yara zim plant technology - esalq.usp.br · pressão de turgor . ... curvas diárias de p p, stem...
TRANSCRIPT

YARA ZIM Plant Technology:
Remote control of plant water status in
real time via Internet
Speakers: Simon Rüger (Managing Director) and
Marta Castiella (Agronomic engineer)
Date: Tuesday 09 December 2014
Time: 09h30 – 16h00
Venue: Anfiteatro de Fisiologia Vegetal, pavilhão
de Horticultura – USP/Esalq, em Piracicaba

Geral
• Background
• Introdução ao inovador principio de medida ZIM-probe

A pressão de turgescência pressiona a membrana plasmática da célula
contra a parede das células da planta.
Esta pressão, turgescência, é causada pelo fluxo osmótico de água a partir
da área de baixa concentração de soluto para fora da célula para o vacúolo,
que possui uma maior concentração de soluto. Células vegetais saudáveis são
turgidas e as plantas dependem de turgescência para manter a rigidez..
A pressão de turgescência demonstra uma mudança diurna devido à perda
de água por transpiração.
Pressão de Turgor
www.wikipedia.com

Pressão de Turgor
Pressão de Turgor é um importante parâmetro do suprimento de água das plantas
Well watered: 5-7 bar
Drought stress: < 1 bar
Turgor Pressure
Microclimate
Irrigation
Fertilizer
Growth
Quality
Productivity
…and diurnal change in turgor pressure due to water loss by transpiration

A Tecnologia ZIM-probe

O inovador princípio de medida ZIM-probe
ZIM-probe mede a pressão de turgor e indicando a “sede” da planta
leaf
movable toric
magnet
lower toric
magnet
pressure sensor
threaded rod
cable to
ZIM-transmitter
magnetic
pressure
turgor pressure
Signals of ZIM-probe
magnetic
pressure
The ZIM-probe
measures the
difference between
magnetic pressure
and turgor
Signals of ZIM-probe:
(Zimmermann et al., 2008; Westhoff et al., 2009)

Alternância Dia/ Noite nas leituras do ZIM-probe
• Medidas contínuas de patch pressure (Pp)
• Patch pressure (Pp) é inversamente correlacionada a pressão de turgor
• Período de leitura entre 10 sec e 10 min
• Comprovação do principio ocorreu em 2007 pelo Prof. Zimmermann e colegas
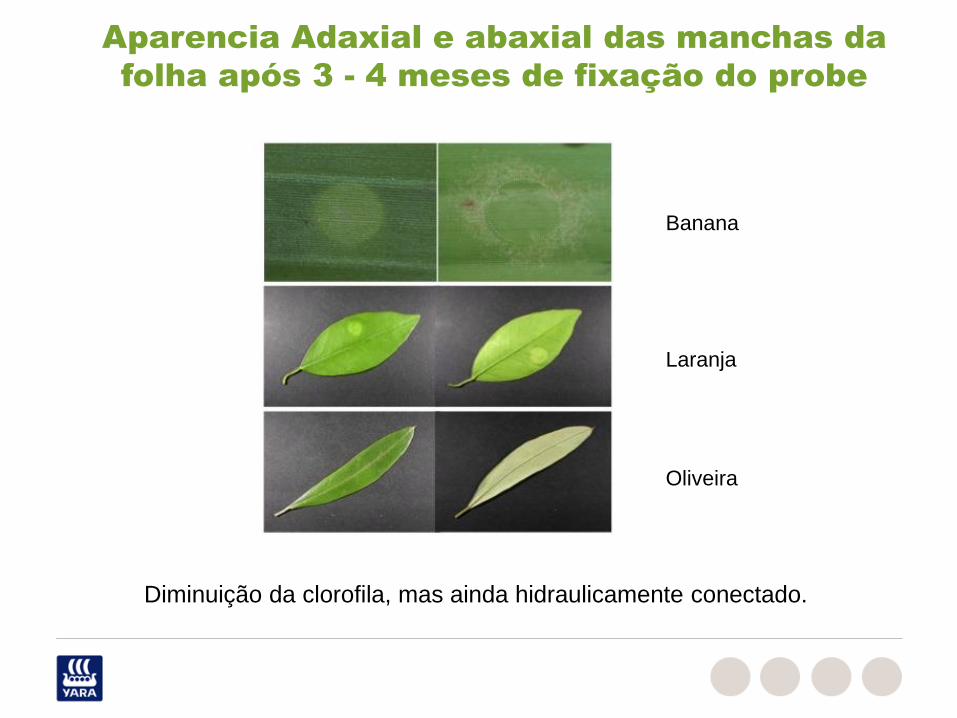
Aparencia Adaxial e abaxial das manchas da
folha após 3 - 4 meses de fixação do probe
Banana
Laranja
Oliveira
Diminuição da clorofila, mas ainda hidraulicamente conectado.

data-analysis ZIM-user data center
O sistema ZIM informa sobre o fornecimento
da água para as plantas em tempo real
ZIM-repeater
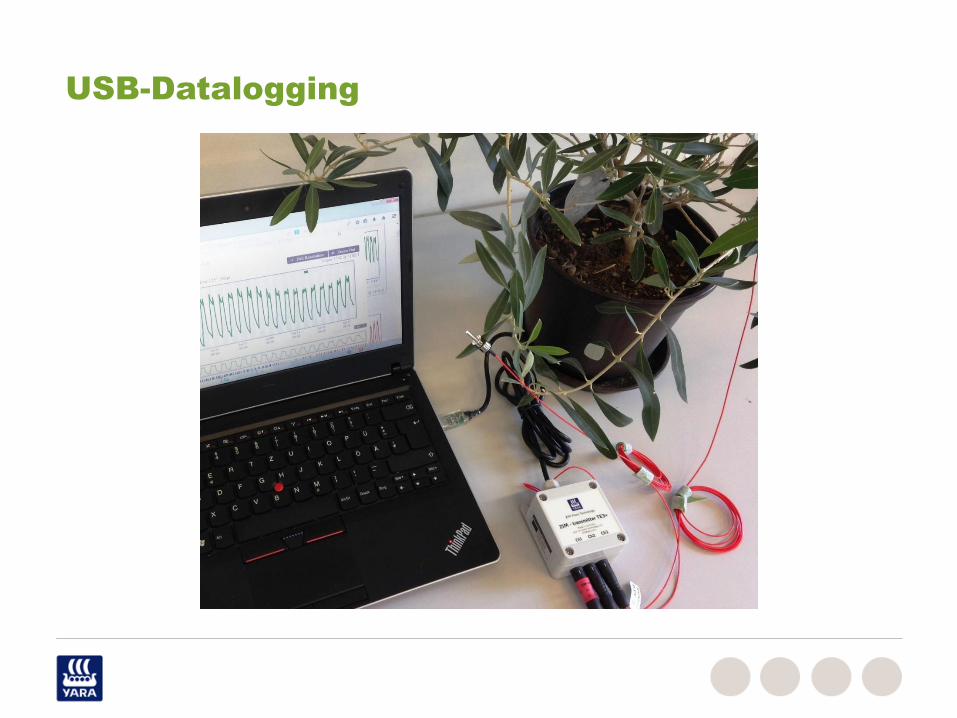
USB-Datalogging

Portfolio de sensores
...all combinations
are possible. Also with USB-
connection available.
soil temperature
sensor
ZIM-relative humidity
probe
light sensor
(PAR or global)
soil moisture
sensor
(FDR)
ZIM-probe
(turgor pressure)
ZIM-temperature probe
(local ambient temperature)

O inovador princípio de medidas ZIM-probe
ZIM-probe mede a pressão de turgor e indicando a “sede” da planta
leaf
movable toric
magnet
lower toric
magnet
pressure sensor
threaded rod
cable to
ZIM-transmitter
magnetic
pressure
turgor pressure
Signals of ZIM-probe
magnetic
pressure
The ZIM-probe
measures the
difference between
magnetic pressure
and turgor
Signals of ZIM-probe:

clampP
aF
a
bc
aP
b
pP
1
• Pp = patch pressure
• Pc = turgor pressure
• Pclamp = clamp pressure
• Fa = attenuation factor (compression of cuticle, cell walls and air-filled interspaces)
• a, b = elasticity constants
O inovador pincípio de medida do ZIM-probe
(Zimmermann et al., 2008)

Calibração de leaf patch clamp pressure probe
(Pp) contra the leaf cell turgor pressure probe
(Pc)
(Zimmermann et al. 2008, Westhoff et al., 2009)

O ZIM-system opera continuamente :
Aquisição de dados em tempo real em condições de
campo
Iinstalação em um campo de canola na
Australia
(Melbourne)
Instalação em parreiral no Chile

Interpretação de dados
• Qual o tipo de informação pode ser deduzida
com os dados do ZIM-probe?
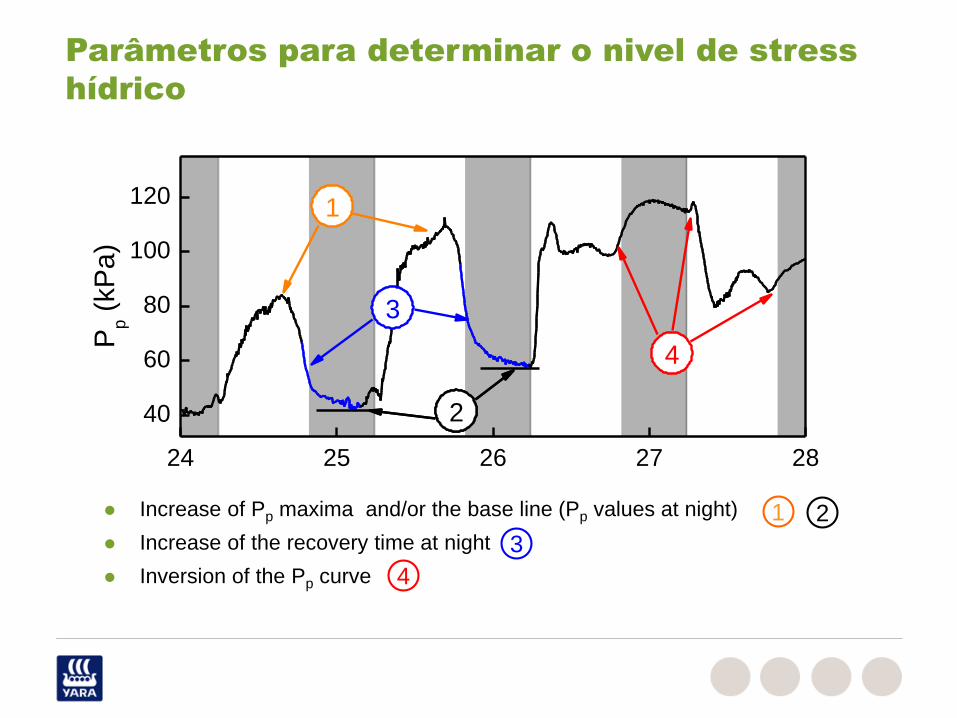
Parâmetros para determinar o nivel de stress
hídrico
24 25 26 27 28
40
60
80
100
120
Pp (
kP
a)
1
2
3
2
4
Increase of Pp maxima and/or the base line (Pp values at night)
Increase of the recovery time at night
Inversion of the Pp curve
1 2
3
4

20
40
60
80
8 11 14 17
20
30
40
20
40
60
80
100
Pp [
kP
a]
July 2009
T [°C
]
R.H
. [%]
Aumento da Pp
maxima e /ou da baseline e
recuperação sob irrigação
Setas marcam a irrigação
laranja
Westhoff et al., 2009
Em citricos, cereja e algumas variedades de videira
4 Jan 8 Jan 12 Jan 16 Jan 20 Jan
15
25
35
T (
°C)
40
60
80
100
R.H
. (%)
30
40
50
Pp (
kP
a)
irrigação
parreira

Aumento de Pp
máximos e mínimos em clementina sob
seca
10.5
17.513.3 11.6
9.112.6
16.0
24 Aug 28 Aug 1 Sep 5 Sep 9 Sep
20
30
T [
°C]
Date
30
80
R.H
. [%]
15
30
45
60
Turgor 5533
Pp [
kP
a]
start irrigation recovery
start water withholding
5
15
25
DI - 2 west middle
s (b
ar)

Curva reversa de Pp
se a pressão de turgor está
próxima a zero
1 Aug 2 Aug 3 Aug 4 Aug
0
20
40
60
inversehalf inverse
Pp [
kP
a]
turgescent
turgor pressure > ca.100 kPa
turgor pressure < ca.50 kPa
turgor pressure ~ 0 kPa
Clear stress parameter in olive, grapevine, persimmon, wheat, almond
Zimmermann et al. Journal of Experimental Botany 59,3157-3167, 2008
Ehrenberger et al. Plant Biology 14,666-674 , 2012
Secciones de hojas de olivo:
(a) óptimo riego
(b) estrés hídrico severo

28 Jul 30 Jul 1 Aug 3 Aug 5 Aug 7 Aug 9 Aug 11 Aug0
20
40
VW
C [
%]
Date
60
90
120
150P
p [
kP
a]
Curva reversa da PP
inversa de Oliveiras sob
irrigação
(Olive farm. Albacete, Spain)

Ajustando estratégias de irrigação em oliveiras de
de acordo com a curva de inversão de PP
Fernández et al., Agricultaral Water Management, 100, 25-35, 2011

O estresse hídrico leva a um atraso da recuperação da
pressão de turgor durante a tarde
Exponential fit of the turgor
pressure recovery after peaking
at noon.
τ = relaxation time (the time
when 66% of end value is
reached)

Efeito de não-irrigação em τ na período da tarde
Zimmermann et al. Plant Biology 424 - 436, 2010
Banana
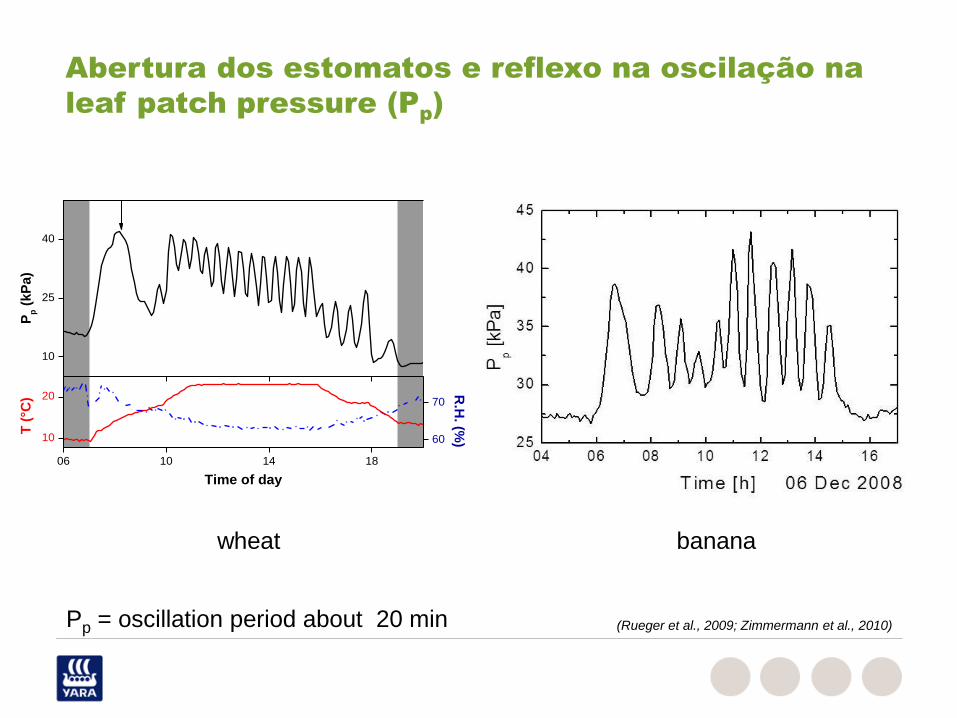
Abertura dos estomatos e reflexo na oscilação na
leaf patch pressure (Pp)
wheat banana
Pp = oscillation period about 20 min (Rueger et al., 2009; Zimmermann et al., 2010)
06 10 14 18
T (
°C)
Time of day
60
70
R.H
. (%)
10
25
40
Pp (
kP
a)
10
20

Depressão medida ao meio dia em videira com o
ZIM probe
00 12 00
20
30
40
T [
°C]
Time [h] 06. August, 2013
20
40
60
80
100
R.H
. [%]
30
40
50
60
Pp [
kP
a]
Commercial winery in Sicily, Italy
80
90
100
Pp [kP
a]
20
30
40
50
60
Pp [kP
a]
10
20
P
p [kP
a]
28 Jun 29 Jun 30 Jun
10
20
30
T [°C
]
Date
40
60
80 R.H
. [%]
Riesling
Silvaner
Spätburgunder
Rüger et al. Australian Journal of Grape and Wine Research16, 405-412, 2010

Comparação das leituras do ZIM-
probe com os métodos tradicionais
• Pressure chamber, Dendrometer, Sap flow, Soil moisture,
Transpiration

Câmara de pressão de Scholander
Manometer
gas pressure

Variações diurnas nos valores de patch
pressure (Pp) e balancing pressure (P
b) em
plantas bem irrigadas
Pb: north-directed leafs (n = 5 per data-point)
Pp: east-directed leaf
02 06 10 14 18 22
40
60
80
100
0.9
1.2
1.5
1.8
2.1
Pp [kP
a]
Time [h] 28 July 2009
Pb [M
Pa
]
(Ben-Gal et al., Agricultural Water Management 98, 124-133,2010)

Comparativo das leituras de status hídrico da
folha utilizando ZIM-probe (Pp) e bomba de
pressão(Pb)
(A) and (B) Avocado, (C) Grapefruit, (D) Oak (Rüger et al., 2010)

Leituras comparativas em trigo
Pp: ZIM-probe, solid line
Ψ : pressure chamber readings, filled circles
Pp: ZIM-probe, solid line
Eplant: transpiration (normalised by leaf area), filled
circles
Pp: ZIM-probe, solid line
Gs: stomatal conductance, filled circles
means ± SEM, n = 4 (Bramley et al., 2013)

Troca gasosa e ZIM-probe em folhas de videira
(Rüger et al., 2010)one day before irrigation one day after irrigation

Troca gasosa e ZIM-probe em folhas de banana
(Zimmermann et al., 2009)
Same frequency in gas exchange and ZIM-probe oscillations
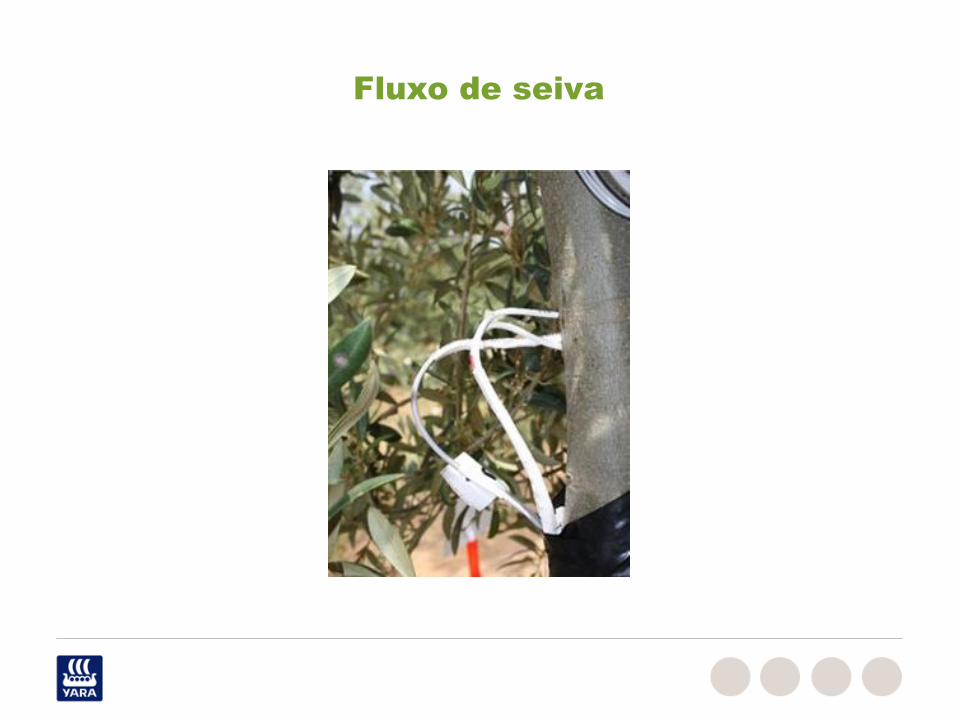
Fluxo de seiva

Leituras de ZIM-probe (A) e fluxo de seiva (B)
em oliveiras sob condição de seca
(C) Solar radiation (Rs; dashed line) and vapour pressure deficit of the air (solid line)
(Rodriguez-Dominguez et al., Agricultural Water Management, 114, 50-58, 2012)

Plotagem das mudanças nas taxas diárias
máximas de fluxo de seiva (Q) versus os
estados medidos pela sonda ZIM
(Rodriguez-Dominguez et al., Agricultural Water Management, 114, 50-58, 2012)

Dendrometro
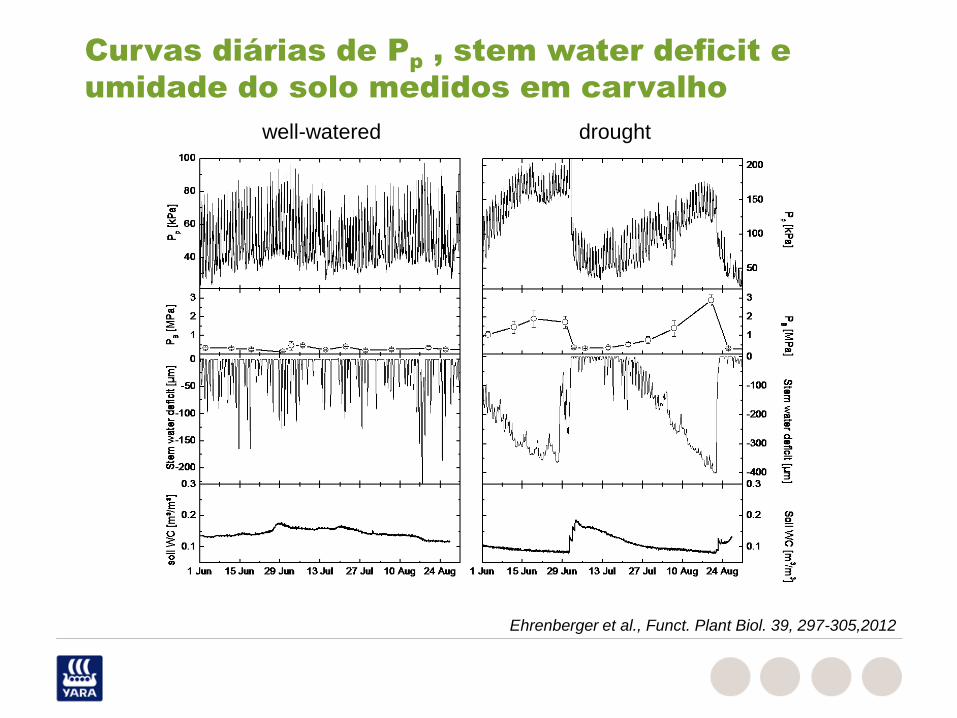
Curvas diárias de Pp
, stem water deficit e
umidade do solo medidos em carvalho
droughtwell-watered
Ehrenberger et al., Funct. Plant Biol. 39, 297-305,2012

Tempo de atraso das leituras máximada e mínima de Pp em
dendrometros com leituras diárias
0
500
1000
SR
[W
/m²]
10
20
30
Ta [
°C]
40
60
80
100
RH
[%]
30
40
50
60
Pp [
kP
a]
03 05 08 10 13 16 18 21 00
420
435
450
465
Time [hh]
De
nd
rom
ete
r [µ
m]
01/02 Jun 2009
-03:00 00:00 03:00 06:00 09:00 12:00 15:000
10
20
30
40
50
Co
un
ts
Time delay [hh:mm]
-03:00 00:00 03:00 06:00 09:00 12:00 15:000
10
20
30
40
50
Counts
Time delay [hh:mm]
control
drought
Ehrenberger et al., Funct. Plant Biol. 39, 297-305,2012
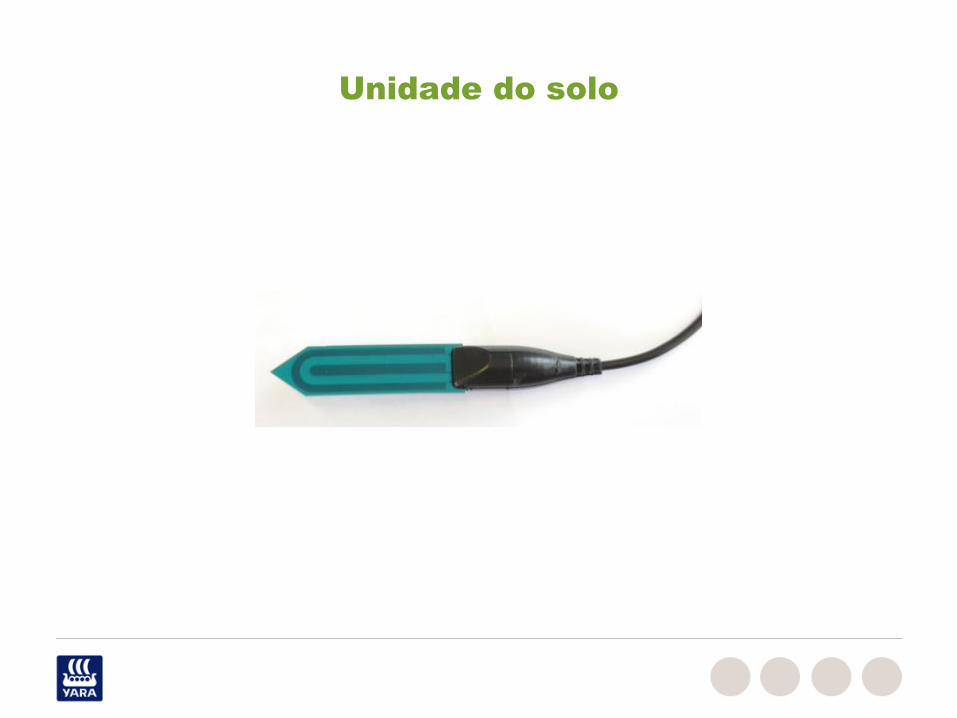
Unidade do solo

28 Jul 30 Jul 1 Aug 3 Aug 5 Aug 7 Aug 9 Aug 11 Aug0
20
40
VW
C [
%]
Date
60
90
120
150P
p [
kP
a]
Curva inversa de PP
em oliveiras sob irrigação
(Olive farm. Albacete, Spain)

Muito obrigado pela sua
atenção
This study was funded by a grant of the Europäischer Fonds für
regionale Entwicklung (EFRE 80145650; State Brandenburg) to
YARA ZIM Plant Technology GmbH.