universite du quebec mÉmoire prÉsentÉ À l'universitÉ … · resume des plaques de...
TRANSCRIPT
UNIVERSITE DU QUEBEC
MÉMOIRE
PRÉSENTÉ À
L'UNIVERSITÉ DU QUÉBEC À CHICOUTIMI
COMME EXIGENCE PARTIELLE
DE LA MAÎTRISE EN INGÉNIERIE
PAR
PENG SHEN,
B. Ing.
THE EFFECTS OF HEAT TREATMENT ON THE MICROSTRUCTURE AND
MECHANICAL PROPERTIES OF THE AA2618 DC CAST PLATE
NOVEMBRE 2012

RESUME
Des plaques de l'alliage AA2618 issue de la coulée semi-continue verticale ontrécemment été proposées pour la fabrication de moules de grandes dimensions. L'alliageAA2618 trouve essentiellement ces applications dans les industries du plastique et del'automobile en raison de ces excellentes propriétés mécaniques et de stabilitédimensionnelle. Les plaques coulées sont coupées directement du lingot issu de la couléeet utilisé sans avoir été déformé, c'est à dire, sans laminage à chaud ou à froid, qui estgénéralement appliqué aux alliages d'aluminium corroyés. L'alliage AA2618 estinitialement désigné comme un alliage pour corroyage, et n'a donc pas été étudié à l'étatnon déformé (brut). Le présent travail a été mené dans le but d'étudier les effets destraitements thermiques sur la microstructure et les propriétés mécaniques de l'alliagenon-déformé AA2618, afin de trouver la meilleure procédure de traitement thermique quipeut être appliquée à cet alliage.
La microstructure de l'alliage AA2618 issue de la coulée a d'abord été examiné dans lesconditions de brute de coulée et de mise en solution en utilisant un microscope optique etun microscope électronique à balayage, ainsi qu'un spectromètre rayon-X à dispersiond'énergie. L'essai Jominy a été mené pour évaluer la sensibilité à la trempe de l'alliage.L'essais de dureté et de traction ont été réalisés pour différentes conditions de mise ensolution, de trempe et de vieillissement. La précipitation de l'alliage a été étudiée par latechnique d'analyse calorimétrique différentielle et par mesure de la conductivitéélectrique.
La caractérisation microstructurale révèle la présence des phases AI2CU, A^CuMg,AI7CU4M, Al7Cu2(Fe,Ni) et A^FeNi dans l'alliage AA2618. La mise en solutioneffectuée à 530 °C pendant 5 heures est la meilleure condition capable de dissoudrecomplètement les phases Al2CuMg, AI2CU et A^C^Ni, dans la solution solide,améliorant ainsi l'effet du durcissement structural. Les phases Al7Cu2(Fe,Ni) et AlçFeNiont été soumises uniquement à la fragmentation et à la sphéroïdisation après une mise ensolution. L'effet du temps de mise en solution sur la microstructure et les propriétés

mécaniques de l'alliage AA2618 n'est pas aussi important que celui de la température demise en solution.
L'évaluation des propriétés mécaniques de l'alliage mis en solution après une trempe àdifférente vitesse de refroidissement montre que ce dernier est un alliage d'aluminium desensibilité à la trempe. Pour les même conditions de mise en solution et de vieillissement,les échantillons refroidis à l'air possèdent une dureté et une résistance à la traction plusfaible que celles des échantillons trempés à l'eau. Les résultats du test de Jominy ontdémontré que la valeur de la dureté de l'alliage AA2618 diminuait significativement avecla diminution de la vitesse de refroidissement.
Les résultats obtenus sur le vieillissement révèlent que les conditions du pic devieillissement de l'alliage AA2618 ont été atteint, après un vieillissement de 36 heures àune température de 175 °C, 10 h à 195 °C et 1 h à 215 °C, respectivement. Lestraitements de vieillissement appliqués à l'alliage AA2618 pourraient produire un largeéventail de combinaisons satisfaisantes de résistance et de ductilité, ce qui répond auxspécifications des fabricants de moules de grande taille. L'alliage AA2618 a égalementété trouvé pour être sujettes au vieillissement naturel, affichant des valeurs de duretécomparables à celles obtenus par le vieillissement artificiel à 195 et 215 °C. Les résultatsobtenus par l'analyse DSC et les mesures de conductivité électrique montrent que laphase principal durcissante de l'alliage AA2618, sous un vieillissement artificiel, est laphase iS-A^CuMg, alors que l'effet du durcissent structurale induit par le vieillissementnaturel est probablement attribué à la formation d'agrégats Cu-Mg et / ou aux zones GPB.

ABSTRACT
Direct chill (DC) cast ingot plates of the AA2618 (Al-Cu-Mg-Fe-Ni) alloy have recentlybeen proposed for the manufacture of large molds in the plastic and automotive industriesdue to the excellent mechanical properties and dimensional stability. The cast plates arecut directly from the DC cast ingot and used in the non-deformed condition, i.e. withouthot and cold rolling usually applied to wrought Al alloys. AA2618 alloy is originallydesignated as a wrought alloy and has therefore not been widely studied in thenon-deformed condition. The present work is undertaken to study the effects of heattreatment on the microstructure and mechanical properties of non-deformed AA2618 DCcast alloy, proposed for the manufacturing of molding plates, in order to find the optimumheat-treatment procedures that can be applied to this alloy.
The microstructure of the AA2618 DC cast alloy was firstly examined in the as-cast andsolution-treated conditions using optical and scanning electron microscopes, as well asenergy dispersive X-ray spectrometer. Jominy end quench test was conducted to evaluatethe quench sensitivity of the alloy. Hardness and tensile tests were carried out fordifferent solution treatment, quenching, and aging conditions. The precipitationcharacteristics of the alloy were studied by differential scanning calorimetry (DSC)technique and electrical conductivity measurement.
An assessment of the microstructure reveals that AI2CU, A^CuMg, AI7CU4M,Al7Cu2(Fe,Ni), and AlçFeNi phases are the main microstructural constituents of theas-cast AA2618 alloy. Solution treatment carried out at 530 °C for 5 h was found to be theoptimum solution treatment, which is able to dissolve the A^CuMg, AI2CU and AI7C114Mphases completely into the solid solution, thereby enhancing the subsequent precipitationstrengthening effect. The Al7Cu2(Fe,Ni) and AlçFeNi phases were only subjected tofragmentation and spheroidization after the solution treatment. The effect of solutionsoaking time on the microstructure and mechanical properties of the AA2618 alloy is notas significant as that of the solution temperature.
IV
The evaluation of mechanical properties of the solutionized AA2618 alloy afterquenching at different cooling rates shows that this alloy is a quench sensitive aluminumalloy. For the same solution and aging conditions, the air cooled samples yields lowerhardness and strength values than water quenched samples. The Jominy end quench testresults demonstrated that the hardness value of the AA2618 alloy declines significantlywith decreasing the cooling rate.
Aging characteristics reveal that the peak-aged conditions of the AA2618 alloy wereattained after aging for 36 h at 175 °C, 10 h at 195 °C and 1 h at 215 °C. The agingtreatments applied to the AA2618 alloy could produce a wide range of satisfactorycombinations of strength and ductility, which may satisfactorily fulfill the specification ofthe large mold manufacturers. AA2618 alloy was also found to be prone to the naturalaging, displaying hardness values comparable to those obtained by the artificial aging at195 and 215 °C. Results from the DSC analysis and electrical conductivity measurementsshow that, the main strengthening phase of the AA2618 alloy, under artificial aging, isS-AhCuMg phase, whereas the strengthening effect caused by the natural aging isprobably attributed to the formation of Cu-Mg co-clusters and/or GPB zones.

ACKNOWLEDGMENTS
After years of research, working with a great number of professors, researchers andtechnicians, this thesis has been finally realized. It is a great pleasure to express mygratitude deeply to all the people contributing to the finalization of this thesis.
In the first place, I would like to acknowledge the financial support from PCP Canada,the Fonds de recherche sur la nature et les technologies (FQRNT) and the NaturalSciences and Engineering Research Council of Canada (NSERC).
I would like to express sincerely all my gratitude to my supervisor, Professor X.-GrantChen, for his valuable direction and encouragement. Working with Prof. Chen has been agreat pleasure. His originality, experience and contributions in the field of aluminum haveabsolutely nourished the value of this thesis.
I am extremely grateful to Dr. Emad Elgallad for his suggestions and generous help onthis thesis. I would like to express my thanks to Jean-Luc Bernier and André Vachon ofPCP-Canada for their continuous support on my research work. I gratefully thank Dr.Zhan Zhang for his guidance and advices on the metallographic analysis using SEM.
Many thanks to my colleagues for their valuable and insightful suggestions (inalphabetical order): Jun-feng Guo, Yu-Mei Han, Gao-feng Li, Kun Liu, Jing Lai,Pierre-Alexandre Minier, Lei Pan, Jian Qin, Cang-ji Shi, and Mohammad Shakiba.Special thanks to Mehand Tebib for French language surpport. I especially thank MartinBouchard, Émélie Brideau, and Dany Racine for their assistance on lab experiments.
I would like to take this chance to express my special thanks to my parents and eldersister in China. Their selfless love and encouragement has always been the greatestsource of power in all my life. Best for last, Yonghuan, my beloved wife, the mostimportant person of my life, has been accompanying with me during the whole period ofmy master study. Thank you for everything that you have done for me and for our family.

VI
I would like to dedicate this thesis to our lovely daughter, Emma, who will come to thisbeautiful world in 4 months.
Finally, I would like to thank everyone who has been involved in the realization of thisthesis. Thank you all.
Vil
TABLE OF CONTENTS
RÉSUMÉ I
ABSTRACT Ill
ACKNOWLEDGMENTS V
TABLE OF CONTENTS VII
LIST OF FIGURES X
LIST OF TABLES XIV
1 DEFINITION OF THE PROBLEM 1
1.1 INTRODUCTION 1
1.2 OBJECTIVES 3
2 LITERATURE REVIEW 5
2.1 AL-CU-MG ALLOYS 5
2.2 AA2618 ALLOY 6
2.2.1 Effects of nickel and iron in 2618 alloy 7
2.2.2 Effects of combined additions of Ni and Fe 12
2.2.3 Effects of other additives on 2618 alloy 13
2.3 SOLUTION HEAT TREATMENT 15
2.4 QUENCHING 18

Vll l
2.5 PRECIPITATION HARDENING ,24
2.5.1 Precipitation sequence 26
2.5.2 Precipitation hardening of AA2618 28
2.5.3 Effects of precipitates on the electrical conductivity 30
3 EXPERIMENTAL PROCEDURES 35
3.1 MATERIALS 35
3.2 HEAT TREATMENTS 36
3.2.1 Solution Heat Treatment and Quenching 37
3.2.2 Artificial and Natural Aging 39
3.3 METALLOGRAPHIC MICROSTRUCTURE EXAMINATION 39
3.4 DSC ANALYSIS 42
3.5 HARDNESS TEST : 44
3.6 TENSILE TEST 45
3.7 ELECTRICAL CONDUCTIVITY MEASUREMENT 47
3.8 QUENCH SENSITIVITY TEST 48
4 RESULTS AND DISCUSSION 51
4.1 CHARACTERIZATION OF THE AS-CAST MICROSTRUCTURE OF THE AA2618 ALLOY 51
4.1.1 Metallographic Observations 51
4.1.2 DSC Analysis 56
4.2 EFFECTS OF SOLUTION TREATMENT 58
4.2.1 Metallographic Observations 58

IX
4.2.2 DSC Analysis 65
4.2.3 Mechanical Properties 69
4.3 QUENCH SENSITIVITY OF THE AA2618 ALLOY 74
4.4 EFFECTS OF AGING TREATMENTS 77
4.4.1 Mechanical Properties 77
4.4.2 Electrical Conductivity 84
4.4.3 DSC Analysis 89
5 CONCLUSIONS AND RECOMMENDATIONS 95
5.1 CONCLUSIONS 95
5.2 RECOMMENDATIONS FOR THE FUTURE WORKS 97
REFERENCES 99

LIST OF FIGURES
Figure 2.1 Values of 0.2% yield strength of 2xxx aluminum alloys after exposure for1000 h (data from Ref [5]) , 7
Figure 2.2 The effects of Fe and Ni on the hardness values of an Al-2.5Cu-l.2Mg alloyfor different aging times at: (a) room-temperature and (b) 190 °C [9] 11
Figure 2.3 Al-rich portion of Al-Cu binary phase diagram [19] 16
Figure 2.4 Effects of solution temperature on the tensile properties of 2014-T4 and2014-T6 sheet [21] 17
Figure 2.5 Tensile strengths of six alloys as a function of average cooling rate duringquenching [19] . 19
Figure 2.6 Effects of thickness and quenching medium on average cooling rates [19] 21
Figure 2.7 Average tensile properties of 7075-T651 plate as a function of thickness [19]. .21
Figure 2.8 Schematic of the Jominy end quench 23
Figure 2.9 Hardness as a function of aging time for an Al-4Cu alloy [29] 25
Figure 2.10 Isothermal section of ternary Al-Cu-Mg phase diagram at 200 °C [42]; 29
Figure 2.11 Eddy current conductivity vs. aging time in unstretched samples of aluminumalloy 2024 [47]. The conductivity is corrected to 20 °C 33
Figure 2.12 Hardness and electrical conductivity profile ofAA7010 at different stages ofageing treatment. The progress of ageing with temperature and time isindicated [53] 34
Figure 3.1 Schematic graph indicating the positions of samples on the cross-section of theingot 36

XI
Figure 3.2 Forced-air electric furnace 37
Figure 3.3 Schematic graphs showing the solution treatment sequences 38
Figure 3.4 Struers Labopress-3 Mounting Press 40
Figure 3.5 Struers Tegrapol-35 Grinder-Polisher 41
Figure 3.6 Nikon Eclipse SE600 optical microscope 42
Figure 3.7 JEOL JSM-6480LV scanning electron microscope 42
Figure 3.8 PerkinElmer DSC8000 differential scanning calorimeter. 43
Figure 3.9 Rockwell hardness tester. 45
Figure 3.10 Instron-3382 universal tensile testing machine 46
Figure 3.11 The dimensions of the tensile sample 46
Figure 3.12 FISCHER SMP 10 Electrical Conductivity Measurement System 48
Figure 3.13 Insulated cylindrical bar and PC-based data logging system 49
Figure 3.14 Jominy end quench fixture 50
Figure 4.1 Optical micrographs showing the as-cast microstructure of the AA2618 alloyat: (a) low magnification (200x); and (b) high magnification (500*) 52
Figure 4.2 Optical micrograph obtained from as-cast 2618 aluminum alloy sample afteretching 53
Figure 4.3 Backscattered electron (BSE) images obtained from as-cast AA2618 sample...55
Figure 4.4 EDX spectra corresponding to the intermetallic phases shown in Figure 4.3: (a)Al9FeNi (labeled 1), (b) AI7CU4M (labeled 2), (c) Al2Cu (labeled 3), (d)Al2CuMg (labeled 4), and (e) Al7Cu2(Fe,Ni) (labeled 5) 56
Figure 4.5 DSC heating curve of as-cast AA2618 alloy. 57
Figure 4.6 BSE images of AA2618 alloy samples solution treated for 5 h at varioustemperatures: (a) 480 °C, (b) 505 °C5 (c) 530 °C, and (d) 545 °C 59
Figure 4.7 Higher magnification BSE image of AA2618 sample solution treated at480 °C for 5 h 60
Figure 4.8 Higher magnification BSE images of AA2618 sample solution treated at

Xll
505 °C for 5 h 61
Figure 4.9 Higher magnification BSE images of AA2618 sample solution treated at530 °C for 5 h 62
Figure 4.10 Higher magnification BSE images of AA2618 sample solution treated at545 °C for 5 h 62
Figure 4.11 Secondary electron image showing slight overheating in AA2618 alloysample solution treated at 545 °C for 5h 63
Figure 4.12 BSE micrographs of AA2618 samples solution treated at 530 °C for variedtimes: (a) 1 h; (b) 3 h; (c) 5 h; (d) 8 h; (e) 12 h 65
Figure 4.13 DSC heating curves of AA2618 samples solutionized for 5 h at differenttemperatures 66
Figure 4.14 DSC heating curves of AA2618 samples solutionized at 530 °C for differenttimes 69
Figure 4.15 Hardness vs. solution temperature curves of AA2618 alloy solution treatedfor 5 h: (a) water quenched samples; (b) air cooled samples 71
Figure 4.16 Hardness vs. solution time curves of the AA2618 alloy solutionized at 530 °C.72
Figure 4.17 Mechanical properties of AA2618 alloy solution treated and quenched underdifferent conditions (WQ: water quenching; AC: air cooling) 74
Figure 4.18 Cooling curves of the Jominy end quenched cylindrical bar (A to G refer tothe thermocouples'positions) 76
Figure 4.19 The average cooling rate in the temperature interval from 350 °C to 230 °C,and the variation of hardness as a function of the distance to the quench end. 77
Figure 4.20 Hardness vs. aging time curves of AA2618 alloy aged at 175, 195 and 215 °C:(a) surface samples and (b) center samples , 79
Figure 4.21 Hardness vs. aging time curves of the natural aged AA2618 alloy. 81
Figure 4.22 Tensile properties of AA2618 alloy under different aging conditions ....83
Figure 4.23 Electrical conductivity vs. aging time curves of the AA2618 alloy samplesaged at 175 °C, 195 °C and 215 °C: (a) surface samples, and (b) center

Xll l
samples 85
Figure 4.24 Electrical conductivity vs. aging time curves of the as-quenched AA2618alloy aged at room temperature 86
Figure 4.25 Hardness versus electrical conductivity profile of the AA2618 alloy fordifferent aging conditions 88
Figure 4.26 DSC curves of the AA2618 alloy in the as-quenched condition and afteraging at 175 °C for 4 and 36 h 91
Figure 4.27 DSC curves of the AA2618 alloy in the as-quenched condition and afteraging at 195 °C for 4 and 10 h 92
Figure 4.28 DSC curves of the AA2618 alloy in the as-quenched condition and afteraging at 215 °C for 1 h 92
Figure 4.29 DSC curves of the AA2618 alloy in the as-quenched condition and afteraging for 4 h at different temperatures 93
Figure 4.30 DSC curves of the AA2618 alloy in the as-quenched condition and afteraging at room temperature for different times 94
LIST OF TABLES
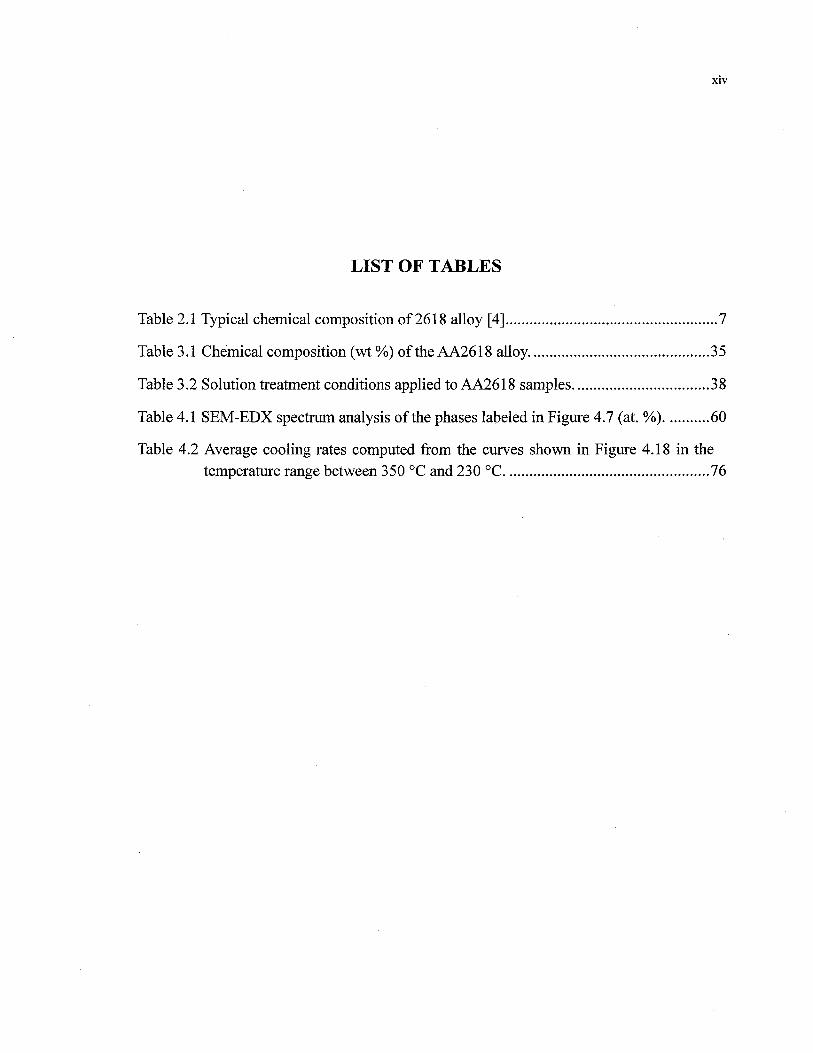
Table 2.1 Typical chemical composition of 2618 alloy [4] 7
Table 3.1 Chemical composition (wt%) of the AA2618 alloy 35
Table 3.2 Solution treatment conditions applied to AA2618 samples .38
Table 4.1 SEM-EDX spectrum analysis of the phases labeled in Figure 4.7 (at. %) 60
Table 4.2 Average cooling rates computed from the curves shown in Figure 4.18 in thetemperature range between 350 °C and 230 °C 76

1 DEFINITION OF THE PROBLEM
1.1 Introduction
Pure aluminum obtained from the electronic reduction of Alumina (AI2O3) is a
relatively weak material. Therefore, for applications requiring greater mechanical
properties, aluminum is alloyed with other alloying elements such as copper, zinc,
magnesium and manganese, usually in combinations of two or more of these elements
together with iron and silicon. Aluminum alloys have traditionally been associated with
applications in the automobile and aerospace industries, because their specific strengths
(strength-to-weight ratios) are outstanding compared to both engineering alloys of other
metals, and other engineering materials in general. The advantages of decreased density
become even more important in engineering design for parameters such as stiffness and
resistance to buckling. Concern with aspects of weight saving should not obscure the fact
that the aluminum alloys possess other properties of considerable technological
importance, e.g. the high corrosion resistance and good electrical and thermal
conductivities.

2xxx series heat-treatable aluminum alloys, based upon the Al-Cu-Mg alloy system,
are widely employed in aerospace and automobile applications requiring a combination
of high strength and ductility [1], However, the mechanical properties of these alloys
decrease significantly when they are exposed at temperature more than 100 °C [2].
Aluminum alloy 2618 is an Al-Cu-Mg alloy containing certain amount of Fe and Ni. The
addition of Fe and Ni to this alloy was found to improve its performance in applications
involving high temperature exposures up to 300 °C, such as engines for both automotive
and aircraft applications [3].
Recently, DC cast aluminum ingot plates have been increasingly used for large mold
manufacturing to take the advantage of the available larger material dimensions
combined with superior mechanical properties and excellent dimensional stability.
Moreover, these plates are cut directly from the ingots and used in the non-deformed
condition, i.e. without hot and/or cold rolling usually applied to wrought alloys, which
reduces production costs and processing time. AA2618 DC cast alloy has received
particular attention from large mold manufacturers owing to its excellent machinability,
good weldability, and high stability of mechanical properties at elevated temperatures.
This alloy was originally employed as a wrought alloy, so most of the existing research
works have focused on the alloy microstructure and mechanical properties after

deformation processes such as forging, rolling and extruding. On the other hand, little
research work has been done on the application of the AA2618 alloy in the non-deformed
condition. The influence of heat treatment procedures on the microstructures and
mechanical properties of the non-deformed AA2618 cast alloy, which represents
important factors for the industry of molding plates, is still unknown and therefore needs
intensive research work.
1.2 Objectives
The present work is undertaken to study the effects of heat treatment on the
microstructure and mechanical properties of non-deformed AA2618 DC cast alloy,
proposed for the manufacturing of molding plates, in order to find the optimum
heat-treatment procedures that can be applied to this alloy. In keeping with this aim, the
objectives of the intended study will include the following points:
1. Identifying the intermetallic phases contained in the as-cast alloy microstructure;
2. Studying the effects of various heat treatment procedures, namely solution
treatment, quenching and aging, on the microstructure and mechanical properties of the
alloy;

3. Investigating the precipitation characteristics of the AA2618 alloy under different
aging conditions.

2 LITERATURE REVIEW
2.1 Al-Cu-Mg alloys
2xxx series aluminum alloys, whose principal alloying element is copper (Cu), are
used in many applications for their particular combinations of strength and corrosion
resistance. In aerospace and automobile industries, the high strength-to-weight ratio,
which is particularly important in the design of structural components, makes these alloys
a very attractive class of materials. Among the present 2xxx series aluminum alloys, alloy
2014 and 2024 are widely used in aircraft structures, rivet hardware, truck wheels, screw
machine products, and other miscellaneous structural applications because of their good
performance below 100 °C [4].
2xxx series Al-Cu-Mg alloys date from the accidental discovery of the age
hardening phenomenon by Alfred Wilm in 1906, who was seeking to develop a stronger
aluminum alloy to replace brass for the manufacture of cartridge cases. His work led to
the production of an alloy known as Duralumin (Al-3.5Cu-0.5Mg-0.5Mn) which has

better properties and was quickly used in aircraft construction. Later, several other
important alloys were developed and widely used in aircraft industry. One example is
2014 alloy (Al-4.4Cu-0.8Si-0.8Mn-0.5Mg) which achieved higher strength because the
relatively high silicon content increases the response to hardening during artificial aging
process. The typical tensile properties of this alloy are: 0.2% yield strength of 414 MPa
and tensile strength of 483 MPa [4]. Another alloy 2024, in which the Mg content is
raised to 1.5% and the Si content is reduced to impurity levels, exhibits significant
hardening by natural aging at room temperature and is frequently used in T3 or T4
tempers.
2.2 AA2618 alloy
Aluminum alloy 2618 (also known as RR58) is an Al-Cu-Mg alloy having chemical
composition listed in Table 2.1. Addition of Fe and Ni to this alloy was found to improve
its elevated temperature performance up to 300 °C as shown in Figure 2.1 [5]. AA2618 is
frequently used for high temperature applications in automotive and aerospace industries
and has been successfully used as the primary structure of the supersonic Concorde
airplane [3].

Table 2.1 Typical chemical composition of 2618 alloy [4].
Alloy
2618
Cu
1.9-2.7
Mg
1.3-1.8
Fe
0.9-1.3
Ni
0.9-1.2
Si
0.1-0.25
Zn
<0.10
Ti
0.04-0.1
others
<0.15
Al
Bal.
COÛ.
450
400
350
300
1 250£ 200CO2 150.CD
> 100
50
0
2618-T651
2014-T651
2024-T6
100 200 300
Temperature(°C)
400
Figure 2.1 Values of 0.2% yield strength of 2xxx aluminum alloys after exposure for
1000 h (data from Ref [5]).
2.2.1 Effects of nickel and iron in 2618 alloy
The addition of certain amounts of Fe and Ni in 2618 alloys could produce
microstructural stability under thermal exposure [6], and thus retain the high strength
property even applied at elevated temperatures.
2.2.1.1. Effect of nickel
Nickel is a corrosion-resistant metal with a high melting temperature (1453°C). It
exhibits good ductility due to its face-centered cubic (f.c.c.) crystal structure. Nickel can
be readily alloyed with other metallic elements to form a wide range of commercial
alloys which are used in a multiplicity of consumer applications, including household
appliances, electronics, and automotive components. They are also used in critical
industrial technologies such as chemical processing, pollution control, aircraft and missile
propulsion, and electric power generation.
The solid solubility of nickel in aluminum does not exceed 0.04%. Over this amount,
it is present as an insoluble intermetallic, usually in combination with iron. Nickel
amount up to 2% increases the strength of high-purity aluminum but reduces ductility.
Binary Al-Ni alloys are no longer in use but Ni is added to Al-Cu and Al-Si alloys to
improve hardness and strength at elevated temperatures and to reduce the coefficient of
expansion [6].
Alloy Y, the first of the Ni-containing light aluminum alloys, was developed by the

National Physical Laboratory during World War I, in attempt to find an aluminum alloy
that would retain its strength at high temperatures. Like duralumin, this was a 4% copper
alloy, but with the addition of 2% nickel and 1.5% magnesium [7]. As for many of the
aluminum alloys, Y alloy can be age hardened spontaneously at normal temperatures after
solution heat treatment. The heat treatment consists of solution treatment at 500-520 °C
for 6 h, then natural aging for 7-10 days [8]. The precipitation hardening that takes place
during this aging forms precipitates of both CuAb and NiA^ [7].
Wilson and Forsyth [9] investigated the effects of adding 1 wt.% nickel to an
age-hardening Al-2.5%Cu-1.2%Mg alloy and found that the nickel formed an
intermetallic phase which was present from the casting stage and was insoluble at the
solution-treatment temperature. After forging and rolling, the as-cast structure was broken
down and the insoluble phase dispersed in the form of small spherical particles (0.5-1 (am
dia.) throughout the matrix. A comparison of the final grain size achieved in the alloys
after solution-treatment showed that the nickel-bearing alloys had resisted grain growth,
and thin-foil transmission electron microscopy revealed that many grain boundaries were
pinned by the nickel-rich particles.
According to the mechanical testing results shown in Figure 2.2, nickel, however,

10
lowers the hardness values of the alloy, since the addition of nickel has decreases the
age-hardening ability of the alloy by forming an insoluble Ni-Cu phase, thereby
preventing copper from entering into solid solution. Underhill et al [10] reported the
existence of AI7CU4M phase particles in spray-formed AA2618 alloy.
400-00
fil
*2 lûQ
*GE1MG TJME. DAYS
(a)
D^Û!
(b)

11
% % g�"*; AI-2-5M Ca~l*2% Mg-CH *. MiA Ai-2-5%Cu-'r-2*iM«~i*o% N;
Figure 2.2 The effects of Fe and Ni on the hardness values of an Al-2.5Cu-1.2Mg
alloy for different aging times at: (a) room-temperature and (b) 190 °C [9].
2.2.1.2. Effect of iron
Iron is usually an impurity in aluminum alloys and forms a constitute, FeAh^that is
essentially insoluble in solid aluminum and frequently appears as a coarse, insoluble
constituents with many other alloying elements that may be present, including Cu, Ni,
Mn and Si. These coarse phases reduce ductility and induce cracking of wrought alloys
during fabrication.
The cast Al-Cu-Mg alloys containing iron are characterized by dimensional stability
and improved bearing characteristics, as well as by high strength and hardness at elevated
temperatures. However, in a wrought Al-4Cu-0.5Mg alloy, iron in concentrations as low
as 0.5% distinctly lowers the tensile properties in the heat treated condition, if the silicon
content is less than that required to tie up the iron as the a-FeSi constitute [6]. In this case,
the excess iron combines with copper to form the AlyCuiFe phase, thereby reducing the

12
amount of copper available for age hardening effects. When sufficient silicon is present to
combine with the iron, the properties are unaffected [6].
Wilson and Forsyth [9] also found that the effect of the addition of 1% iron upon the
age hardening of the Al-2.5%Cu-1.2%Mg alloy was similar to that of 1% nickel, as
shown in Figure 2.2.
2.2.2 Effects of combined additions of Ni and Fe
When 1% Ni and 1% Fe were added together into the Al-Cu-Mg alloy, the
age-hardening behaviour at both room and elevated temperature restored to that of the
ternary alloy, as shown in Figure 2.2. This observation can be explained in terms of the
fact that the combined addition of Ni and Fe forms the low Cu content AlçFeNi
intermetallic phase and therefore allows the full Cu content of the alloy to enter into solid
solution, which in turn improve the age-hardening process. This phase also provides
insoluble particles which stabilize the grain size by pinning the grain boundaries, and as a
result the grain growth is restricted in high temperature applications.
Feng et al [11] and Wang et al [12] investigated the microstructure of the as-cast
Al-2.24Cu-l.42Mg-0.9Fe-0.9Ni alloy and found that the microstmctures of the as-cast

13
alloy consist of a-Al matrix as well as AkCuMg, A^Cu, A^FeNi, A^O^Fe and
AI7CU4M intermetallic phases
Oguocha et ah [13] reported the AlxFeNi phase in cast AA2618alloy has a
C-centered monoclinic structure and the structural formula of this phase varies from
particle to particle according to the aluminum content.
2.2.3 Effects of other additives on 2618 alloy
The mechanical properties of age-hardening aluminum alloys could be greatly
affected by slight variations in chemical composition. Other alloying elements were
added to 2618 alloy by other researchers to promote the comprehensive properties.
Bergsma et ah [14] compared the ambient and elevated-temperature T6 tensile
properties of "air slip" cast aluminum alloy ingot 2618 and 2618 alloyed with additional
Cu as well as some additional Mn, Fe and Ni. They found that the addition of alloying
elements appears to increase strength slightly, but to decrease ductility at ambient
temperature.
Trace additions of Si modify the aging process and sequence in Al-Cu-Mg alloys.
Addition of 0.25 wt% Si enhances the artificial age hardening of Al-2.5wt%Cu

14
-1.5wt%Mg and Al-2.5wt%Cu-1.2wt%Mg alloys, but does not affect the time to peak
hardness. However, Si additions retard the age hardening at room temperature due to
preferential interaction of vacancies with Si atoms [15]. Precipitation of other phases,
such as O-AhCu, is also possible in alloys with higher Si contents in which Mg2Si forms
in greater amounts, thereby consuming more Mg from the matrix [16].
The microstructure and mechanical properties of 2618 alloy with 0.5wt% of Ti were
investigated by Wang et al [17]. When Ti is used as an alloying element, it does not
affect the morphology of AlçFeNi phase in cast alloy, but decreases the grain size of
as-cast alloy remarkably. The grain size of quenched-aged 2618 alloy decreases
apparently due to the existence of a great deal of dispersive A^Ti particles. The addition
of 0.5%Ti has no effect on the tensile properties of 2618 alloy at room temperature, but
apparently increases its elevated temperature instantaneous tensile properties at 250 °C,
as well as those when the alloy is exposed to 250 °C for long time up to 100 h. This is
attributed to the formation of the dispersive A^Ti particles which are stable at high
temperatures.
Effects of combined additions of Sc and Zr on microstructure and mechanical
properties of 2618 alloy were studied by Yu et al [18]. It was found that the addition of

15
Se and Zr to 2618 alloy results in the formation of the primary Al3(Sc, Zr) phase. Such
phase could refine the grain structure of the alloy because it acts as a heterogeneous
nucleation sites during solidification. The secondary Al3(Sc, Zr) phase particles, that
precipitate from the a(Al) solid solution, are fully coherent with the matrix and have an
obvious precipitation hardening effect. These particles also made the distribution of S9
phase precipitates more homogeneous. The strength of the 2618 alloy containing Als(Sc,
Zr) phase increases at both ambient and elevated temperatures, without a decrease in
ductility.
2.3 Solution heat treatment
Heat treatment is a traditional and essential metallurgical technique widely used to
improve the mechanical properties of heat-treatable aluminum alloys. The heat treatment
procedures of AA2618 alloy are similar with other 2xxx series alloys and will be
discussed below.
The purpose of the solution heat treatment is to obtain a solid solution containing the
maximum possible concentration of the hardening solutes such as Cu, Mg, Si, or Zn. The
Al-rich portion of Al-Cu binary phase diagram shown in Figure 2.3 reveals that the
solubility of Cu in a-Al increases obviously with temperature and reaches to maximum

16
(5.65 wt. %) at the eutectic melting temperature (548 °C). The rate of solution increases
with temperature, because of increased diffusion rate. According to the Al-Cu binary
phase diagram, it could be found that the theoretical solution temperature for AA2618
alloy containing 2.4 wt. % copper ranges from 440 °C to 548 °C.
UCDper. atomic %
6 ? 3 9 . 10203
Figure 2.3 Al-rich portion of Al-Cu binary phase diagram [19].
The influence of solution heat treatment temperature on the tensile properties of
2014 alloy for both T4 and T6 aging treatments are shown in Figure 2.4. At low
temperatures, alloying elements are not dissolved completely into the matrix which may
reduce the effect of precipitation hardening. On the other hand, the high solution

17
treatment temperature causes incipient melting of second phases leading to intergranular
networks of nonductile eutectic which in turn decreases both strength and ductility. Liu et
al [20] observed that the mechanical properties of Al-Cu-Mg-Ag alloy increase first and
then decrease with increasing the solution temperature.
Figure 2.4 Effects of solution temperature on the tensile properties of 2014-T4 and
2014-T6 sheet [21].
Given that the nominal temperatures specified for commercial solution heat
treatments of many alloys are only 10 to 15 °C below the eutectic temperature, good
control and uniformity of temperature within furnaces are essential. However, compared

18
to the solution temperature, the solution holding time has less effect on the microstructure
and the mechanical properties.
2.4 Quenching
Quenching after solution treatment is a very critical step in the sequence of heat
treatment practice. The objective of quenching is to preserve as nearly intact as possible
the solid solution formed at the solution heat treating temperature, by rapid cooling to
lower temperature, usually near to room temperature.
The cooling rate has a significant impact on the precipitation strengthening of alloys.
Figure 2.5 illustrates the tensile strength variation tendency of different alloys as a
function of cooling rate during quenching. When the cooling rate is lower than 100 °F per
sec, the tensile strength decreases obviously and the reduction in strength for a specific
decrease in cooling rate differs from one alloy composition to another [19], This
sensitivity to the quench path is attributed primarily to loss of solute by heterogeneous
nucleation and growth of quench precipitates which do not provide strengthening during
subsequent aging [22].

19
i I : | : | i I i | M i 1f ? t t 1 I MI I i I M ! II
I.0 I0 !C2 !0 5 I04 I05
Average cooling rate (750 to 550 F), °F per sec
Figure 2.5 Tensile strengths of six alloys as a function of average cooling rate during
quenching [19].
There are two main factors that determine the cooling rate of alloys: product size
and shape, and quenching medium.
The rate of cooling is a function of the ratio of surface area to volume, since heat
transfer during quenching basically is limited by the resistance at the surface in contact
with the quenching medium. In the case of sheets and plates, as well as other products of
similar shape, average cooling rates vary with product thickness in a relatively simple
manner and the relation can be approximated by the following equation [19]:

20
Logrt = l og r i -k log t (1)
where rt= average cooling rate at thickness t in °F per sec; ri= average cooling rate at
1 in. thickness in °F per sec; and k = constant.
As quenching medium concerned, water is not only the most widely used medium
but also the most effective. Figure 2.6 shows cooling rates determined experimentally for
different thick sections that were quenched by immersing in water at five different
temperatures and by cooling in still air. It could be observed that the cooling rate
decreases with increasing section thickness of products [19]. Moreover, in water
quenching, cooling rates can be reduced by increasing water temperature. Figure 2.7
shows the average tensile properties of 7075 plate as a function of plate thickness [19].

21
0.1 1.0 IC iCf iCT 10
Average cooling rate { 7 5 0 to 5 5 0 F), (>F per sec
Figure 2.6 Effects of thickness and quenching medium on average cooling rates [19].
o . 7 0LI
� -h 1 Y^td strength
c c b UCD d>
fn
50
c -o .t
c: -^
00
^ O � i l l .
Figure 2.7 Average tensile properties of 7075-T651 plate as a function of thickness [19].

22
AA2618 aluminum alloy is a quench sensitive alloy [23]. Cooling rate is a very
important factor in the manufacturing and post-fabrication processes of AA2618
aluminum alloy. In particular, it equally affects the as-quenched and aged properties of
this alloy. However, it does not alter the precipitation sequence of AA2618 aluminum, i.e.,
the precipitation sequence is independent of the quenchant used [23].
The effect of quenching conditions on final properties, which is known as quenching
sensitivity, could be determined using the Jominy end quench test [24-26]. The Jominy
end quench test, which is well known as a method of measuring hardenability in steels,
offers a method for studying many quenching conditions with a minimum of samples. In
the original classic work by Jominy and Boegehold [27], a cylindrical specimen, 100 mm
long by 25 mm in diameter, as shown in Figure 2.8, was austenitized and then removed
from the furnace and placed in a fixture, where the specimen was exposed at one end to a
specified vertical stream of water. The resulting cooling is one dimensional and the
cooling rate decreases with increasing distance to the quench end.

23
Top View
Skis
�
Figure 2.8 Schematic of the Jominy end quench.
Loring et al. [28] authored the first published paper on the use of the Jominy end
quench test for studying aluminum alloys using a modified L-type Jominy specimen. The
cooling curves at various distances up to 25 mm were measured. Different types of
aluminum (14S, 24S, 61S, R-301, and 75S) were tested. Hardnesses were measured at 3
mm intervals using the Rockwell B, F, and Vickers (5 kg) scales. Further, it was seen that
higher quench rates yielded decreasing hardness in the as-quenched condition. Low
cooling rates produced relatively small changes in the hardness. Only 75ST exhibited a
sensitivity to quench rate after aging. Newkirk et al. [24] found that AA7075 aluminum

24
alloy is very quench sensitive, of whom the Vickers hardness of the cross-section area
decreases significantly with increasing distance from the quenched end of the quench bar.
2.5 Precipitation hardening
After solution treatment, a supersaturated solid solution is obtained. At room
temperature or higher temperature, some of the solute atoms will react with some of the
solvent atoms to form precipitate particles, since the practical content is higher than the
solubility limit at this temperature. These fine precipitates will obstruct the movement of
dislocations and therefore improve the mechanical properties of materials.
Hardy [29] examined the aging behavior of an Al-4Cu alloy. The alloy was solution
heat treated for at least 48 h at 520 °C, then water quenched to 20 °C. The hardness is
measured as a function of aging time as shown in Figure 2.9.

25
0.001 0,01 lO.OflQ
Figure 2.9 Hardness as a function of aging time for an Al-4Cu alloy [29].
Note that the hardness curves pass through a maximum value, and are quite
temperature dependent. The maximum hardness, which is known as the peak aging point
or T6 temper, is associated with precipitates attaining a critical size and distribution.
When the precipitates become too coarsened, they are too dispersed to be as effective in
retarding dislocation motion, and hardness decreases. The formation of the precipitates to
an optimum size and distribution will be more rapid at higher temperature, so that the
peak hardness occurs at shorter time as the aging temperature increases. However, the
amount of the precipitate formed decreases with increasing temperature (the degree of

26
supersaturation decreases), and the magnitude of the peak hardness decreases. Also, it is
expected that at a given aging temperature, the higher the solute content, the faster the
peak hardness will be attained, because the supersaturation will be greater, and therefore
diffusion will be faster.
2.5.1 Precipitation sequence
In Al-Cu binary alloys, the precipitation sequence can be represented as:
supersaturated solid solution �� GP zones �� #" �� #' �� # (A^Cu), while in
Al-Cu-Mg alloys, the precipitation sequence is still in dispute.
Bagaryatsky [30] first proposed the precipitation sequence during the artificial aging
of Al-Cu-Mg alloys as supersaturated solid solution (SSSS) �� zones � � S " �� S'
�� S. The zones, which are coherent with the matrix and enriched with Cu and Mg,
were named as the Guinier-Preston-Bagaryatsky (GPB) zones by Silcock [31].
Bagaryatsky [30] considered the GPB zone as a short-range ordering of Cu and Mg solute
atoms. The structure of Sff has not been clearly confirmed. The ternary S phase with a
composition of A^CuMg has been determined as an orthorhombic structure with lattice
parameters a = 0.400 nm, b = 0.923 nm, c = 0.714 nm by Perlitz and Westgren [32] (P-W)
on the basis of X-ray diffraction (XRD) work. The S' phase has generally been

27
considered as semi-coherent with the matrix. As the S' phase possesses the same structure
as the S phase with slightly difference in lattice parameters, it is now regarded that there
is no distinction between the S' and S phases [33, 34].
Since the mid-1990s, atom probe field ion microscopy (APFIM) and
three-dimensional atom-probe (3DAP) have evidenced that the first stage of age
hardening is due to the formation of co-clusters [35, 36]. Ringer et al [37] proposed the
following 3-stage precipitation sequences for the ageing of Al-Cu-Mg alloys:
SSSS �� Cu-Mg co-clusters ��GPB zone�� S
where the Cu-Mg co-clusters are responsible for the initial hardening, GPB zone is
the dominant precipitate at peak strengthening and the S phase appears in the softening
stage. However, Gao et ai [38] and Wang et al. [33] found that the peak aging is
dominated by the formation of S precipitates and no significant amounts of other phases
or zones are detected.
The structural changes occurring at room temperature differ in fundamental ways
from those occurring at elevated temperatures [6]. However, information about the
microstructure evolution during natural aging is scarce. Starink [36] found that

28
strengthening due to modulus hardening generated by the difference in shear modulus of
Cu-Mg co-clusters and matrix is the main strengthening mechanism for room
temperature hardening of Al-Cu-Mg alloys. The early stages of natural ageing in
laboratory Al-Cu-(Mg) alloys and in AA2024 were investigated using positron
annihilation and X-ray absorption spectroscopy by Klobes et al [39] who also concluded
that the natural aging hardening process was associated with the growth of co-clusters
and no S" phase formed during natural aging in the investigated Al-Cu and Al-Cu-Mg
alloys.
2.5.2 Precipitation hardening of AA2618
Figure 2.10 shows AA2618 alloy situated in the a + 0 + S phase field of the
Al-Cu-Mg phase diagram. During the aging process, both 6 and S phases precipitate out
of the solid solution and strengthen the alloy. The fractions of these two phases depend on
the concentration ratio of Cu to Mg, as well as their total content. However, according to
other research works [40, 41], the main strengthening phase in AA2618 alloy is S phase.

29
a+ "«� : Chemical composition of 2618
6
Figure 2.10 Isothermal section of ternary Al-Cu-Mg phase diagram at 200 °C [42];
(a = Al, 0 = CuAl2? S = Al2CuMg, T = Al6CuMg4 and p = Ali2Mgi7).
Novy et al. [41] examined the microstmcture of T6-AA2618 alloys and found that
the microstmcture of the alloy in the peak aging condition consists of polyhedric grains
of the solid solution of a-Al containing Cu and Mg. The AlçFeNi, A^CuMg, Mg2Si?
AlCuNi and AlvCu2Fe intermetallic phases were identified in the microstmcture. The
majority of the intermetallic phases found, however, belong to the phase AlçFeNi. This
phase significantly improves mechanical properties and reduces the undesirable grain
growth at high temperatures. The main strengthening £-Al2CuMg phase was distributed
uniformly in the form of tiny plate-like precipitates (GPBII zones) of the approximate

30
size of 50 nm in grain interior.
Lu et al [16] found that prior natural aging of 2618 alloy weakened the hardening in
the subsequent artificial aging at 180, 200, and 230 °C, but had no such effect at 150 °C.
The decrease in hardness at 180, 200, and 230 °C is due to the cluster reversion that
delays the precipitation of strengthening phases. On the contrary, at 150 °C, the clusters
survive and age hardening proceeds with no delay.
2.5.3 Effects of precipitates on the electrical conductivity
Electrical conductivity measurements, employing eddy current techniques, are often
utilized in order to determine the kinetic behaviour of the precipitation process or to
evaluate the progress of the age hardening sequence non-destructively [43-45]. The
variation in the electrical conductivity with aging is complex and results from a number
of contributions [46] including changes in the scattering of conduction electrons from (1)
the vacancies quenched in during the rapid cooling after solution heat treatment, (2) the
alloying atoms present in the matrix, (3) the Guinier-Preston (GP) zones with dimensions
comparable with the electron wavelength and (4) the boundaries of the zones or clusters
[47].

31
Many aluminum alloys are unstable for a considerable period of time after solution
heat treatment even if held at room temperature. During this time, a certain amount of
atom migration takes place to initiate the formation of sub-microscopic particles. During
this process, sometimes called natural aging, two competing processes occur. There is a
decrease in the number of quenched-in vacancies and a clustering of copper and
magnesium atoms which tend to increase the conductivity. Simultaneously, there is a
more significant decrease in the electrical conductivity due to the appearance of newly
formed clusters, or precipitates, small enough to be effective as scatterers of electrons.
Under the combination effect of these two competing processes, the electrical
conductivities of natural aged samples yield a decreasing tendency with increasing aging
time [47].
If a solution heat treated alloy is precipitation hardened by heating at relatively
higher temperature, that is, artificially aging hardened, alloying atoms form small
particles. At a critical size and distribution of particles, the strength of the aluminum alloy
reaches a maximum. Electrical conductivity also increases during the precipitation
hardening or artificial aging process [48, 49]. If aging is carried on beyond the point
where optimum strength is obtained, strength will decrease, while conductivity will
continue to increase to an ultimate value determined by the solubility of impurity atoms

32
at the specific aging temperature. The absolute value of electrical conductivity achieved
after any given aging time is dependent on aging temperature owing to the fact that the
geometry and size distribution of the precipitates are governed by a thermally activated
process [50].
Rosen and Horowitz [47] found that there is an initial decrease in conductivity at
each of the isothermal aging temperatures in the range between 21 and 190 °C, as shown
in Figure 2.11. For specimens aged in the temperature range between 150 and 190 °C, the
rate of initial decrease in conductivity is virtually identical. They also observed that in
contrast with the decreasing tendency in the electrical conductivity as a function of aging
time at low temperature (below 50 °C)5 the conductivity above 150 °C increases with
increasing isothermal aging temperature after the initial decrease during the first 5 min of
the aging process.
Tariq et al [51] observed that electrical conductivity measurement results of
AA2014, AA2024 and AA2219 aluminum alloys exhibited a linear trend, that is,
conductivity increased with aging time up to peak hardness condition. Further aging
above peak hardness resulted in decrease in conductivity which proved the over-aging of
the structure. Moreover, in most cases the multi-step precipitation sequence can be easily

33
detected by monitoring various steps in electrical conductivity values. Hence, it was
demonstrated that a good correlation exists between progress of aging and electrical
conductivity.
35,6
ZQÙ(00 500 \00Q
AGING TIME.min
Figure 2.11 Eddy current conductivity vs. aging time in unstretched samples of aluminum
alloy 2024 [47]. The conductivity is corrected to 20 °C.
Lee et al [52] and Salazar-Guapuriche et al [53] both observed that the hardness
values versus electrical conductivity plots yield C-shaped plots. The overall relationship

34
between hardness and electrical conductivity is not linear. Salazar-Guapuriche et al [53]
also found that in the natural and over ageing conditions, electrical conductivity and
hardness showed a reciprocal effect, i.e. an increase in one produced a decrease in the
other and vice versa, as shown in Figure 2.12. During natural aging process, hardness
increases because of precipitation hardening while the electrical conductivity decreases.
In over aging condition, hardness decreases due to the growth of precipitates while the
electrical conductivity continues increasing.
200> 180i: 1 6 0w§140-n 120 J
X80
Artificial ageing120°C(up to 10 hrs)173 °C(up to 8 hrs)
Natural ageing(up to 16 days)
Over ageing173 °cf(lip to 100 hrs)
� Natural ageingo Artificial ageing* Qyer ageing
i
13 15 17 19 21 23 25 27
Electrical conductivity, MS/m
Figure 2.12 Hardness and electrical conductivity profile ofAA7010 at different stages of
ageing treatment. The progress of ageing with temperature and time is indicated [53].

35
3 EXPERIMENTAL PROCEDURES
3.1 Materials
The AA2618 aluminum alloy studied was received from PCP Canada Ltd. in the
form of a cross-section slice (54 in x 16 in x 2 in) cut directly from a large AA2618 DC
cast ingot. The chemical composition of the alloy is listed in Table 3.1.
Table 3.1 Chemical composition (wt %) of the AA2618 alloy.
Cu
2.86
Mg
0.97
Fe
0.97
Ni
1.04
Si
0.14
Zn
0.10
Ti
0.02
Mn
<0.01
Al
Bal.
The mechanical properties of the surface and center parts of the cast plate usually
have variations due to the chemical segregation and the different cooling rates during
casting process. Therefore, surface and center samples measuring 2.5 in x 1.5 in x 1.0 in
were cut, respectively, from the AA2618 cast plates for heat treatment and hardness
testing. The positions of the samples are shown in Figure 3.1.

36
Surface
TZZI
XCenter
Figure 3.1 Schematic graph indicating the positions of samples on the cross-section of the
ingot.
3,2 Heat Treatments
The heat treatments proposed were carried out at various temperatures for different
holding times in the forced-air electric furnace shown in Figure 3.2. The heat treatment
procedures will be discussed in the following subsections.

37
Figure 3.2 Forced-air electric furnace.
3.2.1 Solution Heat Treatment and Quenching
The solution treatment conditions shown in Table 3.2 were divided into three groups
according to the solution treatment parameters studied, namely solution temperature,
holding time, and quenching medium. The schematic drawing shown in Figure 3.3
describes the sequence of the solution treatments applied. All samples were further aged
at 200 °C for 20 h.

38
Table 3.2 Solution treatment conditions applied to AA2618 samples.
Group
I*
II*
III*
Solution treatment parameters
Temperature (°C)
480, 505, 530 and 545
480, 505, 530 and 545
530
Holding time (h)
5
5
1, 3, 5, 8, and 12
Cooling method
Water Quenching (WQ)
Air Cooling
Water Quenching (WQ)
pSolution
Aging
Solution
Aging
t/h
Group I and III Group II
Figure 3.3 Schematic graphs showing the solution treatment sequences.

39
3.2.2 Artificial and Natural Aging
Samples prepared for aging treatment investigations were first solution treated at
530 °C for 5 h followed by water quenching. They were subsequently grouped and aged
at room temperature, 175, 195 and 215 °C, respectively, for different holding times
ranging from 1 h to 5 weeks. After aging, the samples were air cooled to room
temperature.
3.3 Metallographic Microstructure Examination
For metallographic observations, 10x10 mm samples were cut from the as-cast and
solution-treated alloy samples and mounted in bakélite using a Struers Labopress-3
Mounting Press shown in Figure 3.4. The samples were then ground and polished to the
desired fine finish by means of a Struers Tegrapol-35 Grinder-Polisher, see Figure 3.5.
The grinding was carried out using successively #120, # 240, # 320, # 500, # 800 grit SiC
papers. The polishing was carried out by applying polycrystalline diamond powder
suspended in water with particles of 6 (im and 3 jim for rough and fine polishing,
respectively. Struers oil is used in both polishing stages as a cooling and lubricating
medium. Finally, to produce a mirror-like surface of the samples, the ultimate polishing
stage was completed using 1 |im colloidal silica suspension with water as a coolant and

40
lubricant. After polishing, the mounted samples were washed with a mix of soap and
alcohol, and then dried using compressed air. The samples used for identification of
i phase were etched for 5 s at ambient temperature in etchant solution with
chemical composition of 1 ml HF(40%), 3 ml HC1(38%), 5 ml HNO3(70%) and 191 ml
distilled water.
Figure 3.4 Struers Labopress-3 Mounting Press.

41
Figure 3.5 Struers Tegrapol-35 Grinder-Polisher.
The microstructures were examined by means of a Nikon Eclipse SE600 optical
microscope (Figure 3.6). Phase identification was carried out using a JEOL JSM-6480LV
Scanning Electron Microscope (SEM), shown in Figure 3.7, in conjunction with energy
dispersive X-ray spectrometer (EDS) operated at 20KV.

42
Figure 3.6 Nikon Eclipse SE600 optical microscope.
Figure 3.7 JEOL JSM-6480LV scanning electron microscope.
3.4 DSC Analysis
DSC analysis was carried out on various as-cast and heat-treated samples using a

43
computerized PerkinElmer DSC8000 differential scanning calorimeter shown in Figure
3.8. The weight of the DSC samples was approximately 20 mg and the heating/cooling
rate was fixed at 10 °C/min. A protective gas atmosphere of pure argon was applied.
Figure 3.8 PerkinElmer DSC8000 differential scanning calorimeter.
As-cast samples were analyzed by DSC to determine the melting points of the
intermetallic phases involved in the AA2618 alloy studied. This makes it possible to find
out the optimum solution treatment temperature for the alloy. Samples after solution
treatment and aging were also analyzed by DSC in order to investigate the impact of

44
solution treatment on the dissolution of the intermetallic phases and to detect the phases
responsible for the precipitation hardening process.
3.5 Hardness Test
The hardness measurements were conducted on all the samples using a QualiRock
Rockwell Hardness Tester shown in Figure 3.9. The tester is equipped with a steel ball
indenter with a diameter of 1/16 in. The indenter was first manually pressed into the
sample to a certain degree by a minor load of 10 kgf and the zero datum was established.
A major load of 50 kgf was then applied for a dwell time of 3 s. The resulting Rockwell
number, scale F, represents the difference in depth from the zero datum position as a
result of the application of the major load.

45
Figure 3.9 Rockwell hardness tester.
3.6 Tensile Test
The tensile properties, namely yield strength (YS) at a 0.2% offset strain, ultimate
tensile strength (UTS), and fracture elongation (%E1), were tested for selected conditions
at room temperature using an Instron-3382 universal testing machine shown in Figure
3.10 at a constant strain rate of 2.7 x 10" s . The dimensions of the tensile sample used

46
are shown in Figure 3.11. The tensile properties of each condition are the average values
of 4 test samples.
Figure 3.10 Instron-3382 universal tensile testing machine.
Figure 3.11 The dimensions of the tensile sample.

47
3.7 Electrical Conductivity Measurement
Eddy current testing technique was used for measuring the electrical conductivity of
the AA2618 alloy in all heat-treated conditions. Electrical conductivity was measured on
ground and polished samples in accordance with ASTM standard E 1004-94 using
portable FISCHER SIGMASCOPE®SMP 10 Electrical Conductivity Measurement
System shown in Figure 3.12. An electrical conductivity measurement probe with a
diameter of 11 mm was used for all measurements. The change in the electrical
conductivity was measured at room temperature in terms of percentage of international
annealed copper standard (%IACS). Before conducting electrical conductivity test, the
equipment was calibrated on standards of known conductivity. The measured values were
considered to be accurate within ±0.5 %IACS. Six readings were taken for each sample
and then the average value was calculated for plotting the graph of electrical conductivity
verses aging time.

Figure 3.12 FISCHER SMP 10 Electrical Conductivity Measurement System.
3.8 Quench Sensitivity Test
AA2618 alloy plates were machined into cylindrical bars which would be used for
the quench sensitivity test. The bars were 35 mm in diameter and 160 mm long. They
were surrounded by insulating asbestos except the two ends in order to create a
one-dimensional heat transfer environment along the axial direction of the bar. By this
way, the heat transfer along the sides of the cylinder would not occur and the radial
variation of hardness could be avoided. Small holes were drilled in the bars at different
distances measured from the quench ends to introduce up to seven type K thermocouples
that were connected to a PC-based data logging system, as shown in Figure 3.13, to

record temperature changes during heating and cooling.
The bars were solutionized for 5 h at 530 °C in the forced-air electric furnace shown
in Figure 3.2. The furnace door was then opened and the test bar was grabbed using
insulated gloved hands. The bar was placed on the Jominy end quench fixture as shown
in Figure 3.14 and the water flow to the nozzle was initiated. The time elapsed between
the opening of the furnace door and the initiation of water flow was approximately 5 s.
Once the temperature of the whole bar dropped to below 50 °C, the bar was removed
from the fixture and immediately placed into a room temperature water bath. After
reaching room temperature, the bar was dried and then aged at 215 °C for 1 h.
Figure 3.13 Insulated cylindrical bar and PC-based data logging system.

50
Figure 3.14 Jominy end quench fixture.
After aging, the quench test bars were sliced at the distances corresponding to the
positions of thermocouples. Hardness test was carried out on the cross sectional areas of
the resulting slices using Rockwell F scale. Hardness profiles of AA2618 aluminum
Jominy end quench bars could be plotted versus cooling rate with the intention of
determining the quench sensitivity of AA2618 aluminum alloy.

51
4 RESULTS AND DISCUSSION
4.1 Characterization of the As-cast Microstructure of the AA2618 Alloy
The as-cast microstructure of the received AA2618 aluminum alloy was first
investigated in order to identify the intermetallic phases contained as a basis for the
following research work.
4.1.1 Metallographic Observations
The optical micrograph shown in Figure 4.1 (a) reveals that the as-cast structure of
the AA2618 alloy consists of uniform equiaxed a-Al grains along with a considerably
high amount of coarse intermetallic phases distributed at the aluminum dendrite
boundaries. At higher magnification (Figure 4.1 (b)), three different intermetallic phases,
namely block-like AfeCu, branched AlçFeNi, and trace dark Mg2Si, can be clearly
observed. The optical micrograph shown in Figure 4.2 was obtained from as-cast
AA2618 alloy sample after etching, in which the AlçFeNi phase can be obviously
identified in brown color. The AlçFeNi phase, which exists as block-like or branched

52
particles, is the predominant intermetallic phase in the alloy microstructure.
(a)
(b)
:Al9FeNi
�
t-
"
?*.*.*.
20
Figure 4.1 Optical micrographs showing the as-cast micro structure of the AA2618 alloy
at: (a) low magnification (200x); and (b) high magnification (500x).

53
P9: ^Figure 4.2 Optical micrograph obtained from as-cast 2618 aluminum alloy sample after
etching.
The higher magnification backscattered electron (BSE) images shown in Figure 4.3
display all the intermetallic phases contained in the as-cast AA2618 alloy micro structure
with different features. The bright phases, 2 and 3, might contain Cu, which has a higher
atomic number and consequently can backscatter more electrons to make the phases seem
brighter in the BSE images. On the contrary, the dark phases, 1 and 5, might contain Fe,
which has a lower atomic number making the Fe-containing phases appear darker.
Based on the Energy Dispersive X-Ray (EDX) Analysis results shown in Figure 4.4,

54
the dark gray branched or irregular phase (labeled 1 ) can be determined approximately as
i phase, which was found to be the predominant intermetallic phase in the alloy
microstructure. The bright elongated phase (labeled 2) contains Al, Cu and Ni as major
elements and may be considered as i phase. The bright round phase (labeled 3)
and the lamellar eutectic structure (labeled 4) can be identified as AkCu phase and
Al/AkCuMg eutectic phase, respectively. The gray needle-like phase labelled 5 in Figure
4.4 (b) contains Al, Cu, Fe and Ni and the ratio of Cu to the sum of the Fe and Ni
contents is approximately 2:1, and therefore can be designated as Al7Cu2(Fe,Ni) phase.

55
Figure 4.3 Backscattered electron (BSE) images obtained from as-cast AA2618 sample.

56
I 2 3 4 ^ 6 7 8 9
I 2 3 4 5 5 7 8 9 10
Figure 4.4 EDX spectra corresponding to the intermetallic phases shown in Figure 4.3: (a)
Al9FeNi (labeled 1 ), (b) AlyC^Ni (labeled 2), (c) Al2Cu (labeled 3), (d) Al2CuMg (labeled
4), and (e) Al7Cu2(Fe,Ni) (labeled 5).
4.1.2 DSC Analysis
DSC analysis was used to determine the melting points of the intermetallic phases
formed in the as-cast AA2618 alloy with the intension of optimizing the solution

57
treatment of the alloy. Figure 4.5 shows the relevant DSC curve, which exhibits six
endothermic peaks at 508.3, 539.9, 553.4, 575.5, 634.0 and 636.5 °C. The first peak
represents the low melting point of the eutectic like AkCuMg phase precipitated by a
quaternary eutectic reaction at the last stage of solidification. The second peak is
attributed to the melting of block-like AI2CU phase. The following three peaks may be
related to the melting of intermetallic phases, namely i, Al7Cu2(Fe,Ni) and
i, respectively. The last large peak corresponds to the bulk melting of the primary
a-Al.
3-O)
CL3O"O
LU
OLL
"CD0)
CO
O
2-
1-
0-508.31:
i * i
553.4'C539.9*C 575£^
� / ^ - ^ ^
1 1 *
636.
634.0X:/
J
5TC
1 � |
450 500 550 600
Temperature (°C)
650 700
Figure 4.5 DSC heating curve of as-cast AA2618 alloy.

58
4.2 Effects of Solution Treatment
4.2.1 Metallographic Observations
The BSE images shown in Figure 4.6 (a-d) display the micro structure of the
AA2618 alloy after solution treatment for 5 h at different temperatures ranging from
480 °C to 545 °C. It can be observed that as the solution treatment temperature increases
from 480 °C to 545 °C, the intermetallic phases undergo a pronounced change when
compared to the as-cast micro structure shown in Figure 4.1 and 4.3. Solution treatment
whether at 480 °C or 505 °C can partially dissolve the bright Cu-containing phases,
namely A^Cu, A^CuMg and i, as shown in Figure 4.6 (a-b). After solution
treatment at 530 °C, these phases seem to become almost completely dissolved in the
solid solution. The gray A^FeNi phase was only subjected to partial fragmentation and
spheroidization, particularly at 530 and 545 °C.

59
Figure 4.6 BSE images of AA2618 alloy samples solution treated for 5 h at various
temperatures: (a) 480 °C, (b) 505 °C, (c) 530 °C, and (d) 545 °C.
In order to understand the evolution of the intermetallic phases during the solution
treatments, higher magnification BSE images were captured and the EDX analysis was
applied to analyze the chemical composition. Figure 4.7 shows the BSE image of an
AA2618 alloy sample solution treated at 480 °C for 5 h. The EDX analysis results of the
phases labeled in this image are provided in Table 4.1. It can be found that some
i phase particles were subjected to a fragmentation while the ratio of Cu to Ni
changed from 4:1 to 1:1, which implies that the AlyCatNi phase was transformed during
the solution treatment to a new phase (labeled b) with a formula of A^CuNi. The
and Al7Cu2(Fe,Ni) phases (labeled a and c, respectively) were not obviously affected by
the solution treatment at 480 °C for 5 h.

60
Figure 4.7 Higher magnification BSE image of AA2618 sample solution treated at 480 °C
for 5 h.
Table 4.1 SEM-EDX spectrum analysis of the phases labeled in Figure 4.7 (at. %).
Phase Al Fe Ni Cu Formula of phases
a
b
c
86.42
77.20
78.51
7.34
3.68
6.24
10.03
4.09
�
12.77
13.72
Al9FeNi
Al7CuNi
Al7Cu2(Fe,Ni)
The transformation of the i phase into the A^CuNi phase also occurred
after solution treatment at 505 °C, as can be discerned from Figure 4.8. It is worth noting
from Figure 4.9 and Figure 4.10 that after solution treatments at 530 and 545 °C the

61
A^CuNi phase cannot be observed any more, which indicates that this phase has been
completely dissolved. This observation is in contrary with the work of Feng et al. [Il]
and Wang et al. [12] in which they concluded that no obvious change was observed on
the size and morphology of the Fe or Ni containing compounds. The dissolution of
A^CuNi phases at higher solution temperature would improve the precipitation
hardening effect during aging treatment to a large extent by contributing more Cu atoms
into the supersaturated a-Al solid solution. The remaining A^FeNi and Al7Cu2(Fe,Ni)
phase particles have no obvious composition change. They have been only subjected to
fragmentation and spheroidization.
Figure 4.8 Higher magnification BSE images of AA2618 sample solution treated at
505 °C for 5 h.

62
Figure 4.9 Higher magnification BSE images of AA2618 sample solution treated at
530 °C for 5 h.
Figure 4.10 Higher magnification BSE images of AA2618 sample solution treated at
545 °C for 5 h.

63
Slight overheating happened in the AA2618 alloy at solution temperature of 545 °C,
as shown in Figure 4.11. Low melting point eutectics were melted near the grain
boundaries forming a hard and persistent spherical structure (marked A) which will act as
a potential crack source and consequently decreases the mechanical properties [6].
Therefore, the overheating temperature of the AA2618 alloy can be specified to be
545 °C, whereas the optimum solution treatment temperature is 530 °C. In the practical
industrial applications, the solution temperature should be precisely controlled to keep the
low melting point copper-rich phases away from the detrimental incipient melting, while
dissolving the greatest amount of such phases into the Al matrix.
Figure 4.11 Secondary electron image showing slight overheating in AA2618 alloy
sample solution treated at 545 °C for 5h.

64
Figure 4.12 shows the BSE images of AA2618 alloy samples solution treated at
530 °C for different soaking times ranging from 1 to 12 h. The remarkable changes
caused in the micro structure can be observed after 1 h solution treatment where a large
amount of the bright Cu-containing phases were dissolved into the solid solution and the
AlçFeNi phase was fragmented into smaller discontinuous phase particles. After 5 h
solution treatment, the low melting point Cu-rich phases seem to be fully dissolved into
the Al matrix. The bright phase remained in the matrix was identified as Al7Cu2(Fe,Ni)
phase, as mentioned above. Prolonged solution treatment at 530 °C for 8 h and 12 h did
not bring any further significant changes in the microstructure as compared to solution
treatment for less time.

65
'a
: Î - . '. � î - ; e t ? s
A
�
s
�v
� V
\ �
5 e B s c
Figure 4.12 BSE micrographs of AA2618 samples solution treated at 530 °C for varied
times: (a) 1 h; (b) 3 h; (c) 5 h; (d) 8 h; (e) 12 h.
4.2.2 DSC Analysis
Figure 4.13 shows the DSC heating curves of the AA2618 alloy after solution
treatment for 5 h at different temperatures. After solution treatment at 480 °C, the first
peak disappeared, whereas the height of the second peak has no obvious change. This

66
implies that solution treatment at 480 °C for 5 h could dissolve AkCuMg phase entirely
into the solid solution and has no significant impact on the A^Cu phases. Solution
treatment at 505 °C leads to the disappearance of the endothermic peak corresponding to
the melting of AkCu phase. This observation indicates that solution treatment at 505 °C for
5 h is successful in dissolving the A^Cu phase completely into the solid solution.
Q.Z)o-oc
LLJ
I(0
T3
N
3-
2 -
1 -
0 -
450
As-cast480°C@5h
�505°C@5h530°C@5h545°C@5h
553.4 V508.3X1 539.9-C i i
650500 550 600
Temperature (°C)
Figure 4.13 DSC heating curves of AA2618 samples solutionized for 5 h at different
700
temperatures

67
The intermetallic phases containing Fe or Ni, which melt at higher temperatures as
represented by the subsequent peaks, were not significantly affected by the solution
treatment whether at 480 or 505 °C. The only change that can be observed after these
solution treatments is a slightly right shift occurred in the endothermic peak,
corresponding to the melting of the AlyCmNi phase from 553.4 °C (green dashed line) to
556.0 °C (orange dashed line), which indicates that the composition of this phase might
be changed by the solution treatment. This result is consistent with the preceding
microstructure observation, which revealed the transformation of the A^CmM phase into
the A^CuNi phases. With the increase of solution temperature, the endothermic peak
corresponding to the melting of the A^CuNi phase disappeared, which indicates that this
phase was completely dissolved by the solution treatment at higher temperature. As a
result, the Al matrix has become enriched by Cu element, which would contribute to the
following precipitation hardening effect and promote the mechanical properties of
AA2618alloy.
Solution treatments at higher temperatures 530 and 545 °C did not, however, affect
the Al7Cu2(Fe,Ni) and AfoFeNi phases as can be manifested by the presence of their
endothermic peaks at 575.5 and 634.0 °C, respectively, on the DSC curves corresponding
to these solution temperatures. It is obvious that all these results obtained from the DSC

68
analysis are in line with the preceding microstructure observations.
The DSC heating curves of samples solutionized at 530 °C for different times are
shown in Figure 4.14. It can be found that the first three endothermic peaks are not
obvious after 1 h of solution treatment at 530 °C, which manifests the potential of this
solution temperature to dissolve the AkCu, AkCuMg, and Al7Cu4Ni phases. However,
based on the previous microstructure observations, 5 h of solution treatment at 530 °C is
recommended for the AA2618 alloy to make these phases fully dissolved into the Al
matrix. The Al7Cu2(Fe,Ni) and AlçFeNi phases were not significantly affected even after
extending the solution treatment holding time up to 12 h.

69
1 3 -Q.
LU 2 -
450
As-cast530°C@1h530°C@3h530°C@12h
553.4r508.3"C 539.9-C
500 550 600
Temperature (°C)
650 700
Figure 4.14 DSC heating curves of AA2618 samples solutionized at 530 °C for different
times.
4.2.3 Mechanical Properties
This section will discuss the effects of solution treatment and quenching rate on the
mechanical properties of the AA2618 alloy. It is important to mention here that, after
solution treatment and subsequent quenching, all the mechanical test samples were aged
at 200 °C for 20 h.

70
Figure 4.15 shows the effect of solution temperature on the hardness values of the
AA2618 alloy under water quenching and air cooling conditions. The alloy samples were
solution treated for 5 h at 480, 505, 530, and 545 °C. As can be seen, the hardness attains
the peak value at the solution temperature of 530 °C, where the degree of supersaturation
of the solid solution with the strengthening Mg and Cu elements reaches to the maximum,
because of the complete dissolution of AkCu, AfeCuMg, and AI7CU4M phases. Due to the
insufficient dissolution of strengthening elements, samples treated at solution
temperatures of 480 and 505 °C yield relatively lower hardness values. When the solution
temperature reaches 545 °C, a minor decrease in the hardness can be observed, which is
ascribed to the overheating caused during the solution treatment.
The maximum hardness values for the surface and center water-quenched samples
are 95.8 and 94.4 HRF respectively, while those for the air-cooled samples are 88.3 and
86.8 HRF respectively. The lower hardness values in center samples were due to the low
content of strengthening elements caused by macrosegregation during the casting process.
The air cooled samples exhibit far lower hardness values than those of the
water-quenched samples, which confirms that the quenching rate has a significant impact
on the age-hardening effect. At higher quenching rates, the atoms of the strengthening
elements can be preserved in the solid solution with a higher degree, which would form

71
finer and more dispersive precipitates during the following aging process, thereby
resulting in better mechanical properties.
x̂05
CD
96-
95-
94-
93-
92-
9 1 -
90-
(a)
�
/ T
/ ^
^ L
��� Surface��� Center
470 480 490 500 510 520 530 540 550
Solution temperature ('C)
89-
8 8 -
rr 87-Xco 86 -3CD
"P 85 -coX
84-
83 -
82-
(b)
T
/ /
t~�<
��� Surface��� Center
t
i
470 480 490 500 510 520 530 540 550
Solution temperature (°C)
Figure 4.15 Hardness vs. solution temperature curves of AA2618 alloy solution treated
for 5 h: (a) water quenched samples; (b) air cooled samples.

72
Figure 4.16 shows the hardness curves of surface and center AA2618 alloy samples
solution treated at 530 °C for different times under water quenching condition. The
hardness increases with the solution time up to 5 h, and then slightly decreases with
extending the solution time up to 12 h. Solution treatment at 530 °C for 1 or 3 h is not
long enough to dissolve all the strengthening elements completely into the solid solution,
which results in insufficient precipitate strengthening effect and lower hardness values
after aging treatment.
904 6 8 10 12
Solution time (h)
Figure 4.16 Hardness vs. solution time curves of the AA2618 alloy solutionized at
530 °C.

73
Figure 4.17 demonstrates the tensile properties of the AA2618 alloy for different
solution treatment and quenching conditions. It is obvious that both the ultimate and yield
strengths are improved greatly after heat treatments attaining approximately twice those
in as-cast condition. Increasing the solution temperature from 480 °C to 530 °C increased
the YS, UTS and %E1 by 4.85%, 9.65%, and 13.16%, respectively. Increasing the
solution temperature further to 545 °C did not bring about much improvement in the YS
and UTS and decreased the %E1 by 4.05%. This observation can be explained in the light
of the harmful overheating caused by this high solution temperature.
With regard to the effect of the quenching rate, it is evident that the yield and tensile
strengths of the air cooled sample (258.70 MPa and 329.46 MPa, respectively) are
significantly lower than those of the water quenched sample (304.60 MPa and 358.74
MPa, respectively) for the same solution treatment condition, 530 °C for 5 h. However,
the air cooling could achieve better elongation rate (17.37%) compared to the water
quenching (16.43%).
When the soaking time increased from 5 h to 12 h at 530 °C, both the yield and
tensile strengths were not considerably affected, while the elongation rate increased
slightly from 16.43% to 17.43%, respectively. Based on the microstructure observations

74
and the results of the mechanical properties, the solution treatment carried out at 530 °C
for 5 h can be deemed as an optimum solution treatment for the non-deformed AA2618
alloy.
Figure 4.17 Mechanical properties of AA2618 alloy solution treated and quenched under
different conditions (WQ: water quenching; AC: air cooling).
4.3 Quench Sensitivity of the AA2618 Alloy
Figure 4.18 shows the cooling curves of the Jominy end quenched cylindrical bar, in

75
which the distances corresponding to the thermocouples' positions, namely A to G, were
measured from the quench end of the test bar. According to the DSC curve shown in
Figure 4.26, the quench sensitive temperature range of the AA2618 alloy, within which S
phase would precipitate rapidly, is between 350 °C and 230 °C. Therefore, the average
cooling rates during the temperature interval from 350 °C to 230 °C were calculated for
the specified thermocouples positions and the corresponding hardness values were
measured in order to determine the effect of cooling rate on the hardness of the AA2618
alloy.
Table 4.2 lists the average cooling rates as computed from the curves shown in
Figure 4.18. It is evident from Figure 4.19 that the cooling rate decreases rapidly from
63.49 to 1.29 °C/s with increasing the distance from the quench end. The hardness also
exhibits the same declining tendency as the cooling rate, which implies that the hardness
of the AA2618 alloy is closely related to the cooling rate. However, the declining level of
the hardness value is not so significant, from 102.25 to 99.85 HRF. Therefore, it can be
concluded that the hardness of AA2618 alloy has a declining tendency with the
decreasing quenching rate, while the declining level is not so significant within the
quenching rate range in the present study.

76
600
500-
p
�ati
Tem
pei
400 -
300 -
200 -
100-
0 -
100 200 300
Time (s)
A: 1mmB: 15mmC: 35mmD: 60mmE: 90mmF: 120mmG: 150mm
400 500 600
Figure 4.18 Cooling curves of the Jominy end quenched cylindrical bar (A to G refer to
the thermocouples' positions).
Table 4.2 Average cooling rates computed from the curves shown in Figure 4.18 in the
temperature range between 350 °C and 230 °C.
Identification
Distance (mm)
Average cooling rate (°C/s)
A
1
63.49
B
15
13.11
C
35
4.10
D
60
1.83
E
90
1.40
F
120
1.32
G
150
1.29

77
100
10-
p
Ien
1O
0.1 i
o
- Cooling rate� Hardness
20 40 60 80 100
Distance (mm)
103
102
101
ÏCDI
100
99120 140 160
Figure 4.19 The average cooling rate in the temperature interval from 350 °C to 230 °C,
and the variation of hardness as a function of the distance to the quench end.
4.4 Effects of aging treatments
4.4.1 Mechanical Properties
Figure 4.20 (a) shows the variation in the hardness values of surface samples of the
AA2618 alloy as a function of aging temperature and time. It can be observed that the
maximum alloy hardness of 100.0 HRF was obtained after 36 h of aging at 175 °C. At
this temperature, the alloy could also display hardness values quite close to this peak

78
hardness, after aging for 48 h. Increasing the aging temperature to 195 °C shortened the
time to reach the peak hardness to 10 h. However, the peak hardness value was decreased
(97.4 HRF) when compared to aging condition at 175 °C. It is interesting to note, for both
aging conditions at 175 and 195 °C, that the hardness of the AA2618 alloy tend to
decrease very slowly after reaching peak hardness contrary to the Al-Cu binary alloys, as
shown in Figure 2.9. This observation indicates that AA2618 alloy is not very susceptible
to overaging, which may be due to the low coarsening tendency of its main strengthening
phase, S-AkCuMg [54, 55]. Aging at 215 °C further shortened the time to peak hardness
to 1 h. This aging condition achieved a peak hardness value (96.8 HRF) slightly lower
than that obtained by aging at 195 °C. Prolonged aging at 215 °C beyond 4 h seems to
lead to a rapid decline in the hardness as compared to aging conditions at 175 and 195 °C.
As shown in Figure 4.20 (b), the hardness values of the center samples are lower than that
of surface samples, while they both exhibit the same aging tendency. The peak hardness
values of the center samples aged at 175, 195 and 215 °C are 97.5, 95.5 and 94.8 HRF,
respectively.

100-
ce
20 40 60 80 100 120
Aging time(h)
100
u_ceC/J
90-
85-
^ 3 0 �
75-
70
� ( b ) . ^ - � -
{
1
�~�� 11
t
- ��175°C�^-195°C
1 ' 1
20 100 12040 60 80
Aging time(h)
Figure 4.20 Hardness vs. aging time curves of AA2618 alloy aged at 175, 195 and 215 °C:(a) surface samples and (b) center samples.

80
The tendency of the AA2618 alloy to the natural aging was also investigated by
aging alloy samples at room temperature for aging times ranging from 10 h to 5 weeks.
The corresponding hardness-aging time curves are illustrated in Figure 4.21, revealing
that the AA2618 alloy has a high proneness to the natural aging. As can be observed, the
hardness of surface samples increases rapidly from 76.8 to 90.3 HRF during the first 24 h,
and then continues to increase gradually, reaching 94.5 HRF after 3 weeks. Prolonged
natural aging beyond 3 weeks did not cause any significant change in the hardness values
and an almost constant hardness plateau was obtained. It is important to note that the
peak hardness value obtained by the natural aging is comparable to the peak hardness
values achieved after artificial aging at 195 and 215 °C. The hardness values of the
surface samples are also slightly higher than that of the center samples, as previously
observed in the artificial aging conditions.

81
75-
200 400 600
Aging time (h)
800 1000
Figure 4.21 Hardness vs. aging time curves of the natural aged AA2618 alloy.
Figure 4.22 displays the tensile properties of the AA2618 alloy for different aging
conditions. The variation tendencies of the ultimate and yield strengths are in line with
those of the hardness values. The elongation exhibits exactly the reverse tendency to
those of the strengths. The maximum YS and UTS values of 395.8 and 422.8 MPa,
respectively, were obtained after aging at 175 °C for 36 h. The lowest elongation value of
10.3% is corresponding to the two peak aging conditions at 215 and 195 °C, respectively.
It is interesting to note that, the aging treatments applied to the AA2618 alloy could

82
produce a wide range of satisfactory combinations of strength and ductility, which may
fulfill the specifications of the molding plates.

83
.�y.)
130
E
17 5 V
215 TC
1C l t M 2c S3 iSÏ 4C 4b hO tbAgingtine (h|
13
12.5
12
gc 11.52c 11
10.5
10
A / ' 'i /� /y
0 5 10 15 20 25 30 35 40 45 50 55Aging time (h)
Figure 4.22 Tensile properties of AA2618 alloy under different aging conditions.

84
4.4.2 Electrical Conductivity
Figure 4.23 shows the variation in the electrical conductivity of the AA2618 alloy as
a fonction of aging time at different isothermal holding temperatures. The value of
electrical conductivity of the surface and center samples, in the as-quenched condition,
was found to be 35.72 and 36.1 %IACS, respectively. It is obvious that, except an initial
decrease caused at 175 °C, the electrical conductivity increases with increasing aging
temperature and extending aging time. The increasing rate of the conductivity depends on
both the aging temperature and aging time, so that it decreases with decreasing aging
temperature and increasing aging time. The slopes of the electrical conductivity curves
begin to decrease after aging for 1 h at 215 °C and 10 h at 195 °C, which corresponds to
the response of the hardness to the aging time. During the overaging stage, the electrical
conductivity increases very slowly, which indicates that the supersaturation degree of the
solid solution has been reduced greatly by the aging treatment.
Contrary to the artificial aging, the electrical conductivity of the AA2618 alloy
declines with increasing the natural aging time, as shown in Figure 4.24. The
conductivity decreases abruptly at the beginning of the natural aging and then becomes
extremely sluggish to change with the aging time, displaying an almost constant value of

85
33.33 and 33.61 %IACS for surface and center samples, respectively.
CO
LU
0 10 20 30 40 50 60 70 80 90 100 110
Aging time (h)
4 6 -
34 -
175°C195'C
0 10 20 30 40 50 60 70 80 90 100 110
Aging time (h)
Figure 4.23 Electrical conductivity vs. aging time curves of the AA2618 alloy samples
aged at 175 °C, 195 °C and 215 °C: (a) surface samples, and (b) center samples.

86
36.0-
O 35.5-
~ 35.0-
1 34.5-
O2 34.0-
dj 33.5 -LU
33.0-
1
4
|
��� Center��� Surface
f '
S>�I _T _ iL_Ji
200 400 600
Aging time (h)
800 1000
Figure 4.24 Electrical conductivity vs. aging time curves of the as-quenched AA2618
alloy aged at room temperature.
The decrease in the electrical conductivity of the AA2618 alloy, during the first few
hours of the artificial aging at 175 °C and after the natural aging, is possibly due to the
formation of GPB zones [47]. The effective scattering of electrons by the evenly
dispersed GPB zones leads to increase in the electrical resistance, that is, decrease in the
electrical conductivity. On the other hand, the formation of GPB zones clusters Cu and
Mg atoms, as well as the quenched-in vacancies, thereby purifying the aluminum matrix
from potential scatterers of electrons, namely, increasing the electrical conductivity.

87
However, the purification achieved by the formation of zones is not sufficient to
compensate for the opposite effect, namely the effective scattering of electrons by the
GPB zones, which in turn results in the reduction observed in the electrical conductivity.
At higher artificial aging temperatures, the GPB zones formed rapidly and cannot
persist since the solvus line for the existence of these zones is approached. Consequently,
they dissolve back into the matrix by the diffusion process or become nuclei for the
formation of strengthening S phase precipitates. As the aging temperature increases, the
increasing rate of both electrical conductivity and hardness increases in accordance with
the rate of the formation of S phase precipitates. The initial decrease caused in the
electrical conductivity at 175 °C was not observed at 195 °C and 215 °C, as shown in
Figure 4.23 because the GPB zones formed and then dissolved rapidly at such elevated
temperatures. The increase in the electrical conductivity during the artificial aging can be
explained in terms of the purification of the aluminum matrix. The solute atoms of Cu
and Mg, which act as scatterers of electrons, precipitate out of the aluminum matrix
forming S phase. In contrast with GPB zones, the relatively large S phase precipitates
scatter electrons to a lesser degree. They increase in size as aging temperature or aging
time increase, thus minimizing their scattering effect. The conductivity at 195 °C and
215 °C levels off at a value of 45 % I ACS as a result of maximum purification of Cu and

88
Mg atoms.
The hardness versus electrical conductivity curve, which exhibit a C-shape, is shown
in Figure 4.25. For the natural aging and over aging conditions, the hardness varies
inversely with the electrical conductivity. For the under and peak aging conditions, the
hardness increases proportionally with the electrical conductivity.
105-
CO
100-
95-
90-
85-
80-
75
O O
oo
� Natural agingo Artificial agingA Over aging
30 32 34 36 38 40 42 44 46 48 50
Electrical conductivity (% IACS)
Figure 4.25 Hardness versus electrical conductivity profile of the AA2618 alloy for
different aging conditions.
89
4.4.3 DSC Analysis
Figure 4.26 to Figure 4.29 show the DSC curves of the AA2618 alloy in
as-quenched and different artificial aging conditions. Three main peaks may be identified
in these thermograms [33, 38]: an endothermic peak, A, between 180 and 240 °C,
attributed to the dissolution of GPB zone; an exothermic peak, B, between about 240 and
320 °C, representing the formation of S phase precipitates and a broad endothermic peak,
C, between 340 and 480 °C, corresponding to the progressive dissolution of the S
precipitates [36].
The DSC curves reveal that both the dissolution peak of GPB zones and the
formation peak of S phase decrease with extending aging time (Figure 4.26 and Figure
4.27) and increasing aging temperature (Figure 4.29). This means that the samples aged
for longer times or at higher aging temperatures contained less GPB zones and more S
phase precipitates, that is, more GPB zones were transformed to the main strengthening
contributor S phase [33].
For aging at 175 °C, the heat flow of peaks A and B decrease with increasing aging
time from 4 h to 36 h, as shown in Figure 4.26. It is obvious that peak A for the sample
aged for 4 h is higher than that for the sample aged for 36 h, which indicates that there are

90
plenty of GPB zones formed initially after aging for 4 h at 175 °C. These zones
contribute to a large extent to the strengthening effect produced by this aging condition.
On the other hand, after 36 h of aging, the significant reduction in heat flow of peaks A
and B implies that a large amount of GPB zones had already transformed to S phase.
It can be observed from Figure 4.27 and Figure 4.28 that, after aging at 195 °C for
10 h and 215 °C for 1 h, the S phase formation peak, B, almost disappeared. This
observation implies that the age hardening at these two aging conditions is mainly
dominated by S phase, which forms dense precipitates at the peak hardness stage. Wang
et al. [33] and Lu et al. [16] used the TEM to study the precipitation sequence after
artificial aging of Al-Cu-Mg and AA2618 alloys and concluded that besides S phase, no
significant amounts of other phases or zones were detected at the peak hardness stage.
It can be found that after aging 36 h at 175 °C, which was concluded as the peak
aging condition previously, the S phase formation peak did not completely disappear as
the peak aged conditions at 195 and 215 °C. According to precipitates hardening theory,
the hardening effect depends on both the volume fraction and size of the precipitates. So
the aging behavior of aluminum alloys is closely related to the precipitating rate and
coarsening rate. It can be presumed that, at relatively low temperature 175 °C, the
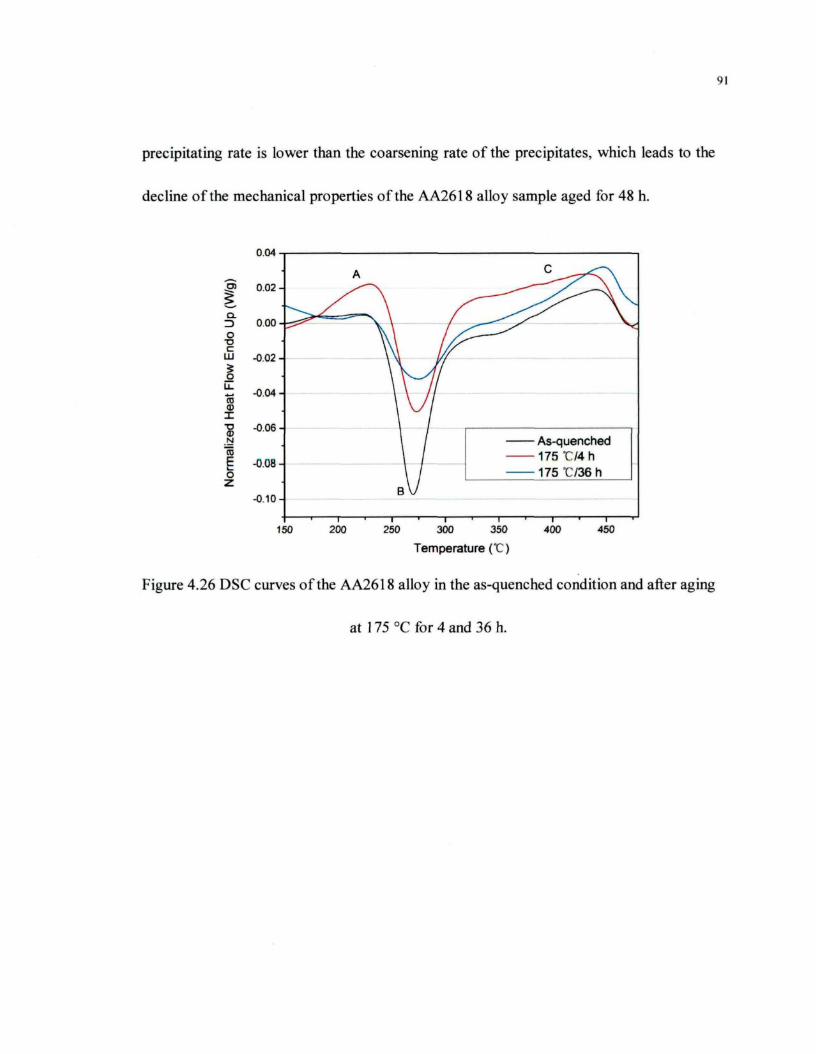
precipitating rate is lower than the coarsening rate of the precipitates, which leads to the
decline of the mechanical properties of the AA2618 alloy sample aged for 48 h.
0.04
1Q .
O-oCLU
.OJ_
roa>I
"Sy
0.02-
0.00-
-0.02-
-0.04-
-0.06-
-0.08-
-0.10-
As-quenched175 °C/4h175"C/36h
150 200 250 300 350
Temperature (°C)
400 450
Figure 4.26 DSC curves of the AA2618 alloy in the as-quenched condition and after aging
at 175 °C for 4 and 36 h.

0.04
D) 0 02-
0.00
O� oc
LU
1LUroCDX
T3CDN
"cô
OZ
-0.02
-0.04
-0 06
-0.08
-0.10
-0.12
- As-quenched-195'C*4h�195'Cx10h
150 200 250 300 350
Temperature ("C)400 450
Figure 4.27 DSC curves of the AA2618 alloy in the as-quenched condition and after aging
at 195 °C for 4 and 10 h.
0.04-
CL
D
vEnd
o
SLU
jHe
at
N
Nor
r
0.02-
0.00-
-0.02 -
-0.04-
-0.06 -
-0.08 -
-0.10-
-0.12
- As-quenched-215"C*1h
150 200 250 300 350
Temperature fC)400 450
Figure 4.28 DSC curves of the AA2618 alloy in the as-quenched condition and after aging
at 215 °C for 1 h.

93
0.04
0.02-
CL= 3O
TD
LU
Lu030)I�aa>N
LUJ
0.00-
-0.02 -
-0.04-
-0.06 -
-0.08 -
-0.10-
As-quenched175°Cx4h195"Cx4h215'C'x4h
150 200 250 300 350 400
Temperature ('C)
450
Figure 4.29 DSC curves of the AA2618 alloy in the as-quenched condition and after aging
for 4 h at different temperatures.
Figure 4.30 shows the DSC curves of the AA2618 alloy samples aged at room
temperature for different times. Besides the three thermal effects mentioned above,
another endothermic effect (labeled a) in temperature range from 150 °C to 180 °C can be
identified, which may be attributed to the dissolution of co-clusters of Cu and Mg. Due to
the extremely slow precipitation speed and the lower temperature during natural aging,
the precipitated co-clusters could be retained, while it could hardly be found during
artificial aging process. The DSC curves also reveal that the formation peak of S phase
has only a slight decline after natural aging for up to 5 week, which indicates that there is
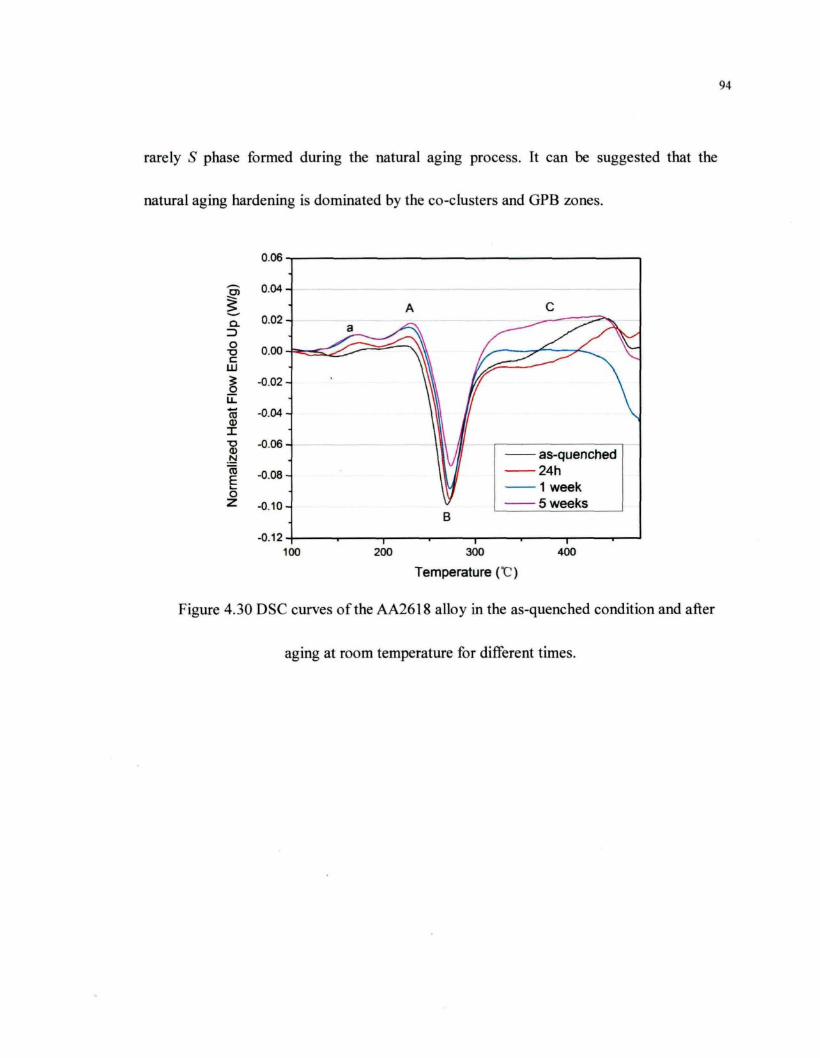
94
rarely S phase formed during the natural aging process. It can be suggested that the
natural aging hardening is dominated by the co-clusters and GPB zones.
0.06
as-quenched24h1 week5 weeks
200 300
Temperature (°C)
400
Figure 4.30 DSC curves of the AA2618 alloy in the as-quenched condition and after
aging at room temperature for different times.
95
5 CONCLUSIONS AND RECOMMENDATIONS
5.1 Conclusions
An investigation was carried out on the effects of the heat treatment on the
microstructure and mechanical properties of the AA2618 DC cast alloy proposed for the
manufacturing of precision molding plates. Based on the results obtained, the following
conclusions can be drawn:
(1) The microstructure of the as-cast AA2618 alloy is composed of AfeCu, AkCuMg,
AMDuiNi, Al7Cu2(Fe,Ni), and AlçFeNi intermetallic phases, distributed at a-Al
dendrite boundaries.
(2) The solution treatment carried out at 530 °C for 5 h was found to be the
optimum solution treatment, by which the AkCuMg, AI2CU and AlyCityNi
phases could be dissolved completely into the solid solution, whereas the
Al7Cu2(Fe,Ni) and AlçFeNi phases were only subjected to fragmentation and
spheroidization.

96
(3) The effect of solution soaking time on the microstructure and mechanical
properties of the AA2618 alloy is not as significant as that of the solution
temperature.
(4) AA2618 alloy is a quench sensitive aluminum alloy. With the same solution and
aging conditions, the air-cooled samples yields lower hardness and strength
values than water-quenched samples. The Jominy end quench test results
demonstrated that the hardness value of the AA2618 alloy declines with
decreasing cooling rate.
(5) The peak-aged conditions of the AA2618 alloy were attained after aging for 36
h at 175 °C, 10 h at 195 °C and 1 h at 215 °C with surface hardness values of
100.0, 97.4 and 96.8 HRF, and center hardness values of 97.5, 95.5 and 94.8
HRF, respectively.
(6) The aging treatments applied to the AA2618 alloy result in different
combinations of strength and ductility, which may satisfactorily fulfill the
specifications of the large mold manufacturers.
(7) AA2618 alloy was found to be prone to the natural aging, displaying hardness

97
values comparable to those obtained by the artificial aging at 195 and 215 °C.
(8) DSC analysis suggested that the main strengthening phase of the AA2618 alloy,
under artificial aging, is S-AkCuMg phase, whereas the strengthening effect
caused by the natural aging is probably attributed to the formation of Cu-Mg
co-clusters and/or GPB zones.
(9) The electrical conductivity of the AA2618 alloy decreased during the first 4
hours of aging at 175 °C and during the whole natural aging process, due to the
formation of GPB zones and increased over other artificial aging periods, due to
the purification of the aluminum matrix.
5.2 Recommendations for the future works
(1) Quench sensitivity test at much lower cooling rates can be further studied to
reveal the relationship between mechanical properties of the AA2618 alloy and
lower quenching rates.
(2) Presently, the internal residual stress of AA2618 alloy induced after solution
treatment and quenching is still a problem affecting the dimensional stability of
the final cast plates. This problem is very essential to the practical production

98
and needs more investigation work to be done. The effects of heat treatment
procedures (solution treatment, quenching, and aging) on the residual stress
developed in the AA2618 cast plates may therefore be recommended to study
by implementing such residual stress measurement techniques as ultrasonic,
X-ray diffraction, crack compliance, and hole drilling methods.

99
REFERENCES
1. I. J. Polmear, Light alloys : metallurgy of the light metals. (J. Wiley &
Sons, New York, 1995).
2. American Society for Metals, ASM handbook. Volume 2, Properties and
selection: nonferrous alloys and special-purpose materials. (ASM International,
Materials Park, OH, 1990).
3. I. Ôzbek, A study on the re-solution heat treatment of AA 2618
aluminum alloy. Materials Characterization 58, 312 (2007).
4. American Society for Metals, ASM handbook. Volume 2, Properties and
selection : nonferrous alloys and special-purpose materials. (American Society
for Metals, Metals Park, Ohio, 1979).
5. J. G. Kaufman, Properties of aluminum alloys: tensile, creep, and fatigue
data at high and low temperatures. (ASM International ; Aluminum Association,
Materials Park, Ohio; Washington, D.C., 1999).
6. J. E. Hatch, Aluminum Association, American Society for Metals,
Aluminum : properties and physical metallurgy. (American Society for Metals,
Metals Park, Ohio, 1984).
7. R. A. Higgins, Engineering metallurgy part I : Applied physical
metallurgy. (R.E. Krieger Pub. Co., Malabar, Fla., 1983).
8. E. C. Rollason, in Metallurgy for engineers. (Edward Arnold, London,
1973), pp. 277-279.
9. R. N. Wilson, P. J. E. Forsyth, Effects of Additions of 1% Iron and 1%

100
Nickel on Age-hardening of an Aluminum-2.5%Copper-1.2%Magnesium Alloy.
Journal of the institute of metals 94, 8 (1966).
10. R. P. Underhill, P. S. Grant, B. Cantor, MICROSTRUCTURE OF
SPRAY-FORMED AL ALLOY-2618. Materials & Design 14, 45 (Feb, 1993).
11. W. Feng, X. Baiqing, Z. Yongan, L. Zhihui, L. Peiyue, Microstructural
characterization of an Al-Cu-Mg alloy containing Fe and Ni. Journal of Alloys and
Compounds 487, 445 (2009).
12. G. Wang, B. Xiong, Y. Zhang, Z. Li, P. Li, Microstructural characterization
of as-cast and homogenized 2D70 aluminum alloy. International Journal of
Minerals, Metallurgy and Materials 16,427 (2009).
13. I. N. A. Oguocha, S. Yannacopoulos, Y. Jin, The structure of AlxFeNi
phase in Al-Cu-Mg-Fe-Ni alloy (AA2618). Journal of Materials Science 31, 5615
(1996).
14. S. C. Bergsma, X. Li, M. E. Kassner, Effects of thermal processing and
copper additions on the mechanical properties of aluminum alloy ingot AA 2618.
J. Mater. Eng. Perform. 5,100 (Feb, 1996).
15. R. N. Wilson, D. M. Moore, P. J. E. Forsyth, EFFECTS OF 3.25 PERCENT
SILICON ON PRECIPITATION PROCESSES IN AN ALUMINIUM-2.5 PERCENT
COPPER-1.2 PERCENT MAGNESIUM ALLOY. Journal of the institute of metals 95,
177 (1967).
16. H. Lu, P. Kadolkar, K. Nakazawa, T. Ando, C. A. Blue, Precipitation
behavior of AA2618. Metall. Mater. Trans. A-Phys. Metall. Mater. Sci. 38A, 2379
(Oct, 2007).
17. J. H. Wang, D. Q. Yi, B. Wang, Microstructure and properties of 2618-Ti
heat resistant aluminum alloy. Trans. Nonferrous Met. Soc. China 13, 590 (Jun,
2003).
18. K. Yu, W. Li, S. Li, J. Zhao, Mechanical properties and microstructure of
aluminum alloy 2618 with AI3(Sc, Zr) phases. Materials Science and Engineering

101
A 368, 88 (2004).
19. K. R. Van Horn, Aluminum, vol.1, properties, physical metallurgy and
phase diagrams. (American Society for Metals, Metals Park (Ohio), 1967).
20. X. Y. Liu et al., Effects of solution treatment on the microstructure and
mechanical properties of Al-Cu-Mg-Ag alloy. Materials & Design 31, 4392 (2010).
21. W. A. Anderson, in Precipitation from Solid Solution, A. S. f. Metals, Ed.
(1959), pp. 150-207.
22. M. Tiryakioglu, R. T. Shuey, Quench sensitivity of 2219-T87 aluminum
alloy plate. Materials Science and Engineering: A 527, 5033 (2010).
23. I. N. A. Oguocha, M. Radjabi, S. Yannacopoulos, The effect of cooling
rate on the quench sensitivity of 2618 AI/AI2O3 MMC. Journal of Materials
Science 35, 5629 (2000).
24. J. W. Newkirk, D. S. MacKenzie, The Jominy end quench for light-weight
alloy development. J. Mater. Eng. Perform. 9,408 (Aug, 2000).
25. J. L. Cavazos, R. Colas, Quench sensitivity of a heat treatable aluminum
alloy. Materials Science and Engineering: A 363,171 (2003).
26. C. Oksuz, O. Sen, R. Bozdogan, M. Cigdem, Quench Sensitivity of
Medium and High Strength Aluminium Alloys. Mater. Test-Mater. Compon. Techn.
Appl. 52, 367 (2010).
27. W. E. Jominy, A. L Boegehold, ASM Trans. 27, (1939).
28. B. M. Loring, W. H. Baer, G. M. Carlton, THE USE OF THE JOMINY TEST
IN STUDYING COMMERCIAL AGE-HARDENING ALUMINUM ALLOYS. Transactions
of the American Institute of Mining and Metallurgical Engineers 175,401 (1948).
29. H. K. Hardy, THE AGEING CHARACTERISTICS OF BINARY
ALUMINIUM-COPPER ALLOYS. Journal of the institute of metals 79, 321 (1951).

102
30. Y. A. Bagaryatsky, Structural changes on aging Al-Cu-Mg alloys. Dokl.
Akad. Nauk SSSR 87, 397 (1952).
31. J. M. Silcock, THE STRUCTURAL AGEING CHARACTERISTICS OF
AL-CU-MG ALLOYS WITH COPPER-MAGNESIUM WEIGHT RATIOS OF 7-1 AND
2.2-1. Journal of the institute of metals 89, 203 (1961).
32. H. Perlitz, A. Westgren, The crystal structure of AI2CuMg. Ark. Kemi,
Mineral. Geol. 16 B, 1 (1943).
33. S. C. Wang, M. J. Starink, N. Gao, Precipitation hardening in Al-Cu-Mg
alloys revisited. Scr. Mater. 54, 287 (Jan, 2006).
34. S. C. Wang, M. J. Starink, Two types of S phase precipitates in Al-Cu-Mg
alloys. Acta Mater. 55, 933 (Feb, 2007).
35. S. P. Ringer, K. Hono, T. Sakurai, I. J. Polmear, Cluster hardening in an
aged Al-Cu-Mg alloy. Scr. Mater. 36, 517 (1997).
36. M. J. Starink, N. Gao, J. L. Yan, The origins of room temperature
hardening of Al-Cu-Mg alloys. Materials Science and Engineering a-Structural
Materials Properties Microstructure and Processing 387, 222 (Dec, 2004).
37. S. P. Ringer, S. K. Caraher, I. J. Polmear, Response to comments on
cluster hardening in an aged Al-Cu-Mg alloy. Scr. Mater. 39,1559 (1998).
38. N. Gao, L. Davin, S. Wang, A. Cerezo, M. J. Starink, in Aluminum Alloys
2002: Their Physical and Mechanical Properties Pts 1-3, P. J. Gregson, S. J. Harris,
Eds. (Trans Tech Publications Ltd, Zurich-Uetikon, 2002), vol. 396-4, pp. 923-928.
39. B. Klobes, K. Maier, T. E. M. Staab, Natural ageing of Al-Cu-Mg revisited
from a local perspective. Materials Science and Engineering: A 528, 3253 (2011).
40. J. Wang, D. Yi, X. Su, F. Yin, Influence of deformation ageing treatment
on microstructure and properties of aluminum alloy 2618. Materials
Characterization 59, 965 (2008).

103
41. F. Novy, M. Janecek, R. Kral, Microstructure changes in a 2618
aluminium alloy during ageing and creep. Journal of Alloys and Compounds 487,146 (2009).
42. P. Villars, A. Prince, H. Okamoto, Handbook of ternary alloy phase
diagrams. (ASM International, [Materials Park, OH], 1995).
43. D. Turnbull, H. S. Rosenbaum, H. N. Treaftis, KINETICS OF CLUSTERING
IN SOME ALUMINUM ALLOYS. Acta Metallurgica 8, 277 (1960).
44. K. M. Entwistle, K. I. Koo, J. H. Fell, EFFECT OF VACANCY/IMPURITY
INTERACTION ON RATE OF QUENCH-AGE-HARDENING IN ALUMINIUM-COPPER
ALLOYS. Journal of the institute of metals 91, 84 (1962).
45. Y. Gefen, M. Rosen, A. Rosen, AGING PHENOMENA IN DURALUMINUM
2024 STUDIED BY RESISTOMETRY AND HARDNESS. Materials Science and
Engineering 8,181 (1971).
46. P. L Rossiter, P. Wells, ELECTRICAL RESISTIVITY DURING
PRE-PRECIPITATION PROCESSES. Philosophical Magazine 24,425 (1971).
47. M. Rosen, E. Horowitz, L. Swartzendruber, S. Fick, R. Mehrabian, The
aging process in aluminum alloy 2024 studied by means of eddy currents.
Materials Science and Engineering 53,191 (1982).
48. C. H. Gur, I. Yildiz, Utilization of Non-destructive Methods for
Determining the Effect of Age-Hardening on Impact Toughness of 2024 Al-Cu-Mg
Alloy. Journal of Nondestructive Evaluation 27, 99 (Dec, 2008).
49. C. H. Gur, I. Yildiz, Non-destructive investigation on the effect of
precipitation hardening on impact toughness of 7020 Al-Zn-Mg alloy. Materials
Science and Engineering a-Structural Materials Properties Microstructure and
Processing 382, 395 (Sep, 2004).
50. C. Panseri, T. Federighi, A RESISTOMETRIC STUDY OF
PRE-PRECIPITATION IN AL-10-PERCENT ZN. Acta Metallurgica 8, 217 (1960).

104
51. F. Tariq, N. Naz, R. Baloch, F. Faisal, Characterization of Material
Properties of 2xxx Series Al-Alloys by Non Destructive Testing Techniques. Journal
of Nondestructive Evaluation 31,17 (2012).
52. E. W. Lee et al., The effect of thermal exposure on the electrical
conductivity and static mechanical behavior of several age hardenable aluminum
alloys. Eng. Fail. Anal. 14,1538 (Dec, 2007).
53. M. A. Salazar-Guapuriche, Y. Y. Zhao, A. Pitman, A. Greene, in
Aluminium Alloys 2006, Pts 1 and 2: Research through Innovation and Technology,
W. J. Poole, M. A. Wells, D. J. Lloyd, Eds. (Trans Tech Publications Ltd,
Zurich-Uetikon, 2006), vol. 519-521, pp. 853-858.
54. W. Rainforth, H. Jones, Coarsening of S'-AI2CuMg in Al-Cu-Mg base
alloys. Journal of Materials Science Letters 16,420 (1997).
55. L. M. Rylands, W. M. Rainforth, H. Jones, Coarsening rates of S1
precipitates in Al-4.1wt% Cu-1.6wt% Mg alloy during extended treatment at
200 °C. Philosophical Magazine Letters 76, 63 (Aug, 1997).