soil erosion assessment using rusle model and gis in juma
TRANSCRIPT

Revista Brasileira de Geografia Física v.14, n.05 (2021) 2931-2945
2931 Duarte., M., L., silva filho., E., P., costa., H., S., acácio., T., A.
Soil Erosion Assessment Using RUSLE Model and GIS in Juma Watershed,
Southern Amazonas State
Miqueias Lima Duarte¹, Eliomar Pereira da Silva Filho², Heron Salazar Costa3 Tatiana Acácio da Silva4
¹Doutorando em Ciências Ambientais - UNESP, Campus Sorocaba (SP), e-mail: [email protected] (autor correspondente); ²Prof Dr do
Programa de Pós-Graduação em Geografia – UNIR, Porto Velho (RO), e-mail: [email protected]; 3Prof Dr. do Instituto de Educação Agricultura e
Ambiente – IEAA/UFAM, Humaitá (AM), e-mail: [email protected]; 4Doutoranda em Ciências Ambientais - UNESP, Campus Sorocaba (SP), e-
mail: [email protected] Artigo recebido em 12/08/2020 e aceito em 02/08/2021
A B S T R A C T
The spread of deforestation in the Amazon region is a cause for concern, seeing as the breakdown of soil-forest
equilibrium provokes and possibly accelerates several processes, including superficial erosion. This process is one of the
major causes of soil degradation worldwide. The Revised Universal Soil Loss Equation (RUSLE) is a well-established
and widely applied indirect method used to estimate soil loss, generating information that helps the conservation and
proper management of soil and subsiding the policies of land use and occupation. This study estimated the potential of
loss by laminar erosion of soil in the area of the basin of the Juma river, located in the municipality of Apuí, in the
Southern Amazonas State. The RUSLE method was used to estimate soil loss in conjunction with GIS techniques. The
results showed a predominance of areas with a high Natural Potential (NP) for erosion (200 to 600 t.ha -1.y-1), occupying
about 77.58% of the examined region, and indicated that this high index is related to the LS factor. In relation to Soil Loss
(SL), it was observed that there is a predominance of small potential (0 to 10 t.ha-1.y-1), occurring in 72.96% of the area,
and the highest indices of soil loss (> 120 t.ha-1.y-1) were observed only in places occupied by exposed soil or farming
areas where there are no conservation practices associated with terrain slope in place, which reiterates the importance of
the adoption of appropriate agricultural practices.
Keywords: Soil loss, RUSLE, Juma watershed, Brazilian Amazon.
Avaliação da Erosão do Solo Usando o Modelo RUSLE e SIG na bacia
hidrográfica do rio Juma, no Sul do Estado do Amazonas R E S U M O O aumento do desmatamento na Amazônia é motivo de preocupação, visto que com a quebra do equilíbrio solo-floresta
provoca o aceleramento de vários impactos, incluindo a erosão superficial do solo. Esse processo é uma das principais
causas de degradação do solo em todo o mundo. A Equação Universal de Perda de Solo (RUSLE) é um método indireto
bem estabelecido e amplamente utilizado para estimar a perda do solo, gerando informações que ajudam na conservação
e manejo adequado do solo e subsidiando as políticas de uso e ocupação. Este estudo estimou o potencial de perda por
erosão laminar do solo na bacia do rio Juma, localizada no município de Apuí, no Sul do Estado do Amazonas. O método
RUSLE foi utilizado para estimar a perda de solo em conjunto com as técnicas de SIG. Os resultados mostraram a
predominância de áreas com alto Potencial Natural (PN) de erosão (200 a 600 t.ha-1.ano-1), ocupando cerca de 77,58% da
região avaliada, indicando que esse alto índice está relacionado ao fator LS. Em relação à Perda de Solo (PS), observou-
se que há predominância de pequeno potencial (0 a 10 t.ha-1.ano-1), ocorrendo em 72,96% da área, e os maiores índices
de perda de solo (> 120 t.ha-1.ano-1) foram observados apenas em locais ocupados por solo exposto ou áreas agrícolas
com ausência de práticas de conservação associadas à inclinação acentuada do terreno, o que reitera a importância da
adoção de práticas agrícolas adequadas.
Palavras-chave: Perda de Solo, RUSLE, Bacia do Rio Juma, Amazônia Brasileira.
Introduction
Soil erosion is a natural geological process
that shapes the landscape through the breakdown,
transport and sedimentation of the particles that
form the superficial layer that covers parts of the
Earth's crust (Rangel et al., 2019; Pereira e Cabral,
2021). When it occurs expeditiously, this process
can result in the loss of soil capacity to sustain plant
ISSN:1984-2295
Revista Brasileira de
Geografia Física Homepage:https://periodicos.ufpe.br/revistas/rbgfe

Revista Brasileira de Geografia Física v.14, n.05 (2021) 2931-2945
2932 Duarte., M., L., silva filho., E., P., costa., H., S., acácio., T., A.
production. Nowadays, particularly due to the
dependence that mankind has on agricultural
production to meet its material needs for survival,
the loss of the productive capacity of soil cannot be
neglected, as it is almost a matter of survival. In
Brazil, the concern with this degradation process is
greater with Amazonian soils that are undergoing
removal of their natural cover for agricultural use
(Duarte et al., 2019; Reis et al., 2021).
In recent decades, the Amazon Region has
been affected by a series of environmental impacts,
mainly due to deforestation and fires associated
with the process of expanding agricultural
boundaries and increasing timber exploitation and
prospection (Duarte et al., 2020; Mataveli et al.,
2021).
Despite the impressive immensity of the
Amazon region, the fragility of this system is also
noteworthy. As already highlighted in several
studies on the performance of vegetation cover in
the protection of soils in the Amazon (Flores e
Holmgren, 2021; Reis et al., 2021), if the
breakdown of soil-vegetation equilibrium occurs,
an increase in intense erosion processes can be
observed, along with the compaction and
impoverishment of soils (Duarte et al., 2020),
consequently leading to the abandonment of
unproductive areas (Silva et al., 2021), which
contributes to increasing pressure to open new
areas (Duarte et al., 2020).
Soil erosion may lead to the disablement of
agricultural areas, soil compaction, removal of
nutrients from the superficial layer and the siltation
of water bodies. Rangel et al. (2019) and Duarte et
al. (2020) call attention to both inappropriate use
and occupation and the lack of conservation
practices as some of the main factors responsible
for soil erosion.
In the search for measures to combat
erosion damage, several methods of assessing
environmental impacts and soil loss have been
widely used as tools in agro-environmental
planning. In recent decades, several models of soil
erosion measurement have been developed.
Among them, we highlight the Revised Universal
Soil Loss Equation, RUSLE, which has presented
consistent results (Benavidez et al., 2018; Vansan
e Tomazoni, 2020; Pereira e Cabral, 2021).
RUSLE is a simple model for predicting
the laminar erosion of soils based on the integration
between climatic, pedological, topographic and
land use dynamics integrated in the Geographic
Information System (GIS) environment. Due to its
simplicity and the availability of input data, the
RUSLE model is still the most widely used to
estimate the average annual loss of soil over large
areas, with acceptable accuracy (Kayet et al., 2018;
Vansan e Tomazoni, 2020).
The municipality of Apuí, in the Southern
Amazonas State, located in a strategic region
between the state of Pará and Rondônia (known as
the "Deforestation Arc"), has undergone
considerable loss of natural vegetation coverage
due to the expansion of agricultural and livestock
activity (Sathler et al., 2018). According to data
from the National Food Supply Company, CONAB
in Portuguese (Brazil, 2017), in the last harvest, the
municipality presented itself as a major exponent
in the production of grains of the state of
Amazonas. However, there is insufficient
information regarding the susceptibility of soils in
this region to erosion.
Due to the lack of information on soil loss
that may occur in the region as a result of the
removal of natural forest cover, this work was
developed with the general objective of
contributing to the gathering of information
regarding the potential for soil loss by erosion of
Amazonian soils, estimating and mapping the
Natural Potential (NP) and Soil Loss (SL) in a
laminar way with the application of the quantitative
model RUSLE in the Juma watershed, in the
municipality of Apuí located in the southern region
of the state of Amazonas.
Materials and methods
Study area
The study area is located in the
municipality of Apuí, in the Southern Amazonas
State, under geographic coordinates 7°3'41.85" at
7°26'46.49" South and 59°54'6.55" at 60°12'41.47"
West (Figure 1). Located in the 5th Sub-Region of
the Madeira River, the municipality of Apuí is
limited to the municipalities of Novo Aripuanã,
Borba, Maués, Manicoré and the state of Mato
Grosso (MT).
The municipality of Apuí emerged from
the largest agricultural settlement project in South
America (Juma river Settlement Project, Decree n°
238/1982), during the military government (Leal,
2009). The BR 230 (Transamazonian highway),
which connects the municipality of Humaitá-AM
(about 397 km, SW) and the municipality of
Taraoacanga-PA (about 300 km away), is the main
access road and outlet of production in the
municipality.
According to Köppen climatic
classification, the climatic characteristics in the
municipality of Apuí are hot and humid, with a
low-pronounced dry season, of the type "Am". The

Revista Brasileira de Geografia Física v.14, n.05 (2021) 2931-2945
2933 Duarte., M., L., silva filho., E., P., costa., H., S., acácio., T., A.
average annual temperature varies between 25 and
27 °C, with averages of 26.3 °C, and the relative
humidity is established at 85%, with the level of
precipitation above 2,200 mm.y-1. The rainiest
period in the Apuí region corresponds to the quarter
from January to March and the least rainy season
(drier period) is from July to August. The lowest
temperatures occur in the months of June and July,
with absolute minimums of 10 to 16 °C (Alvares et
al., 2013).
Figure 1. Location of the Juma River Watershed.
Revised Universal Soil Loss Equation-RUSLE
We chose the Revised Universal Soil Loss
Equation-RUSLE for the ease of acquisition of
input data, mainly in remote regions of difficult
access as in the Amazon region. Although the
USLE has well-known weaknesses, it is still the
only model that allows medium and large size areas
to be easily evaluated (Benavidez et al., 2018;
Devátý et al., 2019).
The results of the soil loss estimates
obtained in this study were compared to soil loss
data obtained through field experiments conducted
in the Amazon region, in order to verify the
consistency of soil loss estimation performed by
the method RUSLE.
Estimation of Annual Soil Loss
As proposed by Wischmeier and Smith
(1978), in the model of the Universal Soil Loss
Equation-USLE, the annual soil loss in tonnes per
hectare is expressed by Equation 1.
𝐴 = 𝑅 ∗ 𝐾 ∗ 𝐿 ∗ 𝑆 ∗ 𝐶 ∗ 𝑃 (1)
Where A corresponds to the Soil Loss (t.ha-
1.y-1); R = Rainfall erosivity (MJ.mm.ha-1 .h-1.y-1);
K = Soil erodibility (t.ha.h.ha-1.MJ-1.mm-1); L*S
topographic factor (dimensionless); C = soil cover
and management (dimensionless) and P =
Conservationist practices (dimensionless).
Modifications have been proposed in some
terms of the USLE to better approximate the
estimates to the data in experimental plots. In this
work, we adopted the Revised Universal Soil Loss
Equation-RUSLE based on the USLE model
proposed by Wischmeier and Smith (1978), which
was developed by a group of scientists in the
United States and soil conservationists that have
had experiences with erosive processes (Benavidez
et al., 2018; USDA, 2018).
In order to observe the effects of vegetation
cover dynamics on soil loss rates in the study area
more objectively, the Natural Potential (NP) of soil
loss was obtained from the multiplication of natural
factors (R*K*L*S), The NP, when presented in a
cartographic form, allows a clear interpretation of
the risk of erosion in a hydrographic basin
depending on the natural characteristics of the
physical environment (Durães e Mello, 2016;
Morais e Sales, 2017).
Data Acquisition and Processing
The acquisition of spatial information for
the application of the RUSLE method was based on
access to public domain databases deposited in
international, federal, state and municipal bodies,

Revista Brasileira de Geografia Física v.14, n.05 (2021) 2931-2945
2934 Duarte., M., L., silva filho., E., P., costa., H., S., acácio., T., A.
as well as soil sampling in field for information
validation. The cartographic products were made
using QGIS software (version 3.2.3 "Bonn") with
the Mercator/UTM Universal Transversa
Coordinate reference system, and the reference
base SIRGAS 2000, zone 20S.
R factor determination
Rainfall erosivity was obtained by
applying the method proposed by Oliveira JR and
Medina (1990), developed for the Manaus/AM
Region (Equation 2).
𝑅 = 3.76 ∗ (𝑀𝑥
2
𝐴) + 42.77 (2)
Where 𝑀𝑥 corresponds to the average
monthly precipitation (mm); and A corresponds to
the average annual rainfall (mm). Due to the low
density of pluvimetric stations for the region, the R
factor was determined from monthly precipitation
data obtained through the radar sensor Tropical
Rainfall Measuring Mission (TRMM). The data
was obtained from the website of the National
Aeronautics and Space Administration/NASA
(NASA, 2018) with an observation period of 18
years (1998-2016). This data set relates to the
3b42-V7 product made available in GeoTiff format
with spatial resolution of 0.25°X 0.25° (Nastos et
al., 2016). Almeida et al. (2015) evaluated this
product for the Amazonas State and concluded that
the data of the TRMM satellite can contribute to
rainfall studies in the region.
The data, covering18 years of
precipitation, was grouped, the average monthly
values were calculated, then the equation proposed
by Oliveira JR and Medina was applied (1990),
obtaining the average annual erosivity, which was
interpolated by the Inverse Distance
Weighting/IDW method. The average monthly
precipitation and erosivity values were transformed
into relative percentages and presented in chart
form.
K factor determination
Soil erodibility was determined by the
Denardin (1990) method, which proposed an
adaptation to the monogram of Wischmeier et al.
(1978) for the calculation of global erodibility. The
calculations were performed using Equation 3.
𝐾 = 0.0000748𝑀 + 0.00448059𝑃 − 0.0631175𝐷𝑀𝑃 + 0.01039567𝑅 (3)
Where:
K = global soil erodibility of Denardin (1990),
t.ha.h.ha-1.MJ-1.mm-1;
M = {(fine sand + silt) x [(fine sand + Silt) + coarse
sand]}, %;
P = codified permeability according to Galindo and
Margolis (1989);
DMP = {[(0.65 x coarse sand) + (0.15 x fine sand)
+ (0.0117 x silt) + (0.00024 x clay)]/100}, mm;
R = [sand – very fine sand x (%MO/100)].
Based on the Brazilian Soil Classification
System – SiBCS (EMBRAPA, 2018), using the
soil map provided by EMBRAPA/PA
(EMBRAPA, 2018), scale 1:100,000 (Vila Apuí
Articulation), 8 soil categories were identified in
the area of study. However, soil samples were
randomly sampled only in the larger orders
(Argisols, Latosols and Spodosols). The definition
of the sample number was based on the percentage
of spatial occurrence of the suborders within each
order.
The 10 sampling points of the Argisol
order were distributed among the following
identified suborders: (four of the Red Argisol class,
five of the Yellow Argisol class, and one of the
Red-Yellow Argisol class). The 10 sample points
for the Latosol order were distributed as follows
among the suborders: (three in the Yellow Latosol
class, three in the Red Latosol class, and four in the
Red-Yellow Latosol class). Another 10 points were
distributed in the area of occurrence of the suborder
Humuvic Spodosol, and one point for the Haplic
Gleysol class.
Soil samples were taken from February
19th to 23rd, 2018. For each sampling point, a
deformed sample was collected in the form of a
lump, from the superficial layer (0-20 cm), and was
subsequently dried and defuncted to obtain the
TFSA (Dried Fine Soil in Open Air), according to
the methodology described by EMBRAPA (1997).
The TFSA samples were subjected to
physical (granulometric) and chemical (organic
matter) analysis in the EMBRAPA-Rondônia Soil
Laboratory. The granulometric analysis was
performed by the pipette method, using a 1.0 mol
L-1 NaOH solution as a chemical dispersing, with a
resting time of 16 hours, as according to
EMBRAPA (1997) methodology, which is used
here to obtain the fractions of sand, silt and clay.
The particle size distribution of the sand
fraction was determined by means of a sieve
shaker, model SOLOTEST. Each sample of sand
fraction from each soil sample was shaken for 3
minutes using the common sieves with meshes of
2mm; 1mm; 0.5mm; 0.250mm; 0.125mm and
0.053mm.
Organic Matter (OM) was estimated based
on the organic carbon (CO) analysis according to
Walkley-Black methodology, modified by
Yeomans and Bremner (1988), based on the

Revista Brasileira de Geografia Física v.14, n.05 (2021) 2931-2945
2935 Duarte., M., L., silva filho., E., P., costa., H., S., acácio., T., A.
premise that the hummus contains approximately
58% of carbon. Thus, the MO was estimated by
Equation 4
MO = CO x 1.724 (4)
Where CO corresponds to the soil organic
carbon obtained in the analysis.
The soil structure was determined directly
in the field, defined by the dimensions of the
structural element classes, based on the classes
established in the Technical Handbook of Pedology
(IBGE, 2007), and codified in the following
classes: (i) very small granular = 1; (ii) small
granular = 2; (iii) medium to large granular = 3 and
(iv) blocks, laminar or massive = 4.
The permeability was determined
according to the texture and degree of soil structure
and codified based on the following classes: (i) fast
= 1; (ii) moderate to rapid = 2; (iii) moderate = 3;
(iv) slow to moderate; and (v) slow = 5, according
to the method proposed by Galindo and Margolis
(1989).
LS factor determination The topographic factor was obtained by the
methodology formulated by Desmet and Glover
(1996), as presented in Equation 5. The LS factor
tool is available in the TerrainAnalysis module of
SAGA GIS (toolbox available in QGIS).
𝐿𝑆𝑖, 𝑗 =[(𝐴𝑖,𝑗−𝑖𝑛+D2)
m+1]
[𝐷𝑚+2∗𝑋𝑖,𝑗𝑚∗(22,13𝑚)]
(5)
Where, 𝐴𝑖,𝑗−𝑖𝑛 corresponds to the area of
contribution of the cell with coordinated (i, j) (m²);
D corresponds to the size of the cell (m); m
corresponds to the slope function coefficient for the
cell grid with coordinates (i, j), where the
coefficient (m) is obtained from the slope classes.
The coefficient m=0.5, if the slope is > 5%; m=0,
for the range of 3 to 5%; m=0.3 for the range of 1
to 3%; and m=0.2 for slope less than 1%. The
variable 𝑋 corresponds to the function of the
spectrum for the coordinate cell grid (i, j), which
can be obtained by the equation 𝑋 = sin 𝛼/ cos 𝛼
where alpha corresponds to the direction of flow in
the strand. To obtain the LS factor, we used a
Digital Model of Hydrologically Consistent
Elevation (MDEHC) generated from mission data
of the shuttle Radar Topography Mission/SRTM,
available on the website of the United States
Geological Survey-USGS (USGS, 2018), achieved
joints S07_W060; S07_W061; S08_W060 and
S08_W061, with original spatial resolution of 1
second arch (30 meters).
CP factor determination
The CP parameter was obtained by means
of supervised classification of orbital images of the
Sentinel-2 remote sensor, 20MRT and 20MRS
articulation, passage date 05/08/2016, obtained
from the USGS website (USGS, 2018).
The supervised classification was
performed using the Semi-Automatic
Classification Plugin tool (6.2.4 version.
"Greenbelt") in QGIS, based on the spectral
signature of the ROI (Regions of Interest) samples.
The Maximum Likelihood (MaxVer) algorithm
uses the data set from the pixel collection employed
for the training of the map classes and creates a
normal probability distribution of the values of all
bands for each class (Duarte and Silva, 2019).
Then, the classification was validated by
calculating the Accuracy and Kappa index.
From the identification of the classes of
soil use and occupation, the weights of the C Factor
were attributed as observed in the literature. As for
the P Factor, which refers to the adoption of
conservation practices, the value attributed was 1
for the whole area, since the absence of a
conservationist practice was observed. Table 1
shows the values adopted for the C Factor, as
observed in literature for the six classes of land use
and occupation observed in the area
.
Table 1. Factor C values observed in the literature.
Land use classes C Factor Source
Water 0.00 Farinasso et al. (2006) and Paes et al. (2010)
Exposed soil 1.00 Farinasso et al. (2006) and Paes et al. (2010)
Farming 1.00 Farinasso et al. (2006) and Paes et al. (2010)
Conserved Pasture 0.055 Vale Júnior et al. (2010) and Paes et al. (2010)
Degraded pasture 0.10 Paes et al. (2010) and Benavidez et al. (2018)
Forest < 0.0004 Fernandes (2008) and Panagos et al. (2015)
Results
Erodibility of Rain Factor (R)
The monthly erosivity values observed for
the study area for the considered period (18 years)
ranged from 47.74 MJ.mm.ha-1.h-1.y-1 to 145.73

Revista Brasileira de Geografia Física v.14, n.05 (2021) 2931-2945
2936 Duarte., M., L., silva filho., E., P., costa., H., S., acácio., T., A.
MJ.mm.ha-1.h-1.y-1, with an annual average of
1,300.67 (156.07±SD) MJ.mm.ha-1.h-1.y-1 for a
total annual precipitation of 2,350.03 mm. These
values were close to those observed by Oliveira JR
and Medina (1990) for the Manaus/AM region,
where an average annual rainfall of 2,355.6 mm.y-
1 with erosivity of 1,177.55 MJ.mm.ha-1.h-1.y-1 was
observed. According to Duarte and Silva Filho
(2019), these values can be classified as low
erosivity.
It was observed that the percentage values
of monthly average erosivity in the study area
increased according to the volume of precipitation
in January, February, March and April. The
erosivity expressed in percentage terms (R%) was
higher than the relative percentage precipitation,
suggesting that rainfall in these months was of
greater erosive power, as shown in Figure 2. This
same behavior was observed by Oliveira JR and
Medina (1990).
In the months from July to December, there
is an inversion, when the percentage values of
erosivity do not exceed the percentage values of
precipitation or become inferior. This behavior can
be explained by the difference in rainfall intensities
that occur distinctly in the two periods, that is, in
the months from January to May, rainfall events are
scattered and intense (Junior et al., 2018), thus
increasing erosive power, as observed by Duarte
and Silva Filho (2019).
Figure 2. Monthly percentage distribution of rainfall and rainfall erosivity between 1998 and 2016.
Soil Erodibility Factor (K)
Table 2 presents the mean values of
texture, organic matter and other parameters used
for the application of Denardin (1990)
methodology. It also presents the erodibility index
for each soil unit observed in the and Soil Loss (SL)
in a laminar way with the application of the
quantitative model RUSLE in the Juma watershed.
Table 2. Erodibility values and parameters used in the Denardin (1990) equation to characterize the potential for erosion
losses of the predominant soil orders of the Juma watershed. Soil classes Particles MO (±SD) M (±SD) Permeability DMP (±SD) R (±SD) K
Esg2 Weak sand 0.363 ± 0.031 736.45 ± 15.49 Moderate 0.558 ± 0.56 0.00765 ± 0.0017 0.036
GXdb2 Silt 0.143 ± 0.017 1,347.00 ± 128.29 Moderate 0.293 ± 0.095 0.02722 ± 0.0011 0.096 PAd8 Clay 0.455 ± 0.039 96.47 ± 7.54 Slow 0.061 ± 0.041 0.01047 ± 0.0010 0.029
PVd1 Clay 0.429 ± 0.041 350.3 ± 16.70 Fast 0.243 ± 0.018 0.00859 ± 0.00046 0.028
PVAd11 Clay 0.363 ± 0.032 60.96 ± 4.79 Moderate 0.041 ± 0.037 0.00436 ± 0.00039 0.015 LAd14 Clay 0.430 ± 0.045 196.82 ± 8.32 Slow 0.106 ± 0.010 0.00535 ± 0.00038 0.031
LVd11 Clay 0.447 ± 0.043 202.84 ± 5.60 Slow/Moderate 0.105 ± 0.013 0.00042 ± 0.00001 0.026 LVAd4 Clay 0.428 ± 0.040 361.39 ± 41.37 Slow/Moderate 0.251 ± 0.019 0.00858 ± 0.00001 0.031
Esg2 - Spodosols; GXdb2 - Gleysol; PAd8 - Yellow Argisol; PVd1 - Red Argisol; PVAd11 – Red-Yellow Argisol; LAD14 - Yellow
Latosol; LVD11- Red Latosol; LVAD4 – Red-Yellow Latosol; M - Organic Matter; M - Indices of the Denardin equation; DMP:
average particle diameter; K - Soil erodibility Index, expressed in t.ha.h.ha-1.MJ-1.mm-1.
The erodibility values (K), among the soil
units, ranged from 0.015 t.ha.h.ha-1.MJ-1.mm-1 to
0.096 t.ha.h.ha-1.MJ-1.mm-1, being 0.031, 0.028,
0.096 and 0.036 t.ha.h.ha-1.MJ-1.mm-1 for the
classes of Latosols, Argisols, Gleysols and
Spodosols respectively.
High values (0.096 t.ha.h.ha-1.MJ-1.mm-1)
were observed for the Gleysol class. These indices
may be related to the high contents of the sand
fraction that directly interfere in the determination
of K factor, as observed by Demarchi and Zimback
(2014). The erodibility observed in the other soil
classes showed values close to those observed in
other regions of Brazil (Mannigel et al., 2002;
Cassol et al., 2018), and in studies with Amazonian
soils (Silva et al., 2018; Gato et al., 2018).

Revista Brasileira de Geografia Física v.14, n.05 (2021) 2931-2945
2937 Duarte., M., L., silva filho., E., P., costa., H., S., acácio., T., A.
According to the classification defined by
Mannigel et al. (2002), the study area presents
50.63% with low erodibility, followed by 27.48%;
18.04% and 3.82% with moderate, very low and
high erodibility of the soil.
Topographic Factor (LS)
The study area presents a predominantly
wavy (45.36%) to gently wavy slope (33.44%), and
only 11.76% corresponds to heavily wavy and
mountainous terrain, and finally 9.35% to flat
areas. The largest soil class corresponds to the Red
Argisol (38.06%), and class is distributed under
predominantly wavy terrain (45.76%) to gently
wavy (33.81%), followed by heavily wavy
(10.72%) and 9.54% of flat land, respectively. The
other soil classes also present similar distributions.
Table 3 presents the classes of the LS
factor obtained by the method of Desmet and
Govers (1996), from which it is observed that
classes 2-3 and 3-4 correspond to 89% of the study
area, while the classes of higher erosive potential
(6-7 and 7-8) occupy about 0.81% of the total area.
This result indicates that in the region a low
potential for soil loss predominates due to rain
laminar erosion.
Table 3. Class frequency of the LS factor in the Juma watershed.
Declivity (%) LS factor classes Area (km²) Area (%)
0 to 3 0-1 0.18 0.01
0 to 3 1-2 1.91 0.10
3 to 8 2-3 996.80 55.00
3 to 8/8 to 20 3-4 612.15 34.00
8 to 20 4-5 143.90 7.90
8 to 20 5-6 50.03 2.70
20 to 45 6-7 14.43 0.80
45 to 75 7-8 1.21 0.1
CP factor
The classification supervised by the
MaxVer method presented an accuracy of 80.44%
and a Kappa index of 0.66, which, according to the
classification described by Duarte and Silva
(2019), is considered as very good. Table 4 shows
the distribution of the classes of land use and
occupation in the area.
The sites occupied by soil exposed in the
study area pedominantly concur with areas where
short-cycle agricultural activities are concentrated,
such as maize, rice and bean plantations, common
activities in the region, as observed in the field. In
such places, soil concentrations in the vicinity of
the roads were also observed, and areas of
degraded pasture or areas of recent burn, all in
dimensions not detected due to the low spatial
resolution of the images used. The agricultural
areas in turn are occupied predominantly by long
cycle activities such as coffee, cacoa, cupuaçu and
banana plantations.
The areas identified as pasture correspond
to the places occupied by cattle-raising activities in
good cultivation conditions and suitable rotating
and grazing practices, while the other areas
identified as degraded pasture correspond to the
areas that are under disordered use due to
supergrazing, showing characteristics of degraded
areas.
The areas occupied by dense forest
represent the class of soil with greater scope in the
basin of the Juma river (60.04%), together with the
areas occupied by dispersed forest with 12.69%
representing 72.73% of the total. These areas exert
natural protection in the soil against the action of
laminar erosion by reducing the impact of
raindrops and the volume of the runoff, in addition
to allowing higher infiltration rates.
However, in the last 16 years, the areas
occupied by pasture have increased significantly in
function, especially, of the increment of bovine
flock, which was higher between 2002 and 2004,
when the herd more than doubled. The increase of
the bovine herd drives the need to open new areas
for the establishment of pasture, as described by
Duarte et al. (2019).

Revista Brasileira de Geografia Física v.14, n.05 (2021) 2931-2945
2938 Duarte., M., L., silva filho., E., P., costa., H., S., acácio., T., A.
Table 4. Distribution of the class of land use and occupation in the Juma watershed obtained from the supervised
classification.
Land use Classes Factor CP Area (km²) Area (%)
Water 0.0 1.96 0.10
Exposed soil 1.0 14.42 0.80
Agriculture 1.0 3.16 0.17
Degraded Pasture 0.1 245.13 13.61
Conserved Pasture 0.055 226.03 12.55
Dispersed Forest 0.0004 228.51 12.69
Dense Forest 0.0004 1,080.78 60.04
Legend: Factor CP: Value attributed to the type of land use classes.
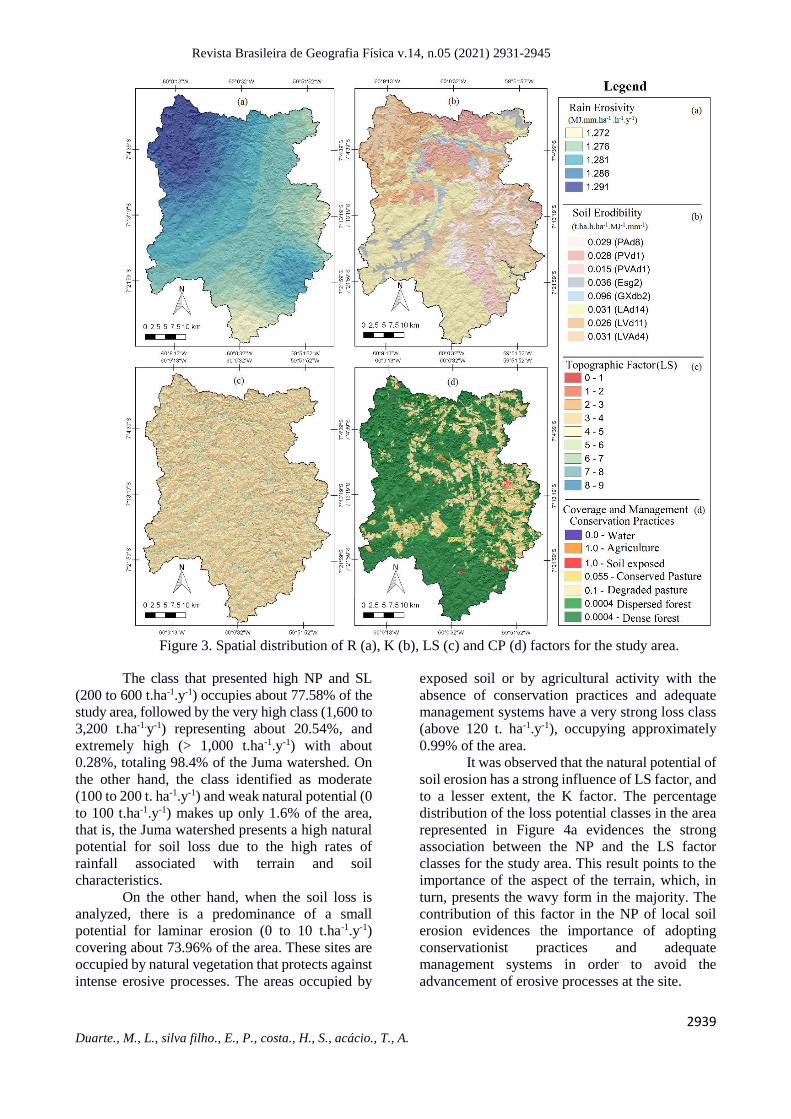
Spatial Distribution of R, K, LS and CP Factors
Figure 3 shows the spatial distribution of R
(a), K (b), LS (c) and CP (d) factors for the study
area. With regard to the R factor (Figure 3a), it was
found that there is greater erosivity in the northern
region of the watershed, while the smallest indices
are distributed in small portions in the southern and
eastern region of the Juma watershed, that is, the
mean erosivity increases from the source to the
mouth. It is noteworthy that the spatial variation of
the rainfall erosivity index along the Juma
watershed is small (average of 11.66 MJ.mm. ha-
1.h-1.y-1), the greatest variations are related to
regional seasonality.
In relation to the K factor (Figure 3b), its
spatial distribution in the study area is analogous to
the distribution of pedological classes, thus
distributed in percentage terms: Red Argisol
(38.06%); Red-Yellow Argisol (18.05%); Yellow
Argisol (16.60%); Spodosol (8.29%); Yellow
Latosol (8.05%); Red Latosol (4.29%); Gleysols
(3.83%) and Red-Yellow Latosol (2.84%).
The spatial distribution of the LS factor is
arranged in Figure 3c, in which it is observed that
the highest values are near the hilltops and along
the water bodies. This occurs as a function of the
method, which provides, pixel by pixel, the value
of LS along the strands. In addition, it uses the
concept of accumulated flow of upstream drainage,
thus, when the values of the source flow are high,
the method tends to also estimate high values of the
LS factor, especially in the positions close to the
drainage (Desmet and Govers, 1996).
Figure 3d presents the spatial distribution
of the CP factor, in which the greater scope of the
class occupied by dense and dispersed forests that
make up about 72.73% of the area is observed,
adding natural protection against superficial
erosion. On the other hand, only 0.80% of the area
is occupied by exposed soil, which corresponds to
the soil use class of greater susceptibility to erosion
because it is in direct contact with the action of rain.
As was also observed in Figure 3d, the spatial
distribution of the different classes of coverage, the
predominance of forest coincident with the ciliary
area and springs suggests that there is cause for
conservationist concern.
Natural Potential and Soil Loss
Table 5 presents the Natural Potential (NP)
and Soil Loss (SL) classes for the study area.
Table 5. NP and SL class in the Juma watershed.
Natural Potential for Soil Loss (t.ha-1.year-1)
Classes Area (km²) Area (%)
0 to 100 (Weak) 2.30 0.13
100 to 200 (Average) 26.39 1.47
200 to 600 (High) 1,396.60 77.58
600 to 1,000 (Very high) 369.72 20.54
>1,000 (Extremely high) 4.99 0.28
Soil Loss (t.ha-1.year-1)
0 to 10 (Small) 1,313.33 72.96
10 to 15 (Moderate) 6.95 0.38
15 to 50 (Average) 354.97 19.74
50 to 120 (Strong) 106.87 5.93
>120 (Very strong) 17.88 0.99
Revista Brasileira de Geografia Física v.14, n.05 (2021) 2931-2945
2939 Duarte., M., L., silva filho., E., P., costa., H., S., acácio., T., A.
Figure 3. Spatial distribution of R (a), K (b), LS (c) and CP (d) factors for the study area.
The class that presented high NP and SL
(200 to 600 t.ha-1.y-1) occupies about 77.58% of the
study area, followed by the very high class (1,600 to
3,200 t.ha-1.y-1) representing about 20.54%, and
extremely high (> 1,000 t.ha-1.y-1) with about
0.28%, totaling 98.4% of the Juma watershed. On
the other hand, the class identified as moderate
(100 to 200 t. ha-1.y-1) and weak natural potential (0
to 100 t.ha-1.y-1) makes up only 1.6% of the area,
that is, the Juma watershed presents a high natural
potential for soil loss due to the high rates of
rainfall associated with terrain and soil
characteristics.
On the other hand, when the soil loss is
analyzed, there is a predominance of a small
potential for laminar erosion (0 to 10 t.ha-1.y-1)
covering about 73.96% of the area. These sites are
occupied by natural vegetation that protects against
intense erosive processes. The areas occupied by
exposed soil or by agricultural activity with the
absence of conservation practices and adequate
management systems have a very strong loss class
(above 120 t. ha-1.y-1), occupying approximately
0.99% of the area.
It was observed that the natural potential of
soil erosion has a strong influence of LS factor, and
to a lesser extent, the K factor. The percentage
distribution of the loss potential classes in the area
represented in Figure 4a evidences the strong
association between the NP and the LS factor
classes for the study area. This result points to the
importance of the aspect of the terrain, which, in
turn, presents the wavy form in the majority. The
contribution of this factor in the NP of local soil
erosion evidences the importance of adopting
conservationist practices and adequate
management systems in order to avoid the
advancement of erosive processes at the site.

Revista Brasileira de Geografia Física v.14, n.05 (2021) 2931-2945
2940 Duarte., M., L., silva filho., E., P., costa., H., S., acácio., T., A.
Figure 4. Relative percentage between NP of soil loss with Factor LS (a), and SL with land use and occupation
(b).
Figure 5a presents the spatial distribution
of the NP and SL for the study area. Regarding the
NP, the strong association with the spatial
distribution of the LS factor is observed, and to a
lesser extent, of the K factor, in which the
occurrences of high potential soil loss classes
happen mainly along the slopes and top of hills,
characteristics observed in the spatial distribution
of the LS factor. An association with the K factor
is also observed, albeit in smaller proportions, the
latter can be easily noticed in the portions that have
medium NP, analogous areas to the sites
constituted by the class of Spodosols, with
erodibility equal to 0.036 t.ha-1.y-1.
As for SL (Figure 5b), there was a strong
association between the classes of soil loss with
their classes of use and occupation. This
relationship can be noted from the comparison
between the use and occupation (Figure 3d) of the
soil and the SL (Figure 5b). The relative percentage
distribution presented (Figure 4b) clearly shows
this relationship (reinforced by the overlap between
use and occupation with the spatial distribution of
the potential for losses). In summary, the sites that
have a small potential for SL are predominantly
occupied by forests, while the areas occupied by
the classes that have very strong erosion potential,
in general, correspond to the exposed soil class.
The spatial distribution of NP and SL in the
study area shows two possible scenarios (Figure 5).
The first shows that most of the areas with marked
topography are covered by natural vegetation, and
the second shows the little spatial coverage of the
exposed soil class, which corresponds to the higher
risk of SL in the area.
Discussion
Table 6 shows a comparison between the
results obtained by the RUSLE method and those
observed in a field experiment in the Amazon
region. In general, the RUSLE method has a strong
tendency to underestimate soil loss in the study
area, by up to 38.40%.
Table 6. Comparison between soil loss by direct and indirect method.
Method Forest Dispersed Forest Pasture Exposed soil
-------------------------------Soil Loss (t.ha-1.y-1)--------------------------------
Experiment 11.15* 18.54*** 35.8** 286.07**
RUSLE (±SD) 3.10 ± 2.31 12.89 ± 1.66 31.48 ± 12.99 169.12 ± 25.00 *Machado (2010), **Arruda et al., (2004), ***Encinas (2011).
According to Benavidez et al. (2018), this
underestimation can occur due to the fact that the
method only takes only soil loss through sheet and
rill erosion into account, disregarding erosion on
margins, erosion in the river canal and landslides.
Schmidt et al. (2019) and Barrena-González et al.
(2020) mention that this underestimation may be
related to the scale of the area, because the method
tends to overestimate on a small scale and
underestimate on a large scale.
In preserved forest area, the RUSLE
method estimated average losses of 3.10 t.ha-1.y-1,
and in field experiments, Machado (2010)
observed losses of 11.15 t.ha-1.y-1. Both values are
well higher than the global average values, which
are 0.004 to 0.05 t.ha-1.y-1 (Benavidez et al., 2018).
The high rates of soil loss observed in the forest
area can be justified by local conditions (high
precipitation rates, sandy soil texture) that strongly
influence the loss of soil in the region (Machado,
2010; Encinas, 2011; Duarte et al., 2019; Duarte et
al., 2020).

Revista Brasileira de Geografia Física v.14, n.05 (2021) 2931-2945
2941 Duarte., M., L., silva filho., E., P., costa., H., S., acácio., T., A.
Figure 5. NP (A) and SL (B) map for the Juma watershed.
The average soil losses estimated for the
plant regeneration class were 12.89 t.ha-1.y-1, while
in field experiment the mean values were 18.54
t.ha-1.y-1. In the pasture-occupied areas, the
estimated soil losses were 31.45 t.ha-1.y-1 and those
observed in experiments were 35.8 t.ha-1.y-1. The
areas occupied by exposed soil presented higher
potential for estimated soil loss (169.12 t.ha-1.y-1),
as was also observed in the field (286.07 t.ha-1.y-1).
This area together with pasture has percentages of
soil loss above the values admitted by the Food and
Agriculture Organization of the United Nations -
FAO (FAO, 2015). However, the adoption of
appropriate cultivation practices can considerably
reduce soil loss (Encinas, 2011; Duarte et al.,
2020).
Comparing the maps of NP (Figure 5a) and
SL (Figure 5b), the importance exerted by the
natural vegetation cover of the soil through the
decrease of the superficial erosion is verified. If, on
the one hand, the NP does not take into account the
vegetation cover, soil loss occurs with greater
intensity and in larger areas due to the lack of
natural protection. On the other hand, when
considering the natural or anthropic protection
factor related to the vegetation cover, the erosion
index decreases considerably, approaching zero. In
other words, vegetation cover associated with
adequate agricultural practices contributes strongly
to the maintenance of low rates of average annual
soil losses (Panagos et al., 2015; Sampaio et al.,
2016).
The values of the percentage of spatial
occurrence of exposed soil (0.8% - Table 4), when
compared to the percentage of spatial occurrence of
the very strong loss class (0.99% - Table 5)
reinforce the importance of the vegetation coverage
in the prevention of soil losses for this region, as
described by several studies (Labrière et al., 2015;
Duarte et al., 2019). Considering the current
dynamics of land use in the Amazon (EMBRAPA,
2016), the need to implement effective

Revista Brasileira de Geografia Física v.14, n.05 (2021) 2931-2945
2942 Duarte., M., L., silva filho., E., P., costa., H., S., acácio., T., A.
environmental public policies aimed at minimizing
the exposure of these areas becomes evident. The
effect of itinerant farming (Ferreira et al., 2018;
Barlow et al., 2019) and supergrazing practices that
are common in the Amazon region can accelerate
the loss of soil in large scales.
Conclusions
Evaluation of soil loss in the Juma
watershed using the RUSLE method in a GIS
environment has highlighted the areas most
exposed to erosion. The methodology used proved
to be satisfactory and can be considered an
alternative for regions with insufficient precise
data, such as the Amazon region.
Comparing the maps of Natural Potential
and Soil Loss reinforces the importance exerted by
natural vegetation cover by decreasing losses due
to superficial erosion. The high potential classes of
soil loss occupy about 77.58% of the area, with
potential losses between 200 to 600 t.ha-1.y-1,
followed by 20.54% of the area classified as very
high natural potential, where losses are between
600 to 1,000 t.ha-1.y-1, demonstrating the region's
high vulnerability to soil degradation.
With the presence of vegetation cover, the
loss scenario is significantly altered. The areas in
which high potential predominates (200 to 600 t.ha-
1.y-1) show low losses (soil losses lower than 10 t.
ha-1.y-1), and, in some areas, this index approaches
zero, which demonstrates the adequacy of the
analysis model adopted here.
As an encouragement, we observed that the
sites where higher soil losses occurred, especially
in discovered areas and agricultural areas with no
conservation practices associated with steep slope,
can be controlled with the adoption of appropriate
conservationist practices. This reinforces the
importance of the use of soil in an adequate way to
minimize losses by laminar erosion.
Acknowledgements
This work was supported by the National
Council for Scientific and Technological
Development, which grants a scholarship to the
main author (grant number 145574/2016-4). The
authors thank the Geoprocessing Laboratory of the
Universidade Federal do Amazonas-IEAA-
UFAM, for providing the space for the
development of this research, and the Brazilian
Agricultural Research Corporation (EMBRAPA,
its acronym in Portuguese), especially Profa. PhD
Marília Locatelli (in memory) for guidance and soil
analysis.
References
Almeida, C.T., Delgado, R.C., Junior, J.F.O., Gois,
G., Cavalcanti, A.S., 2015. Avaliação das
Estimativas de Precipitação do Produto
3B43-TRMM do Estado do Amazonas. Floresta
e Ambiente 22, 279-286.
http://dx.doi.org/10.1590/2179-8087.112114
Alvares, C.A., Stape, J.L., Sentelhas, P.C.,
Gonçalves, J.L.M., Sparovek, G., 2013.
Köppen’s climate classification map for Brazil.
Meteorologische Zeitschrift 22, 711-728.
http://dx.doi.org/10.1127/0941-
2948/2013/0507
Arruda, W.C., Lima, H.N., Forsberg, B.R.,
Teixeira, W.G., 2004. Estimativa de erosão em
clareiras através da mudança do relevo do solo
por meio de pinos. In: 1° Wolrkshop Técnico-
Científico da Rede CT-Preto Amazônia.
Manaus. 4p.
Barlow, J., Berenguer, E., Carmenta, R., França, F.,
2019. Clarifying Amazonia's burning crisis.
Global Change Biology 26, 319-321.
https://doi.org/10.1111/gcb.14872
Barrena-González, J., Rodrigo-Comino, J., Gyasi-
Agyei, Fernández, M.P., Cerdà, A. 2020.
Applying the RUSLE and ISUM in the Tierra
de Barros Vineyards (Extremadura, Spain) to
Estimate Soil Mobilisation Rates. Land 9, 1-17.
https://doi.org/10.3390/land9030093
Benavidez, R., Jackson, B., Maxwell, D., Norton,
K., 2018. A review of the (Revised) Universal
Soil Loss Equation ((R)USLE): with a view to
increasing its global applicability and
improving soil loss estimates. Hydrology and
Earth System Sciences 22, 6059–6086.
https://doi.org/10.5194/hess-22-6059-2018
Cassol, E.A., Silva, T.S., Eltz, F.L.F., Levien, R.
2018. Soil Erodibility under Natural Rainfall
Conditions as the K Factor of the Universal Soil
Loss Equation and Application of the
Nomograph for a Subtropical Ultisol. Revista
Brasileira de Ciência do Solo 42, 1-12.
https://doi.org/10.1590/18069657rbcs2017026
2
CONAB-Companhia Nacional de Abastecimento.
2017. Acompanhamento da safra brasileira de
grão: safra 2016/2017. 1, 1-104.
Demarchi, J.C., Zimback, C.R.L., 2014.
Mapeamento, erodibilidade e tolerância de
perda de solo na sub-bacia do Ribeirão das
Perobas. Revista Energia na Agricultura 29,
102-114.
https://doi.org/10.17224/EnergAgric.2014v29n
2p102-114

Revista Brasileira de Geografia Física v.14, n.05 (2021) 2931-2945
2943 Duarte., M., L., silva filho., E., P., costa., H., S., acácio., T., A.
Denardin, J.E., 1990. Erodibilidade do solo
estimada por meio de parâmetros físicos e
químicos. Tese (Doutorado), Piracicaba, USP.
Desmet, P.J.J.J., Govers, G. 1996. A GIS-
Procedure for Automatically Calculating the
USLE LS-Factor on Topographically Complex
Landscape Units. Journal of Soil and Water
Conservation 51, 427-433.
Devátý, J., Dostál, T., Hösl, R., Krása, J., Strauss,
P., 2019. Effects of historical land use and land
pattern changes on soil erosion – Case studies
from Lower Austria and Central Bohemia. Land
Use Policy 82, 674-685.
https://doi.org/10.1016/j.landusepol.2018.11.0
58
Duarte, M.L., Brito, W.B., Silva, T.A., Castro, A.
L. Padrões e causas do desmatamento no Baixo
Acre, região oeste da Amazônia brasileira.
Journal of EnvironmentalAnalysis and
Progress. v. 5, n.1. p. 117-127. 2020.
https://doi.org/10.24221/jeap.5.1.2020.2790.11
7-127
Duarte, M.L., Silva Filho, E.P., 2019. Estimation
of rain erosion in the Juma river basin based on
TRMM satellite data. Caderno de Geografia 29,
45-60. https://doi.org/10.5752/P.2318-
2962.2019v29n56p45
Duarte, M.L., Silva Filho, E.P., Brito, W.B.M.,
Silva, T.A., 2020. Determinação da
erodibilidade do solo por meio de dois métodos
indiretos em uma bacia hidrográfica na região
sul do estado do Amazonas, Brasil. Revista
Brasileira de Geomorfologia 21, 329-341.
http://dx.doi.org/10.20502/rbg.v21i2.1533
Duarte, M.L., Silva, T.A., 2019. Avaliação do
desempenho de três algoritmos na classificação
de uso do solo a partir de geotecnologias
gratuitas. Revista de Estudos Ambientais 21, 6-
16. http://dx.doi.org/10.7867/1983-
1501.2019v21n1p6-16
Duarte, M.L., Silva, T.A., Cerqueira, C., Silva
Filho, E.P., 2019. Pressões Ambientais em
Unidades de Conservação: estudo de caso no sul
do Estado do Amazonas. Revista de Geografia
e Ordenamento do Território 18, 108-125.
http://dx.doi.org/10.17127/got/2019.18.005
Durães, M.F., Mello, C.R., 2016. Distribuição
espacial da erosão potencial e atual do solo na
Bacia Hidrográfica do Rio Sapucaí, MG.
Engenharia Sanitária e Ambiental 21, 677-685.
https://doi.org/10.1590/s1413-
41522016121182
EMBRAPA - Centro Nacional de Pesquisa de
Solos (CNPS). 1997. Manual de métodos de
análise de solo. EMBRAPA. Rio de Janeiro. 2ª
Ed. 1-211.
EMBRAPA - Empresa Brasileira de Pesquisa
Agropecuária. 2018. MAPA de solos da área
piloto de Apuí - Amazonas: folha: Vila Apuí.
EMBRAPA - Empresa Brasileira de Pesquisa
Agropecuária. 2018. Sistema brasileiro de
classificação de solos. Embrapa, 5. ed. E-book.
Brasília.
Encinas, O.C., 2011. Avaliação de processos
erosivos na base de operações geólogo Pedro de
Moura - Coari, AM. Dissertação (Mestrado),
Manaus, INPA.
FAO - Food and Agriculture Organization. 2015.
Status of the World’s Soil Resources (SWSR) –
Technical Summary. Food and Agriculture
Organization of the United Nations and
Intergovernmental Technical Panel on Soils,
Rome, Italy. 95p.
Farinasso, M., Júnior, O.A.C., Guimarães, R.F.,
Gomes, R.A.T., Ramos, V.M., 2006. Avaliação
Qualitativa do Potencial de Erosão Laminar Em
Grandes Áreas Por Meio da EUPS – Equação
Universal de Perdas de Solos Utilizando Novas
Metodologias Em SIG Para os Cálculos dos
Seus Fatores na Região do Alto Parnaíba – PI-
MA. Revista Brasileira de Geomorfologia 7,
73-85.
Fernandes, L. C., 2008. Estudo multi-temporal do
uso, ocupação e perda de solos em projetos de
assentamento em Rondônia. Tese (Doutorado),
Rio Claro, UNESP.
Ferreira, M.P.S., Artur, A.G., Queiroz, H.M.,
Romero, R.E., Costa, M.C.G., 2018. Changes in
attributes of soils subjected to fallow in
desertification hotspot. Revista Ciência
Agronômica 49, 22-31.
http://dx.doi.org/10.5935/1806-6690.20180003
Flores, B., Holmgren, M. White-Sand Savannas
Expand at the Core of the Amazon After Forest
Wildfires, Ecosystems. 2021.
https://doi.org/10.1007/s10021-021-00607-x
Galindo, I.C., Margolis, E., 1989. Tolerância de
perdas por erosão para solos do Estado de
Pernambuco. Revista Brasileira Ciência do Solo
13, 95-100.
Gato, L.C., Costa, H.S., Duarte, M.L., 2018.
Erodibility of soils in southern Amazonas State
for two Indirect Methods. In: 21 WORLD
CONGRESS OF SOIL SCIENCE.
IBGE – Instituto Brasileiro de Geografia e
Estatística. 2007. Manual Técnico de
Pedologia. 2 Ed. Rio de Janeiro, RJ - Brasil.
316p.

Revista Brasileira de Geografia Física v.14, n.05 (2021) 2931-2945
2944 Duarte., M., L., silva filho., E., P., costa., H., S., acácio., T., A.
Junior, A.L.P., Querino, C.A.S., Querino, J.K.A.S.,
Santos, L.O.F., Moura, A.R.M., Machado,
N.G., Biudes, M.S., 2018. Variabilidade horária
e intensidade sazonal da precipitação no
município de Humaitá-AM. Revista brasileira
de Climatologia 22, 463-475.
http://dx.doi.org/10.5380/abclima.v22i0.58089
Kayet, N., Pathak, K., Chakrabarty, A., Sahoo, S.,
2018. Evaluation of soil loss estimation using
the RUSLE model and SCS-CN method in
hillslope mining areas. International Soil and
Water Conservation Research 6, 31-42.
https://doi.org/10.1016/j.iswcr.2017.11.002
Labrière, L., Locatelli, B., Laumonier, Y., Freycon,
V., Bernoux, M., 2015. Soil erosion in the
humid tropics: A systematic quantitative
review. Agriculture, Ecosystems &
Environment 203, 127-139.
https://doi.org/10.1016/j.agee.2015.01.027
Leal, P.F., 2009. Colonização agrícola dirigida e
construção de parceleiros tutelados.
Antropolítica 2, 155-182.
https://doi.org/10.22409/antropolitica2009.2i2
7.a9
Machado, F.S., 2010. Erosão hídrica sob chuva
simulada em diferentes classes de solos e
coberturas vegetais na província petrolífera de
Urucu – Coari, AM. Dissertação (Mestrado),
Manaus, UFAM.
Mannigel, A.R., Carvalho, M.P., Moreti, D.,
Medeiros, L.R., 2002. Fator erodibilidade e
tolerância de perda dos solos do Estado de São
Paulo. Acta Scientiarum Agronomy 24, 1335-
1340.
http://dx.doi.org/10.4025/actasciagron.v24i0.2
374
Mataveli, G.A.V., Chaves, M.E.D,. Brunsel, N.A.,
Aragão, L.E.O.C. The emergence of a new
deforestation hotspot in Amazonia.
Perspectives in Ecology and Conservation. v.
19, n. 1, p. 33-36. 2021.
https://doi.org/10.1016/j.pecon.2021.01.002
Morais, R.C.S., Sales, M.C.L., 2017. Estimativa do
Potencial Natural de Erosão dos Solos da Bacia
Hidrográfica do Alto Gurguéia, Piauí-Brasil,
com uso de Sistema de Informação Geográfica.
Caderno de Geografia 27, 84-105.
https://doi.org/10.5752/p.2318-
2962.2017v27nesp1p84
NASA - Data Tropical Rainfall Measuring
Mission. Available in:
https://giovanni.gsfc.nasa.gov/giovanni,
Accessed: 01 December 2018.
Nastos, P.T., Kapsomenakis, J., Philandras, K.M.,
2016. Evaluation of the TRMM 3B43 gridded
precipitation estimates over Greece.
Atmospheric Research 169, 497-514.
https://doi.org/10.1016/j.atmosres.2015.08.008
Oliveira Jr.R.C., Medina, B.F., 1990. A
erosividade das chuvas em Manaus (AM).
Revista Brasileira Ciência do Solo 14, 235-239.
Paes, F.S., Dupas, F.A., Silva, F.G.B., Pereira,
J.C.D., 2010. Espacialização da perda de solo
nas bacias hidrográficas que compõem o
município de Santa Rita do Sapucaí (MG).
Geociências 29, 589-601.
Panagos, P., Borrelli, P., Meusburger, K., Alewell,
C., Lugato, E., Montanarella, L., 2015.
Estimating the soil erosion cover-management
factor at the European scale. Land Use Policy
48, 38-50.
http://dx.doi.org/10.1016/j.landusepol.2015.05.
021
Pereira, M. D. R.; Cabral, J. B. P. Perda de solo no
alto curso das bacias hidrográficas dos ribeirões
Taquaruçu Grande e Taquaruçuzinho, Palmas
(TO). Revista Brasileira de Geografia Física. v.
14, n.1. p. 332-339, 2021.
http://dx.doi.org/10.26848/rbgf.v14.1.p332-
339
Rangel, L., Jorge, M. C., Guerra, A., Fullen, M.,
2019. Soil Erosion and Land Degradation on
Trail Systems in Mountainous Areas: Two Case
Studies from South-East Brazil. Soil systems 3,
1-14.
https://doi.org/10.3390/soilsystems3030056
Reis, M., Graça, P. M.L.A., Yanai, A.M., Ramos,
C.J.P, Fearnside, P.M. Forest fires and
deforestation in the central Amazon: Effects of
landscape and climate on spatial and temporal
dynamics. Journal of Environmental
Management, v. 288, 2021.
https://doi.org/10.1016/j.jenvman.2021.112310
Sampaio, A.C.P., Cordeiro, A.M.N., Bastos, F.H.,
2016. Susceptibilidade à erosão relacionada ao
escoamento superficial na sub-bacia do Alto
Mundaú, Ceará, Brasil. Revista Brasileira de
Geografia Física 9, 125-143.
https://doi.org/10.26848/rbgf.v9.1.p125-143
Sathler, D., Adamo, S.B., Lima, E.E.C., 2018.
Deforestation and local sustainable
development in Brazilian Legal Amazonia: an
exploratory analysis. Ecology and Society 23,
1-15. https://doi.org/10.5751/ES-10062-
230230
Schmidt, S., Alewell, C., Meusburger, K., 2019.
Monthly RUSLE soil erosion risk of Swiss
grasslands. Journal of Maps 15, 247-256.
https://doi.org/10.1080/17445647.2019.158598
0

Revista Brasileira de Geografia Física v.14, n.05 (2021) 2931-2945
2945 Duarte., M., L., silva filho., E., P., costa., H., S., acácio., T., A.
Silva, A.S., Duarte, M.L., Costa, H.S., 2018.
Erodibility of a Yellow Latosol (LA) under
pasture and SAF in the southern region of
Amazonas, Brazil by two Indirect Methods. In:
21 WORLD CONGRESS OF SOIL SCIENCE.
Silva, R.O., Barioni, L.G., Moran, D. Fire,
deforestation, and livestock: When the smoke
clears. Land Use Policy, v. 100.
2021.https://doi.org/10.1016/j.landusepol.2020
.104949
USDA - United States Department of Agriculture.
2018. Revised Universal Soil Loss Equation
(RUSLE) - Welcome to RUSLE 1 and RUSLE
2. Available in: https://www.ars.usda.gov
Accessed: 26 November 2019.
USGS. 2018. Shuttle Radar Topography Mission
(SRTM) 1 Arc-Second Global. Available at
(Accessed in 11 December 2018). Available in:
https://earthexplorer.usgs.gov/ Accessed: 26
November 2019
Vale Júnior, J.F., Barros, L.S., Sousa, M.I.L.,
Uchoa, S.C.P., 2009. Erodibilidade e
suscetibilidade à erosão dos solos de cerrado
com plantio de Acacia Mangium em Roraima.
Agro@mbiente On-line 3, 1-8.
http://dx.doi.org/10.18227/1982-
8470ragro.v3i1.253
Vansan, A.P., Tomazoni, J.C. Uso de Técnicas de
Geoprocessamento para Estudo da Erosão
Hídrica Laminar em Microbacia Hidrográfica
do Sudoeste do Paraná. Revista Brasileira de
Geografia Física v.13, n.3. p. 1117-1131. 2020.
https://doi.org/10.26848/rbgf.v13.3.p1117-
1131
Wischmeier, W.H., Smith, D.D., 1978. Predicting
rainfall erosion losses: a guide to conservation
planning. Agriculture and book, 537,
Washington, DC: USDA.
Yeomans, J.C., Bremner, J.M., 1988. A rapid and
precise method for routine determination of
organic carbon in soil. Communications in Soil
Science and Plant Analysis 19, 1467-1476.