guideline - agricultural research council · the accumulation of soil organic material and residual...
TRANSCRIPT
2019
GUIDELINEPRODUCTION OF SMALL GRAINS IN THE WINTER RAINFALL AREA
ARC-SMALL GRAIN
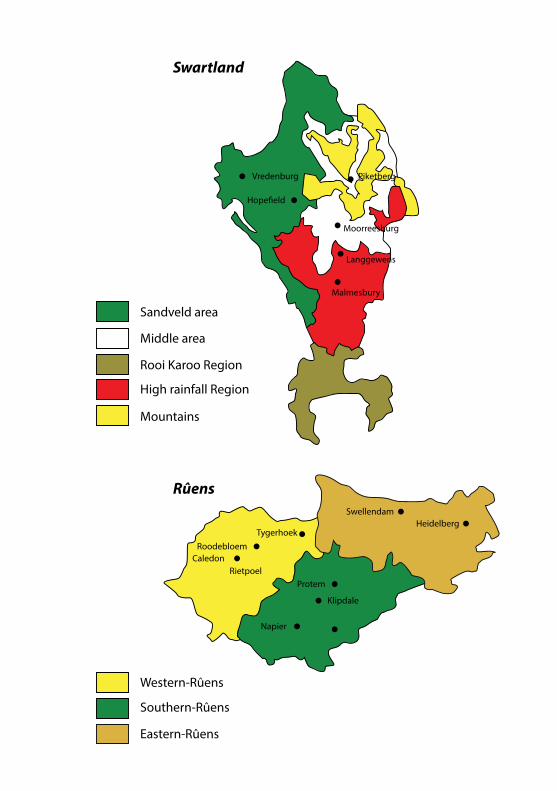
Rûens
Sandveld area
Middle area
Rooi Karoo Region
High rainfall Region
Mountains
Western-Rûens
HeidelbergSwellendam
Malmesbury
Langgewens
Moorreesburg
Vredenburg
Hope�eld
Piketberg
Protem
Klipdale
Napier
Rietpoel
RoodebloemCaledon
Tygerhoek
Southern-Rûens
Eastern-Rûens
Swartland
PB 1
GUIDELINE: PRODUCTION OF SMALL GRAINS IN THE WINTER RAINFALL REGION2019
Compiled by:
ARC-Small GrainUniversity of StellenboschABInBevSABBIDepartment of Agriculture: Western Cape
The information in this booklet is the result of scientific research and is supplied in good faith. The institutions involved therein disclaim any legal liability as a result of the implementation of recommendations in the booklet.
Copyright © Agricultural Research Council
ISBN: 978-0-621-47091-8Coordinated and edited by:
Dr André Malan
Data Editing:
Willem Kilian
Design, Layout and Printing:
Shereno Printers
Tel: (012) 344 2817
ARC-Small Grain would like to thank the following:
• The Winter Cereal Trust for the financial support to conduct the research
• Department of Agriculture: Western Cape for cultivar evaluation data
2 3
Foreword .................................... 3Acknowledgements .................... 4General Crop Management ......... 5Crop rotation ................................ 6Yield limiting factors ..................... 6Long-term rotation ....................... 6What is the best crop rotation system? ......................................... 6Benefits of a sustainable crop rotation system..................... 7Management of Wheat Production ...................... 8What determines wheat yield? .... 8Growth stages .............................. 9Factors influencing yield components.................................. 15Establish target yields ................... 15Achieving target yields ................. 16Soil tillage guidelines .................. 17Objectives of soil tillage ................ 17Influence of soil tillage on yield-limiting factors ................ 17Proposed tillage systems .............. 20Guidelines for wheat cultivar choice ......................................... 27Plant Breeders’ Rights (Act 15 of 1976) ............................ 27Seed certification and Table 8, as described in the Plant Improvement Act ......................... 28Factors determining cultivar choice .............................. 28Recommendations and Summary of Results – 2018......... 33Characteristics .............................. 36Planting dates and seeding rates ................................ 38
Summary of results obtained during 2018 .................................. 40Guidelines for malt barley production ................................. 77Cultivars ........................................ 78Agronomic characteristics ............ 78Quality .......................................... 80Barley recommendations ............. 83Oat production ........................... 90Grazing, silage and hay production .................................... 90Grain quality ................................. 90Cultivation .................................... 92Cultivar choice, planting spectrum and seeding density ..... 92Fertiliser requirements ................. 93Diseases and control .................... 93Harvesting, storage and marketing ..................................... 94Oats trial data 2018 ...................... 94Triticale ...................................... 99Cultivars ........................................ 99Fertiliser requirements ................. 99Herbicides ..................................... 99Diseases and pests ....................... 100 Agronomic and disease resistance data ............................. 100Weed control in Wheat ............... 101Insect control ............................. 112Diseases of Small Grains ............. 117ARC-Small Grain Services ............ 136Contact Information ................... 141
TABLE OF CONTENT
2 3
FOREWORD
Increasing agricultural productivity in an effort to become or remain financially viable in our competitive and global marketing environment is at the heart of your successes as food producers.
For South Africa to become food secure on a household and national level, your continuous production of basic foods such as wheat amongst others is imperative.
This 2019 Production Guideline as proven by its many annual predecessors is the most important decision-making database. The information contained is based on a sound objective and scientifically proven replicated trials (2-4 years data), and is representative of all major production areas and should be used when making the correct cultivar choice in a specific production area.
Performance data of each cultivar is supported by disease, insect and weed control information as well as related crop production practices, soil, water and fertilisation management recommendation.
This publication will certainly lower your risks and increase your productivity and cost efficiency.
Most importantly, do remember that productivity and profitability are not measured in ton/ha, but in profit/ha. Only the latter will ensure our competitiveness.
Dr Toi TsiloSenior Research Manager
4 5
ACKNOWLEDGEMENTS
Special contributions to this publication were prepared by the following:
Dr John Tolmay Agronomist Kynoch
Dr Willem Boshoff Head of Department University of the Free State
* Dr Goddy Prinsloo Entomologist Crop Protection
* Dr Vicki Tolmay Entomologist Germplasm Development
* Dr Justin Hatting Programme Manager Crop Protection
* Dr Astrid Jankielsohn Entomologist Crop Protection
Daniël de Klerk Barley Production South African
Barley Breeding Institute
Willem Botes, Aletta Ellis & Lezaan Springfield
Triticale Breeder University of Stellenbosch
* Cathy de Villiers Plant Pathologist Crop Protection
* Dr André Malan Programme Manager Crop Improvement
* Willem Kilian Programme Manager Production Systems
* Dr Annelie Barnard Plant Physiologist Production Systems
Dr Sandra Lamprecht Plant Pathologist ARC-Plant Protection
* Hestia Nienaber Weed Scientist Crop Protection
* ARC-Small Grain
4 5
GENERAL CROP MANAGEMENT
The aim of this publication is to highlight the management of the wheat crop in a sustainable crop rotation system to increase the competitiveness of the crop. Although there is not one single best management practice for all situations, this publication will discuss the principles of the growth and management of the wheat crop, so that applicable management decisions can be made as the specific situation arises.
The major consideration in dryland wheat production is profitability. The traditional wheat-fallow-wheat system that had been followed for many years had become unprofitable, mainly due to soil water availability restrictions and increased disease occurrence. This system has also led to degradation of soils via decreased organic carbon (humus), and increased soil acidity and soil erosion. Increased profitability can only be achieved by maximising the yield potential of the crop/soil/climate combination, while input costs are also strictly managed.
In striving to achieve greater productivity with the available resources invested in crop production, and not necessarily higher total production, it is important to consider a few basic principles of crop management.
• Soil selection is critical, requiring each land to be reviewed individually to realise its potential;
• Analyse soil samples to evaluate the fertility status of the soil;
• Follow an effective liming programme;
• Do fertilisation planning including all important plant mineral elements;
• Apply appropriate soil cultivation methods. These include: alleviation of compaction layers, crop residue management, weed control and seedbed preparation, with the main aim of maximising soil water conservation in the soil profile. Each soil cultivation input must have a specific objective;
• Plant a number of cultivars with a high yield potential and relevant disease and insect resistance;
• Calibrate planters to ensure the correct seeding density, fertiliser application and planting depth for seed germination;
• Select the optimal planting time for a particular cultivar, and plant at the recommended seeding density to ensure optimal emergence and seedling establishment;
• Follow an effective spraying programme for control of weeds, insects and diseases during the growing season;
• Timely harvest of the crop and post-harvest storage can impact on optimal yield and grain quality;
• Effective marketing of the grain for successful financial management.
6 7
Crop Rotation Management
From an economical and agronomical viewpoint it is beneficial to cultivate wheat in a suitable crop rotation system. Grain yields are increased, while weed, insect and disease problems are reduced.
Yield limiting factors
The major factors that limit crop yields are:
• Unsuitable soil selection;
• Restricted soil water availability and climatic stresses;
• Low soil fertility and nutritional deficiencies;
• Plant diseases;
• Weed competition;
• Insects;
• Sub-optimal planting dates and cultivar choices;
• Poor seed germination and crop establishment.
These factors arise because of poor cultivation methods, inappropriate soil selection and low water retention practices, soil water accumulation, and crop rotation.
Long-term rotations require planning
Good crop rotation planning is the single most important management practice determining yields and profitability. It is an investment in risk aversion. A well planned and managed crop rotation system decreases input costs, increases yields and spreads production risks.
What is the best crop rotation system?
There is not one single crop rotation system that will be suitable for all production regions. Every farmer must plan and develop a long-term system that is adaptable and sustainable, incorporating the principles of agronomic management and farm planning. The choice of crop for each field must be based on an objective determination of gross income, input costs, field, and crop rotation history.
A crop rotation system for any given situation will be determined by:
• The objectives and attitude of the farmer;
• The different enterprises on the farm and relevant commodity prices;
• The cash flow and economics of the cultivated crops;
• Agronomic management principles;
6 7
• Soil depth, structure and texture;
• Soil fertility status and acidity;
• Total rainfall and distribution in the growing season;
• Spectrum of weeds occurring in the fields;
• The rotation of nitrogen fixing and nitrogen dependent crops;
• Occurrence of plant diseases;
• The prevention in the build-up of soilborne diseases;
• Available machinery and equipment, and
• Livestock needs and fodder flow requirements.
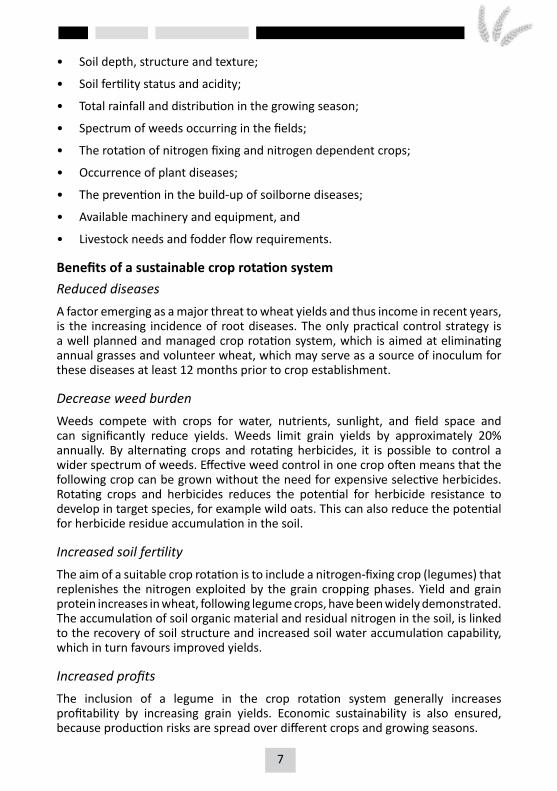
Benefits of a sustainable crop rotation systemReduced diseasesA factor emerging as a major threat to wheat yields and thus income in recent years, is the increasing incidence of root diseases. The only practical control strategy is a well planned and managed crop rotation system, which is aimed at eliminating annual grasses and volunteer wheat, which may serve as a source of inoculum for these diseases at least 12 months prior to crop establishment.
Decrease weed burdenWeeds compete with crops for water, nutrients, sunlight, and field space and can significantly reduce yields. Weeds limit grain yields by approximately 20% annually. By alternating crops and rotating herbicides, it is possible to control a wider spectrum of weeds. Effective weed control in one crop often means that the following crop can be grown without the need for expensive selective herbicides. Rotating crops and herbicides reduces the potential for herbicide resistance to develop in target species, for example wild oats. This can also reduce the potential for herbicide residue accumulation in the soil.
Increased soil fertilityThe aim of a suitable crop rotation is to include a nitrogen-fixing crop (legumes) that replenishes the nitrogen exploited by the grain cropping phases. Yield and grain protein increases in wheat, following legume crops, have been widely demonstrated. The accumulation of soil organic material and residual nitrogen in the soil, is linked to the recovery of soil structure and increased soil water accumulation capability, which in turn favours improved yields.
Increased profitsThe inclusion of a legume in the crop rotation system generally increases profitability by increasing grain yields. Economic sustainability is also ensured, because production risks are spread over different crops and growing seasons.
8 9
MANAGEMENT OF WHEAT PRODUCTION
Good yields and profitability can only be achieved through careful planning and management. Higher yields imply higher profits, since production costs per ton of grain declines relatively as yields increase.
Avoid having an inflexible approach to crop management. Learn to adapt and revise management strategies as the cropping environment, yield potential, commodity prices and input costs changes.
What determines wheat yield?
Total grain yield per hectare is the result of:
• The number of plants per hectare;
• The number of ears per plant;
• The number of grains per ear;
• Individual grain weight.
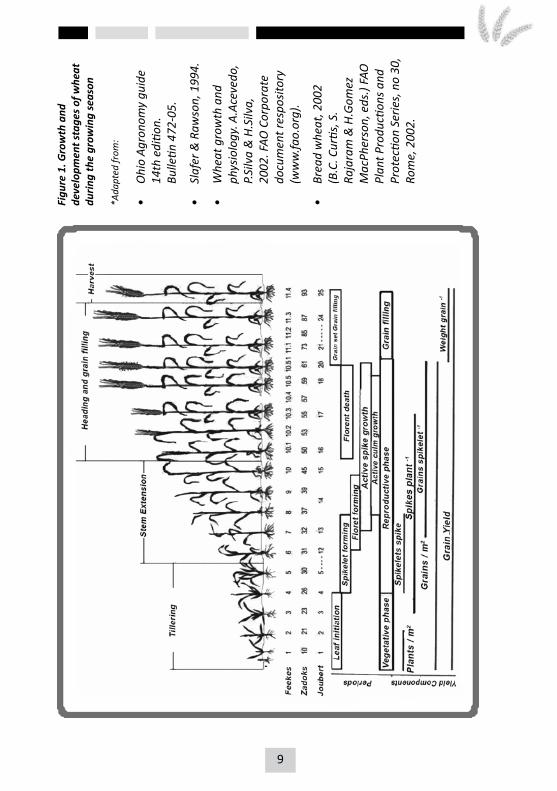
Above-mentioned yield components and eventually grain yield is determined during the three main development phases and relevant growth stages. It is possible that a yield component that kicks in at a later growth phase, partially compensate for reductions in a yield component determined at an earlier development stage. The development stages for the different yield components overlap to some degree in their respective effect on potential grain yield, and they are determined in a definite sequence, as indicated in the following schematic representation (Figure 1).
8 9
Figu
re 1
. Gro
wth
and
de
velo
pmen
t sta
ges o
f whe
at
durin
g th
e gr
owin
g se
ason
*Ada
pted
from
:
• O
hio
Agro
nom
y gu
ide
14th
edi
tion.
Bu
lletin
472
-05.
• Sl
afer
& R
awso
n, 1
994.
• W
heat
gro
wth
and
ph
ysio
logy
. A.A
ceve
do,
P.Si
lva
& H
.Silv
a,
2002
. FAO
Cor
pora
te
docu
men
t res
posit
ory
(w
ww
.fao.
org)
.
• Br
ead
whe
at, 2
002
(B.C
. Cur
tis, S
. Ra
jara
m &
H.G
omez
M
acPh
erso
n, e
ds.)
FAO
Pl
ant P
rodu
ction
s and
Pr
otec
tion
Serie
s, n
o 30
, Ro
me,
200
2.
10 11
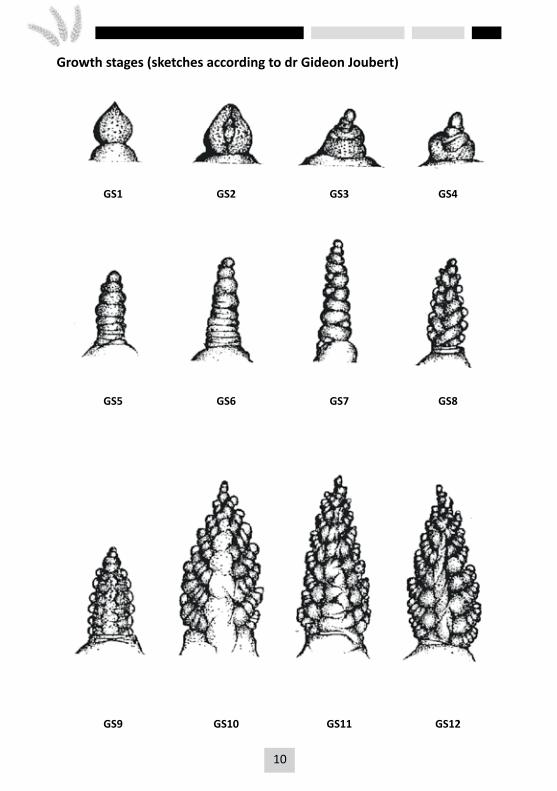
Growth stages (sketches according to dr Gideon Joubert)
GS1 GS2 GS3 GS4
GS5 GS6 GS7 GS8
GS9 GS10 GS11 GS12
10 11
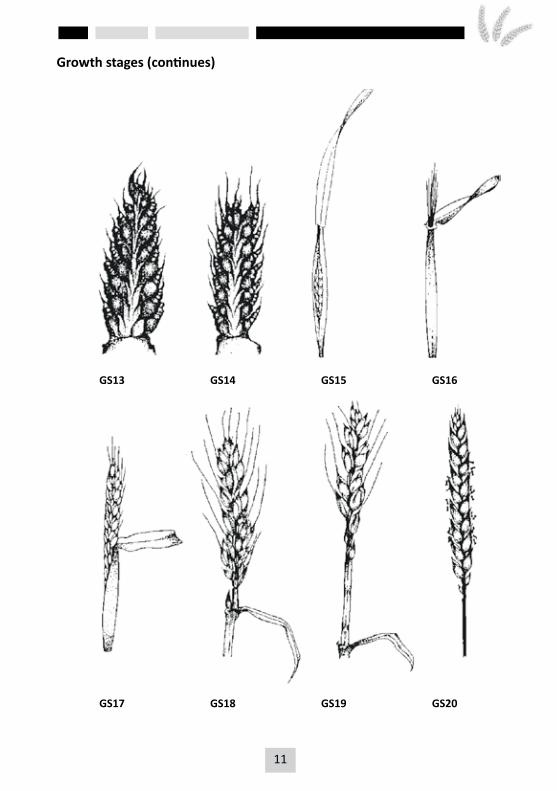
Growth stages (continues)
GS13 GS14 GS15 GS16
GS17 GS18 GS19 GS20
12 13
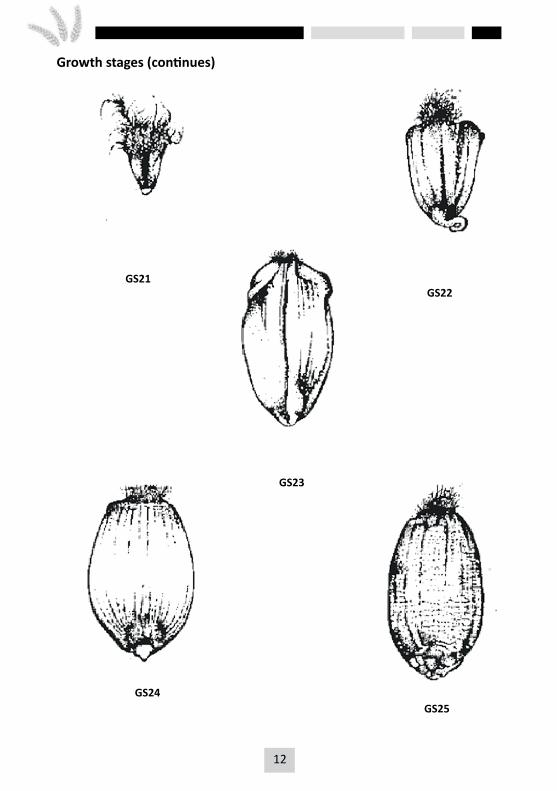
Growth stages (continues)
Gs 21 Gs 22
Gs 25
Gs 24 Gs 23
Gs 21 Gs 22
Gs 25
Gs 24 Gs 23
Gs 21 Gs 22
Gs 25
Gs 24 Gs 23
Gs 21 Gs 22
Gs 25
Gs 24 Gs 23
Gs 21 Gs 22
Gs 25
Gs 24 Gs 23
GS21GS22
GS23
GS24GS25
12 13
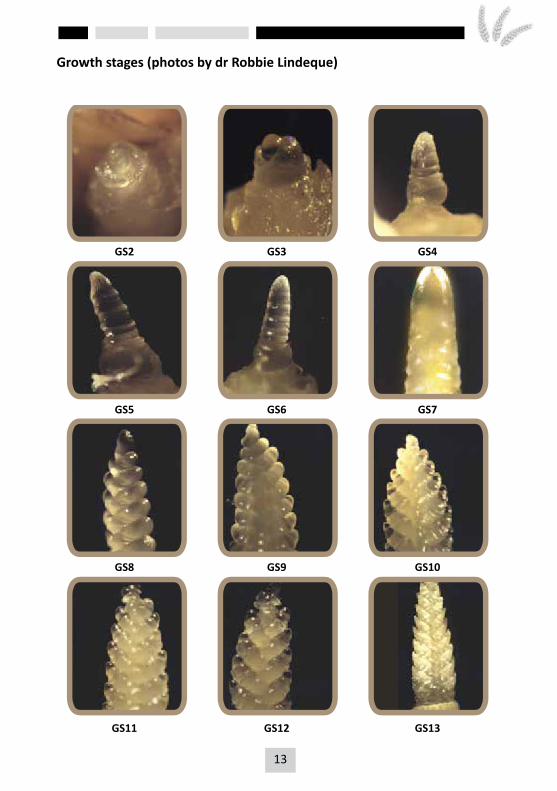
Growth stages (photos by dr Robbie Lindeque)
Gs 2
Gs 3 Gs 4
Gs 5 Gs 6 Gs 7
Gs 8 Gs 9 Gs 10
Gs 11 Gs 12 Gs 13
GS2
GS5
GS8
GS11
GS3
GS6
GS9
GS12
GS4
GS7
GS10
GS13
14 15
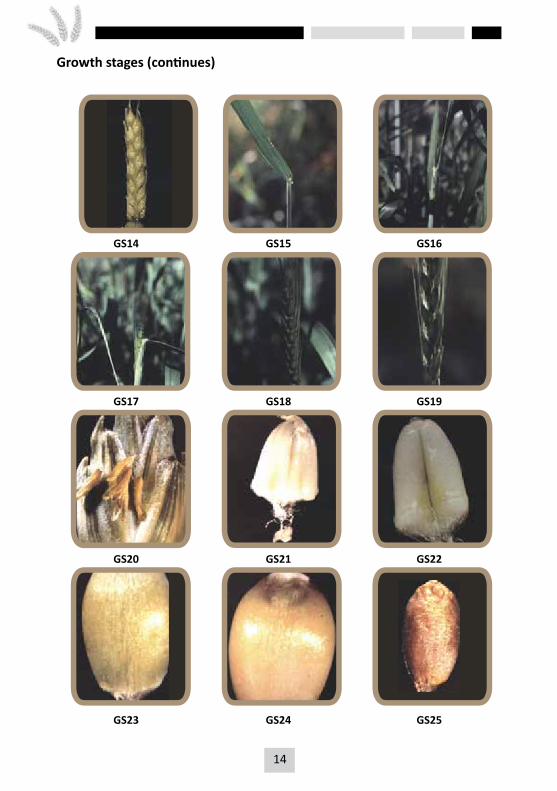
Growth stages (continues)
Gs 14
Gs 18 Gs 17
Gs 15 Gs 16
Gs 19
Gs 20 Gs 21 Gs 22
Gs 23 Gs 25 Gs 24
GS14
GS17
GS20
GS23
GS15
GS18
GS21
GS24
GS16
GS19
GS22
GS25
14 15
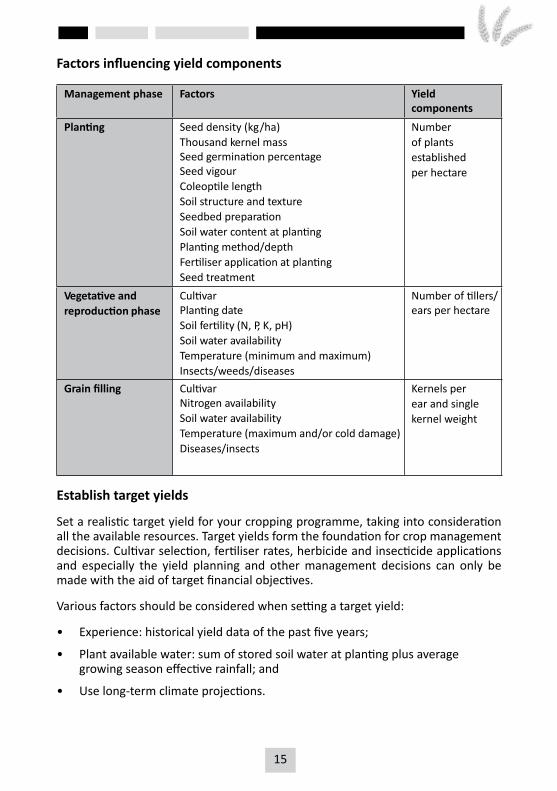
Factors influencing yield components
Management phase Factors Yield components
Planting Seed density (kg/ha) Thousand kernel massSeed germination percentageSeed vigourColeoptile lengthSoil structure and textureSeedbed preparationSoil water content at plantingPlanting method/depthFertiliser application at plantingSeed treatment
Number of plants established per hectare
Vegetative and reproduction phase
CultivarPlanting dateSoil fertility (N, P, K, pH)Soil water availabilityTemperature (minimum and maximum)Insects/weeds/diseases
Number of tillers/ears per hectare
Grain filling CultivarNitrogen availabilitySoil water availabilityTemperature (maximum and/or cold damage)Diseases/insects
Kernels per ear and single kernel weight
Establish target yields
Set a realistic target yield for your cropping programme, taking into consideration all the available resources. Target yields form the foundation for crop management decisions. Cultivar selection, fertiliser rates, herbicide and insecticide applications and especially the yield planning and other management decisions can only be made with the aid of target financial objectives.
Various factors should be considered when setting a target yield:
• Experience: historical yield data of the past five years;
• Plant available water: sum of stored soil water at planting plus average growing season effective rainfall; and
• Use long-term climate projections.
16 17
The risk associated with your selected yield target should be carefully considered. Profit is the compensation for taking risks, but be realistic: certain management practices and target yield goals have a higher risk component.
Achieving target yields
The key management decisions to achieve target yields and to maximise profits include the following:
• Total farm planning including soil selection;
• A well planned crop rotation system;
• Effective management of plant available soil water;
• Soil analysis for a relevant fertilisation and liming programme;
• Setting a realistic target yield;
• Application of effective soil cultivation practices;
• Informed cultivar selection;
• Use of high quality seed;
• Correct planting dates and seedling densities of selected cultivars;
• Appropriate planter speed and planting depth;
• Monitor the crop development and note observations;
• Make timely decisions on weed, insect and disease control;
• Timely harvest of grain crop;
• Develop a financially sound marketing strategy;
• Apply sound agronomic management principles.
16 17
SOIL TILLAGE GUIDELINES
Dr J Tolmay2
Kynoch2
Objectives of soil tillageSoil tillage is simply too expensive to practice without having well defined and specific objectives in mind. In monoculture systems in the Western Cape, the overriding objective is to improve the cultivation conditions of small grains and wheat in particular. Where wheat is cultivated in short crop rotation systems with medics and clovers, the effect of the tillage method on the re-establishment of these pastures also has to be considered. Knowledge of the factors that thus limit grain yield in the Western Cape, and the influence of different soil tillage methods thereon, are a prerequisite to ensure optimal tillage practises.
Influence of soil tillage on yield-limiting factorsPlant density
Despite drastic increases in seeding rates over the past decade, the plant density at seedling establishment is often still below 200 plants/m², which must be considered to be the general target for conventional tillage systems. Contributing to this problem is an uneven stand establishment that causes both an excessive and low stand on the same field.
Low and uneven germination and establishment can be prevented by using good quality seed, creating favourable seedbed conditions and by implementing seeding methods that ensure the seed is placed at an even depth and good contact with the soil should be achieved.
Trials have confirmed that different seeding/planting methods, under identical seedbed conditions, can cause differences in seedling establishment of up to 30%. The results also indicate that seeding implements with good depth control, give the best results, while presswheels and rollers also benefited establishment. The greatest advantage with presswheels and rollers is, however, achieved under fairly dry conditions, and in sandy soils and rough seedbeds with plenty of unwithered stubble. Rollers must, however, be avoided on fine seedbeds and in very wet conditions.
The establishment of an even seedling stand will also benefit from an early planting, when soil temperatures still tend to be higher, in conditions where adequate soil moisture is available. In this regard, a fairly thick layer of stubble on the soil surface may be advantageous. Stubble could also prevent or limit the formation of surface crusting, which strongly inhibits establishment. The optimal quantity of crop residue to be left on the soil surface, will depend on the availability of suitable implements. It is important that implements must be able to handle the residue without blocking. The use of straw choppers and spreaders will be a necessity in most cases, to ensure an even distribution of residue.
18 19
Although a wide variety of disc- and tine drills are on offer, their suitability will depend on specific on-farm soil type, stoniness and topography. Because new implements are very costly, therefore advice from a machinery expert may be needed. Old on-farm machinery may in some cases also be quite effective after modification.
Soil moisture supply
Due to the limited depth of most small grain soils in the Western and Southern Cape and an erratic rainfall distribution pattern, small grain crops are often limited by both water-logged and drought conditions within the same season. Since the amount of rainfall is a fixed production factor, the producer can only strive for better utilisation of the rainfall to ensure an optimal moisture supply for his crop.
While different methods of soil tillage do affect the soil moisture content during the growing season, the effect thereof on the number of days that the crop is subject to drought is minimal in the Western and Southern Cape, due to the low soil moisture storage capacity of the soil. The soil water storage capacity of the soil can, however, be increased slightly by creating ridged beds, for example when practising open furrow drainage. This technique has the added advantage that it also limits waterlogged conditions. Unfortunately, large areas of the Western and especially the Southern Cape are too hilly to apply this technique. In these areas producers can do little more than utilise available soil moisture optimally by arranging planting/seeding dates so that the growth cycle of the crops falls as far as possible within the rainfall season. Crops must thus be planted/seeded directly after the onset of the rainfall season. In the Southern Cape, where part of the annual rainfall occurs in the summer, crops can even be planted just prior to the onset of the rainfall season. These objectives are, however, only achievable if the soil has good structure so that the minimum of tillage will be necessary and early rainfall is conserved by a mulch of stubble on the soil surface.
Root development
This limiting factor largely overlaps with the previous discussion due to the influence of soil depth on root development. Rooting depths of less that 200 mm often occur on soils of 300-400 mm. Shallow root development can thus also be the result of other factors, such as high soil bulk densities, low soil pH (soil acidity) and compacted layers.
Shallow tillage practices and no-till result in an increased soil bulk density at most soil depths. The effect thereof on root development will largely depend on soil type and soil structure. On very sandy and heavy clay soils this effect may be permanent, but the results of previous research, indicates that the effect on shale soils (Glenrosa soil type) decreases as the duration of minimum tillage increases. Due to the important role of soil structure, which takes considerable time to improve, a gradual decrease in the frequency of deep tillage practices is advisable. Crop rotation systems with leguminous crops can help to speed up this process. On lime-poor soils, soil acidity may in any case necessitate deep application of lime. Due to
18 19
high nitrogen fertilisation levels in monoculture systems, the rate of acidification in these soils will be considerably higher than in systems that include leguminous crops.
Diseases and weeds
While wheat diseases such as eyespot, take-all and crown rot, as well as weeds such as gut brome and ryegrass, are important grain yield limiting factors in the Western and Southern Cape, it is a well known fact that crop rotation with leguminous crops is the most efficient method of controlling these problems. In such systems the effective chemical control of grass weeds, which may harbour disease inoculum, in the non-grass crops is essential. Should monoculture, however, be practiced, these problems may be curtailed by burning the residue or by deep mouldboard ploughing. Due to the high costs associated with mouldboard ploughing, the first alternative is preferred. The continuous burning of stubble residue will, however, increase the erodability of the soil and damage the soil structure. For this reason it must be applied judiciously.
Plant nutrition
The contribution of plant nutrition to the total production cost for wheat in the Swartland wheat producing area may be well in excess of 30%. The soil tillage method may have an effect on both the efficient use of fertiliser applications and N-mineralisation that contributes to the cost of plant nutrition.
Efficient use of fertilisers is affected by fertiliser placement (uptake) and root distribution. To improve their uptake, fertilisers (like phosphorus) that do not move easily in the soil, must be placed near the roots. As already discussed, efficient root distribution is affected by soil strength.
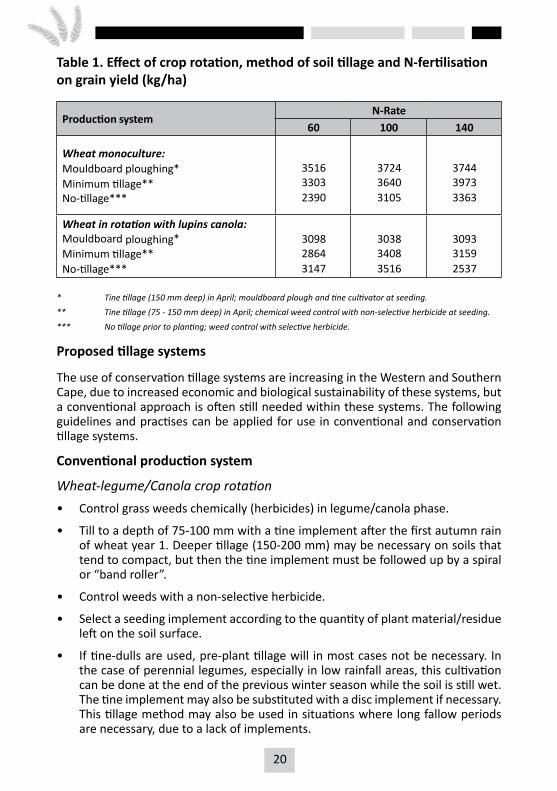
N-mineralisation of the soil is determined by climate, soil conditions and method of soil tillage. N-mineralisation in the soil could provide large amounts of nitrogen in crop rotation systems, which include legume plants and in systems such as conservation farming where microbial activity in the soil is high. Although aggressive mouldboard ploughing may enhance N-mineralisation on the short term, negative effects on soil structure, organic content and soil microbial activity may result in a reduction on the long-term. From Table 1 it is, therefore, clear that optimum N-rates for different crop rotation and methods of tillage will differ.
20 21
Table 1. Effect of crop rotation, method of soil tillage and N-fertilisation on grain yield (kg/ha)
Production systemN-Rate
60 100 140
Wheat monoculture: Mouldboard ploughing* Minimum tillage**No-tillage***
351633032390
372436403105
374439733363
Wheat in rotation with lupins canola:Mouldboard ploughing*Minimum tillage**No-tillage***
309828643147
303834083516
309331592537
* Tine tillage (150 mm deep) in April; mouldboard plough and tine cultivator at seeding.** Tine tillage (75 - 150 mm deep) in April; chemical weed control with non-selective herbicide at seeding.*** No tillage prior to planting; weed control with selective herbicide.
Proposed tillage systems
The use of conservation tillage systems are increasing in the Western and Southern Cape, due to increased economic and biological sustainability of these systems, but a conventional approach is often still needed within these systems. The following guidelines and practises can be applied for use in conventional and conservation tillage systems.
Conventional production system
Wheat-legume/Canola crop rotation• Control grass weeds chemically (herbicides) in legume/canola phase.
• Till to a depth of 75-100 mm with a tine implement after the first autumn rain of wheat year 1. Deeper tillage (150-200 mm) may be necessary on soils that tend to compact, but then the tine implement must be followed up by a spiral or “band roller”.
• Control weeds with a non-selective herbicide.
• Select a seeding implement according to the quantity of plant material/residue left on the soil surface.
• If tine-dulls are used, pre-plant tillage will in most cases not be necessary. In the case of perennial legumes, especially in low rainfall areas, this cultivation can be done at the end of the previous winter season while the soil is still wet. The tine implement may also be substituted with a disc implement if necessary. This tillage method may also be used in situations where long fallow periods are necessary, due to a lack of implements.
20 21
Wheat monoculture system
• If grass weeds and diseases, especially root diseases, are not a problem, the above-mentioned tillage system can also be implemented in this case.
• If diseases and non-selectively controlled grass weeds are the most yield limiting factors, the pre-establishment weed spray can be substituted by a deep plough tillage, followed by a harrow or sweep to bury weed seeds and contaminated/diseased residue.
Conservation tillage systemsConservation tillage systems differ from conventional tillage systems in that soil disturbance is kept at a minimum, soil is hardly ever inverted and stubble is purposefully retained to protect the soil against erosion. The retention of stubble will improve the production potential of soil over time by altering the soils physical, chemical and biological properties and improve soil water usage. However, the retention of stubble also causes problems and difficulties that need to be managed in the system. The use of crop rotation systems, especially the inclusion of pasture phases, is of utmost importance to ensure effective control of weeds, especially herbicide resistant grasses. When wheat is planted in monoculture, especially in conservation tillage systems where stubble is retained, the incidence of diseases like take-all, crown rot, Septoria, eyespot and head blight can increase drastically due to inoculum that is associated with the stubble. Control of herbicide resistant weeds may be more troublesome, due to a smaller range of herbicides (with similar modes of action) that can be applied. Wheat and barley must therefore be rotated with canola, lupines or pasture crops to break these disease cycles and the build-up of inoculum and seed banks of herbicide resistant weeds.
Within conservation tillage systems, a variety of planting methods can be used. These planting methods are sometimes closely related, and can often be confusing. The following definitions can help to clarify these methods:
The no-till planting method
The no-till method (short for no-tillage) is most often used in South Africa and Australia. The planter is fitted with knife-point openers and press wheels, that to some extent, cultivate the soil during the planting process. However, less than 20% of the soil should be disturbed.
Direct seeding
More or less the same as no-till, but stubble openers can also include discs and/or coulters that cause more than 20% of the soil on the surface to be disturbed. This method is often used in Canada, North- and South America and the eastern parts of Australia. In South Africa, it is more often used in heavy stubble situations, such as under irrigation.
22 23
Zero till
Refers to the planting method where planters are equipped only with coulters or discs, without knife-point openers that penetrate the soil. No mechanical loosening of the soil occurs during the planting process. The disc openers cut a groove in the soil in which the seed is placed and then closed. This planting method is extremely fast (up to 16 km/h) and suitable to be used when the crop is established in dry soil because no surface clods are formed. The use of “Star-wheel” planters (that cause the absolute minimum soil disturbance), can also be considered a zero-till planting method. Zero-till will, however, not be suitable for most soils in the Western Cape as they have very high stone and gravel fractions. This planting method is only practical if the soil has already been improved by years of conservation tillage, stubble retention and crop rotation. All three of these planting methods are similar in terms of stubble retention, pre-emergence herbicide application and planting without prior cultivation.
Conversion to conservation tillage
Traditionally, in the Western Cape Province, winter cereals are either broadcasted or sown in 170 mm rows at densities of as much as 130 kg/ha. These sowing methods, however, create problems for farmers who changed from conventional mouldboard and disc-ploughing to more sustainable systems of conservation tillage such as no-till, where crop residues are left on the soil surface and the soil is not disturbed before the planting process. No-till tine drills with knife-point openers are now commonly used, but heavy stubble can still cause blockages of planting equipment. Wider row spacing, distribution of planting units and two or more bars and higher vertical clearance of no-till planters offer better stubble flow than conventional planters. Wide row widths also reduce planting cost by increasing efficiency and decreasing the energy needed for the planting process. This is achieved by using the same fuel to plant a given area in a shorter time. Over time, wider row spacing also reduce the initial cost of the implement and maintenance cost.
For instance, if the row width of a 12 row planter is increased from 250 mm to 300 mm and the planter plants at a speed of 8 km/h, the planter will plant 0.4 ha per hour more. For a typical 12 hour working day, the planter will plant 4.8 ha per day more, using the same fuel and at no extra cost. Increasing planting rate (ha/day) is by itself a major advantage in the Western Cape, due to the short planting window available in the region.
It is important to address any physical or chemical problems in the soil (eg. liming to adjust soil pH) before starting with conservation tillage as it will be difficult to address these problems adequately once the system is implemented and deep tillage is eliminated.
Research results
ARC-Small Grain has conducted research, with regard to the possible effects wider rows may have on spring wheat production in the Western Cape. A commercially
22 23
available no-till planter with knife-point openers and band placing of fertiliser was used to plant trials in the Southern Cape (Caledon, Swellendam and Riversdale) and in the Swartland (Moorreesburg and Hopefield). Where possible, trials were planted only on fields that had been used for canola, clovers or lupines in the previous season, but in some cases the trials were planted on first year wheat stubble. During these seasons, a wide variation of conditions was experienced ranging from excellent to very poor.
Two or three row widths including 250 mm, 300 mm and 350 mm were used at each site. In addition, different cultivars were also included and planted at different seeding densities according to recommendations for the area. The experiments were all executed on the farms of commercial farmers and the producer (except for the planting and harvesting processes) managed the whole trial site.
Seedling survivalSeedling survival in the Western Cape is generally low, due to the shallow soils with limited water holding capacity and high stone and gravel fractions and therefore relatively high planting densities are needed to ensure a stand of at least 200 plants/m². Normally, only 50% seedling survival was achieved with the broadcast planting method, while 60-70% survival could be achieved with conventional planters in conventional tillage systems. Research indicated that 80% seedling survival can be achieved with no-till planters equipped with knife-point openers and press wheels in most seasons. Seedling survival lower than 80% was noted at some localities and in some seasons due to unfavourable conditions after planting, but these conditions would have had a similar effect on other planting methods. Increased seedling survival makes the use of lower planting densities possible without significant yield loss, but it remains important to ensure sufficient plant stands, especially in high potential areas. In these areas, 200 established plants/m² remain a realistic target to ensure optimum grain yield.
Row widths
No-till planters must make use of row widths wider than 170 mm that was formerly used formerly in order to achieve sufficient stubble flow through the system. No-till planters are currently produced with 250, 275 or 300 mm row widths. In general, the wider row option will have the following advantages:
• Lower input and capital costs (fuel, maintenance and initial buying price);• Reduced risk with regard to the use of pre-emergence herbicides and faster
planting speed;• More efficient stubble flow; and• Less competition with weeds between rows, especially in poor sections when
sunlight can enter between the rows.
24 25
Unfortunately, the use of the wider row option can also have the following disadvantages:
• Increased competition with weeds in the row, especially herbicide resistant grasses.
• In poor seasons, wide rows can cause problems during the pick-up process if the crop is swathed.
Research findings from twenty trials indicated that the use of the wider row width option (300 mm vs 250 mm) did not necessarily lead to a negative yield response, but that significant yield loss can occur under certain conditions. In four of the twenty trials, significant yield reductions were measured with the use of 300 mm vs 250 mm row widths. Significant interactions between cultivars, row widths and planting density indicated that cultivars may respond differently to planting density and row widths in this region. When yield loss occurs, it is usually in the order of 200 kg/ha, which can constitute a loss of 5-10% at yield levels of 2-4 ton/ha.
These reductions in grain yield can be attributed to a reduction in the number of heads/m² that was noted in almost all trials when row widths increased. The reduced head populations due to wider row widths can probably be attributed to an increase in inter-plant competition for resources (water, nutrients and light). Similar, grain yield with wide row widths can therefore only be achieved if compensation by the plant (increased kernels/head or increased kernel weight) occurs. This compensation depends heavily on growing conditions late in the season (in the period just before and after flowering) when the number of kernels/head is set and during the grain filling stage when the final kernel weight is determined. Unfortunately, water availability during these two critical periods cannot be controlled and a lack of compensation will lead to reduced yields with wide row widths. Row widths, not wider than 300 mm, will give acceptable results in most seasons and in most production areas, but the risk of yield loss due to the use of the wider row option cannot be excluded. The Swartland and especially the Sandveld are more sensitive to the use of wider row widths.
Recommendations
Row widths
The choice of the row width option used (250, 275 or 300 mm) is left to the producer after considering the advantages of the wider row width option in relation to the risk in his specific area. Requirements with regards to swathing and planting speed when pre-emergence herbicides are used must also be considered. A row width of 275 mm in the Swartland and Sandveld seems to be a good compromise between safety of applying herbicides, planting speed and reduction of risk for yield loss. Row widths wider than 300 mm do not serve any purpose and are not recommended in this region.
24 25
Planting density
New planting density recommendations, based on five season’s data from field trials executed in conservation tillage systems, are made for the no-till planting method in the Western Cape. These recommendations require lower planting densities than recommended by owners of cultivars for use in conventional planting methods and are made with the following prerequisites:
• The planter used is specifically designed to plant effectively through stubble left on the surface by the conservation tillage/crop rotation system;
• A seed survival percentage of 80% or better is easily obtainable with the planter;
• Row widths of 250-300 mm are used;
• Cultivars with above average tillering ability are used;
• Good quality seed with known germination percentage is used;
• Sufficient soil water is available during planting time;
• Early planting dates, well within the optimal planting time, are used;
• A positive outlook on rainfall during the season is expected;
• Fertiliser is placed accurately with the majority of fertiliser placed safely away from the seed. Not more than 15 kg N/ha should be placed in close proximity to the seed, to reduce the risk of fertiliser toxicity;
• Safe application of registered pre-emergence herbicides is ensured;
• Good control over herbicide resistant grasses through the crop rotation system and other practices; and
• Pests that are able to reduce seedling survival, like slugs and isopods, are not present in very large numbers.
If it is not possible to adhere to these prerequisites, it is in the interest of the producer to adhere to the planting densities as recommended by the owner of the cultivar. These planting density recommendations include a large safety factor and will ensure sufficient seedling survival in almost all conditions. If the producer plans a reduced planting density and conditions deteriorate during the planting season, the planting density should be increased to cater for these conditions. The recommendations for lower planting density are linked to target plants/m² and the necessary conversion to kg/ha must be made by taking into account the thousand kernel mass (TKM) for each cultivar to be planted, (Tables 1, 2 and 3 on pages 34 and 35).
26 27
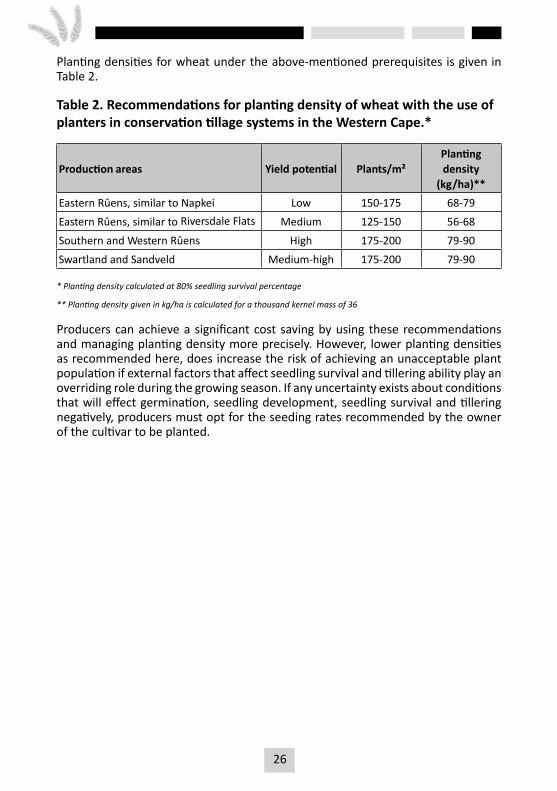
Planting densities for wheat under the above-mentioned prerequisites is given in Table 2.
Table 2. Recommendations for planting density of wheat with the use of planters in conservation tillage systems in the Western Cape.*
Production areas Yield potential Plants/m²Planting density
(kg/ha)**Eastern Rûens, similar to Napkei Low 150-175 68-79
Eastern Rûens, similar to Riversdale Flats Medium 125-150 56-68
Southern and Western Rûens High 175-200 79-90
Swartland and Sandveld Medium-high 175-200 79-90
* Planting density calculated at 80% seedling survival percentage
** Planting density given in kg/ha is calculated for a thousand kernel mass of 36
Producers can achieve a significant cost saving by using these recommendations and managing planting density more precisely. However, lower planting densities as recommended here, does increase the risk of achieving an unacceptable plant population if external factors that affect seedling survival and tillering ability play an overriding role during the growing season. If any uncertainty exists about conditions that will effect germination, seedling development, seedling survival and tillering negatively, producers must opt for the seeding rates recommended by the owner of the cultivar to be planted.
26 27
GUIDELINES FOR WHEAT CULTIVAR CHOICE
Cultivar choice is an important production decision and if planned correctly, could contribute greatly to reducing risk and optimising yields. The decision is complicated by all the different factors that contribute to the adaptability, yield potential, agronomic characteristics and disease risks of the current commercially available cultivars. The correct cultivar choices contribute to management of risk and achieving optimal grain yield in a given situation.
To fully utilise this cultivar diversity and to make an informed decision, it is important that the producer knows the beneficial and limiting characteristics of each cultivar. For this reason, additional information regarding cultivar characteristics, long-term yield data and relative yields are made available to the producer.
There are a few important guidelines that the producer must consider when deciding on his cultivar choice:
• Plant a range of cultivars to spread production risks, especially in terms of drought and disease occurrence;
• Utilise the optimum planting spectrum of the cultivars in an area;
• Do not, within one season, replace a well-known cultivar with a new and unknown cultivar. Rather plant the new cultivar alongside the stalwart for at least one season to compare them and to get to know the new cultivar;
• Cultivars that are able to adapt to specific yield potential conditions should be chosen;
• Revise cultivar choice annually to adapt to changing circumstances, as well as to consider new cultivars; and
• Take the disease/insect resistance levels as well as the quality characteristics of each recommended cultivar into consideration when finalising your cultivar choice annually.
Plant Breeders’ Rights (Act 15 of 1976)
This act renders legal protection to breeders and owners of cultivars. The awarding of rights procedure stipulate that cultivars must be new, distinguishable, uniform and stable, and protection is granted for a 20 year period. The rights of the owner/breeder entail that no party may multiply propagating material (seed), process it for planting, sell it, import it, export it and keep it in stock without the necessary authorisation or license of the holders of right. The act makes provision for the court to grant compensation of R10 000-00 to the holder of the Plant Breeders’ Rights in cases of breaching of rights.
28 29
Seed certification and Table 8, as described in the Plant Improvement Act
The main aim of certification of seed is to ensure the proper maintenance of cultivars. Seed laws and regulations prescribe the minimum physical requirements, while certification of seed strives to achieve high standards of genetic purity and other quality requirements. Seed certification is a voluntary action that is managed by SANSOR on behalf of the Minister of Agriculture. However, if a cultivar is listed in Table 8, it is subject to compulsory certification. This scheme specifically guarantees cultivar purity, as well as good seed quality, renders protection and peace of mind to the buyer (producer), as well as an improved control system for acting on complaints and claims. The costs involved are a minimal price to pay for this peace of mind to both buyer and seller of certified seed. Remember that all retained seed looses the accountability of owner of the cultivar in relation to seed quality and performance of the cultivar.
Factors determining cultivar choice
Cultivar choice is an economic decision by which the producer aims to achieve the highest return with the lowest risk. Factors determining cultivar choice are thus fundamental to this decision. The most important factors are briefly discussed and for this reason a table is included that characterise the released cultivars.
Yield potential
The genetic yield potential of the available cultivars is higher than the yields currently realised under commercial conditions. These differences in yields are mainly due to environmental conditions (climatic and production conditions), crop management decisions, disease, insect and weed pressures.
Cultivars differ in their yield reaction to changing yield potential conditions. Some cultivars perform better at a lower yield potential, while others utilise higher potential conditions better. The ideal cultivar would yield the highest at all yield potential conditions. This would indicate excellent adaptability, but usually high yield is negatively related to other economically important factors, such as protein content, baking quality and hectolitre mass. It is especially important that under dry-land conditions the producer should know the yield potential of his farm and fields according to soil, climate and managerial ability. Thereby a realistic target yield can be determined, that will aid cultivar choice and also other production options like fertiliser planning.
Grading and quality
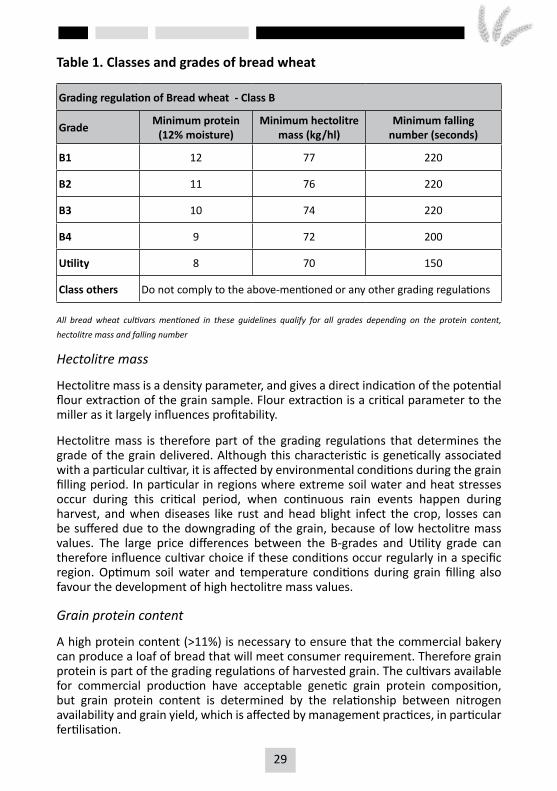
According to the grading system promulgated under the Act on Agricultural Products, only one bread wheat class exists with four grades, viz. B1, B2, B3 and B4, that are determined according to the protein content of the grain, the hectolitre mass and the falling number (Table 1). Hectolitre mass and especially protein content are largely determined by the environment during the grain filling period to maturity, and also by management practices including soil water and fertiliser management.
28 29
Table 1. Classes and grades of bread wheat
Grading regulation of Bread wheat - Class B
Grade Minimum protein(12% moisture)
Minimum hectolitre mass (kg/hl)
Minimum fallingnumber (seconds)
B1 12 77 220
B2 11 76 220
B3 10 74 220
B4 9 72 200
Utility 8 70 150
Class others Do not comply to the above-mentioned or any other grading regulations
All bread wheat cultivars mentioned in these guidelines qualify for all grades depending on the protein content, hectolitre mass and falling number
Hectolitre mass
Hectolitre mass is a density parameter, and gives a direct indication of the potential flour extraction of the grain sample. Flour extraction is a critical parameter to the miller as it largely influences profitability.
Hectolitre mass is therefore part of the grading regulations that determines the grade of the grain delivered. Although this characteristic is genetically associated with a particular cultivar, it is affected by environmental conditions during the grain filling period. In particular in regions where extreme soil water and heat stresses occur during this critical period, when continuous rain events happen during harvest, and when diseases like rust and head blight infect the crop, losses can be suffered due to the downgrading of the grain, because of low hectolitre mass values. The large price differences between the B-grades and Utility grade can therefore influence cultivar choice if these conditions occur regularly in a specific region. Optimum soil water and temperature conditions during grain filling also favour the development of high hectolitre mass values.
Grain protein content
A high protein content (>11%) is necessary to ensure that the commercial bakery can produce a loaf of bread that will meet consumer requirement. Therefore grain protein is part of the grading regulations of harvested grain. The cultivars available for commercial production have acceptable genetic grain protein composition, but grain protein content is determined by the relationship between nitrogen availability and grain yield, which is affected by management practices, in particular fertilisation.
30 31
Falling number
Falling number is an indication of the alpha-amylase enzyme activity in the grain. High alpha-amylase activity (low falling number) is an indication that the starch molecules have to a large extent been broken down to sugars (maltose especially) and that such grain is unacceptable for commercial milling and baking purposes.
Preharvest sprouting tolerance
This refers to the tolerance a cultivar has against germination in the ear during physiological maturity prior to harvesting. Genetic variation exists between cultivars for preharvest sprouting resistance. It is important to note that none of the available cultivars will sprout in the ear under normal conditions. Certain cultivars are, however, more prone to preharvest sprouting than others under continuous rain and high humidity conditions during the harvest period.
Diseases and insects
The occurrence of diseases and insects in a region and the susceptibility of cultivars to these diseases and damage by insects must be considered in cultivar planning. In this way, risk and input costs (chemical spraying costs) can be reduced (see the Diseases and Insect Control Section). Keep in mind that the intensity can change from year to year and in certain exceptional situations also the susceptability.
Seed quality
Buy high quality seed (without shriveled and broken seeds) with a germination percentage of 90% or higher. Plant the chosen cultivar at the recommended seeding density and also be aware of the coleoptiles length of a cultivar when planting deeper into a dry seedbed.
Straw strength
The lodging of spring wheat cultivars often leads to yield losses. It is usually a problem when high yield potential conditions occurs, but factors such as wind and storm occurrence, high seeding densities, row widths and excessive nitrogen fertilisation also play a role. In areas and situations where lodging is widespread, cultivars prone to lodging must be managed carefully. Chemical growth regulators are available on the market that can limit lodging significantly by limiting plant height. These products can be considered for cultivars with high yield potential prone to lodging in high yielding conditions. There are also cultivars available with genetic resistance to lodging.
30 31
Aluminium tolerance
In acidic soils [pH (KCl) <4,5 and acid saturation >8%] in certain wheat producing areas, the Al³+-concentration levels in the soil reach levels toxic to the root growth and development of certain wheat cultivars. Cultivars differ in their tolerance to these harmful levels of aluminium. If these acidic soils are to be planted, it would aid the producer to adapt his cultivar choice to manage this production risk (see table for aluminium tolerant cultivars).
Although a corrective liming programme is the only sustainable long-term solution, tolerant cultivars can be considered as an interim measure (see Fertilisation Guidelines).
Photoperiod and vernalisation
Photoperiod and vernalisation control the growth period and are important factors determining cultivar adaptation. Cultivars must be chosen that are adapted to climatic conditions such as growing season length, planting spectrum, rainfall pattern during the growing season, soil water availability at planting, temperature during the growing season and the first and last frost dates. In this regard, the cultivars have been evaluated and this is reflected in the recommended optimum planting spectrum for each cultivar. Ideally, the choice of cultivars to be planted must cover the available planting spectrum of the specific region, so that the period from maturity to harvesting is increased to some extent. The growth period of a cultivar also gives an indication when the cultivar will be in the anthesis and grain filling growth stages.
Shatterproof
This factor refers to the measure of how well the ripe kernel is attached to the ear, as well as to what extent the chaff of the spikelet covers and protects the kernel. Certain cultivars are more susceptible to bird damage and losses due to shattering before and during harvesting. These cultivars must be carefully evaluated in regions where bird damage to the crop is a major concern, as well as areas where strong winds occur during maturity and harvest.
32 33
32 33
RECOMMENDATIONS AND SUMMARY OF RESULTS 2018
The most promising cultivars of all institutions involved in the small grain industry are annually included in the National Small Grain Cultivar Programme of the ARC Small Grain. Every year the results are evaluated and the guidelines for cultivar choice revised by a committee consisting of officials from ARC-Small Grain, SANSOR, SABM, Sensako, PANNAR, SABBI, K2, various Departments of Agriculture and the Universities of the Free State and Stellenbosch.
The following guidelines for cultivar choice are a summary of the results per region and only cultivars of which at least two year’s data are available are included. The guidelines act as reference within which more specific recommendations should fall. With the compilation of the guidelines, the following factors were considered:
• Grain yield;• Adaptability and yield stability;• Grain quality;• Disease resistance and• Agronomic characteristics such as lodging, threshability, preharvest sprouting,
etc. The recommendations have been made after consideration of these factors and include the following:• Cultivars and class division;• Optimum planting date for each cultivar;• Optimum seeding rate for each cultivar. Seeding rate in kg/ha is also influenced
by thousand kernel mass and planting date;• Recommendations are for grain production only;• Cultivars are not listed according to yield potential
It is important to note that all the field trials are executed in accordance with the production practices followed in the specific production region. The result is that all cultivars are tested in conditions which are similar to those where producers will eventually produce such cultivars.
34 35
Some of the important aspects are as follows:
• All seed used in the trials were treated with “Vitavax” against the smut diseases.• Spraying programmes for the control of diseases, weed and insects are mostly
done by producers themselves. If not, the function is performed by the project team, in accordance with production practices in the specific region.
• Planting dates and planting densities of all cultivars are standardised according to recommendations for the relevant region. The thousand kernel mass of each cultivar is used to calculate the seeding rate in plants/m2 to ensure this.
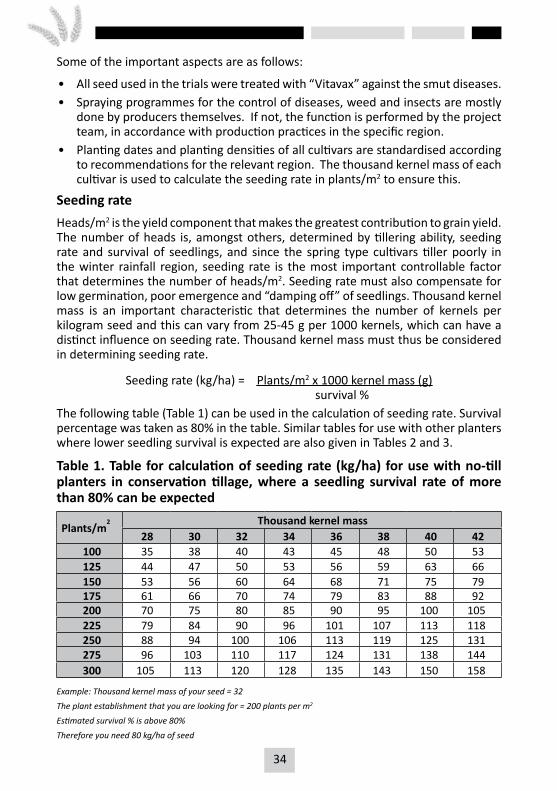
Seeding rate Heads/m2 is the yield component that makes the greatest contribution to grain yield. The number of heads is, amongst others, determined by tillering ability, seeding rate and survival of seedlings, and since the spring type cultivars tiller poorly in the winter rainfall region, seeding rate is the most important controllable factor that determines the number of heads/m2. Seeding rate must also compensate for low germination, poor emergence and “damping off” of seedlings. Thousand kernel mass is an important characteristic that determines the number of kernels per kilogram seed and this can vary from 25-45 g per 1000 kernels, which can have a distinct influence on seeding rate. Thousand kernel mass must thus be considered in determining seeding rate.
Seeding rate (kg/ha) = Plants/m2 x 1000 kernel mass (g) survival %
The following table (Table 1) can be used in the calculation of seeding rate. Survival percentage was taken as 80% in the table. Similar tables for use with other planters where lower seedling survival is expected are also given in Tables 2 and 3.
Table 1. Table for calculation of seeding rate (kg/ha) for use with no-till planters in conservation tillage, where a seedling survival rate of more than 80% can be expected
Plants/m2 Thousand kernel mass
28 30 32 34 36 38 40 42100 35 38 40 43 45 48 50 53125 44 47 50 53 56 59 63 66150 53 56 60 64 68 71 75 79175 61 66 70 74 79 83 88 92200 70 75 80 85 90 95 100 105225 79 84 90 96 101 107 113 118250 88 94 100 106 113 119 125 131275 96 103 110 117 124 131 138 144300 105 113 120 128 135 143 150 158
Example: Thousand kernel mass of your seed = 32The plant establishment that you are looking for = 200 plants per m2
Estimated survival % is above 80% Therefore you need 80 kg/ha of seed
34 35
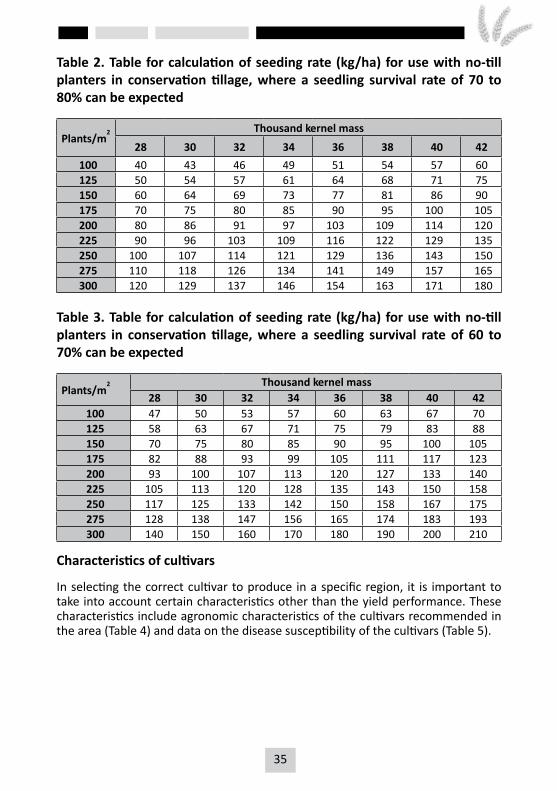
Table 2. Table for calculation of seeding rate (kg/ha) for use with no-till planters in conservation tillage, where a seedling survival rate of 70 to 80% can be expected
Plants/m2 Thousand kernel mass
28 30 32 34 36 38 40 42100 40 43 46 49 51 54 57 60125 50 54 57 61 64 68 71 75150 60 64 69 73 77 81 86 90175 70 75 80 85 90 95 100 105200 80 86 91 97 103 109 114 120225 90 96 103 109 116 122 129 135250 100 107 114 121 129 136 143 150275 110 118 126 134 141 149 157 165300 120 129 137 146 154 163 171 180
Table 3. Table for calculation of seeding rate (kg/ha) for use with no-till planters in conservation tillage, where a seedling survival rate of 60 to 70% can be expected
Plants/m2 Thousand kernel mass
28 30 32 34 36 38 40 42100 47 50 53 57 60 63 67 70125 58 63 67 71 75 79 83 88150 70 75 80 85 90 95 100 105175 82 88 93 99 105 111 117 123200 93 100 107 113 120 127 133 140225 105 113 120 128 135 143 150 158250 117 125 133 142 150 158 167 175275 128 138 147 156 165 174 183 193300 140 150 160 170 180 190 200 210
Characteristics of cultivars
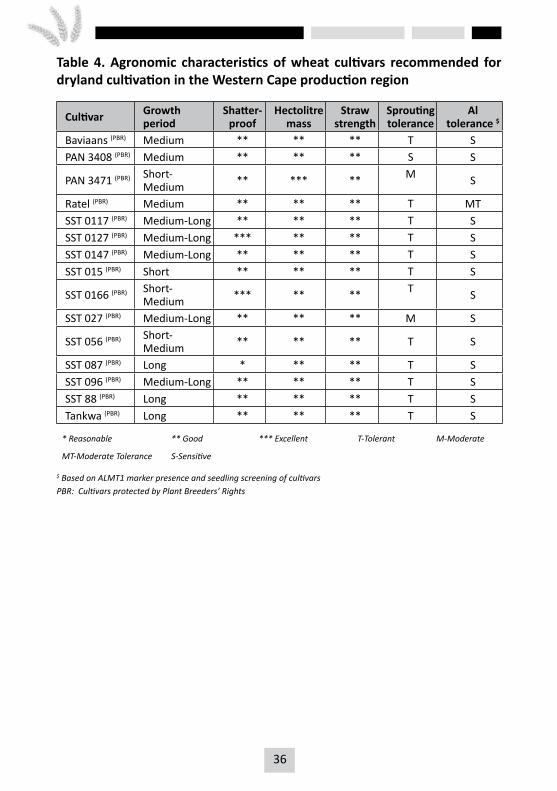
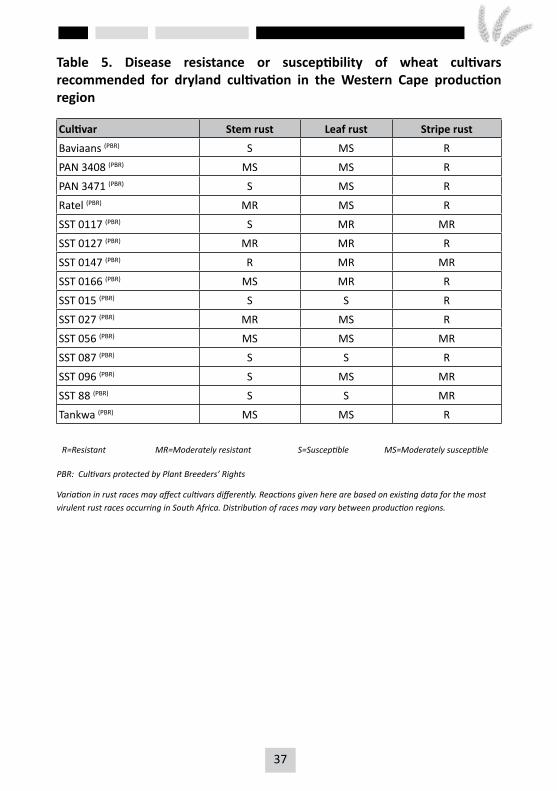
In selecting the correct cultivar to produce in a specific region, it is important to take into account certain characteristics other than the yield performance. These characteristics include agronomic characteristics of the cultivars recommended in the area (Table 4) and data on the disease susceptibility of the cultivars (Table 5).
36 37
Table 4. Agronomic characteristics of wheat cultivars recommended for dryland cultivation in the Western Cape production region
Cultivar Growth period
Shatter-proof
Hectolitre mass
Straw strength
Sprouting tolerance
Al tolerance $
Baviaans (PBR) Medium ** ** ** T SPAN 3408 (PBR) Medium ** ** ** S S
PAN 3471 (PBR) Short-Medium ** *** ** M S
Ratel (PBR) Medium ** ** ** T MTSST 0117 (PBR) Medium-Long ** ** ** T SSST 0127 (PBR) Medium-Long *** ** ** T SSST 0147 (PBR) Medium-Long ** ** ** T SSST 015 (PBR) Short ** ** ** T S
SST 0166 (PBR) Short-Medium *** ** ** T S
SST 027 (PBR) Medium-Long ** ** ** M S
SST 056 (PBR) Short-Medium ** ** ** T S
SST 087 (PBR) Long * ** ** T SSST 096 (PBR) Medium-Long ** ** ** T SSST 88 (PBR) Long ** ** ** T STankwa (PBR) Long ** ** ** T S
* Reasonable ** Good *** Excellent T-Tolerant M-Moderate
MT-Moderate Tolerance S-Sensitive
$ Based on ALMT1 marker presence and seedling screening of cultivarsPBR: Cultivars protected by Plant Breeders’ Rights
36 37
Table 5. Disease resistance or susceptibility of wheat cultivars recommended for dryland cultivation in the Western Cape production region
Cultivar Stem rust Leaf rust Stripe rust
Baviaans (PBR) S MS R
PAN 3408 (PBR) MS MS R
PAN 3471 (PBR) S MS R
Ratel (PBR) MR MS R
SST 0117 (PBR) S MR MR
SST 0127 (PBR) MR MR R
SST 0147 (PBR) R MR MR
SST 0166 (PBR) MS MR R
SST 015 (PBR) S S R
SST 027 (PBR) MR MS R
SST 056 (PBR) MS MS MR
SST 087 (PBR) S S R
SST 096 (PBR) S MS MR
SST 88 (PBR) S S MR
Tankwa (PBR) MS MS R
R=Resistant MR=Moderately resistant S=Susceptible MS=Moderately susceptible PBR: Cultivars protected by Plant Breeders’ Rights
Variation in rust races may affect cultivars differently. Reactions given here are based on existing data for the most virulent rust races occurring in South Africa. Distribution of races may vary between production regions.
38 39
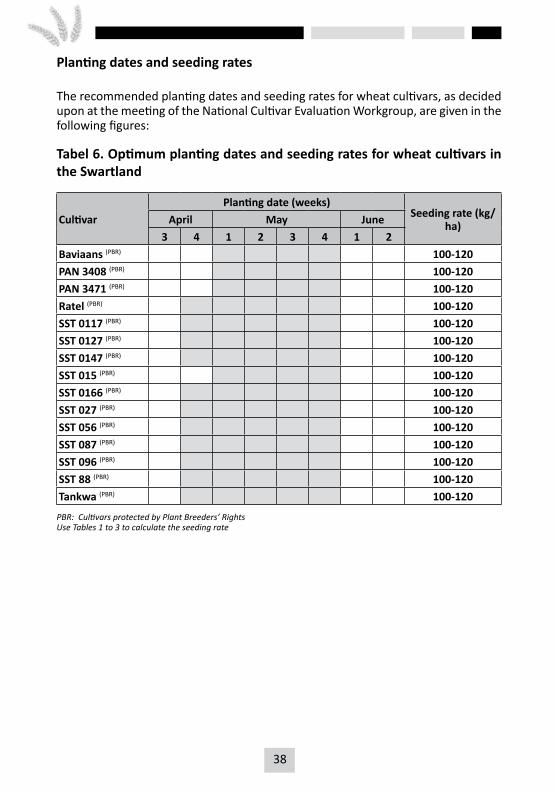
Planting dates and seeding rates
The recommended planting dates and seeding rates for wheat cultivars, as decided upon at the meeting of the National Cultivar Evaluation Workgroup, are given in the following figures:
Tabel 6. Optimum planting dates and seeding rates for wheat cultivars in the Swartland
CultivarPlanting date (weeks)
Seeding rate (kg/ha)April May June
3 4 1 2 3 4 1 2Baviaans (PBR) 100-120PAN 3408 (PBR) 100-120PAN 3471 (PBR) 100-120Ratel (PBR) 100-120SST 0117 (PBR) 100-120SST 0127 (PBR) 100-120SST 0147 (PBR) 100-120SST 015 (PBR) 100-120SST 0166 (PBR) 100-120SST 027 (PBR) 100-120SST 056 (PBR) 100-120SST 087 (PBR) 100-120SST 096 (PBR) 100-120SST 88 (PBR) 100-120Tankwa (PBR) 100-120
PBR: Cultivars protected by Plant Breeders’ RightsUse Tables 1 to 3 to calculate the seeding rate
38 39
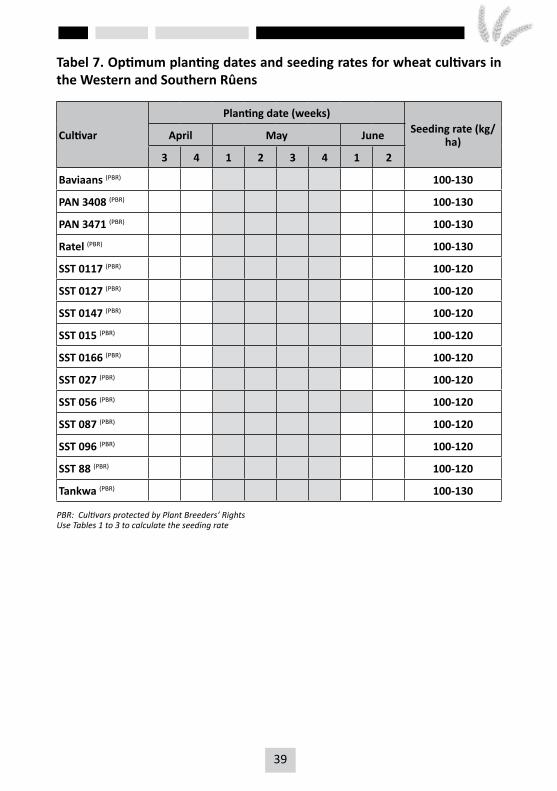
Tabel 7. Optimum planting dates and seeding rates for wheat cultivars in the Western and Southern Rûens
Cultivar
Planting date (weeks)Seeding rate (kg/
ha)April May June
3 4 1 2 3 4 1 2
Baviaans (PBR) 100-130
PAN 3408 (PBR) 100-130
PAN 3471 (PBR) 100-130
Ratel (PBR) 100-130
SST 0117 (PBR) 100-120
SST 0127 (PBR) 100-120
SST 0147 (PBR) 100-120
SST 015 (PBR) 100-120
SST 0166 (PBR) 100-120
SST 027 (PBR) 100-120
SST 056 (PBR) 100-120
SST 087 (PBR) 100-120
SST 096 (PBR) 100-120
SST 88 (PBR) 100-120
Tankwa (PBR) 100-130
PBR: Cultivars protected by Plant Breeders’ RightsUse Tables 1 to 3 to calculate the seeding rate
40 41
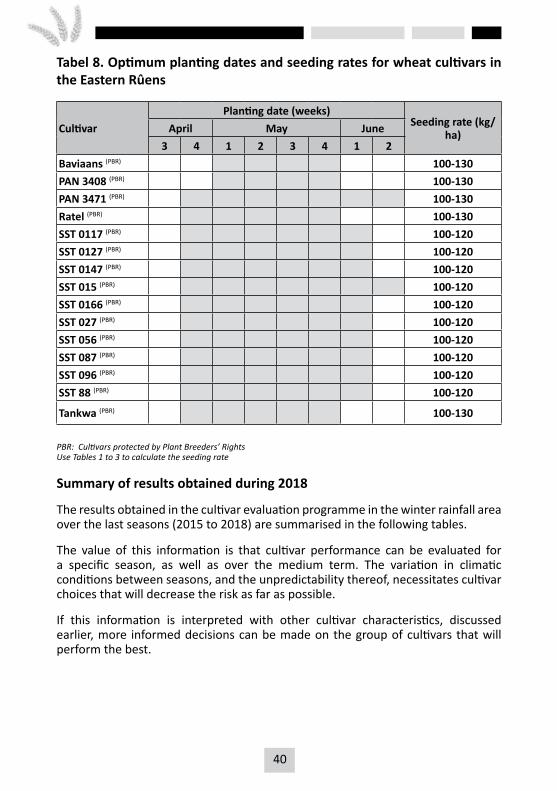
Tabel 8. Optimum planting dates and seeding rates for wheat cultivars in the Eastern Rûens
CultivarPlanting date (weeks)
Seeding rate (kg/ha)April May June
3 4 1 2 3 4 1 2Baviaans (PBR) 100-130PAN 3408 (PBR) 100-130PAN 3471 (PBR) 100-130Ratel (PBR) 100-130SST 0117 (PBR) 100-120SST 0127 (PBR) 100-120SST 0147 (PBR) 100-120SST 015 (PBR) 100-120SST 0166 (PBR) 100-120SST 027 (PBR) 100-120SST 056 (PBR) 100-120SST 087 (PBR) 100-120SST 096 (PBR) 100-120SST 88 (PBR) 100-120
Tankwa (PBR) 100-130
PBR: Cultivars protected by Plant Breeders’ RightsUse Tables 1 to 3 to calculate the seeding rate
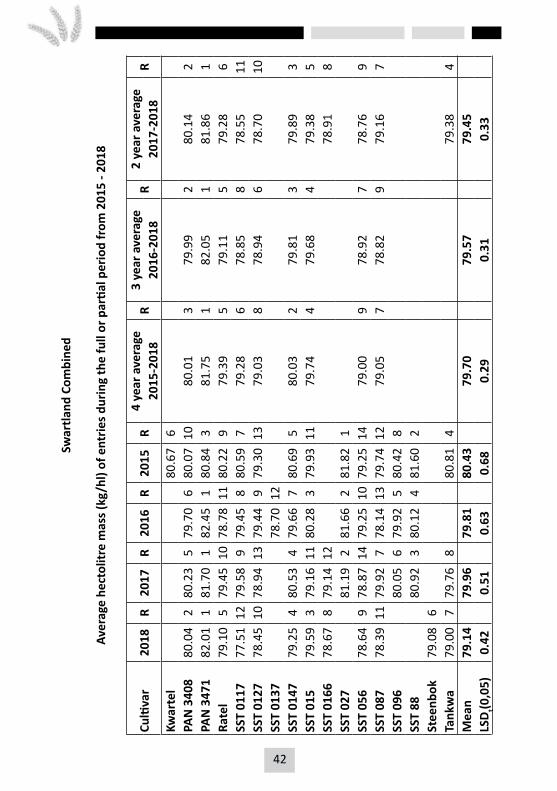
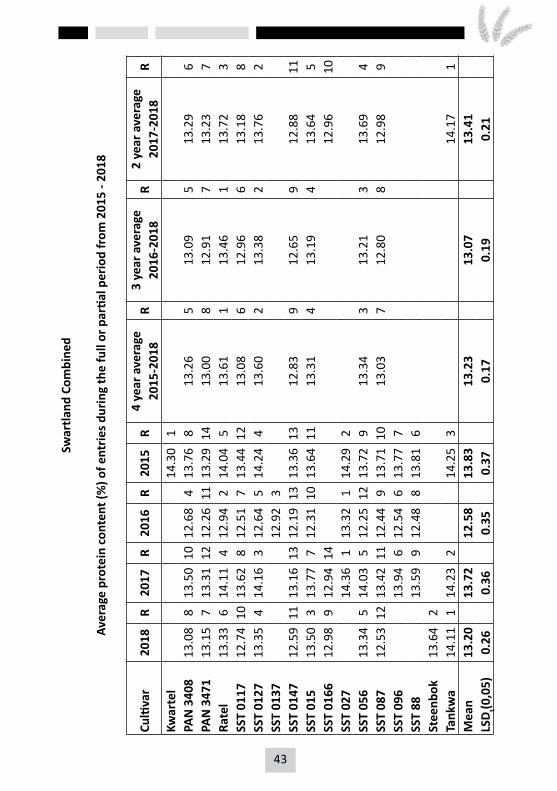
Summary of results obtained during 2018
The results obtained in the cultivar evaluation programme in the winter rainfall area over the last seasons (2015 to 2018) are summarised in the following tables.
The value of this information is that cultivar performance can be evaluated for a specific season, as well as over the medium term. The variation in climatic conditions between seasons, and the unpredictability thereof, necessitates cultivar choices that will decrease the risk as far as possible.
If this information is interpreted with other cultivar characteristics, discussed earlier, more informed decisions can be made on the group of cultivars that will perform the best.

40 41
Swar
tland
Com
bine
d
Aver
age
yiel
d (t
on/h
a) o
f ent
ries d
urin
g th
e fu
ll or
par
tial p
erio
d fr
om 2
015
- 201
8
Culti
var
2018
R20
17R
2016
R20
15R
4 ye
ar a
vera
geR
3 ye
ar a
vera
geR
2 ye
ar a
vera
geR
2015
-201
820
16-2
018
2017
-201
8Kw
arte
l
2.
1013
PAN
340
83.
576
2.48
103.
966
2.25
53.
076
3.34
73.
028
PAN
347
13.
567
2.66
23.
985
2.22
63.
113
3.40
33.
115
Rate
l3.
519
2.44
123.
6913
2.08
142.
939
3.21
92.
979
SST
0117
4.01
12.
624
4.11
12.
351
3.27
13.
581
3.31
2SS
T 01
273.
754
2.48
93.
7812
2.18
83.
057
3.34
63.
124
SST
0137
3.94
7
SS
T 01
473.
763
2.57
53.
939
2.30
33.
142
3.42
23.
173
SST
015
3.53
82.
575
3.94
82.
342
3.10
43.
355
3.05
7SS
T 01
663.
922
2.96
1
3.
441
SST
027
2.51
83.
994
2.18
9
SS
T 05
63.
4610
2.37
134.
003
2.15
112.
998
3.28
82.
9110
SST
087
3.65
52.
527
3.93
102.
197
3.07
53.
374
3.08
6SS
T 09
6
2.
3114
4.02
22.
1710
SST
88
2.
643
3.91
112.
264
Stee
nbok
2.94
12
Ta
nkw
a3.
2711
2.47
11
2.
1312
2.87
11M
ean
3.58
2.
54
3.94
2.
21
3.08
3.
36
3.10
LS
Dt(0
,05)
0.14
0.
13
0.17
0.
12
0.08
0.
09
0.10
42 43
Swar
tland
Com
bine
d
Aver
age
hect
olitr
e m
ass (
kg/h
l) of
ent
ries d
urin
g th
e fu
ll or
par
tial p
erio
d fr
om 2
015
- 201
8
Culti
var
2018
R20
17R
2016
R20
15R
4 ye
ar a
vera
geR
3 ye
ar a
vera
geR
2 ye
ar a
vera
geR
2015
-201
820
16-2
018
2017
-201
8Kw
arte
l
80
.67
6
PA
N 3
408
80.0
42
80.2
35
79.7
06
80.0
710
80.0
13
79.9
92
80.1
42
PAN
347
182
.01
181
.70
182
.45
180
.84
381
.75
182
.05
181
.86
1Ra
tel
79.1
05
79.4
510
78.7
811
80.2
29
79.3
95
79.1
15
79.2
86
SST
0117
77.5
112
79.5
89
79.4
58
80.5
97
79.2
86
78.8
58
78.5
511
SST
0127
78.4
510
78.9
413
79.4
49
79.3
013
79.0
38
78.9
46
78.7
010
SST
0137
78.7
012
SST
0147
79.2
54
80.5
34
79.6
67
80.6
95
80.0
32
79.8
13
79.8
93
SST
015
79.5
93
79.1
611
80.2
83
79.9
311
79.7
44
79.6
84
79.3
85
SST
0166
78.6
78
79.1
412
78.9
18
SST
027
81.1
92
81.6
62
81.8
21
SST
056
78.6
49
78.8
714
79.2
510
79.2
514
79.0
09
78.9
27
78.7
69
SST
087
78.3
911
79.9
27
78.1
413
79.7
412
79.0
57
78.8
29
79.1
67
SST
096
80.0
56
79.9
25
80.4
28
SST
88
80
.92
380
.12
481
.60
2
St
eenb
ok79
.08
6
Ta
nkw
a79
.00
779
.76
8
80
.81
4
79
.38
4M
ean
79.1
4
79.9
6
79.8
1
80.4
3
79.7
0
79.5
7
79.4
5
LSD t(0
,05)
0.42
0.
51
0.63
0.
68
0.29
0.
31
0.33
42 43
Swar
tland
Com
bine
d
Aver
age
prot
ein
cont
ent (
%) o
f ent
ries d
urin
g th
e fu
ll or
par
tial p
erio
d fr
om 2
015
- 201
8
Culti
var
2018
R20
17R
2016
R20
15R
4 ye
ar a
vera
geR
3 ye
ar a
vera
geR
2 ye
ar a
vera
geR
2015
-201
820
16-2
018
2017
-201
8Kw
arte
l
14
.30
1
PA
N 3
408
13.0
88
13.5
010
12.6
84
13.7
68
13.2
65
13.0
95
13.2
96
PAN
347
113
.15
713
.31
1212
.26
1113
.29
1413
.00
812
.91
713
.23
7Ra
tel
13.3
36
14.1
14
12.9
42
14.0
45
13.6
11
13.4
61
13.7
23
SST
0117
12.7
410
13.6
28
12.5
17
13.4
412
13.0
86
12.9
66
13.1
88
SST
0127
13.3
54
14.1
63
12.6
45
14.2
44
13.6
02
13.3
82
13.7
62
SST
0137
12.9
23
SST
0147
12.5
911
13.1
613
12.1
913
13.3
613
12.8
39
12.6
59
12.8
811
SST
015
13.5
03
13.7
77
12.3
110
13.6
411
13.3
14
13.1
94
13.6
45
SST
0166
12.9
89
12.9
414
12.9
610
SST
027
14.3
61
13.3
21
14.2
92
SST
056
13.3
45
14.0
35
12.2
512
13.7
29
13.3
43
13.2
13
13.6
94
SST
087
12.5
312
13.4
211
12.4
49
13.7
110
13.0
37
12.8
08
12.9
89
SST
096
13.9
46
12.5
46
13.7
77
SST
88
13
.59
912
.48
813
.81
6
St
eenb
ok13
.64
2
Ta
nkw
a14
.11
114
.23
2
14
.25
3
14
.17
1M
ean
13.2
0
13.7
2
12.5
8
13.8
3
13.2
3
13.0
7
13.4
1
LSD t(0
,05)
0.26
0.
36
0.35
0.
37
0.17
0.
19
0.21

44 45
Swar
tland
Com
bine
d
Aver
age
falli
ng n
umbe
r (s)
of e
ntrie
s dur
ing
the
full
or p
artia
l per
iod
from
201
5 - 2
018
Culti
var
2018
R20
17R
2016
R20
15R
4 ye
ar a
vera
geR
3 ye
ar a
vera
geR
2 ye
ar a
vera
geR
2015
-201
820
16-2
018
2017
-201
8Kw
arte
l
39
91
PAN
340
834
77
322
1433
310
363
1434
19
334
733
511
PAN
347
136
22
347
235
32
395
436
42
354
235
52
Rate
l36
41
363
136
21
398
237
21
363
136
31
SST
0117
349
533
85
344
438
59
354
434
44
344
5SS
T 01
2734
78
336
734
25
391
635
45
342
534
16
SST
0137
340
8
SS
T 01
4734
59
326
1333
012
376
1234
47
333
833
59
SST
015
356
434
73
346
339
83
362
335
03
352
3SS
T 01
6635
93
342
4
35
14
SST
027
335
834
27
385
8
SS
T 05
634
211
338
634
26
386
735
26
341
634
07
SST
087
341
1233
011
329
1337
413
343
833
39
335
9SS
T 09
6
32
812
331
1137
910
SST
88
33
29
334
937
811
Stee
nbok
348
6
Ta
nkw
a34
310
330
10
39
25
336
8M
ean
350
33
7
341
38
6
354
34
4
344
LS
D t(0,0
5)5.
50
7.80
6.
50
6.80
3.
30
3.70
4.
50

44 45
Swar
tland
Hig
h Ra
infa
ll
Aver
age
yiel
d (t
on/h
a) o
f ent
ries d
urin
g th
e fu
ll or
par
tial p
erio
d fr
om 2
015
- 201
8
Culti
var
2018
R20
17R
2016
R20
15R
4 ye
ar a
vera
geR
3 ye
ar a
vera
geR
2 ye
ar a
vera
geR
2015
-201
820
16-2
018
2017
-201
8Kw
arte
l
3.
137
PAN
340
84.
3610
3.32
84.
3512
3.12
93.
798
4.01
93.
849
PAN
347
14.
2711
3.31
94.
624
3.14
63.
837
4.06
83.
7911
Rate
l4.
526
3.42
64.
479
3.02
113.
866
4.14
53.
976
SST
0117
4.75
53.
544
4.72
33.
193
4.05
14.
342
4.14
3SS
T 01
274.
832
3.20
114.
595
3.13
83.
944
4.21
44.
025
SST
0137
4.85
1
SS
T 01
474.
803
3.39
74.
478
3.20
23.
973
4.22
34.
104
SST
015
4.50
83.
435
4.42
113.
194
3.88
54.
126
3.96
7SS
T 01
665.
051
3.63
2
4.
341
SST
027
3.17
144.
2413
3.04
10
SS
T 05
64.
527
3.18
124.
546
2.89
133.
789
4.08
73.
858
SST
087
4.78
43.
631
4.73
22.
9212
4.02
24.
381
4.21
2SS
T 09
6
3.
2610
4.45
103.
175
SST
88
3.
623
4.50
73.
291
Stee
nbok
3.85
12
Ta
nkw
a4.
429
3.18
13
2.
8514
3.80
10M
ean
4.55
3.
38
4.53
3.
09
3.90
4.
17
4.00
LS
D t(0,0
5)0.
24
0.25
0.
35
0.27
0.
14
0.17
0.
18

46 47
Swar
tland
Hig
h Ra
infa
ll
Aver
age
hect
olitr
e m
ass (
kg/h
l) of
ent
ries d
urin
g th
e fu
ll or
par
tial p
erio
d fr
om 2
015
- 201
8
Culti
var
2018
R20
17R
2016
R20
15R
4 ye
ar a
vera
geR
3 ye
ar a
vera
geR
2 ye
ar a
vera
geR
2015
-201
820
16-2
018
2017
-201
8Kw
arte
l
83
.84
4
PA
N 3
408
82.6
03
83.1
45
78.9
78
83.2
410
81.9
93
81.5
72
82.8
72
PAN
347
184
.29
184
.23
181
.07
284
.84
183
.61
183
.20
184
.26
1Ra
tel
81.9
78
82.3
39
78.3
811
82.7
811
81.3
76
80.8
95
82.1
55
SST
0117
80.7
212
82.3
67
78.9
78
83.5
56
81.4
05
80.6
87
81.5
410
SST
0127
82.1
85
81.4
212
79.0
06
82.6
212
81.3
17
80.8
76
81.8
07
SST
0137
79.0
06
SST
0147
82.2
74
83.3
14
78.8
510
83.6
45
82.0
22
81.4
83
82.7
93
SST
015
82.6
82
80.7
114
79.9
23
83.3
07
81.6
54
81.1
04
81.7
09
SST
0166
81.6
410
81.8
1
81.7
38
SST
027
83.3
93
81.2
71
84.8
02
SST
047
SST
056
82.0
06
80.9
413
77.9
912
82.3
014
80.8
19
80.3
19
81.4
711
SST
087
81.8
19
82.1
610
77.2
013
82.5
613
80.9
38
80.3
98
81.9
96
SST
096
82.7
76
79.2
75
83.2
98
SST
88
83
.91
279
.50
484
.22
3
St
eenb
ok81
.57
11
Ta
nkw
a82
.00
682
.36
7
83
.28
9
82
.18
4M
ean
82.1
4
82.4
9
79.1
8
83.4
5
81.6
8
81.1
7
82.2
2
LSD
t(0,0
5)0.
60
0.97
1.
44
0.70
0.
51
0.62
0.
59
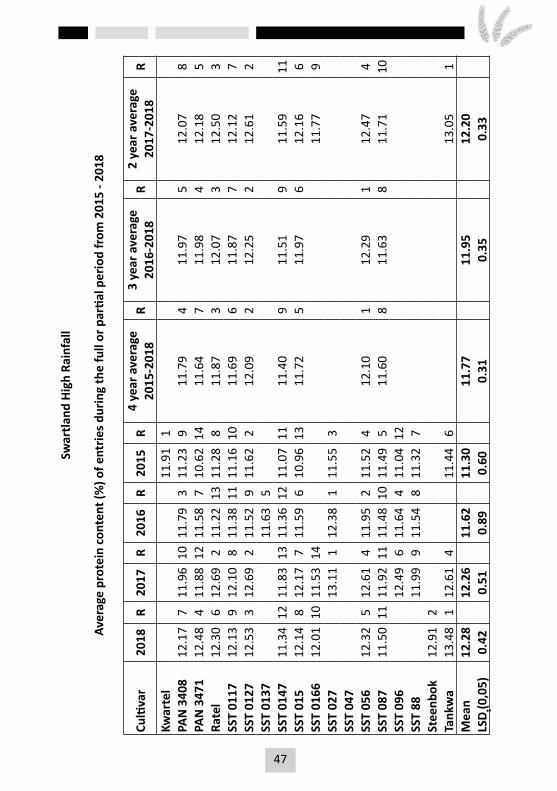
46 47
Swar
tland
Hig
h Ra
infa
ll
Aver
age
prot
ein
cont
ent (
%) o
f ent
ries d
urin
g th
e fu
ll or
par
tial p
erio
d fr
om 2
015
- 201
8
Culti
var
2018
R20
17R
2016
R20
15R
4 ye
ar a
vera
geR
3 ye
ar a
vera
geR
2 ye
ar a
vera
geR
2015
-201
820
16-2
018
2017
-201
8Kw
arte
l
11
.91
1
PA
N 3
408
12.1
77
11.9
610
11.7
93
11.2
39
11.7
94
11.9
75
12.0
78
PAN
347
112
.48
411
.88
1211
.58
710
.62
1411
.64
711
.98
412
.18
5Ra
tel
12.3
06
12.6
92
11.2
213
11.2
88
11.8
73
12.0
73
12.5
03
SST
0117
12.1
39
12.1
08
11.3
811
11.1
610
11.6
96
11.8
77
12.1
27
SST
0127
12.5
33
12.6
92
11.5
29
11.6
22
12.0
92
12.2
52
12.6
12
SST
0137
11.6
35
SST
0147
11.3
412
11.8
313
11.3
612
11.0
711
11.4
09
11.5
19
11.5
911
SST
015
12.1
48
12.1
77
11.5
96
10.9
613
11.7
25
11.9
76
12.1
66
SST
0166
12.0
110
11.5
314
11.7
79
SST
027
13.1
11
12.3
81
11.5
53
SST
047
SST
056
12.3
25
12.6
14
11.9
52
11.5
24
12.1
01
12.2
91
12.4
74
SST
087
11.5
011
11.9
211
11.4
810
11.4
95
11.6
08
11.6
38
11.7
110
SST
096
12.4
96
11.6
44
11.0
412
SST
88
11
.99
911
.54
811
.32
7
St
eenb
ok12
.91
2
Ta
nkw
a13
.48
112
.61
4
11
.44
6
13
.05
1M
ean
12.2
8
12.2
6
11.6
2
11.3
0
11.7
7
11.9
5
12.2
0
LSD
t(0,0
5)0.
42
0.51
0.
89
0.60
0.
31
0.35
0.
33
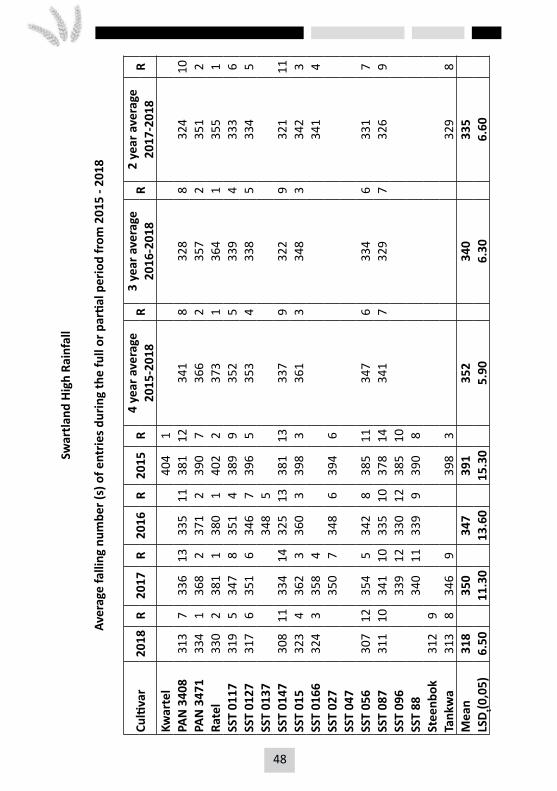
48 49
Swar
tland
Hig
h Ra
infa
ll
Aver
age
falli
ng n
umbe
r (s)
of e
ntrie
s dur
ing
the
full
or p
artia
l per
iod
from
201
5 - 2
018
Culti
var
2018
R20
17R
2016
R20
15R
4 ye
ar a
vera
geR
3 ye
ar a
vera
geR
2 ye
ar a
vera
geR
2015
-201
820
16-2
018
2017
-201
8Kw
arte
l
40
41
PAN
340
831
37
336
1333
511
381
1234
18
328
832
410
PAN
347
133
41
368
237
12
390
736
62
357
235
12
Rate
l33
02
381
138
01
402
237
31
364
135
51
SST
0117
319
534
78
351
438
99
352
533
94
333
6SS
T 01
2731
76
351
634
67
396
535
34
338
533
45
SST
0137
348
5
SS
T 01
4730
811
334
1432
513
381
1333
79
322
932
111
SST
015
323
436
23
360
339
83
361
334
83
342
3SS
T 01
6632
43
358
4
34
14
SST
027
350
734
86
394
6
SS
T 04
7
SS
T 05
630
712
354
534
28
385
1134
76
334
633
17
SST
087
311
1034
110
335
1037
814
341
732
97
326
9SS
T 09
6
33
912
330
1238
510
SST
88
34
011
339
939
08
Stee
nbok
312
9
Ta
nkw
a31
38
346
9
39
83
329
8M
ean
318
35
0
347
39
1
352
34
0
335
LS
Dt(0
,05)
6.50
11
.30
13
.60
15
.30
5.
90
6.30
6.
60

48 49
Mid
dle
Swar
tland
Aver
age
yiel
d (t
on/h
a) o
f ent
ries d
urin
g th
e fu
ll or
par
tial p
erio
d fr
om 2
015
- 201
8
Culti
var
2018
R20
17R
2016
R20
15R
4 ye
ar a
vera
geR
3 ye
ar a
vera
geR
2 ye
ar a
vera
geR
2015
-201
820
16-2
018
2017
-201
8Kw
arte
l
1.
9414
PAN
340
83.
697
1.93
114.
264
2.33
53.
055
3.29
52.
819
PAN
347
13.
816
2.39
24.
078
2.41
33.
172
3.42
23.
103
Rate
l3.
649
1.94
103.
5613
2.17
112.
829
3.04
92.
7910
SST
0117
4.49
12.
157
4.34
22.
432
3.35
13.
661
3.32
2SS
T 01
274.
013
2.09
93.
8711
2.09
133.
016
3.32
43.
054
SST
0137
3.92
10
SS
T 01
473.
865
2.19
44.
166
2.45
13.
163
3.40
33.
025
SST
015
3.68
82.
138
4.01
92.
414
3.06
43.
276
2.91
6SS
T 01
664.
432
2.65
1
3.
541
SST
027
2.20
34.
381
2.29
8
SS
T 05
63.
5410
1.82
134.
235
2.21
102.
958
3.20
82.
6811
SST
087
3.89
41.
8412
3.86
122.
317
2.97
73.
207
2.86
7SS
T 09
6
1.
7114
4.29
32.
1612
SST
88
2.
165
4.07
72.
316
Stee
nbok
2.63
12
Ta
nkw
a3.
4711
2.16
5
2.
259
2.82
8M
ean
3.76
2.
10
4.08
2.
27
3.06
3.
31
2.99
LS
D t(0,0
5)0.
33
0.19
0.
34
0.25
0.
16
0.18
0.
20
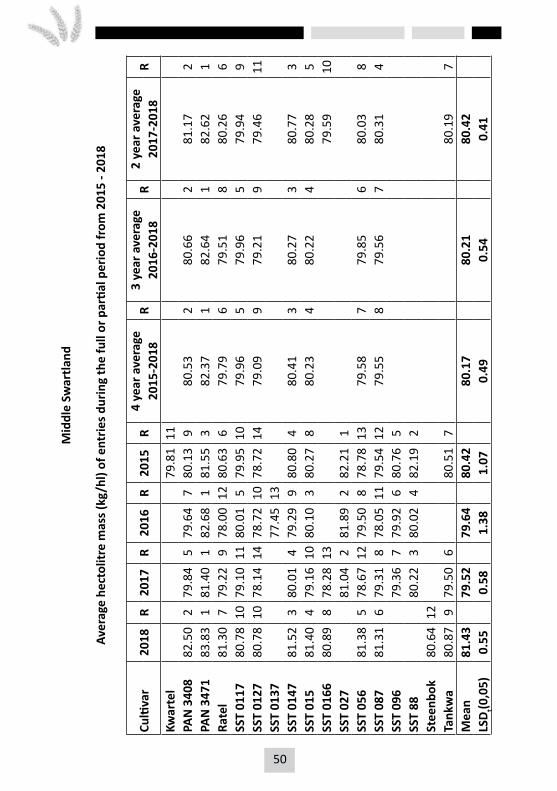
50 51
Mid
dle
Swar
tland
Aver
age
hect
olitr
e m
ass (
kg/h
l) of
ent
ries d
urin
g th
e fu
ll or
par
tial p
erio
d fr
om 2
015
- 201
8
Culti
var
2018
R20
17R
2016
R20
15R
4 ye
ar a
vera
geR
3 ye
ar a
vera
geR
2 ye
ar a
vera
geR
2015
-201
820
16-2
018
2017
-201
8Kw
arte
l
79
.81
11
PA
N 3
408
82.5
02
79.8
45
79.6
47
80.1
39
80.5
32
80.6
62
81.1
72
PAN
347
183
.83
181
.40
182
.68
181
.55
382
.37
182
.64
182
.62
1Ra
tel
81.3
07
79.2
29
78.0
012
80.6
36
79.7
96
79.5
18
80.2
66
SST
0117
80.7
810
79.1
011
80.0
15
79.9
510
79.9
65
79.9
65
79.9
49
SST
0127
80.7
810
78.1
414
78.7
210
78.7
214
79.0
99
79.2
19
79.4
611
SST
0137
77.4
513
SST
0147
81.5
23
80.0
14
79.2
99
80.8
04
80.4
13
80.2
73
80.7
73
SST
015
81.4
04
79.1
610
80.1
03
80.2
78
80.2
34
80.2
24
80.2
85
SST
0166
80.8
98
78.2
813
79.5
910
SST
027
81.0
42
81.8
92
82.2
11
SST
056
81.3
85
78.6
712
79.5
08
78.7
813
79.5
87
79.8
56
80.0
38
SST
087
81.3
16
79.3
18
78.0
511
79.5
412
79.5
58
79.5
67
80.3
14
SST
096
79.3
67
79.9
26
80.7
65
SST
88
80
.22
380
.02
482
.19
2
St
eenb
ok80
.64
12
Ta
nkw
a80
.87
979
.50
6
80
.51
7
80
.19
7M
ean
81.4
3
79.5
2
79.6
4
80.4
2
80.1
7
80.2
1
80.4
2
LSD t(0
,05)
0.55
0.
58
1.38
1.
07
0.49
0.
54
0.41

50 51
Mid
dle
Swar
tland
Aver
age
prot
ein
cont
ent (
%) o
f ent
ries d
urin
g th
e fu
ll or
par
tial p
erio
d fr
om 2
015
- 201
8
Culti
var
2018
R20
17R
2016
R20
15R
4 ye
ar a
vera
geR
3 ye
ar a
vera
geR
2 ye
ar a
vera
geR
2015
-201
820
16-2
018
2017
-201
8Kw
arte
l
13
.87
4
PA
N 3
408
13.0
79
14.9
16
13.4
05
13.3
57
13.6
83
13.7
93
13.9
96
PAN
347
113
.33
514
.33
1312
.87
1112
.44
1413
.24
813
.51
813
.83
7Ra
tel
13.1
87
15.3
81
14.2
51
13.9
33
14.1
91
14.2
71
14.2
83
SST
0117
12.6
111
14.7
59
13.3
48
12.8
112
13.3
87
13.5
77
13.6
88
SST
0127
13.4
64
15.2
82
13.3
57
13.7
95
13.9
72
14.0
32
14.3
72
SST
0137
14.0
32
SST
0147
12.7
910
14.4
712
13.2
110
12.5
013
13.2
48
13.4
99
13.6
39
SST
015
13.7
82
14.7
59
12.7
612
13.4
26
13.6
84
13.7
64
14.2
74
SST
0166
13.1
58
14.0
614
13.6
111
SST
027
15.1
63
13.7
63
13.9
52
SST
056
13.3
26
14.9
08
12.5
913
13.1
89
13.5
05
13.6
05
14.1
15
SST
087
12.5
612
14.7
011
13.4
54
12.9
011
13.4
06
13.5
76
13.6
39
SST
096
14.9
16
13.3
86
13.2
88
SST
88
14
.93
513
.24
913
.11
10
St
eenb
ok13
.77
3
Ta
nkw
a14
.34
115
.08
4
14
.21
1
14
.71
1M
ean
13.2
8
14.8
3
13.3
6
13.3
4
13.5
9
13.7
3
14.0
1
LSD t(0
,05)
0.59
0.
55
0.66
0.
70
0.31
0.
34
0.40

52 53
Mid
dle
Swar
tland
Aver
age
falli
ng n
umbe
r (s)
of e
ntrie
s dur
ing
the
full
or p
artia
l per
iod
from
201
5 - 2
018
Culti
var
2018
R20
17R
2016
R20
15R
4 ye
ar a
vera
geR
3 ye
ar a
vera
geR
2 ye
ar a
vera
geR
2015
-201
820
16-2
018
2017
-201
8Kw
arte
l
41
01
PAN
340
836
38
312
933
911
369
1434
69
338
833
78
PAN
347
137
93
316
635
23
410
136
43
349
334
74
Rate
l38
31
341
136
91
408
637
51
364
136
21
SST
0117
367
531
68
353
240
57
360
434
54
341
5SS
T 01
2736
19
311
1134
96
409
435
75
340
533
69
SST
0137
351
5
SS
T 01
4736
76
304
1434
09
374
1334
68
337
933
510
SST
015
374
432
52
352
340
94
365
235
02
349
2SS
T 01
6638
12
317
5
34
93
SST
027
310
1234
78
399
9
SS
T 05
635
512
316
734
97
400
835
56
340
633
511
SST
087
366
731
29
337
1337
912
348
733
87
339
6SS
T 09
6
30
913
339
1039
310
SST
88
32
43
337
1238
811
Stee
nbok
357
11
Ta
nkw
a35
810
319
4
41
03
338
7M
ean
367
31
6
347
39
7
357
34
5
343
LS
Dt(0
,05)
13.1
0
14.2
0
13.5
0
10.2
0
6.70
7.
90
9.20
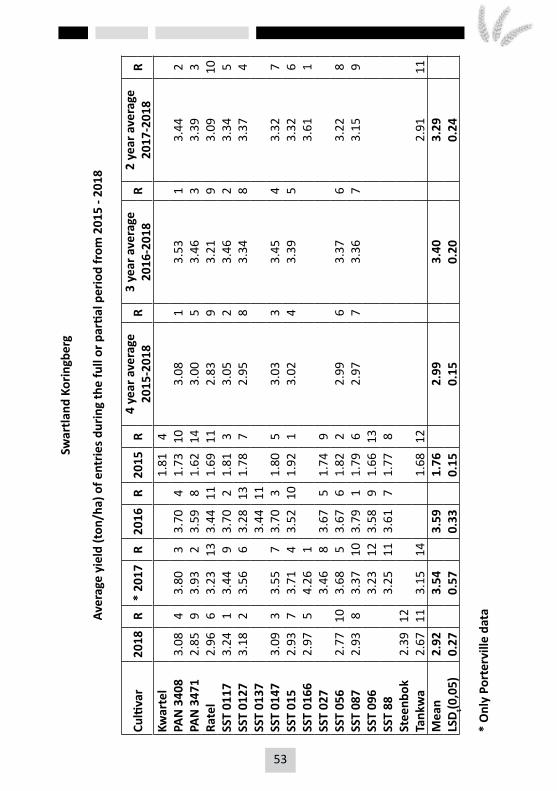
52 53
Swar
tland
Kor
ingb
erg
Aver
age
yiel
d (t
on/h
a) o
f ent
ries d
urin
g th
e fu
ll or
par
tial p
erio
d fr
om 2
015
- 201
8
Culti
var
2018
R*
2017
R20
16R
2015
R4
year
ave
rage
R3
year
ave
rage
R2
year
ave
rage
R20
15-2
018
2016
-201
820
17-2
018
Kwar
tel
1.81
4
PA
N 3
408
3.08
43.
803
3.70
41.
7310
3.08
13.
531
3.44
2PA
N 3
471
2.85
93.
932
3.59
81.
6214
3.00
53.
463
3.39
3Ra
tel
2.96
63.
2313
3.44
111.
6911
2.83
93.
219
3.09
10SS
T 01
173.
241
3.44
93.
702
1.81
33.
052
3.46
23.
345
SST
0127
3.18
23.
566
3.28
131.
787
2.95
83.
348
3.37
4SS
T 01
37
3.
4411
SST
0147
3.09
33.
557
3.70
31.
805
3.03
33.
454
3.32
7SS
T 01
52.
937
3.71
43.
5210
1.92
13.
024
3.39
53.
326
SST
0166
2.97
54.
261
3.61
1SS
T 02
7
3.
468
3.67
51.
749
SST
056
2.77
103.
685
3.67
61.
822
2.99
63.
376
3.22
8SS
T 08
72.
938
3.37
103.
791
1.79
62.
977
3.36
73.
159
SST
096
3.23
123.
589
1.66
13
SS
T 88
3.25
113.
617
1.77
8
St
eenb
ok2.
3912
Tank
wa
2.67
113.
1514
1.68
12
2.
9111
Mea
n2.
92
3.54
3.
59
1.76
2.
99
3.40
3.
29
LSD t(0
,05)
0.27
0.
57
0.33
0.
15
0.15
0.
20
0.24
* O
nly
Port
ervi
lle d
ata
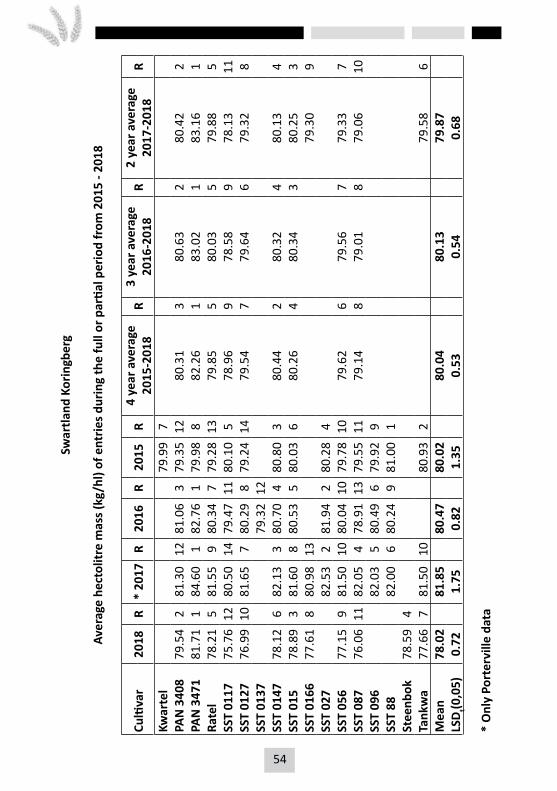
54 55
Swar
tland
Kor
ingb
erg
Aver
age
hect
olitr
e m
ass (
kg/h
l) of
ent
ries d
urin
g th
e fu
ll or
par
tial p
erio
d fr
om 2
015
- 201
8
Culti
var
2018
R*
2017
R20
16R
2015
R4
year
ave
rage
R3
year
ave
rage
R2
year
ave
rage
R20
15-2
018
2016
-201
820
17-2
018
Kwar
tel
79.9
97
PAN
340
879
.54
281
.30
1281
.06
379
.35
1280
.31
380
.63
280
.42
2PA
N 3
471
81.7
11
84.6
01
82.7
61
79.9
88
82.2
61
83.0
21
83.1
61
Rate
l78
.21
581
.55
980
.34
779
.28
1379
.85
580
.03
579
.88
5SS
T 01
1775
.76
1280
.50
1479
.47
1180
.10
578
.96
978
.58
978
.13
11SS
T 01
2776
.99
1081
.65
780
.29
879
.24
1479
.54
779
.64
679
.32
8SS
T 01
37
79
.32
12
SS
T 01
4778
.12
682
.13
380
.70
480
.80
380
.44
280
.32
480
.13
4SS
T 01
578
.89
381
.60
880
.53
580
.03
680
.26
480
.34
380
.25
3SS
T 01
6677
.61
880
.98
13
79
.30
9SS
T 02
7
82
.53
281
.94
280
.28
4
SS
T 05
677
.15
981
.50
1080
.04
1079
.78
1079
.62
679
.56
779
.33
7SS
T 08
776
.06
1182
.05
478
.91
1379
.55
1179
.14
879
.01
879
.06
10SS
T 09
6
82
.03
580
.49
679
.92
9
SS
T 88
82.0
06
80.2
49
81.0
01
Stee
nbok
78.5
94
Tank
wa
77.6
67
81.5
010
80.9
32
79.5
86
Mea
n78
.02
81
.85
80
.47
80
.02
80
.04
80
.13
79
.87
LS
D t(0,0
5)0.
72
1.75
0.
82
1.35
0.
53
0.54
0.
68
* O
nly
Port
ervi
lle d
ata

54 55
Swar
tland
Kor
ingb
erg
Aver
age
prot
ein
cont
ent (
%) o
f ent
ries d
urin
g th
e fu
ll or
par
tial p
erio
d fr
om 2
015
- 201
8
Culti
var
2018
R*
2017
R20
16R
2015
R4
year
ave
rage
R3
year
ave
rage
R2
year
ave
rage
R20
15-2
018
2016
-201
820
17-2
018
Kwar
tel
15.1
61
PAN
340
814
.26
812
.70
1111
.76
814
.40
813
.28
612
.91
613
.48
8PA
N 3
471
14.0
79
12.5
413
11.6
110
13.8
414
13.0
28
12.7
48
13.3
110
Rate
l14
.40
713
.19
1012
.03
314
.66
613
.57
313
.21
413
.80
6SS
T 01
1713
.53
1214
.16
211
.96
414
.28
913
.48
413
.22
313
.85
5SS
T 01
2714
.97
213
.50
711
.89
515
.05
313
.85
113
.45
214
.24
3SS
T 01
37
12
.25
2
SS
T 01
4713
.75
1012
.32
1411
.31
1313
.98
1212
.84
912
.46
913
.04
11SS
T 01
514
.84
313
.76
411
.83
613
.92
1313
.59
213
.48
114
.30
2SS
T 01
6614
.44
612
.59
12
13
.52
7SS
T 02
7
14
.81
112
.72
114
.95
4
SS
T 05
614
.50
513
.54
611
.36
1214
.28
913
.42
513
.13
514
.02
4SS
T 08
713
.65
1113
.21
911
.45
1114
.24
1113
.14
712
.77
713
.43
9SS
T 09
6
13
.73
511
.72
914
.79
5
SS
T 88
13.2
98
11.8
27
15.1
12
Stee
nbok
14.7
14
Tank
wa
15.2
21
13.7
83
14.5
17
14.5
01
Mea
n14
.36
13
.37
11
.82
14
.51
13
.35
13
.04
13
.77
LS
D t(0,0
5)0.
43
1.15
0.
53
1.48
0.
34
0.36
0.
47
* O
nly
Port
ervi
lle d
ata
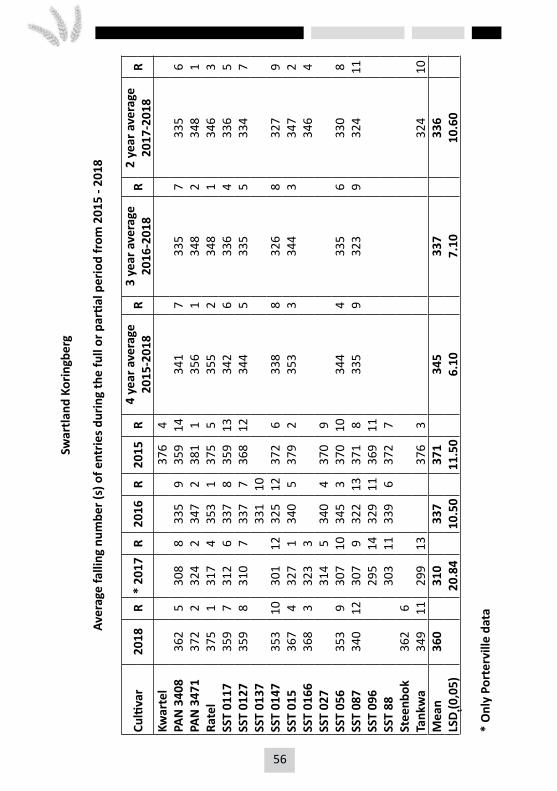
56 57
Swar
tland
Kor
ingb
erg
Aver
age
falli
ng n
umbe
r (s)
of e
ntrie
s dur
ing
the
full
or p
artia
l per
iod
from
201
5 - 2
018
Culti
var
2018
R*
2017
R20
16R
2015
R4
year
ave
rage
R3
year
ave
rage
R2
year
ave
rage
R20
15-2
018
2016
-201
820
17-2
018
Kwar
tel
376
4
PA
N 3
408
362
530
88
335
935
914
341
733
57
335
6PA
N 3
471
372
232
42
347
238
11
356
134
82
348
1Ra
tel
375
131
74
353
137
55
355
234
81
346
3SS
T 01
1735
97
312
633
78
359
1334
26
336
433
65
SST
0127
359
831
07
337
736
812
344
533
55
334
7SS
T 01
37
33
110
SST
0147
353
1030
112
325
1237
26
338
832
68
327
9SS
T 01
536
74
327
134
05
379
235
33
344
334
72
SST
0166
368
332
33
346
4SS
T 02
7
31
45
340
437
09
SST
056
353
930
710
345
337
010
344
433
56
330
8SS
T 08
734
012
307
932
213
371
833
59
323
932
411
SST
096
295
1432
911
369
11
SS
T 88
303
1133
96
372
7
St
eenb
ok36
26
Ta
nkw
a34
911
299
13
37
63
324
10M
ean
360
31
0
337
37
1
345
33
7
336
LS
D t(0,0
5)
20
.84
10
.50
11
.50
6.
10
7.10
10
.60
* O
nly
Port
ervi
lle d
ata
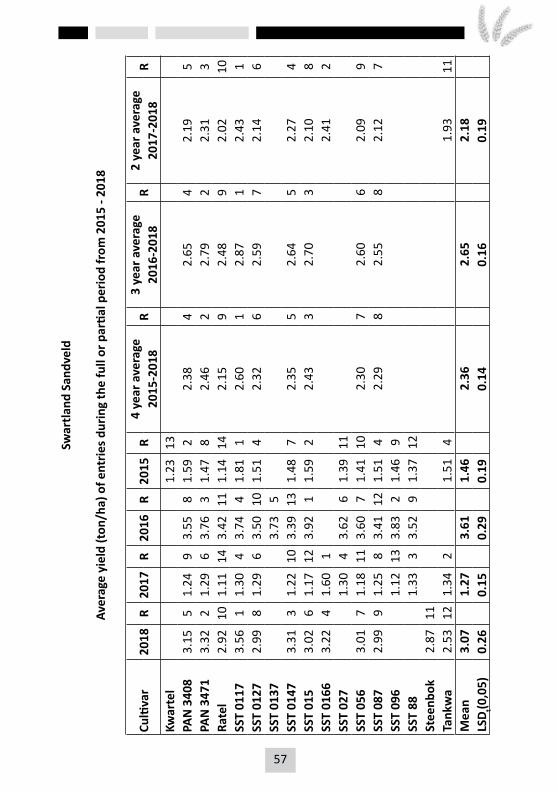
56 57
Swar
tland
San
dvel
d
Aver
age
yiel
d (t
on/h
a) o
f ent
ries d
urin
g th
e fu
ll or
par
tial p
erio
d fr
om 2
015
- 201
8
Culti
var
2018
R20
17R
2016
R20
15R
4 ye
ar a
vera
geR
3 ye
ar a
vera
geR
2 ye
ar a
vera
geR
2015
-201
820
16-2
018
2017
-201
8Kw
arte
l
1.
2313
PAN
340
83.
155
1.24
93.
558
1.59
22.
384
2.65
42.
195
PAN
347
13.
322
1.29
63.
763
1.47
82.
462
2.79
22.
313
Rate
l2.
9210
1.11
143.
4211
1.14
142.
159
2.48
92.
0210
SST
0117
3.56
11.
304
3.74
41.
811
2.60
12.
871
2.43
1SS
T 01
272.
998
1.29
63.
5010
1.51
42.
326
2.59
72.
146
SST
0137
3.73
5
SS
T 01
473.
313
1.22
103.
3913
1.48
72.
355
2.64
52.
274
SST
015
3.02
61.
1712
3.92
11.
592
2.43
32.
703
2.10
8SS
T 01
663.
224
1.60
1
2.
412
SST
027
1.30
43.
626
1.39
11
SS
T 05
63.
017
1.18
113.
607
1.41
102.
307
2.60
62.
099
SST
087
2.99
91.
258
3.41
121.
514
2.29
82.
558
2.12
7SS
T 09
6
1.
1213
3.83
21.
469
SST
88
1.
333
3.52
91.
3712
Stee
nbok
2.87
11
Ta
nkw
a2.
5312
1.34
2
1.
514
1.93
11M
ean
3.07
1.
27
3.61
1.
46
2.36
2.
65
2.18
LS
D t(0,0
5)0.
26
0.15
0.
29
0.19
0.
14
0.16
0.
19

58 59
Swar
tland
San
dvel
d
Aver
age
hect
olitr
e m
ass (
kg/h
l) of
ent
ries d
urin
g th
e fu
ll or
par
tial p
erio
d fr
om 2
015
- 201
8
Culti
var
2018
R20
17R
2016
R20
15R
4 ye
ar a
vera
geR
3 ye
ar a
vera
geR
2 ye
ar a
vera
geR
2015
-201
820
16-2
018
2017
-201
8Kw
arte
l
78
.24
2
PA
N 3
408
75.5
32
74.6
68
78.7
111
76.2
88
76.2
93
76.3
04
75.0
94
PAN
347
178
.22
175
.77
383
.12
175
.06
1278
.04
179
.04
177
.00
1Ra
tel
74.9
47
73.1
114
78.1
613
77.1
96
75.8
57
75.4
09
74.0
38
SST
0117
72.7
812
74.5
010
79.1
59
77.8
43
76.0
76
75.4
88
73.6
411
SST
0127
73.8
311
74.1
912
79.7
36
75.2
811
75.7
68
75.9
26
74.0
19
SST
0137
79.2
38
SST
0147
75.0
86
75.1
95
79.6
07
75.9
210
76.4
52
76.6
23
75.1
42
SST
015
75.3
95
74.8
47
80.5
24
74.2
114
76.2
44
76.9
22
75.1
23
SST
0166
74.5
38
74.6
49
74.5
97
SST
027
76.4
21
81.3
62
79.0
51
SST
056
74.0
410
73.8
213
79.1
210
74.5
813
75.3
99
75.6
67
73.9
310
SST
087
74.3
99
75.6
24
78.1
812
76.0
99
76.0
75
76.0
65
75.0
15
SST
096
75.0
26
79.7
95
76.3
87
SST
88
75
.80
280
.73
377
.67
4
St
eenb
ok75
.51
3
Ta
nkw
a75
.46
474
.24
11
77
.39
5
74
.85
6M
ean
74.9
7
74.8
4
79.8
0
76.5
1
76.2
4
76.3
8
74.7
6
LSD t(0
,05)
1.24
1.
43
1.37
2.
40
0.80
0.
79
0.96
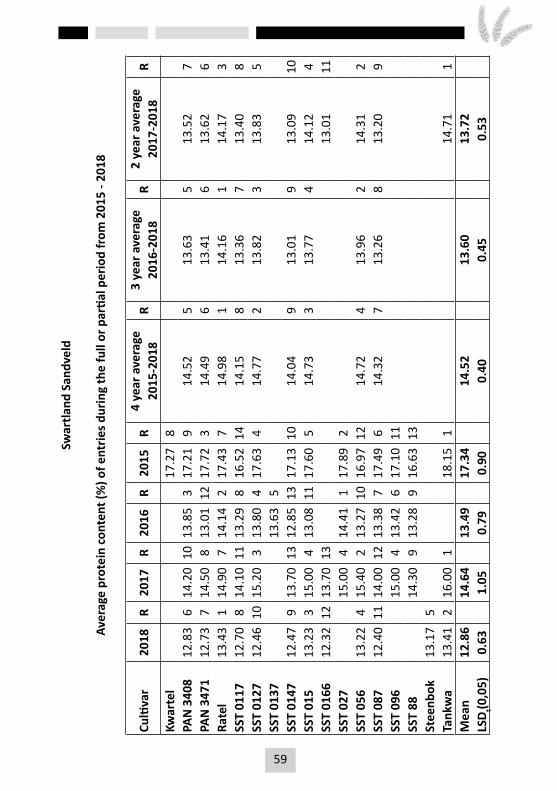
58 59
Swar
tland
San
dvel
d
Aver
age
prot
ein
cont
ent (
%) o
f ent
ries d
urin
g th
e fu
ll or
par
tial p
erio
d fr
om 2
015
- 201
8
Culti
var
2018
R20
17R
2016
R20
15R
4 ye
ar a
vera
geR
3 ye
ar a
vera
geR
2 ye
ar a
vera
geR
2015
-201
820
16-2
018
2017
-201
8Kw
arte
l
17
.27
8
PA
N 3
408
12.8
36
14.2
010
13.8
53
17.2
19
14.5
25
13.6
35
13.5
27
PAN
347
112
.73
714
.50
813
.01
1217
.72
314
.49
613
.41
613
.62
6Ra
tel
13.4
31
14.9
07
14.1
42
17.4
37
14.9
81
14.1
61
14.1
73
SST
0117
12.7
08
14.1
011
13.2
98
16.5
214
14.1
58
13.3
67
13.4
08
SST
0127
12.4
610
15.2
03
13.8
04
17.6
34
14.7
72
13.8
23
13.8
35
SST
0137
13.6
35
SST
0147
12.4
79
13.7
013
12.8
513
17.1
310
14.0
49
13.0
19
13.0
910
SST
015
13.2
33
15.0
04
13.0
811
17.6
05
14.7
33
13.7
74
14.1
24
SST
0166
12.3
212
13.7
013
13.0
111
SST
027
15.0
04
14.4
11
17.8
92
SST
056
13.2
24
15.4
02
13.2
710
16.9
712
14.7
24
13.9
62
14.3
12
SST
087
12.4
011
14.0
012
13.3
87
17.4
96
14.3
27
13.2
68
13.2
09
SST
096
15.0
04
13.4
26
17.1
011
SST
88
14
.30
913
.28
916
.63
13
St
eenb
ok13
.17
5
Ta
nkw
a13
.41
216
.00
1
18
.15
1
14
.71
1M
ean
12.8
6
14.6
4
13.4
9
17.3
4
14.5
2
13.6
0
13.7
2
LSD t(0
,05)
0.63
1.
05
0.79
0.
90
0.40
0.
45
0.53

60 61
Swar
tland
San
dvel
d
Aver
age
falli
ng n
umbe
r (s)
of e
ntrie
s dur
ing
the
full
or p
artia
l per
iod
from
201
5 - 2
018
Culti
var
2018
R20
17R
2016
R20
15R
4 ye
ar a
vera
geR
3 ye
ar a
vera
geR
2 ye
ar a
vera
geR
2015
-201
820
16-2
018
2017
-201
8Kw
arte
l
40
92
PAN
340
835
27
321
1432
212
333
1433
29
332
933
611
PAN
347
136
42
380
234
42
402
437
32
363
237
22
Rate
l36
81
391
134
91
410
137
91
369
137
91
SST
0117
352
837
83
333
538
57
362
435
44
365
5SS
T 01
2735
011
368
633
63
389
636
15
351
535
97
SST
0137
329
8
SS
T 01
4735
110
366
832
79
377
935
57
348
735
98
SST
015
361
537
24
335
440
83
369
335
63
366
3SS
T 01
6636
14
370
5
36
64
SST
027
366
833
26
373
10
SS
T 05
635
19
367
733
07
391
536
06
349
635
96
SST
087
346
1235
511
324
1136
212
347
834
18
350
9SS
T 09
6
35
810
325
1036
611
SST
88
34
912
320
1335
613
Stee
nbok
362
3
Ta
nkw
a35
36
336
13
38
08
344
10M
ean
356
36
3
331
38
2
360
35
2
360
LS
D t(0,0
5)10
.30
22
.40
14
.70
18
.30
7.
30
8.10
10
.10

60 61
Rûen
s Com
bine
d
Aver
age
yiel
d (t
on/h
a) o
f ent
ries d
urin
g th
e fu
ll or
par
tial p
erio
d fr
om 2
015
- 201
8
Culti
var
2018
R20
17R
2016
R20
15R
4 ye
ar a
vera
geR
3 ye
ar a
vera
geR
2 ye
ar a
vera
geR
2015
-201
820
16-2
018
2017
-201
8Kw
arte
l
3.
4914
PAN
340
82.
8311
2.93
104.
338
3.88
83.
496
3.36
62.
8810
PAN
347
12.
929
3.06
64.
0312
3.82
93.
467
3.34
72.
996
Rate
l2.
9210
2.78
134.
1211
3.73
123.
398
3.27
82.
8511
SST
0117
3.03
43.
233
4.57
44.
231
3.76
13.
612
3.13
2SS
T 01
273.
112
3.07
54.
387
3.96
63.
634
3.52
43.
094
SST
0137
4.58
3
SS
T 01
473.
113
3.13
44.
612
4.18
23.
762
3.62
13.
123
SST
015
2.99
62.
8412
3.87
133.
8110
3.37
93.
239
2.91
9SS
T 01
663.
591
3.36
1
3.
481
SST
027
2.78
144.
249
3.79
11
SS
T 05
62.
987
2.99
84.
1810
3.98
43.
535
3.38
52.
987
SST
087
3.01
53.
067
4.53
54.
183
3.69
33.
533
3.03
5SS
T 09
6
2.
989
4.44
63.
965
SST
88
3.
232
4.72
13.
887
Stee
nbok
2.22
12
Ta
nkw
a2.
928
2.92
11
3.
5713
2.92
8M
ean
2.97
3.
03
4.35
3.
89
3.57
3.
43
3.03
LS
D t(0,0
5)0.
12
0.14
0.
17
0.17
0.
08
0.09
0.
10

62 63
Rûen
s Com
bine
d
Aver
age
hect
olitr
e m
ass (
kg/h
l) of
ent
ries f
or d
urin
g th
e fu
ll or
par
tial p
erio
d fr
om 2
015
- 201
8
Culti
var
2018
R20
17R
2016
R20
15R
4 ye
ar a
vera
geR
3 ye
ar a
vera
geR
2 ye
ar a
vera
geR
2015
-201
820
16-2
018
2017
-201
8Kw
arte
l
79
.79
7
PA
N 3
408
77.8
65
79.9
86
79.0
98
79.4
113
79.0
95
78.9
85
78.9
24
PAN
347
180
.41
181
.71
181
.72
181
.27
181
.28
181
.28
181
.06
1Ra
tel
77.5
56
79.3
014
79.0
211
79.5
711
78.8
67
78.6
28
78.4
310
SST
0117
77.5
27
80.1
75
79.5
45
80.1
86
79.3
54
79.0
84
78.8
55
SST
0127
77.4
010
79.4
513
79.0
410
79.3
414
78.8
18
78.6
37
78.4
39
SST
0137
78.4
513
SST
0147
77.9
23
80.4
14
79.6
84
80.2
05
79.5
52
79.3
42
79.1
73
SST
015
78.7
02
79.9
28
79.3
36
79.5
810
79.3
83
79.3
23
79.3
12
SST
0166
77.9
14
79.6
810
78.8
06
SST
027
80.8
83
80.9
52
80.8
73
SST
056
77.4
68
79.5
612
79.2
17
79.6
38
78.9
76
78.7
46
78.5
17
SST
087
76.6
212
79.9
77
78.5
712
79.4
512
78.6
59
78.3
99
78.3
011
SST
096
79.5
911
79.0
98
80.3
44
SST
88
81
.18
280
.60
380
.98
2
St
eenb
ok77
.45
9
Ta
nkw
a77
.10
1179
.83
9
79
.59
9
78
.47
8M
ean
77.8
3
80.1
2
79.5
6
80.0
1
79.3
3
79.1
5
78.9
3
LSD
t(0,0
5)0.
54
0.44
0.
38
0.45
0.
21
0.25
0.
34

62 63
Rûen
s Com
bine
d
Aver
age
prot
ein
cont
ent (
%) o
f ent
ries d
urin
g th
e fu
ll or
par
tial p
erio
d fr
om 2
015
- 201
8
Culti
var
2018
R20
17R
2016
R20
15R
4 ye
ar a
vera
geR
3 ye
ar a
vera
geR
2 ye
ar a
vera
geR
2015
-201
820
16-2
018
2017
-201
8Kw
arte
l
12
.34
4
PA
N 3
408
12.7
35
12.5
79
12.2
65
11.9
78
12.3
83
12.5
23
12.6
55
PAN
347
112
.24
1112
.29
1212
.08
811
.97
812
.15
712
.20
812
.27
10Ra
tel
12.4
78
13.1
23
12.2
94
12.1
36
12.5
02
12.6
32
12.8
03
SST
0117
12.3
89
12.3
911
12.0
09
12.0
47
12.2
06
12.2
66
12.3
99
SST
0127
12.9
12
12.9
04
12.4
13
12.1
65
12.6
01
12.7
41
12.9
12
SST
0137
12.1
36
SST
0147
11.9
612
12.1
814
11.8
012
11.4
313
11.8
49
11.9
89
12.0
711
SST
015
12.6
96
12.7
46
12.1
36
11.7
910
12.3
44
12.5
23
12.7
24
SST
0166
12.5
57
12.2
413
12.4
08
SST
027
13.6
41
13.1
41
13.1
41
SST
056
12.7
64
12.4
910
11.9
110
11.7
711
12.2
35
12.3
95
12.6
36
SST
087
12.3
510
12.6
58
11.7
613
11.3
414
12.0
38
12.2
57
12.5
07
SST
096
12.8
45
12.4
82
12.4
33
SST
88
12
.74
611
.88
1111
.70
12
St
eenb
ok12
.86
3
Ta
nkw
a13
.76
113
.40
2
13
.13
2
13
.58
1M
ean
12.6
4
12.7
3
12.1
7
12.1
0
12.2
5
12.3
9
12.6
3
LSD t(0
,05)
0.28
0.
31
0.26
0.
22
0.13
0.
16
0.21
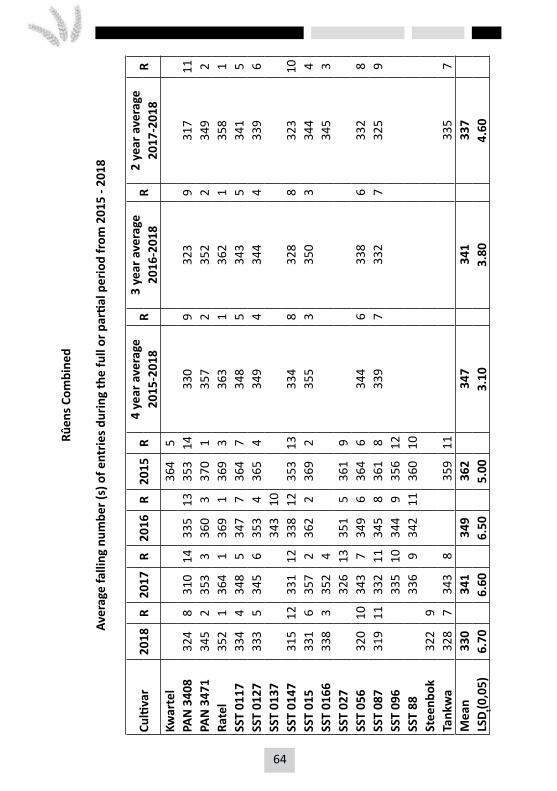
64 65
Rûen
s Com
bine
d
Aver
age
falli
ng n
umbe
r (s)
of e
ntrie
s dur
ing
the
full
or p
artia
l per
iod
from
201
5 - 2
018
Culti
var
2018
R20
17R
2016
R20
15R
4 ye
ar a
vera
geR
3 ye
ar a
vera
geR
2 ye
ar a
vera
geR
2015
-201
820
16-2
018
2017
-201
8Kw
arte
l
36
45
PAN
340
832
48
310
1433
513
353
1433
09
323
931
711
PAN
347
134
52
353
336
03
370
135
72
352
234
92
Rate
l35
21
364
136
91
369
336
31
362
135
81
SST
0117
334
434
85
347
736
47
348
534
35
341
5SS
T 01
2733
35
345
635
34
365
434
94
344
433
96
SST
0137
343
10
SS
T 01
4731
512
331
1233
812
353
1333
48
328
832
310
SST
015
331
635
72
362
236
92
355
335
03
344
4SS
T 01
6633
83
352
4
34
53
SST
027
326
1335
15
361
9
SS
T 05
632
010
343
734
96
364
634
46
338
633
28
SST
087
319
1133
211
345
836
18
339
733
27
325
9SS
T 09
6
33
510
344
935
612
SST
88
33
69
342
1136
010
Stee
nbok
322
9
Ta
nkw
a32
87
343
8
35
911
335
7M
ean
330
34
1
349
36
2
347
34
1
337
LS
D t(0,0
5)6.
70
6.60
6.
50
5.00
3.
10
3.80
4.
60

64 65
Wes
tern
Rûe
ns
Aver
age
yiel
d (t
on/h
a) o
f ent
ries d
urin
g th
e fu
ll or
par
tial p
erio
d fr
om 2
015
- 201
8
Culti
var
2018
R20
17R
2016
R20
15R
4 ye
ar a
vera
geR
3 ye
ar a
vera
geR
2 ye
ar a
vera
geR
2015
-201
820
16-2
018
2017
-201
8Kw
arte
l
3.
0414
PAN
340
83.
3411
2.68
114.
229
3.80
23.
518
3.41
93.
0111
PAN
347
13.
617
2.82
54.
0413
3.72
33.
557
3.49
73.
217
Rate
l3.
589
2.70
94.
0611
3.19
103.
389
3.45
83.
1410
SST
0117
3.61
82.
747
4.30
53.
801
3.61
33.
556
3.17
9SS
T 01
273.
963
2.70
94.
277
3.38
83.
584
3.64
33.
334
SST
0137
4.50
2
SS
T 01
473.
776
2.89
24.
531
3.55
53.
681
3.73
13.
333
SST
015
4.04
22.
6812
4.24
83.
259
3.55
63.
652
3.36
2SS
T 01
664.
401
3.06
1
3.
731
SST
027
2.58
144.
0512
3.14
12
SS
T 05
63.
814
2.75
64.
276
3.45
63.
575
3.61
43.
285
SST
087
3.52
102.
892
4.39
43.
704
3.62
23.
605
3.20
8SS
T 09
6
2.
6613
4.21
103.
447
SST
88
2.
874
4.43
33.
1711
Stee
nbok
2.59
12
Ta
nkw
a3.
805
2.72
8
3.
0513
3.26
6M
ean
3.67
2.
77
4.27
3.
41
3.56
3.
57
3.27
LS
D t(0,0
5)0.
23
0.21
0.
23
0.35
0.
12
0.13
0.
16

66 67
Wes
tern
Rûe
ns
Aver
age
hect
olitr
e m
ass (
kg/h
l) of
ent
ries d
urin
g th
e fu
ll or
par
tial p
erio
d fr
om 2
015
- 201
8
Culti
var
2018
R20
17R
2016
R20
15R
4 ye
ar a
vera
geR
3 ye
ar a
vera
geR
2 ye
ar a
vera
geR
2015
-201
820
16-2
018
2017
-201
8Kw
arte
l
82
.77
5
PA
N 3
408
79.0
211
82.3
76
80.4
17
82.4
88
81.0
75
80.6
05
80.7
06
PAN
347
182
.16
183
.83
182
.77
184
.13
183
.22
182
.92
183
.00
1Ra
tel
79.0
810
81.7
711
80.0
011
82.3
612
80.8
06
80.2
88
80.4
39
SST
0117
79.1
79
82.1
48
80.9
36
82.7
37
81.2
44
80.7
54
80.6
67
SST
0127
79.5
07
81.5
212
80.0
810
81.8
914
80.7
57
80.3
76
80.5
18
SST
0137
79.6
713
SST
0147
79.5
76
82.4
65
81.1
55
83.3
24
81.6
32
81.0
63
81.0
24
SST
015
80.7
22
81.8
79
81.2
84
82.4
88
81.5
93
81.2
92
81.3
02
SST
0166
79.7
64
81.8
610
80.8
15
SST
027
83.0
63
82.6
72
83.7
83
SST
056
79.2
28
81.5
113
80.1
39
82.0
813
80.7
48
80.2
97
80.3
710
SST
087
78.1
812
82.1
77
79.7
112
82.3
711
80.6
19
80.0
29
80.1
811
SST
096
81.4
314
80.2
68
82.7
46
SST
88
83
.45
282
.20
383
.89
2
St
eenb
ok79
.77
3
Ta
nkw
a79
.63
582
.56
4
82
.39
10
81
.10
3M
ean
79.6
5
82.2
9
80.8
7
82.8
2
81.2
9
80.8
4
80.9
1
LSD t(0
,05)
0.96
0.
59
0.75
0.
46
0.39
0.
46
0.58

66 67
Wes
tern
Rûe
ns
Aver
age
prot
ein
cont
ent (
%) o
f ent
ries d
urin
g th
e fu
ll or
par
tial p
erio
d fr
om 2
015
- 201
8
Culti
var
2018
R20
17R
2016
R20
15R
4 ye
ar a
vera
geR
3 ye
ar a
vera
geR
2 ye
ar a
vera
geR
2015
-201
820
16-2
018
2017
-201
8Kw
arte
l
12
.28
5
PA
N 3
408
11.5
53
11.7
213
12.3
95
12.1
87
11.9
64
11.8
95
11.6
48
PAN
347
111
.06
1011
.91
1211
.90
1112
.03
911
.73
811
.62
811
.49
9Ra
tel
11.4
15
12.9
12
12.6
83
12.0
88
12.2
71
12.3
31
12.1
62
SST
0117
11.3
16
12.1
610
12.2
66
12.2
85
12.0
03
11.9
14
11.7
47
SST
0127
11.3
16
12.5
75
12.6
34
12.3
44
12.2
12
12.1
72
11.9
43
SST
0137
12.1
67
SST
0147
10.6
812
12.2
29
11.9
410
11.5
312
11.5
99
11.6
19
11.4
510
SST
015
11.2
59
12.3
78
11.8
113
11.7
710
11.8
06
11.8
17
11.8
15
SST
0166
10.7
311
11.6
714
11.2
011
SST
027
13.2
51
13.2
71
13.0
21
SST
056
11.5
24
12.0
611
11.8
912
11.6
411
11.7
87
11.8
26
11.7
96
SST
087
11.2
98
12.5
57
12.1
58
11.2
314
11.8
15
12.0
03
11.9
24
SST
096
12.5
75
12.7
62
12.3
63
SST
88
12
.75
412
.07
911
.51
13
St
eenb
ok11
.65
2
Ta
nkw
a12
.20
112
.91
2
12
.98
2
12
.56
1M
ean
11.3
3
12.4
0
12.3
0
12.0
9
11.9
1
11.9
1
11.7
9
LSD t(0
,05)
0.54
0.
53
0.48
0.
35
0.25
0.
29
0.37

68 69
Wes
tern
Rûe
ns
Aver
age
falli
ng n
umbe
r (s)
of e
ntrie
s dur
ing
the
full
or p
artia
l per
iod
from
201
5 - 2
018
Culti
var
2018
R20
17R
2016
R20
15R
4 ye
ar a
vera
geR
3 ye
ar a
vera
geR
2 ye
ar a
vera
geR
2015
-201
820
16-2
018
2017
-201
8Kw
arte
l
37
37
PAN
340
833
910
329
1433
413
363
1334
18
334
933
49
PAN
347
136
81
368
236
52
381
137
02
367
236
82
Rate
l36
72
373
136
91
377
437
11
370
137
01
SST
0117
343
935
27
352
537
73
356
534
95
347
8SS
T 01
2735
16
353
535
54
376
535
94
353
435
25
SST
0137
346
7
SS
T 01
4733
711
330
1334
110
354
1434
09
336
733
310
SST
015
352
436
63
359
337
92
364
335
93
359
3SS
T 01
6635
63
359
4
35
74
SST
027
341
935
06
371
9
SS
T 05
634
97
349
834
58
371
835
36
348
634
97
SST
087
333
1233
312
340
1136
712
343
733
58
333
11SS
T 09
6
33
911
341
937
011
SST
88
33
910
338
1237
010
Stee
nbok
347
8
Ta
nkw
a35
15
352
6
37
46
352
6M
ean
349
34
9
349
37
1
355
35
0
350
LS
Dt(0
,05)
11.0
0
9.90
8.
70
9.90
5.
00
5.70
7.
30

68 69
East
ern
Rûen
s
Aver
age
yiel
d (t
on/h
a) o
f ent
ries d
urin
g th
e fu
ll or
par
tial p
erio
d fr
om 2
015
- 201
8
Culti
var
2018
R20
17R
2016
R20
15R
4 ye
ar a
vera
geR
3 ye
ar a
vera
geR
2 ye
ar a
vera
geR
2015
-201
820
16-2
018
2017
-201
8Kw
arte
l
3.
3014
PAN
340
82.
166
2.35
84.
933
3.85
63.
325
3.14
52.
257
PAN
347
12.
107
2.50
44.
4012
3.48
133.
128
3.00
62.
305
Rate
l2.
088
2.21
114.
6011
3.74
83.
167
2.96
82.
148
SST
0117
2.36
22.
762
4.73
73.
933
3.44
13.
281
2.56
1SS
T 01
272.
235
2.46
64.
896
3.92
43.
384
3.19
32.
344
SST
0137
4.71
8
SS
T 01
472.
254
2.46
54.
915
4.04
23.
422
3.21
22.
353
SST
015
1.97
111.
9814
4.21
133.
5211
2.92
92.
729
1.98
11SS
T 01
662.
611
2.40
7
2.
512
SST
027
2.30
104.
699
3.60
9
SS
T 05
62.
059
2.19
124.
6610
3.90
53.
206
2.97
72.
129
SST
087
2.29
32.
319
4.96
14.
091
3.41
33.
184
2.30
6SS
T 09
6
2.
523
4.92
43.
856
SST
88
2.
831
4.93
23.
6010
Stee
nbok
1.73
12
Ta
nkw
a2.
0110
2.03
13
3.
5112
2.02
10M
ean
2.15
2.
38
4.73
3.
74
3.26
3.
07
2.26
LS
D t(0,0
5)0.
16
0.27
0.
36
0.26
0.
13
0.15
0.
14
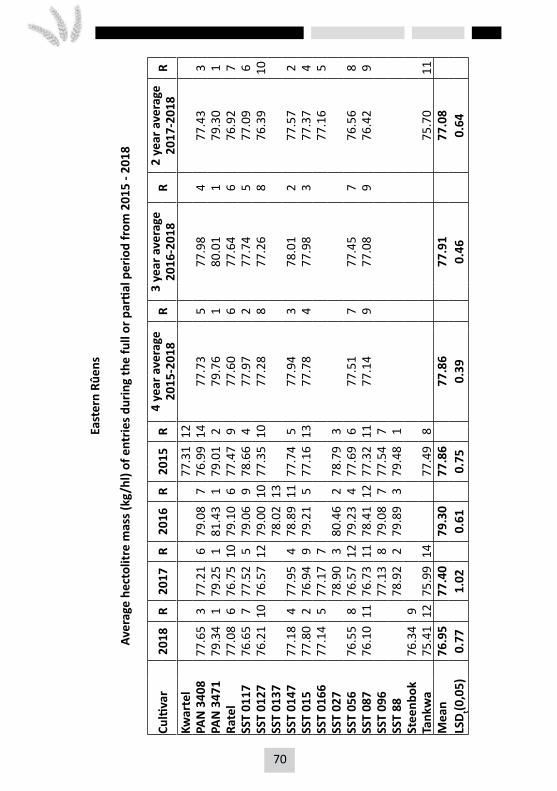
70 71
East
ern
Rûen
s
Aver
age
hect
olitr
e m
ass (
kg/h
l) of
ent
ries d
urin
g th
e fu
ll or
par
tial p
erio
d fr
om 2
015
- 201
8
Culti
var
2018
R20
17R
2016
R20
15R
4 ye
ar a
vera
geR
3 ye
ar a
vera
geR
2 ye
ar a
vera
geR
2015
-201
820
16-2
018
2017
-201
8Kw
arte
l
77
.31
12
PA
N 3
408
77.6
53
77.2
16
79.0
87
76.9
914
77.7
35
77.9
84
77.4
33
PAN
347
179
.34
179
.25
181
.43
179
.01
279
.76
180
.01
179
.30
1Ra
tel
77.0
86
76.7
510
79.1
06
77.4
79
77.6
06
77.6
46
76.9
27
SST
0117
76.6
57
77.5
25
79.0
69
78.6
64
77.9
72
77.7
45
77.0
96
SST
0127
76.2
110
76.5
712
79.0
010
77.3
510
77.2
88
77.2
68
76.3
910
SST
0137
78.0
213
SST
0147
77.1
84
77.9
54
78.8
911
77.7
45
77.9
43
78.0
12
77.5
72
SST
015
77.8
02
76.9
49
79.2
15
77.1
613
77.7
84
77.9
83
77.3
74
SST
0166
77.1
45
77.1
77
77.1
65
SST
027
78.9
03
80.4
62
78.7
93
SST
056
76.5
58
76.5
712
79.2
34
77.6
96
77.5
17
77.4
57
76.5
68
SST
087
76.1
011
76.7
311
78.4
112
77.3
211
77.1
49
77.0
89
76.4
29
SST
096
77.1
38
79.0
87
77.5
47
SST
88
78
.92
279
.89
379
.48
1
St
eenb
ok76
.34
9
Ta
nkw
a75
.41
1275
.99
14
77
.49
8
75
.70
11M
ean
76.9
5
77.4
0
79.3
0
77.8
6
77.8
6
77.9
1
77.0
8
LSD t(0
,05)
0.77
1.
02
0.61
0.
75
0.39
0.
46
0.64

70 71
East
ern
Rûen
s
Aver
age
prot
ein
cont
ent (
%) o
f ent
ries d
urin
g th
e fu
ll or
par
tial p
erio
d fr
om 2
015
- 201
8
Culti
var
2018
R20
17R
2016
R20
15R
4 ye
ar a
vera
geR
3 ye
ar a
vera
geR
2 ye
ar a
vera
geR
2015
-201
820
16-2
018
2017
-201
8Kw
arte
l
11
.97
3
PA
N 3
408
14.0
97
13.7
83
11.2
38
11.4
58
12.6
43
13.0
32
13.9
43
PAN
347
113
.52
1013
.35
811
.52
411
.23
1212
.41
612
.80
613
.44
8Ra
tel
13.8
28
13.4
85
11.5
83
11.7
05
12.6
52
12.9
63
13.6
57
SST
0117
13.8
28
12.6
813
11.2
47
11.5
37
12.3
27
12.5
87
13.2
510
SST
0127
14.7
02
13.5
14
11.4
85
11.5
96
12.8
21
13.2
31
14.1
12
SST
0137
11.4
66
SST
0147
13.4
012
12.5
214
10.9
412
11.1
613
12.0
19
12.2
99
12.9
611
SST
015
14.2
54
13.4
26
11.1
79
11.4
29
12.5
74
12.9
54
13.8
44
SST
0166
14.4
43
13.2
110
13.8
35
SST
027
14.0
92
12.5
41
12.5
52
SST
056
14.1
85
13.4
17
11.1
310
11.4
110
12.5
35
12.9
15
13.8
06
SST
087
13.4
711
13.3
19
10.5
813
11.0
214
12.1
08
12.4
58
13.3
99
SST
096
13.0
911
11.6
72
11.9
54
SST
88
13
.00
1211
.12
1111
.26
11
St
eenb
ok14
.16
6
Ta
nkw
a15
.32
114
.46
1
12
.80
1
14
.89
1M
ean
14.1
0
13.3
8
11.3
6
11.6
5
12.4
5
12.8
0
13.7
3
LSD t(0
,05)
0.35
0.
76
0.55
0.
43
0.25
0.
29
0.36
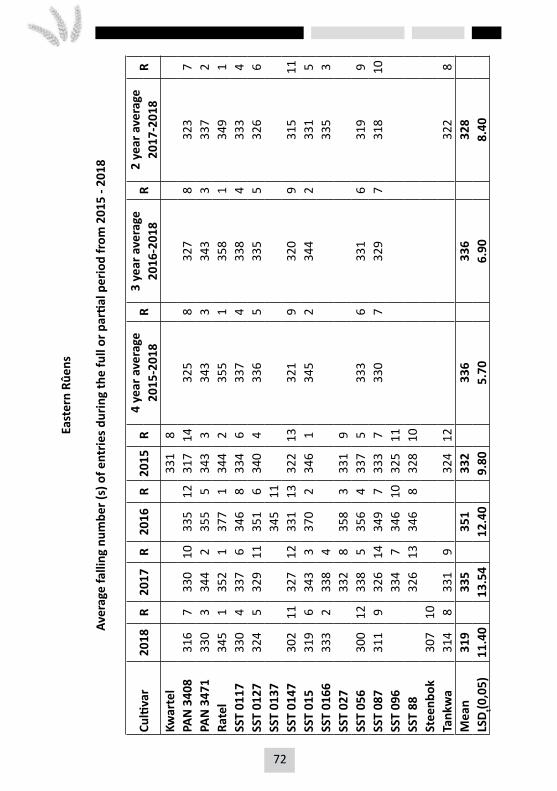
72 73
East
ern
Rûen
s
Aver
age
falli
ng n
umbe
r (s)
of e
ntrie
s dur
ing
the
full
or p
artia
l per
iod
from
201
5 - 2
018
Culti
var
2018
R20
17R
2016
R20
15R
4 ye
ar a
vera
geR
3 ye
ar a
vera
geR
2 ye
ar a
vera
geR
2015
-201
820
16-2
018
2017
-201
8Kw
arte
l
33
18
PAN
340
831
67
330
1033
512
317
1432
58
327
832
37
PAN
347
133
03
344
235
55
343
334
33
343
333
72
Rate
l34
51
352
137
71
344
235
51
358
134
91
SST
0117
330
433
76
346
833
46
337
433
84
333
4SS
T 01
2732
45
329
1135
16
340
433
65
335
532
66
SST
0137
345
11
SS
T 01
4730
211
327
1233
113
322
1332
19
320
931
511
SST
015
319
634
33
370
234
61
345
234
42
331
5SS
T 01
6633
32
338
4
33
53
SST
027
332
835
83
331
9
SS
T 05
630
012
338
535
64
337
533
36
331
631
99
SST
087
311
932
614
349
733
37
330
732
97
318
10SS
T 09
6
33
47
346
1032
511
SST
88
32
613
346
832
810
Stee
nbok
307
10
Ta
nkw
a31
48
331
9
32
412
322
8M
ean
319
33
5
351
33
2
336
33
6
328
LS
D t(0,0
5)11
.40
13
.54
12
.40
9.
80
5.70
6.
90
8.40
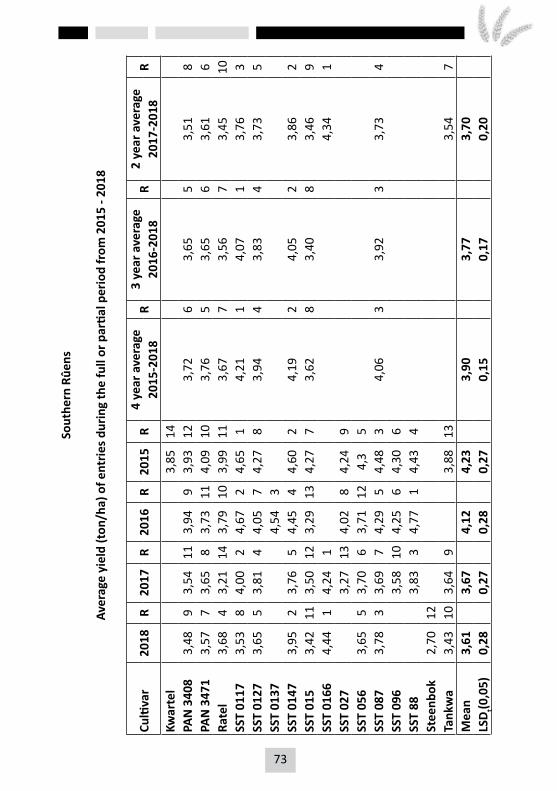
72 73
Sout
hern
Rûe
ns
Aver
age
yiel
d (t
on/h
a) o
f ent
ries d
urin
g th
e fu
ll or
par
tial p
erio
d fr
om 2
015
- 201
8
Culti
var
2018
R20
17R
2016
R20
15R
4 ye
ar a
vera
geR
3 ye
ar a
vera
geR
2 ye
ar a
vera
geR
2015
-201
820
16-2
018
2017
-201
8Kw
arte
l
3,
8514
PAN
340
83,
489
3,54
113,
949
3,93
123,
726
3,65
53,
518
PAN
347
13,
577
3,65
83,
7311
4,09
103,
765
3,65
63,
616
Rate
l3,
684
3,21
143,
7910
3,99
113,
677
3,56
73,
4510
SST
0117
3,53
84,
002
4,67
24,
651
4,21
14,
071
3,76
3SS
T 01
273,
655
3,81
44,
057
4,27
83,
944
3,83
43,
735
SST
0137
4,54
3
SS
T 01
473,
952
3,76
54,
454
4,60
24,
192
4,05
23,
862
SST
015
3,42
113,
5012
3,29
134,
277
3,62
83,
408
3,46
9SS
T 01
664,
441
4,24
1
4,
341
SST
027
3,27
134,
028
4,24
9
SS
T 05
63,
655
3,70
63,
7112
4,3
5
SS
T 08
73,
783
3,69
74,
295
4,48
34,
063
3,92
33,
734
SST
096
3,58
104,
256
4,30
6
SS
T 88
3,83
34,
771
4,43
4
St
eenb
ok2,
7012
Tank
wa
3,43
103,
649
3,88
13
3,
547
Mea
n3,
61
3,67
4,
12
4,23
3,
90
3,77
3,
70
LSD t(0
,05)
0,28
0,
27
0,28
0,
27
0,15
0,
17
0,20

74 75
Sout
hern
Rûe
ns
Aver
age
hect
olitr
e m
ass (
kg/h
l) of
ent
ries d
urin
g th
e fu
ll or
par
tial p
erio
d fr
om 2
015
- 201
8
Culti
var
2018
R20
17R
2016
R20
15R
4 ye
ar a
vera
geR
3 ye
ar a
vera
geR
2 ye
ar a
vera
geR
2015
-201
820
16-2
018
2017
-201
8Kw
arte
l
79
.96
6
PA
N 3
408
76.0
69
79.2
510
78.0
510
79.4
912
78.2
17
77.7
97
77.6
67
PAN
347
179
.59
181
.06
181
.11
181
.34
180
.78
180
.59
180
.33
1Ra
tel
75.6
610
78.3
614
78.1
78
79.5
811
77.9
48
77.4
09
77.0
111
SST
0117
76.4
14
79.8
05
78.8
25
79.9
27
78.7
43
78.3
43
78.1
14
SST
0127
76.1
97
79.1
012
78.2
47
79.4
014
78.2
36
77.8
46
77.6
58
SST
0137
77.8
112
SST
0147
76.4
33
79.8
44
79.1
44
80.2
75
78.9
22
78.4
72
78.1
43
SST
015
76.9
12
79.7
46
77.8
611
79.7
58
78.5
74
78.1
74
78.3
32
SST
0166
76.1
28
79.0
013
77.5
69
SST
027
79.8
93
79.9
72
80.8
13
SST
056
76.2
679
.40
978
.46
679
.70
978
.44
578
.02
577
.80
6SS
T 08
774
.78
1279
.70
777
.78
1379
.41
1377
.92
977
.42
877
.24
10SS
T 09
6
79
.23
1178
.17
881
.00
2
SS
T 88
80.2
82
79.8
93
80.5
34
Stee
nbok
75.5
911
Tank
wa
76.2
95
79.4
18
79.6
010
77.8
55
Mea
n76
.35
79
.58
78
.73
80
.05
78
.64
78
.23
77
.97
LS
D t(0,0
5)1.
06
0.65
0.
56
0.80
0.
30
0.37
0.
49
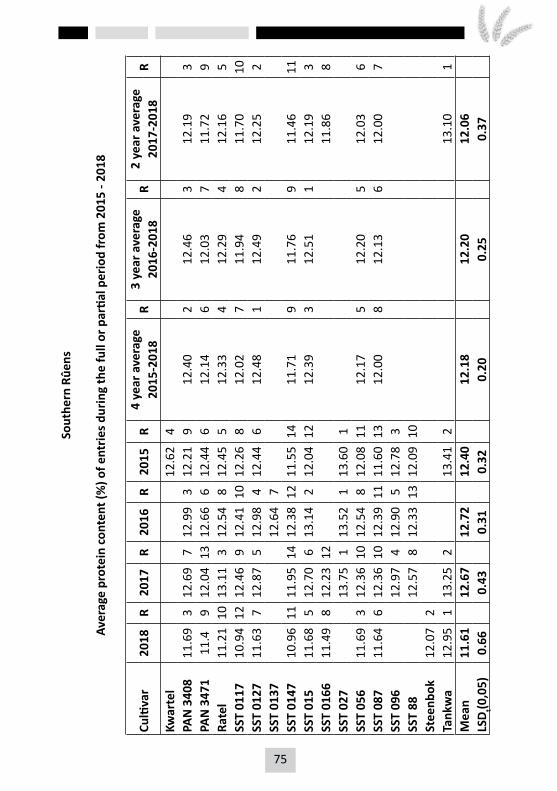
74 75
Sout
hern
Rûe
ns
Aver
age
prot
ein
cont
ent (
%) o
f ent
ries d
urin
g th
e fu
ll or
par
tial p
erio
d fr
om 2
015
- 201
8
Culti
var
2018
R20
17R
2016
R20
15R
4 ye
ar a
vera
geR
3 ye
ar a
vera
geR
2 ye
ar a
vera
geR
2015
-201
820
16-2
018
2017
-201
8Kw
arte
l
12
.62
4
PA
N 3
408
11.6
93
12.6
97
12.9
93
12.2
19
12.4
02
12.4
63
12.1
93
PAN
347
111
.49
12.0
413
12.6
66
12.4
46
12.1
46
12.0
37
11.7
29
Rate
l11
.21
1013
.11
312
.54
812
.45
512
.33
412
.29
412
.16
5SS
T 01
1710
.94
1212
.46
912
.41
1012
.26
812
.02
711
.94
811
.70
10SS
T 01
2711
.63
712
.87
512
.98
412
.44
612
.48
112
.49
212
.25
2SS
T 01
37
12
.64
7
SS
T 01
4710
.96
1111
.95
1412
.38
1211
.55
1411
.71
911
.76
911
.46
11SS
T 01
511
.68
512
.70
613
.14
212
.04
1212
.39
312
.51
112
.19
3SS
T 01
6611
.49
812
.23
12
11
.86
8SS
T 02
7
13
.75
113
.52
113
.60
1
SS
T 05
611
.69
312
.36
1012
.54
812
.08
1112
.17
512
.20
512
.03
6SS
T 08
711
.64
612
.36
1012
.39
1111
.60
1312
.00
812
.13
612
.00
7SS
T 09
6
12
.97
412
.90
512
.78
3
SS
T 88
12.5
78
12.3
313
12.0
910
Stee
nbok
12.0
72
Tank
wa
12.9
51
13.2
52
13.4
12
13.1
01
Mea
n11
.61
12
.67
12
.72
12
.40
12
.18
12
.20
12
.06
LS
D t(0,0
5)0.
66
0.43
0.
31
0.32
0.
20
0.25
0.
37

76 77
Sout
hern
Rûe
ns
Aver
age
falli
ng n
umbe
r (s)
of e
ntrie
s dur
ing
the
full
or p
artia
l per
iod
from
201
5 - 2
018
Culti
var
2018
R20
17R
2016
R20
15R
4 ye
ar a
vera
geR
3 ye
ar a
vera
geR
2 ye
ar a
vera
geR
2015
-201
820
16-2
018
2017
-201
8Kw
arte
l
38
22
PAN
340
831
49
271
1433
513
371
1332
39
307
929
211
PAN
347
133
42
343
635
92
384
135
52
346
233
92
Rate
l33
61
362
136
31
382
336
11
354
134
91
SST
0117
324
335
14
344
837
77
349
434
05
338
3SS
T 01
2732
14
345
535
44
377
834
95
340
433
36
SST
0137
340
12
SS
T 01
4730
212
334
1134
011
373
1233
78
325
831
810
SST
015
319
535
62
359
338
04
354
334
53
337
4SS
T 01
6631
95
354
3
33
75
SST
027
306
1334
66
377
8
SS
T 05
631
68
341
734
75
378
534
66
335
632
98
SST
087
313
1033
410
345
737
86
342
733
17
324
9SS
T 09
6
33
212
344
937
114
SST
88
33
89
341
1037
610
Stee
nbok
310
11
Ta
nkw
a31
77
341
8
37
411
329
7M
ean
319
33
6
348
37
7
346
33
6
329
LS
D t(0,0
5)9.
40
11.6
0
12.0
0
7.00
5.
40
7.20
8.
70
76 77
BARLEY PRODUCTION
Daniël de Klerk - ABInBevTel: (028) 214-3100South African Barley Breeding Institute (SABBI)Tel: (028) 212-2943
Barley is, after wheat, the most important small grain in South Africa. The cultivation area for malting barley under dry land conditions is at present restricted to a very specific region, viz. the Southern Cape, which stretches from Bot River in the west to Heidelberg in the east.
There are various advantages attached to the arrangement that production of a relatively minor commodity, such as malting barley, is restricted to certain and specific areas. Production is concentrated, which facilitates transport, storage and control. Extension and research are cheaper and facilitated more readily. The single most important disadvantage is, however, that the risk of unpredictable weather conditions cannot be reduced and therefore barley production has been introduced to the Swartland and irrigation areas.
For the purpose of these production guidelines, only commercial malting barley cultivars will be discussed.
Plant Breeders’ Rights (Act 15 of 1976)The act renders legal protection to the breeders and owners of cultivars. The awarding of rights stipulates that cultivars must be new, distinguishable, uniform and stable, and protection is granted for a 20 year period. The rights of the owner/ breeder entail that no party may multiply propagating material (seed), process it for planting, sell it, import it, export it or keep it in stock without the necessary authorisation or licence of the holders of the rights. The act makes provision for the court to grant compensation of R10 000.00 to the holder of Plant Breeder’s Rights in cases of breaching of rights.
Seed certification and Table 8, as described in the Plant Improvement Act
The main aim of certification of seed is to maintain cultivars. Seed laws and regulations prescribe the minimum physical requirements, while certification of seed strives to achieve high standards of genetic purity and other quality requirements. Seed certification is a voluntary action that is administered by SANSOR on behalf of the Minister of Agriculture. However, if a cultivar is listed in Table 8, it is subject to compulsory certification. Hereby cultivar purity as well as good seed quality is guaranteed, and renders protection and peace of mind to the buyer (farmer), as well as an improved control system for acting on complaints and claims. The costs involved are surely a minimal price to pay for the peace of mind of both the buyer and seller of certified seed.
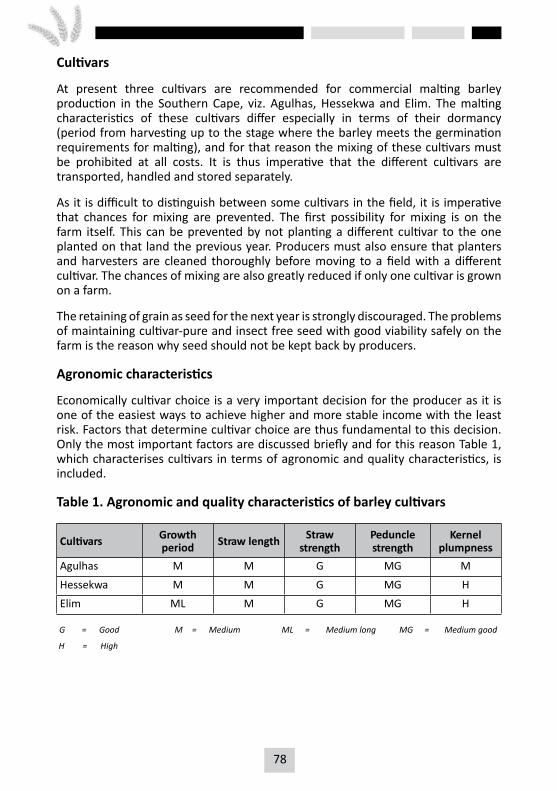
78 79
Cultivars
At present three cultivars are recommended for commercial malting barley production in the Southern Cape, viz. Agulhas, Hessekwa and Elim. The malting characteristics of these cultivars differ especially in terms of their dormancy (period from harvesting up to the stage where the barley meets the germination requirements for malting), and for that reason the mixing of these cultivars must be prohibited at all costs. It is thus imperative that the different cultivars are transported, handled and stored separately.
As it is difficult to distinguish between some cultivars in the field, it is imperative that chances for mixing are prevented. The first possibility for mixing is on the farm itself. This can be prevented by not planting a different cultivar to the one planted on that land the previous year. Producers must also ensure that planters and harvesters are cleaned thoroughly before moving to a field with a different cultivar. The chances of mixing are also greatly reduced if only one cultivar is grown on a farm.
The retaining of grain as seed for the next year is strongly discouraged. The problems of maintaining cultivar-pure and insect free seed with good viability safely on the farm is the reason why seed should not be kept back by producers.
Agronomic characteristics
Economically cultivar choice is a very important decision for the producer as it is one of the easiest ways to achieve higher and more stable income with the least risk. Factors that determine cultivar choice are thus fundamental to this decision. Only the most important factors are discussed briefly and for this reason Table 1, which characterises cultivars in terms of agronomic and quality characteristics, is included.
Table 1. Agronomic and quality characteristics of barley cultivars
Cultivars Growth period Straw length Straw
strengthPeduncle strength
Kernel plumpness
Agulhas M M G MG M
Hessekwa M M G MG H
Elim ML M G MG H
G = Good M = Medium ML = Medium long MG = Medium good
H = High
78 79
Growth period
Growth period refers to the average number of days that it takes from emergence to physiological maturity (Tabel 1). For this reason cultivars that are adapted to the climatic conditions, such as growing season, rainfall pattern and temperature, of the area must be planted.
Straw strength
Straw strength is the ability of a cultivar to remain standing (unlodged) under extreme conditions and is largely determined by straw length and thickness. The lodging of barley often results in considerable yield and grain quality losses, which can largely be attributed to the resulting increased infestation of fungal plant diseases. It is largely a problem where critical yield potential conditions have been exceeded, but rain with a strong wind and excessive nitrogen fertilisation can also play a role.
Peduncle strength
This characteristic refers to the strength of the culm between the flag leaf and the head/ear, and thus to the susceptibility of the cultivar to wind damage (Table 1). The greatest risk of the latter is just prior to harvesting. It is advisable to rather cut the crops into windrows prior to harvesting if the cultivar is susceptible to this phenomenon.
Kernel plumpness
The percentage plump kernels largely determine the grade of the grain. This characteristic is strongly cultivar related (Table 1). In areas where soil water deficits and heat stress occur during the grain filling period and where certain plant diseases, such as Rhynchosporium commune (scald), are common, considerable losses could occur with the downgrading of the crop due to a low kernel plumpness percentage.
Disease characteristics
In the Southern Cape, barley cultivars are often infected by various fungal diseases. Depending on environmental conditions, the levels of infestation differs from year to year. Although different levels of resistance against these fungal diseases exists, a complete spraying programme should still be followed. High levels of infestation has a negative influence on the yield and quality of the harvest.
Table 2 gives an indication of the resistance status of the cultivars to the most important fungal diseases in the area. The nomenclature used to indicate status can be explained as follow:
• Susceptible: The cultivar has no resistance against the pathogen and the disease spreads fast when conditions are favourable.
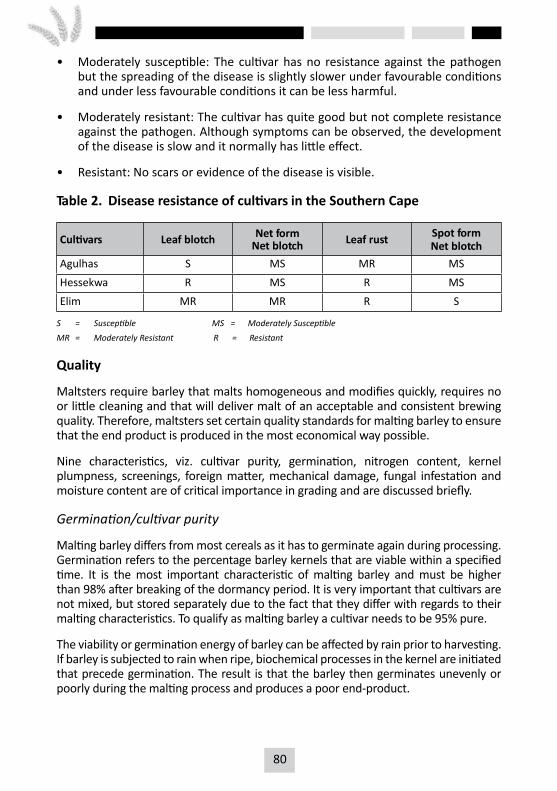
80 81
• Moderately susceptible: The cultivar has no resistance against the pathogen but the spreading of the disease is slightly slower under favourable conditions and under less favourable conditions it can be less harmful.
• Moderately resistant: The cultivar has quite good but not complete resistance against the pathogen. Although symptoms can be observed, the development of the disease is slow and it normally has little effect.
• Resistant: No scars or evidence of the disease is visible.
Table 2. Disease resistance of cultivars in the Southern Cape
Cultivars Leaf blotch Net formNet blotch Leaf rust Spot form
Net blotchAgulhas S MS MR MS
Hessekwa R MS R MS
Elim MR MR R S
S = Susceptible MS = Moderately SusceptibleMR = Moderately Resistant R = Resistant
Quality
Maltsters require barley that malts homogeneous and modifies quickly, requires no or little cleaning and that will deliver malt of an acceptable and consistent brewing quality. Therefore, maltsters set certain quality standards for malting barley to ensure that the end product is produced in the most economical way possible.
Nine characteristics, viz. cultivar purity, germination, nitrogen content, kernel plumpness, screenings, foreign matter, mechanical damage, fungal infestation and moisture content are of critical importance in grading and are discussed briefly.
Germination/cultivar purity
Malting barley differs from most cereals as it has to germinate again during processing. Germination refers to the percentage barley kernels that are viable within a specified time. It is the most important characteristic of malting barley and must be higher than 98% after breaking of the dormancy period. It is very important that cultivars are not mixed, but stored separately due to the fact that they differ with regards to their malting characteristics. To qualify as malting barley a cultivar needs to be 95% pure.
The viability or germination energy of barley can be affected by rain prior to harvesting. If barley is subjected to rain when ripe, biochemical processes in the kernel are initiated that precede germination. The result is that the barley then germinates unevenly or poorly during the malting process and produces a poor end-product.
80 81
Nitrogen content
Barley with extensively high or low nitrogen content cannot produce malt of the required quality for brewing purposes. The sliding scale according to which the price of barley is determined, is based on a base price onto which premiums are added for certain nitrogen levels in the grain. Although grain with a nitrogen content of between 1.50% and 2.00% is accepted as malting barley, the premium is only payable on grain with a nitrogen content of between 1.70% and 2.00%. It is important to note that the cut-off and turning points can differ from season to season and must be confirmed with grain traders.
Nitrogen content of barley is a characteristic that is genetically, as well as environmentally, influenced. Certain cultivars produce lower nitrogen content despite higher nitrogen fertilisation. Such a characteristic of a cultivar would be beneficial as it is not only high nitrogen fertilisation that increases the nitrogen levels in the grain, but also uncontrollable factors such as drought and heat stress during the grain filling period and the nitrogen supply capacity of the soil. The producer must at all times consider the nitrogen supply capability of his soils, and here soil tillage and the preceding crop are of importance.
Kernel plumpness
Kernel plumpness is important for homogeneous malting. Thin kernels absorb water faster than plump kernels. Thin kernels also have a relatively higher percentage husk, which gives beer an astringent taste. Therefore, uniform plumpness will result in better malting quality. Barley qualify as malting barley when the kernel plumpness is from 70% upwards, as measured with a 2.5 mm sieve. According to the sliding scale for plump kernels, more is paid for barley with a kernel plumpness that increases from 85% to 100%. As in the case of nitrogen content, the cut-off point must be confirmed with the grain handlers.
It is also important to note that plump kernels produce malt with a higher extract, which is an important aspect in the brewing process. A low kernel plumpness percentage is the result of unfavourable conditions during the grain filling period, such as late ears that have ripened too fast or if an initial yield potential exceeds the capacity of the environment at the grain filling stage. Certain cultivars however, also genetically tend to have low kernel plumpness and therefore, breeders specifically select for lines with high kernel plumpness. The kernel plumpness of all the present barley cultivars currently in the market can be described as good to very good.
Screenings, foreign matter and mechanical damage
The material that is so small it falls through a 2.2 mm sieve, are called screenings. This material generally consists of shrivelled kernels, broken kernels, small weed seeds, glumae, awns, dead insects and dust. There is a base price for barley deliveries with between 3.1% to 5.0% screenings and an increasing premium for
82 83
deliveries with a screening content between 3.0% and 0.0%. The top limit at which screenings can still be delivered is 5%. Again the cut-off points must be confirmed with the grain handlers. Thin kernels can be ascribed to factors noted, while broken kernels, glumae, awns and dust generally reflect on harvester adjustments. For this reason it is imperative that the producer adjusts his harvester accordingly to ensure good quality, a good grade and thus a good price.
Dead weevils in the screenings are usually an indication of a possible infestation and this would require further investigation. The presence of weevils can lead to downgrading of the crop due to live insects on the one hand, or the presence of insect damaged kernels on the other hand.
Foreign matter’s cut-off point is 2%, while a price incentive applies for foreign matter under 1%. A base price is applicable for barley with a foreign matter content between 1% and 2%, but a feed grade price is applicable for barley with a foreign matter content >2%.
Mechanical damage from harvesters decreases the percentage of usable barley kernels. When embryos are damaged or husk over the embryo is removed, the kernels cause problems in the malting process. Too high percentage of endosperm exposed kernels results in several processing problems in the malting process (fungal growth, foam in steep tanks, etc).
Fungal infestation
Malting barley infested with fungi is not fit for human consumption and is downgraded to undergrade. Some fungi produce mycotoxins (DON) when under stress. Fungal infestation usually takes place when windrows are subjected to continual moist conditions or when barley with a too high moisture content is harvested and stored on the farm under unfavourable conditions. Barley with a high moisture content (>13%) should be dried according to specifications as soon as possible. Barley cultivars have no genetic resistance to these grain fungi.
Moisture content
Malting barley that is delivered and stored with too high a moisture content can result in fungal development and also a decrease in germination capacity. Therefore, no malting barley with a moisture content of higher than 13% are accepted and a pro rata premium is paid for grain with the moisture content decreasing from 13% to 9.5%.
Barley Passport
In the 2005 season, a system was implemented by which the producer is obliged to submit a passport before he can deliver his barley. This barley passport entails a schedule that has to be completed by the producer in co-operation with his chemical agent and must clearly stipulate which chemicals have been applied on the barley, as well as when it was applied, how it was applied and the dosage used. It is therefore, of
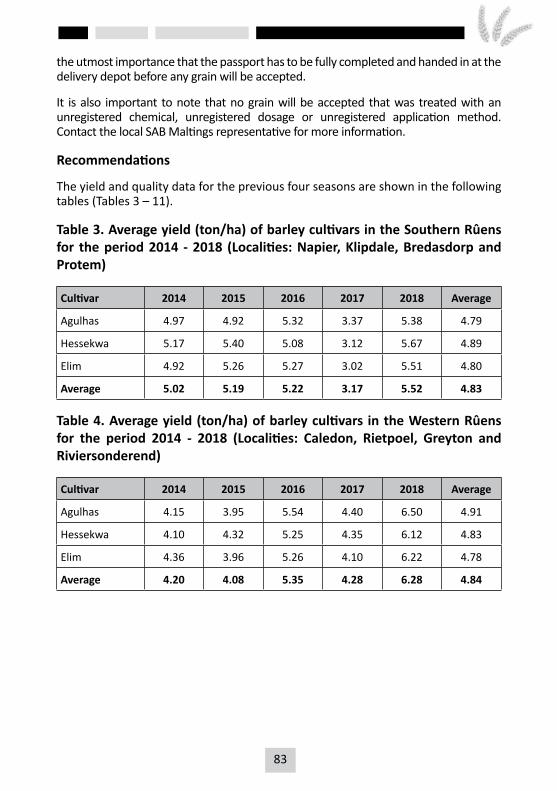
82 83
the utmost importance that the passport has to be fully completed and handed in at the delivery depot before any grain will be accepted.
It is also important to note that no grain will be accepted that was treated with an unregistered chemical, unregistered dosage or unregistered application method. Contact the local SAB Maltings representative for more information.
Recommendations
The yield and quality data for the previous four seasons are shown in the following tables (Tables 3 – 11).
Table 3. Average yield (ton/ha) of barley cultivars in the Southern Rûens for the period 2014 - 2018 (Localities: Napier, Klipdale, Bredasdorp and Protem)
Cultivar 2014 2015 2016 2017 2018 Average
Agulhas 4.97 4.92 5.32 3.37 5.38 4.79
Hessekwa 5.17 5.40 5.08 3.12 5.67 4.89
Elim 4.92 5.26 5.27 3.02 5.51 4.80
Average 5.02 5.19 5.22 3.17 5.52 4.83
Table 4. Average yield (ton/ha) of barley cultivars in the Western Rûens for the period 2014 - 2018 (Localities: Caledon, Rietpoel, Greyton and Riviersonderend)
Cultivar 2014 2015 2016 2017 2018 Average
Agulhas 4.15 3.95 5.54 4.40 6.50 4.91
Hessekwa 4.10 4.32 5.25 4.35 6.12 4.83
Elim 4.36 3.96 5.26 4.10 6.22 4.78
Average 4.20 4.08 5.35 4.28 6.28 4.84
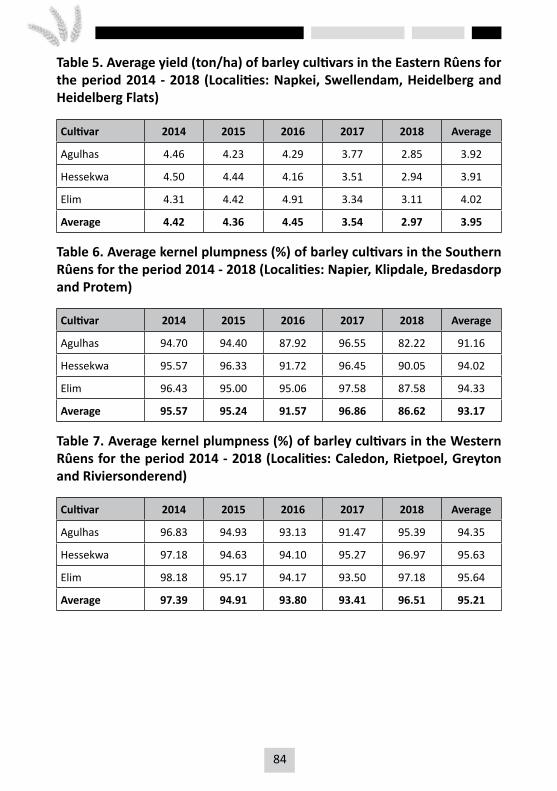
84 85
Table 5. Average yield (ton/ha) of barley cultivars in the Eastern Rûens for the period 2014 - 2018 (Localities: Napkei, Swellendam, Heidelberg and Heidelberg Flats)
Cultivar 2014 2015 2016 2017 2018 Average
Agulhas 4.46 4.23 4.29 3.77 2.85 3.92
Hessekwa 4.50 4.44 4.16 3.51 2.94 3.91
Elim 4.31 4.42 4.91 3.34 3.11 4.02
Average 4.42 4.36 4.45 3.54 2.97 3.95
Table 6. Average kernel plumpness (%) of barley cultivars in the Southern Rûens for the period 2014 - 2018 (Localities: Napier, Klipdale, Bredasdorp and Protem)
Cultivar 2014 2015 2016 2017 2018 Average
Agulhas 94.70 94.40 87.92 96.55 82.22 91.16
Hessekwa 95.57 96.33 91.72 96.45 90.05 94.02
Elim 96.43 95.00 95.06 97.58 87.58 94.33
Average 95.57 95.24 91.57 96.86 86.62 93.17
Table 7. Average kernel plumpness (%) of barley cultivars in the Western Rûens for the period 2014 - 2018 (Localities: Caledon, Rietpoel, Greyton and Riviersonderend)
Cultivar 2014 2015 2016 2017 2018 Average
Agulhas 96.83 94.93 93.13 91.47 95.39 94.35
Hessekwa 97.18 94.63 94.10 95.27 96.97 95.63
Elim 98.18 95.17 94.17 93.50 97.18 95.64
Average 97.39 94.91 93.80 93.41 96.51 95.21
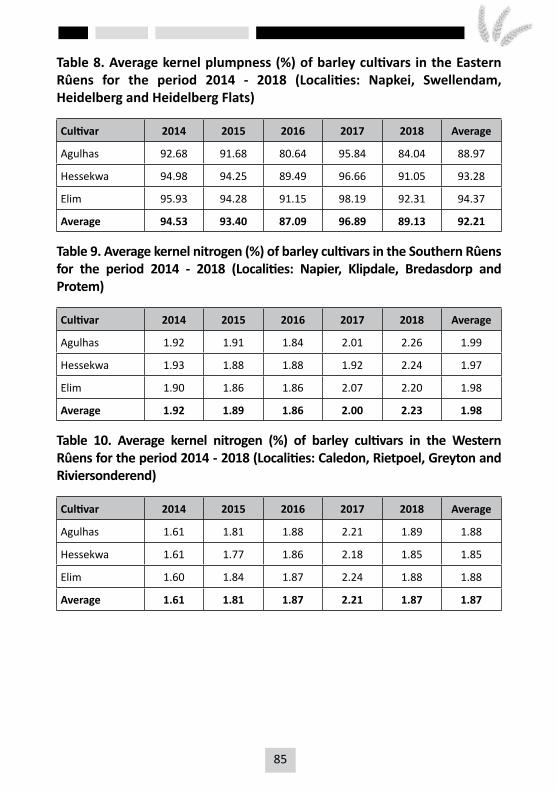
84 85
Table 8. Average kernel plumpness (%) of barley cultivars in the Eastern Rûens for the period 2014 - 2018 (Localities: Napkei, Swellendam, Heidelberg and Heidelberg Flats)
Cultivar 2014 2015 2016 2017 2018 Average
Agulhas 92.68 91.68 80.64 95.84 84.04 88.97
Hessekwa 94.98 94.25 89.49 96.66 91.05 93.28
Elim 95.93 94.28 91.15 98.19 92.31 94.37
Average 94.53 93.40 87.09 96.89 89.13 92.21
Table 9. Average kernel nitrogen (%) of barley cultivars in the Southern Rûens for the period 2014 - 2018 (Localities: Napier, Klipdale, Bredasdorp and Protem)
Cultivar 2014 2015 2016 2017 2018 Average
Agulhas 1.92 1.91 1.84 2.01 2.26 1.99
Hessekwa 1.93 1.88 1.88 1.92 2.24 1.97
Elim 1.90 1.86 1.86 2.07 2.20 1.98
Average 1.92 1.89 1.86 2.00 2.23 1.98
Table 10. Average kernel nitrogen (%) of barley cultivars in the Western Rûens for the period 2014 - 2018 (Localities: Caledon, Rietpoel, Greyton and Riviersonderend)
Cultivar 2014 2015 2016 2017 2018 Average
Agulhas 1.61 1.81 1.88 2.21 1.89 1.88
Hessekwa 1.61 1.77 1.86 2.18 1.85 1.85
Elim 1.60 1.84 1.87 2.24 1.88 1.88
Average 1.61 1.81 1.87 2.21 1.87 1.87
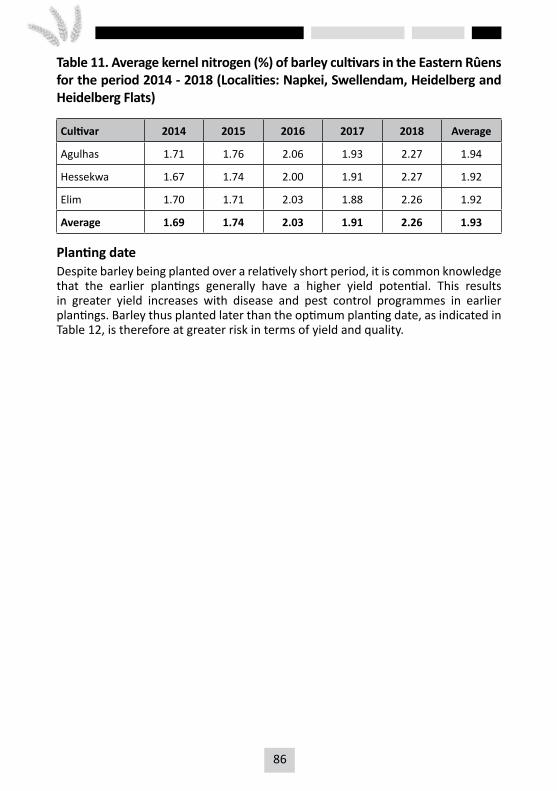
86 87
Table 11. Average kernel nitrogen (%) of barley cultivars in the Eastern Rûens for the period 2014 - 2018 (Localities: Napkei, Swellendam, Heidelberg and Heidelberg Flats)
Cultivar 2014 2015 2016 2017 2018 Average
Agulhas 1.71 1.76 2.06 1.93 2.27 1.94
Hessekwa 1.67 1.74 2.00 1.91 2.27 1.92
Elim 1.70 1.71 2.03 1.88 2.26 1.92
Average 1.69 1.74 2.03 1.91 2.26 1.93
Planting dateDespite barley being planted over a relatively short period, it is common knowledge that the earlier plantings generally have a higher yield potential. This results in greater yield increases with disease and pest control programmes in earlier plantings. Barley thus planted later than the optimum planting date, as indicated in Table 12, is therefore at greater risk in terms of yield and quality.
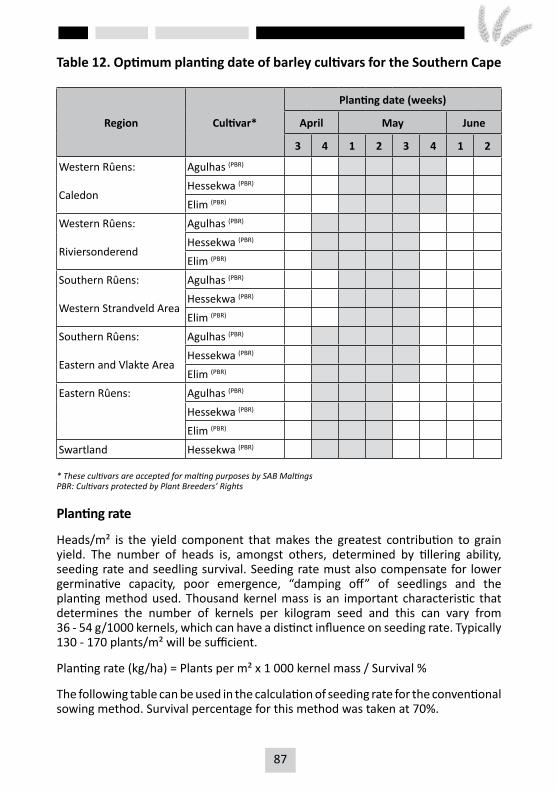
86 87
Table 12. Optimum planting date of barley cultivars for the Southern Cape
Region Cultivar*
Planting date (weeks)
April May June
3 4 1 2 3 4 1 2
Western Rûens: Agulhas (PBR)
CaledonHessekwa (PBR)
Elim (PBR)
Western Rûens: Agulhas (PBR)
RiviersonderendHessekwa (PBR)
Elim (PBR)
Southern Rûens: Agulhas (PBR)
Western Strandveld AreaHessekwa (PBR)
Elim (PBR)
Southern Rûens: Agulhas (PBR)
Eastern and Vlakte AreaHessekwa (PBR)
Elim (PBR)
Eastern Rûens: Agulhas (PBR)
Hessekwa (PBR)
Elim (PBR)
Swartland Hessekwa (PBR)
* These cultivars are accepted for malting purposes by SAB Maltings PBR: Cultivars protected by Plant Breeders’ Rights
Planting rate
Heads/m² is the yield component that makes the greatest contribution to grain yield. The number of heads is, amongst others, determined by tillering ability, seeding rate and seedling survival. Seeding rate must also compensate for lower germinative capacity, poor emergence, “damping off” of seedlings and the planting method used. Thousand kernel mass is an important characteristic that determines the number of kernels per kilogram seed and this can vary from 36 - 54 g/1000 kernels, which can have a distinct influence on seeding rate. Typically 130 - 170 plants/m² will be sufficient.
Planting rate (kg/ha) = Plants per m² x 1 000 kernel mass / Survival %
The following table can be used in the calculation of seeding rate for the conventional sowing method. Survival percentage for this method was taken at 70%.
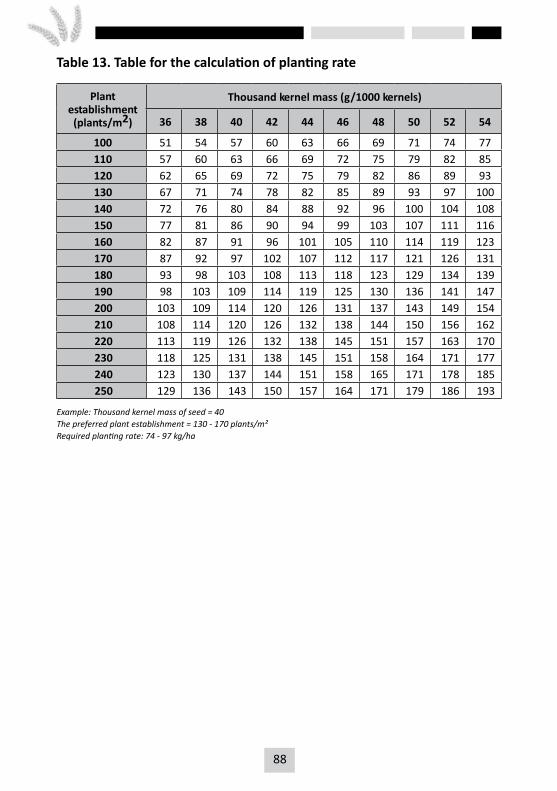
88 89
Table 13. Table for the calculation of planting rate
Plant establishment (plants/m2)
Thousand kernel mass (g /1000 kernels)
36 38 40 42 44 46 48 50 52 54
100 51 54 57 60 63 66 69 71 74 77110 57 60 63 66 69 72 75 79 82 85120 62 65 69 72 75 79 82 86 89 93130 67 71 74 78 82 85 89 93 97 100140 72 76 80 84 88 92 96 100 104 108150 77 81 86 90 94 99 103 107 111 116160 82 87 91 96 101 105 110 114 119 123170 87 92 97 102 107 112 117 121 126 131180 93 98 103 108 113 118 123 129 134 139190 98 103 109 114 119 125 130 136 141 147200 103 109 114 120 126 131 137 143 149 154210 108 114 120 126 132 138 144 150 156 162220 113 119 126 132 138 145 151 157 163 170230 118 125 131 138 145 151 158 164 171 177240 123 130 137 144 151 158 165 171 178 185250 129 136 143 150 157 164 171 179 186 193
Example: Thousand kernel mass of seed = 40The preferred plant establishment = 130 - 170 plants/m² Required planting rate: 74 - 97 kg/ha
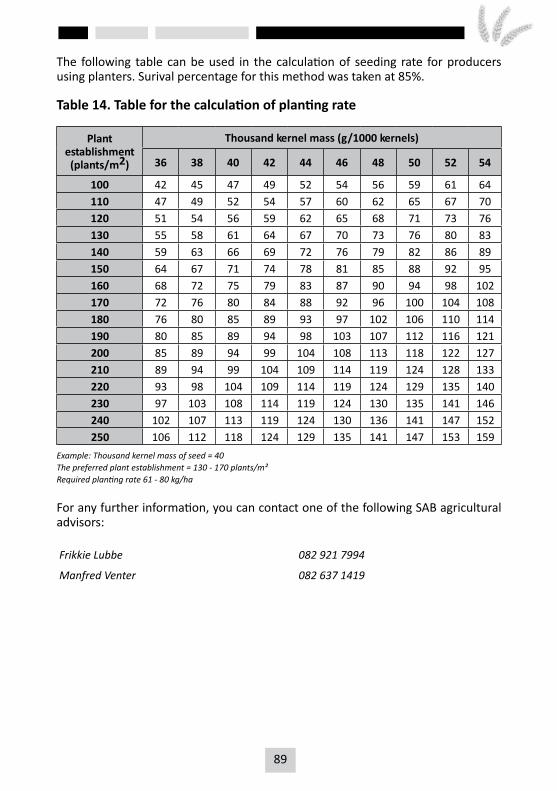
88 89
The following table can be used in the calculation of seeding rate for producers using planters. Surival percentage for this method was taken at 85%.
Table 14. Table for the calculation of planting rate
Plant establishment (plants/m2)
Thousand kernel mass (g /1000 kernels)
36 38 40 42 44 46 48 50 52 54
100 42 45 47 49 52 54 56 59 61 64110 47 49 52 54 57 60 62 65 67 70120 51 54 56 59 62 65 68 71 73 76130 55 58 61 64 67 70 73 76 80 83140 59 63 66 69 72 76 79 82 86 89150 64 67 71 74 78 81 85 88 92 95160 68 72 75 79 83 87 90 94 98 102170 72 76 80 84 88 92 96 100 104 108180 76 80 85 89 93 97 102 106 110 114190 80 85 89 94 98 103 107 112 116 121200 85 89 94 99 104 108 113 118 122 127210 89 94 99 104 109 114 119 124 128 133220 93 98 104 109 114 119 124 129 135 140230 97 103 108 114 119 124 130 135 141 146240 102 107 113 119 124 130 136 141 147 152250 106 112 118 124 129 135 141 147 153 159
Example: Thousand kernel mass of seed = 40The preferred plant establishment = 130 - 170 plants/m² Required planting rate 61 - 80 kg/ha
For any further information, you can contact one of the following SAB agricultural advisors:
Frikkie Lubbe 082 921 7994
Manfred Venter 082 637 1419
90 91
OAT PRODUCTION
Oats has been cultivated in the past mainly for grazing purposes and hay production. Grain production of oats make a limited contribution to the developing breakfast cereal market, with the majority of grain produced ending in the animal feed market. Human consumption of oats is currently the only organised market, with competitive grain prices being paid for a product with suitable grain quality.
Other attributes of oats are also of importance. The introduction and expansion of no-till practices and reduced cultivation systems necessitates the use of suitable cover crops to achieve significant ground cover. Oats fits into this scenario due to the wide planting spectrum, wide adaptability and high biomass production, and can be planted with available cultivation equipment. Furthermore, oats have a depressing effect on soil borne diseases, like take-all, in these crop rotation systems.
Grazing, silage and hay production
Oat grain is widely used by horse owners and other producers in feed mixtures. Well fertilised oats produces high quality hay and grain with a high nutritional value. Oat grain that does not qualify for suitable grades, due to low hectolitre mass values, is also utilised in the animal feed market.
Oats play a significant part in a balanced grazing availability program, with several cultivars suited for this purpose. The wide adaptability, nutritional value and regrowth characteristics of oats create the situation of available grazing over a long period.
Grain quality
The quality standards applied at present are directly related to the processing of the oats. To develop an understanding of these standards it is necessary to briefly note the most important processes during processing. Firstly, all impurities and foreign material such as chaff, stones, weed seeds, wheat and barley are removed. The groat or kernel is the economically valuable part of the grain, while the hulls have no commercial value. The hulls are removed by two rotating milling stones that are set fractionally closer to one another than the thickness of the grain, and literally rub off the hulls. It is thus understandable that the hulls of twin oats cannot be removed and that naked oats will be damaged in this process. After this process, the oats undergoes specific processing for the purpose for which it is needed.
Hectolitre mass
Large and well filled groat/kernels are in big demand by the processors and hectolitre mass is an indication of this quality aspect. The minimum hectolitre mass depending on the grade, is shown in Table 1.
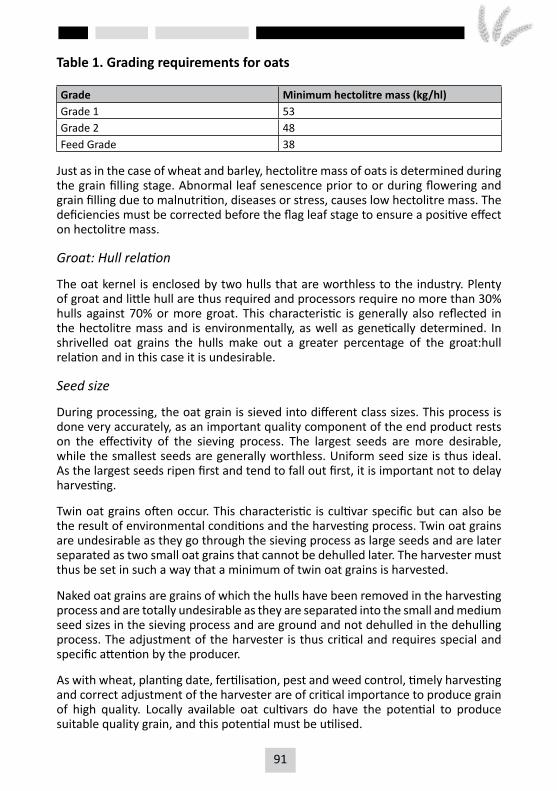
90 91
Table 1. Grading requirements for oats
Grade Minimum hectolitre mass (kg/hl)Grade 1 53Grade 2 48Feed Grade 38
Just as in the case of wheat and barley, hectolitre mass of oats is determined during the grain filling stage. Abnormal leaf senescence prior to or during flowering and grain filling due to malnutrition, diseases or stress, causes low hectolitre mass. The deficiencies must be corrected before the flag leaf stage to ensure a positive effect on hectolitre mass.
Groat: Hull relation
The oat kernel is enclosed by two hulls that are worthless to the industry. Plenty of groat and little hull are thus required and processors require no more than 30% hulls against 70% or more groat. This characteristic is generally also reflected in the hectolitre mass and is environmentally, as well as genetically determined. In shrivelled oat grains the hulls make out a greater percentage of the groat:hull relation and in this case it is undesirable.
Seed size
During processing, the oat grain is sieved into different class sizes. This process is done very accurately, as an important quality component of the end product rests on the effectivity of the sieving process. The largest seeds are more desirable, while the smallest seeds are generally worthless. Uniform seed size is thus ideal. As the largest seeds ripen first and tend to fall out first, it is important not to delay harvesting.
Twin oat grains often occur. This characteristic is cultivar specific but can also be the result of environmental conditions and the harvesting process. Twin oat grains are undesirable as they go through the sieving process as large seeds and are later separated as two small oat grains that cannot be dehulled later. The harvester must thus be set in such a way that a minimum of twin oat grains is harvested.
Naked oat grains are grains of which the hulls have been removed in the harvesting process and are totally undesirable as they are separated into the small and medium seed sizes in the sieving process and are ground and not dehulled in the dehulling process. The adjustment of the harvester is thus critical and requires special and specific attention by the producer.
As with wheat, planting date, fertilisation, pest and weed control, timely harvesting and correct adjustment of the harvester are of critical importance to produce grain of high quality. Locally available oat cultivars do have the potential to produce suitable quality grain, and this potential must be utilised.
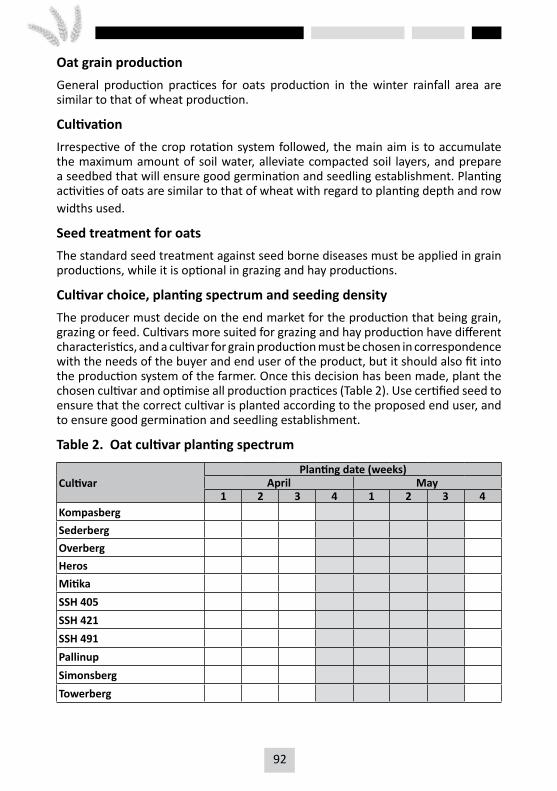
92 93
Oat grain productionGeneral production practices for oats production in the winter rainfall area are similar to that of wheat production.
CultivationIrrespective of the crop rotation system followed, the main aim is to accumulate the maximum amount of soil water, alleviate compacted soil layers, and prepare a seedbed that will ensure good germination and seedling establishment. Planting activities of oats are similar to that of wheat with regard to planting depth and row widths used.
Seed treatment for oatsThe standard seed treatment against seed borne diseases must be applied in grain productions, while it is optional in grazing and hay productions.
Cultivar choice, planting spectrum and seeding densityThe producer must decide on the end market for the production that being grain, grazing or feed. Cultivars more suited for grazing and hay production have different characteristics, and a cultivar for grain production must be chosen in correspondence with the needs of the buyer and end user of the product, but it should also fit into the production system of the farmer. Once this decision has been made, plant the chosen cultivar and optimise all production practices (Table 2). Use certified seed to ensure that the correct cultivar is planted according to the proposed end user, and to ensure good germination and seedling establishment.
Table 2. Oat cultivar planting spectrum
CultivarPlanting date (weeks)
April May1 2 3 4 1 2 3 4
KompasbergSederbergOverbergHerosMitikaSSH 405SSH 421SSH 491PallinupSimonsbergTowerberg
92 93
Seeding density: The target plant population is 250 plants/m². Depending on the specific seed lot and thousand-kernel mass, the seeding density can range from 60 - 100 kg seed/ha. The planting spectrum is based on available data. Planting outside this spectrum is at the producers own risk.
Fertiliser requirement
Oats generally has similar soil requirements as wheat with regard to the macro and micro nutrients (Fe, Cu, Zn, Mn and Mo) that have a major influence on production. Soil acidity levels between (pH 4.8 to 5.5 (KCI) are regarded as being optimal. Oats is more acid tolerant (up to 15% acid saturation) than wheat, but less saline tolerant when compared with wheat and barley.
Nitrogen management of the oat crop is determined by soil and nutrient management strategies, including the previous crop, soil water availability, soil nitrogen availability, yield potential, risk of lodging, timing of nitrogen applications and nitrogen sources available.
For hay production 100 kg N/ha is recommended, with an additional 30 kg N/ha after each grazing and/or fodder harvest depending on production level.
For grain production the general recommendation is 80 kg N/ha, 15 kg P/ha and 15 kg K/ha for a grain yield potential of 2.5 ton/ha. Phosphorus is important, especially early in the growing season for establishment, while sufficiently available potassium can reduce lodging and ensure uniform ripening.
A maximum of 20 kg N/ha or a total of 50 kg N+K/ha can be seed placed safely, and higher applications must be banded away from the seed. The phosphorus fertiliser recommendations (kg P/ha) at the yield potential levels and soil analysis value (mg/kg P-Bray 1), as well as the potassium fertiliser recommendations (kg K/ha) at the relevant yield potential levels and soil potassium analysis value (mg/kg K) currently used for wheat production can also be applied for oat production. Keep in mind that the yield potential of oats is lower than that of wheat. The same fertiliser recommendations can be used for grazing plantings, with the option of additional N applications after grazing events combined with rainfall occurrence.
Diseases and control
Oats is susceptible to crown and stem rust, and to “Barley yellow dwarf virus” which is spread by aphid infestations. It is economically viable to control diseases at yield potential levels above 2 ton/ha. Diseases generally lower the kernel weight and hectolitre mass, and discolour the grain, resulting in downgrading of the product resulting in a lower price per ton grain. Regular field inspections in the growing season must be done to ensure timely disease control and prevent yield and quality losses.
94 95
At seedling stage and in the field, the cultivars Simonsberg and Towerberg showed resistant to low susceptibility, while Kompasberg, Sederberg and SSH 491 showed mild susceptibility to the current crown rust races. The other cultivars are highly susceptible. In a season when the climatic conditions are favourable towards crown rust development, cultivars will have to be inspected regularly to ensure timely control of the disease. Simonsberg and Towerberg showed mild resistance to stem rust infection at the seedling stage and in the field.
Harvesting, storage and marketing
Oats can be harvested at a grain moisture content below 20%, but can only be stored safely at a grain moisture below 12.5%. Shattering in the field can be a problem, and rain during harvesting can discolour kernels, resulting in downgrading of the crop. There are various options (including cleaning and sieving) to improve grain quality parameters, especially hectolitre mass, to attain better prices per ton of grain.
Problems in oat production
Grasses in oat productions can be a huge problem as it cannot be chemically controlled, and these grasses and volunteer wheat must be controlled beforehand, especially if take-all depression is one of the production objectives. Lodging of the crop causes yield losses and non-uniform ripening and hence difficulties in timely harvesting can result in reduced grain quality. Lodging can be managed by cultivar choice, seeding density and nutrient management. In particular, seeding density is a major factor with regard to the incidence of lodging. Due to the lower kernel weight of oat seed, lower seeding densities (kg seed/ha) are needed to achieve target plant populations. Cultivars also differ in tillering capacity that can influence seeding density for a yield target. Bird damage is also a limiting factor in some areas.
Yield results
The yield results and hectolitre mass values obtained in the oat cultivar evaluation programme over the past seasons are summarised in the following tables:
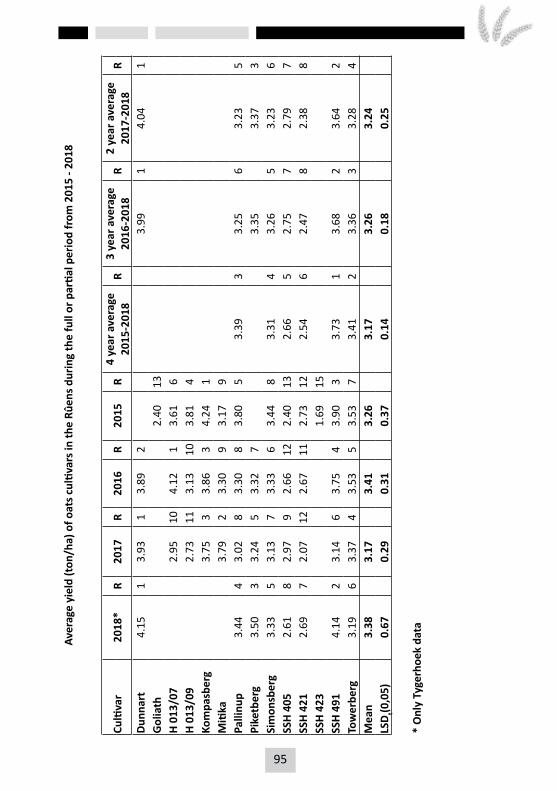
94 95
Aver
age
yiel
d (t
on/h
a) o
f oat
s cul
tivar
s in
the
Rûen
s dur
ing
the
full
or p
artia
l per
iod
from
201
5 - 2
018
Culti
var
2018
*R
2017
R20
16R
2015
R4
year
ave
rage
R3
year
ave
rage
R2
year
ave
rage
R20
15-2
018
2016
-201
820
17-2
018
Dunn
art
4.15
13.
931
3.89
2
3.
991
4.04
1G
olia
th
2.
4013
H 01
3/07
2.
9510
4.12
13.
616
H 01
3/09
2.
7311
3.13
103.
814
Kom
pasb
erg
3.
753
3.86
34.
241
Miti
ka
3.79
23.
309
3.17
9
Pa
llinu
p3.
444
3.02
83.
308
3.80
53.
393
3.25
63.
235
Pike
tber
g3.
503
3.24
53.
327
3.35
3.
373
Sim
onsb
erg
3.33
53.
137
3.33
63.
448
3.31
43.
265
3.23
6SS
H 40
52.
618
2.97
92.
6612
2.40
132.
665
2.75
72.
797
SSH
421
2.69
72.
0712
2.67
112.
7312
2.54
62.
478
2.38
8SS
H 42
3
1.
6915
SSH
491
4.14
23.
146
3.75
43.
903
3.73
13.
682
3.64
2To
wer
berg
3.19
63.
374
3.53
53.
537
3.41
23.
363
3.28
4M
ean
3.38
3.
17
3.41
3.
26
3.17
3.
26
3.24
LS
Dt(0
,05)
0.67
0.
29
0.31
0.
37
0.14
0.
18
0.25
* O
nly
Tyge
rhoe
k da
ta
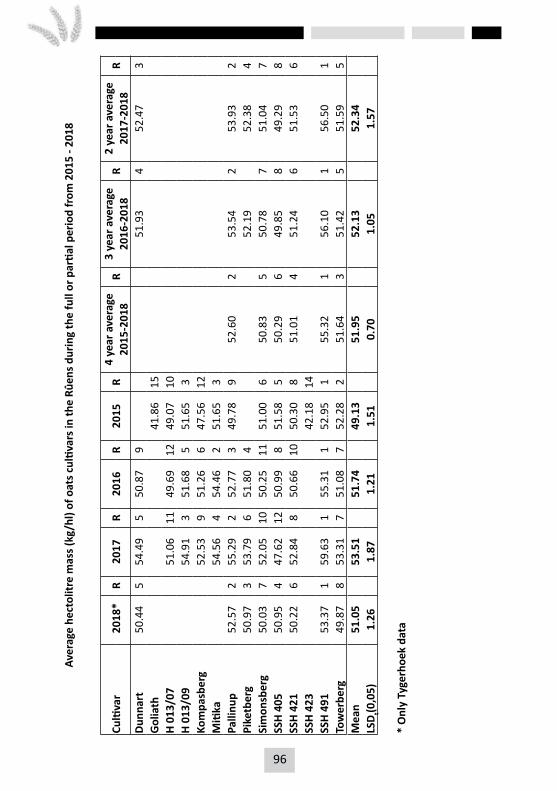
96 97
Aver
age
hect
olitr
e m
ass (
kg/h
l) of
oat
s cul
tivar
s in
the
Rûen
s dur
ing
the
full
or p
artia
l per
iod
from
201
5 - 2
018
Culti
var
201
8*R
2017
R20
16R
2015
R4
year
ave
rage
R3
year
ave
rage
R2
year
ave
rage
R20
15-2
018
2016
-201
820
17-2
018
Dunn
art
50.4
45
54.4
95
50.8
79
51.9
34
52.4
73
Gol
iath
41.8
615
H 01
3/07
51
.06
1149
.69
1249
.07
10
H
013/
09
54.9
13
51.6
85
51.6
53
Kom
pasb
erg
52
.53
951
.26
647
.56
12
M
itika
54
.56
454
.46
251
.65
3
Pa
llinu
p52
.57
255
.29
252
.77
349
.78
952
.60
253
.54
253
.93
2Pi
ketb
erg
50.9
73
53.7
96
51.8
04
52.1
9
52.3
84
Sim
onsb
erg
50.0
37
52.0
510
50.2
511
51.0
06
50.8
35
50.7
87
51.0
47
SSH
405
50.9
54
47.6
212
50.9
98
51.5
85
50.2
96
49.8
58
49.2
98
SSH
421
50.2
26
52.8
48
50.6
610
50.3
08
51.0
14
51.2
46
51.5
36
SSH
423
42.1
814
SSH
491
53.3
71
59.6
31
55.3
11
52.9
51
55.3
21
56.1
01
56.5
01
Tow
erbe
rg49
.87
853
.31
751
.08
752
.28
251
.64
351
.42
551
.59
5M
ean
51.0
5
53.5
1
51.7
4
49.1
3
51.9
5
52.1
3
52.3
4
LSD t(0
,05)
1.26
1.
87
1.21
1.
51
0.70
1.
05
1.57
* O
nly
Tyge
rhoe
k da
ta
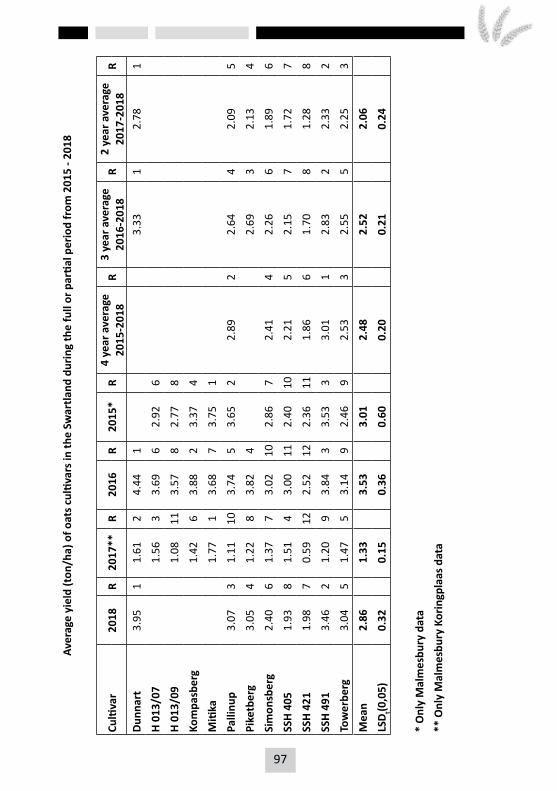
96 97
Aver
age
yiel
d (t
on/h
a) o
f oat
s cul
tivar
s in
the
Swar
tland
dur
ing
the
full
or p
artia
l per
iod
from
201
5 - 2
018
Culti
var
2018
R20
17**
R20
16R
2015
*R
4 ye
ar a
vera
geR
3 ye
ar a
vera
geR
2 ye
ar a
vera
geR
2015
-201
820
16-2
018
2017
-201
8Du
nnar
t3.
951
1.61
24.
441
3.33
12.
781
H 01
3/07
1.
563
3.69
62.
926
H 01
3/09
1.
0811
3.57
82.
778
Kom
pasb
erg
1.
426
3.88
23.
374
Miti
ka
1.77
13.
687
3.75
1
Palli
nup
3.07
31.
1110
3.74
53.
652
2.89
22.
644
2.09
5
Pike
tber
g3.
054
1.22
83.
824
2.69
32.
134
Sim
onsb
erg
2.40
61.
377
3.02
102.
867
2.41
42.
266
1.89
6
SSH
405
1.93
81.
514
3.00
112.
4010
2.21
52.
157
1.72
7
SSH
421
1.98
70.
5912
2.52
122.
3611
1.86
61.
708
1.28
8
SSH
491
3.46
21.
209
3.84
33.
533
3.01
12.
832
2.33
2
Tow
erbe
rg3.
045
1.47
53.
149
2.46
92.
533
2.55
52.
253
Mea
n2.
86
1.33
3.
53
3.01
2.
48
2.52
2.
06
LSD t(0
,05)
0.32
0.
15
0.36
0.
60
0.20
0.
21
0.24
* O
nly
Mal
mes
bury
dat
a**
Onl
y M
alm
esbu
ry K
orin
gpla
as d
ata
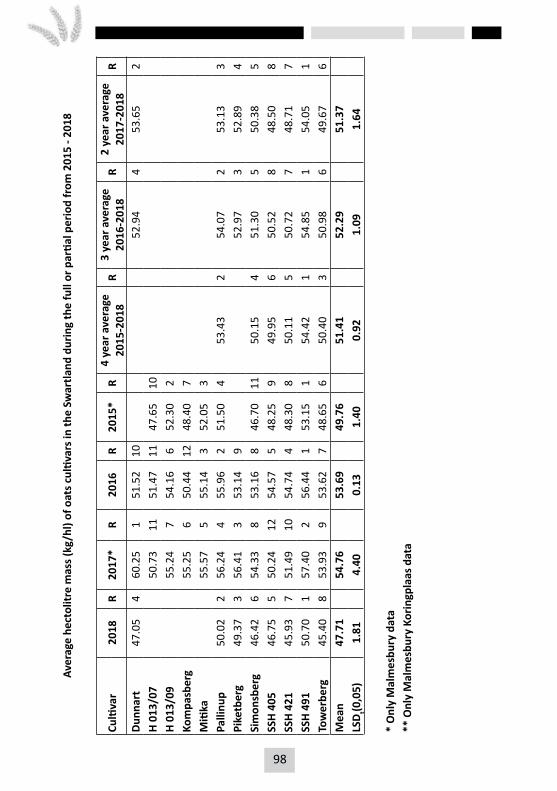
98 99
Aver
age
hect
olitr
e m
ass (
kg/h
l) of
oat
s cul
tivar
s in
the
Swar
tland
dur
ing
the
full
or p
artia
l per
iod
from
201
5 - 2
018
Culti
var
2018
R20
17*
R20
16R
2015
*R
4 ye
ar a
vera
geR
3 ye
ar a
vera
geR
2 ye
ar a
vera
geR
2015
-201
820
16-2
018
2017
-201
8Du
nnar
t47
.05
460
.25
151
.52
10
52
.94
453
.65
2H
013/
07
50.7
311
51.4
711
47.6
510
H 01
3/09
55
.24
754
.16
652
.30
2
Ko
mpa
sber
g
55.2
56
50.4
412
48.4
07
Miti
ka
55.5
75
55.1
43
52.0
53
Palli
nup
50.0
22
56.2
44
55.9
62
51.5
04
53.4
32
54.0
72
53.1
33
Pike
tber
g49
.37
356
.41
353
.14
9
52
.97
352
.89
4Si
mon
sber
g46
.42
654
.33
853
.16
846
.70
1150
.15
451
.30
550
.38
5SS
H 40
546
.75
550
.24
1254
.57
548
.25
949
.95
650
.52
848
.50
8SS
H 42
145
.93
751
.49
1054
.74
448
.30
850
.11
550
.72
748
.71
7SS
H 49
150
.70
157
.40
256
.44
153
.15
154
.42
154
.85
154
.05
1To
wer
berg
45.4
08
53.9
39
53.6
27
48.6
56
50.4
03
50.9
86
49.6
76
Mea
n47
.71
54
.76
53
.69
49
.76
51
.41
52
.29
51
.37
LS
Dt(0
,05)
1.81
4.
40
0.13
1.
40
0.92
1.
09
1.64
* O
nly
Mal
mes
bury
dat
a**
Onl
y M
alm
esbu
ry K
orin
gpla
as d
ata
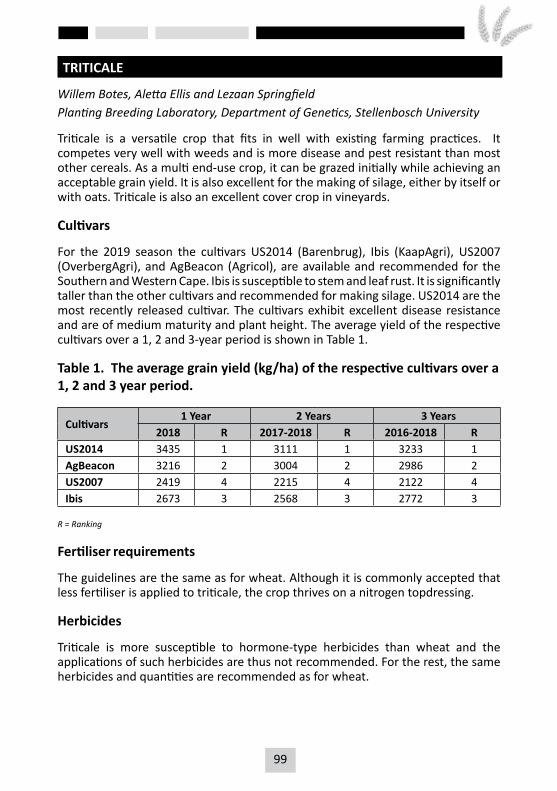
98 99
TRITICALE
Willem Botes, Aletta Ellis and Lezaan SpringfieldPlanting Breeding Laboratory, Department of Genetics, Stellenbosch University
Triticale is a versatile crop that fits in well with existing farming practices. It competes very well with weeds and is more disease and pest resistant than most other cereals. As a multi end-use crop, it can be grazed initially while achieving an acceptable grain yield. It is also excellent for the making of silage, either by itself or with oats. Triticale is also an excellent cover crop in vineyards.
Cultivars
For the 2019 season the cultivars US2014 (Barenbrug), Ibis (KaapAgri), US2007 (OverbergAgri), and AgBeacon (Agricol), are available and recommended for the Southern and Western Cape. Ibis is susceptible to stem and leaf rust. It is significantly taller than the other cultivars and recommended for making silage. US2014 are the most recently released cultivar. The cultivars exhibit excellent disease resistance and are of medium maturity and plant height. The average yield of the respective cultivars over a 1, 2 and 3-year period is shown in Table 1.
Table 1. The average grain yield (kg/ha) of the respective cultivars over a 1, 2 and 3 year period.
Cultivars1 Year 2 Years 3 Years
2018 R 2017-2018 R 2016-2018 RUS2014 3435 1 3111 1 3233 1AgBeacon 3216 2 3004 2 2986 2US2007 2419 4 2215 4 2122 4Ibis 2673 3 2568 3 2772 3
R = Ranking
Fertiliser requirements
The guidelines are the same as for wheat. Although it is commonly accepted that less fertiliser is applied to triticale, the crop thrives on a nitrogen topdressing.
Herbicides
Triticale is more susceptible to hormone-type herbicides than wheat and the applications of such herbicides are thus not recommended. For the rest, the same herbicides and quantities are recommended as for wheat.
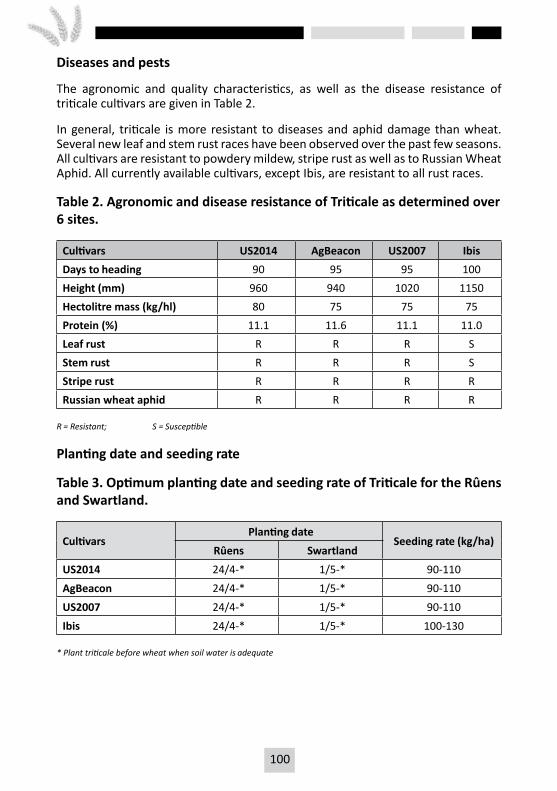
100 101
Diseases and pests
The agronomic and quality characteristics, as well as the disease resistance of triticale cultivars are given in Table 2.
In general, triticale is more resistant to diseases and aphid damage than wheat. Several new leaf and stem rust races have been observed over the past few seasons. All cultivars are resistant to powdery mildew, stripe rust as well as to Russian Wheat Aphid. All currently available cultivars, except Ibis, are resistant to all rust races.
Table 2. Agronomic and disease resistance of Triticale as determined over 6 sites.
Cultivars US2014 AgBeacon US2007 IbisDays to heading 90 95 95 100
Height (mm) 960 940 1020 1150
Hectolitre mass (kg/hl) 80 75 75 75
Protein (%) 11.1 11.6 11.1 11.0
Leaf rust R R R S
Stem rust R R R S
Stripe rust R R R R
Russian wheat aphid R R R R
R = Resistant; S = Susceptible
Planting date and seeding rate
Table 3. Optimum planting date and seeding rate of Triticale for the Rûens and Swartland.
CultivarsPlanting date
Seeding rate (kg/ha)Rûens Swartland
US2014 24/4-* 1/5-* 90-110
AgBeacon 24/4-* 1/5-* 90-110
US2007 24/4-* 1/5-* 90-110
Ibis 24/4-* 1/5-* 100-130
* Plant triticale before wheat when soil water is adequate
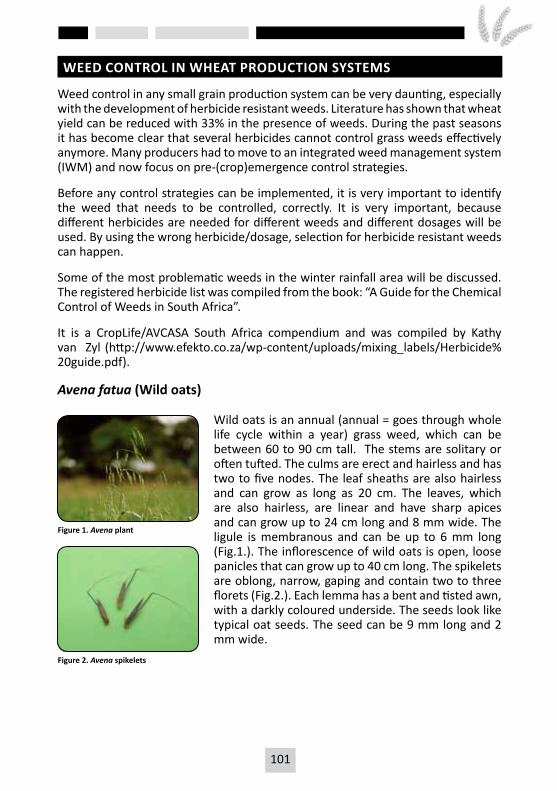
100 101
WEED CONTROL IN WHEAT PRODUCTION SYSTEMS
Weed control in any small grain production system can be very daunting, especially with the development of herbicide resistant weeds. Literature has shown that wheat yield can be reduced with 33% in the presence of weeds. During the past seasons it has become clear that several herbicides cannot control grass weeds effectively anymore. Many producers had to move to an integrated weed management system (IWM) and now focus on pre-(crop)emergence control strategies.
Before any control strategies can be implemented, it is very important to identify the weed that needs to be controlled, correctly. It is very important, because different herbicides are needed for different weeds and different dosages will be used. By using the wrong herbicide/dosage, selection for herbicide resistant weeds can happen.
Some of the most problematic weeds in the winter rainfall area will be discussed. The registered herbicide list was compiled from the book: “A Guide for the Chemical Control of Weeds in South Africa”.
It is a CropLife/AVCASA South Africa compendium and was compiled by Kathy van Zyl (http://www.efekto.co.za/wp-content/uploads/mixing_labels/Herbicide% 20guide.pdf).
Avena fatua (Wild oats)
Wild oats is an annual (annual = goes through whole life cycle within a year) grass weed, which can be between 60 to 90 cm tall. The stems are solitary or often tufted. The culms are erect and hairless and has two to five nodes. The leaf sheaths are also hairless and can grow as long as 20 cm. The leaves, which are also hairless, are linear and have sharp apices and can grow up to 24 cm long and 8 mm wide. The ligule is membranous and can be up to 6 mm long (Fig.1.). The inflorescence of wild oats is open, loose panicles that can grow up to 40 cm long. The spikelets are oblong, narrow, gaping and contain two to three florets (Fig.2.). Each lemma has a bent and tisted awn, with a darkly coloured underside. The seeds look like typical oat seeds. The seed can be 9 mm long and 2 mm wide.
Figure 1. Avena plant
Figure 2. Avena spikelets
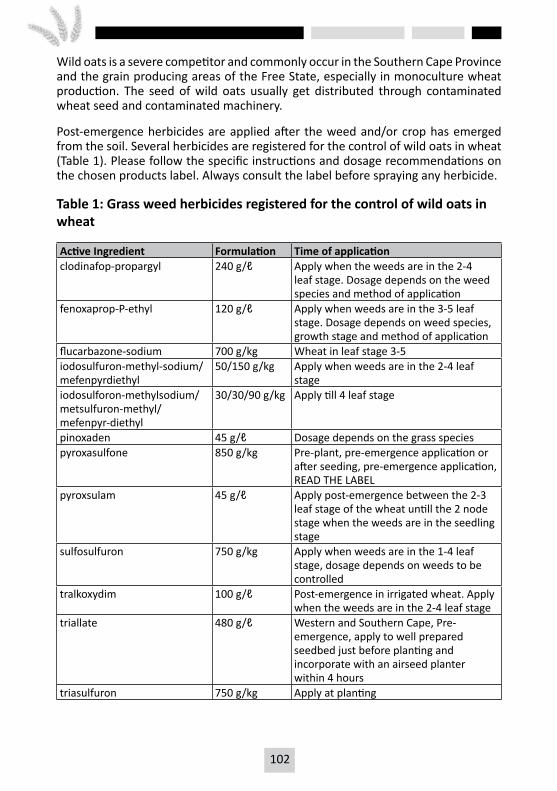
102 103
Wild oats is a severe competitor and commonly occur in the Southern Cape Province and the grain producing areas of the Free State, especially in monoculture wheat production. The seed of wild oats usually get distributed through contaminated wheat seed and contaminated machinery.
Post-emergence herbicides are applied after the weed and/or crop has emerged from the soil. Several herbicides are registered for the control of wild oats in wheat (Table 1). Please follow the specific instructions and dosage recommendations on the chosen products label. Always consult the label before spraying any herbicide.
Table 1: Grass weed herbicides registered for the control of wild oats in wheat
Active Ingredient Formulation Time of applicationclodinafop-propargyl 240 g/ℓ Apply when the weeds are in the 2-4
leaf stage. Dosage depends on the weed species and method of application
fenoxaprop-P-ethyl 120 g/ℓ Apply when weeds are in the 3-5 leaf stage. Dosage depends on weed species, growth stage and method of application
flucarbazone-sodium 700 g/kg Wheat in leaf stage 3-5iodosulfuron-methyl-sodium/mefenpyrdiethyl
50/150 g/kg Apply when weeds are in the 2-4 leaf stage
iodosulforon-methylsodium/metsulfuron-methyl/mefenpyr-diethyl
30/30/90 g/kg Apply till 4 leaf stage
pinoxaden 45 g/ℓ Dosage depends on the grass speciespyroxasulfone 850 g/kg Pre-plant, pre-emergence application or
after seeding, pre-emergence application, READ THE LABEL
pyroxsulam 45 g/ℓ Apply post-emergence between the 2-3 leaf stage of the wheat untill the 2 node stage when the weeds are in the seedling stage
sulfosulfuron 750 g/kg Apply when weeds are in the 1-4 leaf stage, dosage depends on weeds to be controlled
tralkoxydim 100 g/ℓ Post-emergence in irrigated wheat. Apply when the weeds are in the 2-4 leaf stage
triallate 480 g/ℓ Western and Southern Cape, Pre-emergence, apply to well prepared seedbed just before planting and incorporate with an airseed planter within 4 hours
triasulfuron 750 g/kg Apply at planting
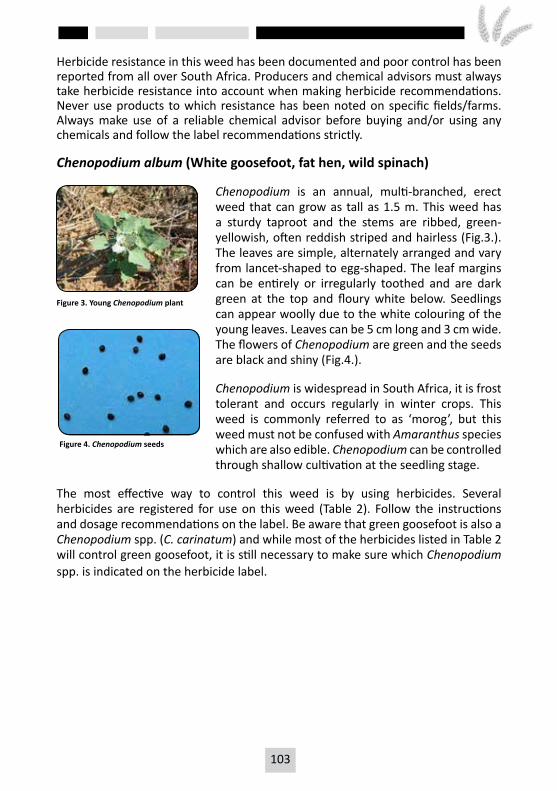
102 103
Herbicide resistance in this weed has been documented and poor control has been reported from all over South Africa. Producers and chemical advisors must always take herbicide resistance into account when making herbicide recommendations. Never use products to which resistance has been noted on specific fields/farms. Always make use of a reliable chemical advisor before buying and/or using any chemicals and follow the label recommendations strictly.
Chenopodium album (White goosefoot, fat hen, wild spinach)
Chenopodium is an annual, multi-branched, erect weed that can grow as tall as 1.5 m. This weed has a sturdy taproot and the stems are ribbed, green-yellowish, often reddish striped and hairless (Fig.3.). The leaves are simple, alternately arranged and vary from lancet-shaped to egg-shaped. The leaf margins can be entirely or irregularly toothed and are dark green at the top and floury white below. Seedlings can appear woolly due to the white colouring of the young leaves. Leaves can be 5 cm long and 3 cm wide. The flowers of Chenopodium are green and the seeds are black and shiny (Fig.4.).
Chenopodium is widespread in South Africa, it is frost tolerant and occurs regularly in winter crops. This weed is commonly referred to as ‘morog’, but this weed must not be confused with Amaranthus species which are also edible. Chenopodium can be controlled through shallow cultivation at the seedling stage.
The most effective way to control this weed is by using herbicides. Several herbicides are registered for use on this weed (Table 2). Follow the instructions and dosage recommendations on the label. Be aware that green goosefoot is also a Chenopodium spp. (C. carinatum) and while most of the herbicides listed in Table 2 will control green goosefoot, it is still necessary to make sure which Chenopodium spp. is indicated on the herbicide label.
Figure 3. Young Chenopodium plant
Figure 4. Chenopodium seeds
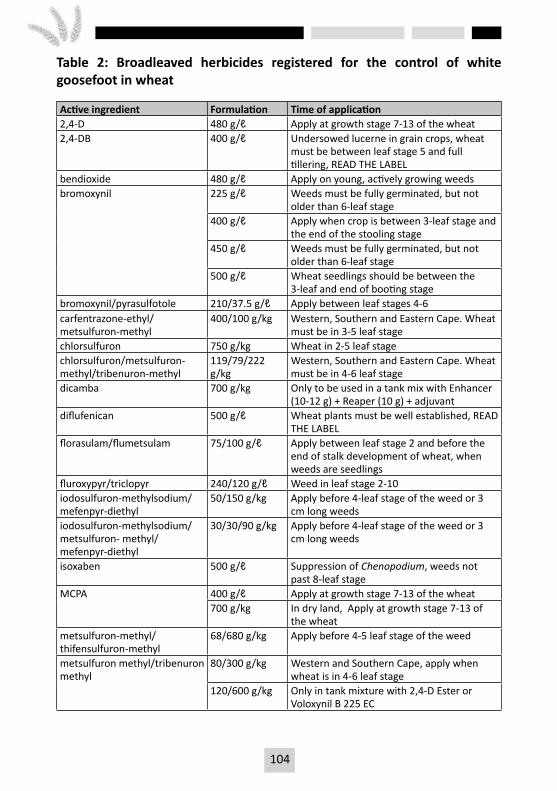
104 105
Table 2: Broadleaved herbicides registered for the control of white goosefoot in wheat
Active ingredient Formulation Time of application2,4-D 480 g/ℓ Apply at growth stage 7-13 of the wheat2,4-DB 400 g/ℓ Undersowed lucerne in grain crops, wheat
must be between leaf stage 5 and full tillering, READ THE LABEL
bendioxide 480 g/ℓ Apply on young, actively growing weedsbromoxynil 225 g/ℓ Weeds must be fully germinated, but not
older than 6-leaf stage400 g/ℓ Apply when crop is between 3-leaf stage and
the end of the stooling stage450 g/ℓ Weeds must be fully germinated, but not
older than 6-leaf stage500 g/ℓ Wheat seedlings should be between the
3-leaf and end of booting stagebromoxynil/pyrasulfotole 210/37.5 g/ℓ Apply between leaf stages 4-6carfentrazone-ethyl/metsulfuron-methyl
400/100 g/kg Western, Southern and Eastern Cape. Wheat must be in 3-5 leaf stage
chlorsulfuron 750 g/kg Wheat in 2-5 leaf stagechlorsulfuron/metsulfuron-methyl/tribenuron-methyl
119/79/222 g/kg
Western, Southern and Eastern Cape. Wheat must be in 4-6 leaf stage
dicamba 700 g/kg Only to be used in a tank mix with Enhancer (10-12 g) + Reaper (10 g) + adjuvant
diflufenican 500 g/ℓ Wheat plants must be well established, READ THE LABEL
florasulam/flumetsulam 75/100 g/ℓ Apply between leaf stage 2 and before the end of stalk development of wheat, when weeds are seedlings
fluroxypyr/triclopyr 240/120 g/ℓ Weed in leaf stage 2-10iodosulfuron-methylsodium/mefenpyr-diethyl
50/150 g/kg Apply before 4-leaf stage of the weed or 3 cm long weeds
iodosulfuron-methylsodium/metsulfuron- methyl/mefenpyr-diethyl
30/30/90 g/kg Apply before 4-leaf stage of the weed or 3 cm long weeds
isoxaben 500 g/ℓ Suppression of Chenopodium, weeds not past 8-leaf stage
MCPA 400 g/ℓ Apply at growth stage 7-13 of the wheat700 g/kg In dry land, Apply at growth stage 7-13 of
the wheatmetsulfuron-methyl/thifensulfuron-methyl
68/680 g/kg Apply before 4-5 leaf stage of the weed
metsulfuron methyl/tribenuron methyl
80/300 g/kg Western and Southern Cape, apply when wheat is in 4-6 leaf stage
120/600 g/kg Only in tank mixture with 2,4-D Ester or Voloxynil B 225 EC
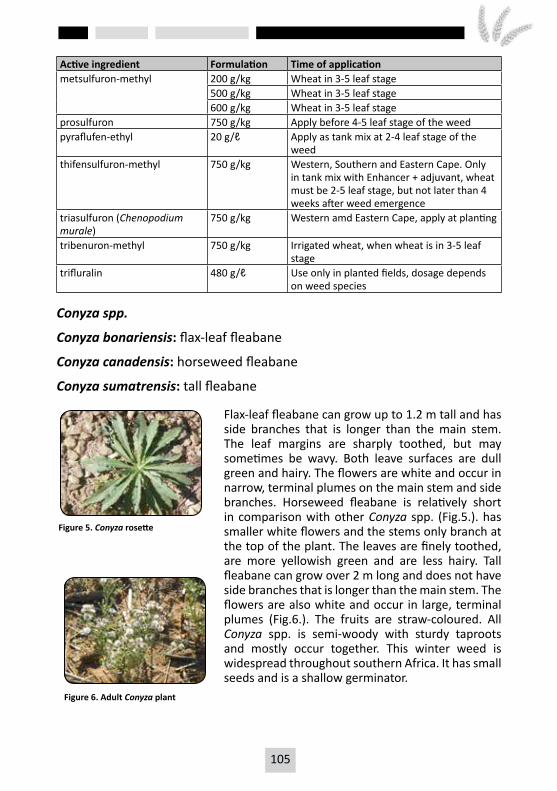
104 105
Active ingredient Formulation Time of applicationmetsulfuron-methyl 200 g/kg Wheat in 3-5 leaf stage
500 g/kg Wheat in 3-5 leaf stage600 g/kg Wheat in 3-5 leaf stage
prosulfuron 750 g/kg Apply before 4-5 leaf stage of the weedpyraflufen-ethyl 20 g/ℓ Apply as tank mix at 2-4 leaf stage of the
weedthifensulfuron-methyl 750 g/kg Western, Southern and Eastern Cape. Only
in tank mix with Enhancer + adjuvant, wheat must be 2-5 leaf stage, but not later than 4 weeks after weed emergence
triasulfuron (Chenopodium murale)
750 g/kg Western amd Eastern Cape, apply at planting
tribenuron-methyl 750 g/kg Irrigated wheat, when wheat is in 3-5 leaf stage
trifluralin 480 g/ℓ Use only in planted fields, dosage depends on weed species
Conyza spp.
Conyza bonariensis: flax-leaf fleabane
Conyza canadensis: horseweed fleabane
Conyza sumatrensis: tall fleabane
Flax-leaf fleabane can grow up to 1.2 m tall and has side branches that is longer than the main stem. The leaf margins are sharply toothed, but may sometimes be wavy. Both leave surfaces are dull green and hairy. The flowers are white and occur in narrow, terminal plumes on the main stem and side branches. Horseweed fleabane is relatively short in comparison with other Conyza spp. (Fig.5.). has smaller white flowers and the stems only branch at the top of the plant. The leaves are finely toothed, are more yellowish green and are less hairy. Tall fleabane can grow over 2 m long and does not have side branches that is longer than the main stem. The flowers are also white and occur in large, terminal plumes (Fig.6.). The fruits are straw-coloured. All Conyza spp. is semi-woody with sturdy taproots and mostly occur together. This winter weed is widespread throughout southern Africa. It has small seeds and is a shallow germinator.
Figure 5. Conyza rosette
Figure 6. Adult Conyza plant
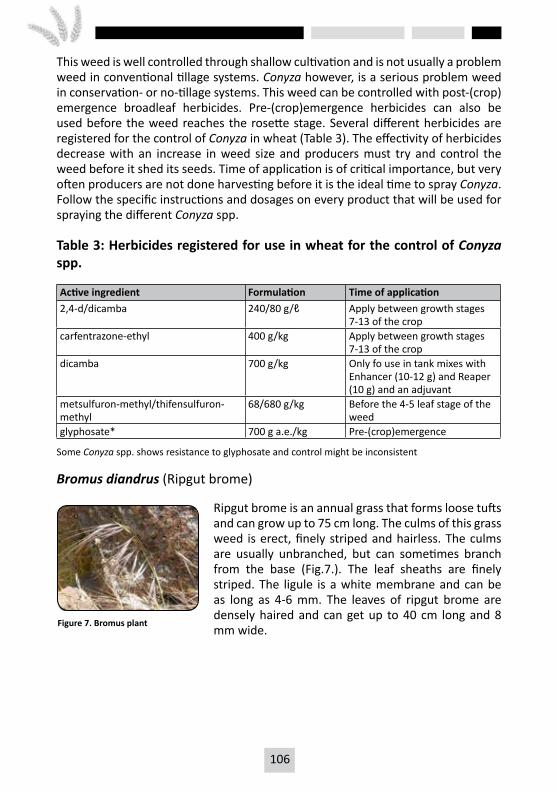
106 107
This weed is well controlled through shallow cultivation and is not usually a problem weed in conventional tillage systems. Conyza however, is a serious problem weed in conservation- or no-tillage systems. This weed can be controlled with post-(crop)emergence broadleaf herbicides. Pre-(crop)emergence herbicides can also be used before the weed reaches the rosette stage. Several different herbicides are registered for the control of Conyza in wheat (Table 3). The effectivity of herbicides decrease with an increase in weed size and producers must try and control the weed before it shed its seeds. Time of application is of critical importance, but very often producers are not done harvesting before it is the ideal time to spray Conyza. Follow the specific instructions and dosages on every product that will be used for spraying the different Conyza spp.
Table 3: Herbicides registered for use in wheat for the control of Conyza spp.
Active ingredient Formulation Time of application2,4-d/dicamba 240/80 g/ℓ Apply between growth stages
7-13 of the cropcarfentrazone-ethyl 400 g/kg Apply between growth stages
7-13 of the cropdicamba 700 g/kg Only fo use in tank mixes with
Enhancer (10-12 g) and Reaper (10 g) and an adjuvant
metsulfuron-methyl/thifensulfuron-methyl
68/680 g/kg Before the 4-5 leaf stage of the weed
glyphosate* 700 g a.e./kg Pre-(crop)emergence
Some Conyza spp. shows resistance to glyphosate and control might be inconsistent
Bromus diandrus (Ripgut brome)
Ripgut brome is an annual grass that forms loose tufts and can grow up to 75 cm long. The culms of this grass weed is erect, finely striped and hairless. The culms are usually unbranched, but can sometimes branch from the base (Fig.7.). The leaf sheaths are finely striped. The ligule is a white membrane and can be as long as 4-6 mm. The leaves of ripgut brome are densely haired and can get up to 40 cm long and 8 mm wide.
Figure 7. Bromus plant
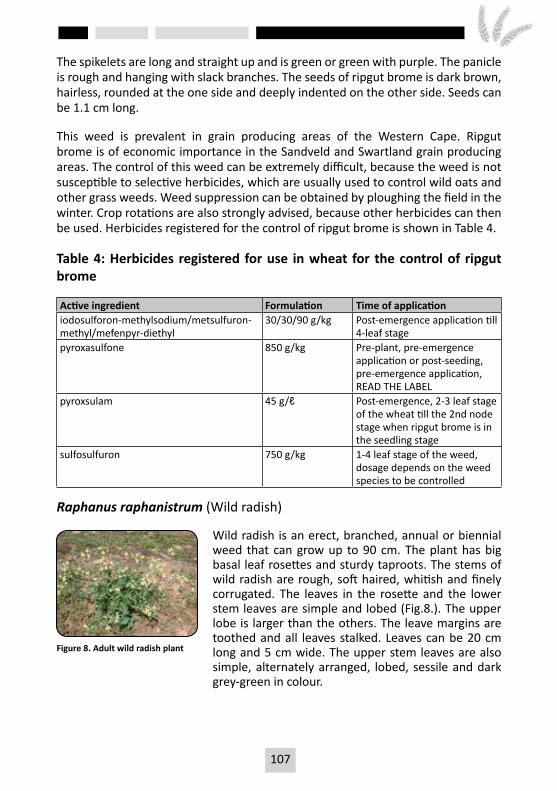
106 107
The spikelets are long and straight up and is green or green with purple. The panicle is rough and hanging with slack branches. The seeds of ripgut brome is dark brown, hairless, rounded at the one side and deeply indented on the other side. Seeds can be 1.1 cm long.
This weed is prevalent in grain producing areas of the Western Cape. Ripgut brome is of economic importance in the Sandveld and Swartland grain producing areas. The control of this weed can be extremely difficult, because the weed is not susceptible to selective herbicides, which are usually used to control wild oats and other grass weeds. Weed suppression can be obtained by ploughing the field in the winter. Crop rotations are also strongly advised, because other herbicides can then be used. Herbicides registered for the control of ripgut brome is shown in Table 4.
Table 4: Herbicides registered for use in wheat for the control of ripgut brome
Active ingredient Formulation Time of applicationiodosulforon-methylsodium/metsulfuron-methyl/mefenpyr-diethyl
30/30/90 g/kg Post-emergence application till 4-leaf stage
pyroxasulfone 850 g/kg Pre-plant, pre-emergence application or post-seeding, pre-emergence application, READ THE LABEL
pyroxsulam 45 g/ℓ Post-emergence, 2-3 leaf stage of the wheat till the 2nd node stage when ripgut brome is in the seedling stage
sulfosulfuron 750 g/kg 1-4 leaf stage of the weed, dosage depends on the weed species to be controlled
Raphanus raphanistrum (Wild radish)
Wild radish is an erect, branched, annual or biennial weed that can grow up to 90 cm. The plant has big basal leaf rosettes and sturdy taproots. The stems of wild radish are rough, soft haired, whitish and finely corrugated. The leaves in the rosette and the lower stem leaves are simple and lobed (Fig.8.). The upper lobe is larger than the others. The leave margins are toothed and all leaves stalked. Leaves can be 20 cm long and 5 cm wide. The upper stem leaves are also simple, alternately arranged, lobed, sessile and dark grey-green in colour.
Figure 8. Adult wild radish plant
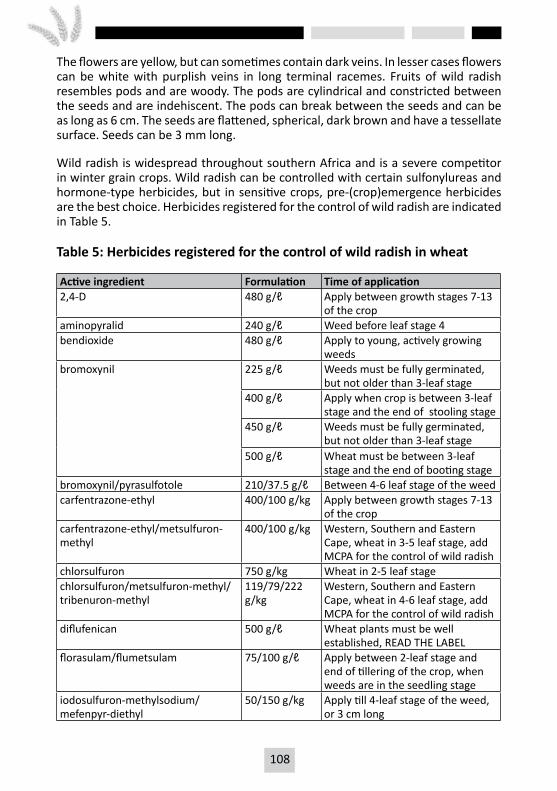
108 109
The flowers are yellow, but can sometimes contain dark veins. In lesser cases flowers can be white with purplish veins in long terminal racemes. Fruits of wild radish resembles pods and are woody. The pods are cylindrical and constricted between the seeds and are indehiscent. The pods can break between the seeds and can be as long as 6 cm. The seeds are flattened, spherical, dark brown and have a tessellate surface. Seeds can be 3 mm long.
Wild radish is widespread throughout southern Africa and is a severe competitor in winter grain crops. Wild radish can be controlled with certain sulfonylureas and hormone-type herbicides, but in sensitive crops, pre-(crop)emergence herbicides are the best choice. Herbicides registered for the control of wild radish are indicated in Table 5.
Table 5: Herbicides registered for the control of wild radish in wheat
Active ingredient Formulation Time of application2,4-D 480 g/ℓ Apply between growth stages 7-13
of the cropaminopyralid 240 g/ℓ Weed before leaf stage 4bendioxide 480 g/ℓ Apply to young, actively growing
weedsbromoxynil 225 g/ℓ Weeds must be fully germinated,
but not older than 3-leaf stage400 g/ℓ Apply when crop is between 3-leaf
stage and the end of stooling stage450 g/ℓ Weeds must be fully germinated,
but not older than 3-leaf stage500 g/ℓ Wheat must be between 3-leaf
stage and the end of booting stagebromoxynil/pyrasulfotole 210/37.5 g/ℓ Between 4-6 leaf stage of the weedcarfentrazone-ethyl 400/100 g/kg Apply between growth stages 7-13
of the cropcarfentrazone-ethyl/metsulfuron-methyl
400/100 g/kg Western, Southern and Eastern Cape, wheat in 3-5 leaf stage, add MCPA for the control of wild radish
chlorsulfuron 750 g/kg Wheat in 2-5 leaf stagechlorsulfuron/metsulfuron-methyl/tribenuron-methyl
119/79/222 g/kg
Western, Southern and Eastern Cape, wheat in 4-6 leaf stage, add MCPA for the control of wild radish
diflufenican 500 g/ℓ Wheat plants must be well established, READ THE LABEL
florasulam/flumetsulam 75/100 g/ℓ Apply between 2-leaf stage and end of tillering of the crop, when weeds are in the seedling stage
iodosulfuron-methylsodium/mefenpyr-diethyl
50/150 g/kg Apply till 4-leaf stage of the weed, or 3 cm long
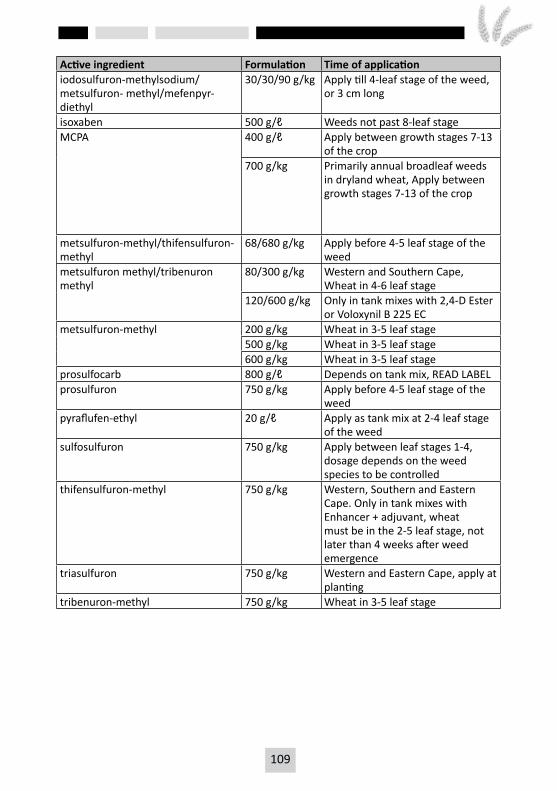
108 109
Active ingredient Formulation Time of applicationiodosulfuron-methylsodium/metsulfuron- methyl/mefenpyr-diethyl
30/30/90 g/kg Apply till 4-leaf stage of the weed, or 3 cm long
isoxaben 500 g/ℓ Weeds not past 8-leaf stageMCPA 400 g/ℓ Apply between growth stages 7-13
of the crop700 g/kg Primarily annual broadleaf weeds
in dryland wheat, Apply between growth stages 7-13 of the crop
metsulfuron-methyl/thifensulfuron-methyl
68/680 g/kg Apply before 4-5 leaf stage of the weed
metsulfuron methyl/tribenuron methyl
80/300 g/kg Western and Southern Cape, Wheat in 4-6 leaf stage
120/600 g/kg Only in tank mixes with 2,4-D Ester or Voloxynil B 225 EC
metsulfuron-methyl 200 g/kg Wheat in 3-5 leaf stage500 g/kg Wheat in 3-5 leaf stage600 g/kg Wheat in 3-5 leaf stage
prosulfocarb 800 g/ℓ Depends on tank mix, READ LABELprosulfuron 750 g/kg Apply before 4-5 leaf stage of the
weedpyraflufen-ethyl 20 g/ℓ Apply as tank mix at 2-4 leaf stage
of the weedsulfosulfuron 750 g/kg Apply between leaf stages 1-4,
dosage depends on the weed species to be controlled
thifensulfuron-methyl 750 g/kg Western, Southern and Eastern Cape. Only in tank mixes with Enhancer + adjuvant, wheat must be in the 2-5 leaf stage, not later than 4 weeks after weed emergence
triasulfuron 750 g/kg Western and Eastern Cape, apply at planting
tribenuron-methyl 750 g/kg Wheat in 3-5 leaf stage
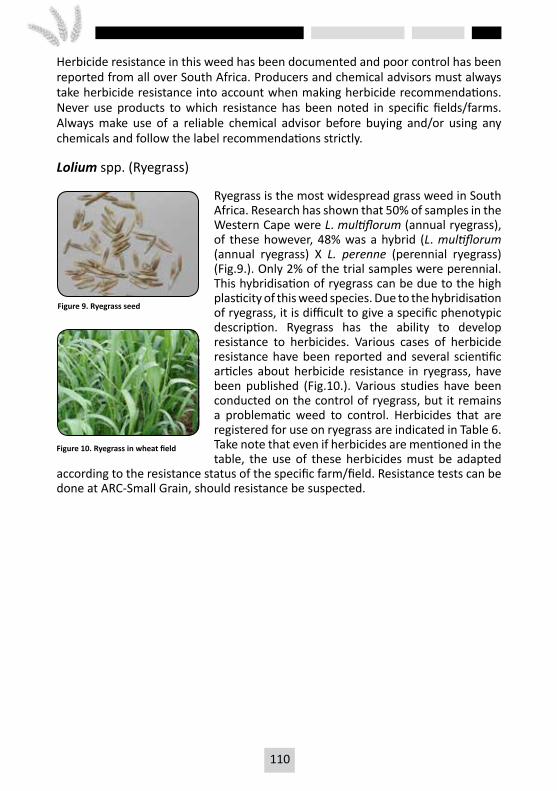
110 111
Herbicide resistance in this weed has been documented and poor control has been reported from all over South Africa. Producers and chemical advisors must always take herbicide resistance into account when making herbicide recommendations. Never use products to which resistance has been noted in specific fields/farms. Always make use of a reliable chemical advisor before buying and/or using any chemicals and follow the label recommendations strictly.
Lolium spp. (Ryegrass)
Ryegrass is the most widespread grass weed in South Africa. Research has shown that 50% of samples in the Western Cape were L. multiflorum (annual ryegrass), of these however, 48% was a hybrid (L. multiflorum (annual ryegrass) X L. perenne (perennial ryegrass) (Fig.9.). Only 2% of the trial samples were perennial.This hybridisation of ryegrass can be due to the high plasticity of this weed species. Due to the hybridisation of ryegrass, it is difficult to give a specific phenotypic description. Ryegrass has the ability to develop resistance to herbicides. Various cases of herbicide resistance have been reported and several scientific articles about herbicide resistance in ryegrass, have been published (Fig.10.). Various studies have been conducted on the control of ryegrass, but it remains a problematic weed to control. Herbicides that are registered for use on ryegrass are indicated in Table 6. Take note that even if herbicides are mentioned in the table, the use of these herbicides must be adapted
according to the resistance status of the specific farm/field. Resistance tests can be done at ARC-Small Grain, should resistance be suspected.
Figure 9. Ryegrass seed
Figure 10. Ryegrass in wheat field
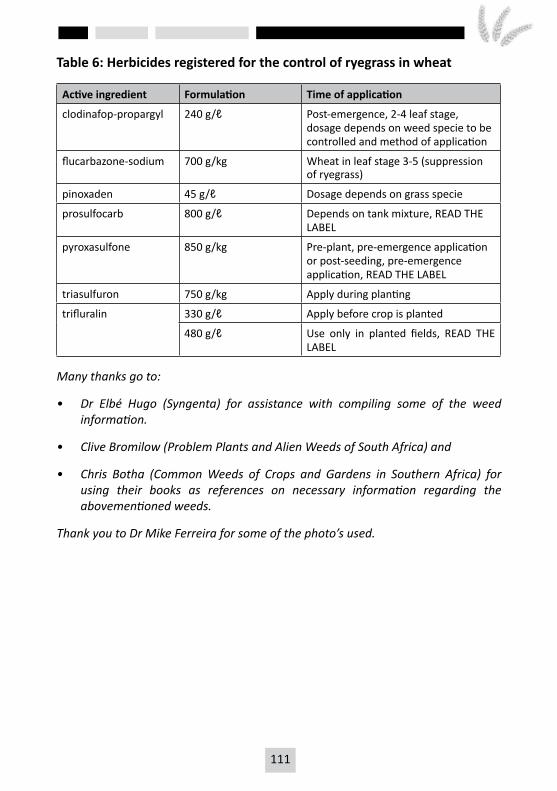
110 111
Table 6: Herbicides registered for the control of ryegrass in wheat
Active ingredient Formulation Time of application
clodinafop-propargyl 240 g/ℓ Post-emergence, 2-4 leaf stage, dosage depends on weed specie to be controlled and method of application
flucarbazone-sodium 700 g/kg Wheat in leaf stage 3-5 (suppression of ryegrass)
pinoxaden 45 g/ℓ Dosage depends on grass specie
prosulfocarb 800 g/ℓ Depends on tank mixture, READ THE LABEL
pyroxasulfone 850 g/kg Pre-plant, pre-emergence application or post-seeding, pre-emergence application, READ THE LABEL
triasulfuron 750 g/kg Apply during planting
trifluralin 330 g/ℓ Apply before crop is planted
480 g/ℓ Use only in planted fields, READ THE LABEL
Many thanks go to:
• Dr Elbé Hugo (Syngenta) for assistance with compiling some of the weed information.
• Clive Bromilow (Problem Plants and Alien Weeds of South Africa) and
• Chris Botha (Common Weeds of Crops and Gardens in Southern Africa) for using their books as references on necessary information regarding the abovementioned weeds.
Thank you to Dr Mike Ferreira for some of the photo’s used.
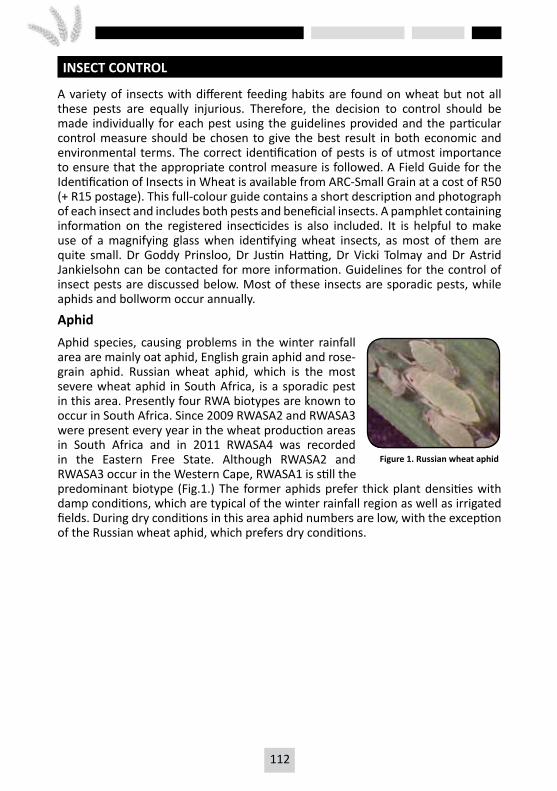
112 113
INSECT CONTROL
A variety of insects with different feeding habits are found on wheat but not all these pests are equally injurious. Therefore, the decision to control should be made individually for each pest using the guidelines provided and the particular control measure should be chosen to give the best result in both economic and environmental terms. The correct identification of pests is of utmost importance to ensure that the appropriate control measure is followed. A Field Guide for the Identification of Insects in Wheat is available from ARC-Small Grain at a cost of R50 (+ R15 postage). This full-colour guide contains a short description and photograph of each insect and includes both pests and beneficial insects. A pamphlet containing information on the registered insecticides is also included. It is helpful to make use of a magnifying glass when identifying wheat insects, as most of them are quite small. Dr Goddy Prinsloo, Dr Justin Hatting, Dr Vicki Tolmay and Dr Astrid Jankielsohn can be contacted for more information. Guidelines for the control of insect pests are discussed below. Most of these insects are sporadic pests, while aphids and bollworm occur annually.
AphidAphid species, causing problems in the winter rainfall area are mainly oat aphid, English grain aphid and rose-grain aphid. Russian wheat aphid, which is the most severe wheat aphid in South Africa, is a sporadic pest in this area. Presently four RWA biotypes are known to occur in South Africa. Since 2009 RWASA2 and RWASA3 were present every year in the wheat production areas in South Africa and in 2011 RWASA4 was recorded in the Eastern Free State. Although RWASA2 and RWASA3 occur in the Western Cape, RWASA1 is still the predominant biotype (Fig.1.) The former aphids prefer thick plant densities with damp conditions, which are typical of the winter rainfall region as well as irrigated fields. During dry conditions in this area aphid numbers are low, with the exception of the Russian wheat aphid, which prefers dry conditions.
Figure 1. Russian wheat aphid
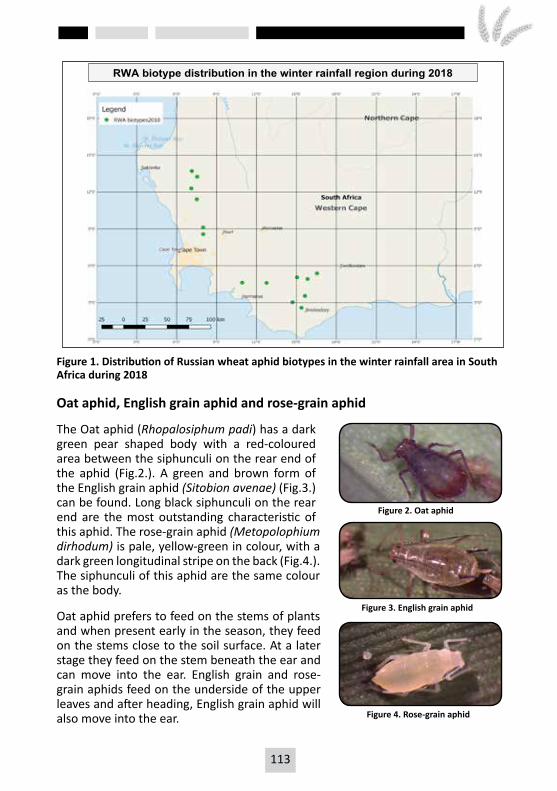
112 113
RWA biotype distribution in the winter rainfall region during 2018
Figure 1. Distribution of Russian wheat aphid biotypes in the winter rainfall area in South Africa during 2018
Oat aphid, English grain aphid and rose-grain aphid
The Oat aphid (Rhopalosiphum padi) has a dark green pear shaped body with a red-coloured area between the siphunculi on the rear end of the aphid (Fig.2.). A green and brown form of the English grain aphid (Sitobion avenae) (Fig.3.) can be found. Long black siphunculi on the rear end are the most outstanding characteristic of this aphid. The rose-grain aphid (Metopolophium dirhodum) is pale, yellow-green in colour, with a dark green longitudinal stripe on the back (Fig.4.). The siphunculi of this aphid are the same colour as the body.
Oat aphid prefers to feed on the stems of plants and when present early in the season, they feed on the stems close to the soil surface. At a later stage they feed on the stem beneath the ear and can move into the ear. English grain and rose-grain aphids feed on the underside of the upper leaves and after heading, English grain aphid will also move into the ear.
Figure 2. Oat aphid
Figure 4. Rose-grain aphid
Figure 3. English grain aphid
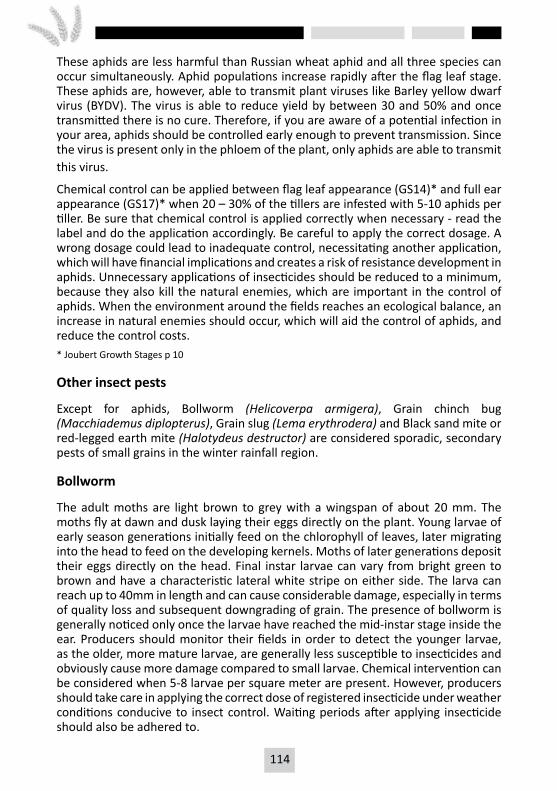
114 115
These aphids are less harmful than Russian wheat aphid and all three species can occur simultaneously. Aphid populations increase rapidly after the flag leaf stage. These aphids are, however, able to transmit plant viruses like Barley yellow dwarf virus (BYDV). The virus is able to reduce yield by between 30 and 50% and once transmitted there is no cure. Therefore, if you are aware of a potential infection in your area, aphids should be controlled early enough to prevent transmission. Since the virus is present only in the phloem of the plant, only aphids are able to transmit this virus.
Chemical control can be applied between flag leaf appearance (GS14)* and full ear appearance (GS17)* when 20 – 30% of the tillers are infested with 5-10 aphids per tiller. Be sure that chemical control is applied correctly when necessary - read the label and do the application accordingly. Be careful to apply the correct dosage. A wrong dosage could lead to inadequate control, necessitating another application, which will have financial implications and creates a risk of resistance development in aphids. Unnecessary applications of insecticides should be reduced to a minimum, because they also kill the natural enemies, which are important in the control of aphids. When the environment around the fields reaches an ecological balance, an increase in natural enemies should occur, which will aid the control of aphids, and reduce the control costs.* Joubert Growth Stages p 10
Other insect pests
Except for aphids, Bollworm (Helicoverpa armigera), Grain chinch bug (Macchiademus diplopterus), Grain slug (Lema erythrodera) and Black sand mite or red-legged earth mite (Halotydeus destructor) are considered sporadic, secondary pests of small grains in the winter rainfall region.
Bollworm
The adult moths are light brown to grey with a wingspan of about 20 mm. The moths fly at dawn and dusk laying their eggs directly on the plant. Young larvae of early season generations initially feed on the chlorophyll of leaves, later migrating into the head to feed on the developing kernels. Moths of later generations deposit their eggs directly on the head. Final instar larvae can vary from bright green to brown and have a characteristic lateral white stripe on either side. The larva can reach up to 40mm in length and can cause considerable damage, especially in terms of quality loss and subsequent downgrading of grain. The presence of bollworm is generally noticed only once the larvae have reached the mid-instar stage inside the ear. Producers should monitor their fields in order to detect the younger larvae, as the older, more mature larvae, are generally less susceptible to insecticides and obviously cause more damage compared to small larvae. Chemical intervention can be considered when 5-8 larvae per square meter are present. However, producers should take care in applying the correct dose of registered insecticide under weather conditions conducive to insect control. Waiting periods after applying insecticide should also be adhered to.
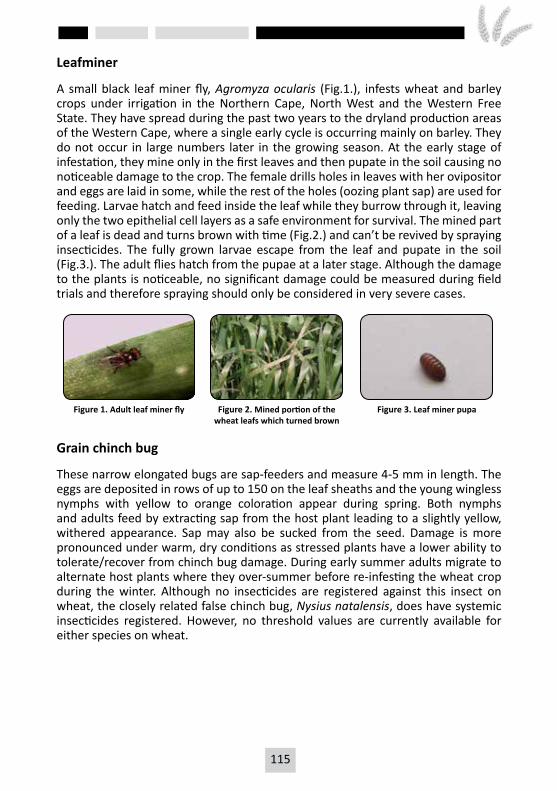
114 115
Leafminer
A small black leaf miner fly, Agromyza ocularis (Fig.1.), infests wheat and barley crops under irrigation in the Northern Cape, North West and the Western Free State. They have spread during the past two years to the dryland production areas of the Western Cape, where a single early cycle is occurring mainly on barley. They do not occur in large numbers later in the growing season. At the early stage of infestation, they mine only in the first leaves and then pupate in the soil causing no noticeable damage to the crop. The female drills holes in leaves with her ovipositor and eggs are laid in some, while the rest of the holes (oozing plant sap) are used for feeding. Larvae hatch and feed inside the leaf while they burrow through it, leaving only the two epithelial cell layers as a safe environment for survival. The mined part of a leaf is dead and turns brown with time (Fig.2.) and can’t be revived by spraying insecticides. The fully grown larvae escape from the leaf and pupate in the soil (Fig.3.). The adult flies hatch from the pupae at a later stage. Although the damage to the plants is noticeable, no significant damage could be measured during field trials and therefore spraying should only be considered in very severe cases.
Figure 1. Adult leaf miner fly Figure 2. Mined portion of the wheat leafs which turned brown
Figure 3. Leaf miner pupa
Grain chinch bug
These narrow elongated bugs are sap-feeders and measure 4-5 mm in length. The eggs are deposited in rows of up to 150 on the leaf sheaths and the young wingless nymphs with yellow to orange coloration appear during spring. Both nymphs and adults feed by extracting sap from the host plant leading to a slightly yellow, withered appearance. Sap may also be sucked from the seed. Damage is more pronounced under warm, dry conditions as stressed plants have a lower ability to tolerate/recover from chinch bug damage. During early summer adults migrate to alternate host plants where they over-summer before re-infesting the wheat crop during the winter. Although no insecticides are registered against this insect on wheat, the closely related false chinch bug, Nysius natalensis, does have systemic insecticides registered. However, no threshold values are currently available for either species on wheat.
116 117
Grain slug
Although the name implies otherwise, this is not a slug but the larva of a metallic green beetle. The adult measures about 5 mm in length and occurs on cereals from June onwards. Eggs are deposited in groups of 2-5 in rows along the main vein of the leaf. The larvae are pale, but soon cover their bodies with a blackish substance giving them a slug-like appearance. The larvae feed between the veins resulting in white longitudinal stripes developing on damaged leaves. Currently, no insecticides are registered for the control of grain slug on wheat.
Black sand mite or red-legged earth mite
These are small black mites, 0.5 mm in length with red legs, first appearing after good autumn or winter rains. The mites feed on plant sap, resulting in silvery white scars adjacent to the main vein of especially older leaves. High infestations could lead to dying off of small plants. The mites over-summer in eggs retained by the female inside her body until after her death. A single systemic insecticide is registered, although no threshold value is available.
116 117
DISEASES OF SMALL GRAINS
Diseases of small grains affect small grain production by reducing yield and impairing quality. To maximise profits, producers need to understand the influences that diseases have on crop potential. The purpose of this section is to assist with the identification of small grain diseases most commonly found in the winter rainfall areas of small grain production. The information contained here is intended to increase the producer’s knowledge of small grain diseases and so indirectly assist with the control of the plant diseases that they may encounter.
A single fungal pathogen may infect a range of small grains, while other small grain pathogens may be confined only to infecting a specific host. Additionally, cultivars may vary in their susceptibility to different diseases. In this section, the most important diseases of small grains in the winter rainfall areas are discussed. After the scientific name of a certain disease, the hosts that are attacked by the specific disease are listed. Advice is given on means of control. In the case of chemical control, the active ingredients registered in South Africa against the disease are listed in Tables 4 to 6.
Leaf and stem diseases
Rusts
Rust variability
All three types of rusts (stem rust, stripe rust and leaf rust) (Fig. 3 - 9) can be effectively controlled using resistant cultivars. However, fungi that cause wheat rusts are variable, consisting of several strains (races) which differ in their virulence to different wheat cultivars. New virulent races emerge mostly through mutation of local races and/or through introduction from other countries. Such new races can overcome resistance in existing cultivars, thereby making them susceptible to rusts.
There is sufficient evidence in South Africa and other countries, which indicates that new rust races may result in epidemics and significant yield losses. The complex biology of rusts causes their frequency and distribution to vary from season to season and between different wheat growing regions (Fig. 1 and 2). For instance, Fig. 1 shows that TTKSF is the most widely found stem rust race in South Africa, being observed in all the major wheat growing regions. In contrast, race TTKSP is found only in the Western Cape and race PTKST only in the Free State and KwaZulu-Natal.
Similar to stem rust, differential distribution of leaf rust races has been observed in South Africa (Fig. 2). For example, race CBMS has been detected only in the Western Cape and Eastern Cape but race MCDS has been found in the Free State, Eastern Cape and KwaZulu-Natal. In addition, most of the leaf rust races shown in Fig. 2 were new, being detected for the first time in South Africa during 2009 and later, indicating that the identity of rust races observed in different wheat growing regions could change in time.
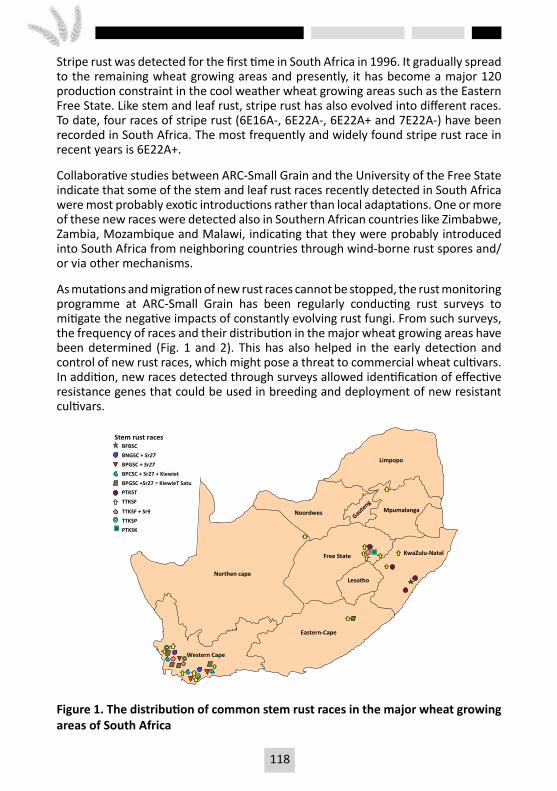
118 119
Stripe rust was detected for the first time in South Africa in 1996. It gradually spread to the remaining wheat growing areas and presently, it has become a major 120 production constraint in the cool weather wheat growing areas such as the Eastern Free State. Like stem and leaf rust, stripe rust has also evolved into different races. To date, four races of stripe rust (6E16A-, 6E22A-, 6E22A+ and 7E22A-) have been recorded in South Africa. The most frequently and widely found stripe rust race in recent years is 6E22A+.
Collaborative studies between ARC-Small Grain and the University of the Free State indicate that some of the stem and leaf rust races recently detected in South Africa were most probably exotic introductions rather than local adaptations. One or more of these new races were detected also in Southern African countries like Zimbabwe, Zambia, Mozambique and Malawi, indicating that they were probably introduced into South Africa from neighboring countries through wind-borne rust spores and/ or via other mechanisms.
As mutations and migration of new rust races cannot be stopped, the rust monitoring programme at ARC-Small Grain has been regularly conducting rust surveys to mitigate the negative impacts of constantly evolving rust fungi. From such surveys, the frequency of races and their distribution in the major wheat growing areas have been determined (Fig. 1 and 2). This has also helped in the early detection and control of new rust races, which might pose a threat to commercial wheat cultivars. In addition, new races detected through surveys allowed identification of effective resistance genes that could be used in breeding and deployment of new resistant cultivars.
Northencape
WesternCape
Eastern-Cape
Noordwes
FreeState
Lesotho
KwaZulu-Natal
Limpopo
Mpumalanga
BFBSCBNGSC+Sr27BPGSC+Sr27BPCSC+Sr27+KiewietBPGSC+Sr27=KiewieTSatuPTKSTTTKSF
TTKSF+Sr9TTKSPPTKSK
Stemrustraces
Figure 1. The distribution of common stem rust races in the major wheat growing areas of South Africa
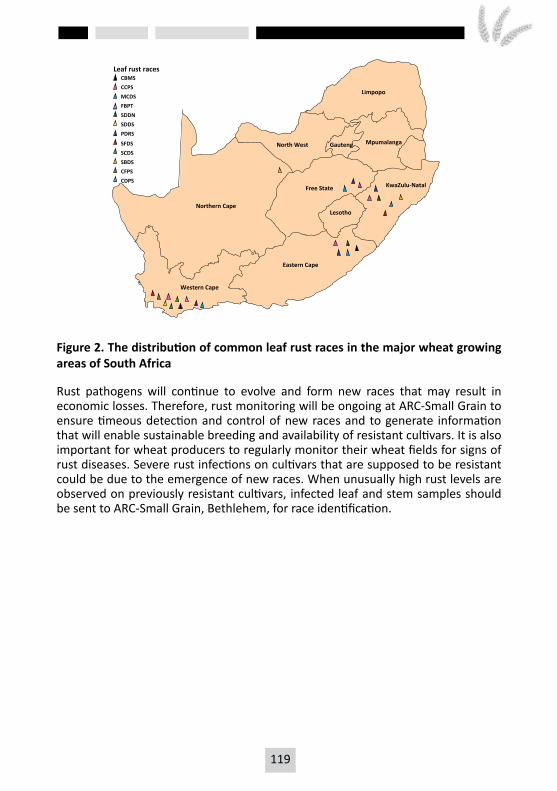
118 119
NorthernCape
WesternCape
EasternCape
NorthWest
FreeState
Lesotho
KwaZulu-Natal
Gauteng
Limpopo
Mpumalanga
CBMSCCPSMCDSFBPTSDDNSDDSPDRS
SFDSSCDSSBDSCFPSCDPS
Leafrustraces
Figure 2. The distribution of common leaf rust races in the major wheat growing areas of South Africa
Rust pathogens will continue to evolve and form new races that may result in economic losses. Therefore, rust monitoring will be ongoing at ARC-Small Grain to ensure timeous detection and control of new races and to generate information that will enable sustainable breeding and availability of resistant cultivars. It is also important for wheat producers to regularly monitor their wheat fields for signs of rust diseases. Severe rust infections on cultivars that are supposed to be resistant could be due to the emergence of new races. When unusually high rust levels are observed on previously resistant cultivars, infected leaf and stem samples should be sent to ARC-Small Grain, Bethlehem, for race identification.
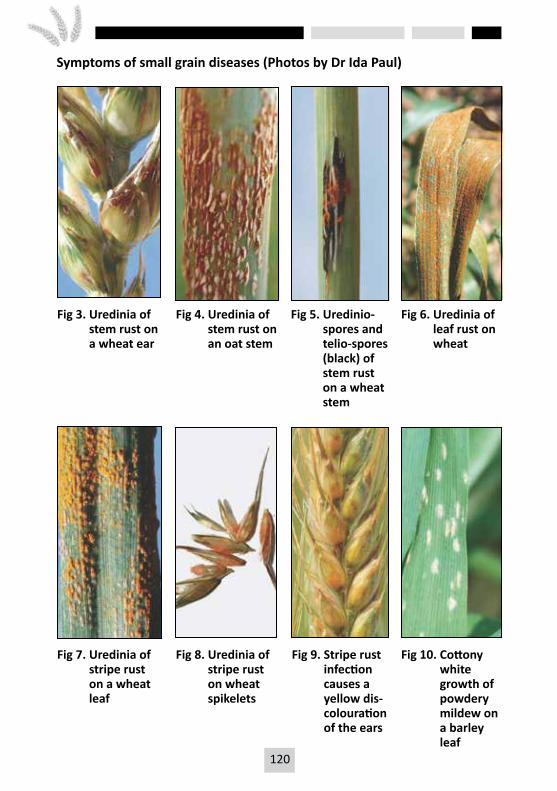
120 121
Symptoms of small grain diseases (Photos by Dr Ida Paul)
Fig 9. Stripe rust infection causes a yellow dis-colouration of the ears
Fig 3. Uredinia of stem rust on a wheat ear
Fig 4. Uredinia of stem rust on an oat stem
Fig 5. Uredinio- spores and telio-spores (black) of stem rust on a wheat stem
Fig 6. Uredinia of leaf rust on wheat
Fig 7. Uredinia of stripe rust on a wheat leaf
Fig 8. Uredinia of stripe rust on wheat spikelets
Fig 10. Cottony white growth of powdery mildew on a barley leaf
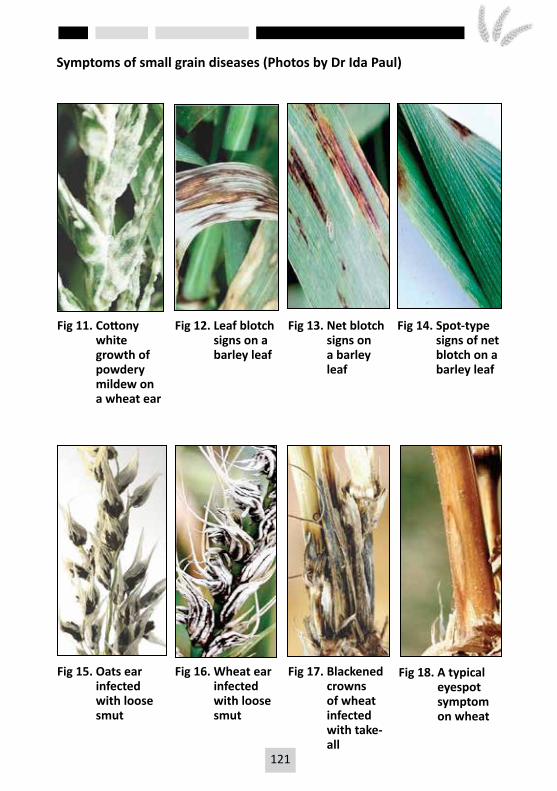
120 121
Symptoms of small grain diseases (Photos by Dr Ida Paul)
Fig 18. A typical eyespot symptom on wheat
Fig 11. Cottony white growth of powdery mildew on a wheat ear
Fig 12. Leaf blotch signs on a barley leaf
Fig 13. Net blotch signs on a barley leaf
Fig 14. Spot-type signs of net blotch on a barley leaf
Fig 15. Oats ear infected with loose smut
Fig 16. Wheat ear infected with loose smut
Fig 17. Blackened crowns of wheat infected with take-all
122 123
Mildew
Powdery mildew
Erysiphe [Blumeria] graminis f. sp. tritici – wheatErysiphe [Blumeria] graminis f. sp. hordei – barleyErysiphe [Blumeria] graminis f. sp. avenae – oatsErysiphe [Blumeria] graminis f. sp. secalis – rye
Powdery mildew (Fig. 10 and 11) is a very common disease of cereals worldwide. Symptoms are most often seen on leaves and include fluffy white pustules that become grey as they age. As the infection progresses the white fungal growth can cover the whole plant. These pustules can be scraped off the surface of the plant, as the infections are very superficial. Later in the season, black dots may be found embedded in the white pustules. These dots are the fruiting bodies of the mildew causing fungus. The fungus survives non-crop seasons as dormant mycelium or as fruiting bodies on host debris or volunteer crops. Conidiospores formed on volunteer plants form a major source of inoculum. The disease is more prevalent in densely planted fields that are over fertilised. In the United Kingdom, up to 25% loss in yield has been recorded, however yield losses in South Africa have not been measured. Small grain producers should take note that powdery mildew can cause losses if not controlled. The foliar application of fungicides is a reliable method of controlling the disease and it is widely practiced.
Spots and blotches
Scald or Leaf Blotch
Rhynchosporium secalis - barley, rye
Scald is mainly a disease of barley (Fig. 12) but can also occur on rye. It is common in the cooler areas of barley production. Symptoms include pale grey patches on the leaf surfaces that enlarge within a few days. These patches then take on a brown colour and a dark brown edge develops around the lesions. Eventually, the symptoms may cover the whole leaf and as a result, the leaf dies. Scald may lead to great yield losses. The initial source of inoculum often comes from small grain cereal debris, on which the fungus sporulates and the spores are disseminated to infect barley plants. However, the pathogen can also survive the non-crop season on volunteer plants. This disease is seed borne and planting disease free seed will suppress the disease to a certain extent. Removal of volunteer plants and barley residues that may harbour the pathogen is an important measure of controlling the disease. The correct application of foliar fungicides can also greatly reduce the levels of scald infection.
122 123
Net blotch
Pyrenophora teres – barley
Net blotch (Fig. 13 and 14) only occurs on barley and it does not infect other small grain cereals. In South Africa, net blotch mainly occurs in the dry land barley cultivation areas of the Western Cape. The occurrence of the disease is strongly related to environmental conditions. The disease expresses two kinds of symptoms. The net form symptoms are dark brown streaks across the length of the leaf with a net-like appearance, while the spot type symptoms are brown to black elliptical lesions. Both the symptom types may be surrounded by dead tissue that is also known as necrotic tissue. Either one of these symptoms or both may appear on the barley leaves. The main source of inoculum is infected stubble, but seed can also be infected with net blotch. Ascospores (sexual spores) from the fruiting bodies on infected residue may cause primary infections, but conidiospores (asexual spores) that form on the infected leaves are mostly responsible for the initiation and spread of the disease. High infections of net blotch can cause significant losses in yield, of up to 30%, and reduce the quality of the barley. The disease is controlled by planting high quality, disease free seed, disposing of volunteer plants and crop residue that serve as a source of inoculum and by the use of seed treatments and foliar fungicide applications. Although resistant cultivars may also be planted as a measure of control, such cultivars are not available in South Africa.
Septoria diseases
Several species of Septoria are pathogens of small grains. In many wheat growing areas, these diseases are of significant economic importance. Septoria diseases occur more frequently in areas where crops are planted densely and receive great amounts of fertiliser. Different Septoria diseases may occur in combinations within fields and on individual plants. The diseases are difficult to differentiate from each other without careful microscopic examination of the fruiting bodies and spore morphologies. The Septoria complex is believed to destroy two percent of the world’s wheat annually. It reduces seed set, impairs seed filling and shriveled grain is lost with the chaff at harvest time. Greatest losses are incurred when significant disease infections occur before heading. The pathogens are weakly virulent on barley, rye, triticale and other wild grasses, but lesions are small and sporulation of the fungi are restricted.
Septoria leaf and glume blotch Septoria tritici - wheat, triticale
Septoria leaf blotch is a common disease of especially wheat in areas where wet and windy conditions prevail during the growing season. It occurs frequently in the wheat production areas of the Western Cape. Two different pathogenic organisms can cause Septoria leaf blotch and the symptoms vary slightly. When the plant is infected by Septoria tritici, leaf lesions first appear as small brown spots, which develop in a longitudinal direction along with the veins of the leaf and later form elongated ovals. These lesions develop grey water soaked areas in the centre in
124 125
which black pycnidia, the fruiting bodies of the fungus, are formed. Lesions may merge gradually as the season progresses and can affect the majority of the leaf area and cause severe necrosis.
Similarly, when the plant is infected with Stagonospora nodorum, oval lesions that coalesce to form larger areas of necrotic tissue form on the leaf. However, the distinctive black pycnidia, or fruiting bodies, that form on the inside of the lesion when it is infected with Septoria tritici cannot be seen and these lesions are often surrounded by a clearly visible yellow chlorotic halo. During prolonged wet weather, masses of pink spores are exuded by the pycnidia of Stagonospora nodorum. Septoria leaf blotch lesions first appear on the lower leaves and dependent on favourable environmental conditions, spread to the upper leaves. These pathogens survive the non-crop season on cereal stubble and debris and on volunteer plants.
Septoria leaf blotch can lead to devastating crop losses. As the crop matures the Stagonospora nodorum pathogen becomes more aggressive and nodes and glumes are infected. [Stagonospora nodorum (previously known as Septoria nodorum)] only infects the leaves of rye plants, and not the heads. The glume blotch infection starts at the tips of the glumes and lemas as grey discolouration across the glume with a brown lower border. The disease develops in a downward direction and the lower brown border is replaced by grey discolouration. Pycnidia, the fruiting bodies of the fungus, can form within these lesions. An important measure for control of the disease is crop rotation with broad leaf non-host plants and disposal of contaminated crop debris. Genetic resistance is an important measure for control of the disease, although several of the cultivars planted in the Western Cape are susceptible to Septoria leaf blotch. The correct application of foliar fungicides to control the Septoria diseases can be highly effective.
Ear and grain diseases
Fusarium head blight (Gert van Coller Dept. of Agriculture, Elsenburg) Fusarium graminearum (previously known as F. graminearum Group 2) - wheat, barley, triticale, oats
Fusarium head blight is one of the most important diseases of wheat, barley and triticale in most grain producing regions of the country. The disease is less important in the Western Cape, although it does occur there. It is especially important in regions where small grains are produced under irrigation. Infection of florets take place as a result of spore release and high humidity during flowering. The disease is characterised by the discolouration of infected florets about 2-3 weeks after flowering. The florets become light coloured and appear blighted. Under high disease pressure the whole wheat head may become infected. The symptoms become less visible as the heads ripen. Infected kernels become shrivelled and contain much less starch and proteins than uninfected kernels. Fusarium head blight can be distinguished from take-all (which also occurs under irrigation) where the entire tiller and head dies and whitens, as opposed to Fusarium head blight where the tiller still remains green and bands of blighted florets form on the wheat
124 125
heads. The fungus survives primarily on crop residues; therefore retention of stubble is needed for the fungus to survive. It is important to note that the fungus can also infect maize and production systems where barley and wheat are produced in rotation with maize, can lead to higher disease pressure in subsequent years. Chemical applications with fungicides can help to manage the disease; however, there are currently no fungicides registered against Fusarium head blight in South Africa. Research to evaluate different fungicides, as well as methods of application, is underway. Resistant cultivars are currently not available in South Africa.
Bunts and smuts
Smuts and bunts infect small grain cereals and several grass species. These fungi produce masses of black spores that partially or completely replace the heads, spikelets and kernels. In South Africa, these diseases are controlled by the routine application of seed treatments by seed distributing companies. Farmers who retain seed to plant must use seed dressings against bunts and smuts. Failure to treat seed, in order to save on input costs, leads to the increased incidence of these diseases.
Loose smut
Ustilago tritici – wheatUstilago nuda – barleyUstilago avenae – oats
Loose smut (Fig. 15 and 16) is a common small grain disease that occurs widely in areas where wheat, oats and barley are grown. Symptoms are not apparent until ear emergence. Infected ears emerge earlier, have a darker colour and are slightly longer than those of healthy plants. Infected spikelets are transformed into powdery masses of dark brown teliospores. Within a few days, the spores are blown away and only the rachis remains. When a spore lands on a flower of a small grain plant in the surrounding area, it germinates and infects the reproductive tissues of the grain so that the embryos of developing seeds are also infected. The fungus then survives as dormant hyphae in infected seed. Infected seeds are not visually different from healthy seed. After seed germination, the fungus forms a systemic infection in the plant and later, as the plant approaches heading, the fungus penetrates the head tissues and converts it to a brown powdery mass of teliospores. Yield losses are roughly equal to the percentage of infected ears. In contrast to stinking smut (Tilletia spp.), the quality of the harvested grain is not affected. In the Western Cape, this disease is effectively managed by the application of seed treatments (Table 6), although some seed treatments may impede seed germination. The use of high quality, disease free seed is also an effective way of controlling the disease, as the only source of inoculum is infected seed.
126 127
Covered smut
Ustilago hordei - barley, oats, rye
Covered smut is a common disease of mainly oats and barley, but it also infects rye and other wild grasses. Symptoms are not obvious until after ear emergence. Smutted heads emerge later than healthy heads and may become trapped in the flag leaf sheath and fail to emerge. With severe infections, plants become dwarfed. Parts of the infected ear or the whole ear are transformed into powdery masses of dark brown spores, known as teliospores, which are covered by a persistent membrane. The covered smut fungus survives in soil and on the surface of seed. The fungus infects the germinating seed through the coleoptile. After seed germination, the fungus forms a systemic infection in the plant and later, as the plant approaches heading, the fungus penetrates the head tissues and converts it to the brown powdery masses of teliospores. The teliospores are generally released at harvest, when this membrane is disrupted. The dark powder from the teliospores discolours grain and affects grain quality and marketability. Covered smut is of economical importance in areas where seed treatments are not routinely used. Several systemic and protective seed treatments are registered for the control of covered smut in South Africa (Table 6).
Karnal Bunt
Tilletia indica - wheat, triticale
Historically, Karnal bunt did not occur in South Africa. It was identified for the first time in December 2000 from the Douglas irrigation area. Currently, measures are in place to restrict the spread of this disease throughout the country. These measures include testing of registered seed units and commercial grains for the presence of teliospores and quarantine regulations on the transport and entry of grains to mills and other delivery points. Since Karnal bunt is regarded as a quarantine disease according to South African regulations, all occurrences of this disease should be reported to the National Department of Agriculture (NDA).
Karnal bunt infected kernels appear blackened, eroded and emit a foul ‘fishy’ odour. In infected spikes, the glumes may also appear flared and expose bunted kernels. Spikes of infected plants are generally reduced in length and in number of spikelets. However, only a few florets per spike might be affected and it may be difficult to identify the disease in the field, as the whole ear does not necessarily become infested. Microscopic examination of the seed to detect the presence of the teliospores is a more reliable method of identification. The primary inoculum source is soil or seed contaminated with teliospores. These teliospores germinate and generate another kind of spore, known as basidiospores. One teliospore can produce up to 200 basidiospores that germinate and infect the head tissues of the plant. The infection is localised and not systemic as with loose smut and covered smut. Individual fungal cells within the kernel are converted to teliospores and parts of, or the whole of the diseased kernel is completely displaced by masses of
126 127
teliospores as the kernel matures. Karnal bunt is of economical importance mainly due to the reduction in flour quality of grain infected with the disease. The flour will have a disagreeable odour and depending on the percentage infection, be darkened by the teliospores. This disease does not lead to yield losses as such. Karnal bunt is difficult to control. A first measure of protecting plants is preventing the entry of the pathogen to a certain area. Therefore, it is of utmost importance to adhere to quarantine regulations and to plant seed that has been certified to be disease free. Some fungicides applied at ear emergence may reduce the incidence of the disease but it is unlikely that they will prevent infection.
Stem base and root diseases
Fusarium crown rot (Dr Sandra Lamprecht, ARC-Plant Protection)
Fusarium pseudograminearum (previously known as F. graminearum Group 1) – wheat, barley, triticale.
Fusarium crown rot is one of the most important soilborne diseases of wheat, barley and triticale in the Western Cape, but it is also present in other small grain producing areas in the country. The disease is especially important in areas where wheat is cultivated under dryland conditions. Oats is susceptible, but is a symptomless host. The disease is characterised by the honey-brown discolouration of the lower parts of the tillers and necroses of the crown tissue and subcrown internodes. A pink discolouration can sometimes be observed under the lower leaf sheaths. The most characteristic symptom is, however, the formation of white heads, but this depends on water stress during grain fill. The disease can be confused with take-all which also causes white heads. The fungus requires moisture for infection, but subsequent disease development is favoured by moisture stress. The fungus survives primarily on crop residues between host crops and the retention of stubble therefore favours its survival, especially where small grain crops are grown in monoculture. The disease is therefore favoured by conservation tillage which is increasingly adopted by small grain farmers. Fusarium crown rot can be reduced with an integrated disease management strategy which include practices such as crop rotation with non-host crops (broadleaf crops such as canola, lupin, medic, lucerne etc.), control of grass weeds (most grass weeds are hosts), alleviation of zinc deficiency and reduction of moisture stress by practices that conserve soil moisture such as conservation tillage. Research conducted in the Western Cape showed that rotation systems where wheat was planted after 3 years of broadleaf crops had the lowest incidence of this disease. Resistant cultivars are not available, but tolerant cultivars with partial resistance have been identified in other countries such as Australia. South African wheat and barley cultivars will be evaluated for resistance/tolerance in the near future.
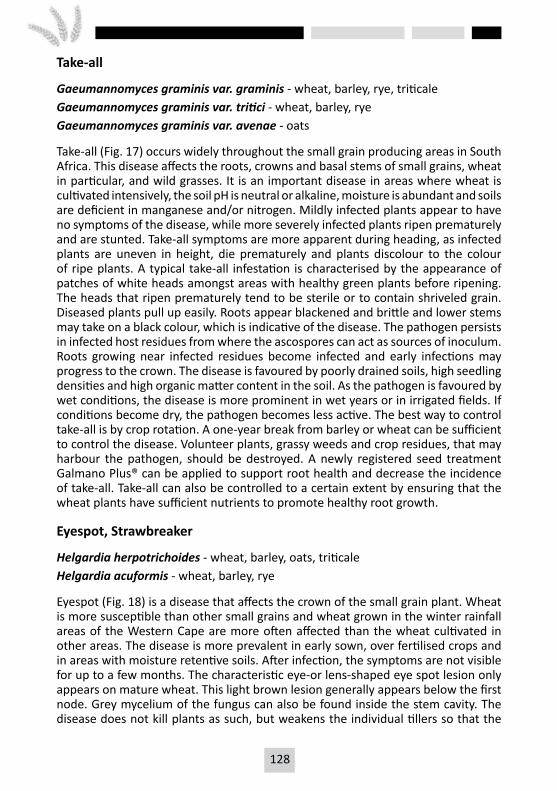
128 129
Take-all
Gaeumannomyces graminis var. graminis - wheat, barley, rye, triticaleGaeumannomyces graminis var. tritici - wheat, barley, ryeGaeumannomyces graminis var. avenae - oats
Take-all (Fig. 17) occurs widely throughout the small grain producing areas in South Africa. This disease affects the roots, crowns and basal stems of small grains, wheat in particular, and wild grasses. It is an important disease in areas where wheat is cultivated intensively, the soil pH is neutral or alkaline, moisture is abundant and soils are deficient in manganese and/or nitrogen. Mildly infected plants appear to have no symptoms of the disease, while more severely infected plants ripen prematurely and are stunted. Take-all symptoms are more apparent during heading, as infected plants are uneven in height, die prematurely and plants discolour to the colour of ripe plants. A typical take-all infestation is characterised by the appearance of patches of white heads amongst areas with healthy green plants before ripening. The heads that ripen prematurely tend to be sterile or to contain shriveled grain. Diseased plants pull up easily. Roots appear blackened and brittle and lower stems may take on a black colour, which is indicative of the disease. The pathogen persists in infected host residues from where the ascospores can act as sources of inoculum. Roots growing near infected residues become infected and early infections may progress to the crown. The disease is favoured by poorly drained soils, high seedling densities and high organic matter content in the soil. As the pathogen is favoured by wet conditions, the disease is more prominent in wet years or in irrigated fields. If conditions become dry, the pathogen becomes less active. The best way to control take-all is by crop rotation. A one-year break from barley or wheat can be sufficient to control the disease. Volunteer plants, grassy weeds and crop residues, that may harbour the pathogen, should be destroyed. A newly registered seed treatment Galmano Plus® can be applied to support root health and decrease the incidence of take-all. Take-all can also be controlled to a certain extent by ensuring that the wheat plants have sufficient nutrients to promote healthy root growth.
Eyespot, Strawbreaker
Helgardia herpotrichoides - wheat, barley, oats, triticaleHelgardia acuformis - wheat, barley, rye
Eyespot (Fig. 18) is a disease that affects the crown of the small grain plant. Wheat is more susceptible than other small grains and wheat grown in the winter rainfall areas of the Western Cape are more often affected than the wheat cultivated in other areas. The disease is more prevalent in early sown, over fertilised crops and in areas with moisture retentive soils. After infection, the symptoms are not visible for up to a few months. The characteristic eye-or lens-shaped eye spot lesion only appears on mature wheat. This light brown lesion generally appears below the first node. Grey mycelium of the fungus can also be found inside the stem cavity. The disease does not kill plants as such, but weakens the individual tillers so that the
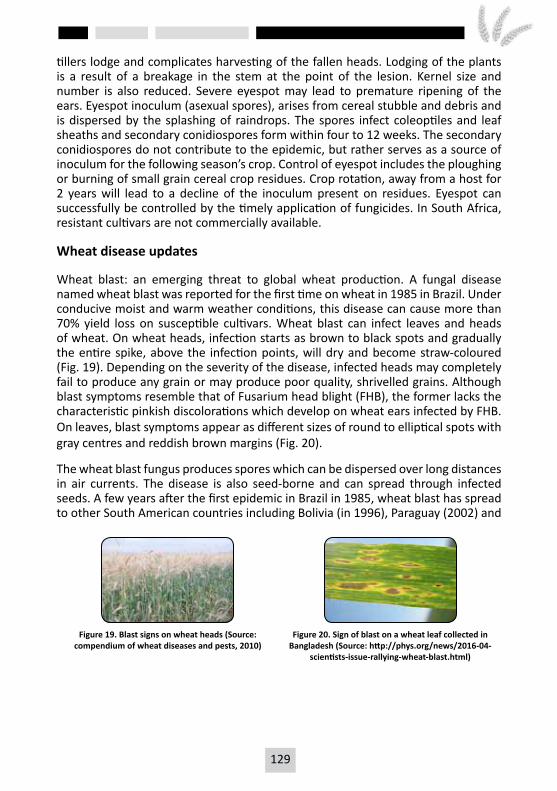
128 129
tillers lodge and complicates harvesting of the fallen heads. Lodging of the plants is a result of a breakage in the stem at the point of the lesion. Kernel size and number is also reduced. Severe eyespot may lead to premature ripening of the ears. Eyespot inoculum (asexual spores), arises from cereal stubble and debris and is dispersed by the splashing of raindrops. The spores infect coleoptiles and leaf sheaths and secondary conidiospores form within four to 12 weeks. The secondary conidiospores do not contribute to the epidemic, but rather serves as a source of inoculum for the following season’s crop. Control of eyespot includes the ploughing or burning of small grain cereal crop residues. Crop rotation, away from a host for 2 years will lead to a decline of the inoculum present on residues. Eyespot can successfully be controlled by the timely application of fungicides. In South Africa, resistant cultivars are not commercially available.
Wheat disease updates
Wheat blast: an emerging threat to global wheat production. A fungal disease named wheat blast was reported for the first time on wheat in 1985 in Brazil. Under conducive moist and warm weather conditions, this disease can cause more than 70% yield loss on susceptible cultivars. Wheat blast can infect leaves and heads of wheat. On wheat heads, infection starts as brown to black spots and gradually the entire spike, above the infection points, will dry and become straw-coloured (Fig. 19). Depending on the severity of the disease, infected heads may completely fail to produce any grain or may produce poor quality, shrivelled grains. Although blast symptoms resemble that of Fusarium head blight (FHB), the former lacks the characteristic pinkish discolorations which develop on wheat ears infected by FHB. On leaves, blast symptoms appear as different sizes of round to elliptical spots with gray centres and reddish brown margins (Fig. 20).
The wheat blast fungus produces spores which can be dispersed over long distances in air currents. The disease is also seed-borne and can spread through infected seeds. A few years after the first epidemic in Brazil in 1985, wheat blast has spread to other South American countries including Bolivia (in 1996), Paraguay (2002) and
Figure 19. Blast signs on wheat heads (Source: compendium of wheat diseases and pests, 2010)
Figure 20. Sign of blast on a wheat leaf collected in Bangladesh (Source: http://phys.org/news/2016-04-
scientists-issue-rallying-wheat-blast.html)
130 131
Argentina (2007). However, it had not been reported outside of South America until February 2016 when a severe epidemic of this disease was observed for the first time in Bangladesh (Asia), affecting over 15 000 hectares of wheat and resulting in about 90% yield losses in certain fields (www.cimmyt.org/wheat-blast/), threatening the livelihood of hundreds of millions of people in South Asia who consume over 100 million tons of wheat, annually. It is therefore highly likely that wheat blast could also spread to other regions including Africa.
In South Africa, stripe rust of wheat was detected for the first time in 1996. In addition, some of the new races of leaf and stem rust, which were identified in recent years, were believed to be introductions into South Africa from other countries. This evidence underscores the vulnerability of the South African wheat industry to diseases of exotic origin and points to the possibility that sooner or later, wheat blast could make its way to South Africa.
A few blast-tolerant cultivars have been identified in South America. To a limited extent, fungicides can also provide protection from this disease. As a proactive measure, it is important to source and import resistant material for use in breeding programmes in South Africa. In addition, a well-organised disease surveillance programme should assist in the early detection of wheat blast as this would enable preparation and application of control measures, reducing the risk of the disease developing at epidemic level. The ongoing rust surveillance programme at ARC-SG is closely monitoring major wheat growing regions for possible occurrence of this disease. It is also essential that wheat producers and institutions working on wheat inspect commercial wheat fields and experimental plots for blast symptoms. When wheat blast is suspected, samples can be sent to ARC-Small Grain, Bethlehem for diagnosis.
Control of Fungal Diseases
Genetic control of fungal diseases
Breeding for resistance is an economically important and environmentally friendly way of controlling fungal diseases of small grains. The objective of breeding programmes is the incorporation of resistance genes into agronomically well adapted cultivars. The susceptibility or resistance of some wheat cultivars to some diseases are indicated in Tables 1 to 3. However, no one cultivar can be resistant to all the fungal diseases that might infect it. Therefore, fungicides remain of importance in the production of small grains in South Africa.
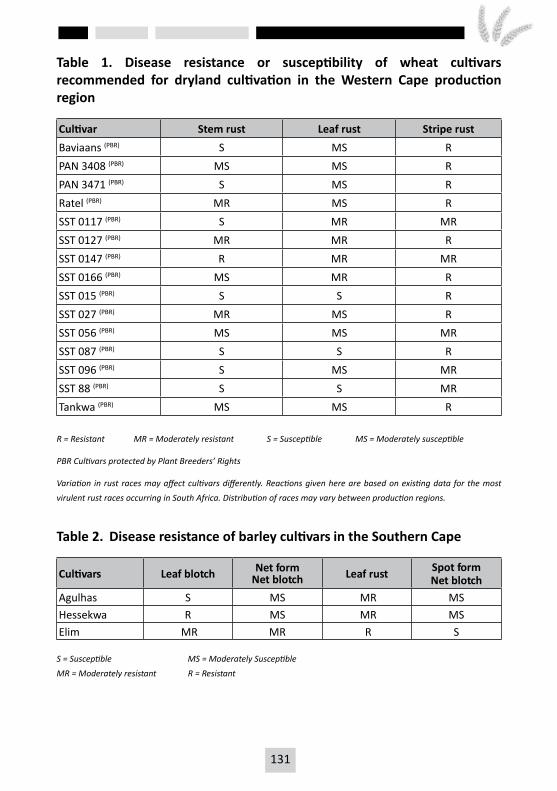
130 131
Table 1. Disease resistance or susceptibility of wheat cultivars recommended for dryland cultivation in the Western Cape production region
Cultivar Stem rust Leaf rust Stripe rustBaviaans (PBR) S MS R
PAN 3408 (PBR) MS MS R
PAN 3471 (PBR) S MS R
Ratel (PBR) MR MS R
SST 0117 (PBR) S MR MR
SST 0127 (PBR) MR MR R
SST 0147 (PBR) R MR MR
SST 0166 (PBR) MS MR R
SST 015 (PBR) S S R
SST 027 (PBR) MR MS R
SST 056 (PBR) MS MS MR
SST 087 (PBR) S S R
SST 096 (PBR) S MS MR
SST 88 (PBR) S S MR
Tankwa (PBR) MS MS R
R = Resistant MR = Moderately resistant S = Susceptible MS = Moderately susceptible
PBR Cultivars protected by Plant Breeders’ Rights
Variation in rust races may affect cultivars differently. Reactions given here are based on existing data for the most virulent rust races occurring in South Africa. Distribution of races may vary between production regions.
Table 2. Disease resistance of barley cultivars in the Southern Cape
Cultivars Leaf blotch Net formNet blotch Leaf rust Spot form
Net blotchAgulhas S MS MR MS
Hessekwa R MS MR MS
Elim MR MR R S
S = Susceptible MS = Moderately SusceptibleMR = Moderately resistant R = Resistant
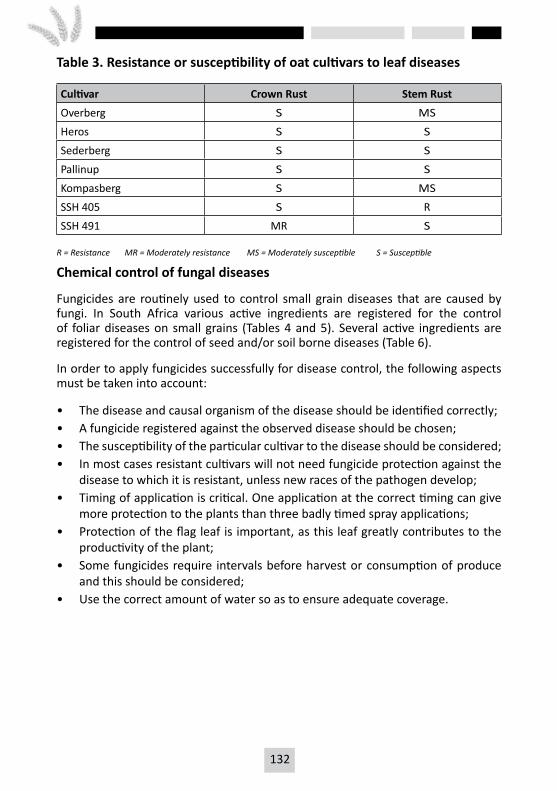
132 133
Table 3. Resistance or susceptibility of oat cultivars to leaf diseases
Cultivar Crown Rust Stem RustOverberg S MS
Heros S S
Sederberg S S
Pallinup S S
Kompasberg S MS
SSH 405 S R
SSH 491 MR S
R = Resistance MR = Moderately resistance MS = Moderately susceptible S = Susceptible
Chemical control of fungal diseases
Fungicides are routinely used to control small grain diseases that are caused by fungi. In South Africa various active ingredients are registered for the control of foliar diseases on small grains (Tables 4 and 5). Several active ingredients are registered for the control of seed and/or soil borne diseases (Table 6).
In order to apply fungicides successfully for disease control, the following aspects must be taken into account:
• The disease and causal organism of the disease should be identified correctly;• A fungicide registered against the observed disease should be chosen;• The susceptibility of the particular cultivar to the disease should be considered;• In most cases resistant cultivars will not need fungicide protection against the
disease to which it is resistant, unless new races of the pathogen develop;• Timing of application is critical. One application at the correct timing can give
more protection to the plants than three badly timed spray applications;• Protection of the flag leaf is important, as this leaf greatly contributes to the
productivity of the plant;• Some fungicides require intervals before harvest or consumption of produce
and this should be considered;• Use the correct amount of water so as to ensure adequate coverage.
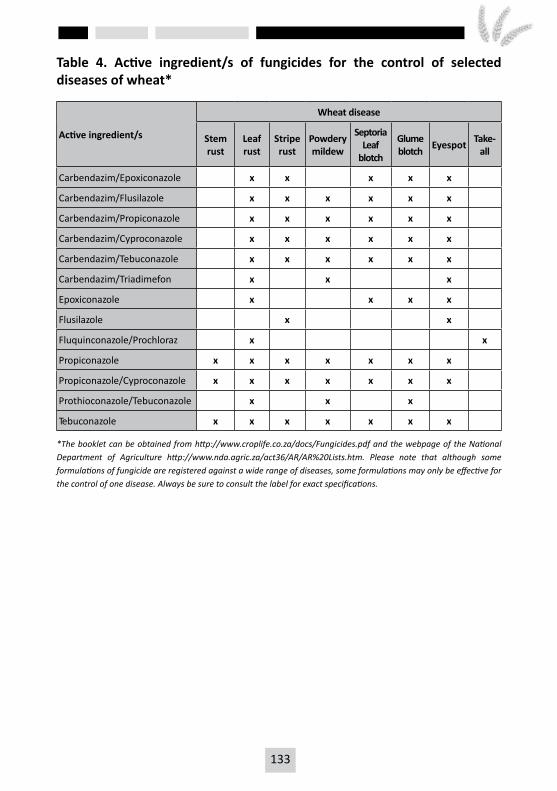
132 133
Table 4. Active ingredient/s of fungicides for the control of selected diseases of wheat*
Active ingredient/s
Wheat disease
Stemrust
Leafrust
Striperust
Powderymildew
SeptoriaLeaf
blotch
Glumeblotch Eyespot Take-
all
Carbendazim/Epoxiconazole x x x x x
Carbendazim/Flusilazole x x x x x x
Carbendazim/Propiconazole x x x x x x
Carbendazim/Cyproconazole x x x x x x
Carbendazim/Tebuconazole x x x x x x
Carbendazim/Triadimefon x x x
Epoxiconazole x x x x
Flusilazole x x
Fluquinconazole/Prochloraz x x
Propiconazole x x x x x x x
Propiconazole/Cyproconazole x x x x x x x
Prothioconazole/Tebuconazole x x x
Tebuconazole x x x x x x x
*The booklet can be obtained from http://www.croplife.co.za/docs/Fungicides.pdf and the webpage of the National Department of Agriculture http://www.nda.agric.za/act36/AR/AR%20Lists.htm. Please note that although some formulations of fungicide are registered against a wide range of diseases, some formulations may only be effective for the control of one disease. Always be sure to consult the label for exact specifications.
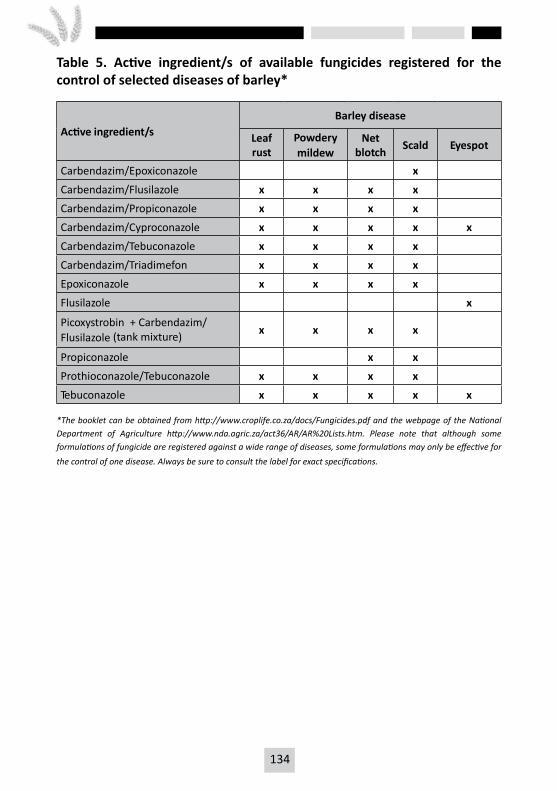
134 135
Table 5. Active ingredient/s of available fungicides registered for the control of selected diseases of barley*
Active ingredient/sBarley disease
Leaf rust
Powdery mildew
Net blotch Scald Eyespot
Carbendazim/Epoxiconazole xCarbendazim/Flusilazole x x x xCarbendazim/Propiconazole x x x xCarbendazim/Cyproconazole x x x x xCarbendazim/Tebuconazole x x x xCarbendazim/Triadimefon x x x xEpoxiconazole x x x xFlusilazole x
Picoxystrobin + Carbendazim/Flusilazole (tank mixture)
x x x x
Propiconazole x xProthioconazole/Tebuconazole x x x xTebuconazole x x x x x
*The booklet can be obtained from http://www.croplife.co.za/docs/Fungicides.pdf and the webpage of the National Department of Agriculture http://www.nda.agric.za/act36/AR/AR%20Lists.htm. Please note that although some formulations of fungicide are registered against a wide range of diseases, some formulations may only be effective for the control of one disease. Always be sure to consult the label for exact specifications.
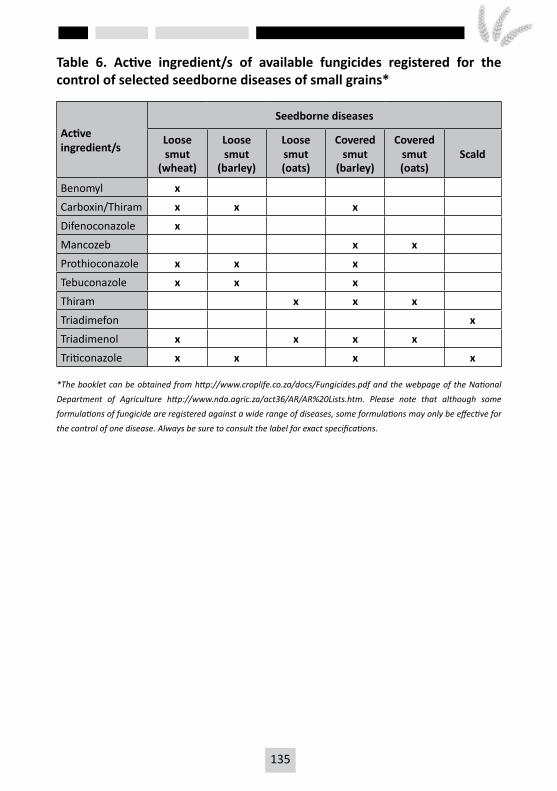
134 135
Table 6. Active ingredient/s of available fungicides registered for the control of selected seedborne diseases of small grains*
Active ingredient/s
Seedborne diseases
Loose smut
(wheat)
Loose smut
(barley)
Loose smut(oats)
Covered smut
(barley)
Coveredsmut (oats)
Scald
Benomyl xCarboxin/Thiram x x xDifenoconazole xMancozeb x xProthioconazole x x xTebuconazole x x xThiram x x xTriadimefon xTriadimenol x x x xTriticonazole x x x x
*The booklet can be obtained from http://www.croplife.co.za/docs/Fungicides.pdf and the webpage of the National Department of Agriculture http://www.nda.agric.za/act36/AR/AR%20Lists.htm. Please note that although some formulations of fungicide are registered against a wide range of diseases, some formulations may only be effective for the control of one disease. Always be sure to consult the label for exact specifications.
136 137
ARC-SMALL GRAIN SERVICES
The laboratories of ARC-Small Grain are well known for their fast, accurate and reliable services to you as producer.
Seed Testing Laboratory
The Seed Testing Laboratory is registered with the Department of Agriculture and ISTA (International Seed Testing Association)-rules are strictly applied to comply with international standards in determining the quality characteristics of seed. Tests include the following:
Germination tests and physical purity analysis package
The germination test is an indication of the percentage seed that will, under favourable conditions, produce normal seedlings. Together with the germination results, the percentage of seed from other crops and weeds are determined. This is also subject to requirements set by law. Each seedlot planted in the field must be tested so that the producer is assured that the seed planted has a germination percentage greater than 80%, which is the minimum for making wheat production a viable proposition.
Coleoptile length
Coleoptile length is the length of the sheath that enfolds the first leaf. The coleoptile provides the force that carries the leaf to the soil surface. To prevent emergence problems under dryland conditions, coleoptile length determinations are recommended. It is important to remember that planting depth is critical where cultivars with short coleoptile lengths are planted.
Seed analyses testing chemical treatments
A seed treatment can be tested for its effect on South African small grain cultivars and even its compatibility with other seed treatments. These services will be provided on contract basis only.
Contact person: Hesta Hatting
Tel: (058) 307-3417
E-mail: [email protected]
136 137
Wheat Quality Laboratory
The Wheat Quality Laboratory participates in two external quality control schemes. The Premier Foods Ring test samples are analysed monthly and the Southern African Grain Laboratory (SAGL)’s Ring test samples are analysed quarterly. The laboratory offers the following analyses on whole wheat kernels:
• Hectolitre mass / Test weight
• Kernel colour
• Flour yield potential
Analyses that can be performed on flour include:
• Flour colour
• Protein content
• Falling number
• Sodium Dodecyl Sulphate (SDS) sedimentation volume
• Wet gluten content
• Moisture content
Analyses indicative of dough properties and end-use quality include:
• Mixograph analyses
• Farinograph analyses
• Mixolab analyses
• Loaf volume
Contact person: Dr Chrissie Miles
Tel: (058) 307-3414
E-mail: [email protected]
138 139
Soil Analyses Laboratory
The Analyses Laboratory specialises in soil analyses and is an active member of the Agri-LASA control scheme.
Soil analyses
• pH (KCl)
• Ca, Mg, Na, K (Ammonium Acetate)
• Phosphate (Bray 1)
• % Acid Saturation
Other analyses:
• Lime requirement Zinc (HCl)
• % Total Carbon (TOC)
• Clay % (Hydrometer Method)
• Particle size
Contact person: Lientjie Visser
Tel: (058) 307-3501
E-mail: [email protected]
138 139
Weed Resistant Allele Profiling Service (WRAPS)
This innovative herbicide resistance screening service is a new tool in the toolbox, offered to producers to assist with the effective management of herbicide resistant weeds. To date, various target-site resistance mutations have been identified on farmers’ fields from the Western Cape, Eastern Cape and Northern Cape. Currently this service has been optimised for ryegrass samples.
For which herbicide groups can the samples be screened for?
Currently ryegrass biotypes can be screened for resistance to herbicides from the ACCase inhibitor (Group A) herbicides, ALS inhibitor (Group B) herbicides and the Group D (bipyridyliums) and Group G (glycine) herbicides. The target-site mutation markers used, can detect single group resistance or broad target-site resistance across multiple groups. All weedy grass species can be screened.
How to get your ryegrass tested for resistance?
Producers/chemical company representatives are welcome to send ryegrass seedlings/fresh bulk leaf material or seeds for testing to ARC-Small Grain, Bethlehem. The samples can be taken any time during the plant life cycle, preferably the younger the better. Please make sure that the bulk sample was taken from plants distributed over the entire field, so as to constitute a true representative sample of the field. Seedlings/leaf material must be kept moist, placed in a zip lock bag, labelled and preferably couriered overnight to ARC-Small Grain, Bethlehem, as this will assure that fresh seedlings/leaf material arrive for processing. This is critical to allow for the isolation of the required DNA quality for successful resistance identification.
Seeds must be stored in brown paper bags to prevent microbial contamination. Please indicate the GPS-coordinates and name of the field/farm where the seedling/ leaf material/seed samples were taken. Please prevent sending seedling samples with intact root systems and soil as this adds unnecessary weight to the parcel. An adequate number of seeds/seedlings must be submitted for the screening process to be conducted successfully.
A full detailed written report per field/farm with recommendations will be submitted electronically via e-mail and telephonically communicated to the producer/chemical company representative within five to seven working days after receiving the samples in good order.
140 141
Costs
Currently WRAPS is offered as a free service, but clients are expected to pay for the courier costs to get the samples to Bethlehem. This innovative project is currently jointly funded by the ARC, Winter Cereal Trust and the National Research Foundation.
In future, to make this service sustainable for the long term, an affordable flat rate per sample will be charged.
Note: This molecular genotyping service only detects the presence of the most common target-site mutation induced herbicide resistances and other forms of resistance, such as metabolic or compartmentalised resistanc,e requires additional testing.
For further information, please contact:
ARC-Small Grain: (058) 307 3400
Ms Hestia Nienaber (Weed Scientist) - [email protected]
Dr Scott Sydenham (Biotechnologist) - [email protected]
140 141
CONTACT INFORMATION
For more information you are advised to contact the following specialists:
Cultivar Choice
Willem Kilian
Plant Physiology
Dr Annelie Barnard
Plant Diseases
Cathy de VilliersDr Tarakegn Terefe
Insect Control
Dr Goddy PrinslooDr Vicki TolmayDr Justin HattingDr Astrid Jankielsohn
Weed Control
Hestia Nienaber
Plant Nutrition
Willem Kilian
Soil Tillage
Willem Kilian
Plant Breeding
Dr André Malan*Dr Ian HeynsDr Robbie Lindeque*Kim Coetzee
Soil Analyses
Lientjie Visser
Quality Analyses
Dr Chrissie Miles
Seed Services
Hesta Hatting
Weed Resistance Allele Profiling Service
Hestia NienaberDr Scott Sydenham
Address correspondence to the following address:
ARC-Small GrainPrivate Bag X29Bethlehem9700
Tel: (058) 307-3400
* SGI Stellenbosch
ARC-Small GrainP O Box 3507Matieland7602
Tel: (021) 809 3554www.arc.agric.za/arc-sgi/

142 143

142 143

144 PB