sistemas de visualizaÇÃo imuno-histoquÍmica livres de
TRANSCRIPT

RAFAEL MALAGOLI ROCHA
SISTEMAS DE VISUALIZAÇÃO IMUNO-HISTOQUÍMICA LIVRES DE BIOTINA
PARA AVALIAÇÃO DE RECEPTOR DE ESTRÓGENO EM CÂNCER DE
MAMA: ANÁLISE EMPREGANDO DIGITALIZAÇÃO DE LÂMINAS, ACESSO
REMOTO E PROGRAMA ANALISADOR DE IMAGENS
Belo Horizonte
Julho de 2009

2
UNIVERSIDADE FEDERAL DE MINAS GERAIS - FACULDADE DE MEDICINA
TESE DE DOUTORADO SISTEMAS DE VISUALIZAÇÃO IMUNO-HISTOQUÍMICA LIVRES DE BIOTINA
PARA AVALIAÇÃO DE RECEPTOR DE ESTRÓGENO EM CÂNCER DE
MAMA: ANÁLISE EMPREGANDO DIGITALIZAÇÃO DE LÂMINAS, ACESSO
REMOTO E PROGRAMA ANALISADOR DE IMAGENS
Tese apresentada ao curso de Pós-Graduação em Patologia da Faculdade de Medicina da Universidade Federal de Minas Gerais, como requisito parcial à obtenção do Título de Doutor em Patologia
Orientadora: Prof. Helenice Gobbi
Belo Horizonte
Julho de 2009

3
Este trabalho foi realizado no Laboratório de Patologia Mamária da Faculdade
de Medicina da Universidade Federal de Minas Gerais, tendo a colaboração dos
Deptos de Patologia do Hospital A.C. Camargo (Dr. Fernando Augusto Soares) e
Faculdade de Ciências Médicas da Universidade Estadual de Campinas (Drs.
José Vassallo e Natália Moraes Guimarães Schenka, e apoio financeiro da
Coordenação de Aperfeiçoamento de Pessoal de Nível Superior (CAPES),
Conselho Nacional de Desenvolvimento Científico e Tecnológico (CNPq),
Fundação de Amparo À Pesquisa do Estado de Minas Gerais (FAPEMIG) e
Fundação de Amparo à Pesquisa do Estado de São Paulo (FAPESP). Parte do
trabalho foi realizado em Programa de Doutorado no Exterior (PDEE)
desenvolvido no Laboratório University College London Advanced Diagnostics
da Universidade de Londres (UCL), com bolsa da CAPES, tendo como mentor o
Sr Keith Miller, diretor do United Kingdom National Quality Assessment Service
(UK-NEQAS ICC & FISH) e chefe da imuno-histoquímica do laboratório de base
deste serviço e da Universidade de Londres.

4
DEDICO A todas as pacientes cuja carne foi motivo do nosso estudo

5
Aos meus pais Carlos e Ângela, às minhas irmãs Renata e Bruna, à minha filha Isabela e aos meus amigos pelo mundo

6
AGRADECIMENTOS Agradeço à minha família, minha filha e aos meus amigos Agradeço ao meu orientador estrangeiro e amigo Sr Keith Miller pelo conhecimento dispensado, ajuda material, financeira e amizade. Agradeço ao Dr. Fernando Soares pela disponibilização de material para a realização do estudo, pelo convite de trabalho e, acima de tudo, pela confiança e amizade. Agradeço ao Dr. José Vassallo por disponibilizar casos para o estudo e pela confiança, amizade e ensinamentos filosóficos diários. Agradeço a Merdol, John Bartlett, Bharat Jasani, Ailin Rhodes, Jess, Gabie, Kzzy, Adriane, Phill, Josi, Crini, Uga, Elder, Bruno, Diogo, Marcos, Nicole e Anne pelos momentos em Londres. Aos meus amigos Lucas Oliveira, Lucas Roque, Felipe Bittencourt, Marcio Carvalho e Augusto Horta. Aos amigos do laboratório Gislene Rocha, Marina De Brot, Flávio Oliveira, Luciene Tafuri, Cristiana Nunes, Vanessa Marinho, Fernanda Sanches, Danielle e Vinicius. À FAPEMIG, CNPq e CAPES pelas bolsas oferecidas desde a minha iniciação científica até a defesa deste doutorado com período sanduíche. Um total de sete anos de bolsa ininterruptos. Agradeço à minha orientadora e amiga Helenice por tudo e principalmente por acreditar.
7
RESUMO Introdução: uma nova geração de sistemas de visualização poliméricos livres
de biotina (SPLB) para imuno-histoquímica têm sido desenvolvidos. Objetivo:
comparamos os SPLB com os sistemas streptavidina-biotina (SABS) para a
avaliação de imuno-reatividade para receptor de estrógeno (RE) em câncer de
mama. Material e método: o anticorpo anti-receptor de estrógeno, clone SP1,
foi empregado em um micro-arranjo de tecido (TMA) contendo 320 carcinomas
mamários. Onze diferentes sistemas de visualização foram utilizados: seis SPLB
de segunda geração (Advance, Novolink, SuperPicTure, PicTure Max, Super
Sensitive Non-Biotin HRP, e Mouse/Rabbit Polydetector HRP/DAB), um SPLB
de primeira geração (EnVision+), e quatro SABS (LSAB+, EasyPath, Super
Sensitive, e Mouse/Rabbit Immunodetector HRP/DAB). As lâminas foram
digitalizadas usando o Mirax Scanner e as imagens obtidas foram analisadas de
forma automatizada e de forma visual adotando o sistema de escore de Allred
para marcação nuclear. Marcação citoplasmática foi avaliada de forma semi-
quantitativa. Resultados: Os SPLB Advance e Novolink mostraram os escores
mais altos na análise visual e ainda detectaram dois casos positivos que foram
considerados negativos utilizando outros sistemas de visualização. Estes
sistemas, juntamente com o SAB LSAB+, também mostraram intensidade de
marcação mais forte pela análise automatizada. SPLB não mostraram marcação
citoplasmática, ao contrário dos SABS. Conclusão: os SPLB de segunda
geração, especialmente o Advance e o Novolink, garantem sinal imuno-
histoquímico mais intenso e marcação nuclear mais bem localizada, sem

8
coloração citoplasmática, quando comparados aos SABS. Outros estudos
correlacionando estes achados com a condição de resposta terapêutica das
pacientes devem ser realizados já que houve discordância quanto à positividade
em alguns casos. SPLB representam uma ferramenta de alta qualidade para
pesquisa e avaliação clínica do receptor de estrógeno em câncer de mama.
9
SUMMARY
Aims: Biotin-free polymeric visualization systems (BFPS) were compared to
streptavidin-biotin systems (SABS) in the evaluation of immunoreactivity for
estrogen receptor (ER) in breast carcinomas. Methods: The anti-estrogen
antibody clone SP1 was employed on a tissue microarray containing 320 breast
carcinomas. Eleven different detection systems were used: six BFPS of second
generation (Advance, Novolink, SuperPicTure, PicTure Max, Super Sensitive
Non-Biotin HRP, and Mouse/Rabbit Polydetector HRP/DAB), one BFPS of first
generation (EnVision+), and four SABS (LSAB+, EasyPath, Super Sensitive, and
Mouse/Rabbit Immunodetector HRP/DAB). The slides were digitalized using the
Mirax scanner and the resulting images were analyzed both by an automated
method and by visual analysis using the Allred´s score system considering
positive nuclear staining. Cytoplasm staining was also separeted evaluated.
Results: The BFPS Advance and Novolink showed the highest scores by visual
analysis, and additionally detected two positive cases which were considered
negative using the other detection systems. Likewise, these systems, together
with the SAB LSAB+, showed higher staining intensity by the automated method.
BFPS revealed no cytoplasm staining, in opposition to the SABS. Conclusions:
The second generation BFPS, especially Advance and Novolink, provide
stronger and sharper nuclear immunohistochemical signal as compared to most
SABS, without nonspecific cytoplasm staining. As in few instances these
detection systems show discordant results in relation to SABS, further studies

10
correlating these findings to therapeutic response are necessary. BFPS may
represent a high quality tool both for research and clinical evalutation of estrogen
receptor in breast cancer.

11
LISTA DE FIGURAS
Figura 1: Disco de TMA no aumento de 200X. A) Coloração imuno-histoquímica original. B) Núcleos positivos selecionados para quantificação numérica de sua intensidade de marcação imuno-histoquímica.........................50 Figura 2: Projeto de TMA construído no programa Mirax Viewer. A) Todas as lâminas ao fundo e uma janela contend o sistema de escore proposto para a avaliação de fundo. B) 320 discos de TMA ordenados e numerados pertencentes a uma única lâmina de TMA mostrada individualmente na tela C) Os mesmos discos de TMA mostrados em maior aumento D) Um único disco de TMA pronto para ser analisado. O sistema de escore é mostrado no rodapé da imagem e um aumento deste disco de 400X é mostrado no topo da janela..............................51 Figura 3: Captura de um disco de TMA de uma lâmina digitalizada observada ao programa HistoQuant para quantificação de intensidade de marcação ao aumento de 400X. O anticorpo primário SP1 e o sistema de visualização Advance foram utilizados nesta lâmina. A) Imagem pronta para o reconhecimento de núcleos positivos. B) Núcleos positivos já reconhecidos e quantificação da intensidade da marcação imuno-histoquímica está sendo processada........................................................................................................74 Figura 4: Lâmina virtual processada pelo Projeto de TMA construído no programa Mirax Viewer. O anticorpo primário SP1 e o sistema de visualização Novolink foram utilizados nesta lâmina. A) 320 discos de TMA numerados e mostrados de forma individualizada na tela. B) Um disco único de TMA pronto para ser avaliado utilizando-se o sistema de escore de Allred (rodapé da imagem).............................................................................................................76 Figura 4: Intensidade da marcação imuno-histoquímica no mesmo tumor utilizando-se 11 diferentes sistemas de visualização imuno-histoquímica e o anticorpo primário monoclonal de coelho SP1 observada ao aumento de 400X: A) Advance, B) EasyPath, C) EnVision, D) LSAB+, E) Novolink, F) PicTure Max, G) Super Sensitive non-biotin HRP, H) Mouse/Rabbit Polydetector HRP/DAB, I) Super Sensitive, J) Mouse/Rabbit Immunodetector HRP/DAB, K) SuperPicTure...................................................................................................... 82

12
LISTA DE TABELAS
Tabela 1: Sistema de escore proposto por ALLRED (1999) para avaliação de receptor de estrógeno em câncer de mama obtido pela combinação de intensidade de marcação e proporção de células marcadas...............................26
Tabela 2: Especificação, tipo e fabricante de cada sistema de visualização.........................................................................................................49
Tabela 3: Onze diferentes sistemas de visualização agrupados de acordo com o nível de intensidade de marcação expressado pelo valor de p................53 Tabela 4: Especificação, tipo e fabricante de cada sistema de visualização utilizados no presente estudo..............................................................................70
Tabela 5: Comparação dos onze sistemas de visualização agrupados de acordo com suas intensidades de marcação.......................................................79
Tabela 6: Exemplos de equipamentos digitalizadores de lâminas comercialmente disponíveis e seus fabricantes................................................106

13
LISTA DE ABREVIATURAS
IHC Immunohistochemistry
BFPS Biotin-free polymeric systems
SABS (Strept)avidin-biotin systems
HER2 Human epidermal growth factor receptor type 2
EGFR Epidermal growth factor receptor
ER Estrogen receptor
PR Progesterone receptor
DNA Desoxiribonucleic acid
TMA Tissue microarray
UK-NEQAS United Kingdom National External Quality Assessment Service
cDNA DNA complementar
FISH Fluorescent in situ hybridization
CISH Chromogenic in situ hibridization
SISH Silver in situ hibridization
IHQ Imuno-histoquímica
HRP Horseradish peroxidase
DAB Diaminobenzidine
FAPEMIG Fundação de Amparo à Pesquisa do Estado de Minas Gerais
FAPESP Fundação de Amparo à Pesquisa do Estado de São Paulo
CNPq Conselho Nacional de Desenvolvimento Científico e Tecnológico
CAPES Coordenação de Aperfeicoamento de Pessoal de Nível Superior
UFMG Universidade Federal de Minas Gerais
UCL University College London
UCLAD University College London Advanced Diagnostics
UNICAMP Universidade Estadual de Campinas
TRIS-HCl Ácido clorídrico tris
CAP Colégio Americano de Patologistas

14
ÍNDICE
INTRODUÇÃO..............................................................................................15
1. O câncer de mama e sua importância............. ...............................................16
2. Fatores prognósticos e preditivos em câncer de mama..................................17
2.1. Receptor de estrógeno...........................................................................20
2.2. Receptor de progesterona......................................................................21
2.3. Receptor do Fator de Crescimento Epidérmico Humano Tipo 2
(HER2).................................................................................................................22
3. Metodologia de avaliação de receptores hormonais.......................................24
4. Controle de qualidade em imuno-histoquímica................................................26
4.1. Controle interno de qualidade em imuno-histoquímica..........................27
4.2. Controle externo de qualidade em imuno-histoquímica.........................28
5. A importância das fases pré-analítica, analítica e pós analítica......................29
6. A tecnologia dos microarranjos de tecido (tissue microarrays, TMA)..............31
6.1. A construção dos TMA............................................................................32
6.2. TMA e câncer de mama..........................................................................34
7. A tecnologia de digitalização de lâminas histológicas.....................................35
8. Aspectos éticos................................................................................................37
OBJETIVOS......................................... ...........................................................38
APPLIED CANCER RESEARCH....................................................................40
JOURNAL OF CLINICAL PATHOLOGY........................................................63
PATHOLOGY RESEARCH AND PRACTICE.................................................90
IMMUNOCYTOCHEMISTRY.........................................................................116
COMENTÁRIOS FINAIS................................ ...............................................129
REFERÊNCIAS BIBLIOGRÁFICAS........................ .....................................131

15
Introdução

16
1. O câncer de mama e a sua importância
O câncer de mama é considerado o segundo tipo de câncer mais comum
no mundo, sendo o mais freqüente entre as mulheres. Ao contrário do câncer de
colo de útero, esta doença encontra-se relacionada ao processo de
industrialização, com risco de adoecimento associado a elevado status sócio-
econômico, além de outros fatores de risco clássicos descritos, tais como baixa
paridade, idade precoce da menarca e tardia da menopausa, obesidade, altura e
consumo de álcool. O câncer de mama é um importante problema de saúde
pública na América Latina, tendo sido observado aumento consistente nas taxas
de mortalidade nos últimos quarenta anos. Estudo conduzido no estado de São
Paulo identificou o câncer de mama como a principal causa de mortalidade por
neoplasias em mulheres na faixa etária de 30 a 49 anos. De acordo com estudo
caso-controle conduzido em hospital universitário de Belo Horizonte, o perfil de
risco para o câncer de mama relativo a fatores sócio-econômicos e reprodutivos
apresentou-se similar em mulheres com diagnóstico efetuado na pré e na pós
menopausa. A partir de estudo ecológico realizado com dados de exposição a
pesticidas em onze estados do Brasil, foram identificadas correlações
importantes entre esta exposição e distúrbios no sistema reprodutivo humano,
incluindo a mortalidade por câncer de mama, principalmente em mulheres com
idade entre 50 a 69 anos no período de 1995 a 1997. No entanto, estudo caso-
controle realizado na Região Metropolitana do Rio de Janeiro, incluindo 177
casos e 350 controles, não verificou associação entre nível sérico de

17
organoclorados e aumento de risco para o câncer de mama. Com relação ao
rastreamento das neoplasias malignas de mama, observou-se que mulheres
idosas e mulheres com baixo grau de escolaridade apresentaram menores
oportunidades de diagnóstico precoce. As mais elevadas taxas de incidência
anuais de câncer de mama no Brasil, ajustadas por idade e por 100 mil
mulheres, foram encontradas em São Paulo (94,0), Distrito Federal (86,1) e
Porto Alegre (66,5) (GUERRA et al. 2005).
2. Fatores prognósticos e preditivos em câncer de m ama
Fatores prognósticos são achados clínicos, patológicos e biológicos do
paciente e do tumor que são úteis para predizer o comportamento clinico do
paciente, como possibilidade de recorrência da doença ou sobrevida do paciente
se este não for tratado (ALLRED et al. 1998). Dentre os principais fatores
prognósticos, temos tamanho do tumor, tipo e grau histológico, numero de
mitoses e metástase. Fatores preditivos são achados clínicos, patológicos e
biológicos usados para estimar a resposta do paciente a um tipo especifico de
terapia. Os principais marcadores imunohistoquímicos com importância preditiva
e prognostica são receptores hormonais, Ki67 e HER2. Estes fatores são
avaliados por patologistas, que fornecem os valores preditivos e prognósticos
juntamente com as características morfológicas do câncer de mama enquanto
oncologistas utilizam estas interpretações, em associação com outros dados
clínicos, para a tomada de decisão terapêutica (GOBBI et al. 2008).

18
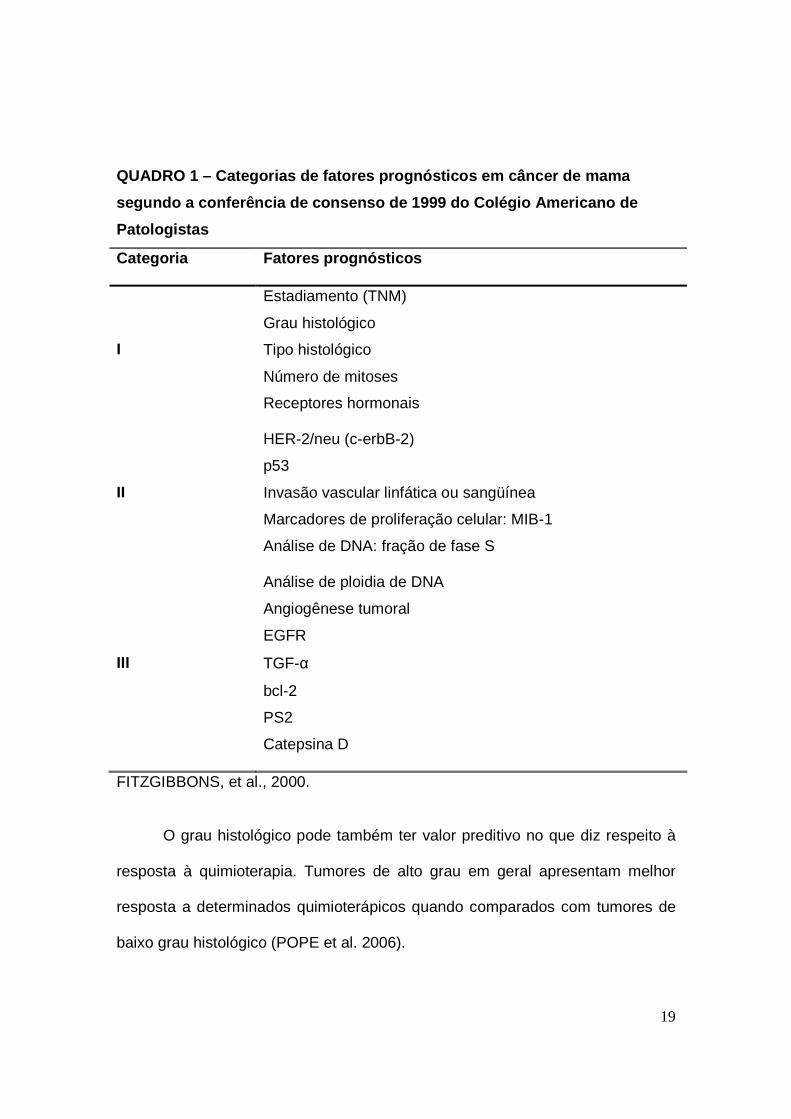
Em 1999, reunião de consenso no Colégio Americano de Patologistas
(CAP) estratificou os fatores prognósticos do câncer de mama em três
categorias especificadas no Quadro 1 (FITZGIBBONS et al. 2000). A categoria I
inclui os fatores já validados como importantes no prognóstico e úteis na
conduta clínica dos pacientes. Na categoria II foram englobados os fatores
prognósticos que têm sido intensamente estudados do ponto de vista da biologia
e da clínica, mas que ainda precisam ser validados em estudos estatísticos
consistentes. A categoria III inclui todos os outros fatores ainda não
suficientemente estudados para demonstrar seu valor prognóstico. O tipo e grau
histológicos dos tumores têm seu valor bem estabelecido e foram incluídos na
categoria I do CAP. Estudos de longos seguimentos mostram que alguns
carcinomas de tipo especial cursam com melhor prognóstico (por exemplo:
tubular, mucinoso e cribriforme) enquanto outros indicam prognóstico
desfavorável (por exemplo: ductal SOE e apócrino) (PAGE et al. 1998).
19
QUADRO 1 – Categorias de fatores prognósticos em câncer de m ama
segundo a conferência de consenso de 1999 do Colégi o Americano de
Patologistas
Categoria Fatores prognósticos
I
Estadiamento (TNM)
Grau histológico
Tipo histológico
Número de mitoses
Receptores hormonais
II
HER-2/neu (c-erbB-2)
p53
Invasão vascular linfática ou sangüínea
Marcadores de proliferação celular: MIB-1
Análise de DNA: fração de fase S
III
Análise de ploidia de DNA
Angiogênese tumoral
EGFR
TGF-α
bcl-2
PS2
Catepsina D
FITZGIBBONS, et al., 2000.
O grau histológico pode também ter valor preditivo no que diz respeito à
resposta à quimioterapia. Tumores de alto grau em geral apresentam melhor
resposta a determinados quimioterápicos quando comparados com tumores de
baixo grau histológico (POPE et al. 2006).

20
Todo fator preditivo de resposta terapêutica deve ser validado técnica e
clinicamente bem como influenciar na tomada de decisão clinica. Uma validação
técnica significa que o método usado para a avaliação do fator preditivo seja
sensível, específico, reprodutível, e possa ser interpretado de maneira universal
em diferentes laboratórios. A validação clinica consiste no fato de que o teste
identifique diferentes grupos de pacientes com diferentes riscos de recorrência
da doença, tempo de sobrevida e resposta terapêutica.
Embora fatores preditivos de resposta terapêutica tenham maior valor
clínico, os únicos fatores preditivos amplamente validados na literatura para a
rotina clínica são receptor de estrógeno, progesterona e HER2.
2.1- Receptor de estrógeno
Receptor de estrógeno é provavelmente o fator preditivo individual mais
importante avaliado em câncer de mama. Até dois terços das mulheres acima de
50 anos apresentarão câncer de mama positivos para receptor de estrógeno,
além disso, aproximadamente 80% dos tumores de mama em mulheres acima
de 50 anos são positivos para receptor de estrógeno. Receptor de estrógeno é
importante no processo de carcinogênese e sua inibição, seja diretamente
utilizando agonistas fracos de estrógeno (Moduladores Seletivos do Receptor de
Estrógeno) ou indiretamente através do bloqueio da conversão de androgênios
em estrógeno (inibidores de aromatase), é considerada a base da terapia
adjuvante do câncer de mama. Aos tumores que são positivos para receptores
de estrógeno ou progesterona são atribuídas características de baixo risco de

21
mortalidade para o paciente comparados aos negativos para os mesmos
receptores (PAYNE, 2008).
A exposição ao estrógeno é conhecidamente um fator de risco para o
câncer de mama (COLDITZ, 1998). O hormônio exerce seus efeitos biológicos
através do seu receptor, que são proteínas nucleares classificadas em dois
subtipos: receptor de estrógeno alfa e beta (NILSSON et al. 2001). Ambos são
fatores de transcrição que mediam a ação do estrógeno. Os receptores alfa e
beta se ligam ao estradiol na mesma extensão, porém se diferenciam na
afinidade com a qual se ligam e também na resposta produzida
subseqüentemente (WATANABE et al. 1997; BARKHEM et al. 1998). O receptor
de estrógeno alfa foi identificado primeiro e, então, renomeado receptor de
estrógeno alfa a partir da descrição do subtipo beta. O receptor de estrógeno
alfa é expresso em ate 80% de todos os cânceres de mama. No entanto, seu
valor preditivo não é ideal até o momento, já que aproximadamente um terço dos
cânceres de mama metastáticos positivos para este receptor não apresentam
resposta a terapia hormonal (OSBORNE, 1998).
2.2- Receptor de progesterona
A expressão do receptor de progesterona parece indicar a funcionalidade
da ação do receptor de estrógeno (HORWITZ et al. 1978). Portanto, a avaliação
do receptor de progesterona deveria, teoricamente, ajudar a prever a resposta a
hormonioterapia de maneira mais apurada. Há evidencias de que tumores
positivos para receptor de progesterona apresentam maior probabilidade de

22
responder ao tamoxifen tanto em pacientes com neoplasia metastática (RAVDIN
et al. 1992) quanto no tratamento adjuvante (BARDOU et al. 2003). O receptor
de progesterona pode ser detectado em casos negativos para receptor de
estrógeno em até 5%. Este fato poderia caracterizar um exame falso negativo
para receptor de estrógeno, presença muito baixa deste receptor nas células
neoplásicas, ou até mesmo variantes de receptor de estrógeno não
reconhecidos pelo anticorpo, mas efetivo na estimulação da expressão de
receptor de progesterona (FUQUA et al. 1991). Ainda há controvérsia quanto ao
valor preditivo da positividade do receptor de progesterona na vigência de
negatividade do receptor de estrógeno. Alguns estudos sugerem que tumores
receptor de progesterona positivo, mesmo negativos para receptor de estrógeno,
determinam grupo de pacientes mais responsivos à hormonioterapia, porém
estes achados não são universais (BARDOU et al. 2003).
2.3- Receptor do Fator de Crescimento Epidérmico H umano Tipo 2 (HER2)
O HER2, também conhecido como c-erb-B2, ERBB2 ou HER2/neu, é um
membro da família dos Receptores do Fator de Crescimento Epidérmico (EGFR)
de tirosinoquinases e está localizado no cromossomo 17q21. Este receptor é
importante para a diferenciação celular, adesão e mobilidade (HANNA et al.
1999). A amplificação é o mecanismo predominante da superexpressão gênica
e, conseqüentemente, altos níveis de seu produto protéico de 185 KDa são
evidenciados em aproximadamente 18 – 20% dos cânceres de mama (SLAMON
et al. 1987). A positividade do HER2 está associada com tumores de alto grau,

23
envolvimento linfonodal (BURSTEIN 2005), alto índice de recorrência tumoral e
mortalidade, portanto, está relacionado a mau prognostico (YAMAUCHI et al.
2001).
A avaliação do HER2 em câncer de mama também representa fator
preditivo de resposta terapêutica, mais especificamente ao trastuzumab
(Herceptin®; Genetech, Sao Francisco, Califórnia, EUA). Esta droga consiste em
um anticorpo monoclonal humanizado, que tem mostrado melhores respostas ao
tratamento do câncer e maior tempo de sobrevida da paciente livre de doença,
tanto ao ser administrado sozinho, ou em combinação com quimioterápicos em
pacientes com neoplasia metastática (SLAMON 2001). Mais recentemente,
cinco estudos clínicos internacionais prospectivos e randomizados mostraram
que o trastuzumab, ao ser administrado de forma adjuvante, reduz
significantemente o risco de recorrência e mortalidade em pacientes com estágio
precoce da doença (ROMOND et al. 2008; JOENSUU et al. 2006; SMITH et al.
2007). Além disso, esta droga foi recomendada pelo National Institute for Clinical
Excellence (NICE) no Reino Unido para o tratamento de pacientes em estágio
precoce e metastático do câncer de mama. Recentemente, a utilização de
inibidor de tirosinoquinases, o lapatinib (Tykerb; GlaxoSmithKline, Philadelphia,
Pensilvânia, EUA) tem mostrado resultados promissores em cânceres de mama
HER2 positivos, em combinação com capecitabine (GEYER et al. 2006).
HER2 pode ajudar a prever a resposta terapêutica a diferentes agentes
quimioterápicos Por exemplo, alguns estudos sugerem que tumores positivos
para HER2 podem ser mais sensíveis a antraciclinas (KONECNY et al. 2004;

24
PRITCHARD et al. 2006). Sugere-se ainda que a positividade para HER2 pode
predizer resistência à terapia endócrina, porém os estudos que mostram este
fato são retrospectivos e não empregaram populações comparáveis, nem
metodologia semelhante para detecção imuno-histoquímica dos marcadores. Até
o momento, a positividade do HER2 não é utilizada para decidir ou não sobre o
emprego da terapia endócrina (PROWELL & ARMSTRONG 2006).
Testes apurados e precoces para HER2 de todos os pacientes portadores
de câncer de mama são essenciais para o aperfeiçoamento do tratamento.
Testes errôneos ou inconclusivos para HER2 podem resultar em inapropriada
conduta clínica e irão apenas dificultar a tomada de decisão sobre a utilização
de novas drogas para o tratamento do câncer de mama (DENT & CLEMONS
2005).
3- Metodologia de avaliação de receptores hormonais
Imuno-histoquímica é o método padronizado para a determinação do
status dos receptores hormonais (ROCHA et al. 2009; ROCHA et al. 2008;
GOBBI et al. 2008) e pode ser aplicada a especimes de core biopsy e excisões
cirúrgicas. Há dados do National Health Service (NHS) do Reino Unido que
asseguram que a imuno-histoquímica pode ser altamente reprodutível entre
diferentes laboratórios. Baixa qualidade de fixação do tecido pode afetar os
resultados da técnica, e controles positivos e negativos devem ser usados para
cada bateria de testes (PAYNE et al. 2008).

25
É necessário que o nível de imunorreatividade do tumor para receptor de
estrógeno e progesterona seja reportado, já que tumores não reativos para tais
hormônios não responderão a terapia endócrina. Aqueles pacientes cujos
tumores mostram baixos valores de avaliação para receptor de estrógeno,
porém altos valores para receptor de progesterona, também se beneficiarão com
a terapia hormonal. Apesar de vários sistemas de escore serem conhecidos
atualmente (LEAKE et al. 2000; REINER et al. 1990), com o objetivo de obter
melhor padronização interlaboratório é recomendado que o método de escore de
Allred seja utilizado (GOLDHIRSCH et al. 2005). Este método combina a
intensidade de marcação imuno-histoquímica e a proporção de células
marcadas, resultando em um escore máximo de oito (Tabela 1). Estudo
correlacionando a resposta terapêutica com o nível de expressão de receptor de
estrógeno avaliado por este sistema de escore mostrou que mesmo pacientes
cujos tumores que receberam um total de três podem se beneficiar da terapia
endócrina adjuvante (HARVEY et al. 1999).

26
Tabela 1: Sistema de escore proposto por ALLRED (1999) para avaliação de
receptor de estrógeno em câncer de mama obtido pela combinação de
intensidade de marcação e proporção de células marcadas
Escore de proporção de células marcadas (%)
Escore de
intensidade
0
> 0 a 10
> 10 a 33
> 33 a 66
> 66 a 100
Fraco
0
2
4
5
6
Moderado 0 3 5 6 7
Forte 0 3 6 7 8
* O escore total é obtido através da soma do escore de proporção de células
marcadas com o escore de intensidade de marcação. Escores totais entre 0 e 2
são considerados negativos e escores totais acima de 2 são considerados
positivos.
4- Controle de qualidade em imuno-histoquímica
É recomendável que qualquer teste utilizado para propósitos clínicos deva
ser oferecido por laboratórios que sejam assegurados com certidão de alta
qualidade tanto por fiscalização interna, controle interno de qualidade, quanto
pela participação de um programa de controle externo da qualidade imuno-
histoquímica (ROMAIN et al. 1995; KOENDERS & THORPE 1983).

27
4.1- Controle interno de qualidade em imuno-histoqu ímica
Procedimentos internos de controle de qualidade devem ser adotados
pelos laboratórios que realizam imuno-histoquímica considerando-se vários
critérios, que incluem a padronização do método. Estes procedimentos, além de
fazerem parte do controle interno de qualidade do laboratório, podem ser
avaliados por serviços de avaliação externos como o Clinical Pathology
Accreditation (CPA), Reino Unido. Também é esperado que os laboratórios de
anatomia patológica fiscalizem parte de sua própria produção diária, e este
passo já é adotado em grande parte dos laboratórios. Por exemplo, o laboratório
pode fiscalizar uma proporção de biópsias selecionadas de maneira aleatória
(MAXWELL & McCLUGGAGE 2000). Durante esta fiscalização, serão avaliados
quesitos como veracidade dos dados do paciente, turnaround time, qualidade da
marcação imuno-histoquímica e representatividade da amostra tumoral
submetida ao teste (LIND et al. 1995; PRESCOTT et al. 1995; RAMSEY 1999).
É esperado que os laboratórios sigam protocolos de padronização para garantir
que a reação imuno-histoquímica seja de alta qualidade. Desta maneira,
anticorpos que apresentarem marcação aquém do esperado possam ser
identificados e providências serem tomadas, como a modificação de protocolos
ou até a exclusão daquele anticorpo da rotina do laboratório (MAXWELL &
McCLUGGAGE 2000). Até o momento, pouco foco tem sido dado à qualidade
da reação imuno-histoquímica em si e, com exceção da avaliação do
desempenho da rotina e checagem de positividade e negatividade dos controles.

28
Há poucas recomendações na literatura a respeito de controle interno de
qualidade em imuno-histoquímica (ROCHA 2009).
4.2- Controle externo de qualidade em imuno-histoqu ímica
No Reino Unido, o United Kingdom National External Quality Assessment
Service for Immunohistochemistry (UK-NEQAS-ICC) é responsável pela
coordenação do controle externo de qualidade em imuno-histoquímica em geral
e, mais recentemente, FISH para HER2. Este programa foi fundado em 1985 e,
em 1988, o programa foi reconhecido pelo Departamento de Saúde do Reino
Unido. A partir disto, o programa passou a ser denominado United Kingdom
National External Quality Assessment Service for Immunocytochemistry (UK
NEQAS-ICC) e mais recentemente, quando a hibridação in situ foi incluída no
programa, passou a ser denominado: UK NEQAS-ICC & ISH. O número de
laboratórios inscritos no programa aumentou muito nos últimos três anos. Ao
longo destes 20 anos tem ocorrido uma melhoria progressiva na qualidade das
colorações imuno-histoquímicas. Atualmente, mais de 70% dos laboratórios
produzem resultados aceitáveis para avaliação de receptor de estrógeno em
lâminas fornecidas pelo NEQAS contendo células de cultura. O NEQAS requer
que cada laboratório core secções de três tumores cujo status de receptor de
estrógeno já havia sido avaliado. As lâminas coradas são retornadas para serem
avaliadas por quatro dos avaliadores do NEQAS. Aos participantes também é
solicitado que se envie um exemplo de uma secção de tumor corada e seu

29
diagnóstico dado pelos analisadores do laboratório. 97% dos laboratórios
produzem colorações classificadas como aceitáveis em suas próprias secções,
mostrando que cada um tem adaptado eficientemente seus protocolos para suas
próprias condições.
Diversas razões técnicas, incluindo o método de reativação antigênica, a
concentração do anticorpo primário e a sensibilidade do sistema de visualização
podem causar variações importantes no resultado final da imuno-histoquímica.
Portanto, todas estas variações devem ser controladas cuidadosamente e o uso
de controles positivo e negativo é, então, imprescindível. O controle positivo
deve conter múltiplas amostras previamente avaliadas contendo diferentes
níveis de marcação para o anticorpo em teste. O uso de tecido com baixo escore
prévio para receptor de estrógeno é particularmente importante para se checar a
sensibilidade do método empregado e faz parte dos procedimentos de controle
interno do laboratório (BARNES et al. 1998). No entanto, a participação em
programas de controle externo são fundamentais tanto para o aprimoramento
técnico laboratorial quanto para o treinamento interpretativo dos resultados
obtidos na reação.
5- A importância das fases pré-analítica, analítica e pós-analítica
A imuno-histoquímica envolve as etapas pré-analítica, analítica e pós-
analítica. A fase pré-analítica compreende a fase de preparação do tecido e tem
como principal etapa a fixação. Problemas relacionados a esta etapa são os

30
principais responsáveis por baixa qualidade da reação imuno-histoquímica por
levar a marcações inespecíficas, danos na morfologia do tecido ou mesmo
ausência de marcação. Uma fixação ideal deve levar em consideração o tipo de
fixador, o seu tamponamento em pH ideal e o tempo de fixação do tecido
(ROCHA et al. 2008).
A fase analítica compreende as fases técnicas do ensaio
imunoistoquímico em si. Os problemas relacionados à fase analítica ou de
processamento da reação são os principais responsáveis por baixas avaliações
nos programas externos de controle de qualidade (HAMMOND et al. 2003;
RHODES et al. 2002; SEIDAL et al. 2001; WICK et al. 2002). Os principais
fatores a serem levados em consideração nesta etapa seriam: a escolha do
anticorpo primário e sua diluição, a escolha do método de reativação antigênica
e seus reagentes e, por fim, a escolha do sistema de visualização imuno-
histoquímica a ser utilizado.
A fase pós-analítica compreende a interpretação e quantificação dos
resultados. Falhas na interpretação da reação levam a dificuldade de
padronização da imuno-histoquímica e discordâncias entre laboratórios como
observado em programas de controle de qualidade externo (MILLER 2008).
Todas as etapas são importantes e ainda há grande variação nas
metodologias empregadas pelos diferentes laboratórios. Como resultado, a
padronização do método é variável e, ao se tratar de testes preditivos, irá
influenciar nas decisões terapêuticas de cada paciente.

31
6 - A tecnologia dos microarranjos de tecido (tissu e
microarrays, TMA)
O advento de estudos moleculares baseados no genoma de doenças
levou à identificação de centenas de moléculas potencialmente associadas com
o processo de doença. Surgiu então, a necessidade de analisar melhor estas
moléculas em amostras de tecido para elucidar sua importância como
biomarcadores ou alvos fisiológicos de prevenção baseados em drogas ou
tratamentos específicos. O TMA tem sido considerado uma etapa necessária à
consolidação do conhecimento adquirido através do mapeamento genético dos
estudos realizados com a técnica de “cDNA Microarrays”. Esta técnica determina
quais as dezenas ou centenas de genes estão superexpressos ou
hipoexpressos em um tumor e que poderiam ser responsabilizados por alguma
particularidade biológica, tais como o rápido crescimento, o potencial de
recorrência local ou de metástase à distância, ou ainda, resistência à
quimioterapia (SAUTER et al. 2002).
A técnica de tissue microarray (TMA) permite a análise retrospectiva em
larga escala da expressão protéica dos tumores através da imuno-histoquímica,
sendo possível conhecer a expressão de uma determinada proteína em até
1000 casos diferentes em apenas uma lâmina histológica. O TMA apresenta
acurácia comprovada que justifica seu emprego com amplas vantagens de custo
e tempo para os estudos retrospectivos de grandes centros ou estudos

32
cooperativos com grandes bancos de dados (BUBENDORF et al. 2001;
MILANES – YEARSLEY et al. 2002; SAPINO et al. 2006).
Em 1986, foi desenvolvida a técnica do sausage ou multi-tissue tumor
block (MTTB) (BATTIFORA et al. 1986), onde tecidos diferentes eram
processados juntos em um mesmo bloco de parafina de modo aleatório e não
ordenado. Esses blocos eram utilizados para teste de novos anticorpos e como
controle de qualidade das reações imuno-histoquímicas. Outros autores
aprimoraram esta técnica: cilindros de amostras eram retiradas de tecidos de
blocos de parafina pré-existentes e reembebidos em um novo bloco de forma
ordenada, com coordenadas pré-estabelecidas, tamanhos e formas regulares
(KONONEN et al. 1998). Havia um maior número e melhor preservação das
amostras e dos blocos, permitindo o estudo de um grande número de casos
analisando-se apenas uma ou poucas lâminas. Essa técnica adicionou a
vantagem de todas as amostras serem processadas em um mesmo momento e
em condições idênticas. Ainda, preserva o material remanescente para outras
pesquisas ou necessidades diagnósticas.
6.1- A construção dos TMA
Para a construção do TMA o pesquisador estuda as lâminas originais e
seleciona as áreas de interesse que representem o tumor. A seguir as áreas
selecionadas são identificadas nos blocos de parafina arquivados (bloco doador)
e um cilindro de tecido (que pode variar de 0,6mm a 2,0mm de diâmetro e 3 a 4

33
mm de comprimento) é retirado desta área com uma agulha acoplada a um
equipamento de precisão. Este cilindro é então introduzido em um novo bloco
(bloco receptor), previamente preparado com orifícios cilíndricos vazios. Os
cilindros dos vários casos são sucessivamente adicionados ao bloco receptor,
manualmente ou com a ajuda de aparelhos específicos, e a posição de cada
caso é identificada em uma planilha com referências de coluna e linha (eixos X e
Y). Ao fim, obtém-se um bloco receptor que pode conter até 1000 amostras
diferentes. Deste bloco são obtidos cortes histológicos seqüenciais numerados
em lâminas tratadas com adesivo que permitem a realização de reações imuno-
histoquímica, FISH, SISH ou CISH. É importante registrar o conjunto de fatores
histológicos relevantes e, eventualmente, prognósticos dos tumores
selecionados (idade do paciente, grau e diferenciação histológicos, grau nuclear,
margens, invasão vascular, etc.) e reclassificar as doenças quando necessário.
Este deve ser feito em arquivo ou planilha permanente para armazenar todas as
informações referentes a cada um dos cilindros que irão compor o TMA, com
suas coordenadas X e Y no bloco receptor (TROTER et al. 2002).
A leitura das lâminas dos TMA pode ser feita em microscopia óptica
convencional pelo pesquisador, seguindo a planilha previamente preparada com
as coordenadas X e Y, anotando os resultados encontrados em papel ou
diretamente na base de dados do computador. Vários grupos desenvolveram
métodos de arquivo digital de imagens com softwares de captura de imagens,
interpretação e armazenamento automatizado dos dados, permitindo rápida
correlação entre os dados armazenados previamente e os resultados obtidos,

34
revisão das imagens, quando necessário, estudos comparativos de
reprodutibilidade, etc. (LIU et al. 2002; MANLEY et al. 2001).
6.2 – TMA e câncer de mama
Os estudos para validação do método TMA no carcinoma da mama
demonstraram ser possível atingir 98% de concordância com as reações nos
cortes histológicos usuais para marcadores imunoistoquímicos como o receptor
de estrógeno e HER2, utilizando-se três amostras de 0,6mm de diâmetro de
cada caso. Quando se utilizaram apenas duas amostras a concordância obtida
foi de 94% (CAMP et al. 2000; De MARZO & FEDOR 2004). Apesar da
amostragem de mais de uma área nos carcinomas de mama ser importante para
que nos TMA esteja representada toda a heterogeneidade destes tumores,
estudos recentes mostraram alta concordância entre uma amostra de 0,6mm ou
2,0mm e os cortes habituais do bloco doador, e que a heterogeneidade
intratumoral não altera o status do HER2 utilizando as técnicas IHQ, CISH e
FISH (HENRIKSEN et al. 2006; LORING et al. 2005; SELVARAJAN et al. 2006;
ZHANG et al. 2003).
Atualmente o TMA tem sido amplamente utilizado para testes de
validação diagnóstica interlaboratoriais, principalmente FISH, CISH E imuno-
histoquímica para a detecção do status de receptores hormonais e HER2 em
grande número de casos, com padronização de protocolos das reações (DIAZ et
al. 2004; KAY et al. 2004; SAEZ et al. 2006) e para estudos comparativos entre

35
diferentes testes diagnósticos para amplificação gênica e superexpressão
protéica do HER2, bem como para a avaliação de receptores hormonais em
câncer de mama (ZHANG et al. 2003).
7 - A tecnologia de digitalização de lâminas histol ógicas
Apesar de muitos avanços no entendimento da evolução dos tumores, os
aspectos mais básicos da Anatomia Patológica têm se modificado de forma
relativamente modesta ao longo dos anos. O patologista supervisiona a
macroscopia do material fixado, desidratação em solventes orgânicos, inclusão
em parafina, microtomia e coloração. O tecido é então, usualmente, avaliado
utilizando um microscópio de luz comum. Então, o patologista libera um
diagnóstico e a lâmina e o bloco são encaminhados para o arquivo. Portanto, a
distribuição de material para consultoria, pesquisa ou ensino se torna laboriosa e
os patologistas restringem seu acesso apenas a material de casos disponíveis
localmente.
O termo “telepatologia” foi usado pela primeira vez em 1986 e, desde
então, tem-se notado aumento de interesse em tecnologias que tornem possível
a idéia de avaliar espécimes a distância. Até os anos de 1990, havia duas
formas de telepatologia: estática e dinâmica. Em telepatologia estática, o
patolgista capturava um pequeno número de imagens que eram transmitidos via
internet e analisadas em tempo real. A forma dinâmica podia ser realizada
utilizando um microscópio controlado remotamente por um patologista a

36
distância. O patologista consultor seria capaz de controlar o microscópio e
selecionar as imagens a serem vistas. Alguns microscópios ofereciam a função
de troca de filtros de diferentes cores ou aplicar diferentes modos de iluminação.
Alguns sistemas desta natureza ainda permitiam a análise simultânea por vários
observadores desde que apenas um comandasse o microscópio.
A nova era da telepatologia trouxe um novo conceito tecnológico: “as
lâminas digitais”. Lâminas digitais são espécimes microscópicos virtuais inteiros
que podem ser vistos e analisados pelo monitor de um computador. As lâminas
digitais podem ser acessadas pelo disco de memória do computador, CD-ROM,
DVD, discos removíveis ou mesmo de uma rede de servidor utilizada para
arquivamento de imagens e distribuição. Imagens digitais de campos adjacentes
em lâminas de cito e histopatologia são colocadas juntas, em ordem, para
formar uma montagem de imagem gigante, utilizando uma plataforma
escaneadora (digitalizadora) controlada por computador. Embora esta tecnologia
já exista há mais de uma década, este processo, também chamado de
digitalização de lâmina inteira, se tornou disponível comercialmente para
computadores comuns apenas em 1998, quando suficiente memória e
velocidade de processamento de dados também se tornaram disponíveis. Já
que o observador pode explorar o corte histológico inteiro, as lâminas digitais
substituem, com vantagens, as lâminas reais para fins educacionais, consultoria
a distância, e armários cheios de lâminas armazenadas. Recuperar uma lâmina
do arquivo se torna apenas uma questão de acessar um banco de dados virtual.
Além disso, são possíveis acessos simultâneos a uma lâmina digital por

37
diferentes observadores, localizados a distância (diferentes países, por
exemplo). Novos programas de computador estão sendo desenvolvidos e
podem desempenhar diversas funções como reconstrução de imagem em três
dimensões a partir de imagens obtidas pelo escaneador naquele mesmo campo
visual em múltiplos planos focais, segmentação de imagens, reconhecimento de
padrões morfológicos e recuperação de imagens (lâminas digitais) que
apresentem as mesmas estruturas identificadas em uma lâmina teste. Lâminas
digitais podem ainda ser usadas como importante ferramenta em programas de
controle externo de qualidade laboratorial. Soluções técnicas para um sistema
de visualização de lâminas digitais através da internet já foram desenvolvidas e
alguns exemplos estão disponíveis para avaliação pública.
O desenvolvimento de programas de computador para visualização e
análise das lâminas virtuais, capacidade de armazenamento virtual e também
dedicação, por parte dos fabricantes dos equipamentos, em promover
treinamentos para os usuários parecem representar os maiores desafios desta
nova tecnologia para os próximos anos (ROCHA et al. 2009).
8 – Aspectos éticos
Este estudo foi aprovado pelo Comitê de Ética em Pesquisa da
Universidade Federal de Minas Gerais sob número de processo: 510 / 04

38
Objetivos
39
Objetivos
Os objetivos do nosso estudo, bem como material e métodos, resultados
e discussão serão apresentados sob forma de trabalhos científicos aceitos em
periódico nacional e internacionais como segue especificado abaixo:
1 – Comparar os polímeros livres de biotina e os sistemas avidina-biotina para a
avaliação de receptor de estrógeno em câncer de mama através da
quantificação automatizada de intensidade de coloração imuno-histoquímica
utilizando microscopia virtual e softwares analisadores. (Applied Cancer
Research – In press)
2 – Comparar os polímeros livres de biotina e os sistemas avidina-biotina para a
avaliação de receptor de estrógeno em câncer de mama através do escore
manual de Allred empregando microscopia virtual e comparar esta avaliação
qualitativa com o valor numérico conseguido pela quantificação automatizada.
(Journal of Clinical Pathology – In press)
3 – Fazer uma análise da atual importância e potencias da patologia digital em
laboratórios de rotina e pesquisa em anatomia patológica, bem como para
processos educacionais e programas de controle externo de qualidade em
imuno-histoquímica (Pathology Research and Practice – In press;
Immunocytochemistry – In press).

40
Applied Cancer Research

41

42
The use of the immunohistochemical biotin-free visualization systems for estrogen receptor evaluation of breast cancer
Rafael Malagoli Rocha1,2,3 *, Keith Miller1, Fernando Soares2, José Vassallo2,4, Natália Shenka4, Helenice Gobbi3
1. University College London
UCL Advanced Diagnostics. 1st floor Rockefeller Building. 21 University Street. London, UK. WC1E 6JJ, UK
2. Hospital A C Camargo R. Professor Antônio Prudente, 109 São Paulo - SP – Liberdade, Brazil - CEP 01509-010
3. Universidade Federal de Minas Gerais Av. Prof. Alfredo Balena, 190 Belo Horizonte - MG – Brazil. CEP 30130-100
4. Universidade de Campinas
Rua Monteiro Lobato, 255 - Campinas - SP - Brazil - CEP 13083-862 * Corresponding author: [email protected]
Institution mailing address
Rafael Malagoli Rocha
Hospital A. C. Camargo
Departamento de Anatomia Patológica – 1º Andar
Rua Professor Antônio Prudente, 109
Liberdade – São Paulo – SP
CEP: 01509 – 900
FAX: (55)(11) 2189 5066
Telephone: (55)(11) 2189 5191

43
Abstract
Background: A novel generation of immunohistochemical visualization systems
based on a biotin-free polymeric (BFP) technology has been released recently.
We have compared the new BFP and the classical streptavidin-biotin systems
(SAB) to evaluate estrogen receptor in breast carcinomas. Methods: Serial
sections from a tissue microarray containing 320 invasive breast carcinomas
were stained by immunohistochemistry for estrogen receptor using the rabbit
monoclonal antibody SP1. Eleven different visualization systems were used,
including 7 BFP (the 2nd generation Advance, DAKOTM; Novolink, LeicaTM;
SuperPicTure, ZymedTM; PicTure Max, ZymedTM; Super Sensitive Non-Biotin
HRP, BiogenexTM and Mouse/Rabbit Polydetector HRP/DAB, CellMarqueTM; and
the 1st generation EnVision+ DAKOTM) and 4 SAB (LSAB+, DAKOTM; EasyPath,
SignetTM; Super Sensitive, BiogenexTM and Mouse/Rabbit Immunodetector
HRP/DAB, CellMarqueTM) following the instructions provided by the
manufacturers. All slides were scanned using Mirax Scan, Zeiss™, and the
intensity of immunohistochemistry staining was automated quantified using
HistoQuant™ software. The cytoplasm staining was visually evaluated as absent
(0), weak (1), moderate (2), or strong (3). Results: The BFP Advance and
Novolink, and the SAB LSAB+ showed the highest staining intensity among all
the systems (P<0.01). However, LSAB+ showed the highest cytoplasm staining
among them (p<0.01). The other 2nd generation BFP showed similar staining
intensities among them and also similar to the SAB. The 1st generation
44
EnVision+ showed the weakest staining intensity. The seven BFP showed
sharper signal without cytoplasm staining compared to all SAB systems (p<0.05).
BFP PicTureMAX showed the least cytoplasm staining. Conclusion: The BFP
provide sharper and better localized immunohistochemical signal without
cytoplasm staining compared to the SAB. The BFP Advance and Novolink
showed the strongest staining intensity and, followed by all the other 2nd
generation BFP, represent a powerful tool for immunohistochemistry
standardization of estrogen receptor evaluation of breast carcinomas.
Key words: immunohistochemistry, automated image analysis, visualization
systems

45
Introduction
The success of immunohistochemistry is largely a result of a development
of reliable markers and of highly sensitive visualization procedures. The
demonstration of antigens in tissues and cells by immunostaining is a two step
process involving first, the binding of an antibody to the antigen of interest, and
second, the detection and visualization of bound antibody by one of a variety of
enzyme chromogenic systems. The choice of visualization systems will impact
the sensitivity, utility, and ease-of-use of the method, including also reduction in
incubation times [1].
Developments in immunohistochemistry techniques, especially antigen
retrieval methods, and sensitive visualization systems, have allowed the
detection of very small quantities of protein. The staining intensity depends on
the staining procedures used in addition to the protein content itself [2]. The
mostly used streptavidin-biotin visualization systems are based on the sequential
application of biotinylated link antibody and streptavidin labeled with one or two
molecules of alkaline phosphatase or peroxidase. These conventional biotin-rich
procedures advertise the advantage that streptavidin presents high affinity for
biotin [DakoCytomation Product Catalog 2005/2006].
Recently, a novel generation of polymeric biotin-free visualization systems
has been released. The polymer-based, biotin-free detection reagent is based on
polymeric technology, which uses compact enzyme-antibody conjugates. They
are based in a polymeric HRP, which is a unique enzyme-conjugated polymer

46
backbone that also carries secondary antibody molecules [3]. The polymeric
visualization systems are claimed to achieve signal amplification and thereby an
enhanced sensitivity by increasing the number of enzyme molecules which are
conjugated to the secondary antibody. According to the suppliers, endogenous
biotin will not affect polymeric staining results due to their biotin-free
characteristic.
In this study, we aimed to compare the performance of the biotin-free
polymeric visualization system kits to the streptavidin-biotin-system kits for
evaluating estrogen receptor using an automated image analysis system.
Material and Methods
Case Selection
Three hundred and twenty cases of invasive breast carcinomas,
diagnosed between 1990 and 2005, were randomly selected from the files of the
Breast Pathology Laboratory of Federal University of Minas Gerais, Medicine
School of Campinas University and Cancer Hospital A.C. Camargo of São Paulo,
Brazil. All original slides were reviewed to confirm the diagnosis and to select
representative areas of tumors. One cylinder (1mm diameter) of each tumor with
representative area of neoplasia was selected from paraffin blocks to build a
tissue microarray (TMA). Two cylinders of tumors from previously tested and
whose results were positive and negative were also included as internal controls
for the TMA. Sequential 4µm sections were obtained and stained for hematoxylin

47
and eosin (first and last sections) to confirm diagnosis, and the interval sections
were used for the immunohistochemical study. Slides containing full sections of
previously tested positive breast tumor were included in all batches as external
control.
Immunohistochemical Procedures
The sections were mounted on glass slides coated with silane (3-
aminopropyltriethoxysilane) and dried for 30 minutes at 37ºC. The sections were
deparaffinized in xylene and rehydrated via a series of graded alcohols.
Endogenous peroxidase activity was blocked by following the procedures and the
reagents supplied by each visualization system manufacturer. All sections were
initially submitted to heat-induced epitope retrieval in steamer for 25 minutes
under the same environment conditions. Each manufacturer supplied its antigen
retrieval reagents, which were all citrate pH = 6.0. The rabbit monoclonal
antibody SP1, RocheTM, against estrogen receptor, was used as primary
antibody for all the visualization systems. Preliminary testing was performed in
our laboratory to identify the best concentration for the primary antibody and to
choose the negative and positive controls using the dilution data supplied by the
manufacturer as the starting point. The best primary antibody dilution achieved
was 1:300 and this dilution was used for all the visualization systems for a 30
minute incubation. After washing the primary antibody with phosphate buffered
saline (PBS), the slides were incubated with the reagents supplied by the
manufacturers of each visualization system following all the procedures and
48
incubation times suggested in the specification sheets. Eleven different
visualization systems were used, including seven biotin-free polymer systems
(the 2nd generation: Advance, DAKOTM; Novolink, LeicaTM; SuperPicTure,
ZymedTM; PicTure Max, ZymedTM; Super Sensitive Non-Biotin HRP, BiogenexTM
and Mouse/Rabbit Polydetector HRP/DAB, CellMarqueTM; and the 1st generation:
EnVision+ DAKOTM) and four streptavidin-biotin systems (LSAB+, DAKOTM;
EasyPath, SignetTM; Super Sensitive, BiogenexTM and Mouse/Rabbit
Immunodetector HRP/DAB, CellMarqueTM) as shown in Table 1. Freshly
prepared DAB solution was applied following the procedures and incubation
times suggested. DAB was removed by rinsing with distilled water. The slides
were counterstained with hematoxylin, dehydrated in ethanol, cleared in xylene
and mounted using Entelan™.

49
Table 1: Specification, type, and supplier of each visualization system
Visualization System
Type
Supplier
EnVision+ Biotin-free polymer 1st generation
Dako, Carpinteria, CA, USA
Advance Biotin-free polymer 2nd generation
Dako, Carpinteria, CA, USA
NovoLink Biotin-free polymer 2nd generation
Leica, New Castle, UK
SuperPicTure Biotin-free polymer 2nd generation
Zymed, San Francisco, CA, USA
PicTure Max Biotin-free polymer 2nd generation
Zymed, San Francisco, CA, USA
Super Sensitive non-biotin HRP
Biotin-free polymer 2nd generation
Biogenex, San Ramon, CA, USA
Mouse/Rabbit Polydetector HRP/DAB
Biotin-free polymer 2nd generation
CellMarque, Rocklin, CA, USA
LSAB + Streptavidin-biotin based system
Dako, Carpinteria, CA, USA
EasyPath Streptavidin-biotin based system
Signet, Dedham, MA, USA
Super Sensitive Streptavidin-biotin based system
Biogenex, San Ramon, CA, USA
Mouse/Rabbit Immunodetector
HRP/DAB
Streptavidin-biotin based system
CellMarque, Rocklin, CA, USA
Immunostaining Analysis
All slides submitted to immunohistochemistry were labeled, and the
examiner was blinded to the visualization system used. The automated analysis
was made using digital microscopy to quantify the intensity of
immunohistochemical staining. All the slides were digitalized using Mirax Scan

50
(developed and produced by 3DHISTECH Ltd., Budapest, Hungary; distributed
worldwide by Carl Zeiss, Jena, Germany) and the images provided by the
software were exhibited in an LCD monitor under contrast, focus, saturation, and
white balance standardization.
To evaluate the intensity of staining, the image analysis system
HistoQuant™, 3DHISTECH™, Budapest, Hungary, was used (Figure 1). The
software identified the immunohistochemical staining to be quantified by
minimizing background-staining artifacts using image filters. Since the software
recognizes the positive nuclei staining of all different intensities, the quantification
was processed in each TMA spot automatically by the software and all the
numerical data was exported to a Microsoft Excel file.
Figure 1: The same TMA spot in 200x magnification. A) Original immunohistochemical staining. B) Selected positive nuclei to have their intensity of immunohistochemical staining numerically quantified.
The cytoplasm staining was semi-quantitatively evaluated as absent (0),
weak (1), moderate (2), and strong (3) by creating a TMA project, which exhibits
each TMA spot at a time on the computer screen (Figure 2).

51
Figure 2: TMA project built in Mirax Viewer software. A) All slides in the background and a window containing the scoring scheme proposed for the background staining evaluation. B) 320 ordered and numerated TMA spots from one single slide shown individually in the screen. C) The same TMA spots shown in higher magnifications. D) One single TMA spot ready to be analyzed. The scoring scheme is shown in the picture footnote and a 400x magnification of this spot is shown in the window on the top. Statistical Analysis
The Software WINKS – Statistical Data Analysis, Version 6.0, was used for the
statistical analysis. Wilcoxon test was used to compare the different groups of
paired variables. Chi-Square test was used to evaluate the difference in
frequencies of score among the groups of categorical variables of the cytoplasm
staining evaluation.

52
Ethics
The procedures described in this section are in compliance with the
Helsinki Declaration and are also in accord with the ethical standards established
by the institutions where this study took place.
Results
The biotin-free polymeric visualization systems Advance and Novolink
showed the strongest staining intensity together with the SAB LSAB+, which
showed stronger staining intensity among all streptavidin-biotin systems and also
among most of the polymeric systems. The polymeric systems PicTure Max and
Super Sensitive Non-Biotin HRP showed up intermediate staining intensity
similarly to the streptavidin-biotin system Super Sensitive. The polymeric
systems SuperPicTure and Mouse/Rabbit Polydetector HRP/DAB showed low
intermediate staining intensity similarly to the streptavidin-biotin systems
Mouse/Rabbit Immunodetector HRP/DAB and EasyPath. The polymer EnVision+
showed the weakest staining intensity among all the visualization systems.
All visualization systems and p values of statistical analysis are shown in
Table 2 according to their intensity of immunohistochemical staining.
The polymeric systems showed a sharper nuclear signal with no
cytoplasm staining when compared to streptavidin-biotin systems (p<0.01). The

53
biotin-free polymer PicTure MAX, Zymed™, showed the least cytoplasm staining
and the streptavidin-biotin LSAB+ showed the most (p<0.01).
Table 2: Eleven different visualization systems grouped according their staining
intensity level expressed by the p value
Staining intensity level Biotin-free polymer system
(p value*) Streptavidin-biotin polymer (p value*)
Stronger
Advance (0.0034) NovoLink (0.0061)
LSAB+ (0.03)
Up intermediate
Super Sensitive non-biotin HRP (0.01) PicTure Max (0.01)
Super Sensitive (0.02)
Low intermediate
SuperPicTure (0.01) Mouse/Rabbit Polydetector (0.01)
Mouse/Rabbit imunodetector EasyPath
Weaker
EnVision+
---------
* p value of the statistical analysis between the staining intensity of each visualization system and the group of systems from the level below. There was no significant difference between the staining intensity of the polymeric systems and the streptavidin-biotin systems of the same level, neither between two systems of the same level group.
Discussion
The present study showed that highly sensitive visualization systems
enhanced immunohistochemistry staining intensity. We have compared the kits
of biotin-free polymeric visualization systems to the conventional streptavidin-

54
biotin-system kits to evaluate estrogen receptor in breast carcinomas. Due to the
great number of different reagents and protocols from all the visualization system
kits, every immunohistochemical reaction was carried out manually in the same
environmental conditions. Since we wanted to compare the efficacy of the
combination between the particular retrieval method and the visualization system
provided by each kit, all the procedure steps, times and reagents supplied by
each manufacturer were followed accordingly.
Interpretation of immunohistochemistry is usually done manually and is,
therefore, dependent on the experience and ability of the interpreter.
Computerized image analysis systems have been used since the late 1980s and
were shown to provide a more accurate means of quantification of ER [14, 15].
Quantification of immunohistochemistry for ER using different types of image
analysis has also shown strong agreement with manual scoring from
experienced observers [16]. According to our automated quantification, the
biotin-free Advance and Novolink showed the strongest staining intensity among
the polymers. Advance, a ready-to-use, peroxidase-based visualization system is
compatible with suitably diluted rabbit and mouse primary antibodies. According
to its manufacturer, it is a super-sensitive, non-biotin based,
immunohistochemical visualization system that is useful for the detection of
antigens in low concentrations, for short incubation time or for higher dilution of
primary antibodies. It consists of two main reagents: an HRP Link, which
contains anti-mouse and anti-rabbit secondary antibodies in a Tris-HCl buffer and
stabilizing protein and an anti-microbial agent, and an HRP Enzyme, which

55
contains antibodies polymerized with horseradish peroxidase in a Tris-HCl buffer
and stabilizing protein and anti-microbial agent [DakoCytomation Product
Catalog 2005/2006]. None of the biotin-free polymer systems employed in this
study supply a link antibody between the primary and the polymer, except by
Advance™ and PicTure Max polymer, Zymed™. This might be one reason for
the increased staining intensity observed. Advance™ kit also supplies an
enhancer reagent, which acts in DAB, and may provide improvements in
sharpness and staining intensity. According to Leica datasheet, the polymer
Novolink contains increased number of peroxidase molecules bound to an
activated dextran backbone with lack of major gaps among them to improve
chromogen reaction, and that might contribute for increasing staining intensity in
this visualization system reactions. Novolink kit also supplies the Post Primary
Block, which is used to enhance penetration of the subsequent polymer reagent
and might be one reason for its high performance. On the other hand, the 1st
generation polymer EnVision+, which does not supply a link antibody neither an
enhancer, and yet shows larger gaps among its peroxidase molecules bound to
the dextran backbone, showed the weakest staining intensity among the
polymers tested in our study.
Our results show that some polymers present equivalent staining intensity
to streptavidin-biotin systems according to the automated image analysis (Table
2). It is relevant to mention that the polymeric systems present macromolecules
containing secondary antibodies and nearly 100 enzyme molecules polymerized
in a dextram backbone, while the streptavidin biotin systems present up to four

56
enzyme molecules bound to one molecule of streptavidin. This great difference in
molecule size might result in different membrane penetration capacities between
these two groups of visualization systems. Although the presence of biotin is the
cause of important background and cytoplasm staining in some tissues, the high
affinity between streptavidin and biotin may be the most important reason for the
strong staining intensity observed in some streptavidin biotin visualization system
reactions compared to some biotin-free polymers.
All the polymeric visualization systems used in this study showed sharper
staining without cytoplasm staining when compared to the streptavidin-biotin
systems. This may be explained by the fact that the polymers utilize a novel
controlled polymerization technology to prepare polymeric HRP-linker antibody
conjugates, which are free of biotin. Therefore, the problem of non-specific
staining that can appear with streptavidin-biotin visualization systems due to
endogenous biotin does not occur. However, streptavidin from the kit and
endogenous biotin may bind to each other leading to background and cytoplasm
staining in most tissues when streptavidin-biotin visualization systems are used
[17]. As an example, the streptavidin-biotin system LSAB+, which showed one of
the highest staining intensity among the systems, also shows the highest
cytoplasm staining among all of them. That applies unreliability to the reaction.
Certainly, adjustments could be made in order to reduce or eliminate cytoplasm
staining seen in LSAB+, such as reducing primary antibody dilution associated
with increased incubation time.

57
According to some authors, besides allowing cheaper
immunohistochemical assays, the high dilutions of the primary antibodies
achieved by the systems shown to present stronger staining intensity also enable
more reliability to the results. High dilutions prevent background and cytoplasm
staining, formation of electrostatic or other non-immunological non-specific
bonds, or unexpected cross reactivities (specially with polyclonal primary
antibodies) [18].
Last but not least, an additional advantage of the polymeric systems would
be the reduction of the staff workload and assay time due to the fewer number of
steps present in their protocol.
In the lights of these results, the kits of biotin-free polymeric visualization
systems provide sharper immunohistochemical signal without cytoplasm staining
when compared to the streptavidin-biotin-system kits. They present variable
staining intensity among them due to their differences in molecule structures,
reagent types and concentrations, and buffers supplied in the kit. Advance and
Novolink were seen to present the highest staining intensity among the biotin-
free systems and, followed by the other polymers of second generation,
represent a powerful tool for clinical testing and research work. They can
contribute to immunohistochemistry standardization of estrogen receptor
evaluation of breast cancer.

58
Competing interests
The authors declare that they have no competing interests'. The authors
have no relationship with the manufacturers of the visualization systems cited in
the manuscript.
Acknowledgements
We are grateful to the financial support provided by Fundação de Amparo
à Pesquisa do Estado de Minas Gerais (FAPEMIG), Fundação de Amparo à
Pesquisa do Estado de São Paulo (FAPESP), Conselho Nacional de
Desenvolvimento Científico e Tecnológico (CNPq), and Coordenação de
Aperfeicoamento de Pessoal de Nível Superior (CAPES), Brazil.

59
References
1. Shi SR, Gu J, Kalra KL, Chen T, Cote RJ, Taylor CR: Antigen retrieval
technique: a novel approach to immunohistochemistry on routinely
processed tissue sections. Cell Vision 1995,2:6-22
2. Umemura S, Itoh J, Itoh H, Serizawa A, Saito Y, Suzuki Y, Tokuda Y,
Tajima T, Osamura RY: Immunohistochemical evaluation of hormone
receptors in breast cancer: which scoring system is suitable for highly
sensitive procedures? Appl Immunohistochem 2004,12:8-13
3. Petrosyan K, Tamayo R, Joseph D: Sensitivity of a novel biotin-free
detection reagent (Powervision+y) for immunohistochemistry. J
Histotechnol 2002,25:247-250
4. Cheang MCU, Treaba DO, Speers CH, Olivotto IA, Bajdik CD, Chia SK,
Goldstein LC, Gelmon KA, Huntsman D, Gilks CB, Nielsen TO, Gown AM:
Immunohistochemical detection using the new rabbit monoclonal antibody
SP1 of estrogen receptor in breast cancer is superior to mouse
monoclonal antibody 1D5 in predicting survival. J Clin Oncol
2006,24:5637-5644

60
5. Gouvea AP, Milanezi F, Olson SJ, Leitao D, Schmitt FC, Gobbi H:
Selecting Antibodies to Detect HER2 Overexpression by
Immunohistochemistry in Invasive Mammary Carcinomas. Appl
Immunohistochem 2006,14:103-108
6. Nunes CB, Rocha RM, Reis-Filho JS, Lambros M, Rocha GFS, Sanches
FSF, Oliveira FN, Gobbi H: Comparative analysis of six different
antibodies against Her2 including the novel rabbit monoclonal antibody
(SP3) and chromogenic in situ hybridisation in breast carcinomas. J Clin
Pathol 2008,61:934-938
7. Rocha RM, Nunes CB, Rocha GFS, Oliveira FN, Sanches FSF, Gobbi H:
Rabbit monoclonal antibodies show higher sensitivity than mouse
monoclonals for estrogen and progesterone receptor evaluation in breast
cancer by immunohistochemistry. Pathol Res Prac 2008,204:655-662
8. Vassallo J, Pinto GA, Alvarenga M, Zeferino LC, Chagas CA, Metze K:
Comparison of immunoexpression of 2 antibodies for estrogen receptors
(1D5 and 6F11) in breast carcinomas using different antigen retrieval and
detection methods. Appl Immunohistochem 2004,12:177-182
9. von Wasielewski R, Mengel M, Wiese B, Rüdiger T, Müller-Hermelink HK,
Kreipe H: Tissue Array Technology for Testing Interlaboratory and

61
Interobserver Reproducibility of Immunohistochemical Estrogen Receptor
Analysis in a Large Multicenter Triall. Am J Clin Pathol 2002,118:475-482
10. Cattoretti G, Pileri S, Parravicini C, Becker MHG, Poggi S, Bifulco C, Key
G, D'Amato L, Sabattini E, Feudale E, Reynolds F, Gerdes J, Rilke F:
Antigen unmasking on formalin-fixed, paraffin-embedded tissue sections.
J Pathol 1993,171:83-98
11. Rhodes A, Jasani B, Couturier J, McKinley MJ, Morgan JM, Dodson AR,
Navabi H, Miller KD, Balaton AJ: A formalin-fixed, paraffin-processed cell
line standard for quality control of immunohistochemical assay of HER-
2/neu expression in breast cancer. Am J Clin Pathol 2002,117:81-89
12. Kim SH, Kook MC, Shin YK, Park SH, Song HG: Evaluation of antigen
retrieval buffer systems. J Mol Histol 2004,35:409- 416
13. Hall PA, McCluggage WG: Assessing p53 in clinical contexts: unlearned
lessons and new perspectives. J Pathol 2005,208:1-6
14. Bacus S, Flowers JL, Press MF, Bacus JW, McCarty-JR KS: The
evaluation of estrogen receptor in primary breast carcinoma by computer-
assisted image analysis. Am J Clin Pathol 1988,90:233-239

62
15. McClelland RA, Wilson D, Leake R, Finlay P, Nicholson RI: A multicentre
study into the reliability of steroid receptor immunocytochemical assay
quantification. Eur J Cancer 1991,27:711-715
16. Gokhale S, Rosen D, Sneige N, Diaz LK, Resetkova E, Sahin A,
Albarracin LJ, Constance T: Assessment of Two Automated Imaging
Systems in Evaluating Estrogen Receptor Status in Breast Carcinoma.
Appl Immunohistochem 2007,15:451-455
17. Ramos-Vara JA: Technical Aspects of Immunohistochemistry. Vet Pathol
2005,42:405-426
18. Sabattini E, Bisgaard K, Ascani S, Poggi S, Piccioli M, Ceccarelli C, Pieri
F, Fraternali-Orcioni G, Pileri SA: The EnVision++ system: a new
immunohistochemical method for diagnostics and research. Critical
comparison with the APAAP, ChemMate, CSA, LABC, and SABC
techniques. J Clin Pathol 1998,51:506-511

63
Journal of Clinical Pathology

64

65
BIOTIN-FREE SYSTEMS PROVIDE STRONGER IMMUNOHISTOCHEMICAL SIGNAL IN ESTROGEN RECEPTOR EVALUATION OF BREAST CA NCER
Rafael Malagoli Rocha1, 2, 3 *, Keith Miller2, Fernando Soares3, Natália Schenka4,
José Vassallo3, 4 , Helenice Gobbi1
1. Universidade Federal de Minas Gerais (UFMG), Belo Horizonte, Brazil 2. University College London (UCL), London, UK 3. Hospital do Câncer A. C. Camargo, São Paulo, Brazil 4. Laboratory of Investigative and Molecular Pathology, CIPED, FCM,
Universidade Estadual de Campinas (Unicamp), Campinas, São Paulo, Brazil
Corresponding author: Rafael Malagoli Rocha E-mail: [email protected]
Av. Prof. Alfredo Balena, 190 Belo Horizonte - MG - Brasil Cep 30130-100 Key words: Breast cancer, Immunohistochemistry, visualization systems,
estrogen receptor, digital microscopy

66
Abstract
Aims: Biotin-free polymeric visualization systems (BFPS) were compared to
streptavidin-biotin systems (SABS) in the evaluation of immunoreactivity for
estrogen receptor (ER) in breast carcinomas. Methods: The anti-estrogen
antibody clone SP1 was employed on a tissue microarray containing 320 breast
carcinomas. Eleven different detection systems were used: six BFPS of second
generation (Advance, Novolink, SuperPicTure, PicTure Max, Super Sensitive
Non-Biotin HRP, and Mouse/Rabbit Polydetector HRP/DAB), one BFPS of first
generation (EnVision+), and four SABS (LSAB+, EasyPath, Super Sensitive, and
Mouse/Rabbit Immunodetector HRP/DAB). The slides were digitalized using the
Mirax scanner and the resulting images were analyzed both by an automated
method and by visual analysis using the Allred´s score system considering
positive nuclear staining. Cytoplasm staining was also separeted evaluated.
Results: The BFPS Advance and Novolink showed the highest scores by visual
analysis, and additionally detected two positive cases which were considered
negative using the other detection systems. Likewise, these systems, together
with the SAB LSAB+, showed higher staining intensity by the automated method.
BFPS revealed no cytoplasm staining, in opposition to the SABS. Conclusions:
The second generation BFPS, especially Advance and Novolink, provide
stronger and sharper nuclear immunohistochemical signal as compared to most
SABS, without nonspecific cytoplasm staining. As in few instances these
detection systems show discordant results in relation to SABS, further studies
correlating these findings to therapeutic response are necessary. BFPS may

67
represent a high quality tool both for research and clinical evalutation of estrogen
receptor in breast cancer.
Copyright Transfer statement:
The Corresponding Author has the right to grant on behalf of all authors and
does grant on behalf of all authors, an exclusive licence on a worldwide basis to
the BMJ Publishing Group Ltd and its Licensees to permit this article (if
accepted) to be published in JCP editions and any other BMJPGL products to
exploit all subsidiary rights, as set out in the licence
(http://jcp.bmjjournals.com/ifora/licence.dtl).
Competing Interest
None to declare

68
Introduction
The broadly used streptavidin-biotin visualization systems (SABS) are
based on the sequential application of a biotinylated link antibody to streptavidin
conjugated to one or two molecules of alkaline phosphatase or horseradish
peroxidase (HRP). These conventional biotin-rich procedures profit from the high
chemical affinity between streptavidin and biotin. On the other hand, variable
nonspecific cytoplasm staining may be detected, especially in biotin rich tissues,
as liver and kidney. Recently, new generation of polymeric biotin-free
visualization systems (BFPS) have been commercially released. BFPS are
based on the polymeric technology, using a compact polymer backbone linked to
the enzyme (e. g., HRP) and to an antibody.[1, 2] These polymeric visualization
systems are claimed to achieve signal amplification and thereby an enhanced
sensitivity by increasing the number of enzyme molecules, which are conjugated
to the secondary antibody. Additionally, endogenous biotin does not represent a
drawback, as in SABS, and there is a reduction in incubation steps.[3]
In spite of the importance of the choice of visualization systems, which
embody an impact on technical feasibility, sensitivity, and interpretation of
immunohistochemical specimens, there are only few reports on the use of biotin-
free visualization systems.[1, 4, 5] Since they appear to have significant practical
clinical relevance, we have comprehensively investigated their comparative
sensitivity to the SABS in the immunohistochemical evaluation of estrogen
receptor alfa (ER) in breast cancer.

69
Materials and Methods
Case Selection and Immunohistochemical Procedures
Three hundred and twenty cases of invasive breast carcinomas,
diagnosed between 1990 and 2005, were randomly selected to build one tissue
microarray (TMA). Slides containing whole sections of previously tested ER
positive and negative breast tumors were included in the batch as external
control.[6] The present study was approved by the Ethics Committee of the
institutions, and performed according to the standard ethical procedures.
Two cylinders of 1mm were obtained from each tumor to build the TMA
(Beecher Instruments™, Sun Prairie, WI, USA). Sequentially, 4µm thick sections
of the TMA were submitted to immunohistochemical detection of ER using the
rabbit monoclonal antibody SP1 (diluted at 1:300; RocheTM, Tucson, Arizona,
USA). Eleven different visualization systems were used, including six biotin-free
polymer systems of second generation (Advance, DAKOTM; Novolink, LeicaTM;
SuperPicTure, ZymedTM; PicTure Max, ZymedTM; Super Sensitive Non-Biotin
HRP, BiogenexTM and Mouse/Rabbit Polydetector HRP/DAB, CellMarqueTM), one
biotin-free polymeric system of first generation (EnVision+ DAKOTM), and four
streptavidin-biotin systems (LSAB+, DAKOTM; EasyPath, SignetTM; Super
Sensitive, BiogenexTM and Mouse/Rabbit Immunodetector HRP/DAB,
CellMarqueTM). Specifications of the visualization systems used in the present
study are shown on Table 1. All slides were incubated with the peroxidase block
supplied by the manufacturers of each visualization system for 5 minutes. All

70
antigen retrieval reactions were performed in steamer, using citrate buffer pH=6.0
for 25 minutes. The incubation time was 30 minutes for the primary antibody and
also for all reagents of each visualization system. Chromogen (DAB) supplied by
each manufacturer was applied for 5 minutes and counterstaining (Harrys
hematoxilin) for 2 seconds. All immunohistochemistry reactions were performed
simultaneously in order to avoid any bias in the results due to the order of testing
or differences in environmental conditions.
Table 1 : Specification, type, and supplier of each visualization system used in
the present study
Visualization System
Type
Supplier
EnVision+ Biotin-free polymer 1st generation
Dako, Carpinteria, CA, USA
Advance Biotin-free polymer 2nd generation
Dako
NovoLink Biotin-free polymer 2nd generation
Leica, New Castle, UK
SuperPicTure Biotin-free polymer 2nd generation
Zymed, San Francisco, CA, USA
PicTure Max Biotin-free polymer 2nd generation
Zymed
Super Sensitive non-biotin HRP
Biotin-free polymer 2nd generation
Biogenex, San Ramon, CA, USA
Mouse/Rabbit Polydetector HRP/DAB
Biotin-free polymer 2nd generation
CellMarque, Rocklin, CA, USA
LSAB + Streptavidin-biotin based system
Dako
EasyPath Streptavidin-biotin based system
Signet, Dedham, MA, USA
Super Sensitive Streptavidin-biotin based system
Biogenex
Mouse/Rabbit Immunodetector
HRP/DAB
Streptavidin-biotin based system
CellMarque

71
HRP: horseradish peroxidase; DAB: diaminobenzidine; LSAB: labeled streptavidin-biotin system
Immunostaining Analysis
All slides submitted to immunohistochemistry were labeled for blinded
examination concerning the visualization system used. All slides were digitalized
using the Mirax Scan (Carl Zeiss™, Jena, Germany) and the images provided by
the software were exhibited on a LCD monitor under standardized contrast,
focus, saturation, and white balance. Both automated image quantification and
the visual scoring were made using the images obtained.
To evaluate the staining intensity, the image analysis system
HistoQuant™ (3DHistech™, Budapest, Hungary) was used. This software
identifies the immunohistochemical staining to be quantified by minimizing
background-staining artifacts through image filters. Since the software
recognizes the positive nuclei staining of all different intensities, the quantification
was processed in each TMA spot automatically by the software.[7-9] Numerical
data of staining intensity average corresponding to each spot were exported to a
Microsoft Excel file (Figure 1).
For the visual evaluation of positivity, a TMA project was programmed
according to the Allred scoring system.[10] Briefly, this system consists of
correlating intensity of staining and number of stained cells for the
immunohistochemistry evaluation of estrogen receptor in breast cancer,
considering negative scores 0 and 2, and positive scores from 3 to 8. The TMA
project exhibits each spot at a time on the screen for evaluation together with the

72
scoring scheme bar shown in the screen footnote (Figure 2). The visual
evaluation was performed by a biomedical researcher (RMR, UK-NEQAS
assessor) and 20% of all spots were double checked by a breast pathologist
(HG) resulting in high agreement of scoring. All data resulting from this
evaluation were exported to an Excel file and the agreement with the automated
quantification analysis was verified statistically.
Cytoplasm staining was also visually evaluated as absent (0), weak (1),
moderate (2), and strong (3) using the TMA project.

73
74
Figure 1: Caption of TMA spot from a scanned virtual slide observed in
HistoQuant Software for staining intensity quantification at 400x. The primary
antibody SP1 and Advance visualization system were employed in this slide. A)
Image ready for positive nuclei recognition; B) Positive nuclei already recognized
and quantification of immunohistochemical staining intensity being processed.

75

76
Figure 2: Virtual slide processed in the TMA Project built in the Mirax Viewer
Software. The primary antibody SP1 and Novolink visualization system were
employed in this slide. A) 320 numerated TMA spots shown individualized on the
screen. B) One single TMA spot ready to be scored according to the Allred
scoring system (picture footnote).
Statistical Analysis
The Software WINKS – Statistical Data Analysis, Version 6.0, was
employed. The Wilcoxon test was used to compare the different groups of paired
parametric and nonparametric variables. The Chi-Square test was applied to
evaluate the difference in frequencies of scored values among the groups.
Correlation coefficient of Pearson was used to verify the correlation between the
different types of analyses.
Results
Taken together, median age of patients was 55y (range 32-77y). 115/320
patients were pre-menopausal and 205/320 menopausal. Stage of disease was I
in 202 patients, II in 91 and III in 27. Tumor size presented a median of 12 mm
(range 2-50 mm). All cases corresponded to the ductal type. Histological grade
was I in 125 patients, II in 163 and III in 32.
According to the automated quantification analysis, the BFPS Advance
and Novolink showed the strongest staining intensity together with the

77
streptavidin-biotin LSAB+. The latter showed stronger staining intensity among all
SABS and also among most BFPS. The BFPS PicTure Max and Super Sensitive
Non-Biotin-HRP showed intermediate staining intensity, similarly to the SABS
Super Sensitive. The polymeric systems SuperPicTure and Mouse/Rabbit
Polydetector HRP/DAB showed low intermediate staining intensity similarly to the
streptavidin-biotin systems Mouse/Rabbit Immunodetector HRP/DAB and
EasyPath. The polymer EnVision+ showed the weakest staining intensity among
all the visualization systems. All values obtained by automated quantifying the
intensity staining of the different visualization systems and the p values are
summarized on Table 2. Examples of staining from all visualization systems can
be seen in Figure 3.
The visual scoring showed high correlation with the automated
quantification (r = 9.1). When evaluating positivity, the BFPS Advance and
Novolink showed 2 positive cases (3+), which had been considered negative
when evaluated using the other visualization systems (0 or 1+). We could also
separate the visualization systems in three different groups according to the
similarities of scoring values achieved by each system evaluated statistically. The
first one includes the BFPS Advance and Novolink, which showed the highest
scores (p<0.01) together with LSAB+ (not included in this group for showing also
high level of cytoplasm staining). The second group includes the SuperPicTure,
Mouse/Rabbit Polydetector, Super Sensitive non-biotin HRP and PicTure Max,
which showed similar scores and there were no discrepancies in positivity among
them (p<0.05). The third group includes all SABS, which showed higher

78
cytoplasm staining compared to all BFPS (p<0.01) and, apart from LSAB+,
showed similar scores among each other (p<0.05). LSAB+ showed the highest
scores among the SABS (p<0.01) and also higher than the BFPS included in the
second group (p<0.05). However, it also showed the highest cytoplasm staining
among all systems (p<0.01). The EnVision+ system provided the weakest
staining intensity among all systems (p<0.01).
The BFPS showed a sharper nuclear staining with no cytoplasm staining,
when compared to the SABS. The biotin-free PicTure MAX showed the least
cytoplasm staining (p<0.05).

79
Table 2: Comparison of eleven different visualization systems grouped according
to their staining intensities *
Staining
intensity level Biotin-free polymer system Streptavidin-biotin syst ems
Stronger
Advance
(49,55 + 16,69; p = 0.0034)
NovoLink
(43,8 + 10,17; p = 0.0061)
LSAB+
(45,3 + 8,98; p = 0.03)
Up
intermediate
Super Sensitive non-biotin HRP
(39,5 + 9,34; p = 0.01)
PicTure Max
(34,8 + 13,37; p = 0.01)
Super Sensitive
(37,7 + 13,81; p = 0.02)
Low
intermediate
SuperPicTure
(31,6 + 10,1; p = 0.01)
Mouse/Rabbit Polydetector
(31,2 + 5,89; p = 0.01)
Mouse/Rabbit immunodetector
(31,7 + 7,1)
EasyPath
(31,8 + 11,67)
Weaker
EnVision+
(29,5 + 5,43)
---------
* The mean intensity values among all cases for each visualization system, standard deviation and p values are referred in parenthesis; p value expresses the statistical analysis between the staining intensity of each visualization system and the group of systems from the level below. There was no significant difference between the staining intensity of the polymeric systems and the

80
streptavidin-biotin systems of the same level, neither between two systems of the same level group.

81
Figure 3: Intensity of immunohistochemical staining in the same tumor using 11
different visualization systems and the rabbit monoclonal primary antibody
SP1observed in the objective of 40x: A) Advance, B) EasyPath, C) EnVision, D)
LSAB+, E) Novolink, F) PicTure Max, G) Super Sensitive non-biotin HRP, H)
Mouse/Rabbit Polydetector HRP/DAB, I) Super Sensitive, J) Mouse/Rabbit
Immunodetector HRP/DAB, K) SuperPicTure.
Discussion
Previous studies have compared various commercially available primary
antibodies against ER, PR, and HER2, the most clinically relevant predictive
markers used in breast cancer.[5, 11-14] Our group itself has carried out a
comparison study between different mouse and rabbit ER and HER2 antibodies
including the most widely used and recommended by external quality control
programs.[13, 14] According to these previous results, in addition to other
author’s results,[11] we were able to select SP1 as a reliable antibody for the
present study. On the other hand, few studies have been carried out to compare
different types of visualization systems in immunohistochemistry.[4, 5] In the
present study, we have compared the novel BFPS with the conventional SABS to
evaluate ER immunohistochemical status in breast carcinomas.
All SABS supply a biotinylated secondary antibody against primary rabbit
and mouse IgG and all BFPS also supply a secondary antibody against primary
rabbit and mouse IgG, however it is bound to their biotin-free dextran backbone,
except by Advance and PicTure Max, which supply a free secondary link

82
antibody against primary mouse and rabbit IgG. In their case, the polymer will
bind this secondary antibody via tertiary antibody bound to the backbone.
According to our results, the BFPS Advance and Novolink showed the
strongest staining intensity. These ready-to-use, peroxidase-based visualization
systems are compatible with suitably diluted rabbit and mouse primary
antibodies. According to the manufacturer, Advance consists of two main
reagents: a HRP-Link, which contains anti-mouse and anti-rabbit secondary
antibodies in a Tris-HCl buffer, and a HRP-Enzyme, which contains antibodies
polymerized with horseradish peroxidase in a Tris-HCl buffer. All BFPS employed
in this study do not supply a link antibody, which connects the primary antibody
to the antibody bound to the dextran backbone of the polymer, except for the
Advance and PicTure Max. This might be one reason for the increase of staining
intensity observed in this system. Also, the main characteristic of the second-
generation polymers, having an increased number of peroxidase molecules
bound to an activated dextran backbone without major gaps among them, might
improve chromogen reaction and increase staining intensity.[5] In addition, the
first generation polymer EnVision+, which does not present a link antibody and
yet shows larger gaps among its peroxidase molecules bound to the dextran
backbone, showed the lowest staining intensity among all detection systems
used here. Additionally, other reagents supplied in some polymer kits may be
important in increasing the staining intensity. The polymer Novolink contains
increased number of peroxidase molecules bound to an activated dextran
backbone, lacking major gaps among them, in order to improve chromogen

83
reaction. That might contribute for the increased staining intensity in this
visualization system. Novolink also supplies the Post Primary Block, which is
used to enhance penetration of the subsequent polymer reagent and might be
another reason for its high performance.
In our study, the superior nuclei staining intensity observed with the
polymers, as compared to those stained with most SABS, might be explained by
the fact that the conventional biotin-rich visualization systems provide a
secondary antibody to which fewer enzyme molecules are bond. Instead, the
polymeric systems may achieve signal amplification by increasing the number of
enzyme molecules conjugated to the secondary antibody through a dextran
backbone.[3, 15, 16]
According to our results, the Advance and Novolink received the greatest
scores among all the visualization systems, together with LSAB+, and also
showed 2 positive cases (3+), which were scored negative (0 and 2+, which is
not clinically significant according to Allred 10) using the other detection systems.
Since the anti-hormone therapy is dependent on ER positive result by
immunohistochemistry [17-19], the choice of the most sensitive and reliable
combination between the detecting primary antibody and the visualization system
happen to be of crucial importance according to these findings. However, the
strong staining achieved by some visualization systems does not necessarily
mean that this system is the best one. Further validation studies correlating these
findings to therapeutic response need to be done in order to determine the most
suitable combination between the primary antibody and its visualization system.

84
Of note, a high concordance rate was achieved between the automated and the
Allred’s visual evaluations, a fact that further supports the clinical feasibility of the
latter. It is not possible to assure that those two positive cases in which the
visualization system were Advance and Novolink did not represent false positive
nuclear staining. This issue should be more precisely addressed by comparing
immunohistochemical reactions to gene expression assays, which are not
feasible in the present retrospective study. However, we tried to achieve the most
reliable reactions by performing negative controls, which were placed in the TMA
and also in external slides. Furthermore, non specific reactions occur mostly also
in the cytoplasm of cells, a feature that was not observed in our two cases and
negative controls.
All polymeric visualization systems used in our study provided sharper
staining intensity without cytoplasm staining. This may be explained by the fact
that the polymers utilize a novel controlled technology to prepare polymeric HRP-
linker antibody conjugates, which are free of biotin. Therefore, the problem of
nonspecific staining that can appear with SABS due to endogenous biotin does
not occur. In opposition to that, streptavidin from the kit and endogenous biotin
may bind to each other leading to background and cytoplasm staining in most
tissues when SABS are used.[4, 5, 20, 21]
The high dilutions of the primary antibodies achieved by the polymers also
enable more reliability to the results, since very high dilutions prevent
background and cytoplasm staining, formation of electrostatic or other non-
immunological non-specific bonds, or unexpected cross reactivities (specially

85
with polyclonal primary antibodies).[4, 13, 22] An additional advantage of the
polymeric systems should be the reduction of the staff workload and assay time
due to the smaller number of steps needed for the procedure.
In light of these results, the BFPS second generation provide stronger
immunohistochemical signal when compared to most SABS. In addition, the
BFPS present an unambiguous lack of cytoplasm staining, allowing regarding
these systems as powerful tools both for daily clinical routine and for research
work. The BFPS may contribute to a more accurate standardization of
immunohistochemical evaluation of estrogen receptor status in breast cancer.
Competing interests
The authors declare that they have no competing interests. The authors
have no financial or political relationship with the manufacturers of the
visualization systems used in the study.
Funding
Conselho Nacional de Desenvolvimento Científico e Tecnológico (CNPq),
Coordenação de Aperfeiçoamento de Pessoal de Nível Superior (CAPES), and
Fundação de Amparo a Pesquisa do Estado de São Paulo (FAPESP), Brazil.

86
References
1. King G, Payne S, Walker F, et al. A highly sensitive detection method for
immunohistochemsitry using biotinylated tyramine. J Pathol 1997;183:237-
41.
2. Petrosyan K, Tamayo R, Joseph D. Sensitivity of a novel biotin-free
detection reagent (Powervision+y) for immunohistochemistry. J
Histotechnol 2002;25:247-50.
3. Shi SR, Gu J, Kalra KL, et al. Antigen retrieval technique: a novel
approach to immunohistochemistry on routinely processed tissue sections.
Cell Vision 1995;2:6-22.
4. Sabattini E, Bisgaard K, Ascani S, et al. The EnVision++ system: a new
immunohistochemical method for diagnostics and research. Critical
comparison with the APAAP, ChemMate, CSA, LABC, and SABC
techniques. J Clin Pathol 1998;51:506-11.
5. Vassallo J, Pinto GA, Alvarenga M, et al. Comparison of
immunoexpression of two antibodies for estrogen receptors (1D5 and
6F11) in breast carcinomas using different antigen retrieval and detection
methods. Appl Immunohistochem 2004;12:177-82.

87
6. von Wasielewski R, Mengel M, Wiese B, et al. Tissue Array Technology
for Testing Interlaboratory and Interobserver Reproducibility of
Immunohistochemical Estrogen Receptor Analysis in a Large Multicenter
Triall. Am J Clin Pathol 2002;118:475-82.
7. Bacus S, Flowers JL, Press MF, et al. The evaluation of estrogen receptor
in primary breast carcinoma by computer-assisted image analysis. Am J
Clin Pathol. 1988;90:233-239.
8. Gokhale S, Rosen D, Sneige N, et al. Assessment of Two Automated
Imaging Systems in Evaluating Estrogen Receptor Status in Breast
Carcinoma. Appl Immunohistochem. 2007;15:451-455.
9. McClelland RA, Wilson D, Leake R, et al. A multicentre study into the
reliability of steroid receptor immunocytochemical assay quantification.
Eur J Cancer. 1991;27:711-715.
10. Harvey JN, Clarck GM, Osborne CK, et al. Estrogen receptor status by
immunohistochemistry is superior to the ligand binding assay for
predicting response to adjuvant endocrine therapy in breast cancer. J Clin
Oncol. 1999;17:1474-1481.
11. Cheang MCU, Treaba DO, Speers CH, et al. Immunohistochemical
detection using the new rabbit monoclonal antibody SP1 of estrogen

88
receptor in breast cancer is superior to mouse monoclonal antibody 1D5 in
predicting survival. J Clin Oncol 2006;24:5637-44.
12. Gouvea AP, Milanezi F, Olson SJ, et al. Selecting Antibodies to Detect
HER2 Overexpression by Immunohistochemistry in Invasive Mammary
Carcinomas. Appl Immunohistochem 2006;14:103-8.
13. Nunes CB, Rocha RM, Reis-Filho JS, et al. Comparative analysis of six
different antibodies against Her2 including the novel rabbit monoclonal
antibody (SP3) and chromogenic in situ hybridisation in breast
carcinomas. J Clin Pathol 2008;61:934-8.
14. Rocha RM, Nunes CB, Rocha GFS, et al. Rabbit monoclonal antibodies
show higher sensitivity than mouse monoclonals for estrogen and
progesterone receptor evaluation in breast cancer by
immunohistochemistry. Pathol Res Prac 2008;204:655-62.
15. Cattoretti G, Pileri S, Parravicini C, et al. Antigen unmasking on formalin-
fixed, paraffin-embedded tissue sections. J Pathol 1993;171:83-98.
16. Rhodes A, Jasani B, Couturier J, et al. A formalin-fixed, paraffin-
processed cell line standard for quality control of immunohistochemical

89
assay of HER-2/neu expression in breast cancer. Am J Clin Pathol
2002;117:81-9.
17. Fisher B, Redmond C, Fisher ER, et al. Relative worth of estrogen or
progesterone receptor and pathologic characteristics of differentiation as
indicators of prognosis in node negative breast cancer patients: findings
from National Surgical Adjuvant and Bowel Project Protocol B-06. J Clin
Oncol 1988;7:1076-87.
18. Goldhirsch A, Glick JH, Gelber RD, et al. Meeting highlights: international
consensus panel on the treatment of primary breast cancer. J Clin Oncol
2001;19:3817-27.
19. Walker RA. Immunohistochemical markers as predictive tools for breast
cancer. J Clin Pathol 2008;61:689-96.
20. Kim SH, Kook MC, Shin YK, et al. Evaluation of antigen retrieval buffer
systems. J Mol Histol 2004;35:409- 16.
21. Wood GS, Warnke R. Suppression of endogenous avidin-binding activity
in tissues and its relevance to biotin-avidin detection systems. J
Histochem Cytochem. 1981;29:1196-1204.

90
22. Umemura S, Itoh J, Itoh H, et al. Immunohistochemical evaluation of
hormone receptors in breast cancer: which scoring system is suitable for
highly sensitive procedures? Appl Immunohistochem. 2004;12:8-13.
Pathology – Research and Practice

91

92
DIGITAL SLIDES: PRESENT STATUS OF A TOOL FOR
CONSULTATION, TEACHING, AND QUALITY CONTROL IN
PATHOLOGY
Rafael Rocha 1,2,3, José Vassallo 2,4, Fernando Soares 2, Keith
Miller 3, Helenice Gobbi 1
1- Department of Pathology Universidade Federal de Minas Gerais, Brazil
2- Department of Pathology, Hospital do Câncer A. C. Camargo, Brazil
3- University College London, UK
4- Laboratory of Investigative and Molecular Pathology, CIPED, State University
of Campinas Medical School, Brazil
• Adress for correspondence:
Dr. Rafael Malagoli Rocha
Rua Professor Antônio Prudente, 109
Depto Anatomia Patológica, 1º andar
Liberdade, São Paulo – SP
Brazil
CEP: 01509-900
KEY WORDS: telepathology, review, surgical pathology, teaching, morphometry

93
ABSTRACT
In the last years, telepathology has benefited from the progress in the technology
of image digitalization and transmission through the world web. The applications
of telepathology and virtual imaging are more current in research and
morphology teaching. In surgical pathology daily practice this technology has still
limits, and is more often used for case consultation. In the present review, it is
intended to discuss its applications and challenges for pathologists and
scientists. Much of the limitations of virtual imaging for the surgical pathologist
reside in the capacity of storage of images, which so far hinders the more
widespread use of this technology. Overcoming this major drawback may
revolutionize surgical pathologist’s activity and slide storing.

94
INTRODUCTION
Despite numerous advances in the understanding of disease processes,
most basic aspects of Anatomic Pathology have changed relatively modestly
over time. The pathologist supervises the gross dissection of the tissue, which is
fixed, dehydrated in organic solvents, embedded in paraffin, sectioned and
stained. The tissue specimen is typically examined directly using a light
microscope, then the pathologist renders a diagnosis, and the glass slide and
paraffin blocks are inevitably relegated to some cumbersome archive. A similar
system is employed for Cytopathology, a method which presents the additional
problem of being mostly irreplaceable. Thus, the distribution of material for
consultative, investigative or teaching purposes remains laborious, and, to a
large extent, pathologists only have access to locally available case material for
comparison in difficult cases [52].
With the introduction of in situ molecular methods in daily practice, especially
immunohistochemistry in the 1970s, this scene has begun to change. The year
2000 marked a turning point, at which pathologists began to spend less time in
front of light microscopes rendering diagnoses and more time multitasking in
front of computers. Although pathologists and their microscopes have been a
hallmark of quality medical care for more than a century, the march of time and
supervening technologies may alter the way Pathology is practiced in the years
ahead [47]. Telepathology surely represents one of such technologies.

95
The term “telepathology” was first used in 1986, in an editorial of a journal of
Pathology [42]. It was followed shortly thereafter by a report in another journal
foreseeing in which way telepathology should be used to create the diagnostic
networks that were implemented a decade later [7, 9]. Over the past 15 years,
there has been increasing interest in technologies that make it possible to
examine specimens at a distance.
Up to the 90s, there used to be two forms of telepathology imaging: static and
dynamic [11, 33, 43, 46]. In static-image, the referring pathologist captured a
small set of digital images that were transmitted and visualized at real time. The
dynamic form of telepathology could be carried out by a remotely controlled real
microscope. The remote consultant pathologist was able to control the
microscope stage and to select the images to be viewed. Some microscopes
provided the functionality for selecting various color filters or applying different
illumination modes. They also allowed the simultaneous viewing of a slide by
multiple clients, although only one client could control the microscope [52].
The new era of telepathology has brought a novel technology concept: the digital
slides. Digital slides are virtual entire microscope specimens that can be viewed
on a computer screen. They can be accessed from the computer’s hard disk,
transportable media (CD-ROM, DVD or memory sticks), or, more practically, from
a network server used for image archiving and distribution. [16, 22, 28, 23, 6, 19].
Digital images of adjacent fields in cyto- and histopathological slides are
assembled together to form a giant image montage, using a computer controlled
scanning stage. Although this technology has existed for more than a decade,

96
this process, also called whole-slide digitization, has been commercially available
for standard desktop computing only since 1998, when sufficient memory and
processing speed became available. As the user can explore the entire
microscopic section, the digital slides substitute with advantages the real ones in
educational venues, remote consultation and may replace cabinets full of slides
[23]. Retrieving a slide becomes just a matter of accessing the proper database
[38]. It can provide simultaneous access to the slides by multiple users, away
from each other, who can access and individually manipulate the same slide or
different slides at the same time. In addition, new software modules can be
added to perform various types of further processing, as three dimensional image
reconstruction from data found in multiple focal planes and on multiple
microscope slides, image segmentation and pattern recognition to better
characterize known malignancies, and content-based image retrieval, to find all
slides with features similar to those in a sample slide [5, 15, 16]. Digital slides
can also be used in interlaboratory quality assurance programs. Technical
solutions for a web based digital slide viewing system also have been presented,
and some examples are available for public evaluation [16, 20, 21, 22, 28, 48,
49].
In the present review, it is intended to present the applications and challenges for
pathologists and scientists with the advent of this new technology.

97
WEB BASED VIRTUAL MICROSCOPY
A digital slide system for public web access is composed of 3 parts: a digital slide
acquisition system that acquires the images, a digital slide server that makes the
acquired images available on the web, and finally a digital slide client that
enables the user to browse the digital slide. The maximum quality of a digital
slide is defined by the following factors:
1. Quality of the section.
2. Completeness: the real slide should be accessible as a whole.
3. Image quality: sharpness, contrast, colors, and other attributes of the digital
slide should not rank behind those of a real microscope.
4. Usability, for example, smoothly scrolling images, short access times,
orientation, several options of magnification.
All these factors are weighted differently by each pathologist. Quality is
satisfactory if the pathologist is able to make a correct diagnosis or if the image
quality is identical to a real microscope image [28]. In a survey carried out by the
Armed Forces Institute of Pathology (AFIP) on 1250 electronic consultations it
was shown that major problems were represented by inadequate focus and
resolution of images [8]. Evidently, the quality of the section itself finally
determines the quality of the resulting digital slide [28]. Using a web-based zoom
viewer, digital slides can be magnified from 0.625X to 40X and moved in an x–y
axis on the computer screen, thus emulating the examination of a glass slide with
a traditional microscope [12, 13, 18, 50, 22, 44].

98
Some examples of web-based virtual microscopy are:
http://patho.med.uni-magdeburg.de, www.3dhistech.com, www.pathonet.org,
www.uiowa.edu, and www.uscap.org.
DIGITAL SLIDE BASED ROUTINE SURGICAL PATHOLOGY – FICTION OR
REALITY?
In his review article, O’Brien stated that the computerization of the histology
laboratory was desirable but it would be a reality just far in the future [34]. In
2001, some authors already affirmed that complete automated slide digitization
had influenced all levels of clinical practice and education, and they also
emphasized the importance of dedicated software technology [22]. More
recently, digital slides and digital microscopy technology have already been used
in selected cases for telepathology consultation. It is reasonable to foresee that,
after the definition of time and storage requirements, the routine use of this
technique can also be considered [6]. Up to date, some issues need to be
developed in order to apply the digital slide technology to clinical practice in a
more efficient way, such as:
1. Development of new user-friendly software suitable to the routine workflow
in a faster and practical way.
2. Development of software, which can be linked to the laboratory database.
3. Improvement in scanning speed.
99
4. Improvement of the computers’ or external servers’ capacity for data
storage.
5. Development of economical scanners and software.
The convenience of quickly analyzing conventional slides on conventional
microscopes by the pathologists may cause resistance against such a new
technology. The current high cost of the scanners associated with deficiencies in
non user-friendly software may be an important reason for the delay in broadly
validating the scanning systems. Also, the process of scanning the material is a
significant additional cost of time and labor to the traditional processing costs.
Recently, the Aperio scanning system and its image analysis software, one of the
commercially available equipments, received the approval of the U. S. Food and
Drug Administration (FDA) for digital evaluation of HER2 and hormone receptors
by immunohistochemistry (www.fda.gov). In spite of the above cited necessary
improvements and further validation studies, this fact represents an important
shift from research to efficient clinical practice employing digital slides.
DIGITAL SLIDES FOR PATHOLOGY EDUCATION
Traditional glass slides and standard microscopes have been used in pathology
education for many decades. However, this has been problematic, because
stains fade over time, they get damaged, are sometimes difficult to duplicate,
may be hard to distribute, and the quality of microscopes provided for
educational purpose is often poor. Early in the last century, photomicroscopy

100
enabled the pathologist to avoid some of these pitfalls and to extend the
availability of microscopic observations in the form of traditional black and white
photographs and 35 mm slides. The dynamic interaction between the viewer and
the glass slide, however, is severely limited by the use of static images. Viewing
static images does not faithfully reproduce the intellectual process through which
information is gathered and analyzed from the perceptual evaluation of the entire
information contained in the glass slide. It cannot substitute the process of
visually scanning the image at varying magnifications or comparing different
areas of the glass slide to reach a final impression of the pathologic process.
With the advent of digitized images during the past few decades, static digital
images on CD-ROMs or on the internet have begun to replace traditional
photographs in pathology education, without the disadvantages of glass slides.
Recent advances in digital microscopy have permitted the generation of very
large images that can be captured by robotic photomicroscopes to create “digital”
slides. The digital slide is often so large that a special viewing application,
referred to as a virtual microscope, is required [17].
Even not using digital slides, web-based educational methods have been
developed for pathology, cytology, surgery, nursing, radiology, emergency
medicine, and anatomy, allowing continued medical education, patient
information, and self-assessment in these subjects [1, 3, 4, 24, 29, 30, 31, 32,
35, 36, 37, 39, 45, 53, 54]. Steinberg et al [53] reported their experience at the
Johns Hopkins School of Medicine with an interactive case- and web-based
approach to teach cytopathology to second-year medical students. Preliminary

101
results were encouraging, as the students have enjoyed the experience and
increased their knowledge on the matter. Kronz et al developed another web-
based tutorial for practicing pathologists that has been very effective in improving
practitioners’ ability to provide Gleason grading to images of needle biopsy
prostate carcinoma specimens [26]. With the same purpose, a digital atlas of
breast histopathology has been published (www.webmicroscope.net/breastatlas)
[32]. Web-based image technology has also allowed to assess inter-observer
agreement of diagnosis [2, 25].
Starting in 1998, the course on Pathophysiology of Disease at UCLA’s School of
Medicine was reorganized to take advantage of rapidly developing web-based
technologies permitting more efficient distribution of standardized teaching
materials to a large group of students. The “individual microscopic sessions” of
the pulmonary pathophysiology course were replaced by self-instructional,
interactive laboratory sessions using web-based technology and case-based
instruction. These sessions replaced traditional microscopic teaching using
multiheaded microscopes and multiple instructors, requiring only one
pneumologist and one pathologist, who discuss the cases with the students with
great benefit [4].
HISTOPATHOLOGY QUALITY ASSURANCE USING DIGITAL SLIDES
Professional proficiency testing has become an integral part of continuous
professional development in all medical specialties in the United Kingdom and
North America. Ideally, proficiency should be measured on the same “task”

102
material for each individual. In the United Kingdom, for example, national quality
assurance scheme in breast screening pathology comes close to the ideal
practical solution. In this scheme, all consultant histopathologists involved in
management of breast disease are confidentially assessed twice a year by
examining two sets of 12 microscopic slides selected from the spectrum of breast
diseases. Individual consultant’s diagnoses on these slides are compared with
the consensus diagnosis of 19 experts in breast pathology. A traditional
evaluation including more than 400 pathologists would easily take about five
months to be completed. The disadvantages are easy to anticipate: circulation of
slides by mail to all participants; variability of morphologic representation in the
consecutive sections, especially in focal lesions; difficulty in circulating more
infrequent processes or interesting lesions detected in small biopsy specimens.
For these reason, the use of digital slides represents a powerful tool for the
assessment of diagnostic accuracy and quality control programs.
As the quality assurance scheme provided by the College of American
Pathologists (CAP) already employ telepathology by supplying images to be
evaluated by the pathologists via web (static pathology), the leaders of the United
Kingdom National External Quality Assessment Service (UK-NEQAS) have
demonstrated interest in digital slides as a tool for receiving the laboratories’
stains and to send them to referees residing in different corners of the world.

103
AUTOMATED IMAGE ANALYSIS APPLIED TO DIGITAL SLIDES
Automated histological analysis has proved to be an important research tool,
and, more recently, software capable of identifying, isolating, and quantifying
different types of stains has become suitable for routine diagnostic practice.
Our group has carried out a study on immunohistochemical staining intensity in
digital slides using commercially available software. We have used the Mirax
Scanner™ to digitalize the slides, the software Mirax Viewer™ for viewing and
isolating the tissue microarray spots, and the software HistoQuant™ for the
automated quantification of staining, all from 3DHistech™ (Budapest, Hungary).
We have quantified the immunohistochemical staining for estrogen receptor in
breast carcinomas using 11 different types of visualization systems in order to
identify the strongest stains. Numerical data of staining intensity average
corresponding to each spot obtained by the software was exported to a Microsoft
Excel file, and compared to the visual scoring system proposed by Allred [27].
Correlation between both scoring was high (r=9.1), supporting the reliability of the
software. However, no cut-off value to consider a case estrogen receptor positive
for therapeutic purposes in breast cancer could be defined as yet [40].
So far, no image analysis software has allowed the establishment of cut-off
values for immunhistochemical evaluation in routine diagnosis. Moreover, the
identification of the target cells to be included in the analysis still represents a
challenge. As validation studies on the reliability of each commercially software
released are made, the offer of improved and user-friendly image analyzers can
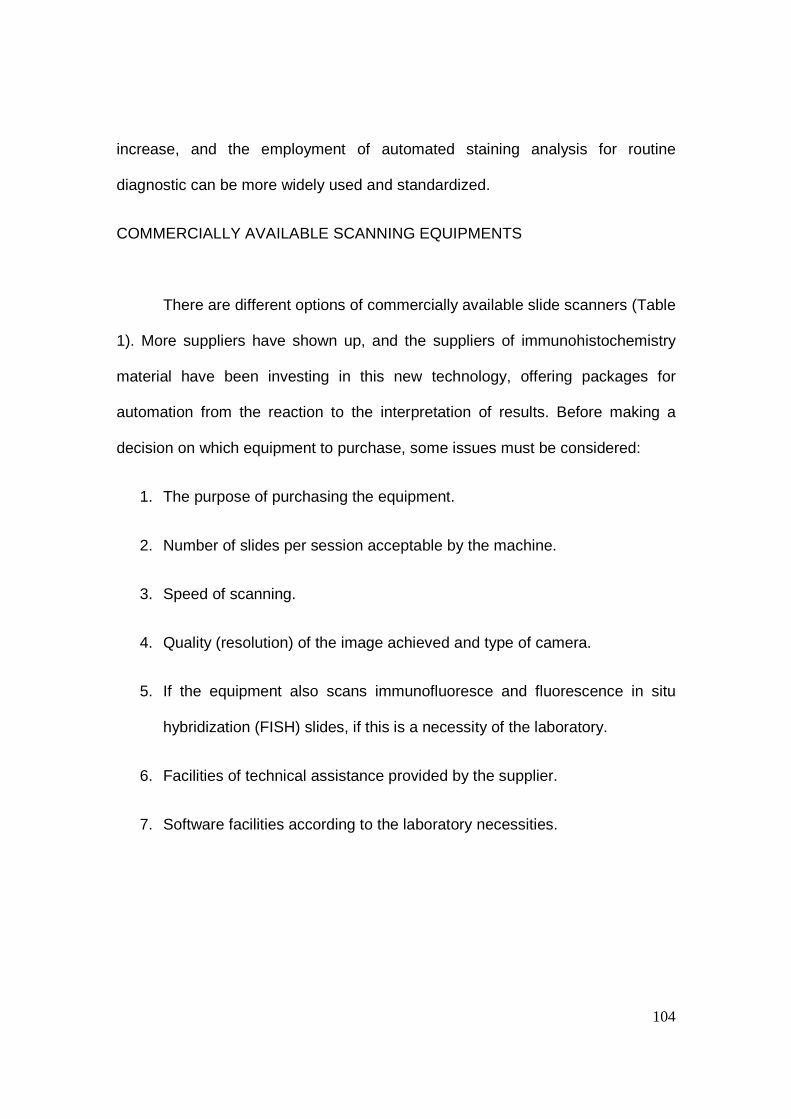
104
increase, and the employment of automated staining analysis for routine
diagnostic can be more widely used and standardized.
COMMERCIALLY AVAILABLE SCANNING EQUIPMENTS
There are different options of commercially available slide scanners (Table
1). More suppliers have shown up, and the suppliers of immunohistochemistry
material have been investing in this new technology, offering packages for
automation from the reaction to the interpretation of results. Before making a
decision on which equipment to purchase, some issues must be considered:
1. The purpose of purchasing the equipment.
2. Number of slides per session acceptable by the machine.
3. Speed of scanning.
4. Quality (resolution) of the image achieved and type of camera.
5. If the equipment also scans immunofluoresce and fluorescence in situ
hybridization (FISH) slides, if this is a necessity of the laboratory.
6. Facilities of technical assistance provided by the supplier.
7. Software facilities according to the laboratory necessities.

105
Table 1: Examples of commercially available slide scanners and suppliers.
Equipment Supplier
Acis DAKO, Carpinteria, CA, USA
Aperio ScanScope Aperio, Vista, CA, USA
Mirax Scanner 3DHistech, Budapest, Hungary
NanoZoomer Leeds, Minneapolis, MN, USA
FUTURE CHALLENGES
While hardware for digitizing tissue samples and microscopy slides more
effectively are rapidly becoming commercially available, software support
required to store, retrieve, and process digitized slides, providing optimal
interactive response times, remains a challenging issue. At the basic level, the
system should emulate the usual behavior of a conventional microscope,
including continuously moving the slide, changing magnification and focus. The
processing for viewing a slide requires projecting high resolution data onto a grid
of suitable resolution (governed by the desired magnification) and appropriately
compositing pixel mapping onto a single grid point, to avoid introducing spurious
artifacts into the displayed image. The main difficulty in providing the basic
functionality is storing and processing the extremely large quantities of data
required to digitalize a large collection of slides [52]. Since the equipments are
made to scan the slides at high magnification (20 or 40X) and multiple focal
planes in depth, one single digital slide may vary from 3 to 50 gigabytes. Thus,

106
storage needs are exacerbated by the fact that hospitals can generate many
thousands of slides per year. For example, at the Johns Hopkins Hospital
(Baltimore, MD, USA) the histology laboratory processes 420 000 routine,
special-stain, and immunohistochemical slides per year. Clearly there is an
enormous storage requirement. Due to this massive need for storage space,
there are also attendant difficulties in achieving rapid response time for various
types of inquiries into the slide image database [38, 52].
Such new technology may bring different expectations for the next few years and
some human barriers may be important in the consolidation of the universe of
digital slides. Difficulties of working with non user friendly software, concerns
about how this technology would affect the smaller laboratories and how far it
could go on replacing human expertise may be topics to worry about. It is
expected that the suppliers provide proper training to the real and potential
customers and also quality control program organizers regarding the usage of
the hardware and software as well as invest in research for developing new
software which are more user friendly and reliable. Also, lectures, conferences
and satellite symposia on the subject should be provided aiming to achieve as
many people as possible. The idea of receiving a brand new technology may
seem chaotic especially for those who are completely used to conventional
methods. However, in a gradual, smooth, and continued way, not the people
themselves, but the concept of work manner can change in the experts’ minds,
since technology, such as any type of culture, has got a dynamic characteristic.

107
According to all this, developments of more efficient software for slide viewing
and analysis, information storage capacity, and also dedication from the
suppliers in training processes and advertisements might be the greatest
challenges for this new technology in the next few years.
TAKE HOME MESSAGES
• Digital slides associated with imaging software are being widely used for
research practice in the last three years. Although some systems have
received the FDA approval for such practice, its usage for diagnostic
routine is still restricted.
• Digital slides have been progressively used for educational purpose
throughout the web, and allow identical images in numerous different
computer screens, do not get damaged, and do not cause problems for
storage or retrieval.
• Digital slides represent a promising tool for quality assurance schemes,
avoiding problems and costs related to conventional mail. Assessors will
be able to access digital slides from their own office decreasing travel
costs and time.
• Software for image analysis can be easily applied to digital slides for
research purposes and, more recently, for routine diagnosis.
• Two main challenges can be pointed for the next few years: the
development of new software, which should be more user friendly, and

108
suitable to research and routine needs; and improvement of image
storage capacity of hard disks.
ACKNOWLEDGMENTS
Conselho Nacional de Desenvolvimento Científico e Tecnológico (CNPq),
Coordenação de Aperfeiçoamento de Pessoal de Nível Superior (CAPES),
Fundação de Amparo a Pesquisa do Estado de São Paulo (FAPESP), Hospital
A. C. Camargo, Brazil.
REFERENCES
1. A. Cumbo, P. Agre, J. Dougherty, Online cancer patient education:
Evaluating usability and content. Cancer Pract 10 (2002) 155-161
2. A. de la Taille, A. Viellefond, N. Berger, et al., Evaluation of the
interobserver reproducibility of Gleason grading of prostatic
adenocarcinoma using tissue microarrays. Hum Pathol 34 (2003) 444-449
3. A. Mehrabi, H. Schwarzer, C. Herfarth, et al., Development of an
international net-based medical information system for advanced surgical
education. Stud Health Tech Inform 81 (2001) 312-314
4. A.M. Marchevsky, A. Relan, S. Baillie, Self-instructional “Virtual Pathology”
laboratories using web-based technology. Hum Pathol 34 (2003) 423-429

109
5. A.W. Wetzel, P.L. Andrews, M.J. Becich, et al., Computational aspects of
pathology image classification and retrieval. J. Supercomput 11 (1997)
279-293
6. B. Molnar, L. Berczi, C. Diczhazy, et al. Digital slide and virtual microscopy
based routine and telepathology evaluation of routine gastrointestinal
biopsy specimens. J Clin Pathol 56 (2003) 433-438
7. B.E. Dunn, H. Choi, U.A. Almagro, et al., Telepethology networking in
VISN-12 of the Veterans Health Administration. Telemed J e-Health 6
(2000) 349-354
8. B.H. Williams, F.G. Mullick, D.R. Butler, et al., Clinical evaluation of an
international static image-based telepathology service. Hum Pathol 32
(2001) 1309-1317
9. B.H. Williams, The AFIP center for telemedicine application pathology for
the twenty-first century. Telemed Virtual Reality. Virtual Real 3 (1998) 64-
65
10. CCD Resolution for Optical Microscopy,
http://www.microscopyu.com/tutorials/flash/pixelcalc/index.html
11. D. Comaniciu, W. Chen, P. Meer, et al., Multiuser workspaces for remote
microscopy in telepathology. IEEE Computer-Based Medical Systems 2
(1999) 150-155
110
12. D. Westerkamp, T. Gahm, Non-distorted assemblage of thedigital images
of adjacent fields in histological sections. Anal Cell Pathol 5 (1993) 235-
247
13. D.A. Silage, J. Gil, Digital image tiles: A method for the processing of large
sections. J Microsc 138 (1985) 221-227
14. D.H. Okada, S.W. Binder, C.L. Felten, et al., Virtual microscopy and the
Internet as telepathology consultation tools: Diagnostic accuracy in
evaluating melanocytic skin lesions. Am J Dermatopathol 21 (1999) 525-
531
15. D.J. Foran, D. Comaniciu, P. Meer, et al., Computer-assisted
discrimination among malignant lymphomas and leukemia using
immunophenotyping, intelligent image repositories, and telemicroscopy,”
IEEE Trans. Inform. Technol. Biomed 4 (2000) 265–273
16. D.J. Romer, K.H. Yearsley, L.W. Ayers, Using a modified standard
microscope to generate virtual slides. Anat Rec 272B (2003) 91-97
17. D.J. Romer, S. Suster, Use of virtual microscopy for didactic live-audience
presentation in anatomic pathology. Ann Diagn Pathol 7 (2003) 67-72
18. D.M. Steinberg, S.Z. Ali, Application of virtual microscopy in clinical
cytopathology. Diagn Cytopathol 25 (2001) 389-396
111
19. D.M. Steinberg, T.Y. Chan, J.A. Freedman, et al., Teaching cytopathology
to second-year medical students. An interactive, case-based approach.
Acta Cytologica 46 (2002) 481-489
20. eSlide. http://www.telemed.uniud.it/eslides/
21. F. Demichelis, M. Barbareschi, P. Dalla Palma, et al., The virtual case: a
new method to completely digitize cytological and histological slides.
Virchows Arch 441 (2002) 159-164
22. F.J. Leong, J.O. McGee, Automated complete slide digitization: a medium
for simultaneous viewing by multiple pathologists. J Pathol 195 (2001)
508-514
23. F.R. Dee, J.M. Lehman, D. Consoer, et al, Implementation of virtual
microscope slides in the annual pathobiology of cancer workshop
laboratory. Hum Pathol 34 (2003) 430-436
24. G. Lieberman, R. Abramson, K. Volkan, Tutor versus computer: A
prospective comparison of interactive tutorial and computer-assisted
instruction in radiology education. Acad Radiol 9 (2002) 40-49
25. G.S. Bova, G. Parmigiani, J.I. Epstein, et al., Web-based tissue microarray
image data analysis: initial validation testing through prostate cancer
Gleason grading. Hum Pathol 32 (2001) 417-427
26. J.D. Kronz, M.A. Silberman, W.C. Allsbrook, A web-based tutorial
improves practicing pathologists’ Gleason grading of images of prostate

112
carcinoma specimens obtained by needle biopsy: Validation of a new
medical education paradigm. Cancer 89 (2000) 1818-1823
27. J.N. Harvey, G.M. Clark, C.K. Osborne, et al., Estrogen receptor status by
immunohistochemistry is superior to the ligand binding assay for
predicting response to adjuvant endocrine therapy in breast cancer, J.
Clin. Oncol. 17 (1999) 1474–1481
28. K. Glatz-Krieger, D. Glatz, M.J. Mihatsch, Virtual slides: high-quality
demand, physical limitations, and affordability. Hum Pathol 34 (2003) 968-
974
29. K.G. Sapnas, S.M. Walsh, W. Vilberg, et al., Using web technology in
graduate and undergraduate nursing education. CIN Plus 5 (2002) 1-7
30. K.N. Jones, R. Kreisle, R.W. Geiss, Group for research in pathology
education online resources to facilitate pathology instruction. Arch Pathol
Lab Med 126 (2002) 346-350
31. L. Chan, K.M. Reilly, Integration of digital imaging into emergency
medicine education. Acad Emerg Med 9 (2002) 93-95
32. L.R. Franck, M.L. Langenkamp, Mandatory education via the computer:
Cost-effective, convenient, and creative. J Nurse Staff Devel 16 (2000)
157-163
33. M. Weinstein, J.I. Epstein, Telepathology diagnosis of prostate needle
biopsies. Hum Pathol 32 (1997) 22-29.

113
34. M.J. O’Brien, A.V. Sotnikov, Digital imaging in anatomic pathology. Am J
Clin Pathol 106 (1996) 25-32
35. M.S. Frank, K. Dreyer, Beyond the electronic textbook model: Software
techniques to make on-line educational content dynamic. J Digit Imaging
14 (2001) 108-112
36. M.S. Frank, K. Dreyer, Empowering radiologic education on the internet: A
new virtual website technology for hosting interactive educational content
on the world wide web. J Digit Imaging 14 (2001) 113-116
37. P. Washer, Barriers to the use of web-based learning in nurse education.
Nurse Educ Today 21 (2001) 455-460
38. R. Ferreira, B. Moon, J. Humphries, et al., The virtual microscope. AMIA
Annual Fall Symposium, 1997.
39. R. Shegog, L.K. Bartholomew, G.S. Parcel, et al., Impact of a computer-
assisted education program on factors related to asthma self-management
behavior. J Am Med Inform Assoc 8 (2001) 49-61
40. R.M. Rocha, C.B. Nunes, G.F.S. Rocha, Rabbit monoclonal antibodies
show higher sensitivity than mouse monoclonals for estrogen and
progesterone receptor evaluation in breast cancer by
immunohistochemistry. Pathol Res Prac 204 (2008) 655-662
41. R.M. Rocha, K. Miller, F. Soares, et al., Non biotin polymeric visualization
system provide stronger signal without background in estrogen receptor
114
evaluation of breast carcinomas. In: XXVIIth International Congress of the
International Academy of Pathology Histopathol 53 (2008) 302
42. R.S. Weinstein, A. Bhattacharyya, A. R. Graham, Telepathology: a ten
year progress report. Hum Pathol 28 (1997) 1-7.
43. R.S. Weinstein, M.R. Descour, C. Liang, Telepathology overview: From
concept to implementation. Hum Pathol 32 (2001) 1283-1299
44. R.S. Weinstein, Prospects for telepathology. Hum Pathol 17 (1986) 433-
434 (editorial)
45. S. Hamza, P. Anderson, V.V. Reddy, Use of the internet in pathology
resident training and education. Adv Anat Pathol 8 (2001) 290-297
46. S. Olsson, C. Busch, A national telepathology trial in Sweden feasibility
and assessment. Arch Anat Cytol Pathol 43 (1995) 234-241
47. S. Ronald, M.D. Weinstein, R. Michael, et al., Telepathology overview:
from concept to implementation. Human Pathol 32 (2001) 1283-1299
48. Scanscope. http://www.scanscope.com/scanscope/
49. Slidebox. V. http://www.path.uiowa.edu/virtualslidebox/
50. T. Harris, T. Leaven, P. Heidger, Comparison of a virtual microscope
versus a regular microscope laboratory for teaching histology. Anat Rec
265 (2001) 10-14

115
51. The Nyquist-Shannon sampling theorem,
http://ptolemy.eecs.berkeley.edu/eecs20/week13/nyquistShannon.html
52. Ü. Çatalyürek, M. Beynon, C. Chang, et al., The virtual microscope. IEEE
Transactions on Information Technology in Biomedicine 7 (2003) 230-248.
53. V.R. Curran, T. Hoekman, W. Gulliver, et al., Web-based continuing
medical education. I: Field test of a hybrid computer-mediated instructional
delivery system. J Cont Ed Health Prof 20 (2000) 97-105
54. V.R. Curran, T. Hoekman, W. Gulliver, et al., Web-based continuing
medical education. II: Evaluation study of computer-mediated continuing
medical education. J Cont Ed Health Prof 20 (2000) 106-119

116
Immunocytochemistry

117

118
DIGITAL SLIDES: A NEW POWERFUL TOOL FOR PATHOLOGY EDUCATION
AND QUALITY CONTROL
Rafael Malagoli Rocha1,2,3, Keith Miller2, José Vassallo4, , Natália
Schenka4, Fernando Soares3, Helenice Gobbi1
1. Universidade Federal de Minas Gerais, Brazil
2. University College London, UK
3. Hospital do Câncer A C Camargo, Brazil
4. Universidade de Campinas, Brazil
*Corresponding author: [email protected]
Mail address:
Hospital A C Camargo – Depto Anatomia Patológica, 1º andar
Rua Professor Antônio Prudente, 109
Liberdade, São Paulo – SP
CEP: 01509-900

119
GENERAL INFORMATION
The year 2000 may have marked a turning point at which pathologists
began to spend less time in front of light microscopes rendering diagnoses and
more time multitasking in front of computers. Although pathologists and their
microscopes have been a hallmark of quality medical care for more than a
century, the march of time and supervening technologies may alter the way
pathology is practiced in the years ahead (1). Digital slides represent such
technology.
Digital slides are digitized entire microscope specimens that can be
viewed on a computer screen. Digital slides can be accessed from the
computer’s hard disk, transportable media (CD-ROM, DVD or memory sticks), or,
more practically, from a network server used for image archiving and distribution
(2). Digital slides are acquired by assembling digital images of adjacent fields in
histological sections or fluid smears into a giant image montage using a
computer controlled scanning stage. Although this technology has existed for
more than a decade, this process (also called whole-slide digitization) has been
commercially available for standard desktop computing only since 1998, when
sufficient memory and processing speed became available. Because digital
slides can capture the important visual information of a glass slide, they can be
used in all of the educational venues in which glass slides and digital
photomicrographs are used, without losing the ability inherent in traditional glass
slide microscopy to explore the entire microscopic section, identify structures and
lesions, and demonstrate their relationships and variations (3). By simply

120
emulating the usual behavior of a physical microscope, such a system can
replace cabinets full of slides with a digital storage subsystem. Retrieving a slide
then becomes a matter of accessing the slide database, without requiring
physical access to the slide. One example of additional capability is in a teaching
environment, where an entire class of students can access and individually
manipulate the same slide at the same time, searching for a particular feature in
the digital slide. Another example is remote consultation, where a physician in a
different part of the country, or even in another country, can view a slide via
internet, once the slide has been scanned and placed in an accessible database
(4). It can provide simultaneous access to the slides by multiple users, who can
access and individually manipulate the same slide or different slides at the same
time as in a real microscope.
The world of digital slides and telepathology will be discussed along this
review including its appliance for didactic purposes and quality assurance
schemes as well as the challenges for pathologists and scientists with the advent
of this new technology.
DIGITAL SLIDES FOR PATHOLOGY EDUCATION
Traditional glass slides and standard microscopes have been used in
pathology education for many decades. However, the use of glass slides in
education has been problematic, because they break, are difficult to duplicate,
fade over time, and are difficult to distribute. Early in the last century,
photomicroscopy enabled the pathologist to avoid some of these pitfalls and

121
extend the availability of microscopic observations in the form of traditional black
and white photographs and 35 mm slides. The dynamic interaction between the
viewer and the glass slide, however, is severely limited by the use of static
images. Viewing static images does not faithfully reproduce the intellectual
process through which information is gathered and analyzed from the perceptual
evaluation of the entire information contained in the glass slide. It cannot
substitute the process of visually scanning the image at varying magnifications or
comparing different areas of the glass slide to reach a final impression of the
pathologic process. With the advent of digitized images during the past few
decades, static digital images on CD-ROMs or on the internet have begun to
replace traditional photographs in pathology education because the digital image
does not break, is easy to duplicate and distribute, and does not fade. Recent
advances in digital microscopy have permitted the generation of very large
images that can be captured by robotic photomicroscopes to create “digital”
slides. The digital slide is often so large that a special viewing application,
referred to as a virtual microscope, is required (5).
Even not using digital slides, web-based educational methods have been
developed for pathology, cytology, surgery, nursing, radiology, emergency
medicine, anatomy, continuing medical education, patient education, and other
related activities. (6) For example, Steinberg et al (6) reported their experience at
the Johns Hopkins School of Medicine with an interactive, case- and web-based
approach to teaching cytopathology to second-year medical students.
Preliminary results from this experience are encouraging; the students have

122
enjoyed the experience and increased their knowledge about basic cytology.
Kronz et al. developed another web-based tutorial for practicing pathologists that
has been very effective in improving practitioners’ ability to provide Gleason
grading to images of prostate carcinoma specimens obtained by needle biopsy
(6). Starting in 1998, the Pathophysiology of Disease course at UCLA’s School of
Medicine was reorganized to take advantage of rapidly developing web-based
technologies that allowed for the efficient distribution of standardized teaching
materials to a large group of students. The “individual microscopic sessions” of
the pulmonary pathophysiology course were replaced by self-instructional,
interactive laboratory sessions using web-based technology and case-based
instruction that allows the students to study digital images representing selected
pathologic conditions at their own place. The microscopic sessions using
multiheaded microscopes and multiple instructors were replaced by 2 discussion
sessions. Led by a pneumologist and a pathologist, the students discuss the
cases available on the website. The cases include a clinical history; description
of physical examination and laboratory tests; and pulmonary pathophysiology,
imaging, and pathologic information (6). The success of the web-based
technology as a teaching method also encouraged these authors to state that it
would benefit from the appliance of digital slides to this technology (6).
Up to 4 years ago, image reference systems and Web tutorials were
based on conventional microscopy images limited to only one magnification level
and a preselected specimen area. Recently, the act of changing magnification
when using conventional light microscopy simulated with zoomable images of the

123
entire microscope slides digitized at a high resolution allows the user to view any
part of the specimen at any magnification (7). Another study showed the usage of
digital slides to evaluate the Gleason grading system, which is the most widely
used grading system for prostatic carcinoma. The study also compared the
interobserver variation in applying the grading system (7). They demonstrated
that web-based virtual microscopy is well suited for interactive education, which
is, for self-testing and learning Gleason grading of prostate carcinoma. They
concluded that web-based virtual microscopy is an effective method to evaluate
interobserver variability and that it is a promising new tool for teaching and
standardizing the use of Gleason grading among training pathologists. The use
of these advanced techniques allows transferring image data over the internet.
Web-based virtual microscopy has been used as a powerful platform for various
educational applications in histopathology (Henrik). The same authors have also
published digital atlas of histopathology such as:
www.webmicroscope.net/breastatlas (7), http://patho.med.uni-magdeburg.de,
www.3dhistech.com, www.pathonet.org, www.uiowa.edu, and www.uscap.org.
HISTOPATHOLOGY QUALITY ASSURANCE USING DIGITAL SLIDES
Professional proficiency testing has become an integral part of continuous
professional development in all medical specialties in the United Kingdom and
North America. Ideally, proficiency should be measured on the same “task”
material for each individual. In the United Kingdom, for example, national quality
assurance scheme in breast screening pathology comes close to the ideal

124
practical solution. In this scheme, all consultant histopathologists involved in
management of breast disease are confidentially assessed twice a year by
examining two sets of 12 microscopic slides selected from the spectrum of breast
diseases. Individual consultant’s diagnoses on these slides are compared with
the consensus diagnosis of 19 histopathologists regarded as expert in breast
diseases’ diagnosis. However, with more than 400 pathologists participating in
the scheme, having to circulate slides by mail to all participants results in each
proficiency round taking 5 months to complete. The sections, although
consecutive, are not identical, yet individuals are judged on what is assumed to
be present in the section rather than its actuality. Presenting the same
microscopic data electronically to all participating pathologists could eliminate
deficiencies. So, the use of digital slides came as a promising tool for
investigating the accuracy of diagnosis and utility of telepathology in pathology
screening. Beyond providing identical images to be analyzed by all pathologists
involved in the program, digital slides also provide time saving on regular mail,
lack of risks of broken slides and comfort for analysis.
The quality assurance scheme provided by the College of American
Pathologists (CAP) already employ telepathology in its program by supplying
images to be evaluated by the pathologists via web (static pathology). The heads
of the United Kingdom National External Quality Assessment Service (UK-
NEQAS) stated their interest in digital slides as a tool for receiving the associated
laboratories’ stains and also for assessing them by assessors from different parts
of the world.
125
FUTURE CHALLENGES
While the hardware for digitizing tissue samples and microscopy slides
more effectively is rapidly becoming commercially available, the software support
required to store, retrieve, and process digitized slides to provide interactive
response times for the standard behavior of a physical microscope remains a
challenging issue. The basic level, the system should emulate the usual behavior
of a physical microscope, including continuously moving the stage and changing
magnification and focus. The processing for viewing a slide requires projecting
high resolution data onto a grid of suitable resolution (governed by the desired
magnification) and appropriately compositing pixels mapping onto a single grid
point, to avoid introducing spurious artifacts into the displayed image. The main
difficulty in providing the basic functionality is storing and processing the
extremely large quantities of data required to represent a large collection of
slides (8).
Developments of more efficient software for slide viewing and analysis and
also information storage capacity might be the greatest challenges for this new
technology in the next few years.
TAKE HOME MESSAGES
• Digital slides associated with imaging software are being widely used for
research practice in the last 3 years. Although some systems have

126
received the FDA approval for such practice, its usage for diagnostic
routine is still restricted.
• Digital slides have been progressively used for educational purpose
throughout web, and allow identical sections in numerous different
computer screens, do not break, and do not cause problems for storage or
retrieval.
• Digital slides represent a promising future for the quality assurance
schemes avoiding problems and costs related to conventional mail.
Assessors will be able to access digital slides from their own office
decreasing cost and time.
• Software for image analysis can be easily applied to digital slides for
research purpose and, more recently, for routine diagnosis.
• Two main challenges can be pointed for the next few years: the
development of new software, which are more user friendly and suitable to
research and routine needs; and improvement of the image storage
capacity of hard disks.

127
REFERENCES
1. Ronald S, Weinstein MD, Michael R, et al . Telepathology overview: from
concept to implementation. Human Pathol 2001; 32: 1283-1299
2. Lundin M, Lundin J, Helin H, et al . A digital atlas of breast
histopathology: an application of web based virtual microscopy. J Clin
Pathol 2004; 57: 1288-1291
3. Dee FR, Lehman JM, Consoer D, et al. Implementation of virtual
microscope slides in the annual pathobiology of cancer workshop
laboratory. Human Pathol 2003; 34: 430-436
4. Ferreira R, Moon B, Humphries J, et al. The virtual microscope. AMIA
Annual Fall Symposium, 1997.
5. Romer DJ and Suster S. Use of virtual microscopy for didactic live-
audience presentation in anatomic pathology. Annals of Diagnostic
Pathology 2003; 7: 67-72
6. Marchevsky AM, Relan A and Baillie S . Self-instructional “virtual
pathology” laboratories using web-based technology enhance medical
school teaching of pathology. Human Pathol 2003; 34: 423-429
7. Helin H, Lundin M, Lundin J, et al . Web based virtual microscopy in
teaching and standardizing Gleason grading. Human Pathol 2005; 36:
381-386

128
8. Çatalyürek Ü, Beynon M, Chang C, et al. The virtual microscope. IEEE
Transactions on Information Technology in Biomedicine 2003; 7: 230-248.

129
Comentários finais

130
Comentários finais
Os sistemas de visualização livres de biotina de segunda geração
mostram marcação imuno-histoquímica mais forte quando comparados aos
sistemas biotinilados, com exceção do LSAB+. Os polímeros Advance e
Novolink mostraram os sinais mais fortes e ainda apresentaram casos positivos
para receptor de estrógeno que foram considerados negativos para todos os
outros sistemas de visualização, o que determina mudança na conduta
terapêutica da paciente. No entanto, estudos correlacionando estes achados
com resposta terapêutica de pacientes necessitam ser feitos para validar estes
resultados.
Os polímeros livres de biotina apresentam reações imuno-histoquímica
mais limpas e sem marcação citoplasmática quando comparados aos sistemas
de estreptavidina-biotina. Isto faz destes novos sistemas uma importante
ferramenta para a rotina clínica e para investigação, contribuindo na
padronização imuno-histoquímica para a avaliação de receptor de estrógeno em
câncer de mama.
Os dois sistemas de análise das reações, visual e automatizada,
mostraram semelhança com alta concordância de resultados. A análise visual
mostrou as diferenças de positividade entre os sistemas de visualização
segundo o sistema de escore adotado, e a análise automatizada complementou
a interpretação do observador diminuindo a subjetividade e aumentando a
fidedignidade da avaliação de receptor de estrógeno em câncer de mama.

131
Referências bibliográficas

132
Referências
1. Aaltomaa S, Lipponen P, Eskelinen M et al. Hormone receptors as
prognostic factors in female breast cancer. Ann Med 1991; 23:643–48.
2. Anderson WF, Chatterjee N, Ershler WB, et al. Estrogen receptor breast
cancer phenotypes in the surveillance, epidemiology and end results
database. Breast cancer res treat 2002; 76:27-36.
3. Anderson WF, Chu KC, Chatterjee N, et al. Tumor variants by hormone
receptor expression in white patients with node-negative breast cancer
from the surveillance, epidemiology, and end results database. J Clin
Oncol 2001; 19:18–27.
4. Bardou VJ, Arpino G, Elledge RM, et al. Progesterone receptor status
significantly improves outcome prediction over estrogen receptor status
alone for adjuvant endocrine therapy in two large breast cancer
databases. J Clin Oncol 2003; 21:1973–9.
5. Barnes DM, Millis RR, Beex LVAM, et al. Increased Use of
Immunohistochemistry for Oestrogen Receptor Measurement in Mammary
Carcinoma: the Need for Quality Assurance. Eur J Cancer 1998;
34(11):1677-82.

133
6. Barkhem T, Carlsson B, Nilsson Y, et al. Differential response of estrogen
receptor alpha and estrogen receptor beta to partial estrogen agonists ⁄
antagonists. Mol Pharmacol 1998; 54:105–12.
7. Burstein HJ. The distinctive nature of HER2-positive breast cancers. N
Engl J Med 2005; 353:1652–4.
8. Brasil, Instituto Nacional de Câncer. Estimativas 2000 de incidência e
mortalidade por câncer no Brasil. Rio de Janeiro: Instituto Nacional de
Câncer ; 2000.
9. Breast and Bowel Project Protocol B-06. J Clin Oncol 1988; 6:1076–87.
10. Camp RL, Charette LA, Rimm DL, et al. Validation of tissue microarray
technology in breast carcinoma. Lab Invest 2000; 80(12):1943-9.
11. Clark GM. Prognostic and predictive factors. In: Harris JR, Lippman ME,
Morrow M, Hellman S, editors. Diseases of breast. 5th ed. Philadelphia:
Lippincott-Raven ; 1996. 461-70.
12. Colditz GA. Relationship between estrogen levels, use of hormone
replacement therapy, and breast cancer. J Natl Cancer Inst 1998;
90:814–23.

134
13. Crowe JP Jr, Gordon NH, Hubay CA et al. Estrogen receptor
determination and long term survival of patients with carcinoma of the
breast. Surg Gynecol Obstet 1991; 173:273–78.
14. Dent R & Clemons M. Adjuvant trastuzumab for breast cancer. BMJ 2005;
331:1035–6.
15. Diaz LK, Gupta R, Kidwai N, et al. The use of TMA for interlaboratory
validation of FISH testing for detection of HER2 gene amplification in
breast cancer. J Histochem Cytochem 2004;52(4):501-7.
16. Elston CW, ELLIS IO. Assessment of histologic grade. In: ELSTON CW &
ELLIS IO eds. Systemic Pathology 3rd Ed. Vol. 13, 365-84, Churchil-
Livinstone. Edinburgh, Scotland, UK. 1998.
17. Elston CW & ELLIS IO. Pathological prognostic factors in breast cancer. I.
The value of histological grade in breast cancer: experience from a large
study with long-term follow-up. Histopathology 1991; 19(5):403-10.
18. Fisher B, Redmond C, Fisher ER, et al. Relative worth of estrogen or
progesterone receptor and pathologic characteristicsof differentiation as

135
indicators of prognosis in node negative breast cancer patients: findings
from National Surgical Adjuvant
19. Fitzgibbons PL, Page DL, Weaver D, et al. Prognostic factors in breast
cancer. College of American Pathologists Consensus Statement. Arch
Pathol Lab Med 1999; 124(7):966-78.
20. Fuqua SA, Fitzgerald SD, Chamness GC, et al. Variant human breast
tumor estrogen receptor with constitutive transcriptional activity. Cancer
Res 1991; 51:105–9.
21. Geyer CE, Forster J, Lindquist D, et al. Lapatinib plus capecitabine for
HER2-positive advanced breast cancer. N Engl J Med 2006; 355:2733–
43.
22. Gobbi, H, Rocha RM, Nunes CB. Predictive factors of breast cancer
evaluated by immunohistochemistry. J Bras Patol Med Lab 2008;
44(2):131-140.
23. Goldhirsch A, Glick JH, Gelber RD, et al. Meeting Highlights: International
Expert Consensus on the Primary Therapy of Early Breast Cancer 2005.
Ann Oncol 2005; 16(10):1569-1583

136
24. Guerra MR,Gallo MCV, Azevedo G, et al. Risco de câncer no Brasil:
tendências e estudos epidemiológicos mais recentes. Rev Bras Cancerol
2005; 51(3): 227-234
25. Hammond ME, et al. Standard reference material for Her2 testing: report
of a National Institute of Standards and Technology-sponsored
Consensus Workshop. Appl Immunohistochem Mol Morphol 2003;
11(2):103-6.
26. Harvey JM, Clark GM, Osborne CK, et al. Estrogen receptor status by
immunohistochemistry is superior to the ligandbinding assay for predicting
response to adjuvant endocrine therapy in breast cancer. J Clin Oncol
1999; 17:1474–81.
27. Henriksen KL, Rasmussen BB, Lykkesfeldt AE, et al. Semi-quantitative
scoring of potentially predictive markers for endocrine treatment of breast
cancer: A comparison between whole sections and tissue microarrays. J
Clin Pathol 2007; 60:397-404.
28. Horwitz KB, Koseki Y, McGuire WL. Estrogen control of progesterone
receptor in human breast cancer: role of estradiol and antiestrogen.
Endocrinology 1978; 103:1742–51.

137
29. Joensuu H, Kellokumpu-Lehtinen PL, Bono P, et al. Adjuvant docetaxel or
vinorelbine with or without trastuzumab for breast cancer. N Engl J Med
2006; 354:809–20.
30. Kay E, AO'Grady, Morgan JM, et al. Use of tissue microarray for
interlaboratory validation of HER2 immunocytochemical and FISH testing.
J Clin Pathol 2004;57(11):1140-4.
31. Koenders A & Thorpe SM. Standardisation of steroid hormone receptor
assays in human breast cancer. Reproducibility of oestradiol and
progesterone receptor assays. Eur J Cancer Clin Oncol 1983; 19:1221-
9.
32. Konecny GE, Thomssen C, Luck HJ, et al. Her-2 ⁄ neu gene amplification
and response to paclitaxel in patients with metastatic breast cancer. J Natl
Cancer Inst 2004; 96:1141–51.
33. Leake R, Barnes D, Pinder S, et al. Immunohistochemical detection of
steroid receptors in breast cancer: a working protocol. UK Receptor
Group, UK NEQAS, The Scottish Breast Cancer Pathology Group, and
The Receptor and Biomarker Study Group of the EORTC. J Clin Pathol
2000; 53:634–5.

138
34. Lind AC, Bewtra C, Healy JC, et al. Prospective peer review in surgical
pathology. Am J Clin Pathol 1995; 104:560–6.
35. Liu CL, Prapong W, Natkunam Y, et al. Software tools for high-throughput
analysis and archiving of immunohistochemistry staining data obtained
with tissue microarrays. Am J Pathol 2002;161(5):1557-65.
36. Loring P, Cummins R, AO'Grady, et al. HER2 positivity in breast
carcinoma: a comparison of chromogenic in situ hybridization with
fluorescence in situ hybridization in tissue microarrays, with targeted
evaluation of intratumoral heterogeneity by in situ hybridization. Appl
Immunohistochem Mol Morphol 2005; 13(2):194-200.
37. Manley S, Mucci NR, De Marzo AM, et al. Relational database structure to
manage high-density tissue microarray data and images for pathology
studies focusing on clinical outcome: the prostate specialized program of
research excellence model. Am J Pathol 2001; 159(3):837-43.
38. De Marzo AM, Fedor H. Molecular analysis of tissues using gene
expression arrays and tissue microarrays. Short Course #47. United
States and Canadian Academy of Pathology , 93rd Annual Meeting,
2004.

139
39. Maxwell P & McCluggage WG. Audit and internal quality control in
immunohistochemistry. J Clin Pathol 2000; 53:929-32
40. Nilsson S, Makela S, Treuter E, et al. Mechanisms of estrogen action.
Physiol Rev 2001; 81:1535–65.
41. Osborne CK. Steroid hormone receptors in breast cancer management.
Breast Cancer Res Treat 1998; 51:227–38.
42. Owens MA, Horten BC, Da Silva MM. HER2 amplification ratios by
fluorescence in situ hybridization and correlation with
immunohistochemistry in a cohort of 6556 breast cancer tissues. Clin
Breast Cancer 2004; 5:63-9.
43. Page DL, Jensen RA, Simpson JF. Routinely available indicators of
prognosis in breast cancer. Breast Cancer Res Treat 1998; 51(3):195-
208.
44. Parl FF, Schmidt BP, Dupont WD, et al. Prognostic significance of
estrogen receptor status in breast cancer in relation to tumor stage,
axillary node metastasis, and histopathologic grading. Cancer 1984;
54:2237–42.

140
45. Payne SJL, Bowen RL, Jones JL, et al. Predictive markers in breast
cancer – the present. Histopathology 2008; 52:82–90.
46. Pinder SE, Murray S, Ellis IO, et al. The importance of the histologic grade
of invasive breast carcinoma and response to chemotherapy. Cancer
1998; 83(8):1529-39.
47. Pope WB, Lai A, Nghiemphu P, et al. MRI in patients with high-grade
gliomas treated with bevacizumab and chemotherapy. Ann Oncol 2005;
16(10):1569-1583
48. Prescott RJ, Wells S, Bisset DL, et al. Audit of tumour histopathology
reviewed by a regional oncology centre. J Clin Pathol 1995; 48:245–9.
49. Pritchard KI, Shepherd LE, O’Malley FP, et al. HER2 and responsiveness
of breast cancer to adjuvant chemotherapy. N Engl J Med 2006;
354:2103–11.
50. Prowell TM & Armstrong DK. Selecting endocrine therapy for breast
cancer: what role does HER-2 ⁄ neu status play? Semin Oncol 2006;
33:681–7.
51. Ramsey AD. Errors in histopathology reporting: detection and avoidance.
Histopathology 1999; 34:481–90.

141
52. Ravdin PM, Green S, Dorr TM, et al. Prognostic significance of
progesterone receptor levels in estrogen receptor-positive patients with
metastatic breast cancer treated with tamoxifen: results of a prospective
Southwest Oncology Group study. J Clin Oncol 1992; 10:1284–91.
53. Reiner A, Neumeister B, Spona J, et al. Immunocytochemical localization
of estrogen and progesterone receptor and prognosis in human primary
breast cancer. Cancer Res 1990; 50:7057–61.
54. Rhodes A, Jasani B, Anderson E, et al. Evaluation of HER-2/neu
immunohistochemical assay sensitivity and scoring on formalin-fixed and
paraffin-processed cell lines and breast tumors: a comparative study
involving results from laboratories in 21 countries. Am J Clin Pathol 2002;
118(3):408-17.
55. Rocha RM, Miller K, Soares FA, et al. Biotin-free systems provide stronger
immunohistochemical signal in Estrogen receptor evaluation of breast
cancer. J. Clin. Pathol 2009; In press.
56. Rocha RM, Nunes CB, Rocha GFS, et al. A comparison between the
novel rabbit monoclonal antibodies (SP1 and B644) and mouse antibodies
for evaluating estrogen receptor in breast tumors. J Bras Patol Med Lab
2007; 43(6):435-40.

142
57. Rocha RM, Nunes CB, Rocha GFS, et al. Rabbit monoclonal antibodies
show higher sensitivity than mouse monoclonals for estrogen and
progesterone receptor evaluation in breast cancer by
immunohistochemistry. Pathol Res Prac 2008; 204:655-62
58. Rocha RM, Nunes CB, Rocha GFS, et al. Construção de arrays de tecido
com equipamento alternativo e de baixo custo para estudo
imunoistoquímico de tumores mamários. J Bras Patol Med Lab 2006;
42(6):477-82.
59. Rocha RM, Vassallo J, Soares FA, et al. Digital slides: Present status of a
tool for consultation, teaching, and quality control in pathology. Pathol
Res Prac 2009; In press.
60. Romain S, Laine A, Bidron C, et al. EORTC receptor study group report:
steroid receptor distribution in 47,892 breast cancers. A collaborative
study of 7 European laboratories. Eur J Cancer 1995; 31A:411-7.
61. Romond EH, Perez EA, Bryant J, et al. Trastuzumab plus adjuvant
chemotherapy for operable HER2-positive breast cancer. N Engl J Med
2005; 353:1673–84.

143
62. Saez A, Andreu FJ, Seguí MA, et al. HER-2 gene amplification by
chromogenic in situ hybridisation (CISH) compared with fluorescence in
situ hybridisation (FISH) in breast cancer-A study of two hundred cases.
Breast 2006; 15(4):519-27.
63. Sauter G & Mirlacher M. Tissue microarrays for predictive molecular
pathology. J Clin Pathol 2002; 55(8):575-6.
64. Seidal T, Balaton AJ, Battifora H. Interpretation and quantification of
immunostains. Am J Surg Pathol 2001; 25(9):1204-7.
65. Selvarajan S, Tan SY, Sii LH, et al. c-erbB-2 (HER-2/neu)
immunohistochemistry in invasive breast cancer: is there concordance
between standard sections and tissue microarrays? Pathology 2006;
38(4):316-20.
66. Slamon DJ, Clark GM, Wong SG, et al. Human breast cancer: correlation
of relapse and survival with amplification of the HER-2 ⁄ neu oncogene.
Science 1987; 235:177–82.
67. Slamon DJ, Leyland-Jones B, Shak S, et al. Use of chemotherapy plus a
monoclonal antibody against HER2 for metastatic breast cancer that
overexpresses HER2. N Engl J Med 2001; 344:783–92.

144
68. Smith I, Procter M, Gelber RD, et al. 2-year follow-up of trastuzumab after
adjuvant chemotherapy in HER2-positive breast cancer: a randomised
controlled trial. Lancet 2007; 369:29–36.
69. Watanabe T, Inoue S, Ogawa S et al. Agonistic effect of tamoxifen is
dependent on cell type, ERE-promoter context, and estrogen receptor
subtype: functional difference between estrogen receptors alpha and beta.
Biochem Biophys Res Commun 1997; 236:140–5.
70. Wick MR & Swanson PE. Editorial: Targeted controls in clinical
immunohistochemistry; a useful approach to quality assurance. Am J Clin
Pathol 2002; 117:7.
71. Yamauchi H, Stearns V, Hayes DF. When is a tumor marker ready for
prime time? A case study of c-erbB-2 as a predictive factor in breast
cancer. J Clin Oncol 2001; 19:2334–56.
72. Zhang D, Salto-Tellez M, Putti TC, et al. Reliability of tissue microarrays in
detecting protein expression and gene amplification in breast cancer. Mod
Pathol 2003; 16(1):79-84.