relatÓrio e contas 2016 pág. 003fcf62ac6-847a-47e5-bf70-498228c7c6d4}.pdf · estados unidos,...
TRANSCRIPT
RELATÓRIO E CONTAS 2016pág. 003
—
ANNUAL REPORT 2016pag. 113


RELATÓRIOE CONTAS
2016PT
003BANC — Relatório e Contas, 2016

1. PRINCIPAIS INDICADORES 005
2. AMBIENTE ECONÓMICO 009
3. INDICADORES DE PERFORMANCE ECONÓMICA 019
4. GESTÃO DOS RISCOS 022
5. ÁREAS DE NEGÓCIO 028
6. IMOBILIZADO 031
7. SECTOR DE MEIOS 033
8. OPERAÇÕES NACIONAIS E SOBRE O ESTRANGEIRO 036
9. RECURSOS HUMANOS 038
10. INFORMÁTICA - DESENVOLVIMENTO E SEGURANÇA 041
11. ANÁLISE FINANCEIRA 043
12. ANÁLISE ECONÓMICA 053
13. DEMONSTRAÇÕES FINANCEIRAS 059
14. RELATÓRIO DOS AUDITORES EXTERNOS 062
15. RELATÓRIO DO CONSELHO FISCAL 066
16. NOTAS ÀS CONTAS 070
BANC — Relatório e Contas, 2016 005

1.PRINCIPAIS
INDICADORES
007BANC — Relatório e Contas, 2016

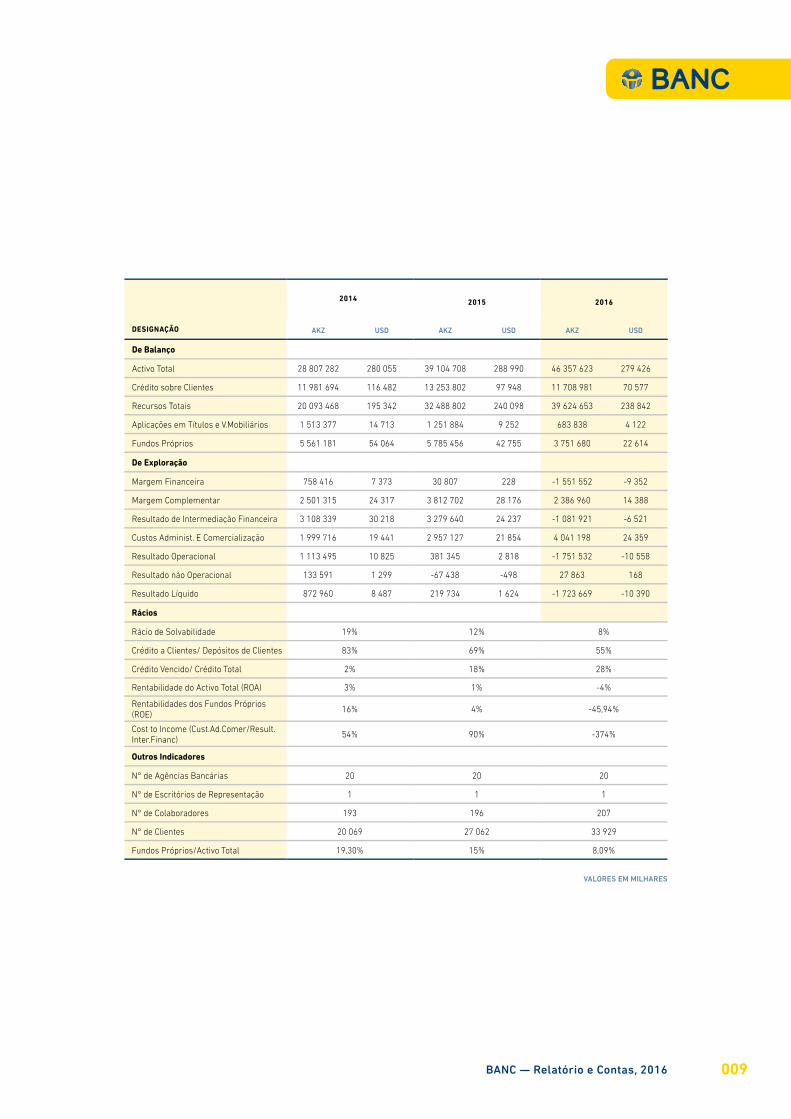
DESIGNAÇÃO
2014 2015 2016
AKZ USD AKZ USD AKZ USD
De Balanço
Activo Total 28 807 282 280 055 39 104 708 288 990 46 357 623 279 426
Crédito sobre Clientes 11 981 694 116 482 13 253 802 97 948 11 708 981 70 577
Recursos Totais 20 093 468 195 342 32 488 802 240 098 39 624 653 238 842
Aplicações em Títulos e V.Mobiliários 1 513 377 14 713 1 251 884 9 252 683 838 4 122
Fundos Próprios 5 561 181 54 064 5 785 456 42 755 3 751 680 22 614
De Exploração
Margem Financeira 758 416 7 373 30 807 228 -1 551 552 -9 352
Margem Complementar 2 501 315 24 317 3 812 702 28 176 2 386 960 14 388
Resultado de Intermediação Financeira 3 108 339 30 218 3 279 640 24 237 -1 081 921 -6 521
Custos Administ. E Comercialização 1 999 716 19 441 2 957 127 21 854 4 041 198 24 359
Resultado Operacional 1 113 495 10 825 381 345 2 818 -1 751 532 -10 558
Resultado não Operacional 133 591 1 299 -67 438 -498 27 863 168
Resultado Líquido 872 960 8 487 219 734 1 624 -1 723 669 -10 390
Rácios
Rácio de Solvabilidade 19% 12% 8%
Crédito a Clientes/ Depósitos de Clientes 83% 69% 55%
Crédito Vencido/ Crédito Total 2% 18% 28%
Rentabilidade do Activo Total (ROA) 3% 1% -4%
Rentabilidades dos Fundos Próprios (ROE)
16% 4% -45,94%
Cost to Income (Cust.Ad.Comer/Result.Inter.Financ)
54% 90% -374%
Outros Indicadores
N° de Agências Bancárias 20 20 20
N° de Escritórios de Representação 1 1 1
N° de Colaboradores 193 196 207
N° de Clientes 20 069 27 062 33 929
Fundos Próprios/Activo Total 19,30% 15% 8,09%
VALORES EM MILHARES
BANC — Relatório e Contas, 2016 009

2.AMBIENTE ECONÓMICO
2.1 INTERNACIONAL
Durante o ano de 2016, a economia mundial pautou-se por uma linha de crescimento bastante volátil, oscilando entre períodos de grande produtividade e períodos de grande contracção na criação de riqueza. Este cenário teve forte reflexo no fortalecimento da actividade comercial internacional, nos períodos de maior estabilidade político/social, enquadradas com pequenas valorizações das matérias-primas, com especial destaque para o mercado petrolífero. Por outro lado, a perda de confiança dos investidores nas políticas de financiamento e de crédito à economia em ambiente de baixa valorização dos activos financeiros nas principais bolsas mundiais, como sejam as bolsas de Nova Iorque, de Tóquio e de Londres, afectaram grandemente a criação de emprego, e de novas empre- sas,o investimento empresarial e a criação de valor para as suas economias. Esta situação foi potencializada por factores negativos como o Brexit.
2.1.1 ECONOMIAS DESENVOLVIDAS A previsão de crescimento para 2017 atribuído às economias desenvolvidas é de 1,9%, o que equivale à estagnação da economia, pois em 2015 o nível de crescimento económico das economias desenvolvidas foi precisamente o mesmo (1,9%). Para isso, muito contribui o desempenho das economias dos Estados Unidos, Reino Unido, Canadá e Japão. Os Estados Unidos tiveram um crescimento de 3,2% em 2016, superando o crescimento obtido em 2015 em 0,3%. O Reino Unido acusou uma quebra de 0,3% relativamente ao crescimento de 2,2%, realizado em Dezembro de 2015, revelando uma economia em recessão, sofrendo as consequências do ambiente de incerteza e de alguma agitação político/económica em torno do Brexit. O Japão arrasta-se desde 2008 com uma economia que varia entre a recessão e a estagnação, o que se pode aferir do crescimento económico alcançado em 2016 na ordem dos 0,5%, que foi obtido igualmente no ano anterior.
2.1.2 ZONA EUROO relatório da Organização para a Cooperação e o Desenvolvimento Económico (OCDE), concluiu que em 2016 o desempenho económico do continente europeu foi fraco. Todavia, a Zona Euro observou um crescimento do Produto Interno Bruto (PIB) de 0,3% no primeiro trimestre de 2016, face a igual período do ano anterior, tendo elevado a produção de riqueza da região para 1,7%. Essa fase de maior expansão do crescimento do PIB teve o seu alicerce no aumento das exportações de bens verificadas nos sectores da Indústria e, em menor escala, dos serviços, que resultaram de um euro mais fraco, do aumento da procura por exportações de serviços, como turismo e viagens para a Zona Euro. Neste particular, destacaram-se as quatro maiores economias do euro, como sejam a Espanha, onde o Índice dos Gestores de Compras (PMI) aponta uma subida de 55,5 pontos no primeiro trimestre de 2016, seguidos da Alemanha com 55,2 pontos percentuais. Em França, o PMI avançou para 53,1 pontos e em Itália para os 55,2 pontos percentuais.
A agência de estatísticas da União Europeia, Eurostat, informou que o PIB dos 19 países cresceu 0,3% no mês de Junho, representando uma desaceleração face a igual período do ano anterior, onde o crescimento do PIB fixou-se em 0,6%. Esta fase de menor crescimento económico da Zona Euro coincidiu com
BANC — Relatório e Contas, 2016 011
a alta do desemprego, herdado da crise de 2008, elevada dívida pública e privada, problemas resultantes do elevado risco de crédito da banca europeia, uma política de maior controlo e acerto na subida das taxas de juros por parte do Banco Central Europeu e o impacto do problema dos refugiados, trazendo aumento das preocupações com a segurança, contribuindo para um clima de maiores incertezas, com fortes repercussões no investimento, na produtividade e nas políticas de reforma.
O terceiro e o quarto trimestre observaram um desempenho relativamente positivo, sendo que entre o mês de Julho e Setembro o crescimento económico da Zona Euro foi mais discreto, tendo em conta o impacto da pressão da saída do Reino Unido da União Europeia. O que resultou num crescimento de 0,3% sobre igual trimestre do ano anterior. O quarto trimestre foi bem melhor em termos de crescimento, tendo elevado o PIB para os 3,9%.
2.1.3 SAÍDA DO REINO UNIDO DA UNIÃO EUROPEIA - BREXITA saída do Reino Unido da União Europeia provocou o pânico no mercado imobiliário britânico, onde após vários anos de pleno crescimento, os sinais de instabilidade começaram a fazer-se sentir. Em consequência disso, os principais investidores do sector imobiliário inglês exigiram o retorno dos seus investimentos aos quatro fundos de investimento imobiliário, que asseguram o êxito dos investimentos feitos no sector imobiliário, garantindo o retorno do capital e dos lucros dos negócios realizados no mercado imobiliário inglês. A Standard Life, a Aviva Investors, a Henderson Global Investors e a M&G Investments juntas movimentam nove mil milhões de Libras Esterlinas de activos no imobiliário comercial. Não obstante, foram incapazes de gerar o retorno do investimento aos principais investidores do sector imobiliário, sendo obrigadas a encerrar temporariamente a sua actividade, originando uma queda na Bolsa de Valores de Londres.
A Libra esterlina atingiu o seu valor mais baixo face ao US Dólar em 31 anos, tendo registado uma descida de 15% depois do referendo. A desvalorização da Libra afectou grandemente o orçamento das famílias britânicas, reduzindo o seu poder de compra, contribuindo para um menor crescimento do consumo e da procura interna. Por esta razão, a criação de emprego reduziu-se para cerca de metade, muito embora a taxa de desemprego tenha baixado para 5%, a mais baixa dos últimos 11 anos.
Por outro lado, a desvalorização da Libra no mercado cambial favoreceu as empresas exportadoras de mercadorias, uma vez que os seus produtos exportados se tornaram mais competitivos no espaço europeu, o que teve impacto positivo na balança comercial britânica. O sector dos transportes foi, porém, a excepção, tendo acusado uma baixa de 0,8% no volume de vendas de automóveis, que terá resultado da incerteza verificada na forma como deverá ser feito o acesso do Reino Unido ao mercado único.
2.1.4 ECONOMIAS EMERGENTESAs economias emergentes tiveram um desempenho positivo em 2016, globalmente falando, pois aceleraram para os 4,3% do PIB. Todavia, o crescimento económico não foi uniforme em todos os países, a economia
www.banc.co.ao012
chinesa manteve o curso de desaceleração registando 6,7%, em Dezembro de 2016, face aos 6,9% do período homólogo. À semelhança de 2015, a Índia continua a ser o país que mais cresceu no mundo, tendo registado uma expansão de 7,6%, não obstante os efeitos da desaceleração da China.
A recessão foi a tónica dominante das economias da América Latina e Caribe, onde se destaca o Brasil cuja economia foi afectada por um clima de instabilidade política e convulsões sociais, aliadas a processos judiciais públicos sobre algumas das maiores empresas de produção petrolífera da região. O Brasil debate-se com um elevado déficit das contas públicas, agravadas pela má gestão dos recursos fiscais e pelo aumento da dívida pública, o que afectou o processo de expansão económica do país, fixando a retração do PIB em 3,3%. Os países emergentes do Médio Oriente obtiveram uma ligeira expansão, que não pôde ser mais robusta, em virtude da região ter sido bastante afectada por conflitos internos, tensões geopolíticas e pelo baixo preço do petróleo, fixando o seu crescimento em 2,9%. A Rússia continua em recessão profunda, que exige uma postura de equilíbrio e ajuste às sanções do Ocidente e aos preços baixos do petróleo, o que não favorece o crescimento da actividade económica. O crescimento do Sul da Ásia deverá atingir os 7,1% em 2016, o que espelha uma quebra de 1,1% face a 2015. Nesta região, o consumo das famílias revelou ser um dos indicadores de desempenho económico de maior destaque.
2.1.5 ECONOMIAS MENOS DESENVOLVIDASOs baixos preços das matérias-primas no mercado internacional resultando em menores receitas provenientes da exportação, aliadas à falta de divisas, à baixa produção de energia e à débil confiança dos investidores, amputou o crescimento económico dos países menos desenvolvidos. A Venezuela debateu-se em 2016 com uma inflação galopante e uma elevada taxa de desemprego, tendo sofrido uma forte contração do PIB de 9,7% em 2016. Angola, por sua vez, enfrenta o desafio da adaptação aos baixos preços das matérias-primas, com especial destaque para o petróleo, em paralelo com uma crise económica e cambial com fortes repecursões no volume de expor- tações e na subida generalizada dos preços dos produtos da cesta básica, conduzindo à estagnação da economia.
A Africa Subsariana cresceu 0,2%, fixando a sua expansão económica em 1,4% do PIB. A região foi afectada por muitos conflitos internos, instabilidade política, doenças infecciosas, ataques terroristas em grande escala, escassez de divisas e a saída massiva de capitais estiveram na base da dificuldade de consolidação de políticas e estratégias de promoção do emprego, produtividade e incremento da oferta de produtos e serviços diversificados. Outro factor de grande preocupação patente nos países menos desenvolvidos é a pressão da emigração para a europa e outros países mais desenvolvidos, o que reduziu a população activa.
2.1.6 MERCADO CAMBIALO mercado cambial internacional destacou-se pela forte valorização do US Dólar face às principais moedas de transacção nos mercados financeiros. Por esta razão, a média anual do EUR/USD em 2016 foi de 1,11, valor igual ao de 2015, o que revelou ser a média mais baixa dos ultimos anos. O factor “Trump” pode vir a ser determinante para a paridade entre o US Dólar e o Euro, a média prevista
BANC — Relatório e Contas, 2016 013

é de 1,05 (EUR/USD). Este facto aponta para o bom momento que a economia americana está a viver desde o segundo trimestre de 2015. O Índice do dólar DXY relativamente ao cabaz de moedas composto pelo Euro, o Iene, a Libra Esterlina o Franco suiço, o Dólar canadiano e a Coroa sueca, determinou no início de 2016, uma vantagem para o US Dólar de 99 pontos, que paulatinamente subiu acima dos 100 pontos no final do ano transacto. O US Dólar continuará a valorizar face ao Iene, passando dos actuais (JPY/USD) 115, para 120 ienes por cada dólar.
2.1.7 DESEMPREGOA taxa de desemprego baixou na maior parte dos países do globo, fruto de um percurso de expansão da economia mundial, consolidado durante o ano de 2016. Por esta razão o incremento do investimento nos sectores mais produtivos da economia mundial proporcionou o aumento da produtividade e da consequente exportação de produtos e serviços, com forte impacto na política de criação de novos postos de trabalho. O aumento do poder de compra das famílias resultou no incremento do consumo interno e externo que se traduziu na âncora da consolidação das políticas de emprego nas economias mais produtivas. É pertinente, dentro deste quadro, realçar a taxa de desemprego registada nos Estados Unidos da América que se fixou em 4,7% da população activa, face aos anteriores 4,80% do ano anterior. A taxa de desemprego da Zona Euro com excepção da Itália fixou-se em 9,6%, contra 12% apurado em Dezembro de 2015. O Brasil e a Itália apresentaram uma taxa de desemprego de 12%, à semelhança do que apuraram em igual período do ano anterior. As economias com pior desempenho nesta matéria são o Djibuti, com uma taxa de desemprego de 54%; a África do Sul, República do Congo, Angola e Palestina, todas com uma taxa de desemprego de 26%; e finalmente, o Lesoto, Macedónia, Grécia, Guiné Equatorial, Montenegro, Gabão e Espanha, com taxas de desemprego que variam entre os 25% a 18,5% da população activa.
2.1.8 RISCOS E CAUTELAS SOBRE A ECONOMIA MUNDIALA economia mundial padece de algumas situações de risco que se revestem de peso preocupante. Desde logo podemos destacar as consequências do Brexit, que poderão conduzir ao reforço dos níveis de protecionismo, perturbações políticas e espírito de independentismo, que poderá colocar em causa o projecto europeu. As eleições na Alemanha poderão ter forte impacto sobre a economia europeia em 2017. A fragilidade da banca europeia, com especial destaque para a banca Italiana, aliada com o volume de crédito de cobrança duvidosa, revelam ser um factor de enorme risco para a economia mundial.
Na qualidade de ser um dos países de maior poderio económico mundial, as alterações estruturais e a desaceleração económica da China, em linha com os ajustamentos das economias emergentes às fortes mudanças da economia mundial, prefiguram um ambiente de elevada incerteza que acarretarão riscos severos. Um factor de risco de instabilidade económica generalizada é a manutenção dos preços baixos das matérias-primas, uma vez que tanto os países em desenvolvimento como os países emergentes dependem muito das exportações das mesmas para a consolidação e expansão das suas economias. Por fim, destacamos as consequências do efeito “Trump” sobre toda a economia global. Torna-se muito preocupante a política de gestão das taxas de juro da Reserva Federal Americana (FED), que poderão fortalecer o US Dólar face às principais moedas de referência no mercado cambial internacional, tornando
www.banc.co.ao014
o crédito mais oneroso e o reembolso do crédito muito mais difícil. Este cenário aponta para o risco de uma “bolha” de crédito que poderá conduzir, entre outras coisas, ao colapso da economia americana, com consequências imprevisíveis para a economia mundial.
Com todos os factores de risco apontados acima, a economia mundial apresentou um percurso consistente com a desaceleração do seu crescimento económico, tendo fixado a sua evolução em 3% em Dezembro de 2016, contra 3,1% alcançados no período homólogo de 2015.
2.2 NACIONAL
Desde 2007 que a economia angolana se tem debatido com a desaceleração do crescimento do seu Produto Interno Bruto (PIB), sendo este um facto que antecede a grande crise imobiliária que eclodiu nos Estados Unidos da América em 2008. Na base deste percurso está sem dúvida a quebra progressiva dos preços das matérias-primas nos mercados internacionais. Neste âmbito podemos destacar a redução drástica do preço do petróleo, que teve como fortes consequências a redução das receitas, a menor disponibilidade de divisas, a necessária contenção das despesas do Estado e um menor estímulo deste na economia. O quadro que se gerou em função disso foi a forte redução das importações, com impacto na redução da capacidade produtiva das empresas que mais dependiam das mesmas para sustentarem a produção, resultando num grande número de falências.
O menor volume de importações obrigou as empresas nacionais a um maior esforço financeiro para cobrir a importação dos seus produtos comerciais, o que resultou no incremento do preço de venda dos mesmos, contribuindo grandemente para a subida dos preços. O poder de compra das famílias angolanas sofreu uma forte quebra face à subida da inflação no decorrer do ano de 2016. Este cenário desencadeou a necessidade de se apostar na diversificação da economia como uma das formas de combater a fraca produtividade, recuperando a produção nacional e a criação de mais emprego.
De acordo com o Fundo Monetário Internacional (FMI), os níveis da dívida pública angolana estão a atingir limites insustentáveis, uma vez que, de acordo com os cálculos daquele organismo, o índice da dívida pública relativamente ao PIB atinge os 70%. Tal facto tem sido uma enorme preocupação para o Estado angolano, que num cenário de receitas reduzidas, tem vindo a endividar-se junto da Banca. O que sujeitou o Estado a compromissos avultados para as gerações futuras e a inevitabilidade de uma política de austeridade fiscal.
O FMI estima que a economia angolana cresça 3,5% em 2016 menos 0,7% face a 2015. Este desempenho demonstra que a economia de Angola está em desaceleração. As dificuldades que o Estado angolano experimenta na implementação de políticas económicas eficazes, capazes de minimizar a burocracia excessiva, criar um ambiente propício ao investimento privado e o estabelecimento de negócios, fortalecendo o primado da lei, melhorando as infra-estruturas físicas e o capital humano, conduziram o FMI a prever a estagnação da economia em 2017.
BANC — Relatório e Contas, 2016 015
2.3 INFLAÇÃO
A taxa de inflação prevista pelo FMI para Angola para o 1º semestre de 2016, situava-se em 19,2% e no ano seguinte em 14%. Todavia, a dinâmica da evolução dos preços dos produtos da cesta básica obrigou o Fundo Monetário Internacional a rever as suas previsões no fim de ano. Por esta razão o FMI ajustou a sua previsão da taxa de inflação para 48% em 2016 e 32% para o ano de 2017.
Para 2016, os dados disponibilizados pelo BNA (Banco Nacional de Angola) relativamente à taxa de inflação mensal e acumulada nos últimos quatro meses do ano, revelam uma taxa média em torno dos 2,06%. Nos oito meses anteriores os níveis de inflação foram sempre mais elevados, sendo que a taxa de inflação média mensal foi de 3,42%. Com este trajecto de subida a taxa de inflação acumulada passou de 14,27% em 2015, para 41,95% em 2016.
2.4 TAXA DE CÂMBIO
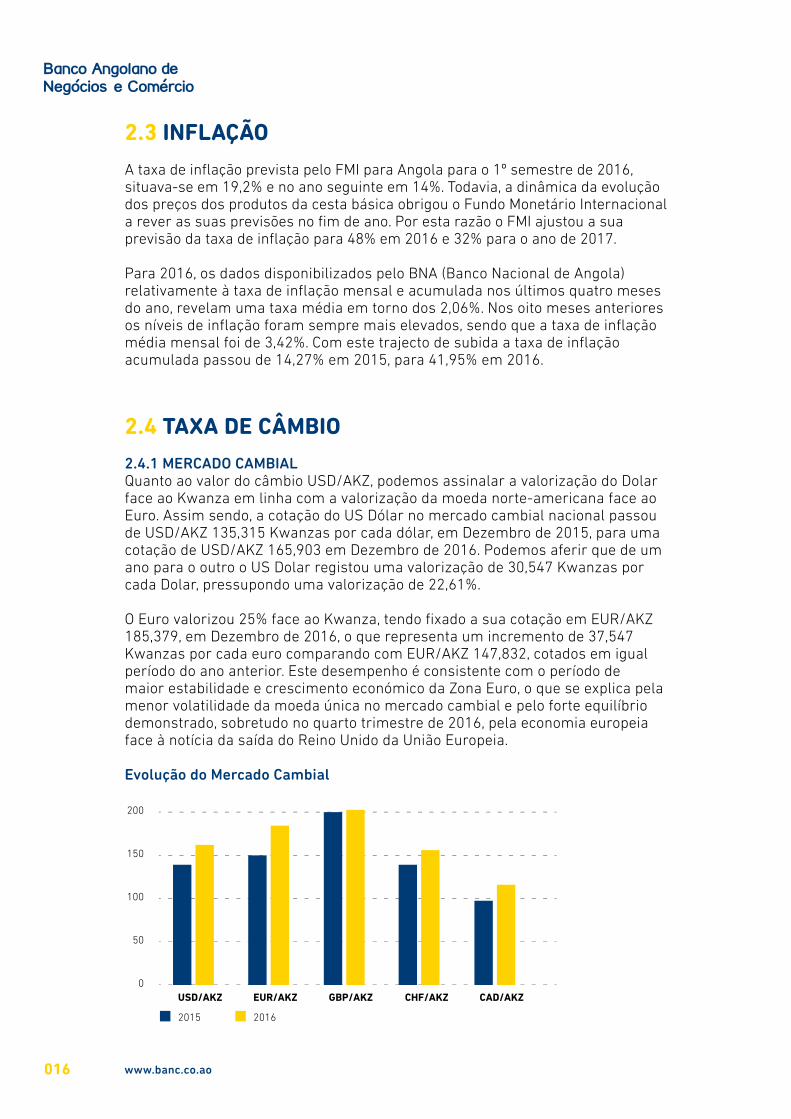
2.4.1 MERCADO CAMBIALQuanto ao valor do câmbio USD/AKZ, podemos assinalar a valorização do Dolar face ao Kwanza em linha com a valorização da moeda norte-americana face ao Euro. Assim sendo, a cotação do US Dólar no mercado cambial nacional passou de USD/AKZ 135,315 Kwanzas por cada dólar, em Dezembro de 2015, para uma cotação de USD/AKZ 165,903 em Dezembro de 2016. Podemos aferir que de um ano para o outro o US Dolar registou uma valorização de 30,547 Kwanzas por cada Dolar, pressupondo uma valorização de 22,61%.
O Euro valorizou 25% face ao Kwanza, tendo fixado a sua cotação em EUR/AKZ 185,379, em Dezembro de 2016, o que representa um incremento de 37,547 Kwanzas por cada euro comparando com EUR/AKZ 147,832, cotados em igual período do ano anterior. Este desempenho é consistente com o período de maior estabilidade e crescimento económico da Zona Euro, o que se explica pela menor volatilidade da moeda única no mercado cambial e pelo forte equilíbrio demonstrado, sobretudo no quarto trimestre de 2016, pela economia europeia face à notícia da saída do Reino Unido da União Europeia.
Evolução do Mercado Cambial250
200
150
100
50
0USD/AKZ
2015 2016
EUR/AKZ GBP/AKZ CHF/AKZ CAD/AKZ
www.banc.co.ao016
O impacto do Brexit sobre a moeda britânica no mercado cambial foi muito forte, pois de facto a Libra perdeu valor face às principais moedas de transação internacional, prejudicando a sua evolução cambial face à moeda nacional. Por essa razão a Libra passou de uma cotação de GBP/AKZ 200,300 em 2015, para uma cotação de GBP/AKZ 202,973, em Dezembro de 2016, o que denota uma valorização de 2,673 Kwanzas por Libra de um ano para o outro. Este desempenho aponta para uma valorização mínima de 1,33% da Libra face ao Kwanza em 12 meses.
2.4.2 MERCADO DE CAPITAISA linha de orientação para compra e venda no mercado de capitais tem sido ditada pelo Plano de Endividamento do Estado. Desde 2014, devido à crise económica, o país vem recorrendo à emissão de dívida para se financiar. Assim sendo, o Banco Nacional de Angola colocou no mercado, no primeiro trimestre de 2016, perto de AKZ 300 mil milhões de títulos da dívida pública em Bilhetes do Tesouro, Obrigações do Tesouro e Eurobonds.
O stock da dívida pública atingiu em 2015, USD 42,9 mil milhões, equivalentes a EUR 39 mil milhões de euros, o que corresponde a 48,7% do Produto Interno Bruto. Os juros da dívida interna irão custar aos cofres do Estado mais de AKZ 261.873 milhões, equivalentes a USD 1.578 milhões, enquanto os juros da dívida contraída no exterior do país irão custar ao Estado angolano cerca de AKZ 222.284 milhões, equivalentes a USD 1.339 milhões. No final do primeiro trimestre de 2016, o Banco Nacional de Angola colocou no mercado primário AKZ 74,6 mil milhões (USD 449,6 milhões) em Bilhetes do Tesouro (BT) e AKZ 17,2 mil milhões (EUR 97,7 milhões) em Obrigações do Tesouro (OT). As taxas de juro médias de emissão de BT oscilaram entre os 14,36% e os 17,12%, para as maturidades de 91 e 364 dias respectivamente, enquanto as OT fecharam com taxas de juro que variaram entre 7% e 7,77%, para as mesmas maturidades. No segmento de venda directa de títulos ao público, o Banco Nacional de Angola realizou só na última semana do mês de Março de 2016 vendas em torno de AKZ 1,7 mil milhões, equivalentes a EUR 9,7 milhões.
No final do mês de Dezembro de 2016, o Banco Nacional de Angola emitiu AKZ 44,6 milhões, equivalentes a EUR 257,1 milhões em Bilhetes do Tesouro e AKZ 26,4 mil milhões, equivalentes a EUR 152,2 milhões em Obrigações do Tesouro. Na última semana do ano, o BNA emitiu títulos da dívida pública que ascenderam a AKZ 70.791 milhões, equivalentes a EUR 379 milhões em Bilhetes do Tesouro e AKZ 22.266 milhões, equivalentes a EUR 119,2 milhões em Obrigações do Tesouro. Desse modo, o stock total da dívida angolana em 2016 atingiu AKZ 1.654,1 mil milhões, em linha com o OGE de 2015. É digno de nota que o Estado tenha emitido durante o ano de 2016 dívida no montante equivalente a 2,2 mil milhões de Euros, correspondentes a AKZ 402.750 milhões em Obrigações do Tesouro para o pagamento de despesas públicas atrasadas desde 2013.
De acordo com o Centro de Estudos e Investigação Científica da Universidade Católica (CEIC), o stock da dívida pública poderá atingir 75% do PIB em 2017. De acordo com os dados disponibilizados pelo Ministério das Finanças, o stock da dívida pública baixará para os 52,7% do PIB. Todavia, o Plano Anual de Endividamento do Estado angolano prevê para este ano necessidades
BANC — Relatório e Contas, 2016 017
de endividamento na ordem dos AKZ 4.667 mil milhões, equivalentes a USD 28,1 mil milhões para financiar as despesas previstas no Orçamento Geral do Estado para 2017.
Para cumprir este objectivo o Estado pretende acabar com o monopólio dos Bancos da praça nacional como investidores exclusivos do mercado de títulos. Em 2017 o Estado pretende alargar a base de investidores no concurso de financiamento da dívida pública. Além dos Bancos angolanos, existem outras instituições com apetência para o investimento que poderão contribuir para compra de dívida do Estado. Por esta razão o Estado pretende contar com a participação dos Fundos de Pensões, Seguradoras e outros fundos. Segundo a Agência Lusa, para o ano de 2017, o Estado prevê emitir Bilhetes do Tesouro no valor de AKZ 1.568 bilhões (USD 9,4 mil milhões), e Obrigações do Tesouro 1.803 bilhões (USD 10,8 mil milhões). Será, portanto, dentro desta base, que o stock da dívida angolana será incrementado, o que é consistente com a análise e previsão do Coordenador do CEIC.
As Reservas Internacionais Líquidas (RIL) de Angola para a cobertura de importações e a cobertura das dívidas do Estado angolano, sofreram uma quebra de 12%, tendo passado de USD 24.266 milhões, equivalentes a EUR 22.905 milhões, em Dezembro de 2015, para USD 21.399 milhões, equivalentes a EUR 20.204 milhões a 31 de Dezembro de 2016. O que se traduz em uma perda de USD 2.867 milhões, equivalentes a EUR 2.706,8 milhões. O valor das RIL em 2016 permitiu a Angola a cobertura de aproximadamente 7 meses de importações, o que é manifestamente pouco para gerar confiança nos investidores nacionais.
2.5 TAXAS DE JURO
A subida da taxa de inflação, medida pela alta generalizada dos preços dos produtos da cesta básica, aliada à forte redução do volume de importações, em consonância com a queda substancial das receitas petrolíferas, estiveram na base da reunião do Comité de Política Monetária do BNA (CPM) no mês de Dezembro de 2016. Nesta reunião foram analisados os sectores Fiscal, Monetário e Externo em linha com o comportamento da economia mundial. Dessa análise genérica da economia nacional no contexto internacional resultaram as seguintes decisões:
× Manter a Taxa Básica de Juro – Taxa BNA – em 16%, ao ano;
× Manter a Taxa de Juro da Facilidade Permanente de Cedência de Liquidez em 20%, ao ano;
× Manter a Taxa de Juro da Facilidade Permante de Absorção de Liquidez a sete dias em 7,25%, ao ano.
A Taxa de Juro de Redesconto passou de 12,5% em Dezembro de 2015 para 20% em igual período de 2016.
www.banc.co.ao018
Relativamente às taxas de juro praticadas no mercado interbancário (MMI), as operações de tomadas e cedências de liquidez tornaram-se mais atraentes do que as operações processadas no mercado de capitais.
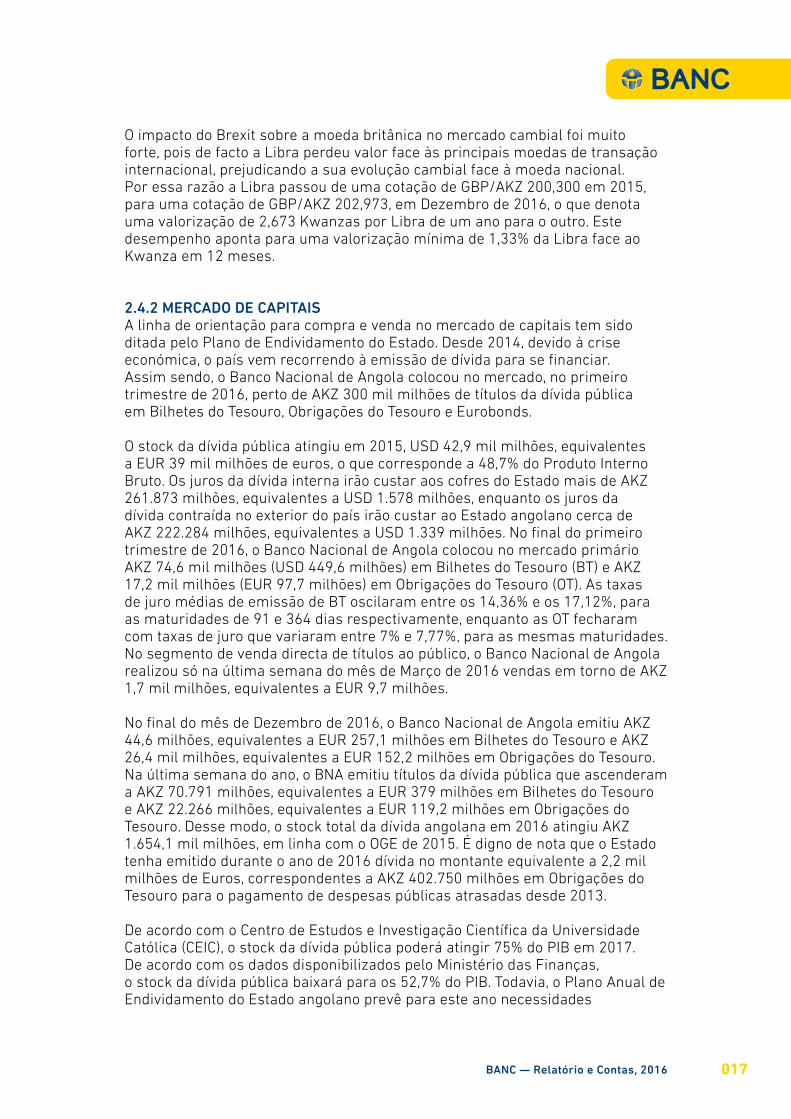
Em Dezembro de 2016 a taxa de juro de referência Luibor para as operações de trinta dias fixou-se em 17,41%, contra os anteriores 11,44%, em igual período de 2015, o que demonstra uma evolução positiva de 52%, que se traduz num aumento de 5,97 pontos percentuais. Para as operações de 3 meses a taxa de referência Luibor fixou-se em 18,23% em Dezembro de 2016, contra 11,88% de Dezembro de 2015, o que representa uma evolução de 53,45%. A taxa de juro para as operações de cedência e tomada de liquidez por um período de 12 meses registaram uma evolução de 57%, tendo passado de uma taxa de juro de 12,84% em Dezembro de 2015, para 20,17% em igual período de 2016.
Os Bilhetes do Tesouro mereceram o maior destaque por parte do Estado angolano por serem títulos de curta maturidade, nos quais o retorno do capital aplicado é mais rápido. Assim sendo, em Dezembro de 2016, os Bilhetes do Tesouro com maturidades de 91 dias foram negociados à taxa de juro de 16,38%, contra 13,90% de igual período do ano anterior. No mesmo período os Bilhetes do Tesouro com maturidade de 182 dias foram negociados à taxa de juro de 23,92%, contra 14,95% praticada em Dezembro de 2015, pelo que podemos concluir que as taxas de juro de remuneração do capital aplicado observaram uma evolução entre os 18% e os 60% para as maturidades de duração mais longa.
As Obrigações do Tesouro nacional foram negociadas em menor volume do que os Bilhetes do Tesouro. Os investidores têm preferência pelos Bilhetes do Tesouro pois as Obrigações do Tesouro são títulos de remuneração de médio prazo, o que no actual contexto de crise económica e de contenção dos gastos não são tão atraentes para os investidores. As Obrigações do Tesouro com maturidades de dois, três, quatro e cinco anos foram negociados a taxas de juro de 7%, 7,25%, 7,50% e 7,75% respectivamente, à semelhança do que aconteceu no ano transacto.
Evolução do Mercado Cambial
25,00%
20,00%
15,00%
10,00%
5,00%
0,00%
1 DIA
2015 2016
1 M 3 M 6 M 9 M 12 M
BANC — Relatório e Contas, 2016 019
3.INDICADORES DE PERFORMANCE ECONÓMICA
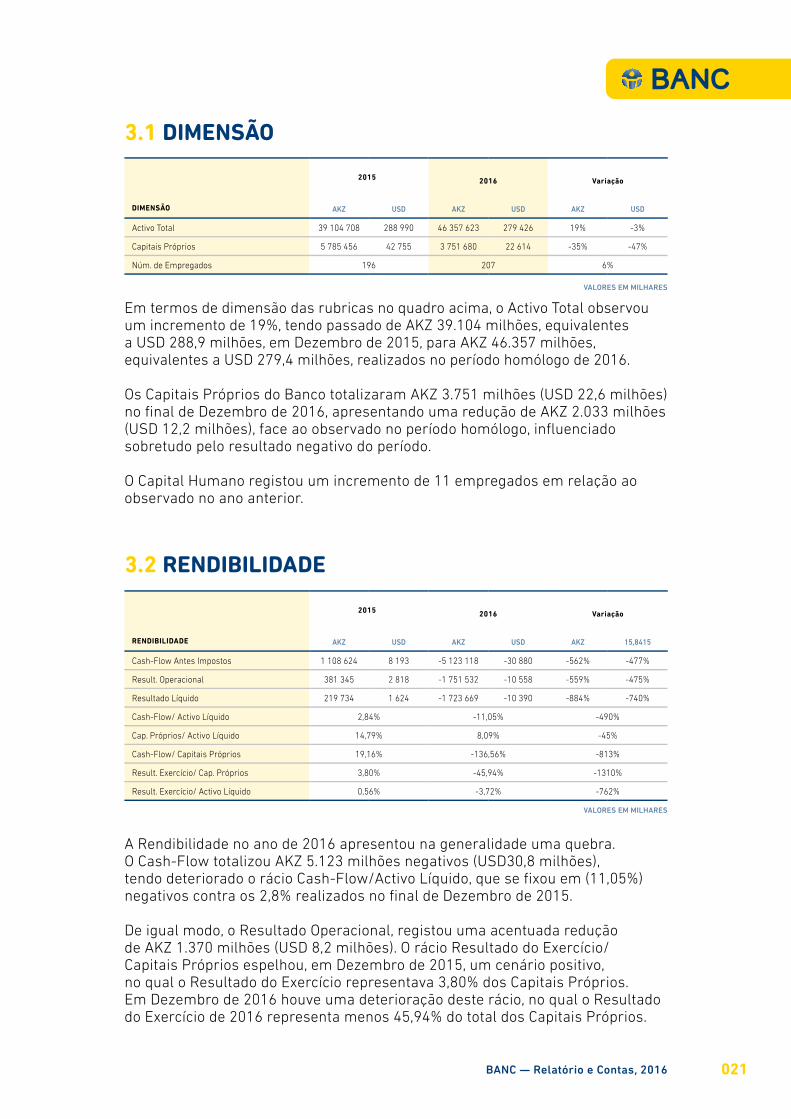
3.1 DIMENSÃO
DIMENSÃO
2015 2016 Variação
AKZ USD AKZ USD AKZ USD
Activo Total 39 104 708 288 990 46 357 623 279 426 19% -3%
Capitais Próprios 5 785 456 42 755 3 751 680 22 614 -35% -47%
Núm. de Empregados 196 207 6%
VALORES EM MILHARES
Em termos de dimensão das rubricas no quadro acima, o Activo Total observou um incremento de 19%, tendo passado de AKZ 39.104 milhões, equivalentes a USD 288,9 milhões, em Dezembro de 2015, para AKZ 46.357 milhões, equivalentes a USD 279,4 milhões, realizados no período homólogo de 2016.
Os Capitais Próprios do Banco totalizaram AKZ 3.751 milhões (USD 22,6 milhões) no final de Dezembro de 2016, apresentando uma redução de AKZ 2.033 milhões (USD 12,2 milhões), face ao observado no período homólogo, influenciado sobretudo pelo resultado negativo do período.
O Capital Humano registou um incremento de 11 empregados em relação ao observado no ano anterior.
3.2 RENDIBILIDADE
VALORES EM MILHARES
RENDIBILIDADE
2015 2016 Variação
AKZ USD AKZ USD AKZ 15,8415
Cash-Flow Antes Impostos 1 108 624 8 193 -5 123 118 -30 880 -562% -477%
Result. Operacional 381 345 2 818 -1 751 532 -10 558 -559% -475%
Resultado Líquido 219 734 1 624 -1 723 669 -10 390 -884% -740%
Cash-Flow/ Activo Líquido 2,84% -11,05% -490%
Cap. Próprios/ Activo Líquido 14,79% 8,09% -45%
Cash-Flow/ Capitais Próprios 19,16% -136,56% -813%
Result. Exercício/ Cap. Próprios 3,80% -45,94% -1310%
Result. Exercício/ Activo Líquido 0,56% -3,72% -762%
A Rendibilidade no ano de 2016 apresentou na generalidade uma quebra. O Cash-Flow totalizou AKZ 5.123 milhões negativos (USD30,8 milhões), tendo deteriorado o rácio Cash-Flow/Activo Líquido, que se fixou em (11,05%) negativos contra os 2,8% realizados no final de Dezembro de 2015.
De igual modo, o Resultado Operacional, registou uma acentuada redução de AKZ 1.370 milhões (USD 8,2 milhões). O rácio Resultado do Exercício/ Capitais Próprios espelhou, em Dezembro de 2015, um cenário positivo, no qual o Resultado do Exercício representava 3,80% dos Capitais Próprios. Em Dezembro de 2016 houve uma deterioração deste rácio, no qual o Resultado do Exercício de 2016 representa menos 45,94% do total dos Capitais Próprios.
BANC — Relatório e Contas, 2016 021

3.3 PRODUTIVIDADE E EFICIÊNCIA
PRODUTIVIDADE/ EFICIÊNCIA
2015 2016 Variação
AKZ USD AKZ USD AKZ USD
Activo Líq./ Núm.Empregados 199 514 1 414 223 950 1 350 12% -8%
Custos de Estrutura/ Activo Líq. 7,56% 8,72% 15%
VALORES EM MILHARES
A Produtividade expressa na relação entre o Activo Líquido/Número de Empregados, espelha uma subida de 12% sobre a cifra alcançada em Dezembro de 2015. Desse modo, o resultado do rácio passou de AKZ 199,5 milhões (USD 1,5 milhões), para AKZ 223,9 milhões (USD 1,3 milhões). Este resultado deve-se ao crescimento do Activo Líquido do Banco, que observou uma subida de 19% em Dezembro de 2016.
A eficiência observou um comportamento de sentido contrário ao que foi demonstrado em matéria de produtividade. O incremento do peso dos Custos de Estrutura sobre o Activo Líquido traduziu-se em um crescimento de 8,72% em relação ao período homólogo
3.4 PRUDENCIAIS
PRUDENCIAIS
2015 2016 Variação
AKZ USD AKZ USD AKZ USD
Rácio de Solvabilidade 12% 8% -31%
O Rácio de Solvabilidade registou um decréscimo de 31%, no final de Dezembro de 2016, posicionando-se em 8%. O comportamento observado deve-se essencialmente à redução dos Fundos Próprios.
www.banc.co.ao022

4.GESTÃO
DOS RISCOS
023BANC — Relatório e Contas, 2016
Durante a actividade de 2016, o Gabinete de Gestão de Risco (GGR) apresentou as seguintes inciativas:
a. Proposta da estrutura organizacional e metodológica:
Esta assenta nos seguintes vectores: (i) Identificação dos principais riscos. Neste sentido o GGR produziu questionários de auto-avaliação; (ii) Identi- ficação de “patamares” de riscos, consubstanciados em indicadores; (iii) Desenvolvimento de métodos de “medição” e “captura” de eventos; (iv) Produção de relatórios.
b. Elaboração da documentação que consubstancia a infra-estrutura indicada no ponto anterior.
Apresentou os seguintes documentos normativos: × Manual de Gestão do Risco;
× Políticas de Gestão do Risco do BANC;
× Metodologias de Avaliação de Riscos e Controlos (MARC);
× Modelo de Avaliação das Categorias de Risco;
× Modelo de Avaliação das Categorias de Controlo do Risco;
× Modelo de Avaliação da Solvabilidade e Liquidez;
Foi dada especial atenção ao documento “Modelo de Avaliação da Solvabilidade e Liquidez”, pois é nele que constam os patamares de risco onde se define o “apetite” de risco da instituição. O GGR considera que a implementação cabal deste documento depende da adopção de uma ferramenta informática que dote o Gabinete de meios para medir os eventos de risco.
Foram ainda produzidos os seguintes documentos: × Políticas de Gestão do Risco de Crédito do BANC;
× Gabinete de Gestão de Risco - Missão, Estrutura, Funcionamento e Competências;
× Manual Controlo Interno;
× Regulamento de Crédito do BANC.
A incidência deste conjunto documental na área de Crédito, parte da avaliação que o GGR faz sobre os riscos que potencialmente poderão causar impactos mais gravosos no capital do Banco.
Neste sentido, foi considerado que o novo Regulamento de Crédito é um documento estruturante. A principal alteração que vem introduzir é a adopção de um modelo de atribuição de notação de risco, baseado num modelo com critérios que já incorporam algumas noções da IAS/39, ou seja ponderando negativamente os créditos reestruturados e os sem garantias reais ou existindo sem estarem avaliadas.
www.banc.co.ao024
Foram entregues ao Comité de Gestão do Risco os seguintes Relatórios de Risco, produzidos pelo GGR:
× Relatório de avaliação de risco de crédito;
× Relatório de avaliação de risco de mercados e liquidez;
× Relatório de avaliação de risco operacional função contabilística;
O Comité de Gestão do Risco considerando os constrangimentos para a função resultantes da pressão legislativa que se tem vindo a acentuar, resolveu propôr ao Conselho de Administração a alocação de mais um colaborador à área de Gestão de Risco.
Foi revisto o documento de suporte “Ponto de Situação – Função de Compliance”, apresentado pelo Gabinete de Compliance.
Ficou decidido que os riscos de Compliance e de Reputação, caem sob a alçada do Comité de Gestão do Risco.
Relativamente aos Riscos de Compliance, deve ser dada atenção aos seguintes pontos:
× Conformidade com leis e regulamentos – Pretende determinar as possibilidades de incorrer em perdas devido à (i) não observância das normas que regulam a actividade da instituição, nomeadamente normas prudenciais; (ii) violação de outras leis ou regulamentos.
× Conformidade com códigos de conduta, práticas instituídas ou princípios éticos – Tem o objectivo de determinar as possibilidades de incorrer em perdas devido à violação de códigos de conduta, práticas instituídas ou princípios éticos.
× Responsabilidade perante terceiros – Aborda o risco de incorrer em sanções por prejuízos causados a terceiros, nomeadamente devido a (i) um comportamento negligente ou doloso; (ii) um relacionamento inapropriado com os clientes; (iii) incumprimento de contratos ou outro tipo de compromissos; (iv) incumprimento do dever de segredo.
× Grau de transparência - Determina o risco associado a um menor grau de transparência na actividade da instituição e nomeadamente nas transacções realizadas.
× Envolvimento em operações de branqueamento de capitais - Determina o risco da instituição se ver envolvida em operações de branqueamento de capitais.
× Relativamente ao Risco Reputacional, ficam sob alçada do Comité de Gestão do Risco os seguintes pontos:
BANC — Relatório e Contas, 2016 025
× Percepção do mercado – Pretende-se determinar a possibilidade de se verificar uma percepção negativa da imagem pública da instituição por parte do mercado (contrapartes, clientes, colaboradores, investidores, órgãos de imprensa, público em geral).
Ficou decidido pedir uma avaliação do sistema de Branqueamento de Capitais e Combate ao Financiamento do Terrorismo a ser conduzido por uma entidade externa.
O Gabinete de Gestão de Risco propôs, e tendo em atenção ao disposto no Aviso 7/2016 de 22 de Junho, quais as áreas de risco que deverão merecer maior priorização até ao final do ano e para o ano de 2017. Esta acção, é encarada ela própria, como uma avaliação de risco.
Em função da exposição dos activos e no sentido de os proteger o Comité de Gestão do Risco considera as seguintes áreas como sendo de:
Risco Muito Elevado (Riscos Materiais): × Crédito; × Gestão de Liquidez e Capital (Mercados);
Risco Elevado: × Mercados (Taxa de Juro e Cambial) × Operacional;
Risco em observação: × Compliance; × Estratégia.
O Gabinete de Gestão do Risco apresentou uma explanação sobre as mais recentes “peças legislativas” emanadas pelo BNA, com previsível impacto nos capitais próprios do Banco. Referimos a seguinte:
Aviso 2/2016, de 15 de Junho – Rácio de Solvabilidade Regulamentar. Esta legislação que introduz o ICAAP (Internal Capital Adequacy Assessement Process) no sistema financeiro angolano, vem ponderar os Fundos Próprios Regulamentares ao risco de crédito, de mercados e operacional;
× Instrutivo 18/2016, de 8 de Agosto – Prestação de Informação sobre a composição dos fundos próprios e rácio de solvabilidade;
× Aviso 3/2016, de 6 de Junho – Risco de Crédito;
× Instrutivo 13/2016, de 8 Agosto – Prestação de informação sobre o requisito de fundos próprios regulamentar para risco de crédito e risco de crédito de contraparte;
× Instrutivo 12/2016, de 8 de Agosto – Cálculo e requisito de fundos próprios regulamentar para risco de crédito e risco de crédito de contraparte;
www.banc.co.ao026

× Aviso 4/2016, de 22 de Junho – Risco de Mercados;
× Instrutivo 14/2016, de 8 de Agosto – Cálculo e requisito de fundos próprios regulamentar para risco de mercado e risco de crédito de contraparte na carteira de negociação;
× Instrutivo 15/2016, de 8 de Agosto – Prestação de Informação sobre requisito de fundos próprios para risco de mercado e risco de crédito de contraparte na carteira de negociação;
× Aviso 5/2016, de 22 de Junho – Risco Operacional;
× Instrutivo 16/2016, de 8 de Agosto – Cálculo e requisito de fundos próprios regulamentar para risco operacional;
× Aviso 7/2016, de 22 de Junho – Risco Operacional;
× Aviso 8/2016, de 22 de Junho – Taxa de Juro;
× Aviso 9/2016, de 22 de Junho – Grandes Riscos;
× Instrutivo 19/2016, de 30 de Agosto – Risco de Liquidez;
× Aviso 6/2016, de 22 de Junho – IFRS;
× Instrutivo 5/2016, de 8 de Agosto – Perdas por imparidade da carteira de crédito;
× Instrutivo 11/2016, de 8 de Agosto – Tratamento das perdas na carteira de crédito;
× Instrutivo 6/2016, de 8 de Agosto – Divulgação de instrumentos financeiros;
× Instrutivo 7/2016, de 8 de Agosto – Método da taxa de juro efectiva no reconhecimento de rendimentos e gastos de instrumentos financeiros;
× Instrutivo 8/2016, de 8 de Agosto – Locações;
× Instrutivo 9/2016, de 8 de Agosto – Títulos e Valores Mobiliário;
× Instrutivo 10/2016, de 8 de Agosto – Benefícios de Empregados;
× Instrutivo 20/2016, de 6 de Setembro – Adopção pela primeira vez das normas internacionais de relato financeiro;
É dada uma especial atenção ao tema do Capital e Liquidez, aguardando medidas que venham reforçar os capitais próprios do Banco.
BANC — Relatório e Contas, 2016 027
O Anexo III do Relatório de Controlo Interno e Governação Corporativa tem uma perspectiva dos riscos evidenciados. De assinalar que a análise integral do mencionado relatório foi feita em sede de Comité de Auditoria. Nesse sentido foram observados os principais riscos elencados no anexo III (deficiências de controlo interno).
Plano de Acção sobre os riscos materiais (Risco de Crédito e Risco de Liquidez e Capital).
O Gabinete de Gestão do Risco apresentou a adopção de medidas de mitigação do risco de crédito, essencialmente através da intensificação das acções de recuperação dos créditos com sinais de imparidades. As acções devem ser conduzidas pela Direcção de Crédito em estreita cooperação com as áreas comerciais. O enfoque deve ser dado no reforço de garantias, recolha de informação quantitativa relevante para a análise do risco de crédito, e desenvolvimento de avaliações de garantias reais.
A Direcção de Crédito deverá adoptar o módulo de créditos reestruturados e integrar essa informação na análise de risco.
Deve a mesma Direcção e o Gabinete de Gestão de Risco participar na adopção do aplicativo KIWI, sobre o cálculo de imparidades.
Na sequência da explanação feita sobre as mais recentes “peças legislativas”, com impacto na actividade bancária, o GGR apresentou os relatórios sobre o Rácio de Solvabilidade Regulamentar, ponderado por riscos (Aviso 2/2016) e sobre o Risco de Taxa de Juro (Aviso 8/2016).
Ao Gabinete de Gestão de Risco caberá a tarefa de propôr medidas de mitigação e coordenar a sua implementação, sempre que os resultados dos relatórios apresentem risco de impacto nos capitais próprios.
www.banc.co.ao028
5.ÁREAS DE
NEGÓCIO
029BANC — Relatório e Contas, 2016
5.1 CARTEIRA DE CLIENTES
Em termos estratégicos o Banco tem mantido uma política comercial que assenta entre outros pontos no crescimento sustentado do número de clientes e da carteira de depósitos em termos de volume. Outro aspecto que importa realçar é o trabalho de fomento da literacia financeira dos nossos clientes. Esse trabalho desenvolve-se no dia-a-dia no relacionamento pessoal com os nossos gestores comerciais e toda a linha de atendimento. Consideramos que a captação de negócio só faz sentido quando os produtos e serviços realmente servem os clientes e lhes trazem vantagens económicas e sociais, nomeadamente a cultura de poupança. Outra aposta do Banco tem sido a contínua segmentação da sua base de clientes.
O Banco dá especial ênfase a um trabalho comercial integrado e conexo que junta as áreas comerciais, o marketing, organização e processos, procurando encontrar soluções financeiras desenhadas à medida das necessidades dos clientes. Realçamos o depósito Super Oportunidade BANC, bem como um conjunto de taxas promocionais de final de ano agregados a outros produtos de poupança.
Desta acção de busca de sinergias internas direccionadas para a satisfação dos clientes resultou um crescimento de 25,4% do número de clientes, o que representa 6.867 novos clientes, dos quais 6.531 são particulares e 336 Empresas, atingindo um total de 33.929 clientes no final de 2016.
Esta carteira de clientes está distribuída geograficamente por 6 províncias de Angola e 2 escritórios de representação, um em Portugal e outro no Brasil.
5.2 CARTEIRA DE DEPÓSITOS (PARTICULARES E EMPRESAS)A carteira de depósitos cresceu 11% relativamente a 2015 fruto de uma conjuntura pouco favorável à constituição de poupança pelas famílias ou de reservas de tesouraria das empresas. Também uma maior contracção do negócio cambial explica uma menor pujança da captação de novos recursos. Este facto obrigou a uma alteração do paradigma do negócio bancário que imperou até ao início da crise do petróleo, que assentava em grande parte na componente de operações cambiais em detrimento da captação de poupanças e reservas para investimento na economia.
5.3 CRÉDITO A CLIENTES
A carteira de crédito a clientes ressentiu-se sobremaneira do arrefecimento da economia, tendo regredido 11% relativamente a 2015. Também uma regulamentação prudencial mais rigorosa obrigou o Banco à adopção de uma política de gestão mais restritiva. Deste modo, o foco do Banco centrou-se na actividade de restruturação e recuperação. Esta nova realidade trouxe enormes desafios à actividade bancária, tendo em consequência disso um
www.banc.co.ao030
efeito positivo na consolidação dos proveitos de crédito. Por outro lado, e não menos importante, consideramos que uma política mais conservadora relativamente a estes activos propiciará no médio prazo vantagens económicas por via da menor afectação de recursos próprios a provisões para crédito de cobrança duvidosa e reconhecimento de imparidades.
Um dos exemplos que ilustra bem o que atrás se referiu é o caso do programa governamental Angola Investe, que no nosso Banco, em 2016, teve muito pouca expressão, pese embora a garantia do Estado que lhe está associada. Este facto é explicado não só pela conjuntura adversa, mas também pela fraca qualidade dos projectos apresentados.
A carteira total de créditos a clientes em 2016 ascendeu a AKZ 11.708 milhões, o que representou uma contracção de 12% relativamente a 2015.
O Banco continua focado na dinamização da sua área comercial como ponto central da sua estratégia de crescimento, tanto do lado da captação de recursos como na gestão do crédito. Este deve obedecer a pressupostos de análise de risco económicos e sustentáveis. Para este fim a nossa instituição continua a investir nos seus colaboradores comerciais no sentido de os apetrechar com as melhores competências profissionais. Neste âmbito destacamos os programas de formação de gestores bem como o de técnicos de vendas.
BANC — Relatório e Contas, 2016 031
6.IMOBILIZADO
Desde o arranque da actividade do Banco Angolano de Negócios e Comércio em 2007, o maior crescimento da sua rede de balcões continua a ser o registado no ano de 2009 com a abertura de 5 agências. Desde então esse número tem crescido prudentemente em função da estratégia adoptada pela instituição. Em 2016 registamos a inauguração do edifício sede, que inclui uma nova agência nas suas instalações e o encerramento de uma dependência no Porto do Lobito.
Actualmente a acção principal incide na manutenção e melhoria das agências existentes, não descurando novas oportunidades e a implementação do plano de abertura de novos postos comerciais, tão logo seja economicamente viável, numa perspectiva de custo-benefício.
Neste plano, destacamos a inauguração das agências de Lubango II e Morro Bento.
BANC — Relatório e Contas, 2016 033
7.SECTOR DE MEIOS
Devido à crescente concorrência que se verificou em 2016 no sistema financeiro, o BANC trabalhou de modo a reter e fidelizar os seus clientes, oferecendo-lhes produtos e serviços de qualidade. Para este resultado foi determinante a actividade do Marketing, uma vez que a sua principal função foi promover a marca BANC como uma instituição bancária de referência a nível nacional. Desta forma foi possível não só satisfazer os clientes como também enquanto instituição, manter o dinamismo e a proactividade.
Destacamos ainda os serviços oferecidos pela internet banking, como também o atendimento personalizado que continua a ser uma marca distintiva do Banco. Continuamos ainda a dinamizar a marca BANC através de publicações feitas em jornais e revistas nacionais e internacionais. Incluímos no nosso portfólio de meios de comunicação novos canais como a Revista Exame, Sapo (Publicações online), Ledbox (sala de desembarque do aeroporto internacional), Big Midia e Continental (aluguer de espaços – outdoors).
7.1 PRINCIPAIS TAREFAS REALIZADAS EM 2016
Dentro dos objectivos de Marketing propostos para o corrente ano, foram realizadas as seguintes tarefas:
1. Renovação do contrato com a empresa Espaços para publicidade;
2. Renovação da assinatura com a revista Exame;
3. Manutenção das campanhas de comunicação do BANC nas cidades de Luanda e Soyo;
4. Inserção de campanhas no Jornal de Angola e jornal “O País”;
5. Assinatura do contrato com a Empresa Sapo jornal de Angola Online;
6. Desenvolvimento conceptual da campanha inaugural da Sede BANC;
7. Assinatura com as empresas Big Midia e Continental.
7.2 PLANO DE MARKETING PARA 2017
Para o ano de 2017 O MKT propõe a criação de mecanismos que continuem a fomentar relações duradouras com os seus actuais e futuros clientes, oferecendo-lhes produtos e serviços segmentados de qualidade e cada vez mais diferenciadores. Para que esta diferenciação seja possível, devemos apostar cada vez mais num atendimento personalizado baseado na estratégia de vendas cruzadas (cross selling).
No plano da comunicação, dada a actual situação financeira que o país tem atravessado, tencionamos dar seguimento à estratégia BTL- Below the Line
BANC — Relatório e Contas, 2016 035

(divulgação dos nossos produtos e serviços através de feiras, patrocínios, internet, sms, mobile). Embora este tipo de acção também contribua para a notoriedade da marca, o seu objectivo prende-se acima de tudo com a oferta de algum tipo de incentivo, para que se obtenha um acréscimo imediato das vendas (ex.: abertura de conta + aplicação a prazo = possibilidade de transferências internacionais para novos clientes). Neste contexto procederemos ao longo do ano com a divulgação dos nossos produtos de poupanças em jornais e sobretudo canais digitais. Pretendemos igualmente criar e divulgar produtos de depósitos a prazos para captação de recursos ao longo do ano.
www.banc.co.ao036

8.OPERAÇÕES
NACIONAIS E SOBRE O
ESTRANGEIRO
037BANC — Relatório e Contas, 2016
O sector bancário angolano vive um cenário de redução no volume de transacções, pela diminuição na quantidade das importações e pelo decréscimo das divisas colocadas nos leilões do Banco Central. Neste contexto, o BANC realizou em 2016 um total de 6.940 operações nacionais e estrangeiras.
8.1 OPERAÇÕES NACIONAIS
As operações realizadas em moeda nacional destacaram-se quer pela sua frequência, quer pelo valor e volume de operações, não obstante o contexto de menor disponibilidade financeira e de desvalorização da moeda nacional. Todavia, o Banco BANC, movimentou um total de 2.150 cheques no montante de AKZ 4.575 milhões. De igual modo os serviços de transferência a crédito (STC) realizaram 335 operações no valor total de AKZ 1.765 milhões, subdivididas em transferências recebidas no montante de AKZ 2.006 milhões, por contrapartida de AKZ 3.771 milhões de transferências efectuadas.
O Sistema de Pagamentos em Tempo Real, observou entradas de valores no montante total de AKZ 9.998 milhões, contra saídas no valor total de AKZ 7.979 milhões, que resultaram num saldo credor de AKZ 2.018 milhões.
8.2 OPERAÇÕES SOBRE O ESTRANGEIRO
Em relação às operações sobre estrangeiro, o Banco BANC recebeu operações em moeda externa que totalizaram USD 104 mil, espelhando um decréscimo de 26%. As operações emitidas em dólares espelharam uma diminuição de 60%, atingindo 1.720 ordens.
Relativamente às operações emitidas em euros perfizeram 2.100 operações, verificando-se um incremento de 70%, relativamente a igual período do ano anterior.
8.3 OPERAÇÕES CAMBIAIS
O Banco BANC registou um total de 3.820 vendas de divisas num total equivalente a USD 45.1 milhões.
8.4 OPERAÇÕES MONEYGRAM, ATM E TPA
Em 2016 as operações enviadas de Moneygram totalizaram AKZ 91,7 milhões num total de 1.977 operações.
Durante o mesmo período foram instalados 3 ATM´s, totalizando 53 montados.
O total de TPA’s no final de 2016 foi de 926, sendo que durante o ano, foram colocados 156 novos dispositivos de pagamento.
www.banc.co.ao038

9.RECURSOS HUMANOS
039BANC — Relatório e Contas, 2016
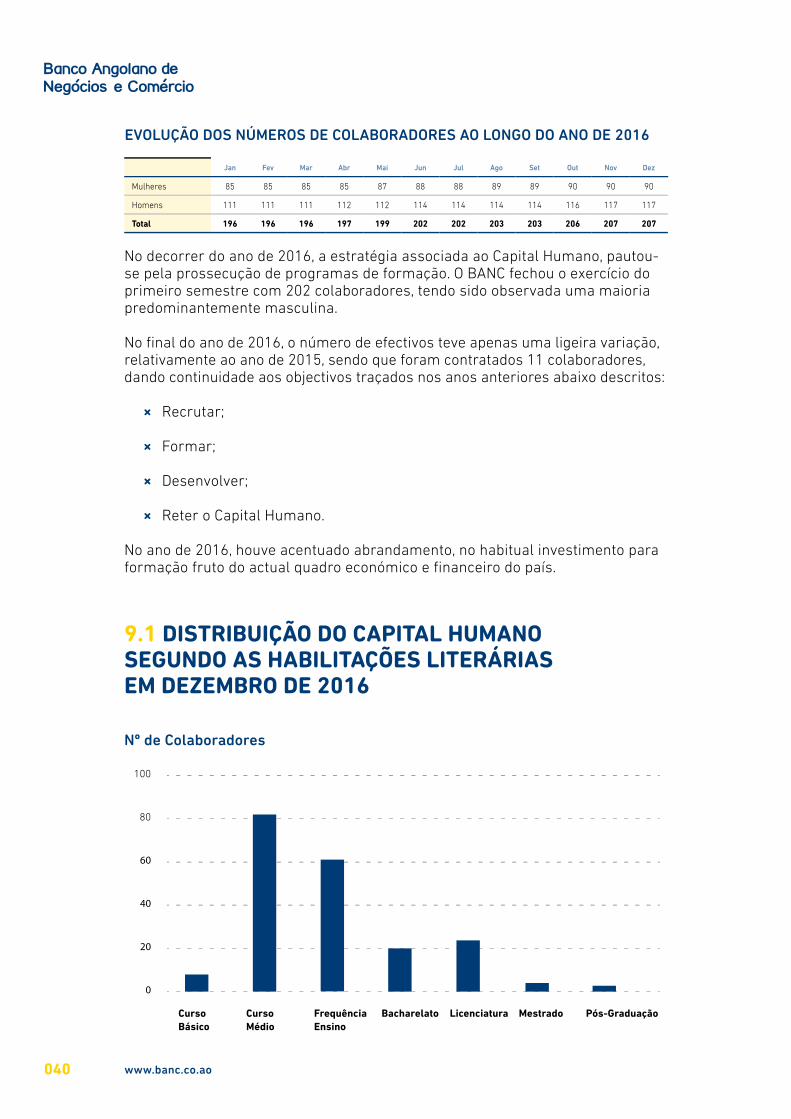
EVOLUÇÃO DOS NÚMEROS DE COLABORADORES AO LONGO DO ANO DE 2016
Jan Fev Mar Abr Mai Jun Jul Ago Set Out Nov Dez
Mulheres 85 85 85 85 87 88 88 89 89 90 90 90
Homens 111 111 111 112 112 114 114 114 114 116 117 117
Total 196 196 196 197 199 202 202 203 203 206 207 207
No decorrer do ano de 2016, a estratégia associada ao Capital Humano, pautou-se pela prossecução de programas de formação. O BANC fechou o exercício do primeiro semestre com 202 colaboradores, tendo sido observada uma maioria predominantemente masculina.
No final do ano de 2016, o número de efectivos teve apenas uma ligeira variação, relativamente ao ano de 2015, sendo que foram contratados 11 colaboradores, dando continuidade aos objectivos traçados nos anos anteriores abaixo descritos:
× Recrutar;
× Formar;
× Desenvolver;
× Reter o Capital Humano.
No ano de 2016, houve acentuado abrandamento, no habitual investimento para formação fruto do actual quadro económico e financeiro do país.
9.1 DISTRIBUIÇÃO DO CAPITAL HUMANO SEGUNDO AS HABILITAÇÕES LITERÁRIAS EM DEZEMBRO DE 2016
Nº de Colaboradores
100
80
60
40
20
0
Curso Básico
Curso Médio
Frequência Ensino
Bacharelato Licenciatura Mestrado Pós-Graduação
www.banc.co.ao040
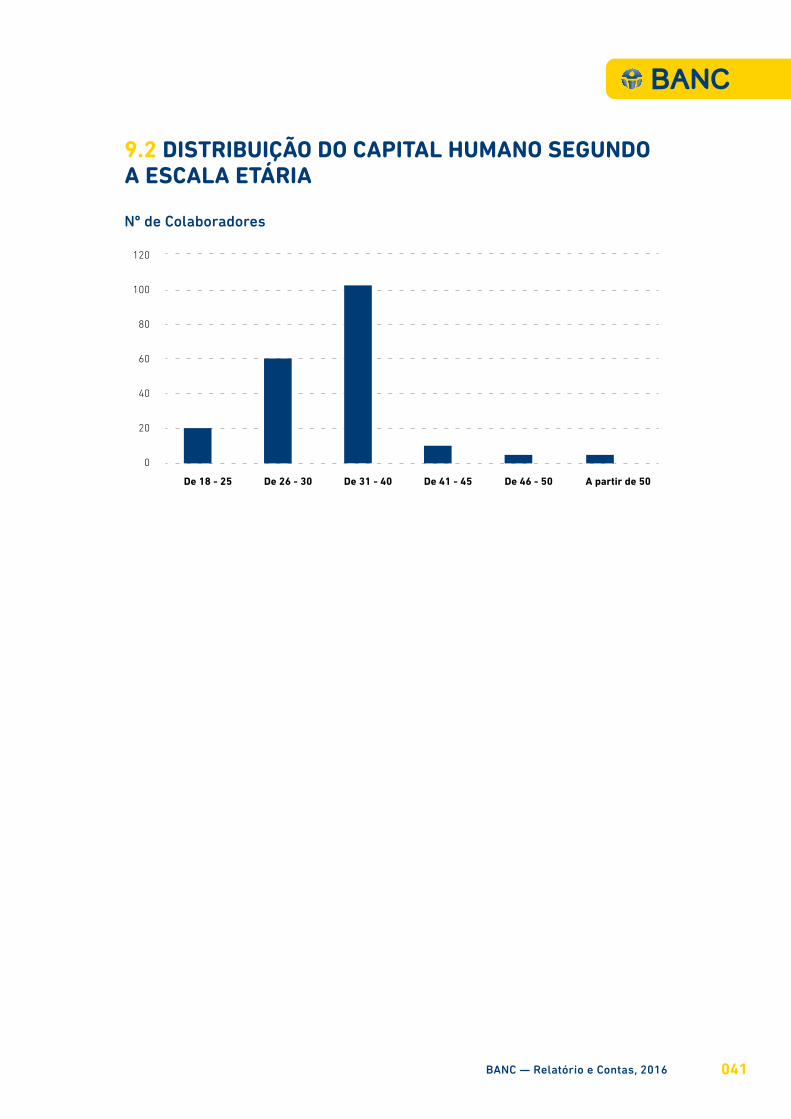
9.2 DISTRIBUIÇÃO DO CAPITAL HUMANO SEGUNDO A ESCALA ETÁRIA
Nº de Colaboradores
120
100
80
60
40
20
0
De 18 - 25 De 26 - 30 De 31 - 40 De 41 - 45 De 46 - 50 A partir de 50
BANC — Relatório e Contas, 2016 041
10. INFORMÁTICA - DESENVOLVIMENTO E SEGURANÇA
10.1 DIRECÇÃO DE DESENVOLVIMENTO E SEGURANÇADurante o ano de 2016 a Direcção de Desenvolvimento e Segurança (DDP) coordenou a implementação dos seguintes projectos e iniciativas:
1. Reestruturação de crédito e Análise de garantias;
2. Projecto Pelicano – MasterCard [Integração BANKA/PEX];
3. Projecto Integração BANKA/SWIFT;
4. Programa de projectos Disaster Recovery × Quick-EDD; × Configuração e arranque da Infraestrutura Blade;
5. Programa de projectos Ondjango – Sede Talatona × SP1 – Datacenter | Plano B - Polo técnico; × SP2 – Neworking; × SP4 – Aprovisionamento.
10.2 DESENVOLVIMENTO
No âmbito de iniciativas regulamentares, foram implementadas por parceiros (EXICTOS), bem como internamente as seguintes:
1. A Framework CEOB, para dar tratamento à cobrança da Contribuição Especial Obrigatória, uma iniciativa do estado angolano, onde os Bancos Comerciais são os principais parceiros;
2. Reformulação da estrutura dos mapas de Necessidades e Operações Executadas em Moeda Estrangeira, iniciativa do BNA para com os Bancos Comerciais;
Iniciativas de necessidade organizacional:
1. Comissão de Manutenção DO, para cobrança de taxa de manutenção/serviço na conta do cliente;
2. Diferenças SAP, iniciativa decorrente do Projecto de Integração BANKA e o SAP com objectivo de terminar com as diferenças existentes no SAP oriundas da integração das interfaces;
3. Suporte Migração, iniciativa para acompanhamento e configurações necessárias à mudança para o novo sítio.
BANC — Relatório e Contas, 2016 043

11.ANÁLISE FINANCEIRA
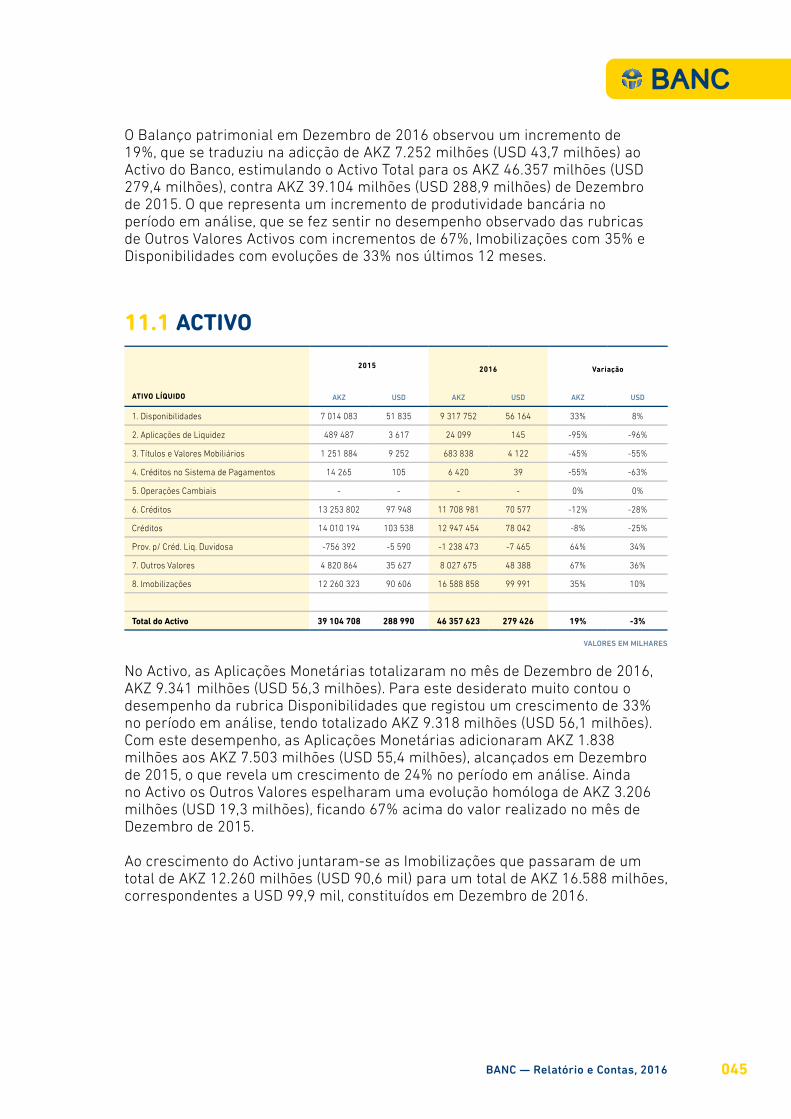
O Balanço patrimonial em Dezembro de 2016 observou um incremento de 19%, que se traduziu na adicção de AKZ 7.252 milhões (USD 43,7 milhões) ao Activo do Banco, estimulando o Activo Total para os AKZ 46.357 milhões (USD 279,4 milhões), contra AKZ 39.104 milhões (USD 288,9 milhões) de Dezembro de 2015. O que representa um incremento de produtividade bancária no período em análise, que se fez sentir no desempenho observado das rubricas de Outros Valores Activos com incrementos de 67%, Imobilizações com 35% e Disponibilidades com evoluções de 33% nos últimos 12 meses.
11.1 ACTIVO
ATIVO LÍQUIDO
2015 2016 Variação
AKZ USD AKZ USD AKZ USD
1. Disponibilidades 7 014 083 51 835 9 317 752 56 164 33% 8%
2. Aplicações de Liquidez 489 487 3 617 24 099 145 -95% -96%
3. Títulos e Valores Mobiliários 1 251 884 9 252 683 838 4 122 -45% -55%
4. Créditos no Sistema de Pagamentos 14 265 105 6 420 39 -55% -63%
5. Operações Cambiais - - - - 0% 0%
6. Créditos 13 253 802 97 948 11 708 981 70 577 -12% -28%
Créditos 14 010 194 103 538 12 947 454 78 042 -8% -25%
Prov. p/ Créd. Liq. Duvidosa -756 392 -5 590 -1 238 473 -7 465 64% 34%
7. Outros Valores 4 820 864 35 627 8 027 675 48 388 67% 36%
8. Imobilizações 12 260 323 90 606 16 588 858 99 991 35% 10%
Total do Activo 39 104 708 288 990 46 357 623 279 426 19% -3%
No Activo, as Aplicações Monetárias totalizaram no mês de Dezembro de 2016, AKZ 9.341 milhões (USD 56,3 milhões). Para este desiderato muito contou o desempenho da rubrica Disponibilidades que registou um crescimento de 33% no período em análise, tendo totalizado AKZ 9.318 milhões (USD 56,1 milhões). Com este desempenho, as Aplicações Monetárias adicionaram AKZ 1.838 milhões aos AKZ 7.503 milhões (USD 55,4 milhões), alcançados em Dezembro de 2015, o que revela um crescimento de 24% no período em análise. Ainda no Activo os Outros Valores espelharam uma evolução homóloga de AKZ 3.206 milhões (USD 19,3 milhões), ficando 67% acima do valor realizado no mês de Dezembro de 2015.
Ao crescimento do Activo juntaram-se as Imobilizações que passaram de um total de AKZ 12.260 milhões (USD 90,6 mil) para um total de AKZ 16.588 milhões, correspondentes a USD 99,9 mil, constituídos em Dezembro de 2016.
VALORES EM MILHARES
BANC — Relatório e Contas, 2016 045
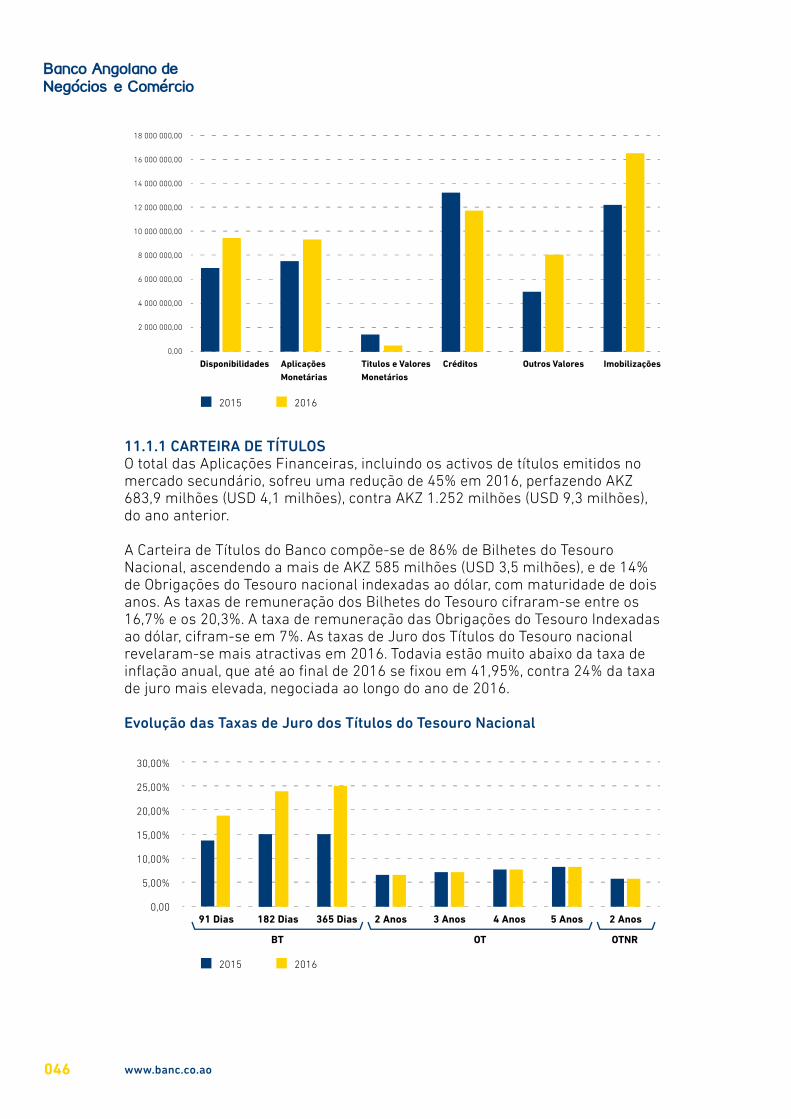
11.1.1 CARTEIRA DE TÍTULOSO total das Aplicações Financeiras, incluindo os activos de títulos emitidos no mercado secundário, sofreu uma redução de 45% em 2016, perfazendo AKZ 683,9 milhões (USD 4,1 milhões), contra AKZ 1.252 milhões (USD 9,3 milhões), do ano anterior.
A Carteira de Títulos do Banco compõe-se de 86% de Bilhetes do Tesouro Nacional, ascendendo a mais de AKZ 585 milhões (USD 3,5 milhões), e de 14% de Obrigações do Tesouro nacional indexadas ao dólar, com maturidade de dois anos. As taxas de remuneração dos Bilhetes do Tesouro cifraram-se entre os 16,7% e os 20,3%. A taxa de remuneração das Obrigações do Tesouro Indexadas ao dólar, cifram-se em 7%. As taxas de Juro dos Títulos do Tesouro nacional revelaram-se mais atractivas em 2016. Todavia estão muito abaixo da taxa de inflação anual, que até ao final de 2016 se fixou em 41,95%, contra 24% da taxa de juro mais elevada, negociada ao longo do ano de 2016.
18 000 000,00
16 000 000,00
14 000 000,00
12 000 000,00
10 000 000,00
8 000 000,00
6 000 000,00
4 000 000,00
2 000 000,00
0,00
Disponibilidades
2015 2016
AplicaçõesMonetárias
Titulos e Valores Monetários
Créditos Outros Valores Imobilizações
30,00%
25,00%
20,00%
15,00%
10,00%
5,00%
0,0091 Dias
2015 2016
182 Dias
BT OT OTNR
365 Dias 2 Anos 3 Anos 4 Anos 5 Anos 2 Anos
Evolução das Taxas de Juro dos Títulos do Tesouro Nacional
www.banc.co.ao046
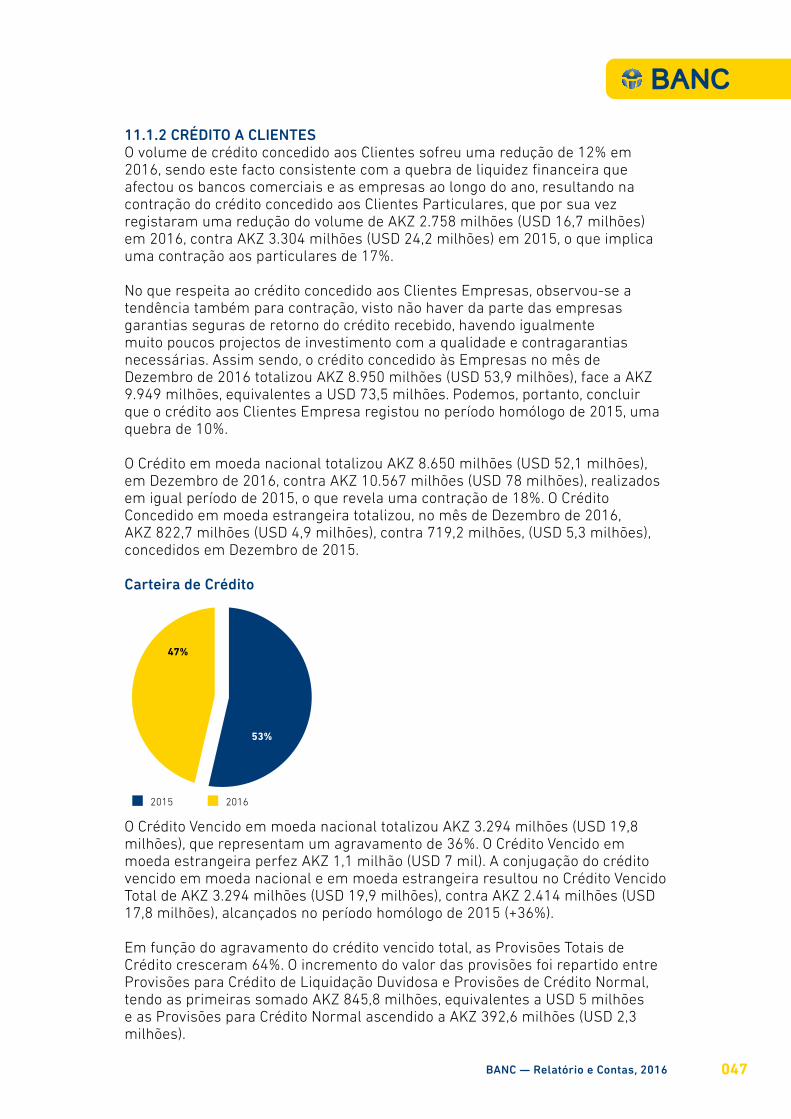
11.1.2 CRÉDITO A CLIENTESO volume de crédito concedido aos Clientes sofreu uma redução de 12% em 2016, sendo este facto consistente com a quebra de liquidez financeira que afectou os bancos comerciais e as empresas ao longo do ano, resultando na contração do crédito concedido aos Clientes Particulares, que por sua vez registaram uma redução do volume de AKZ 2.758 milhões (USD 16,7 milhões) em 2016, contra AKZ 3.304 milhões (USD 24,2 milhões) em 2015, o que implica uma contração aos particulares de 17%.
No que respeita ao crédito concedido aos Clientes Empresas, observou-se a tendência também para contração, visto não haver da parte das empresas garantias seguras de retorno do crédito recebido, havendo igualmente muito poucos projectos de investimento com a qualidade e contragarantias necessárias. Assim sendo, o crédito concedido às Empresas no mês de Dezembro de 2016 totalizou AKZ 8.950 milhões (USD 53,9 milhões), face a AKZ 9.949 milhões, equivalentes a USD 73,5 milhões. Podemos, portanto, concluir que o crédito aos Clientes Empresa registou no período homólogo de 2015, uma quebra de 10%.
O Crédito em moeda nacional totalizou AKZ 8.650 milhões (USD 52,1 milhões), em Dezembro de 2016, contra AKZ 10.567 milhões (USD 78 milhões), realizados em igual período de 2015, o que revela uma contração de 18%. O Crédito Concedido em moeda estrangeira totalizou, no mês de Dezembro de 2016, AKZ 822,7 milhões (USD 4,9 milhões), contra 719,2 milhões, (USD 5,3 milhões), concedidos em Dezembro de 2015.
O Crédito Vencido em moeda nacional totalizou AKZ 3.294 milhões (USD 19,8 milhões), que representam um agravamento de 36%. O Crédito Vencido em moeda estrangeira perfez AKZ 1,1 milhão (USD 7 mil). A conjugação do crédito vencido em moeda nacional e em moeda estrangeira resultou no Crédito Vencido Total de AKZ 3.294 milhões (USD 19,9 milhões), contra AKZ 2.414 milhões (USD 17,8 milhões), alcançados no período homólogo de 2015 (+36%).
Em função do agravamento do crédito vencido total, as Provisões Totais de Crédito cresceram 64%. O incremento do valor das provisões foi repartido entre Provisões para Crédito de Liquidação Duvidosa e Provisões de Crédito Normal, tendo as primeiras somado AKZ 845,8 milhões, equivalentes a USD 5 milhões e as Provisões para Crédito Normal ascendido a AKZ 392,6 milhões (USD 2,3 milhões).
Carteira de Crédito
2015 2016
47%
53%
BANC — Relatório e Contas, 2016 047

O crédito concedido aos clientes totalizou AKZ 9.473 milhões, equivalentes a USD 57,1 milhões no mês de Dezembro de 2016, o que relativamente ao saldo obtido em igual período de 2015 representou uma quebra de AKZ 1.812 milhões, equivalentes a USD 10,9 milhões, indicando uma contração do crédito concedido aos clientes na ordem de 16%. O total dos proveitos de crédito, quer sejam em moeda nacional, quer sejam em moeda estrangeira, fixaram-se em AKZ 179,2 milhões, equivalentes a USD 1 milhão, espelhando um decréscimo de 42% em relação ao ano anterior.
2015 2016 Variação
AKZ USD AKZ USD Absoluta (%)
1. Crédito Total 13 253 802 97 948 11 708 981 70 577 -1 544 822 -12%
1.1 Crédito sobre Clientes 11 286 345 83 408 9 473 360 57 102 -1 812 985 -16%
Moeda Nacional 10 567 062 78 092 8 650 631 52 143 -1 916 432 -18%
Moeda Estrangeira 719 283 5 316 822 729 4 959 103 447 14%
1.2 Crédito e Juros Vencidos 2 414 505 17 844 3 294 813 19 860 880 308 36%
Moeda Nacional 2 414 470 17 843 3 293 677 19 853 879 207 36%
Moeda Estrangeira 36 - 1 136 7 1 100 3085%
Juros Vencidos a Regularizar -1 - - - 1 -100%
2. Proveitos de Crédito 309 344 2 286 179 281 1 080 -130 063 -42%
Moeda Nacional 306 952 2 268 178 868 1 078 -128 084 -42%
Moeda Estrangeira 2 392 18 413 2 -1 979 -83%
3. Provisões Totais de Crédito -756 392 -5 590 -1 238 473 -7 465 -482 081 64%
3.1 Provisões Liquidação Duvidosa -580 395 -4 289 -845 871 -5 099 -265 477 46%
3.2 Provisões Crédito Normal -175 998 -1 301 -392 602 -2 366 -216 604 123%
4. Rácios
4.1 Crédito/ Depósitos 69% 55% -21%
4.2 Crédito Vencido/ Crédito Total 18% 28% 54%
4.3 Próvisões Crédito/ Crédito Total -6% -11% 85%
VALORES EM MILHARES
Evolução do Crédito por segmento10 000,00
8 000,00
6 000,00
4 000,00
2 000,00
0,00
2015
Empresas
Particulares
2016
Evolução do Crédito a Clientes
www.banc.co.ao048

O rácio Crédito/Depósito, o qual espelha uma redução do peso do crédito total sobre a Carteira de depósitos, passou de 69% em 2015, para de 55% em igual período de 2016.
O rácio Crédito Vencido/Crédito Total fixou-se no mês de Dezembro de 2016, em 28%, contra os 18%, obtidos no período homólogo de 2015, o que espelha um aumento de 54% do crédito em situação irregular no total do crédito concedido.
As Provisões de Crédito sobre o crédito total passaram de 6% em Dezembro de 2015, para 11% sobre o total do crédito no mês de Dezembro de 2016.
11.2 PASSIVO
PASSIVO
2015 2016 Variação
AKZ USD AKZ USD AKZ USD
1. Depósitos 19 165 349 141 635 21 365 185 128 781 11% -9%
À Ordem 11 559 470 85 426 13 392 944 80 728 16% -6%
A Prazo 7 526 661 55 623 7 852 001 47 329 4% -15%
Outros Depósitos 79 218 585 120 240 725 52% 24%
2. Captações para Liquidez 13 323 453 98 463 18 259 468 110 061 37% 12%
3. Obrigações no Sistema de Pagamentos 365 215 2 699 399 458 2 408 9% -11%
4. Operações Cambiais - - - - 0% 0%
5. Outras Obrigações 433 984 3 207 2 565 965 15 467 491% 382%
6. Provisões para Responsabilidades Prováveis
31 250 231 15 867 96 -49% -59%
7. Capital Social 4 345 752 32 116 4 345 752 26 195 0% -18%
8. Reservas e Fundos 1 219 970 9 016 1 219 970 7 354 0% -18%
9. Resultados Potenciais - - - - 0% 0%
10. Resultados Transitados - - -90 373 -545 0% 0%
11. Resultado Operacional 381 345 2 818 -1 751 532 -10 558 -559% -475%
12. Resultado Não Operacional -67 438 -498 27 863 168 -141% -134%
13. Encargos s/Resultado Corrente -94 172 -696 - - -100% -100%
Total do Passivo 39 104 708 288 990 46 357 623 279 426 19% -3%
No Passivo destacaram-se as Captações de Liquidez que em 2016 perfizeram AKZ 18.259 milhões (USD 110 milhões), contra AKZ 13.323 milhões (USD 98,4 milhões), realizando uma evolução de 37%.
As Outras Obrigações, totalizaram AKZ 2.565 milhões, (USD 15,4 milhões), obtidos no mês de Dezembro de 2016, contra AKZ 433,9 milhões, (USD 3,2 milhões).
11.2.1 RECURSOS DE CLIENTESOs Recursos de Clientes representavam no final de 2016, 93% do total do passivo do BANC, ilustrando as características de um Banco centrado ao serviço das famílias e das empresas.
VALORES EM MILHARES
BANC — Relatório e Contas, 2016 049
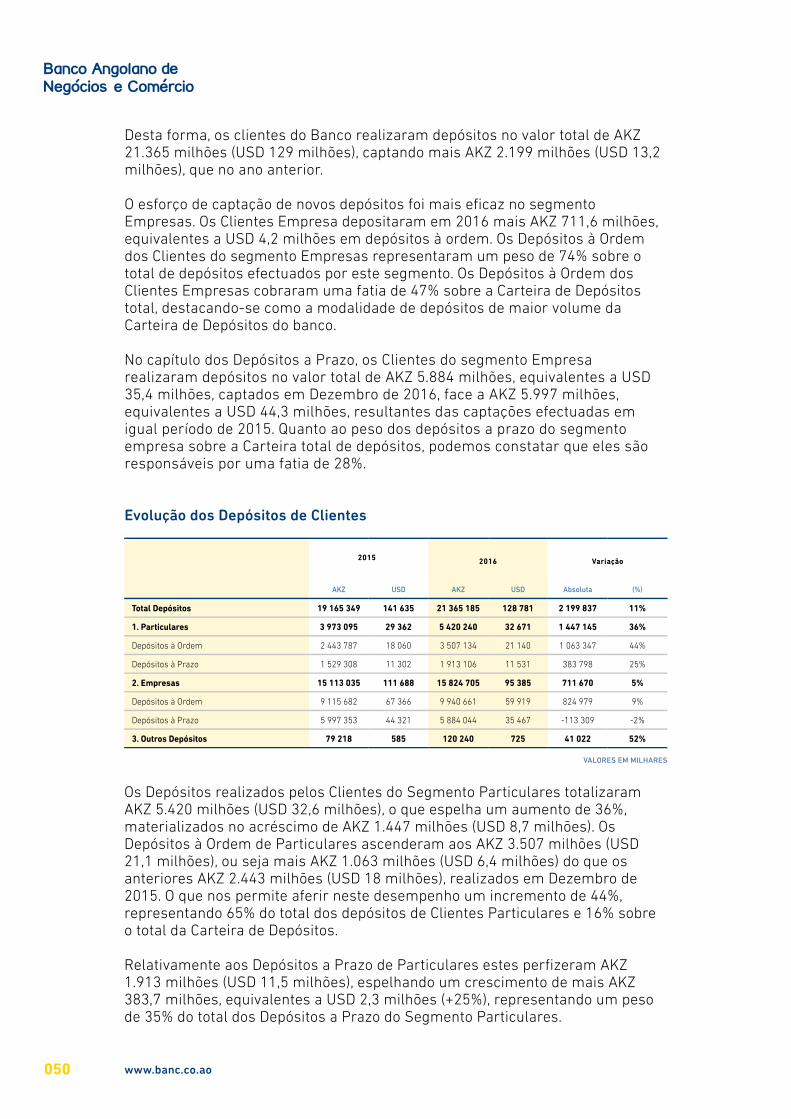
Desta forma, os clientes do Banco realizaram depósitos no valor total de AKZ 21.365 milhões (USD 129 milhões), captando mais AKZ 2.199 milhões (USD 13,2 milhões), que no ano anterior.
O esforço de captação de novos depósitos foi mais eficaz no segmento Empresas. Os Clientes Empresa depositaram em 2016 mais AKZ 711,6 milhões, equivalentes a USD 4,2 milhões em depósitos à ordem. Os Depósitos à Ordem dos Clientes do segmento Empresas representaram um peso de 74% sobre o total de depósitos efectuados por este segmento. Os Depósitos à Ordem dos Clientes Empresas cobraram uma fatia de 47% sobre a Carteira de Depósitos total, destacando-se como a modalidade de depósitos de maior volume da Carteira de Depósitos do banco.
No capítulo dos Depósitos a Prazo, os Clientes do segmento Empresa realizaram depósitos no valor total de AKZ 5.884 milhões, equivalentes a USD 35,4 milhões, captados em Dezembro de 2016, face a AKZ 5.997 milhões, equivalentes a USD 44,3 milhões, resultantes das captações efectuadas em igual período de 2015. Quanto ao peso dos depósitos a prazo do segmento empresa sobre a Carteira total de depósitos, podemos constatar que eles são responsáveis por uma fatia de 28%.
Evolução dos Depósitos de Clientes
2015 2016 Variação
AKZ USD AKZ USD Absoluta (%)
Total Depósitos 19 165 349 141 635 21 365 185 128 781 2 199 837 11%
1. Particulares 3 973 095 29 362 5 420 240 32 671 1 447 145 36%
Depósitos à Ordem 2 443 787 18 060 3 507 134 21 140 1 063 347 44%
Depósitos à Prazo 1 529 308 11 302 1 913 106 11 531 383 798 25%
2. Empresas 15 113 035 111 688 15 824 705 95 385 711 670 5%
Depósitos à Ordem 9 115 682 67 366 9 940 661 59 919 824 979 9%
Depósitos à Prazo 5 997 353 44 321 5 884 044 35 467 -113 309 -2%
3. Outros Depósitos 79 218 585 120 240 725 41 022 52%
VALORES EM MILHARES
Os Depósitos realizados pelos Clientes do Segmento Particulares totalizaram AKZ 5.420 milhões (USD 32,6 milhões), o que espelha um aumento de 36%, materializados no acréscimo de AKZ 1.447 milhões (USD 8,7 milhões). Os Depósitos à Ordem de Particulares ascenderam aos AKZ 3.507 milhões (USD 21,1 milhões), ou seja mais AKZ 1.063 milhões (USD 6,4 milhões) do que os anteriores AKZ 2.443 milhões (USD 18 milhões), realizados em Dezembro de 2015. O que nos permite aferir neste desempenho um incremento de 44%, representando 65% do total dos depósitos de Clientes Particulares e 16% sobre o total da Carteira de Depósitos.
Relativamente aos Depósitos a Prazo de Particulares estes perfizeram AKZ 1.913 milhões (USD 11,5 milhões), espelhando um crescimento de mais AKZ 383,7 milhões, equivalentes a USD 2,3 milhões (+25%), representando um peso de 35% do total dos Depósitos a Prazo do Segmento Particulares.
www.banc.co.ao050
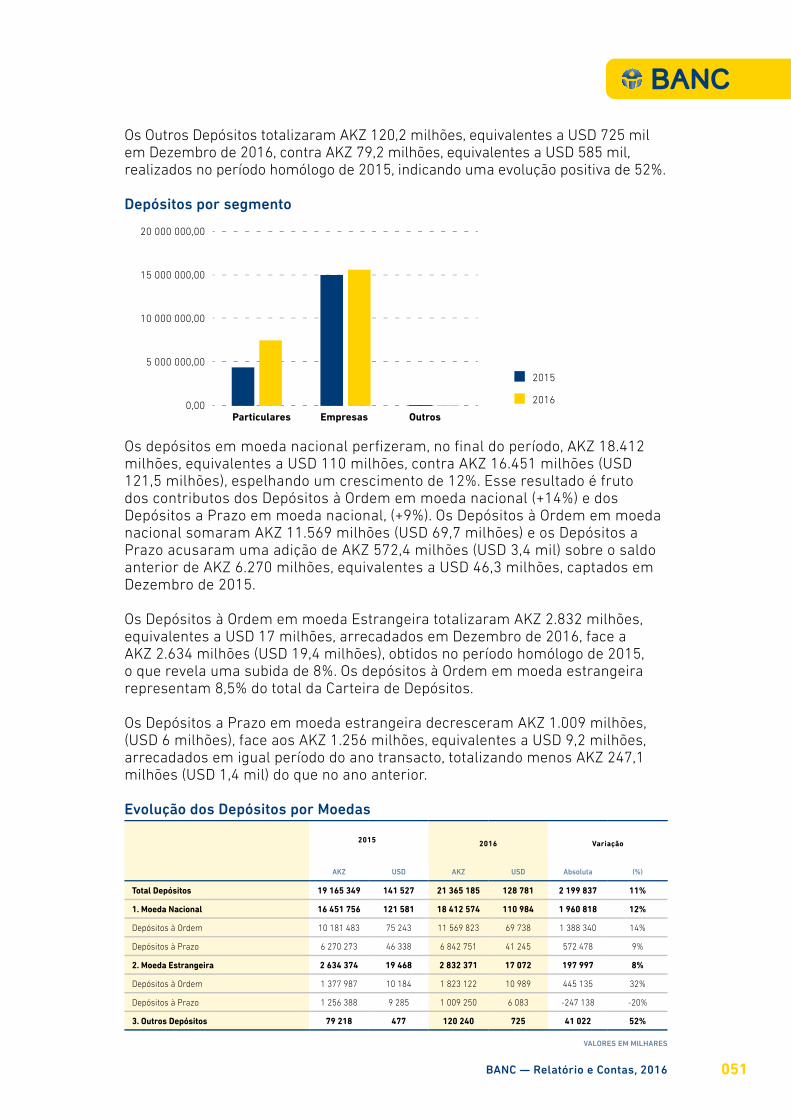
Os Outros Depósitos totalizaram AKZ 120,2 milhões, equivalentes a USD 725 mil em Dezembro de 2016, contra AKZ 79,2 milhões, equivalentes a USD 585 mil, realizados no período homólogo de 2015, indicando uma evolução positiva de 52%.
2015 2016 Variação
AKZ USD AKZ USD Absoluta (%)
Total Depósitos 19 165 349 141 527 21 365 185 128 781 2 199 837 11%
1. Moeda Nacional 16 451 756 121 581 18 412 574 110 984 1 960 818 12%
Depósitos à Ordem 10 181 483 75 243 11 569 823 69 738 1 388 340 14%
Depósitos à Prazo 6 270 273 46 338 6 842 751 41 245 572 478 9%
2. Moeda Estrangeira 2 634 374 19 468 2 832 371 17 072 197 997 8%
Depósitos à Ordem 1 377 987 10 184 1 823 122 10 989 445 135 32%
Depósitos à Prazo 1 256 388 9 285 1 009 250 6 083 -247 138 -20%
3. Outros Depósitos 79 218 477 120 240 725 41 022 52%
Os depósitos em moeda nacional perfizeram, no final do período, AKZ 18.412 milhões, equivalentes a USD 110 milhões, contra AKZ 16.451 milhões (USD 121,5 milhões), espelhando um crescimento de 12%. Esse resultado é fruto dos contributos dos Depósitos à Ordem em moeda nacional (+14%) e dos Depósitos a Prazo em moeda nacional, (+9%). Os Depósitos à Ordem em moeda nacional somaram AKZ 11.569 milhões (USD 69,7 milhões) e os Depósitos a Prazo acusaram uma adição de AKZ 572,4 milhões (USD 3,4 mil) sobre o saldo anterior de AKZ 6.270 milhões, equivalentes a USD 46,3 milhões, captados em Dezembro de 2015.
Os Depósitos à Ordem em moeda Estrangeira totalizaram AKZ 2.832 milhões, equivalentes a USD 17 milhões, arrecadados em Dezembro de 2016, face a AKZ 2.634 milhões (USD 19,4 milhões), obtidos no período homólogo de 2015, o que revela uma subida de 8%. Os depósitos à Ordem em moeda estrangeira representam 8,5% do total da Carteira de Depósitos.
Os Depósitos a Prazo em moeda estrangeira decresceram AKZ 1.009 milhões, (USD 6 milhões), face aos AKZ 1.256 milhões, equivalentes a USD 9,2 milhões, arrecadados em igual período do ano transacto, totalizando menos AKZ 247,1 milhões (USD 1,4 mil) do que no ano anterior.
Evolução dos Depósitos por Moedas
VALORES EM MILHARES
Depósitos por segmento25 000 000,00
20 000 000,00
15 000 000,00
10 000 000,00
5 000 000,00
0,00Particulares Empresas Outros
2015
2016
BANC — Relatório e Contas, 2016 051
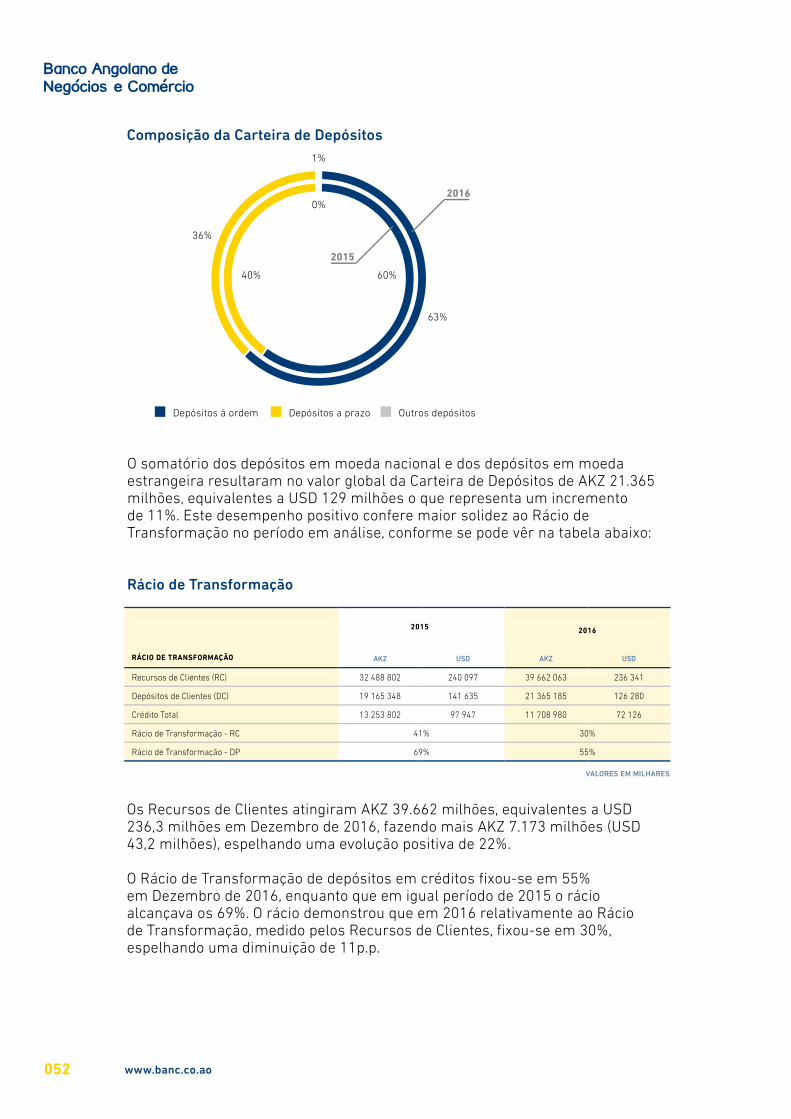
O somatório dos depósitos em moeda nacional e dos depósitos em moeda estrangeira resultaram no valor global da Carteira de Depósitos de AKZ 21.365 milhões, equivalentes a USD 129 milhões o que representa um incremento de 11%. Este desempenho positivo confere maior solidez ao Rácio de Transformação no período em análise, conforme se pode vêr na tabela abaixo:
Rácio de Transformação
RÁCIO DE TRANSFORMAÇÃO
2015 2016
AKZ USD AKZ USD
Recursos de Clientes (RC) 32 488 802 240 097 39 662 063 236 341
Depósitos de Clientes (DC) 19 165 348 141 635 21 365 185 126 280
Crédito Total 13 253 802 97 947 11 708 980 72 126
Rácio de Transformação - RC 41% 30%
Rácio de Transformação - DP 69% 55%
Os Recursos de Clientes atingiram AKZ 39.662 milhões, equivalentes a USD 236,3 milhões em Dezembro de 2016, fazendo mais AKZ 7.173 milhões (USD 43,2 milhões), espelhando uma evolução positiva de 22%.
O Rácio de Transformação de depósitos em créditos fixou-se em 55% em Dezembro de 2016, enquanto que em igual período de 2015 o rácio alcançava os 69%. O rácio demonstrou que em 2016 relativamente ao Rácio de Transformação, medido pelos Recursos de Clientes, fixou-se em 30%, espelhando uma diminuição de 11p.p.
VALORES EM MILHARES
Composição da Carteira de Depósitos
Depósitos à ordem Depósitos a prazo Outros depósitos
0%
1%
36%
63%
40% 60%
www.banc.co.ao052
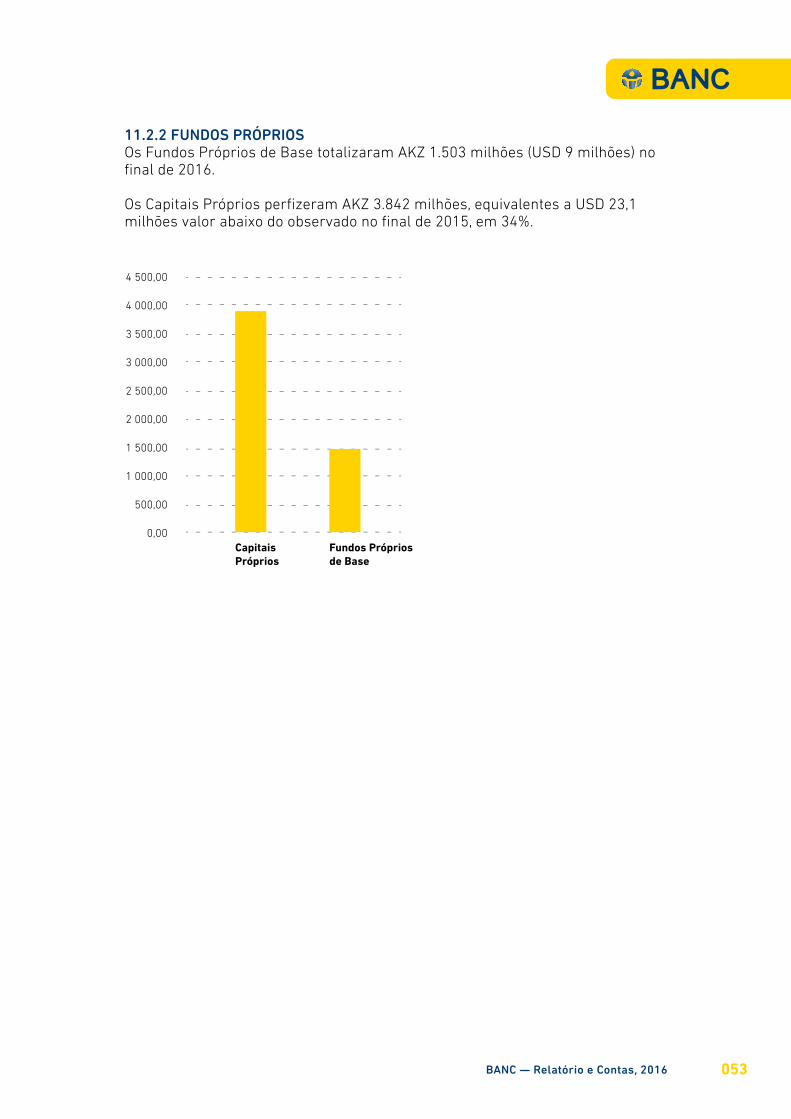
11.2.2 FUNDOS PRÓPRIOSOs Fundos Próprios de Base totalizaram AKZ 1.503 milhões (USD 9 milhões) no final de 2016.
Os Capitais Próprios perfizeram AKZ 3.842 milhões, equivalentes a USD 23,1 milhões valor abaixo do observado no final de 2015, em 34%.
Capitais Próprios
Fundos Próprios de Base
BANC — Relatório e Contas, 2016 053
12.ANÁLISE ECONÓMICA
12.1 RENTABILIDADE
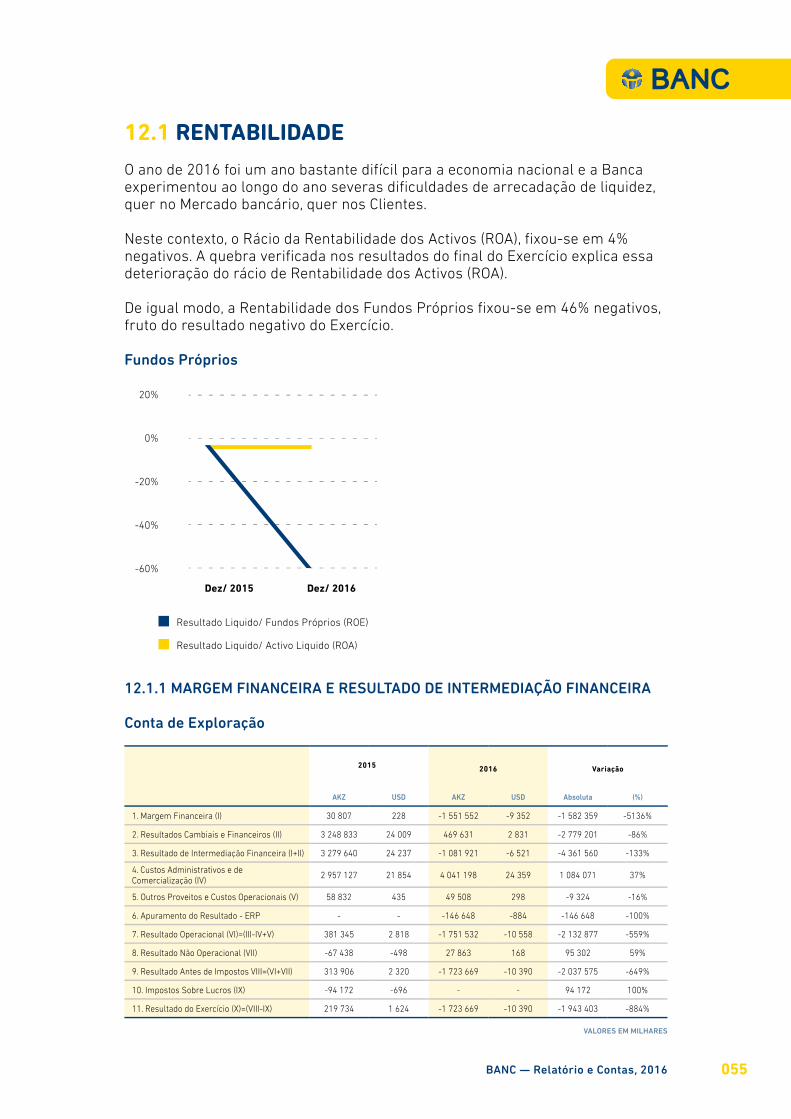
O ano de 2016 foi um ano bastante difícil para a economia nacional e a Banca experimentou ao longo do ano severas dificuldades de arrecadação de liquidez, quer no Mercado bancário, quer nos Clientes.
Neste contexto, o Rácio da Rentabilidade dos Activos (ROA), fixou-se em 4% negativos. A quebra verificada nos resultados do final do Exercício explica essa deterioração do rácio de Rentabilidade dos Activos (ROA).
De igual modo, a Rentabilidade dos Fundos Próprios fixou-se em 46% negativos, fruto do resultado negativo do Exercício.
12.1.1 MARGEM FINANCEIRA E RESULTADO DE INTERMEDIAÇÃO FINANCEIRA
Conta de Exploração
2015 2016 Variação
AKZ USD AKZ USD Absoluta (%)
1. Margem Financeira (I) 30 807 228 -1 551 552 -9 352 -1 582 359 -5136%
2. Resultados Cambiais e Financeiros (II) 3 248 833 24 009 469 631 2 831 -2 779 201 -86%
3. Resultado de Intermediação Financeira (I+II) 3 279 640 24 237 -1 081 921 -6 521 -4 361 560 -133%
4. Custos Administrativos e de Comercialização (IV)
2 957 127 21 854 4 041 198 24 359 1 084 071 37%
5. Outros Proveitos e Custos Operacionais (V) 58 832 435 49 508 298 -9 324 -16%
6. Apuramento do Resultado - ERP - - -146 648 -884 -146 648 -100%
7. Resultado Operacional (VI)=(III-IV+V) 381 345 2 818 -1 751 532 -10 558 -2 132 877 -559%
8. Resultado Não Operacional (VII) -67 438 -498 27 863 168 95 302 59%
9. Resultado Antes de Impostos VIII=(VI+VII) 313 906 2 320 -1 723 669 -10 390 -2 037 575 -649%
10. Impostos Sobre Lucros (IX) -94 172 -696 - - 94 172 100%
11. Resultado do Exercício (X)=(VIII-IX) 219 734 1 624 -1 723 669 -10 390 -1 943 403 -884%
VALORES EM MILHARES
Fundos Próprios
20%
0%
-20%
-40%
-60%
Dez/ 2015
Resultado Liquido/ Fundos Próprios (ROE)
Resultado Liquido/ Activo Liquido (ROA)
Dez/ 2016
BANC — Relatório e Contas, 2016 055
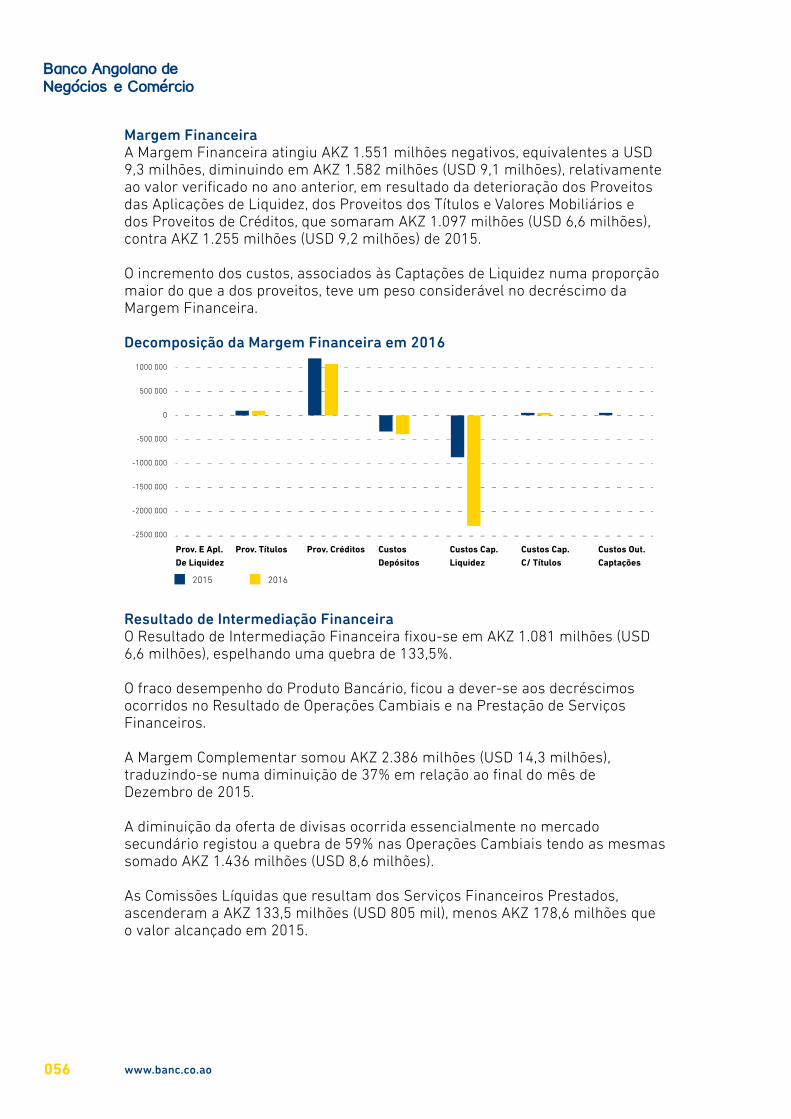
Margem FinanceiraA Margem Financeira atingiu AKZ 1.551 milhões negativos, equivalentes a USD 9,3 milhões, diminuindo em AKZ 1.582 milhões (USD 9,1 milhões), relativamente ao valor verificado no ano anterior, em resultado da deterioração dos Proveitos das Aplicações de Liquidez, dos Proveitos dos Títulos e Valores Mobiliários e dos Proveitos de Créditos, que somaram AKZ 1.097 milhões (USD 6,6 milhões), contra AKZ 1.255 milhões (USD 9,2 milhões) de 2015.
O incremento dos custos, associados às Captações de Liquidez numa proporção maior do que a dos proveitos, teve um peso considerável no decréscimo da Margem Financeira.
Decomposição da Margem Financeira em 2016
Resultado de Intermediação FinanceiraO Resultado de Intermediação Financeira fixou-se em AKZ 1.081 milhões (USD 6,6 milhões), espelhando uma quebra de 133,5%.
O fraco desempenho do Produto Bancário, ficou a dever-se aos decréscimos ocorridos no Resultado de Operações Cambiais e na Prestação de Serviços Financeiros.
A Margem Complementar somou AKZ 2.386 milhões (USD 14,3 milhões), traduzindo-se numa diminuição de 37% em relação ao final do mês de Dezembro de 2015.
A diminuição da oferta de divisas ocorrida essencialmente no mercado secundário registou a quebra de 59% nas Operações Cambiais tendo as mesmas somado AKZ 1.436 milhões (USD 8,6 milhões).
As Comissões Líquidas que resultam dos Serviços Financeiros Prestados, ascenderam a AKZ 133,5 milhões (USD 805 mil), menos AKZ 178,6 milhões que o valor alcançado em 2015.
1500 000
1000 000
500 000
0
-500 000
-1000 000
-1500 000
-2000 000
-2500 000
2015 2016
Prov. E Apl.De Liquidez
Prov. Títulos Prov. Créditos Custos Depósitos
Custos Cap. Liquidez
Custos Cap. C/ Títulos
Custos Out. Captações
www.banc.co.ao056
Produto Bancário
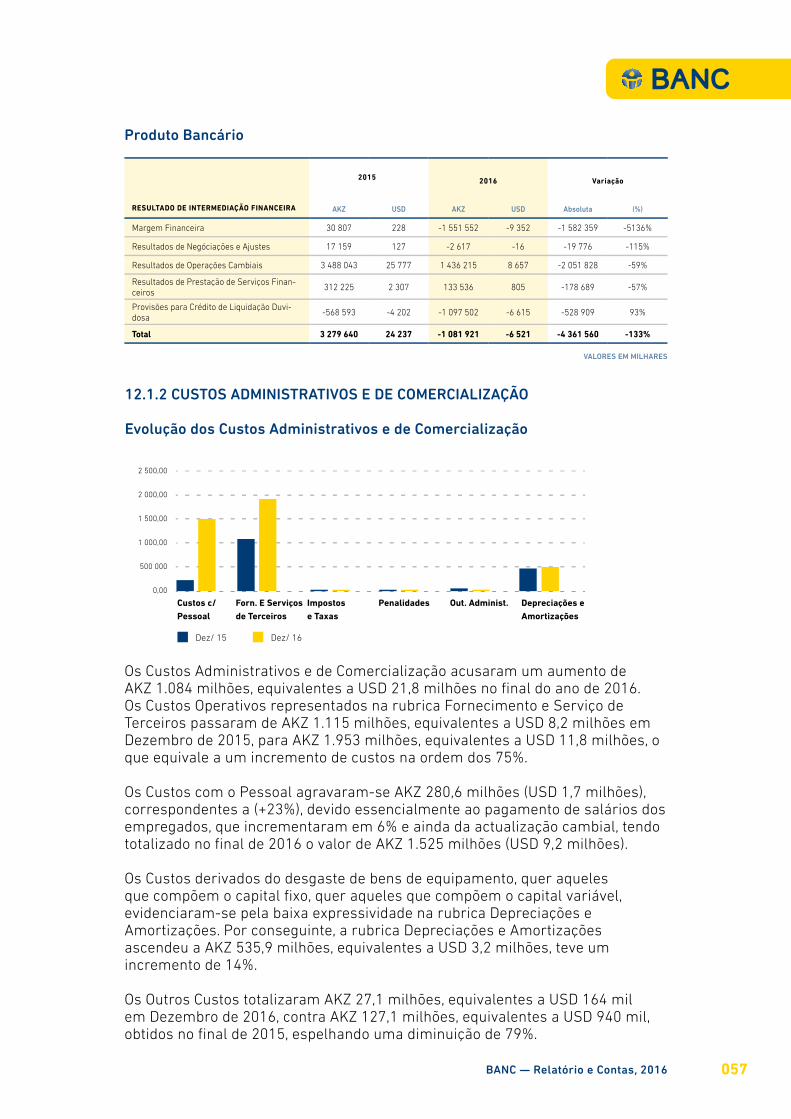
12.1.2 CUSTOS ADMINISTRATIVOS E DE COMERCIALIZAÇÃO
Evolução dos Custos Administrativos e de Comercialização
RESULTADO DE INTERMEDIAÇÃO FINANCEIRA
2015 2016 Variação
AKZ USD AKZ USD Absoluta (%)
Margem Financeira 30 807 228 -1 551 552 -9 352 -1 582 359 -5136%
Resultados de Negóciações e Ajustes 17 159 127 -2 617 -16 -19 776 -115%
Resultados de Operações Cambiais 3 488 043 25 777 1 436 215 8 657 -2 051 828 -59%
Resultados de Prestação de Serviços Finan-ceiros
312 225 2 307 133 536 805 -178 689 -57%
Provisões para Crédito de Liquidação Duvi-dosa
-568 593 -4 202 -1 097 502 -6 615 -528 909 93%
Total 3 279 640 24 237 -1 081 921 -6 521 -4 361 560 -133%
VALORES EM MILHARES
Os Custos Administrativos e de Comercialização acusaram um aumento de AKZ 1.084 milhões, equivalentes a USD 21,8 milhões no final do ano de 2016. Os Custos Operativos representados na rubrica Fornecimento e Serviço de Terceiros passaram de AKZ 1.115 milhões, equivalentes a USD 8,2 milhões em Dezembro de 2015, para AKZ 1.953 milhões, equivalentes a USD 11,8 milhões, o que equivale a um incremento de custos na ordem dos 75%.
Os Custos com o Pessoal agravaram-se AKZ 280,6 milhões (USD 1,7 milhões), correspondentes a (+23%), devido essencialmente ao pagamento de salários dos empregados, que incrementaram em 6% e ainda da actualização cambial, tendo totalizado no final de 2016 o valor de AKZ 1.525 milhões (USD 9,2 milhões).
Os Custos derivados do desgaste de bens de equipamento, quer aqueles que compõem o capital fixo, quer aqueles que compõem o capital variável, evidenciaram-se pela baixa expressividade na rubrica Depreciações e Amortizações. Por conseguinte, a rubrica Depreciações e Amortizações ascendeu a AKZ 535,9 milhões, equivalentes a USD 3,2 milhões, teve um incremento de 14%.
Os Outros Custos totalizaram AKZ 27,1 milhões, equivalentes a USD 164 mil em Dezembro de 2016, contra AKZ 127,1 milhões, equivalentes a USD 940 mil, obtidos no final de 2015, espelhando uma diminuição de 79%.
2 500,00
2 000,00
1 500,00
1 000,00
500 000
0,00
Dez/ 15 Dez/ 16
Custos c/ Pessoal
Forn. E Serviços de Terceiros
Impostos e Taxas
Penalidades Out. Administ. Depreciações e Amortizações
BANC — Relatório e Contas, 2016 057
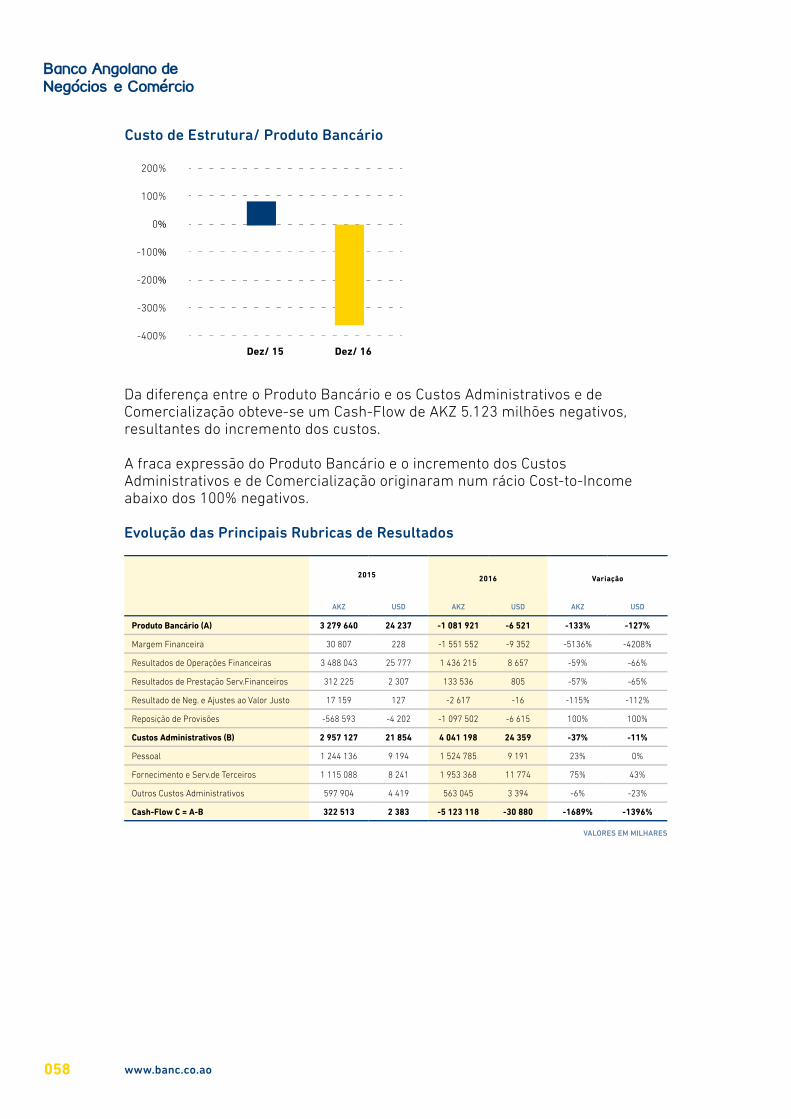
Custo de Estrutura/ Produto Bancário
Da diferença entre o Produto Bancário e os Custos Administrativos e de Comercialização obteve-se um Cash-Flow de AKZ 5.123 milhões negativos, resultantes do incremento dos custos.
A fraca expressão do Produto Bancário e o incremento dos Custos Administrativos e de Comercialização originaram num rácio Cost-to-Income abaixo dos 100% negativos.
Evolução das Principais Rubricas de Resultados
2015 2016 Variação
AKZ USD AKZ USD AKZ USD
Produto Bancário (A) 3 279 640 24 237 -1 081 921 -6 521 -133% -127%
Margem Financeira 30 807 228 -1 551 552 -9 352 -5136% -4208%
Resultados de Operações Financeiras 3 488 043 25 777 1 436 215 8 657 -59% -66%
Resultados de Prestação Serv.Financeiros 312 225 2 307 133 536 805 -57% -65%
Resultado de Neg. e Ajustes ao Valor Justo 17 159 127 -2 617 -16 -115% -112%
Reposição de Provisões -568 593 -4 202 -1 097 502 -6 615 100% 100%
Custos Administrativos (B) 2 957 127 21 854 4 041 198 24 359 -37% -11%
Pessoal 1 244 136 9 194 1 524 785 9 191 23% 0%
Fornecimento e Serv.de Terceiros 1 115 088 8 241 1 953 368 11 774 75% 43%
Outros Custos Administrativos 597 904 4 419 563 045 3 394 -6% -23%
Cash-Flow C = A-B 322 513 2 383 -5 123 118 -30 880 -1689% -1396%
VALORES EM MILHARES
200%
100%
0%
-100%
-200%
-300%
-400%
Dez/ 15 Dez/ 16
www.banc.co.ao058
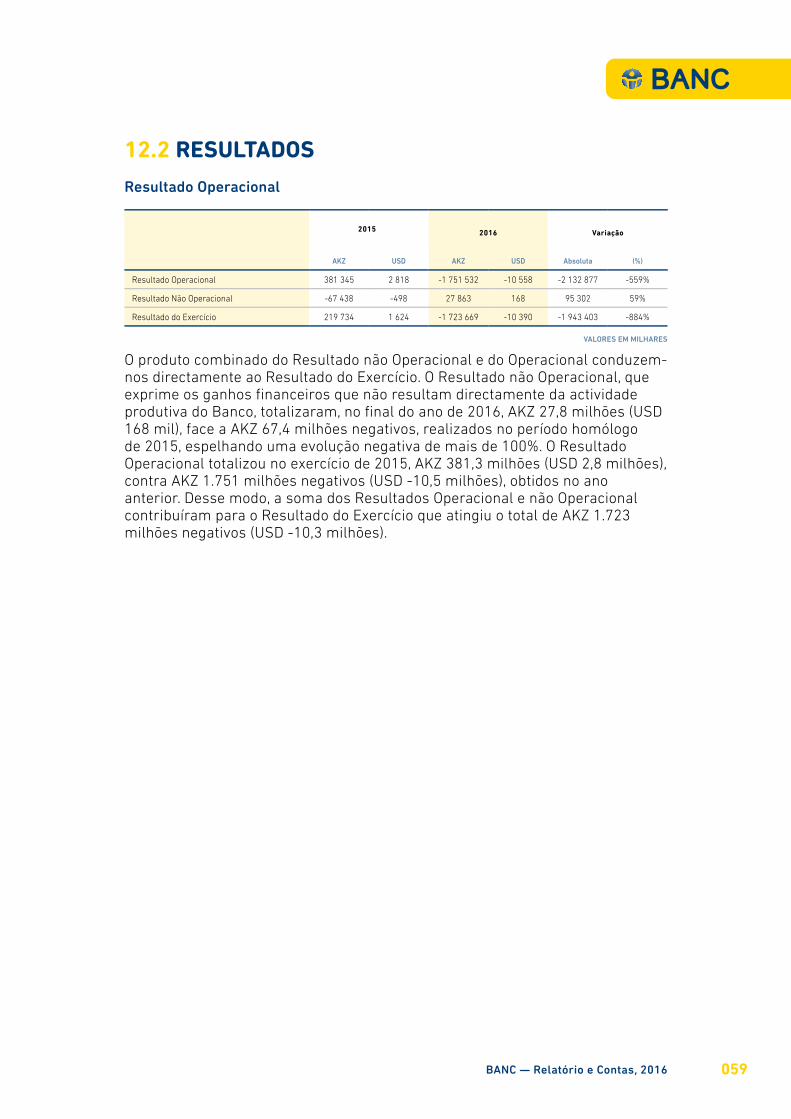
12.2 RESULTADOS
Resultado Operacional
2015 2016 Variação
AKZ USD AKZ USD Absoluta (%)
Resultado Operacional 381 345 2 818 -1 751 532 -10 558 -2 132 877 -559%
Resultado Não Operacional -67 438 -498 27 863 168 95 302 59%
Resultado do Exercício 219 734 1 624 -1 723 669 -10 390 -1 943 403 -884%
O produto combinado do Resultado não Operacional e do Operacional conduzem-nos directamente ao Resultado do Exercício. O Resultado não Operacional, que exprime os ganhos financeiros que não resultam directamente da actividade produtiva do Banco, totalizaram, no final do ano de 2016, AKZ 27,8 milhões (USD 168 mil), face a AKZ 67,4 milhões negativos, realizados no período homólogo de 2015, espelhando uma evolução negativa de mais de 100%. O Resultado Operacional totalizou no exercício de 2015, AKZ 381,3 milhões (USD 2,8 milhões), contra AKZ 1.751 milhões negativos (USD -10,5 milhões), obtidos no ano anterior. Desse modo, a soma dos Resultados Operacional e não Operacional contribuíram para o Resultado do Exercício que atingiu o total de AKZ 1.723 milhões negativos (USD -10,3 milhões).
VALORES EM MILHARES
BANC — Relatório e Contas, 2016 059

13. DEMONSTRAÇÕES FINANCEIRAS
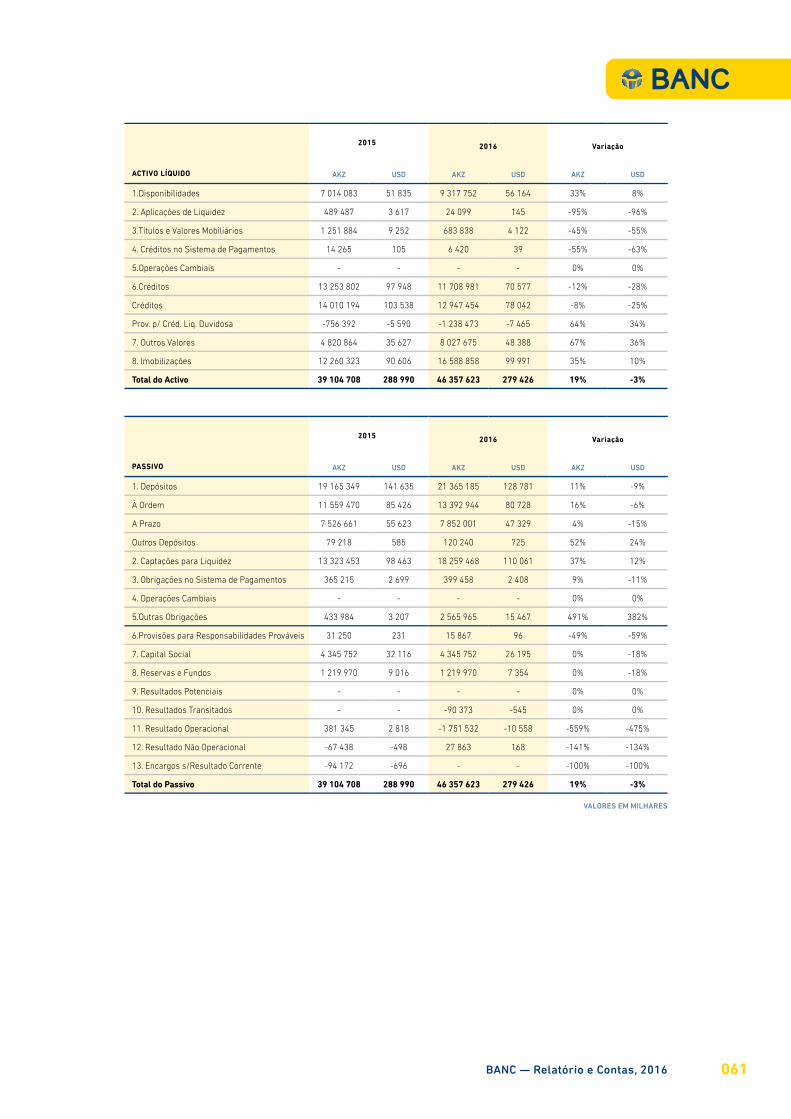
ACTIVO LÍQUIDO
2015 2016 Variação
AKZ USD AKZ USD AKZ USD
1.Disponibilidades 7 014 083 51 835 9 317 752 56 164 33% 8%
2. Aplicações de Liquidez 489 487 3 617 24 099 145 -95% -96%
3.Títulos e Valores Mobiliários 1 251 884 9 252 683 838 4 122 -45% -55%
4. Créditos no Sistema de Pagamentos 14 265 105 6 420 39 -55% -63%
5.Operações Cambiais - - - - 0% 0%
6.Créditos 13 253 802 97 948 11 708 981 70 577 -12% -28%
Créditos 14 010 194 103 538 12 947 454 78 042 -8% -25%
Prov. p/ Créd. Liq. Duvidosa -756 392 -5 590 -1 238 473 -7 465 64% 34%
7. Outros Valores 4 820 864 35 627 8 027 675 48 388 67% 36%
8. Imobilizações 12 260 323 90 606 16 588 858 99 991 35% 10%
Total do Activo 39 104 708 288 990 46 357 623 279 426 19% -3%
PASSIVO
2015 2016 Variação
AKZ USD AKZ USD AKZ USD
1. Depósitos 19 165 349 141 635 21 365 185 128 781 11% -9%
À Ordem 11 559 470 85 426 13 392 944 80 728 16% -6%
A Prazo 7 526 661 55 623 7 852 001 47 329 4% -15%
Outros Depósitos 79 218 585 120 240 725 52% 24%
2. Captações para Liquidez 13 323 453 98 463 18 259 468 110 061 37% 12%
3. Obrigações no Sistema de Pagamentos 365 215 2 699 399 458 2 408 9% -11%
4. Operações Cambiais - - - - 0% 0%
5.Outras Obrigações 433 984 3 207 2 565 965 15 467 491% 382%
6.Provisões para Responsabilidades Prováveis 31 250 231 15 867 96 -49% -59%
7. Capital Social 4 345 752 32 116 4 345 752 26 195 0% -18%
8. Reservas e Fundos 1 219 970 9 016 1 219 970 7 354 0% -18%
9. Resultados Potenciais - - - - 0% 0%
10. Resultados Transitados - - -90 373 -545 0% 0%
11. Resultado Operacional 381 345 2 818 -1 751 532 -10 558 -559% -475%
12. Resultado Não Operacional -67 438 -498 27 863 168 -141% -134%
13. Encargos s/Resultado Corrente -94 172 -696 - - -100% -100%
Total do Passivo 39 104 708 288 990 46 357 623 279 426 19% -3%
VALORES EM MILHARES
BANC — Relatório e Contas, 2016 061
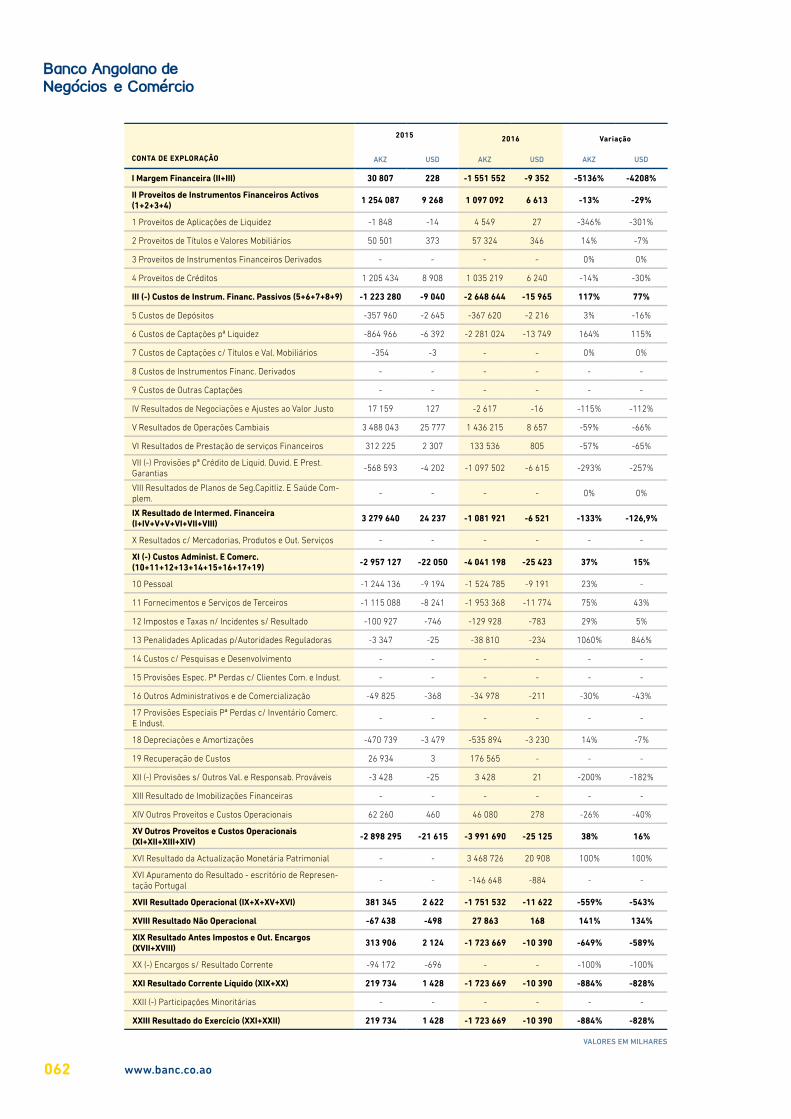
CONTA DE EXPLORAÇÃO
2015 2016 Variação
AKZ USD AKZ USD AKZ USD
I Margem Financeira (II+III) 30 807 228 -1 551 552 -9 352 -5136% -4208%
II Proveitos de Instrumentos Financeiros Activos (1+2+3+4) 1 254 087 9 268 1 097 092 6 613 -13% -29%
1 Proveitos de Aplicações de Liquidez -1 848 -14 4 549 27 -346% -301%
2 Proveitos de Títulos e Valores Mobiliários 50 501 373 57 324 346 14% -7%
3 Proveitos de Instrumentos Financeiros Derivados - - - - 0% 0%
4 Proveitos de Créditos 1 205 434 8 908 1 035 219 6 240 -14% -30%
III (-) Custos de Instrum. Financ. Passivos (5+6+7+8+9) -1 223 280 -9 040 -2 648 644 -15 965 117% 77%
5 Custos de Depósitos -357 960 -2 645 -367 620 -2 216 3% -16%
6 Custos de Captações pª Liquidez -864 966 -6 392 -2 281 024 -13 749 164% 115%
7 Custos de Captações c/ Títulos e Val. Mobiliários -354 -3 - - 0% 0%
8 Custos de Instrumentos Financ. Derivados - - - - - -
9 Custos de Outras Captações - - - - - -
IV Resultados de Negociações e Ajustes ao Valor Justo 17 159 127 -2 617 -16 -115% -112%
V Resultados de Operações Cambiais 3 488 043 25 777 1 436 215 8 657 -59% -66%
VI Resultados de Prestação de serviços Financeiros 312 225 2 307 133 536 805 -57% -65%
VII (-) Provisões pª Crédito de Liquid. Duvid. E Prest. Garantias
-568 593 -4 202 -1 097 502 -6 615 -293% -257%
VIII Resultados de Planos de Seg.Capitliz. E Saúde Com-plem.
- - - - 0% 0%
IX Resultado de Intermed. Financeira (I+IV+V+V+VI+VII+VIII) 3 279 640 24 237 -1 081 921 -6 521 -133% -126,9%
X Resultados c/ Mercadorias, Produtos e Out. Serviços - - - - - -
XI (-) Custos Administ. E Comerc. (10+11+12+13+14+15+16+17+19) -2 957 127 -22 050 -4 041 198 -25 423 37% 15%
10 Pessoal -1 244 136 -9 194 -1 524 785 -9 191 23% -
11 Fornecimentos e Serviços de Terceiros -1 115 088 -8 241 -1 953 368 -11 774 75% 43%
12 Impostos e Taxas n/ Incidentes s/ Resultado -100 927 -746 -129 928 -783 29% 5%
13 Penalidades Aplicadas p/Autoridades Reguladoras -3 347 -25 -38 810 -234 1060% 846%
14 Custos c/ Pesquisas e Desenvolvimento - - - - - -
15 Provisões Espec. Pª Perdas c/ Clientes Com. e Indust. - - - - - -
16 Outros Administrativos e de Comercialização -49 825 -368 -34 978 -211 -30% -43%
17 Provisões Especiais Pª Perdas c/ Inventário Comerc. E lndust.
- - - - - -
18 Depreciações e Amortizações -470 739 -3 479 -535 894 -3 230 14% -7%
19 Recuperação de Custos 26 934 3 176 565 - - -
XII (-) Provisões s/ Outros Val. e Responsab. Prováveis -3 428 -25 3 428 21 -200% -182%
XIII Resultado de Imobilizações Financeiras - - - - - -
XIV Outros Proveitos e Custos Operacionais 62 260 460 46 080 278 -26% -40%
XV Outros Proveitos e Custos Operacionais (XI+XII+XIII+XIV) -2 898 295 -21 615 -3 991 690 -25 125 38% 16%
XVI Resultado da Actualização Monetária Patrimonial - - 3 468 726 20 908 100% 100%
XVI Apuramento do Resultado - escritório de Represen-tação Portugal
- - -146 648 -884 - -
XVII Resultado Operacional (IX+X+XV+XVI) 381 345 2 622 -1 751 532 -11 622 -559% -543%
XVIII Resultado Não Operacional -67 438 -498 27 863 168 141% 134%
XIX Resultado Antes Impostos e Out. Encargos (XVII+XVIII) 313 906 2 124 -1 723 669 -10 390 -649% -589%
XX (-) Encargos s/ Resultado Corrente -94 172 -696 - - -100% -100%
XXI Resultado Corrente Líquido (XIX+XX) 219 734 1 428 -1 723 669 -10 390 -884% -828%
XXII (-) Participações Minoritárias - - - - - -
XXIII Resultado do Exercício (XXI+XXII) 219 734 1 428 -1 723 669 -10 390 -884% -828%
VALORES EM MILHARES
www.banc.co.ao062

14.RELATÓRIO DOS
AUDITORES EXTERNOS
063BANC — Relatório e Contas, 2016
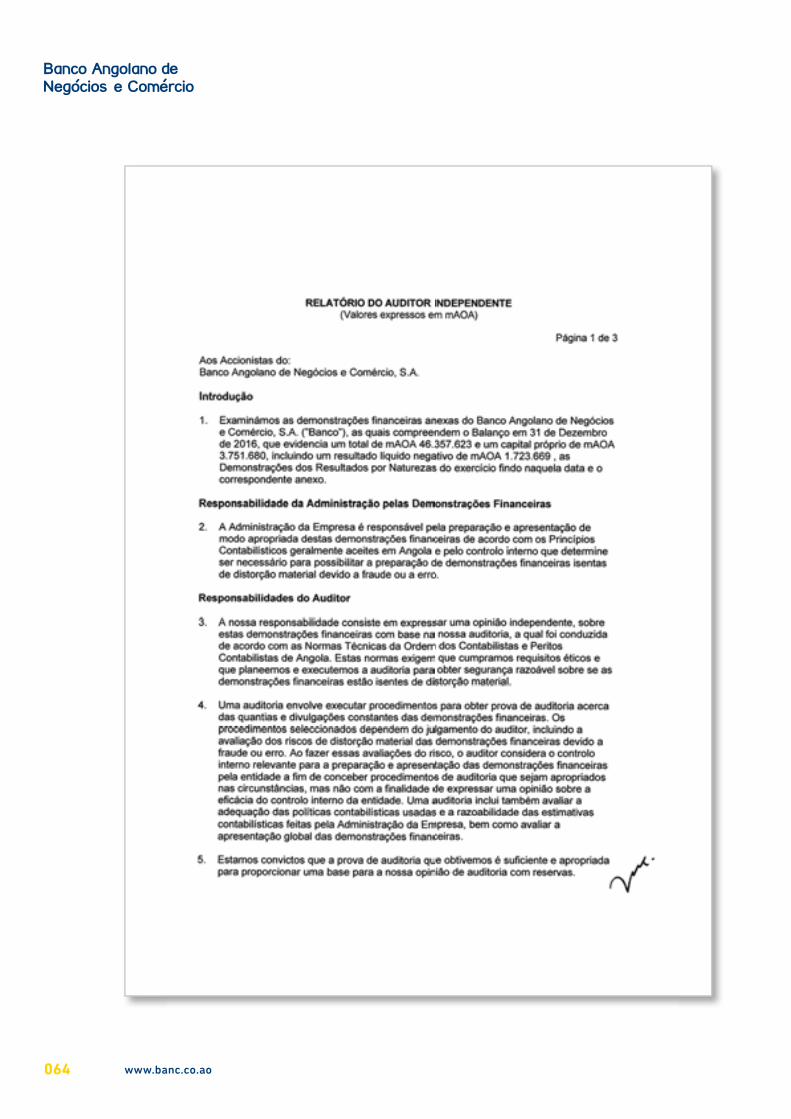
www.banc.co.ao064
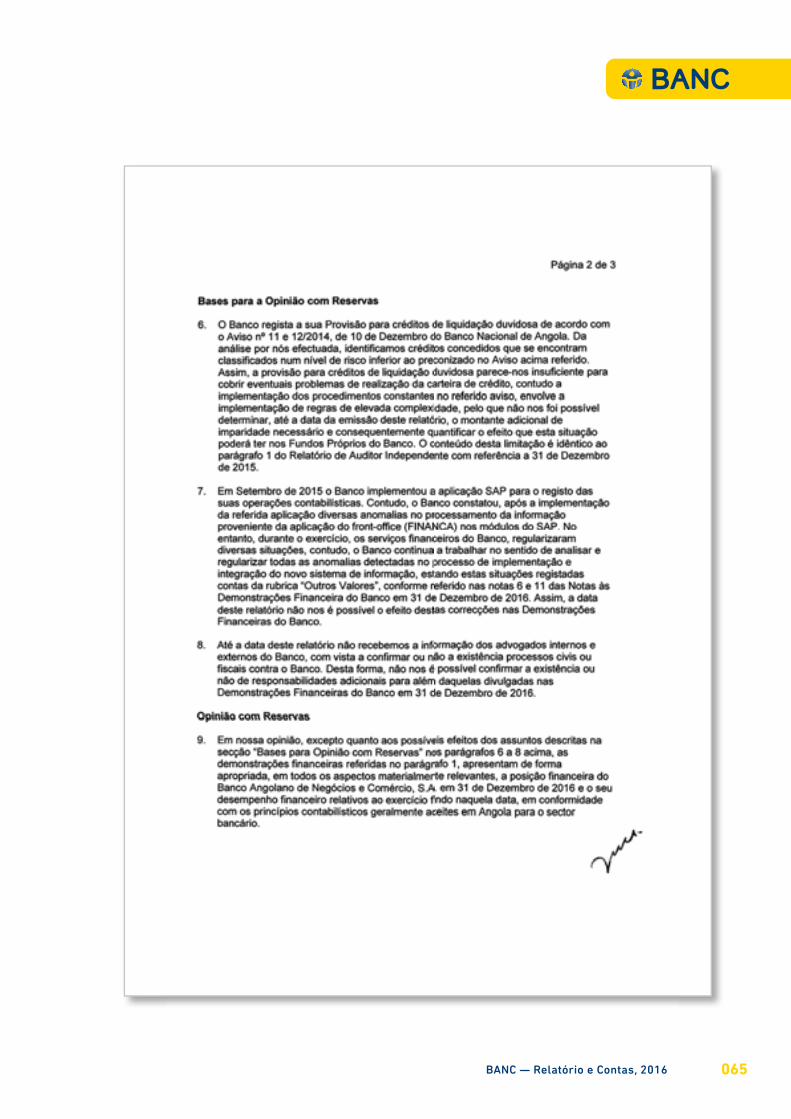
BANC — Relatório e Contas, 2016 065
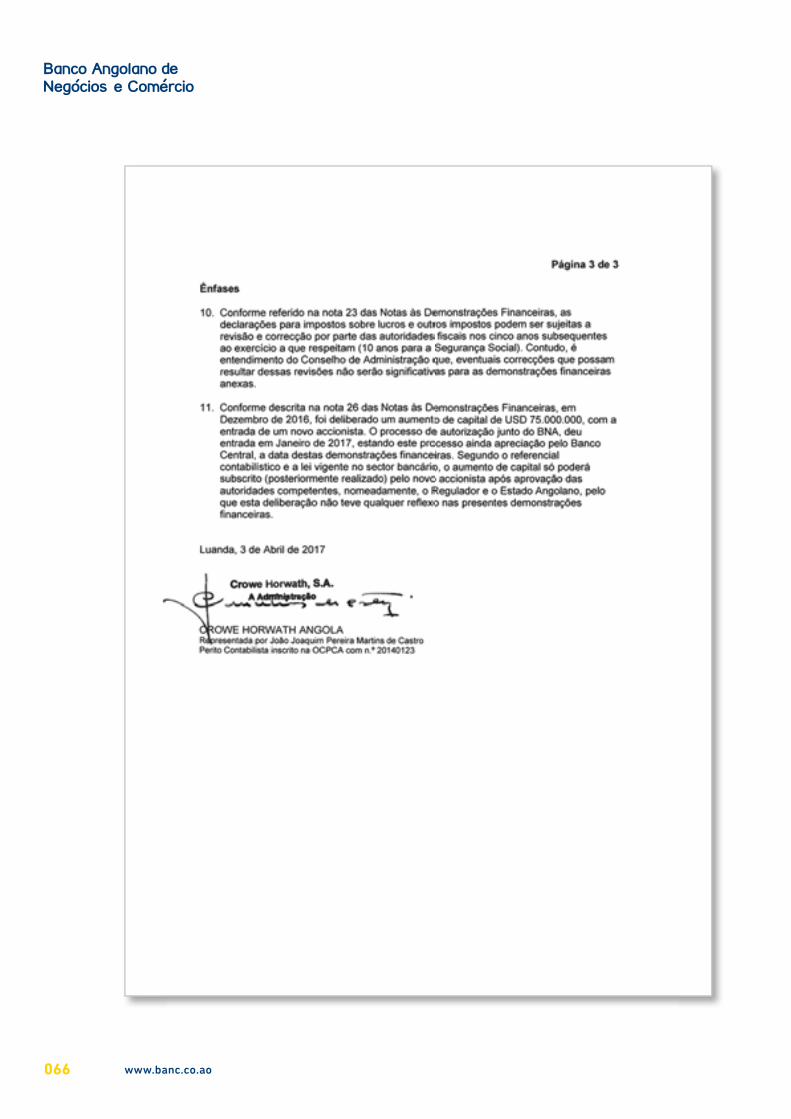
www.banc.co.ao066

15.RELATÓRIO
DO CONSELHO FISCAL
067BANC — Relatório e Contas, 2016

www.banc.co.ao068

BANC — Relatório e Contas, 2016 069

www.banc.co.ao070
16.NOTAS ÀS
CONTAS
071BANC — Relatório e Contas, 2016
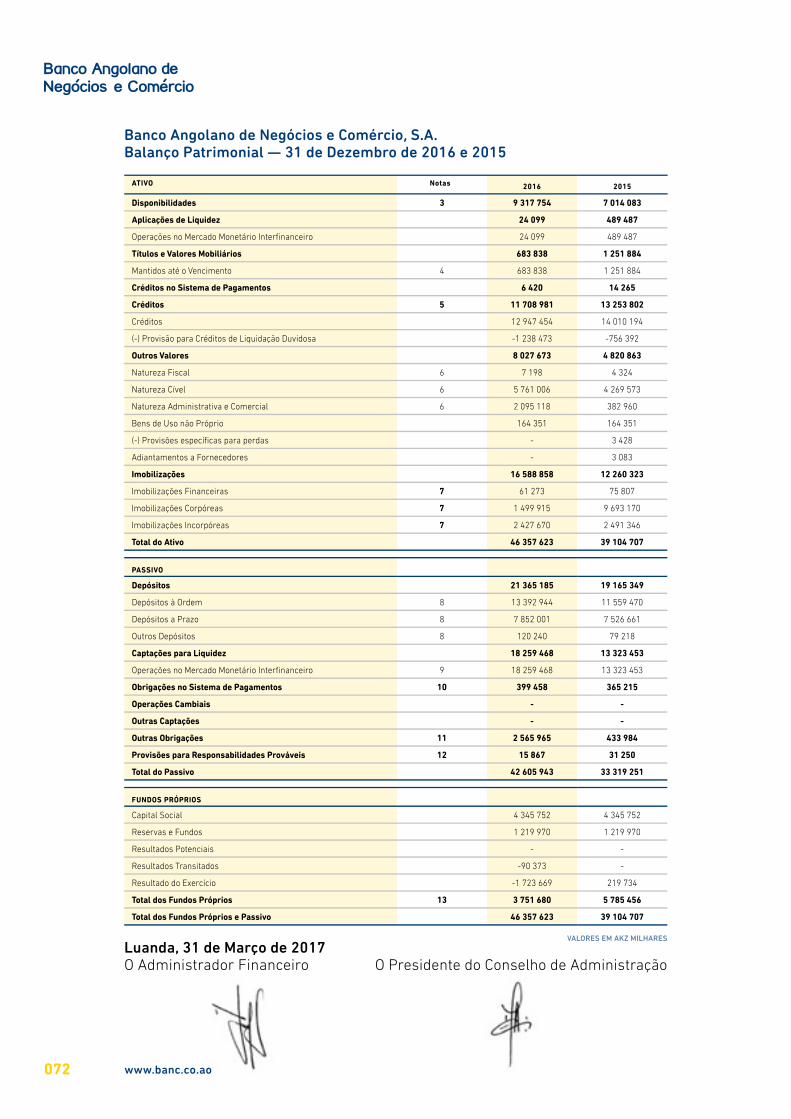
Banco Angolano de Negócios e Comércio, S.A.Balanço Patrimonial — 31 de Dezembro de 2016 e 2015
Luanda, 31 de Março de 2017O Administrador Financeiro O Presidente do Conselho de Administração
ATIVO Notas 2016 2015
Disponibilidades 3 9 317 754 7 014 083
Aplicações de Liquidez 24 099 489 487
Operações no Mercado Monetário Interfinanceiro 24 099 489 487
Títulos e Valores Mobiliários 683 838 1 251 884
Mantidos até o Vencimento 4 683 838 1 251 884
Créditos no Sistema de Pagamentos 6 420 14 265
Créditos 5 11 708 981 13 253 802
Créditos 12 947 454 14 010 194
(-) Provisão para Créditos de Liquidação Duvidosa -1 238 473 -756 392
Outros Valores 8 027 673 4 820 863
Natureza Fiscal 6 7 198 4 324
Natureza Cível 6 5 761 006 4 269 573
Natureza Administrativa e Comercial 6 2 095 118 382 960
Bens de Uso não Próprio 164 351 164 351
(-) Provisões específicas para perdas - 3 428
Adiantamentos a Fornecedores - 3 083
Imobilizações 16 588 858 12 260 323
Imobilizações Financeiras 7 61 273 75 807
Imobilizações Corpóreas 7 1 499 915 9 693 170
Imobilizações Incorpóreas 7 2 427 670 2 491 346
Total do Ativo 46 357 623 39 104 707
PASSIVO
Depósitos 21 365 185 19 165 349
Depósitos à Ordem 8 13 392 944 11 559 470
Depósitos a Prazo 8 7 852 001 7 526 661
Outros Depósitos 8 120 240 79 218
Captações para Liquidez 18 259 468 13 323 453
Operações no Mercado Monetário Interfinanceiro 9 18 259 468 13 323 453
Obrigações no Sistema de Pagamentos 10 399 458 365 215
Operações Cambiais - -
Outras Captações - -
Outras Obrigações 11 2 565 965 433 984
Provisões para Responsabilidades Prováveis 12 15 867 31 250
Total do Passivo 42 605 943 33 319 251
FUNDOS PRÓPRIOS
Capital Social 4 345 752 4 345 752
Reservas e Fundos 1 219 970 1 219 970
Resultados Potenciais - -
Resultados Transitados -90 373 -
Resultado do Exercício -1 723 669 219 734
Total dos Fundos Próprios 13 3 751 680 5 785 456
Total dos Fundos Próprios e Passivo 46 357 623 39 104 707
VALORES EM AKZ MILHARES
www.banc.co.ao072
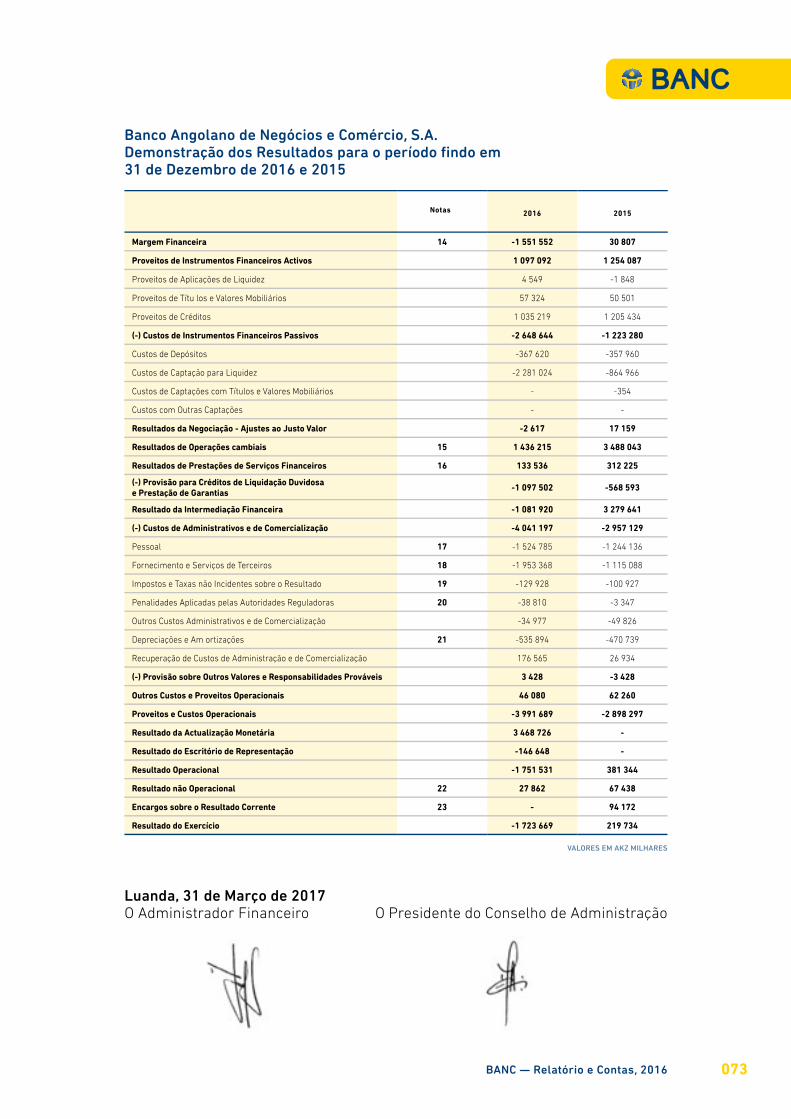
Banco Angolano de Negócios e Comércio, S.A.Demonstração dos Resultados para o período findo em 31 de Dezembro de 2016 e 2015
Notas 2016 2015
Margem Financeira 14 -1 551 552 30 807
Proveitos de Instrumentos Financeiros Activos 1 097 092 1 254 087
Proveitos de Aplicações de Liquidez 4 549 -1 848
Proveitos de Títu los e Valores Mobiliários 57 324 50 501
Proveitos de Créditos 1 035 219 1 205 434
(-) Custos de Instrumentos Financeiros Passivos -2 648 644 -1 223 280
Custos de Depósitos -367 620 -357 960
Custos de Captação para Liquidez -2 281 024 -864 966
Custos de Captações com Títulos e Valores Mobiliários - -354
Custos com Outras Captações - -
Resultados da Negociação - Ajustes ao Justo Valor -2 617 17 159
Resultados de Operações cambiais 15 1 436 215 3 488 043
Resultados de Prestações de Serviços Financeiros 16 133 536 312 225
(-) Provisão para Créditos de Liquidação Duvidosa e Prestação de Garantias -1 097 502 -568 593
Resultado da Intermediação Financeira -1 081 920 3 279 641
(-) Custos de Administrativos e de Comercialização -4 041 197 -2 957 129
Pessoal 17 -1 524 785 -1 244 136
Fornecimento e Serviços de Terceiros 18 -1 953 368 -1 115 088
Impostos e Taxas não Incidentes sobre o Resultado 19 -129 928 -100 927
Penalidades Aplicadas pelas Autoridades Reguladoras 20 -38 810 -3 347
Outros Custos Administrativos e de Comercialização -34 977 -49 826
Depreciações e Am ortizações 21 -535 894 -470 739
Recuperação de Custos de Administração e de Comercialização 176 565 26 934
(-) Provisão sobre Outros Valores e Responsabilidades Prováveis 3 428 -3 428
Outros Custos e Proveitos Operacionais 46 080 62 260
Proveitos e Custos Operacionais -3 991 689 -2 898 297
Resultado da Actualização Monetária 3 468 726 -
Resultado do Escritório de Representação -146 648 -
Resultado Operacional -1 751 531 381 344
Resultado não Operacional 22 27 862 67 438
Encargos sobre o Resultado Corrente 23 - 94 172
Resultado do Exercício -1 723 669 219 734
Luanda, 31 de Março de 2017O Administrador Financeiro O Presidente do Conselho de Administração
VALORES EM AKZ MILHARES
BANC — Relatório e Contas, 2016 073
1. ACTIVIDADE O Banco Angolano de Negócios e Comércio, S.A. (Adiante designado por “BANC” ou “BANCO”, foi constituído em 10 de Abril de 2006, pela Lis n.º 13/05 de 30 de Setembro, tendo iniciado a sua actividade em 1 de Abril de 2007.
O Banco dedica-se à obtenção de recursos de terceiros sob a forma de depósitos ou outros, os quais se aplicam, juntamente com os seus fundos próprios, na concessão de empréstimos, depósitos no Banco Nacional de Angola, aplicações em instituições de crédito, aquisição de títulos e em outros activos, para os quais se encontra devidamente autorizado. O Banco presta ainda outros serviços bancários e realiza diversos tipos de operações em moeda estrangeira, dispondo para o efeito de uma rede de 20 balcões (20 balcões em 2015).
No que se refere à estrutura accionista, conforme detalhado na nota 15, o Banco é detido por vários accionistas.
2. PRINCIPAIS POLÍTICAS CONTABILÍSTICAS2.1 BASES DE APRESENTAÇÃOAs demonstrações financeiras anexas foram preparadas no pressuposto da continuidade das operações, com base nos livros e registos mantidos pelo Banco, de acordo com os princípios contabilísticos consagrados no Plano Contabilístico das Instituições Financeiras (CONTIF), nos termos do Instrutivo n.º 9/2007, de 19 de Setembro, emitido pelo Banco Nacional de Angola (adiante igualmente designado por “BNA”), o qual passou a vigorar a partir de 1 de Janeiro de 2010 e actualizações subsequentes, nomeadamente a Directiva n.º 04/DSI/2011, que estabelece a obrigatoriedade de adopção das Normas Internacionais de Relato Financeiro (IFRS – International Financial Reporting Standards) em todas as matérias relacionadas com procedimentos e critérios contabilísticos que não se encontrem estabelecidos no CONTIF. Estes princípios poderão diferir dos geralmente aceites em outros países.
O CONTIF tem como objectivo a uniformização dos registos contabilísticos e das divulgações financeiras numa aproximação às práticas internacionais, através da convergência dos princípios contabilísticos às Normas Internacionais de Relato Financeiro (IFRS – International Financial Reporting Standards).
As demonstrações financeiras agora apresentadas reflectem os resultados das operações do Banco para os exercícios findos em 31 de Dezembro de 2016 e 2015 e foram preparadas de acordo com os pressupostos da continuidade e do princípio da especialização no qual os items são reconhecidos como activos, passivos, fundos próprios, proveitos e custos quando satisfaçam as definições e os critérios de reconhecimento para esses elementos contidos na estrutura conceptual, em conformidade com as características qualitativas da compreensibilidade, relevância, materialidade, fiabilidade, representação fidedigna, substância sobre a forma, neutralidade, prudência, plenitude e comparabilidade.
As demonstrações financeiras do BANC relativas ao exercício findo em 31 de Dezembro de 2016 foram aprovadas pelo Conselho de Administração em 31 de Março de 2017.
Banco Angolano de Negócios e Comércio, S.A.Notas às Demonstrações Financeiras31 de Dezembro de 2016 e 2015
www.banc.co.ao074

As políticas contabilísticas apresentadas nesta nota foram aplicadas de forma consistente em todos os períodos das demonstrações financeiras agora apresentadas.
As demonstrações financeiras do Banco em 31 de Dezembro de 2016 e 2015 encontram-se expressas em milhares de Kwanzas, conforme Aviso n.º 15/2007, Art.º 5º do BNA, tendo os activos e passivos denominados em moeda estrangeira sido convertidos com base no câmbio indicativo publicado pelo BNA naquelas datas.
Em 31 de Dezembro 2016 e 2015, o câmbio indicativo do Kwanza (AKZ), publicado pelo BNA, face ao Dólar dos Estados Unidos (USD) e ao Euro (EUR) era o seguinte:
31.12.2016 31.12. 2015
1 USD = 165,9026 135,3150
1 EUR = 185,3785 147,8315
2.2 POLÍTICAS CONTABILÍSTICASAs principais políticas contabilísticas utilizadas na preparação das demonstrações financeiras foram as seguintes:
a) Especialização de exercícios
Os proveitos e custos são reconhecidos em função do período de vigência das operações, de acordo com o princípio contabilístico da especialização de exercícios, sendo registados à medida que são gerados, independentemente do momento do seu recebimento ou pagamento.
Os proveitos são considerados realizados quando:
i. Nas transacções com terceiros, o pagamento for efectuado ou assumido firme compromisso de efectivá-lo;
ii. Na extinção, parcial ou total, de um passivo, qualquer que seja o motivo, sem o desaparecimento simultâneo de um activo de valor igual ou maior;
iii. Na geração natural de novos activos, independentemente da intervenção de terceiros;
iv. No recebimento efectivo de doações e subvenções.
Os custos, por sua vez, são considerados incorridos quando:
i. Deixar de existir o correspondente valor activo, por transferência da sua propriedade para um terceiro;
ii. Pela diminuição ou extinção do valor económico de um activo;
iii. Pelo surgimento de um passivo, sem o correspondente activo.
BANC — Relatório e Contas, 2016 075
Os dividendos são reconhecidos quando recebidos.
b) Transacções em moeda estrangeira
As operações em moeda estrangeira são registadas de acordo com os princípios do sistema multi-currency, sendo cada operação registada em função das respectivas moedas de denominação. As transacções em moeda estrangeira são convertidas para Kwanzas à taxa de câmbio indicativa publicada pelo BNA na data da transacção. Os activos e passivos monetários expressos em moeda estrangeira são convertidos para Kwanzas à taxa de câmbio indicativa publicada pelo BNA à data do balanço. Os custos e proveitos relativos a diferenças cambiais, realizadas ou potenciais, são registados na demonstração de resultados do exercício em que ocorrem.
Os activos e passivos não monetários, imobilizações financeiras, são registados ao custo histórico.
Os activos e passivos não monetários expressos em moeda estrangeira, registados ao custo histórico, excepto imobilizações financeiras, são convertidos para Kwanzas à taxa de câmbio indicativa publicada pelo BNA na data da transacção.
Na data da sua contratação, as compras e vendas de moeda estrangeira à vista e a prazo são imediatamente registadas na posição cambial. Sempre que estas operações conduzam a variações dos saldos líquidos das diferentes moedas, há lugar à movimentação das contas de posição cambial, à vista ou a prazo, cujo conteúdo e critério de reavaliação são como segue:
Posição cambial à vistaA posição cambial à vista em cada moeda é dada pelo saldo líquido dos activos e passivos dessa moeda, assim como das operações à vista a aguardar liquidação e das operações a prazo com vencimento nos dois dias úteis subsequentes. A posição cambial à vista é reavaliada diariamente com base na taxa de câmbio indicativa publicada pelo BNA nessa data, dando origem à movimentação da conta de posição cambial (moeda nacional), por contrapartida de resultados.
Posição cambial a prazoA posição cambial a prazo em cada moeda corresponde ao saldo líquido das operações a prazo a aguardar liquidação, com exclusão das que se vençam dentro dos dois dias úteis subsequentes. Todos os contratos relativos a estas operações (forwards de moeda) são reavaliados às taxas de câmbio a prazo do mercado ou, na ausência destas, através do seu cálculo com base nas taxas de juro aplicáveis ao prazo residual de cada operação. A diferença entre os contravalores em Kwanzas às taxas de reavaliação a prazo aplicadas, e os contravalores às taxas contratadas, que representam o custo ou proveito ou o custo de reavaliação da posição cambial a prazo, é registada nas rubricas de “Operações cambiais” do activo ou do passivo, por contrapartida de resultados.
www.banc.co.ao076
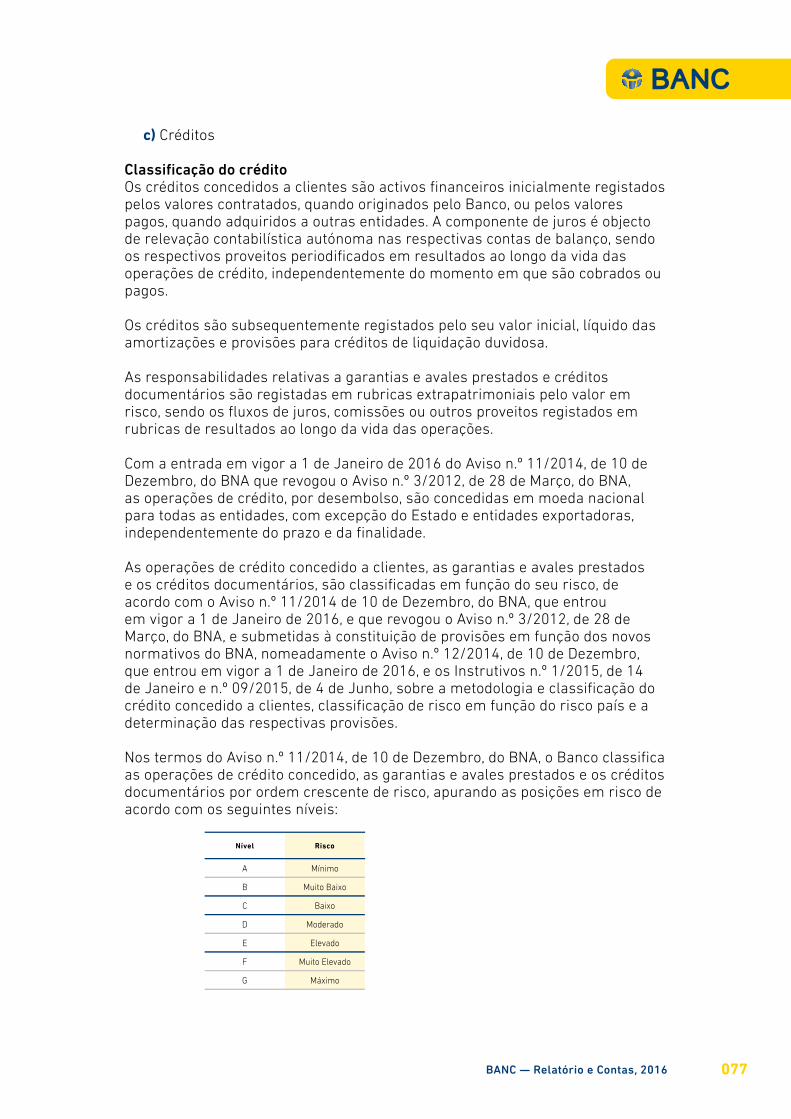
c) Créditos
Classificação do créditoOs créditos concedidos a clientes são activos financeiros inicialmente registados pelos valores contratados, quando originados pelo Banco, ou pelos valores pagos, quando adquiridos a outras entidades. A componente de juros é objecto de relevação contabilística autónoma nas respectivas contas de balanço, sendo os respectivos proveitos periodificados em resultados ao longo da vida das operações de crédito, independentemente do momento em que são cobrados ou pagos.
Os créditos são subsequentemente registados pelo seu valor inicial, líquido das amortizações e provisões para créditos de liquidação duvidosa.
As responsabilidades relativas a garantias e avales prestados e créditos documentários são registadas em rubricas extrapatrimoniais pelo valor em risco, sendo os fluxos de juros, comissões ou outros proveitos registados em rubricas de resultados ao longo da vida das operações.
Com a entrada em vigor a 1 de Janeiro de 2016 do Aviso n.º 11/2014, de 10 de Dezembro, do BNA que revogou o Aviso n.º 3/2012, de 28 de Março, do BNA, as operações de crédito, por desembolso, são concedidas em moeda nacional para todas as entidades, com excepção do Estado e entidades exportadoras, independentemente do prazo e da finalidade.
As operações de crédito concedido a clientes, as garantias e avales prestados e os créditos documentários, são classificadas em função do seu risco, de acordo com o Aviso n.º 11/2014 de 10 de Dezembro, do BNA, que entrou em vigor a 1 de Janeiro de 2016, e que revogou o Aviso n.º 3/2012, de 28 de Março, do BNA, e submetidas à constituição de provisões em função dos novos normativos do BNA, nomeadamente o Aviso n.º 12/2014, de 10 de Dezembro, que entrou em vigor a 1 de Janeiro de 2016, e os Instrutivos n.º 1/2015, de 14 de Janeiro e n.º 09/2015, de 4 de Junho, sobre a metodologia e classificação do crédito concedido a clientes, classificação de risco em função do risco país e a determinação das respectivas provisões.
Nos termos do Aviso n.º 11/2014, de 10 de Dezembro, do BNA, o Banco classifica as operações de crédito concedido, as garantias e avales prestados e os créditos documentários por ordem crescente de risco, apurando as posições em risco de acordo com os seguintes níveis:
Nível Risco
A Mínimo
B Muito Baixo
C Baixo
D Moderado
E Elevado
F Muito Elevado
G Máximo
BANC — Relatório e Contas, 2016 077
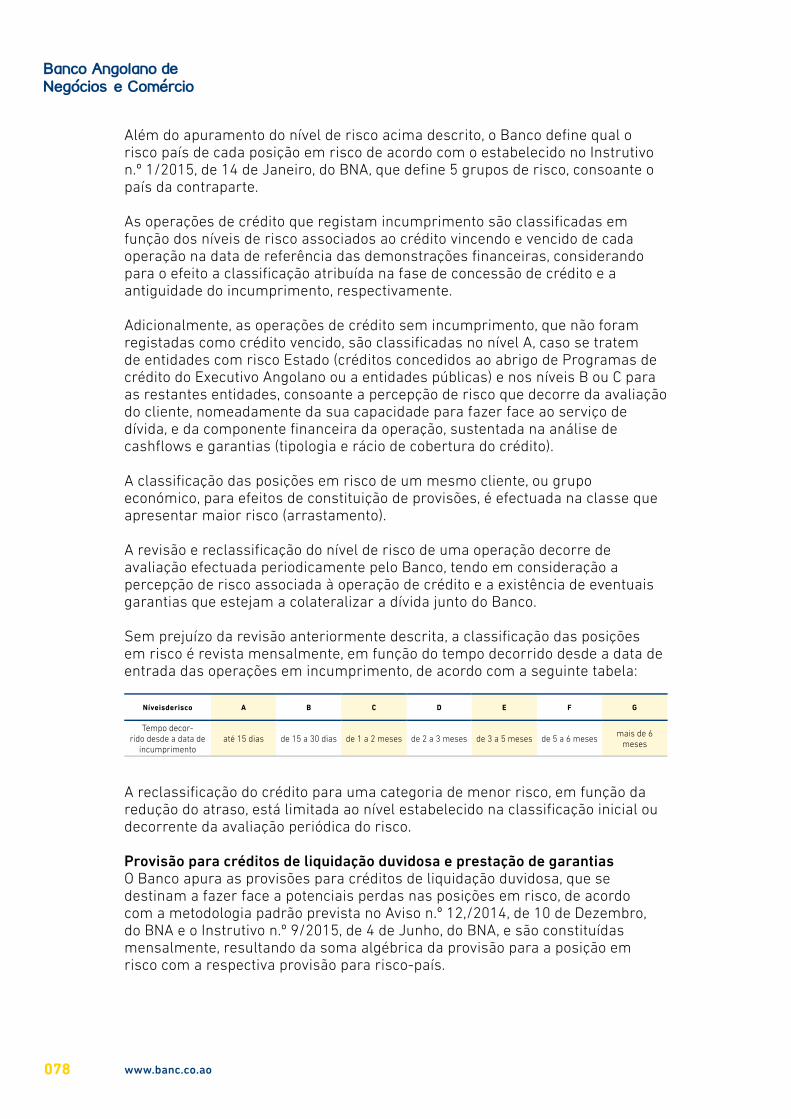
Além do apuramento do nível de risco acima descrito, o Banco define qual o risco país de cada posição em risco de acordo com o estabelecido no Instrutivo n.º 1/2015, de 14 de Janeiro, do BNA, que define 5 grupos de risco, consoante o país da contraparte.
As operações de crédito que registam incumprimento são classificadas em função dos níveis de risco associados ao crédito vincendo e vencido de cada operação na data de referência das demonstrações financeiras, considerando para o efeito a classificação atribuída na fase de concessão de crédito e a antiguidade do incumprimento, respectivamente.
Adicionalmente, as operações de crédito sem incumprimento, que não foram registadas como crédito vencido, são classificadas no nível A, caso se tratem de entidades com risco Estado (créditos concedidos ao abrigo de Programas de crédito do Executivo Angolano ou a entidades públicas) e nos níveis B ou C para as restantes entidades, consoante a percepção de risco que decorre da avaliação do cliente, nomeadamente da sua capacidade para fazer face ao serviço de dívida, e da componente financeira da operação, sustentada na análise de cashflows e garantias (tipologia e rácio de cobertura do crédito).
A classificação das posições em risco de um mesmo cliente, ou grupo económico, para efeitos de constituição de provisões, é efectuada na classe que apresentar maior risco (arrastamento).
A revisão e reclassificação do nível de risco de uma operação decorre de avaliação efectuada periodicamente pelo Banco, tendo em consideração a percepção de risco associada à operação de crédito e a existência de eventuais garantias que estejam a colateralizar a dívida junto do Banco.
Sem prejuízo da revisão anteriormente descrita, a classificação das posições em risco é revista mensalmente, em função do tempo decorrido desde a data de entrada das operações em incumprimento, de acordo com a seguinte tabela:
Níveisderisco A B C D E F G
Tempo decor-rido desde a data de
incumprimentoaté 15 dias de 15 a 30 dias de 1 a 2 meses de 2 a 3 meses de 3 a 5 meses de 5 a 6 meses
mais de 6 meses
A reclassificação do crédito para uma categoria de menor risco, em função da redução do atraso, está limitada ao nível estabelecido na classificação inicial ou decorrente da avaliação periódica do risco.
Provisão para créditos de liquidação duvidosa e prestação de garantiasO Banco apura as provisões para créditos de liquidação duvidosa, que se destinam a fazer face a potenciais perdas nas posições em risco, de acordo com a metodologia padrão prevista no Aviso n.º 12,/2014, de 10 de Dezembro, do BNA e o Instrutivo n.º 9/2015, de 4 de Junho, do BNA, e são constituídas mensalmente, resultando da soma algébrica da provisão para a posição em risco com a respectiva provisão para risco-país.
www.banc.co.ao078
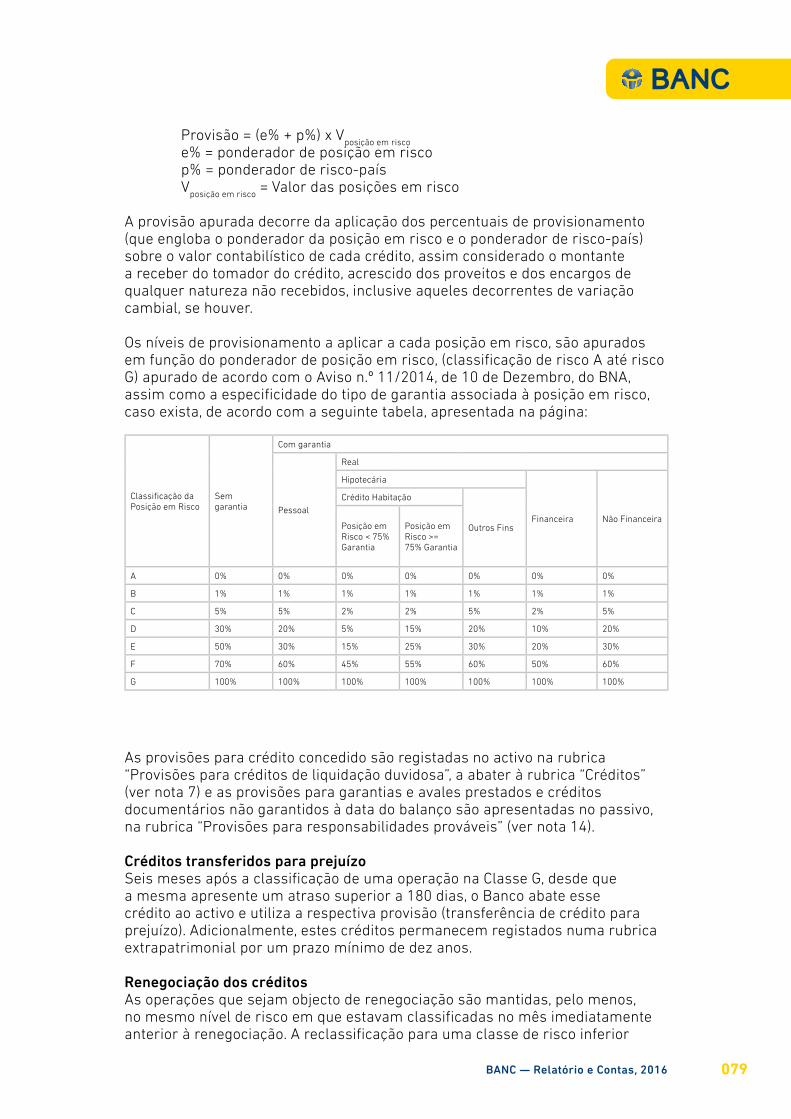
Provisão = (e% + p%) x Vposição em risco
e% = ponderador de posição em riscop% = ponderador de risco-paísV
posição em risco = Valor das posições em risco
A provisão apurada decorre da aplicação dos percentuais de provisionamento (que engloba o ponderador da posição em risco e o ponderador de risco-país) sobre o valor contabilístico de cada crédito, assim considerado o montante a receber do tomador do crédito, acrescido dos proveitos e dos encargos de qualquer natureza não recebidos, inclusive aqueles decorrentes de variação cambial, se houver.
Os níveis de provisionamento a aplicar a cada posição em risco, são apurados em função do ponderador de posição em risco, (classificação de risco A até risco G) apurado de acordo com o Aviso n.º 11/2014, de 10 de Dezembro, do BNA, assim como a especificidade do tipo de garantia associada à posição em risco, caso exista, de acordo com a seguinte tabela, apresentada na página:
Classificação da Posição em Risco
Sem garantia
Com garantia
Pessoal
Real
Hipotecária
Financeira Não Financeira
Crédito Habitação
Outros FinsPosição em Risco < 75% Garantia
Posição em Risco >= 75% Garantia
A 0% 0% 0% 0% 0% 0% 0%
B 1% 1% 1% 1% 1% 1% 1%
C 5% 5% 2% 2% 5% 2% 5%
D 30% 20% 5% 15% 20% 10% 20%
E 50% 30% 15% 25% 30% 20% 30%
F 70% 60% 45% 55% 60% 50% 60%
G 100% 100% 100% 100% 100% 100% 100%
As provisões para crédito concedido são registadas no activo na rubrica “Provisões para créditos de liquidação duvidosa”, a abater à rubrica “Créditos” (ver nota 7) e as provisões para garantias e avales prestados e créditos documentários não garantidos à data do balanço são apresentadas no passivo, na rubrica “Provisões para responsabilidades prováveis” (ver nota 14).
Créditos transferidos para prejuízoSeis meses após a classificação de uma operação na Classe G, desde que a mesma apresente um atraso superior a 180 dias, o Banco abate esse crédito ao activo e utiliza a respectiva provisão (transferência de crédito para prejuízo). Adicionalmente, estes créditos permanecem registados numa rubrica extrapatrimonial por um prazo mínimo de dez anos.
Renegociação dos créditosAs operações que sejam objecto de renegociação são mantidas, pelo menos, no mesmo nível de risco em que estavam classificadas no mês imediatamente anterior à renegociação. A reclassificação para uma classe de risco inferior
BANC — Relatório e Contas, 2016 079

ocorre apenas se houver uma amortização regular e significativa das responsabilidades. Os ganhos ou proveitos resultantes da renegociação só são registados aquando do seu efectivo recebimento.
Recuperação dos créditosNas situações em que são efectuadas recuperações de créditos anteriormente abatidos ao activo por utilização de provisões, os montantes recebidos são registados como outros proveitos operacionais do exercício.
Apropriação de proveitosO Banco procede à anulação de juros vencidos há mais de 90 dias bem como não reconhece juros a partir dessa data, para as operações de crédito em incumprimento, até ao momento em que o cliente regularize a situação.
d) Títulos e valores mobiliários
Classificação dos títulos e valores mobiliáriosOs títulos e valores mobiliários adquiridos pelo Banco, são registados pelo valor efectivamente pago, incluindo corretagens e emolumentos. O Conselho de Administração do Banco determina a classificação dos seus investimentos no reconhecimento inicial, numa das seguintes categorias, atendendo às características dos títulos e à sua intenção aquando da aquisição dos mesmos:
i. Títulos p/ negociação;
ii. Títulos disponíveis p/ venda;
iii. Títulos mantidos até ao vencimento.
Os rendimentos produzidos pelos títulos e valores mobiliários, relativos a juros corridos durante o prazo até o vencimento ou dividendos declarados, devem ser considerados directamente no resultado do período, independentemente da categoria em que tenham sido classificados, observado que os relativos às acções adquiridas há menos de seis meses devem ser reconhecidos em contrapartida à adequada conta que regista o correspondente custo de aquisição.
O Banco classifica, de igual modo, os títulos e valores mobiliários, em ordem crescente de riscos, nos seguintes níveis, sendo observados os mesmos critérios de provisionamento definidos pelo CONTIF para a carteira de crédito:
Nível Risco
A Mínimo
B Muito Baixo
C Baixo
D Moderado
E Elevado
F Muito Elevado
G Máximo
O Banco classifica os títulos de dívida do Estado Angolano e do BNA no Nível A.
www.banc.co.ao080
Títulos para negociaçãoSão considerados títulos para negociação os títulos adquiridos com o objectivo de serem activa e frequentemente negociados.
Os títulos mantidos para negociação são reconhecidos inicialmente ao custo de aquisição, incluindo custos directamente atribuíveis à aquisição do activo. Posteriormente, são valorizados ao justo valor, sendo o respectivo proveito ou custo proveniente da valorização reconhecido em resultados do exercício.
Títulos mantidos até ao vencimentoSão considerados títulos mantidos até ao vencimento, aqueles que são adquiridos com a finalidade de os manter em carteira até ao seu vencimento, desde que haja capacidade financeira do Banco para tal. Essa capacidade financeira é comprovada com base em projecção de fluxos de caixa, não considerando a possibilidade de venda dos títulos antes do vencimento.
As acções não resgatáveis não podem ser classificadas na categoria de títulos mantidos até ao vencimento.
Os títulos mantidos até ao vencimento são registados pelo seu custo de aquisição, acrescido dos rendimentos auferidos pela fluência dos seus prazos (incluindo periodificação do juro e do prémio/desconto por contrapartida de resultados), reconhecendo o Banco eventuais lucros ou prejuízos apurados na data do vencimento pela diferença entre o preço realizado e o respectivo valor contabilístico.
No caso de eventual venda dos títulos e valores mobiliários classificados na categoria títulos mantidos até ao vencimento antes do resgate, devem ser registados os eventuais lucros ou prejuízos apurados na data da venda pela diferença entre o preço de venda e o seu valor contabilístico.
O Banco não poderá classificar quaisquer títulos e valores mobiliários na categoria títulos mantidos até ao vencimento se, durante o exercício económico corrente ou em algum dos dois exercícios económicos anteriores, vendeu ou reclassificou parte substancial deles antes de seu vencimento, exceptuados os casos em que o valor de custo de aquisição dos títulos, acrescido dos rendimentos auferidos, não apresente diferença significativa em relação ao valor de mercado.
Os Títulos do Banco Central, os Bilhetes do Tesouro e as Obrigações do Tesouro são emitidos a valor descontado e registados pelo seu custo de aquisição. A diferença entre este e o valor nominal, que constitui a remuneração do Banco, é reconhecida contabilisticamente como proveito ao longo do período compreendido entre a data de compra e a data de vencimento dos títulos, na própria conta com a especificação “Proveitos a receber”.
As Obrigações do Tesouro emitidas em moeda nacional indexadas à taxa de câmbio do Dólar dos Estados Unidos estão sujeitas a actualização cambial. O resultado da actualização cambial do valor nominal do título, do desconto e do juro corrido, é reflectido na demonstração de resultados do exercício em que ocorre, na rubrica “Proveitos de títulos e valores mobiliários”.
Títulos disponíveis para vendaSão considerados títulos disponíveis para venda os títulos passíveis de serem eventualmente negociados e que não se enquadrem nas demais categorias.
BANC — Relatório e Contas, 2016 081
São registados, no momento inicial, ao custo de aquisição, sendo posteriormente valorizados ao justo valor. As variações do justo valor são registadas por contrapartida de fundos próprios, sendo as valias reconhecidas em resultados do exercício aquando da venda definitiva do activo.
Valor de mercadoO valor de mercado (justo valor) dos títulos é determinado de acordo com os seguintes critérios:
i. Preço médio de negociação no dia do apuramento ou, quando não disponível, o preço médio de negociação no dia útil anterior;
ii. Valor líquido provável de realização obtido mediante adopção de técnica ou modelo interno de valorização;
iii. Preço de instrumento financeiro semelhante, levando em consideração, no mínimo, os prazos de pagamento e vencimento, o risco de crédito e a moeda ou indexador; e
iv. Preço definido pelo BNA.
No caso de títulos com prazo de vencimento inferior a um ano, para os quais não existe cotação em mercado activo com transacções regulares, os mesmos são valorizados com base no custo de aquisição por se entender que reflecte a melhor aproximação ao seu valor de mercado.
Transferência de títulos entre categoriasAs transferências de uma categoria para outra somente poderão ocorrer por motivo isolado, não usual, não recorrente e que não pudesse ter sido razoavelmente antecipado, ocorrido após a data da classificação, devendo permanecer à disposição do BNA a documentação que servir de base para a reclassificação, devidamente acompanhada de exposição de motivos do Conselho de Administração do Banco.
A eventual transferência para categoria diversa deve levar em conta a intenção e a capacidade financeira do Banco e ser efectuada pelo valor de mercado do título ou valor mobiliário, observando-se ainda, os seguintes procedimentos:
1) Na transferência da categoria de “Títulos para negociação” para as demais categorias, não será admitido o estorno dos valores já registados no resultado decorrentes de ganhos ou perdas não realizados;
2) Na transferência da categoria “Títulos disponíveis para venda”, os ganhos e perdas não realizados, registados como componente destacado nos fundos próprios, devem ser reconhecidos no resultado do período:
i. Imediatamente, quando para a categoria “Títulos para a negociação”;
ii. Em função do prazo remanescente até ao vencimento, quando para a categoria “Títulos mantidos até ao vencimento”;
www.banc.co.ao082
3) Na transferência da categoria “Títulos mantidos até ao vencimento” para as demais categorias, os ganhos e perdas não realizados devem ser reconhecidos:
i. Imediatamente no resultado do período, quando para a categoria “Títulos para negociação”;
ii. Como componente destacado nos fundos próprios, quando para a categoria “Títulos disponíveis para a venda”.
ImparidadeAs perdas em títulos e valores mobiliários de carácter permanente devem ser reconhecidas imediatamente no resultado do exercício. O valor ajustado decorrente do reconhecimento das referidas perdas passa a constituir a nova base de valor para efeitos de apropriação de rendimentos. Não se admite a reversão destas perdas.
e) Imobilizações financeiras
Participações coligadas e equipadas São consideradas participações em coligadas ou equiparadas, as participações em sociedades, nas quais o Banco detém, directa ou indirectamente, uma percentagem igual ou superior a 10% do respectivo capital votante, sem controlá-la.
O Banco aplica o método da equivalência patrimonial para a valorização das suas participações em coligadas e equiparadas nas seguintes situações:
a) Quando as participações societárias estejam em relação de grupo; ou
b) Quando as participações societárias sejam relevantes e o Banco tenha influência na sua administração, ou quando a percentagem de participação, directa ou indirectamente, representar 20% (vinte por cento) ou mais do capital votante da participada.
Uma participação societária considera-se em relação de grupo quando seja exercido um domínio sobre a Sociedade, reflectido através de um controlo operacional, nos casos em que tenham administração ou gestão comum, ou por um controlo societário, quando o controlo é obtido através do somatório da percentagem detida directamente pelo Banco, pelos seus administradores, controladores e empresas ligadas.
Uma participação societária considera-se relevante quando:
a) O seu valor contabilístico for igual ou superior a 10% dos fundos próprios do Banco; ou
b) O valor contabilístico das várias participadas, considerado em conjunto, for igual ou superior a 15% dos fundos próprios do Banco.
BANC — Relatório e Contas, 2016 083
De acordo com o método da equivalência patrimonial, as imobilizações financeiras são registadas inicialmente pelo seu custo de aquisição e posteriormente ajustadas em função das alterações verificadas, após a aquisição, na quota-parte do Banco nos activos líquidos das correspondentes participadas. Os resultados do Banco incluem a parte que lhe corresponde nos resultados dessas participadas.
Adicionalmente, o Banco deve constituir uma provisão para perdas, quando existir passivo a descoberto, na participada, e houver intenção manifesta do Banco em manter o seu apoio financeiro à mesma.
Deve deixar de ser avaliado pelo método da equivalência patrimonial, a participação societária em sociedades coligadas e equiparadas com efectiva e clara evidência de perda de continuidade de suas operações ou no caso em que estas estejam a operar sob severas restrições a longo prazo que prejudiquem significativamente a sua capacidade de transferir recursos para a investidora.
Nas situações em que a valorização pelo método da equivalência patrimonial não é aplicável, as imobilizações financeiras encontram-se registadas ao custo de aquisição, deduzido de provisões para perdas.
Quando esta se encontra denominada em moeda estrangeira, é objecto de actualização cambial, sendo o resultado desta actualização cambial reflectido em rubrica específica nos fundos próprios.
Participações em outras sociedadesSão consideradas participações em outras sociedades, as participações em sociedades, nas quais o Banco detém, directa ou indirectamente, uma percentagem inferior a 10% do respectivo capital votante.
As participações em outras sociedades são avaliadas pelo custo de aquisição, deduzido da provisão para perdas.
Os rendimentos decorrentes desses investimentos, relativos a dividendos declarados, devem ser considerados directamente no resultado do exercício. As participações adquiridas com dividendos propostos e não pagos (ex-dividendo) devem ter esses dividendos reconhecidos como custo de aquisição em contrapartida à respectiva conta no resultado do exercício.
Quando esta se encontra denominada em moeda estrangeira, é objecto de actualização cambial, sendo o resultado desta actualização cambial reflectido em rubrica específica nos fundos próprios.
Outros investimentosEsta rubrica inclui direitos de qualquer natureza não classificáveis nas demais rubricas do activo, nem em imobilizações corpóreas ou incorpóreas, tais como, património artístico.
f) Imobilizações incorpóreas e corpóreas
Imobilizações incorpóreasAs imobilizações incorpóreas correspondem, essencialmente, a gastos com trespasses, organização e expansão, benfeitorias em imóveis de terceiros e
www.banc.co.ao084

software, sempre que o Banco consiga demonstrar que os mesmos venham a gerar benefícios económicos futuros. Estas despesas são registadas pelo seu custo de aquisição e amortizadas linearmente por duodécimos ao longo de um período de três anos, com excepção das benfeitorias realizadas em imóveis de terceiros, as quais são amortizadas conforme o prazo expectável de duração do contrato de arrendamento ou pela vida útil das mesmas, se inferior.
Imobilizações corpóreasAs imobilizações corpóreas encontram-se registadas ao custo de aquisição, sendo permitida a sua reavaliação ao abrigo das disposições legais aplicáveis.
Uma percentagem equivalente a 30% do aumento das amortizações que resulta das reavaliações efectuadas não é aceite como custo para efeitos fiscais.
A depreciação é calculada pelo método das quotas constantes às taxas máximas fiscalmente aceites como custo.
Com a publicação do Decreto Presidencial n.º 207/15, em 5 de Novembro de 2015, que veio definir o novo regime das reintegrações e amortizações dos bens do activo imobilizado, a depreciação dos bens adquiridos a partir de 01 de Janeiro de 2015 passou a ser calculada às taxas máximas definidas na tabela anexa ao referido Decreto, a que passaram a corresponder os seguintes anos de vida útil estimada:
Imóveis de uso próprio: Anos
Edifícios 25
Obras 5
Equipamento:
Mobiliário e material 6 a 8
Máquinas e ferramentas 3 a 8
Equipamento informático 3
Instalações interiores 5 a 10
Material de transporte 4
Equipamento de segurança 8
Outros equipamentos 3 a 5
As imobilizações em curso, que correspondem, essencialmente, a Edifícios e a balcões/centros de atendimento em construção e ao respectivo mobiliário e equipamento, encontram-se registadas pelo seu custo de aquisição e iniciarão a sua amortização quando os respectivos Edifícios e os balcões/centros de atendimento entrarem em funcionamento.
g) Bens não de uso próprio
Os bens não de uso próprio são classificados como detidos para venda quando existe a intenção de alienar os referidos activos e os activos ou grupos de activos estão disponíveis para venda imediata e a sua venda é muito provável.
O Banco classifica em bens de não uso próprio os bens detidos em resultado de recuperações de crédito, que se encontram mensurados inicialmente pelo
BANC — Relatório e Contas, 2016 085
menor entre o seu justo valor líquido de despesas e o valor contabilístico do crédito existente na data em que foi efectuada a dação.
Adicionalmente, são classificados em bens não de uso próprio os imóveis que não são parte integrante das instalações do BANC, nem se destinam à prossecução do seu objecto social.
O justo valor é baseado no valor de mercado, sendo este determinado com base no preço expectável de venda obtido através de avaliações periódicas efectuadas pelo Banco.
A mensuração subsequente destes activos é efectuada ao menor do seu valor contabilístico e o correspondente justo valor, líquido de despesas, não sendo sujeitos a amortização. Caso existam perdas não realizadas, estas são registadas como perdas de imparidade por contrapartida de resultados do exercício.
h) Redução no valor recuperável de outros activos (imparidade)
O Banco avalia periodicamente os seus activos, especialmente na ocasião da elaboração de demonstrações financeiras, com vista a identificar activos que apresentem o valor recuperável inferior ao valor contabilístico. O reconhecimento da redução no valor contabilístico (imparidade) de um activo acontece, sempre que o seu valor contabilístico exceder o valor recuperável, por contrapartida de resultados.
Na avaliação do indício de imparidade, a instituição deve considerar, no mínimo, as seguintes indicações:
1) Declínio significativo no valor de um activo, maior do que o esperado no seu uso normal;
2) Mudanças significativas no ambiente tecnológico, económico ou legal, com efeitos adversos sobre o Banco;
3) Aumento nas taxas de juros ou outras taxas de mercado, com efeitos sobre as taxas de desconto e consequente redução no valor presente ou no valor recuperável dos activos;
4) Valor contabilístico de activos líquidos maior do que o valor de mercado;
5) Evidência disponível de obsolescência ou perda de capacidade física de um activo;
6) Mudanças significativas na forma de utilização do activo, como descontinuidade ou reestruturação, com efeitos adversos para o Banco;
7) Indicação de que o desempenho económico do activo será pior do que o esperado.
i) Reserva de actualização monetária e dos fundos próprios
www.banc.co.ao086
Nos termos do Aviso n.º 2/2009, de 8 de Maio, do Banco Nacional de Angola sobre actualização monetária, o qual revogou o Aviso n.º 19/2007, de 26 de Setembro, as instituições financeiras devem, em caso de existência de inflação, considerar mensalmente os efeitos da modificação no poder de compra da moeda nacional, com base na aplicação do índice de Preços ao Consumidor, nas imobilizações e nos saldos de capital, reservas e resultados transitados.
As demonstrações financeiras de uma entidade cuja moeda funcional seja a moeda de uma economia hiperinflacionária devem ser expressas em termos da unidade de mensuração corrente à data do balanço. A hiperinflação é indicada pelas características do ambiente económico de um país que inclui, mas sem limitar, as seguintes situações:
i. A população em geral prefere guardar a sua riqueza em activos não monetários ou em moeda estrangeira relativamente estável. As quantias da moeda local detidas são imediatamente investidas para manter o poder de compra;
ii. A população em geral vê as quantias monetárias em termos de moeda estrangeira estável. Os preços podem ser cotados nessa moeda;
iii. As vendas e compras a crédito têm lugar a preços que compensem a perda esperada do poder de compra durante o período do crédito, mesmo que o período seja curto;
iv. As taxas de juro, salários e preços estão ligados a um índice de preços; e
v. A taxa acumulada de inflação durante os últimos 3 anos aproxima-se de, ou excede, 100%.
O valor resultante da actualização monetária das imobilizações deve ser reflectido mensalmente a crédito na conta de “Resultado da Actualização Monetária”, por contrapartida das rubricas de valor bruto e amortizações acumuladas das imobilizações.
O valor resultante da actualização monetária deve ser reflectido mensalmente, a débito na conta de “Resultado da Actualização Monetária” da demonstração de resultados, por contrapartida do aumento dos saldos de fundos próprios, com excepção da rubrica “Capital Social”, que deve ser classificada numa rubrica específica (“Reserva de actualização monetária do Capital Social”) que só pode ser utilizada para posterior aumento de capital.
Nos exercícios de 2016, o Banco procedeu à actualização monetária das suas imobilizações corpóreas, em virtude da inflação verificada, bem como a evolução cambial que ocorreu ao longo dos últimos três anos ter tido uma variação superior a 100%, nos termos do normativo em vigor. (nota 7)
j) Benefícios a colaboradores
BANC — Relatório e Contas, 2016 087
Provisão para férias e subsídio de fériasA Lei Geral do Trabalho, em vigor em 31 de Dezembro de 2016, determina que o montante de subsídio de férias pagável aos trabalhadores em determinado exercício é um direito por eles adquirido no ano imediatamente anterior. Consequentemente, o Banco releva contabilisticamente no exercício os valores relativos a férias e subsídio de férias pagáveis no ano seguinte.
k) Impostos sobre o rendimento
Os rendimentos obtidos pelo Banco, no âmbito do exercício normal da sua actividade, estão sujeitos a diversos impostos, consoante a sua natureza.
Deste modo, o Banco é tributado pela totalidade dos lucros obtidos quer no país, quer no estrangeiro e o seu lucro tributável corresponde à diferença entre todos os proveitos ou ganhos realizados e os custos ou perdas imputáveis ao exercício em apreço, eventualmente corrigidos nos termos do Código do Imposto Industrial.
O Banco encontra-se sujeito a tributação em sede de Imposto Industrial, sendo considerado fiscalmente um contribuinte do Grupo A. A tributação dos seus rendimentos é efectuada nos termos do novo Código do Imposto Industrial, aprovado pela Lei n.º 19/14, de 22 de Outubro de 2014, que entrou em vigor a 1 de Janeiro de 2015, e que define a nova taxa de imposto de 30% (ver nota 23). Neste exercício, o Banco apresentou prejuízos fiscais, pelo que não houve lugar a qualquer estimativa de imposto a pagar.
Os prejuízos fiscais apurados em determinado exercício, conforme disposto no artigo 48.º do Código do Imposto Industrial, podem ser deduzidos aos lucros tributáveis dos três anos posteriores.
As declarações fiscais estão sujeitas a revisão e correcção por parte das autoridades fiscais durante um período de 5 anos, podendo resultar, devido a diferentes interpretações da legislação fiscal, em eventuais correcções ao lucro tributável dos exercícios de 2012 a 2016. No entanto, não é previsível que qualquer correcção relativa a estes exercícios venha a ocorrer e, caso ocorra, não são esperados impactos significativos nas Demonstrações financeiras.
Os proveitos dos títulos da dívida pública resultantes de Obrigações do Tesouro e de Bilhetes do Tesouro emitidos pelo Estado Angolano, cuja emissão se encontra regulamentada pela Lei-Quadro da Dívida Pública Directa (Lei n.º 16/02, de 5 de Dezembro), bem como pelos Decretos Regulamentares números 51/03 e 52/03, de 8 de Julho, gozam de isenção de todos os impostos. Tal facto é complementado pelo disposto na alínea c) do número 1 do Artigo 23º do Código do Imposto Industrial, onde é referido expressamente que não se consideram como proveitos os rendimentos que provierem de quaisquer títulos da dívida pública angolana, para efeitos do apuramento do Imposto Industrial a pagar. Desta forma, na determinação do lucro tributável para os exercícios findos em 31 de Dezembro de 2016 e 2015, tais proveitos foram deduzidos ao lucro tributável.
www.banc.co.ao088
Imposto correnteO imposto corrente é calculado com base no lucro tributável do exercício, o qual difere do resultado contabilístico devido a ajustamentos resultantes de custos ou proveitos não relevantes para efeitos fiscais ou que apenas serão considerados em outros períodos contabilísticos.
Imposto diferidoO total dos impostos sobre lucros registados em resultados engloba os impostos correntes e os impostos diferidos.
Os impostos diferidos correspondem ao impacto no imposto a recuperar/pagar em períodos futuros resultante de diferenças temporárias dedutíveis ou tributáveis entre o valor de balanço dos activos e passivos e a sua base fiscal, utilizada na determinação do lucro tributável. Os impostos diferidos activos e passivos são calculados com base nas taxas fiscais em vigor para o período em que se prevê que seja realizado o respectivo activo ou passivo.
Os prejuízos fiscais reportáveis dão também origem a impostos diferidos activos.
Os passivos fiscais diferidos são normalmente registados para todas as diferenças temporárias tributáveis, enquanto os activos fiscais diferidos só são reconhecidos até ao montante em que seja provável a existência de lucros tributáveis futuros que permitam a utilização das correspondentes diferenças tributárias dedutíveis ou de reporte de prejuízos fiscais. Adicionalmente, não são registados activos fiscais diferidos nos casos em que a sua recuperabilidade possa ser questionável devido a outras situações, incluindo questões de interpretação da legislação fiscal em vigor.
Apesar disto, não são registados activos ou passivos fiscais diferidos relativos a diferenças temporárias originadas no reconhecimento inicial de activos e passivos em transacções que não afectem o resultado contabilístico ou o lucro tributável.
Imposto sobre a Aplicação de CapitaisNa sequência da linha definida pelo projecto da Reforma Tributária, foi publicado, em Diário da República, o Decreto legislativo Presidencial n.º 2/14, de 20 de Outubro, que procede à revisão e republicação do Código do Imposto sobre a Aplicação de Capitais (“IAC”), em vigor desde o passado dia 19 de Novembro de 2014.
O Decreto Legislativo Presidencial n.º 2/14, de 20 de Outubro, em vigor desde o dia 19 de Novembro, veio, rever e introduzir diversas alterações legislativas ao Código do IAC, na sequência do projecto da Reforma Tributária.
O IAC incide, genericamente, sobre os rendimentos provenientes das aplicações financeiras do Banco. A taxa varia entre 5% (no caso de juros pagos relativamente a títulos de dívida pública que apresentem uma maturidade igual ou superior a três anos) e 15%. Sem prejuízo do exposto, no que diz respeito aos rendimentos de títulos de dívida pública, conforme previamente mencionado, segundo último entendimento das Autoridades Fiscais e do Banco Nacional de Angola dirigido à ABANC (carta do Banco Nacional de Angola, datada de 26 de Setembro de 2013), apenas os que decorrerem de títulos emitidos em data igual ou posterior a 1 de Janeiro de 2013 se encontram sujeitos a este imposto.
BANC — Relatório e Contas, 2016 089
O IAC tem a natureza de pagamento por conta do Imposto Industrial, operando esta compensação por via da dedução à colecta que vier a ser apurada, nos termos da alínea a) do número 81.º do Código do Imposto Industrial.
Imposto Predial Urbano De acordo com as alterações introduzidas pela Lei n.º 18/11, de 21 de Abril, ao Código do Imposto Predial Urbano (“IPU”), sobre as rendas auferidas de imóveis arrendados incide IPU, à taxa de 15%.
Por outro lado, nos termos do artigo 23.º do Código do Imposto Industrial, não se consideram proveitos ou ganhos do exercício, para efeitos de apuramento do imposto devido, as rendas que sejam sujeitas a IPU.
l) Impostos sobre o património
Imposto Predial UrbanoEm face da redacção introduzida pela Lei n.º 18/11, de 21 de Abril, foi revogada a isenção anteriormente prevista no Regulamento do IPU, passando a incidir IPU, à taxa de 0,5%, sobre o valor patrimonial dos imóveis próprios que se destinem ao desenvolvimento da actividade normal do Banco (superior a AKZ 5.000.000).
SISANos termos do Diploma Legislativo n.º 230, de 18 de Maio de 1931 e, bem assim, das alterações introduzidas pela Lei n.º 15/92, de 3 de Julho e Lei n.º 16/11, de 21 de Abril, a SISA incide sobre todos os actos que importem transmissão perpétua ou temporária de propriedade de qualquer valor, espécie ou natureza, qualquer que seja a denominação ou forma do título (v.g., actos que importam transmissão de benfeitorias em prédios rústicos ou urbanos, as transmissões de bens imobiliários por meio de doações com entradas ou pensões ou a transmissão de bens imobiliários por meio de doações), à taxa de 2%.
m) Outros impostos
O Banco está igualmente sujeito a impostos indirectos, designadamente, impostos aduaneiros, Imposto do Selo, Imposto de Consumo, bem como outras taxas.
n) Substituição tributária
Imposto sobre a Aplicação de Capitais De acordo com o Decreto Legislativo Presidencial n.º 2/14, de 20 de Outubro, o Banco procede a retenção na fonte de IAC, à taxa de 10%, sobre os juros de depósitos a prazo pagos a clientes.
Imposto do Selo De acordo com o Decreto Legislativo Presidencial n.º 3/14, de 21 de Outubro, recai sobre o Banco a responsabilidade de liquidação e entrega do Imposto do Selo devido pelos seus clientes na generalidade das operações bancárias (v.g., financiamentos, cobrança de juros de financiamentos, comissões por serviços financeiros), procedendo o Banco à liquidação do imposto, às taxas previstas na Tabela do Imposto do Selo.
www.banc.co.ao090

Imposto IndustrialDe acordo com o previsto no Artigo 67.º da Lei n.º 19/14, de 22 de Outubro, a tributação efectiva das prestações de serviços contratadas pelo Banco, é objecto de retenção na fonte sobre determinadas prestações de serviços, à taxa de 6,5%.
Imposto Predial Urbano De acordo com o previsto na Lei n.º 18/11, de 21 de Abril, o Banco procede a retenção na fonte do IPU devido, à taxa de 15%, sobre o pagamento ou entrega de rendas relativas a imóveis arrendados.
o) Provisões e contingências
ProvisõesAs provisões representam responsabilidades prováveis com prazos e valores estimados. São reconhecidas provisões quando (i) o Banco tem uma obrigação presente, legal ou construtiva, (ii) seja provável que o seu pagamento venha a ser exigido e (iii) quando possa ser feita uma estimativa fiável do valor dessa obrigação. O montante da provisão corresponde à melhor estimativa do valor a desembolsar para liquidar a responsabilidade, na data do balanço.
Contingências passivasCaso o Banco tenha uma responsabilidade em que não seja provável o futuro dispêndio de recursos, trata-se de uma contingência passiva. As contingências passivas são apenas objecto de divulgação, a menos que a possibilidade da sua concretização seja remota.
São reconhecidas contingências passivas em contas extrapatrimoniais quando (i) o Banco tem uma possível obrigação presente cuja existência será confirmada somente pela ocorrência ou não de um ou mais eventos futuros, que não estejam sob o controlo do Banco; (ii) uma obrigação presente que surge de eventos passados, mas que não é reconhecida porque não é provável que o Banco tenha de a liquidar ou o valor da obrigação não pode ser mensurado com suficiente segurança.
As contingências passivas são reavaliadas periodicamente para determinar se a avaliação anterior continua válida. Se for provável que uma saída de recursos será exigida para um item anteriormente tratado como uma contingência passiva, é reconhecida uma provisão nas demonstrações financeiras do período no qual ocorre a mudança na estimativa de probabilidade.
Contingências activasUma contingência activa é um possível activo presente, decorrente de eventos passados, cuja existência será confirmada somente pela ocorrência ou não de um ou mais eventos futuros, que não estejam totalmente sob o controlo da instituição. As contingências activas são apenas objecto de divulgação e reconhecidas em contas extrapatrimoniais, a menos que a possibilidade da sua concretização seja remota.
As contingências activas devem ser reavaliadas periodicamente para determinar se a avaliação inicial continua válida. Se for praticamente certo que uma entrada de recursos ocorrerá por conta de um activo, entrada esta anteriormente classificada como provável, o activo e o correspondente ganho devem ser reconhecidos nas demonstrações financeiras do período em que ocorrer a mudança de estimativa.
BANC — Relatório e Contas, 2016 091
p) Reconhecimento de proveitos resultantes de serviços e comissões
As comissões por serviços prestados são normalmente reconhecidas como proveito ao longo do período de prestação do serviço ou de uma só vez, se resultarem da execução de actos únicos.
q) Resultado por acção
O resultado por acção é calculado dividindo o resultado líquido atribuível a accionistas do Banco pelo número médio ponderado de acções ordinárias em circulação no exercício, excluindo o número médio de acções ordinárias compradas pelo Banco e detidas como acções próprias.
Se o resultado por acção for alterado em resultado de uma emissão a prémio ou desconto ou outro evento que altere o número potencial de acções ordinárias ou alterações nas políticas contabilísticas, o cálculo do resultado por acção para todos os períodos apresentados é ajustado retrospectivamente.
r) Distribuição de dividendos
Os dividendos são reconhecidos como passivo e deduzidos da rubrica de capital próprio após aprovação pelos accionistas.
s) Principais estimativas e incertezas associadas à aplicação das políticas contabilísticas
As contas do Banco integram estimativas realizadas em condições de incerteza, que requerem que o Conselho de Administração utilize o julgamento de forma a apurar a estimativa adequada.
Desta forma, em algumas situações as estimativas apuradas pelo Conselho de Administração do Banco, poderiam ser diferentes caso um julgamento distinto fosse efectuado. O Conselho de Administração considera que os critérios adoptados são apropriados e que as demonstrações financeiras apresentam de forma adequada a posição financeira do Banco e das suas operações em todos os aspectos materialmente relevantes.
Utilizaram-se estimativas e pressupostos, nomeadamente nas áreas significativas: “Provisões para créditos de liquidação duvidosa”, “Títulos e valores mobiliários mantidos até ao vencimento”, “Imobilizações financeiras”, ”Imobilizações corpóreas e incorpóreas”, “Benefícios a colaboradores”, “Provisões para responsabilidades prováveis” e “Impostos sobre os lucros”.
t) Compensação de saldos
Os elementos do activo e do passivo devem ser valorizados separadamente, não sendo permitidas quaisquer compensações entre os saldos devedores e credores, inclusive das contas de resultado, com excepção das compensações relativas às operações interdepartamentais ou interdependências, ou outras definidas pelo BNA.
www.banc.co.ao092
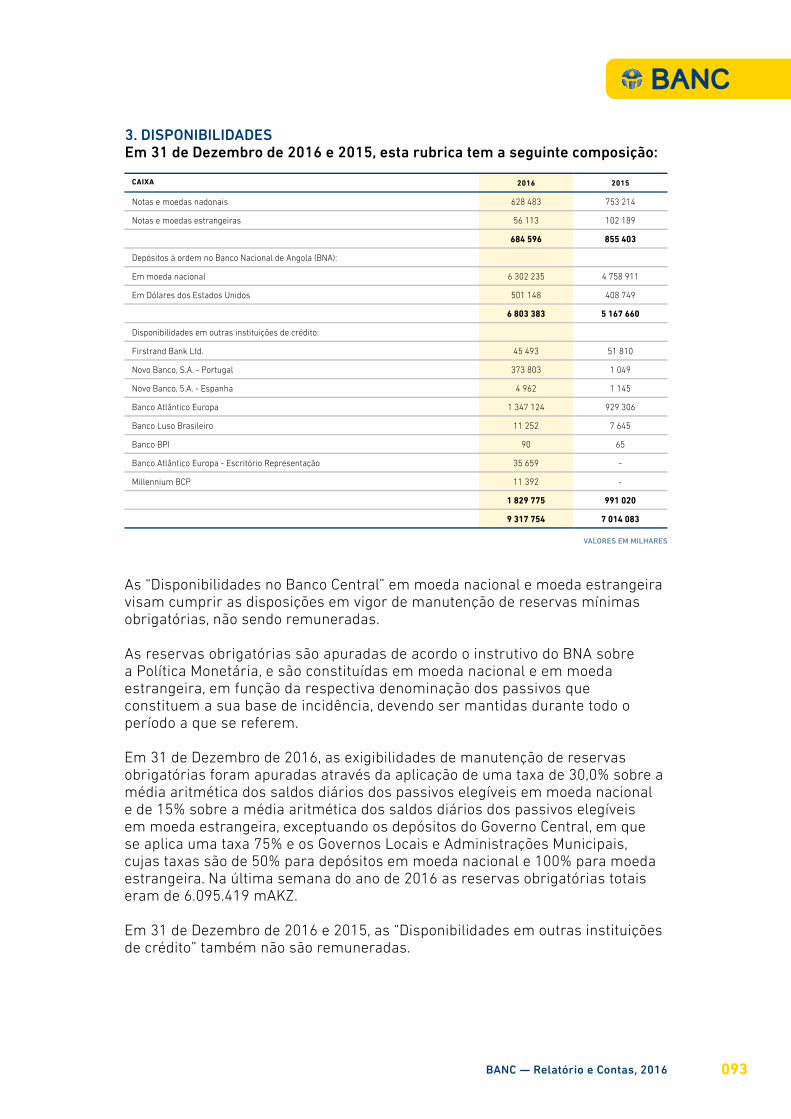
3. DISPONIBILIDADESEm 31 de Dezembro de 2016 e 2015, esta rubrica tem a seguinte composição:
As “Disponibilidades no Banco Central” em moeda nacional e moeda estrangeira visam cumprir as disposições em vigor de manutenção de reservas mínimas obrigatórias, não sendo remuneradas.
As reservas obrigatórias são apuradas de acordo o instrutivo do BNA sobre a Política Monetária, e são constituídas em moeda nacional e em moeda estrangeira, em função da respectiva denominação dos passivos que constituem a sua base de incidência, devendo ser mantidas durante todo o período a que se referem.
Em 31 de Dezembro de 2016, as exigibilidades de manutenção de reservas obrigatórias foram apuradas através da aplicação de uma taxa de 30,0% sobre a média aritmética dos saldos diários dos passivos elegíveis em moeda nacional e de 15% sobre a média aritmética dos saldos diários dos passivos elegíveis em moeda estrangeira, exceptuando os depósitos do Governo Central, em que se aplica uma taxa 75% e os Governos Locais e Administrações Municipais, cujas taxas são de 50% para depósitos em moeda nacional e 100% para moeda estrangeira. Na última semana do ano de 2016 as reservas obrigatórias totais eram de 6.095.419 mAKZ.
Em 31 de Dezembro de 2016 e 2015, as “Disponibilidades em outras instituições de crédito” também não são remuneradas.
CAIXA 2016 2015
Notas e moedas nadonais 628 483 753 214
Notas e moedas estrangeiras 56 113 102 189
684 596 855 403
Depósitos à ordem no Banco Nacional de Angola (BNA):
Em moeda nacional 6 302 235 4 758 911
Em Dólares dos Estados Unidos 501 148 408 749
6 803 383 5 167 660
Disponibilidades em outras instituições de crédito:
Firstrand Bank Ltd. 45 493 51 810
Novo Banco, S.A. - Portugal 373 803 1 049
Novo Banco, 5.A. - Espanha 4 962 1 145
Banco Atlântico Europa 1 347 124 929 306
Banco Luso Brasileiro 11 252 7 645
Banco BPI 90 65
Banco Atlântico Europa - Escritório Representação 35 659 -
Millennium BCP 11 392 -
1 829 775 991 020
9 317 754 7 014 083
VALORES EM MILHARES
BANC — Relatório e Contas, 2016 093
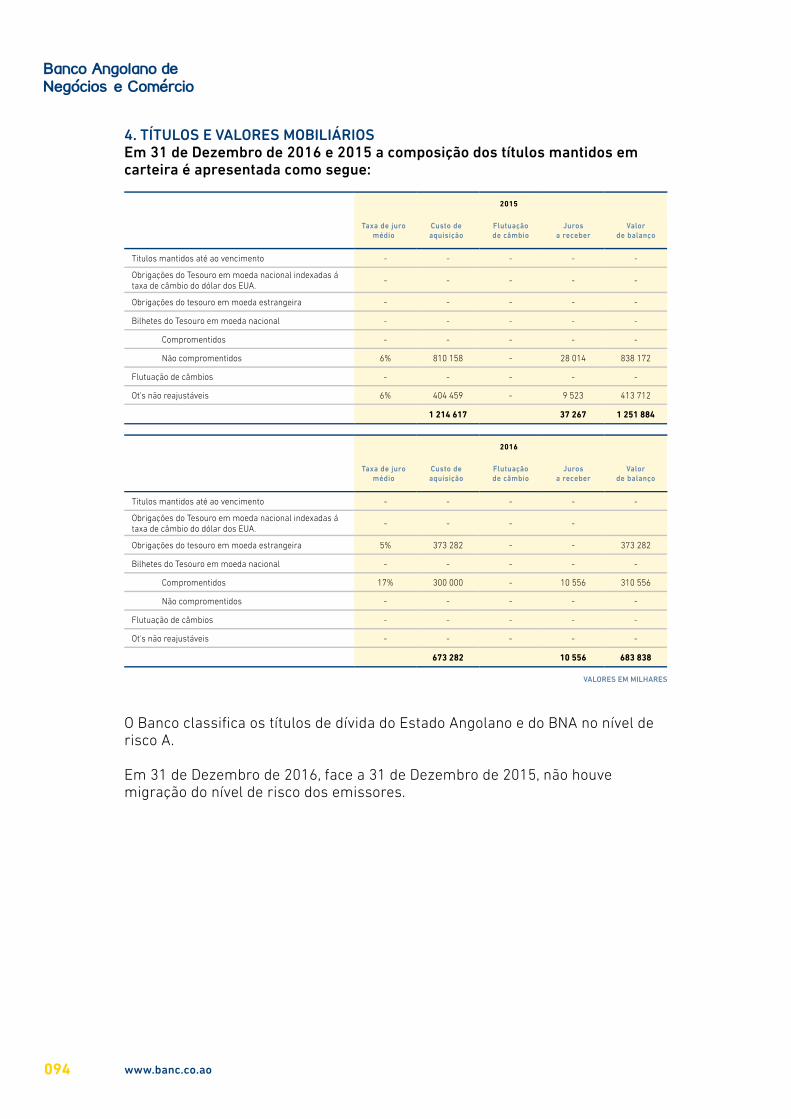
4. TÍTULOS E VALORES MOBILIÁRIOSEm 31 de Dezembro de 2016 e 2015 a composição dos títulos mantidos em carteira é apresentada como segue:
2015
Taxa de juro médio
Custo de aquisição
Flutuação de câmbio
Juros a receber
Valor de balanço
Titulos mantidos até ao vencimento - - - - -
Obrigações do Tesouro em moeda nacional indexadas á taxa de câmbio do dólar dos EUA.
- - - - -
Obrigações do tesouro em moeda estrangeira - - - - -
Bilhetes do Tesouro em moeda nacional - - - - -
Compromentidos - - - - -
Não compromentidos 6% 810 158 - 28 014 838 172
Flutuação de câmbios - - - - -
Ot's não reajustáveis 6% 404 459 - 9 523 413 712
1 214 617 37 267 1 251 884
2016
Taxa de juro médio
Custo de aquisição
Flutuação de câmbio
Juros a receber
Valor de balanço
Titulos mantidos até ao vencimento - - - - -
Obrigações do Tesouro em moeda nacional indexadas á taxa de câmbio do dólar dos EUA.
- - - -
Obrigações do tesouro em moeda estrangeira 5% 373 282 - - 373 282
Bilhetes do Tesouro em moeda nacional - - - - -
Compromentidos 17% 300 000 - 10 556 310 556
Não compromentidos - - - - -
Flutuação de câmbios - - - - -
Ot's não reajustáveis - - - - -
673 282 10 556 683 838
O Banco classifica os títulos de dívida do Estado Angolano e do BNA no nível de risco A.
Em 31 de Dezembro de 2016, face a 31 de Dezembro de 2015, não houve migração do nível de risco dos emissores.
VALORES EM MILHARES
www.banc.co.ao094
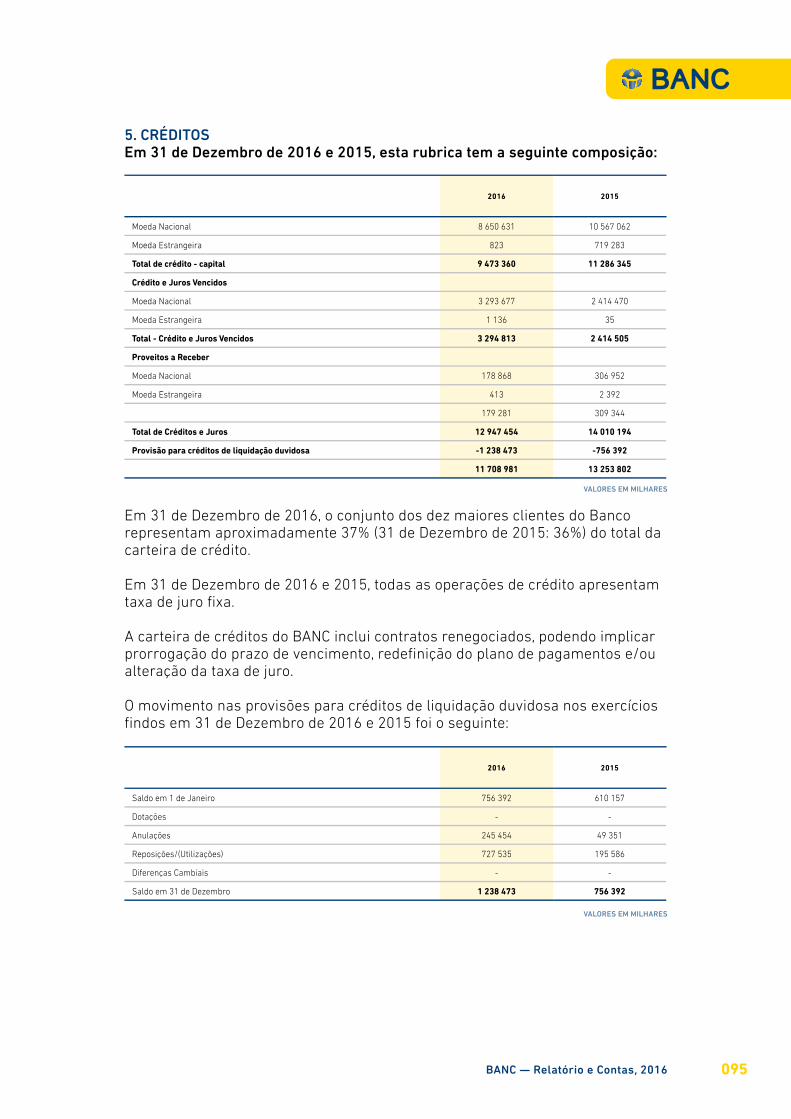
5. CRÉDITOSEm 31 de Dezembro de 2016 e 2015, esta rubrica tem a seguinte composição:
2016 2015
Moeda Nacional 8 650 631 10 567 062
Moeda Estrangeira 823 719 283
Total de crédito - capital 9 473 360 11 286 345
Crédito e Juros Vencidos
Moeda Nacional 3 293 677 2 414 470
Moeda Estrangeira 1 136 35
Total - Crédito e Juros Vencidos 3 294 813 2 414 505
Proveitos a Receber
Moeda Nacional 178 868 306 952
Moeda Estrangeira 413 2 392
179 281 309 344
Total de Créditos e Juros 12 947 454 14 010 194
Provisão para créditos de liquidação duvidosa -1 238 473 -756 392
11 708 981 13 253 802
Em 31 de Dezembro de 2016, o conjunto dos dez maiores clientes do Banco representam aproximadamente 37% (31 de Dezembro de 2015: 36%) do total da carteira de crédito.
Em 31 de Dezembro de 2016 e 2015, todas as operações de crédito apresentam taxa de juro fixa.
A carteira de créditos do BANC inclui contratos renegociados, podendo implicar prorrogação do prazo de vencimento, redefinição do plano de pagamentos e/ou alteração da taxa de juro.
O movimento nas provisões para créditos de liquidação duvidosa nos exercícios findos em 31 de Dezembro de 2016 e 2015 foi o seguinte:
2016 2015
Saldo em 1 de Janeiro 756 392 610 157
Dotações - -
Anulações 245 454 49 351
Reposições/(Utilizações) 727 535 195 586
Diferenças Cambiais - -
Saldo em 31 de Dezembro 1 238 473 756 392
VALORES EM MILHARES
VALORES EM MILHARES
BANC — Relatório e Contas, 2016 095
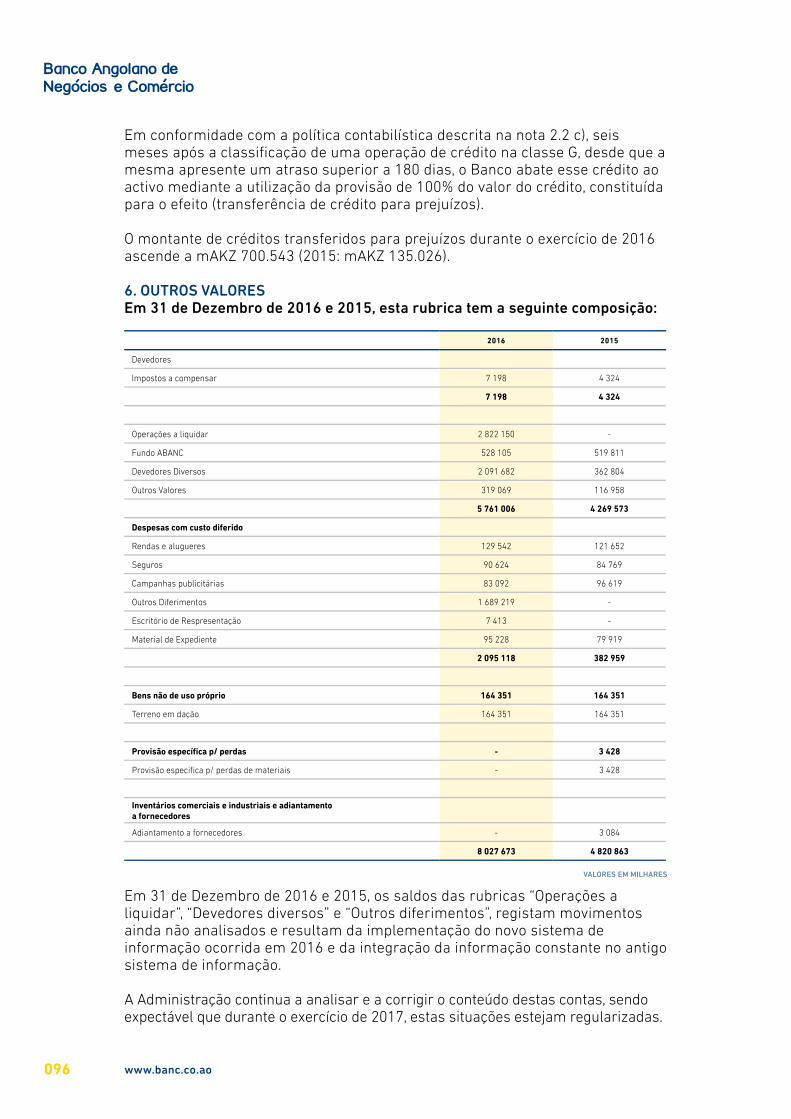
Em conformidade com a política contabilística descrita na nota 2.2 c), seis meses após a classificação de uma operação de crédito na classe G, desde que a mesma apresente um atraso superior a 180 dias, o Banco abate esse crédito ao activo mediante a utilização da provisão de 100% do valor do crédito, constituída para o efeito (transferência de crédito para prejuízos).
O montante de créditos transferidos para prejuízos durante o exercício de 2016 ascende a mAKZ 700.543 (2015: mAKZ 135.026).
6. OUTROS VALORESEm 31 de Dezembro de 2016 e 2015, esta rubrica tem a seguinte composição:
2016 2015
Devedores
Impostos a compensar 7 198 4 324
7 198 4 324
Operações a liquidar 2 822 150 -
Fundo ABANC 528 105 519 811
Devedores Diversos 2 091 682 362 804
Outros Valores 319 069 116 958
5 761 006 4 269 573
Despesas com custo diferido
Rendas e alugueres 129 542 121 652
Seguros 90 624 84 769
Campanhas publicitárias 83 092 96 619
Outros Diferimentos 1 689 219 -
Escritório de Respresentação 7 413 -
Material de Expediente 95 228 79 919
2 095 118 382 959
Bens não de uso próprio 164 351 164 351
Terreno em dação 164 351 164 351
Provisão específica p/ perdas - 3 428
Provisão especifica p/ perdas de materiais - 3 428
Inventários comerciais e industriais e adiantamento a fornecedores
Adiantamento a fornecedores - 3 084
8 027 673 4 820 863
Em 31 de Dezembro de 2016 e 2015, os saldos das rubricas “Operações a liquidar”, “Devedores diversos” e “Outros diferimentos”, registam movimentos ainda não analisados e resultam da implementação do novo sistema de informação ocorrida em 2016 e da integração da informação constante no antigo sistema de informação.
A Administração continua a analisar e a corrigir o conteúdo destas contas, sendo expectável que durante o exercício de 2017, estas situações estejam regularizadas.
VALORES EM MILHARES
www.banc.co.ao096
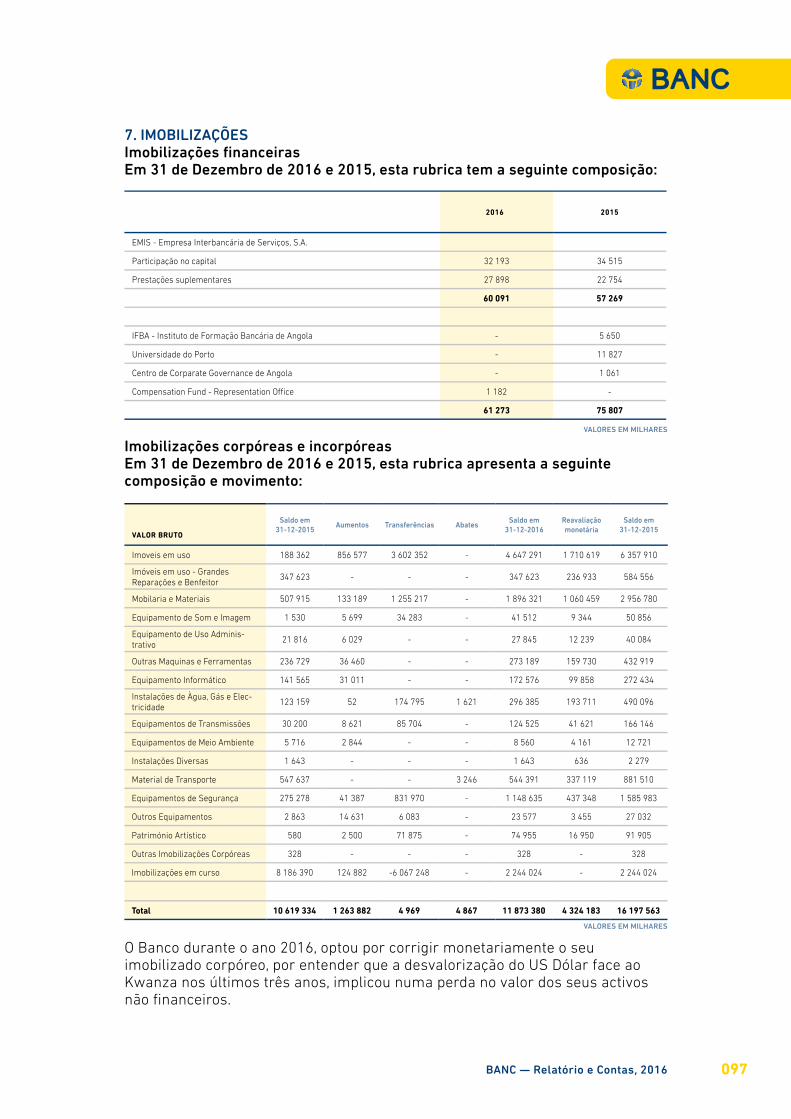
7. IMOBILIZAÇÕESImobilizações financeirasEm 31 de Dezembro de 2016 e 2015, esta rubrica tem a seguinte composição:
VALOR BRUTO
Saldo em 31-12-2015
Aumentos Transferências AbatesSaldo em
31-12-2016Reavaliação monetária
Saldo em 31-12-2015
Imoveis em uso 188 362 856 577 3 602 352 - 4 647 291 1 710 619 6 357 910
Imóveis em uso - Grandes Reparações e Benfeitor
347 623 - - - 347 623 236 933 584 556
Mobilaria e Materiais 507 915 133 189 1 255 217 - 1 896 321 1 060 459 2 956 780
Equipamento de Som e Imagem 1 530 5 699 34 283 - 41 512 9 344 50 856
Equipamento de Uso Adminis-trativo
21 816 6 029 - - 27 845 12 239 40 084
Outras Maquinas e Ferramentas 236 729 36 460 - - 273 189 159 730 432 919
Equipamento Informático 141 565 31 011 - - 172 576 99 858 272 434
Instalações de Àgua, Gás e Elec-tricidade
123 159 52 174 795 1 621 296 385 193 711 490 096
Equipamentos de Transmissões 30 200 8 621 85 704 - 124 525 41 621 166 146
Equipamentos de Meio Ambiente 5 716 2 844 - - 8 560 4 161 12 721
Instalações Diversas 1 643 - - - 1 643 636 2 279
Material de Transporte 547 637 - - 3 246 544 391 337 119 881 510
Equipamentos de Segurança 275 278 41 387 831 970 - 1 148 635 437 348 1 585 983
Outros Equipamentos 2 863 14 631 6 083 - 23 577 3 455 27 032
Património Artístico 580 2 500 71 875 - 74 955 16 950 91 905
Outras Imobilizações Corpóreas 328 - - - 328 - 328
Imobilizações em curso 8 186 390 124 882 -6 067 248 - 2 244 024 - 2 244 024
Total 10 619 334 1 263 882 4 969 4 867 11 873 380 4 324 183 16 197 563
2016 2015
EMIS - Empresa Interbancária de Serviços, S.A.
Participação no capital 32 193 34 515
Prestações suplementares 27 898 22 754
60 091 57 269
IFBA - Instituto de Formação Bancária de Angola - 5 650
Universidade do Porto - 11 827
Centro de Corparate Governance de Angola - 1 061
Compensation Fund - Representation OÌce 1 182 -
61 273 75 807
Imobilizações corpóreas e incorpóreasEm 31 de Dezembro de 2016 e 2015, esta rubrica apresenta a seguinte composição e movimento:
O Banco durante o ano 2016, optou por corrigir monetariamente o seu imobilizado corpóreo, por entender que a desvalorização do US Dólar face ao Kwanza nos últimos três anos, implicou numa perda no valor dos seus activos não financeiros.
VALORES EM MILHARES
VALORES EM MILHARES
BANC — Relatório e Contas, 2016 097
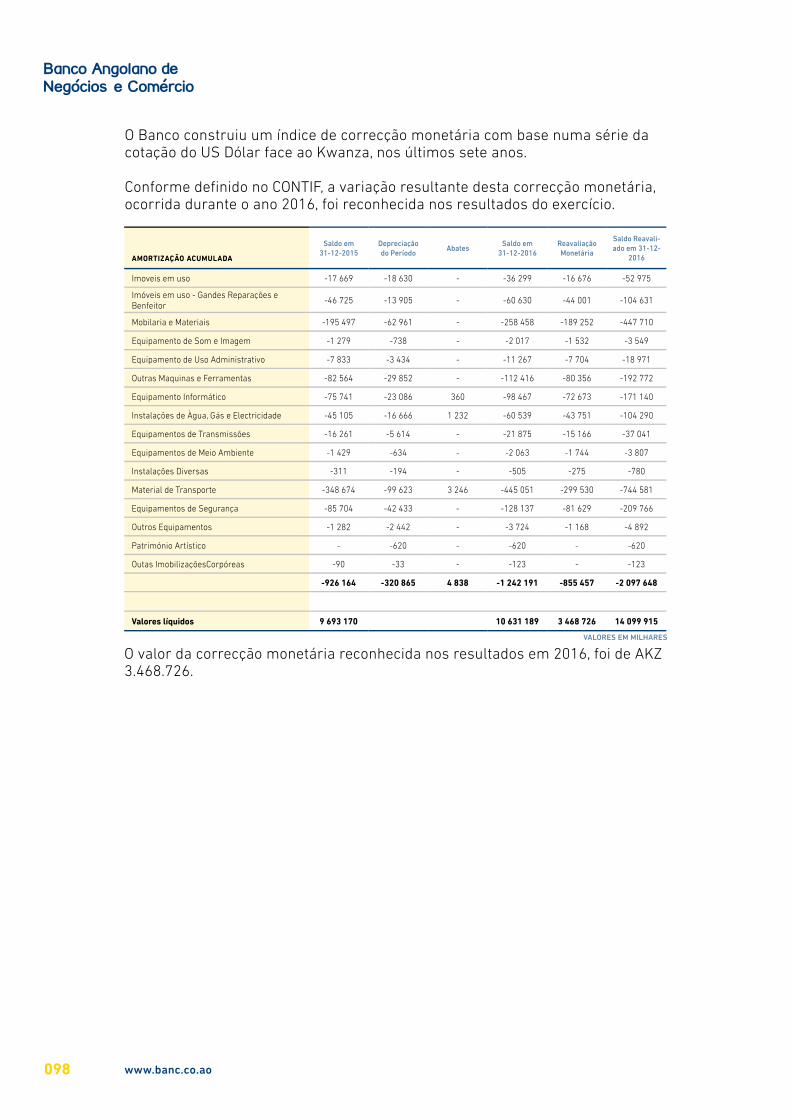
O Banco construiu um índice de correcção monetária com base numa série da cotação do US Dólar face ao Kwanza, nos últimos sete anos.
Conforme definido no CONTIF, a variação resultante desta correcção monetária, ocorrida durante o ano 2016, foi reconhecida nos resultados do exercício.
AMORTIZAÇÃO ACUMULADA
Saldo em 31-12-2015
Depreciação do Período
AbatesSaldo em
31-12-2016Reavaliação Monetária
Saldo Reavali-ado em 31-12-
2016
Imoveis em uso -17 669 -18 630 - -36 299 -16 676 -52 975
Imóveis em uso - Gandes Reparações e Benfeitor
-46 725 -13 905 - -60 630 -44 001 -104 631
Mobilaria e Materiais -195 497 -62 961 - -258 458 -189 252 -447 710
Equipamento de Som e Imagem -1 279 -738 - -2 017 -1 532 -3 549
Equipamento de Uso Administrativo -7 833 -3 434 - -11 267 -7 704 -18 971
Outras Maquinas e Ferramentas -82 564 -29 852 - -112 416 -80 356 -192 772
Equipamento Informático -75 741 -23 086 360 -98 467 -72 673 -171 140
Instalações de Àgua, Gás e Electricidade -45 105 -16 666 1 232 -60 539 -43 751 -104 290
Equipamentos de Transmissões -16 261 -5 614 - -21 875 -15 166 -37 041
Equipamentos de Meio Ambiente -1 429 -634 - -2 063 -1 744 -3 807
Instalações Diversas -311 -194 - -505 -275 -780
Material de Transporte -348 674 -99 623 3 246 -445 051 -299 530 -744 581
Equipamentos de Segurança -85 704 -42 433 - -128 137 -81 629 -209 766
Outros Equipamentos -1 282 -2 442 - -3 724 -1 168 -4 892
Património Artístico - -620 - -620 - -620
Outas ImobilizaçõesCorpóreas -90 -33 - -123 - -123
-926 164 -320 865 4 838 -1 242 191 -855 457 -2 097 648
Valores líquidos 9 693 170 10 631 189 3 468 726 14 099 915
O valor da correcção monetária reconhecida nos resultados em 2016, foi de AKZ 3.468.726.
VALORES EM MILHARES
www.banc.co.ao098
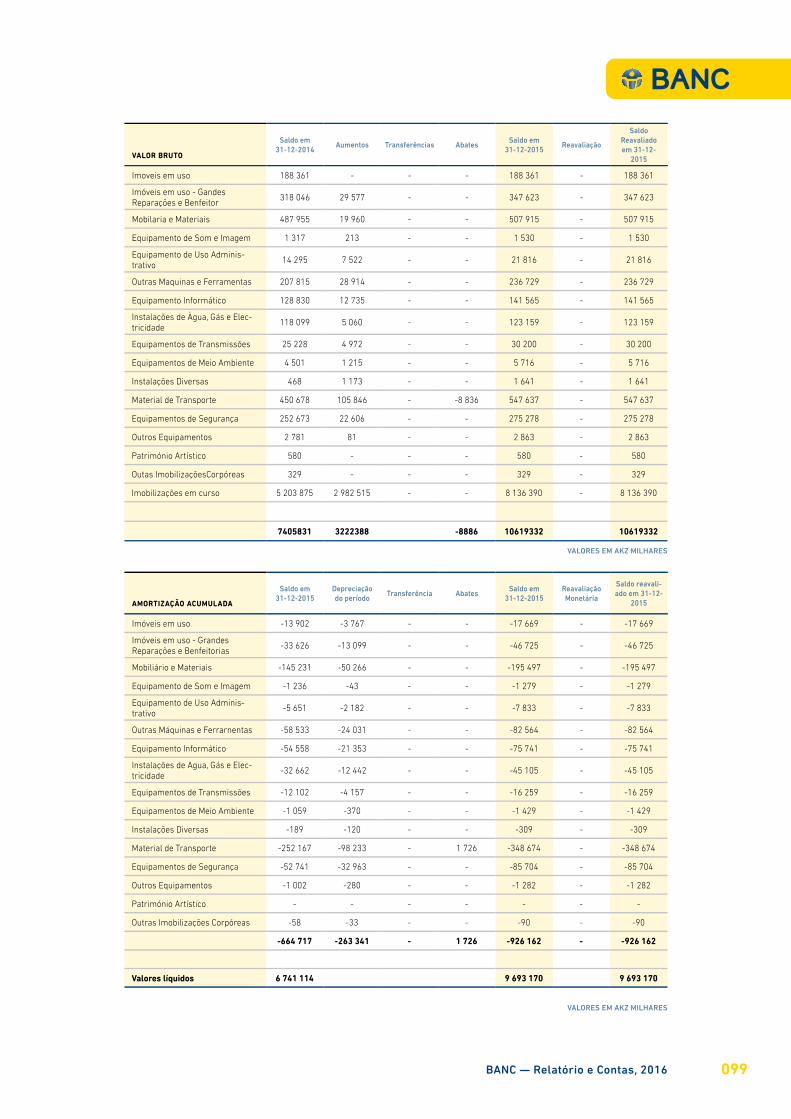
VALOR BRUTO
Saldo em 31-12-2014
Aumentos Transferências AbatesSaldo em
31-12-2015Reavaliação
Saldo Reavaliado em 31-12-
2015
Imoveis em uso 188 361 - - - 188 361 - 188 361
Imóveis em uso - Gandes Reparações e Benfeitor
318 046 29 577 - - 347 623 - 347 623
Mobilaria e Materiais 487 955 19 960 - - 507 915 - 507 915
Equipamento de Som e Imagem 1 317 213 - - 1 530 - 1 530
Equipamento de Uso Adminis-trativo
14 295 7 522 - - 21 816 - 21 816
Outras Maquinas e Ferramentas 207 815 28 914 - - 236 729 - 236 729
Equipamento Informático 128 830 12 735 - - 141 565 - 141 565
Instalações de Àgua, Gás e Elec-tricidade
118 099 5 060 - - 123 159 - 123 159
Equipamentos de Transmissões 25 228 4 972 - - 30 200 - 30 200
Equipamentos de Meio Ambiente 4 501 1 215 - - 5 716 - 5 716
Instalações Diversas 468 1 173 - - 1 641 - 1 641
Material de Transporte 450 678 105 846 - -8 836 547 637 - 547 637
Equipamentos de Segurança 252 673 22 606 - - 275 278 - 275 278
Outros Equipamentos 2 781 81 - - 2 863 - 2 863
Património Artístico 580 - - - 580 - 580
Outas ImobilizaçõesCorpóreas 329 - - - 329 - 329
Imobilizações em curso 5 203 875 2 982 515 - - 8 136 390 - 8 136 390
7405831 3222388 -8886 10619332 10619332
AMORTIZAÇÃO ACUMULADA
Saldo em 31-12-2015
Depreciação do período
Transferência AbatesSaldo em
31-12-2015 Reavaliação Monetária
Saldo reavali-ado em 31-12-
2015
Imóveis em uso -13 902 -3 767 - - -17 669 - -17 669
Imóveis em uso - Grandes Reparações e Benfeitorias
-33 626 -13 099 - - -46 725 - -46 725
Mobiliário e Materiais -145 231 -50 266 - - -195 497 - -195 497
Equipamento de Som e Imagem -1 236 -43 - - -1 279 - -1 279
Equipamento de Uso Adminis-trativo
-5 651 -2 182 - - -7 833 - -7 833
Outras Máquinas e Ferrarnentas -58 533 -24 031 - - -82 564 - -82 564
Equipamento Informático -54 558 -21 353 - - -75 741 - -75 741
Instalações de Agua, Gás e Elec-tricidade
-32 662 -12 442 - - -45 105 - -45 105
Equipamentos de Transmissões -12 102 -4 157 - - -16 259 - -16 259
Equipamentos de Meio Ambiente -1 059 -370 - - -1 429 - -1 429
Instalações Diversas -189 -120 - - -309 - -309
Material de Transporte -252 167 -98 233 - 1 726 -348 674 - -348 674
Equipamentos de Segurança -52 741 -32 963 - - -85 704 - -85 704
Outros Equipamentos -1 002 -280 - - -1 282 - -1 282
Património Artístico - - - - - - -
Outras Imobilizações Corpóreas -58 -33 - - -90 - -90
-664 717 -263 341 - 1 726 -926 162 - -926 162
Valores líquidos 6 741 114 9 693 170 9 693 170
VALORES EM AKZ MILHARES
VALORES EM AKZ MILHARES
BANC — Relatório e Contas, 2016 099
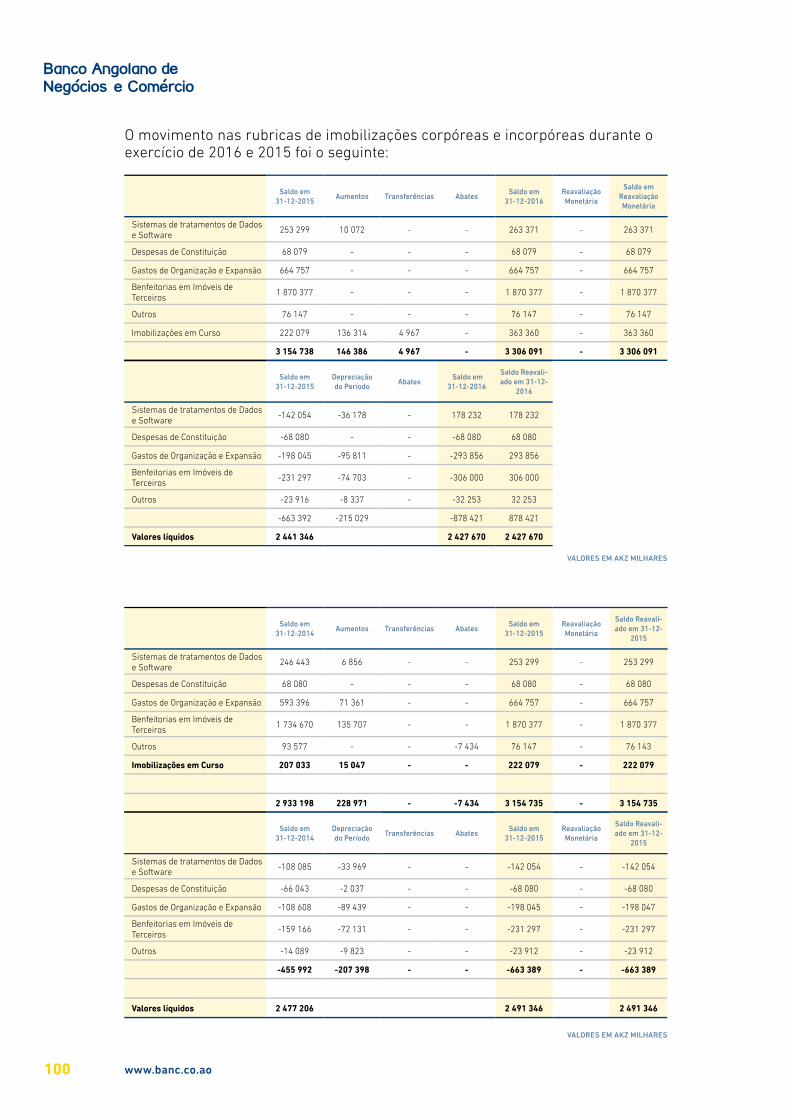
O movimento nas rubricas de imobilizações corpóreas e incorpóreas durante o exercício de 2016 e 2015 foi o seguinte:
Saldo em 31-12-2015
Aumentos Transferências AbatesSaldo em
31-12-2016Reavaliação Monetária
Saldo em Reavaliação Monetária
Sistemas de tratamentos de Dados e Software
253 299 10 072 - - 263 371 - 263 371
Despesas de Constituição 68 079 - - - 68 079 - 68 079
Gastos de Organização e Expansão 664 757 - - - 664 757 - 664 757
Benfeitorias em Imóveis de Terceiros
1 870 377 - - - 1 870 377 - 1 870 377
Outros 76 147 - - - 76 147 - 76 147
Imobilizações em Curso 222 079 136 314 4 967 - 363 360 - 363 360
3 154 738 146 386 4 967 - 3 306 091 - 3 306 091
Saldo em 31-12-2015
Depreciação do Período
Abates Saldo em
31-12-2016
Saldo Reavali-ado em 31-12-
2016
Sistemas de tratamentos de Dados e Software
-142 054 -36 178 - 178 232 178 232
Despesas de Constituição -68 080 - - -68 080 68 080
Gastos de Organização e Expansão -198 045 -95 811 - -293 856 293 856
Benfeitorias em Imóveis de Terceiros
-231 297 -74 703 - -306 000 306 000
Outros -23 916 -8 337 - -32 253 32 253
-663 392 -215 029 -878 421 878 421
Valores líquidos 2 441 346 2 427 670 2 427 670
Saldo em 31-12-2014
Aumentos Transferências AbatesSaldo em
31-12-2015Reavaliação Monetária
Saldo Reavali-ado em 31-12-
2015
Sistemas de tratamentos de Dados e Software
246 443 6 856 - - 253 299 - 253 299
Despesas de Constituição 68 080 - - - 68 080 - 68 080
Gastos de Organização e Expansão 593 396 71 361 - - 664 757 - 664 757
Benfeitorias em Imóveis de Terceiros
1 734 670 135 707 - - 1 870 377 - 1 870 377
Outros 93 577 - - -7 434 76 147 - 76 143
Imobilizações em Curso 207 033 15 047 - - 222 079 - 222 079
2 933 198 228 971 - -7 434 3 154 735 - 3 154 735
Saldo em 31-12-2014
Depreciação do Período
Transferências AbatesSaldo em
31-12-2015Reavaliação Monetária
Saldo Reavali-ado em 31-12-
2015
Sistemas de tratamentos de Dados e Software
-108 085 -33 969 - - -142 054 - -142 054
Despesas de Constituição -66 043 -2 037 - - -68 080 - -68 080
Gastos de Organização e Expansão -108 608 -89 439 - - -198 045 - -198 047
Benfeitorias em Imóveis de Terceiros
-159 166 -72 131 - - -231 297 - -231 297
Outros -14 089 -9 823 - - -23 912 - -23 912
-455 992 -207 398 - - -663 389 - -663 389
Valores líquidos 2 477 206 2 491 346 2 491 346
VALORES EM AKZ MILHARES
VALORES EM AKZ MILHARES
www.banc.co.ao100
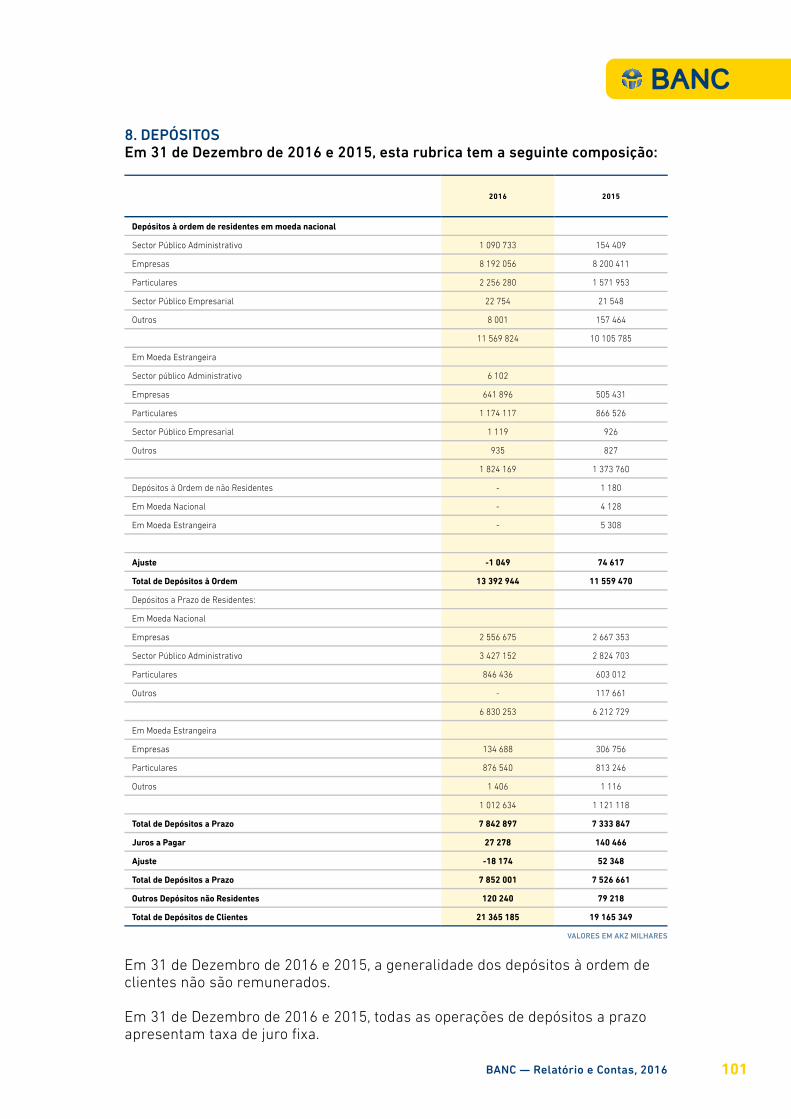
8. DEPÓSITOSEm 31 de Dezembro de 2016 e 2015, esta rubrica tem a seguinte composição:
2016 2015
Depósitos à ordem de residentes em moeda nacional
Sector Público Administrativo 1 090 733 154 409
Empresas 8 192 056 8 200 411
Particulares 2 256 280 1 571 953
Sector Público Empresarial 22 754 21 548
Outros 8 001 157 464
11 569 824 10 105 785
Em Moeda Estrangeira
Sector público Administrativo 6 102
Empresas 641 896 505 431
Particulares 1 174 117 866 526
Sector Público Empresarial 1 119 926
Outros 935 827
1 824 169 1 373 760
Depósitos à Ordem de não Residentes - 1 180
Em Moeda Nacional - 4 128
Em Moeda Estrangeira - 5 308
Ajuste -1 049 74 617
Total de Depósitos à Ordem 13 392 944 11 559 470
Depósitos a Prazo de Residentes:
Em Moeda Nacional
Empresas 2 556 675 2 667 353
Sector Público Administrativo 3 427 152 2 824 703
Particulares 846 436 603 012
Outros - 117 661
6 830 253 6 212 729
Em Moeda Estrangeira
Empresas 134 688 306 756
Particulares 876 540 813 246
Outros 1 406 1 116
1 012 634 1 121 118
Total de Depósitos a Prazo 7 842 897 7 333 847
Juros a Pagar 27 278 140 466
Ajuste -18 174 52 348
Total de Depósitos a Prazo 7 852 001 7 526 661
Outros Depósitos não Residentes 120 240 79 218
Total de Depósitos de Clientes 21 365 185 19 165 349
Em 31 de Dezembro de 2016 e 2015, a generalidade dos depósitos à ordem de clientes não são remunerados.
Em 31 de Dezembro de 2016 e 2015, todas as operações de depósitos a prazo apresentam taxa de juro fixa.
VALORES EM AKZ MILHARES
BANC — Relatório e Contas, 2016 101
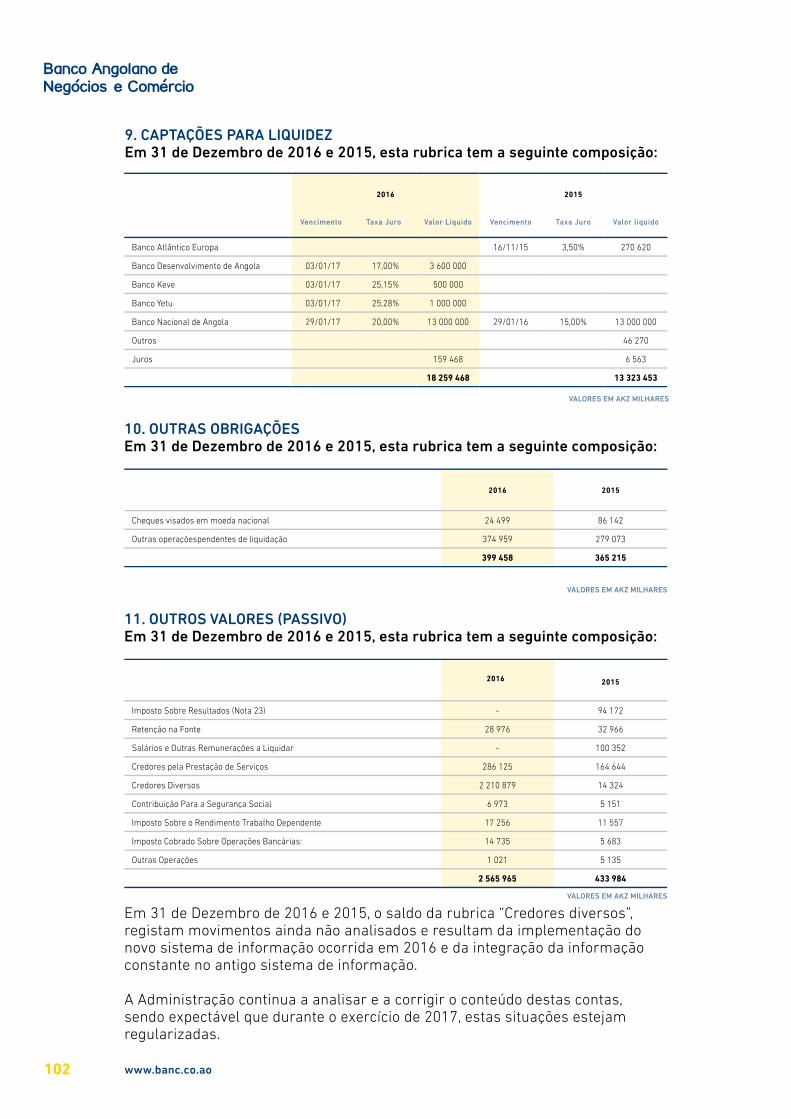
9. CAPTAÇÕES PARA LIQUIDEZEm 31 de Dezembro de 2016 e 2015, esta rubrica tem a seguinte composição:
10. OUTRAS OBRIGAÇÕESEm 31 de Dezembro de 2016 e 2015, esta rubrica tem a seguinte composição:
2016 2015
Vencimento Taxa Juro Valor Liquido Vencimento Taxa Juro Valor liquido
Banco Atlântico Europa 16/11/15 3,50% 270 620
Banco Desenvolvimento de Angola 03/01/17 17,00% 3 600 000
Banco Keve 03/01/17 25,15% 500 000
Banco Yetu 03/01/17 25,28% 1 000 000
Banco Nacional de Angola 29/01/17 20,00% 13 000 000 29/01/16 15,00% 13 000 000
Outros 46 270
Juros 159 468 6 563
18 259 468 13 323 453
11. OUTROS VALORES (PASSIVO)Em 31 de Dezembro de 2016 e 2015, esta rubrica tem a seguinte composição:
2016 2015
Cheques visados em moeda nacional 24 499 86 142
Outras operaçõespendentes de liquidação 374 959 279 073
399 458 365 215
2016 2015
Imposto Sobre Resultados (Nota 23) - 94 172
Retenção na Fonte 28 976 32 966
Salários e Outras Remunerações a Liquidar - 100 352
Credores pela Prestação de Serviços 286 125 164 644
Credores Diversos 2 210 879 14 324
Contribuição Para a Segurança Social 6 973 5 151
Imposto Sobre o Rendimento Trabalho Dependente 17 256 11 557
Imposto Cobrado Sobre Operações Bancárias: 14 735 5 683
Outras Operações 1 021 5 135
2 565 965 433 984
Em 31 de Dezembro de 2016 e 2015, o saldo da rubrica “Credores diversos”, registam movimentos ainda não analisados e resultam da implementação do novo sistema de informação ocorrida em 2016 e da integração da informação constante no antigo sistema de informação.
A Administração continua a analisar e a corrigir o conteúdo destas contas, sendo expectável que durante o exercício de 2017, estas situações estejam regularizadas.
VALORES EM AKZ MILHARES
VALORES EM AKZ MILHARES
VALORES EM AKZ MILHARES
www.banc.co.ao102
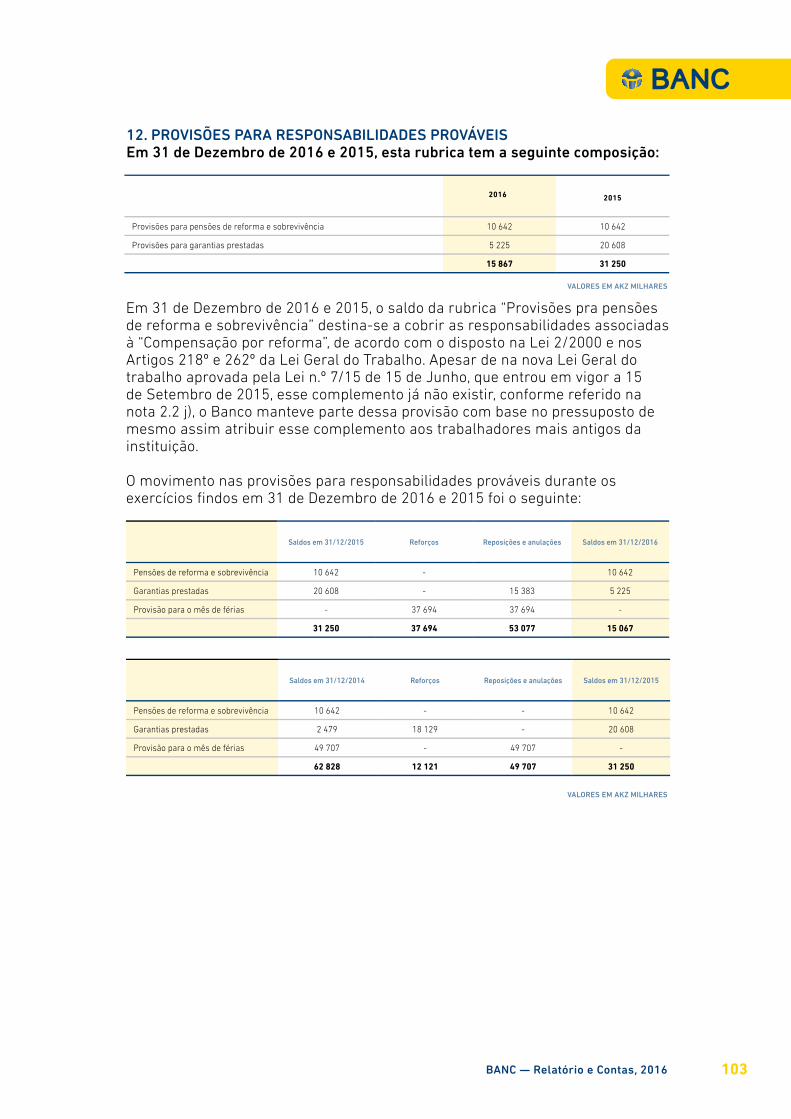
12. PROVISÕES PARA RESPONSABILIDADES PROVÁVEISEm 31 de Dezembro de 2016 e 2015, esta rubrica tem a seguinte composição:
2016 2015
Provisões para pensões de reforma e sobrevivência 10 642 10 642
Provisões para garantias prestadas 5 225 20 608
15 867 31 250
Em 31 de Dezembro de 2016 e 2015, o saldo da rubrica “Provisões pra pensões de reforma e sobrevivência” destina-se a cobrir as responsabilidades associadas à “Compensação por reforma”, de acordo com o disposto na Lei 2/2000 e nos Artigos 218º e 262º da Lei Geral do Trabalho. Apesar de na nova Lei Geral do trabalho aprovada pela Lei n.º 7/15 de 15 de Junho, que entrou em vigor a 15 de Setembro de 2015, esse complemento já não existir, conforme referido na nota 2.2 j), o Banco manteve parte dessa provisão com base no pressuposto de mesmo assim atribuir esse complemento aos trabalhadores mais antigos da instituição.
O movimento nas provisões para responsabilidades prováveis durante os exercícios findos em 31 de Dezembro de 2016 e 2015 foi o seguinte:
Saldos em 31/12/2015 Reforços Reposições e anulações Saldos em 31/12/2016
Pensões de reforma e sobrevivência 10 642 - 10 642
Garantias prestadas 20 608 - 15 383 5 225
Provisão para o mês de férias - 37 694 37 694 -
31 250 37 694 53 077 15 067
Saldos em 31/12/2014 Reforços Reposições e anulações Saldos em 31/12/2015
Pensões de reforma e sobrevivência 10 642 - - 10 642
Garantias prestadas 2 479 18 129 - 20 608
Provisão para o mês de férias 49 707 - 49 707 -
62 828 12 121 49 707 31 250
VALORES EM AKZ MILHARES
VALORES EM AKZ MILHARES
BANC — Relatório e Contas, 2016 103
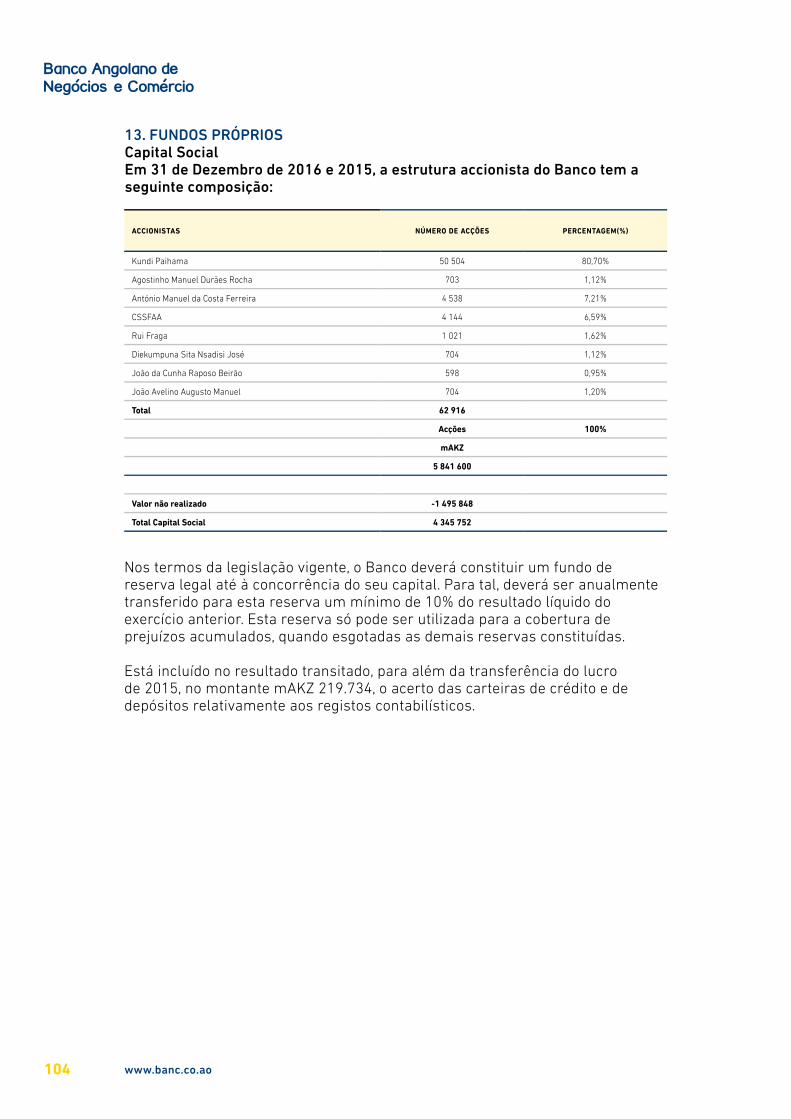
13. FUNDOS PRÓPRIOSCapital SocialEm 31 de Dezembro de 2016 e 2015, a estrutura accionista do Banco tem a seguinte composição:
ACCIONISTAS NÚMERO DE ACÇÕES PERCENTAGEM(%)
Kundi Paihama 50 504 80,70%
Agostinho Manuel Durães Rocha 703 1,12%
António Manuel da Costa Ferreira 4 538 7,21%
CSSFAA 4 144 6,59%
Rui Fraga 1 021 1,62%
Diekumpuna Sita Nsadisi José 704 1,12%
João da Cunha Raposo Beirão 598 0,95%
João Avelino Augusto Manuel 704 1,20%
Total 62 916
Acções 100%
mAKZ
5 841 600
Valor não realizado -1 495 848
Total Capital Social 4 345 752
Nos termos da legislação vigente, o Banco deverá constituir um fundo de reserva legal até à concorrência do seu capital. Para tal, deverá ser anualmente transferido para esta reserva um mínimo de 10% do resultado líquido do exercício anterior. Esta reserva só pode ser utilizada para a cobertura de prejuízos acumulados, quando esgotadas as demais reservas constituídas.
Está incluído no resultado transitado, para além da transferência do lucro de 2015, no montante mAKZ 219.734, o acerto das carteiras de crédito e de depósitos relativamente aos registos contabilísticos.
www.banc.co.ao104
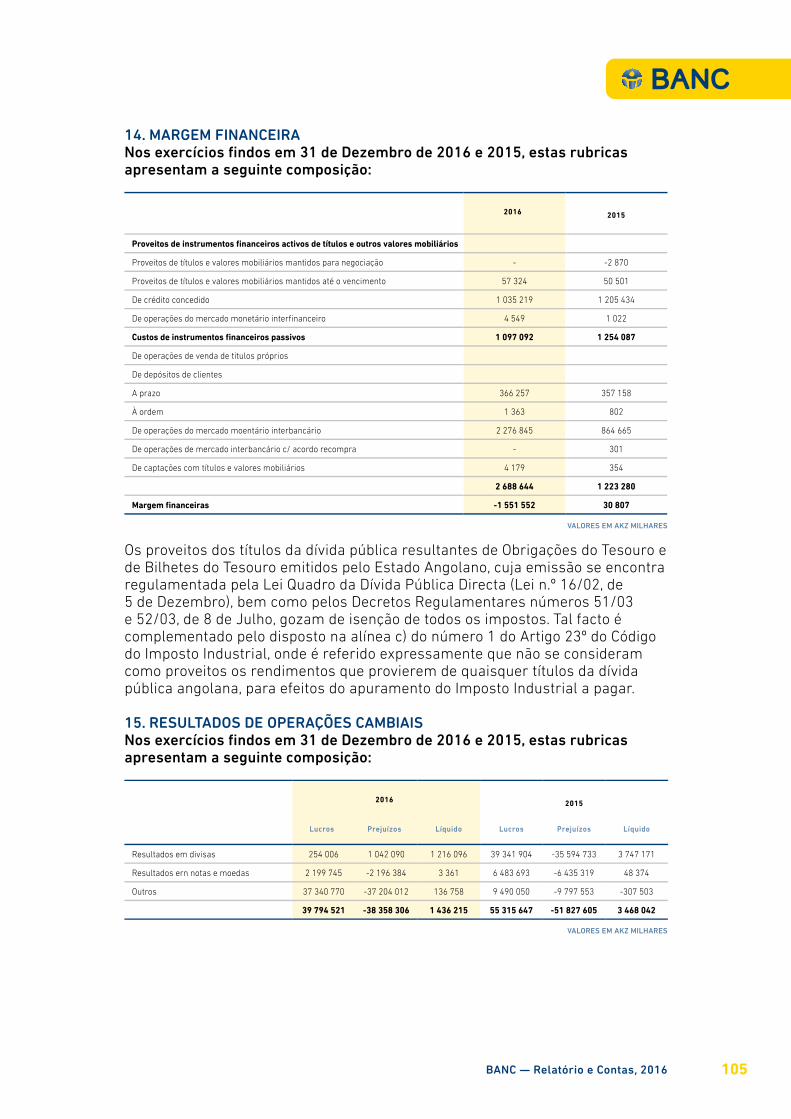
14. MARGEM FINANCEIRANos exercícios findos em 31 de Dezembro de 2016 e 2015, estas rubricas apresentam a seguinte composição:
2016 2015
Proveitos de instrumentos financeiros activos de títulos e outros valores mobiliários
Proveitos de títulos e valores mobiliários mantidos para negociação - -2 870
Proveitos de títulos e valores mobiliários mantidos até o vencimento 57 324 50 501
De crédito concedido 1 035 219 1 205 434
De operações do mercado monetário interfinanceiro 4 549 1 022
Custos de instrumentos financeiros passivos 1 097 092 1 254 087
De operações de venda de titulos próprios
De depósitos de clientes
A prazo 366 257 357 158
À ordem 1 363 802
De operações do mercado moentário interbancário 2 276 845 864 665
De operações de mercado interbancário c/ acordo recompra - 301
De captações com títulos e valores mobiliários 4 179 354
2 688 644 1 223 280
Margem financeiras -1 551 552 30 807
Os proveitos dos títulos da dívida pública resultantes de Obrigações do Tesouro e de Bilhetes do Tesouro emitidos pelo Estado Angolano, cuja emissão se encontra regulamentada pela Lei Quadro da Dívida Pública Directa (Lei n.º 16/02, de 5 de Dezembro), bem como pelos Decretos Regulamentares números 51/03 e 52/03, de 8 de Julho, gozam de isenção de todos os impostos. Tal facto é complementado pelo disposto na alínea c) do número 1 do Artigo 23º do Código do Imposto Industrial, onde é referido expressamente que não se consideram como proveitos os rendimentos que provierem de quaisquer títulos da dívida pública angolana, para efeitos do apuramento do Imposto Industrial a pagar.
15. RESULTADOS DE OPERAÇÕES CAMBIAISNos exercícios findos em 31 de Dezembro de 2016 e 2015, estas rubricas apresentam a seguinte composição:
2016 2015
Lucros Prejuízos Líquido Lucros Prejuízos Líquido
Resultados em divisas 254 006 1 042 090 1 216 096 39 341 904 -35 594 733 3 747 171
Resultados ern notas e moedas 2 199 745 -2 196 384 3 361 6 483 693 -6 435 319 48 374
Outros 37 340 770 -37 204 012 136 758 9 490 050 -9 797 553 -307 503
39 794 521 -38 358 306 1 436 215 55 315 647 -51 827 605 3 468 042
VALORES EM AKZ MILHARES
VALORES EM AKZ MILHARES
BANC — Relatório e Contas, 2016 105
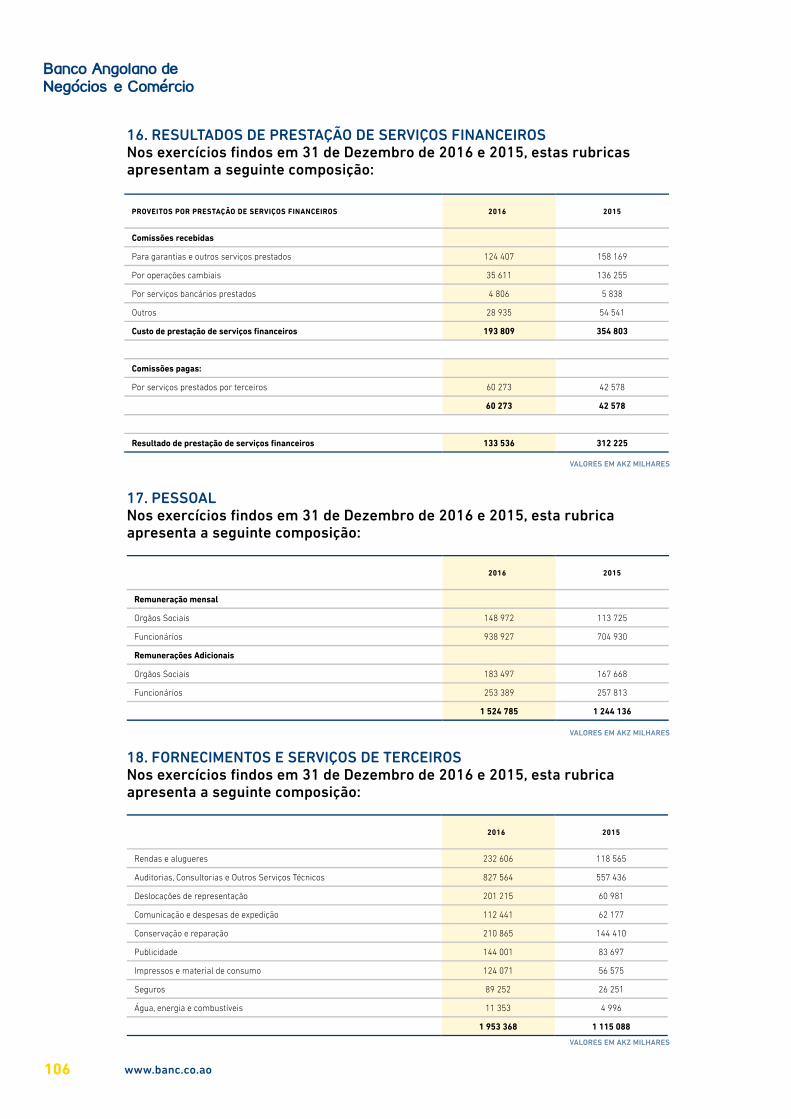
16. RESULTADOS DE PRESTAÇÃO DE SERVIÇOS FINANCEIROSNos exercícios findos em 31 de Dezembro de 2016 e 2015, estas rubricas apresentam a seguinte composição:
PROVEITOS POR PRESTAÇÃO DE SERVIÇOS FINANCEIROS 2016 2015
Comissões recebidas
Para garantias e outros serviços prestados 124 407 158 169
Por operações cambiais 35 611 136 255
Por serviços bancários prestados 4 806 5 838
Outros 28 935 54 541
Custo de prestação de serviços financeiros 193 809 354 803
Comissões pagas:
Por serviços prestados por terceiros 60 273 42 578
60 273 42 578
Resultado de prestação de serviços financeiros 133 536 312 225
17. PESSOALNos exercícios findos em 31 de Dezembro de 2016 e 2015, esta rubrica apresenta a seguinte composição:
2016 2015
Remuneração mensal
Orgãos Sociais 148 972 113 725
Funcionários 938 927 704 930
Remunerações Adicionais
Orgãos Sociais 183 497 167 668
Funcionários 253 389 257 813
1 524 785 1 244 136
18. FORNECIMENTOS E SERVIÇOS DE TERCEIROSNos exercícios findos em 31 de Dezembro de 2016 e 2015, esta rubrica apresenta a seguinte composição:
2016 2015
Rendas e alugueres 232 606 118 565
Auditorias, Consultorias e Outros Serviços Técnicos 827 564 557 436
Deslocações de representação 201 215 60 981
Comunicação e despesas de expedição 112 441 62 177
Conservação e reparação 210 865 144 410
Publicidade 144 001 83 697
Impressos e material de consumo 124 071 56 575
Seguros 89 252 26 251
Água, energia e combustíveis 11 353 4 996
1 953 368 1 115 088
VALORES EM AKZ MILHARES
VALORES EM AKZ MILHARES
VALORES EM AKZ MILHARES
www.banc.co.ao106

19. IMPOSTOS E TAXAS NÃO INCIDENTES SOBRE O RESULTADONos exercícios findos em 31 de Dezembro de 2016 e 2015, estas rubricas apresentam a seguinte composição:
2016 2015
Encargos Sociais
Encargos Socias obrigatorios 55 880 44 982
Encargos Sociais facultativos 1 480 177
Impostos indiretos - -
Imposto aduaneiro - 4 498
Imposto do selo - 1 062
Impostos diretos - -
Imposto sobre consumo 4 389 -
Imposto de circulação 386 408
Outras taxas 12 256 37
Impostos diretos 55 537 49 763
129 928 100 921
20. OUTROS CUSTOS ADMINISTRATIVOSNos exercícios findos em 31 de Dezembro de 2016 e 2015, esta rubrica apresenta a seguinte composição:
2016 2015
Custos e Prejuízos Diversos 4 026 -
Quatizações - ABANC 1 620 2 804
Quatizações - BNA 2 783 2 344
Quatizações - Carteira de Comércio e Indústria Portugal-Angola - -
Outros donativos - Gratificações Diversas 26 549 44 667
34 978 49 825
21. DEPRECIAÇÔES E AMORTIZAÇÔESNos exercícios findos em 31 de Dezembro de 2016 e 2015, estas rubricas apresentam a seguinte composição:
2016 2015
Imobilizações Corpóreas (Nota 7) 320 865 263 341
Imobilizações Incorpóreas (Nota 7) 215 029 207 398
535 894 470 739
VALORES EM AKZ MILHARES
VALORES EM AKZ MILHARES
VALORES EM AKZ MILHARES
BANC — Relatório e Contas, 2016 107
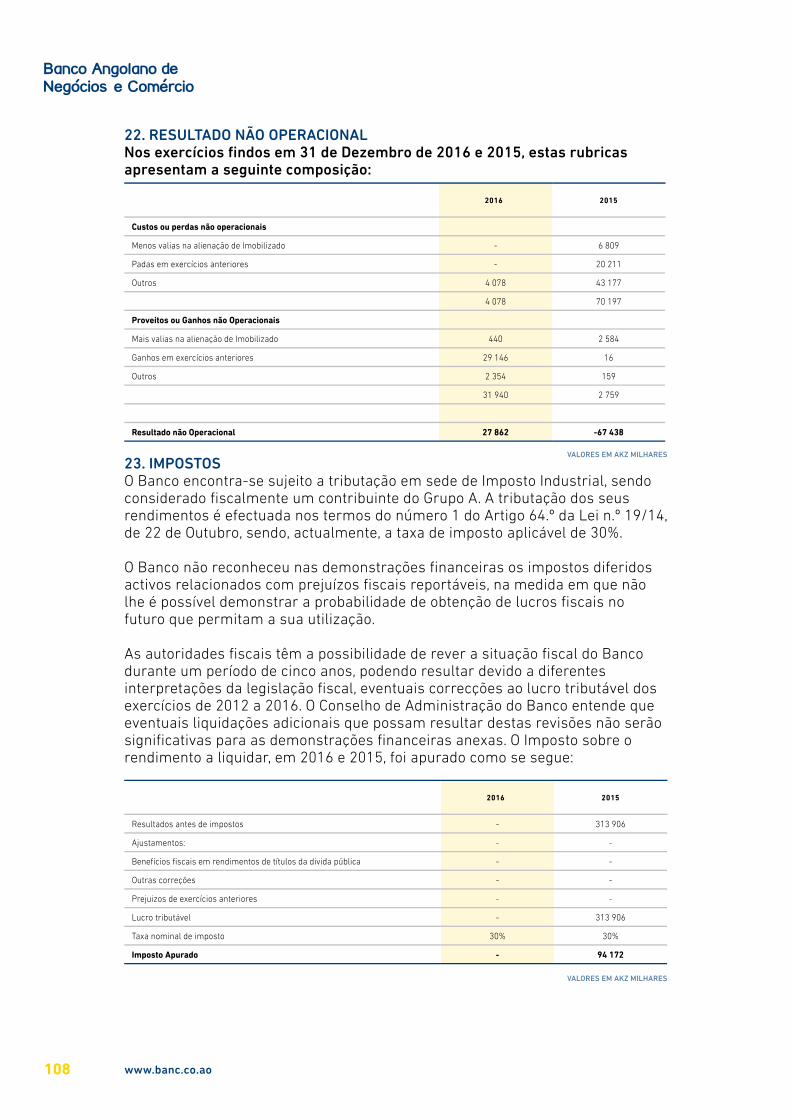
22. RESULTADO NÃO OPERACIONALNos exercícios findos em 31 de Dezembro de 2016 e 2015, estas rubricas apresentam a seguinte composição:
2016 2015
Custos ou perdas não operacionais
Menos valias na alienação de Imobilizado - 6 809
Padas em exercícios anteriores - 20 211
Outros 4 078 43 177
4 078 70 197
Proveitos ou Ganhos não Operacionais
Mais valias na alienação de Imobilizado 440 2 584
Ganhos em exercícios anteriores 29 146 16
Outros 2 354 159
31 940 2 759
Resultado não Operacional 27 862 -67 438
23. IMPOSTOSO Banco encontra-se sujeito a tributação em sede de Imposto Industrial, sendo considerado fiscalmente um contribuinte do Grupo A. A tributação dos seus rendimentos é efectuada nos termos do número 1 do Artigo 64.º da Lei n.º 19/14, de 22 de Outubro, sendo, actualmente, a taxa de imposto aplicável de 30%.
O Banco não reconheceu nas demonstrações financeiras os impostos diferidos activos relacionados com prejuízos fiscais reportáveis, na medida em que não lhe é possível demonstrar a probabilidade de obtenção de lucros fiscais no futuro que permitam a sua utilização.
As autoridades fiscais têm a possibilidade de rever a situação fiscal do Banco durante um período de cinco anos, podendo resultar devido a diferentes interpretações da legislação fiscal, eventuais correcções ao lucro tributável dos exercícios de 2012 a 2016. O Conselho de Administração do Banco entende que eventuais liquidações adicionais que possam resultar destas revisões não serão significativas para as demonstrações financeiras anexas. O Imposto sobre o rendimento a liquidar, em 2016 e 2015, foi apurado como se segue:
2016 2015
Resultados antes de impostos - 313 906
Ajustamentos: - -
Benefícios fiscais em rendimentos de títulos da divida pública - -
Outras correções - -
Prejuizos de exercícios anteriores - -
Lucro tributável - 313 906
Taxa nominal de imposto 30% 30%
Imposto Apurado - 94 172
VALORES EM AKZ MILHARES
VALORES EM AKZ MILHARES
www.banc.co.ao108
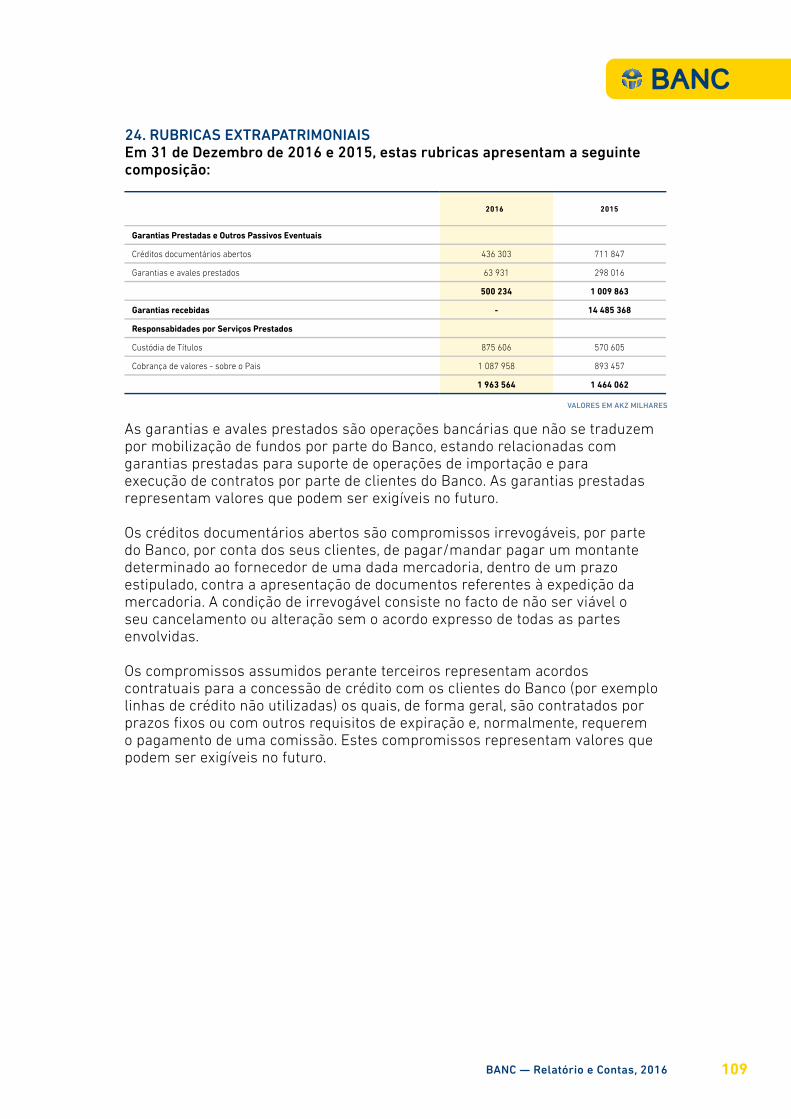
24. RUBRICAS EXTRAPATRIMONIAISEm 31 de Dezembro de 2016 e 2015, estas rubricas apresentam a seguinte composição:
2016 2015
Garantias Prestadas e Outros Passivos Eventuais
Créditos documentários abertos 436 303 711 847
Garantias e avales prestados 63 931 298 016
500 234 1 009 863
Garantias recebidas - 14 485 368
Responsabidades por Serviços Prestados
Custódia de Títulos 875 606 570 605
Cobrança de valores - sobre o Pais 1 087 958 893 457
1 963 564 1 464 062
As garantias e avales prestados são operações bancárias que não se traduzem por mobilização de fundos por parte do Banco, estando relacionadas com garantias prestadas para suporte de operações de importação e para execução de contratos por parte de clientes do Banco. As garantias prestadas representam valores que podem ser exigíveis no futuro.
Os créditos documentários abertos são compromissos irrevogáveis, por parte do Banco, por conta dos seus clientes, de pagar/mandar pagar um montante determinado ao fornecedor de uma dada mercadoria, dentro de um prazo estipulado, contra a apresentação de documentos referentes à expedição da mercadoria. A condição de irrevogável consiste no facto de não ser viável o seu cancelamento ou alteração sem o acordo expresso de todas as partes envolvidas.
Os compromissos assumidos perante terceiros representam acordos contratuais para a concessão de crédito com os clientes do Banco (por exemplo linhas de crédito não utilizadas) os quais, de forma geral, são contratados por prazos fixos ou com outros requisitos de expiração e, normalmente, requerem o pagamento de uma comissão. Estes compromissos representam valores que podem ser exigíveis no futuro.
VALORES EM AKZ MILHARES
BANC — Relatório e Contas, 2016 109
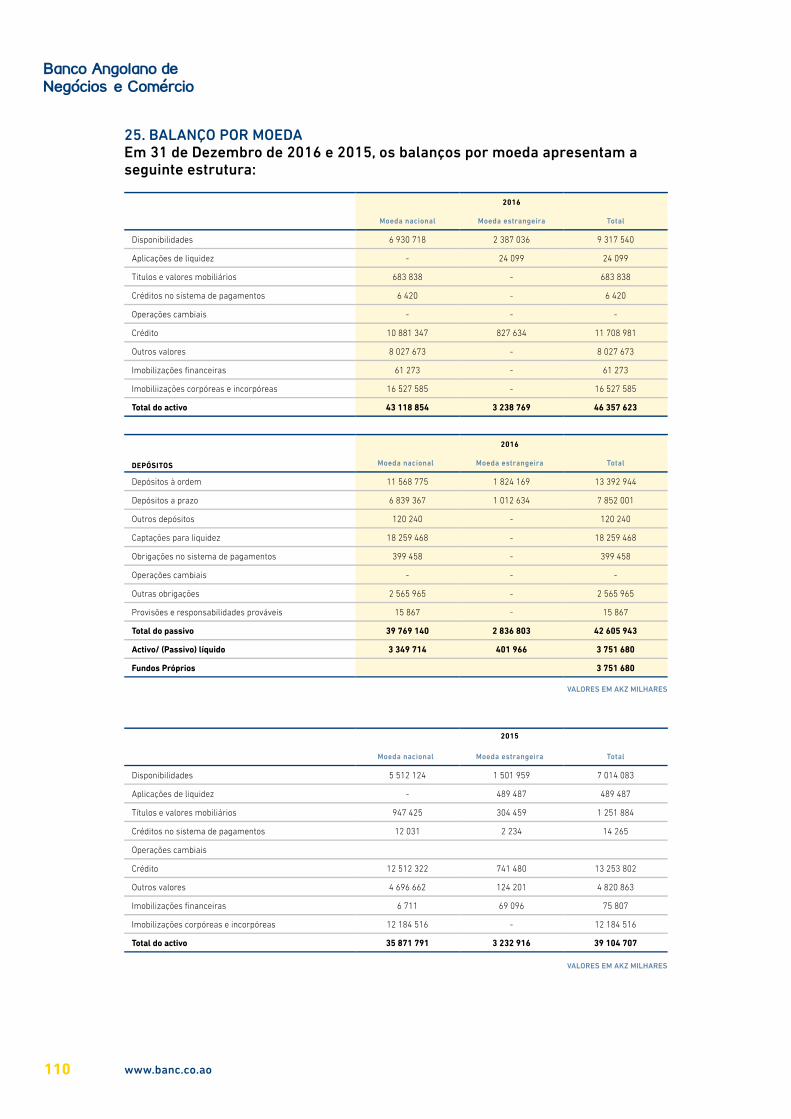
25. BALANÇO POR MOEDAEm 31 de Dezembro de 2016 e 2015, os balanços por moeda apresentam a seguinte estrutura:
2016
Moeda nacional Moeda estrangeira Total
Disponibilidades 6 930 718 2 387 036 9 317 540
Aplicações de liquidez - 24 099 24 099
Titulos e valores mobiliários 683 838 - 683 838
Créditos no sistema de pagamentos 6 420 - 6 420
Operações cambiais - - -
Crédito 10 881 347 827 634 11 708 981
Outros valores 8 027 673 - 8 027 673
Imobilizações financeiras 61 273 - 61 273
Imobiliizações corpóreas e incorpóreas 16 527 585 - 16 527 585
Total do activo 43 118 854 3 238 769 46 357 623
DEPÓSITOS
2016
Moeda nacional Moeda estrangeira Total
Depósitos à ordem 11 568 775 1 824 169 13 392 944
Depósitos a prazo 6 839 367 1 012 634 7 852 001
Outros depósitos 120 240 - 120 240
Captações para liquidez 18 259 468 - 18 259 468
Obrigações no sistema de pagamentos 399 458 - 399 458
Operações cambiais - - -
Outras obrigações 2 565 965 - 2 565 965
Provisões e responsabilidades prováveis 15 867 - 15 867
Total do passivo 39 769 140 2 836 803 42 605 943
Activo/ (Passivo) líquido 3 349 714 401 966 3 751 680
Fundos Próprios 3 751 680
2015
Moeda nacional Moeda estrangeira Total
Disponibilidades 5 512 124 1 501 959 7 014 083
Aplicações de liquidez - 489 487 489 487
Títulos e valores mobiliários 947 425 304 459 1 251 884
Créditos no sistema de pagamentos 12 031 2 234 14 265
Operações cambiais
Crédito 12 512 322 741 480 13 253 802
Outros valores 4 696 662 124 201 4 820 863
Imobilizações financeiras 6 711 69 096 75 807
Imobilizações corpóreas e incorpóreas 12 184 516 - 12 184 516
Total do activo 35 871 791 3 232 916 39 104 707
VALORES EM AKZ MILHARES
VALORES EM AKZ MILHARES
www.banc.co.ao110
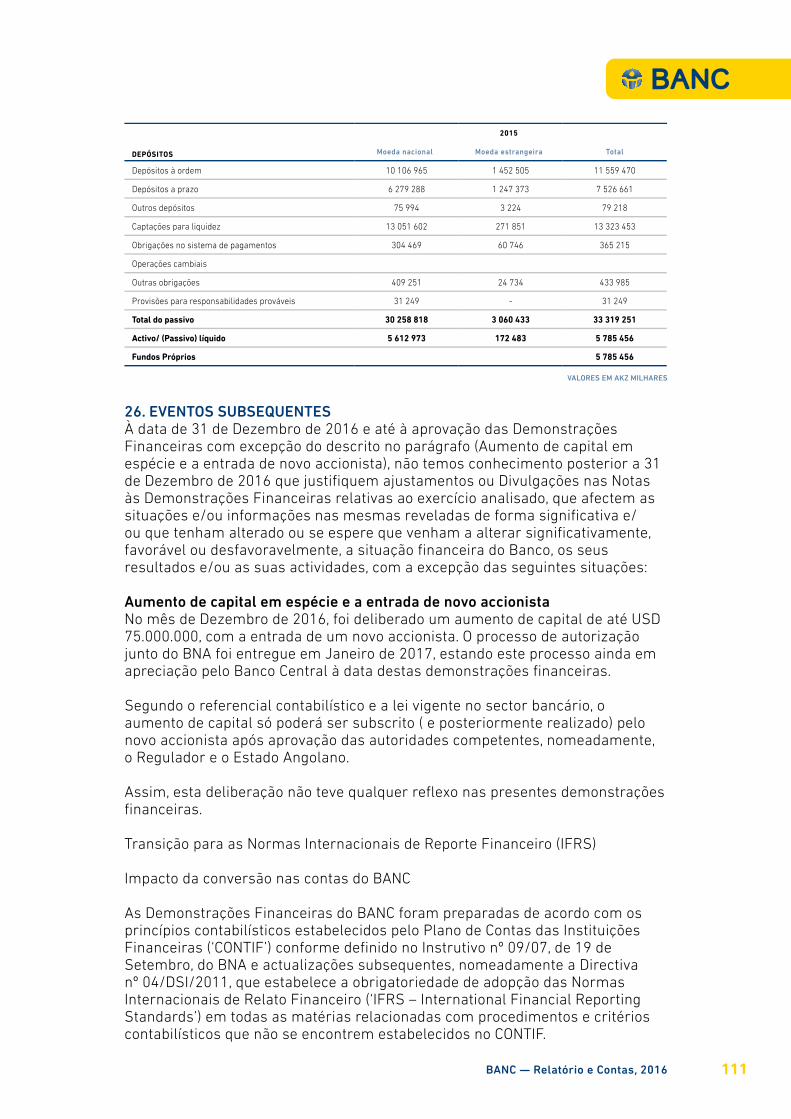
26. EVENTOS SUBSEQUENTESÀ data de 31 de Dezembro de 2016 e até à aprovação das Demonstrações Financeiras com excepção do descrito no parágrafo (Aumento de capital em espécie e a entrada de novo accionista), não temos conhecimento posterior a 31 de Dezembro de 2016 que justifiquem ajustamentos ou Divulgações nas Notas às Demonstrações Financeiras relativas ao exercício analisado, que afectem as situações e/ou informações nas mesmas reveladas de forma significativa e/ou que tenham alterado ou se espere que venham a alterar significativamente, favorável ou desfavoravelmente, a situação financeira do Banco, os seus resultados e/ou as suas actividades, com a excepção das seguintes situações:
Aumento de capital em espécie e a entrada de novo accionistaNo mês de Dezembro de 2016, foi deliberado um aumento de capital de até USD 75.000.000, com a entrada de um novo accionista. O processo de autorização junto do BNA foi entregue em Janeiro de 2017, estando este processo ainda em apreciação pelo Banco Central à data destas demonstrações financeiras.
Segundo o referencial contabilístico e a lei vigente no sector bancário, o aumento de capital só poderá ser subscrito ( e posteriormente realizado) pelo novo accionista após aprovação das autoridades competentes, nomeadamente, o Regulador e o Estado Angolano.
Assim, esta deliberação não teve qualquer reflexo nas presentes demonstrações financeiras.
Transição para as Normas Internacionais de Reporte Financeiro (IFRS)
Impacto da conversão nas contas do BANC
As Demonstrações Financeiras do BANC foram preparadas de acordo com os princípios contabilísticos estabelecidos pelo Plano de Contas das Instituições Financeiras (‘CONTIF’) conforme definido no Instrutivo nº 09/07, de 19 de Setembro, do BNA e actualizações subsequentes, nomeadamente a Directiva nº 04/DSI/2011, que estabelece a obrigatoriedade de adopção das Normas Internacionais de Relato Financeiro (‘IFRS – International Financial Reporting Standards’) em todas as matérias relacionadas com procedimentos e critérios contabilísticos que não se encontrem estabelecidos no CONTIF.
DEPÓSITOS
2015
Moeda nacional Moeda estrangeira Total
Depósitos à ordem 10 106 965 1 452 505 11 559 470
Depósitos a prazo 6 279 288 1 247 373 7 526 661
Outros depósitos 75 994 3 224 79 218
Captações para liquidez 13 051 602 271 851 13 323 453
Obrigações no sistema de pagamentos 304 469 60 746 365 215
Operações cambiais
Outras obrigações 409 251 24 734 433 985
Provisões para responsabilidades prováveis 31 249 - 31 249
Total do passivo 30 258 818 3 060 433 33 319 251
Activo/ (Passivo) líquido 5 612 973 172 483 5 785 456
Fundos Próprios 5 785 456
VALORES EM AKZ MILHARES
BANC — Relatório e Contas, 2016 111
No âmbito do processo de adopção das IFRS por parte das instituições financeiras em Angola, na sequência das orientações do BNA, e considerando os períodos definidos para a realização do processo de conversão, o BANC encontra-se a dar continuidade ao seu processo de conversão, estando a ultimar a avaliação do impacto qualitativo e quantitativo dos efeitos das eventuais diferenças de alteração de normativo contabilístico.
As entidades de supervisão e o “International Accounting Standards Board” (IASB) continuam a desenvolver normas que podem afectar as diferenças entre o CONTIF e as IFRS descritas nesta nota, bem como em diferenças nas Demonstrações Financeiras futuras.
Plano de conversão para as IFRS
O BANC iniciou em 2015 o seu plano de conversão com vista à preparação das suas demonstrações financeiras de acordo com as IFRS a partir de 1 de Janeiro de 2017, ou seja, com as primeiras demonstrações financeiras publicadas, de acordo com as IFRS, no início do ano de 2018, aquando da apresentação das contas do ano de 2017.
O plano definido pelo BANC visa igualmente acolher todos os relatórios intercalares solicitados pelo BNA no âmbito do processo de conversão.
Luanda, 31 de Março de 2017O Administrador Financeiro O Presidente do Conselho de Administração
www.banc.co.ao112

113BANC — Annual Report, 2016

ANNUALREPORT
2016ENG


1. MAIN INDICATORS 119
2. ECONOMIC ENVIRONMENT 122
3. ECONOMIC PERFORMANCE INDICATORS 132
4. RISK MANAGEMENT 135
5. BUSINESS AREAS 141
6. FIXED ASSETS 144
7. DEPARTMENT OF MEANS 146
8. DOMESTIC AND FOREIGN OPERATIONS 149
9. HUMAN RESOURCES 151
10. IT - DEVELOPMENT AND SECURITY 154
11. FINANCIAL ANALYSIS 156
12. ECONOMIC ANALYSIS 165
13. FINANCIAL STATEMENTS 170
14. EXTERNAL AUDITORS REPORT 173
15. AUDIT COMMITTEE REPORT 177
16. NOTES TO THE ACCOUNTS 181
BANC — Annual Report, 2016 117

1.MAIN
INDICATORS


DESIGNATION
2014 2015 2016
AKZ USD AKZ USD AKZ USD
Balance Sheet
Total Assets 28 807 282 280 055 39 104 708 288 990 46 357 623 279 426
Loans to Clients 11 981 694 116 482 13 253 802 97 948 11 708 981 70 577
Total Resources 20 093 468 195 342 32 488 802 240 098 39 624 653 238 842
Investment in Securities 1 513 377 14 713 1 251 884 9 252 683 838 4 122
Equity 5 561 181 54 064 5 785 456 42 755 3 751 680 22 614
Operating
Financial Margin 758 416 7 373 30 807 228 -1 551 552 -9 352
Supplementary Margin 2 501 315 24 317 3 812 702 28 176 2 386 960 14 388
Financial Intermediation Result 3 108 339 30 218 3 279 640 24 237 -1 081 921 -6 521
Administrative and Marketing Costs 1 999 716 19 441 2 957 127 21 854 4 041 198 24 359
Operating Income 1 113 495 10 825 381 345 2 818 -1 751 532 -10 558
Non-operating Income 133 591 1 299 -67 438 -498 27 863 168
Net earnings 872 960 8 487 219 734 1 624 -1 723 669 -10 390
Ratios
Solvency Ratio 19% 12% 8%
Loans to Customers/Customer Deposits 83% 69% 55%
Overdue/ Total Loans 2% 18% 28%
Return on Total Assets (ROA) 3% 1% -4%
Return on Equity (ROE) 16% 4% -45,94%
Cost to Income (Cust.Ad.Comer/Result.Inter.Financ)
54% 90% -374%
Other Indicators
No. Bank Branches 20 20 20
No. Representative OÌces 1 1 1
No. Employees 193 196 207
No. Customers 20 069 27 062 33 929
Equity/ Net asset 19,30% 15% 8,09%
AMOUNTS IN THOUSANDS
BANC — Annual Report, 2016 121
2.ECONOMIC ENVIRONMENT
2.1 INTERNATIONAL
During 2016, the world economy was characterized by a highly volatile growth line, oscillating between periods of high productivity and periods of great contraction in wealth creation. This scenario had a strong impact on the strengthening of international trade activity, in the periods of greater political / social stability, framed by small valuations of raw materials, with special emphasis on the oil market. On the other hand, the loss of investores’ confidence in the policies of financing and credit to the economy in low-value environment of financial assets in the main world stock exchanges, such as the New York, Tokyo and London stock exchanges, significantly aÎected the creation of employment, and start-ups, business investment and the creation of value for their economies. This situation has been potentiated by negative factors such as Brexit.
2.1.1 DEVELOPED ECONOMIESThe growth forecast for developed economies for 2017 is 1.9%, which is equivalent to the stagnation of the economy, as in 2015 the level of economic growth in developed economies was precisely the same (1.9%). A major contributing factor to that is the performance of the economies of the United States, the United Kingdom, Canada and Japan. The United States grew by 3.2% in 2016, surpassing the 2015 growth by 0.3%. The United Kingdom reported a 0.3% decline from the 2.2% growth in December 2015, revealing an economy in recession, suÎering from the uncertainty environment and some political / economic commotion around Brexit. Since 2008, Japan has been dragging on with an economy that ranges from a recession to a stagnation. This can be seen from the 2016 economic growth of 0.5%, which was also achieved in the previous year.
2.1.2 EURO AREAThe Organization for Economic Co-operation and Development (OECD) report concluded that in 2016 the economic performance of the European continent was weak. However, the Eurozone observed a growth of 0.3% in the Gross Domestic Product (GDP) in the first quarter of 2016, compared to the same period of the previous year, rising the region’s wealth production to 1.7%. This stage of greater expansion of the GDP growth had its basis of the increase in exports of goods in the industries sectors, and in a lesser extent on the services sectors, which resulted from a weaker Euro, from an increase demand for services exports, such as tourism and travel to the Eurozone. In this respect, the highlights were to the four largest Euro economies, such as Spain, where the Purchasing Managers’ Index (PMI) rose 55.5 percent in the first quarter of 2016, followed by Germany with 55.2 percentage points. In France, the PMI advanced to 53.1 percent and in Italy to 55.2 percentage points.
The European Union’s statistics agency, Eurostat, reported that the GDP of the 19 countries grew by 0.3% in June, representing a slowdown compared to the same period of the previous year, where GDP growth stood at 0,6%. This phase of lower economic growth of the Euro Zone coincided with the rise in unemployment, inherited from the 2008 crisis, with high public and private debt, problems resulting from the high credit risk of European banks, with a policy of greater control and rising interest rates by the European Central Bank
BANC — Annual Report, 2016 123
and the impact of the refugee problem, leading to increased security concerns, contributing to a climate of greater uncertainty, with strong repercussions on investment, productivity and reform policies.
The third and fourth quarters of the year observed a moderately positive performance, with Eurozone economic growth more discrete between July and September, taking into account the pressure’s impact of the United Kingdom exit from the European Union. This resulted in a growth of 0.3% over the same quarter of the previous year. The fourth quarter was much better in terms of growth, raising the GDP to 3.9%.
2.1.3 UNITED KINGDOM’S EXIT FROM THE EUROPEAN UNION - BREXIT The exit of the United Kingdom from the European Union caused panic in the British real estate market, where after several years of full growth, signs of instability had begun to come about. As a result, major English real estate investors have demanded the return of their investments to the four real estate investment funds, which ensure the success of investments in real estate, guaranteeing the return of capital and profits from businesses conducted in the English real estate market. Standard Life, Aviva Investors, Henderson Global Investors and M & G Investments together move GBP 9 billion of assets in commercial real estate. Nevertheless, they were unable to generate the return on investment to the main real estate investors, and were forced to temporarily close their activity, causing a fall in the London Stock Exchange.
The British pound reached its lowest value against the US Dollar in 31 years, posting a drop of 15% after the referendum. The devaluation of the sterling pound has significantly aÎected the budget of British households, reducing their purchasing power, contributing to lower growth of consumption and domestic demand. For this reason, job creation has declined about a half, even though the unemployment rate has dropped to 5%, the lowest in the last 11 years.
On the other hand, the devaluation of the sterling pound in the exchange market favoured the exporting goods companies, since their exported products became more competitive in the European space market, which had a positive impact on the British trade balance. The transport sector, however, was the exception, with a 0.8% decline in the car sales volume, which would result from the uncertainty to how should be made the United Kingdom’s access to the Single Market.
2.1.4 EMERGING ECONOMIESEmerging Economies performed positively in 2016, globally speaking, as they accelerated to 4.3% of GDP. However, economic growth was not uniform in all countries, the Chinese economy continued to decelerate by 6.7% in December 2016, compared to 6.9% in the same period of last year. As in 2015, India continues to be the fastest growing country in the world, has been expanding by 7.6%, despite the eÎects of China’s slowdown.
The recession was the dominant feature of the economies of Latin America and the Caribbean, particularly Brazil whose economy was aÎected by a climate of political instability and social upheavals, coupled with public court proceeding
124 www.banc.co.ao
over some of the region’s largest oil production companies. Brazil is confronted with a high deficit of the public accounts, worsened by the mismanagement of fiscal resources and the increase of the public debt, which aÎected the process of economic expansion of the country, setting the retraction of the GDP by 3.3%. Emerging Middle East countries registered a slight expansion, which cannot have been more robust as the region was heavily aÎected by internal conflicts, geopolitical tensions and by the low price of oil, setting its growth at 2,9%. Russia is still in deep recession, which requires a balance and adjustment stance to the sanctions of the West and to the low oil prices, which is not conducive to economic growth. South Asia growth is not expected to be is 7.1% in 2016, reflecting a decline of 1.1% over 2015. In this region, household consumption has shown to be a stronger economic performance indicator.
2.1.5 LESS DEVELOPED ECONOMIESLow raw materials prices on the international market resulting in lower export earnings coupled with the lack of foreign exchange, low energy production and weak investor confidence have amputated the economic growth of the least developed countries. Venezuela struggled with a rampant inflation and a high unemployment rate, having suÎered a sharp GDP contraction of 9.7% in 2016. Angola, in turn, faces the challenge of adapting to low commodities prices, with particular emphasis on oil prices, alongside with an economic and foreign exchange crisis with strong repercussions on the volume of exports and with the general rise in the prices of staple basket products, leading to the stagnation of the economy.
Sub-Saharan Africa grew by 0.2%, setting its economic expansion at 1.4% of GDP. The region was aÎected by many internal conflicts, political instability, infectious diseases, large-scale terrorist attacks, scarcity of foreign exchange and the massive capital outflows were at the root of the diÌculty of consolidating policies and strategies to promote employment, productivity and increase of the supply of diversified products and services. Another factor of great concern, evident in the least developed countries, is the emigration pressure to Europe and other more developed countries, which reduced the working population.
2.1.6 EXCHANGE MARKETThe international exchange market was highlighted by the strong US Dollar appreciation against the main transaction currencies in the financial markets. For this reason, the annual average of EUR / USD in 2016 was 1.11, the same as in 2015, which was the lowest average of the past years. The “Trump” factor may be decisive for the parity between the US Dollar and the Euro, the expected average is 1.05 (EUR / USD). This points to the good moment the US economy is experiencing since the second quarter of 2015. The DXY dollar index in respect of the currencies basket composed by the Euro, the Yen, the British Pound, the Swiss Franc, the Canadian Dollar and the Swedish Crown, determined at the beginning of 2016, an advantage for the US Dollar of 99 points, which gradually rose above 100 points at the end of last year. The US Dollar will continue to appreciate against the Yen, going from current (JPY / USD) 115, to 120 yen per dollar.
BANC — Annual Report, 2016 125
2.1.7 UNEMPLOYMENTThe unemployment rate has declined in most of the countries of the world as a result of the expansion of the world economy consolidated during 2016. For this reason, the increase in investment in the most productive sectors of the world economy has increased productivity and the consequent export of products and services, with a strong impact on the job creation policy. The increase in households’ purchasing power resulted in an increase in domestic and foreign consumption, translating into the anchor of the consolidation of employment policies in the most productive economies. It is appropriate, within this framework, to highlight the unemployment rate recorded in the United States of America which was 4.7% of the working population, compared to the previous 4.80% of the preceding year. The unemployment rate in the Euro Zone, with the exception for Italy, was 9.6% against 12% in December 2015. Brazil and Italy verified an unemployment rate of 12%, similarly to what was observed in the previous year. The worst performing economies in this area are Djibouti, with an unemployment rate of 54%; South Africa, Republic of Congo, Angola and Palestine, all with an unemployment rate of 26%; and finally Lesotho, Macedonia, Greece, Equatorial Guinea, Montenegro, Gabon and Spain, with unemployment rates ranging from 25% to 18.5% of the working population.
2.1.8 RISKS AND PRECAUTIONS ABOUT THE WORLD ECONOMY The world economy suÎers from some risk situations that are of worrying importance. Firstly, we can highlight the consequences of Brexit, which could lead to a strengthening of levels of protectionism, political disruption and the spirit of independentism, which could jeopardize the European project. Elections in Germany could have a strong impact on the European economy in 2017. The fragility of European banking, especially the Italian banking system, coupled with the volume of doubtful debt collection, are a major risk factor for the world economy.
As one of the countries with the greatest economic power in the world, China’s rough structure and economic slowdown, in line with the adjustments of emerging economies to the strong global economic changes, foreshadow a high uncertainty environment that will lead to severe risks. A risk factor for generalized economic instability is the maintenance of low raw materials prices, as both developing and emerging countries rely heavily on exports to consolidate and expand their economies. Finally, we highlight the consequences of the “Trump” eÎect on the wider global economy. It becomes really worrisome the American Federal Reserve (Fed) interest rate management policy, which may strengthen the US Dollar against the major reference currencies in the international exchange market, making credit more expensive and repayment of credit much harder. This scenario points to the risk of a “credit bubble” that could lead, among other things, to the collapse of the American economy, with unpredictable consequences for the world economy.
With all the risk factors mentioned above, the global economy has been consistently slowing its economic growth, having set its evolution in 3% in December 2016, against 3.1% in the same period of 2015.
126 www.banc.co.ao
2.2 DOMESTIC
Since 2007, the Angolan economy has been debating with a slowdown in the growth of its Gross Domestic Product (GDP), which is a fact that precedes the great real estate crisis that broke out in the United States of America in 2008. At the base of this path is undoubtedly the progressive fall in prices of raw materials in international markets. Thereunder, we can highlight the oil price drastic reduction, which had strong consequences on the decrease of revenues, lower foreign currency supply, the necessary containment of the State’s expenditure and a lesser stimulus in the economy. The framework generated by this was a strong reduction of imports, with impact on the reduction of the capacity of production of the companies that were more dependent of them to sustain the production, resulting in a great number of bankruptcies.
The smaller volume of imports forced domestic companies to a greater financial eÎort to cover the importation of its commercial products, which resulted in the increase of its selling price, contributing significantly to the rise of prices. The Angolan households’ purchasing power suÎered a sharp decline to rising inflation at the end of the year 2016. This scenario has triggered the need to focus on the diversification of the economy as one of the ways to combat poor productivity, recovering domestic production and creation of more jobs.
According to the International Monetary Fund (IMF), the levels of Angolan public debt are reaching unsustainable limits, since, according to the calculations of that entity, the ratio of public debt to GDP reaches 70%. This has been a major concern for the Angolan State, which in a scenario of low revenues, has run up debts in the banking system. This has put the State to large commitments for future generations and the inevitability of a fiscal austerity policy.
The IMF points to a 3.5% growth rate for the Angolan economy in 2016, minus 0.7% when comparing with 2015. This performance shows that the economy of Angola is slowing. The diÌculties experienced by the Angolan State in implementing eÎective economic policies capable of minimizing excessive bureaucracy, creating an environment conducive to private investment and establishing business, strengthening the rule of law, improving physical infrastructures and human capital have led to the IMF to predict the stagnation of economy in 2017.
2.3 INFLATION
The expected inflation rate by the IMF for Angola for the first half of 2016 stood at 19.2% and in the following year at 14%. However, the dynamics of the evolutions of staple basket prices have forced the International Monetary Fund to revise its forecasts by the end of the year. For this reason, the IMF adjusted its inflation rate forecast to 48% in 2016 and 32% in 2017.
For 2016, the data provided by the BNA (Banco Nacional de Angola) regarding the monthly and accumulated inflation rate in the last four months of the year, reveal an average rate around 2.06%. In the previous eight months, inflation levels were always higher, with the average monthly inflation rate being 3.42%. With this upward trend, the accumulated inflation rate rose from 14.27% in 2015 to 41.95% in 2016.
BANC — Annual Report, 2016 127
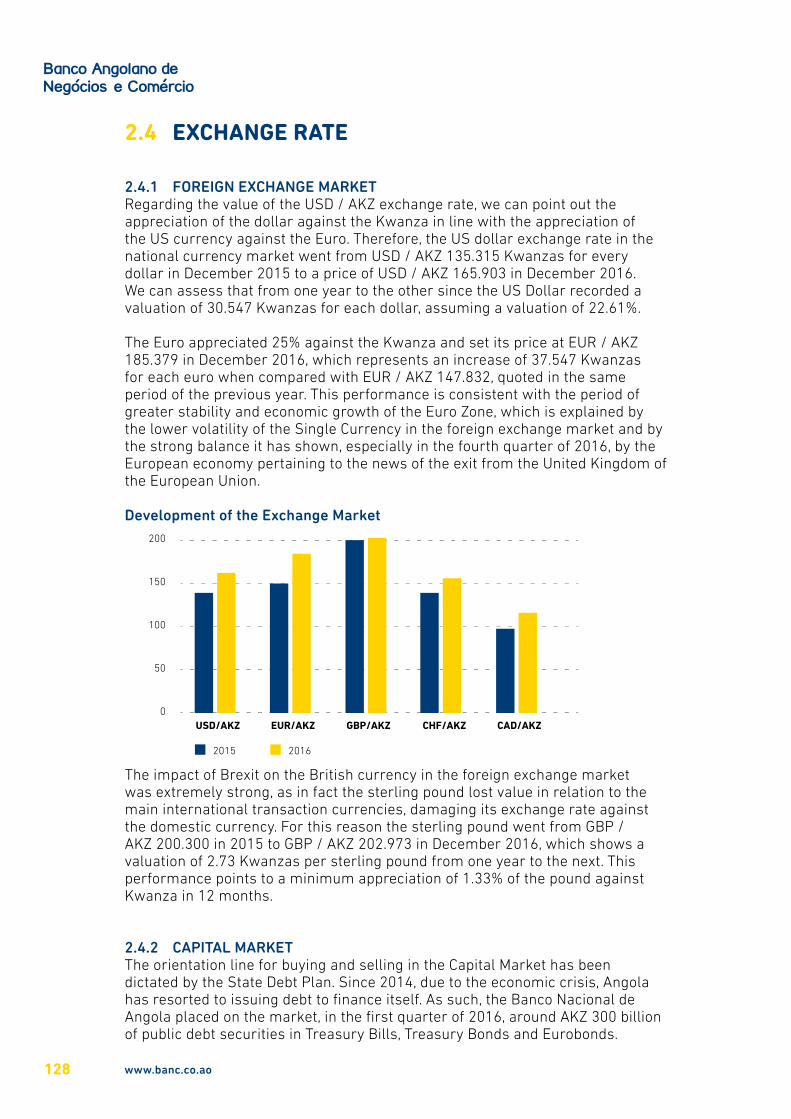
2.4 EXCHANGE RATE
2.4.1 FOREIGN EXCHANGE MARKETRegarding the value of the USD / AKZ exchange rate, we can point out the appreciation of the dollar against the Kwanza in line with the appreciation of the US currency against the Euro. Therefore, the US dollar exchange rate in the national currency market went from USD / AKZ 135.315 Kwanzas for every dollar in December 2015 to a price of USD / AKZ 165.903 in December 2016. We can assess that from one year to the other since the US Dollar recorded a valuation of 30.547 Kwanzas for each dollar, assuming a valuation of 22.61%.
The Euro appreciated 25% against the Kwanza and set its price at EUR / AKZ 185.379 in December 2016, which represents an increase of 37.547 Kwanzas for each euro when compared with EUR / AKZ 147.832, quoted in the same period of the previous year. This performance is consistent with the period of greater stability and economic growth of the Euro Zone, which is explained by the lower volatility of the Single Currency in the foreign exchange market and by the strong balance it has shown, especially in the fourth quarter of 2016, by the European economy pertaining to the news of the exit from the United Kingdom of the European Union.
Development of the Exchange Market250
200
150
100
50
0
2015 2016
USD/AKZ EUR/AKZ GBP/AKZ CHF/AKZ CAD/AKZ
The impact of Brexit on the British currency in the foreign exchange market was extremely strong, as in fact the sterling pound lost value in relation to the main international transaction currencies, damaging its exchange rate against the domestic currency. For this reason the sterling pound went from GBP / AKZ 200.300 in 2015 to GBP / AKZ 202.973 in December 2016, which shows a valuation of 2.73 Kwanzas per sterling pound from one year to the next. This performance points to a minimum appreciation of 1.33% of the pound against Kwanza in 12 months.
2.4.2 CAPITAL MARKETThe orientation line for buying and selling in the Capital Market has been dictated by the State Debt Plan. Since 2014, due to the economic crisis, Angola has resorted to issuing debt to finance itself. As such, the Banco Nacional de Angola placed on the market, in the first quarter of 2016, around AKZ 300 billion of public debt securities in Treasury Bills, Treasury Bonds and Eurobonds.
128 www.banc.co.ao
The public debt stock reached USD 42.9 billion in 2015, equivalent to EUR 39 billion, corresponding to 48.7% of the Gross Domestic Product. Interest on domestic debt will cost the state safes more than AKZ 261,873 million, equivalent to USD 1,578 million, while interest on debt owed abroad will cost the Angolan State about AKZ 222,284 million, equivalent to USD 1,339 million. At the end of the first quarter of 2016, the Banco Nacional de Angola placed on the primary market AKZ 74.6 billion (USD 449.6 million) in Treasury Bills (T-Bills) and AKZ 17.2 billion (EUR 97.7 million) in Treasury Bonds (T-Bonds). The average interest rates on T-Bills issues ranged from 14.36% to 17.12% for maturities of 91 and 364 days respectively, while the T-Bonds closed with interest rates ranging from 7% to 7.77%, for the same maturities. In the direct sales of securities to the public segment, in the last week of March 2016, the Banco Nacional de Angola sold around AKZ 1.7 billion, equivalent to EUR 9.7 million.
At the end of December 2016, the Banco Nacional de Angola issued AKZ 44.6 million, equivalent to EUR 257.1 million in Treasury Bills and AKZ 26.4 billion, equivalent to EUR 152.2 million in Treasury Bonds. In the last week of the year, the BNA issued public debt securities, amounted AKZ 70,791 million, equivalent to EUR 379 million in Treasury Bills and AKZ 22,266 million, equivalent to EUR 119.2 million in Treasury Bonds. As a result, the total stock of Angolan debt in 2016 reached AKZ 1,654.1 billion, in line with the 2015 State General Budget. It is noteworthy that in 2016 the State issued debt equivalent to 2.2 thousand million, corresponding to AKZ 402.750 million in Treasury Bonds for the payment of overdue public expenditures since 2013.
According to the Centro de Estudos e Investigação Científica da Universidade Católica (CEIC), the stock of public debt may reach 75% of GDP in 2017. According to data provided by the Ministry of Finance, the stock of public debt will fall to the 52.7% of GDP. However, the Angolan State Debt Annual Plan foresees for this year debt needs of about AKZ 4.667 billion, equivalent to USD 28.1 billion to finance the expenses foreseen in the General State Budget for 2017.
To fulfil this objective the State intends to end the monopoly of the national banks as exclusive investors of the bond market. In 2017 the State intends to broaden the investor base in the public debt financing contest. In addition to the Angolan banks, there are other institutions with an enthusiasm for investment that may contribute to the purchase of government debt. For this reason, the State intends to count on the participation of the Pension Funds, Insurance Companies and other funds. According to the Agência Lusa, for the year 2017, the State expects to issue Treasury Bills in the amount of AKZ 1,568 billion (USD 9.4 billion), and Treasury Bonds 1,803 billion (USD 10.8 billion). It will therefore be on this basis that the Angolan debt stock will be increased, which is consistent with the analysis and prediction of the CEIC Coordinator.
The Angolan Net International Reserves (NIR) for import coverage and debt coverage of the Angolan state fell by 12% from USD 24,266 million, equivalent to EUR 22,905 million in December 2015 to USD 21,399 million, equivalent to EUR 20,204 million in 31 December 2016. This translates into a loss of USD 2,867 million, equivalent to EUR 2,706.8 million. The value of NIRs in 2016 allowed Angola to cover approximately 7 months of imports, which is clearly not enough to generate confidence in domestic investors.
BANC — Annual Report, 2016 129
2.5 INTEREST RATES
The rise in the inflation rate, as measured by the generalized rise in prices of staple basket products, coupled with the strong reduction in the volume of imports, in line with the substantial drop in oil revenues, was the basis of the meeting of the Monetary Policy Committee of the BNA (MPC) in December 2016. At this meeting the Fiscal, Monetary and External sectors were analysed in line with the world economy behaviour. From this generic analysis of the national economy in the international context resulted the following decisions:
× Maintain the Basic Interest Rate - BNA rate - at 16% per year;
× Maintain the Interest Rate of the Liquidity Lending Permanent Facility at 20% per year;
× Maintain the Interest Rate of the Liquidity Absorption Facility at seven days at 7.25% per year.
The Rediscount Interest Rate rose from 12.5% in December 2015 to 20% in the same period of 2016.
With regard to interest rates in the interbank market, liquidity-taking and liquidity-providing operations have become more attractive than transactions carried out on the capital markets.
In December 2016, the Luibor benchmark interest rate for the thirty-day operations was set at 17.41%, against the previous 11.44% in the same period of 2015, showing a positive evolution of 52%, which translates into an increase of 5.97 percentage points. For the 3-month operations, the reference rate Luibor was set at 18.23% in December 2016, against 11.88% in December 2015, which represents an evolution of 53.45%. The interest rate on the lending and liquidity operations for a period of 12 months grew by 57% from an interest rate of 12.84% in December 2015 to 20.17% in the same period of 2016.
The Angolan State highlighted Treasury Bills as they are short maturities, in which the return on capital applied is faster. Therefore, in December 2016, Treasury Bills with maturities of 91 days were traded at the interest rate of 16.38%, against 13.90% of the same period of the previous year. In the same period, Treasury Bills with a maturity of 182 days were traded at the interest rate of 23.92%, against 14.95% in December 2015. So, we can conclude that the return of the applied capital interest rates observed an evolution between 18% and 60% for longer-term maturities.
National Treasury Bonds were traded at a lower volume than Treasury Bills. Investors have preference for Treasury Bills as Treasury Bonds are medium-term compensation bonds, which in the current context of economic crisis and cost containment are not so attractive to investors. The Treasury Bonds with maturities of two, three, four and five years were traded at interest rates of 7%, 7.25%, 7.50% and 7.75% respectively, as with the previous year.
130 www.banc.co.ao

Development of the Interbank Money Market interest rates
25,00%
20,00%
15,00%
10,00%
5,00%
0,00%
1 DAY
2015 2016
1 M 3 M 6 M 9 M 12 M
BANC — Annual Report, 2016 131
3.ECONOMIC PERFORMANCE INDICATORS
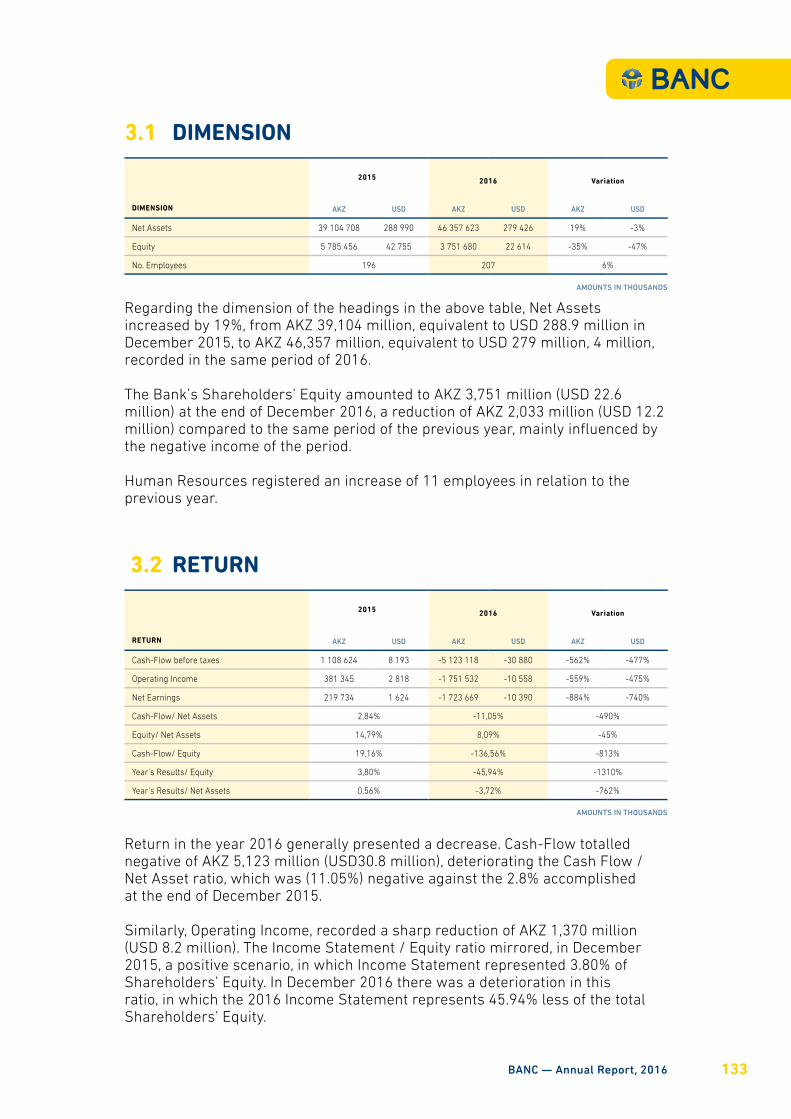
3.1 DIMENSION
DIMENSION
2015 2016 Variation
AKZ USD AKZ USD AKZ USD
Net Assets 39 104 708 288 990 46 357 623 279 426 19% -3%
Equity 5 785 456 42 755 3 751 680 22 614 -35% -47%
No. Employees 196 207 6%
AMOUNTS IN THOUSANDS
Regarding the dimension of the headings in the above table, Net Assets increased by 19%, from AKZ 39,104 million, equivalent to USD 288.9 million in December 2015, to AKZ 46,357 million, equivalent to USD 279 million, 4 million, recorded in the same period of 2016.
The Bank’s Shareholders’ Equity amounted to AKZ 3,751 million (USD 22.6 million) at the end of December 2016, a reduction of AKZ 2,033 million (USD 12.2 million) compared to the same period of the previous year, mainly influenced by the negative income of the period.
Human Resources registered an increase of 11 employees in relation to the previous year.
3.2 RETURN
AMOUNTS IN THOUSANDS
RETURN
2015 2016 Variation
AKZ USD AKZ USD AKZ USD
Cash-Flow before taxes 1 108 624 8 193 -5 123 118 -30 880 -562% -477%
Operating Income 381 345 2 818 -1 751 532 -10 558 -559% -475%
Net Earnings 219 734 1 624 -1 723 669 -10 390 -884% -740%
Cash-Flow/ Net Assets 2,84% -11,05% -490%
Equity/ Net Assets 14,79% 8,09% -45%
Cash-Flow/ Equity 19,16% -136,56% -813%
Year's Results/ Equity 3,80% -45,94% -1310%
Year's Results/ Net Assets 0,56% -3,72% -762%
Return in the year 2016 generally presented a decrease. Cash-Flow totalled negative of AKZ 5,123 million (USD30.8 million), deteriorating the Cash Flow / Net Asset ratio, which was (11.05%) negative against the 2.8% accomplished at the end of December 2015.
Similarly, Operating Income, recorded a sharp reduction of AKZ 1,370 million (USD 8.2 million). The Income Statement / Equity ratio mirrored, in December 2015, a positive scenario, in which Income Statement represented 3.80% of Shareholders’ Equity. In December 2016 there was a deterioration in this ratio, in which the 2016 Income Statement represents 45.94% less of the total Shareholders’ Equity.
BANC — Annual Report, 2016 133

3.3 PRODUCTIVITY AND EFFICIENCY
PRODUCTIVITY/ EFFICIENCY
2015 2016 Variation
AKZ USD AKZ USD AKZ USD
Net Assets/ No. Employees 199 514 1 414 223 950 1 350 12% -8%
Overheads/ Net Assets 7,56% 8,72% 15%
AMOUNTS IN THOUSANDS
Productivity expressed in the ratio between Net Assets / Number of Employees, reflects a 12% increase over the value reached in December 2015. Thus, the result of the ratio increased from AKZ 199.5 million (USD 1.5 million), to AKZ 223.9 million (USD 1.3 million). This result is due to the growth of the Bank’s Net Assets, which increased by 19% in December 2016.
EÌciency has observed a behaviour contrary to what has been demonstrated in terms of productivity. The increase in the Structure Costs weight over Net Assets translated into a growth of 8.72% in relation to the same period of the previous year.
3.4 PRUDENTIAL
PRUDENTIAL
2015 2016 Variation
AKZ USD AKZ USD AKZ USD
Solvency Ratio 12% 8% -31%
The Solvency Ratio fell by 31% at the end of December 2016 standing at 8%. The observed behaviour is mainly due to the reduction of Equity.
134 www.banc.co.ao

4.RISK
MANAGEMENT
135BANC — Annual Report, 2016
During the 2016 activity, the Risk Management OÌce (RMO) presented the following initiatives:
a. The Proposal of the organizational and methodological structure:
It is based on the following vectors: (i) Identification of the main risks. In this sense, the RMO produced self-evaluation questionnaires; (ii) Identification of risk “levels”, consubstantiated in indicators; (iii) Development of methods of “measurement” and “capture” of events; (iv) Production of reports.
b. Elaboration of the documentation that incorporates the infrastructure indicated in the previous point.
Were presented the following normative documents: × Risk Management Manual;
× BANC Risk Management Policies;
× Risk Assessment and Control Methodologies (RACM);
× Risk Categories Assessment Model;
× Risk Control Categories Assessment Model;
× Solvency and Liquidity Evaluation Model;
Particular attention has been paid to the document “Solvency and Liquidity Assessment Model”, as it is the risk levels where the “risk appetite” of our institution is defined. The RMO considers that the full implementation of this document depends on the adoption of a computer tool that will equip the OÌce with resources to measure risk events.
The following documents were also produced: × BANC Credit Risk Management Policies;
× Risk Management OÌce - Mission, Structure, Functioning and Skills;
× Internal Control Manual;
× BANC Credit Regulations.
The impact of this group of documents in the Credit area is part of the RMO’s assessment of the risks that may potentially cause the Bank’s capital to be more burdensome.
In this sense, it was considered that the new Credit Regulation is a structuring document. The main change that is being introduced is the adoption of a credit rating model, based on a model with criteria that already incorporate some IAS 39 notions, that is, by negatively weighting the restructured credits and those without real guarantees or existing without being evaluated.
136 www.banc.co.ao
The following Risk Reports produced by the RMO were submitted to the Risk Management Committee:
× Credit Risk Assessment Report;
× Market and Liquidity Risk Assessment Report;
× Operational Accounting Function Risk Assessment Report;
The Risk Management Committee, considering the constraints to the function resulting from the legislative pressure that has become more evident, decided to propose to the Board of Directors the allocation of one more employee to the Risk Management area.
The support document “Situation Report - Compliance Function”, presented by the Compliance OÌce, was revised.
It was decided that Compliance and Reputation risks fall under the responsibility of the Risk Management Committee.
Regarding Compliance Risks, attention should be paid to the following points: × Compliance with laws and regulations - It seeks to determine the
possibility of incurring losses due to (i) non-compliance with the rules governing the institution’s activity, including prudential rules; (ii) violation of other laws or regulations.
× Compliance with codes of conduct, established practices or ethical principles - Is intended to determine the possibility of incurring losses due to violations of codes of conduct, established practices or ethical principles.
× Responsibility towards third parties - Addresses the risk of incurring penalties for damages caused to third parties, namely due to (i) negligent or intentional behavior; (ii) an inappropriate relationship with customers; (iii) non-performance of contracts or other commitments; (iv) breach of the duty of secrecy.
× Degree of transparency - Determines the risk associated with a lesser degree of transparency in the activity of the institution and in particular in the transactions carried out.
× Involvement in money laundering - Determines the institution’s risk of being involved in money laundering
× Regarding Reputational Risk, the following points are under the responsibility of the Risk Management Committee:
× Market perception - It is intended to determine the possibility of a negative perception of the public image of the institution by the market (counterparts, customers, employees, investors, press agencies, the general public).
It was decided to request an evaluation of the Money Laundering and Anti-Terrorist Financing Provisions system to be conducted by an external entity.
BANC — Annual Report, 2016 137

The Risk Management Committee proposed, in accordance with the Notice 7/2016 of June 22, which areas of risk should merit greater prioritization by the end of the year and to the year 2017. This action is considered itself as a risk assessment.
Due to the exposure of the assets and in order to protect them, the Risk Management Committee considers the following areas to be:
Very High Risk (Material Risks): × Credit; × Liquidity and Capital Management (Markets);
High Risk; × Markets (Interest Rate and Foreign Exchange Rate); × Operational;
Observation risk: × Compliance; × Strategy.
The Risk Management Committee presented an explanation of the latest “pieces of legislation” issued by the BNA, with a foreseeable impact on the Bank’s equity. We refer to the following:
× Notice 2/2016, of June 15 - Regulatory Solvency Ratio. This legislation that introduces ICAAP (Internal Capital Adequacy Assessment Process) in the Angolan financial system, comes to consider the Regulatory Equity to the credit, market and operational risk;
× Instruction 18/2016, of 8 August - Provision of information on the composition of Equity and Solvency Ratio;
× Notice 3/2016, of June 6 - Credit Risk;
× Instruction 13/2016, of 8 August - Provision of information on regulatory capital requirement for credit risk and counterparty credit risk;
× Instruction 12/2016, of 8 August - Calculation and regulatory capital requirement for credit risk and counterparty credit risk;
× Notice 4/2016, of June 22 - Market Risk;
× Instruction 14/2016, of 8 August - Calculation and regulatory capital requirement for market risk and counterparty credit risk in the trading book;
× Instruction 15/2016, of 8 August - Provision of information on capital requirement for market risk and counterparty credit risk in the trading book;
138 www.banc.co.ao

× Notice 5/2016, of June 22 - Operational Risk;
× Instruction 16/2016, of 8 August - Calculation and regulatory capital requirement for operational risk;
× Notice 7/2016, of June 22 - Operational Risk;
× Notice 8/2016, of June 22 - Interest Rate;
× Notice 9/2016, of June 22 - Great Risks;
× Instruction 19/2016, of August 30th - Liquidity Risk;
× Notice 6/2016, of June 22 - IFRS;
× Instruction 5/2016, of 8 August - Impairment losses on the loan portfolio;
× Instruction 11/2016, of 8 August - Treatment of losses in the loan portfolio;
× Instruction 6/2016, of 8 August - Disclosure of financial instruments;
× Instruction 7/2016, of 8 August - EÎective interest rate method for the recognition of income and expenses of financial instruments;
× Instruction 8/2016, of 8 August - Locations;
× Instruction 9/2016, of August 8 - Securities;
× Instruction 10/2016, of August 8 - Employee Benefits;
× Instruction 20/2016 of 6 September - First-time adoption of international financial reporting standards;
Special attention is given to the Capital and Liquidity issue, awaiting measures to strengthen the Bank’s Equity.
Annex III of the Report on Internal Control and Corporate Governance has a perspective on the risks highlighted. It should be noted that the full analysis of this report was made in the Audit Committee. In this regard, the main risks listed in Annex III (internal control deficiencies) were observed.
Action Plan on material risks (Credit Risk and Liquidity and Capital Risk).
The Risk Management Committee presented the adoption of measures to mitigate credit risk, mainly through the intensification of credit recovery actions with signs of impairment. The actions should be conducted by the Credit Directorate in close cooperation with the commercial areas. The focus should be on strengthening collaterals, collecting relevant quantitative information to credit risk analysis, and developing real guarantees valuations.
BANC — Annual Report, 2016 139
The Credit Directorate must adopt the restructured credit module and integrate this information into the risk analysis.
The Credit Directorate and the Risk Management Committee should participate in the adoption of the KIWI application on the calculation of impairments.
Following the explanation of the most recent “pieces of legislation” with an impact on banking activity, the RMO presented the reports on the risk-weighted Regulatory Solvency Ratio (Notice 2/2016) and on Interest Rate Risk (Notice 8/2016).
The Risk Management Committee will have the task of proposing mitigation measures and coordinate their implementation whenever the results of the reports presente a risk of impact on shareholders’ equity.
140 www.banc.co.ao

5.BUSINESS
AREAS
141BANC — Annual Report, 2016
5.1 CLIENT PORTFOLIO
In strategic terms, the Bank has maintained a commercial policy based, among other things, on sustained growth in the number of clients and the deposit portfolio in terms of volume. Another aspect that should be highlighted is the work of fostering the financial literacy of our clients. This work is carried out day-to-day in the personal relationship with our commercial managers and the entire service line. We believe that attracting business only makes sense when products and services really serve customers and bring them economic and social benefits, including the savings culture. Another stake of the Bank has been the continued segmentation of its customer base.
The Bank places special emphasis on integrated and connected commercial work that brings together the commercial, marketing, organization and processes areas, seeking to find financial solutions tailored to the needs of customers. We highlight the BANC Super Opportunity deposit as well as a set of end-of-year promotional rates added to other savings products.
This action to search for internal synergies aimed at customer satisfaction resulted in a 25.4% increase in the number of customers, representing 6,867 new customers, of which 6,531 are private customers and 336 companies, reaching a total of 33,929 customers at the end 2016.
This customer portfolio is distributed geographically through 6 provinces of Angola and 2 representative oÌces, one in Portugal and the other in Brazil.
5.2 DEPOSIT PORTFOLIO (INDIVIDUALS AND COMPANIES)The deposit portfolio grew by 11% compared to 2015 due to a situation that was not conducive to the creation of savings by households or by companies’ cash reserves. Also, a greater contraction of the foreign exchange business explains a smaller strength of the capture of new resources. This forced a change in the paradigm of the banking business that prevailed until the beginning of the oil crisis, which was based largely on the foreign exchange component in detriment of the capture of savings and reserves for investment in the economy.
5.3 LOANS TO CLIENTS
The customer loan portfolio was significantly aÎected by the slowdown of the economy, having fallen by 11% over 2015. Tighter prudential regulation also forced the Bank to adopt a more restrictive management policy. Thus, the attention of the Bank focused on the restructuring and recovery activity. This new reality has brought enormous challenges to banking activity, with a consequent positive eÎect on the consolidation of credit income. On the other hand, and not least, we believe that a more conservative policy regarding these assets will provide economic advantages in the medium term, through the lower allocation of own resources to provisions for doubtful loans and recognition of impairments.
142 www.banc.co.ao
One of the examples that well illustrates what was previously mentioned is the case of the government program Angola Investe, which in our Bank in 2016 had very little manifestation, despite the guarantee of the State that is associated with it. This is explained not only by adverse circumstances but also by the poor quality of the projects presented.
The total customer loan portfolio in 2016 amounted to AKZ 11,708 million, representing a contraction of 12% compared to 2015.
The Bank continues to focus on boosting its commercial area as the focal point of its growth strategy, both on the side of raising funds and managing credit. This must comply with economic and sustainable risk analysis assumptions. To this end our institution continues to invest in its commercial collaborators in order to equip them with the best professional skills. In this context we highlight the training programs for managers as well as sales technicians.
BANC — Annual Report, 2016 143
6.FIXED ASSETS

Since the start of the activity of the Banco Angolano de Negócios e Comércio in 2007, the largest growth in its agency network continues to be the one registered in 2009 with the opening of 5 agencies. Since then, this number has grown prudently due to the strategy adopted by the institution. In 2016 we registered the opening of the headquarters building, which includes a new agency in its facilities and the closure of a dependency in Lobito Port.
Currently the main action is to maintain and improve existing agencies, not neglecting new opportunities and implementing the plan to open new commercial stations, as soon as it is economically feasible, from a cost-benefit perspective.
In this plan, we highlight the opening of the agencies of Lubango II and Morro Bento.
BANC — Annual Report, 2016 145
7.DEPARTMENT
OF MEANS
Due to increased competition in the financial system in 2016, BANC worked to hold and retain its customers by oÎering them quality products and services. For this result was decisive the Marketing activity, since its main function was to promote the BANC brand as a reference bank at the national level. In this way, it was possible not only to satisfy customers, but also as an institution, to maintain dynamism and proactivity.
We also highlight the services oÎered by internet banking, as well as the personalized service that continues to be a distinctive mark of the Bank. We also continue to promote the BANC brand through publications in national and international newspapers and magazines. We have included in our media portfolio new channels such as the Exame Magazine, Sapo (Publications Online), Ledbox (Landing Room of the International Airport), Big Midia and Continental (rental of spaces - billboards).
7.1 MAIN TASKS CARRIED OUT OVER 2016
Within the Marketing objectives proposed for the current year, the following tasks were carried out:
1. Renewal of the contract with the company Espaços Para Publicidade;
2. Renewal of the subscription with the magazine Exame;
3. Maintenance of BANC communication campaigns in the cities of Luanda and Soyo;
4. Insertion of campaigns in Jornal de Angola and newspaper “O País”;
5. Signature of the agreement with the firm Sapo - Angola Online newspaper;
6. Conceptual development of the inaugural campaign of the BANC Headquarters;
7. Signature with Big Midia and Continental companies.
7.2 MARKETING PLAN FOR 2017
For the year 2017 Marketing proposes the creation of mechanisms that will continue to foster lasting relationships with its current and future clients, oÎering them segmented and quality products and services that are increasingly diÎerentiating. In order for this diÎerentiation to be possible, we must bet more and more on a personalized service based on the cross-selling strategy.
In the communication plan, given the current financial situation that the country has gone through, we intend to follow the BTL-Below the Line strategy (dissemination of our products and services through fairs, sponsorships,
BANC — Annual Report, 2016 147

internet, SMS, mobile). Although this type of action also contributes to brand awareness, its aim is above all to oÎer some kind of incentive, to obtain an immediate increase in sales (egg, account opening + application to term = possibility of international transfers to new clients). In this context, we will proceed throughout the year with the dissemination of our savings products in newspapers and above all digital channels. We also intend to create and disclose deposit products at maturity for funding throughout the year.
148 www.banc.co.ao
8.DOMESTIC
AND FOREIGN OPERATIONS
149BANC — Annual Report, 2016
The Angolan banking sector is experiencing a reduction in the volume of transactions, by a decrease in the quantity of imports and a decrease in the currencies placed in Central Bank auctions. In this context, BANC carried out a total of 6,940 domestic and foreign operations in 2016.
8.1 DOMESTIC OPERATIONS
The operations carried out in local currency were characterized from their frequency and the value and volume of operations, despite the context of less financial availability and devaluation of the national currency. However, BANC Bank handled a total of 2,150 checks in the amount of AKZ 4,575 million. Credit Transfer Services (CTS) also carried out 335 transactions totalling AKZ 1,765 million, subdivided into transfers received in the amount of AKZ 2,006 million, in exchange for AKZ 3,771 million in transfers.
The Real-Time Payments System recorded value inflows totalling AKZ 9,998 million, against outflows totalling AKZ 7,979 million, which resulted in a credit balance of AKZ 2,018 million.
8.2 Foreign Operations
In relation to foreign operations, BANC bank received operations in foreign currency totalling USD 104 thousand, reflecting a decrease of 26%. Transactions issued in dollars reflected a decrease of 60%, reaching 1,720 orders.
In relation to operations issued in Euros, 2,100 operations were carried out, an increase of 70% compared to the same period of the previous year.
8.3 FOREIGN EXCHANGE OPERATIONS
BANC bank recorded a total of 3,820 foreign exchange sales totaling USD 45.1 million.
8.4 MONEYGRAM, ATM AND POS OPERATIONS
In 2016 transactions sent from Moneygram totalled AKZ 91.7 million out of 1,977 transactions. During the same period, 3 ATMs were installed, totalling 53 units.
The total POSs at the end of 2016 was 926, and during the year 156 new payment devices were placed.
150 www.banc.co.ao

9.HUMAN
RESOURCES
151BANC — Annual Report, 2016
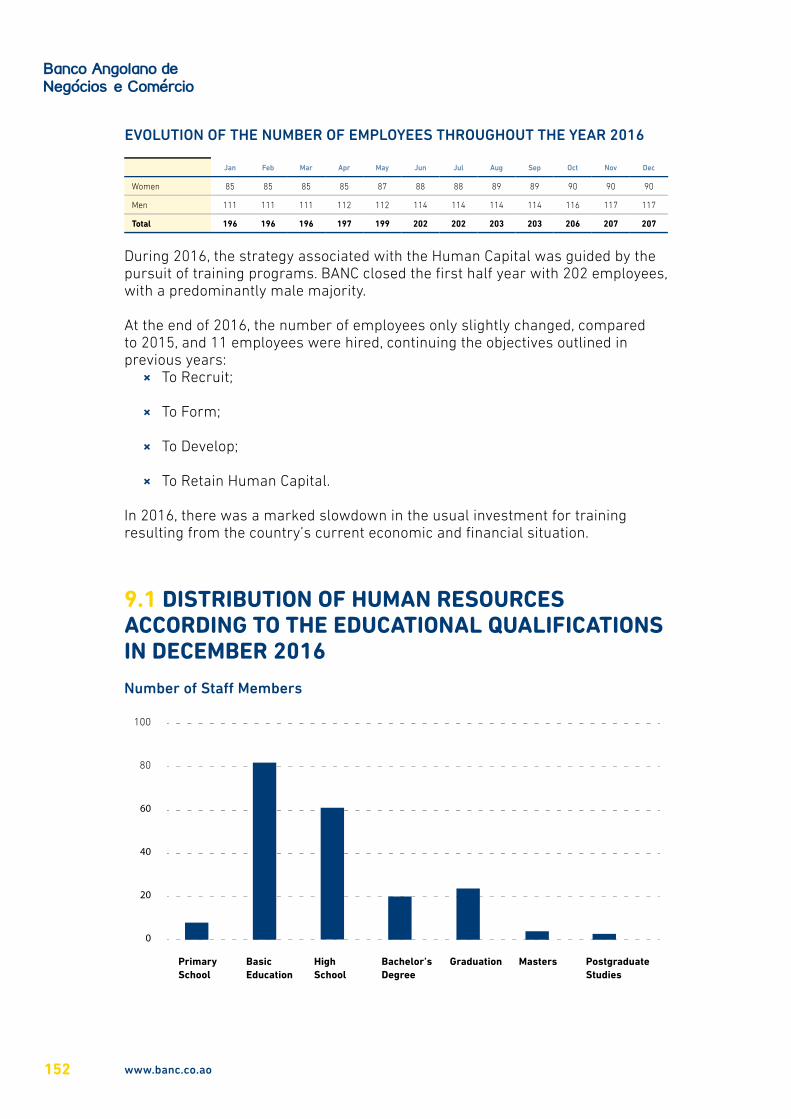
EVOLUTION OF THE NUMBER OF EMPLOYEES THROUGHOUT THE YEAR 2016
Jan Feb Mar Apr May Jun Jul Aug Sep Oct Nov Dec
Women 85 85 85 85 87 88 88 89 89 90 90 90
Men 111 111 111 112 112 114 114 114 114 116 117 117
Total 196 196 196 197 199 202 202 203 203 206 207 207
During 2016, the strategy associated with the Human Capital was guided by the pursuit of training programs. BANC closed the first half year with 202 employees, with a predominantly male majority.
At the end of 2016, the number of employees only slightly changed, compared to 2015, and 11 employees were hired, continuing the objectives outlined in previous years:
× To Recruit;
× To Form;
× To Develop;
× To Retain Human Capital.
In 2016, there was a marked slowdown in the usual investment for training resulting from the country’s current economic and financial situation.
9.1 DISTRIBUTION OF HUMAN RESOURCES ACCORDING TO THE EDUCATIONAL QUALIFICATIONS IN DECEMBER 2016
Number of Sta� Members
100
80
60
40
20
0
PrimarySchool
Basic Education
High School
Bachelor’sDegree
Graduation Masters PostgraduateStudies
152 www.banc.co.ao

9.2 DISTRIBUTION OF HUMAN CAPITAL BY AGE GROUPNumber of Staff Members
120
100
80
60
40
20
0
18 - 25 26 - 30 31 - 40 41 - 45 46 - 50 50 and up
BANC — Annual Report, 2016 153

10. IT - DEVELOPMENT AND SECURITY
10.1 DIRECTORATE FOR ORGANIZATION AND INFORMATICSDuring 2016, the Directorate for Organization and Informatics (DOI) coordinated the implementation of the following projects and initiatives:
1. Credit Restructuring and Guarantees Analysis;
2. Pelicano Project - MasterCard [BANKA / PEX Integration];
3. BANKA / SWIFT Integration Project;
4. Disaster Recovery Project Programs: × Quick-EDD; × Configuration and start-up of the Blade Infrastructure;
5. Ondango Projects Program - Talatona Headquarters × SP1 - Datacentre | Plan B - Technical Pole; × SP2 - Networking; × SP4 - Procurement.
10.2 DEVELOPMENT
The following regulatory initiatives were implemented by partners (EXICTOS) as well internally:
1. The Framework CEOB, to give treatment to the collection of the Special Mandatory Contribution, an initiative of the Angolan state, where Commercial Banks are the main partners;
2. Reformulation of the structure of the Maps of Needs and Operations Executed in Foreign Currency, BNA’s initiative with Commercial Banks;
Organizational need initiatives1. Maintenance Fee DO, for collection of maintenance / service fee in
the client’s account;
2. SAP DiÎerences, initiative resulting from the BANKA Integration Project and SAP with the objective of ending the existing diÎerences in SAP resulting from the integration of the interfaces;
3. Support Migration, initiative for monitoring and necessary settings to move to the new site.
BANC — Annual Report, 2016 155
11.FINANCIAL ANALYSIS
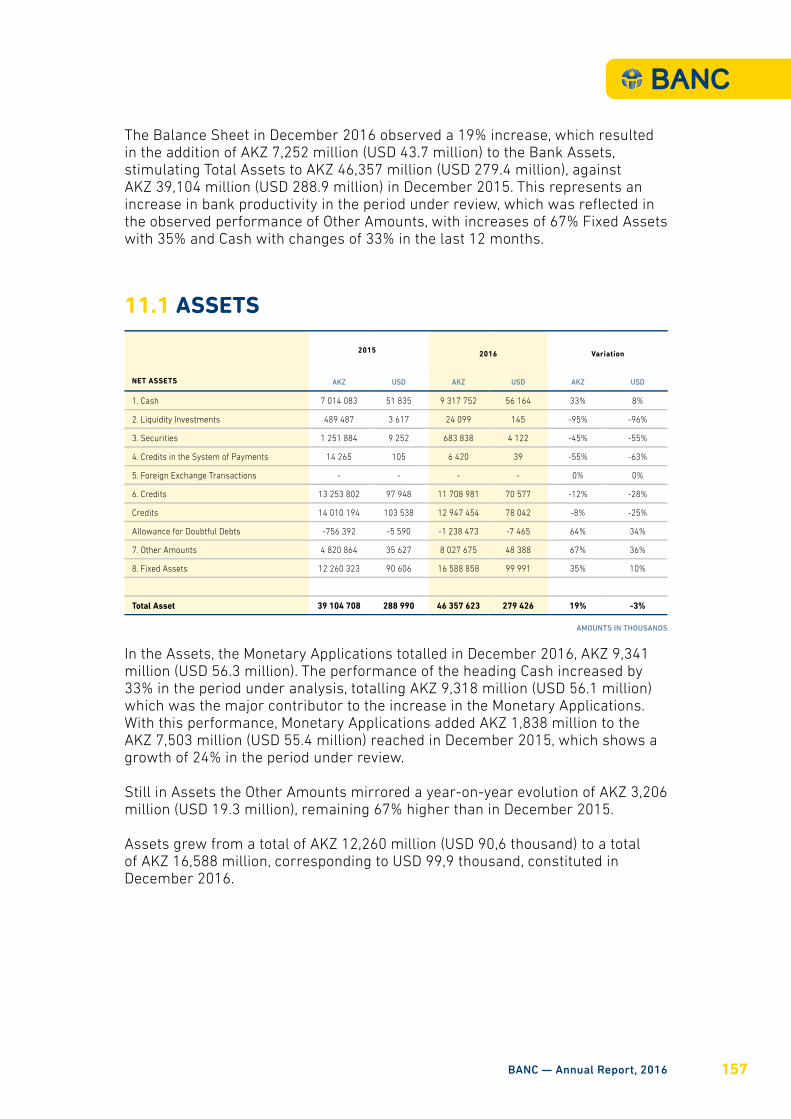
The Balance Sheet in December 2016 observed a 19% increase, which resulted in the addition of AKZ 7,252 million (USD 43.7 million) to the Bank Assets, stimulating Total Assets to AKZ 46,357 million (USD 279.4 million), against AKZ 39,104 million (USD 288.9 million) in December 2015. This represents an increase in bank productivity in the period under review, which was reflected in the observed performance of Other Amounts, with increases of 67% Fixed Assets with 35% and Cash with changes of 33% in the last 12 months.
11.1 ASSETS
NET ASSETS
2015 2016 Variation
AKZ USD AKZ USD AKZ USD
1. Cash 7 014 083 51 835 9 317 752 56 164 33% 8%
2. Liquidity Investments 489 487 3 617 24 099 145 -95% -96%
3. Securities 1 251 884 9 252 683 838 4 122 -45% -55%
4. Credits in the System of Payments 14 265 105 6 420 39 -55% -63%
5. Foreign Exchange Transactions - - - - 0% 0%
6. Credits 13 253 802 97 948 11 708 981 70 577 -12% -28%
Credits 14 010 194 103 538 12 947 454 78 042 -8% -25%
Allowance for Doubtful Debts -756 392 -5 590 -1 238 473 -7 465 64% 34%
7. Other Amounts 4 820 864 35 627 8 027 675 48 388 67% 36%
8. Fixed Assets 12 260 323 90 606 16 588 858 99 991 35% 10%
Total Asset 39 104 708 288 990 46 357 623 279 426 19% -3%
In the Assets, the Monetary Applications totalled in December 2016, AKZ 9,341 million (USD 56.3 million). The performance of the heading Cash increased by 33% in the period under analysis, totalling AKZ 9,318 million (USD 56.1 million) which was the major contributor to the increase in the Monetary Applications. With this performance, Monetary Applications added AKZ 1,838 million to the AKZ 7,503 million (USD 55.4 million) reached in December 2015, which shows a growth of 24% in the period under review.
Still in Assets the Other Amounts mirrored a year-on-year evolution of AKZ 3,206 million (USD 19.3 million), remaining 67% higher than in December 2015.
Assets grew from a total of AKZ 12,260 million (USD 90,6 thousand) to a total of AKZ 16,588 million, corresponding to USD 99,9 thousand, constituted in December 2016.
AMOUNTS IN THOUSANDS
BANC — Annual Report, 2016 157

11.1.1 SECURITIES PORTFOLIOTotal Financial Investments, including securities issued on the secondary market, decreased by 45% in 2016 to AKZ 683.9 million (USD 4.1 million) against AKZ 1,252 million (USD 9.3 million) of the previous year.
The Bank’s Securities Portfolio consists of 86% of National Treasury Bills, amounting to more than AKZ 585 million (USD 3.5 million), and 14% of National Treasury Bonds Indexed to the US dollar, with a maturity of two years. The remuneration rates for Treasury Bills were between 16.7% and 20.3%. The remuneration rate of Treasury Bonds Indexed to the US dollar is 7%. Interest rates on domestic Treasury Bonds were more attractive in 2016. However, they are far below the annual inflation rate, which stood at 41.95% at the end of 2016, against 24% of the highest interest rate, negotiated during the year 2016.
18 000 000,00
16 000 000,00
14 000 000,00
12 000 000,00
10 000 000,00
8 000 000,00
6 000 000,00
4 000 000,00
2 000 000,00
0,00
Cash
2015 2016
LiquidityInvestments
Securities Credits Other Amounts Fixed Assets
30,00%
25,00%
20,00%
15,00%
10,00%
5,00%
0,0091 days
2015 2016
182 days
Treasury Bills Treasury Bonds Non-readjustable Treasury
365 days 2 years 3 years 4 years 5 years 2 years
Development of Treasury Bills and Bonds interest rates
158 www.banc.co.ao
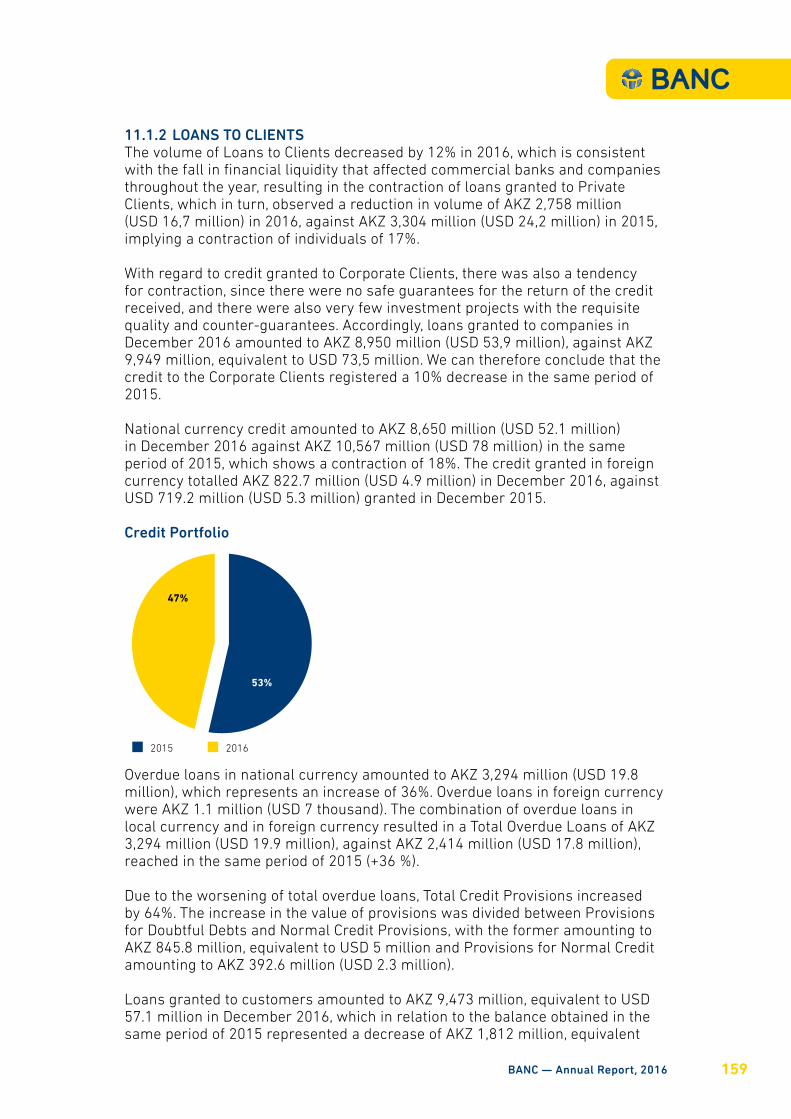
11.1.2 LOANS TO CLIENTSThe volume of Loans to Clients decreased by 12% in 2016, which is consistent with the fall in financial liquidity that aÎected commercial banks and companies throughout the year, resulting in the contraction of loans granted to Private Clients, which in turn, observed a reduction in volume of AKZ 2,758 million (USD 16,7 million) in 2016, against AKZ 3,304 million (USD 24,2 million) in 2015, implying a contraction of individuals of 17%.
With regard to credit granted to Corporate Clients, there was also a tendency for contraction, since there were no safe guarantees for the return of the credit received, and there were also very few investment projects with the requisite quality and counter-guarantees. Accordingly, loans granted to companies in December 2016 amounted to AKZ 8,950 million (USD 53,9 million), against AKZ 9,949 million, equivalent to USD 73,5 million. We can therefore conclude that the credit to the Corporate Clients registered a 10% decrease in the same period of 2015.
National currency credit amounted to AKZ 8,650 million (USD 52.1 million) in December 2016 against AKZ 10,567 million (USD 78 million) in the same period of 2015, which shows a contraction of 18%. The credit granted in foreign currency totalled AKZ 822.7 million (USD 4.9 million) in December 2016, against USD 719.2 million (USD 5.3 million) granted in December 2015.
Overdue loans in national currency amounted to AKZ 3,294 million (USD 19.8 million), which represents an increase of 36%. Overdue loans in foreign currency were AKZ 1.1 million (USD 7 thousand). The combination of overdue loans in local currency and in foreign currency resulted in a Total Overdue Loans of AKZ 3,294 million (USD 19.9 million), against AKZ 2,414 million (USD 17.8 million), reached in the same period of 2015 (+36 %).
Due to the worsening of total overdue loans, Total Credit Provisions increased by 64%. The increase in the value of provisions was divided between Provisions for Doubtful Debts and Normal Credit Provisions, with the former amounting to AKZ 845.8 million, equivalent to USD 5 million and Provisions for Normal Credit amounting to AKZ 392.6 million (USD 2.3 million).
Loans granted to customers amounted to AKZ 9,473 million, equivalent to USD 57.1 million in December 2016, which in relation to the balance obtained in the same period of 2015 represented a decrease of AKZ 1,812 million, equivalent
Credit Portfolio
2015 2016
47%
53%
BANC — Annual Report, 2016 159

to USD 10.9 million , indicating a contraction of credit granted to customers by the order of 16%. Total credit income, whether in local currency or in foreign currency, stood at AKZ 179.2 million, equivalent to USD 1 million, mirroring a decrease of 42% over the previous year.
2015 2016 Variation
AKZ USD AKZ USD Absolute (%)
1. Total Credit 13 253 802 97 948 11 708 981 70 577 -1 544 822 -12%
1.1 Customers 11 286 345 83 408 9 473 360 57 102 -1 812 985 -16%
Local Currency 10 567 062 78 092 8 650 631 52 143 -1 916 432 -18%
Foreign Currency 719 283 5 316 822 729 4 959 103 447 14%
1.2 Credit and Overdue Interest 2 414 505 17 844 3 294 813 19 860 880 308 36%
Local Currency 2 414 470 17 843 3 293 677 19 853 879 207 36%
Foreign Currency 36 - 1 136 7 1 100 3085%
Overdue Interest for Settling -1 - - - 1 -100%
2. Credit Income 309 344 2 286 179 281 1 080 -130 063 -42%
Local Currency 306 952 2 268 178 868 1 078 -128 084 -42%
Foreign Currency 2 392 18 413 2 -1 979 -83%
3. Total Credit Provisions -756 392 -5 590 -1 238 473 -7 465 -482 081 64%
3.1 Provisions Doubtful Debts -580 395 -4 289 -845 871 -5 099 -265 477 46%
3.2 Provisions Normal Credit -175 998 -1 301 -392 602 -2 366 -216 604 123%
4. Ratios
4.1 Credit / Deposits 69% 55% -21%
4.2 Overdue Loans / Total Credit 18% 28% 54%
4.2 Overdue Loans / Total Credit -6% -11% 85%
AMOUNTS IN THOUSANDS
Credit Development by Sector10 000,00
8 000,00
6 000,00
4 000,00
2 000,00
0,00
2015
Corporate
Private
2016
Development of Clients Credit
The Credit / Deposit ratio, which reflects a reduction in the total credit burden on the Deposit Portfolio, increased from 69% in 2015 to 55% in the same period of 2016.
160 www.banc.co.ao
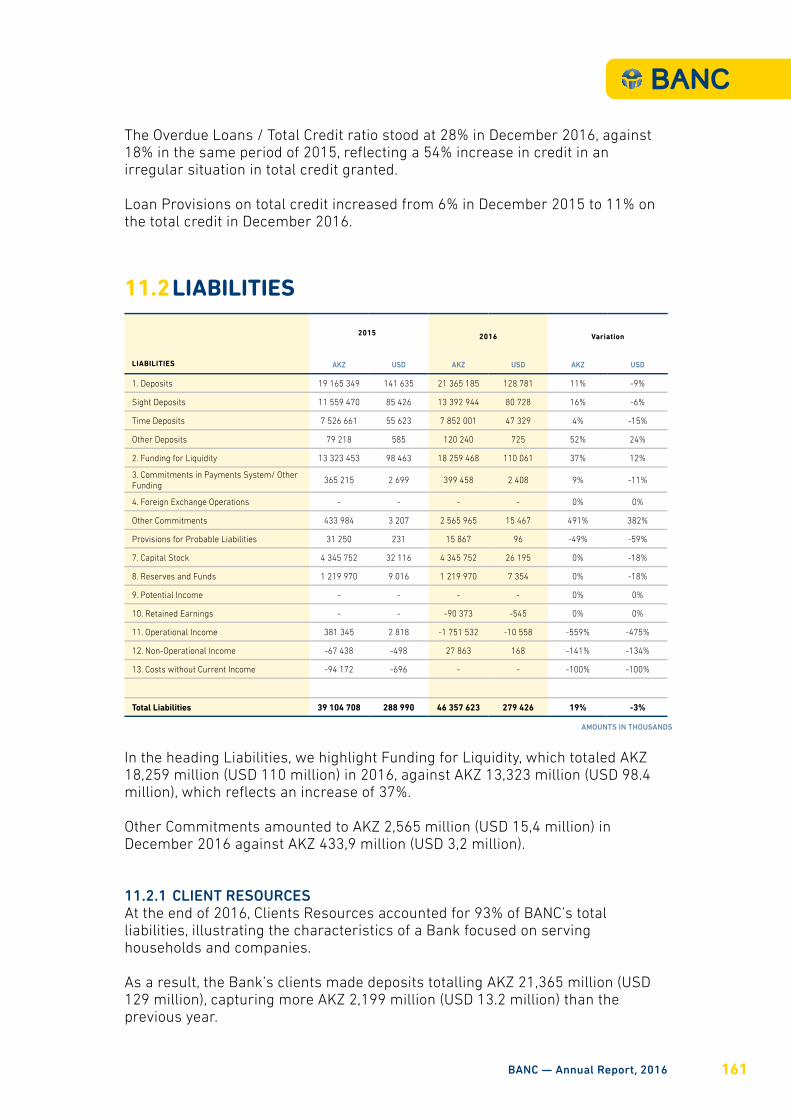
The Overdue Loans / Total Credit ratio stood at 28% in December 2016, against 18% in the same period of 2015, reflecting a 54% increase in credit in an irregular situation in total credit granted.
Loan Provisions on total credit increased from 6% in December 2015 to 11% on the total credit in December 2016.
11.2 LIABILITIES
LIABILITIES
2015 2016 Variation
AKZ USD AKZ USD AKZ USD
1. Deposits 19 165 349 141 635 21 365 185 128 781 11% -9%
Sight Deposits 11 559 470 85 426 13 392 944 80 728 16% -6%
Time Deposits 7 526 661 55 623 7 852 001 47 329 4% -15%
Other Deposits 79 218 585 120 240 725 52% 24%
2. Funding for Liquidity 13 323 453 98 463 18 259 468 110 061 37% 12%
3. Commitments in Payments System/ Other Funding
365 215 2 699 399 458 2 408 9% -11%
4. Foreign Exchange Operations - - - - 0% 0%
Other Commitments 433 984 3 207 2 565 965 15 467 491% 382%
Provisions for Probable Liabilities 31 250 231 15 867 96 -49% -59%
7. Capital Stock 4 345 752 32 116 4 345 752 26 195 0% -18%
8. Reserves and Funds 1 219 970 9 016 1 219 970 7 354 0% -18%
9. Potential Income - - - - 0% 0%
10. Retained Earnings - - -90 373 -545 0% 0%
11. Operational Income 381 345 2 818 -1 751 532 -10 558 -559% -475%
12. Non-Operational Income -67 438 -498 27 863 168 -141% -134%
13. Costs without Current Income -94 172 -696 - - -100% -100%
Total Liabilities 39 104 708 288 990 46 357 623 279 426 19% -3%
In the heading Liabilities, we highlight Funding for Liquidity, which totaled AKZ 18,259 million (USD 110 million) in 2016, against AKZ 13,323 million (USD 98.4 million), which reflects an increase of 37%.
Other Commitments amounted to AKZ 2,565 million (USD 15,4 million) in December 2016 against AKZ 433,9 million (USD 3,2 million).
11.2.1 CLIENT RESOURCESAt the end of 2016, Clients Resources accounted for 93% of BANC’s total liabilities, illustrating the characteristics of a Bank focused on serving households and companies.
As a result, the Bank’s clients made deposits totalling AKZ 21,365 million (USD 129 million), capturing more AKZ 2,199 million (USD 13.2 million) than the previous year.
AMOUNTS IN THOUSANDS
BANC — Annual Report, 2016 161
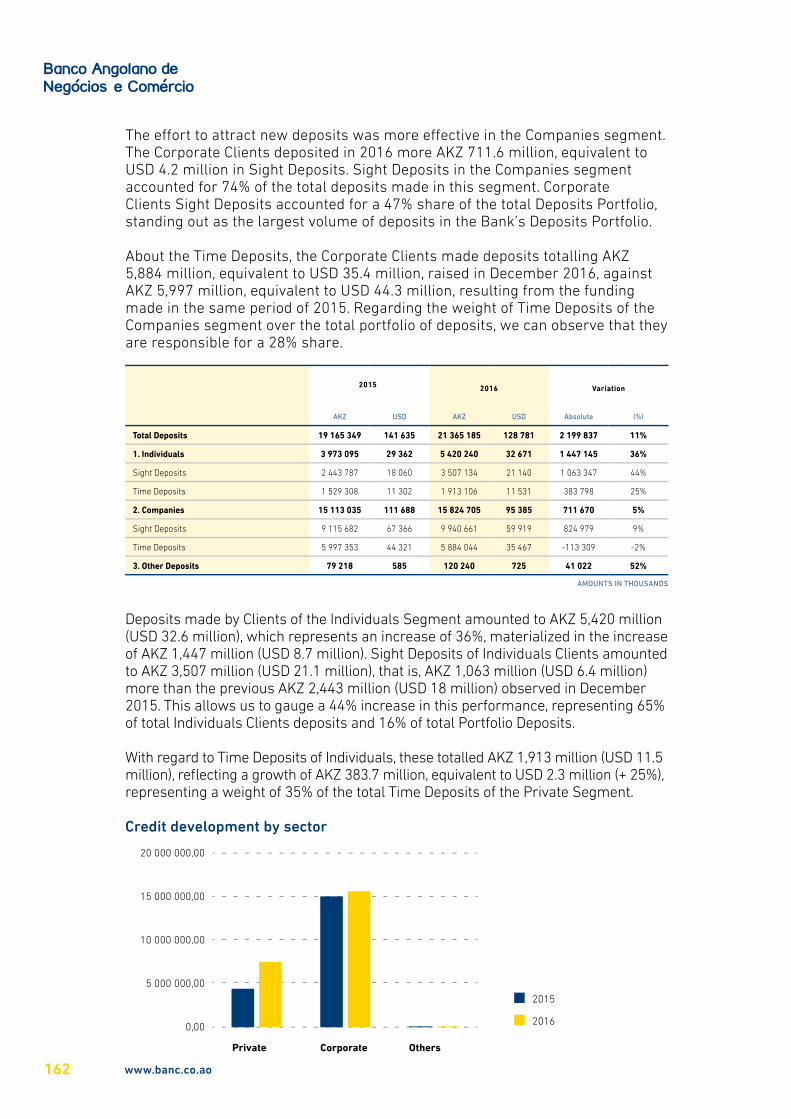
The eÎort to attract new deposits was more eÎective in the Companies segment. The Corporate Clients deposited in 2016 more AKZ 711.6 million, equivalent to USD 4.2 million in Sight Deposits. Sight Deposits in the Companies segment accounted for 74% of the total deposits made in this segment. Corporate Clients Sight Deposits accounted for a 47% share of the total Deposits Portfolio, standing out as the largest volume of deposits in the Bank’s Deposits Portfolio.
About the Time Deposits, the Corporate Clients made deposits totalling AKZ 5,884 million, equivalent to USD 35.4 million, raised in December 2016, against AKZ 5,997 million, equivalent to USD 44.3 million, resulting from the funding made in the same period of 2015. Regarding the weight of Time Deposits of the Companies segment over the total portfolio of deposits, we can observe that they are responsible for a 28% share.
2015 2016 Variation
AKZ USD AKZ USD Absolute (%)
Total Deposits 19 165 349 141 635 21 365 185 128 781 2 199 837 11%
1. Individuals 3 973 095 29 362 5 420 240 32 671 1 447 145 36%
Sight Deposits 2 443 787 18 060 3 507 134 21 140 1 063 347 44%
Time Deposits 1 529 308 11 302 1 913 106 11 531 383 798 25%
2. Companies 15 113 035 111 688 15 824 705 95 385 711 670 5%
Sight Deposits 9 115 682 67 366 9 940 661 59 919 824 979 9%
Time Deposits 5 997 353 44 321 5 884 044 35 467 -113 309 -2%
3. Other Deposits 79 218 585 120 240 725 41 022 52%
AMOUNTS IN THOUSANDS
Deposits made by Clients of the Individuals Segment amounted to AKZ 5,420 million (USD 32.6 million), which represents an increase of 36%, materialized in the increase of AKZ 1,447 million (USD 8.7 million). Sight Deposits of Individuals Clients amounted to AKZ 3,507 million (USD 21.1 million), that is, AKZ 1,063 million (USD 6.4 million) more than the previous AKZ 2,443 million (USD 18 million) observed in December 2015. This allows us to gauge a 44% increase in this performance, representing 65% of total Individuals Clients deposits and 16% of total Portfolio Deposits.
With regard to Time Deposits of Individuals, these totalled AKZ 1,913 million (USD 11.5 million), reflecting a growth of AKZ 383.7 million, equivalent to USD 2.3 million (+ 25%), representing a weight of 35% of the total Time Deposits of the Private Segment.
Credit development by sector25 000 000,00
20 000 000,00
15 000 000,00
10 000 000,00
5 000 000,00
0,00
Private Corporate Others
2015
2016
162 www.banc.co.ao
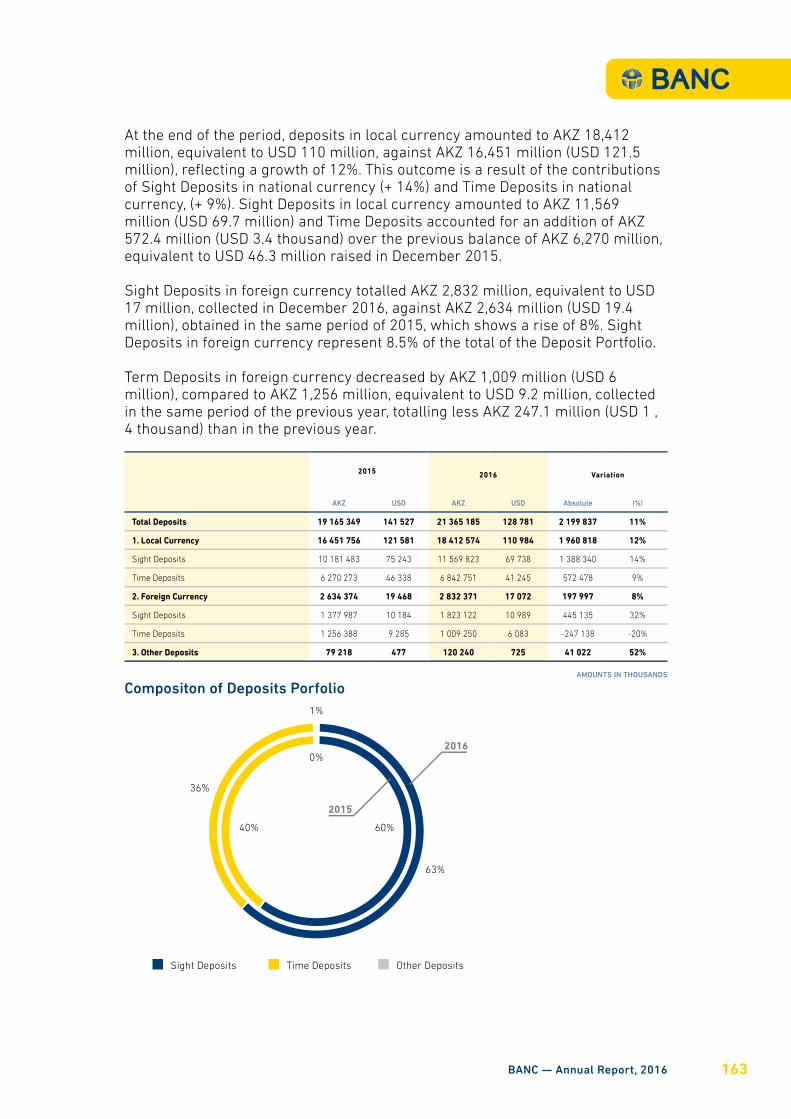
Compositon of Deposits Porfolio
Sight Deposits Time Deposits Other Deposits
0%
1%
36%
63%
40% 60%
At the end of the period, deposits in local currency amounted to AKZ 18,412 million, equivalent to USD 110 million, against AKZ 16,451 million (USD 121.5 million), reflecting a growth of 12%. This outcome is a result of the contributions of Sight Deposits in national currency (+ 14%) and Time Deposits in national currency, (+ 9%). Sight Deposits in local currency amounted to AKZ 11,569 million (USD 69.7 million) and Time Deposits accounted for an addition of AKZ 572.4 million (USD 3.4 thousand) over the previous balance of AKZ 6,270 million, equivalent to USD 46.3 million raised in December 2015.
Sight Deposits in foreign currency totalled AKZ 2,832 million, equivalent to USD 17 million, collected in December 2016, against AKZ 2,634 million (USD 19.4 million), obtained in the same period of 2015, which shows a rise of 8%. Sight Deposits in foreign currency represent 8.5% of the total of the Deposit Portfolio.
Term Deposits in foreign currency decreased by AKZ 1,009 million (USD 6 million), compared to AKZ 1,256 million, equivalent to USD 9.2 million, collected in the same period of the previous year, totalling less AKZ 247.1 million (USD 1 , 4 thousand) than in the previous year.
2015 2016 Variation
AKZ USD AKZ USD Absolute (%)
Total Deposits 19 165 349 141 527 21 365 185 128 781 2 199 837 11%
1. Local Currency 16 451 756 121 581 18 412 574 110 984 1 960 818 12%
Sight Deposits 10 181 483 75 243 11 569 823 69 738 1 388 340 14%
Time Deposits 6 270 273 46 338 6 842 751 41 245 572 478 9%
2. Foreign Currency 2 634 374 19 468 2 832 371 17 072 197 997 8%
Sight Deposits 1 377 987 10 184 1 823 122 10 989 445 135 32%
Time Deposits 1 256 388 9 285 1 009 250 6 083 -247 138 -20%
3. Other Deposits 79 218 477 120 240 725 41 022 52%
AMOUNTS IN THOUSANDS
BANC — Annual Report, 2016 163
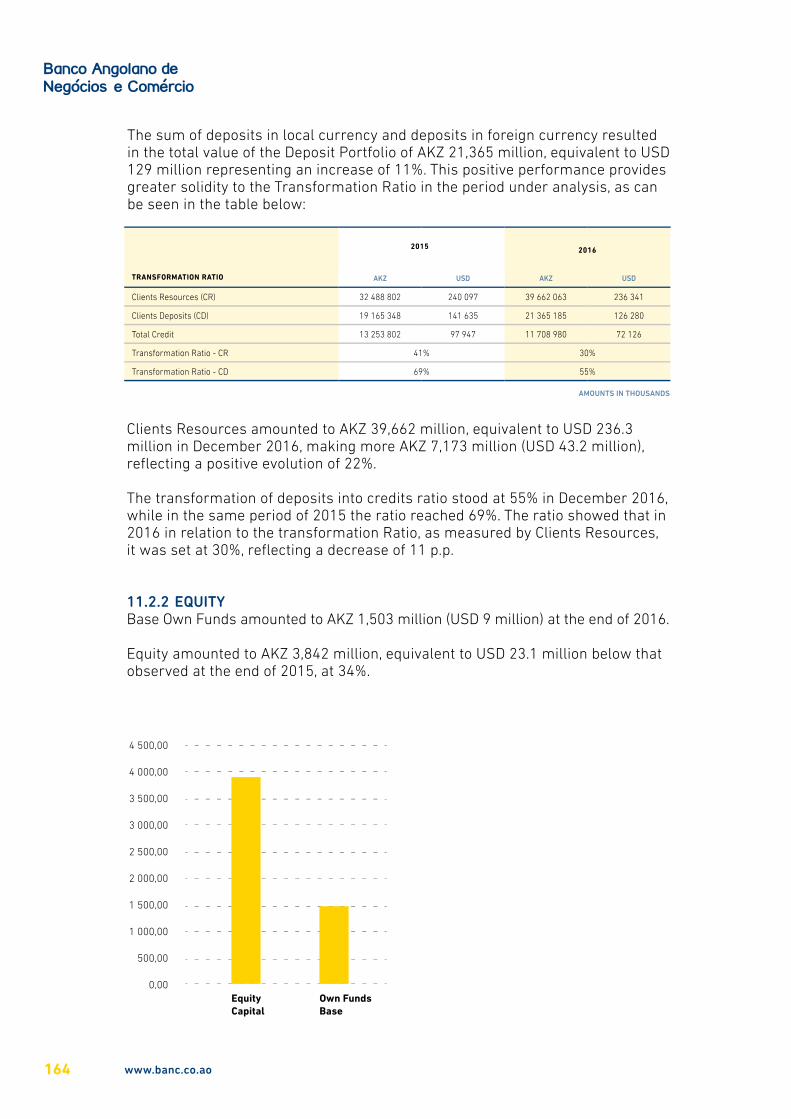
The sum of deposits in local currency and deposits in foreign currency resulted in the total value of the Deposit Portfolio of AKZ 21,365 million, equivalent to USD 129 million representing an increase of 11%. This positive performance provides greater solidity to the Transformation Ratio in the period under analysis, as can be seen in the table below:
TRANSFORMATION RATIO
2015 2016
AKZ USD AKZ USD
Clients Resources (CR) 32 488 802 240 097 39 662 063 236 341
Clients Deposits (CD) 19 165 348 141 635 21 365 185 126 280
Total Credit 13 253 802 97 947 11 708 980 72 126
Transformation Ratio - CR 41% 30%
Transformation Ratio - CD 69% 55%
Clients Resources amounted to AKZ 39,662 million, equivalent to USD 236.3 million in December 2016, making more AKZ 7,173 million (USD 43.2 million), reflecting a positive evolution of 22%.
The transformation of deposits into credits ratio stood at 55% in December 2016, while in the same period of 2015 the ratio reached 69%. The ratio showed that in 2016 in relation to the transformation Ratio, as measured by Clients Resources, it was set at 30%, reflecting a decrease of 11 p.p.
11.2.2 EQUITYBase Own Funds amounted to AKZ 1,503 million (USD 9 million) at the end of 2016.
Equity amounted to AKZ 3,842 million, equivalent to USD 23.1 million below that observed at the end of 2015, at 34%.
AMOUNTS IN THOUSANDS
Equity Capital
Own FundsBase
164 www.banc.co.ao
12.ECONOMIC ANALYSIS
165BANC — Annual Report, 2016
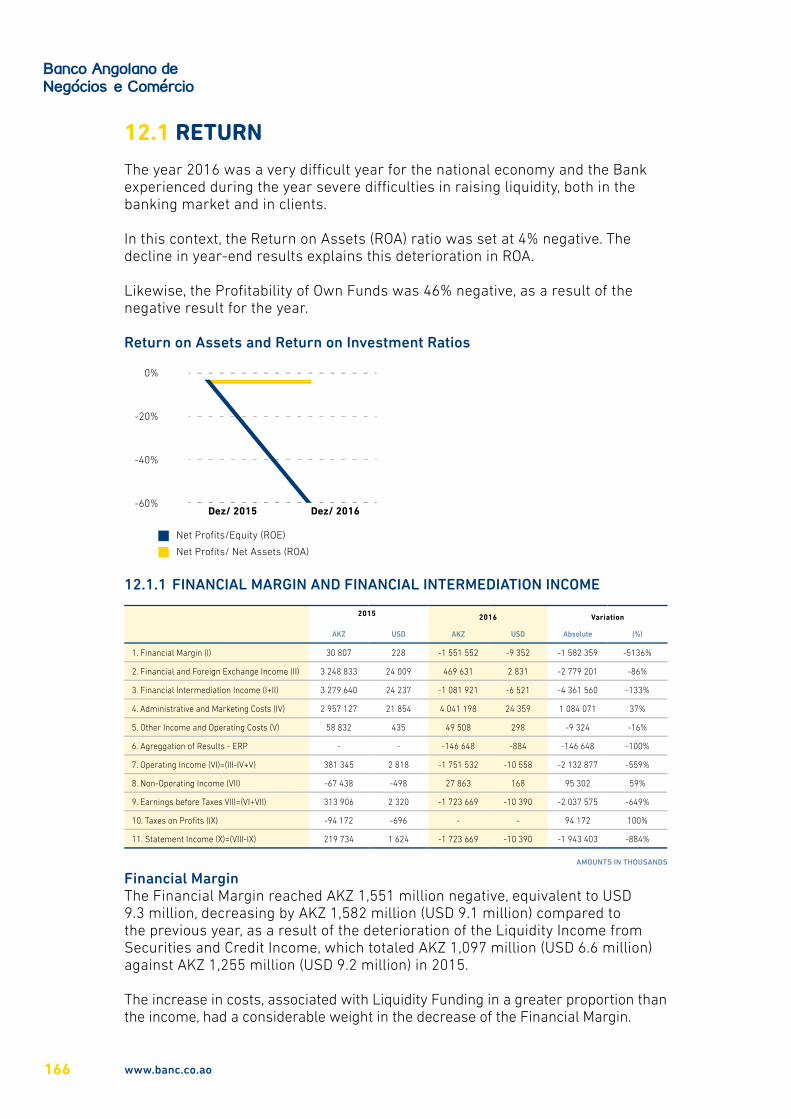
12.1 RETURN
The year 2016 was a very diÌcult year for the national economy and the Bank experienced during the year severe diÌculties in raising liquidity, both in the banking market and in clients.
In this context, the Return on Assets (ROA) ratio was set at 4% negative. The decline in year-end results explains this deterioration in ROA.
Likewise, the Profitability of Own Funds was 46% negative, as a result of the negative result for the year.
12.1.1 FINANCIAL MARGIN AND FINANCIAL INTERMEDIATION INCOME
2015 2016 Variation
AKZ USD AKZ USD Absolute (%)
1. Financial Margin (I) 30 807 228 -1 551 552 -9 352 -1 582 359 -5136%
2. Financial and Foreign Exchange Income (II) 3 248 833 24 009 469 631 2 831 -2 779 201 -86%
3. Financial Intermediation Income (I+II) 3 279 640 24 237 -1 081 921 -6 521 -4 361 560 -133%
4. Administrative and Marketing Costs (IV) 2 957 127 21 854 4 041 198 24 359 1 084 071 37%
5. Other Income and Operating Costs (V) 58 832 435 49 508 298 -9 324 -16%
6. Agreggation of Results - ERP - - -146 648 -884 -146 648 -100%
7. Operating Income (VI)=(III-IV+V) 381 345 2 818 -1 751 532 -10 558 -2 132 877 -559%
8. Non-Operating Income (VII) -67 438 -498 27 863 168 95 302 59%
9. Earnings before Taxes VIII=(VI+VII) 313 906 2 320 -1 723 669 -10 390 -2 037 575 -649%
10. Taxes on Profits (IX) -94 172 -696 - - 94 172 100%
11. Statement Income (X)=(VIII-IX) 219 734 1 624 -1 723 669 -10 390 -1 943 403 -884%
AMOUNTS IN THOUSANDS
20%
0%
-20%
-40%
-60%Dez/ 2015
Net Profits/Equity (ROE)
Net Profits/ Net Assets (ROA)
Dez/ 2016
Return on Assets and Return on Investment Ratios
Financial MarginThe Financial Margin reached AKZ 1,551 million negative, equivalent to USD 9.3 million, decreasing by AKZ 1,582 million (USD 9.1 million) compared to the previous year, as a result of the deterioration of the Liquidity Income from Securities and Credit Income, which totaled AKZ 1,097 million (USD 6.6 million) against AKZ 1,255 million (USD 9.2 million) in 2015.
The increase in costs, associated with Liquidity Funding in a greater proportion than the income, had a considerable weight in the decrease of the Financial Margin.
166 www.banc.co.ao
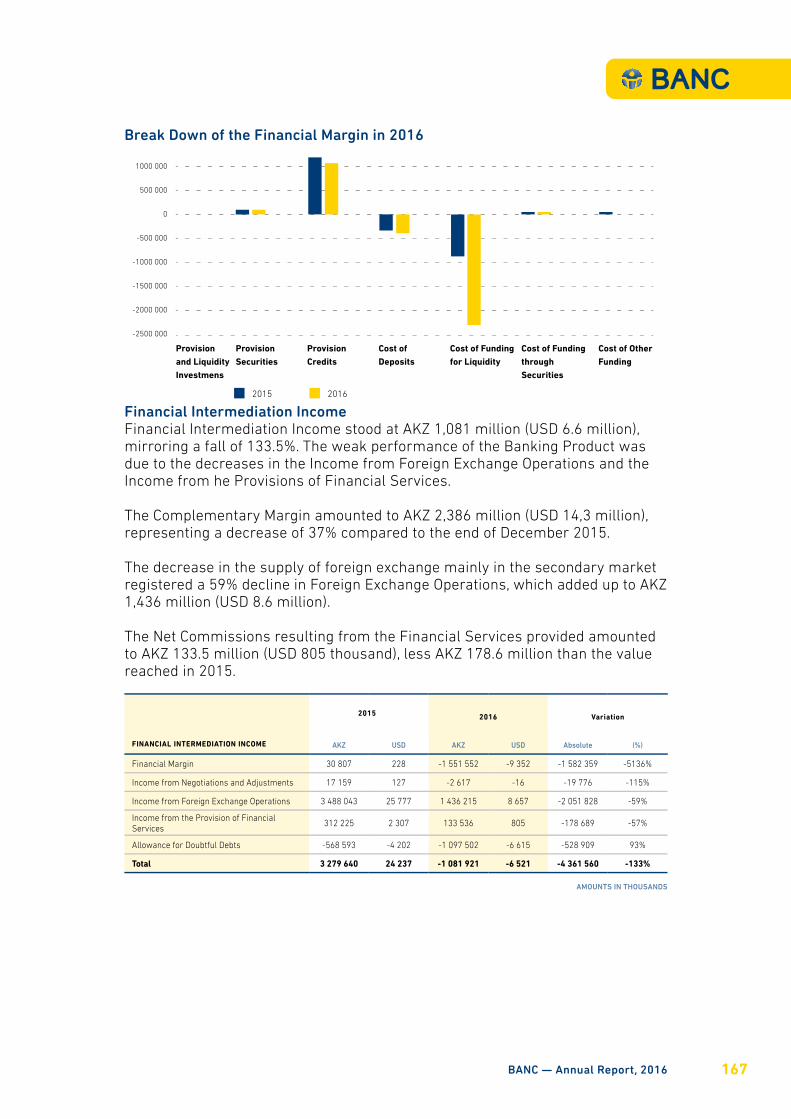
Financial Intermediation IncomeFinancial Intermediation Income stood at AKZ 1,081 million (USD 6.6 million), mirroring a fall of 133.5%. The weak performance of the Banking Product was due to the decreases in the Income from Foreign Exchange Operations and the Income from he Provisions of Financial Services.
The Complementary Margin amounted to AKZ 2,386 million (USD 14,3 million), representing a decrease of 37% compared to the end of December 2015.
The decrease in the supply of foreign exchange mainly in the secondary market registered a 59% decline in Foreign Exchange Operations, which added up to AKZ 1,436 million (USD 8.6 million).
The Net Commissions resulting from the Financial Services provided amounted to AKZ 133.5 million (USD 805 thousand), less AKZ 178.6 million than the value reached in 2015.
1500 000
1000 000
500 000
0
-500 000
-1000 000
-1500 000
-2000 000
-2500 000
2015 2016
Provisionand LiquidityInvestmens
ProvisionSecurities
ProvisionCredits
Cost ofDeposits
Cost of Funding for Liquidity
Cost of Fundingthrough Securities
Cost of OtherFunding
FINANCIAL INTERMEDIATION INCOME
2015 2016 Variation
AKZ USD AKZ USD Absolute (%)
Financial Margin 30 807 228 -1 551 552 -9 352 -1 582 359 -5136%
Income from Negotiations and Adjustments 17 159 127 -2 617 -16 -19 776 -115%
Income from Foreign Exchange Operations 3 488 043 25 777 1 436 215 8 657 -2 051 828 -59%
Income from the Provision of Financial Services
312 225 2 307 133 536 805 -178 689 -57%
Allowance for Doubtful Debts -568 593 -4 202 -1 097 502 -6 615 -528 909 93%
Total 3 279 640 24 237 -1 081 921 -6 521 -4 361 560 -133%
AMOUNTS IN THOUSANDS
Break Down of the Financial Margin in 2016
BANC — Annual Report, 2016 167
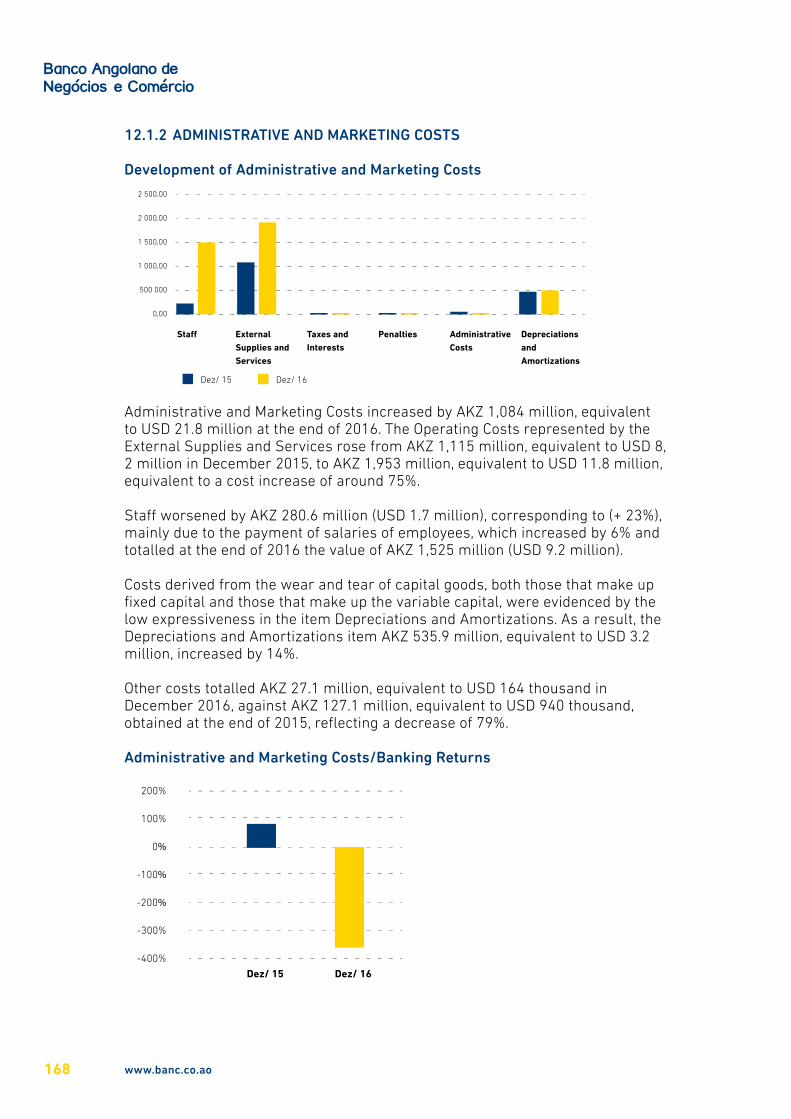
12.1.2 ADMINISTRATIVE AND MARKETING COSTS
Administrative and Marketing Costs increased by AKZ 1,084 million, equivalent to USD 21.8 million at the end of 2016. The Operating Costs represented by the External Supplies and Services rose from AKZ 1,115 million, equivalent to USD 8, 2 million in December 2015, to AKZ 1,953 million, equivalent to USD 11.8 million, equivalent to a cost increase of around 75%.
StaÎ worsened by AKZ 280.6 million (USD 1.7 million), corresponding to (+ 23%), mainly due to the payment of salaries of employees, which increased by 6% and totalled at the end of 2016 the value of AKZ 1,525 million (USD 9.2 million).
Costs derived from the wear and tear of capital goods, both those that make up fixed capital and those that make up the variable capital, were evidenced by the low expressiveness in the item Depreciations and Amortizations. As a result, the Depreciations and Amortizations item AKZ 535.9 million, equivalent to USD 3.2 million, increased by 14%.
Other costs totalled AKZ 27.1 million, equivalent to USD 164 thousand in December 2016, against AKZ 127.1 million, equivalent to USD 940 thousand, obtained at the end of 2015, reflecting a decrease of 79%.
2 500,00
2 000,00
1 500,00
1 000,00
500 000
0,00
Dez/ 15 Dez/ 16
Sta� ExternalSupplies andServices
Taxes andInterests
Penalties Administrative Costs
Depreciationsand Amortizations
Development of Administrative and Marketing Costs
200%
100%
0%
-100%
-200%
-300%
-400%
Dez/ 15 Dez/ 16
Administrative and Marketing Costs/Banking Returns
168 www.banc.co.ao
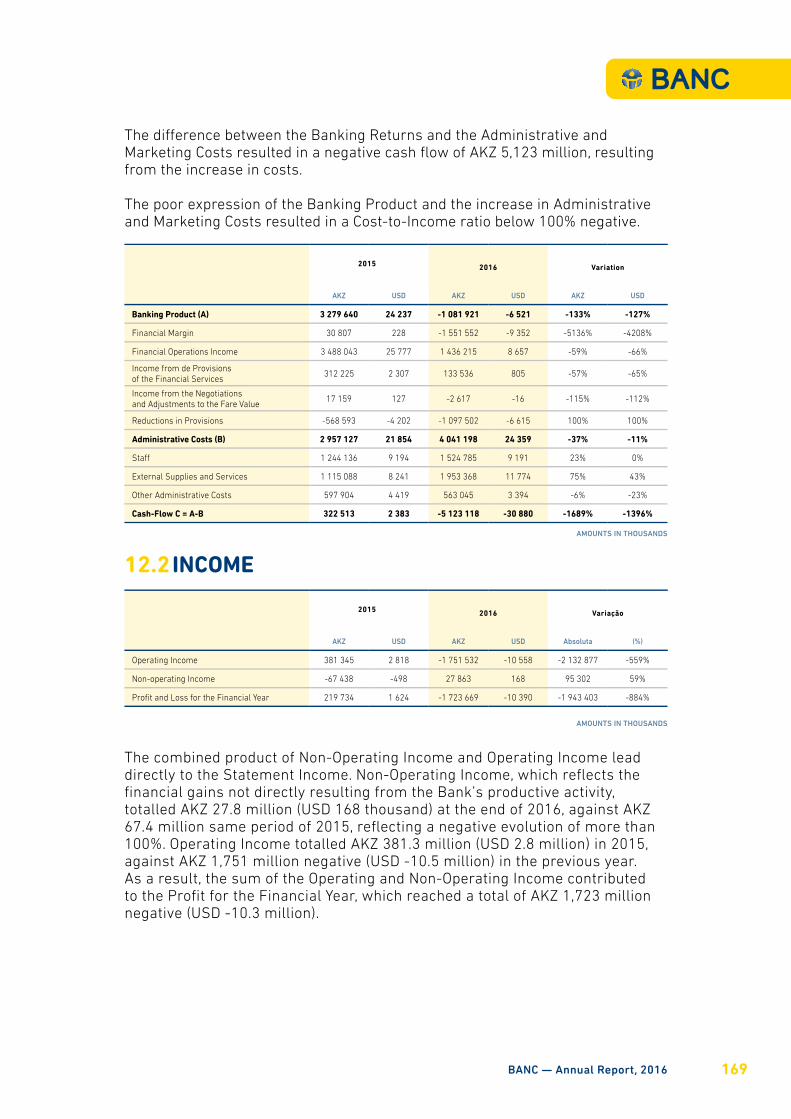
The diÎerence between the Banking Returns and the Administrative and Marketing Costs resulted in a negative cash flow of AKZ 5,123 million, resulting from the increase in costs.
The poor expression of the Banking Product and the increase in Administrative and Marketing Costs resulted in a Cost-to-Income ratio below 100% negative.
2015 2016 Variation
AKZ USD AKZ USD AKZ USD
Banking Product (A) 3 279 640 24 237 -1 081 921 -6 521 -133% -127%
Financial Margin 30 807 228 -1 551 552 -9 352 -5136% -4208%
Financial Operations Income 3 488 043 25 777 1 436 215 8 657 -59% -66%
Income from de Provisions of the Financial Services
312 225 2 307 133 536 805 -57% -65%
Income from the Negotiations and Adjustments to the Fare Value
17 159 127 -2 617 -16 -115% -112%
Reductions in Provisions -568 593 -4 202 -1 097 502 -6 615 100% 100%
Administrative Costs (B) 2 957 127 21 854 4 041 198 24 359 -37% -11%
StaÎ 1 244 136 9 194 1 524 785 9 191 23% 0%
External Supplies and Services 1 115 088 8 241 1 953 368 11 774 75% 43%
Other Administrative Costs 597 904 4 419 563 045 3 394 -6% -23%
Cash-Flow C = A-B 322 513 2 383 -5 123 118 -30 880 -1689% -1396%
AMOUNTS IN THOUSANDS
The combined product of Non-Operating Income and Operating Income lead directly to the Statement Income. Non-Operating Income, which reflects the financial gains not directly resulting from the Bank’s productive activity, totalled AKZ 27.8 million (USD 168 thousand) at the end of 2016, against AKZ 67.4 million same period of 2015, reflecting a negative evolution of more than 100%. Operating Income totalled AKZ 381.3 million (USD 2.8 million) in 2015, against AKZ 1,751 million negative (USD -10.5 million) in the previous year. As a result, the sum of the Operating and Non-Operating Income contributed to the Profit for the Financial Year, which reached a total of AKZ 1,723 million negative (USD -10.3 million).
2015 2016 Variação
AKZ USD AKZ USD Absoluta (%)
Operating Income 381 345 2 818 -1 751 532 -10 558 -2 132 877 -559%
Non-operating Income -67 438 -498 27 863 168 95 302 59%
Profit and Loss for the Financial Year 219 734 1 624 -1 723 669 -10 390 -1 943 403 -884%
12.2 INCOME
AMOUNTS IN THOUSANDS
BANC — Annual Report, 2016 169
13. FINANCIAL STATEMENTS

NET ASSET
2015 2016 Variation
AKZ USD AKZ USD AKZ USD
1. Cash 7 014 083 51 835 9 317 752 56 164 33% 8%
2. Liquidity Investments 489 487 3 617 24 099 145 -95% -96%
3. Securities 1 251 884 9 252 683 838 4 122 -45% -55%
4. Credits in the System of Payments 14 265 105 6 420 39 -55% -63%
5. Foreign Exchange Transactions - - - - 0% 0%
6. Credits 13 253 802 97 948 11 708 981 70 577 -12% -28%
Credits 14 010 194 103 538 12 947 454 78 042 -8% -25%
Allowance for Doubtful Debts -756 392 -5 590 -1 238 473 -7 465 64% 34%
7. Other Amounts 4 820 864 35 627 8 027 675 48 388 67% 36%
8. Fixed Assets 12 260 323 90 606 16 588 858 99 991 35% 10%
Total Asset 39 104 708 288 990 46 357 623 279 426 19% -3%
LIABILITIES
2015 2016 Variation
AKZ USD AKZ USD AKZ USD
1. Deposits 19 165 349 141 635 21 365 185 128 781 11% -9%
Sight 11 559 470 85 426 13 392 944 80 728 16% -6%
Time 7 526 661 55 623 7 852 001 47 329 4% -15%
Other Deposits 79 218 585 120 240 725 52% 24%
2. Funding for Liquidity 13 323 453 98 463 18 259 468 110 061 37% 12%
3. Commitments in the Payment System 365 215 2 699 399 458 2 408 9% -11%
4. Foreign Exchange Transactions - - - - 0% 0%
5. Other Commitments 433 984 3 207 2 565 965 15 467 491% 382%
6. Provisions for Probable Liabilities 31 250 231 15 867 96 -49% -59%
7. Share Capital 4 345 752 32 116 4 345 752 26 195 0% -18%
8. Reserves and Funds 1 219 970 9 016 1 219 970 7 354 0% -18%
9. Potential Income - - - - 0% 0%
10. Results Carried Over - - -90 373 -545 0% 0%
11. Operating Income 381 345 2 818 -1 751 532 -10 558 -559% -475%
12. Non-operating Income -67 438 -498 27 863 168 -141% -134%
13. Charges on Current Income -94 172 -696 - - -100% -100%
Total Liabilities 39 104 708 288 990 46 357 623 279 426 19% -3%
AMOUNTS IN THOUSANDS
BANC — Annual Report, 2016 171
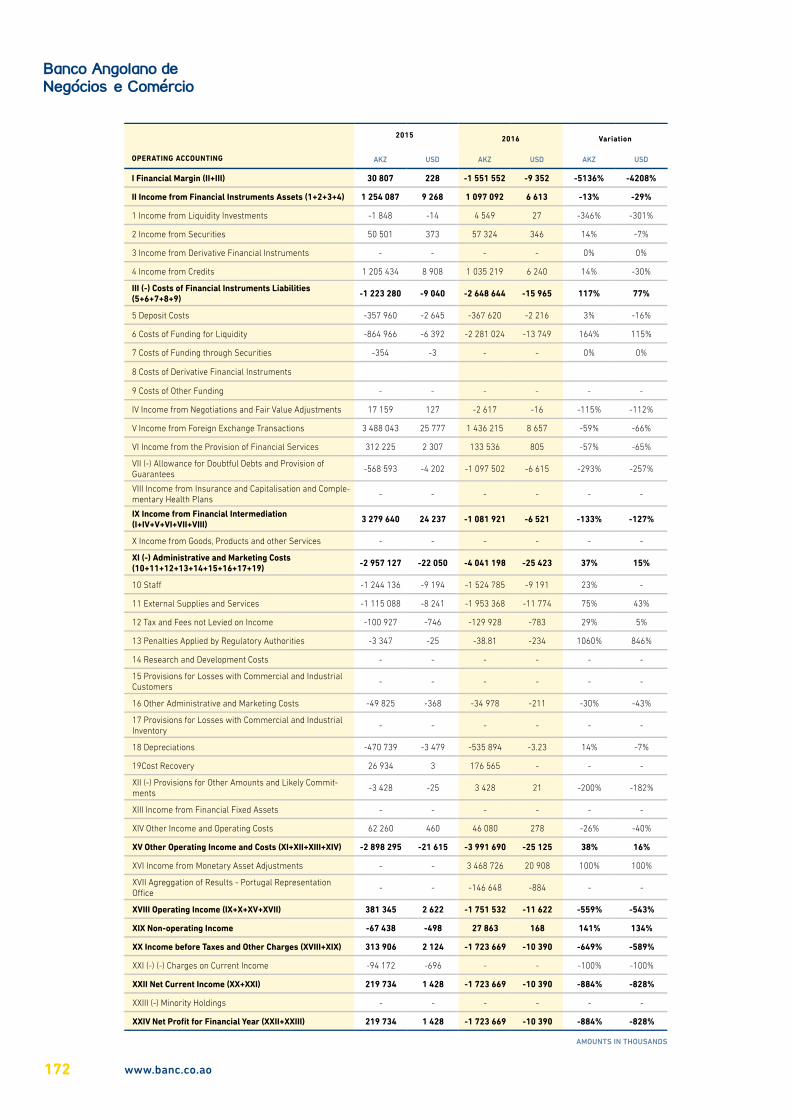
OPERATING ACCOUNTING
2015 2016 Variation
AKZ USD AKZ USD AKZ USD
I Financial Margin (II+III) 30 807 228 -1 551 552 -9 352 -5136% -4208%
II Income from Financial Instruments Assets (1+2+3+4) 1 254 087 9 268 1 097 092 6 613 -13% -29%
1 Income from Liquidity Investments -1 848 -14 4 549 27 -346% -301%
2 Income from Securities 50 501 373 57 324 346 14% -7%
3 Income from Derivative Financial Instruments - - - - 0% 0%
4 Income from Credits 1 205 434 8 908 1 035 219 6 240 14% -30%
III (-) Costs of Financial Instruments Liabilities (5+6+7+8+9) -1 223 280 -9 040 -2 648 644 -15 965 117% 77%
5 Deposit Costs -357 960 -2 645 -367 620 -2 216 3% -16%
6 Costs of Funding for Liquidity -864 966 -6 392 -2 281 024 -13 749 164% 115%
7 Costs of Funding through Securities -354 -3 - - 0% 0%
8 Costs of Derivative Financial Instruments
9 Costs of Other Funding - - - - - -
IV Income from Negotiations and Fair Value Adjustments 17 159 127 -2 617 -16 -115% -112%
V Income from Foreign Exchange Transactions 3 488 043 25 777 1 436 215 8 657 -59% -66%
VI Income from the Provision of Financial Services 312 225 2 307 133 536 805 -57% -65%
VII (-) Allowance for Doubtful Debts and Provision of Guarantees
-568 593 -4 202 -1 097 502 -6 615 -293% -257%
VIII Income from Insurance and Capitalisation and Comple-mentary Health Plans
- - - - - -
IX Income from Financial Intermediation (I+IV+V+VI+VII+VIII) 3 279 640 24 237 -1 081 921 -6 521 -133% -127%
X Income from Goods, Products and other Services - - - - - -
XI (-) Administrative and Marketing Costs (10+11+12+13+14+15+16+17+19) -2 957 127 -22 050 -4 041 198 -25 423 37% 15%
10 StaÎ -1 244 136 -9 194 -1 524 785 -9 191 23% -
11 External Supplies and Services -1 115 088 -8 241 -1 953 368 -11 774 75% 43%
12 Tax and Fees not Levied on Income -100 927 -746 -129 928 -783 29% 5%
13 Penalties Applied by Regulatory Authorities -3 347 -25 -38.81 -234 1060% 846%
14 Research and Development Costs - - - - - -
15 Provisions for Losses with Commercial and Industrial Customers
- - - - - -
16 Other Administrative and Marketing Costs -49 825 -368 -34 978 -211 -30% -43%
17 Provisions for Losses with Commercial and Industrial Inventory
- - - - - -
18 Depreciations -470 739 -3 479 -535 894 -3.23 14% -7%
19Cost Recovery 26 934 3 176 565 - - -
XII (-) Provisions for Other Amounts and Likely Commit-ments
-3 428 -25 3 428 21 -200% -182%
XIII Income from Financial Fixed Assets - - - - - -
XIV Other Income and Operating Costs 62 260 460 46 080 278 -26% -40%
XV Other Operating Income and Costs (XI+XII+XIII+XIV) -2 898 295 -21 615 -3 991 690 -25 125 38% 16%
XVI Income from Monetary Asset Adjustments - - 3 468 726 20 908 100% 100%
XVII Agreggation of Results - Portugal Representation OÌce
- - -146 648 -884 - -
XVIII Operating Income (IX+X+XV+XVII) 381 345 2 622 -1 751 532 -11 622 -559% -543%
XIX Non-operating Income -67 438 -498 27 863 168 141% 134%
XX Income before Taxes and Other Charges (XVIII+XIX) 313 906 2 124 -1 723 669 -10 390 -649% -589%
XXI (-) (-) Charges on Current Income -94 172 -696 - - -100% -100%
XXII Net Current Income (XX+XXI) 219 734 1 428 -1 723 669 -10 390 -884% -828%
XXIII (-) Minority Holdings - - - - - -
XXIV Net Profit for Financial Year (XXII+XXIII) 219 734 1 428 -1 723 669 -10 390 -884% -828%
AMOUNTS IN THOUSANDS
172 www.banc.co.ao
14.EXTERNAL AUDITORS
REPORT
173BANC — Annual Report, 2016
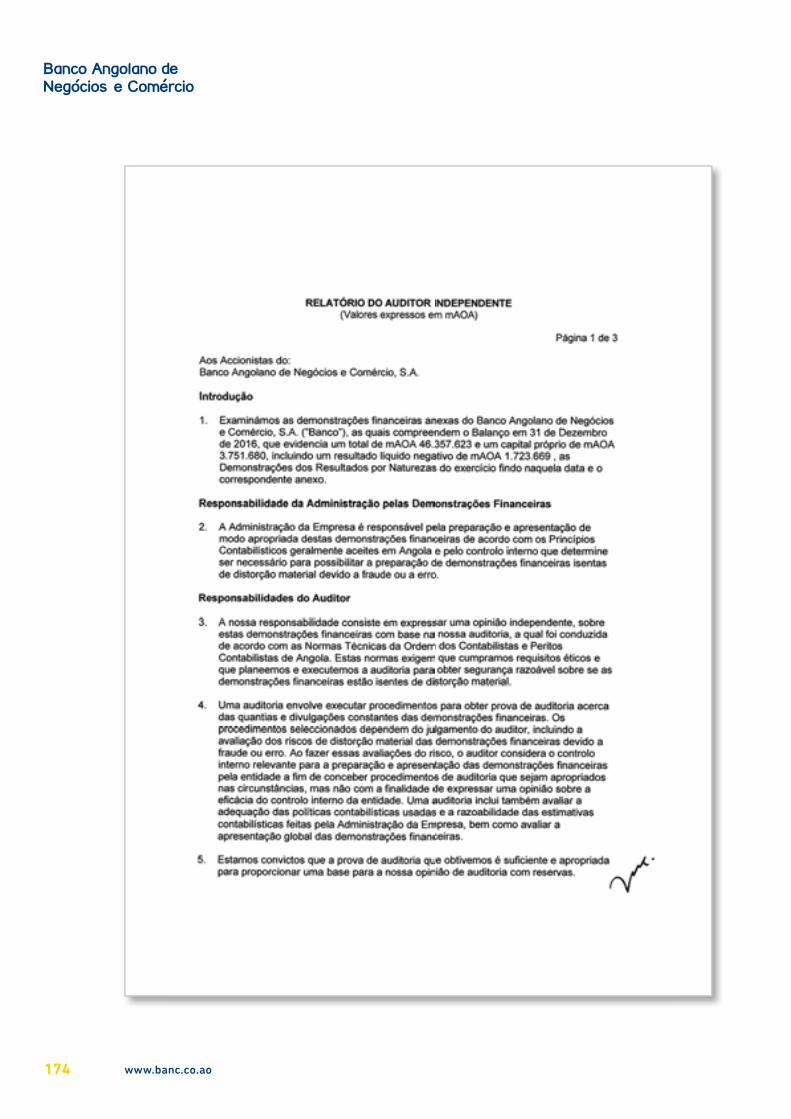
174 www.banc.co.ao

BANC — Annual Report, 2016 175

176 www.banc.co.ao
15.AUDIT
COMMITTEE REPORT
177BANC — Annual Report, 2016
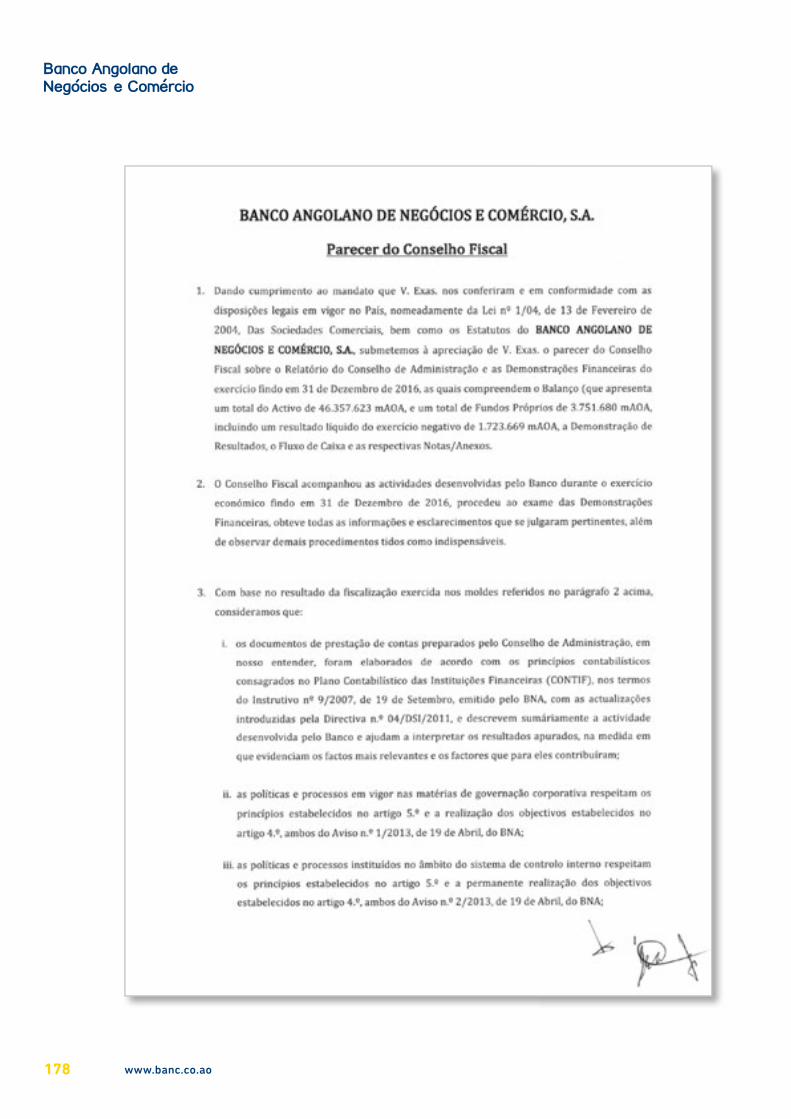
178 www.banc.co.ao
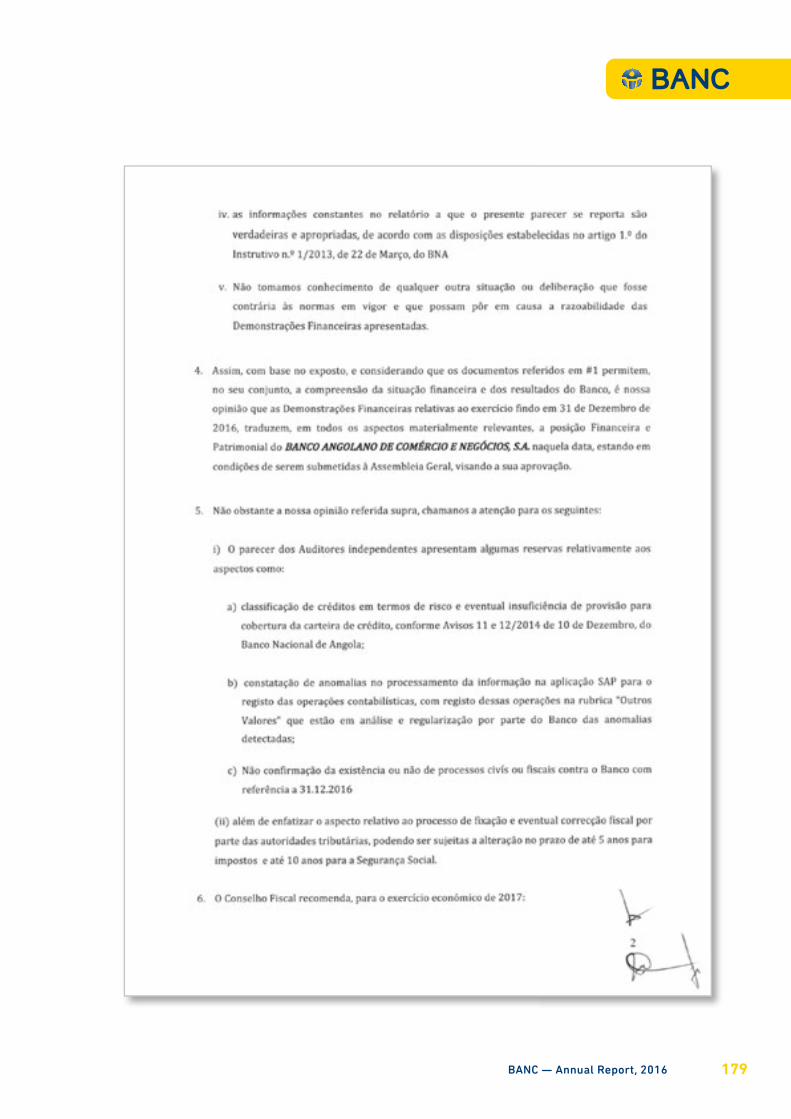
BANC — Annual Report, 2016 179
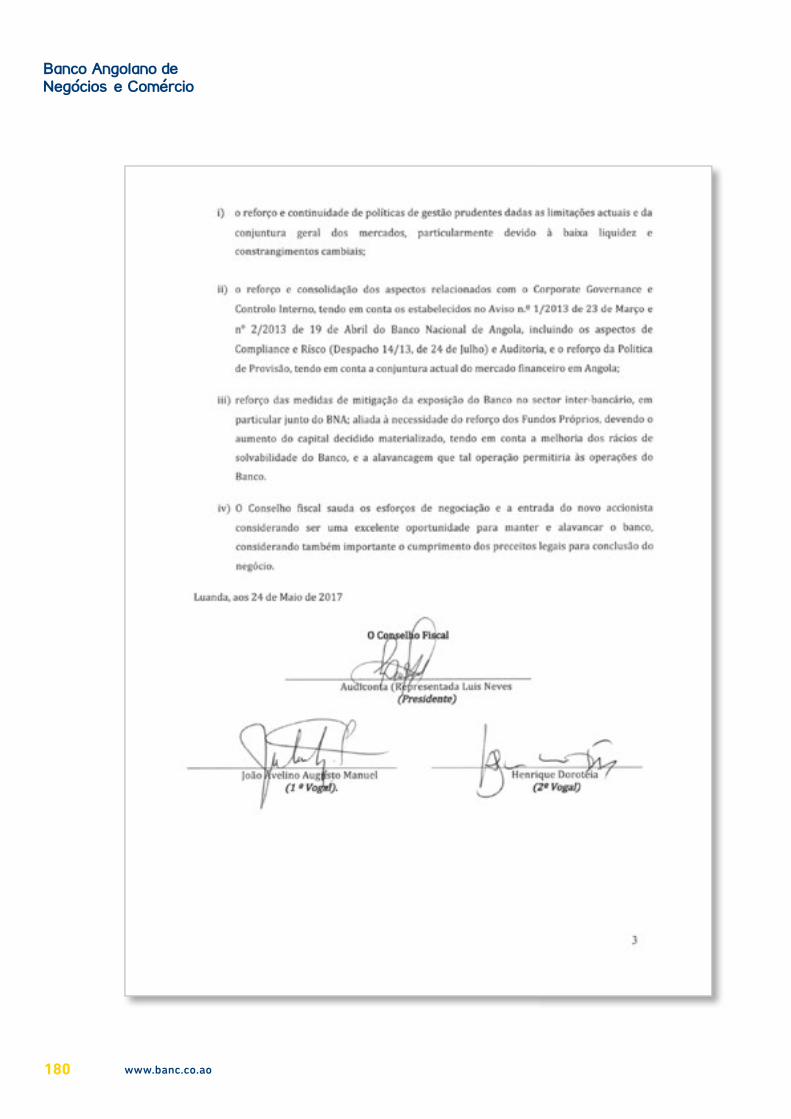
180 www.banc.co.ao
16.NOTES TO THE
ACCOUNTS
181BANC — Annual Report, 2016
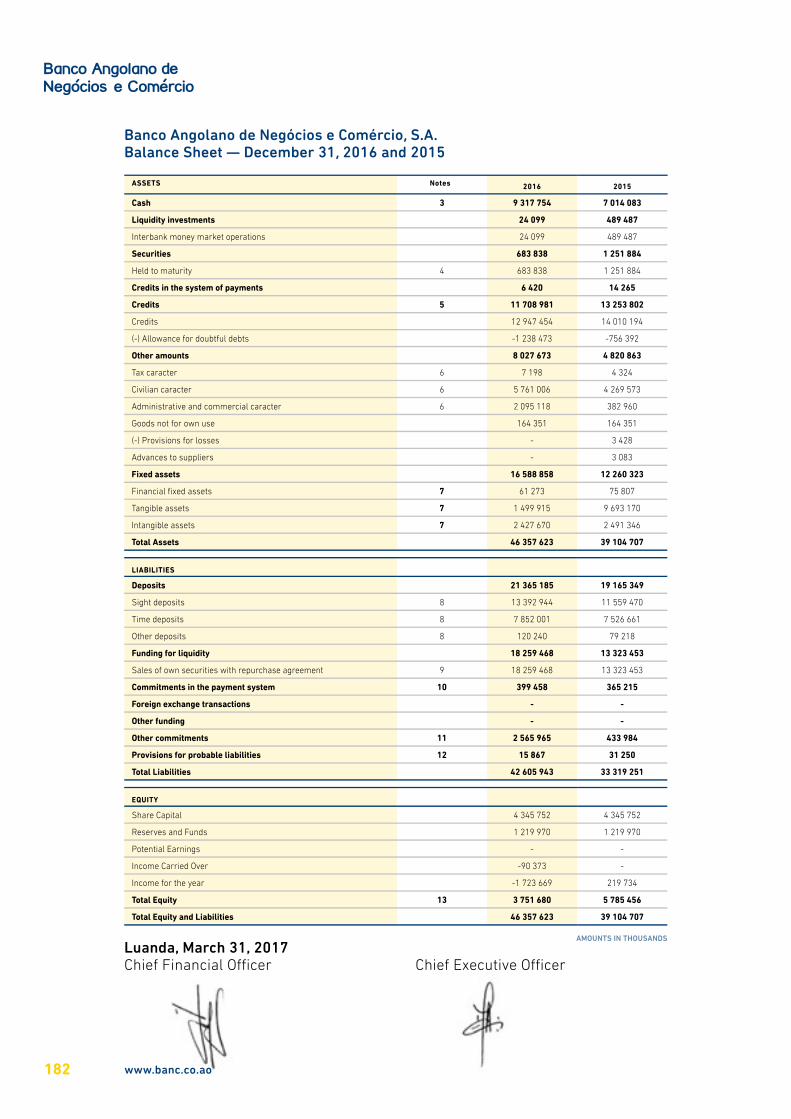
Banco Angolano de Negócios e Comércio, S.A.Balance Sheet — December 31, 2016 and 2015
Luanda, March 31, 2017Chief Financial OÌcer Chief Executive OÌcer
ASSETS Notes 2016 2015
Cash 3 9 317 754 7 014 083
Liquidity investments 24 099 489 487
Interbank money market operations 24 099 489 487
Securities 683 838 1 251 884
Held to maturity 4 683 838 1 251 884
Credits in the system of payments 6 420 14 265
Credits 5 11 708 981 13 253 802
Credits 12 947 454 14 010 194
(-) Allowance for doubtful debts -1 238 473 -756 392
Other amounts 8 027 673 4 820 863
Tax caracter 6 7 198 4 324
Civilian caracter 6 5 761 006 4 269 573
Administrative and commercial caracter 6 2 095 118 382 960
Goods not for own use 164 351 164 351
(-) Provisions for losses - 3 428
Advances to suppliers - 3 083
Fixed assets 16 588 858 12 260 323
Financial fixed assets 7 61 273 75 807
Tangible assets 7 1 499 915 9 693 170
Intangible assets 7 2 427 670 2 491 346
Total Assets 46 357 623 39 104 707
LIABILITIES
Deposits 21 365 185 19 165 349
Sight deposits 8 13 392 944 11 559 470
Time deposits 8 7 852 001 7 526 661
Other deposits 8 120 240 79 218
Funding for liquidity 18 259 468 13 323 453
Sales of own securities with repurchase agreement 9 18 259 468 13 323 453
Commitments in the payment system 10 399 458 365 215
Foreign exchange transactions - -
Other funding - -
Other commitments 11 2 565 965 433 984
Provisions for probable liabilities 12 15 867 31 250
Total Liabilities 42 605 943 33 319 251
EQUITY
Share Capital 4 345 752 4 345 752
Reserves and Funds 1 219 970 1 219 970
Potential Earnings - -
Income Carried Over -90 373 -
Income for the year -1 723 669 219 734
Total Equity 13 3 751 680 5 785 456
Total Equity and Liabilities 46 357 623 39 104 707
AMOUNTS IN THOUSANDS
182 www.banc.co.ao
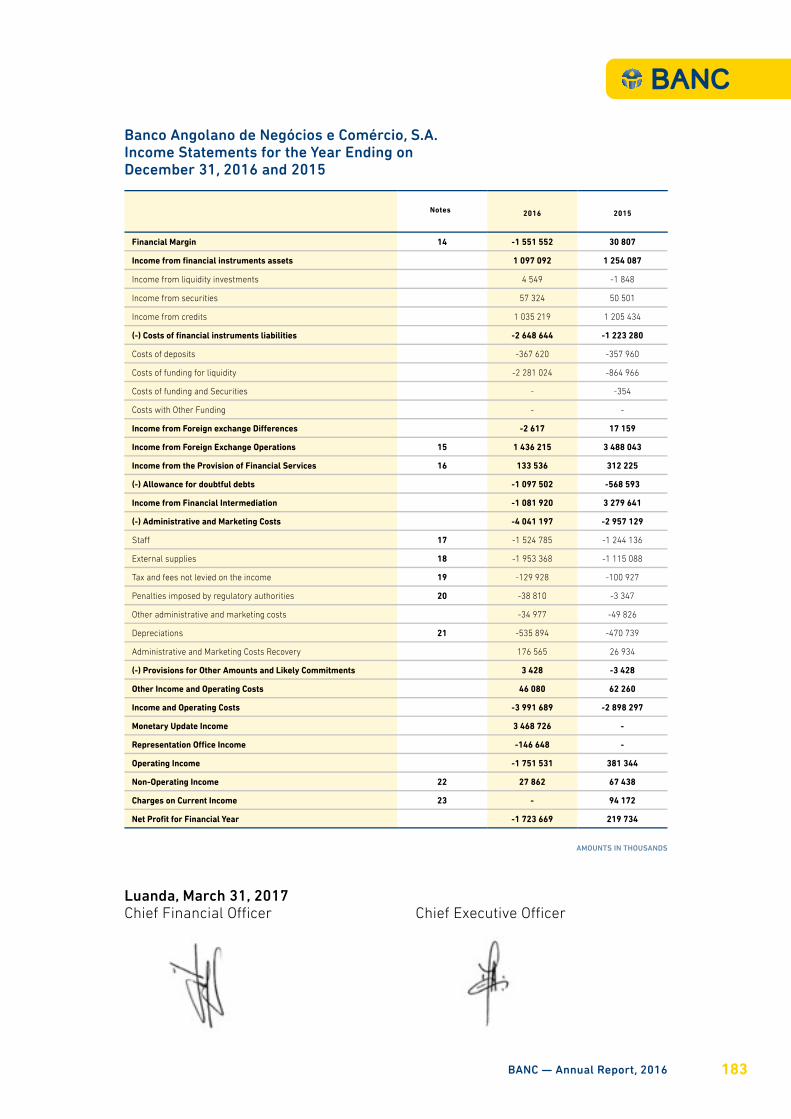
Banco Angolano de Negócios e Comércio, S.A.Income Statements for the Year Ending on December 31, 2016 and 2015
Notes 2016 2015
Financial Margin 14 -1 551 552 30 807
Income from financial instruments assets 1 097 092 1 254 087
Income from liquidity investments 4 549 -1 848
Income from securities 57 324 50 501
Income from credits 1 035 219 1 205 434
(-) Costs of financial instruments liabilities -2 648 644 -1 223 280
Costs of deposits -367 620 -357 960
Costs of funding for liquidity -2 281 024 -864 966
Costs of funding and Securities - -354
Costs with Other Funding - -
Income from Foreign exchange Di�erences -2 617 17 159
Income from Foreign Exchange Operations 15 1 436 215 3 488 043
Income from the Provision of Financial Services 16 133 536 312 225
(-) Allowance for doubtful debts -1 097 502 -568 593
Income from Financial Intermediation -1 081 920 3 279 641
(-) Administrative and Marketing Costs -4 041 197 -2 957 129
StaÎ 17 -1 524 785 -1 244 136
External supplies 18 -1 953 368 -1 115 088
Tax and fees not levied on the income 19 -129 928 -100 927
Penalties imposed by regulatory authorities 20 -38 810 -3 347
Other administrative and marketing costs -34 977 -49 826
Depreciations 21 -535 894 -470 739
Administrative and Marketing Costs Recovery 176 565 26 934
(-) Provisions for Other Amounts and Likely Commitments 3 428 -3 428
Other Income and Operating Costs 46 080 62 260
Income and Operating Costs -3 991 689 -2 898 297
Monetary Update Income 3 468 726 -
Representation O�ce Income -146 648 -
Operating Income -1 751 531 381 344
Non-Operating Income 22 27 862 67 438
Charges on Current Income 23 - 94 172
Net Profit for Financial Year -1 723 669 219 734
Luanda, March 31, 2017Chief Financial OÌcer Chief Executive OÌcer
AMOUNTS IN THOUSANDS
BANC — Annual Report, 2016 183
1. ACTIVITYThe Banco Angolano de Negócios e Comércio, S.A. (hereinafter referred to as “BANC” or the “BANK”), was created in April 10, 2006, by Law No. 13/05 of 30 September, and began its activity on 1 April 2007.
The Bank is devoted to obtaining third-party resources in the form of deposits or other, which it uses along with its own resources to grant loans, place deposits with the National Bank of Angola, invest in credit institutions, purchase securities and other assets for which it is duly authorized. The Bank also provides other banking services and carries out various types of operations in foreign currency, with a network of 20 branches (20 branches in 2015).
With regard to the shareholder structure, as detailed in note 15, the Bank is held by several shareholders.
2. SUMMARY OF THE MAIN ACCOUNTING POLICIES2.1 BASES OF REPRESENTATIONThe attached financial statements have been prepared on a going concern basis, based on the books and records kept by the Bank in accordance with the accounting principles of the Accounting Plan of Financial Institutions (CONTIF), pursuant to Instruction No. 9/2007, of 19 September, issued by the Banco Nacional de Angola (hereinafter also referred to as “BNA”), which became eÎective as of 1 January 2010, and subsequent updates, namely Directive No. 04/ISD/2011, which establishes the obligation to adopt the International Financial Reporting Standards (IFRS) in all matters related to procedures and accounting criteria that are not established in the CONTIF. These principles may diÎer from those generally accepted in other countries.
The CONTIF aims at standardizing the accounting records and financial disclosures in an approximation to international practices, through the convergence of accounting principles to International Financial Reporting Standards (IFRS).
The financial statements now presented reflect the results of the Bank’s operations for the years ended on December 31, 2016 and 2015 and were prepared in accordance with the assumptions of continuity and the principle of specialization in which the items are recognized as assets, liabilities, own funds, income and costs when they meet the definitions and recognition criteria for those elements contained in the conceptual framework, in accordance with the qualitative characteristics of comprehensibility, relevance, materiality, reliability, reliable representation, substance on the form, neutrality, prudence, completeness and comparability.
The BANC financial statements for the year ended 31 December 2016 were approved by the Board of Directors on 31 March 2017.
The accounting policies presented in this note have been consistently applied in all periods of the financial statements now presented.
Banco Angolano de Negócios e Comércio, S.A.Notes to the Income StatementsDecember 31, 2016 and 2015
184 www.banc.co.ao

The Bank’s financial statements at December 31, 2016 and 2015 are expressed in thousands of Kwanzas, according to Notice no. 15/2007, Art. 5 of the BNA, and the assets and liabilities denominated in foreign currency have been converted based on the indicative exchange rate published by BNA on those dates.
On December 31, 2016 and 2015, the Kwanza (AKZ) indicative exchange rate published by BNA against the United States Dollar (USD) and the Euro (EUR) was as follows:
31.12.2016 31.12. 2015
1 USD = 165,9026 135,3150
1 EUR = 185,3785 147,8315
2.2 ACCOUNTING POLICIESThe main accounting policies used in the preparation of the financial statements were as follows:
a) Accrual
Income and expenses are recorded on the basis of duration of transactions in accordance with the accrual-based accounting principle, being recorded as they are earned, regardless of when received or paid.
Income is considered realized when:i. In transactions with third parties, the payment is made or a firm
commitment is made to eÎect it;
ii. In the extinction, partial or total, of a liability, for whatever reason, without the simultaneous disappearance of an asset of equal or greater value;
iii. In the natural generation of new assets, regardless of the intervention of third parties;
iv. EÎective receipt of donations and grants.
Costs, in turn, are considered to be incurred when:i. To cease to exist the corresponding asset value, by transferring its
property to a third party;
ii. For the decrease or extinction of the economic value of an asset;
iii. For the appearance of a liability, without the corresponding asset.
Dividends are recognized when received.
b) Foreign currency transactions
Transactions in a foreign currency are recorded in accordance with the principles of the multi-currency system, each transaction being recorded against the respective currencies.
BANC — Annual Report, 2016 185

Transactions in foreign currency are converted into Kwanzas at the indicative exchange rate published by BNA on the date of the transaction. Monetary assets and liabilities denominated in foreign currency are converted into Kwanzas at the indicative exchange rate published by BNA at the balance sheet date. The costs and income related to exchange diÎerences, performed or potential, are recorded in the income statement for the year in which they occur.
Non-monetary assets and liabilities and financial assets are recorded at historical cost.
Non-monetary assets and liabilities denominated in foreign currency, recorded at historical cost, except financial assets, are converted into Kwanzas at the indicative exchange rate published by BNA at the date of the transaction.
On the date they are contracted, purchases and sales of spot and forward foreign currency are immediately recorded in the foreign exchange position. Whenever these operations lead to changes in the net balances of the diÎerent currencies, there is a change in the foreign currency position, spot or forward accounts, whose content and revaluation criteria are as follows:
Foreign Exchange SpotThe cash spot position in each currency is given by the net balance of the assets and liabilities of that currency, as well as cash transactions pending settlement and forward transactions maturing within two business days thereafter. The spot exchange rate is revalued daily based on the indicative exchange rate published by BNA on that date, leading to the movement of the foreign exchange position account (national currency), against results of the period.
Foreign Exchange ForwardThe forward foreign exchange position in each currency corresponds to the net balance of forward transactions pending settlement, with the exception of those due within two subsequent business days. All contracts relating to these operations (currency forwards) are revalued at the forward exchange rates of the market or, in the absence thereof, by calculating them based on the interest rates applicable to the residual term of each transaction. The diÎerence between the counterparts in Kwanzas at the revaluation rates applied in the period, and the equivalent to the contracted rates, which represent the cost or profit or the cost of revaluation of the forward foreign exchange position, is recorded under the heading “Foreign exchange operations” or liabilities, against results.
c) Credits
Credit RatingThe loans granted to clients are financial assets initially recorded by contracted amounts, when originated by the Bank, or by amounts paid, when purchased from other entities. The interest component is given a separate autonomous accounting entry on the corresponding balance sheet accounts, and the respective income is accrued in results over the life of the credit operations, regardless of when they are charged or paid.
Credits are subsequently recorded at their initial value, net of amortizations and provisions for doubtful debts.
186 www.banc.co.ao

Liabilities related to guarantees and sureties and documentary credits are recorded in oÎ-balance-sheet items at their value-at-risk, with interest, commissions or other income being recorded in the income statement over the life of operations.
With the entry into force on January 1, 2016 of Notice No. 11/2014, of December 10, of the BNA that revoked Notice No. 3/2012, of March 28, of the BNA, credit operations, by disbursement, are granted in national currency to all entities, except for the State and exporting entities, regardless of the period and purpose.
Loans granted to clients, guarantees and sureties provided and documentary credits are classified according to their risk, in accordance with BNA Notice no. 11/2014 of 10 December, which entered into force on January 1, 2016, and which revoked Notice No. 3/2012, of March 28, of the BNA, and submitted to the constitution of provisions in accordance with the new regulations of the BNA, namely Notice No. 12/2014, of December 10, which entered into force on January 1, 2016, and Instruction no. 1/2015, dated January 14 and no. 09/2015, dated June 4, on the methodology and classification of credit granted to clients, risk classification according to the country risk and the determination of the respective provisions.
Level Risk
A Minimum
B Very Low
C Low
D Moderate
E High
F Very High
G Maximum
In addition to assessing the level of risk described above, the Bank defines the country risk of each exposure as set out in Instruction no. 1/2015, of 14 January, of the BNA, which defines 5 risk groups, depending on the country of the counterparty.
Non-performing credit operations are classified according to the risk levels associated with the outstanding credit due and overdue credit in each operation on the reference date of the financial statements, considering for this purpose the classification granted in the credit granting phase and the seniority of the default, respectively.
In addition, non-performing loans, which were not recorded as past-due loans, are classified in level A, in the case of entities with a State risk (credits granted under Angolan Executive credit programs or to public entities) and levels, depending on the perception of risk arising from the client’s valuation, namely the capacity to pay the debt service, and the financial component of the operation, based on the analysis of cashflows and guarantees (typology and credit coverage ratio).
The classification of the exposures of the same client or economic group for the purpose of establishing provisions is carried out in the class which presents the greatest risk (drawdown).
BANC — Annual Report, 2016 187

The review and reclassification of the risk level of an operation is based on an assessment made periodically by the Bank, taking into account the risk perception associated with the credit operation and the existence of any guarantees that are collateralizing the debt with the Bank.
Without prejudice to the review described above, the classification of exposures shall be reviewed on a monthly basis, taking into account the time elapsed since the date of entry of the defaulted transactions, in accordance with the following table:
Risk Levels A B C D E F G
Time elapsed since the date of default
Up to 15 days 15 to 30 daysFrom 1 to 2
months2 to 3 months
From 3 to 5 months
From 5 to 6 months
More than 6 months
The reclassification of the credit to a lower risk category, depending on the reduction of the delay, is limited to the level established in the initial classification or resulting from the periodic risk assessment.
Allowance for doubtful debts and provision of guaranteesThe Bank calculates provisions for doubtful debts, which are intended to cover potential losses on exposures, in accordance with the standard methodology set forth in Notice No. 12, / 2014, of December 10, of the BNA and Instruction no. 9/2015, of 4 June, of the BNA, and are made monthly, resulting from the algebraic sum of the provision for the exposure with the respective provision for country risk.
Provision = (e% + p%) x Vrisk position
e% = risk weightp% = country risk weightV
risk position = risk position value
The provision calculated is based on the application of the provisioning percentages (which includes the exposure risk weight and the country risk weight) on the book value of each credit, thus taking into account the amount receivable from the borrower, plus income and of any nature not received, including those arising from exchange variation, if any.
The provisioning levels to be applied to each exposure are calculated on the basis of the exposure risk weight (risk rating A to risk G) ascertained in accordance with Notice No. 11/2014 of December 10, of the BNA, as well as the specificity of the type of collateral associated with the exposure, if any, according to the following table, shown on the page:
188 www.banc.co.ao
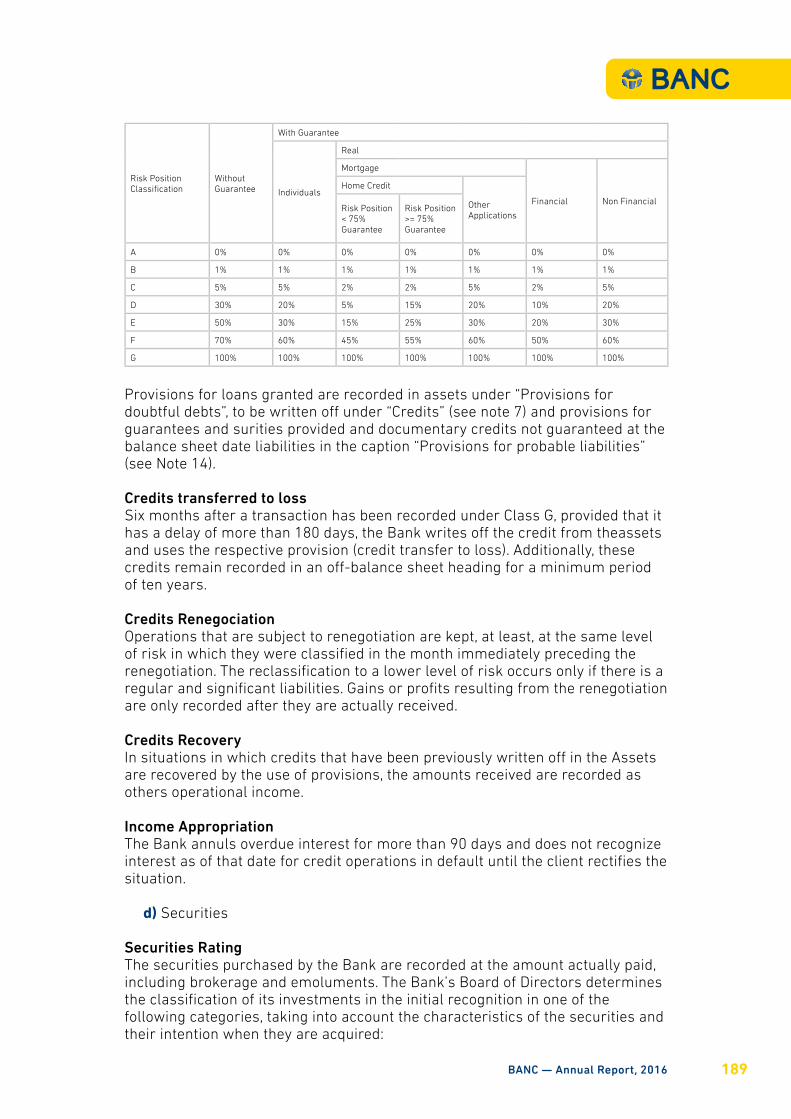
Risk Position Classification
Without Guarantee
With Guarantee
Individuals
Real
Mortgage
Financial Non Financial
Home Credit
Other Applications
Risk Position < 75% Guarantee
Risk Position >= 75% Guarantee
A 0% 0% 0% 0% 0% 0% 0%
B 1% 1% 1% 1% 1% 1% 1%
C 5% 5% 2% 2% 5% 2% 5%
D 30% 20% 5% 15% 20% 10% 20%
E 50% 30% 15% 25% 30% 20% 30%
F 70% 60% 45% 55% 60% 50% 60%
G 100% 100% 100% 100% 100% 100% 100%
Provisions for loans granted are recorded in assets under “Provisions for doubtful debts”, to be written oÎ under “Credits” (see note 7) and provisions for guarantees and surities provided and documentary credits not guaranteed at the balance sheet date liabilities in the caption “Provisions for probable liabilities” (see Note 14).
Credits transferred to lossSix months after a transaction has been recorded under Class G, provided that it has a delay of more than 180 days, the Bank writes oÎ the credit from theassets and uses the respective provision (credit transfer to loss). Additionally, these credits remain recorded in an oÎ-balance sheet heading for a minimum period of ten years.
Credits RenegociationOperations that are subject to renegotiation are kept, at least, at the same level of risk in which they were classified in the month immediately preceding the renegotiation. The reclassification to a lower level of risk occurs only if there is a regular and significant liabilities. Gains or profits resulting from the renegotiation are only recorded after they are actually received.
Credits RecoveryIn situations in which credits that have been previously written oÎ in the Assets are recovered by the use of provisions, the amounts received are recorded as others operational income.
Income AppropriationThe Bank annuls overdue interest for more than 90 days and does not recognize interest as of that date for credit operations in default until the client rectifies the situation.
d) Securities
Securities RatingThe securities purchased by the Bank are recorded at the amount actually paid, including brokerage and emoluments. The Bank’s Board of Directors determines the classification of its investments in the initial recognition in one of the following categories, taking into account the characteristics of the securities and their intention when they are acquired:
BANC — Annual Report, 2016 189

i. Trading Securities
ii. Available For Sale Securities
iii. Securities held to maturity
The yields on the securities, relative to interest accrued during the maturity or declared dividends, must be considered directly in the profit or loss for the period, regardless of the category in which they were classified, whereas those relating to the shares acquired for less six months must be recognized against the appropriate account that records the corresponding acquisition cost.
The Bank also classifies the securities in the order of increasing risk at the following levels, observing the same provisioning criteria defined by CONTIF for the credit portfolio:
The Bank classifies the Angolan State and BNA debt securities at Level A.
Trading SecuritiesTrading securities are securities acquired for the purpose of being actively and frequently traded.
Trading Securities are initially recognized at acquisition cost, including costs directly attributable to the acquisition of the asset. Subsequently, they are valued at fair value, with the respective income or cost coming from the valuation recognized in income for the year.
Securities held to maturitySecurities considered to be held to maturity are those acquired for the purpose of keeping them in the portfolio until maturity, provided that the fnancial capacity of the Bank so permits. This financial capacity is evidenced based on projection of cash flows, not considering the possibility of selling securities before maturity.
Non-redeemable shares may not be classified as held-to-maturity securities.
Securities held do maturity are recorded at acquisition cost, plus income earned through the fluency of their maturities (including interest accrual and premium / discount against profit or loss), with the Bank recognizing any profits or losses ascertained on the date of the due to the diÎerence between the eÎective price and the respective book value.
In the event of the possible sale of securities classified as held-to-maturity securities prior to redemption, any profit or loss determined at the date of sale shall be recorded for the diÎerence between the selling price and its book value.
Level Risk
A Minimum
B Very Low
C Low
D Moderate
E High
F Very High
G Maximum
190 www.banc.co.ao

The Bank may not classify any securities in the held-to-maturity category if, during the current financial year or in any of the previous two financial years, it has sold or reclassified a substantial part of them before maturity, except in cases where the acquisition cost of securities, plus income earned, does not present a significant diÎerence in relation to the market value.
Central Bank securities, Treasury Bills and Treasury Bonds are issued at a discount and recorded at their acquisition cost. The diÎerence between this and the nominal value, which is the Bank’s remuneration is recorded as income over the period between the purchase date and the maturity date of the securities on own account with the specification “Income receivable”.
The Treasury Bonds issued in national currency indexed to the exchange rate of the U.S. Dollar are subject to exchange rate adjustments. Thus, the result of the exchange rate adjustment of the nominal value of the bond, the discount and accrued interest is reflected in the income statement in the year they occur, in the heading “Securities Income”.
Available For Sale SecuritiesAvailable-for-sale securities are securities that may be traded and that do not fall into the other categories.
They are initially recorded at acquisition cost and subsequently valued at fair value. Changes in fair value are recorded against equity, and capital gains are recognized in income for the year when the asset is definitively sold.
Market ValueThe market value (fair value) of securities is determined according to the following criteria:
i. Average trading price on the settlement day or, when not available, the average trading price on the previous business day;
ii. Net probable realizable value obtained through adoption of internal valuation technique or model;
iii. Price of a similar financial instrument, taking into account at least payment and maturity terms, credit risk and currency or indexer; and
iv. Price defined by BNA.
Regarding securities with a maturity of less than one year, for which there is no quotation in active market with regular transactions, they are valued based on the acquisition cost because it reflects the best approximation to their market value.
Transfer of Securities between categoriesTransfers from one category to another may only occur for an isolated, unusual, non-recurring and that could not have been reasonably anticipated, occurred after the classification date, and the documentation that serves as the basis for the reclassification shall remain at the disposal of the BNA, duly accompanied by an explanatory memorandum from the Bank’s Board of Directors.
BANC — Annual Report, 2016 191

Any transfer to a diÎerent category should take into account the Bank’s intention and financial capacity and be carried out at the market value of the security, as well as the following procedures:
1) In the transfer of the “Trading Securities” category to the other categories, the reversal of amounts already recorded in the income statement resulting from unrealized gains or losses will not be accepted;
2) In the transfer of the “Available-for-sale securities” category, unrealized gains and losses, recorded as a separate component in equity, should be recognized in the statement of income for the period:
i. Immediately, when for the category “Trading Securities”;
ii. Due to the remaining term to maturity, when for the category “Held to maturity Securities “;
3) In the transfer of the category “Securities held to maturity” for other categories, unrealized gains and losses must be recognized:
i. Immediately in the result of the period, when for the category “Trading Securities”;
ii. As a separate component in equity, when for the “Available for sale Securities” category.
ImpairmentLosses on permanent securities should be recognized immediately in the income statement for the year. The adjusted amount resulting from the recognition of said losses becomes the new value base for the purpose of appropriating income. The reversal of these losses is not allowed.
e) Financial Assets
Related and associated companies Investments in subsidiaries or aÌliated companies are considered as participations in companies in which the Bank holds, directly or indirectly, a percentage equal to or greater than 10% of its voting capital, without controlling it.
The Bank applies the equity method for the valuation of its holdings in associates in the following situations:
a) When the equity interests are in a group relationship; or
b) When the equity interests are relevant and the Bank has influence in its management, or when the percentage of participation, directly or indirectly, represents 20% (twenty percent) or more of the voting capital of the investee.
A shareholding interest is considered in a group relationship when a control over the Company is applied, reflected by an operational control, in cases where they are jointly managed, or by a corporate control, when control is obtained through the summation of the percentage held directly by the Bank, its administrators, controllers and related companies.
192 www.banc.co.ao
A shareholding interest is considered relevant when:a) ts book value is equal to or greater than 10% of the Bank’s own
funds; or
b) The book value of the several investees, taken together, is equal to or greater than 15% of the Bank’s own funds.
According to the equity method, financial assets are initially recorded at acquisition cost and subsequently adjusted based on changes in the Bank’s share of the net assets of the respective investees following acquisition. The Bank’s results include its share of the results of these investees.
In addition, the Bank must establish a provision for losses, when there is an unfunded liability in the investee, and there is a clear intention of the Bank to maintain its financial support for it.
It should no longer be accounted for under the equity method of accounting, equity interest in aÌliated companies and be equated with actual and clear evidence of loss of continuity of operations or in the event that they are operating under severe long-term restrictions that significantly ability to transfer funds to the investor.
In situations where valuation by the equity method is not applicable, financial assets are recorded at acquisition cost, less provisions for losses.
When it is denominated in foreign currency, it is subject to exchange rate adjustment, and the result of this exchange rate adjustment is reflected in a specific heading in own funds.
Participations in other companiesInvestments in companies in which the Bank holds, directly or indirectly, less than 10% of its voting capital are considered as participations in other companies.
Participations in other companies are measured at acquisition cost, less the provision for losses.
The income from these investments, related to declared dividends, must be considered directly in the income for the year. Shares acquired with proposed and unpaid dividends (ex-dividend) must have such dividends recognized as cost of acquisition against the respective account in the result for the year.
When it is denominated in foreign currency, it is subject to exchange rate adjustment, and the result of this exchange rate adjustment is reflected in a specific heading in own funds.
Other investmentsThis heading includes rights of any not classifiable nature in other asset items, or in tangible or intangible assets, such as artistic assets.
f) Intangible and tangible fixed assets
BANC — Annual Report, 2016 193
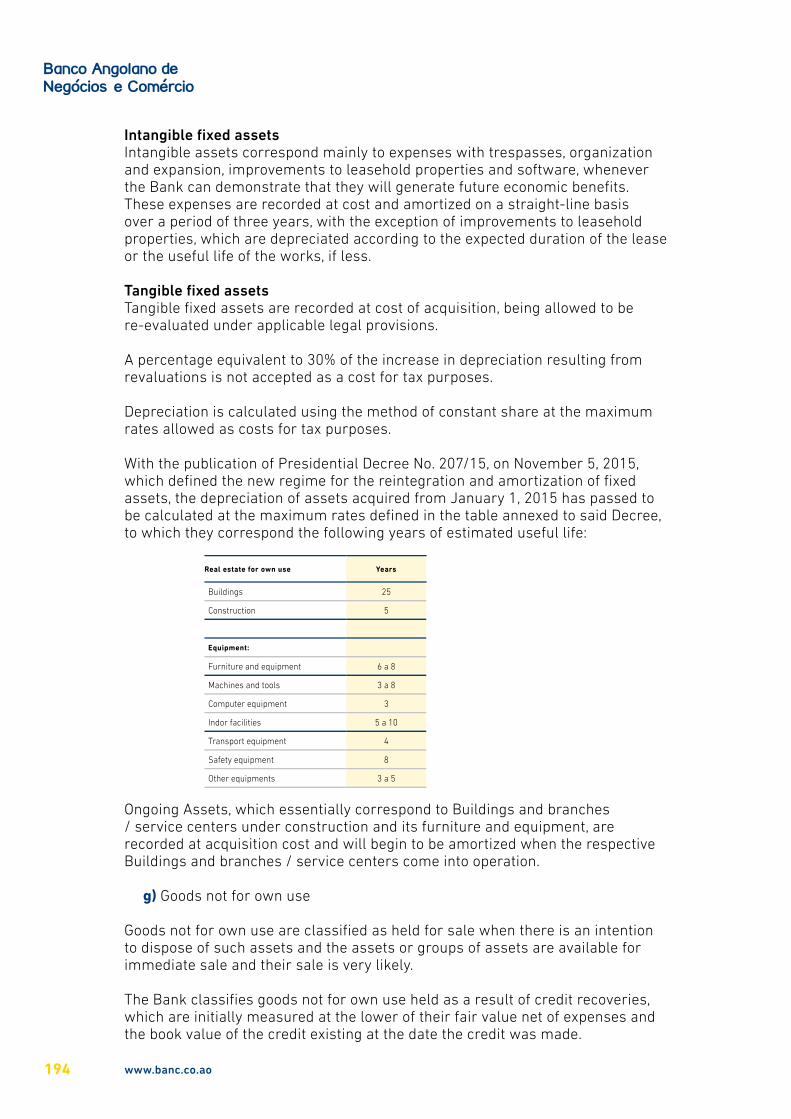
Intangible fixed assetsIntangible assets correspond mainly to expenses with trespasses, organization and expansion, improvements to leasehold properties and software, whenever the Bank can demonstrate that they will generate future economic benefits. These expenses are recorded at cost and amortized on a straight-line basis over a period of three years, with the exception of improvements to leasehold properties, which are depreciated according to the expected duration of the lease or the useful life of the works, if less.
Tangible fixed assetsTangible fixed assets are recorded at cost of acquisition, being allowed to be re-evaluated under applicable legal provisions.
A percentage equivalent to 30% of the increase in depreciation resulting from revaluations is not accepted as a cost for tax purposes.
Depreciation is calculated using the method of constant share at the maximum rates allowed as costs for tax purposes.
With the publication of Presidential Decree No. 207/15, on November 5, 2015, which defined the new regime for the reintegration and amortization of fixed assets, the depreciation of assets acquired from January 1, 2015 has passed to be calculated at the maximum rates defined in the table annexed to said Decree, to which they correspond the following years of estimated useful life:
Real estate for own use Years
Buildings 25
Construction 5
Equipment:
Furniture and equipment 6 a 8
Machines and tools 3 a 8
Computer equipment 3
Indor facilities 5 a 10
Transport equipment 4
Safety equipment 8
Other equipments 3 a 5
Ongoing Assets, which essentially correspond to Buildings and branches / service centers under construction and its furniture and equipment, are recorded at acquisition cost and will begin to be amortized when the respective Buildings and branches / service centers come into operation.
g) Goods not for own use
Goods not for own use are classified as held for sale when there is an intention to dispose of such assets and the assets or groups of assets are available for immediate sale and their sale is very likely.
The Bank classifies goods not for own use held as a result of credit recoveries, which are initially measured at the lower of their fair value net of expenses and the book value of the credit existing at the date the credit was made.
194 www.banc.co.ao
In addition, goods not for own use are classifieid when there is property that is not part of the BANC’s premises, nor is it intended for the pursuit of its corporate purpose.
Fair value is based on market value, which is determined based on the expected sales price obtained through periodic evaluations conducted by the Bank.
Subsequent measurement of these assets is carried out at the lower of their book value and the corresponding fair value, net of expenses, and are not subject to amortization. In the event of unrealized losses, these are recorded as impairment losses against income for the year.
h) Reduction in the recoverable value of other assets (impairment)
The Bank periodically evaluates its assets, especially when preparing financial statements, in order to identify assets that have a recoverable value lower than the book value. The recognition of the reduction in the book value (impairment) of an asset occurs, whenever its book value exceeds the recoverable value, by a counterpart of results.
In assessing impairment, the institution shall consider, as a minimum, the following:
1) Significant decline in the value of an asset, greater than expected in its normal use;
2) Significant changes in the technological, economic or legal environment, with adverse eÎects on the Bank;
3) Increase in interest rates or other market rates, with eÎect on discount rates and consequent reduction in the present value or the recoverable value of the assets;
4) Net book value of assets greater than the market value;
5) Available evidence of obsolescence or loss of physical capacity of an asset;
6) Significant changes in the way the asset is used, such as discontinuance or restructuring, with adverse eÎects to the Bank;
7) Indication that the economic performance of the asset will be worse than expected.
i) Reserve for monetary restatement and own funds
Pursuant to Bank of Angola Notice No. 2/2009, of May 8, on monetary updating, which revoked Notice no. 19/2007, of September 26, financial entities should, in existence of inflation, consider monthly the eÎects of the change in the purchasing power of the national currency, based on the application of the Consumer Price Index, fixed assets and capital balances, reserves and retained earnings.
The financial statements of an entity whose functional currency is the currency of a hyperinflationary economy shall be expressed in terms of the measurement
BANC — Annual Report, 2016 195
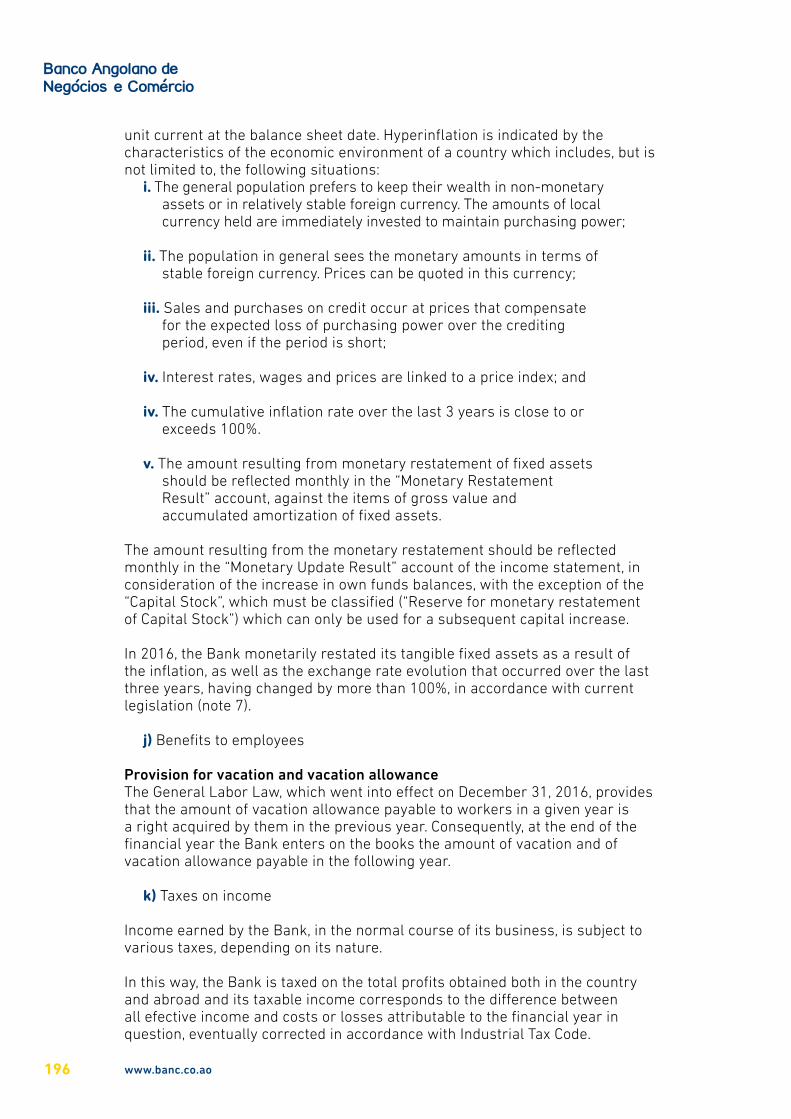
unit current at the balance sheet date. Hyperinflation is indicated by the characteristics of the economic environment of a country which includes, but is not limited to, the following situations:
i. The general population prefers to keep their wealth in non-monetary assets or in relatively stable foreign currency. The amounts of local currency held are immediately invested to maintain purchasing power;
ii. The population in general sees the monetary amounts in terms of stable foreign currency. Prices can be quoted in this currency;
iii. Sales and purchases on credit occur at prices that compensate for the expected loss of purchasing power over the crediting period, even if the period is short;
iv. Interest rates, wages and prices are linked to a price index; and
iv. The cumulative inflation rate over the last 3 years is close to or exceeds 100%.
v. The amount resulting from monetary restatement of fixed assets should be reflected monthly in the “Monetary Restatement Result” account, against the items of gross value and accumulated amortization of fixed assets.
The amount resulting from the monetary restatement should be reflected monthly in the “Monetary Update Result” account of the income statement, in consideration of the increase in own funds balances, with the exception of the “Capital Stock”, which must be classified (“Reserve for monetary restatement of Capital Stock”) which can only be used for a subsequent capital increase.
In 2016, the Bank monetarily restated its tangible fixed assets as a result of the inflation, as well as the exchange rate evolution that occurred over the last three years, having changed by more than 100%, in accordance with current legislation (note 7).
j) Benefits to employees
Provision for vacation and vacation allowanceThe General Labor Law, which went into eÎect on December 31, 2016, provides that the amount of vacation allowance payable to workers in a given year is a right acquired by them in the previous year. Consequently, at the end of the financial year the Bank enters on the books the amount of vacation and of vacation allowance payable in the following year.
k) Taxes on income
Income earned by the Bank, in the normal course of its business, is subject to various taxes, depending on its nature.
In this way, the Bank is taxed on the total profits obtained both in the country and abroad and its taxable income corresponds to the diÎerence between all efective income and costs or losses attributable to the financial year in question, eventually corrected in accordance with Industrial Tax Code.
196 www.banc.co.ao
The Bank is subject to taxation in Industrial Tax, being considered a taxpayer of Group A. The taxation of its income is carried out in accordance with the new Industrial Tax Code, approved by Law no. 19/14, of October 22, 2014, which entered into force on January 1, 2015 and sets the new 30% tax rate (see note 23). In this fiscal year, the Bank presented tax losses, and therefore no estimate of tax payable was made.
Tax losses calculated in a given year, as provided for in article 48 of the Industrial Tax Code, may be deducted from the taxable profits of the three subsequent years.
Tax declarations are subject to review and correction by the tax authorities for a period of 5 years and may result, due to diÎerent interpretations of tax legislation, in any corrections to taxable income for the years 2012 to 2016. However, it is not predictable that any correction relating to these years will occur and, if it occurs, no significant impacts are expected on the Financial Statements.
The income from public debt securities resulting from Treasury Bonds and Treasury Bills issued by the Angolan State, whose issuance is regulated by the Framework Law on Direct Public Debt (Law No. 16/02 of December 5), as well as by Regulatory Decrees number 51/03 and 52/03, of 8 July, benefit exemption from all taxes. This fact is complemented by the provision in paragraph c) of number 1 of Article 23 of the Industrial Tax Code, where it is expressly stated that income derived from any Angolan public debt securities is not considered as income for purposes of tax clearance Industrial to pay. Therefore, in determining taxable income for the years ended December 31, 2016 and 2015, such income was deducted from taxable income.
Current TaxCurrent tax is calculated based on taxable income for the year, which diÎers from the accounting result due to adjustments resulting from costs or income not relevant to tax purposes or that will only be considered in other accounting periods.
Deferred taxThe total income tax recorded in the income statement includes current and deferred taxes.
Deferred taxes correspond to the impact on the tax recoverable / payable in future periods resulting from deductible or taxable temporary diÎerences between the balance sheet value of the assets and liabilities and their tax base used to determine the taxable profit. Deferred tax assets and liabilities are calculated based on the tax rates in force for the period in which the respective asset or liability is expected to be realized. Reportable tax losses also give rise to deferred tax assets.
Deferred tax liabilities are normally recorded for all taxable temporary diÎerences, whereas deferred tax assets are only recognized up to the amount at which it is probable that future taxable profits will exist that allow the use of the corresponding deductible tax diÎerences or the reporting of tax losses. In addition, no deferred tax assets are recorded in cases where their recoverability may be questionable due to other situations, including questions of interpretation of the tax legislation in force.
BANC — Annual Report, 2016 197
However, deferred tax assets or liabilities relating to temporary diÎerences arising from the initial recognition of assets and liabilities are not recorded in transactions that do not aÎect the accounting result or taxable income.
Capital Gains TaxFollowing the line defined by the Tax Reform project, Presidential Legislative Decree No. 2/14 of 20 October was published in the Diário da República, which reviews and republishes the Tax Code on the Application of Capital (“IAC”), in force since 19 November 2014.
Presidential Legislative Decree No. 2/14 of 20 October, in force since 19 November, has come to review and introduce various legislative amendments to the IAC Code, following the Tax Reform project.
The IAC relates generally to income from the Bank’s financial investments. The rate ranges from 5% (in the case of interest paid on public debt securities with a maturity of three years or more) and 15%. Notwithstanding the foregoing, with respect to income from public debt securities, as previously mentioned, according to the last understanding of the Tax Authorities and the Banco Nacional de Angola addressed to ABANC (letter from the Banco Nacional de Angola, dated September 26, 2013), only those arising from securities issued on or after January 1, 2013 are subject to this tax.
The IAC has the nature of payment on account of the Industrial Tax, operating this compensation by means of the deduction to the collection that will be determined, in accordance with paragraph a) of number 81 of the Industrial Tax Code.
Urban Real Estate Tax According to the changes introduced by Law no. 18/11, of April 21, to the Urban Real Estate Tax Code (“IPU”), leasehold income levied is IPU, at the rate of 15%.
On the other hand, under the terms of article 23 of the Industrial Tax Code, the income that is subject to IPU is not considered income or gains of the fiscal year for the purposes of calculating the tax due.
l) Taxes on Assets
Urban Real Estate TaxIn view of the wording introduced by Law no. 18/11, of April 21, the exemption previously provided in the IPU Regulation was revoked, with IPU being levied at a rate of 0.5% on the book value of own properties which are intended to develop the normal business of the Bank (in excess of AKZ 5,000,000).
SISAPursuant to Legislative Decree no. 230 of 18 May 1931, as well as the amendments introduced by Law no. 15/92 of 3 July and Law no. 16/11 of 21 April , SISA shall cover all acts involving the perpetual or temporary transfer of ownership of any value, kind or nature, regardless of the name or form of the title (eg acts that aÎect the transmission of improvements in rural or urban buildings, transmissions real estate through donations with pensions or the transfer of real estate through donations) at the rate of 2%.
198 www.banc.co.ao
m) Other Taxes
The Bank is also subject to indirect taxes, such as customs duties, Stamp Duty, Consumption Tax, and other taxes.
n) Tax substitution
Capital Gains Tax According to Presidential Legislative Decree No. 2/14, dated October 20, the Bank proceeds to IAC withholding, at the rate of 10%, of the interest on term deposits paid to clients.
Stamp Duty According to Presidential Legislative Decree 3/14 of 21 October, the Bank is responsible for the settlement and delivery of Stamp Duty due by its clients in all banking operations (eg, financing, interest collection financing commissions, financial services commissions), proceeding to settle the tax at the rates set forth in the Stamp Tax Table.
Industrial TaxIn accordance with Article 67 of Law No. 19/14 of 22 October, the eÎective taxation of services contracted by the Bank is subject to withholding tax on certain services, at the rate of 6.5%.
Urban Real Estate TaxPursuant to Law No. 18/11, of April 21, the Bank proceeds withholding of the IPU due, at the rate of 15%, on the payment or delivery of rents related to rented properties.
o) Provisions and contingencies
ProvisionsProvisions represent probable liabilities with estimated terms and amounts. Provisions are recognized when (i) the Bank has a present legal or constructive obligation, (ii) it is probable that its payment will be required and (iii) when a reliable estimate of the amount of that obligation can be made. The amount of the provision corresponds to the best estimate of the amount to be disbursed to settle the liability, at the balance sheet date.
Passive ContingentIf the Bank has a liability in which the future expenditure of resources is not probable, it is a contingency liability. Passive contingencies are only subject to disclosure, unless the possibility of their realization is remote.
Passive contingencies are recognized in oÎ-balance-sheet accounts when (i) the Bank has a possible present obligation whose existence will be confirmed only by the occurrence or not of one or more future events that are not under the control of the Bank; (ii) a present obligation that arises from past events but is not recognized because it is not probable that the Bank has to settle it or the amount of the obligation cannot be measured with suÌcient security.
BANC — Annual Report, 2016 199
The contingent liabilities are reassessed periodically to determine if the previous continuous valuation is valid. If it is probable that an outflow of resources will be required for an item previously treated as a contingent liability, a provision is recognized in the financial statements for the period in which the change in the probability estimate occurs.
Active contingenciesAn active contingency is a possible present asset arising from past events whose existence will be confirmed only by the occurrence or not of one or more future events that are not wholly under the control of the institution. The active contingencies are only disclosed and recognized in oÎ-balance-sheet accounts, unless the possibility of their realization is remote.
The active contingencies should be periodically reassessed to determine if the initial valuation is still valid. If it is practically certain that an inflow of resources will occur on account of an asset, an asset that is previously classified as probable, the asset and the corresponding gain must be recognized in the financial statements for the period in which the change of estimate occurs.
p) Recognition of income from services and commissions
Commissions for services rendered are normally recognized as income over the period of service provision or in a single time, if they result from the execution of single acts.
q) Earnings per share
Earnings per share are calculated by dividing net income attributable to shareholders of the Bank by the weighted average number of ordinary shares outstanding in the year, excluding the average number of ordinary shares purchased by the Bank and held as treasury shares.
If the result per share is changed as a result of a premium or discount issue or other event that changes the potential number of ordinary shares or changes in accounting policies, the calculation of earnings per share for all periods presented is retrospectively adjusted.
r) Distribution of dividends
Dividends are recognized as liabilities and deducted from shareholders’ equity after approval by the shareholders.
s) Main estimates and uncertainties associated with the application of accounting policies
The Bank’s accounts include estimates made under conditions of uncertainty, which require the Board of Directors to use the judgment in order to determine the appropriate estimate.
Thus, in some situations, the estimates determined by the Bank’s Board of Directors could be diÎerent if a diÎerent judgment were made. The Board
200 www.banc.co.ao
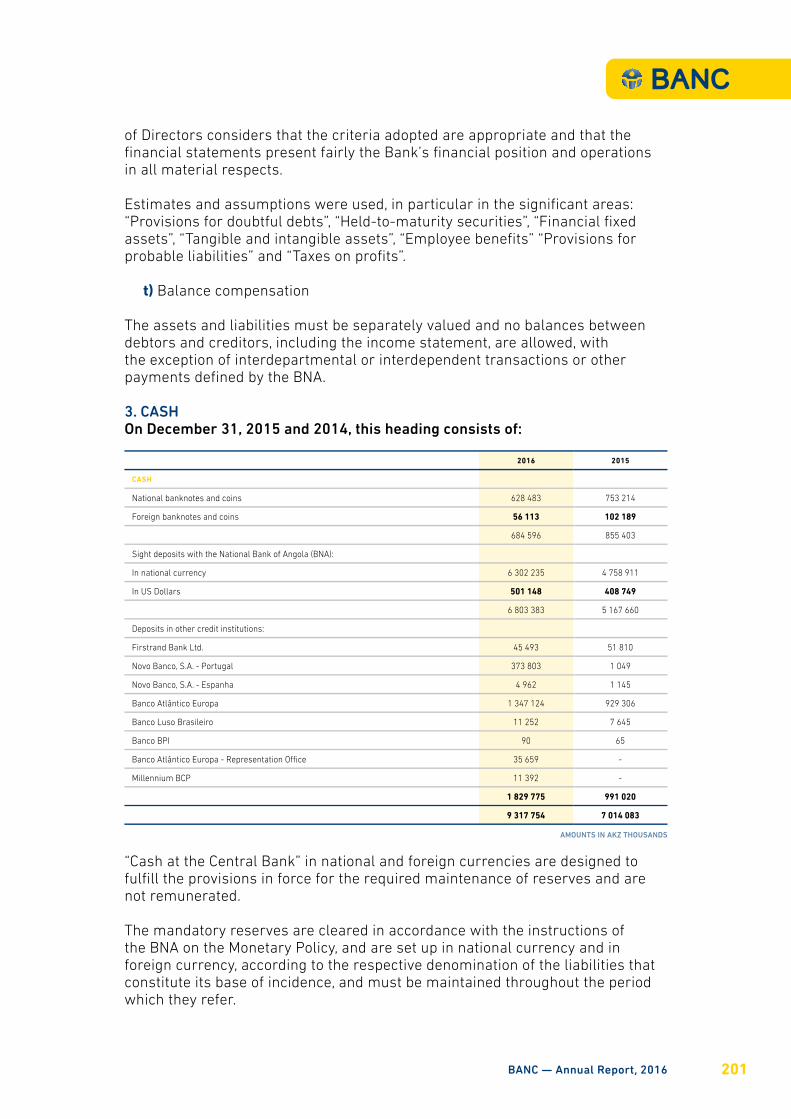
of Directors considers that the criteria adopted are appropriate and that the financial statements present fairly the Bank’s financial position and operations in all material respects.
Estimates and assumptions were used, in particular in the significant areas: “Provisions for doubtful debts”, “Held-to-maturity securities”, “Financial fixed assets”, “Tangible and intangible assets”, “Employee benefits” “Provisions for probable liabilities” and “Taxes on profits”.
t) Balance compensation
The assets and liabilities must be separately valued and no balances between debtors and creditors, including the income statement, are allowed, with the exception of interdepartmental or interdependent transactions or other payments defined by the BNA.
3. CASHOn December 31, 2015 and 2014, this heading consists of:
2016 2015
CASH
National banknotes and coins 628 483 753 214
Foreign banknotes and coins 56 113 102 189
684 596 855 403
Sight deposits with the National Bank of Angola (BNA):
In national currency 6 302 235 4 758 911
In US Dollars 501 148 408 749
6 803 383 5 167 660
Deposits in other credit institutions:
Firstrand Bank Ltd. 45 493 51 810
Novo Banco, S.A. - Portugal 373 803 1 049
Novo Banco, S.A. - Espanha 4 962 1 145
Banco Atlântico Europa 1 347 124 929 306
Banco Luso Brasileiro 11 252 7 645
Banco BPI 90 65
Banco Atlântico Europa - Representation OÌce 35 659 -
Millennium BCP 11 392 -
1 829 775 991 020
9 317 754 7 014 083
AMOUNTS IN AKZ THOUSANDS
“Cash at the Central Bank” in national and foreign currencies are designed to fulfill the provisions in force for the required maintenance of reserves and are not remunerated.
The mandatory reserves are cleared in accordance with the instructions of the BNA on the Monetary Policy, and are set up in national currency and in foreign currency, according to the respective denomination of the liabilities that constitute its base of incidence, and must be maintained throughout the period which they refer.
BANC — Annual Report, 2016 201

At December 31, 2016, the required reserve requirements were calculated by applying a rate of 30.0% on the arithmetic mean of the daily balances of the eligible liabilities in national currency and 15% on the arithmetic mean of the balances of the eligible liabilities in foreign currency, with the exception of Central Government deposits, where a 75% rate applies and Local Governments and Municipal Administrations, whose rates are 50% for deposits in national currency and 100% for foreign currency. In the last week of 2016 the total mandatory reserves were 6,095,419 mAKZ.
At December 31, 2016 and 2015, “Cash at other credit institutions” are also unpaid.
4. SECURITIESOn December 31, 2016 and 2015, the composition of the securities in portfolio is presented as follows:
2015
Interest rate
Interest rate
Exchange fluctuation
Interests Balance sheet value
Securities held to maturity - - - - -
Treasury bonds in national currency indexed to the ex-change rate of the U.S. Dollar
- - - - -
Treasury bonds in foreign currency - - - - -
Treasury bills in national currency - - - - -
Committed - - - - -
Not committed 6% 810 158 - 28 014 838 172
Exchange rate fluctuation - - - - -
Non-adjustable T. Bonds 6% 404 459 - 9 523 413 712
1 214 617 37 267 1 251 884
2016
Interest rate
Interest rate
Exchange fluctuation
Interests Balance sheet value
Securities held to maturity - - - - -
Treasury bonds in national currency indexed to the ex-change rate of the U.S. Dollar
- - - -
Treasury bonds in foreign currency 5% 373 282 - - 373 282
Treasury bills in national currency - - - - -
Committed 17% 300 000 - 10 556 310 556
Not committed - - - - -
Exchange rate fluctuation - - - - -
Non-adjustable T. Bonds - - - - -
673 282 10 556 683 838
AMOUNTS IN AKZ THOUSANDS
The Bank classifies the Angolan State and BNA debt securities at risk level A.
At December 31, 2016, compared to December 31, 2015, there was no migration of the risk level of issuers.
202 www.banc.co.ao
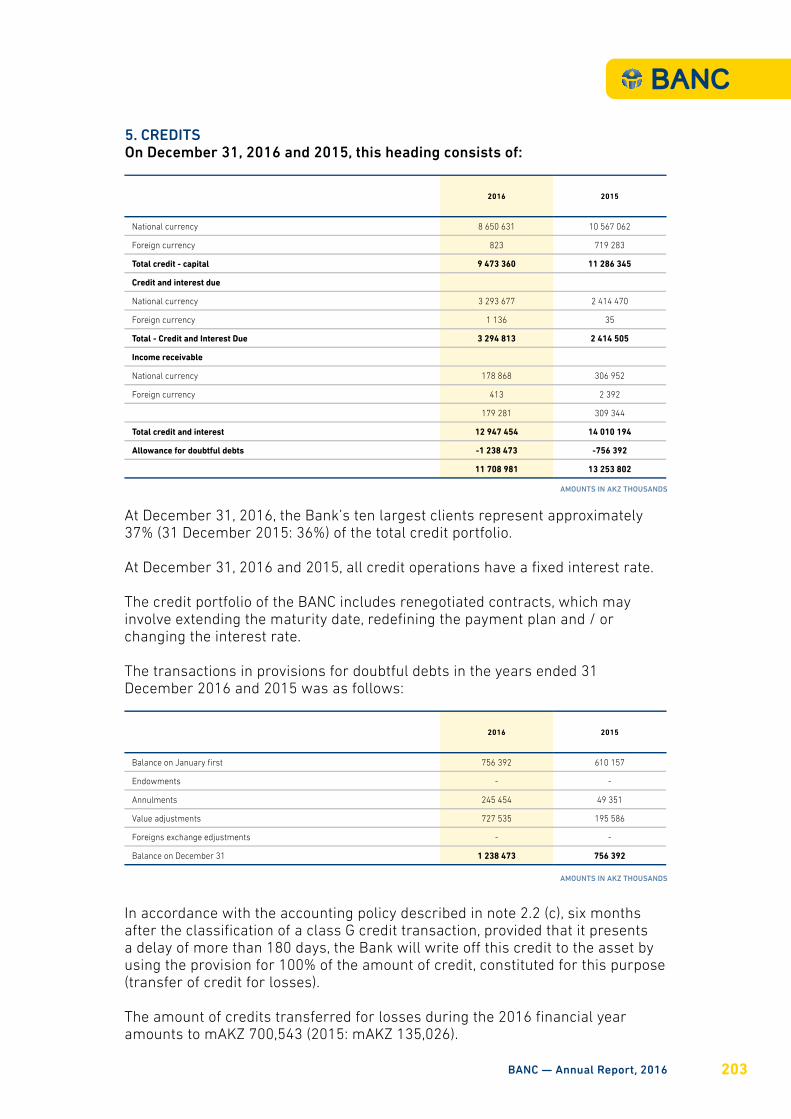
5. CREDITSOn December 31, 2016 and 2015, this heading consists of:
At December 31, 2016, the Bank’s ten largest clients represent approximately 37% (31 December 2015: 36%) of the total credit portfolio.
At December 31, 2016 and 2015, all credit operations have a fixed interest rate.
The credit portfolio of the BANC includes renegotiated contracts, which may involve extending the maturity date, redefining the payment plan and / or changing the interest rate.
The transactions in provisions for doubtful debts in the years ended 31 December 2016 and 2015 was as follows:
2016 2015
National currency 8 650 631 10 567 062
Foreign currency 823 719 283
Total credit - capital 9 473 360 11 286 345
Credit and interest due
National currency 3 293 677 2 414 470
Foreign currency 1 136 35
Total - Credit and Interest Due 3 294 813 2 414 505
Income receivable
National currency 178 868 306 952
Foreign currency 413 2 392
179 281 309 344
Total credit and interest 12 947 454 14 010 194
Allowance for doubtful debts -1 238 473 -756 392
11 708 981 13 253 802
AMOUNTS IN AKZ THOUSANDS
2016 2015
Balance on January first 756 392 610 157
Endowments - -
Annulments 245 454 49 351
Value adjustments 727 535 195 586
Foreigns exchange edjustments - -
Balance on December 31 1 238 473 756 392
AMOUNTS IN AKZ THOUSANDS
In accordance with the accounting policy described in note 2.2 (c), six months after the classification of a class G credit transaction, provided that it presents a delay of more than 180 days, the Bank will write oÎ this credit to the asset by using the provision for 100% of the amount of credit, constituted for this purpose (transfer of credit for losses).
The amount of credits transferred for losses during the 2016 financial year amounts to mAKZ 700,543 (2015: mAKZ 135,026).
BANC — Annual Report, 2016 203

6. OTHER AMOUNTSOn December 31, 2016 and 2015, this heading consists of:
At December 31, 2016 and 2015, the balances of “Outstanding transactions”, “Sundry debtors” and “Other deferrals”, recorded transactions not yet analyzed and resulted from the implementation of the new information system in 2016 and the integration of information in the old information system.
Administration continues to analyze and correct the content of these accounts, and it is expected that during 2017, these situations will be regularized.
2016 2015
Debtors
Taxes to be OÎset 7 198 4 324
7 198 4 324
Operation to be settled 2 822 150 -
ABANC Fund 528 105 519 811
Sundry Debtors 2 091 682 362 804
Other Values 319 069 116 958
5 761 006 4 269 573
Deferred costs
Rents and leases 129 542 121 652
Insurance 90 624 84 769
Advertisement Campaigns 83 092 96 619
Other diferrals 1 689 219 -
Representation OÌce 7 413 -
OÌce Supplies 95 228 79 919
2 095 118 382 959
Goods not for own use 164 351 164 351
Land to Pawn 164 351 164 351
Provision for losses - 3 428
Provision for losses in Materials - 3 428
Industrial and Commercial Inventory
Advances to suppliers - 3 084
8 027 673 4 820 863
AMOUNTS IN AKZ THOUSANDS
204 www.banc.co.ao
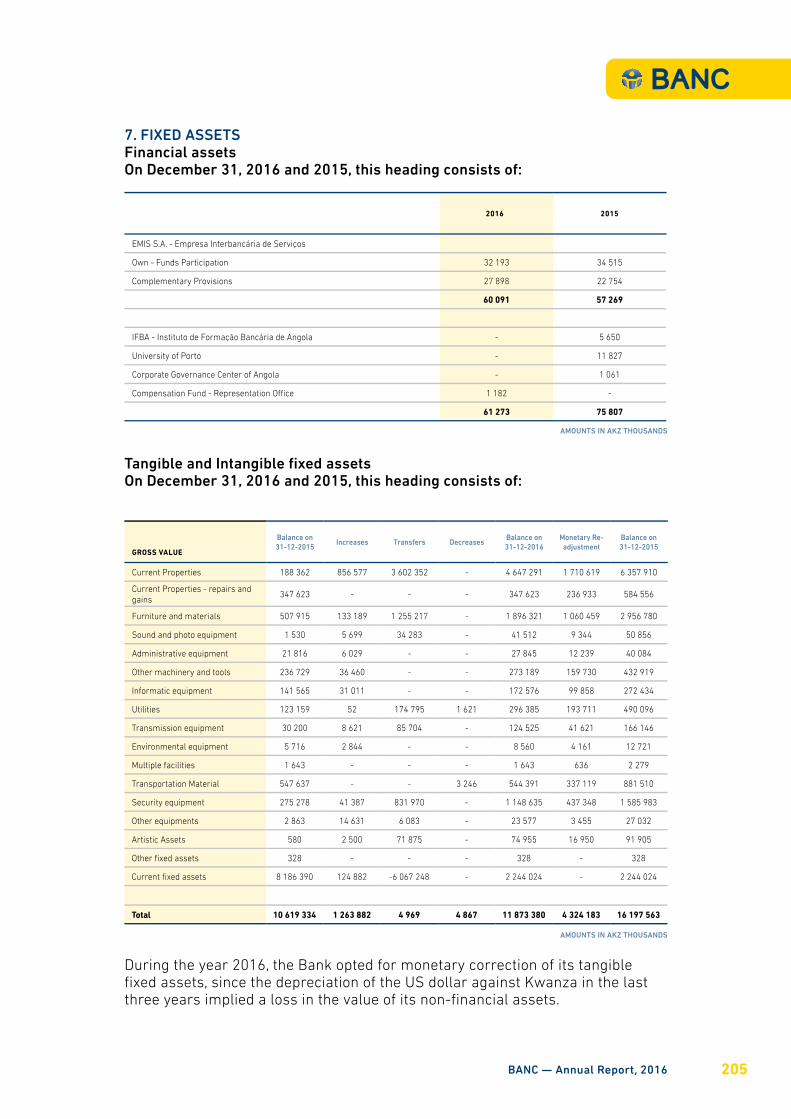
7. FIXED ASSETSFinancial assetsOn December 31, 2016 and 2015, this heading consists of:
Tangible and Intangible fixed assetsOn December 31, 2016 and 2015, this heading consists of:
2016 2015
EMIS S.A. - Empresa Interbancária de Serviços
Own - Funds Participation 32 193 34 515
Complementary Provisions 27 898 22 754
60 091 57 269
IFBA - Instituto de Formação Bancária de Angola - 5 650
University of Porto - 11 827
Corporate Governance Center of Angola - 1 061
Compensation Fund - Representation OÌce 1 182 -
61 273 75 807
AMOUNTS IN AKZ THOUSANDS
GROSS VALUE
Balance on 31-12-2015
Increases Transfers DecreasesBalance on 31-12-2016
Monetary Re-adjustment
Balance on 31-12-2015
Current Properties 188 362 856 577 3 602 352 - 4 647 291 1 710 619 6 357 910
Current Properties - repairs and gains
347 623 - - - 347 623 236 933 584 556
Furniture and materials 507 915 133 189 1 255 217 - 1 896 321 1 060 459 2 956 780
Sound and photo equipment 1 530 5 699 34 283 - 41 512 9 344 50 856
Administrative equipment 21 816 6 029 - - 27 845 12 239 40 084
Other machinery and tools 236 729 36 460 - - 273 189 159 730 432 919
Informatic equipment 141 565 31 011 - - 172 576 99 858 272 434
Utilities 123 159 52 174 795 1 621 296 385 193 711 490 096
Transmission equipment 30 200 8 621 85 704 - 124 525 41 621 166 146
Environmental equipment 5 716 2 844 - - 8 560 4 161 12 721
Multiple facilities 1 643 - - - 1 643 636 2 279
Transportation Material 547 637 - - 3 246 544 391 337 119 881 510
Security equipment 275 278 41 387 831 970 - 1 148 635 437 348 1 585 983
Other equipments 2 863 14 631 6 083 - 23 577 3 455 27 032
Artistic Assets 580 2 500 71 875 - 74 955 16 950 91 905
Other fixed assets 328 - - - 328 - 328
Current fixed assets 8 186 390 124 882 -6 067 248 - 2 244 024 - 2 244 024
Total 10 619 334 1 263 882 4 969 4 867 11 873 380 4 324 183 16 197 563
AMOUNTS IN AKZ THOUSANDS
During the year 2016, the Bank opted for monetary correction of its tangible fixed assets, since the depreciation of the US dollar against Kwanza in the last three years implied a loss in the value of its non-financial assets.
BANC — Annual Report, 2016 205

The Bank has constructed a monetary restatement index based on a series of US dollar quotation against Kwanza for the past seven years.
As defined in CONTIF, the variation resulting from this monetary correction, which occurred during the year 2016, was recognized in the results for the year.
The amount of the monetary correction recognized in results in 2016 was mAKZ 3,468,726.
COMPOUNDED AMORTIZATION
Balance on 31-12-2015
Depreciation DecreasesBalance on 31-12-2016
Monetary Readjustment
Readjusted Balance on 31-12-2016
Current Properties -17 669 -18 630 - -36 299 -16 676 -52 975
Current Properties - repairs and gains -46 725 -13 905 - -60 630 -44 001 -104 631
Furniture and materials -195 497 -62 961 - -258 458 -189 252 -447 710
Sound and photo equipment -1 279 -738 - -2 017 -1 532 -3 549
Administrative equipment -7 833 -3 434 - -11 267 -7 704 -18 971
Other machinery and tools -82 564 -29 852 - -112 416 -80 356 -192 772
Informatic equipment -75 741 -23 086 360 -98 467 -72 673 -171 140
Utilities -45 105 -16 666 1 232 -60 539 -43 751 -104 290
Transmission equipment -16 261 -5 614 - -21 875 -15 166 -37 041
Environmental equipment -1 429 -634 - -2 063 -1 744 -3 807
Multiple facilities -311 -194 - -505 -275 -780
Transportation Material -348 674 -99 623 3 246 -445 051 -299 530 -744 581
Security equipment -85 704 -42 433 - -128 137 -81 629 -209 766
Other equipments -1 282 -2 442 - -3 724 -1 168 -4 892
Artistic Assets - -620 - -620 - -620
Other fixed assets -90 -33 - -123 - -123
-926 164 -320 865 4 838 -1 242 191 -855 457 -2 097 648
Net Values 9 693 170 10 631 189 3 468 726 14 099 915
AMOUNTS IN AKZ THOUSANDS
206 www.banc.co.ao
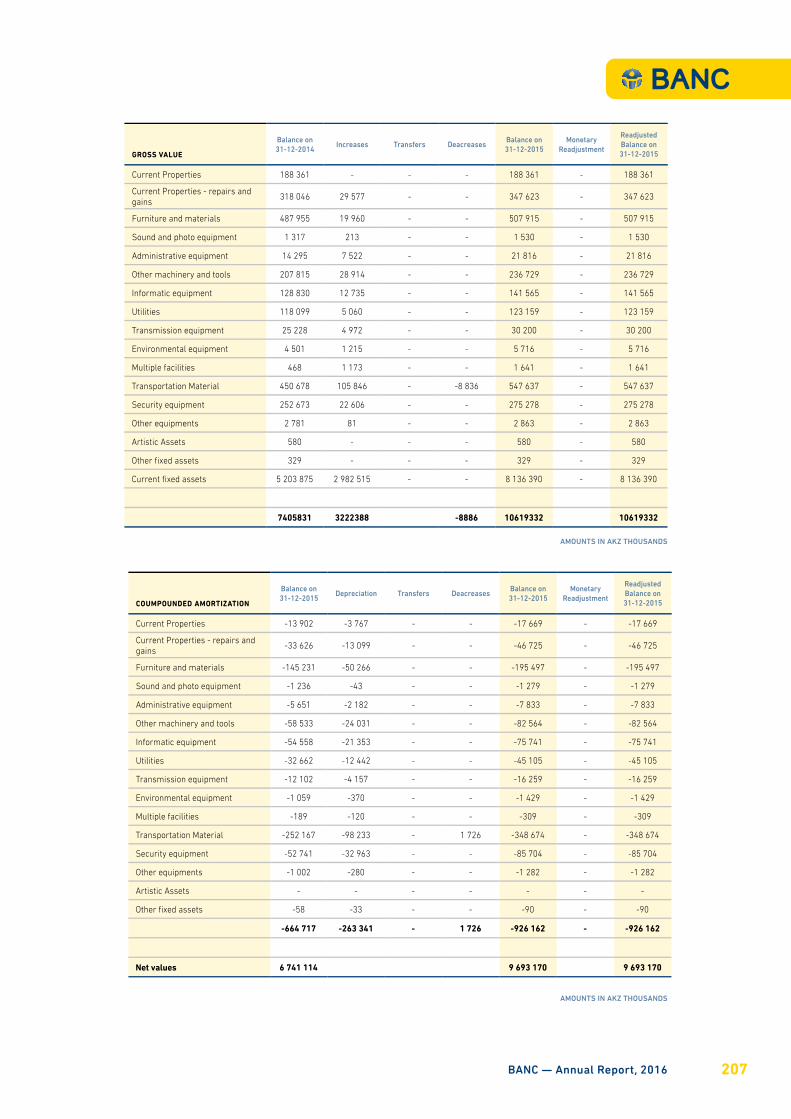
GROSS VALUE
Balance on 31-12-2014
Increases Transfers DeacreasesBalance on 31-12-2015
Monetary Readjustment
Readjusted Balance on 31-12-2015
Current Properties 188 361 - - - 188 361 - 188 361
Current Properties - repairs and gains
318 046 29 577 - - 347 623 - 347 623
Furniture and materials 487 955 19 960 - - 507 915 - 507 915
Sound and photo equipment 1 317 213 - - 1 530 - 1 530
Administrative equipment 14 295 7 522 - - 21 816 - 21 816
Other machinery and tools 207 815 28 914 - - 236 729 - 236 729
Informatic equipment 128 830 12 735 - - 141 565 - 141 565
Utilities 118 099 5 060 - - 123 159 - 123 159
Transmission equipment 25 228 4 972 - - 30 200 - 30 200
Environmental equipment 4 501 1 215 - - 5 716 - 5 716
Multiple facilities 468 1 173 - - 1 641 - 1 641
Transportation Material 450 678 105 846 - -8 836 547 637 - 547 637
Security equipment 252 673 22 606 - - 275 278 - 275 278
Other equipments 2 781 81 - - 2 863 - 2 863
Artistic Assets 580 - - - 580 - 580
Other fixed assets 329 - - - 329 - 329
Current fixed assets 5 203 875 2 982 515 - - 8 136 390 - 8 136 390
7405831 3222388 -8886 10619332 10619332
AMOUNTS IN AKZ THOUSANDS
COUMPOUNDED AMORTIZATION
Balance on 31-12-2015
Depreciation Transfers DeacreasesBalance on 31-12-2015
MonetaryReadjustment
Readjusted Balance on 31-12-2015
Current Properties -13 902 -3 767 - - -17 669 - -17 669
Current Properties - repairs and gains
-33 626 -13 099 - - -46 725 - -46 725
Furniture and materials -145 231 -50 266 - - -195 497 - -195 497
Sound and photo equipment -1 236 -43 - - -1 279 - -1 279
Administrative equipment -5 651 -2 182 - - -7 833 - -7 833
Other machinery and tools -58 533 -24 031 - - -82 564 - -82 564
Informatic equipment -54 558 -21 353 - - -75 741 - -75 741
Utilities -32 662 -12 442 - - -45 105 - -45 105
Transmission equipment -12 102 -4 157 - - -16 259 - -16 259
Environmental equipment -1 059 -370 - - -1 429 - -1 429
Multiple facilities -189 -120 - - -309 - -309
Transportation Material -252 167 -98 233 - 1 726 -348 674 - -348 674
Security equipment -52 741 -32 963 - - -85 704 - -85 704
Other equipments -1 002 -280 - - -1 282 - -1 282
Artistic Assets - - - - - - -
Other fixed assets -58 -33 - - -90 - -90
-664 717 -263 341 - 1 726 -926 162 - -926 162
Net values 6 741 114 9 693 170 9 693 170
AMOUNTS IN AKZ THOUSANDS
BANC — Annual Report, 2016 207

During 2016 and 2015, the transactions in the headings of intangible and tangible fixed assets were as follows:
Balance on 31-12-2015
Increases Transfers DeacreasesBalance on 31-12-2016
Monetary Readjustment
Balance after Monetary
Readjustment
Software 253 299 10 072 - - 263 371 - 263 371
Incorporation Costs 68 079 - - - 68 079 - 68 079
Organization and Expansion Expenses
664 757 - - - 664 757 - 664 757
Improvments to leasehold proper-ties
1 870 377 - - - 1 870 377 - 1 870 377
Others 76 147 - - - 76 147 - 76 147
Current Fixed Assets 222 079 136 314 4 967 - 363 360 - 363 360
3 154 738 146 386 4 967 - 3 306 091 - 3 306 091
Balance on 31-12-2015
Depreciations DeacreasesBalance on 31-12-2016
Revaluated Balance
31-12-2016
Software -142 054 -36 178 - 178 232 178 232
Incorporation Costs -68 080 - - -68 080 68 080
Organization and Expansion Expenses
-198 045 -95 811 - -293 856 293 856
Improvements to leasehold properties
-231 297 -74 703 - -306 000 306 000
Others -23 916 -8 337 - -32 253 32 253
-663 392 -215 029 -878 421 878 421
Net Values 2 441 346 2 427 670 2 427 670
AMOUNTS IN AKZ THOUSANDS
Balance on 31-12-2014
Increases Transfers DecreasesBalance on 31-12-2015
Monetary Re-adjustment
Readjusted balance on 31-12-2015
Software 246 443 6 856 - - 253 299 - 253 299
Incorporation costs 68 080 - - - 68 080 - 68 080
Multiyear costs 593 396 71 361 - - 664 757 - 664 757
Works on leased buildings 1 734 670 135 707 - - 1 870 377 - 1 870 377
Other intangible fixed assets 93 577 - - -7 434 76 147 - 76 143
Current Fixed Assets 207 033 15 047 - - 222 079 - 222 079
2 933 198 228 971 - -7 434 3 154 735 - 3 154 735
Balance on 31-12-2014
Depreciations Transfers DecreasesBalance on 31-12-2015
Monetary Re-adjustment
Readjusted balance on 31-12-2015
Software -108 085 -33 969 - - -142 054 - -142 054
Constitution Expenses -66 043 -2 037 - - -68 080 - -68 080
Organization and expansion expenses
-108 608 -89 439 - - -198 045 - -198 047
Benefits on third parties properties -159 166 -72 131 - - -231 297 - -231 297
Others -14 089 -9 823 - - -23 912 - -23 912
-455 992 -207 398 - - -663 389 - -663 389
Net Values 2 477 206 2 491 346 2 491 346
AMOUNTS IN AKZ THOUSANDS
208 www.banc.co.ao
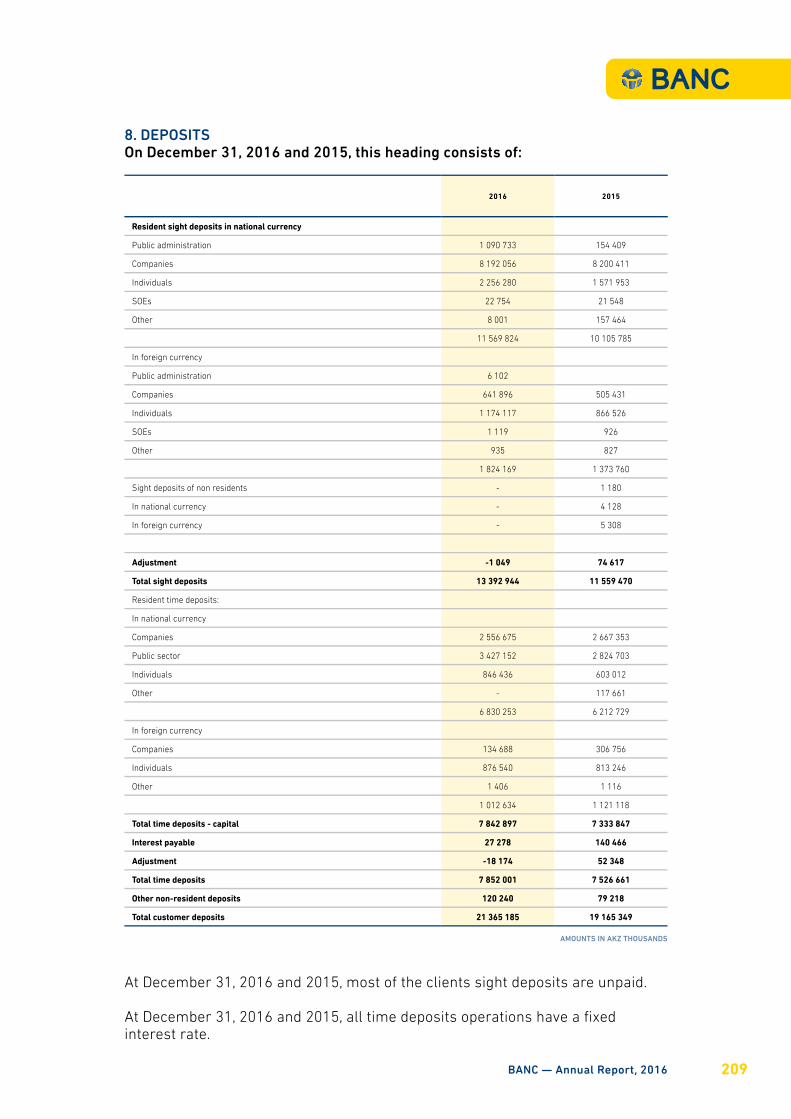
8. DEPOSITSOn December 31, 2016 and 2015, this heading consists of:
At December 31, 2016 and 2015, most of the clients sight deposits are unpaid.
At December 31, 2016 and 2015, all time deposits operations have a fixed interest rate.
2016 2015
Resident sight deposits in national currency
Public administration 1 090 733 154 409
Companies 8 192 056 8 200 411
Individuals 2 256 280 1 571 953
SOEs 22 754 21 548
Other 8 001 157 464
11 569 824 10 105 785
In foreign currency
Public administration 6 102
Companies 641 896 505 431
Individuals 1 174 117 866 526
SOEs 1 119 926
Other 935 827
1 824 169 1 373 760
Sight deposits of non residents - 1 180
In national currency - 4 128
In foreign currency - 5 308
Adjustment -1 049 74 617
Total sight deposits 13 392 944 11 559 470
Resident time deposits:
In national currency
Companies 2 556 675 2 667 353
Public sector 3 427 152 2 824 703
Individuals 846 436 603 012
Other - 117 661
6 830 253 6 212 729
In foreign currency
Companies 134 688 306 756
Individuals 876 540 813 246
Other 1 406 1 116
1 012 634 1 121 118
Total time deposits - capital 7 842 897 7 333 847
Interest payable 27 278 140 466
Adjustment -18 174 52 348
Total time deposits 7 852 001 7 526 661
Other non-resident deposits 120 240 79 218
Total customer deposits 21 365 185 19 165 349
AMOUNTS IN AKZ THOUSANDS
BANC — Annual Report, 2016 209
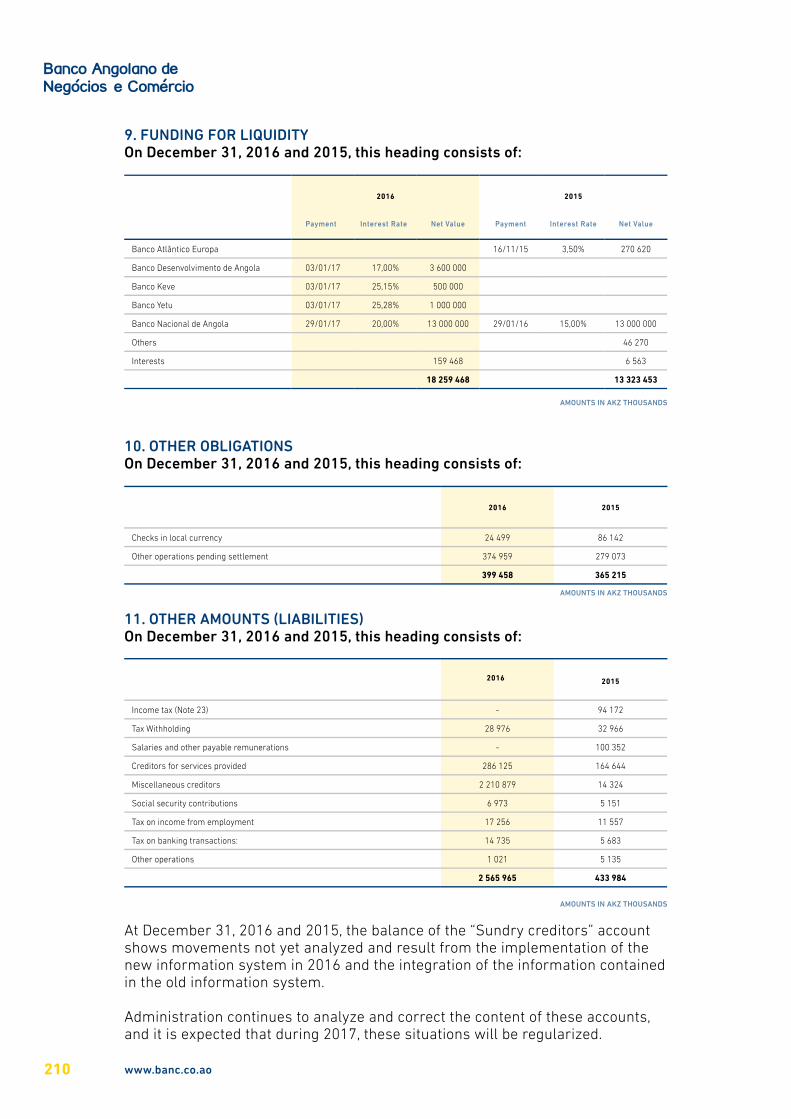
9. FUNDING FOR LIQUIDITYOn December 31, 2016 and 2015, this heading consists of:
2016 2015
Payment Interest Rate Net Value Payment Interest Rate Net Value
Banco Atlântico Europa 16/11/15 3,50% 270 620
Banco Desenvolvimento de Angola 03/01/17 17,00% 3 600 000
Banco Keve 03/01/17 25,15% 500 000
Banco Yetu 03/01/17 25,28% 1 000 000
Banco Nacional de Angola 29/01/17 20,00% 13 000 000 29/01/16 15,00% 13 000 000
Others 46 270
Interests 159 468 6 563
18 259 468 13 323 453
AMOUNTS IN AKZ THOUSANDS
10. OTHER OBLIGATIONSOn December 31, 2016 and 2015, this heading consists of:
2016 2015
Checks in local currency 24 499 86 142
Other operations pending settlement 374 959 279 073
399 458 365 215
AMOUNTS IN AKZ THOUSANDS
11. OTHER AMOUNTS (LIABILITIES)On December 31, 2016 and 2015, this heading consists of:
2016 2015
Income tax (Note 23) - 94 172
Tax Withholding 28 976 32 966
Salaries and other payable remunerations - 100 352
Creditors for services provided 286 125 164 644
Miscellaneous creditors 2 210 879 14 324
Social security contributions 6 973 5 151
Tax on income from employment 17 256 11 557
Tax on banking transactions: 14 735 5 683
Other operations 1 021 5 135
2 565 965 433 984
AMOUNTS IN AKZ THOUSANDS
At December 31, 2016 and 2015, the balance of the “Sundry creditors” account shows movements not yet analyzed and result from the implementation of the new information system in 2016 and the integration of the information contained in the old information system.
Administration continues to analyze and correct the content of these accounts, and it is expected that during 2017, these situations will be regularized.
210 www.banc.co.ao
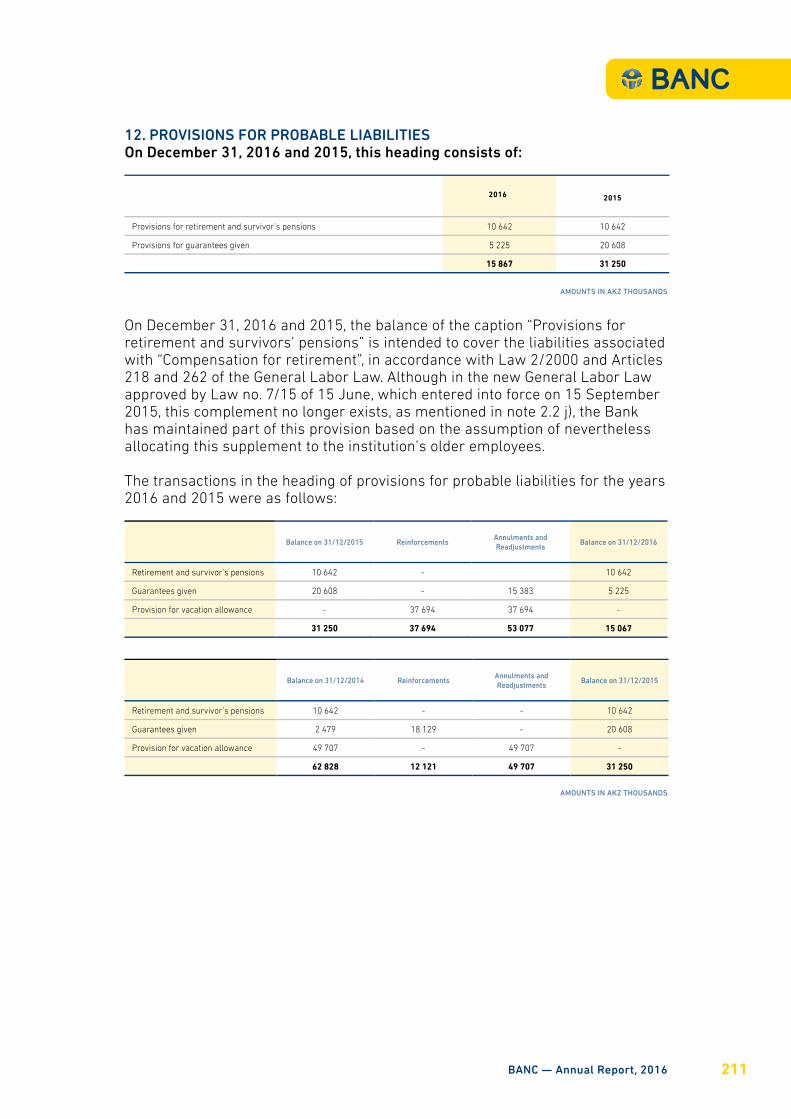
12. PROVISIONS FOR PROBABLE LIABILITIESOn December 31, 2016 and 2015, this heading consists of:
On December 31, 2016 and 2015, the balance of the caption “Provisions for retirement and survivors’ pensions” is intended to cover the liabilities associated with “Compensation for retirement”, in accordance with Law 2/2000 and Articles 218 and 262 of the General Labor Law. Although in the new General Labor Law approved by Law no. 7/15 of 15 June, which entered into force on 15 September 2015, this complement no longer exists, as mentioned in note 2.2 j), the Bank has maintained part of this provision based on the assumption of nevertheless allocating this supplement to the institution’s older employees.
The transactions in the heading of provisions for probable liabilities for the years 2016 and 2015 were as follows:
2016 2015
Provisions for retirement and survivor’s pensions 10 642 10 642
Provisions for guarantees given 5 225 20 608
15 867 31 250
AMOUNTS IN AKZ THOUSANDS
Balance on 31/12/2015 ReinforcementsAnnulments and Readjustments
Balance on 31/12/2016
Retirement and survivor’s pensions 10 642 - 10 642
Guarantees given 20 608 - 15 383 5 225
Provision for vacation allowance - 37 694 37 694 -
31 250 37 694 53 077 15 067
Balance on 31/12/2014 ReinforcementsAnnulments and Readjustments
Balance on 31/12/2015
Retirement and survivor’s pensions 10 642 - - 10 642
Guarantees given 2 479 18 129 - 20 608
Provision for vacation allowance 49 707 - 49 707 -
62 828 12 121 49 707 31 250
AMOUNTS IN AKZ THOUSANDS
BANC — Annual Report, 2016 211
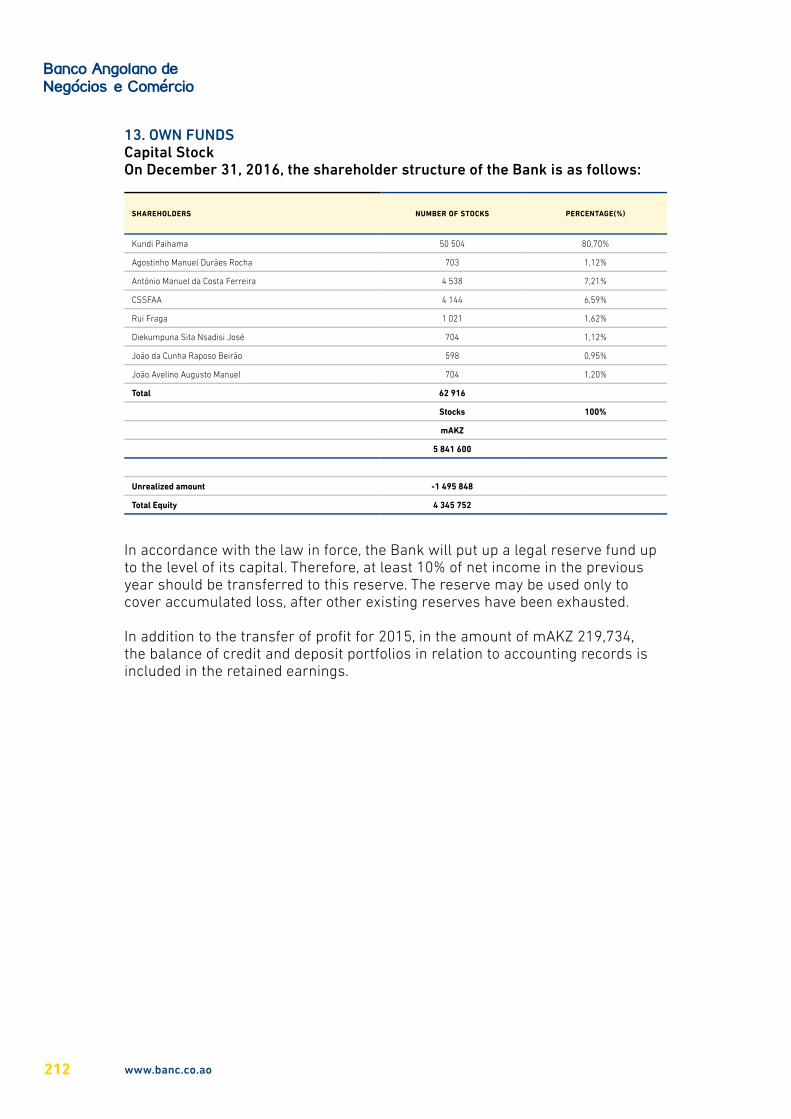
In accordance with the law in force, the Bank will put up a legal reserve fund up to the level of its capital. Therefore, at least 10% of net income in the previous year should be transferred to this reserve. The reserve may be used only to cover accumulated loss, after other existing reserves have been exhausted.
In addition to the transfer of profit for 2015, in the amount of mAKZ 219,734, the balance of credit and deposit portfolios in relation to accounting records is included in the retained earnings.
13. OWN FUNDSCapital StockOn December 31, 2016, the shareholder structure of the Bank is as follows:
SHAREHOLDERS NUMBER OF STOCKS PERCENTAGE(%)
Kundi Paihama 50 504 80,70%
Agostinho Manuel Durães Rocha 703 1,12%
António Manuel da Costa Ferreira 4 538 7,21%
CSSFAA 4 144 6,59%
Rui Fraga 1 021 1,62%
Diekumpuna Sita Nsadisi José 704 1,12%
João da Cunha Raposo Beirão 598 0,95%
João Avelino Augusto Manuel 704 1,20%
Total 62 916
Stocks 100%
mAKZ
5 841 600
Unrealized amount -1 495 848
Total Equity 4 345 752
212 www.banc.co.ao
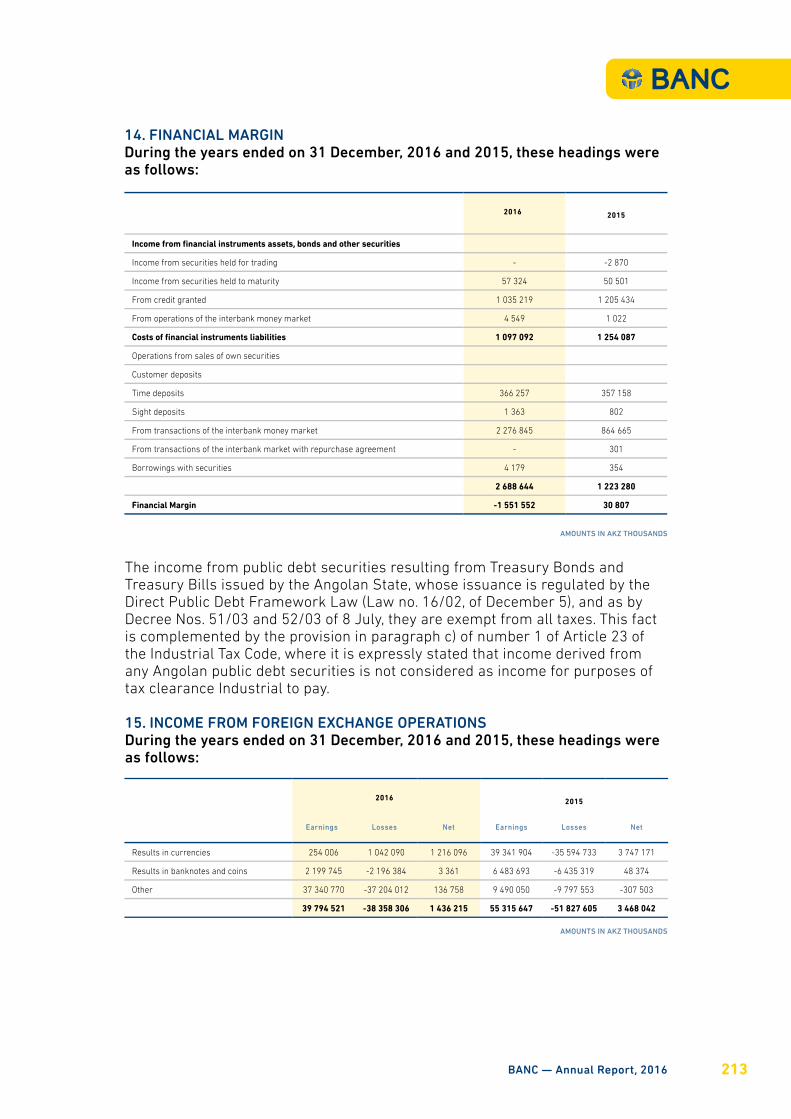
The income from public debt securities resulting from Treasury Bonds and Treasury Bills issued by the Angolan State, whose issuance is regulated by the Direct Public Debt Framework Law (Law no. 16/02, of December 5), and as by Decree Nos. 51/03 and 52/03 of 8 July, they are exempt from all taxes. This fact is complemented by the provision in paragraph c) of number 1 of Article 23 of the Industrial Tax Code, where it is expressly stated that income derived from any Angolan public debt securities is not considered as income for purposes of tax clearance Industrial to pay.
15. INCOME FROM FOREIGN EXCHANGE OPERATIONSDuring the years ended on 31 December, 2016 and 2015, these headings were as follows:
2016 2015
Income from financial instruments assets, bonds and other securities
Income from securities held for trading - -2 870
Income from securities held to maturity 57 324 50 501
From credit granted 1 035 219 1 205 434
From operations of the interbank money market 4 549 1 022
Costs of financial instruments liabilities 1 097 092 1 254 087
Operations from sales of own securities
Customer deposits
Time deposits 366 257 357 158
Sight deposits 1 363 802
From transactions of the interbank money market 2 276 845 864 665
From transactions of the interbank market with repurchase agreement - 301
Borrowings with securities 4 179 354
2 688 644 1 223 280
Financial Margin -1 551 552 30 807
14. FINANCIAL MARGINDuring the years ended on 31 December, 2016 and 2015, these headings were as follows:
AMOUNTS IN AKZ THOUSANDS
2016 2015
Earnings Losses Net Earnings Losses Net
Results in currencies 254 006 1 042 090 1 216 096 39 341 904 -35 594 733 3 747 171
Results in banknotes and coins 2 199 745 -2 196 384 3 361 6 483 693 -6 435 319 48 374
Other 37 340 770 -37 204 012 136 758 9 490 050 -9 797 553 -307 503
39 794 521 -38 358 306 1 436 215 55 315 647 -51 827 605 3 468 042
AMOUNTS IN AKZ THOUSANDS
BANC — Annual Report, 2016 213
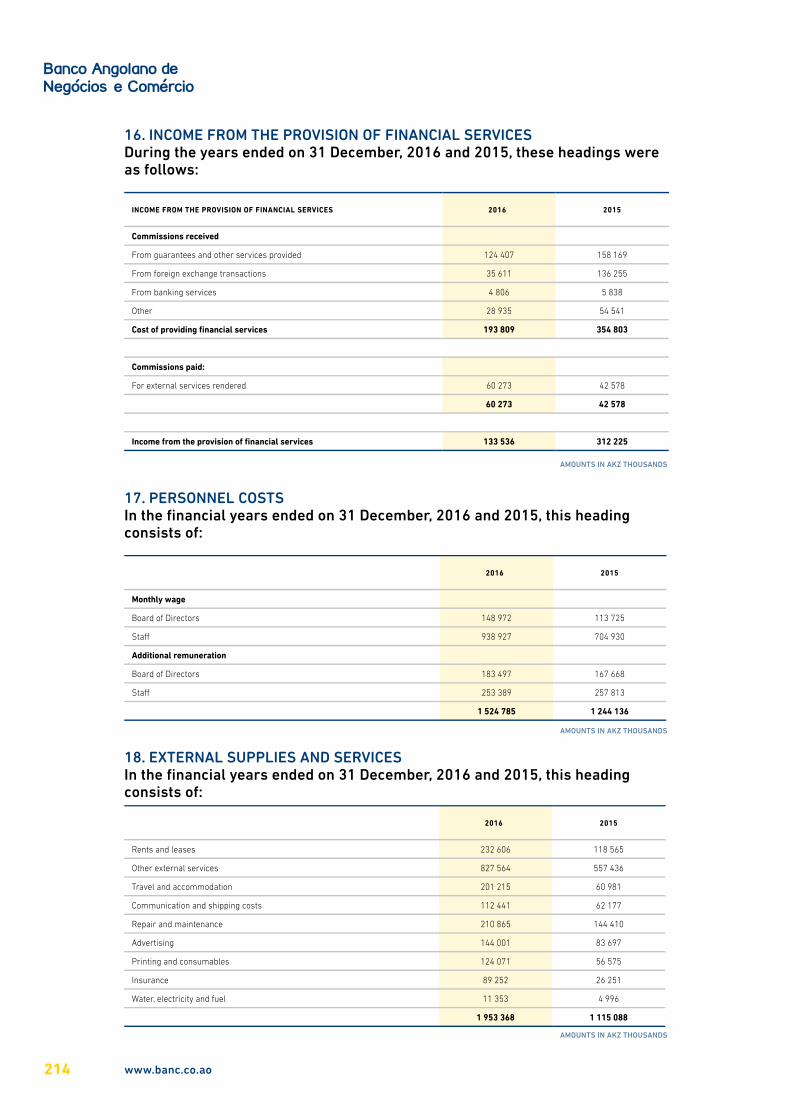
16. INCOME FROM THE PROVISION OF FINANCIAL SERVICESDuring the years ended on 31 December, 2016 and 2015, these headings were as follows:
INCOME FROM THE PROVISION OF FINANCIAL SERVICES 2016 2015
Commissions received
From guarantees and other services provided 124 407 158 169
From foreign exchange transactions 35 611 136 255
From banking services 4 806 5 838
Other 28 935 54 541
Cost of providing financial services 193 809 354 803
Commissions paid:
For external services rendered 60 273 42 578
60 273 42 578
Income from the provision of financial services 133 536 312 225
AMOUNTS IN AKZ THOUSANDS
17. PERSONNEL COSTSIn the financial years ended on 31 December, 2016 and 2015, this heading consists of:
2016 2015
Monthly wage
Board of Directors 148 972 113 725
StaÎ 938 927 704 930
Additional remuneration
Board of Directors 183 497 167 668
StaÎ 253 389 257 813
1 524 785 1 244 136
AMOUNTS IN AKZ THOUSANDS
18. EXTERNAL SUPPLIES AND SERVICESIn the financial years ended on 31 December, 2016 and 2015, this heading consists of:
2016 2015
Rents and leases 232 606 118 565
Other external services 827 564 557 436
Travel and accommodation 201 215 60 981
Communication and shipping costs 112 441 62 177
Repair and maintenance 210 865 144 410
Advertising 144 001 83 697
Printing and consumables 124 071 56 575
Insurance 89 252 26 251
Water, electricity and fuel 11 353 4 996
1 953 368 1 115 088
AMOUNTS IN AKZ THOUSANDS
214 www.banc.co.ao
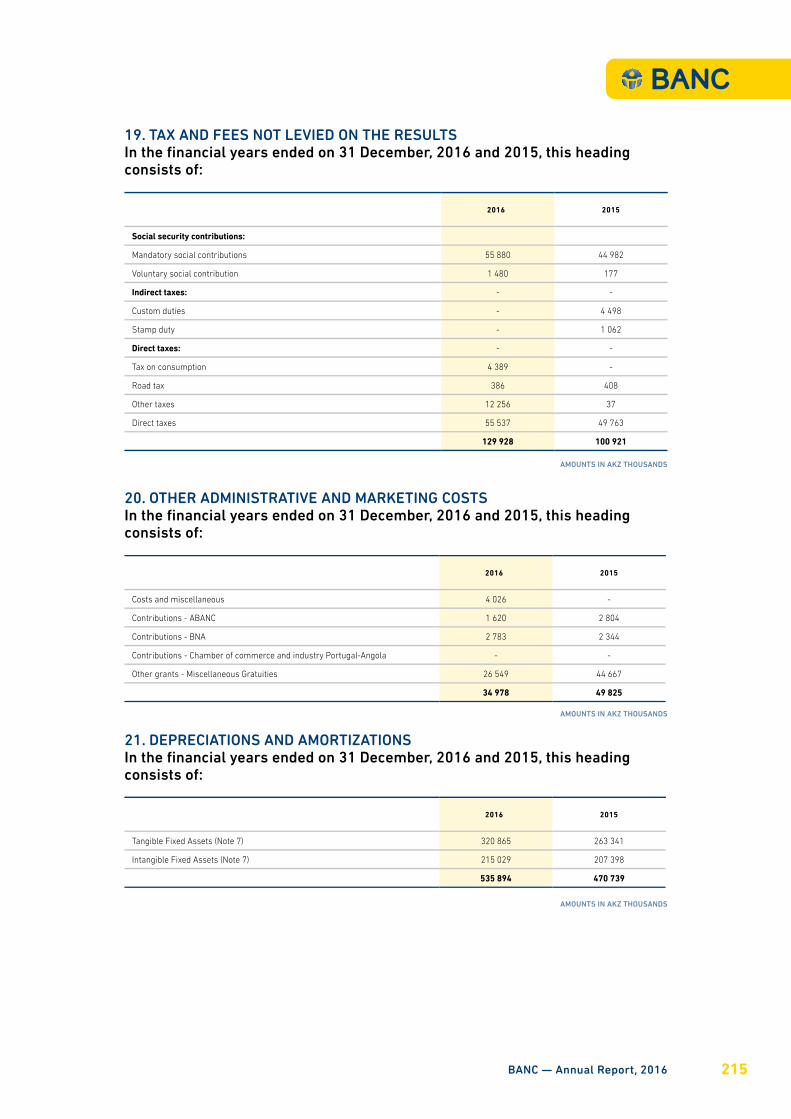
19. TAX AND FEES NOT LEVIED ON THE RESULTSIn the financial years ended on 31 December, 2016 and 2015, this heading consists of:
20. OTHER ADMINISTRATIVE AND MARKETING COSTSIn the financial years ended on 31 December, 2016 and 2015, this heading consists of:
2016 2015
Social security contributions:
Mandatory social contributions 55 880 44 982
Voluntary social contribution 1 480 177
Indirect taxes: - -
Custom duties - 4 498
Stamp duty - 1 062
Direct taxes: - -
Tax on consumption 4 389 -
Road tax 386 408
Other taxes 12 256 37
Direct taxes 55 537 49 763
129 928 100 921
AMOUNTS IN AKZ THOUSANDS
2016 2015
Costs and miscellaneous 4 026 -
Contributions - ABANC 1 620 2 804
Contributions - BNA 2 783 2 344
Contributions - Chamber of commerce and industry Portugal-Angola - -
Other grants - Miscellaneous Gratuities 26 549 44 667
34 978 49 825
21. DEPRECIATIONS AND AMORTIZATIONSIn the financial years ended on 31 December, 2016 and 2015, this heading consists of:
AMOUNTS IN AKZ THOUSANDS
2016 2015
Tangible Fixed Assets (Note 7) 320 865 263 341
Intangible Fixed Assets (Note 7) 215 029 207 398
535 894 470 739
AMOUNTS IN AKZ THOUSANDS
BANC — Annual Report, 2016 215

22. NON-OPERATING INCOMEDuring the years ended on 31 December, 2016 and 2015, these headings were as follows:
23. TAXESThe Bank is subject to taxation in Industrial Tax, being considered a taxpayer of Group A. The taxation of its income is made under the number 1 of Article 64 of Law no. 19/14, of October 22, the current tax rate being 30%.
The Bank did not recognize in the financial statements the deferred tax assets related to reportable tax losses, since it is not possible to demonstrate the probability of obtaining future taxable profits that allow its use.
The tax authorities have the possibility to review the fiscal situation of the Bank over a period of five years and may result from diÎerent interpretations of tax legislation, possible corrections to taxable income for the years 2012 to 2016. The Bank’s Board of Directors understands that any additional settlements that may result from these revisions will not be material to the accompanying financial statements. The income tax payable in 2016 and 2015 was calculated as follows:
2016 2015
Non-Operating income or gains
Capital losses on disposal of fixed assets - 6 809
Losses carried forward - 20 211
Other 4 078 43 177
4 078 70 197
Non-operating income or gains
Capital gains on disposal of fixed assets 440 2 584
Profit carried forward 29 146 16
Other 2 354 159
31 940 2 759
Non-operating income 27 862 -67 438
AMOUNTS IN AKZ THOUSANDS
2016 2015
Earnings before taxes - 313 906
Adjustments: - -
Tax benefits in treasury bonds returns - -
Other adjustments - -
Pre-year losses - -
Earnings before interest - 313 906
Interest rate 30% 30%
Interest - 94 172
AMOUNTS IN AKZ THOUSANDS
216 www.banc.co.ao
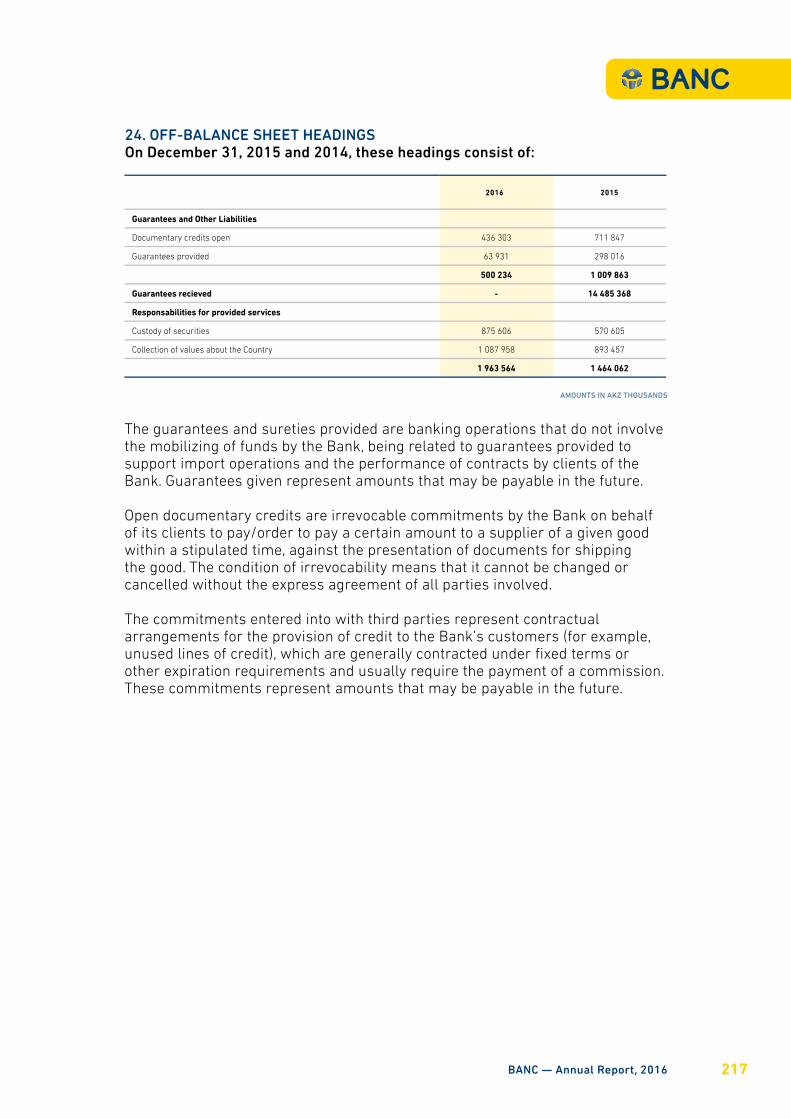
24. OFF-BALANCE SHEET HEADINGSOn December 31, 2015 and 2014, these headings consist of:
The guarantees and sureties provided are banking operations that do not involve the mobilizing of funds by the Bank, being related to guarantees provided to support import operations and the performance of contracts by clients of the Bank. Guarantees given represent amounts that may be payable in the future.
Open documentary credits are irrevocable commitments by the Bank on behalf of its clients to pay/order to pay a certain amount to a supplier of a given good within a stipulated time, against the presentation of documents for shipping the good. The condition of irrevocability means that it cannot be changed or cancelled without the express agreement of all parties involved.
The commitments entered into with third parties represent contractual arrangements for the provision of credit to the Bank’s customers (for example, unused lines of credit), which are generally contracted under fixed terms or other expiration requirements and usually require the payment of a commission. These commitments represent amounts that may be payable in the future.
2016 2015
Guarantees and Other Liabilities
Documentary credits open 436 303 711 847
Guarantees provided 63 931 298 016
500 234 1 009 863
Guarantees recieved - 14 485 368
Responsabilities for provided services
Custody of securities 875 606 570 605
Collection of values about the Country 1 087 958 893 457
1 963 564 1 464 062
AMOUNTS IN AKZ THOUSANDS
BANC — Annual Report, 2016 217
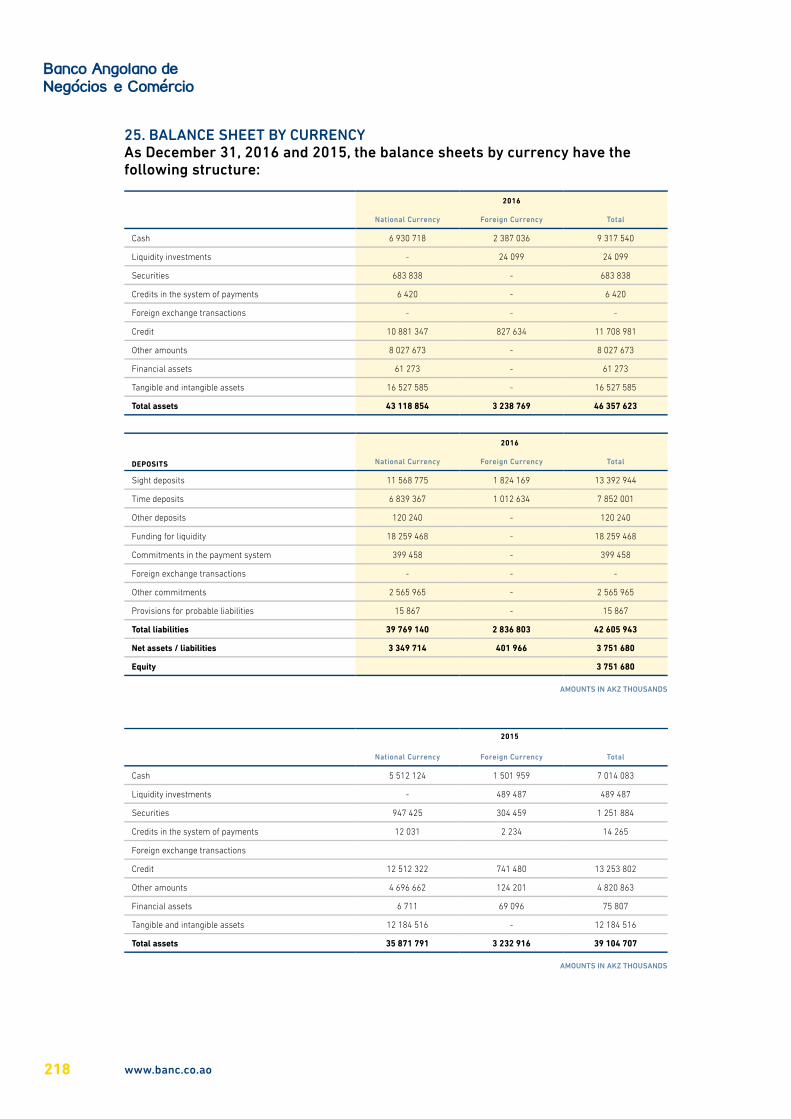
25. BALANCE SHEET BY CURRENCYAs December 31, 2016 and 2015, the balance sheets by currency have the following structure:
2016
National Currency Foreign Currency Total
Cash 6 930 718 2 387 036 9 317 540
Liquidity investments - 24 099 24 099
Securities 683 838 - 683 838
Credits in the system of payments 6 420 - 6 420
Foreign exchange transactions - - -
Credit 10 881 347 827 634 11 708 981
Other amounts 8 027 673 - 8 027 673
Financial assets 61 273 - 61 273
Tangible and intangible assets 16 527 585 - 16 527 585
Total assets 43 118 854 3 238 769 46 357 623
DEPOSITS
2016
National Currency Foreign Currency Total
Sight deposits 11 568 775 1 824 169 13 392 944
Time deposits 6 839 367 1 012 634 7 852 001
Other deposits 120 240 - 120 240
Funding for liquidity 18 259 468 - 18 259 468
Commitments in the payment system 399 458 - 399 458
Foreign exchange transactions - - -
Other commitments 2 565 965 - 2 565 965
Provisions for probable liabilities 15 867 - 15 867
Total liabilities 39 769 140 2 836 803 42 605 943
Net assets / liabilities 3 349 714 401 966 3 751 680
Equity 3 751 680
2015
National Currency Foreign Currency Total
Cash 5 512 124 1 501 959 7 014 083
Liquidity investments - 489 487 489 487
Securities 947 425 304 459 1 251 884
Credits in the system of payments 12 031 2 234 14 265
Foreign exchange transactions
Credit 12 512 322 741 480 13 253 802
Other amounts 4 696 662 124 201 4 820 863
Financial assets 6 711 69 096 75 807
Tangible and intangible assets 12 184 516 - 12 184 516
Total assets 35 871 791 3 232 916 39 104 707
AMOUNTS IN AKZ THOUSANDS
AMOUNTS IN AKZ THOUSANDS
218 www.banc.co.ao
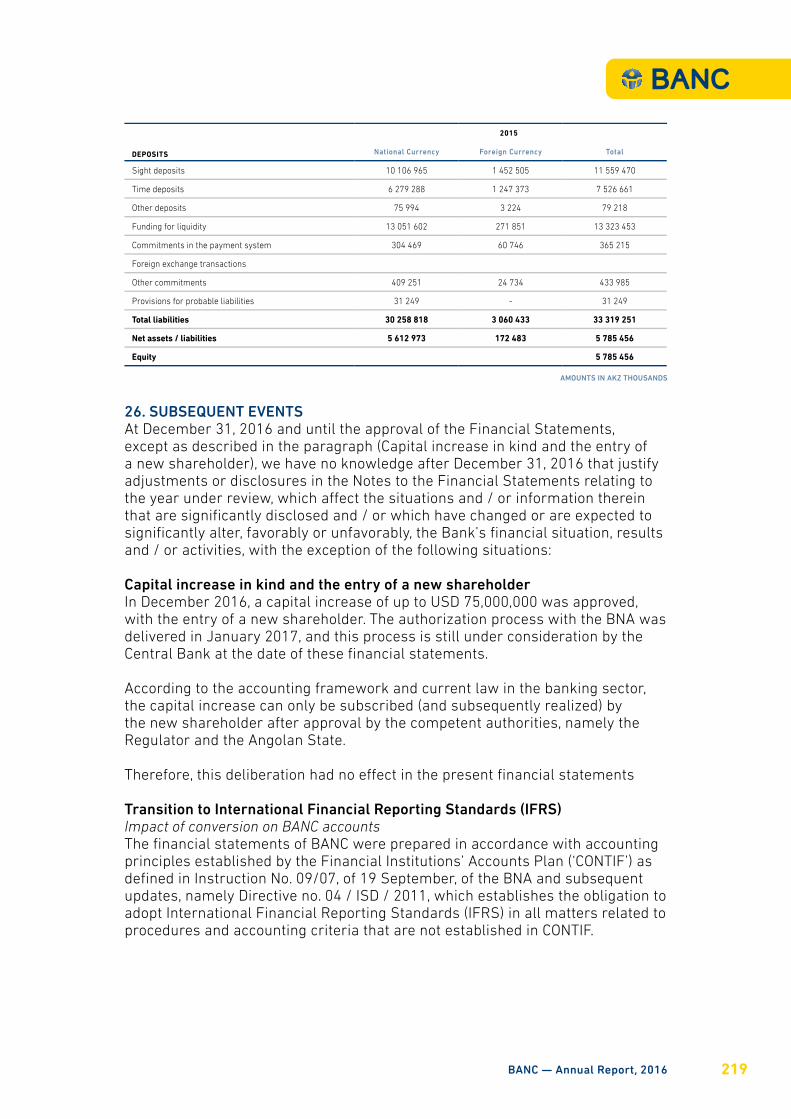
26. SUBSEQUENT EVENTSAt December 31, 2016 and until the approval of the Financial Statements, except as described in the paragraph (Capital increase in kind and the entry of a new shareholder), we have no knowledge after December 31, 2016 that justify adjustments or disclosures in the Notes to the Financial Statements relating to the year under review, which aÎect the situations and / or information therein that are significantly disclosed and / or which have changed or are expected to significantly alter, favorably or unfavorably, the Bank’s financial situation, results and / or activities, with the exception of the following situations:
Capital increase in kind and the entry of a new shareholderIn December 2016, a capital increase of up to USD 75,000,000 was approved, with the entry of a new shareholder. The authorization process with the BNA was delivered in January 2017, and this process is still under consideration by the Central Bank at the date of these financial statements.
According to the accounting framework and current law in the banking sector, the capital increase can only be subscribed (and subsequently realized) by the new shareholder after approval by the competent authorities, namely the Regulator and the Angolan State.
Therefore, this deliberation had no eÎect in the present financial statements
Transition to International Financial Reporting Standards (IFRS)Impact of conversion on BANC accountsThe financial statements of BANC were prepared in accordance with accounting principles established by the Financial Institutions’ Accounts Plan (‘CONTIF’) as defined in Instruction No. 09/07, of 19 September, of the BNA and subsequent updates, namely Directive no. 04 / ISD / 2011, which establishes the obligation to adopt International Financial Reporting Standards (IFRS) in all matters related to procedures and accounting criteria that are not established in CONTIF.
DEPOSITS
2015
National Currency Foreign Currency Total
Sight deposits 10 106 965 1 452 505 11 559 470
Time deposits 6 279 288 1 247 373 7 526 661
Other deposits 75 994 3 224 79 218
Funding for liquidity 13 051 602 271 851 13 323 453
Commitments in the payment system 304 469 60 746 365 215
Foreign exchange transactions
Other commitments 409 251 24 734 433 985
Provisions for probable liabilities 31 249 - 31 249
Total liabilities 30 258 818 3 060 433 33 319 251
Net assets / liabilities 5 612 973 172 483 5 785 456
Equity 5 785 456
AMOUNTS IN AKZ THOUSANDS
BANC — Annual Report, 2016 219
In the context of the adoption of IFRS by financial institutions in Angola, following the BNA guidelines, and considering the periods defined for the conversion process, BANC is continuing its conversion process, being to finalize the evaluation of the qualitative and quantitative impact of the eÎects of possible diÎerences of alteration of accounting regulations.
Supervisory bodies and the International Accounting Standards Board (IASB) continue to develop standards that may aÎect the diÎerences between CONTIF and IFRS described in this note, as well as diÎerences in the future Financial Statements.
Conversion Plan for IFRSBANC started its conversion plan in 2015 to prepare its financial statements in accordance with IFRS as from 1 January 2017, ie with the first published financial statements, in accordance with IFRS, at the beginning of the year 2018, when presenting the accounts for the year 2017.
The plan defined by the BANC also aims to accommodate all the interim reports requested by the BNA in connection with the conversion process.
Luanda, March 31, 2017Chief Financial OÌcer Chief Executive OÌcer
220 www.banc.co.ao