protein-energy malnutrition alters the c3 ... - sistema...
TRANSCRIPT
131
Original Article/Artigo original
Protein-energy malnutrition alters the C3 complement factor in response to lipopolysaccharide in a murine modelA desnutrição proteico-energética altera a concentração do fator C3 do sistema complemento em resposta ao lipopolissacarídeo em um modelo murínico
RICARDO AMBRÓSIO FOCK1; MARCELO
MACEDO ROGERO2; PRIMAVERA BORELLI1
1Laboratório de Hematologia,
Departamento de Análises Clínicas e Toxicológicas,
Faculdade de Ciências Farmacêuticas,
Universidade de São Paulo.
2Departamento de Alimentos e Nutrição
Experimental, Faculdade de Ciências
Farmacêuticas, Universidade de
São Paulo.Corresponding
author:Ricardo Ambrósio Fock:
Lab. Hematologia Experimental, Depto.
de Análises Clínicas e Toxicológicas, Faculdade
de Ciências Farmacêuticas, Universidade de São
Paulo.Av. Prof. Lineu Prestes,
580, B17, CEP 05508-900, São Paulo, SP, Brasil
e-mail: [email protected]:
This investigation was supported by grants from
Fundação de Amparo à Pesquisa do Estado de
São Paulo - FAPESP, and from Conselho Nacional de Desenvolvimento Científi co
e Tecnológico (CNPq), Brazil.
FOCK, R. A.; ROGERO, M. M.; BORELLI, P. Protein-energy malnutrition alters the C3 complement factor in response to lipopolysaccharide in a murine model. Nutrire: rev. Soc. Bras. Alim. Nutr. = J. Brazilian Soc. Food Nutr., São Paulo, SP, v. 34, n. 1, p. 131-142, abr. 2009.
Malnutrition modifi es the host’s resistance to infection, altering many physiological processes, including hematopoiesis and immunological functions. In this study, we evaluated the total complement system and its C3 component factor in animals subjected to a protein malnutrition model with lipopolysaccharide (LPS) stimulation. The cellularity of blood, bone marrow and spleen, as well as the production of C3 and CH50, were evaluated. Two-month old male Swiss mice were submitted to protein malnutrition with a low-protein diet containing 4% protein. A control group received a control diet containing 20% protein. When the experimental group had reached a loss of about 20% in their original body mass, they were intravenously inoculated with LPS. Cells in the blood, bone marrow and spleen were counted and the circulating levels of C3 and CH50 were evaluated in these animals. Malnourished animals presented anemia, leucopenia, and a severe reduction in bone marrow and spleen cellularity. The survival rate of the malnourished animals was lower, as well as the production of C3 and CH50, if compared to the control animals. These fi ndings suggest that malnourished mice present a defi cient response to LPS. The decrease in the complement synthesis may be partially responsible for the immunodefi ciency observed. These data lead us to conclude that the nutritional status interferes in the immune response activation.
Keywords: Malnutrition. Complement system. C3 complement factor.
ABSTRACT
132
RESUMORESUMEN
La desnutrición proteico-energética modifi ca la resistencia a la infección, alterando numerosos procesos fi siológicos, incluyendo la hematopoyesis y la función inmunológica. En este estudio medimos las concentraciones séricas del factor C3 y del Sistema Complemento Total (CH50) en ratos con desnutrición proteico-energética estimulados con lipopolisacárido (LPS). Fue evaluada la celularidad periférica, medular y esplénica. Ratos Swiss, machos, adultos, con dos meses de edad fueron sometidos a desnutrición proteica con una dieta de 4% de proteína .El grupo control consumía una dieta con 20% de proteínas. Cuando los animales desnutridos perdieron 20% de su peso inicial, fueron inoculados por vía endovenosa con LPS. Fueron determinadas las concentraciones de células sanguíneas, de la médula ósea, del bazo y los valores de C3 y CH50 circulantes en los animales estimulados. Los animales desnutridos presentaron anemia y leucopenia además de una reducción signifi cativa de celularidad de la médula ósea y del bazo. La sobrevivencia de este grupo era menor y también eran más bajas las concentraciones del factor C3 del complemento y del complemento total, en relación a los animales del grupo control. Los resultados sugieren que animales desnutridos muestran una respuesta defi ciente a LPS. La síntesis menor de complemento puede ser en parte responsable por la inmunodefi ciencia observada. Estos resultados nos conducen a inferir que la desnutrición proteico-energética interfiere en la activación de la respuesta inmune.
Palabras clave: Desnutrición. Sistema complemento. Factor C3 del complemento.
A desnutrição proteico-energética modifi ca a resistência à infecção, modifi cando diversos processos fi siológicos, incluindo a hematopoiese e as funções imunológicas. Neste estudo, avaliamos as concentrações séricas do fator C3 e do Sistema Complemento total (CH50) em um modelo no qual camundongos submetidos à desnutrição proteico-energética são estimulados com lipopolissacarídeo (LPS), e avaliamos a celularidade periférica, medular e esplênica. Camundongos Swiss, machos, adultos, com dois meses de idade foram submetidos ao processo de desnutrição proteica com uma dieta contendo 4% de proteína em comparação aos animais controles com uma dieta contendo 20% de proteína. Quando os animais do grupo desnutrido alcançaram aproximadamente 20% de perda de peso, em relação ao inicial, foram inoculados endovenosamente com LPS. As células do sangue, da medula óssea e do baço foram quantifi cadas, bem como as concentrações circulantes de C3 e CH50 em animais estimulados com LPS. Os animais desnutridos apresentaram anemia e leucopenia, além de redução signifi cativa da celularidade da medula óssea e do baço. Os animais desnutridos apresentaram menor taxa de sobrevivência, bem como das concentrações do fator C3 do complemento e do complemento total em relação aos animais controles. Estes resultados sugerem que animais desnutridos apresentam uma resposta defi ciente aos LPS. A síntese menor do complemento pode ser em parte responsável pela imunodefi ciência observada. Estes resultados conduzem-nos a inferir que a desnutrição proteico-energética interfere na ativação da resposta imune.
Palavras-chave: Desnutrição. Sistema Complemento. Fator C3 do Complemento.
FOCK, R. A.; ROGERO, M. M.; BORELLI, P. Protein-energy malnutrition alters the C3 complement factor in response to lipopolysaccharide in a murine model. Nutrire: rev. Soc. Bras. Alim. Nutr.= J. Brazilian Soc. Food Nutr., São Paulo, SP, v. 34, n. 1, p. 131-142, abr. 2009.
133
FOCK, R. A.; ROGERO, M. M.; BORELLI, P. Protein-energy malnutrition alters the C3 complement factor in response to lipopolysaccharide in a murine model. Nutrire: rev. Soc. Bras. Alim. Nutr.= J. Brazilian Soc. Food Nutr., São Paulo, SP, v. 34, n. 1, p. 131-142, abr. 2009.
INTRODUCTION
Protein-energy malnutrition (PEM) is the most frequent type of malnutrition. It
occurs especially in children, the elderly, patients suffering from neoplasia or chronic
illnesses or undergoing chemotherapy (DE ONIS et al., 1993; RICE et al., 2000).
Several different studies have demonstrated that malnourished individuals present
an increased susceptibility to infections (GROSS; NEWBERNE, 1980; KEUSCH, 2003; NOVA
et al., 2002). Malnutrition alters many physiological processes, including hematopoiesis
and the immune response, which brings to evidence the close interaction between
malnutrition and infection. PEM modifi es the specifi c and nonspecifi c immune response
of the organism (CHANDRA, 1992; GROSS; NEWBERNE, 1980; REDMOND et al., 1991) by
the decreased production of hematopoietic cells, resulting, eventually, in bone marrow
hypoplasia (BORELLI; MARIANO; BOROJEVIC, 1995; ORTIZ; BETANCOURT, 1984; VITURI
et al., 2001; XAVIER et al., 2007), it also induces structural alterations in lymphoid organs
and thymus-dependent areas (MUNOZ; MARCOS; UNZAGA, 1981) which could interfere
in the animals’ resistance to infections. The exact mechanisms by which malnutrition
affects the immune response are not fully understood yet.
The recognition of pathogen surface molecules, such as surface carbohydrates
and lipopolysaccharides (LPS) is the fi rst step in the immune response. The complement
system is an effector mechanism of humoral immunity, innate and acquired, that
plays an important role in the defense of the organism against infections (LISZEWSKI;
ATKINSON, 1998).
Complement proteins raise interest because they seem to be a key component of
the innate immune system as well as participate in the adaptive immunity phylogenetic
development (MICHAEL; FRANK, 2000).
The complement cascade consists of 3 separate pathways that converge into a fi nal
common one. The pathways are: the classic pathway (C1qrs, C2, C4), the alternative
pathway (C3, factor B, properdin), and the mannan-binding (mannan-binding lectin,
MBL) pathway. The terminal complement consists of all proteins activated after C3,
forming a group of proteins, known collectively as the membrane attack complex (MAC).
MAC carries out effective killing activity by creating perforations in cellular membranes
(BOHLSON et al., 2001). Defi ciencies in complement components predispose patients to
infection via two mechanisms (LISZEWSKI; ATKINSON, 1998): ineffective opsonization
and defects in lytic activity (defects in the MAC). Specifi c complement defi ciencies are
also associated with an increased risk of developing autoimmune diseases such as
systemic lupus erythematosus (BOHLSON et al., 2001; MICHAEL; FRANK, 2000).
In this study, we evaluated total complement (CH50) and its C3 component in
animals submitted to PEM stimulated with LPS.
134
MATERIALS AND METHODS
DIETS
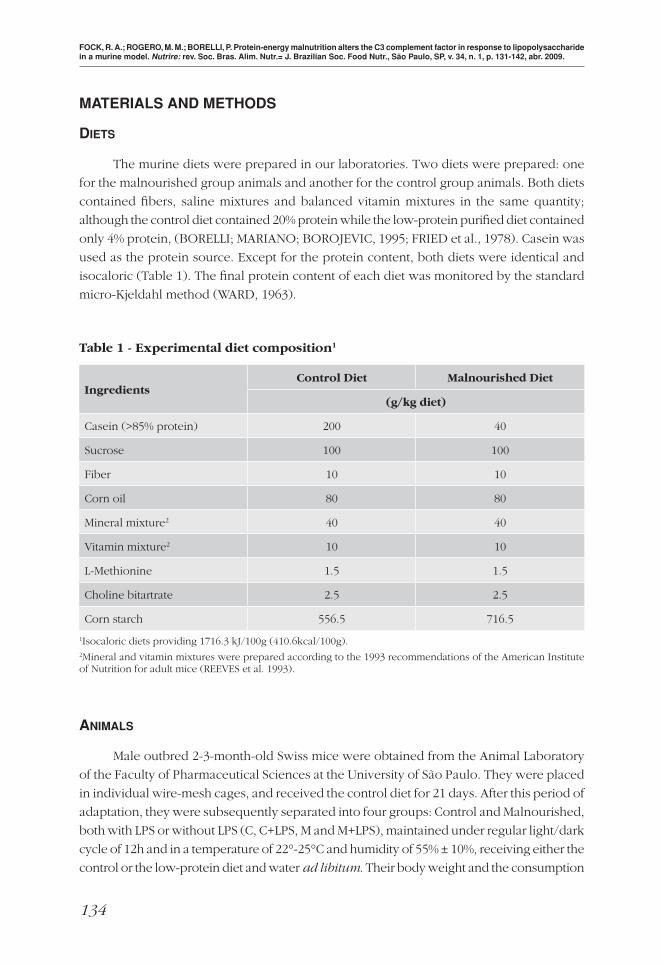
The murine diets were prepared in our laboratories. Two diets were prepared: one
for the malnourished group animals and another for the control group animals. Both diets
contained fi bers, saline mixtures and balanced vitamin mixtures in the same quantity;
although the control diet contained 20% protein while the low-protein purifi ed diet contained
only 4% protein, (BORELLI; MARIANO; BOROJEVIC, 1995; FRIED et al., 1978). Casein was
used as the protein source. Except for the protein content, both diets were identical and
isocaloric (Table 1). The fi nal protein content of each diet was monitored by the standard
micro-Kjeldahl method (WARD, 1963).
Table 1 - Experimental diet composition1
Ingredients Control Diet Malnourished Diet
(g/kg diet)
Casein (>85% protein) 200 40
Sucrose 100 100
Fiber 10 10
Corn oil 80 80
Mineral mixture2 40 40
Vitamin mixture2 10 10
L-Methionine 1.5 1.5
Choline bitartrate 2.5 2.5
Corn starch 556.5 716.5
1Isocaloric diets providing 1716.3 kJ/100g (410.6kcal/100g).2Mineral and vitamin mixtures were prepared according to the 1993 recommendations of the American Institute of Nutrition for adult mice (REEVES et al. 1993).
ANIMALS
Male outbred 2-3-month-old Swiss mice were obtained from the Animal Laboratory
of the Faculty of Pharmaceutical Sciences at the University of São Paulo. They were placed
in individual wire-mesh cages, and received the control diet for 21 days. After this period of
adaptation, they were subsequently separated into four groups: Control and Malnourished,
both with LPS or without LPS (C, C+LPS, M and M+LPS), maintained under regular light/dark
cycle of 12h and in a temperature of 22°-25°C and humidity of 55% ± 10%, receiving either the
control or the low-protein diet and water ad libitum. Their body weight and the consumption
FOCK, R. A.; ROGERO, M. M.; BORELLI, P. Protein-energy malnutrition alters the C3 complement factor in response to lipopolysaccharide in a murine model. Nutrire: rev. Soc. Bras. Alim. Nutr.= J. Brazilian Soc. Food Nutr., São Paulo, SP, v. 34, n. 1, p. 131-142, abr. 2009.
135
of food were monitored every 48h. The mice were submitted to experimental assays after
14 days eating their respective chows, when the undernourished group reached a loss of
about 20% in their original body weight (BORELLI; MARIANO; BOROJEVIC, 1995). For the
collection of different biological, the animals were previously anesthetized with xylazene
hydrochloride (Rompum®, Bayer, 10mg/Kg) and with ketamide hydrochloride (Ketamina®,
Cristália, 100mg/Kg). All procedures were carried out under aseptic conditions. The reagents
and materials used were pyrogen-free. This study was approved by the Commission on
Ethics in Animal Studies of the Faculty of Pharmaceutical Sciences at the University of São
Paulo, Brazil, according to the Brazilian College on Animal Experimentation guidelines.
LPS ENDOTOXEMIA
Escherichia coli (055:B5) lipopolisaccharide (LPS) (Sigma Chemical Company, St.
Louis, MO) was diluted in pyrogen-free isotonic saline solution. Animals in the C+LPS and
M+LPS groups received 1.25µg of LPS intravenously.
NUTRITIONAL EVALUATION
A nutritional evaluation of each animal was performed by measuring body weight,
diet consumption and the plasma concentrations of protein, albumin and pre-albumin.
BLOOD CELLS AND PLASMA PROTEINS
Mice were anesthetized and the whole blood samples were obtained by cardiac
puncture and collected concomitantly with bone marrow and spleen cells. The blood
samples were collected in tubes containing EDTA as anticoagulant in a fi nal concentration
of 1mg/mL of blood (EDTA, Sigma Chemical Company, St. Louis, MO). The hemoglobin
concentration and hematocrit were determined by standard methods (DACIE; LEWIS, 1995).
Total cell counts were obtained using a Neubauer chamber. Differential leukocyte counts
were performed on blood smears stained by the standard May-Grunwald and Giemsa
solutions (Sigma Chemical Co., St. Louis, MO).
Plasma was separated by centrifugation and the total protein content, albumin and pre-
albumin were determined by standard methods used in clinical laboratory tests (DOUMAS;
WATSON; BIGGS, 1971; GORNALL; BARDAWILL; DAVID, 1949). Blood collected without
anticoagulant was obtained from all groups. The serum was separated by centrifugation
(2000 x g for 10 minutes, 4°C) and frozen in aliquots at -40°C until analysis.
BONE MARROW AND SPLENIC CELLULARITY
Bone marrow cells were obtained by fl ushing the femoral cavity with 1mL of McCoy’s
5A medium (Sigma, Chemical Company, USA). The spleen was removed, placed in Petri
FOCK, R. A.; ROGERO, M. M.; BORELLI, P. Protein-energy malnutrition alters the C3 complement factor in response to lipopolysaccharide in a murine model. Nutrire: rev. Soc. Bras. Alim. Nutr.= J. Brazilian Soc. Food Nutr., São Paulo, SP, v. 34, n. 1, p. 131-142, abr. 2009.
136
dishes containing 5mL of McCoy’s 5A medium with EDTA (1mg/mL) and dissociated
gently using needles and tweezers. The number of total cells was quantifi ed in a standard
hemocytometer.
C3 AND CH50 DETERMINATION
The concentrations of CH50 and the C3 complement component were measured by
using the commercially available kits (N Antisera Complement Factors, Dade Behring®,
Marburg, Germany) for immunonephelometry in the BN system (Dade Behring®, Marburg,
Germany). The concentrations of CH50 and C3 were determined in serum, which was
separated from venous blood obtained from control and malnourished animals.
STATISTICAL ANALYSIS
Results are expressed as means ± standard deviations of the means (SD). Data were
analysed using one-way analyses of variance and Tukey’s Multiple Comparison Test (p≤0.05)
with the aid of computer software GraphPad Prism®. Survival analyses between groups
was calculated using the log rank method.
RESULTS
PROTEIN CONSUMPTION, BODY WEIGHT AND PROTEIN, ALBUMIN AND PRE-ALBUMIN PLASMA CONCENTRATIONS
Mice maintained on the low-protein diet spontaneously reduced their food
consumption compared to control mice, which resulted in the reduction of protein
consumption, body weight loss and decrease in protein, albumin and pre-albumin plasma
concentrations (Table 2). The control group received an adequate protein diet and the
malnourished group received a protein-defi cient diet. The malnourished group presented
a markedly lower feed intake and experienced a 22.1% loss of body weight in a period of
14 to 16 days after the introduction of the low-protein diet.
SURVIVAL WITH LPS
A signifi cantly lower survival rate (83%, p ≤0.05) was observed in malnourished
animals 24 hours after the infl ammatory stimulus with LPS, when compared to the control
group (99%).
BLOOD
The malnourished animals of both groups (M and M+LPS) presented anemia with
a decrease in hemoglobin concentration, hematocrit, total number of erythrocytes and
FOCK, R. A.; ROGERO, M. M.; BORELLI, P. Protein-energy malnutrition alters the C3 complement factor in response to lipopolysaccharide in a murine model. Nutrire: rev. Soc. Bras. Alim. Nutr.= J. Brazilian Soc. Food Nutr., São Paulo, SP, v. 34, n. 1, p. 131-142, abr. 2009.
137
leucocytes (polymorphonuclear leucocytes, lymphocytes and monocytes were all found
in lower quantities in these animals than in the control animals) (Table 3).
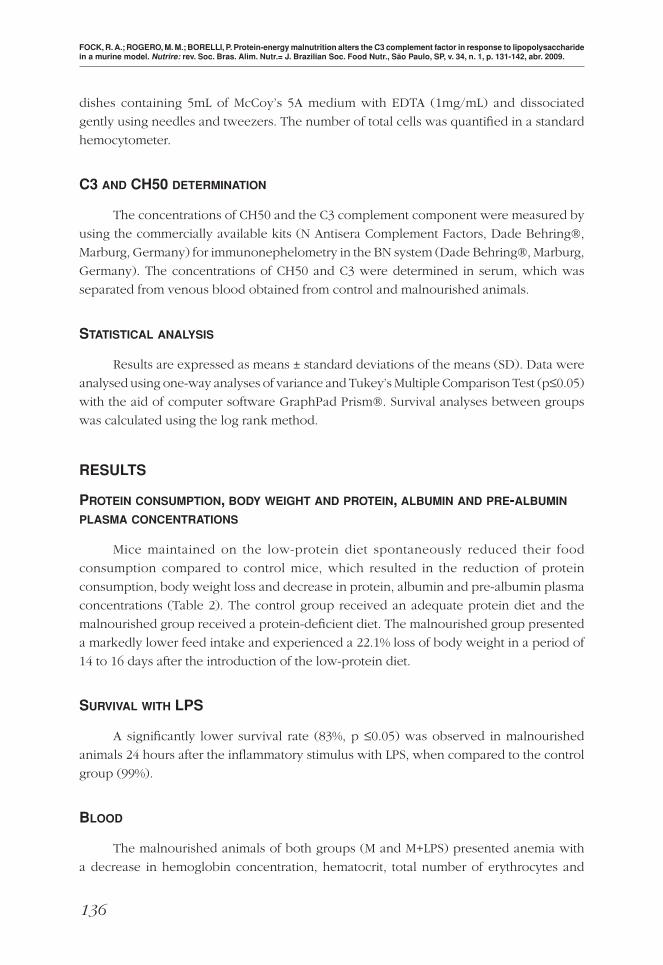
Table 2 - Diet and protein consumption, body weight variation and total protein, albumin and pre-albumin concentrations
GroupsControl (n=8)
Whitout LPS
Control (n=8)
LPS 24 hours
Malnourished (n=8)
Whitout LPS
Malnourished (n=8)
LPS 24 hours
Diet consumption (g/day/animal)
6.52 ± 0.29a 6.11 ± 0.33b 4.06 ± 0.18a, b 3.99± 0.22a, b
Protein consumption (g/day/animal)
1.31± 0.14a 1.23 ± 0.12b 0.16 ± 0.05a, b 0.16 ± 0.07a, b
Body weight variation (%) 4.19 ± 0.8a 4.33 ± 0.4b -22.1 ± 1.4a, b -23.0 ± 1.9a, b
Plasma protein (g/dL) 7.2 ± 0.98a 7.4 ± 0.33b 4.8 ± 0.81* a, b 4.9 ± 0.77a, b
Albumin (g/dL) 4.2 ± 0.6a 4.2 ± 0.7b 3.1 ± 0.4a, b 3.0 ± 0.5a, b
Pre-albumin (mg/dL) 10.8 ± 1.2a 10.9 ± 1.9b 2.9 ± 0.81a, b 2.7 ± 0.77a, b
Values expressed as mean ± standard deviation (SD). The number in parentheses denotes the number of animals used in the experiment. aindicates signifi cant difference between the control group without LPS and other groups (p ≤0.05). bindicates signifi cant difference between the control group with LPS and other groups (p ≤0.05).
Table 3 - Erythrocytes, hemoglobin, hematocrit, leucocytes, polymorphouclear, lymphocytes and monocytes values
GroupsControl (n=8)
Whitout LPS
Control (n=8)
LPS 24 hours
Malnourished (n=8)
Whitout LPS
Malnourished (n=8)
LPS 24 hours
Erythrocytes (x 106/mm3) 7.52 ±0.21a 7.82 ± 0.33b 4.08 ± 0.15a,b 3.99 ± 0.33a,b
Hemoglobin (g/dL) 13.3 ± 0.6a 13.9 ± 0.8b 6.6 ± 0.9a,b 5.8 ± 0.21a,b
Hematocrit (%) 36.3 ± 1.55a 37.1 ± 1.11b 19.8 ± 2.85* a,b 17.9 ± 1.29a,b
Leucocytes (/mm3) 3433 ± 211.5a,b 4210 ± 121.1b 1470 ± 65.7a,b 1125 ± 90.5a,b
Polymorphonuclear granulocytes (/mm3)
602 ± 14.1a 823 ± 92b 186.7 ± 4.3a,b 200± 4,3a,b
Lymphocytes (/mm3) 2399 ± 45.0a 2410 ± 127b 1370 ± 40.0a,b 987± 43a,b
Monocytes (/mm3) 75.8 ± 2.2a 14.7± 0.33a,b 10.1± 0.5a,b,c 2,0 ± 0,22a,b,c
Bone Marrow Total Cells (x107/mL)
0.87 ± 0.07a 0.82 ± 0.24b 0.58 ± 0.04* a,b 0.51± 0.11a,b
Spleen Total Cells (x107/mL)
0.83 ± 0.07a 0.78 ± 0.22b 0.49 ± 0.05a,b 0.44 ± 0.42a,b
Values expressed as mean ± standard deviation (SD). The number in parentheses denotes the number of animals used in the experiment. aindicates signifi cant difference between the control group without LPS and other groups (p ≤0.05). bindicates signifi cant difference between the control group with LPS and other groups (p ≤0.05). cindicates signifi cant difference between the malnourished group without LPS and malnourished with LPS (p ≤0.05).
FOCK, R. A.; ROGERO, M. M.; BORELLI, P. Protein-energy malnutrition alters the C3 complement factor in response to lipopolysaccharide in a murine model. Nutrire: rev. Soc. Bras. Alim. Nutr.= J. Brazilian Soc. Food Nutr., São Paulo, SP, v. 34, n. 1, p. 131-142, abr. 2009.
138
BONE MARROW AND SPLEEN CELLS
Animals of the malnourished groups (M and M+LPS) presented a decrease in the
number of blood cells in bone marrow and spleen (Table 3). The granulocytic to erythroid
(G/E) ratio in the malnourished animals was signifi cantly lower (p ≤ 0.05) than in the
control animals (data not show).
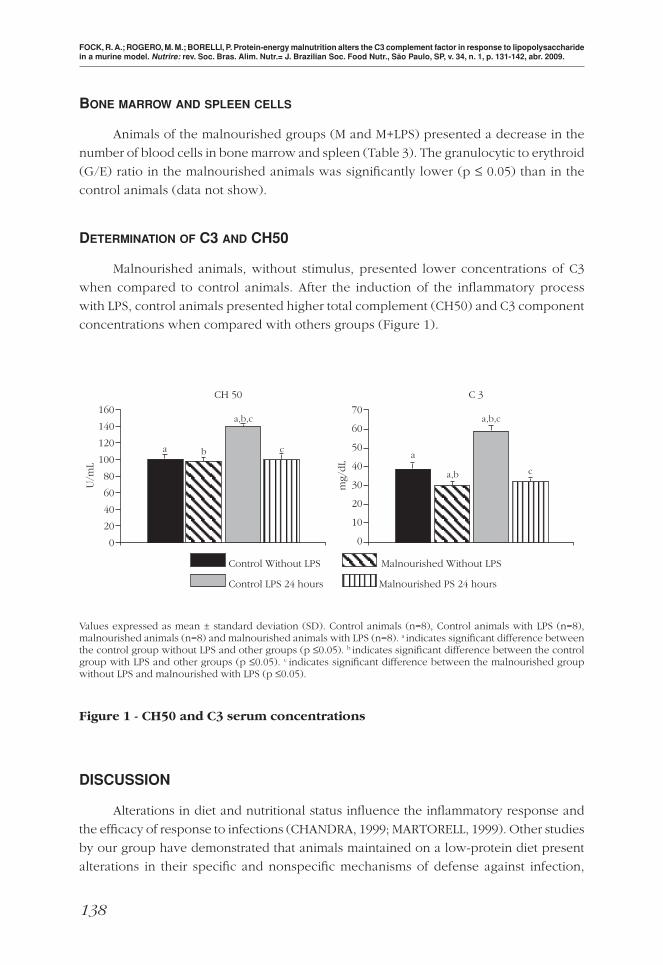
DETERMINATION OF C3 AND CH50
Malnourished animals, without stimulus, presented lower concentrations of C3
when compared to control animals. After the induction of the infl ammatory process
with LPS, control animals presented higher total complement (CH50) and C3 component
concentrations when compared with others groups (Figure 1).
Values expressed as mean ± standard deviation (SD). Control animals (n=8), Control animals with LPS (n=8), malnourished animals (n=8) and malnourished animals with LPS (n=8). a indicates signifi cant difference between the control group without LPS and other groups (p ≤0.05). b indicates signifi cant difference between the control group with LPS and other groups (p ≤0.05). c indicates signifi cant difference between the malnourished group without LPS and malnourished with LPS (p ≤0.05).
Figure 1 - CH50 and C3 serum concentrations
DISCUSSION
Alterations in diet and nutritional status infl uence the infl ammatory response and
the effi cacy of response to infections (CHANDRA, 1999; MARTORELL, 1999). Other studies
by our group have demonstrated that animals maintained on a low-protein diet present
alterations in their specifi c and nonspecifi c mechanisms of defense against infection,
FOCK, R. A.; ROGERO, M. M.; BORELLI, P. Protein-energy malnutrition alters the C3 complement factor in response to lipopolysaccharide in a murine model. Nutrire: rev. Soc. Bras. Alim. Nutr.= J. Brazilian Soc. Food Nutr., São Paulo, SP, v. 34, n. 1, p. 131-142, abr. 2009.
139
including hemopoiesis, celularity and structure of lymphoid organs and thymus-dependant
areas and modifi cations in some functional aspects of phagocytic cells such as the respiratory
burst and the ability of these cells in synthesizing nitric oxide and pro-infl ammatory
cytokines (IL-1, IL-6 and TNF-α) (BORELLI; MARIANO; BOROJEVIC, 1995; BORELLI et
al., 1998; FOCK; SILVA; BORELLI, 2003; FOCK et al., 2007; VITURI et al., 2001).
The control group received a diet with adequate protein content whereas the test
group received a protein-defi cient diet. The defi cient group presented a markedly lower
feed intake and experienced a loss of about 20% of their body mass. Despite malnourished
groups ingested a lower amount of feed, their diet met the minimum nutrient requirements
for adult mice except for protein (REEVES; NIELSEN; FAHEY, 1993). Since the minimum
daily amounts of nutrients other than protein were ingested by the animals of the
malnourished group, we can conclude that the changes observed in our experimental
model are mainly the result of the decrease in protein and energy intake.
Data found in literature as well as our own data also indicate that in situations when
malnutrition is not associated with other diseases, leucopenia always occurs (BORELLI et
al., 1998; CATCHATOURIAN; ECKERLING; FRIED, 1980). In this study, the malnourished
animals presented leucopenia as well as bone marrow and spleen hypoplasia compared
to animals of the control group. Animals in the malnourished group which had received
LPS also presented marrow hypoplasia and peripheral leucopenia compared to the control
animals. The apparent diffi culty in leucocyte response to bacterial infections in PEM is,
according to Suda et al. (1976) is due to a reduction in the reserve compartment of the
bone marrow and changes in the extracellular matrix (XAVIER et al., 2007) and not due
to the primary impairment of leucocyte mobilization from blood to tissue (CARLOS;
HARLAN, 1994).
The primary humoral immune response requires several days to occur and
therefore in the early stages of host defense antibody-independent mechanisms of
complement activation are extremely important (BOHLSON et al., 2001). The role of the
complement system as a system merging early-phase innate immunity with later-phase
acquired immunity has been extensively established in literature. C3 is a key protein
of the complement system. It can be activated by four pathways: (1) the classical or
alternative pathway, (2) the mannan binding protein pathway, (3) the C-reactive protein
pathway, and (4) the natural IgM pathway of innate immunity (SAKAMOTO; FUJISAWA;
NISHIOKA, 1998).
The effects of defi ciencies in one of these aforementioned pathways, particularly
in the alternative pathway, increase the host’s susceptibility to infection. The biological
effects of the complement system include the promotion of chemotaxis and anaphylaxis,
opsonization, and phagocytosis of microorganisms. C3 is the most important central
molecule of the complement system because both the classic and the alternative pathways
activate it, and its activation products mediate opsonization and anaphylactic activity and
also activate the terminal pathway (MICHAEL; FRANK, 2000; MOLINA, 2004).
FOCK, R. A.; ROGERO, M. M.; BORELLI, P. Protein-energy malnutrition alters the C3 complement factor in response to lipopolysaccharide in a murine model. Nutrire: rev. Soc. Bras. Alim. Nutr.= J. Brazilian Soc. Food Nutr., São Paulo, SP, v. 34, n. 1, p. 131-142, abr. 2009.
140
C3 activation results in a variety of immune reactions such as immune adherence,
phagocytosis, antibody response, cytolysis, infl ammation, and killing of pathogenic
microorganisms (SAKAMOTO; FUJISAWA; NISHIOKA, 1998). In humans and in
experimental animals, reduced levels of complement, especially of C3, were observed in
hosts whose defense against infection was defi cient (CARVALHO; MARTINS; CARNEIRO,
1984; SAKAMOTO; FUJISAWA; NISHIOKA, 1998).
It has been established now that nutritional defi ciency is commonly associated
with impaired immune responses, particularly cell-mediated immunity, phagocyte
function, cytokine production, secretory antibody response, antibody affi nity and the
complement system (CHANDRA, 1999). Complement is an essential opsonin and the
concentrations and activity of most complement components are decreased. The best
documented is a reduction in C3, CS, factor B, and total hemolytic activity. There is a
slight reduction in opsonic activity of plasma. Furthermore, metabolic activation and
intracellular destruction of bacteria are also reduced (CHANDRA, 1997).
In our study, the C3 component and total complement were determined in control
and malnourished animals without stimulus or stimulated with LPS. Our results showed
lower concentrations of C3 in malnourished animals in both cases. An interesting result
was observed after the LPS stimulus, when the control animals showed an increase in the
values of CH50 and C3, thus indicating an increase of the non-specifi c immunological
response. In our model of malnutrition, we observed less production of IL-1, IL-6 and
TNF-α after the LPS stimulus (FOCK et al., 2007). In the present work the lower serum
concentration of C3 Complement in malnourished mice stimulated with LPS can be a
consequence of the lower capacity of synthesis of pro-infl ammatory substances such as
IL-1, IL-6 and TNF-α. These cytokines induce liver proteins of acute phase production
such as C3 component of the system Complement (KOJ et al., 1988). Moreover, the
reduction of protein ingestion and, consequently essential amino acids in the diet, as
branched-chain amino acids, favored the lower serum C3 concentration in malnourished
animals, since branched-chain amino acids are involved in the liver turnover (JIMÉNEZ
et al., 1991; HOLECEK; SPRONGL; TILSER, 2001; MAY; BUSE, 1989).
The experimental data lead us to infer that the immune defi ciency response is
not only due to decreased C3 complement levels. The principal cause is the inability
to produce more C3 in response an infection.
CONCLUSION
Our data show that animals in an infl ammatory model of PEM present a decrease in
all parameters evaluated and do not present an immune response in the same intensity
or manner as well nourished animals.
FOCK, R. A.; ROGERO, M. M.; BORELLI, P. Protein-energy malnutrition alters the C3 complement factor in response to lipopolysaccharide in a murine model. Nutrire: rev. Soc. Bras. Alim. Nutr.= J. Brazilian Soc. Food Nutr., São Paulo, SP, v. 34, n. 1, p. 131-142, abr. 2009.
141
REFERÊNCIAS/REFERENCES
BOHLSON, S. S.; STRASSER, J. A.; BOWER, J. J.; SCHOREY, J. S. Role of complement in Mycobacterium avium pathogenesis: in vivo and in vitro analyses of the host response to infection in the absence of complement component C3. Infect. Immun, v. 69, n. 12, p. 7729-7735, 2001.
BORELLI, P.; MARIANO, M.; BOROJEVIC, R. Protein malnutrition: effect on myeloid cell production and mobilization into infl ammatory reactions in mice. Nutr. Res., v. 15, n. 10,p. 1477-1485, 1995.
BORELLI, P.; SOUZA, I. P.; BOROJEVIC, R.; DAGLI, M. L. Z.; KANG, H. C. Protein malnutrition: Some aspects of the in vitro adhesion of peritoneal mouse macrophages. Ann. Nutr. Metab., v. 42, n. 6, p. 367-373, 1998.
CARLOS, T. M.; HARLAN, J. M. Leucocyte endothelial adhesion molecules. Blood, v. 84,n. 7, p. 2068-2101, 1994.
CARVALHO, W. N. F.; MARTINS, J. V. C.; CARNEIRO, R. L. Non specifi c immunological response in moderate malnutrition. Allergol. Immunopathol., v. 12, n. 6, p. 489-496, 1984.
CATCHATOURIAN, R.; ECKERLING, G.; FRIED, W. Effect of short term protein deprivation on hemopoietic functions of healthy volunteers. Blood, v. 55, n. 4, p. 625–628, 1980.
CHANDRA, R. K. Nutrition and the immune system: an introduction. Am. J. Clin. Nutr., v. 66, n. 2, p. 460S-463S, 1997.
CHANDRA, R. K. Nutrition and immunology: from the clinic to cellular biology and back again. Proc. Nutr. Soc., v. 58, n. 3, p. 681-683, 1999.
CHANDRA, R. K. Protein-energy malnutrition and immunological responses. J. Nutr., v. 122, n. 3, p. 597-600, 1992. Supplement.
DACIE, J. V.; LEWIS, S. M. Practical haematology. Edinburgh, England: Churchill Livingstone, 1995. p. 57-58.
DE ONIS, M.; MONTEIRO, C.; AKRE, J.; GLUGSTON, G. The worldwide magnitude of protein-energy malnutrition: an overview from the WHO Global Database on Child Growth. Bull. World Health Organ., v. 71, n. 6, p. 703-712, 1993.
DOUMAS, B. T.; WATSON, W. A.; BIGGS, H. G. Albumin standards and the measurement of serum albumin with bromocresol green. Clin. Chim. Acta, v. 31, n. 1, p. 87-96, 1971.
FOCK, R. A.; SILVA, O. P. P.; BORELLI, P. Desnutrição proteica modifi ca a síntese de óxido nítrico em macrófagos. Braz. J. Pharm. Scien., v. 39, p. S115-118, 2003.
FOCK, R. A.; RAMIREZ VINOLO, M. A.; DE SÁ ROCHA, V. M.; DE SÁ ROCHA, L. C.; BORELLI, P. Protein-energy malnutrition decreases the expression of TLR-4/MD-2 and CD14 receptors in peritoneal macrophages and reduces the synthesis of TNF-α in response to lipopolysaccharide (LPS) in mice. Cytokine, v. 40, n. 2, p. 105-114, 2007.
FRIED, W.; SHAPIRO, S.; BARONE, J.; ANAGNOST, A. Effect of protein deprivation on hematopoietic stem cells and on peripheral blood counts. J. Lab. Clin. Med., v. 92, n. 2, p. 303–310, 1978.
GORNALL, A. G.; BARDAWILL, C. J.; DAVID, M. M. Determination of serum proteins by means of the biuret reactions. J. Biol. Chem., v. 177, p. 751, 1949.
GROSS, R. L.; NEWBERNE, M. P. Role of nutrition in immunologic function. Physiol. Rev., v. 60, n. 1, p. 188-302, 1980.
HOLECEK, M.; SPRONGL, L.; TILSER, I. Metabolism of branched-chain amino acids in starved rats: the role of hepatic tissue. Physiol Res. v. 50, n. 1, p. 25-33, 2001.
JIMÉNEZ, J. F. J.; ORTIZ L. C.; MORALES, M. S.; BARROS, P. M.; MUÑOZ, G. J. Prospective study on the effi cacy of branched-chain amino acids in septic patients. J. Parenter. Enteral Nutr., v. 15, n. 3, p. 252-261, 1991.
FOCK, R. A.; ROGERO, M. M.; BORELLI, P. Protein-energy malnutrition alters the C3 complement factor in response to lipopolysaccharide in a murine model. Nutrire: rev. Soc. Bras. Alim. Nutr.= J. Brazilian Soc. Food Nutr., São Paulo, SP, v. 34, n. 1, p. 131-142, abr. 2009.
142
KEUSCH, G. T. History of nutrition: malnutrition, infection and immunity. J. Nutr., v. 133, n. 1, p. 336S-340S, 2003.
KOJ, A.; MAGIELSKA-ZERO, D.; BERETA, J.; KURDOWSKA, A.; ROKITA, H.; GAULDIE, J. The cascade of infl ammatory cytokines regulating synthesis of acute phase proteins. J. Exp. Clin. Med., v. 13, n. 6, p. 255-264, 1988.
LISZEWSKI, M. K.; ATKINSON, J. P. Regulatory proteins of complement. In: FRANK, M. M.; VOLANAKIS, J. E. (Ed.). The human complement system in health and disease. New York: Marcel Dekker, 1998. p. 149-166.
MARTORELL, R. The nature of child malnutrition and its long-term implications Food Nutr. Bull., v. 20, n. 3, p. 288-292, 1999.
MAY, M. E.; BUSE, M. G. Effects of branched-chain amino acids on protein turnover. Diabetes Metab. Rev., v. 5, n. 3, p. 227-245, 1989.
MICHAEL, M.; FRANK, M. Primary immune deficiencies: presentation, diagnosis, and management. Pediatr. Clin. North Am., v. 47, p. 1-7, 2000.
MOLINA, H. Complement and immunity. Rheum. Dis. Clin. North Am., v. 30, n. 1, p. 1-18, 2004.
MUNOZ, E.; MARCOS, A.; UNZAGA, M. T. Effect of protein defi ciency on the lysosomal enzyme activities of the spleen and thymus of weanling rats. J. Nutr., v. 111, n. 12, p. 2133-2141, 1981.
NOVA, E.; SAMARTÍN, S.; GÓMEZ, S.; MORANDÉ, G.; MARCOS, A. The adaptive response of the immune system to the particular malnutrition of eating disorders. Eur. J. Clin. Nutr., v. 56, p. S34-S37, 2002. Supplement 3.
ORTIZ, R.; BETANCOURT, M. Cell proliferation in bone marrow cells of severely malnourished animals. J. Nutr., v. 144, n. 3, p. 472-476, 1984.
REDMOND, H. P.; LEON, P.; LIEBERMAN, M. D.; HOFMANN, K.; SHOU, J.; REYNOLDS, J.; GOLDFINE, J.; JOHNSTON, R. B.; DALY, J. M. Impaired macrophage function in severe protein – energy malnutrition. Arch. Surg., v. 126, n. 2, p. 192–196, 1991.
REEVES, P. G.; NIELSEN, F. H.; FAHEY, G. C. AIN-93 purifi ed diets for laboratory rodents: fi nal report of the American Institute of Nutrition Ad Hoc Writing Committee on the Reformulation of the Ain-76a Rodent. Diet. J. Nutr., v. 123, n. 11, p. 1939-1951, 1993.
RICE, A. L.; SACCO, L.; HYDER, A.; BLACK, R. E. Malnutrition as an underlying cause of childhood deaths associated with infectious diseases in developing countries. Bull. World Health Organ., v. 78, n. 10, p. 1207-1221, 2000.
SAKAMOTO, M.; FUJISAWA, Y.; NISHIOKA, K. Physiologic role of the complement system in host defense, disease, and malnutrition. Nutrition., v. 14, n. 4, p. 391-398, 1998.
SUDA, K. A.; MATHUR, M.; DEO, K.; DEO, M. G. Kinetics of mobilization of neutrophils and their marrow pool in protein – calorie defi ciency. Blood, v. 48, n. 6, p. 864-875, 1976.
VITURI, C. L.; ALVAREZ-SILVA, M.; TRETIN, A. Z.; BORELLI, P. Alteration of the bone marrow in extracellular matrix in mice undernourished. Braz. J. Med. Biol. Res., v. 33, n. 8, p. 889-895, 2001.
WARD, P. G. A micro-Kjeldahl procedure for field use. J. Med. Lab. Technol., v. 20, p. 191-195, 1963.
XAVIER, J. G.; FAVERO, M. E.; VINOLO, M. A.; ROGERO, M. M.; DAGLI, M. L.; ARANA-CHAVEZ, V. E.; BOROJEVIC, R.; BORELLI, P. Protein-energy malnutrition alters histological and ultrastructural characteristics of the bone marrow and decreases haematopoiesis in adult mice. Histol Histopathol., v. 22, n. 6, p. 651-660, 2007.
Recebido para publicação em 24/06/08.Aprovado em 06/11/08.
FOCK, R. A.; ROGERO, M. M.; BORELLI, P. Protein-energy malnutrition alters the C3 complement factor in response to lipopolysaccharide in a murine model. Nutrire: rev. Soc. Bras. Alim. Nutr.= J. Brazilian Soc. Food Nutr., São Paulo, SP, v. 34, n. 1, p. 131-142, abr. 2009.