panorama e tendências 2008 brazilian software market€¦ · especialmente o business continuity...
TRANSCRIPT

Mercado Brasileiro de SoftwarePanorama e Tendências
2008
Brazilian Software MarketScenario and Trends
2008

DesenvolverPromoverInformarProteger

Mercado Brasileiro de SoftwarePanorama e Tendências - 2008
ABES - Associação Brasileira das Empresas de Software
Brazilian Software MarketScenario and Trends - 2008
1º Edição
São Paulo/SP
2008

Copyright© ABES 2008Diagramação : Ronaldo Morais
Impressão e acabamento: BC Gráfica
Proibida a reprodução total ou parcial.Os infratores serão processados na forma da lei.
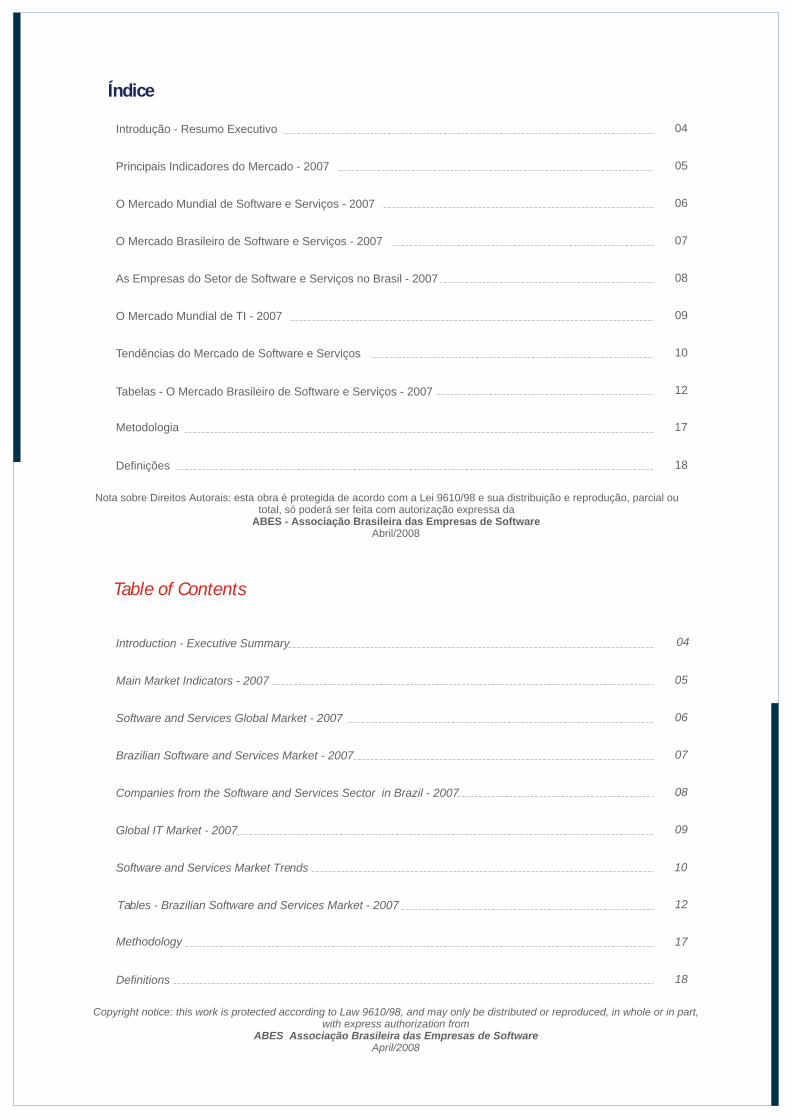
Índice
Table of Contents
Introduction - Executive Summary
Main Market Indicators - 2007
Software and Services Global Market - 2007
Brazilian Software and Services Market - 2007
Companies from the Software and Services Sector in Brazil - 2007
Global IT Market - 2007
Software and Services Market Trends
Tables - Brazilian Software and Services Market - 2007
Definitions
Methodology
04
05
06
07
08
09
10
12
17
18
Copyright notice: this work is protected according to Law 9610/98, and may only be distributed or reproduced, in whole or in part, with express authorization from
ABES Associação Brasileira das Empresas de SoftwareApril/2008
Introdução - Resumo Executivo
Principais Indicadores do Mercado - 2007
O Mercado Mundial de Software e Serviços - 2007
O Mercado Brasileiro de Software e Serviços - 2007
As Empresas do Setor de Software e Serviços no Brasil - 2007
O Mercado Mundial de TI - 2007
Tendências do Mercado de Software e Serviços
Tabelas - O Mercado Brasileiro de Software e Serviços - 2007
Definições
Metodologia
04
05
06
07
08
09
10
12
17
18
Nota sobre Direitos Autorais: esta obra é protegida de acordo com a Lei 9610/98 e sua distribuição e reprodução, parcial ou total, só poderá ser feita com autorização expressa da
ABES - Associação Brasileira das Empresas de SoftwareAbril/2008

04 Mercado Brasileiro de SoftwarePanorama e Tendências - 2008
Introdução - Resumo Executivo Introduction - Executive Summary
No ano de 2007 o Brasil ocupou a 12ª posição no mercado mundial de software e serviços, tendo movimentado aproximadamente 11,12 bilhões de dólares, equivalente a 0,86% do PIB naquele ano. Deste total, foram movimentados 4,19 bilhões em software, o que representou perto de 1,6% do mercado mundial e 43% do mercado latino americano. Os restantes 6,93 bilhões foram movimentados em serviços relacionados. Estudos apontam para um crescimento médio anual superior a 10% até 2010.
Este mercado é alimentado por 7.936 empresas, dedicadas ao desenvolvimento, produção e distribuição de software e de prestação de serviços. Daquelas que atuam no desenvolvimento e produção, 94% das empresas são classificadas como micro e pequenas empresas.
Em 2007, a participação de programas de computador desenvolvidos no país atingiu 33,6% do total do mercado brasileiro de software, confirmando a importante tendência de crescimento que vinha sendo apontada desde 2004, quando a participação era 27%, e que poderá atingir 40% até o final da década.
Os consumidores de software e serviços apresentam uma concentração específica, sendo que o setores industrial e financeiro representaram quase 50% do mercado usuário, seguidos pelos setores de serviços, comércio, governo, agroindústria e outros. Ainda do ponto de vista dos usuários, a perspectiva é que os investimentos em TI no Brasil deverão crescer mais que 10% no ano de 2008, considerando-se que o mercado está aquecido e o nível de confiança dos empresários está elevado.
Quanto às tendências do mercado, as pesquisas indicam que a curto/médio prazo, a segurança, especialmente o Business Continuity será uma das áreas de maior crescimento, em conjunto com Business Process Management e Bussines Intelligence. A Convergência de TI/TELECOM , que confere grande mobilidade aos negócios, também será um setor aquecido em 2008/2009. A longo prazo, Software as a Service, cujo modelo já está maduro, se mostrará mais flexível, com menor complexidade e custo. Da mesma forma, sistemas mais flexíveis (Dynamic IT), e a TI Verde deverão ser conceitos cada vez mais presentes como parte dos negócios empresariais.
O presente estudo, resultado de uma parceria firmada com a ABES, foi realizado com base em dados levantados pelo IDC junto aos mais de 50 escritórios no mundo, no mercado local com entrevistas a mais de 500 empresas, entre desenvolvedores, fornecedores e exportadores de software, além de empresas usuárias de TI. Os dados aqui analisados são relativos ao Q4 2007 da publicação “Black Book” do IDC.
thIn the year of 2007 Brazil occupied the 12 position Software and Services in the global market, with sales of approximately 11,12 billion dollars, equivalent to 0,86% of the Brazilian GDP that year. Out of this total, 4,19 billion referred to software licensing, which represented close to 1.6% of the global market and 43% of the Latin American market. The remaining 6,93 billion referred to related services. Studies forecast an annual average growth rate over 12% by 2010.
This market is supplied by about 7,936 companies, dedicated to developing, producing and distributing software and providing services. Considering only the developing and producing companies, 94% are classified as micro and small companies.
In 2007, the participation of domestic products achieved 33,6% of the Brazilian software market, which confirms this important increasing trend, initiated in 2004,when this participation was of 27%, and that forecasts indicate that this participation can reach 40% by the end of the decade.
The Software and Services consumers are specifically concentrated; the industrial and the financial sectors represent together almost 50% of the end user market, followed by services, trade, government, agricultural industry and others. Still from the point of view of users, the forecast for IT investments in Brazil is to increase more than 10% in 2008, considering that the market shows a growing trend and the level of confidence of the investors is very high.
Regarding market trends, surveys indicate Business Continuity, Business Process Management and Business Intelligence as the highest growing segments of the market, along with TI/TELECOM Convergence, in the short/medium term. In the long term, Software as a Service will show more flexibility, with less complexity and lower costs. In the same way, flexible systems (Dynamic IT), and Green IT will be allways more present in the company businesss.
This report was produced based on data gathered from the market by IDC through a partnership established with ABES, through which the consulting firm used information of its 50 regional offices, interviewed 550 companies, among software developers, suppliers and exporters, and IT user companies. The information is related to Q4 2007 from the “Black Book”.

Standard
U$ 324 milhões24,3 %
Standard
Sob Encomenda
U$ 995 milhões70,6 %
Custom
Desenvolvido no Exterior
U$ 2,779 bilhões66,4 %
Foreign Production
Total
Software
U$ 4,19 bilhões
37,7 %
Exportação
U$ 71 milhões5,1 %
Export
Mercado Total
Software Serviços
Software Services
Total Market
U$ 11,12 bilhões
Nacional
U$ 6,689 bilhões
96,5 %
Domestic
Exportação
U$ 242 milhões
3,5 %
Export
Desenvolvidono País
U$ 1,408 bilhões33,6 %
DomesticProduction
Total
Serviços
U$ 6,93 bilhões
62,3 %
Principais Indicadores do Mercado Brasileiro - 2007 (Us$ Bilhões)
Main Brazilian Market Indicators - 2007 (Us$ Billion)
Indicadores de Mercado e Evolução - 2004 / 2005 / 2006 / 2007 (Us$ Bilhões)
Market Indicators and Evolution 2004 / 2005 / 2006 / 2007 (Us$ Billion)Market Indicators and Evolution 2004 / 2005 / 2006 / 2007 (Us$ Billion)
+ 18,8 %
Software
+ 28,5 %
Total Market
+ 22,3 %
TotalU$ 11,12
TotalU$ 9,09
TotalU$ 7,41
TotalU$ 5,98
Services
Mercado Total
Variação
Serviços
2006 / 2007
2006 / 2007
2006 / 2007
Software
05Brazilian Software MarketScenario and Trends - 2008
Services
U$ 3,62
Serviços
Services
U$ 3,62
Serviços
Software
U$ 2,36
Software
U$ 2,72
Services
U$ 4,69
Serviços
Software
U$ 3,26
Services
U$ 5,83
Serviços
Software
U$ 4,19
Services
U$ 6,93
Serviços
Software and Services Global Market - 2007 (Us$ Billion)
O Mercado Mundial de Software e Serviços - 2007 (Us$ Bilhões)
ção
(%)
Volume Market
(Us$ bilhões)
s
Software and Services Global Market - 2007 (Us$ Billion)
O Mercado Mundial de Software e Serviços - 2007 (Us$ Bilhões)
ção
(%)
Volume Market
(Us$ bilhões)
s
100%756,5TotalTotalTotalTotal
12,5%ROWRest of WorldRest of World
95,2ROW
1,05%7,92CoréiaCoréiaKoreaKorea
1,22%9,25
ChinaChinaChinaChina
1,30%9,85
SuíçaSwitzerlandSuíçaSwitzerland
1,43%10,8110,81
SuéciaSuéciaSwedenSweden
1,52%11,5
AustráliaAustráliaAustraliaAustralia
1,52%11,5
BrasilBrasilBrazilBrazil
1,71%13,0
EspanhaSpainEspanhaSpain
1,79%13,6HolandaHolandaNetherlandsNetherlands
2,56%19,3ItáliaItalyItáliaItaly
2,91%22,0CanadáCanadaCanadáCanada
5,50%41,6FrançaFranceFrançaFrance
6,86%51,8AlemanhaGermanyAlemanhaGermany
7,98%60,3UKUKUKUK
8,43%63,8JapãoJapanJapãoJapan
41,6%USAUSA
315USAUSA
Participa ão Share
Volume Market
(Us$ billion)(Us$ bilhões)
PaíCountry
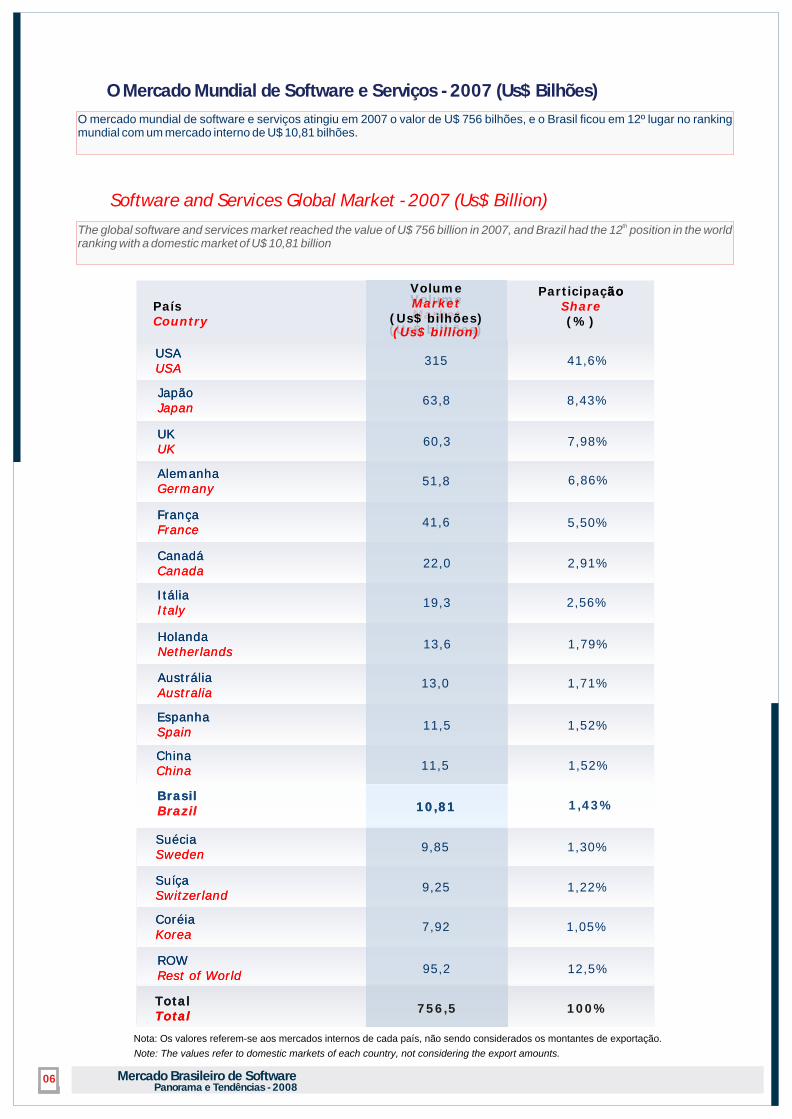
O mercado mundial de software e serviços atingiu em 2007 o valor de U$ 756 bilhões, e o Brasil ficou em 12º lugar no ranking mundial com um mercado interno de U$ 10,81 bilhões.
thThe global software and services market reached the value of U$ 756 billion in 2007, and Brazil had the 12 position in the world ranking with a domestic market of U$ 10,81 billion
06 Mercado Brasileiro de SoftwarePanorama e Tendências - 2008
Software and Services Global Market - 2007 (Us$ Billion)
O Mercado Mundial de Software e Serviços - 2007 (Us$ Bilhões)
ção
(%)
Volume Market
(Us$ bilhões)
s
100%756,5TotalTotalTotalTotal
12,5%ROWRest of WorldRest of World
95,2ROW
1,05%7,92CoréiaCoréiaKoreaKorea
1,22%9,25
ChinaChinaChinaChina
1,30%9,85
SuíçaSwitzerlandSuíçaSwitzerland
1,43%10,8110,81
SuéciaSuéciaSwedenSweden
1,52%11,5
AustráliaAustráliaAustraliaAustralia
1,52%11,5
BrasilBrasilBrazilBrazil
1,71%13,0
EspanhaSpainEspanhaSpain
1,79%13,6HolandaHolandaNetherlandsNetherlands
2,56%19,3ItáliaItalyItáliaItaly
2,91%22,0CanadáCanadaCanadáCanada
5,50%41,6FrançaFranceFrançaFrance
6,86%51,8AlemanhaGermanyAlemanhaGermany
7,98%60,3UKUKUKUK
8,43%63,8JapãoJapanJapãoJapan
41,6%USAUSA
315USAUSA
Participa ão Share
Volume Market
(Us$ billion)(Us$ bilhões)
PaíCountry
O mercado mundial de software e serviços atingiu em 2007 o valor de U$ 756 bilhões, e o Brasil ficou em 12º lugar no ranking mundial com um mercado interno de U$ 10,81 bilhões.
thThe global software and services market reached the value of U$ 756 billion in 2007, and Brazil had the 12 position in the world ranking with a domestic market of U$ 10,81 billion
06 Mercado Brasileiro de SoftwarePanorama e Tendências - 2008
Nota: Os valores referem-se aos mercados internos de cada país, não sendo considerados os montantes de exportação.
Note: The values refer to domestic markets of each country, not considering the export amounts.

Software and Services Brazilian Market - 2007
O Mercado Brasileiro de Software e Serviços - 2007
07Brazilian Software MarketScenario and Trends - 2008
Software
Mercado Total de Us$ 4,19 bilhõesRepresenta 1,6 % do mercado mundialAtendido em 33,6 % por programas desenvolvidos no paísExportação de Us$ 71 milhões em licençasConta com 6.154 empresas dedicadas à exploração econômica
Serviços
Mercado Total de Us$ 6,93 bilhõesRepresenta 1,4 % do mercado mundialExportação de Us$ 242 milhõesConta com 1.782 empresas dedicadas à exploração econômica
Indicadores Gerais de TI
Mercado Total de Us$ 20,7 bilhõesRepresenta 1,6 % do mercado mundial e 43,4 % do mercado A.L.Venda de 8,9 milhões de PC's Base instalada composta por 27,1 milhões de Pc’s42 milhões de usuários da Internet
Software
Total Market of Us$ 4,19 billionRepresents 1,6 % of world market
Local development represents 33,6 % of the marketLicence export of Us$ 71 million
6.154 companies in the market
Services
Total Market of Us$ 6,93 billionRepresets 1,4 % of world market
Export of Us$ 242 million1.782 companies in the market
General IT Indicators
Total Market of Us$ 20,7 billionRepresents 1,6 % of world market and 43,4 % of L.A. market
Sales of 8,9 million PC's unitsInstaled base of 27,1 million PC’s
42 million users of intrnet

As Empresas do Setor de Software e Serviços no Brasil - 2007
Companies from the Software and Services Sector in Brazil - 2007
LargeGrande
0,8%
MédiaMedium
5,1%
Divisão por Tipo de AtividadeDivision by Activity
Divisão por Porte da EmpresaDivision by company Size
ProductionProdução
24%
ServicesServicesServiços
22,5%
DistributionDistribuição
53,5%Small
Pequena
57,2%
MicroMicro
36,9%
08 Mercado Brasileiro de SoftwarePanorama e Tendências - 2008
7.936
Total
Empresas
Companies
ServiçosServices
1.782
DistribuiçãoDistribution
4.247
DesenvolvimentoDevelopment
1.907

IT World Market - 2007 (Us$ Billion)
O Mercado Mundial de TI - 2007 (Us$ Bilhões)
Distribuição do Mercado de TI
IT Market Distribution
Mercado Latino americano de TIem 2007 - U$ 47,7 Bilhões
Brasil representa 43,4%
Latin America IT Market (Us$ billion)
Brazil participation
Nota: Os valores referem-se aos mercados internos de cada país, não sendo considerados os montantes de exportação.
Representa 43,4%
Mercado Mundial de TI em 2007 - Us$ 1.300 Bilhões
Note: The values refer to domestic markets of each country, not considering the export amounts.
09Brazilian Software MarketScenario and Trends - 2008
Brasil20,7
México11,3
EUA466 Irlanda
3,9
Uk89 China
57,0
Colombia2,6 Brasil
20,7
Argentina3,1
México11,3
Rússia19,5
Japão107
Índia17,6
Israel4,7
Espanha21,9
Services
38%
Serviços
Software
20,9%
Software
Hardware
42%
Hardware

Cenário Macro Econômico 2008/2009
Tendências de curto e médio prazo
Tendências de longo prazo
Cenário positivo para o mercado de TI no Brasil :Apesar da incerteza na economia mundial, as empresas transnacionais irão voltar suas atenções aos países emergentes, onde as taxas de crescimento ainda são maiores.
Mercado interno aquecido: Queda no desemprego, inflação sob controle, dólar em queda e nível de confiança dos empresários elevado.
Mais investimento :Maioria das pequenas e médias empresas pretende aumentar o orçamento para investimento em TI em 2008, em relação a 2007.
Segurança :Menos questões técnicas e maior preocupação com o negócio como um todo (Business Continuity).
Business Process Management Software: BPM será um dos mercados funcionais com maior crescimento em 2008.
Business Intelligence :Diferencial competitivo e alinhamento às estratégias de negócio. A necessidade de integração e alinhamento das funcionalidades de Inteligência do Negócio ao conjunto de processos e necessidades estratégicas de negócio das organizações deverá aquecer o mercado de BI em 2008.
Convergência TI / Telecom Mobilidade : Protocolo SIP (Session Initiation Protocol), que possibilita a realização de conferências multimídia, cursos pela Internet, telefonia sobre Internet, entre outras funcionalidades, permitirá aos colaboradores levar o trabalho para fora dos escritórios, através de notebooks ou smart phones. Sistemas de gerenciamento remoto controlarão suas atividades e, com a nova geração de redes, eles poderão estar conectados em qualquer hora e lugar.
Maior controle dos projetos de TI :TI é um gargalo para muitas organizações, o que tornará necessário maior controle sobre os processos, fomentando o mercado de ferramentas de garantia da qualidade, como software para testes (Bug Tracking), software de qualidade (Automated Software Quality ASQ) e gerenciamento de configurações, como versionamento, gerenciamento de processos, etc (Software Configuration Management - SCM).
Software Livre : Aumento da utilização de aplicativos em código aberto, além dos sistemas operacionais.
SaaS: Maior flexibilidade com menor complexidade e menor custo:O modelo de Software como Serviço está maduro para aplicações básicas, padronizadas, que podem ser compartilhadas por várias empresas e não exigem customização, mas é pouco adequado para sistemas críticos. O mercado de SaaS deve continuar crescendo pois permite que processos mais complexos como a migração, o relacionamento e a dependência de fornecedores sejam amenizados.
SOA: Time-to-market, agilidade e flexibidade:Adoção da arquitetura orientada a serviço em crescimento, especialmente no fornecimento de infra-estrtura para as aplicações.
Dynamic IT - Virtualização - TI Verde:Hardware, Software e Serviços tenderão a formar juntos uma solução única de TI, independente do local físico onde o dado é armazenado. Governança e TI Verde (Green IT) contribuirão para popularizar a virtualização e a TI dinamica.
Tendências do Mercado de Software e Serviços
10 Mercado Brasileiro de SoftwarePanorama e Tendências - 2008

11Brazilian Software MarketScenario and Trends - 2008
Macro Economic Scenario
Positive cenario for IT market in Brazil:Despite international economy uncertainness, the multinational companies are looking to the emerging countries, where the growing trends are still high.
Positive internal market conditions:Unemployment reduction, inflation under control, dollar devaluation and growing investitors confidence.
Increasing investiment:Most of the small and medium companies are planning to increase their IT investment in 2008.
Short and medium term trends
Security:Less technical issues and more concern to the business as a whole (Business Continuity).
Business Process Management Software:BPM is expected to be one of the highest growth market in 2008.
Business Intelligence: Competitive differential and alignment to the business strategies. The need to align and integrate the intelligence functionalities to the process needs and business strategies should boost the BI market during 2008.
IT / TELECOM Convergence Mobility:SIP protocols that permit the use of internet for multimedia conferences, e-learning and telecom functionalities will allow workers to take the labor out of the offices, by the use of notebooks or smartphones. Remote management systems will control their activities and the new network generation will guarantee constant connection.
Control of IT Projects:IT can be a bottleneck for many organizations what will generate a higher control over the business processes, increasing the quality assurance tools market as test software (Bug Tracking), quality assurance software (Automated Software Quality ASQ), and configuration management software such as version control (Software Configuration Management - SCM).
Free Software:Increase in the use of open source applications, beyond operating systems.
Long Term Trends
SaaS Increasing flexibility, decreasing costs:The model is mature for basic and standard applications, which need few customizations and can be shared by many companies, although not adequate for critical systems. The SaaS market will grow as reduces the complexity of processes such as migration, relationship and suppliers dependence.
SOA Time to Market, Flexibility:Still a strong trend, specially for the supply of application infrastructure.
Dynamic IT Virtualization Green IT:Hardware, software and services will become one IT solution, regardless of the physical location where the data is stored. Management and Green IT will lead to virtualization and dynamic IT.
Software and Services Market Trends

Brazilian Software and Services Market 2007 (Us$ Million)
O Mercado Brasileiro de Software e Serviços - 2007 (Us$ Milhões)
Divisão por Origem do Software/ServiçoMarket by Orign
Divisão por Classe do Software/ServiçoMarket by Class
+ 22,3 %---11.120Total Software e ServiçosSoftware and Services Total
+ 18,9%100%6.930Sub Total ServiçosServices Subtotal
+28,5 %100%4.190Sub Total SoftwareSoftware Subtotal
+30,9 %23,7%995Software Sob EncomendaCustom Developed Software
+29,5 %62,6%2.623Software Parametrizável Parameterizable SoftwareParameterizable Software
+ 19,7 %13,6%571Software StandardStandard Software
Variação 2007/2006
Participação Volume (Us$ milhões)Classe
---Total Software e ServiçosSoftware and Services Total
Sub Total ServiçosServices Subtotal
Sub Total SoftwareSoftware Subtotal
Software Sob EncomendaCustom Developed Software
Software Parametrizável
Software StandardStandard Software
Participação (%)Classe
+ 22,3 %---7.410Software and Services Total
+ 18,9 %100%4.690Sub Total ServiçosServices Subtotal
+ 24,1 %3 %142Serviços ExportaçãoServices Export
+ 18,7 %97 %4.548Serviços Mercado LocalDomestiv Market Services
+ 28,5 %100 %2.720Sub Total SoftwareSoftware Subtotal
+ 36,5 %1,2 %35,3Produção Local ExportaçãoDomestic Production for Export
+ 35,7 %7,3 %202,1Produção Local StandardDomestic Standard Production
+ 30,9 %20,5 %558,5Produção Local Sob EncomendaDomestic Custom Development
71,0 %1.924,1Desenvolvido no ExteriorForeign Production
Variação Participação Volume (Us$ milhões)
Origem
---11.120Total Software e Serviços
100%6.930Sub Total Serviços
3,5 %242Serviços ExportaçãoServices Export
96,5 %6.689Serviços Mercado LocalDomestiv Market Services
100 %4.190Sub Total Software
1,7 %71Produção Local ExportaçãoDomestic Production for Export
8,2 %342Produção Local StandardDomestic Standard Production
23,7 %995Produção Local Sob EncomendaDomestic Custom Development
+ 26,2 %66,4 %2.779Desenvolvido no ExteriorForeign Production
2007/2006(%)
12 Mercado Brasileiro de SoftwarePanorama e Tendências - 2008

Segmentação do Mercado de Software e ServiçosSoftware and Services Market Segmentation
Brazilian Software and Services Market 2007 (Us$ Million)
O Mercado Brasileiro de Software e Serviços - 2007 (Us$ Milhões)
+ 22,3 %---11.120 ---Total Software e ServiçosTotal Software e
1,7%71
+ 28,5 %100%4.190
Software para ExportaçãoExportation Software
23,7%995
Serviços
Software and Services TotalSoftware and Services Total
+ 18,9%100%6.930Sub Total ServiçosSub Total Serviços
Services SubtotalServices Subtotal
208Treinamento
Training3,0%
1.247SuporteSupport
18,0%SuporteSupport
3.049 44,0%OutsourcingOutsourcing
OutsourcingOutsourcing
1.248 18,0%Integração de SistemasIntegração de Sistemas
System integrationSystem integration
17,0%1.178ConsultoriaConsultancyConsultoriaConsultancy
Sub Total SoftwareSoftware Subtotal
29,4%1.232Infra-estruturaInfrastructure
Software sob EncomendaCustom Developed Software
22,0%925Desenvolvimento e ImplementaçãoDevelopment and implementation
+ 32,2 %
- 3,5 %
+ 63,6 %
+ 30,9 %
+ 36,5 %
+ 18,4 %
+ 18,9 %
+ 21,6 %
+ 17,9 %
- 10,7 %
23,2%973AplicativosApplications
Variação 2007/2006
Participação (%)
Volume (Us$ milhões)
Segmento
(*) Devido a alterações na taxonomia em 2006, o cálculo da variação não é aplicável neste caso.
13Brazilian Software MarketScenario and Trends - 2008
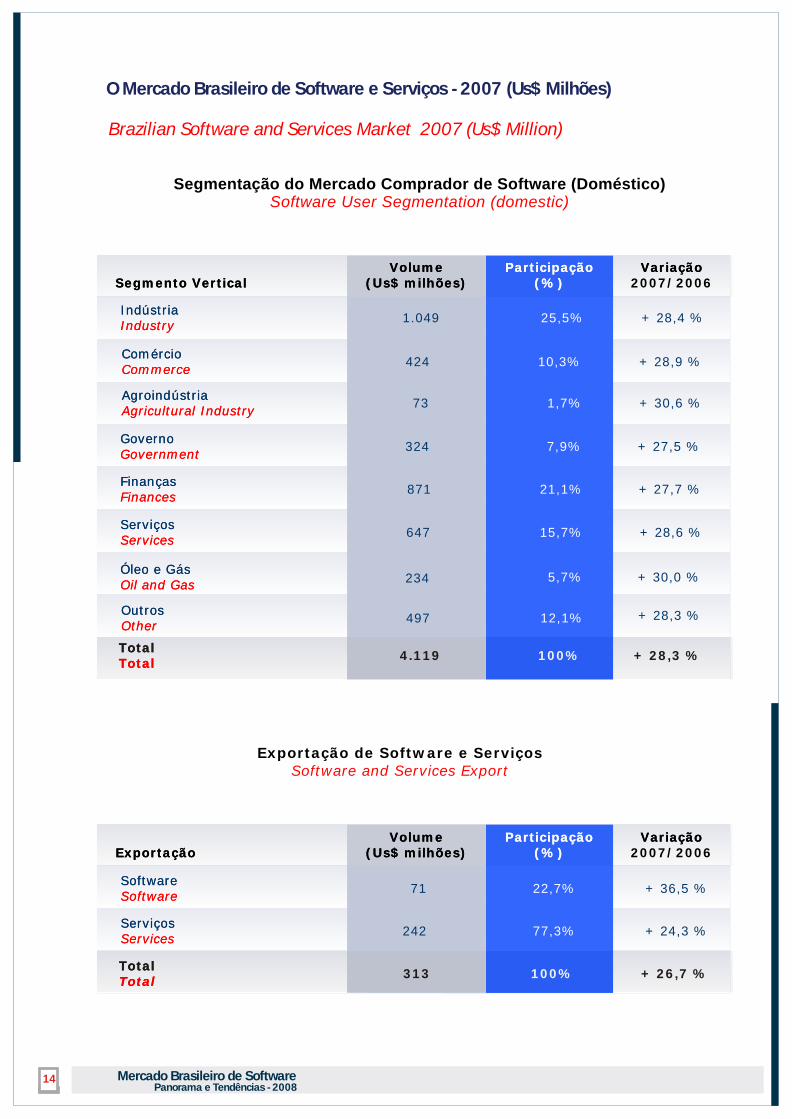
Segmentação do Mercado Comprador de Software (Doméstico)Software User Segmentation (domestic)
Exportação de Software e ServiçosSoftware and Services Export
Brazilian Software and Services Market 2007 (Us$ Million)
O Mercado Brasileiro de Software e Serviços - 2007 (Us$ Milhões)
Total+ 28,3 %100%4.119
Total Total Total
12,1%497OutrosOtherOutrosOther
+ 30,0 %
+ 28,3 %
5,7%234Óleo e GásOil and GasÓleo e GásOil and Gas
ServiçosServiços+ 28,6 %15,7%647
ServicesServices
+ 27,7 %21,1%871FinançasFinancesFinançasFinances
+ 27,5 %7,9%324GovernoGovernmentGovernoGovernment
+ 30,6 %1,7%73AgroindústriaAgricultural IndustryAgroindústriaAgricultural Industry
éé+ 28,9 %10,3%424
Com rcioCommerceCom rcioCommerce
+ 28,4 %25,5%1.049IndústriaIndustryIndústriaIndustry
Variação 2007/2006
Participação (%)
Volume (Us$ milhões)Segmento Vertical
Variação Participação (%)
Volume (Us$ milhões)Segmento Vertical
+ 26,7 %100%313Total TotalTotal Total
+ 24,3 %77,3%242Serviços ServicesServiços Services
+ 36,5 %22,7%71Software SoftwareSoftware Software
Variação 2007/2006
Participação (%)
Volume (Us$ milhões)Exportação
Variação Participação (%)
Volume (Us$ milhões)Exportação
14 Mercado Brasileiro de SoftwarePanorama e Tendências - 2008

Software Category Segmentation
Brazilian Software and Services Market 2007 (Us$ Million)
O Mercado Brasileiro de Software e Serviços - 2007 (Us$ Milhões)
Outros (Usuário Final, Engenharia, Manufatura)Other
Outros (Ferramentas de Qualidade, Desenvolvimento)Other
Análise e Entrega
Analysis and Delivery
Aplicativos para ImplementaçãoApplication Deployment
Armazenamento
Outros (Sistemas Operacionais, Interfaces, Subsist.)
Storage
Other
Segurança
Gerenciamento de Sistemas e Redes
Security
System and Network Management
Infra Estrutura
Infrastructure
---11.120 ---
100%6.930
208
189
79
Gerenciamento de Bancos de Dados RelacionaisInformation and Data Mangement
Desenvolvimento e Implementação Developing and application deployment
CRM (Customer Relationship Management) CRM
SCM (Supply Chain Management)SCM
ERM (Enterprise Resource Management)ERM
AplicativosApplications
---
---
---
---
---
---
---
---
---
---
---
---
140
29,5 %925
367
100%
39,5 %
200
178
278
576
1.232
3.130
189
79
286
371
81
385
31,0 %973
Participação (%)
Volume (Us$ milhões)
Categoria de Software
Total
15Brazilian Software MarketScenario and Trends - 2008
Segmentação do Mercado de Software por Categoria

16 Mercado Brasileiro de SoftwarePanorama e Tendências - 2008
Security Software
User Platform
Brazilian Software and Services Market 2007 (Us$ Million)
O Mercado Brasileiro de Software e Serviços - 2007 (Us$ Milhões)
Gerenciamento de Segurança e VulnerabilidadeSecurity and Vulnerability Management
Outros Software de SegurançaOther
Gerenciamento de Conteúdo e Ameaças
Plataforma Baixa (Desk Tops, Lap Tops)
Secure Content and Threat Management
Low Platform
Security Software Applications
Gerenciamento de Acesso e Identificação
Plataforma Alta (Main Frames, AS 390, AS 340)
Identity and Access Management
High Platform
3
30
131
2.453
18,0 %
21,6 %
65,5 %
78,4 %
15,0 %
1,5 %
36
677
Participa
Participa
ç
ç
ão
ão
(%)
(%)
Volume
Volume
(Us$ milhões)
(Us$ milhões)
Software para Segurança
Software
200Total
Segmentação do Mercado de Software - Categoria Infra Estrutura- Segurança
Segmentação do Mercado de Software - Divisão por Plataforma de Utilização
100%
3.130Total 100%
17Brazilian Software MarketScenario and Trends - 2008
Metodologia Methodology
As pesquisas foram baseadas em metodologia da IDC já consagrada mundialmente, de forma que os resultados deste estudo apresentem total concordância com as tendências regionais e globais. A metodologia de levantamento das informações consistiu em:
Dados globais
A IDC utilizou-se da consolidação trimestral dos dados realizada em 50 escritórios divididos em seis regiões mundiais. Estes dados são consolidados no estudo “Black Book” que congrega informações gerais dos mercados de Tecnologia da Informação nestes países. Essas informações são atualizadas trimestralmente. O presente estudo está baseado nos dados relativos a Q4 2007 do “Black Book”.
Entrevistas com Fornecedores de Software
Para este projeto, a IDC utilizou informações coletadas junto a 500 fornecedores de produtos de software, dentre os quais multinacionais atuando no mercado brasileiro. Os dados de dimensionamento de mercado (exceto exportações de software) derivam desta pesquisa primária. As entrevistas foram realizadas pessoalmente e via telefone. Os interlocutores são analistas ligados a área de software na IDC Brasil.
Entrevistas com Desenvolvedores
A IDC entrevistou empresas que trabalham com desenvolvimento de software produzindo produtos customizados e parametrizáveis. Estas empresas são geralmente classificadas como ISVs locais (Local Independent Software Vendors). Para a IDC, o universo de empresas ligadas ao desenvolvimento de software próprio é de 1.907 empresas, garantindo que a amostra possui significância estatística adequada para representar o universo considerado. Também foram realizadas entrevistas com empresas que exportam produtos de software e serviços relacionados, no mesmo período em que ocorreu o acesso aos fornecedores de software locais e multinacionais.
Entrevistas com usuários de TI
A IDC também utilizou informações coletadas junto a empresas usuárias de TI.
Segmentos não pesquisados
Alguns segmentos do setor de software e serviços não foram pesquisados, para efeito deste trabalho. São eles:
Software Embarcado software integrado a equipamentos, constituindo-se numa solução completa de hardware, tais como centrais telefônicas, celulares, máquinas e equipamentos de automação industrial, entre outros.
Software OEM as licenças OEM referentes a sistemas operacionais para equipamentos de grande porte não foram consideradas.
Software para Uso Próprio software desenvolvido dentro de empresas, para uso próprio e que são eventualmente distribuídos a terceiros sem envolvimento comercial.
Firmware programas em linguagem básica integrados ao hardware.
BPO serviços prestados por fornecedor externo à organização, que compreendem a transferência do gerenciamento e execução de processos de trabalho ou função de negócio completa.
t
t
t
t
t
The surveys were based on the IDC methodology, already reconized worldwide, such that this study's results were fully compliant with regional and global trends. The methodology for gathering information consisted of:
Global data
IDC used the quarterly consolidation of data conducted in 50 offices divided into six world regions. This data is consolidated in the “Black Book” study that gathers general information on Information Technology in these countries. This information is updated quarterly. The present study is based in data relative to Q4 2007 from the “Black Book”.
Interviews with Software Suppliers
For this project, IDC used information collected from 500 software product suppliers, among which multinationals operating in the Brazilian market. The market sizing data (except for software exports) was obtained from this preliminary survey. The interviews were conducted personally and by phone. The interlocutors are analysts of IDC Brazil.
Interviews with Developers
IDC interviewed companies that work with software development, producing customized and parameterizable products. These companies are usually classified as local ISVs (Local Independent Software Vendors). For IDC, the universe of companies linked to own software development is 1,907 companies, guaranteeing that the sample has adequate statistical significance to represent the universe considered. Also, interviews were conducted with companies that export related software and services products, during the same period in which the local and multinational software suppliers were accessed.
Interviews with IT users
IDC also collected data by interviewing heavy users of information technology.
Segments not surveyed
Some segments of the software and services market were not surveyed for purposes of this work, namely:
Shipped Software software integrated to equipments constituting a complete hardware solution, such as telephone central offices, cell phones, industrial automation machinery and equipments, among others.
OEM Software OEM (Original Equipment Manufacturer) licenses of operating systems for large equipments were not considered.
Software for Internal Use software developed inside the company, for own use and, eventually, distributed to third parties without commercial involvement.
Firmware programs in basic computer language integrated to the hardware.
BPO services provided by a supplier external to the organization, comprising transfer of management and execution of work processes or complete business function.
t
t
t
t
t
Definições
A seguir algumas definições adotadas neste trabalho:
Quanto à segmentação do mercado:
t Aplicativos: Estão incluídos nesta segmentação os pacotes de aplicativos para consumidores, aplicativos comerciais, aplicativos industriais e programas específicos para automação de processos industriais ou de negócios.
t Software de Desenvolvimento e Implementação de Aplicações: Segmento conhecido por “middleware”, no qual estão incluídos os programas para gerenciar e definir os dados que serão mantidos em um ou mais bancos de dados, ferramentas de desenvolvimento, ferramentas de BI, entre outros.
t Software de Infra-estrutura: É dividido em 5 categorias primárias, que são software de gerenciamento de sistemas e redes, software de segurança, software de storage e backup, software de rede e software de sistemas operacionais.
t Consultoria: Serviços de consultoria e aconselhamento relativos à Tecnologia da Informação.t Integração de Sistemas: Compreende o planejamento, “design”, implementação e gerenciamento de soluções de
TI para atender a especificações técnicas definidas pelo cliente, para atender suas necessidades de negócios.t Outsourcing: Atividade na qual um provedor de serviços externo à organização assume a responsabilidade pelo
gerenciamento e operação de parte ou toda infra-estrutura de TI do cliente, inclusive redes, comunicação, manutenção e operação de sistemas e aplicativos, entre outros.
t Suporte: Serviços relacionados à instalação, customização e configuração de software, assim como serviços de suporte técnico aos usuários.
t Treinamento: Processo de capacitação de funcionários ou clientes, relacionado ao desenvolvimento, administração ou utilização de TI.
Quanto à classe do software:
t Software Standard: produtos que podem ser instalados pelo próprio usuário, sem necessidade de serviços adicionais. Neste mercado encontram-se sistemas operacionais, suítes de produtividade, produtos de consumo de entretenimento e colaboração, entre outros.
t Software Parametrizável: produtos que requerem a contratação de serviços adicionais para sua implantação e parametrização.
t Software Sob Encomenda: sistemas desenvolvidos de acordo com as especificações de um único usuário e que vão atender apenas às necessidades daquele usuário.
t Serviços: são os serviços técnicos agregados ao software, tais como consultoria, treinamento, suporte, data-entry, processamento de dados, desenvolvimento e manutenção de conteúdo de páginas da internet, etc.
Quanto à segmentação do mercado comprador:
t Indústria: inclui todas as empresas de manufatura, sejam de manufatura discreta ou de transformação.t Comércio: Inclui todas as empresas que atuem no comércio, varejo, ou distribuição.t Agroindústria: inclui empresas fabricantes de maquinário agrícola, adubos e fertilizantes, usinas e cooperativas,
empresas de trading, exportação de carnes e processamento de alimentos.t Governo: instituição voltada à administração pública, seja em nível municipal, estadual ou federal.t Finanças: inclui empresas públicas e privadas, bancos, empresas de seguros, cartões de crédito, corretora de
valores e todas as outras instituições financeiras. t Serviços: empresas da área de saúde, transportes, educação, turismo, entretenimento e demais serviços. t Óleo & Gás: empresas públicas e privadas relacionadas ao setor óleo, gás e mineração. t Outros: estão incluídas as organizações dos setores de comunicações, utilidades e o mercado doméstico.
Outras definições:
t SOA - Service Oriented Architeture (plataformas de TI orientadas para serviços)t ISO - International Organization for Standardizationt ITIL - Information Technology Infrastructure Library t VoIP - Voice over Internet Protocol t OEM - Original Equipment Manufacturert BPO - Business Process Outsourcing
18 Mercado Brasileiro de SoftwarePanorama e Tendências - 2008

Definitions
Below are some definitions adopted in this report:
Regarding market segmentation:
t Applications: included in this segmentation are applications for consumers, commercial application, industrial applications and specific programs for industrial or business process automation.
t Application Development and Deployment Software: Segment known as “middleware”, in which are included programs to manage and define data that will be kept in one or more databases, development tools, BI tools, among others.
t Infrastructure Software: is divided into 5 primary categories: management software for systems and networks, security software, storage and backup software and operating system software.
t Consultancy: Consultancy and advisory services pertaining to Information Technology.t System Integration: Comprises planning, design, implementation and management of IT solutions to meet technical
specifications defined by the customer to meet its business needs.t Outsourcing: Activity in which a service provider external to the organization assumes responsibility for the management
and operation of all or part of the customer's IT infrastructure, including networks, communication, maintenance and operation of systems and applications, among others.
t Support: Services related to software installation, customization and configuration, as well as technical support services to users.
t Training: Process of empowering employees or customers, related to IT development, administration or utilization.
Regarding software class:tt Standard Software: products that can be installed by the user itself, without need of additional services. In this market we
have operating systems, productivity suites, entertainment and collaboration consumer products, among others.t Parameterizable Software: products that require the hiring of additional services for their installation and
parameterization.t Custom Developed Software: systems developed according to the specifications of a single user and that will meet the
needs of that user alone.t Services: are technical services added to the software, such as consultancy, training, support, data entry, data
processing, development and maintenance of internet page content, etc.
Regarding buyer market segmentation:
t Industry: includes all manufacturing companies, whether discrete manufacturing or conversion.t Trade: includes all companies working in trade, retail, or distribution.t Agricultural Industry: includes manufacturing companies of agricultural machinery, composts and fertilizers, plants and
cooperatives, trading companies and food processing.t Government: institution directed toward public administration, whether at municipal, state or federal level.t Finances: includes public and private companies, banks, insurance companies, credit cards, value broker and all other
financial institutions. t Services: health, transport, education, tourism, entertainment and other services. t Oil & Gas: public and private companies related to the oil, gas and mining sector. t Other: included are organizations from the communication, utilities and domestic market sectors.
Other definitions:
t SOA - Service Oriented Architeture t ISO - International Organization for Standardizationt ITIL - Information Technology Infrastructure Library t VoIP - Voice over Internet Protocol t OEM - Original Equipment Manufacturert BPO - Business Process Outsourcing
19Brazilian Software MarketScenario and Trends - 2008
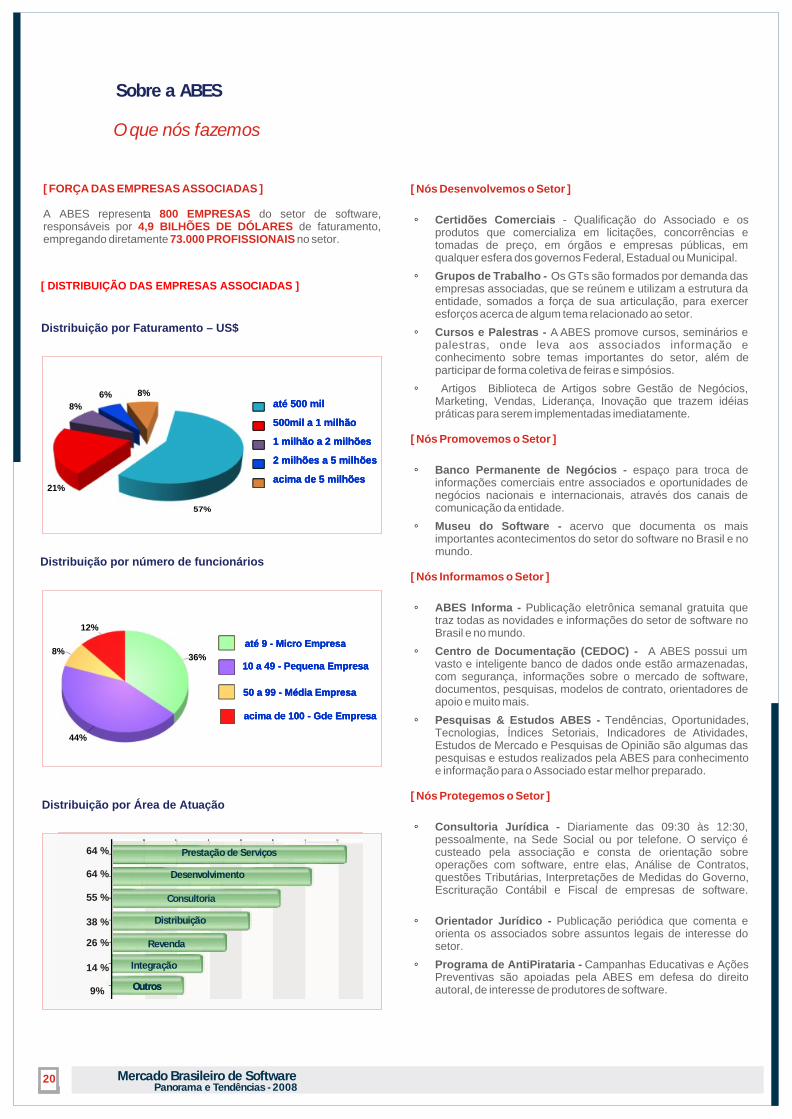
Sobre a ABES
até 500 mil
500mil a 1 milhão
1 milhão a 2 milhões
2 milhões a 5 milhões
acima de 5 milhões21%
8%6%
8%
57%
até 500 mil
500mil a 1 milhão
1 milhão a 2 milhões
2 milhões a 5 milhões
acima de 5 milhões
até 500 mil
500mil a 1 milhão
1 milhão a 2 milhões
2 milhões a 5 milhões
acima de 5 milhões
até 9 - Micro Empresa
10 a 49 - Pequena Empresa
50 a 99 - Média Empresa
acima de 100 - Gde Empresa
até 9 - Micro Empresa
10 a 49 - Pequena Empresa
50 a 99 - Média Empresa
acima de 100 - Gde Empresa
até 9 - Micro Empresa
10 a 49 - Pequena Empresa
50 a 99 - Média Empresa
acima de 100 - Gde Empresa
O que nós fazemos
[ DISTRIBUIÇÃO DAS EMPRESAS ASSOCIADAS ]
Distribuição por Faturamento – US$
Distribuição por número de funcionários
Distribuição por Área de Atuação
[ Nós Desenvolvemos o Setor ]
[ Nós Promovemos o Setor ]
[ Nós Informamos o Setor ]
[ Nós Protegemos o Setor ]
ƒ
ƒ
ƒ
ƒ
ƒ
ƒ
ƒ
ƒ
ƒ
ƒ
ƒ
ƒ
Certidões Comerciais - Qualificação do Associado e os produtos que comercializa em licitações, concorrências e tomadas de preço, em órgãos e empresas públicas, em qualquer esfera dos governos Federal, Estadual ou Municipal.
Grupos de Trabalho - Os GTs são formados por demanda das empresas associadas, que se reúnem e utilizam a estrutura da entidade, somados a força de sua articulação, para exercer esforços acerca de algum tema relacionado ao setor.
Cursos e Palestras - A ABES promove cursos, seminários e palestras, onde leva aos associados informação e conhecimento sobre temas importantes do setor, além de participar de forma coletiva de feiras e simpósios.
Artigos Biblioteca de Artigos sobre Gestão de Negócios, Marketing, Vendas, Liderança, Inovação que trazem idéias práticas para serem implementadas imediatamente.
Banco Permanente de Negócios - espaço para troca de informações comerciais entre associados e oportunidades de negócios nacionais e internacionais, através dos canais de comunicação da entidade.
Museu do Software - acervo que documenta os mais importantes acontecimentos do setor do software no Brasil e no mundo.
ABES Informa - Publicação eletrônica semanal gratuita que traz todas as novidades e informações do setor de software no Brasil e no mundo.
Centro de Documentação (CEDOC) - A ABES possui um vasto e inteligente banco de dados onde estão armazenadas, com segurança, informações sobre o mercado de software, documentos, pesquisas, modelos de contrato, orientadores de apoio e muito mais.
Pesquisas & Estudos ABES - Tendências, Oportunidades, Tecnologias, Índices Setoriais, Indicadores de Atividades, Estudos de Mercado e Pesquisas de Opinião são algumas das pesquisas e estudos realizados pela ABES para conhecimento e informação para o Associado estar melhor preparado.
Consultoria Jurídica - Diariamente das 09:30 às 12:30, pessoalmente, na Sede Social ou por telefone. O serviço é custeado pela associação e consta de orientação sobre operações com software, entre elas, Análise de Contratos, questões Tributárias, Interpretações de Medidas do Governo, Escrituração Contábil e Fiscal de empresas de software.
Orientador Jurídico - Publicação periódica que comenta e orienta os associados sobre assuntos legais de interesse do setor.
Programa de AntiPirataria - Campanhas Educativas e Ações Preventivas são apoiadas pela ABES em defesa do direito autoral, de interesse de produtores de software.
[ FORÇA DAS EMPRESAS ASSOCIADAS ]
800 EMPRESAS4,9 BILHÕES DE DÓLARES
73.000 PROFISSIONAIS
A ABES representa do setor de software, responsáveis por de faturamento, empregando diretamente no setor.
64 %
64 %
55 %
38 %
26 %
14 %
9%
Prestação de Serviços
Desenvolvimento
Distribuição
Revenda
Integração
OutrosOutros
Consultoria
12%
8%36%
44%
20 Mercado Brasileiro de SoftwarePanorama e Tendências - 2008