nelson manuel eduardo veríssimo - autenticação · análise de logs de motores de busca é a...
TRANSCRIPT
Spatio-Temporal Search Log Analysis
Nelson Manuel Eduardo Veríssimo
Dissertação para obtenção do grau de mestre em
Engenharia Informática e de Computadores
Júri
Presidente: Prof. Doutor Pedro Sousa Orientador: Prof. Doutor Pável Calado Co-orientador: Prof. Doutor Bruno Martins Vogal: Prof. Doutor José Borbinha
Outubro 2009

i
Resumo O trabalho descrito nesta dissertação está ligado ao campo da análise de logs de motores de
busca. Aplicações para efectuarem este tipo de análise são raras, os seus detalhes de
desenvolvimento, código fonte e documentação não estão disponíveis à comunidade
científica e estão restritos a funcionar apenas com logs de motores de busca específicos.
Tendo constatado esta limitação e identificado a existência desta lacuna nesta área de
pesquisa, este trabalho teve como objectivo o planeamento, desenvolvimento e teste de uma
aplicação web open-source adaptável e capaz de produzir uma análise espacial e temporal,
útil e relevante, para uma multitude the logs de motores de busca.
A ferramenta passou os testes com sucesso e o objectivo foi alcançado. A aplicação web de
análise de logs de motores de busca é a principal contribuição para a comunidade científica
desta tese de mestrado, acreditando que isso contribuirá para o desenvolvimento e melhoria
da análise e das aplicações de logs de motores de busca. A aplicação inclui várias
funcionalidades inovadoras e também combina características encontradas em ferramentas
já existentes como a Google Trends e a Google Zeitgeist, mas, ao contrário destas, não está
restrita a um log específico. A aplicação fornece mecanismos para dar informação sob
perspectivas diferentes. Ela inclui várias estatísticas globais para a generalidade do log, bem
como um conjunto de perspectivas definidas pelo utilizador através da combinação de três
filtros independentes: o filtro a nível da query, o filtro a nível temporal e o filtro a nível da
localização.
Palavras chave: análise de logs, aplicação web, geo-referenciação, estatística de
logs
ii
Abstract The work described in this dissertation relates to the field of search log analysis. Applications
for performing this type of analysis are rare, their development details, source code and
documentation are not made available to the research community and they are restricted to
work only with specific search logs. Having acknowledged this limitation and identified the
existence of this gap in this field of research, this work has had the objective of planning,
designing, developing and testing an open-source web application that is adaptable and
capable of performing useful and relevant spatio-temporal analysis for a multitude of different
search logs.
The application performs successfully and the objective has been met. The developed Search
Log Analysis web application is the main contribution of this Master thesis to the scientific
community, believing that it will further promote the development and improvement of search
log analysis and Search Log Analysis applications. It includes a number of innovative features
as well as combines characteristics found in existing tools such as Google Trends and
Google Zeitgeist but, unlike these, it is not restricted to a specific log. The application provides
mechanisms to deliver information from different perspectives. It provides several overall log
statistical measures as well as a set of custom perspectives created by a combination of three
independent filters: the query level, the time period level and the location level.
Keywords: search log analysis, web application, georeferentiation, log statistics

iii
Table of contents
RESUMO........................................................................................................................................I
ABSTRACT ................................................................................................................................... II
LIST OF FIGURES ..........................................................................................................................V
LIST OF TABLES...........................................................................................................................VI
1. INTRODUCTION..................................................................................................................... 1
1.1. Problem statement, objectives and contribution...................................................... 2
1.2. Overview of this document ...................................................................................... 3
2. CONCEPTS AND RELATED WORK.......................................................................................... 4
2.1. Concepts and terminology....................................................................................... 4
2.2. Typical stages of log analysis.................................................................................. 5
2.2.1. Data Collection ............................................................................................................5 2.2.2. Data Preparation .........................................................................................................7 2.2.3. Data Analysis ............................................................................................................10
2.2.3.1. Session level analysis................................................................................11 2.2.3.2. Query level analysis...................................................................................12 2.2.3.3. Term level analysis ....................................................................................16
2.3. Exploratory interfaces for search log analysis ....................................................... 17
2.3.1. Session Viewer..........................................................................................................17 2.3.2. Google Trends and Google Zeitgeist.........................................................................19 2.3.3. Other tools.................................................................................................................20
2.4. Summary and conclusions .................................................................................... 21
3. SOLUTION APPROACH ........................................................................................................ 24
3.1. The Data Model ..................................................................................................... 24
3.2. Data Collection ...................................................................................................... 26
3.2.1. The log data ..............................................................................................................26 3.2.2. The Geolocation data ................................................................................................27
3.3. Working with GeoLocation data............................................................................. 27 3.3.1. Determining the locations ..........................................................................................28
3.4. Data Preparation.................................................................................................... 29 3.4.1. Preparing the Log Data .............................................................................................29 3.4.2. Preparing the geolocation data..................................................................................31
3.5. Discussion ............................................................................................................. 32
4. A WEB APPLICATION FOR SEARCH LOG ANALYSIS ............................................................... 34
4.1. Overview of the Web application ........................................................................... 34
4.2. The Search Log Analysis interface........................................................................ 35
4.2.1. The Home Page ........................................................................................................36
iv
4.2.2. The Hot Trends interface...........................................................................................37 4.2.3. Dataset Statistics interface ........................................................................................37 4.2.4. Advanced Search interface .......................................................................................38 4.2.5. The Results interface.................................................................................................40
4.2.5.1. Analysis through the information categories ..............................................42 4.2.5.2. Visual data analysis through charts ...........................................................43 4.2.5.3. Visual data analysis and exploration through maps ...................................44
5. EXPERIMENTAL EVALUATION .............................................................................................. 47
5.1. Characterization study of the Biblioteca Nacional’s Search Log........................... 47 5.1.1. Interpretation of the General Statistics interface........................................................49
5.1.1.1. Providing answers to “when?” type of questions:.......................................49 5.1.1.2. Providing answers to “how many?” type of questions: ...............................50
5.1.2. Interpretation of the Overall Search Results interface ...............................................52 5.1.2.1. Providing answers to “where?” type of questions.......................................52 5.1.2.2. Providing answers to “what?” type of questions.........................................55 5.1.2.3. Providing answers to “when?” type of questions........................................56 5.1.2.4. Providing answers to “who?” type of questions..........................................57
5.1.3. Discussion .................................................................................................................58
6. CONCLUSIONS AND FUTURE WORK...................................................................................... 59
6.1. Future Work ........................................................................................................... 60
BIBLIOGRAPHY .......................................................................................................................... 62

v
List of Figures Figure 2.1 – Entity Relation (ER) diagram for modeling web searching transaction log. (Jansen, 2006) ..................... 8
Figure 2.2 – The interface of the Session Viewer log analysis tool (Lam et al., 2007)............................................... 18
Figure 2.3 – Google Trends and Google Zeitgeist interfaces.................................................................................... 19
Figure 2.4 – Interface of the Webalizer log analysis tool........................................................................................... 20
Figure 2.5 – Two example reports provided by the SpeedTracer tool. ...................................................................... 21
Figure 3.1 – The Search Log Analysis Entity Relational Diagram ............................................................................. 24
Figure 3.2 – A sample of the geolocation data used in this work, showing the connections between the two tables . 28
Figure 3.3 – Adapting an IP range to an area representation ................................................................................... 32
Figure 4.1 – The Search Log Analysis home page interface..................................................................................... 36
Figure 4.2 – The Hot Trends interface...................................................................................................................... 37
Figure 4.3 – An example of the four types of displays of the time series chart existing in the result pages ............... 38
Figure 4.4 – The Advanced Search page ................................................................................................................. 39
Figure 4.5 – Example of the results interface. The three distinct sections of the page are highlighted. ..................... 41
Figure 4.6 – An example of the calendar displays for selecting the time constraint................................................... 42
Figure 4.7 – An example of the four types of displays of the time series chart .......................................................... 44
Figure 4.8 – An example of a bar chart displayed in the analysis result pages ......................................................... 44
Figure 4.9 – An example of a map illustrating the regions where the specific search was conducted ....................... 45
Figure 4.10 – Example of a dot map illustrating the distribution and density of the search activity across the globe. 45
Figure 5.1 – General Statistics for the Biblioteca Nacional’s dataset ........................................................................ 48
Figure 5.2 – Overall Search Results output page for the Biblioteca Nacional’s log (with no filters applied) ............... 49
Figure 5.3 – Extract of the top countries and top cities tables for the Biblioteca Nacional’s log. ................................ 52
Figure 5.4 – Map showing 10 top locations (zoomed out)......................................................................................... 52
Figure 5.6 – Extract of the top languages table for the Biblioteca Nacional’s log. ..................................................... 55
Figure 5.7 - Extract of the top search queries table for the Biblioteca Nacional’s log. ............................................... 55
Figure 5.8 - Extract of the top terms table for the Biblioteca Nacional’s log............................................................... 56
Figure 5.9 – Line chart displayed for the Biblioteca Nacional’s log............................................................................ 56
Figure 5.10 - Extract of the most frequent users (IP addresses) for the Biblioteca Nacional’s log. ............................ 57
vi
List of Tables Table 2.1 – Comparison between the Common Log Format, AOL log, Alltheweb log and Altavista log....................... 6
Table 2.2 – Brief description of previous search log analysis studies and the source and volume of data used .......... 7
Table 2.3 – Description of the ER schema presented in Figure 2.1............................................................................. 9
Table 2.4 – Search Goal Hierarchy proposed by Rose and Levinson. (Rose and Levinson, 2004) adapted.............. 14
Table 2.5 – The Search Query Classification as defined by (Spink et al., 2001)........................................................ 14
Table 3.1 – The data contained in the logs from AOL Search Engine and Biblioteca Nacional de Portugal............... 27
Table 3.2 – The AOL search engine log format and some examples ........................................................................ 30
Table 3.3 – The Biblioteca Nacional de Portugal log format and example................................................................. 30
Table 4.1 – Description of the existing categories for each type of search. ............................................................... 43

1
1. Introduction
Analyzing the way people use and interact with the web is a field of research that has been
gaining relevance. In order to understand web user behaviour, several studies have been
made, ranging from field studies to log analysis (Kellar, Watters and Shepherd, 2007;
Holscher and Strube, 2000; Silverstein et al., 1999; Brown and Sellen, 2001; Grimes, Tang
and Russel, 2007). Field studies consist of experiences oriented for research purposes in
which one or more participants are recruited to perform a set of tasks. Their behaviour is then
monitored while performing the tasks. Although these studies can reveal many important
details, they have the strong limitation of low scalability. On the other hand, log analysis is a
more scalable approach for studying the behaviour of web users. Peters defines log analysis
as “the study of electronically recorded interactions between on-line information retrieval
systems and the persons who search for the information found in those systems” (Peters,
1993). Generally, a log is a file that records the transactions between a system and the users
of that system. Because of its transactional nature a log is commonly referred to as a
transaction log, and its analysis is also known as Transaction Log Analysis.
Logs enable the study of real user behaviour, in the user’s own context, and with queries
based on real information needs. Since there is no exterior influence, logs capture data in a
non-intrusive way, leading to unbiased data collection. Furthermore, log analysis provides a
good capturing process to accommodate the huge volume of data that is constantly being
produced. Search log analysis is concerned with extracting, organizing, filtering, analyzing
and summarizing information from search engine logs, ultimately giving meaning to otherwise
complex, uninformative and unstructured raw datasets. The process can be relatively
inexpensive and it takes less time than other methods of study such as field studies.
A search log is a specific type of log in which the transactions refer to the user’s actions and
the server responses. Search logs are an unobtrusive method of collecting large amounts of
data related to users’ interactions with search engines. Through the analysis of such data it is
possible to obtain valuable information, answering a wide range of questions about what
people search about and how people search the web. There are several different purposes
and reasons for conducting log analysis. These include:
• Improving web search systems - by analyzing how people search for information,
search engine developers can design mechanisms for providing better results in
terms of efficiency and accuracy. Many information needs, when translated into
queries, are ambiguous or incomplete, causing difficulties when it comes to decide
which document results are the best for satisfying each information requirement.
2
Several studies have been made to improve search engine results, including the
organization of search results (Wang and Zhai, 2007), the recommendation of better
queries (e.g. by using query expansion) (Baeza-Yates, Hurtado and Mendoza, 2004;
Cui, Wen and Nie, 2003; Baeza-Yates et al., 2005) or the recommendation of related
documents (Baeza-Yates et al., 2005). Search logs have also been analyzed for
geographical purposes (e.g. for providing geographically-related results based on the
user’s location) (Xiao et al., 2008; Sanderson and Kohler, 2004; Gan et al., 2008;
Zhuang, Brunk and Giles, 2008; Zhang et al., 2006).
• Discovering informational trends and user interests - user information needs change
over time, and as these changes occur, log analysis enables the understanding of
what web search trends and user interests are emerging and declining, within the
various global regions (Baeza-Yates et al., 2005; Jansen and Spink, 2005; Pass,
Chowdhury and Torgeson, 2006). The benefits obtainable from this source of
information are vast. For instance, advertising companies can have a better insight on
how users access the web and can target adverts to specific groups of users (Rose
and Levinson, 2004).
1.1. Problem statement, objectives and contribution
Applications for providing useful information from search logs exist but are rare, typically
proprietary, and are not applicable to general search engines. Web applications such as
Google Trends and Google Zeitgeist are examples of search log analysis systems that
provide useful information and are available for general public use. However these
applications are restricted for use with the logs from the Google search engine. For that
reason, the aim and the contribution of my MSc thesis was to design, develop and test an
open-source web application for performing log analysis over general search engine logs. The
Web application was built on top of a relational database and combines features from Google
Trends and Google Zeitgeist and also presents some extra new features like general log
statistics information and supports additional geographical analysis and filtering mechanisms.
The main hypothesis underlying this work was as follows:
A Web application, developed with basis on a relational database, can be used to
perform spatio-temporal search log analysis, providing useful and relevant
information.
To support both data storage and retrieval, the relational database that is used is the MySQL
relational database. This Relational Database Management System is free, can scale to large

3
volumes of data and supports features such as text indexes (e.g. for indexing query terms),
geospatial querying (e.g. for georeferencing queries through the IP addresses) and stored
procedures (e.g. for preparing and importing the data).
The web application was developed on top of the relational database. This application
supports the analysis of search log data according to both query and spatio-temporal
constraints. The application is made available to the scientific community in the expectation
that it is useful and adds value to the search log analysis field of research.
Validation is performed by means of a characterization study over a search log. This study
serves as the basis for evaluating the practicality and usefulness of the information that can
be drawn from the output interfaces of the Search Log Analysis application. The search log
used for this purpose is a portion of the Biblioteca Nacional de Portugal (the National Library
of Portugal) search engine logs, with approximately 1GB in size and comprising about two
months of search activity.
The tests performed with the search log analysis web application show that the application is
able to provide answers to “what?”, “where?”, “when?” and ”who?” questions, hence proving
that it has useful applicability.
1.2. Overview of this document
This document is composed of six chapters plus the bibliography. It is organized as follows:
Chapter 1 is the current chapter and introduces a brief overview of the dissertation. Chapter 2
introduces a brief definition of the concepts that are commonly used in the related literature,
and presents a survey in the field of search log analysis. It describes the typical stages
involved in the process, and presents some log visualization and exploration tools. Chapter 3
describes the solution approach, focusing on the data model and the general decisions
regarding data storage and indexing. Chapter 4 describes the Web application and presents
its interface. Chapter 5 describes the method used for evaluating the main hypothesis of this
dissertation. It describes tests with a 1GB log from the Biblioteca Nacional de Portugal
(National Library of Portugal) search engine and the results that were obtained. Finally,
Chapter 6 summarizes the conclusions and points some limitations that can be the basis for
future work.

4
2. Concepts and Related Work This chapter presents a survey on the subject of log analysis, mainly focusing on search log
analysis. The first section introduces the terminology and the main concepts used in the
context of this research area. The second section, the typical processing stages involved in
search log analysis are described, with basis on a study of the related literature. Afterwards,
some interactive applications for performing log analysis are presented. Finally, the chapter
ends with a summary and a critical analysis.
2.1. Concepts and terminology
This section presents and defines the most important technical terms related to the field of
search log analysis, which will be used in the rest of the document. These terms are also
commonly used in the related scientific literature.
Information retrieval (IR) is the theoretical field that studies the techniques used to implement
search engines. In IR, a particular subfield of study relates to data mining over search logs, in
order to discover patterns behind the user’s information requests.
In the IR literature, a term is any series of characters separated by white space (e.g. a word).
A query represents a user’s need for information and consists on the verbalization of that
specific need, using a set of one or more terms. Queries are submitted to search engines in
order to satisfy the specific user requirement and, in response, the search engine provides
result pages containing ordered links to web documents. The queries are recorded in the
search engine logs, as well as the result clicks that are associated. A result click consists in
the document selections that individual users make from the result pages. The study of the
result is also known as clickstream analysis and is useful for extracting user activity
information. A query instance is a single query submitted to a search engine in a defined
point of time, followed by zero, one or more result clicks. A query session (or simply session)
consists of a sequence of related query instances performed by a single user within a small
range of time, together with all the result clicks made during this range of time. Sessions are
used to identify a single information need, as well as to identify the refinement process of the
queries performed by the user. A group of sessions with shared characteristics, such as
usage patterns or task types, is referred to as a session population. A session has an
associated duration (i.e. the session duration), which is the total time the user spent
interacting with the search engine, including the time spent viewing the first and subsequent
web documents, except the final document.
Based on the user’s intentions, queries can be defined as being navigational, informational or
transactional. A navigational query is defined as a user’s expression of intent to reach a

5
particular site. It can be a site that the user has visited before or it may be one that he or she
assumes that exists. Queries of this type usually have only one satisfactory result, and users
expect to reach it directly by submitting a single query. An informational query is a query
that expresses the intent to gather information regarding one or more topics that may be
present in several result pages. It has a broader scope than the navigational query. A
transactional query, also referred to as resource query, is one that expresses the intent to
reach a site where sophisticated interactions will take place, usually related to the acquisition
of goods and services, or to the downloading of some resource (e.g. images, videos or
music). The latter type of queries can have several appropriate results of various degrees of
quality.
2.2. Typical stages of log analysis
This section outlines the three typical stages of search log analysis, namely (i) data collection,
(ii) data preparation and (iii) data analysis (Jansen, 2006). A description is given for each
stage, together with examples of how each stage was addressed in previous related studies.
It is important to notice that several previous studies involved manual approaches, in which
the logs were prepared and analyzed manually. Manual approaches are labour intensive and
generally deal with relatively small portions of logs. There are also studies that rely on text-
processing scripts to obtain information about the logs (Silverstein et al., 1999), and there are
others that rely on a relational database for storage and retrieval (Jansen, 2006). Text-
processing scripts are effective to analyze logs, allowing the target information to be obtained
in a single pass. However, they have the limitation that, if additional analysis is needed, the
entire data must be re-analyzed. The use of a relational database allows a more interactive
approach with the data in the analysis process and allows the designing and building of more
complex analysis applications (Jansen, 2006). This work follows the approach of using a
relational database for performing the search log analysis.
2.2.1. Data Collection
The first stage of web log analysis, Data Collection, consists of gathering resources for the
analysis, i.e. gathering web search logs that record and store user interactions with a search
engine during a certain period of time. Transaction logs are usually generated automatically,
by the Web servers, and collected in server access logs (i.e. the log files). Search logs are a
specific type of transaction logs. The set of fields that compose a search log may vary from
search engine to search engine although the following are often present:

6
• User identification – the IP address of the client’s computer that interacts with the
system or some unique identifier based on a server cookie.
• Date/Time – a timestamp indicating when the query was submitted.
• Query terms – the words that define the search, exactly as submitted (i.e. the query).
• Result click – a document from the results that the user has selected.
The transactional log formats used by web servers are regulated by the W3C1 consortium.
The Common Log Format is a typical type of log that is used by web servers. Entries consist
of a sequence of fields relating to a single HTTP transaction. Because the format is
standardized, the files may be analyzed by different software tools. The format is extensible in
order to allow a wider range of data to be captured. Search engines usually adopt a similar
format for their logs. Table 2.1 provides a comparison between the common log format and
some of the previously analyzed search engine logs, such as the AOL log, the Alltheweb log
and the Altavista log.
Table 2.1 – Comparison between the Common Log Format, AOL log, Alltheweb log and Altavista log.
Common Log Format
Syntax: UserID(IP) Ident authuser DateTime Request Status Bytes
Example: 127.0.0.1 – frank [10/Oct/2000:13:55:36 -0700] "GET /apache_pb.gif HTTP/1.0" 200 2326
AOL log (Gan et al., 2008)
Syntax: AnonymousUserID Query Time ItemRank ClickURL
Example: 142 westchester.gov 2006-03-20 03:55:57 1 http://www.westchestergov.com
Alltheweb log (Jansen and Spink, 2005)
Syntax: Time AnonymousUserID Query Language ClickURL
Altavista log (Silverstein et al., 1999)
Syntax: Time Cookie Query ResultScreen UserSpecifiedModifiers SubmissionInformation
SubmitterInformation
As shown in Table 2.1, there are differences between the log formats, as some have more
fields than others. For instance, Altavista records the identification through a server cookie, as
well as user specified modifiers (e.g. result restrictions, language or date of modification),
submission information (such as whether it is a simple or an advanced query) and submitter
information (e.g. the web browser being used).
Regarding user identification, it is important to notice that search engines such as Altavista
assign cookies to identify user’s computers and record each interaction with a cookie stamp.
Cookies are better than IP addresses for user distinction purposes because the IP address
changes and may be shared between different users, while the cookie remains the same, as
long as the user uses the same browser on the same computer and doesn’t delete them.
1 http://www.w3.org/

7
However, the IP address helps identifying visitor’s geographic location elements such as the
country, city, latitude or longitude
The log files that have been analyzed by the scientific community vary in terms of volume and
in terms of the origin of the data. Table 2.2 summarizes previous studies that analyzed search
logs, showing the source and volume of the logs as well as a brief description of the study
objectives.
Table 2.2 – Brief description of previous search log analysis studies and the source and volume of data used
Study Source of Logs Volume Objectives
(Silverstein et al., 1999)
Altavista search engine (1998)
993208159 queries Modelling search engine user behaviour.
(Spink et al., 2002) Excite and Alltheweb search engines (2001)
Excite: 1025910 queries Alltheweb: 451551 queries
Identifying differences in search trends between US and European users.
(Jansen and Spink, 2003)
Alltheweb search engine (sets from 2001 & 2002)
Approx. 1 million queries per set. Identifying trends and patterns in the way people (mainly European) search for information.
(Baeza-Yates et al., 2005)
TodoCL search engine (2004)
1520000 queries Modelling search engine user behaviour.
(Zhang et al., 2006)
Yahoo search engine (2006)
4 million queries randomly selected over two weeks of logs.
Analyzing the impact in the geographic information in queries in order to provide better results.
(Wang and Zhai, 2007)
MSN search engine (2006)
30 days of usage 8144000 queries
Exploring past query history in order to better organize the search results for future queries.
(Gan et al., 2008) AOL search engine (2006)
36 million queries Studying geographic search queries for improving geographical search.
The IP address of many of the search log files is usually turned anonymous because of
ethical and privacy issues. Also because of these issues, there are not many search logs
available for research. Some logs were available in the past but are not available anymore
and others are restricted to internal company researchers, such as the case of the Yahoo
logs. As the logs get older, the studies conducted upon them also tend to diverge from the
current searching patterns and trends. It is, therefore, important to analyze logs that are as
recent as possible. In addition, a study focusing on one web search engine cannot be applied
wholesale to all web search engines (Jansen and Spink, 2005).
2.2.2. Data Preparation
Before data analysis is performed, several operations must be made in order to transform the
data into a form which can be examined for patterns and relationships. In the case of the

8
analysis procedures that rely on a relational database, the preparation stage typically consists
of the following steps:
1. Parsing and importing the data into the database.
2. Cleaning the data (e.g. removing corrupt and empty records).
3. Identifying sessions.
Essentially, parsing deals with decomposing records in the log file into individual fields. Using
a description of the log structure, a parser breaks the data into the individual fields, preparing
them to be imported to a structured database. Log file parsers should be tolerant to errors. If
an entry has corrupt data, the parser is supposed to continue and parse the remaining
entries.
Regarding the importing of the data into the database, the idea is to store and index (e.g.
through B-trees and inverted indexes) the structured information in order to facilitate further
processing (Zobel, Moffat and Sacks-Davis, 1992).
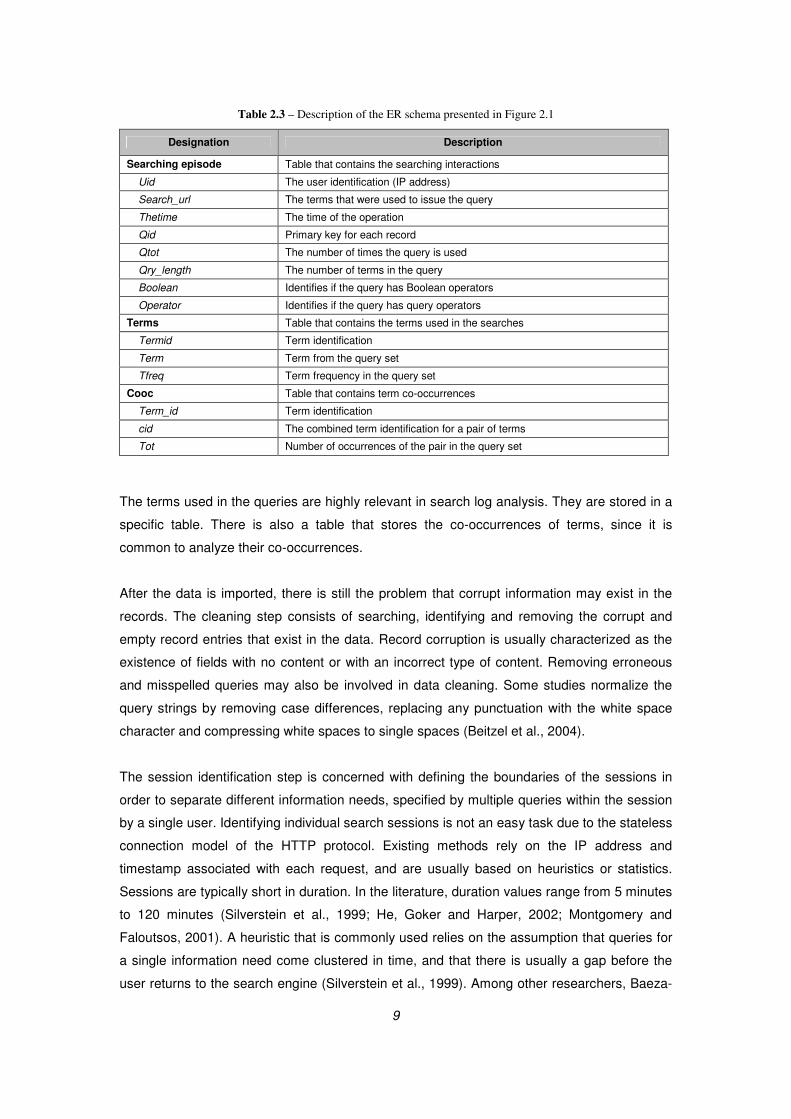
To structure the log database for his research, Jansen used a relational database
corresponding to the Entity-Relation (ER) diagram shown in Figure 2.1 and described in Table
2.3 (Jansen, 2006).
Figure 2.1 – Entity Relation (ER) diagram for modeling web searching transaction log. (Jansen, 2006)
9
Table 2.3 – Description of the ER schema presented in Figure 2.1
Designation Description
Searching episode Table that contains the searching interactions
Uid The user identification (IP address)
Search_url The terms that were used to issue the query
Thetime The time of the operation
Qid Primary key for each record
Qtot The number of times the query is used
Qry_length The number of terms in the query
Boolean Identifies if the query has Boolean operators
Operator Identifies if the query has query operators
Terms Table that contains the terms used in the searches
Termid Term identification
Term Term from the query set
Tfreq Term frequency in the query set
Cooc Table that contains term co-occurrences
Term_id Term identification
cid The combined term identification for a pair of terms
Tot Number of occurrences of the pair in the query set
The terms used in the queries are highly relevant in search log analysis. They are stored in a
specific table. There is also a table that stores the co-occurrences of terms, since it is
common to analyze their co-occurrences.
After the data is imported, there is still the problem that corrupt information may exist in the
records. The cleaning step consists of searching, identifying and removing the corrupt and
empty record entries that exist in the data. Record corruption is usually characterized as the
existence of fields with no content or with an incorrect type of content. Removing erroneous
and misspelled queries may also be involved in data cleaning. Some studies normalize the
query strings by removing case differences, replacing any punctuation with the white space
character and compressing white spaces to single spaces (Beitzel et al., 2004).
The session identification step is concerned with defining the boundaries of the sessions in
order to separate different information needs, specified by multiple queries within the session
by a single user. Identifying individual search sessions is not an easy task due to the stateless
connection model of the HTTP protocol. Existing methods rely on the IP address and
timestamp associated with each request, and are usually based on heuristics or statistics.
Sessions are typically short in duration. In the literature, duration values range from 5 minutes
to 120 minutes (Silverstein et al., 1999; He, Goker and Harper, 2002; Montgomery and
Faloutsos, 2001). A heuristic that is commonly used relies on the assumption that queries for
a single information need come clustered in time, and that there is usually a gap before the
user returns to the search engine (Silverstein et al., 1999). Among other researchers, Baeza-
10
Yates et al. used this technique with a 15-minute gap between sessions (Baeza-Yates et al.,
2005).
It should be noted that session identification is closely related to data cleaning. For instance,
Jansen adopted the interaction cut-off heuristic proposed in (Kurth, 1993) to distinguish
between human and non-human sessions (Jansen, 2006; Jansen and Spink, 2005). Non-
human sessions result from the searches conducted by automated agents. The underlying
assumption is that sessions larger than a certain number of records are likely to be
associated with an automated agent. The threshold number of records was considered to be
100, thus removing sessions with over 100 records.
Other studies, such as (Baeza-Yates et al., 2005), remove empty query sessions, i.e.
sessions in which there is not at least one document selected. The rationale is that in studies
concerned with result click analysis, empty query sessions do not provide relevant information
and should be removed.
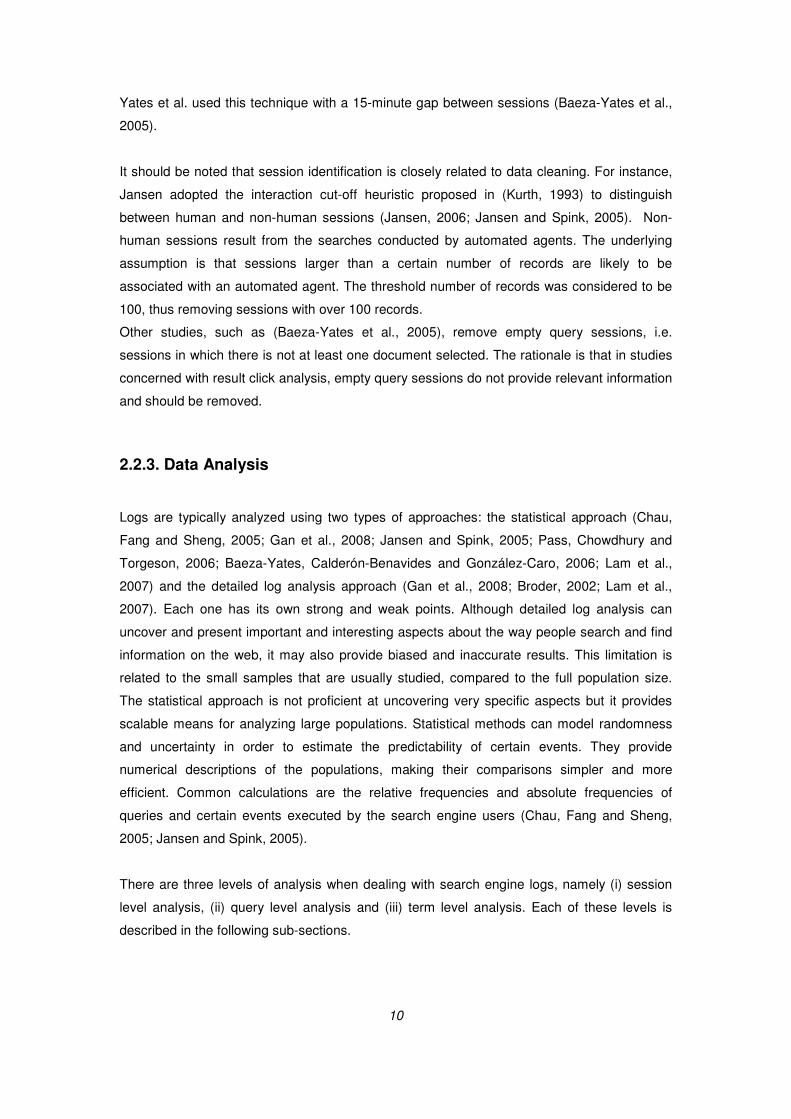
2.2.3. Data Analysis
Logs are typically analyzed using two types of approaches: the statistical approach (Chau,
Fang and Sheng, 2005; Gan et al., 2008; Jansen and Spink, 2005; Pass, Chowdhury and
Torgeson, 2006; Baeza-Yates, Calderón-Benavides and González-Caro, 2006; Lam et al.,
2007) and the detailed log analysis approach (Gan et al., 2008; Broder, 2002; Lam et al.,
2007). Each one has its own strong and weak points. Although detailed log analysis can
uncover and present important and interesting aspects about the way people search and find
information on the web, it may also provide biased and inaccurate results. This limitation is
related to the small samples that are usually studied, compared to the full population size.
The statistical approach is not proficient at uncovering very specific aspects but it provides
scalable means for analyzing large populations. Statistical methods can model randomness
and uncertainty in order to estimate the predictability of certain events. They provide
numerical descriptions of the populations, making their comparisons simpler and more
efficient. Common calculations are the relative frequencies and absolute frequencies of
queries and certain events executed by the search engine users (Chau, Fang and Sheng,
2005; Jansen and Spink, 2005).
There are three levels of analysis when dealing with search engine logs, namely (i) session
level analysis, (ii) query level analysis and (iii) term level analysis. Each of these levels is
described in the following sub-sections.

11
2.2.3.1. Session level analysis
Session level analysis is concerned with aspects such as finding the number of sessions
during a certain period of time, finding the session durations, finding session patterns (e.g.
similarity among sessions) and finding the document resources that have been consulted in
the context of sessions (result clicks) (Jansen, 2006; Nettleton, Calderón-Benavides and
Baeza-Yates, 2006).
Silverstein et al. (1999) claimed that queries regarding a single information need come
clustered in time, and that there is a gap before the user returns to the search engine.
Clustering user navigation sessions enables grouping together a set of user’s navigation
sessions having similar characteristics (Wang, 2005). Two main benefits arise from clustering
sessions, namely user grouping and web page grouping. User grouping is concerned with the
discovery of groups of users exhibiting similar browsing patterns. This provides the means for
serving personalized content. Web page grouping is concerned with the discovery of sets of
pages having related content and it is based on the frequency of the selection of URL
references that occur together across user sessions. There are two types of techniques for
session clustering, namely similarity-based clustering and probabilistic clustering (Vakali,
2004).
Similarity-based clustering is based on the analysis of similarity between sessions by means
of distance functions. Originally, session clustering did not take into account the result clicking
order, but later it was recognized that the order of document selection is important. For
instance, the Sequence Alignment Method (SAM) considers that sessions are chronological
ordered sequences of page accesses (Vakali, 2004; Hay, Wets and Vanhoof, 2001).
Analyzing the result clicks (clickstream analysis) allows the evaluation of similarities between
sessions. The evaluation of similarity is often based on the following methods:
• Determining the Longest Common Subsequence, which is the length of the largest
subsequence that is common between two session clickstreams.
• Determining the relative frequency of co-occurrence of page views.
• Determining the SAM distance between two sessions, which is the number of
transformation operations that are required in order to have similar sessions (Hay,
Wets and Vanhoof, 2001).
Probabilistic clustering is based on the assumption that the data follows a probability
distribution. It determines a probability model for each cluster using the Expectation-

12
Maximization algorithm for estimating the maximum likelihood between clusters (Dempster,
Laird and Rubin, 1977).
By using the time stamp field and the user identification, Jansen and Spink could locate a
session’s initial query and recreate the chronological series of actions in a session (Jansen
and Spink, 2005). They then collapsed the data set by combining all identical queries
submitted by the same user to obtain the unique queries in order to analyze sessions,
queries, languages, terms and result pages. In a different work, Jansen experimented with
collapsing the data that was just referred, by grouping the records that have identical queries
submitted by the same user (Jansen, 2006).
Several studies, like the one conducted by Jansen and Spink, concluded that most users
prefer to reformulate the query rather than going through the list of results (Jansen and Spink,
2005). Regarding the number of result pages, it is possible to confirm that most users are not
browsing much beyond the first pages, regardless of the effort they put into their queries or
the number of queries submitted during a search session.
2.2.3.2. Query level analysis
When faced with an information need, users need to verbalize the information they seek and
choose the terms that will form the query. For the same information need, the choice of terms
in a query varies greatly from user to user. Even the same user may issue different queries on
different occasions. This happens because there is no single way to find a specific resource
or piece of information. Previous log analysis studies have shown that experienced users
construct searches in a different way from novice users, making effective use of these search
engines by searching for tightly constrained keywords and phrases (Holscher and Strube,
2000). However, several studies show that most Web queries are short, without much
modification, and are simple in structure.
Categorizing Queries
Query level analysis focuses on the queries that the users submit, monitoring their frequency
and their changes over time and space, as well as examining and categorizing them
according to different classification schemes.
Query classification schemes are based on the types of queries, their syntax complexity, and
the usage of advanced searching techniques, such as the use of Boolean and filtering
operators (Jansen, 2006). Several studies have been conducted to categorize the users’
needs. For instance, Broder classified queries into 3 categories: Navigational queries,
Informational queries and Transactional queries (Broder, 2002). This classification has

13
been adopted by several other studies, most of them being performed manually while only a
minority attempted to perform automatic classification.
Several other classification schemes followed. Lee et al. attempted to create an automatic
classification mechanism but, to simplify the problem, they didn’t consider the transactional
queries (Lee, Liu and Cho, 2005). They concluded that through a human subject study,
approximately 60% of the queries have predictable goals, while the remaining 40% are more
ambiguous to classify. They proposed two features to identify the goal of the queries,
consisting in past user click-behaviour and anchor link distribution, and realized that the
combination of these features allowed the identification of goals in approximately 90% of the
queries.
In his work, Fujii enhanced the classification method proposed by Lee et al (Fujii, 2008). He
did not consider the result click behaviour, but he analyzed the distribution of query terms in
the anchor texts (i.e. clickable text of hyperlinks) on the Web, because the navigational query
terms commonly appear in the text of hyperlinks. He used content-based retrieval for
informational queries and anchor-based retrieval for navigational queries. His retrieval method
determines the probability that a document is retrieved to satisfy a given query, enables
synonym identification of query terms in the anchor texts on the Web, and uses these
synonyms refining the probability estimation.
Baeza-Yates et al. used different techniques to classify over six thousand web queries as
either informational, not informational or ambiguous, initially conducting a manual
classification followed by an automatic classification, involving both supervised and
unsupervised learning. The automatic classification had a precision of about 50% using
methods such as Support Vector Machines and Probabilistic Latent Semantic Analysis
(Baeza-Yates, Calderón-Benavides and González-Caro, 2006). They used a classification
scheme based on the general categories of the Open Directory Project search engine, ODP2
(Arts, Games, Kids and Teens, Reference, Shopping, World, Business, Health, News,
Society, Computers, Home, Recreation, Science, Sports). Besides these categories, they
added three more categories: Various (for queries that can belong to more than one
category), Sex, and Other (for queries that don’t belong to any of the other categories).
Rose and Levinson broadened the classification proposed by Broder by presenting the search
goal hierarchy shown in Table 2.4 (Rose and Levinson, 2004).
2 Open Directory Project. http://dmoz.org

14
Table 2.4 – Search Goal Hierarchy proposed by Rose and Levinson. (Rose and Levinson, 2004) adapted.
Search Goal Description
1 Navigational
2 Informational
2.1 Directed The intention is to learn something particular about a certain topic.
2.1.1 Closed The intention to find a single unambiguous closed answer.
2.1.2 Open The intention targets open-ended answers.
2.2 Undirected The intention is to search a topic in a global way.
2.3 Advice The intention is to obtain an advice.
2.4 Locate The intention is to discover the location of something.
2.5 List The intention is to search for lists of relevant nature regarding a topic.
3. Resource
3.1 Download The intention is to download some resource for it to be useful.
3.2 Entertainment The intent is to search for entertainment resources.
3.3 Interact The queries look for pages that require further interaction, such as a map.
3.4 Obtain The intention is to obtain a resource that doesn’t require a computer to be useful, such as documents that can be both seen onscreen and printed.
Spink et al. classify queries based on eleven different categories according to what topic most
closely matches their intent (Spink et al., 2001). The query classification used is presented in
Table 2.5.
Table 2.5 – The Search Query Classification as defined by (Spink et al., 2001)
Search Query Classification
Entertainment
Pornography
Business, travel, employment
Computers
Science and medicine
People, places, things. Odds and ends
Society and religion
Education, humanitarian interests
Arts
Government
Unknown and other

15
Analyzing queries for geographical purposes In the past, search queries have also been analyzed for geographical purposes. Gan et al,
defined a geographic search query as a “query that employs geographical terms in an attempt
to restrict results to a particular region or location” (Gan et al., 2008). Several studies have
been made regarding these queries (Xiao et al., 2008; Sanderson and Kohler, 2004; Gan et
al., 2008; Zhang et al., 2006). (Sanderson and Kohler, 2004) presented a characterization
study over geographic queries, measuring their frequency, topics, length and spatial
relationships. (Zhang et al., 2006) studied how users reformulate their geographic terms after
non-satisfactory results are presented by the search engine.
The examination of geographic queries conducted by Gan et al. was initially focused on a
manual classification of six thousand queries of the AOL search engine. Only geographic
entities existing in the USA were considered. For each query, they decided if it had a
geographic intent or not, and based their location descriptions on a USA gazetteer (i.e. the
US Census Bureau). They categorized each query according to the following classification
scheme:
1. Geographic query that contains a city, country or state name as a geographic term.
2. Geographic query that doesn’t have an explicit geographic term (the geographic
restriction it is implicit in the query).
3. Non-geographic query seemingly containing one or more geographic terms (a false
positive situation) (e.g. New York Times, Paris Hilton).
4. Non-geographic queries without geographic terms.
Afterwards, based on the observations that were compiled during the manual examination,
Gan et al. built two automatic classifiers to classify the entire 36 million queries of AOL. One
of the classifiers can differentiate queries with and without geographic intent. The second
classifier picks the geographic queries and classifies them as either informational or
navigational. The geographic differentiation classifier first uses a filter to remove all queries
that don’t have geographic terms, leaving only queries of type 1 or type 3 of the previous
classification scheme. Then, these queries were further classified according to the following
characteristics:
• Does the query contain property and tourism terms?
• Does is refer a State?
• Is it an ambiguous State Abbreviation?
• Does it refer to a City?
• Does it refer to a County? If so, does the term “County” follow?
16
• The size of the place to be found (bigger places provide more results).
• The frequency of the geographic term in the web documents, globally.
• The frequency of the geographic terms in all the queries.
Backstrom et al. analyzed the Yahoo! search query logs and used both the query string and
the IP address to determine an approximation of the latitude and longitude from which the
query originated (Backstrom et al., 2008). The study focused on queries issued inside the
USA territory and described a probabilistic model for the spatial variation in search queries.
This model, applied to each query, determines the differential frequency with which the query
appears across geographic regions. For each query this model determines a maximum-
likelihood value for a geographic centre, that corresponds to the location point at which the
query should occur most frequently, a constant, C, corresponding to the frequency at the
query’s centre, and an exponent α determining the frequency decreasing factor in terms of
distance from the centre.
According to this model a user issuing a query in a location at distance d from the query’s
centre, the probability P of the query being equal to the query under consideration is:
α−
= CdP
As queries tend to be more local it is expected to have a larger value of α and, on the
opposite, queries regarding no geographic aspects or specific regional setting have their α
tending to zero, which indicates that the frequency is geographically uniform.
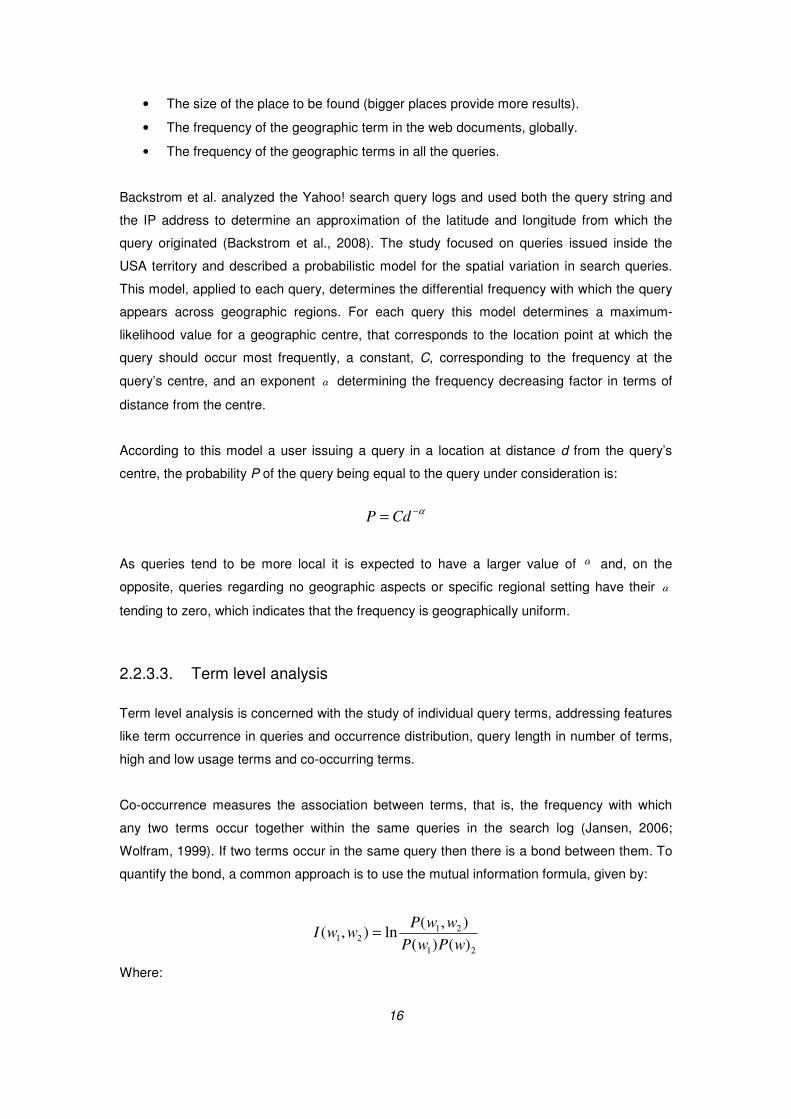
2.2.3.3. Term level analysis
Term level analysis is concerned with the study of individual query terms, addressing features
like term occurrence in queries and occurrence distribution, query length in number of terms,
high and low usage terms and co-occurring terms.
Co-occurrence measures the association between terms, that is, the frequency with which
any two terms occur together within the same queries in the search log (Jansen, 2006;
Wolfram, 1999). If two terms occur in the same query then there is a bond between them. To
quantify the bond, a common approach is to use the mutual information formula, given by:
21
2121
)()(
),(ln),(
wPwP
wwPwwI =
Where:
17
')(;
')( 2
21
1Q
FwP
Q
FwP ==
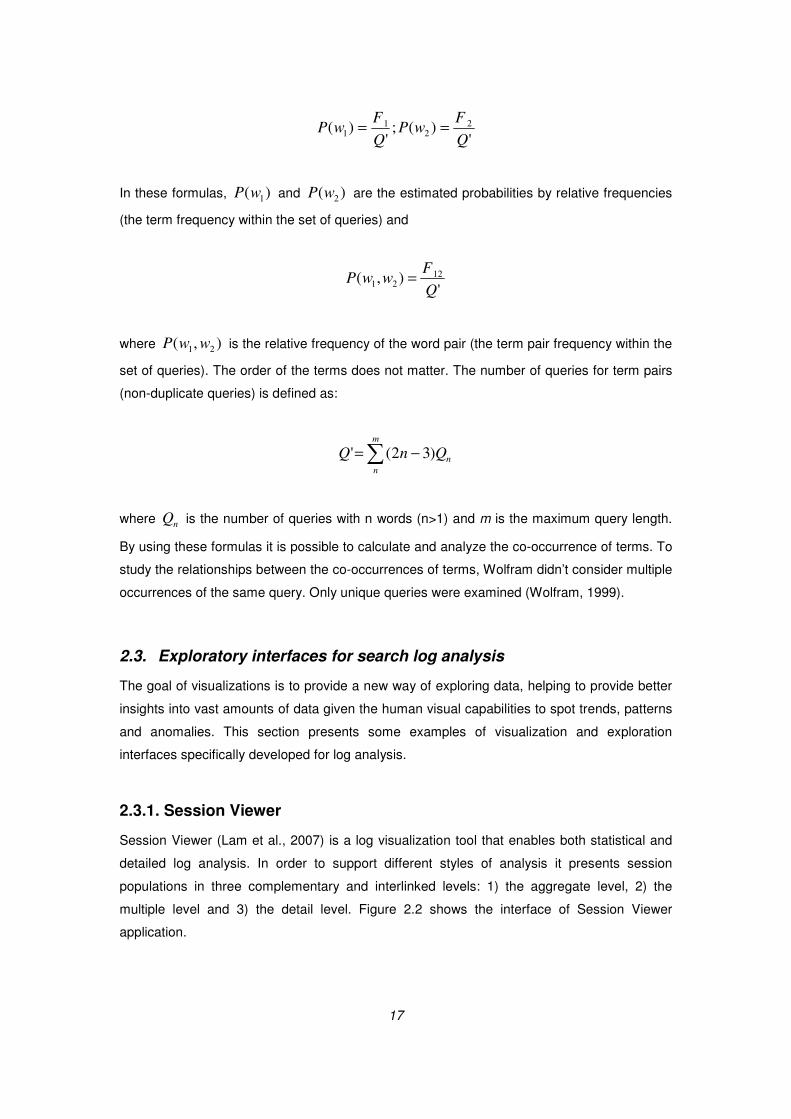
In these formulas, )( 1wP and )( 2wP are the estimated probabilities by relative frequencies
(the term frequency within the set of queries) and
'),( 12
21Q
FwwP =
where ),( 21 wwP is the relative frequency of the word pair (the term pair frequency within the
set of queries). The order of the terms does not matter. The number of queries for term pairs
(non-duplicate queries) is defined as:
∑ −=
m
n
nQnQ )32('
where nQ is the number of queries with n words (n>1) and m is the maximum query length.
By using these formulas it is possible to calculate and analyze the co-occurrence of terms. To
study the relationships between the co-occurrences of terms, Wolfram didn’t consider multiple
occurrences of the same query. Only unique queries were examined (Wolfram, 1999).
2.3. Exploratory interfaces for search log analysis
The goal of visualizations is to provide a new way of exploring data, helping to provide better
insights into vast amounts of data given the human visual capabilities to spot trends, patterns
and anomalies. This section presents some examples of visualization and exploration
interfaces specifically developed for log analysis.
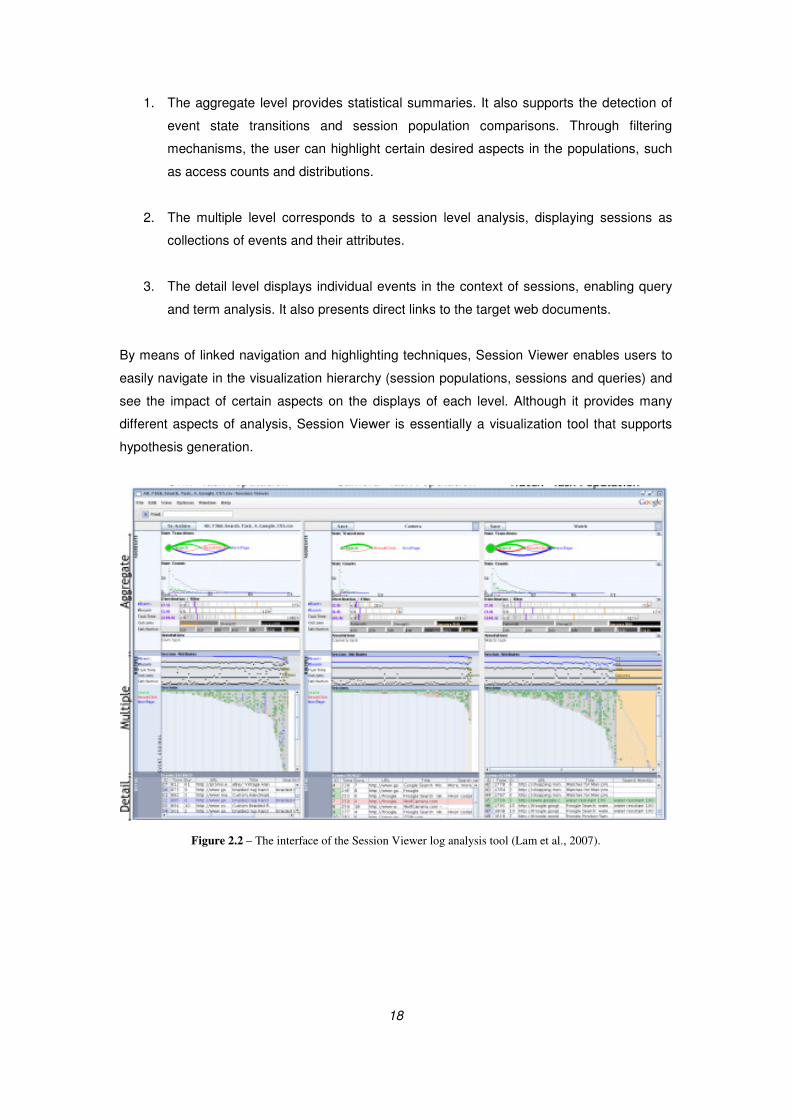
2.3.1. Session Viewer
Session Viewer (Lam et al., 2007) is a log visualization tool that enables both statistical and
detailed log analysis. In order to support different styles of analysis it presents session
populations in three complementary and interlinked levels: 1) the aggregate level, 2) the
multiple level and 3) the detail level. Figure 2.2 shows the interface of Session Viewer
application.
18
1. The aggregate level provides statistical summaries. It also supports the detection of
event state transitions and session population comparisons. Through filtering
mechanisms, the user can highlight certain desired aspects in the populations, such
as access counts and distributions.
2. The multiple level corresponds to a session level analysis, displaying sessions as
collections of events and their attributes.
3. The detail level displays individual events in the context of sessions, enabling query
and term analysis. It also presents direct links to the target web documents.
By means of linked navigation and highlighting techniques, Session Viewer enables users to
easily navigate in the visualization hierarchy (session populations, sessions and queries) and
see the impact of certain aspects on the displays of each level. Although it provides many
different aspects of analysis, Session Viewer is essentially a visualization tool that supports
hypothesis generation.
Figure 2.2 – The interface of the Session Viewer log analysis tool (Lam et al., 2007).

19
2.3.2. Google Trends and Google Zeitgeist
Google Trends3 is a web application for term level query log analysis. It charts how often a
particular search term is presented in queries in relation to the total search volume across
various regions of the world. It also allows the user to compare the volume of searches
between two or more terms.
The main interface is based on a timeline. The horizontal axis of the main graph represents
time and the vertical axis represents the frequency of a term that is searched in relation to the
total number of searches. On another graph, popularity is shown by region, city and language.
It is possible to highlight the main graph by region and by time period. Google Trends also
presents news items related to the search terms overlaid on the chart, showing how events
affect search popularity.
Google Zeitgeist4 is a website that provides annual reports of the most common queries,
organized by several categories that were submitted to the Google search engine. There are
both global and regional reports.
Figure 2.3 shows the interfaces of both Google Trends and Google Zeitgeist. The main
limitation of applications like Google Trends and Google Zeitgeist is that their functionalities
are not applicable to other search engine logs because their use and licensing is specific to
the proprietary logs of the Google search engine.
Figure 2.3 – Google Trends and Google Zeitgeist interfaces.
3 www.google.com/trends/
4 www.google.com/zeitgeist/
20
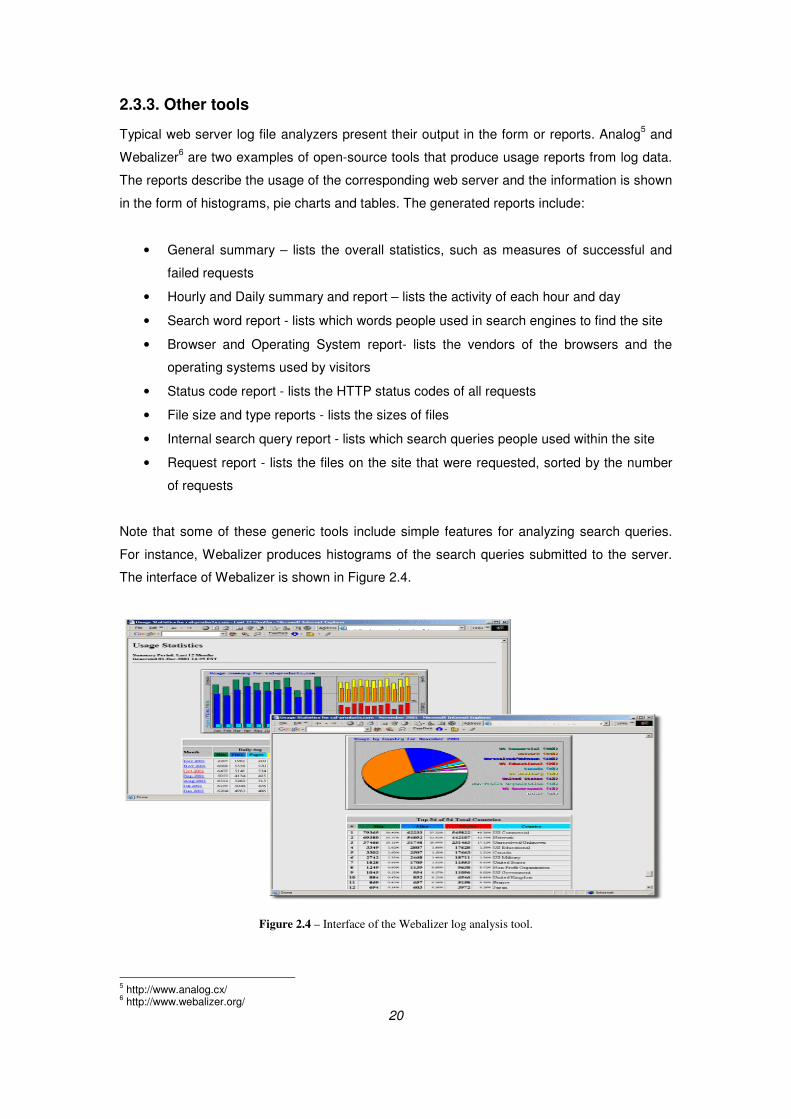
2.3.3. Other tools
Typical web server log file analyzers present their output in the form or reports. Analog5 and
Webalizer6 are two examples of open-source tools that produce usage reports from log data.
The reports describe the usage of the corresponding web server and the information is shown
in the form of histograms, pie charts and tables. The generated reports include:
• General summary – lists the overall statistics, such as measures of successful and
failed requests
• Hourly and Daily summary and report – lists the activity of each hour and day
• Search word report - lists which words people used in search engines to find the site
• Browser and Operating System report- lists the vendors of the browsers and the
operating systems used by visitors
• Status code report - lists the HTTP status codes of all requests
• File size and type reports - lists the sizes of files
• Internal search query report - lists which search queries people used within the site
• Request report - lists the files on the site that were requested, sorted by the number
of requests
Note that some of these generic tools include simple features for analyzing search queries.
For instance, Webalizer produces histograms of the search queries submitted to the server.
The interface of Webalizer is shown in Figure 2.4.
Figure 2.4 – Interface of the Webalizer log analysis tool.
5 http://www.analog.cx/
6 http://www.webalizer.org/
21
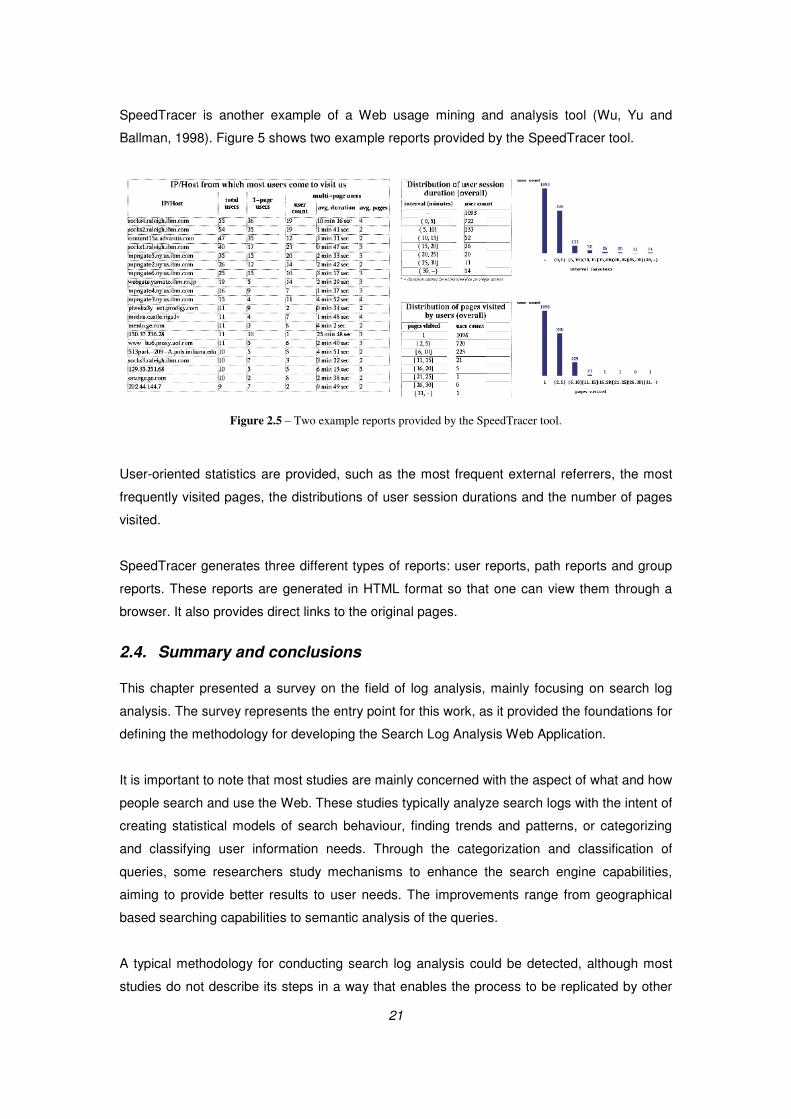
SpeedTracer is another example of a Web usage mining and analysis tool (Wu, Yu and
Ballman, 1998). Figure 5 shows two example reports provided by the SpeedTracer tool.
Figure 2.5 – Two example reports provided by the SpeedTracer tool.
User-oriented statistics are provided, such as the most frequent external referrers, the most
frequently visited pages, the distributions of user session durations and the number of pages
visited.
SpeedTracer generates three different types of reports: user reports, path reports and group
reports. These reports are generated in HTML format so that one can view them through a
browser. It also provides direct links to the original pages.
2.4. Summary and conclusions
This chapter presented a survey on the field of log analysis, mainly focusing on search log
analysis. The survey represents the entry point for this work, as it provided the foundations for
defining the methodology for developing the Search Log Analysis Web Application.
It is important to note that most studies are mainly concerned with the aspect of what and how
people search and use the Web. These studies typically analyze search logs with the intent of
creating statistical models of search behaviour, finding trends and patterns, or categorizing
and classifying user information needs. Through the categorization and classification of
queries, some researchers study mechanisms to enhance the search engine capabilities,
aiming to provide better results to user needs. The improvements range from geographical
based searching capabilities to semantic analysis of the queries.
A typical methodology for conducting search log analysis could be detected, although most
studies do not describe its steps in a way that enables the process to be replicated by other

22
researchers. An exception to this is the work of Jansen (Jansen, 2006), in which the typical
methodology for conducting search log analysis is presented together with an Entity-
Relational model for organizing the data. That work was actually the most important source of
information for starting and guiding the development of the work described in this dissertation.
In previous studies, three different levels of analysis were identified. These are the session
level, the query level and the term level. Each of these levels was discussed in terms of the
information goals, metrics and research processes. Session level analysis is typically
concerned with aspects such as determining the number of sessions during a certain period
of time, the session durations, discovering session patterns (i.e. the similarity among
sessions) and the document resources that were consulted in the context of sessions. The
query level analysis focuses on the queries that the users submit, monitoring their frequency
and their changes through time, as well as examining and categorizing them according to
different classification schemes. Term level analysis focuses on the study of individual query
terms, addressing features like query length in number of terms, high and low usage terms,
term occurrence and co-occurrence in queries and their distribution. The work in this
dissertation addresses the three levels, although giving particular emphasis to the query level.
It is important to note that there is limited availability of search data sets to researchers
outside of the search service companies. Understandably, these companies wish to protect
the privacy of their users while also guarding strategic information on their products in a highly
competitive environment. The collection and analysis of logs has raised several ethical and
privacy issues (Jones et al., 2007; Adar, 2007). There is a particular concern regarding the
study of highly identifying queries, i.e. queries that, when aggregated, enable the identification
of users and their private behaviour.
Although the number of data sets is small and getting dated, it possible to use them to
conduct several useful researches and to develop the application that is the main contribution
of my MSc thesis. For the validation experiments, we made use of a data set from Biblioteca
Nacional de Portugal (the National Library of Portugal).
This chapter also presented the visualization and data exploration techniques used in
applications specifically developed for web log analysis.
The Search Log Analysis Web application that is proposed here is based on the Google
Trends and Google Zeitgeist Web applications. It inherits many of the concepts from these
two applications and tries to fill the gap left by these applications by widening the array of
possible logs to be analyzed and also introducing new features. The main purpose is to
provide quality analysis results for general search logs since these two applications have their
use restricted to proprietary logs. Besides this, the Search Log Analysis Web application

23
features new functionalities that include session, query and term analysis, as well as spatio-
temporal analysis and filtering capabilities.

24
3. Solution Approach
This chapter describes the solution approach. It starts by presenting the data model that
supports the development of the Search Log Analysis Web application. It also presents the
data that was used in this work and the main decisions regarding its preparation for use with
the Search Log Analysis Web application.
3.1. The Data Model
An Entity-Relation diagram (ERD) is a graphical representation of the organization of data
within a database. It illustrates the data structure of an information system by describing the
entities or concepts that exist in the database, showing the name of each entity, its list of
attributes and the relationships with other entities. Figure 3.1 illustrates the ERD for a
database that can support search log analysis applications.
Figure 3.1 – The Search Log Analysis Entity Relational Diagram

25
The data model comprises a set of five entities: the Searching Episode, the Query, the Term,
the Clickurl and the Location. This entity set allows the separation of the different types of
data handled and analyzed by the system. Each of the entities ends up isolating the main
element for a distinct section or level of analysis in the result page reports.
The Searching Episode entity, which stores client and session related data, comprises the
sequences of search interactions performed by a single user. Each Searching Episode
includes the following attributes that may be or not be defined according to their availability on
the specific log dataset source:
• User identification, which may be the IP address of the client’s computer or another
user identification code.
• The cookie identifier, for helping track the history of the user activities.
• A session identifier, for helping separating searching contexts and analysing the
intentions and the outcomes of the user searches.
• The referrer, which is the address of the previous webpage from which a link led to
the current page.
• The user-agent, for identifying the client’s platform details. It usually identifies the
browser and operating system. It may also identify the usage by indexing robots or
spiders which are automated programs searching the internet.
A Searching Episode contains one or more queries. The Query entity stores the complete
search queries, as introduced by the user, and includes a time stamp registering the date and
time of the requests. The Query entity has relations to both the Term entity and to the Clickurl
entity. The first is a one Query contains many Terms relation, as the Term entity stores the
set of individual terms existing in a specific query and their frequency. The second is a one
Query contains one Clickurl relation, as for each query there is at most a result that is
selected. The Clickurl’s itemrank attribute corresponds to the ranking of the result as provided
by the search engine results page.
Finally, the remaining entity is the Location entity which provides the system with a set of
geographical related features. These features are essentially names of regions and their
corresponding geospatial coordinates. The relation with the Searching Episode entity means
that each Searching Episode may have its geographical location determined, allowing the
reports to the include location related information as well as allowing location related
searches and filters. In more detail, the location entity stores the following set of location
attributes:
• The country code
• The country name
• The city name
26
• The latitude
• The longitude
• The most common language
• The geocode, which is important for pinpointing locations on the map and for
performing searches and filtering results based on map areas. Further details will be
described ahead in this chapter.
In order to increase system performance, some adaptations were made to the data model.
Some denormalization techniques have been followed. For instance, since each query
belongs to one and only one Searching Episode, and each Searching Episode as its origin in
one location, it was decided to provide each query with data regarding its origin, including, for
that matter, a column location identifier in table Query.
For optimizing data retrieval, three types of indexes are applied to the different types of data:
B-tree index, Fulltext index and Spatial index. The B-tree index is the most used for indexing
the data in this system’s database and unless stated otherwise it is the default index. A
Fulltext index is used for providing complex text searching capabilities against data stored in
character-based fields, while a Spatial index optimizes the performance of spatial queries and
the retrieval of all geometry based data. Indexes add a certain amount of overhead for
inserting rows into the database, and a trade-off had to be made. The main idea has been to
optimize the retrieval of data in sacrifice of insertion speed.
3.2. Data Collection
For developing and testing the application, log data and geolocation data are required. This
section provides a brief description of the log data and the geolocation data that was used in
this work.
3.2.1. The log data
During the development of this work, portions of logs from the AOL search engine (America
Online) and Biblioteca Nacional de Portugal (National Library of Portugal) were obtained and
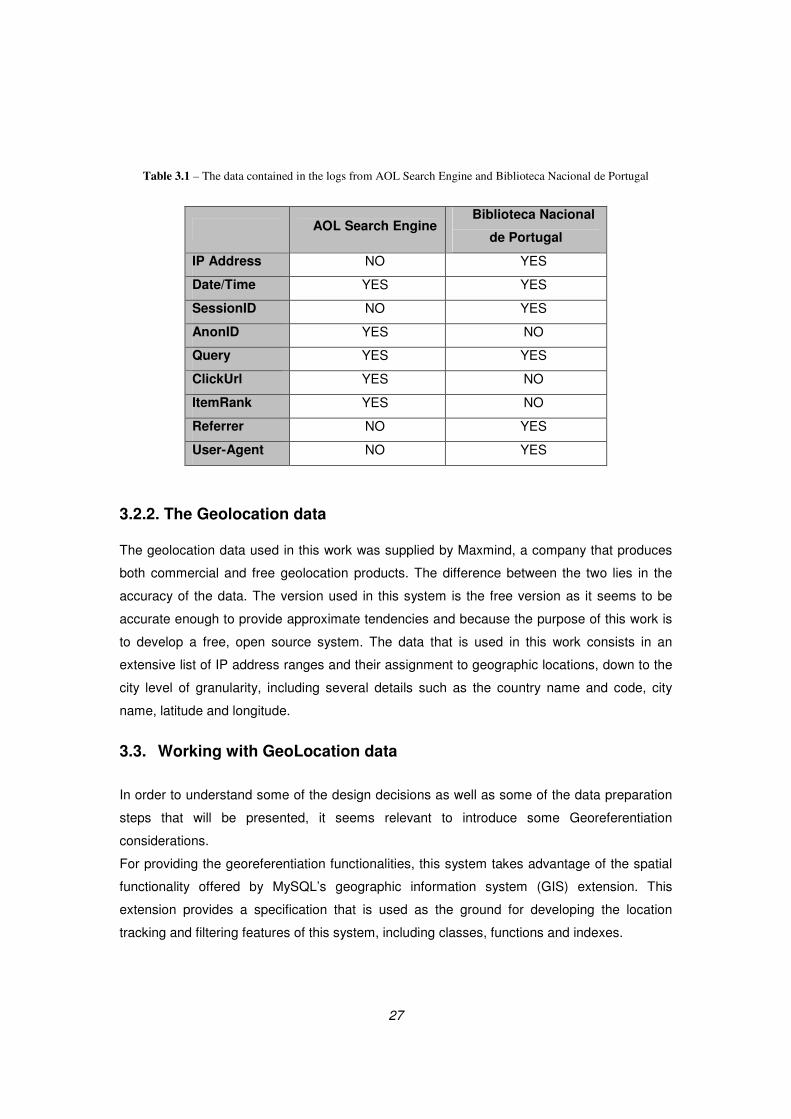
used. Table 3.1 illustrates the data contained in these logs.
27
Table 3.1 – The data contained in the logs from AOL Search Engine and Biblioteca Nacional de Portugal
AOL Search Engine Biblioteca Nacional
de Portugal
IP Address NO YES
Date/Time YES YES
SessionID NO YES
AnonID YES NO
Query YES YES
ClickUrl YES NO
ItemRank YES NO
Referrer NO YES
User-Agent NO YES
3.2.2. The Geolocation data
The geolocation data used in this work was supplied by Maxmind, a company that produces
both commercial and free geolocation products. The difference between the two lies in the
accuracy of the data. The version used in this system is the free version as it seems to be
accurate enough to provide approximate tendencies and because the purpose of this work is
to develop a free, open source system. The data that is used in this work consists in an
extensive list of IP address ranges and their assignment to geographic locations, down to the
city level of granularity, including several details such as the country name and code, city
name, latitude and longitude.
3.3. Working with GeoLocation data
In order to understand some of the design decisions as well as some of the data preparation
steps that will be presented, it seems relevant to introduce some Georeferentiation
considerations.
For providing the georeferentiation functionalities, this system takes advantage of the spatial
functionality offered by MySQL’s geographic information system (GIS) extension. This
extension provides a specification that is used as the ground for developing the location
tracking and filtering features of this system, including classes, functions and indexes.

28
In terms of classes, two are particularly relevant in this work: the point class and the polygon
class. According to the MySQL documentation, “a Point is a geometry that represents a
single location in coordinate space” and “a Polygon is a planar Surface representing a
multisided geometry. It is defined by a single exterior boundary and zero or more interior
boundaries”. Points are used to define geographic coordinates in terms of latitude and
longitude parameters. Polygons, on the other hand, are used for defining and representing
areas.
In terms of functions, one is particularly important in this work: the MBRContains function.
This function receives two geometry elements and indicates if the Minimum Bounding
Rectangle of one element is contained in the Minimum Bounding Rectangle of the other
element. In this work, this function is used to indicate which points are contained inside a
given area or polygon.
Finally, the GIS extension provides a special type of index that is used for spatial data called
R-tree ("R" stands for Region) indexing. An R-tree index is similar to a B-tree and organizes
the indexed nodes in a hierarchy where the nodes in the index represent the Minimum
Bounding Rectangle of the objects in the node.
3.3.1. Determining the locations
Knowing the IP address range assigned to each specific city enables the possibility to, given
any client’s IP address, determine that client’s approximate location.
Figure 3.2 shows a sample of the geolocation data used in this work. It consists of two tables
where the left table maps IP ranges to locations and the right table provides the location
details. The table excludes the data elements that are not used in this work: the PostalCode,
the Metrocode and the AreaCode.
Figure 3.2 – A sample of the geolocation data used in this work, showing the connections between the two tables
In this work, another operation that is fairly common involves determining the locations
existing inside a specific area. Each location has Latitude and Longitude values that can be
used to define a point class element, as follows:
POINT (Latitude, Longitude)
29
This is the case of the geocode attribute that was mentioned in the data model section.
A point may or may not be inside in a specific area, which, in turn, is defined as a polygon.
Such a polygon is defined as follows:
IP_POLY = GEOMFROMWKB(POLYGON(LINESTRING(
POINT(X1,Y1),
POINT(X2,Y2),
. . .
POINT(Xn,Yn)
)))
This is determined by using the function MBRContains, which receives the polygon and the
point and indicates if the point is “contained” inside the polygon.
MBRCONTAINS(IP_POLY, POINTFROMWKB(POINT(Latitude, Longitude)))
In addition, using a similar method, the same function can be used for determining which
points exist inside any specific area.
3.4. Data Preparation
The data preparation stage involves preparing the log and the geolocation data. It is achieved
by running a MySQL script containing the preparation details. This script uses the UTF-8
character encoding to allow the representation of any character in the Unicode standard.
3.4.1. Preparing the Log Data
The first step in the log data preparation stage consists in parsing the log data. Logs from
different sources are stored in different databases and usually require a different parser as it
must be custom made to reflect the log’s structure and data. The input is read in sequence.
The parser scans the data, identifies tokens, breaks the distinct data fields and stores them in
the adequate tables and columns. The data fields depend on the availability of the specific log
dataset and thus may include the following set or a subset of the fields:
1. IP address, or another user identifier
2. cookie identifier
3. session identifier
4. referrer
5. user-agent

30
6. search query
7. querytime
8. clickurl
9. itemrank
Fields 1 to 5 are stored in table Searching Episode, fields 6 and 7 in table Query, and fields 8
and 9 in table Clickurl.
Table 3.2 exemplifies three log entries from the AOL search engine and Table 3.3 shows a
single log entry, partitioned for simplifying display and description, from the Biblioteca
Nacional de Portugal (the National Library of Portugal).
Table 3.2 – The AOL search engine log format and some examples
AnonID Query QueryTime ItemRank ClickURL
142 rentdirect.com 2006-03-01 07:17:12
1326 dellcomputers 2006-03-06 20:09:58
1337 Searchtec 2006-03-22 17:58:46 1 http://www.searchtec.com
Table 3.3 – The Biblioteca Nacional de Portugal log format and example
IP Address 217.129.79.241 - -
Date [02/Dec/2008:00:00:15 +0000]
Request
"GET /ipac20/ipac.jsp?session=QO28C75596993.60411&menu=search&aspect=subtab13&npp=20
&ipp=20&spp=20&profile=bn&ri=5&source=%7E%21bnp&index=AUTHOR
&term=Casanova%2C+Carlos+Joaquim+Martins+Sobral&aspect=subtab13&x=14&y=13
HTTP
response and
byte count
http/1.1" 200 36774
Referrer
"http://catalogo.bn.pt/ipac20/ipac.jsp?session=QO28C75596993.60411&menu=search
&aspect=subtab13&npp=20&ipp=20&spp=20&profile=bn&ri=4&source=%7E%21bnp
&index=AUTHOR&term=Casanova%2C+Carlos+Joaquim+Martins+Sobral&aspect=subtab13"
User-Agent "Mozilla/4.0 (compatible; MSIE 7.0; Windows NT 5.1; .NET CLR 1.1.4322; InfoPath.1)"
IP addresses are usually represented by a series of four one-to three-digit numbers separated
by periods. In order to simplify operations and optimize system performance they are stored
in the database as an integer.
Example: IP = 209.207.224.40
Its value becomes: 209x256^3 + 207x256^2 + 224x256 + 40 = 3520061480

31
In logs such as Biblioteca Nacional de Portugal, a subset of data fields are contained in a
URL address, so it is necessary to detect, extract and decode those fields from the URL and
store them in the database. This case is illustrated in Table 3.3 where the session identifier
and the query are highlighted to denote that they are registered in the context of the request
URL, confined between substrings that identify the start and the end of each element.
The query is stored and indexed with a fulltext index and its terms are separated, have the
non alphanumeric characters removed, and then the resulting terms are stored in table Term.
A copy of the table Term is created, and a set of stop words of the English, Portuguese,
Spanish, German, French and Italian languages are removed.
The system retains data regarding both the full set of terms set and the set of terms excluding
stop words.
3.4.2. Preparing the geolocation data
It is during the geolocation data preparation stage that the location of every request is
determined, removing that computation load from execution time.
Just like the log data, the entire location data must be stored in the database. During this
step, each table row gets an additional field, the geocode, which is a point defined in terms of
the specific Latitude and Longitude values of that location. This field is indexed using MySQL
GIS spatial index.
As Figure 3.2 illustrates, the approximate location of a given IP address can be determined by
finding the range in which that value belongs to:
IP FROM <= IP ADDRESS <= IP TO
However, this operation turns out to be inefficient as the number of ranges to be scanned and
the number of times it must be executed reaches a certain level. The MySQL GIS extension,
introduced earlier, provides a much more efficient mechanism for performing such operations.
Instead of scanning in one dimension, the search is performed in two dimensions, Each IP
range is translated into an area representation, the IP polygon, and the specific IP address is
translated into a point representation. As Figure 3.3 shows, the IP polygon has its vertices
horizontal axis based on the starting and ending IP values while the vertical axis ranges from
values -1 to 1.

32
Figure 3.3 – Adapting an IP range to an area representation
To represent the IP address as a point, the actual IP becomes the horizontal value and the
vertical value becomes the value 0.
POINT (IP, 0)
The scanning operation becomes the search of the IP polygon that contains a given IP point
and thus the search procedure ends up being the same as the one described in section 3.3.1.
Using this mechanism every request having an IP address is associated with its
corresponding location. This is done by including the location identifier in each of the rows of
the Searching Episode table and in each row of the table Query.
An additional step in the geolocation preparation consists in determining the most common
language for each location and storing it the Location table. It is important to note that the
language is based on the official language of the countries where the queries were
performed. In cases where more than one official language applies, the most frequent
language is selected.
3.5. Discussion
The data model described in this chapter integrates most of the concepts proposed by
(Jansen, 2006) and presented in the entity-relational diagram of Figure 2.1. Just like in that
data model, the Searching Episode stores the user and session details, with the exception
that, in this work, queries are stored in a separate table. The rationale is that each Searching
Episode may contain several queries and it is not necessary to store repeated data regarding
the user and the session. Another important difference between this and the model proposed
by Jansen is that in his work he decided to store term co-occurrences, while I decided to store
only the terms for each query. The reason for this is because the terms that need to be
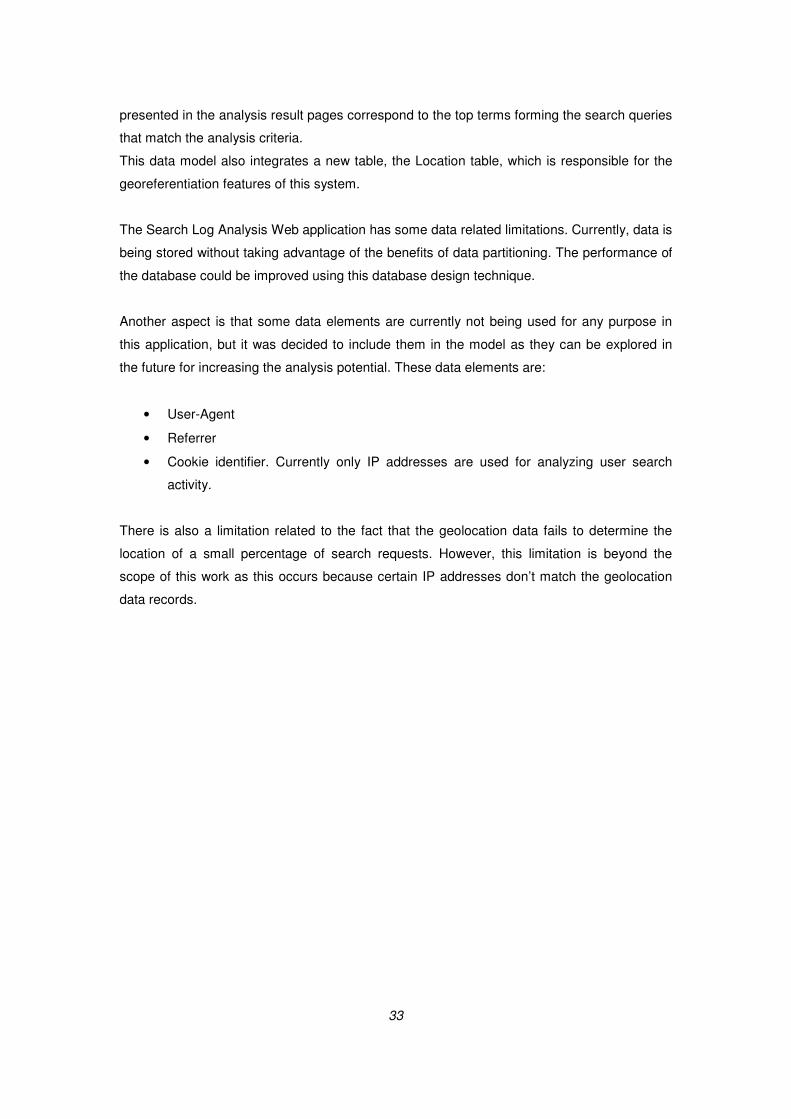
33
presented in the analysis result pages correspond to the top terms forming the search queries
that match the analysis criteria.
This data model also integrates a new table, the Location table, which is responsible for the
georeferentiation features of this system.
The Search Log Analysis Web application has some data related limitations. Currently, data is
being stored without taking advantage of the benefits of data partitioning. The performance of
the database could be improved using this database design technique.
Another aspect is that some data elements are currently not being used for any purpose in
this application, but it was decided to include them in the model as they can be explored in
the future for increasing the analysis potential. These data elements are:
• User-Agent
• Referrer
• Cookie identifier. Currently only IP addresses are used for analyzing user search
activity.
There is also a limitation related to the fact that the geolocation data fails to determine the
location of a small percentage of search requests. However, this limitation is beyond the
scope of this work as this occurs because certain IP addresses don’t match the geolocation
data records.

34
4. A Web application for search log analysis
This chapter describes the Search Log Analysis Web application that was built on top of the
data model that was described in the previous chapter. The first section of this chapter
provides a brief overview of the system, summarizing its general aspects and its underlying
principles. The following sections describe the application at a more detailed level, illustrating
the user interface and presenting its features and functionalities.
4.1. Overview of the Web application
The Search Log Analysis web application is a system designed for analyzing logs, specifically
the logs of search engines.
The application provides mechanisms to deliver information from different perspectives,
ranging from a global or general perspective to a set of custom perspectives created by a
combination of filters. The global perspective provides a general picture of the searching
activity, including several overall statistical measures. The filtered perspectives may adapt to
meet the specific information needs of the users. In terms of the filtering capabilities, this
system allows the analysis to be conducted over three distinct levels: the query level, the time
period level and the location level. The three levels are independent, meaning that it is
possible to conduct the analysis using any combination of filters from the three levels.
The query level covers three distinct types of filters. In this context the user may:
• Filter for query terms. By doing this the application returns a set of results reflecting
the search log queries that comply with the selected set of terms. These results
include the most frequent locations where the searches were made, the most
common queries, the most common terms existing in the queries containing those
terms, the most common websites associated with the search of those terms, and the
users that most often performed searches using those terms.
• Filter for users. Given that the log source provides data for identifying users, such as
an IP address or other identifier, it is possible to analyze information regarding user
activity, including the location of the user or users, the most common searches, the
frequency of searches over time and the most visited websites.
• Filter for URL addresses. Given that the log source provides data regarding the
selection of URL addresses in the search results, it is possible to determine the most
common queries and query terms associated with the webpage, the frequency of

35
user clicks over time, the list of the most common visiting users and the geographical
locations with most visitors.
Up to five queries, delimited by commas, may be analyzed simultaneously. This enables the
comparison of the analysis results. The reason to this limit is due to the compromise between
usefulness and performance, as more than five queries would imply a decreased efficiency.
The time level is taken into consideration when a user selects a specific time period for the
analysis. The user may restrict the analysis results to match a specific day, month or year.
The location level allows the restriction of the results to be based on a selected region. The
selection of a region enables the retrieval of information regarding that specific area. This is
possible through the analysis of the IP addresses contained in the logs. Note that this level of
analysis is disabled for logs that don’t contain the IP addresses of the machines performing
the queries. Filtering results based on a location is done by selecting a country, selecting a
city or by defining a custom area on a world map.
The information is provided in both tabular and visual formats. The tabular information covers
a set of different categories, namely location names, queries, terms, users and websites. The
displayed categories depend on the context of the analysis and consist in the list of its most
frequent elements.
The visual information is displayed through the use of charts displaying frequencies and
through a thematic world map pinpointing contextual locations.
4.2. The Search Log Analysis interface
The web application is composed of the following main interface screens:
• the home page
• the more hot trends interface
• the dataset statistics interface
• the analysis result interface
• the advanced search interface
Each of these interfaces will be described in the following sub-sections.

36
Each interface includes several guidelines and tooltips to help the users understand the
usage of the application. The action of moving the mouse over certain items (e.g. links)
causes tooltips to be displayed.
4.2.1. The Home Page
The home page is the first interface that is displayed to the system users. Figure 4.1 presents
this interface, divided into three distinct sections for ease of description. The first section has
a search box and a drop-down box where users can determine the queries to be searched
and select the specific search log to be analyzed, respectively. A user can submit up to five
queries at the same time, separated by commas. In the context of the home page the users
may only search for term-related queries.
The second section presents the “Hot Trends” search queries, which is a list of the 10 most
common search queries for the selected log source, for all periods of time and all locations.
Each of these entries is a link, allowing users to click on them and to search the particular
query in more detail. Selecting one of the queries in hot trends links has the same effect as
introducing the same exact terms in the search box described in the first section. The effect is
the change of interface to the Results page.
Finally, the third section there are four links entitled “More Hot Trends”, “Dataset Statistics”,
“Overall Results” and “Advanced Search”. These interfaces are described in their respective
chapter sub-sections.
Figure 4.1 – The Search Log Analysis home page interface

37
4.2.2. The Hot Trends interface
The Hot Trends interface provides a list with the hundred most common queries performed in
a selectable log source. Each of the listed queries is a clickable link which allows the user to
analyze it in more detail. By default, the list presents the all-time most common queries
across all locations, but the user may restrict the results by selecting a specific country in the
Country drop-down box, the and/or by specifying a particular year, month or day on the
calendar. Figure 4.2 presents the hot trends interface.
Figure 4.2 – The Hot Trends interface
4.2.3. Dataset Statistics interface
The Dataset Statistics interface shows the overall statistics for the entire selected log dataset.
These statistics provide generic information regarding queries, terms, users, sessions,
locations and languages. The set of statistics that were considered is inspired by previous
characterization studies in search log analysis. Metrics include the average number of queries
per day, the percentage of distinct queries and distinct terms, the average number of terms
per query (including and excluding stop words), the average number of queries per user and
the average number of queries per session. Figure 4.3 presents an example of the general
statistics page.
38
Figure 4.3 – An example of the four types of displays of the time series chart existing in the result pages
4.2.4. Advanced Search interface
The advanced search interface provides additional searching mechanisms besides the
searching possibilities provided in the home page. In the home page the searches were
based solely in term-related queries. As it will be described, the advanced search interface

39
provides the support for performing analysis based on a wide variety of query types and
based on geographical spatial restrictions.
Figure 4.4 presents the advanced search interface and illustrates its three distinct sections.
The first section is located on top of the screen and consists of a set of tabs defining the type
of search to be performed. There are four possible types of searches:
• Search for term-related queries
• Search for user-related queries
• Search for website-related queries
• Search by Area. In this situation the query field is left empty and the analysis
results page presents the general search information regarding a spatial
restriction. The spatial restriction definition is described ahead.
Figure 4.4 – The Advanced Search page
The second section is composed of a search box that is used for specifying the actual query
to be searched, and a drop down box that is used for selecting the log source.
Finally, the third section is the spatial restriction section. A spatial restriction is applied to the
search analysis by using one of two possibilities:
• By selecting a country in the Country drop down box. By default, the option is set to
contemplate all countries.
• By a user definable area on the world map – the user defines the area by creating a
polygon over the world map. This is done by clicking on the location points matching
the polygon vertices of the desired polygon. The defined area is displayed in blue.
40
In order to ease location exploration, the map supports zooming and dragging as well as four
distinct visualization schemes: map, satellite, hybrid and terrain. For further ease of use, in
the bottom of the screen the user can search for a specific location by inserting the location
details in the search box and selecting the option to find the location. Next to this option are
two buttons that are used for deleting defined polygon points on the map or clearing the map.
4.2.5. The Results interface
The information that is presented in the results interface is divided in three distinct sections:
• the information categories section,
• the chart section and
• the map section
Figure 4.5 presents an example of an analysis page for a set of term-related queries,
highlighting the three distinct sections of the interface. Each of these interface sessions is
described in the following sub-sections.
To select a time period for filtering the results, the interface integrates calendar features as
presented in Figure 4.6.
The time level allows users to define the time interval to be considered in the analysis. It
consists in one of the following time period criteria:
• All-time, no time restriction is applied and the entire log span is taken into
consideration
• Analysis restricted for a specific day
• Analysis restricted for a specific month
• Analysis restricted for a specific year
The location level supports spatial restrictions over the result analysis. One of the following
filtering criteria can be applied:
• All countries, no spatial restriction is applied
• Analysis restricted for a specific country.
• Analysis restricted for a user definable area
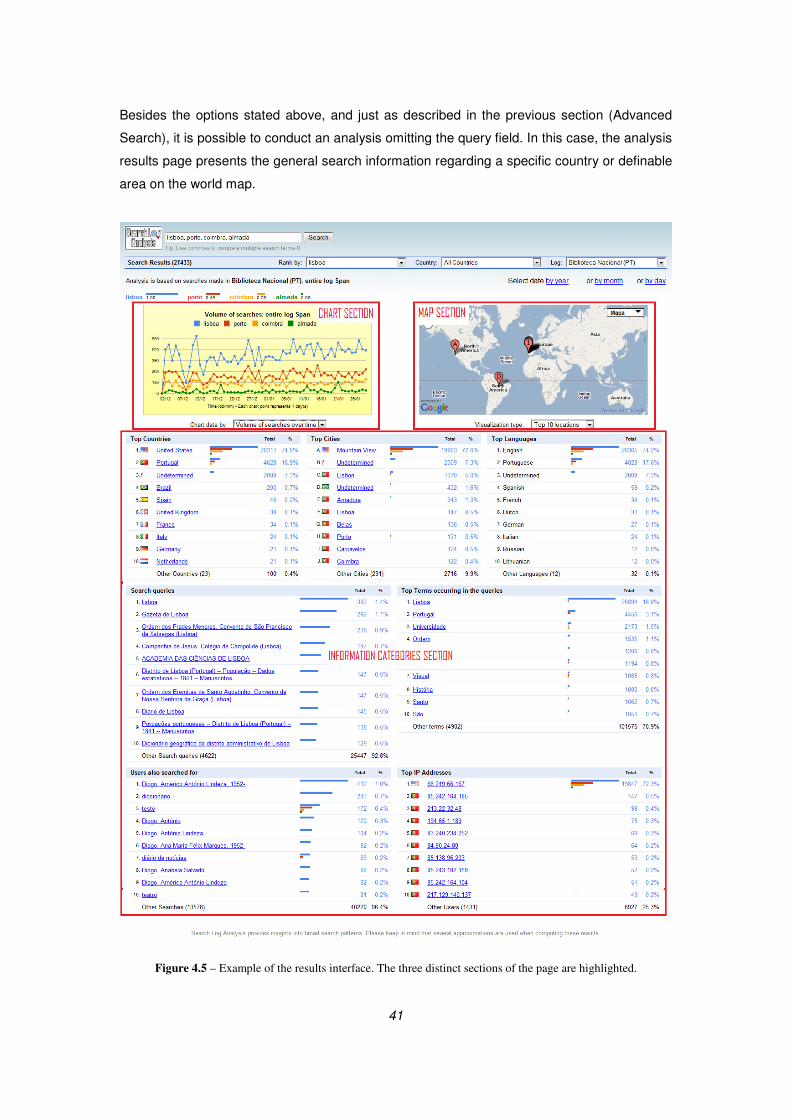
41
Besides the options stated above, and just as described in the previous section (Advanced
Search), it is possible to conduct an analysis omitting the query field. In this case, the analysis
results page presents the general search information regarding a specific country or definable
area on the world map.
Figure 4.5 – Example of the results interface. The three distinct sections of the page are highlighted.
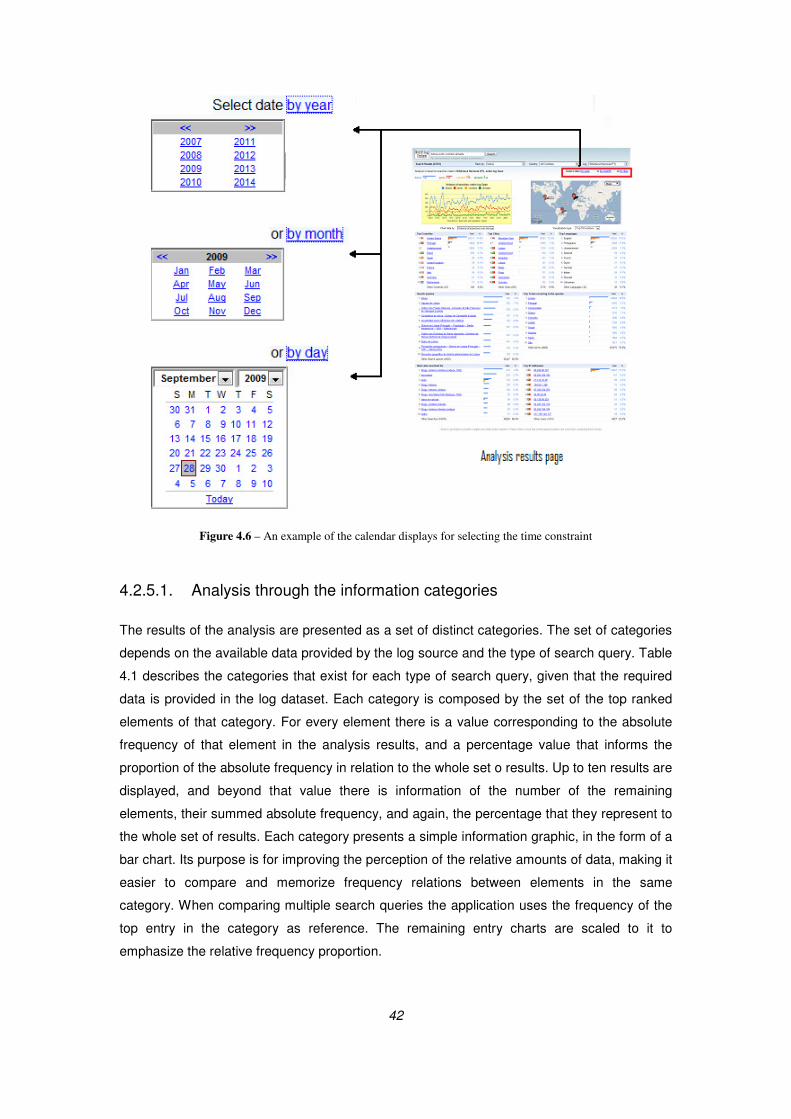
42
Figure 4.6 – An example of the calendar displays for selecting the time constraint
4.2.5.1. Analysis through the information categories
The results of the analysis are presented as a set of distinct categories. The set of categories
depends on the available data provided by the log source and the type of search query. Table
4.1 describes the categories that exist for each type of search query, given that the required
data is provided in the log dataset. Each category is composed by the set of the top ranked
elements of that category. For every element there is a value corresponding to the absolute
frequency of that element in the analysis results, and a percentage value that informs the
proportion of the absolute frequency in relation to the whole set o results. Up to ten results are
displayed, and beyond that value there is information of the number of the remaining
elements, their summed absolute frequency, and again, the percentage that they represent to
the whole set of results. Each category presents a simple information graphic, in the form of a
bar chart. Its purpose is for improving the perception of the relative amounts of data, making it
easier to compare and memorize frequency relations between elements in the same
category. When comparing multiple search queries the application uses the frequency of the
top entry in the category as reference. The remaining entry charts are scaled to it to
emphasize the relative frequency proportion.
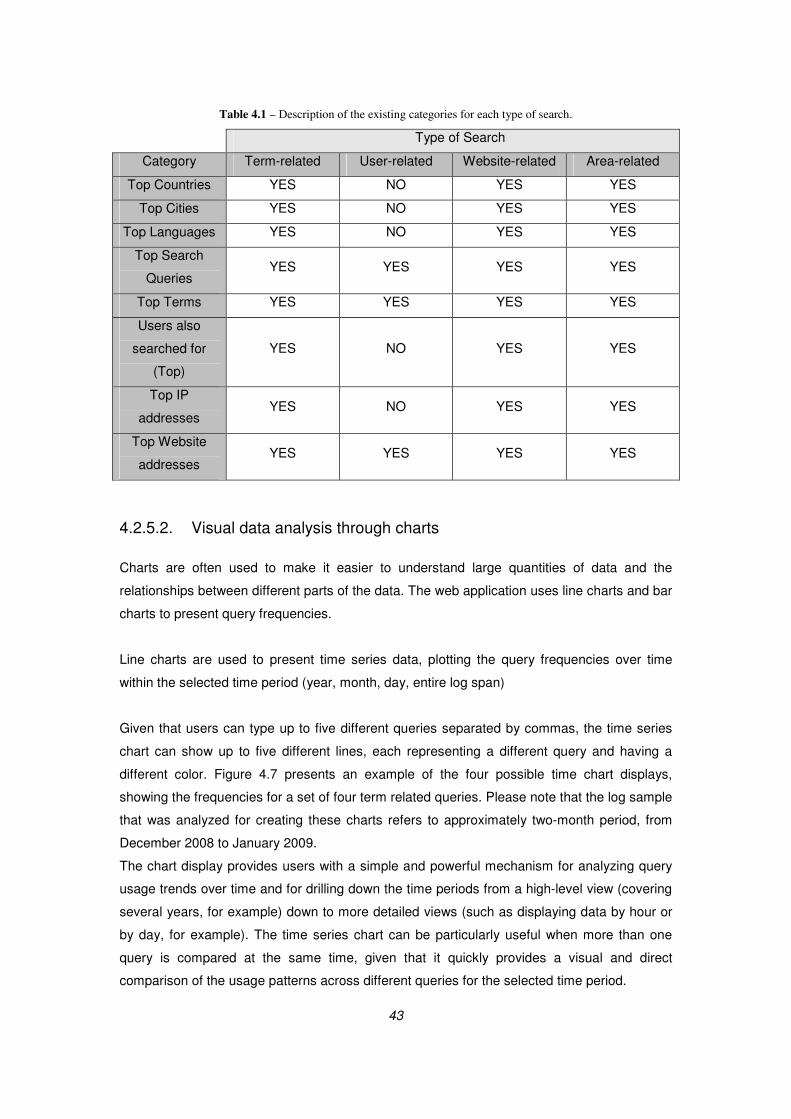
43
Table 4.1 – Description of the existing categories for each type of search.
Type of Search
Category Term-related User-related Website-related Area-related
Top Countries YES NO YES YES
Top Cities YES NO YES YES
Top Languages YES NO YES YES
Top Search
Queries YES YES YES YES
Top Terms YES YES YES YES
Users also
searched for
(Top)
YES NO YES YES
Top IP
addresses YES NO YES YES
Top Website
addresses YES YES YES YES
4.2.5.2. Visual data analysis through charts
Charts are often used to make it easier to understand large quantities of data and the
relationships between different parts of the data. The web application uses line charts and bar
charts to present query frequencies.
Line charts are used to present time series data, plotting the query frequencies over time
within the selected time period (year, month, day, entire log span)
Given that users can type up to five different queries separated by commas, the time series
chart can show up to five different lines, each representing a different query and having a
different color. Figure 4.7 presents an example of the four possible time chart displays,
showing the frequencies for a set of four term related queries. Please note that the log sample
that was analyzed for creating these charts refers to approximately two-month period, from
December 2008 to January 2009.
The chart display provides users with a simple and powerful mechanism for analyzing query
usage trends over time and for drilling down the time periods from a high-level view (covering
several years, for example) down to more detailed views (such as displaying data by hour or
by day, for example). The time series chart can be particularly useful when more than one
query is compared at the same time, given that it quickly provides a visual and direct
comparison of the usage patterns across different queries for the selected time period.

44
Figure 4.7 – An example of the four types of displays of the time series chart
Bar charts are used to display absolute frequencies of queries. Figure 4.8 illustrates an
example of a bar chart measuring the absolute frequencies of four term related queries.
Figure 4.8 – An example of a bar chart displayed in the analysis result pages
4.2.5.3. Visual data analysis and exploration through maps
The developed application supports two ways to visualize information on a map. The first
visualization type consists of a map having a set of markers displaying the contextual
locations also presented in tabular format. Figure 4.9 illustrates this type of visualization. The
information depends on the type of query. For user related queries the map displays specific
user locations. For term related queries and website related queries, the map displays the
locations where those terms or websites where most frequently used. Up to ten markers may
exist on the map corresponding to the highest related cities presented in the Top Cities

45
category. In order to relate the mapping information with the tabular information, both the city
names in the Top Cities category and the markers on the map are identified with letters.
Figure 4.9 – An example of a map illustrating the regions where the specific search was conducted
The second visualization type is a dot map which is a geographic representation that uses
colored dots to display the distribution and density of the search activity across a geographic
area. The dot map has a color code that uses three colors: green, yellow and red to represent
increasing levels of density. Areas with no color indicate the absence of search activity for a
given analysis context. Figure 4.10 portrays an example of a dot map displayed by this
application.
Figure 4.10 – Example of a dot map illustrating the distribution and density of the search activity across the globe.
The dot maps are created using a Java servlet. Each search request has an associated
location. The servlet starts by requesting the database to provide the latitude and longitude of
the locations that meet the specific search criteria, grouped by location and ordered by
frequency of searches. The retrieved results are rows indicating map coordinates and a
frequency number. The dots are created by drawing colored circles, in a translucent image

46
that when finished is overlaid on top of the map. In order to draw the points in their respective
positions, a change in referential is needed, from map coordinates to image pixels. To
determine the pixels the following formulas are used:
))1802
(2
(longitudewidthwidth
roundX ×+=
))90
)2/(
2(
2(
latitudeheightheightroundY ×−=
Where width and height correspond to the image attributes of the same name.
The color associated to each dot is relative to the search frequency value in each location.
It is important to note that the map functionalities are disabled for logs that don’t contain IP
addresses. This is because the mapping features relate to search requests through the
operation of georeferentiation which, in turn is achieved by using the IP address of the
request.

47
5. Experimental Evaluation
This chapter will illustrate the type, practicality and usefulness of the analysis, of the
interpretation and of the conclusions that can be drawn from the output interfaces of the
Search Log Analysis application. Through testing and the practical usage of the web
application, this chapter will check whether the hypothesis presented in chapter 1 is validated
and confirmed. The testing will be considered successful, proving the hypothesis, if it is
shown that the Search Log Analysis application can be used to perform spatio-temporal
search log analysis, providing useful and relevant information.
In order to formalize the testing and the validation of the hypothesis, the DIKUW (Data,
Information, Knowledge, Understanding and Wisdom) hierarchy model will be used as a
framework (Ackoff, 1989). Ackoff classifies the content of the human mind into five categories:
1. Data: Symbols, in a raw format, without a significance or meaning of itself
2. Information: Data that are processed to be useful; provides answers to "what",
"where", "when" and "who" questions
3. Knowledge: Application of data and information; answers "how" questions
4. Understanding: Appreciation of "why"
5. Wisdom: Evaluated understanding
Considering the above, a characterization study of a search log is presented in the next
section in order to evaluate the potential of the developed application in terms of extracting
relevant and useful information from the search logs. The log used for this study originates
from the search engine of Biblioteca Nacional de Portugal (National Library of Portugal).
5.1. Characterization study of the Biblioteca Nacional’s Search Log
The Biblioteca Nacional’s log is approximately 1GB in size and contains data for
approximately two months of search activity. The testing will be based on the interpretation of
the results obtained in the General Statistics and in the Overall Search Results output
interfaces, shown in Figures 5.1 and 5.2 respectively. In particular, the focus will be on
checking the application’s capability in providing answers to “when”, “how many”, “where”,
“what” and “who” type of questions and check that such information is relevant and adds
value.
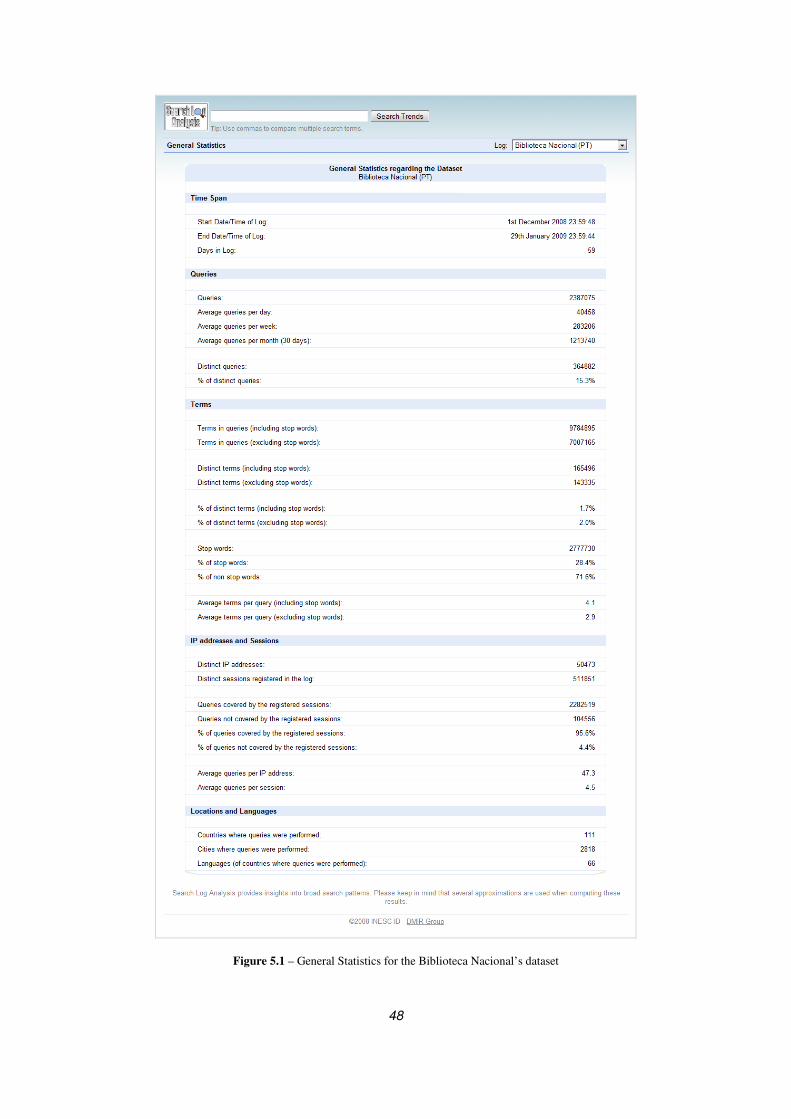
48
Figure 5.1 – General Statistics for the Biblioteca Nacional’s dataset
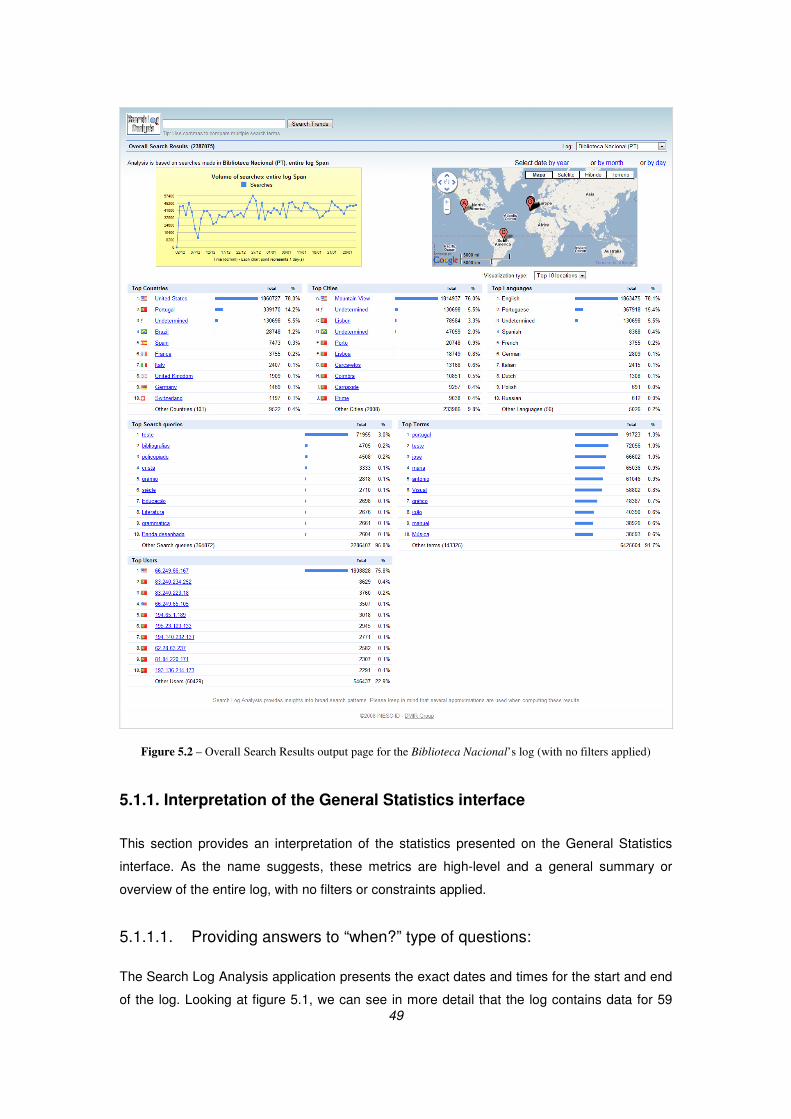
49
Figure 5.2 – Overall Search Results output page for the Biblioteca Nacional’s log (with no filters applied)
5.1.1. Interpretation of the General Statistics interface
This section provides an interpretation of the statistics presented on the General Statistics
interface. As the name suggests, these metrics are high-level and a general summary or
overview of the entire log, with no filters or constraints applied.
5.1.1.1. Providing answers to “when?” type of questions:
The Search Log Analysis application presents the exact dates and times for the start and end
of the log. Looking at figure 5.1, we can see in more detail that the log contains data for 59

50
days, covering the period from 1st December 2008, 23:59:48 to 29
th January 2009, 23:59:44.
This information is important in order to allow the user to identify the exact timing, relevancy
of duration and context of when the searches were carried out and the data was captured.
5.1.1.2. Providing answers to “how many?” type of questions:
The General Statistics page is mostly made of statistics representing frequencies and
averages answering several “how many?” type of questions. Among several other metrics,
the interface informs the user about the total number of days contained in the log, the total
number of queries performed during that period and the average number of queries
performed per day, per week and per month.
The “Average Queries per Day”, “Average Queries per Week” and Average Queries per
Month” statistics supply simple but useful information as they provide the user with an
understanding of how much the Search Engine or the database is being used on a daily,
weekly and monthly basis. This information is useful to the management team of Biblioteca
Nacional. For example, it would add value to its Director as it provides insight regarding the
number of searches carried out and the levels of usage of the library. It would be of interest to
the Marketing Director to enable comparisons of actual data versus usage targets and assess
deviations and required actions to achieve the objectives. These statistics would also be
relevant and important to IT teams as they would need to understand how busy the servers
and the terminals are, whether there is enough available capacity or whether there is the
need to add new hardware to cope with the demand.
The application makes a distinction between “queries” and “distinct queries” in order to give
the user an understanding of how different, repetitive or unique the queries being performed
are. For Biblioteca Nacional there were 15.3% of distinct queries during the period being
analyzed. This means that out of nearly 2.4 million queries only about 365,000 were distinct
and approximately 2 million were non distinct.
The Search Log Analysis application calculates and displays the total number of terms
searched, including and excluding stop words. It is useful to know the difference between
both in order to understand the percentage of stop words and the percentage of non stop
words. In this example of Biblioteca Nacional, stop words represent nearly 30% of all words
used. After excluding such relatively unimportant words one can get a better view of the
number of key words entered in the searches. The Average Terms per Query statistic,
particularly the one excluding stop words, provides users with an understanding of how long
or how complex queries tend to be on average. If we exclude stop words we observe that the
average number of terms per query is approximately 3 while if we include them the average
becomes approximately 4 terms per query.

51
Similarly, the Search Log Analysis application calculates and displays the total number of
distinct terms, including and excluding stop words, as well as the percentage of distinct terms.
Depending on whether we include stop words in the calculation or not, the percentage of
distinct terms searched on the Biblioteca Nacional’s database ranges between just 1.7% and
2% of all terms used, respectively. This information gives useful insight to the users of the
Search Log Analysis application as it quickly shows that the large majority of the terms
searched within Biblioteca Nacional are repeated and non-distinct (around 98%). In generic
terms, this statistic gives the user the information regarding how varied or repeated the terms
searched tend to be.
As seen in figure 5.1, the Search Log Analysis application calculates and displays the total
number of distinct IP addresses and the total number of distinct sessions registered in the log.
This information is useful in order to understand how many different computers and how
many different sessions generated the queries. The application also calculates the average
number of queries per session and per IP address and informs the user about the total
number of different computers (IP addresses), countries, cities and languages from where
queries were performed. In the example of the Biblioteca Nacional’s log we can see that
users carried out an average of 4.5 queries per session, that there were approximately 47
queries conducted per IP address and that queries were performed from nearly 50,500
different computers, across 2818 cities and 111 countries of 66 different languages (some of
this information nearly relates to “where?” type of questions). This information can provide the
users of the Search Log Analysis application, namely the management of Biblioteca Nacional,
with a view of how popular or how spread the service is across the globe.
Whether we apply the Search Log Analysis application to Biblioteca Nacional’s log or to any
other log, these general statistics are interesting and useful general information to any
director or team managing the company related to the log. For instance, the senior
management of the European Library or the directors of the AOL Search Engine will have
ambitions and specific targets in terms of the usage levels of their search engines, not only in
terms of the volume of queries performed but also in terms of number of computers,
geographical spread and sessions making use of those search engines. The Search Log
Analysis application can easily help providing those answers and allow a comparison of
targets versus actual values.
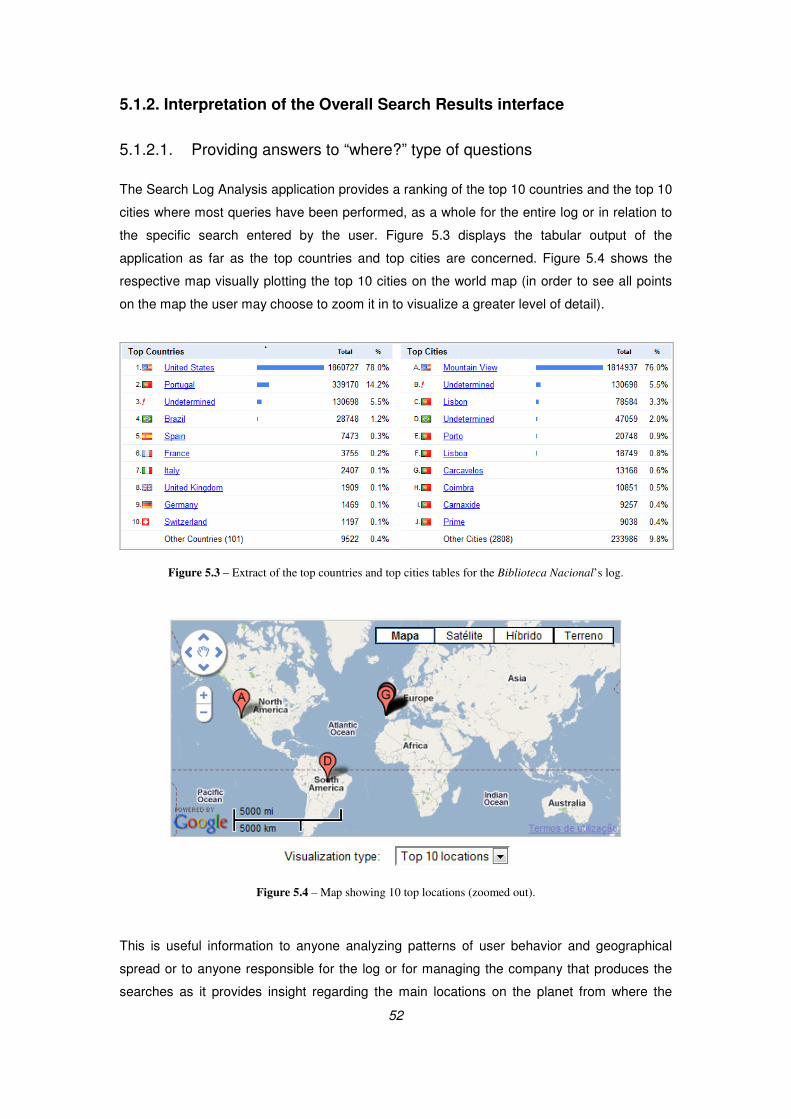
52
5.1.2. Interpretation of the Overall Search Results interface
5.1.2.1. Providing answers to “where?” type of questions
The Search Log Analysis application provides a ranking of the top 10 countries and the top 10
cities where most queries have been performed, as a whole for the entire log or in relation to
the specific search entered by the user. Figure 5.3 displays the tabular output of the
application as far as the top countries and top cities are concerned. Figure 5.4 shows the
respective map visually plotting the top 10 cities on the world map (in order to see all points
on the map the user may choose to zoom it in to visualize a greater level of detail).
Figure 5.3 – Extract of the top countries and top cities tables for the Biblioteca Nacional’s log.
Figure 5.4 – Map showing 10 top locations (zoomed out).
This is useful information to anyone analyzing patterns of user behavior and geographical
spread or to anyone responsible for the log or for managing the company that produces the
searches as it provides insight regarding the main locations on the planet from where the

53
searches have been carried out. Any Sales Director or any Marketing Director will want to
know where most of their customers are, which markets are more important and which
countries have got the largest potential for customer growth.
Looking at both the Top Countries and the Top Cities tables in parallel, it is interesting to
notice that out of all queries carried out at Biblioteca Nacional during the period analyzed,
over 3/4 of all searches, the large majority, were performed in the United States, and
particularly in Mountain View (97.5% of all of queries known to be performed in the United
States were actually carried out from this single location in California). Moreover, examining
also the table showing the Top IP Addresses used, it can be calculated that nearly all
searches (97.2%) carried out in the United States originated from one single IP address in
Mountain View.
This could, for example, help understand that the Library might need to focus on purchasing
more books written in the English language or buying or promoting more books relevant to the
people who live or work in that part of the United States. This statistic by itself may not be
enough to make those conclusions but will certainly help to paint a picture which will get
clearer with the help of additional queries to the database or with additional filters applied
within the Search Log Analysis application. For instance, with the help of relevant and
complementary queries and filters, one could more easily identify the need to make certain
books available to the United States audience, which would more easily meet the existing
demand and needs of the readers in those parts of the United States.
The second most frequent country is Portugal, where 14.2% of all queries were carried out.
The application shows that the United States and Portugal combined together represent over
92% of all queries. This insight is valuable as it helps decision makers to focus on their main
target markets. Looking at the table displaying the top cities, we can observe that 7 of the top
10 cities are Portuguese (although representing just 6.9% of all queries, a far lower proportion
than the 76% achieved by Mountain View). Searches have been carried out from a large
number of cities (2818) but 2808 cities only account for 9.8% of all queries. The third most
common country querying the database is actually an undetermined country, given that there
wasn’t a valid match for that IP address. Only 1.2% of all queries came from Brazil (4th in the
ranking). Although queries were performed from several different countries (110 countries to
be exact), the reality is that approximately 99% of all queries came from just these four
countries.
By default, the map within the application pinpoints the location of the top 10 countries.
However, through selecting “Dot Map” from the drop down list below the map, the Search Log
Analysis application allows the user to also visualize a Dot Map highlighting the relevant

54
locations reflecting activity. Looking at the overall dot map for the Biblioteca Nacional’s log in
Figure 4.10, we observe that the main highlighted areas where the searches are mainly
performed are Portugal, Western and Central Europe in general, East of the US, California
and South and East of Brazil. It is also interesting to see that Azores, Madeira, Canary Islands
and Cape Verde are quite visible on the dot map as being relevant areas for this log. Almost
with the exception of small areas in India, China, Japan and Indonesia, the Asian continent
has got very little expression. We can also see some activity in areas such as parts of South
Africa, Angola, Mexico and South East of Australia.
The application has shown accurate results when plotting points on the map. As planned, it is
observed that the Search Log Analysis application plots 3 different colors on the map,
depending on the frequency queries performed. The locations of high activity are displayed in
red, while the locations of lower activity are displayed in yellow and green (such as areas in
Central America and Eastern Europe). The interface allows the user to zoom in and zoom out
the map (by clicking the “+“ and “-” buttons) in order to see different levels of geographic
detail.
Many further searches could be carried out using the Search Log Analysis application and the
Biblioteca Nacional’s log (which would calculate and display additional statistics to interpret),
and understand their comparative popularity in different countries and cities, namely searches
using specific queries or terms or sets of simultaneous searches separated by commas. For
example, the Biblioteca Nacional’s staff would most certainly like to know how particular
topics have got different levels of popularity or demand in different countries. This information
would not only help to understand how different people from different locations have got
different backgrounds, preferences, priorities or concerns but would also help the library to
better meet different needs for different geographical locations.
In relation to the language of the queries used, over 3/4 of all queries were in English and
15.5% were in Portuguese. These two languages combined account for 93.5% of all queries.
If we include the third most common language used (which is actually undetermined and
different from the ones listed in the next sentence), then that equates to 99% of all queries.
Spanish, French, German, Italian, Dutch, Polish and Russian combined together represent
less than 1% of all queries. Figure 5.6 presents the output of the application in relation to the
language results.
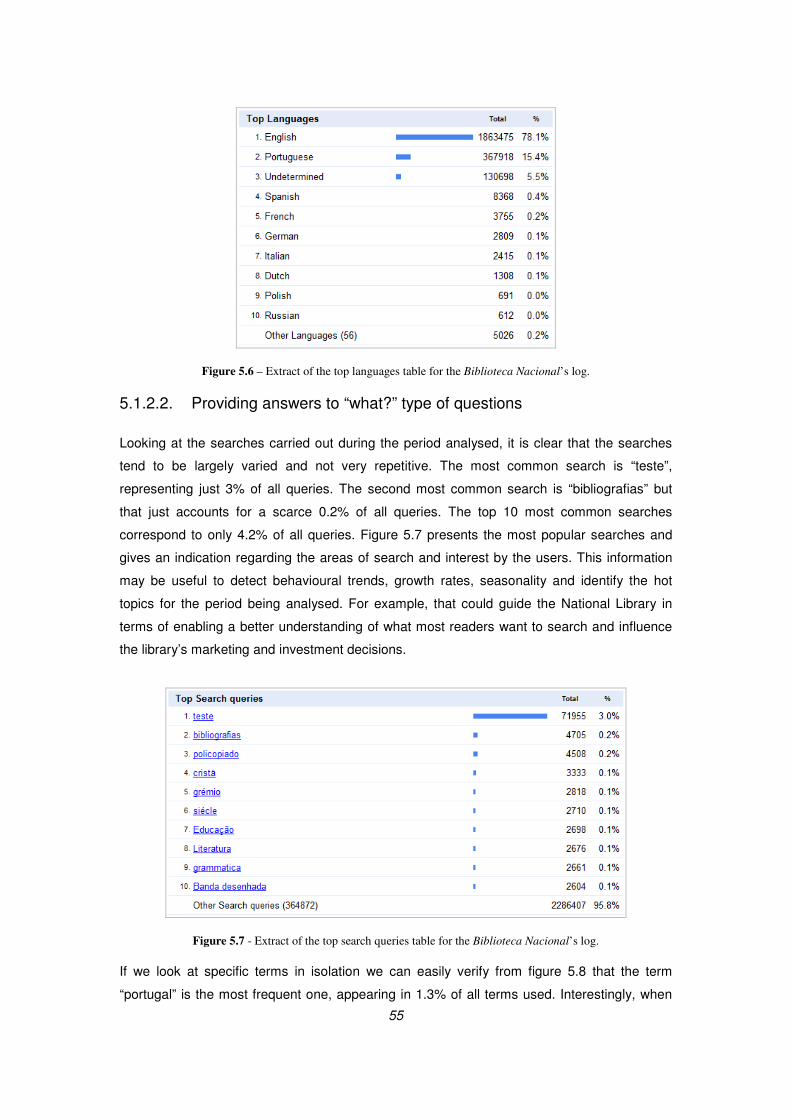
55
Figure 5.6 – Extract of the top languages table for the Biblioteca Nacional’s log.
5.1.2.2. Providing answers to “what?” type of questions
Looking at the searches carried out during the period analysed, it is clear that the searches
tend to be largely varied and not very repetitive. The most common search is “teste”,
representing just 3% of all queries. The second most common search is “bibliografias” but
that just accounts for a scarce 0.2% of all queries. The top 10 most common searches
correspond to only 4.2% of all queries. Figure 5.7 presents the most popular searches and
gives an indication regarding the areas of search and interest by the users. This information
may be useful to detect behavioural trends, growth rates, seasonality and identify the hot
topics for the period being analysed. For example, that could guide the National Library in
terms of enabling a better understanding of what most readers want to search and influence
the library’s marketing and investment decisions.
Figure 5.7 - Extract of the top search queries table for the Biblioteca Nacional’s log.
If we look at specific terms in isolation we can easily verify from figure 5.8 that the term
“portugal” is the most frequent one, appearing in 1.3% of all terms used. Interestingly, when
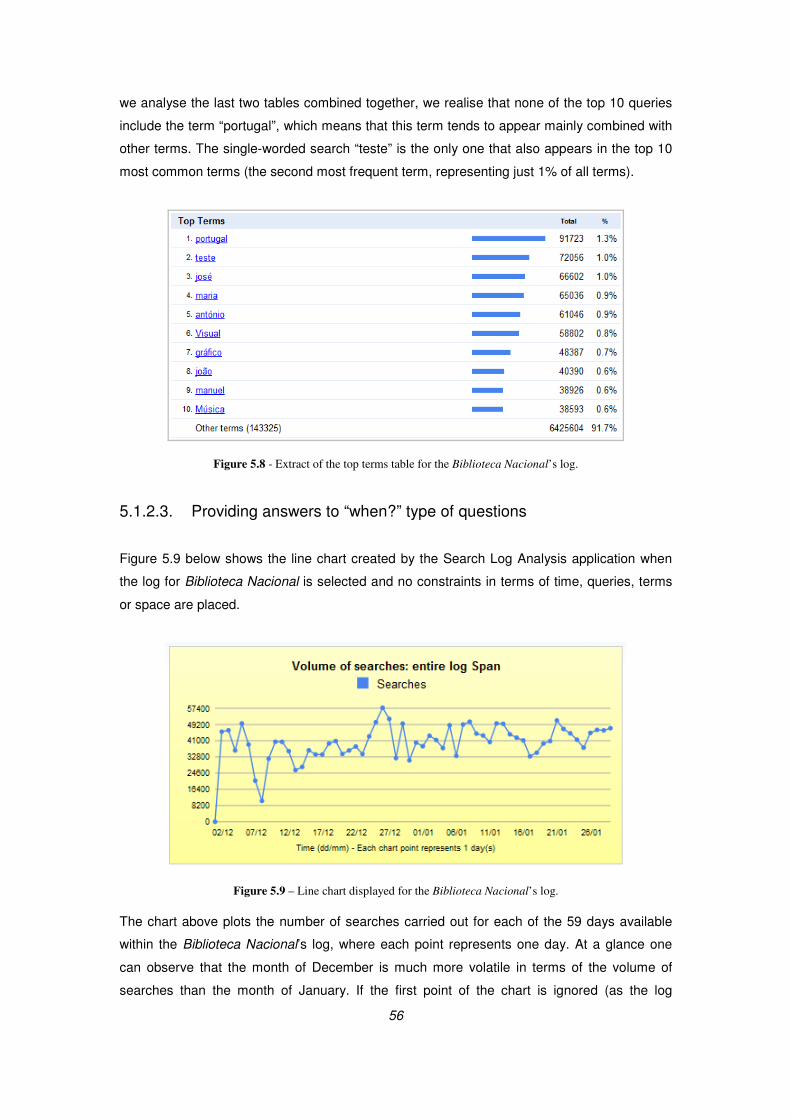
56
we analyse the last two tables combined together, we realise that none of the top 10 queries
include the term “portugal”, which means that this term tends to appear mainly combined with
other terms. The single-worded search “teste” is the only one that also appears in the top 10
most common terms (the second most frequent term, representing just 1% of all terms).
Figure 5.8 - Extract of the top terms table for the Biblioteca Nacional’s log.
5.1.2.3. Providing answers to “when?” type of questions Figure 5.9 below shows the line chart created by the Search Log Analysis application when
the log for Biblioteca Nacional is selected and no constraints in terms of time, queries, terms
or space are placed.
Figure 5.9 – Line chart displayed for the Biblioteca Nacional’s log.
The chart above plots the number of searches carried out for each of the 59 days available
within the Biblioteca Nacional’s log, where each point represents one day. At a glance one
can observe that the month of December is much more volatile in terms of the volume of
searches than the month of January. If the first point of the chart is ignored (as the log

57
includes very partial data for that day), it can be observed that the day with the lowest number
of searches is 8th December 2008 (Monday, bank holiday in Portugal) while the day with the
highest number of searches is 26th December 2008 (with approximately 57,400 searches).
The daily volume of searches in the month of January appears more predictable and displays
weekly patterns which range from approximately 33,000 daily searches up to approximately
50,000 daily searches. The overall trend for the 2-month period is of a slight growth in the
number of searches conducted.
The line chart presented by the Search Log Analysis application adds value because it
provides quantitative answers to the question “how many queries?” and adds information
regarding “when”. It can be observed that the line chart does provide useful and relevant
information to the user in a quick and visual manner.
5.1.2.4. Providing answers to “who?” type of questions
Figure 5.10 shows that over 3/4 of all searches were carried out from a single IP address in
the United States. This is by far the most used IP address given than the second in the
ranking of usage (located in Portugal) only managed to represent a mere 0.4% of all queries
searched during the studied period. The importance of that single IP address in the United
States is such that it actually corresponds to 98.3% of all 10 top IP addresses combined
together.
The top 10 most used IP addresses correspond to 77.1% of all queries and cover just the
United States and Portugal. The remaining IP addresses used (and they are over 50,000)
represent 22.9% but they are spread by a large variety of IP addresses, each one
representing less than 0.1% of all queries carried out.
Figure 5.10 - Extract of the most frequent users (IP addresses) for the Biblioteca Nacional’s log.
58
5.1.3. Discussion
The real value of this application lies in the value of the information it is able to provide and in
what researchers and managers can do with that information to help them extract conclusions
and make more informed decisions.
The testing of the Search Log Analysis application has proved successful and the hypothesis
has been confirmed as the tool has shown that large amounts of unstructured raw data can
be converted into relevant, summarized and useful information that enables its users to
answer “when”, “how many”, “where”, “what” and “who” questions:
• “When” questions successfully answered – The application is able to inform when
the queries and the search terms where carried out (year, month, day and hour).
• “How many” questions successfully answered – The application is able to
calculate and inform about several frequency metrics and averages, including the
number of queries, distinct queries, terms, distinct terms, stop words, distinct IP
addresses, sessions, countries, cities, languages, average queries per day, average
queries per week, average queries per month, average terms per query, average
queries per IP address, average queries per session, etc.
• “Where” questions successfully answered – The application is able to inform
where most searches are carried out (top 10 countries and top 10 cities)
• “What” questions successfully answered – The application is able to provide what
specific searches and what specific terms have been most in use.
• “Who” questions successfully answered – The application is able to identify who
are the most frequent users, by IP address, querying the database.
Moreover, and referring to the DIKUW hierarchy model, the interpretation and application of
the information provided by the Search Log Analysis tool helps users to answer some “how”
questions, converting that insight into knowledge and even going beyond the information
level. The outputs provided by the Search Log Analysis application provide enough relevant
and useful information to allow the users to make conclusions and decide what actions they
may need to perform and how.

59
6. Conclusions and future work
Every day large volumes of search data are stored in the logs of search engines. On its own,
this raw data is just a set of transaction records between users searching for information and
the systems that handle and serve those requests. However, if properly analyzed this
resource can prove to be very valuable, as it provides comprehensive details of how a search
engine was used, namely answering questions such as what and when was searched, where
the searches where conducted and by whom.
Whilst some applications have already been developed with the purpose of answering these
and other questions, those applications are still rare, their development details and source
code are not made available and they are restricted to work only with specific search logs.
Acknowledging this limitation and realising the existence of a gap in this field of research, I
hypothesized that an open-source Web application, based on a relational database, could be
developed and used to perform spatio-temporal search log analysis. In addition, this
application should provide useful and relevant information and should not be restricted to
work with a specific log but, instead, be adaptable to a myriad of search logs.
The main aim of this dissertation was to prove the hypothesis by designing, developing and
testing such a Web application, all of which have been accomplished. Validation was
performed by means of a characterization study over a search log from Biblioteca Nacional de
Portugal(National Library of Portugal) with the objective to prove that the Search Log Analysis
web application provides useful and relevant information. The Search Log Analysis
application provides both general and detailed statistics of the dataset used. The framework
used to prove the usefulness and relevancy of the information was the DIKUW (Data,
Information, Knowledge, Understanding and Wisdom) hierarchy model, according to (Ackoff,
1989). Following the model, the tool has shown that the Search Log Analysis web application
is able to convert large amounts of unstructured raw data into relevant, summarized and
useful information that enables its users to answer “when”, “how many”, “where”, “what” and
“who” questions:
• “When” questions successfully answered – The application was able to inform
when the queries and the search terms where carried out (year, month, day and
hour).
• “How many” questions successfully answered – The application was able to
calculate and inform about several frequency metrics and averages, including the
number of queries, distinct queries, terms, distinct terms, stop words, distinct IP
addresses, sessions, countries, cities, languages, average queries per day, average

60
queries per week, average queries per month, average terms per query, average
queries per IP address, average queries per session, etc.
• “Where” questions successfully answered – The application was able to inform
where most searches are carried out (top 10 countries and top 10 cities)
• “What” questions successfully answered – The application was able to provide
what specific searches and what specific terms have been most in use.
• “Who” questions successfully answered – The application was able to identify
who are the most frequent users, by IP address, querying the database.
Still referring to the DIKUW hierarchy model, the interpretation and application of the
information provided by the Search Log Analysis tool helps users to answer some “how”
questions, converting that insight into knowledge and even going beyond the information
level. The outputs provided by the Search Log Analysis application provide enough relevant
and useful information to allow the users to make conclusions and decide what actions they
may need to perform and how.
The testing of the Search Log Analysis application has proved successful and the hypothesis
has been confirmed. As my contribution to this field of research I am sharing it with the
scientific community.
One of the most interesting and useful capabilities of the Search Log Analysis application
relates to the fact that the user may search for up to five queries simultaneously and view
trends over a definable period of time and identify correlations in terms of usage and
popularity of those terms or queries. For instance, if we use the Search Log Analysis
application with the logs of a search engine one could visually and numerically compare terms
which typically could be complementary, rival or substitute. The further capabilities of the
Search Log Analysis application in applying additional filters (such as filtering by search
terms, location or time, or any combination of those) make it a powerful tool for extracting
useful behavioral patterns, growth rates, trends, seasonalities, correlations, time comparisons
and geographical contrasts.
6.1. Future Work
The Search Log Analysis Web application has some limitations that can be addressed in
future work.
Currently, data is being stored without taking advantage of the benefits of data partitioning.
The performance of the database could be improved using this database design technique.

61
Another aspect is that some log data elements are currently not being used for any purpose in
this application, but it was decided to include them in the model as they can be explored in
the future for increasing the analysis potential. These data elements are:
• User-Agent
• Referrer
• Cookie identifier. Currently only IP addresses are used for analyzing user search
activity.
There is also a limitation related to the fact that the geolocation data fails to determine the
location of a small percentage of search requests. However, this limitation is beyond the
scope of this work as this occurs because there are some gaps in the IP address ranges of
the geolocation data.

62
Bibliography Ackoff, R. L.: From Data to Wisdom, Journal of Applies Systems Analysis, Volume 16, (1989)
Adar, E.: User 4XXXXX9: Anonymizing Query Logs. In Proceedings of the 16th International World Wide Web
Conference (WWW'07). IW3C2, Banff, Alberta, Canada (2007)
Backstrom, L., Kleinberg, J., Kumar, R., Novak, J.: Spacial Variation in Search Engine Queries. In Proceeding of
the 17th international conference on World Wide Web. China (2008)
Baeza-Yates, R., Hurtado, C., Mendoza, M.: Query Recommendation using Query Logs in Search Engines. In
International Workshop on Clustering Information over the Web (2004)
Baeza-Yates, R., Hurtado, C., Mendoza, M., Dupret, G.: Modeling User Search Behavior. In Proceedings of the
Third American Web Congress. Washington DC, USA (2005)
Baeza-Yates, R., Calderón-Benavides, L., González-Caro, L.: The Intention Behind Web Queries. String
Processing and Information Retrieval (2006)
Beitzel, S., Jensen, E., Chowdhury, A. Grossman, D. Frieder, O.: Hourly Analysis of a Very Large Topically
Categorized Web Query Log. Illinois Institute of Technology, Chicago, USA (2004)
Broder, A.: A taxonomy of web search. In ACM SIGIR Forum, Volume 36, Issue 2. New York, USA (2002)
Brown, B., Sellen, A.: Exploring Users’ Experience of the Web. HP Laboratories. Bristol, United Kingdom (2001)
Chau, M., Fang, X., Sheng, O.: Analysis of the Query Logs of a Web Site Search Engine. In Journal of the
American Society for Information Science and Technology Volume 53, Issue 13 (2005)
Cui, H., Wen, J., Nie, W.: Query Expansion by Mining User Logs. IEEE Transactions on Knowledge and Data
Engineering. Volume 15, Issue 4. USA (2003)
Dempster, A. P., Laird, N. M., Rubin, D. B.: Maximum Likelihood from Incomplete Data via the EM Algorithm.
In Journal of Royal Statistical Society, series B (1977)
Fujii, A.: Modeling Anchor Text and Classifying Queries to Enhance Web Document Retrieval. In Proceeding of
the 17th international conference on World Wide Web. China (2008)
Gan, Q., Attenberg, J., Markowetz, A., Suel, T.: Analysis of Geographic Queries in a Search Engine Log. In
Proceedings of the first international workshop on Location and the web. In CM International Conference
Proceeding Series. Volume 300 (2008)
Grimes, C., Tang, D., Russel, D.: Query Logs Alone are not Enough. In Proceedings of the Workshop on Query
Log Analysis. Banff, Alberta, Canada (2007)
Hay, B., Wets, G., Vanhoof, K.: Clustering navigation patterns on a website using a Sequence Alignment Method.
In Proceedings of 17th International Joint Conference on Artificial Intelligence. (2001)
He, D., Goker, A., & Harper, D. J.: Combining evidence for automatic web session identification. Information
Processing & Management (2002)
Holscher, C., Strube, G.: Web search behaviour of internet experts and Newbies. In Proceedings of the 9th
international World Wide Web conference on Computer networks (2000)
Jansen, B., Spink, A.: An Analysis of web searching by European alltheweb.com users. Information Processing an
Management: an International Journal, Volume 41, Issue 2 (2005)
Jansen, B., Spink, A.: How are we searching the world wide web? A comparison of nine search engine transaction
logs. In Information Processing & Management: an International Journal, Volume 42, Issue 1. Tarrytown, NY,
USA (2005)
Jansen, B.: Search log analysis: what it is, what’s been done, how to do it. In Library & Information Science
Research, Volume 28, Issue 3 (2006)
63
Jones, R., Kumar, R., Pang, B., Tomkins, A.: “I Know What You Did Last Summer” – Query Logs and User
Privacy. In Proceedings of the sixteenth ACM conference on Conference on information and knowledge
management. Conference on Information and Knowledge Management. Lisbon, Portugal (2007)
Kellar, M., Watters, C., & Shepherd, M.: A field study characterizing Web-based information-seeking tasks. In
Journal of the American Society for Information Science and Technology (2007)
Kurth, M.: The Limits and Limitations of transaction log analysis. In Library Hi Tech (1993)
Lam, H., Russel, D., Tang, D., Munzner, T.: Session Viewer: Visual Exploratory Analysis of the Web Session
Logs. In Visual Analytics Science and Technology IEEE Symposium (2007)
Lee, U., Liu, Z., Cho, J.: Automatic Identification of User Goals in Web Search. In Proceedings of the World Wide
Web Conference. Chiba, Japan. (2005)
Montgomery, A., & Faloutsos, C.: Identifying web browsing trends and patterns. IEEE Computer (2001)
Nettleton, D., Calderón-Benavides, L., Baeza-Yates, R.: Analysis of Web Search Engine Query Sessions. ACM
SIGKDD Workshop on Web Mining and Web Usage Analysis, WEBKDD 2006. Philadelphia, USA. (2006)
Pass, G., Chowdhury, A., Torgeson, C.: A Picture of Search. In Proceedings of the 1st international conference on
Scalable information systems. ACM International Conference Proceeding Series, Volume 152. Hong Kong (2006)
Peters, T.: The history and development of transaction log analysis. In Library Hi Tech, Volume 1, Issue 2 (1993)
Rose, D., Levinson, D.: Understanding User Goals in Web Search. in Proceedings of the 13th international
conference on World Wide Web. International World Wide Web Conference. New York, USA (2004)
Sanderson, M., Kohler, J.: Analyzing geographic queries. In Proceedings of the Workshop on Geographic
Information Retrieval. 27th Annual International ACM SIGIR Conference. Sheffield, UK (2004)
Silverstein, C., Henzinger, M., Marais, H., & Moricz, M.: Analysis of a very large Web search engine query log. In
SIGIR Forum, Volume 33, Issue 1. New York, USA (1999)
Spink, A., Wolfram, D., Jansen, M., Saracevic, T.: Searching the Web: The Public and their Queries. In Journal of
the American Society for Information Science and Technology (2001)
Spink, A., Ozmutlu, S., Ozmutlu, H. C., Jansen, B.:. U.S. versus European Web searching trends. SIGIR Forum
(2002)
Vakali, A.: Web data clustering – Current research status & trends. Presentation lecture. Prague (2004)
Wang, P.: A Dual-approach to Web Query Mining: Towards Conceptual Representations of Information Needs.
School of information Sciences, College of Communication and Information, University of Tennessee, Knoxville
(2005)
Wang, X., Zhai, C.: Learn from Web Search Logs to Organize Search Results. In Proceedings of the 30th annual
international ACM SIGIR conference on Research and development in information retrieval (2007) 8
Wolfram, D.: Search Engine Queries: An Analysis of Excite Data Set. School of Library and Information Science.
University of Wisconsin – Milwaukee (1999)
Wu, K., Yu, P., Ballman, A.: SpeedTracer: a Web usage mining and analysis tool. IBM Systems Journal, Volume
37, Issue 1. Riverton, NJ, USA (1998)
Xiao, X., Wang, L., Xie, X., Luo, Q.: Discovering Co-located Queries in Geographic Search Logs. In Proceedings
of the first international workshop on Location and the web. ACM International Conference Proceeding Series,
Volume 300 (2008)
Zhang, V., Rey, B., Stipp, E., Jones, J.: Geomodification in Query Rewriting. In Proceedings of the 3rd ACM
workshop on Geographical information retrieval (2006)
Zhuang, Z., Brunk, C., Giles, C.: Modelling and Visualizing Geo-Sensitive Queries Based on User Clicks. In
Proceedings of the first international workshop on Location and the web. ACM International Conference
Proceeding Series. Volume 300 (2008)

64
Zobel, J., Moffat, A., Sacks-Davis, R.: An Efficient Indexing Technique for Full-Text Database Systems. In
Proceedings of 18th International Conference on Very Large Databases. Canada (1992)