inpa - bem vindo ao portal do cenbam e ppbio amazônia ... · sinopse: estudei o padrão de...
TRANSCRIPT
INSTITUTO NACIONAL DE PESQUISAS DA AMAZÔNIA - INPA
PROGRAMA DE PÓS-GRADUAÇÃO EM CIÊNCIAS BIOLÓGICAS
(ECOLOGIA)
ECOLOGIA ESPACIAL E COMUNICAÇÃO VOCAL DE ARIRANHAS
(PTERONURA BRASILIENSIS) NO PANTANAL
CAROLINE LEUCHTENBERGER
Manaus, Amazonas
Dezembro de 2012

i
CAROLINE LEUCHTENBERGER
ECOLOGIA ESPACIAL E COMUNICAÇÃO VOCAL DE ARIRANHAS
(PTERONURA BRASILIENSIS) NO PANTANAL
WILLIAM MAGNUSSON
Guilherme Mourão
Tese apresentada ao Instituto
Nacional de Pesquisas da Amazônia
como parte dos requisitos para
obtenção do titulo de Doutora em
Ciências Biológicas (Ecologia)
Manaus, Amazonas
Dezembro de 2012

ii
Relação da banca julgadora do trabalho escrito
Mario Cohn-Haft
Instituto Nacional de Pesquisas da Amazônia (INPA)
PARECER: Aprovada
Fernando Fernandez
Universidade Federal do Rio de Janeiro
PARECER: Aprovada
Benoit de Thoisy
Institut Pasteur de la Guyane
PARECER: Aprovada com correções
Matthew E. Gompper
School of Natural Resources. University of Missouri, USA.
PARECER: Aprovada
Kimberly Pollard
University of California
PARECER: Aprovada com correções
Relação da banca examinadora da defesa oral
Marina Anciães
Instituto Nacional de Pesquisas da Amazônia (INPA)
PARECER: Aprovada
Wilson R. Spironello
Instituto Nacional de Pesquisas da Amazônia (INPA)
PARECER: Aprovada
Vera M. F. da Silva
Instituto Nacional de Pesquisas da Amazônia (INPA)
PARECER: Aprovada

iii
Sinopse:
Estudei o padrão de atividade, ecologia espacial e comunicação vocal
de ariranhas, Pteronura brasiliensis no Pantanal Sul, Brasil. Monitorei
os grupos através de observações diretas, rádio-telemetria e armadilhas
fotográficas. Gravei vocalizações de diferentes grupos e o
comportamento dos emissores. Aspectos como área de vida, seleção de
caracterísitcas da paisagem, territorialidade, repertório vocal e variações
acústicas individuais foram avaliados.
Palavras- chave: Ariranhas – Comportamento, Bioacústica, Ecologia
de populações, Vocalização
L652 Leuchtenberger, Caroline
Ecologia espacial e comunicação vocal de ariranhas (Pteronura
brasiliensis) no Pantanal / Caroline Leuchtenberger. --- Manaus : [s.n.],
2012.
xxii, 180f. : il. color.
Tese (doutorado) --- INPA, Manaus, 2012.
Orientador : William Magnusson
Coorientador : Guilherme Mourão
Área de Concentração: Ecologia.
1. Ariranhas – Comportamento. 2. Bioacústica. 3. Ecologia de populações.
4. Vocalização. I. Título.
CDD 19. ed. 599.74447

iv
Dedico esta Tese...
...à minha família e ao meu namorado que abdicaram da minha presença em momentos
importantes para que eu pudesse realizar os estudos.
...àquelas ariranhas, em especial Aquarela, Pinguim e Risco, que foram figuras
importantes para a realização deste estudo.
...a todos aqueles interessados na conservação da espécie.

v
AGRADECIMENTOS
Ao meu orientador, Bill, que aceitou orientar uma aluna desconhecida à distância, em um
projeto que não parecia ser muito promissor.
Ao meu coorientador, e acima de tudo amigo, Gui que, há seis anos, me apresentou às
ariranhas, que se tornaram meu objeto de estudo por todo esse período. Por toda a serenidade
durante os momentos mais tensos, que me ajudou a chegar até aqui com sanidade.
À Renata Sousa-Lima pelos ensinamentos em bioacústica e disposição em ajudar,
mesmo à distância.
À banca examinadora do trabalho escrito e presencial às importantes contribuições para a
melhoria desta tese.
Renato Cintra pela amizade e apoio em momentos importantes.
À Embrapa Pantanal pelo apoio logístico para a realização das atividades de campo. Em
especial Batista e Odilza pela atenção e apoio fundamental para que missões ―impossíveis‖
fossem realizadas. Maciel, pela ajuda em arquitetar projetos engenhosos essenciais para o projeto
e Denis, pelo alto astral e prestatividade em nos ―dirigir‖ ao campo.
À Pró Reitoria de Pesquisa e Pós-Graduação (PROPP) da UFMS, em especial ao Antônio
Lopes de Oliveira, pela excelente logística na Base de Estudos do Pantanal (BEP), fundamental
para a realização dos estudos e ao Erich Fisher por viabilizar essa parceria.
À Fazenda Barranco Alto pelo apoio logístico durante os estudos no rio Negro. Em
especial aos amigos Lucas Leuzinger, pelos bons momentos de prosa e pelas valiosas dicas
técnicas que melhoraram a qualidade das filmagens; pela disposição em voar, mesmo com pouca
visibilidade, para me ajudar a procurar por ariranhas perdidas; Marina Schweizer pela
companhia especial durante longos períodos (em posição ―estátua‖) para observar nossas
queridas ―amigas‖, por todo o carinho e amizade que tornaram o trabalho muito mais agradável;
às princesinhas pantaneiras Lelê e Emília que despertaram em mim ainda mais a fantasia do
Pantanal.

vi
Ao querido amigo, Jorge Schweizer que disponibilizou seu histórico CESSNA-182 e se
aventurou, juntamente com sua esposa Evelyn, a encontrar a primeira ariranha marcada com
transmissor no Pantanal (Aquarela) durante a estação chuvosa de 2010. Pelas conversas e
histórias estimulantes para continuar pesquisando a espécie.
Aos piloteiros (cada um com uma virtude única): Waldomiro de Lima e Silva (Fuscão),
parceiro nas pesquisas desde o mestrado e profundo conhecedor do Pantanal; Sidnei Benício,
pela agradável companhia, piadas vitais para aguentar o mau humor sob calor e mosquitos
infernais e sua habilidade única em montar o jiqui durante as capturas; Procópio de Almeida,
pela disposição em desbravar brejos, abrir entupimentos de camalotes por horas, fazer trilhas
estratégicas para acessar lugares que poucos teriam coragem, e aguentar firme ao meu lado
enquanto onças nos rodeavam; Zé Augusto, pela disposição em seguir ariranhas em lugares que
jacarés não chegam; Paulo R. dos Santos, pela paciência em ficar horas sob o sol escaldante e
puxar o barco em longos trechos de areia pelo rio Negro à procura dos melhores momentos com
ariranhas.
Ao velho amigo Seu Geraldo pelos momentos de alegria e descontração durante as
atividades na BEP. Com certeza suas histórias e canções pantaneiras tornaram essa experiência
ainda mais especial.
Às cozinheiras (Cleide, Claudia, Sandra, Rosa, Ramona, Ingrid e tantas mais) que se
dispuseram a fazer marmitas matutinas que garantiam a energia da equipe durante o dia de
campo.
À fantástica equipe veterinária, que enfrentou mosquitos, frios e até onça. Em especial à
minha querida amiga, e competente profissional, Mariana Furtado, que nunca mediu esforços
para estar presente em todas as capturas, mesmo quando todos os aeroportos estavam fechados
devido ao mau tempo ou quando faltavam dias para a entrega de sua tese. Sem você Aquarela,
Risco e Pingüim não teriam sido capturados. Aos queridos Mario Ferraro Rego e Marina
Bueno que acompanharam as capturas com muita competência e disposição. Erika Hayashi que
tornou a campanha ―frustrada‖ de captura mais divertida.
Aos amigos que me acompanharam em campo. Nilo (o caçador de chapéu de couro),
Dedé (o rei do tereré), Luna (companheira de Estrada Parque), Paula Melges (―Magali‖),
Patrícia Mendonça (dona do canivete mais afiado do mundo), Zucco (ótimo assistente de

vii
câmera) e Carlos (o único que conheceu o aquário do Fuscão). À Ju que me ajudou a lavar
latrinas e Paula que também participou do ―atraente‖ processo de desossar peixes. Francisco
Neto pelo auxílio na identificação dos peixes.
Aos amigos geniosos Jorge e Victor Landeiro pela ajuda estatística e em especial aos
meus ―coorientadores‖ Zucco e Gustavo, sempre dispostos a ajudar seja com complexas funções
no R ou com formatações ―banais‖ no Word (não é Zucco?).
Carolina Ribas pela troca de experiências e aprendizado durante o doutorado e pelas
dicas importantes em momentos críticos.
Aos amigos Victor Sábato e Luciane Erdtmann pelas valiosas discussões virtuais sobre
acústica.
Ao Luiz Alberto Pellegrin pela ajuda na classificação das imagens para as análises e
elaboração de mapas.
Ubiratan Piovezan pelo empréstimo do microfone durante os primeiros meses de campo.
Nicole Duplaix pela ajuda em conhecer o idioma das ariranhas e por todo o incentivo nos
momentos finais.
Peter Crawshaw por me apresentar à Barranco Alto e a esse paraíso, que rendeu ótimos
resultados e amizades especiais. Pelas dezenas de cartas de recomendações, pelo apoio e atenção
em todos os momentos, pela amizade e carinho.
À querida amiga Claudia Gaigher que soube apresentar as ariranhas ao Brasil com todos
os méritos de uma grande repórter.
Ao amigo Luciano Candisani que com seu talento e olhos criativos eternizou momentos,
expressões e personagens especiais do ―universo ariranha‖.
À amiga Neiva Guedes pelos sábios conselhos e oportunidade de mostrar um pouco do
projeto aos seus alunos.
À minha família Corumbaense Pamela, Gustavo e Zucco, e ao novo integrante da
república Gustavo Gaertner por me acolherem com carinho.
Aos amigos Amazonense: Emília, Ulisses, Ricardo, Mariana Tolentino, Camila (Mila),
Andressa Scabin e a todos aqueles que marcaram as minhas rápidas estadas na cidade tropical:

viii
Anacy, Carine, Claudinha, Ju, Cida, Pedro, Rato, Marina, Fê Paim, Lu, Sandra, Anelise,
Anderson...
Aos amigos de Natal: Guiga, Adriana, Bernardo, Carlos, Gislene e Tida.
Aos amigos gaúchos: Line, Ju, Duda, Pitol, Gui e Harriet, que pegaram a estrada para
conhecer meu esconderijo.
Aos parceiros de trabalho, roda de cerveja e ombro amigo: Zucco, Tavinho, Gui, Alê,
Carol Ribas, PV, Dedé, Hugo, Wal, Bifão, Alessandro, Alan, Ismael (Gauchinho), Maca,
Nilo, Marcelo (Pelotas), Lydia (Frau Ameisenbär), Sil (parceria), Fran e Leopoldo, Vanessa
e Marcelo. Em especial às minhas amigas Grasi Porfírio, Pam, Carol Cheida e Ju por toda
cumplicidade e amizade.
Às minhas queridas tia Delci e vó Selma, que nos deixaram sem a oportunidade de
despedida, mas com ótimas recordações.
Ao meu irmão Carlos e minha cunhada Mariane por nos presentearem com uma
figurinha muito especial...À minha pequena grande princesa Valentina, que nunca deixe de
sonhar e buscar a realização de seus sonhos.
E o agradecimento especial àqueles que sempre acreditaram em mim, muito mais do que
eu mesma...
Ao meu companheiro de todas as horas e aventuras, Carlos Lehn, por todo amor e apoio,
por sempre estar disposto a me ajudar, como me resgatar em brejos e estradas atoladas de barro
ou me acompanhar por horas sob o sol escaldante para observar ariranhas; por aguentar firme ao
meu lado em todos os momentos, mesmo quando a saudade apertava.
Aos meus pais Dario e Anecy, que nunca mediram esforços para que eu realizasse meus
sonhos.
Sintam-se todos parte desta conquista.

ix
―Durante os últimos anos vivi em um ―universo paralelo‖, com figuras que me ensinaram
muito além da ciência. Aprendi que não basta fazer parte de um grupo, mas é preciso cooperar,
interagir e cuidar, fortalecendo os laços e garantindo a coesão. Foram momentos inesquecíveis,
que me deram forças para superar as dificuldades e querer saber cada vez mais. Nesta tese
compartilho com vocês um pouco do que aprendi com elas, que espero que contribua para o
conhecimento e conservação da espécie.‖

x
RESUMO
Ariranhas vivem em grupos coesos, que defendem ativamente territórios, durante a
estação seca. Durante o período de inundação, a ecologia espacial da espécie é pouco é
conhecida, quando acredita-se que os grupos abandonam seus territórios. Grupos de ariranhas são
coesão e territoriais, indicando que a espécie utilize um elaborado sistema de comunicação vocal,
para garantir a estabilidade e comunicação dentro e entre os grupos. O presente estudo teve como
objetivos gerais: 1) descrever o padrão de atividade de grupos de ariranhas no Pantanal; 2)
estimar o tamanho de área de vida e o padrão de seleção de habitat de grupos de ariranhas em um
ambiente sazonal; 3) compreender os efeitos da sazonalidade no tamanho de território e de
territórios exclusivos, e do comportamento territorial de grupos de ariranhas; 4) descrever o
repertório vocal da espécie, relacionando os tipos sonoros com o contexto comportamental em
que foram emitidos; 5) testar se sons de alarme apresentam características acústicas potenciais
para codificação individual. Dez grupos de ariranhas foram monitorados através de observações
diretas entre junho de 2009 e junho de 2011 nos rios Vermelho e Miranda, e outros sete grupos
foram monitorados no rio Negro entre setembro de 2009 e junho de 2011. Três machos adultos de
diferentes grupos foram monitorados com rádio-telemetria entre novembro de 2009 e junho de
2011 na primeira área de estudo. Armadilhas fotográficas foram armadas em locas e latrinas
ativas de oito grupos de ariranhas nas duas áreas de estudo, a fim de registrar atividades em ciclos
de 24-h. Vocalizações e o comportamento dos emissores foram gravados ao longo das
campanhas. Os grupos apresentaram um padrão de atividade crepuscular e diurno, mas 31% dos
registros de armadilhas fotográficas ocorreram no período noturno. A área de vida dos grupos foi
de 4 a 59 vezes maior no período chuvoso e alguns grupos abandonaram seus territórios durante a
inundação. Alguns grupos sobrepuseram os limites de seus territórios com grupos vizinhos. O
tamanho dos territórios foi correlacionado com o tamanho do grupo em ambas as estações. O
tamanho dos territórios exclusivos foi negativamente relacionado com a pressão de intrusos. O
repertório vocal da espécie foi classificado em 15 tipos sonoros emitidos em diferentes contextos.
Sons de alarme variaram significativamente entre grupos e indivíduos, com uma discriminação
maior entre fêmeas e machos, o que pode estar relacionado ao tamanho corporal dos emissores e,
consequente dimorfismo sexual.

xi
ABSTRACT
Spatial ecology and vocal communication of giant otters (Pteronura brasiliensis) in Pantanal
Giant otters live in cohesive groups, which defend territories during the dry season. Little
is known about the spatial ecology of the species during the flooding period, when it is believed
that groups abandon their territories. The strong cohesion between group members and the
territorial behavior of the species indicate that giant otters use a complex vocalization system, to
provide the stability and communication within and among groups. The present study aimed to:
1) to describe the activity pattern of giant otter groups in the Pantanal; 2) to estimate home range
size of groups and landscape selection patterns between dry and wet seasons in Pantanal; 3) to
look for the effect of season on territory size, territory exclusivity and territorial behaviour of
giant otter groups; 4) to describe the vocal repertoire of the species, according to the behavioral
context in which sound were emitted; and 5) to test if alarm sounds may present potential identity
coding. Ten giant otter groups were monitored through visual observations between June 2009
and June 2011 in the Vermelho and Miranda Rivers, and another seven groups were monitored in
the Negro River from September 2009 to June 2011. Three adult males of different groups were
monitored with radio-telemetry between November 2009 and June 2011 in the first study area.
Camera traps were located on active dens and latrines to record activity patterns in 24-h cycles.
Vocalizations and the behavior of senders were recorded during the field campaigns. Groups
presented a crepuscular and diurnal activity pattern, but 31% of photographic records occurred at
night. The home range size of groups increased from 4 to 59 times during the wet seasons and
some groups left their territories during flooding. Some groups overlapped the territories
boundaries of neighboring groups. Territory size was correlated with group size in both seasons.
The size of exclusive territories of giant otter groups was negatively related with intruder
pressure. The vocal repertoire of the species was classified from 15 sounds emitted in different
behavioral contexts. Alarm sounds varied significantly among groups and individuals, with a
higher discrimination between females and males, which may be related to the body size of the
senders and, consequently, sexual dimorphism.

xii
SUMÁRIO
Agradecimentos .......................................................................................................................... v
Resumo ....................................................................................................................................... x
Abstract ...................................................................................................................................... xi
Sumário ..................................................................................................................................... xii
Lista de Tabelas ........................................................................................................................ xv
Lista de Figuras ...................................................................................................................... xviii
Introdução Geral ......................................................................................................................... 1
Objetivos ..................................................................................................................................... 6
CAPÍTULO 1 ................................................................................................................................. 7
Activity patterns of giant otters recorded by telemetry and camera traps .................................. 8
ABSTRACT ........................................................................................................................... 9
RESUMO ............................................................................................................................. 10
2. MATERIALS AND METHODS ..................................................................................... 12
3. RESULTS ........................................................................................................................ 16
4. DISCUSSION .................................................................................................................. 18
5. ACKNOWLEDGMENTS ............................................................................................... 20
6. REFERENCES ................................................................................................................. 21
FIGURE CAPTIONS ........................................................................................................... 25
CAPÍTULO 2 ............................................................................................................................... 29
Space use by giant otter groups in the Brazilian Pantanal ........................................................ 30
MATERIAL AND METHODS ........................................................................................... 33
RESULTS ............................................................................................................................ 39
DISCUSSION ...................................................................................................................... 42

xiii
ACKNOWLEDGMENTS ................................................................................................... 46
RESUMO ............................................................................................................................. 47
LITERATURE CITED ........................................................................................................ 48
FIGURE LEGENDS ............................................................................................................ 57
TABLES ............................................................................................................................... 60
CAPÍTULO 3 ............................................................................................................................... 65
Territoriality of giant otter groups in an area with seasonal flooding ...................................... 66
Abstract ................................................................................................................................ 66
Resumo ................................................................................................................................. 67
Introduction .......................................................................................................................... 69
Material and Methods .......................................................................................................... 71
Results .................................................................................................................................. 74
Discussion ............................................................................................................................ 76
Acknowledgments ................................................................................................................ 80
References ............................................................................................................................ 81
Figure Legends ..................................................................................................................... 86
Table Legends ...................................................................................................................... 89
CAPÍTULO 4 ............................................................................................................................... 92
A sentence is more than the sum of its words: vocal repertoire of the giant otter .................... 93
METHODS .......................................................................................................................... 96
RESULTS .......................................................................................................................... 101
DISCUSSION .................................................................................................................... 111
ACKNOWLEDGMENTS ................................................................................................. 115
Resumo ............................................................................................................................... 116
REFERENCES ................................................................................................................... 117

xiv
FIGURE LEGENDS .......................................................................................................... 123
TABLES ............................................................................................................................. 133
CAPÍTULO 5 ............................................................................................................................. 136
Acoustic variation in giant otter alarm calls ........................................................................... 137
METHODS ........................................................................................................................ 140
RESULTS .......................................................................................................................... 144
DISCUSSION .................................................................................................................... 145
ACKNOWLEDGMENT .................................................................................................... 148
Resumo ............................................................................................................................... 149
REFERENCES ................................................................................................................... 150
FIGURE LEGENDS .......................................................................................................... 156
TABLES ............................................................................................................................. 159
Síntese ..................................................................................................................................... 162
Referências bibliográficas ....................................................................................................... 166
Apêndices I a VIII ................................................................................................................... 181

xv
LISTA DE TABELAS
CAPÍTULO 2 -
Table 1 - Home-range size (km2) and overlapped area (km
2 and %) between dry (DS)
and wet (WS) seasons of ten giant otter groups (ID=G1-G4, G8-G13) monitored by
radio telemetry (RT) and direct observations (DO) from June 2009 to June 2011, in
southern Pantanal, Brazil. Home ranges were estimated with k-LoCoh (isopleths 98%,
95% and 50%) and Kernel ad hoc (h=80 for dry season and h=100 for wet season)
methods.
........60
Table 2 - Linear home-range estimate (km) of ten giant otter groups monitored by
radio-telemetry (RT) and direct observation (DO), during four seasons (DS 2009 - dry
season of 2009, WS 2010 - wet season of 2010, DS 2010 - dry season of 2010, WS
2011- wet season of 2011), from June 2009 to June 2011, in the southern Pantanal of
Brazil.
........62
Table 3 - Ranking matrix of habitat types (RI – river, PO –pond, FO – forest, SW –
swamp, GL – grassland) selected by eight giant otter groups during the dry seasons,
from June 2009 to January 2011 in the southern Pantanal of Brazil. A) proportional
habitat use within group‘s kernel home ranges with proportion of total available habitat
types within study area; B) proportions of independent locations for each group in each
habitat type within group‘s kernel home range. Each mean element in the matrix was
replaced by its sign, a triple sign represents significant deviation from random at
P<0.05. Plus sign indicates that the habitat was positively selected.
........63
Table 4 – Number of dens and campsites built by ten giant otter groups in different
landscape features (SW – swamp, GL – grassland, SFL – seasonal flooded grassland,
FO – forest) during four seasons (DS 2009 – dry season of 2009, WS 2010 – wet
season of 2010, DS 2010 – dry season of 2010, WS 2011- wet season of 2011) from
June 2009 to June 2011, in the southern Pantanal of Brazil.
........64
CAPÍTULO 3 -
Table 1 – Percentage of territories (in rows) overlapped by the neighboring group‘s
territory (in columns) during each season (dry season of 2009, wet season of 2010, dry
........89

xvi
season of 2010, wet season of 2011) from June 2009 to June 2011, in the southern
Pantanal, Brazil. Group size is indicated in parentheses beside the group ID. (―-‖
indicates the absence of the group in the study area, * territory estimated based on
small number of locations, and not included in the analyses).
Table 2 - Territory total extension (TE) and exclusive territory (ET) of ten giant otter
groups monitored by radio-telemetry (RT) and direct observations (DO), during four
seasons (dry season of 2009, wet season of 2010, dry season of 2010, wet season of
2011), from June 2009 to June 2011, in the southern Pantanal, Brazil.
........90
Table 3 - Territory fidelity (% overlap of territories among seasons) of six giant otter
groups between consecutive seasons (columns 1-2) and between same season (high- or
dry) in different years (columns 3-4), monitored from June 2009 to June 2011, in the
southern Pantanal, Brazil. Dry season = DS; wet season = WS.
........91
CAPÍTULO 4 -
Table 1. Individual emission rates (number of sounds/hour) and proportions of giant
otter vocalizations given in different behavioral contexts (CC – close contact, GR –
grooming, SW – swimming, DE – within the den, SM – scent-marking, IS – isolation,
BE – begging, WD – warning/defense , IN – inquiry, AL – alarm, IA – intraspecific
agonistic encounter by adults (A), subadults (S), juveniles (J) and cubs (C) from six
groups. N is the number of sounds recorded, (groups) refers to the number of groups
that presented that particular sound type in its repertoire.
......133
Table 2. Descriptive statistics [X ±SD or median (minimum-maximum ranges)] of
sound types emitted by giant otters from six groups monitored from September 2009 to
June 2011 in the Southern Pantanal, Brazil. N represents the number of sounds used
for acoustic measurements, and the number of giant otters groups included in analyses
of each sound type is given in parentheses. (Sound – Co=coo, Cc=coo-call, Ch=coo-
hum, Hu=hum, Pu=purr, Gr=growl, Gr2=cub growl, So=snort, Ha=hah, Ac=adult call,
Sc=adult scream, Sc2=cub scream, Be=adult begging scream, Be2=cub begging
scream, Hs=adult high-scream, Hs2=cub high-scream, Cu=cub call, Sk=scream-gurgle,
Sq=squeak; Variables – CD=call duration, LF= lowest and HF=highest frequencies of
the sound, PF=peak frequency of the entire sound, Q3=3rd quartile frequency,
PU=number of pulses of the sound, FI=initial value of F0 (for harmonic sounds) or of
......134

xvii
the peak frequency (for non-harmonic sounds), FM=maximum value of F0 or PF,
FF=final F0 or PF, FM=maximum frequency of F0 or PF, FD=difference between the
highest and the lowest frequency of F0 or PF, D1=duration from the start of the
vocalisation to the highest frequency value of F0 or PF, D2=duration from the highest
F0 or PF to the end of the vocalisation, and PD=plateau duration (when F0 or PF did
not varied), *temporal units in seconds (s), frequency units in kHz).
CAPÍTULO 5 -
Table 1 – Number of snorts recorded from giant otters living in 8 groups (Group
ID=G1, G2, G10, G12, G17-G20) located in the Miranda (Mir), Vermelho (Ver), EPP
road (EPP) and Negro (Neg) Rivers in the Southern Pantanal, Brazil. Additional
information of each individual are presented as sex (M=male, F=female), hierarchical
status (D=dominant, S=subordinate) and group size, which varied during the study
period.
......159
Table 2 – Coefficient of variation (CV) average and potential for individual identity
coding (PIC) of ten acoustic parameters (CD – call duration, PU – number of pulses,
PF – peak frequency, Q3F – 3rd quartile frequency, F1-F5 – frequency of formants 1-5
and DF – formant dispersion) measured from 197 snorts vocalized by 20 giant otters (8
males and 11 females) distributed in 8 groups localized two study areas in the Southern
Pantanal, Brazil. CV and PIC are presented within study areas (CViare, PICare),
among groups (CVigro, PICgro), among individuals (CViind, PICind), between sex
(CVisex, PICsex) and the total coefficient of variation (CVtot).
......160
Table 3 – Results of the differences (ANOVA) between the snort formant frequencies
(F1-F5) and formant dispersion (DF) of giant otter females and males. Mean and
standard deviation (SD) are given in Hz.
......161

xviii
LISTA DE FIGURAS
CAPÍTULO 1 -
Fig. 1. ― Map of the study area showing the location of camera traps at dens
(triangles) and latrines (squares) of groups of giant otters on the Miranda and
Vermelho Rivers (a) and on the Negro River (b) in the southern Brazilian Pantanal.
…..25
Fig. 2. ― Giant otter activities recorded by camera traps positioned at dens and latrines
in the Miranda, Vermelho and Negro Rivers, in the southern Brazilian Pantanal. a)
(EN) entering the den, b) (EX) exiting the den (see arrow), c) (SMD) scent-marking
and/or using the latrines at the den (arrow), d) (SML) scent-marking and/or latrine use
at latrines distant from the den.
…..26
Fig. 3. ― Diurnal (05:00 – 19:00 h) activity patterns of three groups of giant otters
monitored by radio telemetry in the Miranda and Vermelho Rivers, southern Brazilian
Pantanal, between November 2009 and June 2011. The numbers above each bar
indicate the sample size for that hourly period. ID – in the den; RC – resting outside
the den; SI – social interactions; SML – scent-marking and/or latrine use at latrines
distant from the den; SMD – scent-marking and/or latrine use at the den; SW –
swimming; FS – fishing.
…...27
Fig. 4. ― Patterns of den use and scent-marking of giant otters recorded by camera
traps positioned at dens and latrines (June 2010; December 2010 to October 2011) in
the Miranda, Vermelho and Negro rivers, southern Brazilian Pantanal. The proportions
are relative to the total number of records for each behaviour (n = 456). EN – entering
at den, EX – exiting from den, SMD – scent-marking and/or latrine use at the den,
SML – scent-marking and/or latrine use at latrines distant from the den. The gray area
in the graph indicates the period of nighttime darkness.
.......28
CAPÍTULO 2 -
Figure 1 – Cumulative estimated area used (LoCoh 100%) in relation to the number of
chronological locations of three groups of giant otters radio-tracked from November
2009 to June 2011, in the southern Pantanal of Brazil.
.......57
Figure 2 – Seasonal home ranges of three giant otter groups monitored by radio .......58

xix
telemetry between November 2009 and June 2011, in the southern Brazilian Pantanal.
Upper figures: k-LoCoh 98% of (a) group G2, (b) group G10, and (c) group G12. The
black arrow indicates the location of the reduced home-range of group G12 during the
dry season. Lower figures: Kernel 95% of (d) group G2; (e) group G10; (f) group G12.
Figure 3 – Results of eigenanalysis of landscape-element selection ratio by giant otter
groups for six landscape elements (FO – Forest, PO –ponds, GL – grassland, SFG –
seasonal flooded grassland, SW – swamp, RI – river), from June 2009 to June 2011 in
the southern Brazilian Pantanal. (a) During the dry season (groups G1–G4, G8–G10,
G12) and (b) during the wet season (groups G1–G3, G10, G12). Upper graphs show
the landscape-element loadings on the first two factorial axes and lower graphs show
the groups' scores on the first factorial plane.
.......59
CAPÍTULO 3 -
Figure 1 – Territory extent of 13 giant otter groups (G1-G13) monitored between July
2006 and November 2007 (Leuchtenberger & Mourão 2008), and from June 2009 to
June 2011 (this study), on the Miranda and Vermelho Rivers, in the southern Brazilian
Pantanal. Parts a, b and c were modified from Leuchtenberger & Mourão 2008.
........86
Figure 2 – Water level in the Miranda River in the Brazilian Pantanal during the study.
The dotted line indicates the limit between dry (river within its banks) and wet
(floodplain inundation) seasons. Agonistic events between giant otters groups are
indicated by triangles (warning vocalizations) and circles (fights).
........88
CAPÍTULO 4 -
Figure 1. Map of the study area, presenting the Miranda and Vermelho Rivers, located
in the Southern Pantanal in Brazil.
Figure 2. Measurements of acoustic parameters of a giant otter's coo-hum call: A)
Oscillogram used to measure the total call duration (CD); the duration (D1) from the
start of the vocalisation to the highest value of the fundamental frequency (F0) or Peak
frequency (PF); the duration (D2) from the highest frequency of F0 or PF to the end of
the vocalisation; and the plateau duration (PD), when the frequency of F0 or PF did not
vary. B) On the Spectrogram (winodw size 512) we measure the lowest frequency (LF)
of the sound; the highest frequency (HF) of the sound; the difference (FD) between HF
and LF; the initial frequency (FI) of F0 or PF of the sound; final frequency (FF) of F0
......123
.......124

xx
or PF; and the maximum frequency (FM) of the FO or PF. C) Zoom view of a stretch
of the oscillogram presenting the measurement of the inter-pulse interval to estimate
the number of pulses. D) Power spectrum presenting the measurement of the peak
frequency (PF) of the selection.
Figure 3. Dendrogram of the hierarchical-cluster relationship of the 19 sounds (N=458
vocalizations) emitted by giant otters distributed in 9 groups in the Southern Pantanal,
from November 2009 to June 2011.
......125
Figure 4. Spectrograms and oscillograms (bottom) of vocalizations emitted by giant
otters in the southern Pantanal of Brazil: a) coo (FFT=1024), b) coo-hum (FFT=1024),
c) coo-call (FFT=1024), d) hum (FFT=1024), e) purr (FFT=512), f) adult growl
(FFT=512) , g) cub growl (FFT=512, note scale difference in frequency), h) snort
(FFT=512, arrows indicate formants), i) hah (FFT=512), j) adult call (FFT=512, note
scale difference in frequency), l) adult scream (FFT=1024), m) cub scream
(FFT=1024).
.......126
Figure 5. Spectrograms and oscillograms (bottom) of vocalizations emitted by giant
otters in the southern Pantanal of Brazil: a) cub begging scream (FFT=1024), b) adult
high-scream (FFT=1024, arrows indicate subharmonics and a biphonation), c) cub
high-scream (FFT=1024), d) cub call (FFT=512), e) scream-gurgle (FFT=512, note
scale difference in frequency), f) squeak (FFT=512).
.......128
Figure 6. Spectrograms and oscillograms (bottom) of vocalizations emitted by giant
otters in the southern Pantanal of Brazil: a) combination between hum and purr sounds
(hum-purr, FFT=1024), b) combination between hum and growl sounds (hum-growl,
FFT=1024), c) gradation among affiliative sounds (coo, coo-hum and hum-purr,
FFT=1024), d) sequence of snort-hahs (indicated by arrows)-snort (FFT=512), e) adult
call with harsh, noisy ending (arrow indicates the transition, FFT=512), f) cub call with
harsh, noisy ending (arrow showing the transition, FFT=512), g) adult scream with
harsh, noisy ending (arrow indicates the transition, FFT=512), h) transition of adult
calls (arrows) and adult scream vocalized during agonistic encounter (FFT=1024), i)
transition between cub high-scream and cub scream (arrow indicates the transition,
FFT=1024).
.......129
Figure 7. Biplots of the relationship between the first and second axes (a) and the first .......131

xxi
and third axes (b) of the principal coordinate analysis of 19 sound types vocalized by
giant otters in different behavioral context (AL-alarm, WD-warning/defense, IN-
inquiry, BE-begging, IS-isoltaion, DE-within den, CC-close contact) represented by
different colors (see legend above the graphs). Small letters refer to the different sound
types (co=coo, cc=coo-call, ch=coo-hum, hu=hum, pu=purr, gr=growl, gr2=cub growl,
so=snort, ha=hah, ac=adult call, sc=adult scream, sc2=cub scream, be=adult begging
scream, be2=cub begging scream, hs=adult high-scream, hs2=cub high-scream, cu=cub
call, sk=scream-gurgle, sq=squeak) and the capital letters (in black) indicate the sound
features analyzed (CD=call duration, LF= lowest and HF=highest frequencies of the
sound, PF=peak frequency of the entire sound, Q3=3rd quartile frequency, PU=number
of pulses of the sound, FI=initial value of F0 (for harmonic sounds) or of the peak
frequency (for non-harmonic sounds), FM=maximum value of F0 or PF, FF=final F0
or PF, FM=maximum frequency of F0 or PF, FD=difference between the highest and
the lowest frequency of F0 or PF, D1=duration from the start of the vocalization to the
highest frequency value of F0 or PF, D2=duration from the highest F0 or PF to the end
of the vocalization, and PD=plateau duration (when F0 or PF did not varied)).
CAPÍTULO 5 -
Figure 1. Map of the study area showing the limits of linear territories (dot ellipsis) of
eight giant otter groups (G1, G2, G10, G12, G17 – G20) monitored from September
2009 to June 2011 in the Southern Pantanal of Brazil.
.......156
Figure 2. Spectrogram and oscillogram (bottom) of snorts vocalized by a giant otter
dominant female (a) and a dominant male (b). Arrows indicate the five formants (F1-
F5) that present higher energy in the frequency spectrum.
.......157
Figure 3. Biplot of the relationship (a) between the first and second components and
(b) between the first and third components of the PCA of 197 snorts emitted by 20
giant otters distributed in 8 giant otter groups, monitored from September 2009 to June
2011 in the Southern Pantanal. The biplots are presented in relation to three grouping
factors: 1) giant otter groups (G1, G2, G10, G12, G17 – G20); 2) individuals (see
Table 1 for the identity code of individuals); 3) sex (1=Female, 2=Male). Ellipses
represent standard deviation of factors. The single numbers and names represent the
centroid of the sample of each group and individual, respectively. Arrows in a.3 and
.......158

xxii
b.3 indicate the loadings of acoustic variables (CD=call duration, PU=number of
pulses, PF=peak frequency, Q3=3rd
quartile frequency, F1-F5=frequency of formants
and DF=formant dispersion).

1
INTRODUÇÃO GERAL
Ariranhas (Pteronura brasiliensis; Zimmermann, 1780), são sociais e são consideradas as
maiores lontras do mundo (Kruuk, 2006). A espécie é endêmica da América do Sul e, devido
principalmente à caça ilegal que ocorreu até meados da década de 80, muitas populações de
ariranhas foram dizimadas ou reduzidas a valores críticos (Schweizer, 1992; Carter & Rosas,
1997) Atualmente no Brasil,populações estáveis e em recuperação da espécie parecem ser
limitadas ao Pantanal e à Bacia Amazônia (Leuchtenberger & Mourão, 2008; Rosas et al., 2008).
No entanto, devido ao crescimento populacional humano, destruição de habitat, entre outros
fatores como a superexploração da pesca, contaminação dos corpos d‘água, caça ilegal, turismo
desordenado e comercialização de filhotes como animais de estimação (Gómez et al., 1999;
Lima, 2009as ariranhas são classificadas como em perigo de extinção na lista vermelha da IUCN
(2011) e como vulneráveis no Brasil (Rosas et al. 2008).
Ariranhas vivem em grupos monogâmicos, formados por um casal dominante não
relacionado geneticamente e parentes próximos (Duplaix, 1980; Ribas 2012). No entanto, o grau
de parentesco entre os indivíduos do grupo é variável e alguns grupos podem ser formados por
indivíduos sem relação genética (Ribas, 2012). Os grupos estão organizados sob cooperação
reprodutiva e compreendem de dois a 20 indivíduos (Duplaix, 1980; Schweizer, 1992). Machos
dominantes apresentam um papel importante na defesa do grupo e do território (Duplaix 1980),
uma vez que se envolvem com maior frequência na demarcação territorial e sobremarcam o
cheiro dos demais indivíduos do grupo (Leuchtenberger & Mourão 2009). Fêmeas dominantes
são responsável pelo coordenação das atividades do grupo e são reconhecidas durante o período
reprodutivo por apresentarem estado de lactação (Duplaix, 1980).
Ariranhas se alimentam principalmente de peixes, podendo eventualmente consumir
invertebrados e outros vertebrados (Duplaix, 1980; Rosas et al. 1999). A espécie pode se
alimentar de presas maiores, como jacarés do Pantanal (Caiman yacare), como observado em
grupos que habitavam lagos artificiais ao longo da Estrada Parque do Pantanal, o que pode ser um
efeito da escassez de recursos e do aumento da densidade populacional da área (Ribas et al.
2012). Os indivíduos se orientam visualmente para capturar seu alimento (Duplaix, 1980, Rosas

2
et al., 1999), o que parece limitar a atividade da espécie ao período diurno (Schweizer, 1992;
Kruuk, 2006).
Os grupos são fortemente coesos e realizam grande parte de suas atividades diárias em
conjunto (Duplaix, 1980; Leuchtenberger & Mourão, 2008). As atividades iniciam quando o
grupo deixa a sua loca ao amanhecer e encerram no final do dia com o retorno do grupo ao
refúgio (Duplaix, 1980; Schweizer, 1992; Staib, 2005). Estudos sobre a atividade da espécie são
limitados a observações oportunísticas e de animais em cativeiro (Duplaix, 1980; Staib, 2005;
Carter & Rosas, 1997), o que dificulta a detecção de padrões temporais em condições naturais.
Em ambientes sazonais, grupos de ariranhas mantêm territórios ao longo dos corpos
d‘água durante o período seco (Duplaix, 1980; Laidler, 1984; Schweizer, 1992; Tomas et al.,
2000; Ribas, 2004; Utreras et al., 2005; Leuchtenberger & Mourão, 2008; Evangelista & Rosas,
2011a). Neste período, os peixes estão confinados ao leito dos rios, baías e corpos d'água
marginais (Wantzen et al., 2002) e os barrancos elevados proporcionam disponibilidade de
refúgios. O estabelecimento de territórios quando recursos importantes ainda estão disponíveis
em um ambiente sazonal pode garantir a manutenção dessas áreas ao longo das estações (Stamps,
1990). A familiaridade com o ambiente favorece o sucesso reprodutivo do dono da área, uma vez
que aumenta sua habilidade de forragear e de se mover em áreas mais seguras (Stamps, 1995).
Alterações sazonais na disponibilidade de recursos e de habitat podem afetar a
organização espacial e seleção de habitat de muitas espécies (Erlinge & Sandell, 1986; Arthur et
al., 1996), levando algumas delas a aumentar a sua área de vida e outras a abandonarem seus
territórios durante a estação desfavorável (Stamps, 1990; Maher & Lott, 2000). Durante a estação
chuvosa, a inundação das planícies e das áreas marginais aos rios causa a dispersão dos peixes e o
alagamento dos barrancos (Wantzen et al. 2002). Segundo Duplaix (1980), durante a estação
chuvosa os grupos de ariranhas abandonam seus territórios, seguindo a migração de peixes para
as áreas inundadas e apenas os barrancos mais elevados são visitados, para a construção de locas
e latrinas comunais. Além disso, a dispersão dos grupos durante a estação chuvosa pode
ocasionar um aumento de 4 a 13 vezes nas suas áreas de vidas, como estimado por Utreras et al.
(2005) na Amazônia do Equador. O monitoramento da espécie durante o período de inundação,
no entanto, é ineficiente sem o uso de tecnologias adequadas e a possível alteração na
organização espacial dos grupos durante este período ainda é desconhecida.

3
Os grupos de ariranhas defendem ativamente seus territórios através de um sistema
avançado de comunicação, que envolve sinais olfativos e acústicos (Duplaix, 1980; Ribas &
Mourão, 2004; Leuchtenberger & Mourão, 2009). Encontros agonísticos entre grupos de
ariranhas e solitários, como também canibalismo, registrados no Pantanal (Schweizer, 1992;
Mourão & Carvalho, 2001; Ribas & Mourão, 2004; Leuchtenberger & Mourão, 2009) ressaltam
o comportamento territorial da espécie. Marcações de cheiro e latrinas comunais são depositados
ao longo dos barrancos em acampamentos e locas (Carter & Rosas, 1997). Sinais químicos são
eficientes para demarcação territorial uma vez que transmitem informações sobre o dono do
território, mesmo na sua ausência (Gosling, 1982) e geralmente são depositados em locais onde
há uma maior pressão de intrusos (Sillero-Zubiri & Macdonald, 1998). Sinais químicos parecem
exercer um importante papel na comunicação entre indivíduos e grupos de ariranhas e podem
representar um mecanismo de supressão reprodutiva dos indivíduos subordinados
(Leuchtenberger & Mourão, 2009).
A forte coesão social entre os indivíduos do mesmo grupo e o comportamento territorial
da espécie podem ser sustentados por um elaborado sistema de comunicação vocal, que garanta a
estabilidade e comunicação entre os grupos (Schassburger, 1993). Entre os mustelídeos, ariranhas
(Pteronura brasiliensis), lontras marinhas (Enhydra lutrisi) e texugos (Meles meles), apresentam
os sistemas de organização social mais complexos da família e seus repertórios vocais são os
mais variados (Duplaix, 1980; McShane et al., 1995; Wong et al.,1999). O conhecimento sobre o
repertório vocal de ariranhas é limitado ao estudo de Duplaix (1980), que descreveu
qualitativamente nove tipos sonoros emitidos em diferentes contextos sociais. Bezerra et al.
(2010) apresentou a descrição sonográfica de cinco dos tipos sonoros classificados por Duplaix
(1980) e sugeriram a possibilidade de variações individuais em sons de alarme (snort).Variações
acústicas podem carregar codificações individuais que facilitam a coordenação das atividades dos
indivíduos e podem proporcionar a coesão dos grupos (Janik & Slater 1998; Fitchel & Manser
2010). Tais variações são geralmente determinadas por características ambientais e genéticas
(Bradbury & Vehrencamp 1998), enquanto que algumas variações podem ser aprendidas e
fixadas através do comportamento, criando padrões de variação acústicas geográfica (Mitani et
al. 1999; Collins & Terhune 2007; Delgado 2007), entre grupos e indivíduos (Weilgart &
Whitehead 1997; Boughman 1998; Janik & Slater 1998; Sousa-Lima et al. 2002, 2008; McComb
et al. 2003; Crockford et al. 2004).

4
Informações sobre a área de vida de uma espécie, as características ambientais e os
demais fatores que determinam a sua manutenção no espaço e no tempo, são ferramentas
importantes para ações de conservação. Além disso, o estudo do sistema de comunicação vocal e
de variações acústicas de uma espécie podem gerar informações sobre sua história de vida,
comportamento, bem como padrões de dispersão e isolamento genético de populações, o que
pode afetar decisões de manejo e conservação de espécies ameaçadas (Terry et al. 2005).
Considerando a complexidade de fatores que afetam a organização espacial e o sistema de
comunicação de ariranhas. Essa tese teve como objetivos gerais: 1) descrever o padrão de
atividade de grupos de ariranhas no Pantanal; 2) estimar o tamanho de área de vida de grupos de
ariranhas durante estações secas e chuvosas no Pantanal e comparar o padrão de seleção de
características da paisagem durante ambas as estações; 3) compreender os efeitos da sazonalidade
no tamanho de território e de territórios exclusivos, e do comportamento territorial de grupos de
ariranhas no Pantanal;; 4) descrever o repertório vocal da espécie no Pantanal, relacionando os
tipos sonoros com o contexto comportamental em que foram emitidos; 5) testar se sons de alarme
apresentam características acústicas potenciais para codificação idividual.
Sendo assim, a tese está organizada em cinco capítulos: Capítulo 1 – ―Activity patterns of
giant otters recorded by telemetry and camera traps‖, onde descrevemos o padrão de atividade de
grupos de ariranhas monitorados através de rádio telemetria e armadilhas fotográficas nos rios
Miranda, Vermelho e Negro, no Patnanal, apresentando registros de atividade noturna; Capítulo 2
– ―Space use by giant otter groups in the Brazilian Pantanal‖, no qual o tamanho da área de vida e
o padrão de seleção de habitat de diferentes grupos de ariranhas foram analisados em estações
secas e chuvosas nos rios Miranda e Vermelho, no Pantanal; Capítulo 3 – ―Territoriality of giant
otter groups in an area with seasonal flooding‖, neste capítulo analisamos o efeito da
sazonalidade na fidelidade dos grupos aos seus territórios, bem como no tamanho dos territórios e
territórios exclusivos, além de relações entre o tamanho de território com o número de sinais
químicos depositados por diferentes grupos, com o tamanho de grupo e com a pressão de
intrusos; Capítulo 4 – ―A sentence is more than the sum of its words: vocal repertoire of giant
otter‖, no qual descrevemos 15 tipos sonoros compondo o repertório vocal da espécie e o
contexto comportamental em que eles foram emitidos; Capítulo 5 – ―Acoustic variation in giant
otter alarm calls‖, neste capítulo analisamos variações acústicas presentes em sons de alarme de

5
diferentes grupos e indivíduos, apresentando discriminações acústicas significativas entre grupos,
indivíduos e entre machos e fêmeas.

6
OBJETIVOS
O presente estudo teve como objetivos gerais:
1) descrever o padrão de atividade de grupos de ariranhas no Pantanal;
2) estimar o tamanho de área de vida e o padrão de seleção de características da paisagem
de grupos de ariranhas em um ambiente sazonal;
3) compreender os efeitos da sazonalidade no tamanho de território e de territórios
exclusivos, e do comportamento territorial de grupos de ariranhas no Pantanal;
4) descrever o repertório vocal da espécie no Pantanal, relacionando os tipos sonoros com
o contexto comportamental em que foram emitidos;
5) testar se sons de alarme apresentam características acústicas potenciais para codificação
individual.

7
CAPÍTULO 1
_____________________________________________________________________________
Leuchtenberger, C; Zucco, C.A.; Ribas, C.; Magnusson, W. & Mourão,
G. Activity patterns of giant otters recorded by telemetry and camera
traps. Manuscrito submetido à Ethology Ecology & Evolution.

8
Activity patterns of giant otters recorded by telemetry and camera traps
CAROLINE LEUCHTENBERGER 1,2,4
, CARLOS ANDRÉ ZUCCO 2, 3
, CAROLINA RIBAS 1, 2
, WILLIAM
MAGNUSSON 1, GUILHERME MOURÃO
2
1 Programa de Pós-Graduação em Ecologia, Instituto Nacional de Pesquisas da Amazônia –
INPA, Av. André Araújo 2936, CP 478, CEP 69011-970, Manaus, AM, Brazil.
2 Laboratório de Vida Selvagem, Embrapa Pantanal, Rua 21 de Setembro, 1880, CEP 79320-
900, Corumbá, MS, Brazil.
3 Departamento de Ecologia, Universidade Federal do Rio de Janeiro, Av. Carlos Chagas Filho,
373 - Sala A027, CP 68020 - Ilha do Fundão, CEP 21941-902, Rio de Janeiro, RJ, Brazil.
4 Correponding author: Caroline Leuchtenberger, Postal address: Embrapa/Pantanal, Laboratório
de Vida Selvagem, 21 de Setembro, n. 1880, Bairro Nossa Senhora de Fátima, 79320-900,
Corumbá, MS, Brazil (E-mail: [email protected]).

9
ABSTRACT
The giant otter is a social species that defends territories along water bodies. Although some
researchers have visually monitored otters during long periods at night no nocturnal activity of
the species has been recorded and giant otters are currently believed to be strictly diurnal. In this
study, we present information about the activity patterns of groups of giant otters in the Pantanal of Brazil,
using radio telemetry and camera trap data. We captured, implanted transmitters and monitored three male
giant otters from different groups in the Miranda and the Vermelho Rivers between November 2009 and
July 2010. The locations and behavior of the group were recorded at 30-min intervals from 05:00 to 19:00
h. Camera traps were positioned at the active dens and latrines, located in the territories of eight groups of
giant otters in the rivers Miranda, Vermelho and Negro between June 2010 and October 2011. The groups
of giant otters were more crepuscular and diurnal, but 31% of the camera trap recordings were nocturnal.
Fishing was the most frequent (64%) behavior recorded by telemetry. Giant otters were recorded exiting
the den mostly in the early morning (06:00 h) and entering the den at the end of the day (16:00 to 19:00 h).
Nocturnal activity appeared to be associated with the need to defecate, prey availability nearby the den
and predation risk.
KEY WORDS: Pteronura brasiliensis, den, latrine, prey availability, predation risk, scent-mark, night
activity

10
RESUMO
Ariranha é uma espécie socia que defende territórios ao longo dos corpos d'água. Apesar
de alguns pesquisadores terem monitorado a espécie visualmente durante long visually monitored
otters during long periods at nigs períodos durante a noite, nenhuma atividade noturna foi
registrada e ariranhas são consideradas estritamente diurnas. Neste estudo, nós apresentamos
informações sobre padrões de atividade de grupos de ariranhas no Patnanal do Brasil, usando
dados de rádio telemetria e armadilhas fotográficas. Nós capturamos, implantamos transmissores
e monitoramos três machos adultos de ariranhas de diferentes grupos nos rios Vermelho e
Miranda entre Novembro de 2009 e Julho de 2010. As localizações e o comportamento do grupo
foram registrados em intervalos de 30 minutos entre 05:00 e 19:00 h. Armadilhas fotográficas
foram posicionadas em locas e latrinas ativas, localizadas nos territórios de oito grupos de
ariranhas nos rios Miranda, Vermelho e Negro entre Junho de 2010 e Outubro de 2011. Os
grupos de ariranhas foram mais crepusculares e diurnos, mas 31% dos registros de armadilhas
fotográficas foram noturnos. Pesca foi o comportamento mais frequente (64%) registrado por
telemetria. Ariranhas foram registradas saindo da loca com maior frequência no início da manhã
(06:00 h) e entrando na loca no final do dia (16:00 to 19:00 h). Atividade noturna parece estar
associada com a necessidade de defecar, disponibilidade de presas próximo à loca e risco de
predação.
PALAVRAS-CHAVE: Pteronura brasiliensis, loca, latrina, disponibilidade de presas, risco de predação,
marcação, atividade noturna

11
The activity pattern of most animals is related to circadian rhythms and periodical
changes in environmental stimuli (ASCHOFF 1966). Carnivores usually exhibit daily cycles of
activity, which seem to be a function of prey activity and feeding tactics (GERELL 1969;
ZIELINSKI 1988; LODE 1995). Some otters change activity patterns seasonally according to prey
availability (MELQUIST & HORNOCKER 1983; KRUUK 2006; GARCIA DE LEANIZ et al. 2006), and
individual variation in activity patterns may be a strategy to avoid intraspecific competition
(RALLS & SINIFF 1990).
The giant otter (Pteronura brasiliensis) is a social species that eats mainly fish (DUPLAIX
1980; ROSAS et al. 1999). Foraging is visually oriented, which seems to limit the species‘ activity
to daylight hours (KRUUK 2006). Information about giant otter activity patterns comes from direct
field observations and captive individuals (CARTER & ROSAS 1997; STAIB 2005).
Some authors have described that giant-otter groups leave their dens in the early morning,
scent-marking latrines near the den before they go fishing during the whole day and returning at
the end of the day to the main den, where they stay during the night (DUPLAIX 1980; SCHWEIZER
1992; CARTER & ROSAS 1997; STAIB 2005). Although some researchers have monitored visually
otters during long periods at night (DUPLAIX 1980; SCHWEIZER 1992), no nocturnal activity of the
species has been recorded and giant otters are currently believed to be strictly diurnal (DUPLAIX
1980; SCHWEIZER 1992; CARTER & ROSAS 1997; STAIB 2005).
Diurnal activity of giant otters involves territory patrolling and demarcation. Groups mark
their territories using communal latrines, which can be located at dens or at sites along the banks
(DUPLAIX 1980; LEUCHTENBERGER & MOURÃO 2009). Dens are tunnels systems built along river
banks, under roots or fallen trees, with one to seven entrances (DUPLAIX 1980; CARTER & ROSAS

12
1997). Giant otters may use different dens for resting at night and for temporary refuge during the
day. Therefore, the monitoring of dens and latrines can provide information on activity patterns
(SERVHEEN & KLAVER 1983; LIM AND NG 2008; STEVEN & SERFASS 2008).
Although radio telemetry and camera traps are wide used methods, these technologies
have just recently become more powerful tools for studying giant otters, improving the
monitoring of groups in the field and providing new information about the biology and ecology
of the species (UTRERAS & PINOS 2003; PICKLES et al. 2011; SILVEIRA et al. 2011). In this study
we used telemetry and camera trap data to describe the activity pattern of giant otters groups in
the Brazilian Pantanal wetlands.
2. MATERIALS AND METHODS
We studied giant otter activity in the southern Pantanal of Brazil. The region receives an
annual precipitation of about 1200 mm, with most of the rain falling between November and
March, providing a flooding season from December to June. Discharge of the rivers that flow
from surrounding uplands result in seasonal inundation of the Pantanal (HAMILTON et al. 1996).
This study was carried out at a site that includes a stretch of the Miranda River and its smaller
tributary, the Vermelho River (19o34‘S; 57
o01‘W), and a stretch of the Negro River (19
o34‘S; 56
o09‘W) about 60 km east of the Miranda River site.
2.1. Data collection
Activity patterns were described based both on radio telemetry and on camera trapping.
Between November 2009 and July 2010, we captured two dominant males and one adult
subordinate male (average of body weight 31 ±1.7 kg) from three different groups of giant otters
(coding of groups: G2, G10 and G12) in the Miranda and Vermelho Rivers. A funnel-shaped net
was used at the den entrance to capture animals, following techniques described by SILVEIRA et

13
al. (2011). The animals were immobilized chemically using a dosage of 2.0 mg/kg of a 1:1
combination of tiletamine and zolazepam (Zoletil®, Virbac, Carros-Cedex, France) and received
a complementary dosage of 1.5 mg/kg ketamine hydrochloride 10% (Vetaset®, Fort dodge,
Campinas, Brasil) combined with 0.25 mg/kg midazolam (Midapine®). Individuals were tagged
with intraperitoneally implanted transmitters (Advanced Telemetry System, Isanti, Minnesota),
weighting approximately 42 g (~0. 1% body weight). All the handling and surgical procedures
followed the guidelines of the American Society of Mammalogists for the use of wild mammals
in research (SIKES et al. 2011), and were authorized under permit no. 12794/4 of the Brazilian
Federal Environment Agency (IBAMA).
Tracking of radio-tagged animals was carried out from 05:00 to 19:00 h during 8 to 10
days every month, from November 2009 to June 2010 for the group G2 and from July 2010 to
June 2011 for the groups G10 and G12 (making a total of 153 monitored days). The animals were
radio-tracked by boat and their location recorded every 30-min. Since they were in the same area,
the groups of G10 and G12 were monitored in alternate periods (05:00 to 12:00 h or 12:30 to
19:00 h) in each day. Whenever visual observation was possible, the predominant behavior of the
majority of the group was observed and classified by focal group sampling (ALTMAN 1973) as: a)
fishing (FS), when the individuals were foraging or eating; b) swimming (SW), when the
individuals were seen moving through the area; c) scent-marking at the den (SMD), when the
individuals were scent-marking and/or using the latrines near den entrances; d) scent-marking at
latrines (SML), when the individuals were scent-marking and/or using a latrine far from the den
(i.e., usually >1000 m); e) social interaction (SI), considering all affiliative interactions between
members of the same group, such as grooming, cub caring and play; f) in the den (ID), when
individuals were in a den; and g) resting outside the den (RC), when individuals rested at sites
along the bank. Periods when animals could not be located were not included in the analysis. We

14
also conducted 20 nighttime radio tracking sessions (19:00 to 24:00 h), recording the same
behaviors in same monitoring intervals as described above.
Camera traps (Bushnell® Trophy Cam 8MP, Overland Park, KS) were positioned
monthly (during a period of 2 to 30 days) at the entrances of active dens and on latrines. We
monitored 10 dens and 13 latrines of six groups of giant otters (G2, G3, G9, G10, G12, G13; n =
35 individuals) in the Miranda and Vermelho Rivers in June 2010, from December 2010 to June
2011, and at four dens and one latrine near the den of two giant-otter groups (G18, G19; n = 7
individuals) in the Negro River between June and October 2011 (Fig. 1). The camera traps were
programmed to operate 24 h/day with 15 seconds-intervals between photographs and to record
the date and time of each shot. The behavior recorded by camera traps was classified as: a)
entering the den (EN), when the photographed individual was facing the den, b) exiting the den
(EX) when the individual was facing the water, c) scent-marking at the den (SMD) when the
individual was scent-marking and/or using the latrines at the den site, and d) scent-marking other
latrines (SML) when the individual was scent-marking and/or using latrines more than 1000 m
distant from dens (Fig. 2).
2.2. Data analysis
As photoperiod in our study area ranged from 10h57min length in winter to
13h19min in summer, we fitted all data in a common standardized diurnal time scale, in which
sunrise and sunset were fixed at 06:00 and 18:00 h respectively. Taking into account the actual
sunrise and sunset time of the date each photo was taken, we calculated through interpolation a
new time for that photograph in the standardized scale. This assured that, a photo taken near the
light threshold will always refer to the same standardized time, no matter if it was taken in mid-
summer or mid-winter. We used this standardized time in results and discussion. To determine
the activity pattern by camera trap method, we considered just the independent records.

15
Photographs of giant otters showing the same behavior at the same trap station were considered
independent only if taken at >30-min intervals. Activity patterns were, then, determined for each
method (radio-telemetry and camera trap) as the proportion of each behavior recorded in 1-h
intervals throughout the day, based on the standardized record times.
Additionally, considering only the camera trap records, we split the daily cycle in three
periods: day (07:00 – 17:00), night (18:30 – 05:30) and crepuscular (05:30 – 07:00 and 17:00 –
18:30), to test for differences in the use of the time. Electivity of each period was tested by
adapting the Ivlev Electivity index (IVLEV 1961), which is usually used to quantify an individual
or population preference for food types, taking into account the relative availability of food types
in the environment and their relative occurrence in the diet of organisms. We calculated ―relative
use‖ as the proportion of photo taken in a given period and ―relative availability‖ as the number
of hours of that period/24. We accessed the significance of the index by bootstrap resampling of
the photographs 1000 times. Resampling was performed with replacement and the same sample
size as the original sample.
We have been studying giant otters for eight years at the Miranda River site and for three
years at the Negro River. Therefore, most of individuals were recognizable based on their throat
and chest markings. Whenever possible, we identified group events from the complete series of
photographs as a set of consecutive records of different individuals performing the same
movement (in or out of the den) in a short interval of time (<10-min) at a given camera station.
Classification of these events required only the conclusion that more than half the group was
involved in the activity, and it was not necessary to identify each individual. The chronology of
group events was then used to estimate the time the group spent outside the den. In the case of
nighttime photographs, we identified individuals that moved in or out of the den to estimate the
time that they spent outside, and to determine which individuals scent-marked. This could not be

16
done in the daytime because the intense activity of the animals hindered our attempts to associate
specific activities to individuals. All the analyses were performed using R 2.13 software (R
Development Core Team).
3. RESULTS
We obtained 2323 behavioral records from telemetry data for the three marked groups
(G2, n = 956; G10, n = 801; G12, n = 566) between 05:00 and 19:00 h (Fig. 3). The overall time
budget recorded by telemetry was 64% fishing (FS, n =1477), 18% resting in a den (ID, n = 411),
5% swimming (SW, n = 118), 5% scent marking at a den (SMD, n = 110), 4% scent marking at a
latrine (SML, n = 96), 3% resting outside the den (RC, n = 81), and 1% social interactions (SI, n
= 30). FS was recorded more frequently between 07:00 and 11:00 h and from 14:00 to 16:00 h.
Scent-marking events (SMD and SML) were observed throughout the day, with higher peaks at
06:00 h for SMD and 18:00 h for SML. Activity at the den was recorded in higher proportion
(more than 40% of the behavior ID) at 05:00 h, before the animals left the den at the beginning of
the day and at 18:00 h, generally indicating the moment that animals entered the den at the end of
the day, with a lower peak of resting between 11:00 and 14:00 h. Resting outside the den
occurred more frequently at noon.
We obtained 1163 photographs (456 independent records) during a total camera trapping
effort of 362 camera days. However, our sample refers to 90 daily cycles, for which we had at
least one record. Photographs were taken at all the 28 trapping stations, with 17 stations having
more than 5 independent records and a single station with up to 84 independent records.
Most of the records were taken during the day (n = 215), however otter activity was
concentrated mostly in the crepuscular period (98 records, Ivlev index = 0.26, P<0.001), followed
by daylight (Ivlev index = 0.06, P<0.001), while night period was avoided (143 records, Ivlev

17
index = -0.19, P<0.001). Entering the den (EN) was the most common behavior, corresponding
to 34% (n= 153) of the records, followed by exiting the den (EX) with 30% (n = 135), scent-
marking at the den (SMD) with 26% (n = 119) and scent-marking at latrines (SML) with 11% (n
= 49) (Fig 4).
Giant otters were recorded exiting the den mostly in the early morning (06:00 h) and
entering the den at the end of the day (16:00 to 19:00 h). There were also peaks of entering and
leaving the den between 11:00 and 13:00 h and about two hours after dusk (20:00 – 22:00 h).
Peak scent-marking near the den coincided with the beginning of outdoor activity in the morning
and preceded den entering at the end of the day. A third peak was synchronous with movements
around the den in the early evening. Scent-marking at latrines far from dens occurred almost
exclusively during the day, peaking between 11:00 and 12:00 h. Pooling all the behaviors, 80%
(n = 114) of nocturnal activity outside the den occurred in the first half of the night (18:30 to
24:00 h).
All but one of the 51 group events identified in the photographs (n = 1163) occurred from
05:00 to 19:00 h. The average time groups spent outside the den during the daytime was 356 min
(SD=228). Coincidentally, the only nocturnal group event outside that period occurred at a den of
the group G10 during a nocturnal radio tracking session, enabling us to directly observe the
cause. The group members were surprised by a jaguar a few meters above the den entrance while
trying to enter the den at 18:16 h. The group immediately left the area, moving downstream to a
latrine, where they spent approximately 3-h before returning to the den only after 21:00 h.
In 19 nocturnal individual forays that we could confidently monitor with the camera traps,
individuals spent a median of 5 min outside the den (varying from 1 to 50 min). In 12 nocturnal
scent-marking events (from 28 photographic records) of which we were able to identify the

18
individual, four cases involved dominant females, three cases involved dominant males, three
cases of subordinate females, 2 cases of subordinate males and no records of immature otters.
During 20 nights of telemetry monitoring (between December 2010 and June 2011),
nocturnal fishing by the group G10 was observed on two occasions. Both events occurred during
the high-water season, which extended from February to June. On one of these events, a large
fish shoal migrating upriver passed in front of the den. One individual that had remained outside
the den at dusk vocalized ―coo‖ and ―hum-purr‖ sequences at the den entrance. The other group
members then left the den and fished successfully for about 20 minutes before returning to the
den. The second event was at the peak of the high-water season, when fish are usually scattered
and difficult to catch, and the group may have taken advantage of the light of the full moon for
fishing until about 21:00 h.
4. DISCUSSION
Giant otter activity was more intense during daylight (from 05:00 to 18:00 h), with more
animals exiting the den in the early morning and entering at dusk, as observed previously by
many authors (DUPLAIX 1980; LAIDLER 1984; SCHWEIZER 1992; CARTER & ROSAS 1997; STAIB
2005). Lower peaks in the den or resting at latrines were recorded during the day. DUPLAIX
(1980) observed that resting periods during the day followed fishing sequences and usually lasted
about 50 min, but could take up to 1.5-h. Direct observations indicated that fishing was the most
frequent activity recorded from 06:00 to 18:00 h, with peaks in the morning and mid-afternoon,
as observed in Peru (LAIDLER 1984). The resting peak at noon has been recorded previously in
the Pantanal (SCHWEIZER 1992) and among captive animals (CARTER & ROSAS 1997).
Scent-marking was more intense during the daytime, with the highest peak in den scent-
marking recorded by both methods in the early morning and a lower peak at dusk. SCHWEIZER

19
(1992) stated that groups of giant otters in the Negro River spent more time on territory
demarcation in the early morning. Like other otter species (MELQUIST & HORNOCKER 1983;
KRUUK 2006), giant otters scent-mark frequently throughout the day during foraging sessions.
Latrine scent-marking was recorded almost exclusively during the day, with higher peaks at noon
and on the end of the day. In Bolivia, camera traps positioned at giant otter latrines recorded
scent-marking events from 06:00 to 18:00 h, with higher peaks from 08:00 to 12:00 h and from
14:00 to 18:00 h (PICKLES et al. 2011).
Although several authors have spent many nights monitoring giant otters, no nocturnal
activity had previously been recorded (DUPLAIX 1980; SCHWEIZER 1992). In our study, 31% of
the activities recorded by camera traps corresponded to nocturnal activity at dens and latrines,
suggesting that the species is not exclusively diurnal, although groups seemed to avoid the
nocturnal period. Scent-marking activity at night may be associated with the passage of food
through the digestive tract, which takes about 3-h (CARTER et al. 1999), since the peak of
nighttime exiting the den was about 3-h after the peak of entering the den at dusk. Defecation by
one individual may trigger a similar response in other members of the group, as has been
observed in Lontra canadensis (MELQUIST & HORNOCKER 1983), but usually only one or two
giant otters left the den at any one time during the night.
Scent-marking is an important mechanism of communication among otters (ROSTAIN et
al. 2004; KRUUK 2006; KEAN et al. 2011). The scent-marking rate of giant otters plays an
important role in intraspecific defense and is related to the sexual and social status of group
members (LEUCHTENBERGER & MOURÃO 2009), which can lead to the reproductive suppression
of subordinate individuals. Therefore, scent-marking at night may be related with territorial
defense and may also be a strategy used by individuals to provide information about their
reproductive status and improve their fitness. However, we were unable to identify sufficient

20
individuals in nighttime photographs to fully support this explanation. In any case, it is notable
that immature otters were not recorded at night activities.
Activity patterns may be affected by predation risk (DALY et al. 1992). The presence of a
jaguar apparently prevented one group from entering a den and provoked a shift of about three
hours in their denning time. Otters can also change their activity because of individual strategies
(RALLS & SINIFF 1990), mainly due to prey availability (MELQUIST & HORNOCKER 1983; GARCIA
DE LEANIZ et al. 2006; KRUUK 2006). Giant otters are visually oriented (CARTER & ROSAS 1997)
and usually need daylight to find fishes that are motionless and/or hidden under banks. Although
our night observations were limited to the high-water season, the nocturnal fishing events
reported in this study may be due the high availability of prey provided by a fish shoal, and food
scarcity during the high water season. The ―coo‖ and ―hum-purr‖ sounds vocalized before a
fishing event seem to have been used to advise other members of a fishing opportunity. DUPLAIX
(1980) classified these sounds as close-contact vocalizations, which are used before departure
from the resting site or when the individuals are reunited after a brief absence during fishing
sequences.
The results reported here demonstrate that giant otters are not strictly diurnal, and further
studies should be undertaken to determine whether the same behaviors occur in other
populations.
5. ACKNOWLEDGMENTS
We thank CNPq (grant n. 476939/2008-9), the Rufford Small Grants Foundation (grant n.
88.08.09), the Mohamed bin Zayed Species Conservation Fund (project n. 10051040) and the
IDEA Wild for their financial support. We are also indebted to Embrapa Pantanal, Barranco Alto
Farm and the Federal University of Mato Grosso do Sul for their logistic support. Three of the

21
authors (C.L., C.A.Z. and C.R.) were recipients of CNPq scholarships. Paulo R. dos Santos,
Waldomiro de L. e Silva, Sidnei Benício, Procópio de Almeida and José A. D. da Silva assisted
us in the field. Lucas Leuzinger, Marina Schweizer and Jorge Schweizer helped with the camera
trap survey and aerial monitoring. Luiz G. R. O. Santos performed some of the data analysis.
Peter Crawshaw offered many useful suggestions and improved the English of a draft manuscript.
We are particularly grateful to Mariana M. Furtado, Mario A. F. Rego and Marina Bueno for
their unstinting assistance and support during the capture and surgical procedures.
6. REFERENCES
ASCHOFF J. 1966. Circadian activity pattern with two peaks. Ecology 47:657-662.
CARTER S.K. & ROSAS F.C.W. 1997. Biology and conservation of the giant otter Pteronura
brasiliensis. Mammal Review 27:1-26.
CARTER S.K., ROSAS F.C.W., COOPER A.B. & CORDEIRO-DUARTE A.C. 1999. Consumption rate,
food preferences and transit time of captive giant otter Pteronura brasiliensis: Implications for
the study of wild populations. Aquatic Mammals 25 (2):79-90.
DUPLAIX N. 1980. Observations on the ecology and behavior of the giant river otter Pteronura
brasiliensis in Suriname. Revue Ecologique (Terre Vie) 34:496-620.
DALY M., BEHRENDS P.R., WILSON M.I. & JACOBS L.F. 1992. Behavioral modulation of predation
risk: moonlight avoidance and crepuscular compensation in a nocturnal desert rodent, Dipodomys
merriami. Animal Behaviour 44:1-9.
GARCIA DE LEANIZ C., FORMAN D.W., DAVIES S. & THOMSON A. 2006. Non-intrusive monitoring
of otters (Lutra lutra) using infrared technology. Journal of Zoology 270:577-584.
GERELL R. 1969. Activity patterns of the mink Mustela vison Schreber in southern Sweden.
Oikos 20:451-460.

22
HAMILTON S.K., SIPPEL S.J. & MELACK J.M. 1996. Inundation patterns in the Pantanal wetland of
South America determined from passive microwave remote sensing. Archiv für Hydrobiologie
137:1-23.
IVLEV V.S. 1961. Experimental ecology of the feeding of fishes. Yale University Press, New
Haven, Connecticut, USA.
KEAN E.F., MÜLLER C.T. & CHADWICK E.A. 2011. Otter scent signals age, sex, and reproductive
status. Chemical Senses 36:555-564.
KRUUK H. 2006. Otters: Ecology, behavior and conservation. Oxford University Press Inc., New
York.
LAIDLER L. 1984. The behavioral ecology of the giant otter in Guyana. Master dissertation,
University of Cambridge.
LEUCHTENBERGER C. & MOURÃO G. 2009. Scent-marking of giant otter in the Southern Pantanal,
Brazil. Ethology 115:210-216.
LIM N.T.L. & NG P.K.L. 2008. Home range, activity cycle and natal den usage of a female Sunda
pangolin Manis javanica (Mammalia: Pholidota) in Singapore. Endangered Species Research
4:233-240.
LODE T. 1995. Activity pattern of polectas Mustela putorius L. in relation to food habits and prey
activity. Ethology 100:295-308.
MELQUIST W. E. & HORNOCKER M.G. 1983. Ecology of river otters in west Central Idaho.
Wildlife Monographs 83:1-60.
PICKLES R., ZAMBRANA V., JORDAN B., HOFFMANN-HEAP I., SALINAS A., GROOMBRIDGE J. &
DAMME P.V. 2011. An evalutaion of the utility of camera traps in monitoring giant otter
populations. IUCN Otter Specialist Group Bulletin 28:39-45.

23
RALLS K. & SINIFF D.B. 1990. Time budget and activity patterns in California sea otters. The
Journal of Wildlife Management 54:251-259.
ROSAS F.C.W., ZUANON J.A.S. & CARTER S.K. 1999. Feeding ecology of the giant otter,
Pteronura brasiliensis. Biotropica 31:502-506.
ROSTAIN R.R., BEN-DAVID M., GROVES P. & RANDALL J.A. 2004. Why do river otters scent-
mark? An experimental test of several hypotheses. Animal Behaviour 68:703-711.
SCHWEIZER J. 1992. Ariranhas no Pantanal: Ecologia e comportamento de Pteronura brasiliensis.
Edibran-Editora Brasil Natureza Ltda, Curitiba, Paraná.
SERVHEEN C. & KLAVER R. 1983. Grizzly bear dens and denning activity in the Mission and
Rattlesnake Mountains, Montana. Bears: Their Biology and Management 5:201-207.
SILVEIRA L., FURTADO M.M., ROSAS F.C.W., SILVA L.C., CABRAL M.M.M., TORRES N.M.,
SOLLMANN R., KOUBA A. & JÁCOMO A.T.A. 2011. Tagging giant otters (Pteronura brasiliensis)
(Carnivora, Mustelidae) for radio-telemetry studies. Aquatic Mammals 37:208-212.
SIKES R.S., GANNON W.L. & THE ANIMAL CARE AND USE COMMITTEE OF THE AMERICAN SOCIETY
OF MAMMALOGISTS. 2011. Guidelines of the American Society of Mammalogists for the use of
wild mammals in research. Journal of Mammalogy 92:235-253.
STAIB E. 2005. Eco-Etología del Lobo de Río (Pteronura brasiliensis) en el Sureste del Perú.
PhD Tesis. Sociedad Zoológica de Francfort Perú.
STEVENS S.S. & SERFASS T.L. 2008. Visitation patterns and behavior of nearctic river otters
(Lontra canadensis) at latrines. Northeastern Naturalist 15:1-12.
UTRERAS V. & PINOS L. 2003. Camera trap use for studying giant otters (Pteronura brasiliensis)
in the Yasuní Biosphere Reserve, Ecuadorian Amazon. IUCN Otter Specialist Group Bulletin
20:12-13.

24
ZIELINSKI W.J. 1988. The influence of daily variation in foraging cost on the activity of small
carnivores. Animal Behaviour 36:239-249.

25
FIGURE CAPTIONS
Fig. 1. ― Map of the study area showing the location of camera traps at dens (triangles) and
latrines (squares) of groups of giant otters on the Miranda and Vermelho Rivers (a) and on the
Negro River (b) in the southern Brazilian Pantanal.

26
Fig. 2. ― Giant otter activities recorded by camera traps positioned at dens and latrines in the
Miranda, Vermelho and Negro Rivers, in the southern Brazilian Pantanal. a) (EN) entering the
den, b) (EX) exiting the den (see arrow), c) (SMD) scent-marking and/or using the latrines at the
den (arrow), d) (SML) scent-marking and/or latrine use at latrines distant from the den.

27
Fig. 3. ― Diurnal (05:00 – 19:00 h) activity patterns of three groups of giant otters monitored by
radio telemetry in the Miranda and Vermelho Rivers, southern Brazilian Pantanal, between
November 2009 and June 2011. The numbers above each bar indicate the sample size for that
hourly period. ID – in the den; RC – resting outside the den; SI – social interactions; SML –
scent-marking and/or latrine use at latrines distant from the den; SMD – scent-marking and/or
latrine use at the den; SW – swimming; FS – fishing.
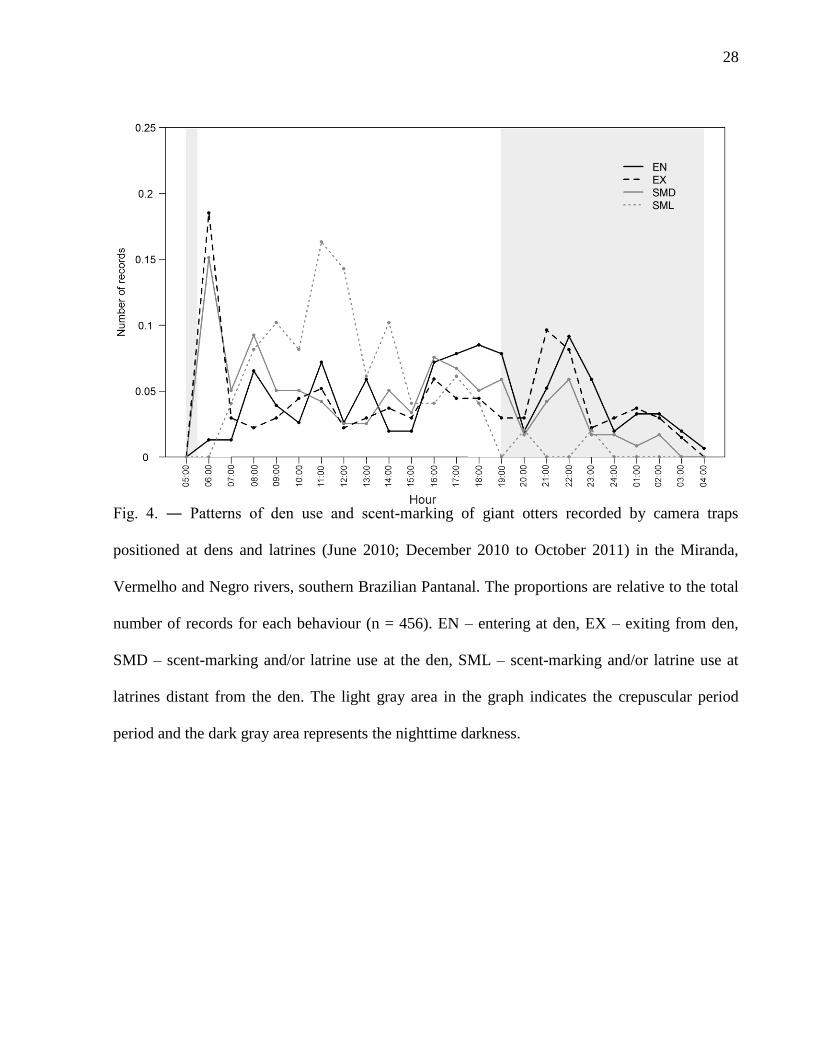
28
Fig. 4. ― Patterns of den use and scent-marking of giant otters recorded by camera traps
positioned at dens and latrines (June 2010; December 2010 to October 2011) in the Miranda,
Vermelho and Negro rivers, southern Brazilian Pantanal. The proportions are relative to the total
number of records for each behaviour (n = 456). EN – entering at den, EX – exiting from den,
SMD – scent-marking and/or latrine use at the den, SML – scent-marking and/or latrine use at
latrines distant from the den. The light gray area in the graph indicates the crepuscular period
period and the dark gray area represents the nighttime darkness.
29
CAPÍTULO 2
_____________________________________________________________________________
Leuchtenberger, C; Oliveira-Santos, L.G.; Magnusson, W. & Mourão, G.
Space use by giant otter groups in the Brazilian Pantanal. Journal of
Mammalogy (no prelo).

30
Space use by giant otter groups in the Brazilian Pantanal
Caroline Leuchtenberger*, Luiz Gustavo Rodrigues Oliveira-Santos, William Magnusson &
Guilherme Mourão
(CL) – Graduate Program in Ecology, Instituto Nacional de Pesquisas da Amazônia - INPA,
Brazil and Laboratory of Wild Life, Embrapa Pantanal, Brazil
(LGROS) – Department of Ecology, Federal University of Rio de Janeiro, Brazil
(WM) - Laboratory of Vertebrate Ecology, National Institute of Amazonian Research – INPA,
Brazil
(GM) - Laboratory of Wild Life, Embrapa Pantanal, Brazil
Giant otters (Pteronura brasiliensis) are social and feed mainly on fish. Information on
the spatial organization of giant otters is limited to dry-season observations. However, groups
may abandon their territories to follow spawning fish into flooded areas during the wet season.
Therefore, we studied the spatial ecology of giant otter groups during dry and wet seasons in the
Vermelho and Miranda Rivers in the Brazilian Pantanal. We monitored 10 giant otter groups
monthly from June 2009 to June 2011. Locations of dens, campsites and visual observations of
the groups were recorded. Three of the groups were monitored monthly by radio-telemetry
between November 2009 and June 2011 during daylight hours and their locations were recorded
at 30 minute intervals. We estimated home-range size for all groups with the following methods:
(1) linear river length, considering the extreme locations of each group, and (2) fixed kernel. For
the radio-tracked groups, we also used (3) the k-LoCoh method. Spatial fidelity was calculated as
the percentage of home range and core area overlapped between seasons. Habitat selection of
giant otter groups was analyzed considering the landscape composition during the dry and wet

31
seasons. During the dry season, the home range of giant otter groups estimated by linear and 95%
fixed-kernel methods varied, respectively, from 1.8 to 22.9 km and from 1.1 to 3.2 km2. During
the wet season, these estimates varied, respectively, from 14.8 to 31.7 km and from 1 to 3.9 km2.
Based on k-LoCoh (98%) method, home range sizes during the wet season (3.6 - 7.9 km2) were 4
to 59 times larger than during the dry season (0.1 - 2.3 km2). Home-range fidelity between
seasons varied among giant otter groups from 0% to 87%, and 2 radio-tagged groups shifted to
flooded areas during the wet seasons. Giant otter groups were selective in relation to the
composition of the landscape available during the dry seasons, when the river was used more
intensively than other landscape features. However, they seemed to be less selective in
positioning activity ranges during the wet season. During this season, giant otters were frequently
observed fishing in the areas adjacent to the river, such as flooded forest, grassland and swamps.
Key-words: home range, Pteronura brasiliensis, selection of landscape features, site fidelity
*Correspondent: Rua 21 de Setembro, 1880, CEP 79320-900, Corumbá/MS/Brazil;

32
Animals adopt different strategies to deal with spatial and temporal heterogeneity of
environmental features. Most species constrain their activities to an area on the landscape defined
as a home range, which comprises areas used in diverse ways for survival, reproduction and other
activities that maximize fitness (Krebs & Davies 1997; Powell 2000). Some core areas are used
more intensely within the boundaries of the home range and commonly contain refuges and more
defendable food sources (Kernohan et al. 2001; Samuel et al. 1985). The maintenance of the
home range in space and time is favored by a cognitive map (Spencer 2012) that provides site
familiarity, which enhances the owners‘ fitness, increasing their ability to forage and to move
rapidly and safely in the area (Stamps 1995).
Some landscape features are used more by a species than their proportional availability in
the environment (Aebischer et al. 1993; Johnson 1980). However, under highly seasonal
fluctuations, changes in habitat and resource availability may induce a shift in the animal‘s spatial
organization and habitat use through different seasons (Arthur et al. 1996). Availability and
abundance of food resources, together with the metabolic needs of each species, seem to be the
most important variables determining the home range size and habitat selection of carnivores
(e.g., Dillon & Kelly 2008; Macdonald 1983; Valenzuela & Ceballos 2000). Space use by semi-
aquatic mammals is strongly affected by the availability of water bodies and prey, and such
relationships have been reported for several species of otters (Blundell et al. 2000; Garcia de
Leaniz et al. 2006; Kruuk 2006; Melquist and Hornocker 1983). In places with well-defined
hydrological cycles, flooding increases the amount of water in the landscape and may result in
the dispersal of fish assemblages across vast flooded areas (Wantzen et al. 2002; Winemiller &
Jepsen 1998), which may attract fish predators and induce predictable movement patterns of the
piscivores.

33
Giant otters (Pteronura brasiliensis) feed mainly on fish, and information on their spatial
ecology is limited to direct observations during the dry season, when groups maintain linear
territories along water bodies (Duplaix 1980; Evangelista & Rosas 2011a; Laidler 1984;
Leuchtenberger & Mourão 2008; Ribas 2004; Schweizer 1992; Tomas et al. 2000; Utreras et al.
2005). Groups build dens and campsites with communal latrines throughout their home ranges
that are used for resting, scent-marking and rearing cubs (Duplaix 1980; Leuchtenberger &
Mourão 2009; Lima et al. 2012). During the rainy season, giant otters seem to relinquish their
territories to follow spawning fish into the flooded forest and swamps, and to search for emergent
sites for building dens and campsites (Duplaix 1980). Seasonal shifts in movement patterns can
increase home-range sizes of giant otter groups, which have been estimated to be 4 to 13 times
larger during the rainy season (Utreras et al. 2005). However, in the absence of fluctuating water
levels, giant otter groups seem to maintain their territories throughout the year (Laidler 1984).
The Pantanal is an extensive wetland located near the centre of South America and it is
subject to a strong annual flood pulse, which is considered to be the most important ecological
phenomenon for the maintenance of local biodiversity (Alho 2008). Giant otters are locally
abundant and distributed throughout this region (Leuchtenberger & Mourão 2008; Tomas et al.
2000). In this paper, we examine home-range size, home-range fidelity and habitat selection of
giant otters in the Brazilian Pantanal based on direct observations and radio-telemetry, with the
aim of answering the following questions: Is home-range size during the wet season larger than in
the dry season? Do giant otter groups show home-range fidelity within and between seasons? Do
habitat-selection patterns differ between seasons?
MATERIAL AND METHODS

34
From June 2009 to June 2011, we monitored 10 giant otter groups in the Vermelho River
(19o34'S; 57
o01'W) and a stretch of the Miranda River (19°36'S, 57°00'W), totaling 119 linear km
of river, in the southern Pantanal of Brazil. The annual precipitation in the region is about 1,200
mm, with most of the rain falling between November and March (Hamilton et al. 1996). Due to
the low declivity and seasonal inundation, almost 80% of the plain undergoes transition from
terrestrial to aquatic habitat during the rainy season (Alho 2008). We measured the level of the
Miranda River every day at a fixed station (19°34'S, 57°01'W), and it varied from 126 to 481 cm
during the study period. Flooding tended to be abrupt, and the transition from wet to dry occurred
within a few weeks. Based on the river-level measurements, we recognized 2 dry seasons (June-
December 2009 and July 2010-January 2011) and 2 wet seasons (January-June 2010 and
February-June 2011) during the study.
We monitored giant otter groups by boat, using a video camera (Canon HF-200) to record
individual natural marks on the throat of otters and their behaviors. This allowed us to identify
the sex, position in the group hierarchy, group composition and other details about the
individuals. The location of individuals, groups, dens, latrines and other vestiges were registered
by a global positioning system receptor (Garmin Etrex®, Inc., Olathe, KS).
Between November 2009 and July 2010, we undertook three 10-day field trips to capture
and implant radio-transmitters in individuals from different groups of giant otters. In each
campaign, we first searched for active dens suitable for setting traps (i.e. dens with one or few
entrances relatively free of entanglements of roots and vegetation). We blocked the den entrance
with a funnel-shaped net late at night, as described by Silveira et al. (2011), and waited in the
vicinity of the den to capture the individuals in the early morning. We captured 2 dominant males
(from groups G2 and G12) and 1 adult subordinate male (group G10). The mean weight of

35
captured individuals was 30.97 kg (SD=1.75) and the mean total body length of 178 cm
(SD=6.25).
We chemically immobilized the animals after capture using a dosage of 2.0 mg/kg of a
combination of tiletamine and zolazepam (Zoletil®, Virbac, Carros-Cedex, France) and applied a
complementary dosage of 1.5 mg/kg ketamine hydrochloride 10% (Vetaset®
, Fort Dodge,
Campinas, Brasil) combined with 0.25 mg/kg midazolam (Midapine®). Radios were implanted
intraperitoneally by a registered veterinarian. During surgery, we applied 0.5 ml of intramuscular
penicillin (Pentabiótico Veterinário®, Fort Dodge Animal Health, Campinas, Brazil) and a
subcutaneous dosage of 2mg/kg of anti-inflammatory/analgesic (Ketoprofen 1%, Merial Animal
Health, Paulínea, Brazil). We examined each captured individual for general body condition,
photographed their throat markings and took body measurements. The radio transmitter
(M1245B, Advanced Telemetry System®, Isanti, Minnesota), which weighed 42 g (~0.1% of
body weight). All handling and surgery procedures followed the guidelines of the American
Society of Mammalogists for the use of wild mammals in research (Sikes et al. 2011), and were
authorized under license No. 12794/4 of the Brazilian Federal Environment Agency (IBAMA).
We released the radio-tagged giant otters after they recovered from the anesthesia, at the place of
capture or near their group.
We radio-tracked animals by boat or walking on the bank with a Yagi antenna (RA-17,
Telonics®, Mesa, Arizona) attached to a 2.5m pole and connected to a TR4-receiver (Telonics®,
Mesa, Arizona). One group (G2) was monitored from November 2009 to June 2010, and 2
groups (G10 and G12) from July 2010 to June 2011, totaling 153 days of monitoring. Radio-
tagged animals were monitored from 05:00 h, when almost all members of the group had left the
den, to 19:00 h or when the whole group had entered the den, during 8-10 consecutive days every
month. On two occasions, when the tagged animals were not found for two consecutive months,

36
we undertook aerial surveys with a fixed-wing aircraft (CESSNA-182) to locate them. Once
located from the ground, we followed the animals as silently as possible, keeping a distance that
apparently did not disturb their behavior. We recorded locations with the GPS every 30 min when
the group could be seen until we lost the radio signal. Since groups G10 and G12 had territories
near each other, we monitored these groups in alternate periods (05:00-12:00 or 12:30-19:00).
We undertook nocturnal monitoring irregularly, but these data were not considered for home
range and habitat-use analyses, as movements were very limited at night. We used only locations
recorded more than 10 days after capture in the analyses to avoid abnormal behavior due to the
effects of capture and handling.
Home range. – Removal of sequential data to increase independence of locations can
reduce the biological meaning of the information (Blundell et al. 2001; De Solla et al. 1999;
Reynolds & Laundre 1990; Rooney et al. 1998). Also, giant otters cover much of their home
range every day, so observations taken over 6-13 hs per day tend not to be clustered in a limited
part of the home range. Therefore, we considered all sequential locations (n = 2,321) acquired by
radio telemetry for home range analysis, as well as some visual locations of the group G2 (n =
38) made before the capture event.
To allow comparison with other studies, we estimated home range for all groups as linear
river length (RL) within the extreme locations of each group, which is commonly used to
estimate giant otter linear home range (Evangelista & Rosas 2011a), and the fixed-kernel
estimator with ad hoc estimation of the h value. For the radio-tracked groups, for which we
obtained more locations, we also used the k-LoCoh method (Getz & Wilmers, 2004). Because
groups sometimes shifted their areas from one season to another (Leuchtenberger & Mourão
2008), we stratified the home-range estimates by seasons in cases where we had more than 20

37
locations for a given group in a given season. All home-range analyses were undertaken in the R
software (version 2.13, The R Foundation for Statistical Computing), using the packages ade4
(Thioulouse et al. 1997), adehabitat and adehabitatHR (Callenge 2006), gpclib, maptools (Lewin-
Koh et al. 2009), rgdal (Keitt et al. 2010), rgeos (Renard & Bez 2005) and shapefiles (Stabler
2003). We calculated 98% and 95% isopleths for k-LoCoh analyses and 95% isopleths for the
kernel estimator of total home-range size and the 50% isopleths to delimit core areas.
We measured the linear extension of river (RL) and/or other water bodies, such as ponds,
streams or flooded areas along roads, within the extreme locations of each monitored group using
the GPS Track Maker software (Geo Studio Technology Ltda., Brasil). For the kernel analysis,
we tried to use the Least-Square Cross-Validation (LSCV) method, but this analysis did not
converge. Therefore, we chose the h-value of h = 80 and h = 100, respectively, for the dry and
wet seasons analyses of all groups, as they resulted in kernel-contour shapes that visually better
accommodated the group locations.
To evaluate if we had enough locations to determine the home-range areas of radio-
tracked giant otter groups, we plotted the cumulative estimated LoCoh 100% areas
chronologically. For this analysis, we fixed the number of nearest-neighbor locations (k) to five.
However, to estimate the appropriate k for calculation of the group‘s home range area, we
followed the procedure described in Ryan et al. (2006). That is, we plotted the home-range areas
based on 100% of locations, calculated with k values varying from 2 to 30 (100% isopleths) for
each group. The asymptote of the 3 radio-tagged groups was estimated to be approximated at k =
16, which was the value used for the k-LoCoh analyses.
We overlapped the home ranges and core areas (estimated with the kernel and LoCoh
methods) of groups that were monitored in consecutive seasons to estimate the percentage of area
fidelity. These were estimated with ArcMap 10.0 software (Environmental Systems Research

38
Institute, Inc., Redlands, California), using the clip function. We also calculated the daily speed
of each radio-tracked group by season, dividing the daily mean of the Euclidean distance traveled
among consecutive locations by the respective mean of time interval.
Selection of landscape features. ― Here we use habitat to mean a category of physical
environment that occurs in a circumscribed area that is available to an organism or group of
organisms. In this sense, habitats include areas that may never be used by the organism under
study. Used in this way, habitats are not necessarily related to particular organisms, and do not
exist as inherent natural objects in the landscape, but are merely convenient categories that
humans use to get a preliminary understanding of the spatial relationships of organisms to their
environment. We created 3 landscape-category maps, representing 3 seasons (dry, wet 2010 and
wet 2011), due to the differences in the flood levels of the wet seasons during the study period.
We classified Landsat (TM5) satellite images within seasons using the Kmedia method in the
Spring v.4.3.3 (DPI/Inpe) software. We digitalized an image taken during the dry season of 2009
in Google Earth and classified it in ArcMap 10.0 software. The wet-season images were
overlapped on this dry-season image, recovering some landscape-unit types that could not be
classified automatically. We used six landscape-unit categories: (1) river; (2) pond (comprising
permanent and temporary freshwater ponds, and artificial ponds created during the construction
of roads or water reservoirs used for cattle); (3) swamp (water bodies that act as a transition
between the aquatic and terrestrial, normally found at the edge of ponds, streams and rivers, and
that are dominated by grasses sometimes including isolated trees and shrubs); (4) seasonally
flooded grassland (seasonally flooded plains, including the grasslands); (5) forest (riparian forest,
semi-deciduous forest and/or woodland savanna); (6) grassland (non-flooded matrix of grasses

39
and herbs, we also included in this class roads and a few riparian human communities that were
established in areas that originally had this vegetation cover).
We analyzed landscape-category selection of giant otter groups using a log-ratio
compositional analysis (Aebisher et al. 1993) with 2,000 permutations in the R 2.13 software,
using the packages adehabitat (Callenge 2006), maptools (Lewin-Koh et al. 2009), raster
(Hijmans & van Etten 2010), rgdal (Keitt et al. 2010), rgeos (Renard & Bez 2005) and shapefiles
(Stabler 2003). We undertook landscape-category selection analysis for eight groups (G1-G4,
G8-G12) within the second and third levels proposed by Johnson (1980), which are the home-
range area selected by each group in the study area, and space use (locations) of the groups
within their home ranges. A buffer of 2 km was incorporated around each location of giant otters
during the monitoring period in the study area (Blundell et al. 2001) using ArcMap 10.0 software.
This buffer range was considered the study area for compositional analysis within home ranges.
For home range availability, we used the fixed-kernel contours with ad hoc estimation of the h
values. We undertook eigen analysis of selection ratio as described by Callenge & Duffor (2006),
which assigns scores to each giant otter group and habitat, resulting in a measure of habitat
selection for each group. We counted the number of dens and campsites built by giant otter
groups in each landscape feature to analyze the proportion of refuge and site locations in each
habitat.
RESULTS
From June 2009 to June 2011 (n = 188 days), we visually monitored 10 giant otter groups
(n = 361 locations), totaling 77 individuals in groups (20 females, 26 males and 31 indeterminate)
with an average of six individuals per group (varying from 2 to 15, Tab. 1). Three giant otter
males (2 dominant and 1 subordinate) of different groups (G2, G12 and G10) were radio-tracked

40
from November 2009 to June 2011, resulting in 2,321 locations (591-937 locations per group) in
151 days of monitoring (69-81 days per group). The relationship between the number of locations
and the cumulative home range presented a punctuated equilibrium, approaching multiple
asymptotes with different sample size for each group (Fig. 1). This pattern may be explained by
the shift of home range areas during the wet season, associated with territorial expansion of the
groups within the season.
Home range. – The linear river extent of home range of the 8 groups monitored during
both dry seasons ranged from 1.8 to 22.9 km (Tab. 2). During the wet seasons, the linear home
ranges for five groups varied from 14.8 to 31.7 km. Based on the 95% fixed-kernel method,
during the dry season, the home-range size of 8 groups varied from 0.5 to 3.2 km2 (Tab. 1), while
the home-range sizes of the five groups monitored during the wet season varied from 1.0 to 12.0
km2. However, these values may be underestimated due to differences in sampling effort and
should be treated with caution. The 98% k-LoCoh home-range sizes (Fig. 2) for the radio-tagged
groups G2, G10 and G12 during the dry season were, respectively, 1.0, 2.3 and 0.1 km2, while
during the wet season they were 3.9, 7.9 and 3.6 km2, respectively (Tab. 1), which represents an
increase of 4 to 59 times in home-range size during the wet season.
The 3 radio-tagged groups reared cubs during the monitoring period. Group G2 had 3
cubs during the wet season of 2010 (born in March), while the groups G10 and G12 had,
respectively, 6 and 2 cubs during the dry season of 2010 (born in September and August). Groups
G10 and G12 had larger core areas during the wet season (k-LoCoh 50% = 0.5 and 0.01 km2)
than during the dry season, but group G2 reduced its core area by about 10 times from 0.03 to
0.003 km2 between the dry season and the following wet season (Tab. 1). The daily speed of
movement followed the same pattern, since during the wet season the mean daily speeds of

41
groups G2, G10 and G12 were respectively, 0.5 (0.03-1.9) km/h, 1.3 (0-4.7) km/h and 0.8 (0.3-
1.7) km/h, while during the dry season these values were 0.9 (0-3) km/h, 0.9 (0.04-4.6) km/h and
0.4 (0.1-0.5) km/h.
It was not feasible to monitor all groups during the wet season. Therefore, we estimated
home-range fidelity only for the radio-tagged groups and 2 other groups (G1 and G3). Home-
range overlap varied from 0% to 87% between seasons (Tab. 1). The radio-tagged groups G2 and
G10 used 78% and 87%, respectively, of their dry-season home ranges (k-LoCoh 98%) during
the consecutive wet season. The area occupied during the wet season of 2011 by group G12 did
not overlap its home range in the previous dry season of 2010. Groups G2 and G12 both
dispersed to flooded plains at the beginning of the wet season, abandoning the home ranges used
during the previous dry season until the middle of the wet season. These groups used temporary
streams and constructed dens and campsites on the banks of artificial ponds and on the roadside
of the Estrada Parque Pantanal (EPP). The EPP is a dirt road with 1-2 m elevation that crosses a
section of the Southern Pantanal. From March to April 2011, the water level was at its highest
and almost all river banks in the study area were submerged. During this time, groups G10 and
G12 broke branches of emerged shrubs to construct clumsy nests, which the animals used to rest
and defecate. The radio-tagged groups were not neighbors during the study. Therefore, none of
them overlapped the home range areas of other radio-tagged groups in the same season. Groups
G2 and G10 partially overlapped their own core areas (k-LoCoh 50%) in consecutive wet and dry
seasons by 17% and 13%, respectively.
Selection of landscape features. – During the wet seasons, groups did not select any of the
landscape categories to establish home ranges (Ʌ = 0.05, P = 0.121) or select landscape elements
within the home ranges (Ʌ = 0.059, P = 0.13). During the dry season, selection for landscape

42
features to establish home ranges differed significantly from random (Ʌ = 0.007, P = 0.017). The
ranking matrix ordered the habitat types as river = forest = swamp = ponds > grassland (Tab.
3A). Changes in use of landscape features between seasons seemed to differ among groups.
During the wet seasons, group G1 continued using the river more intensively than other
landscape elements, while group G12 selected seasonally flooded grassland and grassland
habitats. During dry season, group G12 selected ponds, whereas the other groups selected the
river and forest habitats (Fig. 3). Seasonally flooded grassland occurred within only one of the
home ranges of the eight groups studied during the dry seasons. Therefore, we excluded this
landscape feature from the analyses related to this season.
During the dry season, giant otters groups did not select landscape elements within the
home ranges (Ʌ = 0.186, P = 0.07), but the low probability for the null hypothesis indicates a
likely type-II error. The ranking matrix of landscape-element selection suggests that the river was
proportionally more used than expected from availability relative to the other landscape elements
(Tab. 3B). Forest was used mainly to build dens and campsites, and 83% of dens (n = 156) and
77 % of campsites (n = 92) were located in riparian forest (Tab. 4).
DISCUSSION
Home range. – Despite the increasing knowledge of the ecology of giant otters since the
reference study by Duplaix (1980), data on the spatial ecology of the species has been restricted
to observations made during the dry season, and most of these observations were reported as
linear home ranges. Here we provide two-dimensional as well as linear estimates of home ranges
for giant otter groups in an area of the southern Pantanal, in both dry and wet seasons. During the
dry seasons, the linear home ranges varied from 1.8 to 22.9 km, with a median of 13.7 km and
were of same magnitude as the linear home ranges for giant otters inhabiting areas in Guyana and

43
the Amazon (Duplaix 1980; Evangelista & Rosas 2011a). Laidler (1984) suggested a home range
of 32 km of creek or 20 km2 of a lake in Guyana, based on the assumption that the groups
cyclically move among different hunting places. However, such cyclic movements were not
observed in our study site (Leuchtenberger & Mourão 2008) or elsewhere (Duplaix 1980;
Evangelista & Rosas 2011a; Staib 2005). Using the two-dimensional locations of our radio-
tagged groups, the home-range estimates for the dry season ranged from 0.1 to 2.3 km2 (LoCoh
98%), which is similar to the two-dimensional home ranges reported for giant otters in areas of
the Amazon (0.6–1.1 km2, Staib 2005; and 0.5–2.8 km
2, Utreras et al. 2005).
Site fidelity of radio-tagged groups between seasons varied from 0% to 87% of
overlapping. During the wet season, 2 of the 3 radio-tagged groups left the area they used during
the dry season partially or entirely to move into the flooded plains. Seasonal shifts in home-range
size have been observed for many carnivores (Curtis & Zaramody 1998; Dillon & Kelly 2008;
Valenzuela & Ceballos 2000), including otters (Blundell et al. 2000), and seems to be strongly
related to resource availability. Duplaix (1980) stated that giant otter groups abandon their ranges
during the rainy season to follow dispersing fish into the flooded forest and swamps, and to
search for higher banks for building dens and campsites. The availability of banks may not be
restrictive, as the otters can use emerged shrubs to rest during flooding (this study). One group
we radio-tracked remained in its original stretch of river, but frequently used the flooded
marginal areas. Giant otters can increase their home ranges at least fourfold during the wet season
in the Pantanal (this study) and in an area in the Amazon (Utreras et al. 2005), by taking
advantage of the flooded areas along the river courses.
Core areas comprised less than 7% of the home ranges of the groups and usually
contained dens, latrines and intensive foraging sites, as suggested by Duplaix (1980). During the
first months of cub rearing, giant otter groups reduced their movements and limited their core

44
areas to extremely small sizes (e.g., group G12 used a pond of 1.3 ha), as previously reported for
the species (Duplaix 2004; Evangelista & Rosas 2011a; Laidler 1984) and other otters (Erlinge
1967; Hussain & Choudhury 1995; Melquist & Hornoker 1983; Ruiz-Olmo et al. 2005). The
restriction of movement and reduction of ranges during the first four months of cub rearing may
be a strategy to improve the raising success, as this is the critical period for lactation and cub
learning (Evangelista & Rosas 2011b), and cub mortality may be higher in this period (Schweizer
1992).
Selection of landscape features. – Changes in availability of landscape features may
induce changes in habitat-selection patterns (Arthur et al. 1996, Humphrey & Zinn 1982). Giant
otter groups were selective in relation to their use of landscape elements available during the dry
season. However they seemed to be less selective in positioning activity ranges during the wet
season. According to Duplaix (1980), food availability is one of the key factors that affect habitat
choice by giant otters. Therefore, when their prey becomes more dispersed through the
floodplains, groups may move more unpredictably with regard to landscape elements when
searching for food as a foraging strategy to maximize food gain, as is expected for an animal
using an optimal foraging strategy (Schoener 1971).
During the wet season, giant otters were frequently observed fishing in the areas adjacent
to the river, such as flooded forest, grassland and swamps. These areas have shallow water, which
is preferred for foraging by many otter species (Anoop & Hussain 2004; Hussain & Choudhury
1995; Kruuk 2006; Laidler 1984), presumably due to the higher concentration of prey during the
flood season (Wantzen et al. 2002; Winemiller & Jepsen 1998). During the dry season, the river
was most intensively used in relation to other landscape features that were available within the
home range. However, there was variation in use of landscape elements between groups. Some

45
groups selected marginal habitats, such as freshwater ponds and artificial ponds beside roads,
during the dry season, and seasonally flooded grassland during the wet season. However, this
apparent preference may be an artifact of territoriality, since the groups that inhabited those
marginal habitats were smaller than their neighboring groups. The use of such habitats by giant
otter groups may be a result of lack of space in areas where the species has reached carrying
capacity (Ribas et al. 2012). However, these marginal habitats may not support larger groups for
long, as the fish stocks in these habitats are rapidly and drastically reduced due to the high rate of
predation by piscivorous animals (Ribas et al. 2012) and deterioration of water conditions
(Winemiller & Jepsen 1998).
The selection of forest by most of the groups during the dry season is probably related to
the use of banks with vegetative cover near water bodies to build dens and campsites (Carter &
Rosas 1997; Duplaix, 1980; Lima et al. 2012; Schenck 1999; Schweizer 1992; Souza 2004).
Banks covered by vegetation are less impacted by erosion and may offer more protection of dens
from predators (Lima et al. 2012; Souza 2004). During the wet season, groups continued to use
the highest forested banks available in their territories to build dens and campsites, and some
groups used emerged shrubs to build temporary platforms in marginal flooded areas and swamps.
The importance of vegetation cover has been noted for other otter species (Lutrogale
perspiscillata, Anoop & Hussain 2004; Nawab & Hussain 2012; Lutra lutra, Macdonald &
Mason 1983; Lontra provocax, Medina-Vogel et al. 2003; Lutra maculicollis, Aonyx capensis,
Perrin & Carugati 2000). The removal of riparian vegetation by canalization of rivers and streams
has affected the habitat and prey of L. provocax in Chile and led to declines in density (Medina-
Vogel et al. 2003). Vegetation cover on the bank seems to be important for all otter species
(Anoop & Hussain 2004; Nawab & Hussain 2012) and should be considered as a key factor for
the maintenance of giant otter groups.

46
Many studies have investigated the relationship between home-range size and individual-
or group-mass and diet (e.g., Gittleman & Harvey 1982; Lindstedt et al. 1986; Ottaviani et al.
2006). Based on the relationship presented by Gittleman and Harvey (1982), social mustelids as
giant otters, sea otters (Enhydra lutris) and European badgers (Meles meles) have an unusually
smaller home range than expected for a strict carnivore (Johnson et al. 2000). The home range
size of giant otter groups was similar to the home ranges estimates for other social otters, as L.
perspicillata (2.1 to 6.6 km2, Hussain & Chudoury 1995), L. maculicollis (1.1 to 9.5 km², Perrin
et al. 2000) and male groups of E. lutris outside the breeding season (0.6 to 1 km², Jameson
1989), despite differences in data analysis and on their social system. This suggests that the home
ranges of giant otter groups in our study have a large and dense prey base that supports that large
otters in such small areas, which also demands healthy habitat. As the flood pulse is often linked
to high fish productivity (Welcomme 1985; 1990), the maintenance of the annual hydrological
fluctuations should be considered a priority for the conservation of vulnerable species which have
fish as their principal prey. This is particularly worrying for giant otters in the Pantanal, because
70 small dams for hydroelectric purposes are planned and another 44 have already been
constructed on streams that flow into the Paraguay River Basin (Mourão et al. 2010), and these
may promote drastic changes in the flood pulse of this large wetland.
ACKNOWLEDGMENTS
We thank CNPq (grant n. 476939/2008-9), the Rufford Small Grants Foundation (grant n.
88.08.09), the Mohamed bin Zayed Species Conservation Fund (project n. 10051040) and IDEA
Wild for their financial support. We are also indebted to Embrapa Pantanal, Barranco Alto Farm
and the Federal University of Mato Grosso do Sul for their logistic support. Two of the authors
(C.L. and L.G.R.O.S.) were recipients of CNPq scholarships. Luiz A. Pellegrin helped us with

47
GIS processing. Waldomiro de L. e Silva, Sidnei Benício, Procópio de Almeida and José A. D.
da Silva assisted us in the field. Lucas Leuzinger, Marina Schweizer and Jorge Schweizer helped
with aerial monitoring. We are particularly grateful to Mariana M. Furtado, Mario A. F. Rego and
Marina Bueno for their unstinting assistance and support during the capture and surgical
procedures.
RESUMO
Ariranhas (Pteronura brasiliensis) são sociais e se alimentam principalmente de peixes.
Informação sobre a organização espacial de ariranhas é limitada a observações durante estações
secas. No entanto, grupos podem abandonam seus territórios para seguir a dispersão de peixes
para áreas inundadas durante a estação chuvosa. Por isso, nós estudamos a ecologia especial de
grupos de ariranhas durante as estações seca e chuvosa nos rios Vermelho e Miranda no Pantanal
brasileiro. Nós monitoramos dez grupos de ariranhas mensalmente entre junho de 2009 e junho
de 2011. Localizações de locas, latrinas e observações visuais de grupos ou indivíduos foram
registradas. Três grupos foram monitorados mensalmente com rádio-telemetria entre novembro
de 2009 e junho de 2011 durante o dia e suas localizações foram registradas em intervalos de 30
minutos. Nós estimamos o tamanho da área de vida de todos os grupos através dos seguintes
métodos: (1) comprimento linear do rio, considerando as localizações extremas de cada grupo, e
(2) kernel fixo. Para os grupos monitorados com telemetria nós também usamos o método (3) k-
LoCoh. Fidelidade de espaço foi calculada como a porcentagem de área de vida e área núcleo
sobrepostas entre estações. Seleção de habitat de grupos de ariranhas foi analisada considerando a
composição da paisagem durante as estações seca e chuvosa. Durante a estação seca as áreas de
vida de grupos de ariranhas estimada através dos métodos lineares e kernel 95% variaram,
respectivamente, de 1.8 a 22.9 km e de 1.1 a 3.9 km2. Durante a estação chuvosa, estas

48
estimativas variaram, respectivamente, de 14.8 a 31.7 km e de 1 a 3.9 km2. Baseado no método
de k-LoCoh (98%), os tamanhos das áreas de vidas durante a estação chuvosa (3.6 - 7.9 km2)
foram 4 a 59 vezes maiores do que durante as estações secas (0.1 - 2.3 km2). Fidelidade de área
de vida entre estações variou de 0% to 87% entre os grupos de ariranhas e dois grupos
monitorados com rádio-telemetria dispersaram para áreas inundadas durante as estações
chuvosas. Grupos de ariranhas foram seletivos em relação à composição da paisagem durante as
estações secas, quando o rio foi mais intensamente utilizado em relação a outras características da
paisagem.. No entanto, eles pareceram ser menos seletivos no posicionamento de suas atividades
durante as estações chuvosas. Durante a estação chuvosa ariranhas foram freqüentemente
observadas pescando em áreas adjacentes ao rio, como florestas inundadas, campos e brejos.
LITERATURE CITED
AEBISCHER, N. J., P. A. ROBERTSON, AND R. E. KENWARD. 1993. Compositional analysis of
habitat use from animal radio-tracking data. Ecology 74(5):1313−1325.
ALHO, C. J. R. 2008. Biodiversity of the Pantanal: response to seasonal flooding regime and to
environmental degradation. Brazilian Journal of Biology 68(4, Suppl.):957−966.
ANOOP, K. R., AND S. A. HUSSAIN. 2004. Factors affecting habitat selection by smooth-coated
otters (Lutrogale perspicillata) in Kerala, India. Journal of Zoology 263:417–423.
ARTHUR, S. M., B. F. J. MANLY, L. L. MCDONALD, AND G. W. GARNER. 1996. Assessing habitat
selection when availability changes. Ecology 77(1):215-227.
BLUNDELL, G. M., R. T. BOWYER, M. BEN-DAVID, T. A. DEAN, AND S. C. JEWETT. 2000. Effects
of food resources on spacing behavior of river otters: does forage abundance control
home-range size?. Pp. 325-333 in Biotelemetry 15: Proceedings of the Fifteenth

49
International Symposium on Biotelemetry (J. H. Eiler, D. J. Alcorn and M. R. Neuman,
eds.). International Society of Biotelemetry, Wageningen, Netherlands.
BLUNDELL, G. M., J. A. K. MAIER AND E. M. DEBEVEC. 2001. Linear home ranges: effects of
smoothing, sample size, and autocorrelation on kernel estimates. Ecological Monographs
71(3):469−489.
CALLENGE, C. 2006. The package ―adehabitat‖ for the R software: A tool for the analysis of
space and habitat use by animals. Ecological Modelling 197:516–519.
CALLENGE, C., AND A. B. DUFOUR. 2006. Eigenanalysis of selection ratios from animal radio-
tracking data. Ecology 87(9):2349–2355.
CARTER, S., AND F. C. W. ROSAS. 1997. Biology and conservation of the giant otter Pteronura
brasiliensis. Mammal Review 27(1):1−26.
CURTIS, D. J. AND A. ZARAMODY. 1998. Group size, home range use, and seasonal variation in
the ecology of Eulemur mongoz. International Journal of Primatology 19 (5):811-835.
DE SOLLA, S. R., R. BONDURIANSKY, AND R. J. BROOKS. 1999. Eliminating autocorrelation
reduces biological relevance of home range estimates. The Journal of Animal Ecology
68(2):221−234.
DILLON, A., AND M. J. KELLY. 2008. Ocelot home range, overlap and density: comparing radio
telemetry with camera trapping. Journal of Zoology 275:391–398.
DUPLAIX, N. 1980. Observations on the ecology and behavior of the giant otter Pteronura
brasiliensis in Suriname. Revue Ecologique (Terre Vie) 34:495−620.
DUPLAIX, N. 2004. Guyana giant otter project: 2002-2004 research results. Oceanic Society. San
Francisco, California, USA: 44 p.
http://www.giantotterresearch.com/articles/OCEANIC_SOCIETY_Guyana_Project_Repo
rt_2002-2004.pdf

50
ERLINGE, S. 1967. Home range of the otter Lutra lutra L. in southern Sweden. Oikos
18(2):186−209.
EVANGELISTA, E., AND F. C. W., ROSAS. 2011a. The home range and movements of giant otters
(Pteronura brasiliensis) in the Xixuaú Reserve, Roraima, Brazil, IUCN Otter Specialist
Group Bulletin 28(A):31−37.
EVANGELISTA, E., AND F. C. W. ROSAS. 2011b. Breeding behavior of giant otter (Pteronura
brasiliensis) in the Xixuaú Reserve, Roraima, Brazil. IUCN Otter Specialist Group
Bulletin 28(A):5−10.
GARCIA DE LEANIZ, C., D. W. FORMAN, S. DAVIES, AND A. THOMSON. 2006. Non-intrusive
monitoring of otters (Lutra lutra) using infrared technology. Journal of Zoology 270:577–
584.
GETZ, W. M., AND C. C. WILMERS. 2004. A local nearest-neighbor convex-hull construction of
home ranges and utilization distributions. Ecography 27:489−505.
GITTLEMAN, J. L., AND P. H. HARVEY. 1982. Carnivore home-range size, metabolic needs and
ecology. Behavioral Ecology and Sociobiology 10(1):57−63.
HAMILTON, S. K., S. J. SIPPEL, AND J. M. MELACK. 1996. Inundation patterns in the Pantanal
wetland of South America determined from passive microwave remote sensing. Archiv
für Hydrobiologie 137:1−23.
HIJMANS, R. J., AND J. VAN ETTEN. 2010. Raster: package for reading, writing, and manipulating
raster (grid) type geographic (spatial) data. http://cran.r-project.org/web/packages/r
aster/index.html.
HUMPHREY, S. R., AND T. L. ZINN. 1982.Seasonal habitat use by river otters and everglades mink
in Florida. The Journal of Wildlife Management 46:375–381.

51
HUSSAIN S. A., AND B. C. CHOUDHURY 1995. Seasonal movement, home range and habitat
utilization by smooth-coated otter in National Chambal Sanctuary. Habitat 11:45–55.
JAMESON, R. J. 1989. Movements, home range and territories of male sea ottersof Central
California. Marine Mammal Science 5(2):159-172.
JOHNSON, D. H. 1980. The comparison of usage and availability measurements for evaluating
resource preference. Ecology 61(1):65−71.
JOHNSON, D. D. P., D. W. MACDONALD, AND A. J. DICKMAN. 2000. An analysis and review of
models of the sociobiology of the Mustelidae. Mammal Review 30(3 & 4): 171-196.
KEITT, T. H., R. BIVAND, E. PEBESMA, AND B. ROWLINGSON. 2010. Rgdal: bindings for the
geospatial data abstraction library. R package version 0.6-24. http://CRAN.R-
project.org/package=rgdal
KERNOHAN, B. J., R. A. GITZEN, AND J. J. MILLSPAUGH. 2001. Analysis of animal space use and
movements. Pp. 125-166 in: Radio tracking and animal populations. (J. J. Millspaugh and
J. M. Marzluff, eds.). San Diego: Academic press.
KREBS, J. R., AND N. B. DAVIES. 1997. Behavioural ecology: an evolutionary approach, 4th ed.
Oxford, UK: Blackwell.
KRUUK, H. 2006. Otters: Ecology, behavior and conservation. Oxford University Press Inc., New
York.
LAIDLER, L. 1984. The behavioral ecology of the giant otter in Guyana. Master dissertation,
University of Cambridge.
LEUCHTENBERGER, C., AND G. MOURÃO. 2008. Social organization and territoriality of giant
otters (Carnivora : Mustelidae) in a Seasonally Flooded Savanna in Brazil. Sociobiology
52(2):257−270.

52
LEUCHTENBERGER, C., AND G. MOURÃO. 2009. Scent-marking of giant otter in the Southern
Pantanal, Brazil. Ethology 115:210−216.
LEWIN-KOH, N. J., ET AL. 2009. Maptools: Tools for reading and handling spatial objects. R
package version 0.7-29. http://CRAN.R-project.org/package=maptools
LIMA, D. DOS S., M. MARMONTEL, AND E. BERNARD. 2012. Site and refuge use by giant river
otters (Pteronura brasiliensis) in the Western Brazilian Amazonia. Journal of Natural
History 46(11-12):729−739.
LINDSTEDT, S. L., B. J. MILLER, AND S. W. BUSKIRK. 1986 Home Range, time, and body size in
mammals. Ecology 67(2):413-418.
MACDONALD, D. W. 1983. The ecology of carnivore social behaviour. Nature 301:379−384.
MACDONALD, S. M., AND C. F. MASON. 1983. Some factors influencing the distribution of otters
(Lutra lutra). Mammal Review 13:1–10.
MEDINA-VOGEL, G., V. S. KAUFMAN, R. MONSALVE, AND V. GOMEZ. 2003. The influence of
riparian vegetation, woody debris, stream morphology and human activity on the use of
rivers by southern river otters in Lontra provocax in Chile. Oryx 37(4):422−430.
MELQUIST, W. E., AND M. G. HORNOKER. 1983 Ecology of river otters in West Central Idahos.
Wildlife Monographs 83:3−60.
MOURÃO, G., W. TOMAS, AND Z. CAMPOS. 2010. How much can the number of jabiru stork
(Ciconiidae) nests vary due to change of flood extension in a large Neotropical
floodplain? Zoologia 27(5):751−756.
NAWAB, A., AND S. A. HUSSAIN. 2012. Factors affecting the occurrence of smooth-coated otter in
aquatic systems of the Upper Gangetic Plains, India. Aquatic Conservation.

53
OTTAVIANI, D., S. C. CAIRNS, M. OLIVERIO, AND L. BOITANI. 2006. Body mass as a predictive
variable of home-range size among Italian mammals and birds. Journal of Zoology
269:317–330.
PERRIN, M. R., I. D. CARRANZA, AND I. J. LINN. 2000. Use of space by the spotted-necked otter in
the KwaZulu-Natal Drakensberg, South Africa. South African Journal of Wildlife
Research 30(1):15-21.
PERRIN, M. R., AND C. CARUGATI. 2000. Habitat use by the cape clawless otter and the spotted-
necked otter in the KwaZulu-Natal Drakensberg, South Africa. South African Journal of
Wildlife Research 30(3):103−113.
POWELL, R. A. 2000. Animal home ranges and territories and home range estimators. Pp. 65-110
in Research techniques in animal ecology: controversies and consequences (L. Boitani
and T. K. Fuller, eds). Columbia University Press, New York.
RENARD, D., AND N. BEZ. 2005. RGeoS: geostatistical package. R package. Version 2.1. Centre
de Géostatistique, Ecole des Mines de Paris, Fontainebleau, France.
REYNOLDS, T. D., AND J. W. LAUNDRE. 1990. Time intervals for estimating pronghorn and coyote
home ranges and daily movements. The Journal of Wildlife Management 54(2):316−322.
RIBAS, C. 2004. Desenvolvimento de um programa de monitoramento em longo prazo das
ariranhas (Pteronura brasiliensis) no pantanal brasileiro. Master dissertation, Federal
University of Mato Grosso do Sul, Brazil.
RIBAS, C., G. DAMASCENO, W. MAGNUSSON, C. LEUCHTENBERGER, AND G. MOURÃO. 2012. Giant
otters feeding on caiman: evidence for an expanded trophic niche of recovering
populations. Studies on Neotropical Fauna and Environment 47(1):19−23.

54
ROONEY, S. M., A. WOLFE, AND T. J. HAYDEN. 1998. Autocorrelated data in telemetry studies:
time to independence and the problem of behavioural effects. Mammal Review 28(2):89–
98.
RUIZ-OLMO, J., A. MARGALIDA, AND A. BATET. 2005. Use of small rich patches by Eurasian otter
(Lutra lutra L.) females and cubs during the pre-dispersal period. Journal of Zoology
265:339–346.
RYAN, S. J., C. U. KNECHTEL, AND W. M. GETZ. 2006. Range and Habitat Selection of African
Buffalo in South Africa. Journal of Wildlife Management 70(3):764−776.
SAMUEL, M. D., D. J. PIERCE, AND E. O. GARTON. 1985. Identifying areas of concentrated use
within the home range. Journal of Animal Ecology 54(3):711−719.
SCHENCK, C. 1999. Lobo de Rio (Pteronura brasiliensis). Presencia, uso del hábitat y protección
en el Perú. GTZ/INRENA, Lima, Peru.
SCHOENER, T. W. 1971. Theory of Feeding Strategies. Annual Review of Ecology and
Systematics 2:369−404
SCHWEIZER, J. 1992. Ariranhas no pantanal: ecologia e comportamento de Pteronura brasiliensis.
Edibran-Editora Brasil Natureza Ltda, Curitiba, Paraná.
SIKES, R. S., W. L. GANNON, AND THE ANIMAL CARE AND USE COMMITTEE OF THE AMERICAN
SOCIETY OF MAMMALOGISTS. 2011. Guidelines of the American Society of Mammalogists
for the use of wild mammals in research. Journal of Mammalogy 92:235−253.
SILVEIRA, L., M. M. FURTADO, F. C. W. ROSAS, L. C. SILVA, M. M. M. CABRAL, N. M. TORRES, R.
SOLLMANN, A. KOUBA, AND A. T. A. JÁCOMO. 2011. Tagging giant otters (Pteronura
brasiliensis) (Carnivora, Mustelidae) for radio-telemetry studies. Aquatic Mammals
37:208−212.

55
SOUZA, J. D. de. 2004. Estudos ecológicos da ariranha, Pteronura brasiliensis (Zimmermann,
1780) (Carnivora: Mustelidae) no Pantanal Mato-Grossense. Master dissertation, Federal
University of Mato Grosso, Brazil.
SPENCER, W. D. 2012. Home ranges and the value of spatial information. Journal of Mammalogy
93(4):929–947.
STAIB, E. 2005. Eco-Etología del Lobo de Río (Pteronura brasiliensis) en el Sureste del Perú.
PhD dissertation, Sociedad Zoológica de Francfort Perú.
STABLER, B. 2003. Shapefiles, version 0.3. R package. http://cran.r-project.org.
STAMPS, J. A. 1995. Motor learning and the value of familiar space. The American Naturalist
146(1):41−58.
THIOULOUSE, J., D. CHESSEL, S. DOLEDEC, AND J. M. OLIVIER. 1997. Ade-4: a multivariate
analysis and graphical display software. Statistics and computing 7:75–83.
TOMAS, W., P. A. L. BORGES, H. J. F. ROCHA, R. SÁ FILHO, F. KUTCHENSKI JR, AND T. V. UDRY.
2000. Potencial dos Rios Aquidauana e Miranda, no Pantanal de Mato Grosso do Sul,
para a conservação da ariranha (Pteronura brasiliensis). Pp 1-12. in III Simpósio sobre
Recursos Naturais e Sócio-econômicos do Pantanal: Os Desafios do Novo Milênio
(Embrapa Pantanal, eds.), Corumbá, Brazil.
UTRERAS, V. B., E. R. SUÁREZ, G. ZAPATA-RÍOS, G. LASSO, AND L. PINOS. 2005. Dry and rainy
season estimations of giant otter, Pteronura brasiliensis, home range in the Yasuní
National Park, Ecuador. The Latin American Journal of Aquatic Mammals 4 (2):1–4.
VALENZUELA, D., AND G. CEBALLOS. 2000. Habitat Selection, Home Range, and Activity of the
White-Nosed Coati (Nasua narica) in a Mexican Tropical Dry Forest. Journal of
Mammalogy 81 (3):810−819.

56
WANTZEN, K. M., F. DE A. MACHADO, M. VOSS, H. BORISS, AND W. J. JUNK. 2002. Seasonal
isotopic shifts in fish of the Pantanal wetland, Brazil. Aquatic Sciences 64:239–251.
WELCOMME, R. L. 1985. River fisheries. FAO Fish. Technical Paper, 262.
WELCOMME, R.L. 1990. Status of fisheries in South American rivers. Interciência 15(6):337−345.
WINEMILLER, K. O., AND D. B. JEPSEN. 1998. Effects of seasonality and fish movement on
tropical river food webs. Journal of Fish Biology 53A:267–296.

57
FIGURE LEGENDS
Figure 1 – Cumulative estimated area used (LoCoh 100%) in relation to the number of
chronological locations of 3 groups of giant otters radio-tracked from November 2009 to June
2011, in the southern Pantanal of Brazil.

58
Figure 2 – Seasonal home ranges of three giant otter groups monitored by radio telemetry
between November 2009 and June 2011, in the southern Brazilian Pantanal. Upper figures: k-
LoCoh 98% of (a) group G2, (b) group G10, and (c) group G12. The black arrow indicates the
location of the reduced home-range of group G12 during the dry season. Lower figures: Kernel
95% of (d) group G2; (e) group G10; (f) group G12.

59
Figure 3 – Results of eigenanalysis of landscape-element selection ratio by giant otter groups for
six landscape elements (FO – Forest, PO –ponds, GL – grassland, SFG – seasonal flooded
grassland, SW – swamp, RI – river), from June 2009 to June 2011 in the southern Brazilian
Pantanal. (a) During the dry season (groups G1–G4, G8–G10, G12) and (b) during the wet season
(groups G1–G3, G10, G12). Upper graphs show the landscape-element loadings on the first two
factorial axes and lower graphs show the groups' scores on the first factorial plane.

60
TABLES
Table 1 - Home-range size (km2) and overlap area (km
2 and %) between dry (DS) and wet (WS) seasons of 10 giant otter
groups (ID=G1-G4, G8-G13, G size=range of number of individuals that composed the group during the monitoring period)
monitored by radio telemetry (RT) and direct observations (DO) from June 2009 to June 2011, in southern Pantanal, Brazil. Home
ranges were estimated with k-LoCoh (isopleths 98%, 95% and 50%) and Kernel ad hoc (h=80 for dry season and h=100 for wet
season) methods.
k-LoCoh Kernel
DS WS Overlap DS WS Overlap
ID
G size Period Days
Locat
ions 98% 95% 50% 98% 95% 50% 98% 95% 50% 95% 50% 95% 50% 95% 50%
RT
G2
3 14/08/09-
10/6/10 79 965 0.99 0.8 0.03 3.9 3.12 0.003
0.77
(78%)
0.58
(73%)
0.005
(17%) 2.66 0.28 5.28 0.06
1.36
(51%) 0
G10
9-15 4/8/09-
21/6/11 81 793 2.31 1.67 0.03 7.86 7.86 0.53
2
(87%)
1.42
(85%)
0.004
(13%) 2.38 0.3 11.97 0.06
1.98
(83%)
0.007
(2%)
G12
2-3 4/8/09-
20/6/11 69 591 0.1 0.04 0.004 3.6 2.32 0.01 0 0 0 0.52 0.1 4.34 0.3
0.03
(6%) 0
G1
5-8 5/6/09-
21/6/11 57 177 3.15 0.28 3.88 0.23
2.75
(87%) 0
G3
3-9 3/6/09-
17/3/11 26 71 3.17 0.12 0.98 0.16
0.53
(17%)
0.01
(8%)
G4
7 3/6/09-
17/6/11 11 43 1.11 0.1
- - - -

61
DO G8
8 2/6/09-
15/12/09 22 80 2.28 0.3
- - - -
G9
2-6 15/8/09-
18/6/11 31 72 2.1 0.19
- - - -
G11
4-6 22/7/10-
18/5/11 9 18
- -
- - - -
G13
3 15/2/11-
11/5/11 6 7
- -
- - - -

62
Table 2 - Linear home-range estimate (km) of ten giant otter groups monitored by radio-telemetry
(RT) and direct observation (DO), during four seasons (DS 2009 - dry season of 2009, WS 2010 -
wet season of 2010, DS 2010 - dry season of 2010, WS 2011- wet season of 2011), from June
2009 to June 2011, in the southern Pantanal of Brazil.
Method Groups DS 2009 WS 2010 DS 2010 WS 2011
RT G2 10.5 22.7
G10 9.1* 22.9 31.7
G12 1.8 15.6
DO G1 18.0 23.1 20.1* 6.4*
G3 14.2 14.8 13.7 4.9*
G4 17.2 6.7* 0.3* 4.1*
G8 12.1
G9 13.0 8.5* 11.5*
G11 9.4* 1.8*
G13 1.6*
Median 13.6 22.7 13.7 23.6
(*Estimates should be accepted with caution, as they are based on few locations (<20), and
therefore were not used to calculate the medians).

63
Table 3 - Ranking matrix of habitat types (RI – river, PO –pond, FO – forest, SW – swamp, GL –
grassland) selected by eight giant otter groups during the dry seasons, from June 2009 to January
2011 in the southern Pantanal of Brazil. A) proportional habitat use within group‘s kernel home
ranges with proportion of total available habitat types within study area; B) proportions of
independent locations for each group in each habitat type within group‘s kernel home range. Each
mean element in the matrix was replaced by its sign, a triple sign represents significant deviation
from random at P<0.05. Plus sign indicates that the habitat was positively selected.
A) Home range vs. landscape
Habitat type RI FO SW PO GL
RI 0 + + + +++
FO --- 0 + + +++
SW --- - 0 + +++
FP --- --- --- 0 +++
GL --- --- --- --- 0
B) Radio locations vs. home range
Habitat type RI PO FO SW GL
RI 0 + +++ +++ +++
PO - 0 + + +++
FO - - 0 + +++
SW - - - 0 +
GL --- --- --- --- 0

64
Table 4 – Number of dens and campsites built by ten giant otter groups in different landscape
features (SW – swamp, GL – grassland, SFL – seasonal flooded grassland, FO – forest) during
four seasons (DS 2009 – dry season of 2009, WS 2010 – wet season of 2010, DS 2010 – dry
season of 2010, WS 2011- wet season of 2011) from June 2009 to June 2011, in the southern
Pantanal of Brazil.
DS 2009 WS 2010 DS 2010 WS 2011 TOTAL
Habitat den campsite den campsite den campsite den Campsite den campsite
SW 8 5 1 2 2 7 1 0 12 14
GL 5 2 1 2 2 0 2 2 10 6
SGL 0 0 2 1 0 0 2 0 4 1
FO 70 17 16 14 31 18 13 22 130 71
TOTAL 83 24 20 19 35 25 18 24 156 92

65
CAPÍTULO 3
______________________________________________________________________________
Leuchtenberger, C.; Magnusson. W. & Mourão, G. Territoriality of giant
otter groups in an area with seasonal flooding. Manuscrito formatado
para Journal of Zoology.

66
Territoriality of giant otter groups in an area with seasonal flooding
Caroline Leuchtenberger1, 2
, William Magnusson1 & Guilherme Mourão
2
1 Graduate Program in Ecology, Instituto Nacional de Pesquisas da Amazônia – INPA, Brasil
2 Laboratory of Wild Life, Embrapa Pantanal, Brasil
Correspondence: Caroline Leuchtenberger, Laboratório de Vida Selvagem, Embrapa Pantanal,
Rua 21 de Setembro, 1880, CEP 79320-900, Corumbá, MS, Brazil. E-mail:
Abstract
Territoriality carries costs and benefits, which are commonly affected by the spatial and
temporal abundance and predictability of food, and by intruder pressure. Giant otters live in
groups that defend territories along water bodies during the dry season, using chemical signals,
loud vocalizations and agonistic encounters. However, little is known about the territoriality of
giant otters during the rainy season, when groups leave their territories and follow fish dispersing
into flooded areas. The objective of this study was to analyze long-term territoriality of giant otter
groups in a seasonal environment. The linear extensions of the territories of 10 giant otter groups
were determined based on locations of active dens, latrines and scent-marks in each season. Some
groups overlapped the limits of neighboring territories. The total territory extent of giant otters
was correlated with group size in both seasons. The extent of exclusive territories of giant otter
groups was negatively related to the number of adults present in adjacent groups. Territory
fidelity ranged from 0 to 100% between seasons. Some groups maintained their territory for long

67
periods, which demanded constant effort in marking and re-establishing their territories during
the wet season. These results indicate that the defense capacity of groups had an important role in
the maintenance of their territories across seasons, which may also affect the reproductive
success of giant otter alpha pairs.
Key-words: Pteronura brasiliensis, territory size, exclusive territory, overlap, chemical signal,
agonistic encounters.
Resumo
Territorialidade implica em custos e benefícios, que são geralmente afetados pela
abundância e previsibilidade de alimento no tempo e espaço, e por pressão de intrusos. Ariranhas
vivem em grupos que defendem territórios ao longo de corpos d‘água durante a estação seca
utilizando sinais químicos, vocalizações estridentes e encontros agonísticos. No entanto, pouco é
conhecido sobre a territorialidade de ariranhas durante a estação chuvosa, quando se acredita que
grupos abandonam seus territórios e seguem a dispersão de peixes para áreas inundadas. O
objetivo deste estudo foi entender a territorialidade de grupos de ariranhas em um ambiente
sazonal por longo tempo. Alguns grupos fizeram incursões em territórios vizinhos. O tamanho de
território de ariranhas foi correlacionado com o tamanho de grupo em ambas as estações. A
extensão dos territórios exclusivos de grupos de ariranhas foi negativamente relacionada com o
número de adultos presentes em grupos adjacentes. A fidelidade de território variou de 0 a 100%
entre estações. Alguns grupos mantiveram seus territórios por longos períodos, os quais
demandaram constantes esforços em marcação e restabelecimento de território durante a estação
chuvosa. Estes resultados indicam que a capacidade de defesa do grupo tem um importante papel
na manutenção de seus territórios ao longo das estações, que pode também afetar o sucesso
reprodutivo dos casais dominantes.

68
Palavras-chaves: Pteronura brasiliensis, tamanho de território, território exclusivo,
sobreposição, sinais químicos, encontros agonísticos.

69
Introduction
Most of social species defend territories within their home range in an attempt to have
exclusive access to important resources (Brown & Orians, 1970; Grant et al., 1992; Kruuk,
1992). However, territories may be more or less exclusive and some overlap with neighboring
intruders may occur (Stamps, 1990; Stamps & Kirschnan, 1990; Wolf, 1993, Adams 2001). An
important strategy to avoid conspecific rivals is to inform ownership to intruders, such as through
chemical signals, which are an efficient communication tool, even in the absence of the signaler
(e.g., Gosling, 1982; Sillero-Zubiri & Macdonald, 1998; Zub et al., 2003). Scent-marking may
inform intruders about the composition and strength of the group, and the aversion to marks left
by strangers may constrain owners to their territories (Sillero-Zubiri & Macdonald, 1998).
Species adopt different patterns of territory marking, and in heterogeneous habitat signals are
commonly concentrated in areas where the threat of intrusion is highest (Kruuk et al., 1984;
Sillero-Zubiri & Macdonald, 1998; Gosling & Roberts, 2001; Zub et al., 2003; Herr & Rosell,
2004).
Territoriality carries costs and benefits, which are commonly affected by the abundance
and predictability of food in time and space (Maher & Lott, 2000). The Resource Dispersion
Hypothesis (RDH) suggests that the territory size of carnivores is determined by resource
dispersion, while group size is related to the richness of patches (Macdonald, 1983). Assuming
that territory size and shape represent an economic optimum (Maher & Lott, 2000), the minimum
defensible territory would contain enough resources to maintain a minimum breeding unit, and
areas with more abundant resources will support additional individuals, increasing group size
(Macdonald, 1983; Doncaster & Macdonald, 1992; Revilla & Palomares, 2002). Therefore, when
resources are widely distributed, the size of territories may be related to the metabolic needs of

70
individuals (Gittleman & Harvey, 1982) and consequently to group size (Macdonald, 1983;
Kruuk & Macdonald, 1985; Adams, 2001), although the relation between group and territory size
is potentially complicated by other factors that benefit group-living, such as hunting and breeding
cooperation (Brown, 1982).
In seasonal environments, some species maintain territories only in the period during
which important resources are available (Stamps & Kirschnan, 1990). As groups select and
establish territories in a given area, the order of territory establishment may affect the final size of
the territory and the fitness of the owners for the entire territorial season, since the first groups
that establish territories during this period will have territories of optimal size, and later groups
will have to establish their territories in the remaining space (Stamps & Kirschnan, 1990; Adams,
1994). Therefore, neighbor pressure may prevent expansion of territories and result in conflicts
and territory overlap (Erlinge, 1968; Stamps, 1990; Stamps & Kirschnan, 1990; Wolf, 1993;
Powel, 2000; Herr & Rossell, 2004; Tallents et al., 2012). In such situations, the size of exclusive
territories may have a negative correlation with intruder pressure (Stamps, 1990), with greater
overlap in areas with more conflicts.
The pressure of neighboring groups may have negative consequences because of agonistic
encounters (White & Harris, 1994; Sillero-Zubiri & Macdonald, 1998; Zub et al., 2003), which
may affect the maintenance of territories (Stamps & Kirschnan, 1999). Groups that remain in the
same territory for longer periods will become more familiar with the area, which may also
improve fitness and defense capacity, since owners learn to explore their territory more
efficiently and to defend those areas that are more frequently invaded by intruders (Stamps,
1995). Giant otters live in cohesive groups ranging from two to 20 individuals, which cooperate
with the care of the offspring of the dominant pair (Duplaix, 1980). Giant otter groups mark their
territories with scent-marks and communal latrines, which are located at dens and campsites
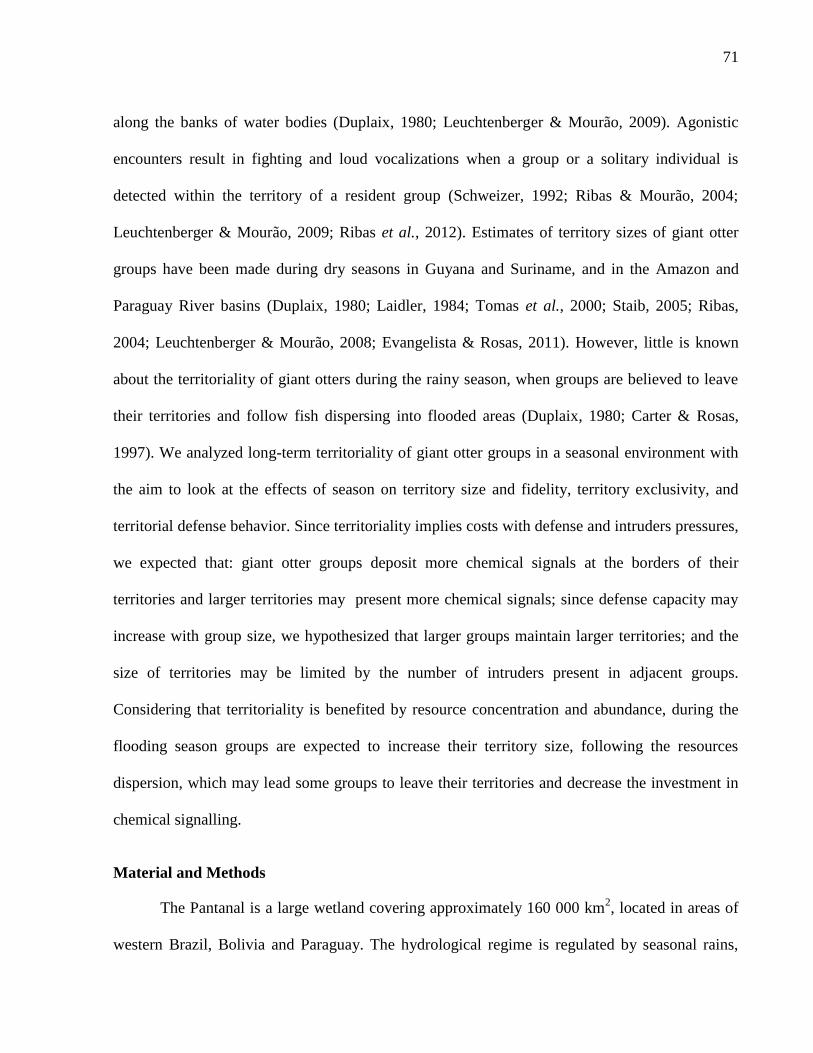
71
along the banks of water bodies (Duplaix, 1980; Leuchtenberger & Mourão, 2009). Agonistic
encounters result in fighting and loud vocalizations when a group or a solitary individual is
detected within the territory of a resident group (Schweizer, 1992; Ribas & Mourão, 2004;
Leuchtenberger & Mourão, 2009; Ribas et al., 2012). Estimates of territory sizes of giant otter
groups have been made during dry seasons in Guyana and Suriname, and in the Amazon and
Paraguay River basins (Duplaix, 1980; Laidler, 1984; Tomas et al., 2000; Staib, 2005; Ribas,
2004; Leuchtenberger & Mourão, 2008; Evangelista & Rosas, 2011). However, little is known
about the territoriality of giant otters during the rainy season, when groups are believed to leave
their territories and follow fish dispersing into flooded areas (Duplaix, 1980; Carter & Rosas,
1997). We analyzed long-term territoriality of giant otter groups in a seasonal environment with
the aim to look at the effects of season on territory size and fidelity, territory exclusivity, and
territorial defense behavior. Since territoriality implies costs with defense and intruders pressures,
we expected that: giant otter groups deposit more chemical signals at the borders of their
territories and larger territories may present more chemical signals; since defense capacity may
increase with group size, we hypothesized that larger groups maintain larger territories; and the
size of territories may be limited by the number of intruders present in adjacent groups.
Considering that territoriality is benefited by resource concentration and abundance, during the
flooding season groups are expected to increase their territory size, following the resources
dispersion, which may lead some groups to leave their territories and decrease the investment in
chemical signalling.
Material and Methods
The Pantanal is a large wetland covering approximately 160 000 km2, located in areas of
western Brazil, Bolivia and Paraguay. The hydrological regime is regulated by seasonal rains,

72
which fall mostly between November and March and result in the inundation of almost 80% of
the area (Hamilton et al., 1996).
From June 2009 to June 2011, we studied home-range size and habitat selection of ten
giant otter groups inhabiting stretches of the Miranda and Vermelho Rivers in the southern
Pantanal. We use these data, together with data on home-range sizes of these groups that has been
published previously (Leuchtenberger & Mourão, 2008; Chapter 2), to examine aspects of the
long-term stability of territories of giant otter groups in a seasonal environment.
Ten giant otter groups were monitored (G1-G4, G8-G13) for 8-10 consecutive days every
month, interspaced by two to three weeks, along 119 km of the Vermelho (19o34'S; 57
o01'W) and
Miranda Rivers (19°36'S, 57°00'W) in the southern Pantanal (Chapter 2). Monitoring was
undertaken during the daytime (05:00-19:00), when we searched for individuals or groups, active
dens, campsites, scent-marks and other signs (see Groenendijk et al., 2005), and registered the
locations with a global positioning system receptor (Garmin Etrex, Inc., Olathe, KS). Giant otters
were video recorded (Canon HF-200), which allowed identification of their natural individualistic
marks on the throat, and their sex and behavior whenever possible. The hierarchical status of
individual within the group was identified according to their behavior and other cues
(Leuchtenberger & Mourão 2009). Two dominant males and one subordinate male from different
giant otter groups (G2, G10 and G12) were radio-tracked from November 2009 to June 2011. For
more details see Chapter 2.
Based on the Miranda River level, we recognized two dry seasons (June-December 2009
and July 2010-January 2011) and two wet seasons (January-June 2010 and February-June 2011)
during the study period (Chapter 2).
We measured the linear extent of territories of all groups observed, based on the extreme
locations of active dens, latrines and scent-marks in each season. We also measured the exclusive

73
stretches within the territories, which were defined as the core area defended only by the resident
group that did not overlap with areas defended by adjacent groups (Brown & Orians, 1970). We
calculated territory overlap between groups as the proportion of the territory of one group that
overlapped the territory of another group. These overlaps are asymmetrical between groups
(Kernohan et al., 2001).
We combined latrines and isolated scent-marks as chemical-signal sites. The density of
chemical signals was estimated for each group along the linear extent of river within the
exclusive and overlapping areas and these estimates were averaged for dry and wet seasons. We
used a two-way-ANOVA to test the difference between the densities of chemical-signals sites
between exclusive and overlap areas and seasons.
Group size was considered the number of individuals in the group during each season,
including juveniles 6-months-old or more, since they were usually already integrated in the daily
activities of the group. Potential intruder pressure was estimated by summing the number of
adults and sub-adults (>1 year old) present in adjacent groups during each season. We estimated
means of total-territory extent, exclusive-territory extension, group size, intruder pressure and
number of chemical-signal sites for each group during each season (dry and wet seasons). We
also included in these calculations the estimates of territory size of giant-otter groups monitored
during 2006 and 2007 by Leuchtenberger & Mourão (2008). We used ANCOVA models to
estimate (1) the effects of territory size and season on the number of chemical-signal sites; (2) the
effects of group size and season on territory size and (3) the effect of number of adult otters in
neighboring groups and season on exclusive-territory size of groups. In all cases, we first checked
the assumption of slope parallelism of ANCOVA by testing a preliminary model including the
interaction term between the explanatory variables (Wilkinson, 2004). If the interaction term was
not significant (P<0.05), we excluded it and ran the ANCOVA with interaction. If the interaction

74
term was significant, we tested the simple effect of the continuous explanatory variable
separately for each season.
Agonistic events were video recorded during the study period. We classified these events
as "fights" when individuals of different groups fought or chased each other, and "warning
vocalizations", when a group emitted agonistic vocalizations (e.g. screams and hahs, see Chapter
4) to another group or when invading the borders of neighboring territories. Since we did not
observe enough agonistic events to make confident conclusions of seasonal patterns, we
presented this data only for purposes of discussion.
We used the percentage overlap of total extent of the territory of a group during one
season with the total territory extent from the previous season as an index of territory fidelity.
Territory fidelity was estimated only for groups that were monitored in more than three months
during each season. As giant otters in this area had been monitored in 2006 and 2007 by our
team, we used the available data (Leuchtenberger & Mourão, 2008) to evaluate long-term
changes in group territories. There was no siginificant relationship between estimated territory
size and number of observations of the groups during the dry (P=0.102) or wet seasons
(P=0.285). However, due to the small sample size (N<20 per season), territory estimates from
some groups were excluded from analyses involving seasonality.
Results
The ten groups monitored had a mean of six individuals per group (2-15), totaling 77
individuals (20 females, 26 males and 31 indeterminate), which resulted in a linear density of
0.42 individuals/km. Almost all groups overlapped their territory borders with neighboring
groups. Overlap ranged from 0 to 69% of linear extensions during both dry and wet seasons
(Table 1).

75
The linear density of chemical-signal sites did not differ significantly between exclusive
and overlapped territories (F(1,27) = 0.431, P = 0.517) or seasons (F(1,27) = 0.802, P = 0.379).
There was no interaction between territory size and season in the ANCOVA analysis (P = 0.899)
when predicting the number of chemical signal sites. The number of chemical-signal sites
increased linearly with territory size (β = 0.858, t = 4.884, P <0.001), but did not differ between
seasons (t = -1.401, P = 0.185).
Linear territories during the dry seasons ranged from 1.1 to 17.8 km (N = 7 groups, Table
1), excluding the estimates for two groups, which had few locations and one new group that was
establishing its territory within the season, as that biased estimates of territory size. The wet
linear territories ranged from 8.1 to 23.9 km (N = 5 groups), as some groups extended their
former ranges into the flooded areas or artificial lakes beside stretches of the Estrada Parque
Pantanal (EPP) road (Fig. 1). The extent of the exclusive territories varied from 1.1 to 12.7 km
during the dry seasons and from 6.6 to 16.1 km during the wet seasons (Table 2). There was no
interaction (P = 0.67) between group size and season, as explanatory variables of territory size.
ANCOVA (F(2, 13) = 11.67, P = 0.001, R2
= 0.64) indicated that territory size increased linearly
with group size (β = 1.434, t = 4.356, P<0.001) and was larger during high water (β = 6.599, t =
2.910, P = 0.012). The effects of the number of adult otters in neighboring groups interacted with
the season (t = 2.827, P = 0.015) as explanatory variables of exclusive territory size. Therefore
we examined its simple effects within each level of season. The exclusive territory size was
linearly and negatively affected by the number of adult neighboring otters during the dry seasons
(β = -1.732, F(1, 8) = 8.487, P = 0.019, r2
= 0.52), but not during the wet seasons (F(1,4) = 0.509, P
= 0.515).
Although most overlapped areas were not used simultaneously by more than one group,
we witnessed 12 agonistic events between groups, which seemed to occur more likely at the

76
boundaries (Fig. 1), including warning vocalizations (N = 7) and fights (N = 5). Most of the fights
we saw occurred during dry periods, while the warning vocalizations were more frequent during
floods, but the number of observations is too small to allow generalizations (Fig. 2).
Territory fidelity varied from 0 to 100% between seasons (Table 3). Three groups (G2,
G9 and G12) changed their territories completely between seasons (Fig. 1). Group G8 was
observed in the area only during the dry season of 2009. Group G10 expanded its territory from
the wet season to the dry season of 2010 pushing group G1 up the Miranda River. Nevertheless,
group G1 maintained 15% of its territory between the dry seasons of 2009 and 2010. Groups G1
and G3 have been observed in the study area since 2002 (Ribas, 2004) and group G4 established
its territory in 2006 (Leuchtenberger & Mourão, 2008), with changes in territory location
thereafter (Fig. 1). Group G2 was first observed in 2006, but the dominant male was substituted
four times in the following two years (Leuchtenberger & Mourão, 2008). During the wet season
of 2010, we sighted group G2 in the same site that the group used during the dry season of 2008.
Discussion
The linear density of 0.42 ind/km of river observed for the giant otters in the study area
has been stable since the surveys conducted in 2002 in the same area (Ribas, 2004), reinforcing
the suggestion that this population had achieved carrying capacity (Leuchtenberger & Mourão,
2008; Ribas et al., 2012). This density is within the range reported for the Guyana, Suriname and
the Amazon Basin, which varied from values as high as the 1-2 ind/km (Duplaix, 1980;
Evangelista & Rosas, 2011) to about 0.2 ind/km (Laidler, 1984; Schenck, 1999). Otters may
increase the intensity of territorial defense behaviors when at high densities (Erlinge, 1968;
Laidler, 1984), and giant otter groups may defend the entire extent of their home ranges, even
though some boundaries overlap (Duplaix, 1980).

77
In our study, some giant otter groups overlapped the boundaries of neighboring territories
and both groups alternately scent-marked these areas, sometimes in the same day, which could
have confounded the real limit of groups territories. Demarcation in overlapped territories has
been considered as attempts of animals to expand their territories (Stamps & Krishnan, 1990;
Doncaster & Macdonald, 1992; Adams, 2001). Some social species increase their investment in
the defense of borders to maximize the chance of being detected by intruders (Kruuk et al., 1984;
Sillero-Zubiri & Macdonald, 1998; Zub et al., 2003; Herr & Rosell, 2004). In our study, the total
territory extent and the extent of exclusive territories were larger during the wet seasons than
during the dry seasons. Furthermore, the number of giant otter chemical-signal sites was
positively correlated with territory length in both seasons and the density of chemical-signal sites
did not differ between overlapped and exclusive territories (this study, Leuchtenberger &
Mourão, 2008), indicating that groups spend proportionally more time and energy to mark their
territory as it increases in size. Although scent-marking is energetically expensive, giant-otter
groups commonly forage throughout their entire territory every day, and may expend almost 10%
of their daily active time in marking their territory (Chapter 1). For species such as Lutra lutra,
inhabiting areas where flood-pulses occur within hours, scent-marks may signal priority of use of
resources for other members of the group (Kruuk, 1992). However, for a species as cohesive as
the giant otter, inhabiting areas with seasonal flood-pulses, the distribution of chemical signals
throughout the territory may be related to defense and reduction of intrusion, since a sparsely
marked territory could be considered a vacant area by neighboring groups (Sillero-Zubiri &
Macdonald, 1998).
Territory size of giant otters was correlated with group size in both seasons, despite the
increase in territory size during the wet season, which may suggest that larger groups increment
their territories more during flooding, when resources are more dispersed. Although this

78
relationship is not common for social carnivores living in heterogeneous habitat (Macdonald,
1983; Doncaster & Macdonald, 1992; Johnson et al., 2001; Adams, 2001), this could be related
to the need of larger groups to access more resources (Macdonald, 1983; Kruuk & Macdonald,
1985), as there is a relationship between metabolic needs and home range size of most carnivores
(Gittleman & Harvey 1982; Grant et al 1992). The addition of individuals to the group may also
improve defense capacity (Doncaster & Macdonald, 1992; Sillero-Zubiri & Macdonald, 1998;
Mares et al., 2012; Tallents et al., 2012), favoring the acquisition of larger territories.
During the dry season, the extent of exclusive territories of giant otter groups was
negatively related to the number of adults present in adjacent groups. The pressure of intruders
may restrict the expansion of territories, and consequently exert a negative effect on exclusive-
territory size (Stamps, 1990; Stamps & Krishnan, 1990; Wolf, 1993; Tallents et al., 2012).
However, there was no relationship between intruder pressure and exclusive-territory size during
the wet season, probably because resources become widely distributed during floods, attenuating
the pressure of neighboring groups with the decrease in density of otters along water bodies.
Fights between giant otter groups are highly vocal and may lead to severe injuries or
death of individuals and the disintegration of the group (Schweizer, 1992; Mourão & Carvalho,
2001; Ribas & Mourão, 2004). In our study, agonistic events (fights and warning vocalizations)
were common at the borders of territories and areas of territory overlap, and appeared to be more
frequent during the dry season, while warning vocalizations were more frequent during the
floods. Smaller groups seemed to avoid fights in overlap areas. We have witnessed cases of large
groups invading the territory of smaller groups, which remained hidden in marginal swamps or
ponds until the invaders left the area. However, hiding is more practicable at high water when
there are many ways to avoid detection or to escape, which may account for the lower rate of
fights between groups during the wet season. Agonistic encounters, as well as scent-marking,

79
may constrain each group to its territory (White & Harris, 1994; Sillero-Zubiri & Macdonald,
1998). As scent-marking may inform intruders about the composition and identity of the group
(Sillero-Zubiri & Macdonald, 1998; Rostain et al., 2004; Brennan & Kendrick, 2006), the
behavior of mixing feces and urine in communal latrines could be a strategy to hide the
information about the size of the group, in order to make it more difficult for larger groups to
identify weakly protected territories.
Territory fidelity ranged from 0 to 100% between seasons. Site familiarity may be a
strategy to promote continuous access to key resources and enhance the owners‘ fitness (Stamps,
1995). Also, in seasonal environments, such as the Pantanal, the establishment of territories
before important resources become available appears to help a group maintain its territory in the
following seasons (Stamps & Krishnan, 1990; Adams, 1994). However, in these seasonal areas,
the maintenance of territories could be difficult, as flooding can submerge marks and border
limits, and allow access to new areas not yet settled. Despite these difficulties, in our study area,
some groups maintained their territory for long periods (> 7 years), which demanded effort in
marking and re-establishing their territories during the wet season.
Defense capacity apparently had an important role in territory maintenance of giant otter
groups across seasons, and negative experiences as during fights may lead a group to abandon its
territory. During the wet season of 2010, a larger group (G10) overlapped and ultimately took
over the territory from group G1, which was forced to dislocate up river and settle a new area.
Other groups apparently were forced to leave their high-quality territories and settle new ones in
sub-optimal or marginal areas (Ribas et al., 2012; this study). The shift of one group from the
river to a marginal habitat (group G2) seems to have caused it to reduce in size, with the death of
the cubs and the dispersal of the only subordinate. The reproductive success of giant otter alpha
pairs maybe affected by their capacity to maintain a territory in a high-quality environment for a

80
long time and by increasing the number of helpers in the group. Giant otter groups commonly
increase in size through the philopatry of offspring (Duplaix, 1980). However groups with
unrelated members were observed in the study area (Leuchtenberger & Mourão, 2008; Ribas,
2012), which may be an efficient strategy to improve the success of a giant otter groups and
individual fitness.
Acknowledgments
We thank CNPq (grant n. 476939/2008-9), the Rufford Small Grants Foundation (grant n.
88.08.09), the Mohamed bin Zayed Species Conservation Fund (project n. 10051040) and IDEA
Wild for their financial support. We are also indebted to Embrapa Pantanal and the Federal
University of Mato Grosso do Sul for their logistic support. C.L. held a CNPq scholarship.
Waldomiro de L. e Silva, Sidnei Benício, Procópio de Almeida and José A. D. da Silva assisted
in the field. Lucas Leuzinger, Marina Schweizer and Jorge Schweizer helped with aerial
monitoring. Luiz G. R. Oliveria-Santos helped with data analysis. We are particularly grateful to
Mariana M. Furtado, Mario A. F. Rego and Marina Bueno for their unstinting assistance and
support during the capture and surgical procedures.

81
References
Adams, E. S. (1994). Settlement Tactics in Seasonally Territorial Animals: Resolving Conflicting
Predictions. Am. Nat. 143(5), 939-943.
Adams, E. S. (2001). Approaches to the study of territory size and shape. Ann. Rev. Ecol. Syst.
32, 277-303.
Brennan, P. A. & Kendrick, M. K. (2006). Mammalian social odours: attraction and individual
recognition. Philos. T. Roy. Soc. B 361, 2061-2078.
Brown, J. L. & Orians, G. H. (1970). Spacing patterns in mobile animals. Ann. Rev. Ecol. Syst. 1,
239-262.
Brown, J. L. (1982). Optimal group size in territorial animals. J. Theor. Biol. 95, 793-810.
Carter, S. & Rosas, F. C. W. (1997). Biology and conservation of the giant otter Pteronura
brasiliensis. Mammal Rev. 27(1), 1−26.
Doncaster, C. P. & Macdonald, D. W. (1992). Optimum group size for defending heterogenous
distributions of resources: A model applied to red foxes, Vulpes vulpes, in Oxford City. J.
theor. Biol. 159, 189-198.
Duplaix, N. (1980). Observations on the ecology and behavior of the giant otter Pteronura
brasiliensis in Suriname. Rev. Ecol. (Terre Vie) 34, 495-620.
Erlinge, S. (1968). Territoriality of the Otter Lutra lutra L. Oikos 19 (1): 81-98
Evangelista, E. & Rosas, F. C.W. (2011). The home range and movements of giant otters
(Pteronura brasiliensis) in the Xixuaú Reserve, Roraima, Brazil, IUCN Otter Spec.
Group Bull. 28(A), 31-37.
Gittleman, J. L. & Harvey, P. H. (1982). Carnivore home-range size, metabolic needs and
ecology. Behav. Ecol. Sociobiol. 10(1), 57−63.

82
Gosling, L. M. & Roberts, S. C. (2001). Testing ideas about the function of scent marks in
territories from spatial patterns. Anim. Behav. 62, F7-F10.
Gosling, L. M. (1982). A reassessment of the function of scent marking in territories. Z.
Tierpsychol. 60, 89–118.
Grant, J. W. A., Chapman, C. A. & Richardson, K. S. (1992). Defended versus undefended home
range size of carnivores, ungulates and primates. Behav. Ecol. Sociobiol. 31, 149-161.
Groenendijk, J., Hayek, F., Duplaix, N., Reuther, C., Van Damme, P., Schenck, C., Staib, E.,
Wallace, R., Waldemarin, H., Notin, R., Marmontel, M., Rosas, F., de Mattos, G.E.,
Evangelista, E., Utreras, V., Lasso, G., Jacques, H., Matos, K., Roopsind, I. & Botello,
J.C. (2005) Surveying and monitoring distribution and population trends of the giant otter
(Pteronura brasiliensis) – Guidelines for a standardization of survey methods as
recommended by the Giant Otter Section of the IUCN/SSC Otter Specialist Group.
Habitat 16, 1–100.
Hamilton, S. K., Sippel, S. J. & Melack, J. M. (1996). Inundation patterns in the Pantanal wetland
of South America determined from passive microwave remote sensing. Arch. Hydrobiol.
137, 1-23.
Herr, J. & Rossell, F. (2004). Use of space and movement patterns in monogamous adult
Eurasian beavers (Castor fiber). J. Zool., Lond. 262, 257–264
Kernohan, B. J., Gitzen, R. A. & Millspaugh, J. J. (2001). Analysis of animal space use and
movements. In Radio tracking and Animal Populations: 125-166. Millspaugh, J. J. &
Marzluff, J. M. (Eds). San Diego: Academic press.
Kruuk, H. (1992). Scent marking by otters (Lutra lutra): signaling the use of resources. Behav.
Ecol. 3(2), 133-140

83
Kruuk, H., Gorman, M. & Leitch, A. (1984). Scent-marking with the subcaudal gland by the
European Badger, Meles meles L. Anim. Behav. 32, 899-907.
Kruuk, H. & Macdonald, D.W. (1985). Group territories of carnivores: empires and enclaves. In
Behavioural ecology: ecological consequences of adaptive behaviour, 521-536. Sibly, R.
M. & Smith, R. H. (Eds), Blackwell Scientific Publications, Oxford, UK.
Laidler, L. (1984). The behavioral ecology of the giant otter in Guyana. Master thesis, University
of Cambridge.
Leuchtenberger, C. & Mourão, G. (2008). Social organization and territoriality of giant otters
(Carnivora : Mustelidae) in a Seasonally Flooded Savanna in Brazil. Sociobiology 52(2),
257-270.
Leuchtenberger, C. & Mourão, G. (2009). Scent-marking of giant otter in the Southern Pantanal,
Brazil. Ethology 115, 210-216.
Macdonald, D.W. (1983). The ecology of carnivore social behaviour. Nature 301, 379–384
Maher, C. R. & Lott, D. F. (2000). A Review of ecological determinants of territoriality within
vertebrate species. Am. Midl. Nat. 143(1), 1-23.
Mares, R., Young, A. J. & Clutton-Brock, T. H. (2012). Individual contributions to territory
defence in a cooperative breeder: weighing up the benefits and costs. Philos. T. Roy. Soc.
B. http// rspb.royalsocietypublishing.org.
Mourão, G. & Carvalho, L. (2001). Canibalism among giant otters (Pteronura brasiliensis).
Mammalia 6(2), 225-227.
Powell, R. A. (2000). Animal home ranges and territories and home range estimators. In
Research techniques in animal ecology: controversies and consequences, 65-110. Boitani,
L. & Fuller, T. K. (Eds). Columbia University Press, New York.

84
Revilla, E. & Palomares, F. (2002). Spatial organization, group living and ecological correlates in
low-density populations of Eurasian badgers, Meles meles. J. Anim. Ecol. 71, 497–512.
Ribas, C. (2004). Desenvolvimento de um programa de monitoramento em longo prazo das
ariranhas (Pteronura brasiliensis) no pantanal brasileiro. Master thesis. Federal
University of Mato Grosso do Sul, Brazil.
Ribas, C. (2012). Grau de parentesco e relações sociais entre grupos de ariranhas (Pteronura
brasiliensis). PhD thesis. Instituto Nacional de Pesquisas da Amazônia, Brazil.
Ribas, C. & Mourão, G. (2004). Intraspecific Agonism Between Giant Otter Groups. IUCN Otter
Spec. Group Bull. 21(2), 89-93.
Ribas, C., Damasceno, G., Magnusson, W., Leuchtenberger, C. and Mourão, G. (2012). Giant
otters feeding on caiman: evidence for an expanded trophic niche of recovering
populations. Stud. Neotrop. Fauna E. 47(1), 19-23.
Rostain, R. R., Ben-David, M., Groves, P. & Randall, J. A. (2004). Why do river otters scent-
mark? An experimental test of several hypotheses. Anim. Behav. 68, 703–711.
Schenck, C. (1999). Lobo de Rio (Pteronura brasiliensis). Presencia, uso del hábitat y protección
en el Perú. GTZ/INRENA, Lima, Peru.
Schweizer, J. (1992). Ariranhas no Pantanal: Ecologia e comportamento de Pteronura
brasiliensis. Edibran-Editora Brasil Natureza Ltda, Curitiba, Paraná.
Sillero-Zubiri, C. & Macdonald, D.W. (1998) Scent-marking and territorial behaviour of
Ethiopian wolves Canis simensis. J. Zool. 245, 351–361.
Staib, E. (2005). Eco-Etología del Lobo de Río (Pteronura brasiliensis) en el Sureste del Perú.
PhD thesis. Sociedad Zoológica de Francfort Perú.
Stamps, J.A. (1990). The effect of contender pressure on territory size and overlap in seasonally
territorial species. Am. Nat. 135(5), 614-632.

85
Stamps, J. A. (1995). Motor learning and the value of familiar space. Am. Nat. 146(1), 41-58.
Stamps, J. A. & Krishnan, V. V. (1990). The effect of settlement tactics on territory sizes. Am.
Nat. 135(4), 527-546.
Stamps, J. A. & Krishnan, V. V. (1999). A learning-based model of territory establishment. Q.
Rev. Biol. 74(3), 291-318.
Tallents, L. A., Randall, D. A, Williams, S. D. & Macdonald, D. W. (2012). Territory quality
determines social group composition in Ethiopian wolves Canis simensis. J. Anim. Ecol.
81, 24–35.
Tomas, W., Borges, P. A. L., Rocha, H. J. F., Sá Filho, R., Kutchenski Junior, F. & Udry, T. V.
(2000). Potencial dos Rios Aquidauana e Miranda, no Pantanal de Mato Grosso do Sul,
para a conservação da ariranha (Pteronura brasiliensis). In III Simpósio sobre Recursos
Naturais e Sócio-econômicos do Pantanal: Os Desafios do Novo Milênio. Corumbá,
Brazil.
White, P.C.L. & Harris, S. (1994). Encounters between red foxes (Vulpes vulpes): implications
for territory maintenance, social cohesion and dispersal. J. Anim. Ecol. 63(2), 315-327.
Wilkinson, L. (2004). SYSTAT—Systems for Statistics. Version 11. Systat Software Inc,
Chicago, Illinois.
Wolf, J. O. (1993). Why Are Female Small Mammals Territorial? Oikos 68(2), 364-370.
Zub, K., Theuerkauf, J, Edrzejewski, B. J. I., Schmidt, K. & Alczyk, R. K. (2003). Wolf pack
territory marking in the Bilaowieza Primeval Forest (Poland). Behaviour 140, 635-648.

86
FIGURE LEGENDS

87
Figure 1. Territory extent of 13 giant otter groups (G1-G13) monitored between July 2006 and
November 2007 (Leuchtenberger & Mourão 2008), and from June 2009 to June 2011 (this
study), on the Miranda and Vermelho Rivers, in the southern Brazilian Pantanal. Parts a, b and c
were modified from Leuchtenberger & Mourão 2008.

88
Figure 2. Water level in the Miranda River in the Brazilian Pantanal during the study. The dotted
line indicates the limit between dry (river within its banks) and wet (floodplain inundation)
seasons. Agonistic events between giant otters groups are indicated by triangles (fights ) and
circles (warning vocalizations).

89
TABLE LEGENDS
Table 1. Percentage of territories (in rows) overlapped by the neighboring group‘s territory (in
columns) during each season (dry season of 2009, wet season of 2010, dry season of 2010, wet
season of 2011) from June 2009 to June 2011, in the southern Pantanal, Brazil. Group size is
indicated in parentheses beside the group ID. (―-‖ indicates the absence of the group in the study
area, * territory estimated based on small number of locations, and not included in the analyses).
Groups
G
G1
G
G2
G
G3
G
G4
G
G8
G
G9
G
G10
G
G11
G
G12
G
G13
G1 (8) 100 38.93 0 0 10.22 0 - - - -
Low- G2 (3) 69.23 100 0 0 0 0 - - - -
water G3 (5) 0 0 100 31.69 0 18.78 - - - -
2009 G4 (7) 0 0 26.16 100 0 0 - - - -
G8 (8) 15.04 0 0 0 100 39.09 - - - -
G9 (6) 0 0 17.54 0 36.38 100 - - - -
G1 (8) 100 27.35 0 0 - 0 24.11 - - -
High- G2 (3) 34.09 100 0 0 - 0 0 - - -
water G3 (3) 0 0 100 * - 0 0 - - -
2010 G4 (7) 0 0 * 100 - 0 0 - - -
G9 (3) 0 0 0 0 - 100 0 - - -
G10 (9) * 0 0 0 - 0 100 - - -
G1 (5) 100 0 0 0 - - 0 0 0 -
G2 (2) 0 100 0 0 - - 0 0 0 -
Low- G3 (9) 0 0 100 * - - 16.79 0 0 -
water G4 (7) 0 0 * 100 - - 0 0 0 -
2010 G10 (15) 0 0 10.36 0 - - 100 0 0 -
G11 (4) 0 0 0 0 - - 0 100 * -
G12 (3) 0 0 0 0 - - 0 * 100 -
G1 (4) 100 - 0 0 - 0 0 0 0 0
G3 (9) 0 - 100 * - 0 * 0 0 0
G4 (7) 0 - * 100 - 0 0 0 0 0
High- G9 (2) 0 - 0 0 - 100 48.31 0 0 *
water G10 (11) * - 6.86 0 - 19.21 100 0 0 0
2011 G11 (4) 0 - 0 0 - 0 0 100 * *
G12 (3) 0 - 0 0 - 0 0 18.26 100 0
G13 (3) 0 - 0 0 - * 0 * 0 100

90
Table 2. Territory total extent (TE, km) and exclusive territory (ET, km) of ten giant otter groups
monitored by radio-telemetry (RT) and direct observations (DO), during four seasons (dry season
of 2009, wet season of 2010, dry season of 2010, wet season of 2011), from June 2009 to June
2011, in the southern Pantanal, Brazil.
*Estimates should be considered with caution, as they are based on few locations (<20), ** There
was an expansion and/or shift of territory, which may have lead to overestimated sizes, and these
values were not used to calculate medians. 1Chapter 2.
Dry 2009 Wet 2010 Dry 2010 Wet 2011
Groups TE ET TE ET TE ET TE ET
G2 10.5 3.0 21.4 13.1 0.7* 0.7*
RT G10 7* 0* 22.2** 19.9** 23.9 16.1
G12 1.1 1.1 8.1 6.6
G1 17.81 9.1 23.1**
1 15.8 20.1*
1 20.1* 4.2* 4.2*
G3 14.21 7.3 14.8
1 14.8 13.7
1 11.4 4.9*
1 4.9*
1
G4 17.21 12.7 6.7*
1 6.7 0.3*
1 0.32* 4.1*
1 4.1*
1
DO G8 12.11 5.5
G9 13.01 6.0 8.5*
1 8.5 9.5 6.9
G11 9.4*1 9.4* 1.8*
1 1.8*
1
G13 1.6*1 1.6*
1
Median 13.61 6.7 18.1 13.9 7.4 6.3 9.5 6.9

91
Table 3. Territory fidelity (% overlap of territories among seasons) of six giant otter groups
between consecutive seasons (columns 1-3) and between same season (high- or dry) in different
years (columns 4-5), monitored from June 2009 to June 2011, in the southern Pantanal, Brazil.
Dry season = DS; wet season = WS.
Groups DS2009-
WS2010
WS2010-
DS2010
DS2010-
WS2011
DS2009-
DS2010
WS2010-
WS2011
G1 26.30 35.53 15.09
G2 43.2 100 0
G3 51.72 73.78 100 27.41
G9 0
G10 71.09
G12 0

92
CAPÍTULO 4
____________________________________________________________________________
Leuchtenberger, C.; Sousa-Lima; Magnusson. W. & Mourão, G. A
sentence is more than the sum of its words: vocal repertoire of the giant
otter. Manuscrito formatado para Animal Behaviour.

93
A sentence is more than the sum of its words: vocal repertoire of the giant
otter
Caroline Leuchtenberger a, b,*
, Renata Sousa-Limac, Nicole Duplaix
d, William Magnusson
a &
Guilherme Mourãob
a Graduate Program in Ecology, Instituto Nacional de Pesquisas da Amazônia - INPA, Brazil
b Laboratory of Wild Life, Embrapa Pantanal, Brazil
c Department of Physiology, Federal University of Rio Grande do Norte, Brazil
d Fisheries and Wildlife Department, Oregon State University, USA
Word count= 7965
*corresponding author - Postal address: Rua 21 de Setembro, n.1880, Nossa Senhora de Fátima,
79331-090, Corumbá – MS – Brazil, email: [email protected], telephone: + 55 67
33017895, fax: +55 67 32345815

94
The giant otter (Pteronura brasiliensis) is a highly social species. Knowledge of its vocal
repertoire is limited to qualitative descriptions and opportunistic recordings of sounds in specific
contexts. The aim of this study was to describe, qualitatively and quantitatively, the vocal
repertoire of giant otters in the Brazilian Pantanal and the distribution of call types across different
behavioral contexts.We classified 15 basic sound types emitted in different behavioural contexts
by otters of different ages. Cub calls and purrs were the most frequently emitted sounds. However,
the vocal repertoire of giant otters comprises a continuum of sound types, with combinations,
gradations and transitions that allow for a much larger repertoire than the 15 basic types, reflecting
the complex and subtle communication system used by this social species. Not only for giant
otters, but also for other social mammals, rather than defining subjective new sound types, it may
be more productive to describe vocalisations in multivariate space and relate these coordinates to
the presumed motivational states of the animals.
Keywords: communication, emission rate, Pteronura brasiliensis, social behaviour,
vocalisation.
95
Animals communicate through different kinds of signals, which presumably increase their
fitness (Bradbury & Vehrencamp 1998; Endler 2000; Wilson 2000). The content of signals may
provide information on the status, mood, and identity of senders and may vary according to the
behavioural context and the environment (Bradbury & Vehrencamp 1998). A way to understand
the communication system of a species is to pool the sets of signals used to deal with different
questions (Bradbury & Vehrencamp 1998; Lehner 1998). Different sound types within vocal
repertoires are associated with different behavioural contexts in a wide range of species, including
otters (e.g., Schassburger 1993; Sieber 1994; McShane et al. 1995; Wong et al. 1999).
The vocal repertoires of the social mustelids, such as sea otters (Enhydra lutris, McShane
et al. 1995) and badgers (Meles meles, Wong et al. 1999), seem to be more complex, containing
larger sets of sounds and compounds and graded signal structures than solitary species (Mustela
nivalis, Huff & Price 1968; Martes americana, Belan et al. 1978; Mustela eversamanni, Farley et
al. 1987; Aonyx cinereus, Lutrogale perspicillata, Lontra canadensis, Duplaix 1982, Lutra lutra,
Gnoli & Prigioni 1995). Highly social species display more complex interactions and behaviours
than solitary or non-social animals, which may adopt more complex communication systems
(Bradbury & Vehrencamp 1998; McComb & Semple 2005; Roux et al. 2009). Some social species
use of graded sounds and combinations, which increase the number of messages that can be
transmitted and add to the complexity of their vocal repertoire (Schassburger 1993; Wilson 2000).
Giant otters live in cohesive groups of two to 20 individuals (Duplaix 1980;
Leuchtenberger & Mourão 2008). Individuals in the group undertake almost all their daily
activities together and frequently scent-mark the banks of water bodies to delineate their territories
(Duplaix 1980, Leuchtenberger & Mourão 2009), and defending these areas from intruders with
loud choruses (Duplaix 1980, Ribas & Mourão 2004). However, knowledge of the vocal

96
communication of giant otters is limited to a few studies carried out with free-ranging animals in
the Guyanas and Amazon Basins (Duplaix 1980; Staib 2005; Bezerra et al. 2010), observations of
some captive animals originating from the Amazon and the Pantanal regions (Machado 2004), and
a few spectrographic descriptions of sounds emitted by free-ranging animals in specific contexts in
the Pantanal (Ribas & Mourão 2004; Leuchtenberger & Mourão 2009; Ribas et al. 2012). Despite
the information provided by these studies, the vocal communication of this highly social species is
poorly understood. In this study, we set out to document the vocal repertoire of giant otters in the
Brazilian Pantanal and the distribution of call types across different behavioral contexts.
METHODS
The study was carried out in an area of the Pantanal, a large, seasonally flooded wetland
covering approximately 160 000 km2 located at low altitude (75-200 m a.s.l), near the geographic
centre of South America (Mourão et al. 2010). The area is subject to a strong annual flood pulse
(Alho 2008). The Paraguay River is the main river draining the region from north to south, and
most of its tributaries flow from east to west, including the Miranda and Negro rivers (Fig. 1).
We monitored five giant otter groups (G1, G2, G4, G10 and G12) monthly, from September 2009
to June 2011, along a stretch of the Miranda River (19°36'S, 57° 00'W) and its tributary, the
Vermelho River (19o34'S; 57
o01'W). We monitored another four groups (G17 – G20) in the
Negro River (19o35'S; 56
o11'W) in September 2009, June and September 2010, and June 2011.
Each monthly field campaign lasted from 7 to 10 days. Most groups were located through the use
of boat-based visual surveys, which were carried out in daylight hours (5:00-19:00h), but three
groups were radio-tracked from November 2009 to June 2011 (G2, G10 and G12) as a part of a
spatial ecology study (Chapter 2). Giant otters were captured and implanted with radio-
transmitters using the methods described by Silveira et al. (2011, for more details see Chapter 2).

97
All handling and surgery procedures followed the guidelines of the American Society of
Mammalogists for the use of wild mammals in research (Sikes et al. 2011) and were authorised
under license n° 12 794/4 of the Brazilian Federal Environment Agency (IBAMA).
The locations of individuals, groups and signs of the species, such as dens and latrines,
were registered with a global positioning system receptor (Garmin Etrex, Inc., Olathe, KS). Once
located, the group was followed at a distance of 10 to 100 m, depending on the shyness and on
the reaction of the group to the observer, to avoid disturbance. Whenever possible, the behaviours
of individuals, their natural individualistic throat marks, and their sex were recorded using a high-
definition camcorder (Canon HF-200) during the whole observation period. Images were
analyzed to describe behaviour and identity of individuals. We also identified the hierarchy of
individuals within the group through specific behaviours, such as by defense position and
frequency of scent-marking or by the presence of lactation (for more details see Leuchtenberger
& Mourão 2009). Sounds were recorded with a directional microphone (Sennheiser ME-66)
connected to a digital Marantaz PMD-660 recorder (AIFF format, 16-bit resolution and 44.1 kHz
sampling rate). Behavioural samples of visible individuals vocalising (senders) were filmed ad
libitum (Altmann 1974), and the sounds were recorded concomitantly, from a maximum distance
of 50 m.
We classified the senders into three age categories according to the system of Groenendijk
et al. (2005): adults and sub-adults (>12 months), juveniles (6–12 months), and cubs (0–6
months). The behavioural context of the individual or group that vocalised was classified in the
following manner: i) close contact (CC), when two or more members of the same group
displayed affiliative contact; ii) grooming (GR), when individuals displayed self-grooming or
groomed other members of the group; iii) swimming (SW), when moving through the area; iv)
within den behaviour (DE), when cubs vocalised from within the den; v) scent-marking (SM),

98
when the individuals were scent marking and/or defecating; vi) isolation (IS), when the individual
was distant from the other members of the group and started to call looking around as if searching
for other individuals; vii) begging (BE), when an individual solicited a prey item from another;
viii) warning defense (WD), mainly when the individual caught a fish and/or was eating, he
vocalized an advertisement sound to keep other otters away; ix) inquiry (IN), when individuals
investigated something new in their environment, sometimes adopting a periscoping posture; x)
alarmed (AL), when an individual was startled and its behaviour generated attention or led the
other members of the group to escape; xi) intraspecific agonistic encounter (IA), when the
individual or the group interacted negatively (physically or vocally) with a conspecific intruder;
and xii) interspecific encounter (IE), when an individual or a group faced a caiman (Caiman
crocodilus yacare).
The emission rate was estimated from the number of sounds emitted by all group
members combined during each monitoring period. The average emission rate per individual was
subsequently divided by the number of individuals present during the recording period. The
monitoring interval was counted from the beginning of the visual detection of the group or
individual at a maximum distance of 50 m until the end of observations, when they were lost
form sight. The monitoring was restarted when the same or another individual or group was re-
located during the same day. The emission rate of sounds emitted exclusively by a particular age
category was calculated, normalising for the monitoring time in which that individual was present
during the sampling. To determine emission rates, we only considered sounds recorded from six
of the groups monitored (G1, G2, G10, G17, G18 and G20), because three groups (G4, G12 and
G19) were very shy, which might have compromised our ability to approach without disturbing
their normal behaviour. Even within the groups that we considered in our analyses, sounds

99
clearly emitted in response to the presence of the observers were not used to estimate emission
rates.
Acoustical analyses
Acoustic analyses were performed using Raven Pro 1.4 (Cornell Lab of Ornithology),
applying the following settings for spectrograms and power spectra: Hanning window; FFT size
= 1024 and 50% overlap. Sound parameters were measured in spectrograms, oscillograms and
power spectra (Fig. 2) and were used to describe and/or compare vocalisations: (CD) call
duration, (LF) lowest frequency of the sound, (HF) highest frequency of the sound, (PF) peak
frequency of the entire sound, (Q3) 3rd quartile frequency, this value is computed automatically
by the software and represents the frequency that divides the selection into two frequency
intervals containing 75% and 25% of the energy in the selection, (PU) number of pulses
(temporal units that repeat rhythmically) of the sound, (FI) initial frequency of F0 (for harmonic
sounds) or of the peak frequency (for non-harmonic sounds), (FM) maximum frequency of F0 or
PF, (FF) final frequency of F0 or PF, (FD) difference between the highest and the lowest
frequency of F0 or PF, (D1) duration from the start of the vocalisation to the highest frequency
value of F0 or PF, (D2) duration from the highest frequency of F0 or PF to the end of the
vocalisation, and (PD) plateau duration (when the frequency of F0 or PF did not vary). The
number of pulses was measured using oscillograms for sounds that presented stretches with
regularly spaced pulses (e.g., coo-call, purr, snort, adult and cub growls, scream and scream-
gurgle), and for sounds that presented a large number (>10) of pulses, we estimated the number
of pulses by dividing the duration of pulsed stretches by the inter-pulse interval within that
stretch. The sound parameters are presented as the mean and standard deviation (SD) of the mean
or median and its respective ranges. Sound types were classified according to the species vocal

100
description first elaborated by Duplaix (1980). Spectrogram and oscillogram figures were
produced with R software using the function spectro in the package seewave (Sueur et al. 2008).
Statistical Analyses
All statistical analyses were undertaken using R 2.13 Software (R Foundation for
Statistical Computing, 2011). The vocal repertoire of giant otters is derived from a continuum,
with transitions, gradations and combinations among different sound types. However, based on
13 structural characteristics, we visually classified 15 discrete sound types. We then standardised
the acoustic parameters by columns and rows using the decostand function with the total method
in the Vegan package (Oksanen et al. 2008) and used a nested nonparametric multivariate
permutational analysis of variance (PERMANOVA, age categories nested within sound types) to
identify differences among sound types. We used the PERMANOVA analysis with 1000
permutations, which permutes the distance matrix (Manhattan method) of acoustic parameters,
through the adonis function in the Vegan package.
A linear discriminant analysis (LDA) was carried out to estimate the distinctiveness
between sound types, using the package MASS (Venables & Ripley 2002). We applied the first
step of LDA with a sorted (training) subset of 50% of the data. The remaining (validation) subset
of data was used to evaluate the accuracy of classification based on the equations derived from
the training subset. The percentage of correctly classified cases indicates the effectiveness of
discriminant function in distinguishing groups (vocalisation type). We only used four variables to
estimate the LDA among sound types (PF, Q3, FD, PU), because the other variables did not
conform to the linearity assumptions of the analysis.
Because some of the sound types were expected to be subdivided between age categories,
we applied a PERMANOVA with 1000 permutations (adonis, Vegan package) to test for these
differences. We then conducted a hierarchical clustering analysis taking into account these

101
subdivisions. For this analysis, we used a Manhattan-distance matrix of the median values of the
variables extracted from each sound type and the average linkage between groups (UPGMA).
This analysis results in a dendrogram that represents the similarity between sound clusters (Wong
et al. 1999).
A principal-coordinate analysis (PCoA) was carried out to ordinate the 13 acoustic
variables of the 15 main sound types from the Manhattan-distance matrix. To avoid distortions of
the configuration due to extreme points from the PCoA, we corrected 53.3% of the distances
using the ―extended‖ procedure available in the stepacross function from the package Vegan. We
used a PERMANOVA (1000 permutations, adonis, Vegan package) to test whether the context
associated with the emissions of sounds was statistically associated with the ordination of
acoustic variables (i.e., the first three axis of the PCoA).
RESULTS
The giant otter groups included 43 adults (20 males, 16 females and 7 unknown), 4
juveniles (2 male, 1 female and 1 unknown) and 25 cubs (1 male, 1 female and 23 unknown).
During the study period, eight cubs became juveniles, and three of the juveniles became adults.
Group size varied from 2 to 15 individuals, with an average of 6 individuals.
We recorded 6246 vocalisations during 112 hours of monitoring. The individual total
emission rate was 11.4 sounds/h (Table 1), and the frequency of individual sound types varied
from the infrequently emitted cub squeak (0.03 sounds/h) to the more frequent cub call (3.4
sounds/h). We included only 458 of the total recorded sounds for the vocal-repertoire analysis (379
from adults/sub-adults, 9 from juveniles and 70 from cubs), because most of the recordings
overlapped with sounds from motor boats and/or vocalisations of other species or non-focal giant
otters.

102
The vocal repertoire of giant otters was classified into 15 discrete sound types
(PERMANOVA: F14, 443= 130.66, R2=0.81, P<0.001), of which seven were emitted only by adults
and sub-adults; one, by juveniles and cubs; two, exclusively by cubs; and five, by all age
categories. Linear discriminant analysis correctly classified 74% of the sound types. The first two
discriminant functions explained 92% of the variance in sound variables. The number of pulses
was the variable that contributed most to the first discriminant function, while the difference
between the highest and the lowest frequency of F0 or PF (FD) was the most important variable in
the second discriminant function.
Some of the main sounds could be subdivided into two types, depending on the age of the
sender animal, resulting in a total of 19 distinct sounds (Fig. 3). The begging scream of adults/sub
adults and cubs/juveniles differed (PERMANOVA: F1,19=3.35, P=0.016), but it accounted for little
of the variance in the data (R2=0.15). The cub growl differed from adult growls (PERMANOVA:
F1,25=14.53, P<0.001), but the difference explained a relatively low proportion of the variance in
the data (R2=0.37), and as the cub sound could be classified aurally as a growl, we considered them
to be the same sound type. The high scream of cubs and adults (PERMANOVA: F1,12=0.78,
P=0.536) did not differ, although the high scream of some adults had nonlinear components and
the adult/sub-adult and cub screams also did not differ statistically (PERMANOVA: F1, 27=1.35,
P=0.232).
Vocal Repertoire
Coo. The coo is a discrete harmonic sound (Fig. 4a) vocalised with the mouth closed and
was heard only at close range (to approximately 10 m). The average coo duration was 0.36 (SD=
0.11 s), with two harmonic parts or notes: an ascendant (D1: X + SD= 0.15 + 0.06 s, Table 2) in the
beginning of the coo and a descendant segment (D2: X + SD= 0.07 + 0.03 s) at the end,
interspersed by an interval of silence (PL: X + SD= 0.16 + 0.09 s). Pulses (PU: X + SD= 109.67 +

103
29.19 pulses) were visible in part or through the entire harmonic segment. The mean of F0 ranged
from 0.27 (SD= 0.06) kHz to 0.52 (SD= 0.06) kHz, with an average peak frequency of 0.45 (SD=
0.05) kHz. Context: Coos were emitted at a rate of 1.1 sounds/h (Table 1). This chevron-shaped
double-note sound was emitted mainly during close-contact episodes (51%, n=290), especially
when adults were caring for cubs, but also during scent-marking events (26%, n=148). Adults
cooed when they met during swimming (14%, n=80), sometimes touching their noses, and before
changing their activity or leaving the site. Coos were also emitted during grooming sessions (9%,
n=51).
Coo-hum. This low sound is emitted with the mouth closed, and it seems to be a
combination of the coo (Fig. 4a) and the hum (Fig. 4d) sounds. The coo-hum is a harmonic sound
with at least three visible harmonics and mean call duration 0.2 s (SD= 0.09 s, Fig. 4b), with pulses
(PU: X +SD= 98.7 + 45.88 pulses) through the entire duration of the sequence or in segments of
the sound. The F0 is frequency modulated and begins at a low frequency (F1: X + SD= 0.25 + 0.04
kHz), rising to a mean of 0.43 (SD= 0.08) kHz for a mean of 0.11 (SD =0.07) s and then
decreasing towards the end of the sequence of continuous sound. Context: Adults vocalised coo-
hums at a rate of 0.7 sounds/h (Table 1). Coo-hums were mainly emitted during close-contact
events (72%, n=226), when individuals were swimming together (12%, n=38), grooming (9%,
n=28) and scent marking (5%, n=16) and were emitted in behavioural contexts similar to those in
which coos were produced. However, this sound was also emitted when an adult called other
individuals, independent of their ages, to come out of the den (2%, n=6).
Coo-call. The coo-call is louder than coos and coo-hums, with an average duration of 0.44
(SD= 0.13) s, and is vocalised with the mouth partially closed. This sound seems to be a
combination between the coo (Fig. 4a) and adult calls (Fig. 4j). It has an abrupt transition from an
ascendant low-pitch harmonic and pulsed segment resembling a coo to a high-pitch bell-shaped

104
frequency modulated harmonic sound similar to the adult call and then reverts back to a
descendant pulsed sound at the end of the sound (Fig. 4c). The middle part of this sound may have
a plateau (median of 0.03 s, ranging from 0.01 to 0.2 s) with a constant frequency (X + SD= 4.32 +
1.14 kHz). The minimum F0 average of the beginning and end segments were 0.26 (SD= 0.1) kHz
and 0.34 (SD= 0.1) kHz, respectively. Context: Coo-calls were vocalised at a rate of 0.3 sounds/h
(Table 1) when the animal appeared to be in an intense motivational state, mainly in close-contact
events (64%, n=124). This sound was also used for calling to other members of the group (16%,
n=31), as well as during scent-marking events (12%, n=23) and swimming (8%, n=15).
Hum. The hum is a low sound emitted with the mouth closed. It had at least five visible
harmonics (Fig. 4d), lasting an average of 0.33 (SD= 0.19) s, with some segments of regular pulses
(PU: X + SD= 80.4 + 48.2 pulses). The mean beginning frequency of F0 was 0.23 (SD= 0.04) kHz,
which increased to a mean of 0.27 (SD= 0.07) kHz at the end of the sound. Context: The hum
emission rate was 0.5 sounds/h (Table 1), and this sound was observed more frequently during
affiliative close contacts (55%, n=123), followed by scent-marking events (21%, n=47) and
grooming (19%, n=43). This type of sound was observed less often during swimming (5%, n=11).
The hum was commonly produced in combination with purrs (hum-purr, Fig. 6a) and growls
(hum-growl, Fig. 6b).
Purr. The purr is a low, harmonic and pulsed sound that is vocalised with the mouth closed
and has a nasal quality (Fig. 4e). This sound had a call duration average of 0.54 (SD= 0.27) s and
an average of 11.65 (SD= 5.25) pulses. The average value of F0 was 0.21 (SD= 0.01) kHz, and the
peak frequency average (X + SD= 0.42 + 0.07 kHz) was concentrated on the second harmonic.
Context: Purr was the most frequent vocalisation of adults, with an emission rate of 3 sounds/h
(Table 1). This sound was emitted during similar behavioural contexts to coos and hums and was
more frequently observed during close contact (52%, n=733). Gradations between the close

105
contact coo, coo-hum and coo-call sounds were commonly combined with hums and purrs (Fig.
5c). Peters (2002) suggested that the term purr is not adequate for similar sounds observed in
mustelids because it is not homologous to felid purring. However, considering the low amplitude
and rhythmic characteristics of this sound and the behavioural context in which giant otters emitted
purrs, we maintained this term in the species‘ vocal repertoire.
Growl. Growl is a low, harmonic and pulsed sound emitted with the mouth totally or
partially closed and may present amplitude modulation along the signal, with increasing energy
towards the end of the sound (Fig. 4f). The mean duration of this sound was 2.35 (SD= 1.71) s, and
a high number of pulses (X + SD= 516.94 + 339.27 pulses) and high values of the 3rd quartile
frequency (X + SD= 2.16 + 0.77 kHz) were observed. The mean values of minimum and maximum
F0 frequency were 0.20 (SD= 0.03) kHz and 0.22 (SD= 0.04) kHz, respectively, with at least four
visible harmonics at distances greater than 20 m and at least eight at closer range. Context: Adults
growled at a rate of 0.3 sounds/h (Table 1). Growls were emitted mainly in warning and defense
contexts (74%, n=107), when the vocalising individual was handling and eating a fish or it was
directed toward another individual trying to steal it. While eating and growling, the individuals
sometimes opened their mouths, producing a more intense sound with a slight increase in
frequency. Startled individuals also growled as an alarm (24%, n=35) and during inter-specific
encounters (2%, n=3) with caimans (Caiman crocodilus yacare).
Cub growl. The cub growl is a pulsed (PU: X + SD= 115.8 + 63.62 pulses) sound with
harmonic interval (F1, F2, FM: X + SD= 0.22 + 0.01 kHz). The mean duration was 0.46 (SD=
0.25) s, with no frequency modulation. The peak frequency coincided with the second harmonic,
with a mean value of 0.44 (SD= 0.02) kHz. Context: This sound was recorded from newborn cubs
(1-3 months) inside the den at a rate of 0.1 sounds/h (Fig. 4g).

106
Snort. The snort is an explosive, noisy and pulsed sound, emitted during strong exhalations
of air with the mouth partially open. While snorting in water, the animals commonly raised their
throat out of the water (periscoping). Snorts had a call duration average of 0.27 (SD= 0.1) s and a
mean of 6.55 (SD= 2.35) pulses. The average peak frequency was 1.47 (SD= 0.74) kHz, and 75%
of the energy of the sound was concentrated in a mean frequency of 2.63 (SD= 0.67) kHz. Snorts
can be emitted as a single note or in double bursts. The snort burst was often louder when the
animal was startled and may serve to alert other members of the group. Five formants were visible
along the spectrogram of the snorts (Fig. 4h). The snort was the second most emitted sound type
observed (1.4 sounds/h, Table 1), vocalised by all age categories, including five-month-old cubs.
Context: This sound was usually emitted during alarm situations (93%, n=726). Snorts were also
emitted during intra-specific agonistic encounters (5%, n=39) between different groups and inter-
specific events (2%, n=16) when the group faced caimans.
Hah. This noisy and atonal sound was produced by exhalation and/or inhalation (Fig. 4i).
The hah is a short sound with mean duration of 0.16 (SD= 0.07) s and an average peak frequency
of 1.56 (SD= 0.63) kHz. Context: Hahs were emitted mostly in low alarm situations in an inquiry
context (100%, n=174). In conflict situations, groups may emit sequential hahs combined with
snorts (Fig. 6d). Hahs were emitted at a rate of 0.3 sounds/h and can transition into either alarm or
affiliative sounds.
Adult call. The adult call is a harmonic bell-shaped sound (Fig. 4j), vocalised with the
mouth partially open. The mean call duration was 0.3 (SD= 0.1) s, with the plateau lasting from
0.01 to 0.26 s (Median= 0.05 s). At least two harmonics were visible with the peak frequency (X +
SD= 4.42 + 1.51 kHz) restricted to the F0. The FI had a median value of 0.56 kHz (ranging from
0.217 to 4.15 kHz) and reached its highest value of 5.94 (SD= 1.42) kHz at approximately 0.14
(SD= 0.04) s. Adults emitted 0.2 adult calls/h (Table 1). Context: This sound was vocalised mainly

107
when animals were calling to another member of the group (74%, n=120), which sometimes
elicited a response from other individuals that called back with either calls or screams. During
intra-specific agonistic encounters (21%, n=33) adult calls were emitted in combinations with
screams and snorts. Adult calls were also emitted when individuals were startled (5%, n=8). The
ending of this sound became harsher and noisier (Fig. 6e) or transitioned to a scream as the senders
became more excited.
Adult scream. This harmonic sound, which may have a wavering quality, was emitted with
the mouth open. This sound has some pulsed segments (X + SD= 466.35 + 202.72 pulses), a mean
duration of 0.93 (SD= 0.41) s and at least eleven visible harmonics (Fig. 4l). The average value of
F0 varied from 0.35 (SD= 0.06) kHz in the beginning of the signal to 0.43 (SD= 0.06) kHz at the
end, with a high-frequency mean value of 0.48 (SD= 0.08) kHz. The peak frequency exhibited a
mean of 1.56 (SD= 0.64) kHz. Context: This sound was emitted at a rate of 0.5 sounds/h (Table 1),
mainly in situations where it apparently was used as a warning (47%, n=145) during fishing
events. The individual that had caught a fish (especially if the fish was large) usually screamed
with the prey in its mouth or in its forepaws. This sound was also emitted by giant otters that tried
to steal prey caught by another group member, which was usually answered with growls. When the
motivation of the individual sender appeared to be more intense, screams showed chaotic
components towards the end of the signal (Fig. 6g) or the scream merged into a begging scream.
Adult screams were also emitted when individuals called to each other (39%, n=121). For instance,
individuals screamed to get cubs out from the den, or if an individual was not keeping up with the
rest of the group during excursions, the individual may scream as a signal to wait up, which may
be answered with other screams by individuals ahead of it. Moreover, individuals screamed (9%,
n=28) when startled, apparently as an alarm for others. Screams may also become harsher in

108
hostile situations, as during intra-specific agonistic encounters (5%, n=16) when almost all
members of the group screamed in a chorus interspersed with abrupt calls (Fig. 6h).
Cub scream. This harmonic scream presented in pulsed segments (X + SD= 268.22 +
146.67 pulses) with a mean duration of 0.81 (SD= 0.44) s (Fig. 4m). Ten to 24 harmonics were
visible. The mean frequency in the beginning of the F0 was 0.32 (SD= 0.07) s, rising to a
maximum mean value of 0.37 (SD= 0.05) kHz and then decreasing to a mean value of 0.34 (SD=
0.05) kHz. Context: This scream was emitted by young cubs at a rate of 0.2 sounds/h from within
the den.
Begging scream. This sound is derived from the adult scream but with a highly frequency
modulated tonal component along parts of the signal or throughout the entire sound (Fig. 5a). The
begging scream was produced by opening and closing the mouth when in high-intensity
motivational states. The mean begging scream duration was 1.21 (SD= 1.03) s. The mean F0
frequency value was 0.39 (SD= 0.1) kHz in the beginning, rising to 0.49 (SD= 0.09) kHz and
decreasing to a mean of 0.36 (SD= 0.09) kHz at the end of the sound. The peak frequency (PF: X +
SD= 3.13 + 1.82 kHz) was higher than that for the adult scream because of the high modulation
index of the tonal component that modulates this sound from a minimum PF of 1.17 (SD= 0.39)
kHz to a maximum PF of 6 (SD= 1.32) kHz. Context: The begging scream was emitted at a rate of
0.3 sounds/h (Table 1) in a begging context during fishing events (58%, n=86) and during
agonistic encounters (32%, n=48). Individuals sometimes screamed when scent marking (10%,
n=15), probably in response to an intruder‘s scent.
Cub begging scream. This scream lasted a mean of 2.65 (SD= 1.39) s. The mean value of
the F0 was 0.33 (SD= 0.03) kHz at the beginning of the sound, reaching a maximum value of 3.22
kHz (median of 0.48 kHz) and ending with an average frequency of 0.37 (SD= 0.04) kHz. The
peak frequency was higher than that of the adult scream, with a mean value of 2.67 (SD= 0.87)

109
kHz. The tonal component ranged from a minimum PF of 1.59 (SD= 0.07) kHz to a maximum of
5.69 (SD= 1.83) kHz. Context: Cub begging screams were emitted at a rate of 0.7 sounds/h, when
begging for fish (n=155).
High scream. This harmonic scream was vocalised with the mouth open. The median call
duration of adult high screams was 0.94 s (ranging from 0.36 to 2.25 s, Fig. 5b). Unlike the adult
scream, the peak frequency values were found for F0. The start frequency of F0 ranged from 0.39
to 6.09 kHz, ascending to a mean frequency of 6.31 (SD= 1.05) kHz and decreasing to 3.02 (SD=
1.88) kHz at the end. This sound showed nonlinear phenomena, including subharmonics and
biphonation at irregular time intervals. Context: High screams were heard only in five fishing
events (emission rate= 0.1 sounds/h, n=25), when the adult begged for a fish from another group
member. High screams were often combined in a continuous sequence with adult screams.
Cub high scream. This scream showed at least three visible harmonics (Fig. 5c) and was
recorded from young cubs (1-3 months) within the den. The median duration of this scream was
0.46 s (ranging from 0.29 to 0.95 s). The F0 began at a frequency of 3.03 (SD= 1.71) kHz,
ascended to a maximum frequency of 5.19 (SD= 1.96) kHz and then decreased to 2.83 (SD= 0.98)
kHz towards the end. Context: This sound was emitted at a rate of 0.05 sounds/h and sometimes
displayed a gradation distinct from cub screams (Fig. 6i).
Cub call. This high pitched and loud sound is emitted with the mouth open (Fig. 5d). Cub
calls were frequency modulated with a mean duration of 0.35 (SD= 0.15) s and sometimes showed
a plateau in frequency of variable intervals (median 0.03 s, ranging from 0 to 0.34 s). The mean F0
was 3.17 (SD= 2.12) kHz in the beginning, ascending to an average frequency of 8.83 (SD= 1.92)
kHz, with a mean interval of 0.13, (SD= 0.06) s and then decreasing to a mean frequency of 5.54
(SD= 2.82) kHz. Context: Cub calls were the most frequent (Emission rate = 3.4 sounds/h) sounds,
and they were vocalised by individuals ranging from 2 to 9 months of age (Table 1). This sound

110
was mainly emitted when cubs were calling to others (59%, n= 811), typically when they were
separated from the group. Cubs also used this type of sound to beg for fish (31%, n= 426) during
fishing sessions. During more excited states, these calls may have a harsher ending (Fig. 6f) or
merge into a longer and high-frequency modulated begging scream. Cubs also called when cared
for by adults (10%, n=137) in close-contact events.
Scream-gurgle. The scream-gurgle is a harmonic sound with a mean duration of 1.01 (SD=
0.1) s. This sound begins with a pulsed scream (PU: X + SD= 227.17 + 33.89 pulses) and ascends
to a high-frequency interval, comprising four to five bell-shaped frequency modulated parts
interspersed by short screams (Fig. 5e). The scream part has a mean F0 value of 0.24 (SD= 0.03)
kHz at the beginning of the sound and 0.33 (SD= 0.04) kHz at the end of the sound. The middle
bell-shaped parts of this sound have a maximum F0 of 7.83 (SD= 0.9) kHz. The peak frequency
value was found in the scream structure with a mean value of 0.75 (SD= 0.26) kHz. Context:
Scream-gurgles were vocalised by young cubs inside the den at a rate of 0.1 sounds/h, and other
cubs frequently vocalised screams and high screams in the background. All scream-gurgles were
vocalised when the lactating female was in the den. On one occasion, the cubs were seen emitting
scream-gurgles while suckling from the female, which was lying near the den entrance.
Squeak. This harmonic sound was recorded only from two-month-old cubs from one
group, resulting in an emission rate of 0.03 sounds/h. The mean duration of squeaks was 0.44
(SD= 0.1) s, with a peak frequency of 8.38 (SD= 0.65) kHz (Fig. 5f). The mean frequency of F0 at
the beginning of the sound was 0.52 (SD= 0.06) kHz, rising to an average maximum frequency of
0.72 (SD= 0.07) kHz. Context: This sound was vocalised during a close contact event, while adults
were caring for cubs, emitting purrs, coos and hums in the background.
The PCoA analysis resulted in three axes that accounted for 56% of the variation among
sounds types, with 27.7% of the variation represented by the first axis; 17.1%, by the second axis;
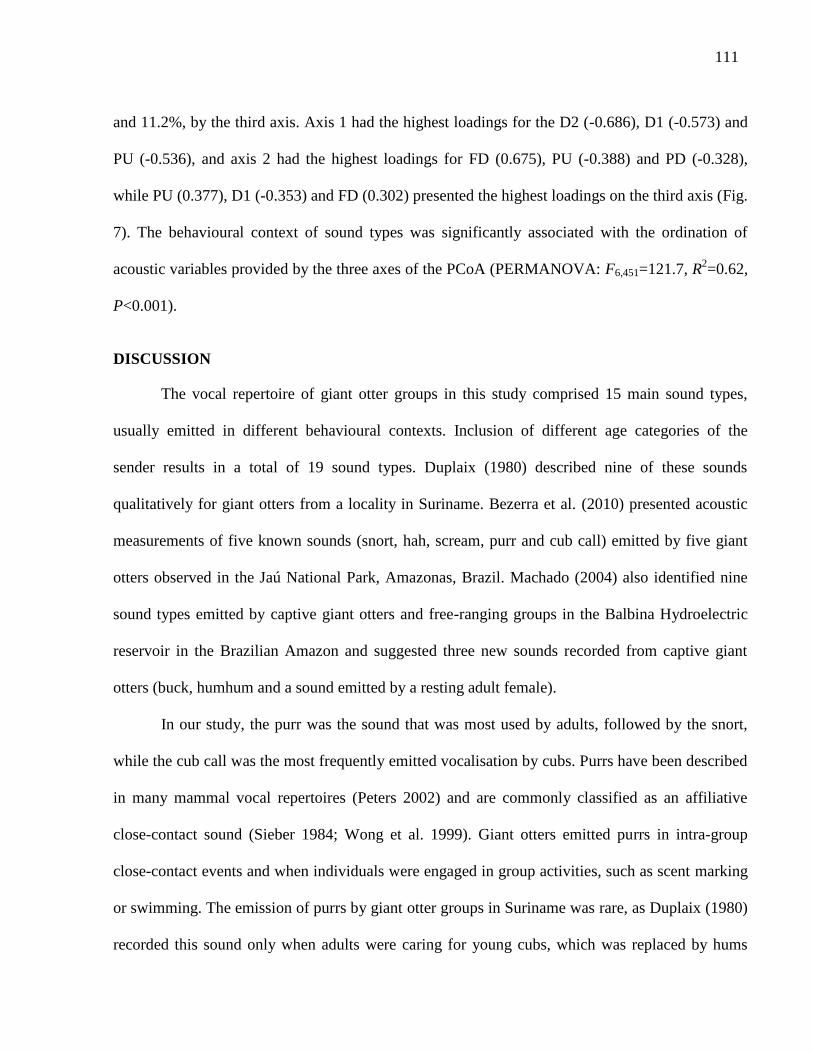
111
and 11.2%, by the third axis. Axis 1 had the highest loadings for the D2 (-0.686), D1 (-0.573) and
PU (-0.536), and axis 2 had the highest loadings for FD (0.675), PU (-0.388) and PD (-0.328),
while PU (0.377), D1 (-0.353) and FD (0.302) presented the highest loadings on the third axis (Fig.
7). The behavioural context of sound types was significantly associated with the ordination of
acoustic variables provided by the three axes of the PCoA (PERMANOVA: F6,451=121.7, R2=0.62,
P<0.001).
DISCUSSION
The vocal repertoire of giant otter groups in this study comprised 15 main sound types,
usually emitted in different behavioural contexts. Inclusion of different age categories of the
sender results in a total of 19 sound types. Duplaix (1980) described nine of these sounds
qualitatively for giant otters from a locality in Suriname. Bezerra et al. (2010) presented acoustic
measurements of five known sounds (snort, hah, scream, purr and cub call) emitted by five giant
otters observed in the Jaú National Park, Amazonas, Brazil. Machado (2004) also identified nine
sound types emitted by captive giant otters and free-ranging groups in the Balbina Hydroelectric
reservoir in the Brazilian Amazon and suggested three new sounds recorded from captive giant
otters (buck, humhum and a sound emitted by a resting adult female).
In our study, the purr was the sound that was most used by adults, followed by the snort,
while the cub call was the most frequently emitted vocalisation by cubs. Purrs have been described
in many mammal vocal repertoires (Peters 2002) and are commonly classified as an affiliative
close-contact sound (Sieber 1984; Wong et al. 1999). Giant otters emitted purrs in intra-group
close-contact events and when individuals were engaged in group activities, such as scent marking
or swimming. The emission of purrs by giant otter groups in Suriname was rare, as Duplaix (1980)
recorded this sound only when adults were caring for young cubs, which was replaced by hums

112
and coos as cubs grew. However, Bezerra et al. (2010) recorded purrs vocalised by a giant otter
group in the Amazon but did not mention hums or coos, which were relatively common in our
study (emission rate, hum=0.5 sounds/h and coo=1.1 sounds/h). Snorts, hahs, adult screams and
cub calls seem to be common vocalisations in the repertoire of giant otters, as they have been
described by many authors (Duplaix 1980; Machado 2004; Staib 2005; Bezerra et al. 2010; this
study). Variation in repertoire sizes as well as call-emission rates among giant otters from different
localities may be a consequence of differences in environmental features, learning, or genetic
variation among clades (Bradbury & Vehrencamp 1998; Wilson 2000).
The ability to detect rare sound types may be compromised by limited opportunities to
witness specific behaviours, such as the newborn cub‘s squeaks recorded from young cubs by
Duplaix (1980). Some sounds, such as the cub growl, scream-gurgle, scream, and high scream
were first reported in the present study. Morales-Betancourt (2011) described a comfort sound that
may refer to the scream-gurgle sound, which was emitted by a captive juvenile male before
sleeping and performing a suckling-like movement. Tonal whistles were recorded once by Duplaix
(1980) during an intra-group event in Suriname. Ribas & Mourão (2004) also mentioned whistles
during an agonistic encounter between a giant otter group and a solitary male in the Pantanal, but
the sound presented a harmonic structure, characteristic of adult calls, as we witnessed in five other
agonistic encounters between giant otter groups.
The vocal repertoire of a species includes a variation of sounds, which may transmit a
corresponding number of messages (Bradbury & Vehrencamp 1998). The giant otter snort is a
sound type that is also found in the repertoire of other mammals (Sieber 1994; Wong et al. 1999)
and that is commonly emitted in alarm situations. In giant otters, more energetic snorts (with
increasing amplitude) cause an immediate response of group members, which usually run to the
water and submerge. The atonal hah appears to mean an inquiry (Duplaix 1980), and it is similar to

113
the hiss sound commonly vocalised in aggressive and fearful contexts by sea otters (McShane et al.
1995) and other mustelids (Huff & Price 1968; Farley et al. 1987; Wong et al. 1999). Screams and
harmonic sounds are frequent in the repertoires of many species (McShane et al. 1995; Wong et al.
1999, Fitch et al. 2002), and they may provide identity information and have an important function
in group cohesion, as they can be heard at great distances (McComb & Reby 2005). Some physical
features of sounds, such as the presence of formants in the snorts and the fundamental frequency of
harmonic sounds, can be considered an ‗honest‘ indication of body size and individual identity
(McShane et al. 1995; Sousa-Lima et al. 2002; Fitch et al. 2002; Taylor & Reby 2010), and they
should be considered in studies of acoustic individuality in the species.
Nonlinear components, shown as chaotic structures, biphonations and subharmonics, were
observed in adult screams and high screams. These acoustic phenomena originate from the
intrinsic properties of the vibrating components of the larynx (Fitch et al. 2002; Tokuda et al.
2005) but may also be produced by the presence of systemic infection or diseases in the vocal tract
(Riede et al. 1997). The presence of nonlinear components has been observed in many other
mammalian vocalisations (Wilden et al. 1998; Riede et al. 2000; Fitch et al. 2002; Sousa-Lima et
al. 2002; Blumstein et al. 2008; Riede et al. 2008) and may be a means of achieving individual
recognition (McComb & Reby 2005). However, in some mammals, the presence of non-linearity
in sounds may indicate the arousal state of individuals (Marmota flaviventris, Blumstein et al.
2008; Ailuropoda melanoleuca, Briefer et al. 2012; Stoeger et al. 2012).
The behavioural contexts of sound types were significantly associated with the acoustic
variables. The main variables of the three axes of the PCoA were related to the duration and shape
of the sound (D1, D2, FD) and the number of pulses (PU). According to Briefer et al. (2012), there
is a positive relationship between arousal level and some acoustic variables, such as call duration,
F0 range and F0 contour. This observation is consistent with the motivational structure (MS)

114
model, which hypothesises that sounds vocalised in aggressive and hostile situations are low
frequency and noisy and that sounds vocalised in fearful or friendly contexts are high frequency
and tonal (Collias 1960; Morton, 1977; August & Anderson 1987). In the giant otter vocal
repertoire, alarm, inquiry and warning sounds were noisier and occurred at lower frequency, while
calls and some scream types were harmonic and had higher frequencies. In more excited
motivational states, the endpoint of adult calls and screams becomes harsher and noisier, indicating
a high degree of individual hostility, as suggested by Morton (1977). The harmonic coo sounds
vocalised in close contacts changed from a lower amplitude coo with a silent interval to a
combination coo-hum and, in a more excited state, to a coo-call with a high frequency interval,
which may elicit proximity in affiliative contexts. Although there is much overlap between fearful
and friendly contexts (August & Anderson 1987), the vocal repertoire of giant otters seems to be
consistent with the MS hypothesis and may reflect the arousal state of individuals.
Transitions and gradations may increase the variability of sound combinations and convey
more information than discrete signals (Wilson 2000). The vocal repertoire of giant otters can be
classified as a continuum, presenting graded sounds that were common during affiliative close
contacts and in more excited and agonistic events. The combination of sounds, as between the hum
and the affiliative purr, or the hum with the aggressive growl, probably increases the amount of
decodable information (Crockford & Boesch 2005). During agonistic encounters, adult screams
became modulated and turned into abrupt calls generating a harsh and long chorus (Ribas &
Mourão 2004; this study). During some excited fishing events, as well as during suckling, screams
and cub calls graded to begging screams or high screams.
Giant otter vocal repertoires represent a good example of how communication is
intrinsically linked with sociality (Pollard & Blummstein 2012). The presence of gradations and
transitions in the vocal repertoire of giant otters reflect their high degree of sociality, as previously

115
suggested (Duplaix 1980; 1982) and observed in other social mammals (Canis lupus, Schassburger
1993; E. lutris, McShane et al. 1995; Wilden et al. 1998; M. meles, Wong et al. 1999; Pan
troglodytes, Crockford & Boesch 2005). The variety of sound types and possible combinations, as
well as the function of nonlinear components in giant otter vocalisations, should be considered in
future acoustic studies, as these components may indicate an important mechanism in the
communication system of the species. Although giant otter vocalisations can be subjectively
divided into a few dozen categories, they occupy almost all of the available multivariate space
when analysed as continuous variables. Not only for giant otters, but also for other social
mammals, rather than defining subjective new sound types, it may be more productive to describe
vocalisations in multivariate space and relate these coordinates to presumed motivational states of
the animals involved.
ACKNOWLEDGMENTS
We thank CNPq (grant n. 476939/2008-9), the Rufford Small Grants Foundation (grant n.
88.08.09), the Mohamed bin Zayed Species Conservation Fund (project n. 10051040) and IDEA
Wild for their financial support. We are also indebted to Embrapa Pantanal, Barranco Alto Farm
and the Federal University of Mato Grosso do Sul for their logistic support. C.L. was the recipient
of a CNPq scholarship. Paulo R. dos Santos, Waldomiro de L. e Silva, Sidnei Benício, Procópio de
Almeida and José A. D. da Silva assisted us in the field. Carlos A. Zucco and Victor Landeiro
helped us with some of the data analysis. We thank Victor Sábato and Luciana Erdtman for useful
suggestions. We are grateful to Ubiratan Piovezan for lending equipment during field work.

116
RESUMO
Ariranha (Pteronura brasiliensis) é uma espécie altamente social. O conhecimento de seu
repertório vocal é limitado a descrições qualitativas e gravações oportunísticas de sons em
contextos específicos. O objetivo deste estudo foi descrever, qualitativamente e quantitativamente,
o repertório vocal de ariranhas no Pantanal Brasileiro e a distribuição dos tipos sonoros em
diferentes contextos comportamentais. Nós classificamos 15 tipos sonoros básicos emitidos por
ariranhas de diferentes idades, em diferentes contextos comportamentais. Chamados de filhotes e
purrs foram os sons emitidos mais frequentemente. No entanto, o repertório vocal de ariranhas
compreende um contínuo de tipos sonoros, com combinações, gradações e transições que
proporcionam um repertório maior do que os 15 tipos básicos, refletindo o sistema de comunicação
complexo usado por essa espécie social. Não apenas para ariranhas, mas também para outros
mamíferos sociais, em vez de apenas definir novos tipos sonoros, pode ser mais produtivo
descrever vocalizações em um espaço multivariado e relacionar essas coordenadas com o estado
motivacional dos animais.
Keywords: comunicação, taxa de emissão, Pteronura brasiliensis, comportamento social,
vocalisação.

117
REFERENCES
Alho, C. J. R. 2008. Biodiversity of the Pantanal: response to seasonal flooding regime and to
environmental degradation. Brazilian Journal of Biology, 68(4), 957-966.
Altmann, J. 1974. Observational study of behaviour: sampling methods. Behaviour, 49, 227–
267.
August, P. V. & Anderson, J. G. T. 1987. Mammal sounds and motivation-structural rules: A
test of the hypothesis. Journal of Mammalogy, 68(1), 1-9.
Belan, I.; Lehner, P. N. & Clark, T. 1978. Vocalizations of the American Pine Marten, Martes
americana. Journal of Mammalogy, 59(4), 871-874.
Bezerra, B. M.; Souto, A. S., Schiel, N. & Jones, G. 2010. Notes on vocalisations of giant
otters in the flooded Igapó forests of Jaú National Park, Amazonas, Brazil. Journal of
Ethology, 29(1), 169-175.
Blumstein, D. T.; Richardson, D. T.; Cooley, L., Winternitz, J. & Daniel J.C. 2008. The
structure, meaning and function of yellow-bellied marmot pup screams. Animal Behaviour,
76, 1055-1064.
Bradbury, J. W. & Vehrencamp, S. L. 1998. Principles of Animal Communication.
Massachusetts, Sinauer Associates Inc. Publishers. 882 p.
Briefer, E. F. 2012. Vocal expression of emotions in mammals: mechanisms of production and
evidence. Journal of Zoology, http://dx.doi.org/10.1111/j.1469-7998.2012.00920.x.
Collias, N. E. 1960. An ecological and functional classification of animal sounds. In: Animal
sounds and communication (Ed. By Lanyon, W.E. & Tavolga, W.N.), pp. 368-391,
American Institute of Biological Sciences.

118
Crockford, C. & Boesch, C. 2005. Call combinations in wild chimpanzees. Behaviour, 142(4),
397-421.
Duplaix, N. 1980. Observations on the ecology and behaviour of the giant river otter Pteronura
brasiliensis in Surinam. Review Ecologique (Terre Vie), 34, 495–520.
Duplaix, N. 1982. Contribution à l'écologie et à l'éthologie de Pteronura brasiliensis (Carnivora,
Lutrinae): Implications évolutives. PhD Thesis, Université Paris-Sud. 353 p.
Endler, J. A. 2000. Evolutionary implications of the interaction between animal signals and the
environment. In: Animal Signals: Signaling and Signal design in animal communication.
(Ed. By Espmark, Y.; Amundsen, T. & Rosenqvist, G.), pp. 11-46, Tapir Academic Press,
Trondheim, Norway. 496 p.
Farley, S.D.; Lehner, P.N.; Clark, T. & Trost, C. 1987. Vocalizations of the Siberian ferret
(Mustela eversmanni) and comparisons with other Mustelids. Journal of Mammalogy,
68(2), 413-416.
Fitch, W. T.; Neubauer, J. & Herzel, H. 2002. Calls out of chaos: the adaptive significance of
nonlinear phenomena in mammalian vocal production. Animal Behaviour, 63, 407–418.
Gnoli, C. & Prigioni, C.1995. Preliminary study on the acoustic communication of captive otters
(Lutra lutra). Hystrix, 7(1-2), 289-296.
Groenendijk, J.; Hajek, F.; Duplaix, N.; Reuther, C.; Van Damme, P.; Schenk, C.; Staib, E.;
Wallace, R.; Waldemarin, H.; Notin, R.; Marmontel, M.; Rosas, F. W. C.; Mattos De,
G. E.; Evangelista, E.; Utreras, V.; Lasso, G.; Jaques, H.; Matos, K.; Roopsind, I. &
Botello, J. C. 2005. Surveying and monitoring distribution and population trends of the
giant otter (Pteronura brasiliensis). Habitat, 16, 1-500.
Huff, N. & Price, E. O. 1968. Vocalizations of the least weasel, Mustela nivalis. Journal of
Mammalogy, 49(3), 548-550.

119
Lehner, P. N. 1998. Handbook of ethological methods. Garland STPM Press, London, 672 p.
Leuchtenberger C. & Mourão G. 2009. Scent-marking of giant otter in the Southern Pantanal,
Brazil. Ethology, 115, 210–216.
Leuchtenberger C. & Mourão G. 2008. Social organization and territoriality of giant otters
(Carnivora: Mustelidae) in a seasonally flooded Savanna in Brazil. Sociobiology, 52(2),
257-270.
Machado M. R. B. 2004. Bioacústica de ariranhas (Pteronura brasiliensis) (Carnivora:
Mustelidae): discriminação vocal e repertório. Master Thesis, Instituto Nacional de
Pesquisa da Amazônia.
McComb, K. & Reby, D. 2005. Vocal communication networks in large terrestrial mammals. In:
Animal Communication Networks. (Ed. by P. McGregor). pp. 372-389. University Press.
McComb, K. & Semple, S. 2005. Coevolution of vocal communication and sociality in
primates. Biology Letters, 1, 381–385.
McShane L., Estes J. A., Riedman M. L., Staedler M. M. 1995. Repertoire, structure and
individual variation of vocalisation in the sea otter. Journal of Mammalogy, 76, 414–427.
Morales-Betancourt, D. 2011. Report of an adaptive reintroduction of a juvenile giant otter
(Pteronura brasiliensis). IUCN Otter Specialist Group Bulletin, 28(1), 23-33.
Morton, E. S. 1977. On the occurrence and significance of motivation-structural rules in some
bird and mammal sounds. American Naturalist, 111, 855–869.
Mourão, G.; Tomas, W. & Campos, Z. 2010. How much can the number of jabiru stork
(Ciconiidae) nests vary due to change of flood extension in a large Neotropical floodplain?
Zoologia, 27(5), 751-756.
Oksanen, J.; Kindt, R.; Legendre, P.; O’Hara, B.; Simpson, G. L.; Solymos, P.; Stevens, M.
H. H. & Wagner, H. 2008. The Vegan Package.

120
Peters, G. 2002. Purring sounds in mammals. Mammal Review, 32(4), 245–271.
Pollard, K. A. & Blumstein, D. T. 2012. Evolving communicative complexity: insights from
rodents and beyond. Philosophical Transactions of The Royal Society B, 367, 1869–1878.
Ribas, C. & Mourão, G. 2004. Intraspecific agonism between giant otter groups. IUCN Otter
Specialist Group Bulletin, 21, 89–93.
Ribas, C.; Damasceno G.; Magnusson W.; Leuchtenberger C. & Mourão, G. 2012. Giant
otters feeding on caiman: evidence for an expanded trophic niche of recovering
populations. Studies on Neotropical Fauna and Environment, 47(1), 19-23.
Riede, T.; Wilden, I & Tembrock, G. 1997. Subharmonics, biphonations, and frequency jumps-
common components of mammalian vocalization or indicators for disorders. Zeitschrift für
Säugetier, 62(Suppl 2), 198–203.
Riede, T.; Herzel, H.; Mehwald, D.; Seidner, W.; Trumler, E.; Böhme, G. & Tembrock, G.
2000. Nonlinear phenomena in the natural howling of a dog-wolf mix. The Journal of the
Acoustical Society of America, 108, 1435–1442.
Riede, T.; Owren, M. J. & Arcadi, A. C. 2008. Nonlinear acoustics in pant hoots of common
chimpanzees (Pan troglodytes): frequency jumps, subharmonics, biphonation, and
deterministic chaos. American Journal of Primatology, 64, 277–291.
Roux, A. L.; Cherry, M. I. & Manser, M. B. 2009. The vocal repertoire in a solitary foraging
carnivore, Cynictis penicillata, may reflect facultative sociality. Naturwissenschaften, 96,
575–584.
Schassburger, R. M. 1993. Vocal communication in the Timber Wolf, Canis lupus, Linnaeus.
Paul Parey Scientific Publishers, Berlin, Germany.
Sieber, O. J. 1984. Vocal communication in raccoons (Procyon lotor). Behaviour, 90(1/3), 80-
113.

121
Silveira, L.; Furtado, M. M.; Rosas, F. C. W.; Silva, L. C.; Cabral, M. M. M.; Torres, N.
M.; Sollmann, R.; Kouba, A. & Jácomo, A. T. A. 2011. Tagging giant otters (Pteronura
brasiliensis) (Carnivora, Mustelidae) for radio-telemetry studies. Aquatic Mammals, 37,
208-212.
Sousa-Lima, R.; Paglia, A. P. & Fonseca, G. A. B. da. 2002. Signature information and
individual recognition in the isolation calls of Amazonian manatees, Trichechus inunguis
(Mammalia: Sirenia). Animal Behaviour, 63, 301–310.
Staib, E. 2005. Eco-etología del lobo de río (Pteronura brasiliensis) en el sureste del Perú. PhD
Thesis – Sociedad Zoológica de Francfort Perú, 195 p.
Stoeger, A.; Baotic, A.; Li, D. & Charlton, B. D. 2012. Acoustic features indicate arousal in
infant giant panda vocalisations. Ethology, 118, 1–10.
Sueur, J.; Aubin, T. & Simonis, C. 2008. Seewave: a free modular tool for sound analysis and
synthesis. Bioacustics, 18, 213-216.
Taylor, A. M. & Reby, D. 2010. The contribution of source–filter theory to mammal vocal
communication research. Journal of Zoology, 280, 221–236.
Tokuda, I.; Riede, T. Neubauer, J.; Owren, M. & Herzel, H. 2005. Nonlinear analysis of
irregular animal vocalizations The Journal of the Acoustical Society of America, 111(6),
2908-2919.
Venables, W. N. & Ripley, B. D. 2002. Modern applied statistics with S. 4th edition. Springer,
New York.
Wilden, I.; Herzel, H.; Peters, G. & Tembrock, G. 1998. Subharmonics, biphonation, and
deterministic chaos in mammal vocalization. Bioacoustics, 9, 171-196.
Wilson, E. 2000. Sociobiology: The new synthesis. 25th
Aniversary ed. President and Fellows of
Harvard College, USA. 697 p.

122
Wong, J.; Stewart, P. D. & MacDonald, D. W. 1999. Vocal repertoire in the European badger
(Meles meles): structure, context, and function. Journal of Mammalogy, 80, 570–588.
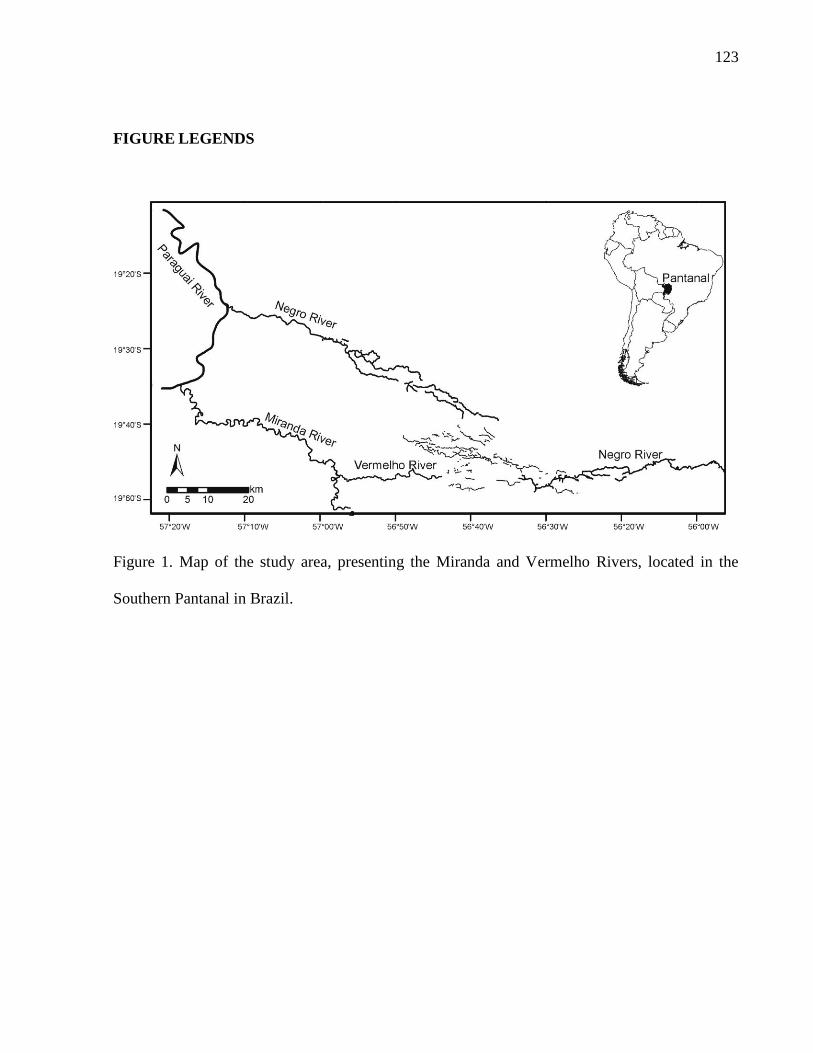
123
FIGURE LEGENDS
Figure 1. Map of the study area, presenting the Miranda and Vermelho Rivers, located in the
Southern Pantanal in Brazil.

124
Figure 2. Measurements of acoustic parameters of a giant-otter coo-hum call: A) Oscillogram
used to measure the total call duration (CD); the duration (D1) from the start of the vocalisation
to the highest value of fundamental frequency (F0) or Peak frequency (PF); the duration (D2)
from the highest frequency of F0 or PF to the end of the vocalisation; and the plateau duration
(PD), when the frequency of F0 or PF did not vary. B) Spectrogram (winodw size 512) used to
measure the lowest frequency (LF) of the sound; the highest frequency (HF) of the sound; the
difference (FD) between HF and LF; the initial frequency (FI) of F0 or PF of the sound; final
frequency (FF) of F0 or PF; and the maximum frequency (FM) of the FO or PF. C) Zoom view of
a stretch of the oscillogram showing the measurement of the inter-pulse interval used to estimate
the number of pulses of the sound. D) Power spectrum used to measure of the peak frequency
(PF) of the selection.

125
Figure 3. Dendrogram of the hierarchical-cluster relationship of the 19 sounds (N=458
vocalizations) emitted by giant otters distributed in 9 groups in the Southern Pantanal, from
November 2009 to June 2011.

126

127
Figure 4. Spectrograms and oscillograms (bottom) of vocalisations emitted by giant otters in the
southern Pantanal of Brazil: a) coo (FFT=1024), b) coo-hum (FFT=1024), c) coo-call
(FFT=1024), d) hum (FFT=1024), e) purr (FFT=512), f) adult growl (FFT=512) , g) cub growl
(FFT=512, note the scale difference in frequency), h) snort (FFT=512, arrows indicate formants),
i) hah (FFT=512), j) adult call (FFT=512, note scale difference in frequency), l) adult scream
(FFT=1024), and m) cub scream (FFT=1024).

128
Figure 5. Spectrograms and oscillograms (bottom) of vocalisations emitted by giant otters in the
southern Pantanal of Brazil: a) cub begging scream (FFT=1024), b) adult high scream
(FFT=1024, arrows indicate subharmonics and a biphonation), c) cub high scream (FFT=1024),
d) cub call (FFT=512), e) scream-gurgle (FFT=512, note the scale difference in frequency), and
f) squeak (FFT=512).

129
Figure 6. Spectrograms and oscillograms (bottom) of vocalisations emitted by giant otters in the
southern Pantanal of Brazil: a) combination of hum and purr sounds (hum-purr, FFT=1024), b)
combination of hum and growl sounds (hum-growl, FFT=1024), c) gradation among affiliative
sounds (coo, coo-hum and hum-purr, FFT=1024), d) sequence of snort-hahs (indicated by arrows,
FFT=512), e) adult call with a harsh, noisy ending (arrow indicates the transition, FFT=512), f)
cub call with a harsh, noisy ending (arrow showing the transition, FFT=512), g) adult scream
with a harsh, noisy ending (arrow indicates the transition, FFT=512), h) transition of adult calls

130
(arrows) and adult scream vocalised during an agonistic encounter (FFT=1024), and i) transition
between cub high scream and cub scream (arrow indicates the transition, FFT=1024).

131

132
Figure 7. Biplots of the relationship between the first and second axes (a) and the first and third
axes (b) of the principal coordinate analysis of 19 sound types vocalised by giant otters in
different behavioural context (AL-alarm, IN-inquiry, WD-warning/defense, BE-begging, IS-
isolation, DE-within den, CC-close contact) represented by different colours (see legend above
the graphs). Small letters refer to the different sound types (co=coo, cc=coo-call, ch=coo-hum,
hu=hum, pu=purr, gr=growl, gr2=cub growl, so=snort, ha=hah, ac=adult call, sc=adult scream,
sc2=cub scream, be=adult begging scream, be2=cub begging scream, hs=adult high scream,
hs2=cub high scream, cu=cub call, sk=scream-gurgle, sq=squeak), and the capital letters (in
black) indicate the sound features analysed (CD=call duration, LF= lowest and HF=highest
frequencies of the sound, PF=peak frequency of the entire sound, Q3=3rd quartile frequency,
PU=number of pulses of the sound, FI=initial value of F0 (for harmonic sounds) or of the peak
frequency (for non-harmonic sounds), FM=maximum value of F0 or PF, FF=final F0 or PF,
FM=maximum frequency of F0 or PF, FD=difference between the highest and the lowest
frequency of F0 or PF, D1=duration from the start of the vocalisation to the highest frequency
value of F0 or PF, D2=duration from the highest F0 or PF to the end of the vocalisation, and
PD=plateau duration (when F0 or PF did not varied)).

133
TABLES
Table 1. Individual emission rates (number of sounds/hour) and proportions of giant otter
vocalisations given in different behavioural contexts (CC – close contact, GR – grooming, SW –
swimming, DE – within the den, SM – scent-marking, IS – isolation, BE – begging, WD –
warning/defense , IN – inquiry, AL – alarm, IA – intraspecific agonistic encounter, and IE –
interspecific encounter by adults (A), subadults (S), juveniles (J) and cubs (C) from six groups. N
is the number of sounds recorded, (groups) refers to the number of groups that presented that
particular sound type in its repertoire.
BEHAVIORAL CONTEXT (%)
Sound N (groups) Age
class Sound/h CC GR SW DE SM IS BE WD IN AL IA IE
1. Cub call 1388 (6) J/C 3.4 10 59 31
2. Purr 1523 (6) A/S 3.0 52 15 12 21
3. Snort 781 (6) A/S/J/C 1.4 93 5 2
4. Coo 584 (6) A/S 1.1 51 9 14 26
5. Coo-hum 322 (6) A/S 0.7 72 9 12 5 2
6. Adult scream 310 (5) A/S 0.5 39 47 9 5
6.1. Cub scream 43 (5) C 0.2 100
7. Hum 235 (6) A/S 0.5 55 19 5 21
8. Coo-call 197 (6) A/S 0.3 64 8 12 16
9. Hah 174 (6) A/S 0.3 100
10. Adult begging scream 149 (4) A/S 0.3 10 58 32
10.1. Cub begging scream 155 (3) J/C 0.7 100
11. Growl 149 (5) A/S 0.3 74 24 2
11.1. Cub Growl 12 (1) C 0.1 100
12. Adult call 148 (6) A/S 0.2 74 5 21
13. Scream-gurgle 25 (3) C 0.1 100
14. Adult high scream 25 (3) A/S 0.1 100
14.1. Cub high scream 11 (2) J/C 0.05 100
15. Squeak 15 (1) C 0.03 100
Total 6246 11.4

134
Table 2. Descriptive statistics [X ±SD or median (minimum-maximum ranges)] of sound types emitted by giant otters from six groups
monitored from September 2009 to June 2011 in the Southern Pantanal, Brazil. N represents the number of sounds used for acoustic
measurements, and the number of giant otters groups included in analyses of each sound type is given in parentheses. (Sound –
Co=coo, Cc=coo-call, Ch=coo-hum, Hu=hum, Pu=purr, Gr=growl, Gr2=cub growl, So=snort, Ha=hah, Ac=adult call, Sc=adult
scream, Sc2=cub scream, Be=adult begging scream, Be2=cub begging scream, Hs=adult high-scream, Hs2=cub high-scream, Cu=cub
call, Sk=scream-gurgle, Sq=squeak; Variables – CD=call duration, LF= lowest and HF=highest frequencies of the sound, PF=peak
frequency of the entire sound, Q3=3rd quartile frequency, PU=number of pulses of the sound, FI=initial value of F0 (for harmonic
sounds) or of the peak frequency (for non-harmonic sounds), FM=maximum value of F0 or PF, FF=final F0 or PF, FM=maximum
frequency of F0 or PF, FD=difference between the highest and the lowest frequency of F0 or PF, D1=duration from the start of the
vocalisation to the highest frequency value of F0 or PF, D2=duration from the highest F0 or PF to the end of the vocalisation, and
PD=plateau duration (when F0 or PF did not varied), *temporal units in seconds (s), frequency units in kHz).
Call N CD LF HF PF Q3 PU FI FF FM FD D1 D2 PD
Co 15 0.36
±0.11
0.18
±0.05
5.29
±0.94
0.45
±0.05
0.61
±0.26
109.67
±29.19
0.27
±0.06
0.33
±0.05
0.52
±0.06
0.25
±0.06
0.15
±0.06
0.07
±0.03
0.16
±0.09
Cc 18 0.44
±0.13
0.16
±0.04
4.98
±1.43
0.5
(0.3-4.09)
2.89
±1.38
77.22
±33.55
0.26
±0.1
0.34
±0.1
4.32
±1.14
4.06
±1.14
0.26
±0.12
0.13
±0.07
0.03
(0.01-0.2)
Ch 20 0.2
±0.09
0.17
±0.03
4.75
±1.31
0.44
±0.08
0.51
(0.39- 3.66)
98.7
±45.88
0.25
±0.04
0.27
±0.06
0.43
±0.08
0.18
±0.08
0.11
±0.07
0.08
±0.04 0
Hu 20 0.33
±0.19
0.09
±0.07
4.84
±1.18
0.43
±0.08
0.62
(0.43-4.1)
80.4
±48.2
0.23
±0.04
0.26
±0.06
0.27
±0.07
0.04
±0.07
0.26
±0.14 0 0
Pu 23 0.54
±0.27
0.09
±0.07
2.35
±1.76
0.42
±0.07
0.52
(0.39-3.19)
11.65
±5.25
0.21
±0.01
0.21
±0.01
0.21
±0.01 0
0.54
±0.27 0 0
Gr 17 2.35
±1.71
0.12
±0.04
3.75
±0.8
0.39
(0.17-2.63)
2.16
±0.77
516.94
±339.27
0.2
±0.03
0.2
±0.04
0.22
±0.04
0.02
(0-0.1)
0.1
(0-1.97)
0.13
(0-4.23)
1.05
(0 to 3.22)

135
Gr2 10 0.46
±0.25
0.07
(0- 0.15)
1.29
±0.17
0.44
±0.02
0.47
±0.01
115.8
±63.62
0.22
±0.01
0.22
±0.01
0.22
±0.01 0 0.00 0.00
0.37
(0.17-0.93)
So 197 0.27
±0.1
0.16
±0.04
8.70
±1.29
1.47
±0.74
2.63
±0.67
6.55
±2.35
1.47
±0.75
1.77
±0.81
1.47
±0.74 0 0 0
0.27
±0.1
Ha 11 0.16
±0.07 0
4.38
±0.55
1.56
±0.63
2.31
±0.54 1
1.43
±0.49
1.03
±0.67
2.07
±0.23 0
0.16
±0.07 0 0
Ac 15 0.3
±0.1
0.75
±0.86
5.94
±1.47
4.42
±1.51
4.96
±0.86
1
±0
0.56
(0.27-4.15)
1.87
±1.32
5.94
±1.42
4.33
±1.95
0.14
±0.04
0.09
±0.05
0.05
(0.01-
0.26)
Sc 20 0.93
±0.41
0.22
±0.09
6.57
±2.22
1.56
±0.64
2.60
±0.95
466.35
±202.72
0.35
±0.06
0.43
±0.07
0.48
±0.08
0.12
±0.09
0.27
±0.22
0.29
±0.26
0.23
(0-1.42)
Sc2 9 0.81
±0.44
0.19
±0.09
5.64
±2.34
1.18
±0.71
2.24
±0.87
268.22
±146.67
0.32
±0.07
0.34
±0.05
0.37
±0.05
0.05
(0-0.22)
0.09
(0-1.1)
0.31
±0.3
0.22
±0.09
Be 12 1.21
±1.03
0.13
±0.11
6.91
±1.52
3.13
±1.82
4.15
±1.1
1
±0
0.39
±0.1
0.36
±0.09
0.49
±0.09
0.1
(0-0.34)
0.25
±0.19
0.96
±0.92 0
Be2 9 2.65
±1.39
0.17
±0.08
7.76
±1.67
2.67
±0.87
3.69
±1.04
1
±0
0.33
±0.03
0.37
±0.04
0.48
(0.35-3.22)
0.43
(0.07-2.9)
0.43
±0.34
2.22
±1.38 0
Hs 4 0.94
(0.36-2.25)
1.41
±1.26
6.61
±1.17
4.04
±1.91
4.68
±1.33
1
±0
3.15
(0.39-6.09)
3.02
±1.88
6.31
±1.05
3.12
±2.69
0.22
±0.13
0.63
(0.2-2.13)
0
(0-0.07)
Hs2 10 0.46
(0.29-0.95)
1.72
±0.81
6.3
±2.29
3.29
±1.07
4.29
±0.77
1
±0
3.03
±1.71
2.83
±0.98
5.19
±1.96
2.16
±2.06
0.17
(0-0.64)
0.33
±0.19 0
Cu 27 0.35
±0.15
1.41
±0.46
9.95
(7.7-13.92)
8.02
±1.46
8.64
±0.99
1
±0
3.17
±2.12
5.54
±2.82
8.83
±1.92
5.66
±2.43
0.13
±0.06
0.14
±0.09
0.03
(0-0.34)
Sk 6 1.01
±0.1
0.15
±0.02
8.73
±1.18
0.75
±0.26
0.85
±0.16
227.17
±33.89
0.24
±0.03
0.33
±0.04
7.83
±0.9
7.59
±0.91
0.61
±0.15
0.40
±0.06 0
Sq 15 0.44
±0.1 0
18.3
±1.23
8.38
±0.65
8.74
±0.68
1
±0
0.52
±0.06
0.57
±0.06
0.72
±0.07
0.21
(0.06-0.8)
0.08
(0.06-0.1)
0.06
(0-0.24)
0.26
(0.2-0.5)
136
CAPÍTULO 5
______________________________________________________________________________
Leuchtenberger, C.; Sousa-Lima R.; Ribas, C.; Magnusson, W. &
Mourão, G. Acoustic variation in giant otter alarm calls. Manuscrito
formatado para Animal Behaviour.

137
Acoustic variation in giant otter alarm calls
Caroline Leuchtenberger a, b,
*, Renata Sousa-Lima c, Carolina Ribas
a, b,, William Magnusson
a &
Guilherme Mourão b
a Graduate Program in Ecology, Instituto Nacional de Pesquisas da Amazônia - INPA, Brazil
b Laboratory of Wild Life, Embrapa Pantanal, Brazil
c Department of Physiology, Federal University of Rio Grande do Norte, Brazil
Word count= 3226
*corresponding author - Postal adresse: Rua 21 de Setembro, n.1880, Nossa Senhora de Fátima,
79331-090, Corumbá – MS – Brazil, email: [email protected], telephone: + 55 67
33017895, fax: +55 67 32345815

138
Acoustic variations in animal calls may carry identity coding, which in social species may
improve communication within and among groups, and may be useful to identify the sex of
senders. Giant otters live in highly cohesive groups, which defend exclusive territories along water
bodies, using acoustic and chemical signals. Snorts are harsh alarm calls, vocalised in threat
contexts, which commonly elicit a reaction in the other members of the group. The aim of this
study was to determine whether giant otter snorts vary across study areas, social groups,
individuals, or sexes. Alarm calls emitted by twenty giant otters, composing eight different groups,
were recorded from September 2009 to June 2011 in the Vermelho and Negro Rivers in the
Pantanal. The sex and identity of individuals were determined. Acoustic parameters, as well as
formant frequencies, were measured and analysed through acoustic softwares. Snort acoustic
variables did not differ significantly among study areas. Snorts varied significantly among groups,
individuals and between sexes, with highest discrimination between sexes. The frequency of
formants (F1-F5) and formant dispersion (DF) potentially allow identity coding among groups,
individuals and sexes. The higher discrimination of snort acoustic variation between sexes may be
related to information on body size carried by formant frequencies and dispersion, indicating some
sexual dimorphism in giant otters. Acoustic differences among groups and individuals are more
likely to be learned, since we did not find correlation with genetic traits of some individuals.
Key-words: acoustic identity; formant frequency; Pteronura brasiliensis; sex discrimination;
vocal communication.

139
Communication in social species occurs within a network of multiple potential senders and
receivers (McComb & Reby 2005). In such systems, identity coding carried in vocal signals
facilitates the coordination of individual activities and may improve the cohesion of groups (Janik
& Slater 1998; Fitchel & Manser 2010). Acoustic variations are commonly determined by a mix of
environmental and genetic influences (Bradbury & Vehrencamp 1998). However, some variation
may also be learned and fixed through behaviour matching, which can create geographic variation
in repertoires (Mitani et al. 1999; Collins & Terhune 2007; Delgado 2007), as well as group and
individual coding (Weilgart & Whitehead 1997; Boughman 1998; Janik & Slater 1998; Sousa-
Lima et al. 2002, 2008; McComb et al. 2003; Crockford et al. 2004).
Acoustic signals that carry individual or kin-group specificity must have a large number of
distinguishable variants (Bradbury & Vehrencamp 1998). Frequency components of sounds, such
as fundamental frequency and formants, are potential parameters to carry individual and social
coding (Fitch & Hauser 1995; Rendall et al. 1996; Sousa-Lima et al. 2002, 2008; McComb et al.
2003; Fitch & Fritz 2006; Delgado 2007; Vannoni & Elligott 2007, 2008; Koren & Geffen 2011).
Fundamental frequency is determined by the length and mass of vocal folds (Fitch 1997), which in
some species seem to be related to body size, which is also useful to determine sex identity of
senders (e.g. Sousa-Lima et al. 2008; Vannoni & Elligott 2008). However this correlation does not
occur in all vertebrates (Fitch 1997) and acoustic variables related to the filter component of the
vocal tract, such as formant frequencies (McComb & Reby 2005), are more likely to be an ‗honest‘
indication of the sender‘s body size (Fitch & Hauser 1995; Rendall et al. 1996; Charlton et al.
2011). In some species, the identity of sex and body size of senders may be a useful tool for sexual
selection and/or determining the social status of individuals (Vannoni & Elligott 2008; Charlton et
al. 2010).

140
Giant otters (Pteronura brasiliensis) live in highly cohesive groups formed by a dominant
pair and up to 20 other related or unrelated individuals (Ribas 2012), which spend almost all their
daily activities together (Duplaix 1980; Chapter 1). Groups defend exclusive territories along water
bodies, which are patrolled daily by the whole group, and marked with acoustic and chemical
signals (Duplaix 1980; Schweizer 1992; Leuchtenberger & Mourão 2009). Agonistic encounters
between groups and solitaries have been observed, especially in the Pantanal (Schweizer 1992;
Ribas & Mourão 2004; Leuchtenberger & Mourão 2009; Ribas et al 2012; Chapter 3), and may
lead to serious injuries or the death of individuals. Therefore, kin recognition through
communication within and among giant otter groups must be efficient to maintain cohesion and to
avoid agonistic interactions.
Giant otters emit harsh snorts when alarmed and use a periscoping posture display, which
commonly elicit a reaction in the other members of the group (Duplaix 1980). Snorts are
broadband and pulsed calls, often showing five visible formants (Chapter 4). Considering that
alarm signals are likely to have individual traits in social species (Pollard 2011), we analyzed if
giant otter snorts show acoustic variations between two study areas, among social groups and
among individuals. We also tested if acoustic traits of snorts of males and females are
distinguishable.
METHODS
The Pantanal is a seasonally flooded plain of approximately 160 000 km2, of which 80%
may be flooded from November to March, the extent depending on the rainfall that year
(Hamilton et al. 1996). We monitored giant otters in two areas, approximately 61 km distant, in
the Southern Pantanal. The first study area was located in the Vermelho River (19o34'S;
57o01'W), a stretch of the Miranda River (19°36'S, 57° 00'W) and water bodies along the

141
Estrada-Parque Pantanal (EPP) road. The second study area included the middle stretch of the
Negro River (19o35'S; 56
o11'W). The two areas are connected through a wide swamp, which
drained waters from the Negro River to the Vermelho River (Fig. 1).
Alarm calls from four groups (G1, G2, G10 and G12) were recorded monthly from
September 2009 to June 2011 in the Vermelho River area. In the Negro River we recorded
sounds from four giant otter groups (G17, G18, G19 and G20) during the months of September
2009, June and September 2010 and June 2011. Monthly monitoring lasted from 7 to 10 days,
and was undertaken during daylight hours (5-19 h). Most groups were located opportunistically,
but three groups (G2, G10 and G12) were radio-tagged and monitored in different periods from
November 2009 to June 2011 (Chapter 2).
The sex of individuals was identified through observation of their genitals when they were
on land and their identity was confirmed by their individually-distinctive natural throat marks.
The behaviour of individuals was recorded by a high-definition camcorder (Canon HF-200) and
the hierarchy of individuals in the group was inferred as described by Leuchtenberger & Mourão
(2009). The territorial limits of each giant otter group were estimated through the location of
active latrines and dens (see Chapter 3). Once located, the group was followed at a distance of 10
to 100 m that did not disturb their behaviour. We considered only snorts vocalised in response to
the observer, excluding those snorts that resulted in the chasing of another individual or the entire
group. Sounds were recorded at a maximum distance of 50 m with a directional microphone
(Sennheiser, ME-66) connected to a digital Marantaz PMD-660 recorder (AIF format, 16-bit
resolution and 44.1 kHz sampling rate).
Acoustical analyses
Acoustic measurements were carried out using oscillograms and power spectra generated
with Raven Pro 1.4 (Cornell Lab of Ornithology), using the following settings: Hanning window;

142
FFT size = 1024 and 50% overlap. We measured the following call properties to analyze snorts:
(CD) call total duration, (PF) peak frequency of the entire call, (Q3) 3rd quartile frequency and
(PU) the number of pulses (temporal units that repeat rhythmically) of the call.
Additionally, snort formant frequencies (Fig. 2) were estimated using Linear Predictive
Coding analysis (LPC) through the command ―To Formant (burg)‖ in Praat 5.3.12 software (P.
Boersma & D. Weenink, University of Amsterdam, Amsterdam, The Netherlands). We carried
out two LPC analyses on each snort, to better detect the frequency of first formant (F1). The first
LCP was carried out using the following settings: time step 0.01s, number of formants 1,
maximum formant 400– 500 Hz and window length 0.02 s, to measure the frequencies of F1. The
second LPC analysis was carried out to measure the frequencies of formants 2 to 5 (F2 - F5),
using the following settings: time step 0.01 s, number of formants: 4, maximum formant 5500–
7500 Hz, window length 0.02 s. We measured the formant dispersion (DF) following the methods
of Fitch (1997).
Statistical Analyses
All statistical calculations were performed with the R 2.13 Software (The R Foundation
for Statistical Computing). The acoustic parameters were standardized by columns using the
decostand function with the total method in the package Vegan (Oksanen et al. 2008). A
principal-component analysis (PCA) was carried out to ordinate acoustic variables. Components
with eigenvalues greater than the mean were selected. A nested nonparametric multivariate
analysis of variance (PERMANOVA, function adonis from the package Vegan), with 1000
permutations, was used to test for differences in standardized acoustic parameters between study
areas (nested within groups), among giant otter groups (nested within study areas), among
individuals and between sexes (nested within group).

143
A linear discriminant analysis (LDA) was carried out to estimate the distinctiveness
between acoustic variables of snorts, using the package MASS (Venables & Ripley 2002). The
first step of LDA was carried out with a sorted subset of 50% of the total data set of the
standardized acoustic parameters. The remaining subset of data was used to attest the predictions
based on the equations generated by the first classification. The percentage of correctly classified
cases indicates the effectiveness of the discriminant function in identifying group. For performing
LDA among snorts, we included only the acoustic variables (PU, PF, Q3, F5, DF) that presented
higher loadings in the PCA and conform to the linearity assumptions of the analysis.
We tested whether the snort traits of groups were correlated with the distance between
groups, by measuring the median of standardized snort features for each group and computing the
Euclidean distance matrix between all possible dyads of groups. Then we computed the distance
matrix between the centres of the territories of groups (Leuchtenberger & Mourão 2008) and
applied the Mantel test to estimate the correlation between the two matrix, using the package
ade4 (Thioulouse et al. 1997).
Biological samples were collected from six individuals (aqu, exc, ris, pal, wil, pig; Table
1) inhabiting the Vermelho and Miranda Rivers as part of a larger study on genetic questions
about the groups inhabiting this area (Ribas 2012). These data provided information on genetic
relationships among individuals, and this matrix was compared with a Euclidean matrix of snort
traits of respective senders with a Mantel test.
For each of the acoustic variables of snorts, we measured the total coefficient of variation
(CVtot) considering the overall mean (X) and the respective standard deviation (SD) by the
equation CVtot=100% × (SD/X). We also calculated the coefficient of variation (CVi) of each of
these variables at four different levels: within study areas (CViare), within giant otter groups
(CVigro), within individuals (CViind) and within sex (CVisex), using the mean (Xi) and the

144
standard deviation (SDi) of each variable within levels. We then determined the potential of
individual identity coding (PIC) of each parameter by CVtot/mean CVi. Parameters with PIC
value greater than 1 may be used for individual recognition since intra-individual variability is
smaller than inter-individual variability (Robisson et al. 1993). The formant frequencies and
dispersion of formants were compared between females and males and the differences were
tested with ANOVA.
RESULTS
The giant otter groups we studied included 36 adults (19 males, 15 females and 2 not
identified), 4 juveniles (2 male, 1 female and 1 not identified) and 24 cubs (1 male, 1 female and
21 not identified). Group size varied from 2 to 15 individuals, with an average of 6. We recorded
snorts from 8 adult males (5 dominant and 3 subordinate) and 12 adult females (6 dominant and 6
subordinate) (Table 1).
The PCA analysis resulted in three axes that accounted for 79% of the variation among
snorts (first axis=47%, second axis=18% and third axis=14%). The frequency of the second to the
fifth formants and dispersion of formants had the highest loadings (F2=2.41, F3= 2.63, F3= 2.64,
F5 = 2.67, DF=2.62) on the first component. The second component had the highest loadings for
Q3 (-3.61) and PF (-3.45), while PU (-3.6) and CD (-3.22) had the highest loadings on the third
component. Standardized snort variables did not differ significantly among study areas
(PERMANOVA: F1, 195=0.26, P=0.87). Snorts varied significantly amongst groups, nested within
study areas (PERMANOVA: F7, 189=4.479, P=0.001, R2=0.14) and there was significant variation
in snorts amongst individuals (PERMANOVA: F19, 177=7.61, P=0.001, R2=0.45) and between
sexes (PERMANOVA: F1, 195=31.926, P=0.001, R2=0.14), nested within groups. However there
was high overlap of call traits among giant otter groups and individuals (Fig. 3). The similarity of
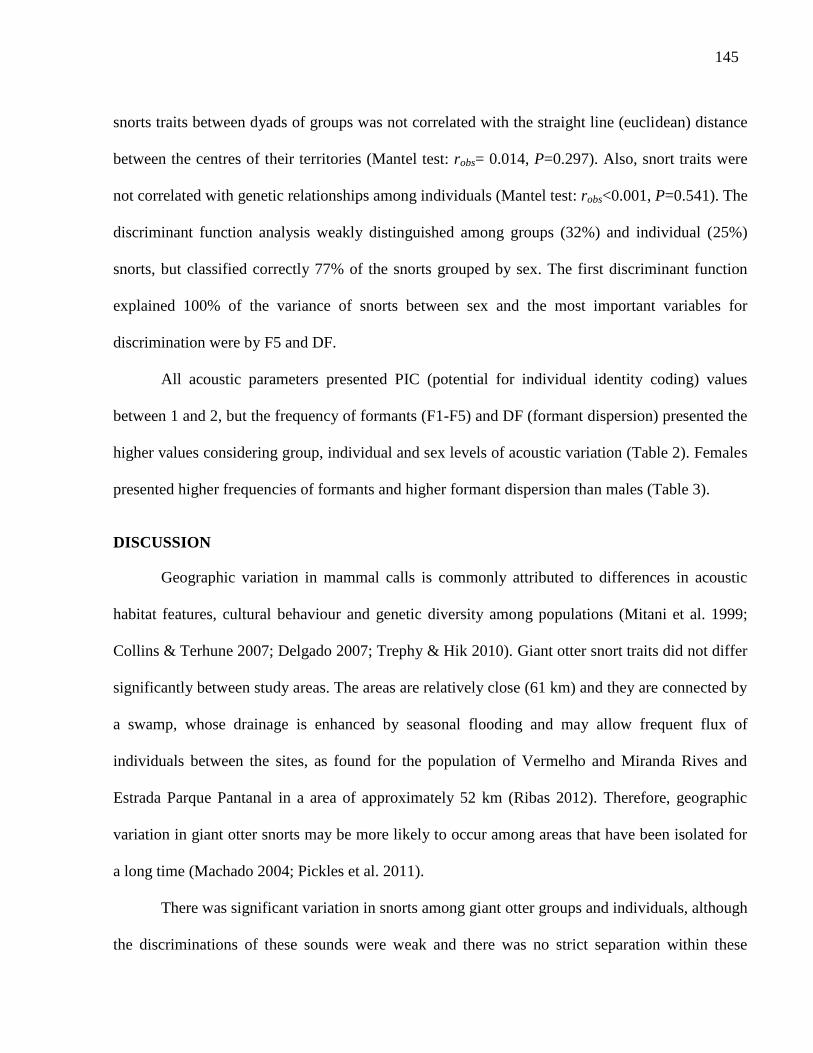
145
snorts traits between dyads of groups was not correlated with the straight line (euclidean) distance
between the centres of their territories (Mantel test: robs= 0.014, P=0.297). Also, snort traits were
not correlated with genetic relationships among individuals (Mantel test: robs<0.001, P=0.541). The
discriminant function analysis weakly distinguished among groups (32%) and individual (25%)
snorts, but classified correctly 77% of the snorts grouped by sex. The first discriminant function
explained 100% of the variance of snorts between sex and the most important variables for
discrimination were by F5 and DF.
All acoustic parameters presented PIC (potential for individual identity coding) values
between 1 and 2, but the frequency of formants (F1-F5) and DF (formant dispersion) presented the
higher values considering group, individual and sex levels of acoustic variation (Table 2). Females
presented higher frequencies of formants and higher formant dispersion than males (Table 3).
DISCUSSION
Geographic variation in mammal calls is commonly attributed to differences in acoustic
habitat features, cultural behaviour and genetic diversity among populations (Mitani et al. 1999;
Collins & Terhune 2007; Delgado 2007; Trephy & Hik 2010). Giant otter snort traits did not differ
significantly between study areas. The areas are relatively close (61 km) and they are connected by
a swamp, whose drainage is enhanced by seasonal flooding and may allow frequent flux of
individuals between the sites, as found for the population of Vermelho and Miranda Rives and
Estrada Parque Pantanal in a area of approximately 52 km (Ribas 2012). Therefore, geographic
variation in giant otter snorts may be more likely to occur among areas that have been isolated for
a long time (Machado 2004; Pickles et al. 2011).
There was significant variation in snorts among giant otter groups and individuals, although
the discriminations of these sounds were weak and there was no strict separation within these

146
groups. Snort variation among neighboring groups and individuals may result from vocal learning
(Weilgart & Whitehead 1997; Boughman 1998; Janik & Slater 1998; Sousa-Lima et al. 2002,
2008; Crockford et al. 2004) and genetic variation (Sousa-Lima et al. 2002, 2008; Rendell et al.
2012). However the absence of correspondence between the acoustic parameters measured in
snorts and genetic traits of some senders may indicate that variations in this type of sound are more
likely achieved by vocal learning. Considering the cohesion of giant otter groups, vocal learning
could evolve through the intense social interactions among individuals (Fitchel & Manser 2010).
Nevertheless, the high degree of genetic relationship among giant otter groups of the Vermelho
and Miranda Rivers (Ribas 2012) indicates a high exchange of individuals among groups, which
may dilute differences (Boughman 1998).
The main function of alarm sounds is to inform about predation risk (Blumstein 1999) and
individual discrimination through alarm signals may have an adaptive value (Pollard 2011; Hare
1998; Blumstein & Daniel 2004; Matrosova et al. 2011). Social species are expected to have more
individualistic alarm signals (Pollard 2011), since the recognition of alarm calls of group members
may inform a more imminent threat than calls from more distant conspecifics (Hare 1998).
However contact calls and loud screams, which can be heard over large distances, may be more
likely to carry identity coding than alarm calls (Charrier et al. 2001; McComb & Reby 2005), as
observed in screams of sea otters (McShane et al. 1995). Furthermore, the use of other modalities
of signals, such as scent-marks, plays an important role in individual identity in mustelids (e.g.
Palphramand & White 2007; Oldham & Black 2009) and these multi-modal signals may enhance
the communication of identity among giant otter groups (Bradbury & Vehrencamp 1998;
Leuchtenberger & Mourão 2009). Although giant otter snorts commonly elicit a reaction in other
individuals (Duplaix 1980; Chapter 3), the potential function of this call in carrying identity coding
must be further tested by playback experiments.

147
Giant otter-snorts differed significantly between sexes. The distinctiveness of potential
mates is commonly accessed through acoustic source filter traits, which may indicate the hormonal
status of senders and their phenotypic characteristics (Sousa-Lima et al. 2002, 2008; Vannoni &
Elligott 2008; Charlton et al. 2010). The frequencies and dispersion of formants were the
parameters most likely to encode group, individual and sex discrimination in giant otter snorts.
These acoustic traits are determined by the filter component of the vocal tract (Fitch 1997;
McComb & Reby 2005) and play important roles in size estimation and individual recognition in
mammals (Fitch 1997; Fitch & Fritz 2006; Vanoni & McElligott 2007). Since formants are an
‗honest‘ indication of body size, some species identify potential mates through the formant
frequencies of the sender‘s calls (Vannoni & Elligott 2008; Charlton et al. 2010), and this may also
be an important cue to potential mates in giant otters.
Giant-otter-male snorts had lower formant dispersion and lower frequencies at the fifth
formants than female snorts. Considering giant otter‘s vocal tract as a uniform tube, the negative
correlation between formant dispersion and vocal tract length (Fitch 1997) suggests that adult
males have larger vocal tracts than adult females, which may also correspond to larger body sizes
(Fitch 1997; Reby & McComb 2003; Sanvito et al. 2007; Charlton et al. 2009; Charlton et al.
2011). Although some authors have suggested that giant otter adult males have larger body size
and wider necks than adult females (Duplaix 1980; Carter & Rosas 1997), Rosas et al. (2009) did
not record significant differences in body measurements of captive males (average of 163 cm and
22.5 kg, N=11) and females (average of 162 cm and 28.8 kg, N =4). However, measurement of
three adult males captured for radio-telemetry procedures in Pantanal (Chapter 2) presented higher
values (171-183 cm total body length and 29.5-32.9 kg of total weight) than those presented by
Rosas et al. (2009). These values may be an indication of geographic variation in body structure
between individuals in the Pantanal and in Amazonia (Carter & Rosas 1997) or the differences

148
may just be due to the vagaries of sampling. If sexual dimorphism exists in giant otters,
broadcasting body size through snorts may provide a tool for sexual selection in the species. The
next step in testing this hypothesis is to correlate senders‘ vocal tract length with body size, which
will clarify the function of formants in discriminating sex and physical characteristics among giant
otters.
ACKNOWLEDGMENT
We thank CNPq (grant n. 476939/2008-9), the Rufford Small Grants Foundation (grant n.
88.08.09), the Mohamed bin Zayed Species Conservation Fund (project n. 10051040) and IDEA
Wild for their financial support. We are also indebted to Embrapa Pantanal, Barranco Alto Farm
and the Federal University of Mato Grosso do Sul for their logistic support. Paulo R. dos Santos,
Waldomiro de L. e Silva, Sidnei Benício, Procópio de Almeida and José A. D. da Silva assisted us
in the field. Carlos A. Zucco and Victor Landeiro helped us with some of the data analysis. C. R.
Lehn helped with the organization of sound files. We thank Victor Sábato and Luciana Erdtman
for useful suggestions. We are grateful to Ubiratan Piovezan for lending equipments during the
field work.

149
RESUMO
Variações acústicas em vocalizações de animais podem carregar codificações de
identidade, as quais em espécies sociais podem melhorar a comunicação dentro e entre grupos, e
pode ser útil para identificar o sexo dos emissores. Ariranhas vivem em grupos altamente coesos,
que defendem territórios exclusivos ao longo dos corpos d'água, usando sinais acústicos e
químicos. Bufos são sinais de alarme estridentes, vocalizados em contextos de pergio, os quais
geralmente provocam uma reação em outros membros do grupo. O objetivo deste estudo foi
determinar se bufos de ariranhas variam entre áreas de estudo, grupos sociais, indivíduos e entre
sexos. Sons de alarme emitidos por vinte ariranhas, compondo oito grupos diferentes, foram
gravados entre Setembro de 2009 e Junho de 2011 nos rios Vermelho e Negro no Pantanal. O sexo
e identidade dos indivíduos foi determinado. Parâmetros acústicos, assim como as frequências
formantes, foram medidos e analisados através de programas acústicos. Variáveis acústicas dos
bufos não diferiram entre áreas de estudo. Bufos variaram significativamente entre grupos,
indivíduos e entre sexos, apresentando uma discrminação maior entre sexos. A frequência dos
formantes (F1-F5) e a dispersão dos formantes (DF) potencialmente permitem a codificação de
identidade entre grupos, indivíduos e sexos. A alta discriminação da variação acústica dos bufos
entre sexos pode estar relacionada com a informação do tamanho corporal transmitida pela
frequência e dispersão dos formantes, indicando algum dimorfismo sexual em ariranhas.
Diferenças acústicas entre grupos e indivíduos são mais propensos a serem aprendidas, uma vez
que nós não encontramos correlação com as caracteríticas genéticas de alguns indivíduos.
Key-words: dentidade acústica; frequência formante; Pteronura brasiliensis; discriminação de
sexo; comunicação vocal.

150
REFERENCES
Blumstein, D. T. 1999. Alarm calling in three species of marmots. Behaviour, 136, 731-757.
Blumstein, D. T. & Daniel, J. C. 2004. Yellow-bellied marmots discriminate between the alarm
calls of individuals and are more responsive to calls from juveniles. Animal Behaviour, 68,
1257–1265.
Boughman, J. W. 1998. Vocal Learning by Greater Spear-Nosed Bats. Biological Sciences,
265(1392), 227-233.
Bradbury, J. W. & Vehrencamp, S. L. 1998. Principles of Animal Communication.
Massachusetts, Sinauer Associates Inc. Publishers. 882 pp.
Carter, S. & Rosas, F. C. W. 1997. Biology and Conservation of the Giant Otter Pteronura
brasiliensis. Mammal Review, 27, 1-26.
Charlton, B. D.; Zhihe, Z. & Snyder, R. J. 2009. The information content of giant panda,
Ailuropoda melanoleuca, bleats: acoustic cues to sex, age and size. Animal Behaviour, 78,
893–898.
Charlton, B. D.; Zhile, Z. & Snyder, R. J. 2010. Giant pandas perceive and attend to formant
frequency variation in male bleat. Animal Behaviour, 79, 1221-1227.
Charlton, B. D.; Ellis, W. A. H.; McKinnan, A. J.; Cowin, G. J.; Brumm, J.; Nolsson, K. &
Fitch W. T. 2011. Cues to body size in the formant spacing of male koala (Phascolarctos
cinereus) bellows: honesty in an exaggerated trait. The Journal of Experimental Biology,
214, 3414-3422.
Charrier, I.; Jouventin, P.; Mathevon, N. & Aubin, T. 2001. Individual identity coding
depends on call type in the South Polar skua Catharacta maccormicki. Polar Biology, 24,
378-382.

151
Collins, K. T. & Terhune, J. M. 2007. Geographic variation of Weddell seal (Leptonychotes
weddellii) airborne mother–pup vocalisations. Polar Biology, 30, 1373–1380.
Crockford, C.; Herbinger, I.; Vigilant, L. & Boesh, C. 2004. Wild chimpanzees produce
group-specific calls: a case for vocal learning? Ethology, 110, 221—243.
Delgado, R. A. Jr. 2007. Geographic Variation in the Long Calls of Male Orangutans (Pongo
spp.). Ethology, 113, 487–498.
Duplaix, N. 1980. Observations on the ecology and behaviour of the giant river otter Pteronura
brasiliensis in Surinam. Review Ecologique (Terre Vie), 34, 495–520.
Fitch, W. T. & Hauser, M. D. 1995. Vocal production in nonhuman primates: Acoustics,
physiology, and functional constraints on ‗honest‘ advertisement. American Journal of
Primatology, 37, 191–219.
Fitch, W. T. 1997. Vocal tract length and formant frequency dispersion correlate with body size in
rhesus macaques. Journal of the Acoustical Society of America, 102, 1213-1222.
Fitch, W. T. & Fritz, J. B. 2006. Rhesus macaques spontaneously perceive formants in
conspecific vocalizations. Journal of the Acoustical Society of America, 120, 2132-2141.
Fitchel, C. & Manser, M. 2010. Vocal communication in social groups. In: Animal Behaviour:
Evolution and Mechanisms, Part I, (Ed. by P. Kappeler), pp. 29-54. Springer Berlin
Heidelberg.
Hamilton, S. K.; Sippel, S. J. & Melack, J. M. 1996. Inundation patterns in the Pantanal
wetland of South America determined from passive microwave remote sensing. Archives of
Hydrobiology, 137, 1-23.
Hare, J. F. 1998. Juvenile Richardson‘s ground squirrels, Spermophilus richardsonii,
discriminate among individual alarm callers. Animal Behaviour, 55, 451–460.

152
Janik, V. & Slater, P. J. B. 1998. Context-specific use suggests that bottlenose dolphin
signature whistles are cohesion calls. Animal Behaviour, 56, 829-838.
Koren, L. & Geffen, E. 2011. Individual identity is communicated through multiple pathways in
male rock hyrax (Procavia capensis) songs. Behavioral Ecology and Sociobiology, 65,
675–684.
Leuchtenberger, C. & Mourão, G. 2008. Social organization and territoriality of giant otters
(Carnivora: Mustelidae) in a seasonally flooded savanna in Brazil. Sociobiology, 52, 257-
270.
Leuchtenberger, C. & Mourão, G. 2009. Scent-marking of giant otter in the Southern Pantanal,
Brazil. Ethology, 115, 210–216.
Machado, M. R. B. 2004. Bioacústica de ariranhas (Pteronura brasiliensis) (Carnivora:
Mustelidae): discriminação vocal e repertório. MSc thesis, Universidade Federal do
Amazonas and Instituto Nacional de Pesquisa da Amazônia, Amazonas, Brazil.
Matrosova, V. A.; Blumstein, D. T.; Volodin, I. A. & Volodina, E. V. 2011. The potential to
encode sex, age, and individual identity in the alarm calls of three species of Marmotinae.
Naturwissenschaften, 98, 181–192.
McComb, K.; Reby, D.; Baker, L.; Moss, C. & Sayialel, S. 2003. Long-distance communication
of acoustic cues to social identity in African elephants. Animal Behaviour, 65, 317–329.
McComb, K. & Reby, D. 2005. Vocal communication networks in large terrestrial mammals. In:
Animal Communication Networks. (Ed. by P. McGregor). pp. 372-389. University Press.
McShane, L.; Estes, J. A.; Riedman, M. L. & Staedler, M. M. 1995. Repertoire, structure and
individual variation of vocalisation in the sea otter. Journal of Mammalogy, 76, 414–427.

153
Mitani, J. C.; Hunley, K. L. & Murdoch, M. E. 1999. Geographic variation in the calls of wild
chimpanzees: a reassessment. American Journal of Primatology 47, 133–151.
Oksanen, J.; Kindt, R.; Legendre, P.; O’Hara, B.; Simpson, G. L.; Solymos, P.; Stevens, M.
H. H. & Wagner, H. 2008. The Vegan Package.
Oldham, A. & Black, J. M. 2009. Experimental tests of latrine use and communication by river
otters. Northwestern Naturalist, 90(3), 207-211.
Palphramand, K. & White, P. C. L. 2007. Badgers, Meles meles, discriminate between
neighbour, alien and self scent. Animal Behaviour, 74, 429-436.
Pickles, R. S. A; Groombridge, J. J.; Zambrana Rojas, V. D.; Van Damme, P.; Gottelli, D.;
Kundu, S.; Ariani, C. V.; Iyenar, A. & Jordan, W. C. 2011. Evolutionary history and
identification of conservation units in the giant otter, Pteronura brasiliensis. Molecular
Phylogenetics and Evolution, 1:12.
Pollard, K. A. 2011. Making the most of alarm signals: the adaptive value of individual
discrimination in an alarm context. Behavioral Ecology, 22(1), 93-100.
Reby, D. & McComb, K. 2003. Anatomical constraints generate honesty: acoustic cues to age
and weight in the roars of red deer stags. Animal Behaviour, 65, 519–530.
Rendall, D.; Rodman, P.S. & Emond, R.E. 1996. Vocal recognition of individuals and kin in
free-ranging rhesus monkeys. Animal Behaviour, 51, 1007–1015.
Rendell, L.; Mesnick, S. L.; Dalebout, M. L.; Burtenshaw, J. & Whitehead, H. 2012. Can
genetic differences explain vocal dialect variation in sperm whales, Physeter
macrocephalus? Behavioral Genetics, 42, 332-343.
Ribas, C. & Mourão, G. 2004. Intraspecific agonism between giant otter groups. IUCN Otter
Specialist Group Bulletin, 21, 89–93.

154
Ribas, C.; Damasceno, G.; Magnusson, W.; Leuchtenberger, C. & Mourão, G. 2012. Giant
otters feeding on caiman: evidence for an expanded trophic niche of recovering
populations. Studies on Neotropical Fauna and Environment, 47, 19-23.
Ribas, C. 2012. Grau de parentesco e relações sociais entre grupos de ariranhas (Pteronura
brasiliensis). PhD thesis. Instituto Nacional de Pesquisas da Amazônia. 105pp.
Robisson, P.; Aubin, T. & Bremond, J-C. 1993. Individuality in the voice of the Emperor
Penguin Aptenodytes forsteri: adaptation to a noisy environment. Ethology, 94(4), 279-290.
Rosas, F. C. W.; da Rocha, C. S.; Mattos, G. E. de & Lazzarini, S. M. 2009. Body Weight-
Length Relationships in Giant Otters (Pteronura brasiliensis) (Carnivora, Mustelidae).
Brazilian Archievs of Biology and Technology, 52(3), 587-591.
Sanvito, S.; Galimberti, F. & Miller, E. H. 2007. Vocal signalling of male southern elephant
seals is honest but imprecise. Animal Behaviour, 73, 287-299.
Schweizer, J. 1992. Ariranhas no Pantanal: Ecologia e comportamento da Pteronura
brasiliensis. Edibran-Editora Brasil Natureza Ltda, Curitiba, Paraná.
Sousa-Lima, R.; Paglia, A. P. & Fonseca, G. A. B. da. 2002. Signature information and
individual recognition in the isolation calls of Amazonian manatees, Trichechus inunguis
(Mammalia: Sirenia). Animal Behaviour, 63, 301-310.
Sousa-Lima R., Paglia A. P. & Fonseca G. A. B. da. 2008. Gender, age, and identity in the
isolation calls of Antillean manatees (Trichechus manatus manatus). Aquatic Mammals,
34(1), 109-122
Thioulouse, J.; Chessel, D.; Doledec, S. & Olivier J. M. 1997. Ade-4: a multivariate analysis
and graphical display software. Statistics and Computing, 7, 75–83.
Trephy, S. A. & Hik, D. S. 2010. Variation in pika (Ochotona collaris, O. princeps)
vocalizations within and between populations. Ecography, 33, 784-795.

155
Vannoni, E. & McElligott, A. G. 2007. Individual acoustic variation in fallow deer (Dama
dama) common and harsh groans: a source-filter theory perspective. Ethology, 113, 223–
234.
Vannoni, E. & McElligott, A. G. 2008. Low frequency groans indicate larger and more
dominant fallow deer (Dama dama) males. Plos One, 3(9), 1-8.
Venables, W. N. & Ripley, B. D. 2002. Modern applied statistics with S. 4th edition. Springer,
New York.
Weilgart, L. & Whitehead, H. 1997.Group-specific dialects and geographical variation in coda
repertoire in South Pacific sperm whales. Behavioral Ecology and Sociobiology, 40, 277-
285.

156
FIGURE LEGENDS
Figure 1. Map of the study area showing the limits of linear territories (dot ellipsis) of eight giant
otter groups (G1, G2, G10, G12, G17 – G20) monitored from September 2009 to June 2011 in
the Southern Pantanal of Brazil.

157
Figure 2. Spectrogram and oscillogram (bottom) of snorts vocalized by a giant otter dominant
female (a) and a dominant male (b). Arrows indicate the five formants (F1-F5) that present higher
energy in the frequency spectrum.
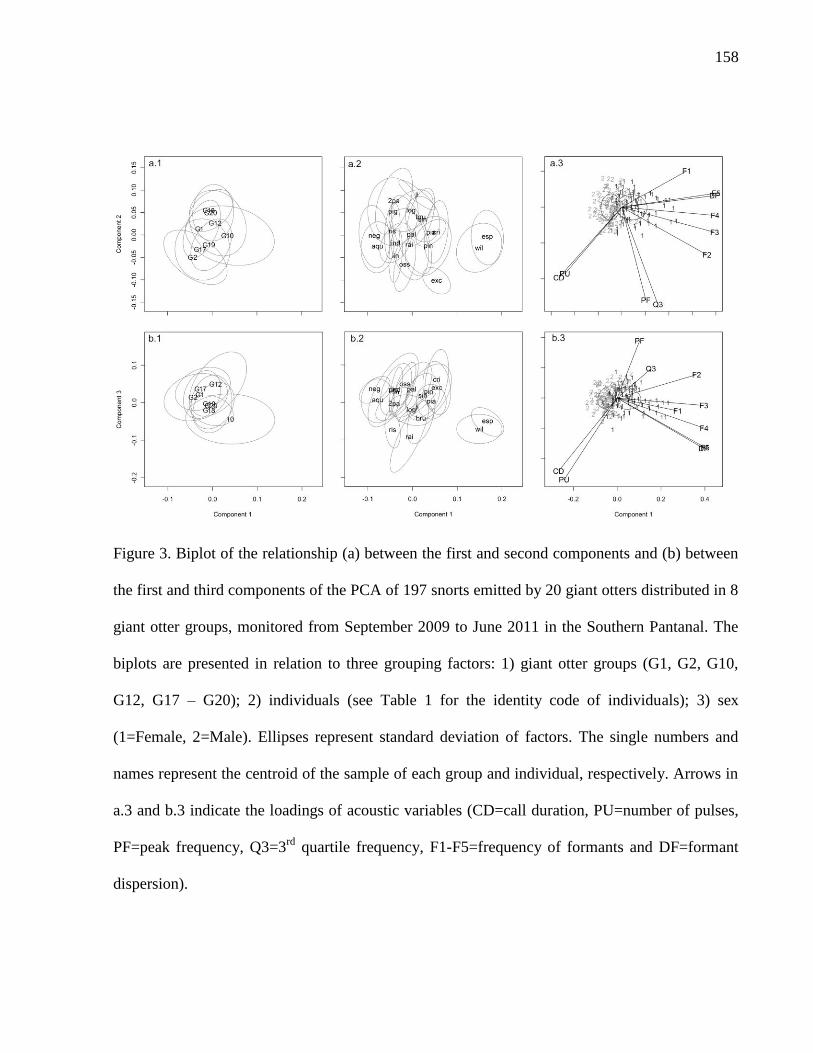
158
Figure 3. Biplot of the relationship (a) between the first and second components and (b) between
the first and third components of the PCA of 197 snorts emitted by 20 giant otters distributed in 8
giant otter groups, monitored from September 2009 to June 2011 in the Southern Pantanal. The
biplots are presented in relation to three grouping factors: 1) giant otter groups (G1, G2, G10,
G12, G17 – G20); 2) individuals (see Table 1 for the identity code of individuals); 3) sex
(1=Female, 2=Male). Ellipses represent standard deviation of factors. The single numbers and
names represent the centroid of the sample of each group and individual, respectively. Arrows in
a.3 and b.3 indicate the loadings of acoustic variables (CD=call duration, PU=number of pulses,
PF=peak frequency, Q3=3rd
quartile frequency, F1-F5=frequency of formants and DF=formant
dispersion).

159
TABLES
Table 1. Number of snorts recorded from giant otters living in 8 groups (Group ID=G1, G2, G10,
G12, G17-G20) located in the Miranda (Mir), Vermelho (Ver), EPP road (EPP) and Negro (Neg)
Rivers in the Southern Pantanal, Brazil. Additional information of each individual are presented
as sex (M=male, F=female), hierarchical status (D=dominant, S=subordinate) and group size,
which varied during the study period.
ID
Snorts
(N)
Sex/Hierarchical
status
Group
ID
Group
Size Location
ji 4 FS G1 5 - 8 Mir
ind 10 MS
aqu 16 MD G2 3 Mir/EPP
exc 7 FD
pal 10 MD G10 9 - 15 Mir/Ver
wil 7 FS
esp 9 FS
ris 18 MS
pig 6 MD G12 2 - 3 Mir/EPP
cri 8 FD
oss 11 FD G17 5 - 9 Neg
pin 10 FS
neg 10 MS
log 11 FD G18 4 - 8 Neg
lin 12 MD G19 3 Neg
rai 5 FD
pia 10 FS
2pa 10 MD G20 6 - 9 Neg
bru 11 FD
sin 12 FS

160
Table 2. Coefficient of variation (CV) average (±SD) and potential for individual identity coding
(PIC) of ten acoustic parameters (CD – call duration, PU – number of pulses, PF – peak
frequency, Q3F – 3rd
quartile frequency, F1-F5 – frequency of formants 1-5 and DF – formant
dispersion) measured from 197 snorts vocalized by 20 giant otters (8 males and 11 females)
distributed in 8 groups localized two study areas in the Southern Pantanal, Brazil. CV and PIC
are presented within study areas (CViare, PICare), among groups (CVigro, PICgro), among
individuals (CViind, PICind), between sex (CVisex, PICsex) and the total coefficient of variation
(CVtot).
Parameter CViare CVigro CViind CVisex CVtot PICare PICgro PICind PICsex
CD 35.52
±0.96
35.39
±11.68
31.17
±13.72
33.56
±5.03
35.54 1 1 1.14 1.06
PU 35.93
±1.8
35.23
±11.06
33.67
±11.56
34.79
±3.47
35.86 1 1.02 1.07 1.03
PF 50.37
±2.23
50.3
±13.61
45.92
±17.36
50.49
±1.6
50.34 1 1 1.1 1
Q3F 25.39
±2.42
23.63
±4.52
21.21
±7.2
24.3
±0.49
25.39 1 1.08 1.2 1.04
F1 11.05
±1.44
9.93
±2.93
7.19
±2.25
9.52
±0.59
11.1 1 1.12 1.54 1.17
F2 17.3
±3.48
15.9
±3.64
11.51
±3.85
14.6
±0.21
17.44 1 1.1 1.52 1.2
F3 13.47
±3.04
11.88
±4.04
8.4
±3.51
11.5
±3.84
13.84 1.03 1.17 1.65 1.2
F4 12.93
±3.54
10.39
±3.04
7.2
±2.27
10.59
±3.55
13.41 1.04 1.29 1.86 1.27
F5 9.15
±2.85
7.51
±1.81
5.2
±1.52
7.57
±1.37
9.31 1.02 1.24 1.79 1.23
DF 9.44
±3.01
7.72
±1.9
5.56
±1.66
7.94
±1.38
9.6 1.02 1.25 1.73 1.21

161
Table 3. Results of the differences (ANOVA) between the snort formant frequencies (F1-F5) and
formant dispersion (DF) of giant otter females and males. Mean and standard deviation (SD) are
given in Hz.
ANOVA Females Males
F1,195 P Mean SD Mean SD
F1 66.017 <0.001 0.37 0.04 0.33 0.03
F2 80.926 <0.001 1.38 0.2 1.14 0.17
F3 51.856 <0.001 2.56 0.36 2.25 0.2
F4 75.926 <0.001 3.96 0.52 3.43 0.28
F5 84.095 <0.001 5.63 0.48 5.08 0.34
DF 75.671 <0.001 1.32 0.12 1.19 0.08

162
SÍNTESE
Ariranhas são sociais e se alimentam principalmente de peixes (Duplaix, 1980, Rosas et
al. 1999). A espécie se orienta visualmente para capturar suas presas, o que parece limitar sua
atividade ao período diurno (Duplaix, 1980; Schweizer, 1992; Kruuk, 2006). Neste estudo,
utilizando o método de rádio-telemetria e armadilhas fotográficas, observamos que grupos de
ariranhas apresentam um padrão de atividade crepuscular e diurno no Pantanal, com picos de
saída da loca no início da manhã (06:00 h) e de entrada na loca no final do dia (16:00 a 19:00 h),
como observado por outros autores (Duplaix, 1980; Schweizer, 1992). No entanto, 31% das
atividades registradas por armadilhas fotográficas ocorreram durante a noite. A maoria dos
registros noturnos correspondeu a eventos individuais, que podem estar associados com a
passagem do alimento através do trato digestivo (Carter et al., 1999), comportamento territorial,
risco de predação e disponibilidade de presas próximo à loca.
Apesar do crescente conhecimento sobre ariranhas desde o estudo pioneiro de Duplaix
(1980), informações sobre ecologia espacial têm sido restritas a observações diretas realizadas
durante a estação seca. Neste estudo apresentamos estimativas de área de vida de três grupos de
ariranhas adquiridas através de rádio-telemetria, que variaram entre 0.1 e 2.3 km2 (LoCoh 98%)
na estação seca e de 3.6 a 7.9 km2 na estação chuvosa. Mudanças sazonais no tamanho da área de
vida têm sido observadas para muitos carnívoros (Curtis & Zaramody, 1998; Dillon & Kelly,
2008; Valenzuela & Ceballos, 2000), incluindo lontras (Blundell et al., 2000), e parecem estar
fortemente relacionadas com a disponibilidade de recursos. O aumento de área de vida observada
neste estudo é similar ao estimado por Utreras et al. (2005) na Amazônia do Equador e parece
estar associado à dispersão de peixes nas áreas alagadas, como sugerido por (Duplaix, 1980).
Enquanto que a disponibilidade de barrancos para a construção de locas e latrinas não foi um
fator limitante, já que alguns grupos utilizaram vegetação emergente como refúgio durante o pico
de inundação.
A fidelidade à área de vida entre estações variou de 0 a 87%, já que durante a estação
chuvosa dois grupos monitorados com rádio-telemetria abandoram a área utilizada durante a seca
e dispersaram para a planície inundada. Mudanças na disponibilidade de características da
paisagem podem induzir mudanças nos padrões de seleção de habitat (Arthur et al., 1996).

163
Grupos de ariranhas foram seletivos em relação ao uso de elementos da paisagem durante a
estação seca. No entanto, eles foram menos seletivos durante a estação chuvosa. Considerando
que a disponibilidade de alimento é um fator importante na seleção de habitat da espécie
(Duplaix, 1980), a dispersão de peixes para áreas alagadas pode afetar a movimentação dos
grupos, que passam a se deslocar mais imprevisivelmente ao longo do ambiente a procura de
alimento para maximizar o ganho energético, como esperado para animais que utilizam
estratégias de forrageamento ótimo (Schoener, 1971).
O tamanho da área de vida de carnívoros geralmente apresenta uma relação positiva com
as necessidades metabólicas dos animais (Gittleman & Harvey, 1982). De acordo com essa
relação, ariranhas apresentam uma área de vida menor do que esperada para uma espécie com
uma dieta estritamente carnívora. Isto sugere que ariranhas dependem de uma base de presas
grande e densa, relativos a um habitat saudável. Como a produtividade de peixes está ligada com
o pulso de inundação em ambientes sazonais (Welcomme 1985; 1990), a manutenção de
flutuações hidrológicas anuais deve ser considerada uma prioridade para a conservação de uma
espécie vulnerável, que tem peixes como sua presa principal. Esta é uma preocupação
particularmente importante para ariranhas no Pantanal, devido aos mais de 70 projetos
hidrelétricos e outros 44 em fase de contrução na Bacia do Rio Paraguai (Mourão et al., 2010),
que deverão promover mudanças drásticas no pulso de inundação desta grande planície
inundável.
Territorialidade implica em custos e benefícios, que geralmente são afetados pela
abundância e previsibilidade de alimento no tempo e espaço (Macdonald, 1983). Neste estudo,
grupos de ariranhas defenderam territórios ao longo das estações secas e chuvosas e alguns
grupos sobrepuseram os limites de seus territórios com grupos vizinhos. Embora algumas
espécies dispendem um maior esforço em defender partes do território que são mais requisitadas
por competidores (Kruuk et al., 1984; Sillero-Zubiri & Macdonald, 1998; Zub et al., 2003; Herr
& Rosell, 2004), a densidade de sinais químicos não foi significativamente diferente entre as
áreas sobrepostas e exclusivas dos territórios. No entanto, o número de sinais químicos foi
positivamente relacionado ao tamanho do território, o que pode ser uma estratégia para reduzir a
invasão de intrusos, já que territórios marcados esparsamente podem ser considerados como uma
área vaga para o estabelecimento de grupos vizinhos (Sillero-Zubiri & Macdonald, 1998).

164
O tamanho da extensão total do território foi maior durante as estações chuvosas do que
durante as estações secas e esteve correlacionado positivamente com o tamanho do grupo em
ambas as estações. Embora essa relação não seja comum para carnívoros socias em ambientes
heterogêneos (Macdonald, 1983; Doncaster & Macdonald, 1992; Johnson et al., 2001; Adams,
2001), este resultado pode estar relacionado com as necessidades metabólicas dos grupos, uma
vez que grupos maiores necessitariam acessar mais recursos (Macdonald, 1983; Kruuk &
Macdonald, 1985). Mas essa relação também pode ser um efeito da capacidade de defesa, uma
vez que grupos maiores teriam a capacidade de defender territórios maiores. Durante a estação
seca, o tamanho do território exclusivo foi relacionado negativamente com o número de adultos
presentes em grupos adjacentes, como observado para outras espécies (Stamps, 1990; Stamps &
Krishnan, 1990; Wolf, 1993; Tallents et al., 2012). No entanto, na estação chuvosa não
observamos relação entre a pressão de intrusos e o tamanho dos territórios exclusivos,
provavelmente por que os recursos estão mais amplamente distribuídos neste período, atenuando
a pressão de grupos vizinhos com a diminuição da densidade de ariranhas ao longo dos corpos
d‘água. Dessa forma, os resultados indicam que a capacidade de defesa exece um papel
importante na manutenção de territórios de grupos de ariranhas ao longo das estações, o que pode
afetar o sucesso reprodutivo dos casais dominantes.
Ariranhas vivem em grupos coesos, que realizam a maioria das atividades diárias em
conjunto (Duplaix, 1980; Leuchtenberger & Mourão, 2008) e dessa forma necessitam de um
complexo sistema de comunicação para manter as relações sociais dentro e entre os grupos. O
repertório vocal da espécie representou um contínuo, com transições e gradações que aumentam a
complexidade do sistema de comunicação da espécie. Classificamos 15 tipos sonoros distintos
emitidos em diferentes contextos comportamentais, que estiveram significativamente associados
com a ordenação das variáveis acústicas. Embora haja muita sobreposição entre contextos de
medo e afiliativos (August & Anderson, 1987), o repertório vocal de ariranhas parece estar de
acordo com o modelo de estrutura motivacional (Morton, 1977) e reflete o estado motivacional
dos indivíduos.
A principal função dos sons de alarme é informar sobre o risco de predação (Blumstein,
1999) e a discriminação individual através de sinais de alarme pode ter um valor adaptativo
(Hare, 1998; Blumstein & Daniel, 2004; Matrosova et al., 2011; Pollard, 2011). Espécies sociais
podem apresentar individualidade em sinais de alarme (Pollard, 2011), uma vez que o

165
reconhecimento de sons de alarme de membros do grupo pode informar um perigo mais eminente
do que sons de indivíduos mais distantes (Hare, 1998). Ariranhas vocalizam sons de alarme
(snorts), que geralmente resultam em uma reação nos demais membros do grupo e, dessa forma,
são sinais potenciais para transmitir informações individuais (Bezerra et al., 2010). Neste estudo,
snorts não foram significativamente distintos entre as áreas de estudo, mas discriminaram
significativamente entre grupos sociais e indivíduos, sendo que a discriminação foi mais forte
entre fêmeas e machos. A frequência e a dispersão dos formantes foram as variáveis acústicas
com maior potencial para codificar identidade de grupo, indivíduos e sexos. Estas características
acústicas são determinadas por componentes do trato vocal denominadas de filtro (Fitch 1997,
McComb & Reby, 2005) e têm uma importante função na estimativa de tamanho e
reconhecimento individual em mamíferos (Fitch, 1997; Fitch & Fritz, 2006; Vanoni &
McElligott, 2007). A correlação negativa entre a dispersão dos formantes e o comprimento do
trato vocal (Fitch, 1997) sugere que machos adultos de ariranhas têm tratos vocais maiores do
que fêmeas adultas, o que pode também corresponder a maiores tamanhos corporais. Dessa
forma, snorts poderiam ser uma importante ferramenta para seleção de potenciais parceiros
reprodutivos na espécie. No entanto, a discriminação de identidade de grupos, indivíduos e entre
sexos deve ser testada com experimentos de play-back, além das correlações entre trato vocal e
dispersão de formantes, para confirmar a função dos formantes na discriminação sexual e de
características físicas entre ariranhas.

166
REFERÊNCIAS BIBLIOGRÁFICAS
Adams, E.S. 1994. Settlement Tactics in Seasonally Territorial Animals: Resolving Conflicting
Predictions. American Naturalist, 143(5): 939-943.
Adams, E.S. 2001. Approaches to the study of territory size and shape. Annual Review of Ecology
and Systematics, 32: 277-303.
Aebischer, N.J.; Robertson, P.A. & Kenward, R.E. 1993. Compositional analysis of habitat use
from animal radio-tracking data. Ecology, 74(5): 1313−1325.
Alho, C.J.R. 2008. Biodiversity of the Pantanal: response to seasonal flooding regime and to
environmental degradation. Brazilian Journal of Biology, 68(4): 957-966.
Altmann, J. 1974. Observational study of behaviour: sampling methods. Behaviour, 49: 227–267.
Anoop, K.R. & Hussain, S.A. 2004. Factors affecting habitat selection by smooth-coated otters
(Lutra perspicillata) in Kerala, India. Journal of Zoology, 263:417–423.
Arthur, S.M.; Manly, B.F.J.; McDonald, L.L. & Garner, G.W. 1996. Assessing habitat selection
when availability changes. Ecology, 77(1):215-227.
Aschoff, J. 1966. Circadian activity pattern with two peaks. Ecology, 47:657-662.
August, P.V. & Anderson, J.G.T. 1987. Mammal sounds and motivation-structural rules: A test
of the hypothesis. Journal of Mammalogy, 68(1), 1-9.
Belan, I.; Lehner, P.N. & Clark, T. 1978. Vocalizations of the American Pine Marten, Martes
Americana. Journal of Mammalogy, 59 (4), 871-874.
Bezerra, B.M.; Souto, A.S., Schiel, N. & Jones, G. 2010. Notes on vocalisations of giant otters in
the flooded Igapó forests of Jaú National Park, Amazonas, Brazil. Journal of Ethology,
29(1), 169-175.
Blumstein, D.T. & Daniel, J.C. 2004. Yellow-bellied marmots discriminate between the alarm
calls of individuals and are more responsive to calls from juveniles. Animal Behaviour, 68:
1257–1265.
Blumstein, D.T. 1999. Alarm calling in three species of marmots. Behaviour, 136:731-757.
Blumstein, D.T.; Richardson, D.T.; Cooley, L., Winternitz, J. & Daniel J.C. 2008. The structure,
meaning and function of yellow-bellied marmot pup screams. Animal Behaviour, 76: 1055-
1064.

167
Blundell, G.M.; Maier, J.A.K. & Debevec, E.M. 2001. Linear home ranges: effects of smoothing,
sample size, and autocorrelation on kernel estimates. Ecological Monographs,
71(3):469−489.
Blundell, G.M.; Bowyer, R.T.; Ben-David, M.; Dean, T.A. & Jewett, S.C. 2000. Effects of food
resources on spacing behavior of river otters: does forage abundance control home-range
size?. In: Eiler, J.H.; Alcorn, D.J. & Neuman, M.R. (Eds). Proceedings of the Fifteenth
International Symposium on Biotelemetry. International Society of Biotelemetry,
Wageningen, Netherlands. p. 325-333.
Boughman, J.W. 1998. Vocal Learning by Greater Spear-Nosed Bats. Biological Sciences,
265(1392): 227-233.
Bradbury, J.W. & Vehrencamp, S.L. 1998. Principles of Animal Communication. Massachusetts,
Sinauer Associates Inc. Publishers. 882 pp.
Brennan, P.A. & Kendrick, M.K. 2006. Mammalian social odours: attraction and individual
recognition. Philosophical Transactions of The Royal Society B, 361: 2061-2078.
Briefer, E.F. 2012. Vocal expression of emotions in mammals: mechanisms of production and
evidence. Journal of Zoology, http://dx.doi.org/10.1111/j.1469-7998.2012.00920.x.
Brown, J.L. 1982. Optimal group size in territorial animals. Journal Theoretical Biology, 95:
793-810.
Brown, J.L. & Orians, G.H. 1970. Spacing patterns in mobile animals. Annual Review of Ecology
and Systematics, 1: 239-262.
Callenge, C. 2006. The package ―adehabitat‖ for the R software: A tool for the analysis of space
and habitat use by animals. Ecological Modelling, 197:516–519.
Callenge, C. & Dufour A.B. 2006. Eigenanalysis of selection ratios from animal radio-tracking
data. Ecology, 87 (9): 2349–2355.
Carter, S.K.; Rosas, F.C.W.; Cooper, A.B. & Cordeiro-Duarte, A.C. 1999. Consumption rate,
food preferences and transit time of captive giant otter Pteronura brasiliensis: Implications
for the study of wild populations. Aquatic Mammals 25(2):79-90.
Carter, S. & Rosas F.C.W. 1997. Biology and conservation of the giant otter Pteronura
brasiliensis. Mammal Review, 27(1):1−26.
Charlton, B.D.; Ellis, W.A.H.; McKinnan, A.J.; Cowin, G.J.; Brumm, J.; Nolsson, K. & Fitch,
W.T. 2011. Cues to body size in the formant spacing of male koala (Phascolarctos

168
cinereus) bellows: honesty in an exaggerated trait. The Journal of Experimental Biology,
214: 3414-3422.
Charlton, B.D.; Zhihe, Z. & Snyder, R.J. 2009. The information content of giant panda,
Ailuropoda melanoleuca, bleats: acoustic cues to sex, age and size. Animal Behaviour, 78:
893–898.
Charlton, B.D.; Zhile, Z. & Snyder, R.J. 2010. Giant pandas perceive and attend to formant
frequency variation in male bleat. Animal Behaviour, 79: 1221-1227.
Charrier, I.; Jouventin, P.; Mathevon, N. & Aubin, T. 2001. Individual identity coding depends
on call type in the South Polar skua Catharacta maccormicki. Polar Biology, 24: 378-382.
Collias, N.E. 1960. An ecological and functional classification of animal sounds. In: Lanyon,
W.E. & Tavolga, W.N (Eds). Animal sounds and communication. American Institute of
Biological Sciences. p. 368-391.
Collins K.T. & Terhune J.M. 2007. Geographic variation of Weddell seal (Leptonychotes
weddellii) airborne mother–pup vocalizations. Polar Biology, 30:1373–1380.
Crockford C., Herbinger I., Vigilant L. & Boesh C. 2004. Wild chimpanzees produce group-
specific calls: a case for vocal learning? Ethology, 110: 221-243.
Crockford, C. & Boesch, C. 2005. Call combinations in wild chimpanzees. Behaviour, 142 (4):
397-421.
Curtis, D. J. and Zaramody, A. 1998. Group size, home range use, and seasonal variation in the
ecology of Eulemur mongoz. International Journal of Primatology, 19 (5):811-835.
Daly, M.; Behrends, P.R.; Wilson, M.I. & Jacobs, L.F. 1992. Behavioral modulation of predation
risk: moonlight avoidance and crepuscular compensation in a nocturnal desert rodent,
Dipodomys merriami. Animal Behaviour, 44:1-9.
De Solla, S.R.; Bonduriansky, R. & Brooks, R.J. 1999. Eliminating autocorrelation reduces
biological relevance of home range estimates. The Journal of Animal Ecology,
68(2):221−234.
Delgado, R.A.Jr. 2007. Geographic variation in the long calls of male orangutans (Pongo spp.).
Ethology, 113: 487–498.
Dillon, A. & Kelly, M.J. 2008. Ocelot home range, overlap and density: comparing radio
telemetry with camera trapping. Journal of Zoology, 275:391–398.

169
Doncaster, C.P. & Macdonald, D.W. 1992. Optimum group size for defending heterogenous
distributions of resources: A model applied to red foxes, Vulpes vulpes, in Oxford City.
Journal of Theoretical Biology, 159: 189-198.
Duplaix N. 1980. Observations on the ecology and behavior of the giant river otter Pteronura
brasiliensis in Suriname. Revue Ecologique (Terre Vie) 34: 496-620.
Duplaix, N. 1982. Contribution à l'écologie et à l'éthologie de Pteronura brasiliensis (Carnivora,
Lutrinae): Implications évolutives. PhD Thesis, Université Paris-Sud. 353 pp.
Duplaix, N. 2004. Guyana giant otter project: 2002-2004 research results. Oceanic Society. San
Francisco, California, USA: 44 p.
http://www.giantotterresearch.com/articles/OCEANIC_SOCIETY_Guyana_Project_Report
_2002-2004.pdf
Endler, J. A. 2000. Evolutionary implications of the interaction between animal signals and the
environment. In: Espmark, Y.; Amundsen, T. & Rosenqvist, G. (Eds). Animal Signals:
Signaling and Signal design in animal communication. Tapir Academic Press, Trondheim,
Norway. p. 11-46.
Erlinge, S. 1967. Home range of the otter Lutra lutra L. in southern Sweden. Oikos
18(2):186−209.
Erlinge, S. 1968. Territoriality of the Otter Lutra lutra L. Oikos 19 (1): 81-98
Evangelista, E. & Rosas, F.C.W. 2011a. The home range and movements of giant otters
(Pteronura brasiliensis) in the Xixuaú Reserve, Roraima, Brazil, IUCN Otter Specialist
Group Bulletin, 28(A):31−37.
Evangelista, E. & Rosas, F.C.W. 2011b. Breeding behavior of giant otter (Pteronura brasiliensis)
in the Xixuaú Reserve, Roraima, Brazil. IUCN Otter Specialist Group Bulletin,
28(A):5−10.
Farley, S.D.; Lehner, P.N.; Clark, T. & Trost, C. 1987. Vocalizations of the Siberian ferret
(Mustela eversmanni) and comparisons with other Mustelids. Journal of Mammalogy,
68(2): 413-416.
Fitch, W.T. & Hauser, M.D. 1995. Vocal production in nonhuman primates: Acoustics,
physiology, and functional constraints on ‗honest‘ advertisement. American Journal of
Primatology, 37; 191–219.

170
Fitch, W.T. 1997. Vocal tract length and formant frequency dispersion correlate with body size in
rhesus macaques. Journal of Acoustic Society of America, 102 (2): 1213-1222.
Fitch, W. T.; Neubauer, J. & Herzel, H. 2002. Calls out of chaos: the adaptive significance of
nonlinear phenomena in mammalian vocal production. Animal Behaviour, 63: 407–418.
Fitch, W.T. & Fritz, J.B. 2006. Rhesus macaques spontaneously perceive formants in conspecific
vocalizations. Journal of Acoustic Society of America, 120(4): 2132-2141.
Fitchel, C. & Manse,r M. 2010. Vocal communication in social groups Animal Behaviour:
Evolution and Mechanisms, Part I, Pages 29-54.
Garcia de Leaniz, C.; Forman, D.W.; Davies, S. & Thomson, A. 2006. Non-intrusive monitoring
of otters (Lutra lutra) using infrared technology. Journal of Zoology, 270: 577-584.
Gerell, R. 1969. Activity patterns of the mink Mustela vison Schreber in southern Sweden. Oikos
20:451-460.
Getz, W.M. & Wilmers C.C. 2004. A local nearest-neighbor convex-hull construction of home
ranges and utilization distributions. Ecography, 27: 489−505.
Gittleman, J.L. & Harvey, P.H. 1982. Carnivore home-range size, metabolic needs and ecology.
Behavioral Ecology and Sociobiology, 10(1): 57−63.
Gnoli, C. & Prigioni, C.1995. Preliminary study on the acoustic communication of captive otters
(Lutra lutra). Hystrix, 7(1-2): 289-296.
Gómez, J.R.; Jorgenson, J.P. & Valbuena, R. 1999. Report on the rehabilitation and release of
two giant river otter (Pteronura brasiliensis) pups in the Bita river (Vichada, Colombia).
IUCN Otter Specialist Group Bulletin, 16(2): 86-89.
Gompper, M.E. & Gittleman, J.L. 1991. Home range scaling: intraspecific and comparative
trends. Oecologia, 87(3): 343-348.
Gosling, L.M. & Roberts, S.C. 2001. Testing ideas about the function of scent marks in territories
from spatial patterns. Animal Behaviour, 62: F7-F10.
Gosling, L.M. 1982. A reassessment of the function of scent marking in territories. Zeitschrift für
Tierpsychologie, 60: 89–118.
Grant, J.W.A.; Chapman, C.A. & Richardson, K.S. 1992. Defended versus undefended home
range size of carnivores, ungulates and primates. Behavioral Ecology and Sociobiology, 31:
149-161.

171
Groenendijk, J.; Hajek, F.; Duplaix, N.; Reuther, C.; Van Damme, P.; Schenk, C.; Staib, E.;
Wallace, R.; Waldemarin, H.; Notin, R.; Marmontel, M.; Rosas, F.W.C.; Mattos De, G.E.;
Evangelista, E.; Utreras, V.; Lasso, G.; Jaques, H.; Matos, K.; Roopsind, I. & Botello, J.C.
2005. Surveying and monitoring distribution and population trends of the giant otter
(Pteronura brasiliensis). Habitat, 16: 1-500.
Hamilton, S.K.; Sippel, S.J. & Melack, J.M. 1996. Inundation patterns in the Pantanal wetland of
South America determined from passive microwave remote sensing. Archiv für
Hydrobiologie, 137:1−23.
Hare, J.F. 1998. Juvenile Richardson‘s ground squirrels, Spermophilus richardsonii, discriminate
among individual alarm callers. Animal Behaviour, 55: 451–460.
Herr, J. & Rossell, F. 2004. Use of space and movement patterns in monogamous adult Eurasian
beavers (Castor fiber). Journal of Zoology, London, 262: 257–264
Hijmans, R.J. & van Etten, J. 2010. Raster: package for reading, writing, and manipulating raster
(grid) type geographic (spatial) data. http://cran.r-project.org/web/packages/r
aster/index.html.
Humphrey, S. R. & Zinn, T. L. 1982. Seasonal habitat use by river otters and everglades mink in
Florida. The Journal of Wildlife Management, 46: 375–381
Huff, N. & Price, E. O. 1968. Vocalizations of the least weasel, Mustela nivalis. Journal of
Mammalogy, 49(3): 548-550.
Ivlev, V.S. 1961. Experimental ecology of the feeding of fishes. Yale University Press, New
Haven, Connecticut, USA.
Janik, V. & Slater, P.J.B. 1998. Context-specific use suggests that bottlenose dolphin signature
whistles are cohesion calls. Animal Behaviour, 56: 829-838.
Johnson, D.H. 1980. The comparison of usage and availability measurements for evaluating
resource preference. Ecology 61(1): 65−71.
Kean, E.F.; Müller, C.T. & Chadwick, E.A. 2011. Otter scent signals age, sex, and reproductive
status. Chemical Senses, 36: 555-564.
Keitt, T.H.; Bivand, R.; Pebesma, E. & Rowlingson, B. 2010. Rgdal: bindings for the geospatial
data abstraction library. R package version 0.6-24. http://CRAN.R-
project.org/package=rgdal

172
Kernohan, B.J.; Gitzen, R.A. & Millspaugh, J.J. 2001. Analysis of animal space use and
movements. In: Millspaugh, J. J. & Marzluff, J. M. (Eds). Radio tracking and Animal
Populations. San Diego: Academic press. p. 125-166.
Kleiman, D.G. 1989. Reintroduction of captive mammals for conservation. BioScience,
39(3):152−161.
Koren, L. & Geffen, E. 2011. Individual identity is communicated through multiple pathways in
male rock hyrax (Procavia capensis) songs. Behaviroal Ecology and Sociobiology, 65:
675–684.
Krebs, J.R., and Davies, N.B. 1997. Behavioural ecology: an evolutionary approach. 4th ed.
Oxford, UK: Blackwell.
Kruuk, H. 1992. Scent marking by otters (Lutra lutra): signaling the use of resources. Behavioral
Ecology, 3(2): 133-140
Kruuk, H. 2006. Otters: Ecology, behavior and conservation. Oxford University Press Inc., New
York.
Kruuk, H. & Macdonald, D.W. 1985. Group territories of carnivores: empires and enclaves. In:
Sibly, R. M. & Smith, R. H. (Eds). Behavioural ecology: ecological consequences of
adaptive behavior. Blackwell Scientific Publications, Oxford, UK. p. 521-536.
Kruuk, H.; Gorman, M. & Leitch, A. 1984. Scent-marking with the subcaudal gland by the
European Badger, Meles meles L. Animal Behaviour, 32: 899-907.
Laidler L. 1984. The behavioral ecology of the giant otter in Guyana. Master dissertation,
University of Cambridge.
Lehner, P.N. 1998. Handbook of ethological methods. Garland STPM Press, London, 672 pp.
Leuchtenberger, C & Mourão, G. 2009. Scent-marking of giant otter in the Southern Pantanal,
Brazil. Ethology, 115:210–216.
Leuchtenberger C. & Mourão G. 2008. Social organization and territoriality of giant otters
(Carnivora: Mustelidae) in a seasonally flooded Savanna in Brazil. Sociobiology, 52 (2):
257-270.
Lewin-Koh, N.J., et al. 2009. Maptools: Tools for reading and handling spatial objects. R
package version 0.7-29. http://CRAN.R-project.org/package=maptools
173
Lim, N.T.L. & Ng, P.K.L. 2008. Home range, activity cycle and natal den usage of a female
Sunda pangolin Manis javanica (Mammalia: Pholidota) in Singapore. Endangered Species
Research, 4: 233-240.
Lima, dosS.D. 2009. Ocorrência de ariranhas Pteronura brasiliensis (Carnivora: Mustelidae) e
interferências antrópicas à espécie no lago Amanã, Reserva de Desenvolvimento
Sustentável Amanã, Amazonas. Dissertação de Mestrado. Fundação Universidade Federal
do Amapá. 58pp.
Lima, D. dos S.; Marmontel, M. & Bernard, E. 2012. Site and refuge use by giant river otters
(Pteronura brasiliensis) in the Western Brazilian Amazonia. Journal of Natural History,
46(11-12): 729−739.
Lode T. 1995. Activity pattern of polectas Mustela putorius L. in relation to food habits and prey
activity. Ethology, 100: 295-308.
Macdonald, D.W. 1983. The ecology of carnivore social behaviour. Nature, 301: 379−384.
Macdonald, S.M., and Mason, C.F. 1983. Some factors influencing the distribution of otters
(Lutra lutra). Mammal Review, 13:1–10.
Machado, M.R.B. 2004. Bioacústica de ariranhas (Pteronura brasiliensis) (Carnivora:
Mustelidae): discriminação vocal e repertório. Dissertação de Mestrado, Instituto Nacional
de Pesquisa da Amazônia. 94pp.
Maher, C.R. & Lott, D.F. 2000. A review of ecological determinants of territoriality within
vertebrate species. The American Midland Naturalist, 143(1):1−23.
Mares, R.; Young, A.J. & Clutton-Brock, T.H. 2012. Individual contributions to territory defence
in a cooperative breeder: weighing up the benefits and costs. Philosophical Transactions of
The Royal Society B, (http// rspb.royalsocietypublishing.org) Acesso: 10/07/2012.
Matrosova, V.A.; Blumstein, D.T.; Volodin, I.A. & Volodina, E.V. 2011. The potential to encode
sex, age, and individual identity in the alarm calls of three species of Marmotinae.
Naturwissenschaften, 98:181–192.
McComb, K.; Reby, D.; Baker, L.; Moss, C. & Sayialel, S. 2003. Long-distance communication
of acoustic cues to social identity in African elephants. Animal Behaviour, 65: 317–329.
McComb, K. & Reby, D. 2005. Vocal communication networks in large terrestrial mammals. In
McGregor, P. (Eds). Animal communication networks. Cambridge University Press. p 372-
389.

174
McComb, K. & Semple, S. 2005. Coevolution of vocal communication and sociality in primates.
Biology Letters, 1: 381–385.
McShane, L.; Estes, J.A.; Riedman, M.L. & Staedler, M.M. 1995. Repertoire, structure and
individual variation of vocalisation in the sea otter. Journal of Mammalogy, 76: 414–427.
Medina-Vogel, G.; Kaufman, V. S.; Monsalve, R. & Gomez, V. 2003. The influence of riparian
vegetation, woody debris, stream morphology and human activity on the use of rivers by
southern river otters in Lontra provocax in Chile. Oryx, 37(4):422−430.
Melquist, W. E. & Hornocker, M.G. 1983. Ecology of river otters in west Central Idaho. Wildlife
Monographs, 83:1-60.
Mitani, J.C.; Hunley, K.L. & Murdoch, M.E. 1999. Geographic variation in the calls of wild
chimpanzees: a reassessment. American Journal of Primatology, 47:133–151.
Morales-Betancourt, D. 2011. Report of an adaptive reintroduction of a juvenile giant otter
(Pteronura brasiliensis). IUCN Otter Specialist Group Bulletin, 28 (1): 23-33.
Morton, E.S. 1977. On the occurrence and significance of motivation-structural rules in some bird
and mammal sounds. American Naturalist, 111: 855–869.
Mourão, G. & Carvalho, L. 2001. Canibalism among giant otters (Pteronura brasiliensis).
Mammalia 6(2): 225-227.
Mourão, G.; Tomas, W. & Campos, Z. 2010. How much can the number of jabiru stork
(Ciconiidae) nests vary due to change of flood extension in a large Neotropical floodplain?
Zoologia, 27(5):751−756.
Oksanen, J.; Kindt, R.; Legendre, P.; O‘Hara, B.; Simpson, G. L.; Solymos, P.; Stevens, M. H. H.
& Wagner, H. 2008. The Vegan Package.
Oldham, A. & Black, J.M. 2009. Experimental tests of latrine use and communication by river
otters. Northwestern Naturalist, 90(3): 207-211.
Ottaviani, D., Cairns, S.C.; Oliverio, M. & Boitani, L. 2006 Body mass as a predictive variable of
home-range size among Italian mammals and birds. Journal of Zoology, 269: 317–330.
Palphramand, K. & White, P.C.L. 2007. Badgers, Meles meles, discriminate between neighbour,
alien and self scent. Animal Behaviour, 74: 429-436.
Perrin, M. R., and C.Carugati. 2000. Habitat use by the cape clawless otter and the spotted-
necked otter in the KwaZulu-Natal Drakensberg, South Africa. South African Journal of
Wildlife Research, 30(3):103−113.

175
Peters, G. 2002. Purring sounds in mammals. Mammal Review, 32 (4), 245–271.
Pickles, R.; Zambrana, V.; Jordan, B.; Hoffmann-Heap, I.; Salinas, A.; Groombridge, J. &
Damme, P.V. 2011. An evalutaion of the utility of camera traps in monitoring giant otter
populations. IUCN Otter Specialist Group Bulletin, 28:39-45.
Pickles, R.S.A; Groombridge, J.J.; Zambrana Rojas, V.D.; Van Damme, P.; Gottelli, D.; Kundu,
S.; Ariani, C.V.; Iyenar, A. & Jordan, W.C. 2011. Evolutionary history and identification of
conservation units in the giant otter, Pteronura brasiliensis. Molecular Phylogenetics and
Evolution, 1:12.
Pollard, K.A. 2011. Making the most of alarm signals: the adaptive value of individual
discrimination in an alarm context. Behavioral Ecology, 22(1): 93-100.
Pollard, K.A. & Blumstein, D.T. 2012. Evolving communicative complexity: insights from
rodents and beyond. Philosophical Transactions of The Royal Society B, 367: 1869–1878.
Powell, R. A. 2000. Animal home ranges and territories and home range estimators. Pp. 65-110
In: Boitani, L. & Fuller, T.K. (Eds). Research techniques in animal ecology: controversies
and consequences. Columbia University Press, New York.
Ralls K. & Siniff D.B. 1990. Time budget and activity patterns in California sea otters. The
Journal of Wildlife Management 54:251-259.
Reby D. & McComb K. 2003. Anatomical constraints generate honesty: acoustic cues to age and
weight in the roars of red deer stags. Animal Behaviour, 65: 519–530.
Renard, D. & Bez, N. 2005. RGeoS: geostatistical package. R package. Version 2.1. Centre de
Géostatistique, Ecole des Mines de Paris, Fontainebleau, France.
Rendall, D.; Rodman, P.S. & Emond, R.E. 1996. Vocal recognition of individuals and kin in free-
ranging rhesus monkeys. Animal Behaviour, 51: 1007–1015
Rendell, L.; Mesnick, S.L.; Dalebout, M.L.; Burtenshaw, J. & Whitehead, H. 2012. Can genetic
differences explain vocal dialect variation in sperm whales, Physeter macrocephalus?
Behavior Genetics, 42: 332-343.
Revilla, E. & Palomares, F. 2002. Spatial organization, group living and ecological correlates in
low-density populations of Eurasian badgers, Meles meles. Journal of Animal Ecology, 71:
497–512.
Reynolds, T.D. & Laundre, J.W. 1990. Time intervals for estimating pronghorn and coyote home
ranges and daily movements. The Journal of Wildlife Management, 54(2): 316−322.

176
Ribas, C. 2012. Grau de parentesco e relações sociais entre grupos de ariranhas (Pteronura
brasiliensis). PhD thesis. Instituto Nacional de Pesquisas da Amazônia, Manaus, Brazil.
105pp.
Ribas, C.; Damasceno, G.; Magnusson, W.; Leuchtenberger, C. & Mourão, G. 2012. Giant otters
feeding on caiman: evidence for an expanded trophic niche of recovering populations.
Studies on Neotropical Fauna and Environment, 47: 19-23.
Ribas, C. & Mourão, G. 2004. Intraspecific agonism between giant otter groups. IUCN Otter
Specialist Group Bulletin, 21: 89–93.
Ribas, C. 2004. Desenvolvimento de um programa de monitoramento em longo prazo das
ariranhas (Pteronura brasiliensis) no pantanal brasileiro. Dissertação de Mestrado.
Universidade Federal do Mato Grosso do Sul, Campo Grande, Brazil. 68pp.
Riede, T.; Herzel, H.; Mehwald, D.; Seidner, W.; Trumler, E.; Böhme, G. & Tembrock, G. 2000.
Nonlinear phenomena in the natural howling of a dog-wolf mix. The Journal of the
Acoustical Society of America, 108: 1435–1442.
Riede, T.; Owren, M.J. & Arcadi, A.C. 2008. Nonlinear acoustics in pant hoots of common
chimpanzees (Pan troglodytes): frequency jumps, subharmonics, biphonation, and
deterministic chaos. American Journal of Primatology, 64: 277–291.
Riede, T.; Wilden, I & Tembrock, G. 1997. Subharmonics, biphonations, and frequency jumps-
common components of mammalian vocalization or indicators for disorders. Zeitschrift für
Säugetier, 62 (Suppl 2): 198–203.
Robisson, P.; Aubin, T. & Bremond, J-C. 1993. Individuality in the voice of the Emperor
Penguin Aptenodytes forsteri: adaptation to a noisy environment. Ethology, 94 (4): 279-290
Rooney, S.M.; Wolfe, A. & Hayden, T. J. 1998. Autocorrelated data in telemetry studies: time to
independence and the problem of behavioural effects. Mammal Review, 28(2): 89–98.
Rosas, F.C.W.; Zuanon, J.A.S. & Carter, S.K. 1999. Feeding ecology of the giant otter,
Pteronura brasiliensis. Biotropica, 31: 502-506.
Rosas, F.C.W.; Waldemarin, H. & Mattos, G.E.de. 2008. Pteronura brasiliensis (Zimmermann,
17880). pp. 800-801. In: Machado, A.B.M.; Drummond G.M. & Paglia A.P. (Eds). Livro
Vermelho da Fauna Brasileira Ameaçada de Extinção. 1a Ed. Belo Horizonte: Ministério
do Meio Ambiente - Fundação Biodiversitas.

177
Rosas, F.C.W.; da Rocha, C.S.; Mattos, G.E.de & Lazzarini, S.M. 2009. Body weight-length
relationships in giant otters (Pteronura brasiliensis) (Carnivora, Mustelidae). Brazilian
Archievs of Biology and Technology, 52 (3): 587-591.
Rostain, R.R.; Ben-David, M.; Groves, P. & Randall, J.A. 2004. Why do river otters scent-mark?
An experimental test of several hypotheses. Animal Behaviour, 68: 703-711.
Roux, A.L.; Cherry, M.I. & Manser, M.B. 2009. The vocal repertoire in a solitary foraging
carnivore, Cynictis penicillata, may reflect facultative sociality. Naturwissenschaften, 96:
575–584.
Ruiz-Olmo, J.; Margalida, A. & Batet, A. 2005. Use of small rich patches by Eurasian otter
(Lutra lutra L.) females and cubs during the pre-dispersal period. Journal of Zoology, 265:
339–346.
Samuel, M.D.; Pierce, D.J. & Garton, E.O. 1985. Identifying areas of concentrated use within the
home range. Journal of Animal Ecology, 54(3): 711−719.
Sanvito, S.; Galimberti, F. & Miller, E.H. 2007. Vocal signalling of male southern elephant seals
is honest but imprecise. Animal Behaviour, 73: 287 299.
Schassburger, R.M. 1993. Vocal communication in the Timber Wolf, Canis lupus, Linnaeus. Paul
Parey Scientific Publishers, Berlin, Germany.
Schenck, C. 1999. Lobo de Rio (Pteronura brasiliensis). Presencia, uso del hábitat y protección
en el Perú. GTZ/INRENA, Lima, Peru.
Schoener, T.W. 1971. Theory of Feeding Strategies. Annual Review of Ecology and Systematics,
2: 369−404
Schweizer, J. 1992. Ariranhas no Pantanal: Ecologia e comportamento de Pteronura
brasiliensis. Edibran-Editora Brasil Natureza Ltda, Curitiba, Paraná.
Servheen, C. & Klaver, R. 1983. Grizzly bear dens and denning activity in the Mission and
Rattlesnake Mountains, Montana. Bears: Their Biology and Management, 5: 201-207.
Sieber, O.J. 1984. Vocal communication in raccoons (Procyon lotor). Behaviour, 90(1/3): 80-
113.
Sikes, R.S.; Gannon, W.L. & the Animal Care and Use Committee of the American Society of
Mammalogists. 2011. Guidelines of the American Society of Mammalogists for the use of
wild mammals in research. Journal of Mammalogy, 92: 235-253.

178
Sillero-Zubiri, C. & Macdonald, D.W. 1998. Scent-marking and territorial behaviour of Ethiopian
wolves Canis simensis. Journal of Zoology, 245, 351–361.
Silveira, L.; Furtado, M.M.; Rosas, F.C.W.; Silva, L.C.; Cabral, M.M.M.; Torres, N.M.;
Sollmann, R.; Kouba, A. & Jácomo, A.T.A. 2011. Tagging giant otters (Pteronura
brasiliensis) (Carnivora, Mustelidae) for radio-telemetry studies. Aquatic Mammals, 37:
208-212.
Sousa-Lima, R.; Paglia, A. P. & Fonseca, G.A.B.da. 2002. Signature information and individual
recognition in the isolation calls of Amazonian manatees, Trichechus inunguis (Mammalia:
Sirenia). Animal Behaviour, 63: 301-310.
Sousa-Lima, R.; Paglia, A.P. & Fonseca, G.A.B.da. 2008. Gender, age, and identity in the
isolation calls of Antillean manatees (Trichechus manatus manatus). Aquatic Mammals,
34(1): 109-122
Souza, J.D.de. 2004. Estudos ecológicos da ariranha, Pteronura brasiliensis (Zimmermann,
1780) (Carnivora: Mustelidae) no Pantanal Mato-Grossense. Dissertação de Mestrado,
Universidade Federal do Mato Grosso, Brazil. 97pp.
Stabler, B. 2003. Shapefiles, version 0.3. R package. http://cran.r-project.org.
Staib, E. 2005. Eco-Etología del Lobo de Río (Pteronura brasiliensis) en el Sureste del Perú.
Tese de Doutorado. Sociedad Zoológica de Francfort Perú.
Stamps, J.A. 1990. The effect of contender pressure on territory size and overlap in seasonally
territorial species. The American Naturalist, 135(5): 614-632.
Stamps, J.A. 1995. Motor learning and the value of familiar space. The American Naturalist,
146(1): 41−58.
Stamps, J.A. & Krishnan, V.V. 1990. The effect of settlement tactics on territory sizes. The
American Naturalist, 135(4): 527-546.
Stamps, J.A. & Krishnan, V.V. 1999. A learning-based model of territory establishment. The
Quarterly Review of Biology, 74(3): 291-318.
Stevens S.S. & Serfass T.L. 2008. Visitation patterns and behavior of nearctic river otters (Lontra
canadensis) at latrines. Northeastern Naturalist, 15:1-12.
Stoeger, A.; Baotic, A.; Li, D. & Charlton, B. D. 2012. Acoustic features indicate arousal in
infant giant panda vocalisations. Ethology, 118: 1–10.

179
Sueur, J.; Aubin, T. & Simonis, C. 2008. Seewave: a free modular tool for sound analysis and
synthesis. Bioacustics, 18: 213-216.
Tallents, L.A.; Randall, D.A.; Williams, S.D. & Macdonald, D.W. 2012. Territory quality
determines social group composition in Ethiopian wolves Canis simensis. Journal of
Animal Ecology, 81: 24–35.
Taylor, A.M. & Reby, D. 2010. The contribution of source–filter theory to mammal vocal
communication research. Journal of Zoology, 280: 221–236.
Terry, A. M. R.; Peake, T. M. & McGregor, P. K. 2005. The role of vocal individuality in
conservation. Frontiers in Zoology, 2:10.
Thioulouse, J.; Chessel, D.; Doledec, S. & Olivier, J.M. 1997. Ade-4: a multivariate analysis and
graphical display software. Statistics and Computing, 7: 75–83.
Tokuda, I.; Riede, T. Neubauer, J.; Owren, M. & Herzel, H. 2005. Nonlinear analysis of irregular
animal vocalizations The Journal of the Acoustical Society of America, 111(6): 2908-2919.
Tomas, W.; Borges, P.A.L.; Rocha, H.J.F.; Sá Filho, R.; Kutchenski Junior, F. & Udry, T.V.
2000. Potencial dos Rios Aquidauana e Miranda, no Pantanal de Mato Grosso do Sul, para
a conservação da ariranha (Pteronura brasiliensis). In: III Simpósio sobre Recursos
Naturais e Sócio-econômicos do Pantanal: Os Desafios do Novo Milênio. Corumbá, Brazil.
Trephy, S.A.& Hik, D.S. 2010. Variation in pika (Ochotona collaris, O. princeps) vocalizations
within and between populations. Ecography,, 33: 784-795.
Utreras, V. & Pinos, L. 2003. Camera trap use for studying giant otters (Pteronura brasiliensis)
in the Yasuní Biosphere Reserve, Ecuadorian Amazon. IUCN Otter Specialist Group
Bulletin, 20:12-13.
Utreras, V.B.; Suárez, E.R.; Zapata-Ríos, G.; Lasso, G. & Pinos, L. 2005. Dry and rainy season
estimations of giant otter, Pteronura brasiliensis, home range in the Yasuní National Park,
Ecuador. The Latin American Journal of Aquatic Mammals, 4 (2):1–4.
Valenzuela, D. & Ceballos, G. 2000. Habitat Selection, Home Range, and Activity of the White-
Nosed Coati (Nasua narica) in a Mexican Tropical Dry Forest. Journal of Mammalogy,
81(3): 810−819.
Vannoni, E. & McElligott, A.G. 2007. Individual acoustic variation in fallow deer (Dama dama)
common and harsh groans: a source-filter theory perspective. Ethology, 113: 223–234.

180
Vannoni, E. & McElligott, A.G. 2008. Low frequency groans indicate larger and more dominant
fallow deer (Dama dama) males. Plos One, 3(9): 1-8.
Venables, W.N. & Ripley, B.D. 2002. Modern applied statistics with S. 4th edition. Springer,
New York.
Wantzen, K.M.; Machado, F.deA.; Voss, M.; Boriss, H. & Junk, W.J. 2002. Seasonal isotopic
shifts in fish of the Pantanal wetland, Brazil. Aquatic Sciences, 64:239–251.
Weilgart, L. & Whitehead, H. 1997.Group-specific dialects and geographical variation in coda
repertoire in South Pacific sperm whales. Behavioral Ecology and Sociobiology, 40: 277-
285.
Welcomme, R.L. 1985. River fisheries. FAO Fish. Technical Paper, 262.
Welcomme, R.L. 1990. Status of fisheries in South American rivers. Interciência, 15(6):
337−345.
White, P.C.L. & Harris, S. 1994. Encounters between red foxes (Vulpes vulpes): implications for
territory maintenance, social cohesion and dispersal. Journal of Animal and Ecology, 63(2):
315-327.
Wilden, I.; Herzel, H.; Peters, G. & Tembrock, G. 1998. Subharmonics, biphonation, and
deterministic chaos in mammal vocalization. Bioacoustics, 9: 171-196.
Wilkinson, L. 2004. SYSTAT—Systems for Statistics. Version 11. Systat Software Inc, Chicago,
Illinois.
Wilson, E. 2000. Sociobiology: The new synthesis. 25th
Aniversary ed. President and Fellows of
Harvard College, USA. 697pp.
Winemiller, K.O. & Jepsen, D.B. 1998. Effects of seasonality and fish movement on tropical
river food webs. Journal of Fish Biology, 53A: 267–296.
Wolf, J.O. 1993. Why Are Female Small Mammals Territorial? Oikos, 68(2): 364-370.
Wong, J.; Stewart, P.D. & MacDonald, D.W. 1999. Vocal repertoire in the European badger
(Meles meles): structure, context, and function. Journal of Mammalogy, 80: 570–588.
Zielinski, W.J. 1988. The influence of daily variation in foraging cost on the activity of small
carnivores. Animal Behaviour, 36: 239-249.
Zub, K., Theuerkauf, J, Edrzejewski, B. J. I., Schmidt, K. & Alczyk, R. K. 2003. Wolf pack
territory marking in the Bilaowieza Primeval Forest (Poland). Behaviour, 140: 635-648.

181
APÊNDICE I

182

183

184

185

186
APÊNDICE II

187
APÊNDICE III

188
APÊNDICE IV

189
APÊNDICE V

190
APÊNDICE VI

191
APÊNDICE VII

192
APÊNDICE VIII