imageamento gpr e m p r carbonÁticas carstificadas … · universidade federal do rio grande do...
TRANSCRIPT
UNIVERSIDADE FEDERAL DO RIO GRANDE DO NORTE
CENTRO DE CIÊNCIAS EXATAS E DA TERRA PROGRAMA DE PÓS GRADUAÇÃO EM GEODINÂMICA E
GEOFÍSICA
IMAGEAMENTO GPR E MEDIDAS PETROFÍSICAS DE ROCHAS
CARBONÁTICAS CARSTIFICADAS DA FORMAÇÃO SALITRE, NORTE DA BAHIA
Autora: Iurianne Monik Medeiros Conti
Orientador: David Lopes de Castro
Dissertação nº 208/PPGG
Natal/RN 23 de Julho de 2018
UNIVERSIDADE FEDERAL DO RIO GRANDE DO NORTE
CENTRO DE CIÊNCIAS EXATAS E DA TERRA PROGRAMA DE PÓS GRADUAÇÃO EM GEODINÂMICA E GEOFÍSICA
IMAGEAMENTO GPR E MEDIDAS PETROFÍSICAS DE
ROCHAS CARBONÁTICAS CARSTIFICADAS DA
FORMAÇÃO SALITRE, NORTE DA BAHIA
Autora: Iurianne Monik Medeiros Conti
Dissertação de Mestrado apresentada em 23 de julho de 2018 ao Programa de Pós-Graduação em Geodinâmica e Geofísica (PPGG) da Universidade Federal do Rio Grande do Norte (UFRN) como requisito a obtenção do Título de Mestre em Geodinâmica e Geofísica.
Comissão examinadora
Prof. Dr. David Lopes de Castro (PPGG/UFRN – Orientador) Prof. Dr. Josibel Gomes de Oliveira Júnior (DGEF/UFRN – Membro Externo)
Prof. Dr. José Antônio Barbosa (UFPE – Membro Externo)
Natal/RN 23 de Julho de 2018

Conti, Iurianne Monik Medeiros. Imageamento GPR e medidas petrofísicas de rochas carbonáticascarstificadas da formação salitre, norte da Bahia / IurianneMonik Medeiros Conti. - 2018. 71f.: il.
Dissertação (mestrado) - Universidade Federal do Rio Grandedo Norte, Centro de Ciências Exatas e da Terra, Programa de Pós-Graduação em Geodinâmica e Geofísica. Natal, 2018. Orientador: David Lopes de Castro.
1. Geofísica - Dissertação. 2. Carste - Dissertação. 3.Rochas carbonáticas - Dissertação. 4. Fraturas - Dissertação. 5.Porosidade - Dissertação. 6. Permissividade dielétrica -Dissertação. 7. GPR - Dissertação. I. Castro, David Lopes de.II. Título.
RN/UF/CCET CDU 550.3
Universidade Federal do Rio Grande do Norte - UFRNSistema de Bibliotecas - SISBI
Catalogação de Publicação na Fonte. UFRN - Biblioteca Setorial Prof. Ronaldo Xavier de Arruda - CCET
Elaborado por Joseneide Ferreira Dantas - CRB-15/324
UFRN/CCET/PPGG– Dissertação de Mestrado Agradecimentos
Agradecimentos
Primeiramente agradeço a Deus pelo seu infinito amor e misericórdia, que em
nenhum momento deixou me sentir sozinha nesta caminhada.
Agradeço a Universidade Federal do Rio Grande do Norte (UFRN) e ao
Programa de Pós-Graduação em Geodinâmica e Geofísica (PPGG) pela
oportunidade de realizar esse mestrado. Ao projeto Porocarste/Petrobras pelo
financiamento da pesquisa.
Agradeço ao Professor Dr. David Lopes de Castro pela orientação, apoio e
dedicação dados a este trabalho.
Ao Professor Dr. Francisco Hilário Bezerra pelas sugestões e contribuições,
pela coorientação e por todo apoio neste projeto.
Ao Professor Dr. Márcio Assolin Corrêa por gentilmente realizar as medidas
de permissividade dielétrica no Laboratório de Caracterização Elétrica e Magnética
da UFRN.
Ao meu companheiro Tomaz Lima pelo apoio emocional e também pelo apoio
técnico. A minha família pela torcida.
A geóloga da Petrobras Caroline L. Cazarin por ceder as amostras de plug e
pelas suas contribuições no trabalho.
A Juliana G. Rabelo pela imensa ajuda. A Adler P. de Araújo e Cícero R. da
Silva pelo trabalho de aquisição de dados.
A todos os amigos que contribuíram direta ou indiretamente nessa
caminhada. Em especial a Thayane S. C. Victor, pela amizade e pelo apoio
emocional. Aos colegas de trabalho do Laboratório de Sismologia da UFRN.

UFRN/CCET/PPGG – Dissertação de Mestrado Resumo
Resumo
O presente estudo compreende uma análise integrada de dados GPR e
petrofísicos que permitiram definir a distribuição tridimensional de zonas cársticas e
a distribuição de porosidade a partir de atributos GPR, em unidades de rochas
carbonáticas fraturadas da Formação Salitre na Pedreira Sal (norte da Bahia). Zonas
caracterizadas por reflexões de baixa amplitude podem estar associadas a halos de
dissolução mineral que se desenvolveram em torno de fraturas e planos de
acamamento. Os volumes GPR mostram uma geometria 3D das zonas de rochas
carbonáticas carstificadas, com orientações e dimensões semelhantes ao conjunto
de condutos controlados pelos sistemas de fraturas de direção N-S e E-W,
observado em imagens de veículos aéreos não tripulados. Medidas em amostras de
plugs indicam que a dissolução modificou a densidade, a permissividade dielétrica e
a porosidade das rochas carbonáticas estudadas. A densidade média e a
permissividade dielétrica relativa diminuíram de 2714 para 2713 kg/m3 e de 7,36
para 6,81, respectivamente, e a porosidade média aumentou ligeiramente de 0,95%
para 1,08%. Essas mudanças nas propriedades da rocha afetam os contrastes da
impedância EM entre os horizontes carbonáticos, causando a atenuação do sinal
GPR. A correlação entre a permissividade dielétrica e a porosidade pode ser
analisada usando o Modelo de Indice de Refração Complexo (CRIM), que usa a
velocidade EM estimada a partir de dados GPR. Apesar da porosidade obtida pelo
CRIM ser um pouco mais baixa que a porosidade medida nas amostras coletadas,
devido às diferentes escalas de medição, o fato de que a porosidade é ligeiramente
maior nas zonas carbonáticas carstificadas foi mantido. Além disso, os atributos
instantâneos de amplitude e frequência foram utilizados para estimar a variabilidade
espacial da porosidade ao longo de todo o volume de dados GPR. Assumindo a
correlação empírica entre as propriedades físicas e atributos, dois volumes de
porosidade estimada foram estabelecidos para as rochas carbonáticas carstificados
na área estudada.
Palavras-chave: Carste, Rochas Carbonáticas, Fraturas, Porosidade,
Permissividade Dielétrica, GPR
UFRN/CCET/PPGG – Dissertação de Mestrado Abstract
Abstract
Three-dimensional distribution of karstic zones and estimated porosity were
obtained in fractured carbonate units of the Salitre Formation (Northern of the Bahia
State) from GPR data and petrophysical. Low-amplitude GPR zones could be
associated with mineral dissolution halos that developed around fractures and
bedding planes. GPR volumes show a 3D mazelike geometry of the vertical karstified
carbonate zones, similar with the set of passages controlled by ~N-S and E-W
oriented fracture system, observed on surface in unmanned aerial vehicle images.
Measurements in plug samples indicate that the local karstification modified
the density, dielectric permittivity and porosity of the studied carbonate rocks. While
the average density and relative dielectric permittivity decreased from 2714 to 2713
kg/m3 and from 7.36 to 6.81, respectively, the average porosity slightly increased
from 0.95% to 1.08%. These changes in the rock properties affect the EM impedance
contrasts between carbonate bedding, causing attenuation of the reflected GPR
signal. The correlation between dielectric permittivity and porosity could be analyzed
using the complex refractive index model (CRIM), which uses EM velocity estimated
from GPR data. The CRIM porosities are somewhat lower than porosities derived
from plug sample due to different measurement scales. However, the fact that
porosity is slightly higher in the karstified carbonates was maintained. In addition,
GPR instantaneous amplitude and frequency attributes were used to estimate spatial
variability in porosity throughout the whole GPR data volume. The crossplot of these
two GPR attributes show that karstified zones generally cluster in narrow ranges of
GPR instantaneous amplitude and in broad range of GPR instantaneous frequency.
Assuming empirical correlation between physical properties and GPR attributes two
predicted porosity volumes were established for the karstified carbonates in the
studied area.
Keywords: Karst, Carbonates, Fractures, Porosity, Dielectric Permittivity, GPR
UFRN/CCET/PPGG – Dissertação de Mestrado Indice
Indice
Agradecimentos ......................................................................................... pág. i
Resumo ....................................................................................................... pág. ii
Abstract ....................................................................................................... pág. iii
Indice ........................................................................................................... pág. iv
Lista de Figuras........................................................................................... pág. vi
Capítulo I – Introdução
1.1 – Apresentação ...................................................................................... pág. 1
1.2 – Justificativa .......................................................................................... pág. 1
1.3 – Área de estudo .................................................................................... pág. 2
1.4 – Objetivos ............................................................................................. pág. 3
Capítulo II – Contexto geológico
2.1 – Geologia regional ................................................................................ pág. 5
2.2 – Geologia local ...................................................................................... pág. 6
Capítulo III – Materiais e métodos
3.1 – GPR ..................................................................................................... pág. 12
3.1.1 – Aquisição e processamento ............................................................ pág. 14
3.2 – Petrofísica............................................................................................ pág. 16
3.2.1 – Medidas petrofísicas ........................................................................ pág. 17
3.2.2 – Modelo de Indice de Refração complexo (CRIM) ............................ pág. 17
Conti, I.M.M. Dissertação N° 208 Julho/2018
UFRN/CCET/PPGG – Dissertação de Mestrado Indice
página v
Capítulo IV – Artigo
Abstract ........................................................................................................ pág. 27
1. Introduction ........................................................................................ pág. 27
2. Geological Setting .............................................................................. pág. 29
3. GPR Survey ....................................................................................... pág. 30
3.1. Data Acquisition and Processing.................................................. pág. 30
3.2. GPR Attributes.............................................................................. pág. 31
4. Rock Properties and Porosity Prediction ........................................... pág. 33
4.1. Plug Samples ............................................................................... pág. 33
4.2. Porosity Estimation - CRIM .......................................................... pág. 34
4.3. Porosity Estimation – GPR Attributes .......................................... pág. 35
5. Geometric Characterization of Altered Zone and Karstic
Features ............................................................................................ pág. 36
6. Discussions ........................................................................................ pág. 37
6.1. 3D Porosity Estimation ................................................................ pág. 38
6.2. 3D Geometric Characterization .................................................... pág. 38
7. Conclusions ....................................................................................... pág. 40
Acknowledgements ...................................................................................... pág. 41
References ................................................................................................... pág. 41
Capítulo V – Conclusões............................................................................ pág. 56
Referências ................................................................................................. pág. 58
UFRN/CCET/PPGG – Dissertação de Mestrado Lista de figuras
Lista de figuras
Figura 1.1 – Mapa de localização da área de estudo na região de Laje dos Negros - BA ........................................................................................................................
pág. 4
Figura 2.1 – Mapa do Cráton do São Francisco mostrando os limites e as principais unidades estruturais. A poligonal em vermelho destaca a localização da Bacia de Irecê (Adaptado de BARBOSA et al. 2003) ...............
pág. 8
Figura 2.2 – Mapa geológico da Bacia de Irecê com a localização da Pedreira Sal e o sistema de cavernas TBV-TBR (Adaptado de BORGES, 2016) ....................................................................................................................................
pág. 9
Figura 2.3 – Coluna estratigráfica da Formação Salitre (Retirado de PEDREIRA et al.,1985) ..................................................................................................
pág. 10
Figura 2.4 – Fácies das sequências estratigráficas da Formação Salitre identificadas na Toca da Boa Vista e na área de estudo. A Pedreira Sal corresponde a parte superior da fácies 7. (Modificado de KLIMCHOUK et al., 2016) .............................................................................................................................
pág. 11
Figura 3.1 – Espectro eletromagnético indicando a faixa de atuação do GPR (OLIVEIRA JR, 2001) ............................................................................................
pág. 19
Figura 3.2 – A: Princípio de funcionamento do GPR considerando duas camadas geológicas de constantes dielétricas diferentes (K1 e K2). B: Traço de GPR contendo registros dos tempos de chegada associados a onda direta pelo ar (Aw), onda direta pela terra (Gw), e reflexões (Rw) na interface das camadas 1 e 2 (OLIVEIRA JR, 2001) ...............................................
pág. 19
Figura 3.3 – Sistema GPR utilizado na aquisição. Unidade central (SIR, 3000), odômetro, cabos de conexão e um par de antenas blindadas de 400 MHz .......................................................................................................................................
pág. 20
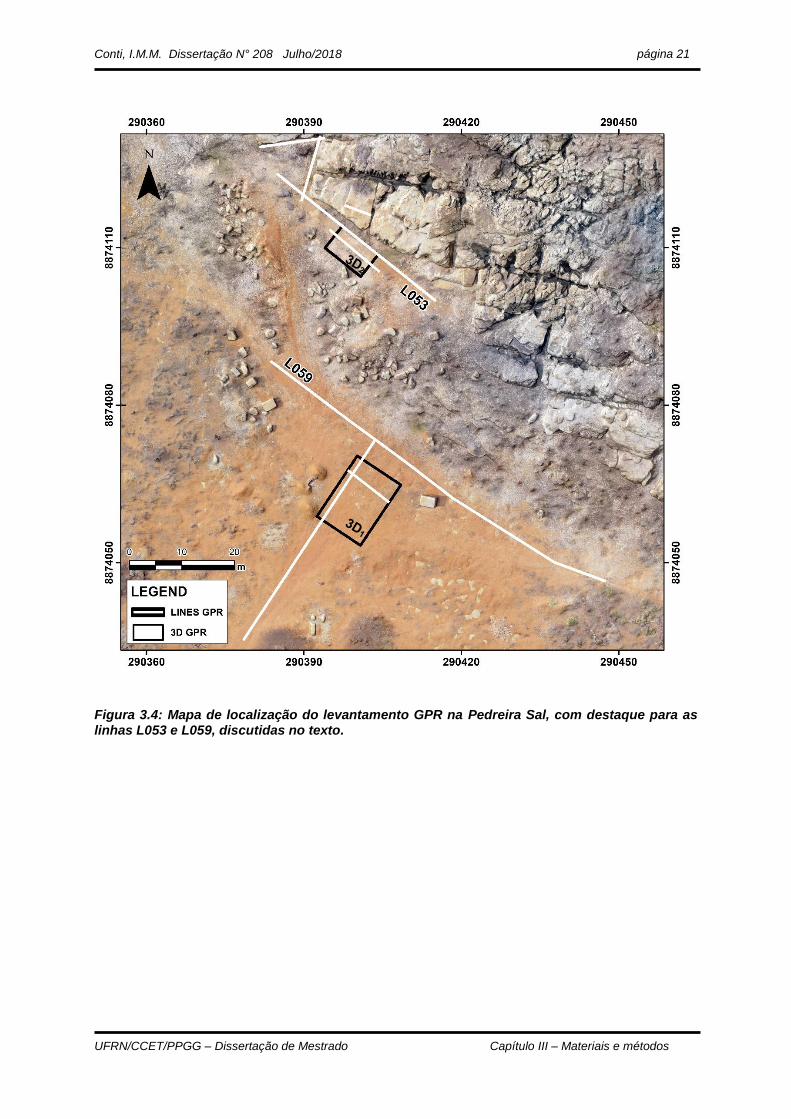
Figura 3.4 – Mapa de localização do levantamento GPR na Pedreira Sal, com destaque para as linhas L053 e L059, discutidas no texto .........................
pág. 21
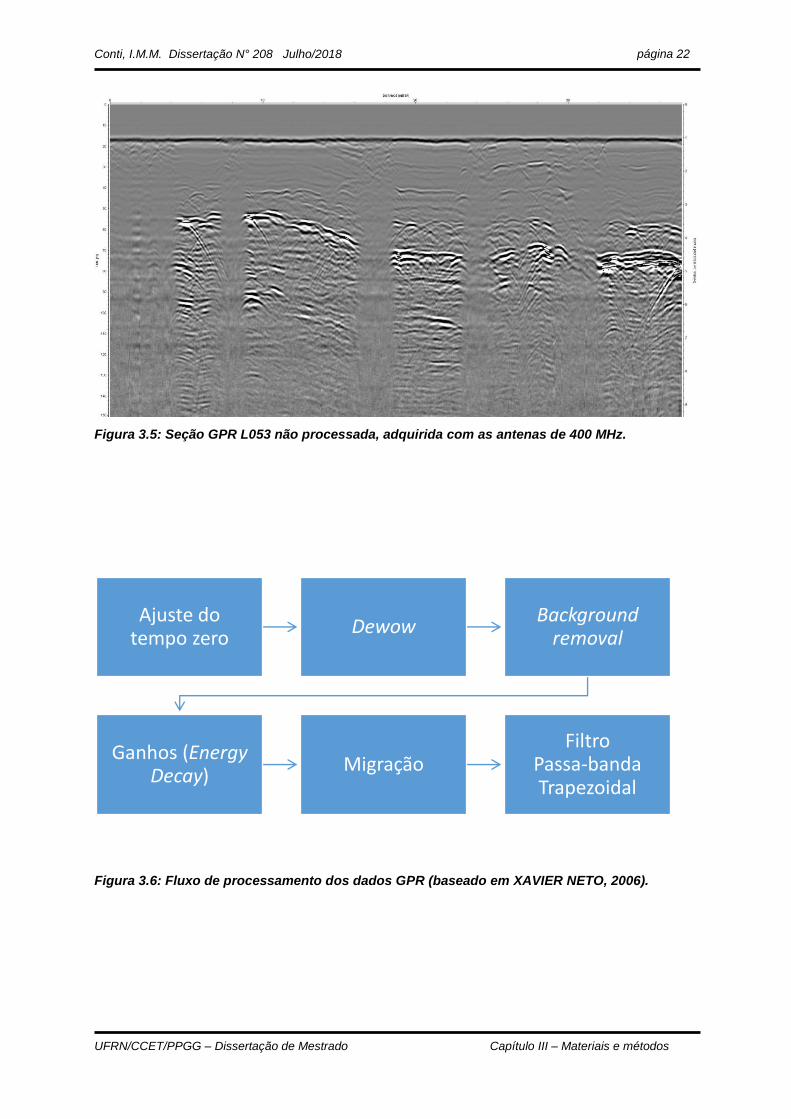
Figura 3.5 – Seção GPR L053 não processada, adquirida com as antenas de 400 MHz ........................................................................................................................
pág. 22
Figura 3.6 – Fluxo de processamento dos dados GPR (baseado em XAVIER NETO, 2006) .....................................................................................................
pág. 22
Conti, I.M.M. Relatório N°208 mês/2011 página vii
UFRN/CCET/PPGG – Dissertação de Mestrado Lista de figuras
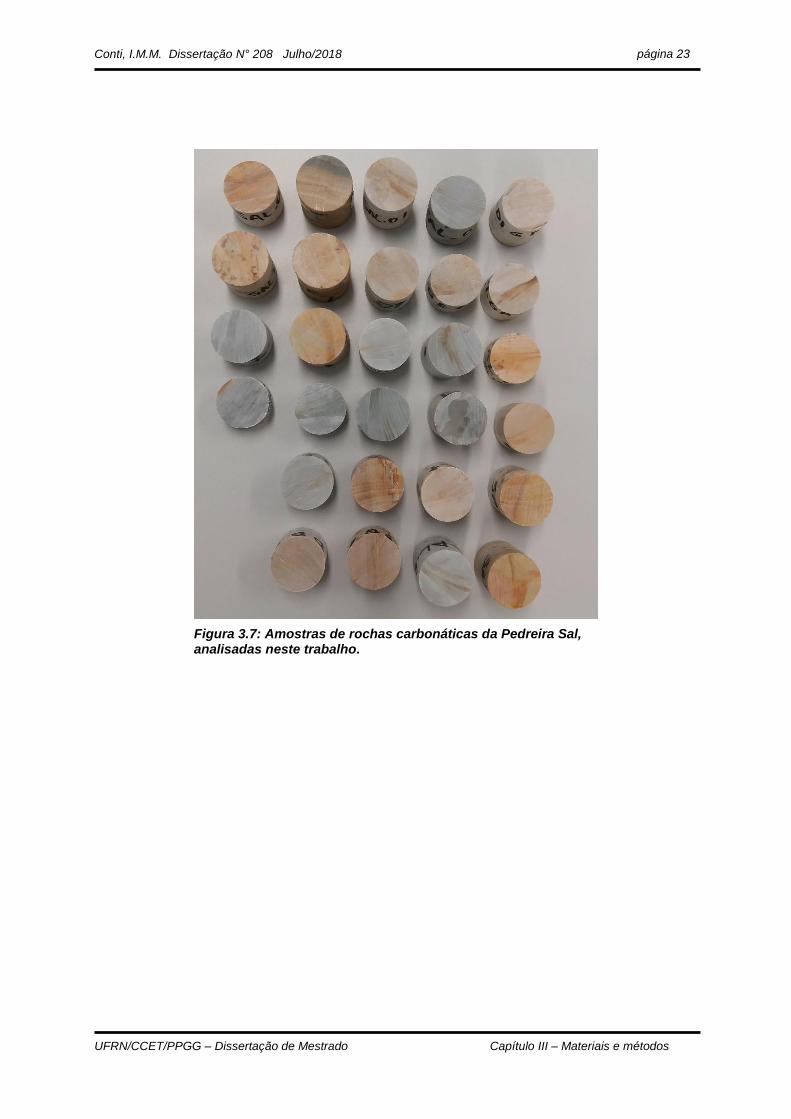
Figura 3.7 – Amostras de rochas carbonáticas da Pedreira Sal, analisadas neste trabalho ....................................................................................................................
pág. 23
Figura 3.8 – Amostra SAL.01-LB e sua respectiva pastilha de ~1,5 mm de espessura, serrada para medidas de permissividade dielétrica .........................
pág. 24
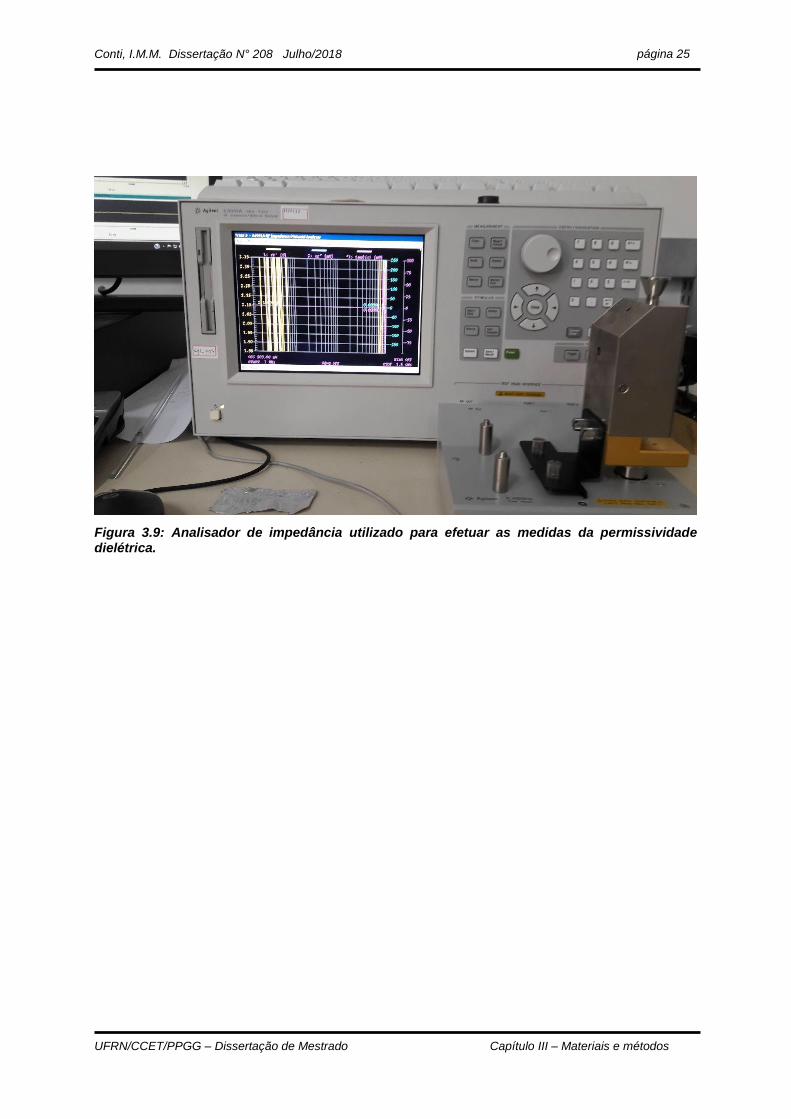
Figura 3.9 – Analisador de impedância utilizado para efetuar as medidas da permissividade dielétrica ..........................................................................................
pág. 25
UFRN/CCET/PPGG – Dissertação de Mestrado Capítulo I – Introdução
Capítulo I – Introdução
1.1 – Apresentação
O presente trabalho, sob o título “Imageamento GPR e Medidas Petrofísicas de
rochas Carbonáticas Carstificadas da Formação Salitre, Norte da Bahia”, compõe a
dissertação de mestrado que integra os requisitos necessários para a obter o título de
Mestre em Geodinâmica e Geofísica do Curso de Mestrado do Programa de Pós-
graduação em Geodinâmica e Geofísica (PPGG) da Universidade Federal do Rio
Grande do Norte (UFRN). A mestranda contou com a orientação do Professor Dr.
David Lopes de Castro para desenvolver a presente pesquisa. A pesquisa aqui
apresentada, está vinculada ao Projeto Procarste (UFRN/Petrobras) que visa adquirir
e interpretar parâmetros para caracterizar e modelar análogos de reservatórios em
rochas carbonáticas.
A pesquisa realizada integrou dados de Radar de Penetração de solo (GPR) e
dados petrofísicos de amostras das rochas estudadas, como medidas de porosidade,
densidade e permissividade dielétrica, que permitiu um correlação da porosidade
estimada através de atributos GPR. A partir das informações obtidas foi produzido um
manuscrito, apresentado no Capítulo 4, submetido a Pure and Applied Geophysics.
1.2 – Justificativa
Para a indústria de óleo e gás é de extrema importância o estudo de análogos de
reservatórios de hidrocarbonetos, que permitem estudar em superfície características
de um modelo comparável ao do reservatório, para que se possa ter um maior
entendimento sobre o comportamento das rochas que ocorrem em subsuperfície.
As rochas carbonáticas totalizam de 25% a 35% de seções estratigráficas
(SUGUIO, 2003). E cerca de 60% das reservas de hidrocarbonetos e 40% das
reservas de gás encontram-se nessas rochas (SCHLUMBERGER, 2009). Por isso o
crescente interesse em ampliar os estudos nesse tipo de reservatório.

Conti, I.M.M. Dissertação N° 208 Julho/2018
UFRN/CCET/PPGG – Dissertação de Mestrado Capítulo I – Introdução
página 2
As rochas carbonáticas podem ser de origem química e bioquímica, e formadas
em diferentes ambientes de deposição, que podem ser do tipo marinho de água rasa,
marinho de água profunda, água doce (lagos e fontes), e bacias evaporíticas
(SUGUIO, 2003). Sua porosidade primária é resultante dos vários processos
deposicionais e pós-deposicionais (MURRAY, 1960). Dessa maneira, apresentam um
alto grau de heterogeneidade (AHR, 2008), o que torna desafiador sua caracterização.
O GPR é um método geofísico de fácil aquisição e apresenta um baixo custo em
relação ao levantamento de dados. Este método de investigação rasa (poucas
dezenas de metros) vem sendo bastante utilizado no estudo de ambientes cársticos e
no estudo de análogos de reservatórios (JESUS et al., 2012; FERNADES, 2014).
Ainda se tem uma escassez na bibliografia do uso de GPR no estudo de rochas
carbonáticas para criação de modelos de análogos de reservatórios. A maior parte
das pesquisas GPR nessas rochas são para monitoramento de risco geológico e
recursos hídricos (OVERMEEREN, 1998; AL-FARES et al., 2002).
Além disso, alguns estudos recentes correlacionam parâmetros do sinal de GPR
com propriedades físicas como a condutividade elétrica e a permissividade dielétrica
(REPPERT et al., 2000; ALSHARAHI, 2016). Atributo GPR é uma quantidade
específica que mede uma característica de interesse (CHOPRA et al., 2005; ZHAO et
al., 2013). O uso de atributos tem contribuído para estimar a porosidade e a
permeabilidade (CORBEANU et al., 2002; MOUNT et al., 2014).
1.3 – Área de estudo
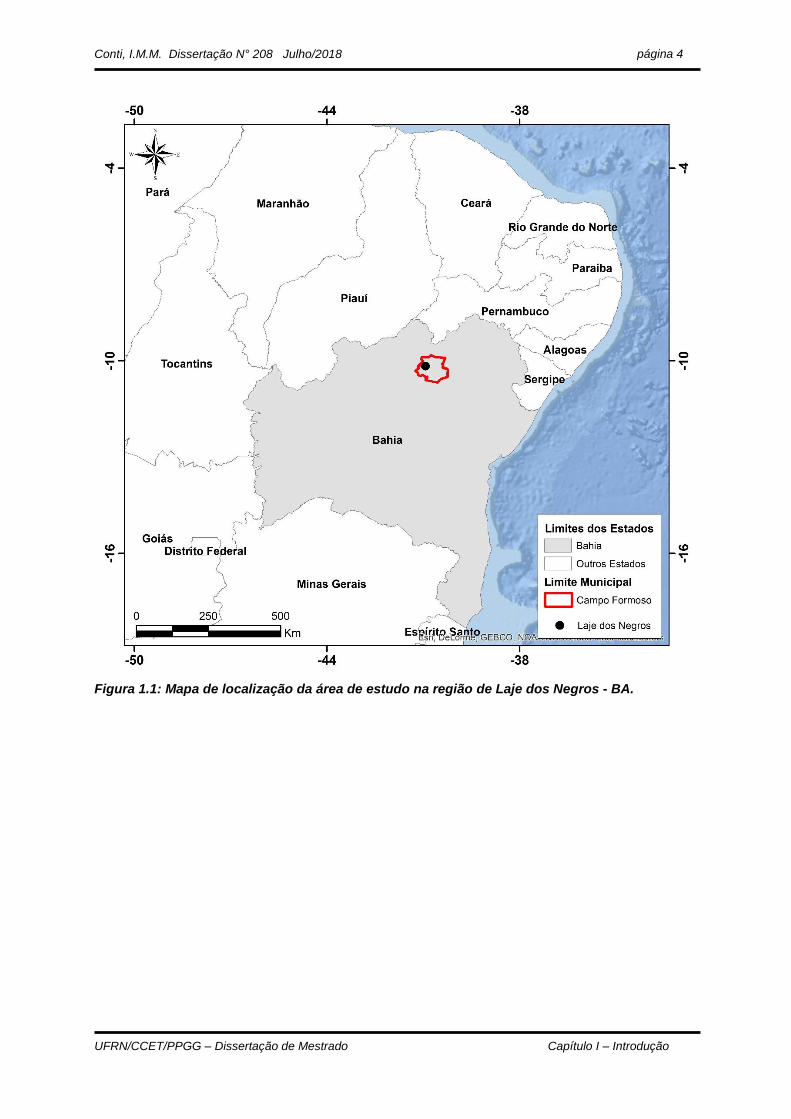
A Pedreira Sal, objeto deste estudo, está localizada aproximadamente a 5 km de
Laje dos Negros, no município baiano de Campo Formoso (Fig. 1.1). A pedreira
apresenta rochas carstificadas e bastante fraturadas e antes de ser desativada,
extraía calcário para fins comerciais. Do ponto de vista geológico, a área está inserida
na Bacia de Irecê localizada na porção norte do Cráton São Francisco. As rochas
carbonáticas que afloram na Pedreira Sal pertencem as unidades Neoproterozóicas
da Formação Salitre, Grupo Una.
Conti, I.M.M. Dissertação N° 208 Julho/2018
UFRN/CCET/PPGG – Dissertação de Mestrado Capítulo I – Introdução
página 3
No local foi realizado levantamento de dados GPR, e foram adquiridas imagens
de drone para confecção do mapa da pedreira. Também foram coletados plugs de
rochas carbonáticas onde foram realizados os ensaios petrofísicos.
1.4 – Objetivos
Este estudo tem como objetivo principal estimar distribuição espacial da
porosidade secundária de rochas carbonáticas da Formação Salitre na Pedreira Sal e
caracterizar a geometria 3D destas. Para tanto, é necessário (1) identificar as feições
cársticas e investigar a geometria 3D das rochas carbonáticas com dados GPR
adquiridos na pedreira, (2) correlacionar parâmetros petrofísicos como porosidade (φ),
densidade (ρ) e permissividade dielétrica (ε) e (3) gerar um cubo de distribuição
espacial da porosidade a partir de atributos GPR. Assim feito, foi possível
correlacionar dados petrofísicos e atributos GPR para estimar distribuição espacial da
porosidade secundária nas unidades carbonáticas da Formação Salitre.
Conti, I.M.M. Dissertação N° 208 Julho/2018
UFRN/CCET/PPGG – Dissertação de Mestrado Capítulo I – Introdução
página 4
Figura 1.1: Mapa de localização da área de estudo na região de Laje dos Negros - BA.
UFRN/CCET/PPGG – Dissertação de Mestrado Capítulo II – Contexto geológico
Capítulo II – Contexto geológico
2.1 – Geologia regional
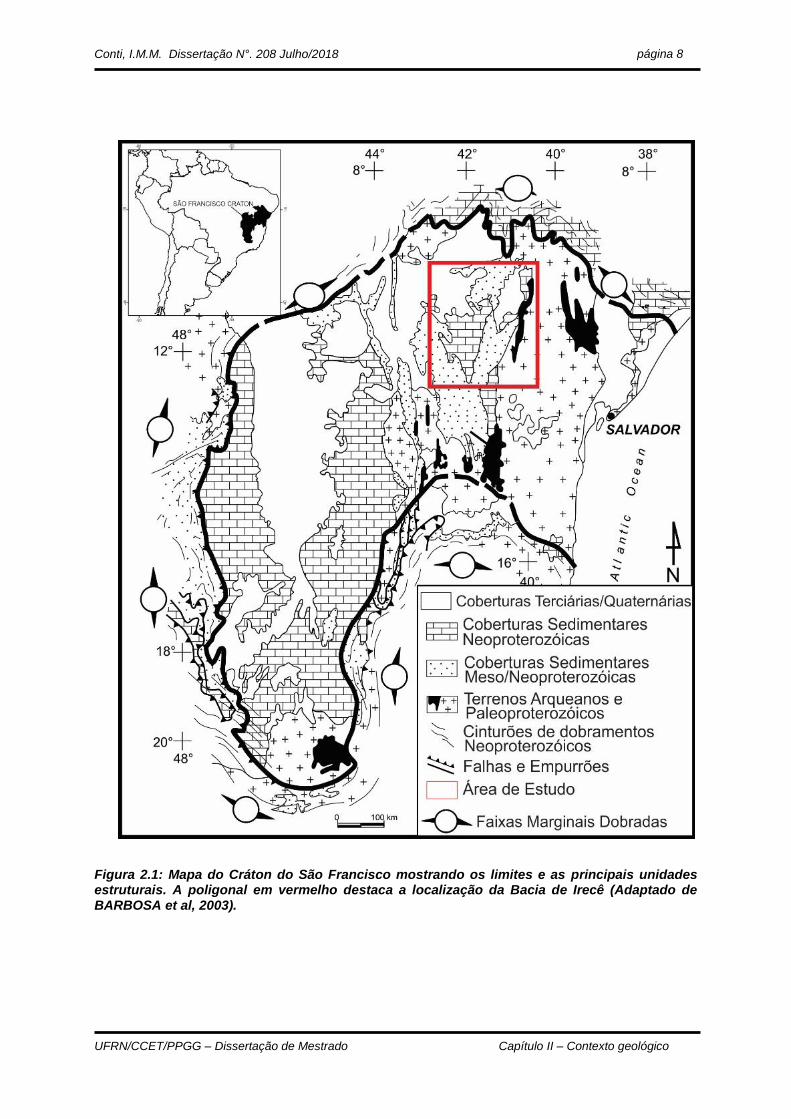
A área de estudo está situada na Bacia de Irecê, na porção norte do Cráton São
Francisco (ALMEIDA 1967, ALMEIDA 1977). A bacia constitui a principal ocorrência
de rochas sedimentares de idade Meso e Neoproterozoica do cráton (Figura 2.1).
O Cráton São Francisco é uma grande massa de litosfera continental composta
por várias unidades estruturais, formado por uma sucessão de eventos tectônicos
como acresção crustal e/ou colisões continentais (BARBOSA et al., 2003), no final do
Paleoproterozoico. Segundo dados geológicos e geofísicos (USSAMI, 1993), o cráton
é limitado por cinturões orogênicos brasilianos. Os limites a norte e nordeste
correspondem a Faixa Rio Preto (INDA e BARBOSA, 1978), Faixa Riacho do Pontal
e Faixa Sergipana (BRITO NEVES et al., 2000), a oeste a Faixa Brasília (ALMEIDA,
1969) e a sul, a Faixa Araçuaí (ALMEIDA, 1977).
Em sua maior parte, o interior do cráton é coberto por unidades Pré-Cambrianas
e Fanerozoicas, que incluem três grandes unidades morfotectônicas (ALKMIM, 2004).
A feição morfotectônica da porção norte do cráton é o Aulacógeno do Paramirim
(MOUTINHO DA COSTA e INDA, 1982) e seus limites norte e sul correspondem aos
limites do cráton. O aulacógeno é preenchido pelas unidades Supergrupo Espinhaço
e Supergrupo São Francisco, que são de idade Meso e Neoproterozoica,
respectivamente. O Supergrupo Espinhaço é representado pelo Grupo Paraguaçu e
pelo Grupo Chapada Diamantina, este último subdividido pelas Formações Tombador,
Caboclo e Morro do Chapéu.
A Bacia de Irecê (Figura 2.2), onde se encontra a área de estudo, foi preenchida
pelos sedimentos do Supergrupo São Francisco, representado pelo Grupo Una,
subdividido pelas Formações Bebedouro e Salitre. A deposição inicial do Grupo Una
está relacionada a um evento glacial de âmbito continental em torno de 1.0 Ga
(BARBOSA et al., 2003). Como resultado da deglaciação, ocorreu a subida do nível
do mar e inundação da maior parte do cráton, implantando importantes plataformas
carbonáticas.
Conti, I.M.M. Dissertação N°. 208 Julho/2018
UFRN/CCET/PPGG – Dissertação de Mestrado Capítulo II – Contexto geológico
página 6
A deposição da Formação Bebedouro ocorreu em ambiente glácio-marinho
(GUIMARÃES e DOMINGUEZ, 1995) em discordância sobre o Grupo Chapada
Diamantina, composta por diamictitos, siltitos calcíferos e pelitos (LEÃO e
DOMINGUEZ, 1992). A sequência carbonática da Formação Salitre foi depositada em
um sistema marinho raso, e é composta por finas intercalações de rochas
siliciclásticas e margas (LEÃO e DOMINGUEZ, 1992; ENNES-SILVA et al., 2016). A
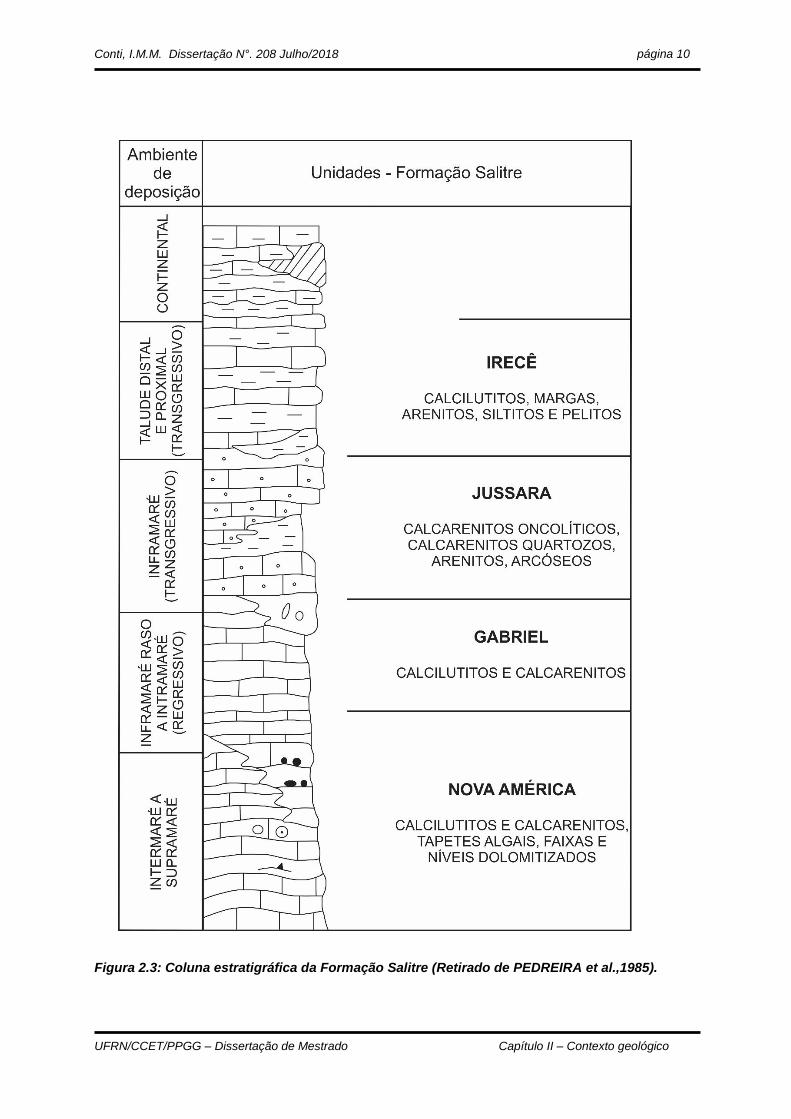
formação é dividida nas unidades Nova América, Gabriel, Jussara e Irecê (Figura 2.3).
A Unidade Nova América é composta por calcilutitos laminados e por calcarenitos
(PEDREIRA et al., 1985). Os calcilutitos possuem coloração variada e estrutura mud
supported com matriz micrítica e cimento espático (PEDREIRA et al., 1985; LEÃO e
DOMINGUEZ, 1992). Nos calcarenitos há presença de oncólitos, pelóides e
intraclastos (PEDREIRA et al., 1985).
A composição da Unidade Gabriel são calcilutitos, calcissiltitos e calcarenitos finos
e podem conter corpos de dolomito (PEDREIRA et al., 1985). Apresentam coloração
rosa, creme e cinza claro (PEDREIRA et al., 1985; LEÃO e DOMINGUEZ, 1992).
A Unidade Jussara é composta por intercalações de calcarenitos e calcilutitos, e
apresentam coloração cinza escura a negra (PEDREIRA et al., 1985; LEÃO e
DOMINGUEZ, 1992). Nessa unidade foram encontrados estromatólitos colunares de
pequeno porte (PEDREIRA et al., 1985)
A Unidade Irecê corresponde ao topo da Formação Salitre, onde predominam
calcilutitos laminados variando para calcarenitos fino a médio de cor cinza escura a
negra (PEDREIRA et al., 1985; LEÃO e DOMINGUEZ, 1992). Apresentam
intercalações de margas, siltito e arenitos imaturos (PEDREIRA et al., 1985).
2.2 – Geologia local
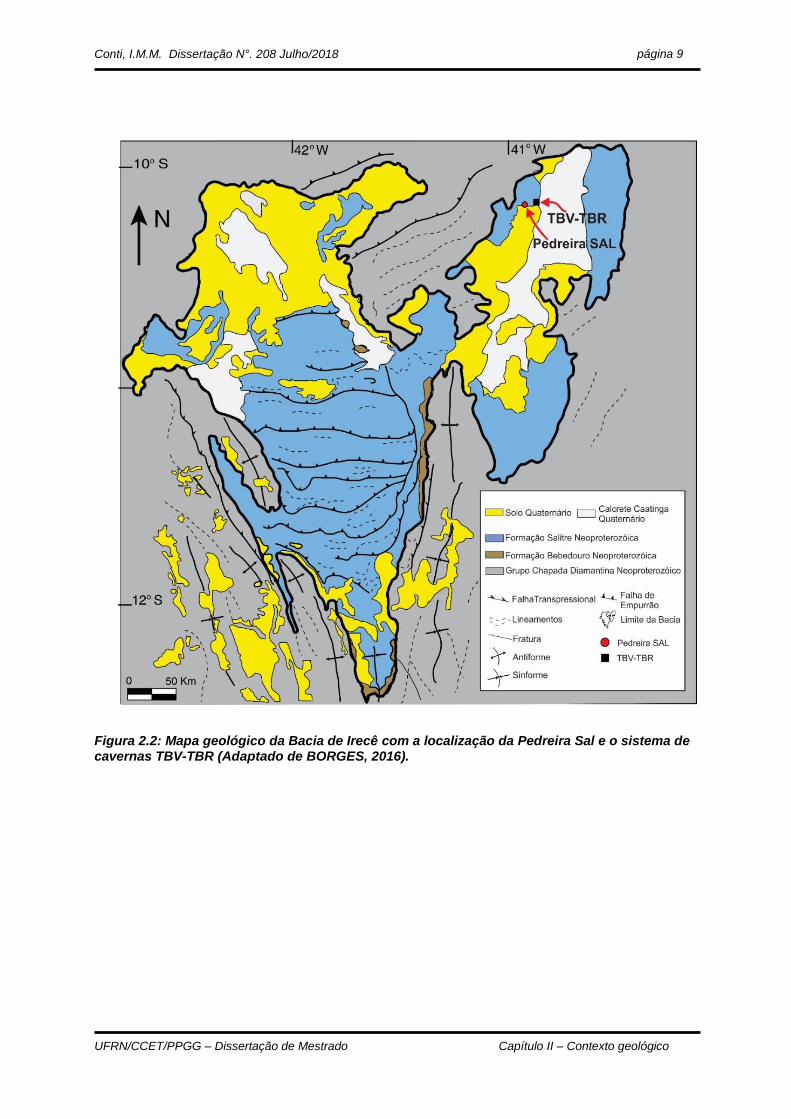
A Pedreira Sal, nordeste da bacia de Irecê, fica próxima ao sistema de cavernas
da Toca da Boa Vista e da Toca da Barriguda (TBV-TBR) (Figura 2.2). Esse é o maior
sistema de cavernas da América do Sul que ocorre na formação Salitre (KLIMCHOUK
et al., 2016). Na Pedreira Sal afloram rochas carbonáticas de coloração cinza à bege,
Conti, I.M.M. Dissertação N°. 208 Julho/2018
UFRN/CCET/PPGG – Dissertação de Mestrado Capítulo II – Contexto geológico
página 7
com laminação plano paralela e presença de estilólitos, sets de juntas, boudins de
chert (SANTOS, 2016).
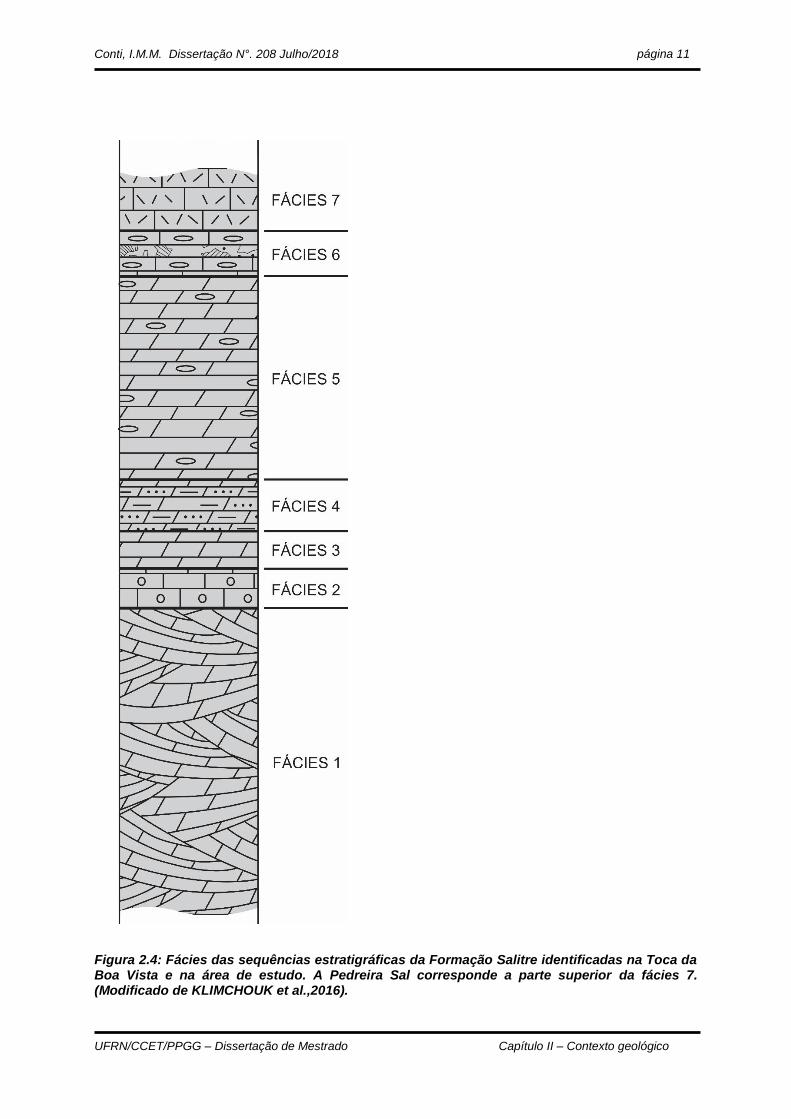
Nas sequências estratigráficas da Formação Salitre expostas nas cavernas e na
área de estudo foram identificadas sete fácies distintas, cinco delas descritas por
SANTOS (2016), que correspondem as fácies 1, 2, 3, 4 e 5. KLIMCHOUK et al. (2016)
descreveram as fácies 6 e 7 (Figura 2.4). A pedreira é a parte superior da fácies 7.
Assim, da base para o topo, a fácies 1 é composta por grainstone cinza-esbranquiçado
com estratificações cruzadas e plano- paralelas. A fácies 2 sobreposta, constitui uma
camada de grainstone de mesma coloração e granulometria menor. A fácies 3 é
composta por mudstone cinza-amarelado a branco, finamente laminado,
estromatolitos colunares e trombolitos, enquanto a fácies 4 é predominantemente
siliciclástica, constituída de um siltito de coloração avermelhada. A composição da
fácies 5 é um grainstone acamadado com intercalações de sílex. A fácies 6 é
composta por carbonatos de coloração rosa intercalados com camadas descontinuas
de folhelho escuro, e separando as fácies 6 e 7, uma pequena camada de xisto. Por
fim, a fácies 7, objeto deste estudo, é constituída por argilas calcíferas laminadas, com
vugs e lentes de sílex.
Conti, I.M.M. Dissertação N°. 208 Julho/2018
UFRN/CCET/PPGG – Dissertação de Mestrado Capítulo II – Contexto geológico
página 8
Figura 2.1: Mapa do Cráton do São Francisco mostrando os limites e as principais unidades estruturais. A poligonal em vermelho destaca a localização da Bacia de Irecê (Adaptado de BARBOSA et al, 2003).
Conti, I.M.M. Dissertação N°. 208 Julho/2018
UFRN/CCET/PPGG – Dissertação de Mestrado Capítulo II – Contexto geológico
página 9
Figura 2.2: Mapa geológico da Bacia de Irecê com a localização da Pedreira Sal e o sistema de cavernas TBV-TBR (Adaptado de BORGES, 2016).
Conti, I.M.M. Dissertação N°. 208 Julho/2018
UFRN/CCET/PPGG – Dissertação de Mestrado Capítulo II – Contexto geológico
página 10
Figura 2.3: Coluna estratigráfica da Formação Salitre (Retirado de PEDREIRA et al.,1985).
Conti, I.M.M. Dissertação N°. 208 Julho/2018
UFRN/CCET/PPGG – Dissertação de Mestrado Capítulo II – Contexto geológico
página 11
Figura 2.4: Fácies das sequências estratigráficas da Formação Salitre identificadas na Toca da Boa Vista e na área de estudo. A Pedreira Sal corresponde a parte superior da fácies 7. (Modificado de KLIMCHOUK et al.,2016).
UFRN/CCET/PPGG – Dissertação de Mestrado Capítulo III – Materiais e métodos
Capítulo III – Materiais e métodos
3.1 – GPR
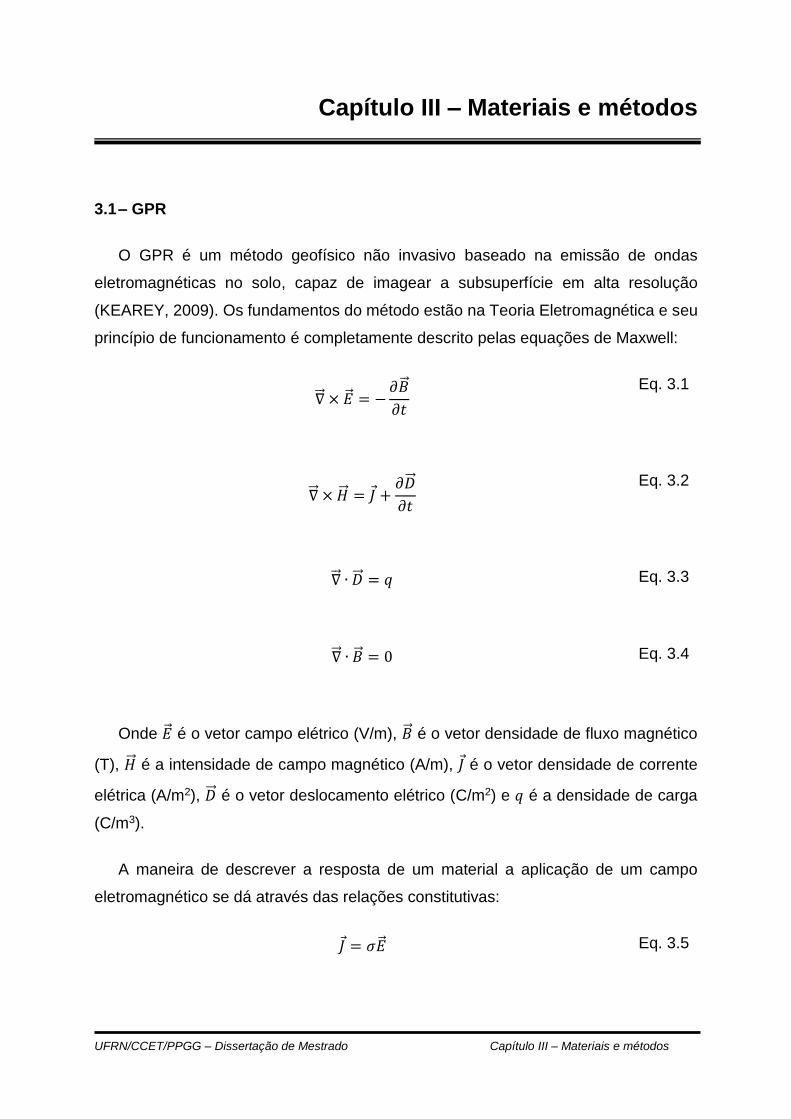
O GPR é um método geofísico não invasivo baseado na emissão de ondas
eletromagnéticas no solo, capaz de imagear a subsuperfície em alta resolução
(KEAREY, 2009). Os fundamentos do método estão na Teoria Eletromagnética e seu
princípio de funcionamento é completamente descrito pelas equações de Maxwell:
∇⃗⃗ × �⃗� = −𝜕�⃗�
𝜕𝑡
Eq. 3.1
∇⃗⃗ × �⃗⃗� = 𝐽 +𝜕�⃗⃗�
𝜕𝑡
Eq. 3.2
∇⃗⃗ ∙ �⃗⃗� = 𝑞
Eq. 3.3
∇⃗⃗ ∙ �⃗� = 0 Eq. 3.4
Onde �⃗� é o vetor campo elétrico (V/m), �⃗� é o vetor densidade de fluxo magnético
(T), �⃗⃗� é a intensidade de campo magnético (A/m), 𝐽 é o vetor densidade de corrente
elétrica (A/m2), �⃗⃗� é o vetor deslocamento elétrico (C/m2) e 𝑞 é a densidade de carga
(C/m3).
A maneira de descrever a resposta de um material a aplicação de um campo
eletromagnético se dá através das relações constitutivas:
𝐽 = 𝜎�⃗�
Eq. 3.5
Conti, I.M.M. Dissertação N° 208 Julho/2018
UFRN/CCET/PPGG – Dissertação de Mestrado Capítulo III – Materiais e métodos
página 13
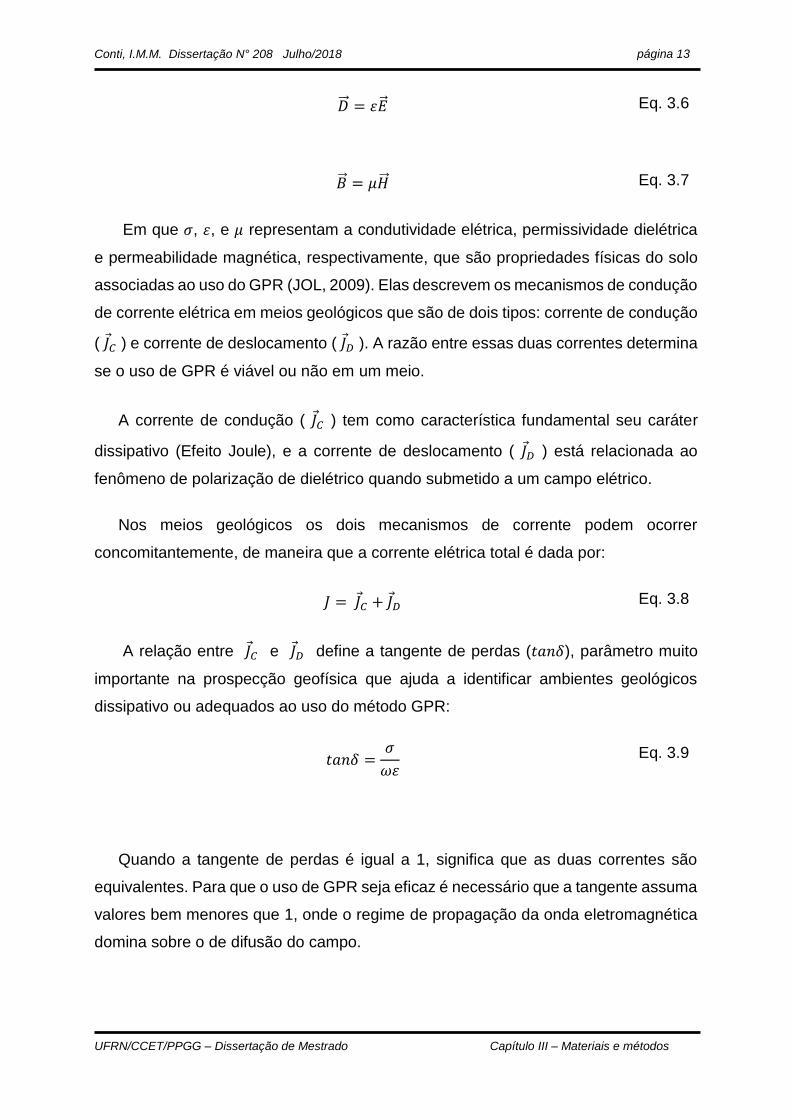
�⃗⃗� = 휀�⃗�
Eq. 3.6
�⃗� = 𝜇�⃗⃗� Eq. 3.7
Em que 𝜎, 휀, e 𝜇 representam a condutividade elétrica, permissividade dielétrica
e permeabilidade magnética, respectivamente, que são propriedades físicas do solo
associadas ao uso do GPR (JOL, 2009). Elas descrevem os mecanismos de condução
de corrente elétrica em meios geológicos que são de dois tipos: corrente de condução
( 𝐽 𝐶 ) e corrente de deslocamento ( 𝐽 𝐷 ). A razão entre essas duas correntes determina
se o uso de GPR é viável ou não em um meio.
A corrente de condução ( 𝐽 𝐶 ) tem como característica fundamental seu caráter
dissipativo (Efeito Joule), e a corrente de deslocamento ( 𝐽 𝐷 ) está relacionada ao
fenômeno de polarização de dielétrico quando submetido a um campo elétrico.
Nos meios geológicos os dois mecanismos de corrente podem ocorrer
concomitantemente, de maneira que a corrente elétrica total é dada por:
𝐽 = 𝐽 𝐶 + 𝐽 𝐷 Eq. 3.8
A relação entre 𝐽 𝐶 e 𝐽 𝐷 define a tangente de perdas (𝑡𝑎𝑛𝛿), parâmetro muito
importante na prospecção geofísica que ajuda a identificar ambientes geológicos
dissipativo ou adequados ao uso do método GPR:
𝑡𝑎𝑛𝛿 =𝜎
𝜔휀 Eq. 3.9
Quando a tangente de perdas é igual a 1, significa que as duas correntes são
equivalentes. Para que o uso de GPR seja eficaz é necessário que a tangente assuma
valores bem menores que 1, onde o regime de propagação da onda eletromagnética
domina sobre o de difusão do campo.
Conti, I.M.M. Dissertação N° 208 Julho/2018
UFRN/CCET/PPGG – Dissertação de Mestrado Capítulo III – Materiais e métodos
página 14
O método GPR baseia-se na propagação da onda eletromagnética, e por essa
razão é considerado por alguns autores como um método à parte (KEAREY, 2009).
Tradicionalmente, os métodos eletromagnéticos trabalham com difusão do campo
eletromagnético.
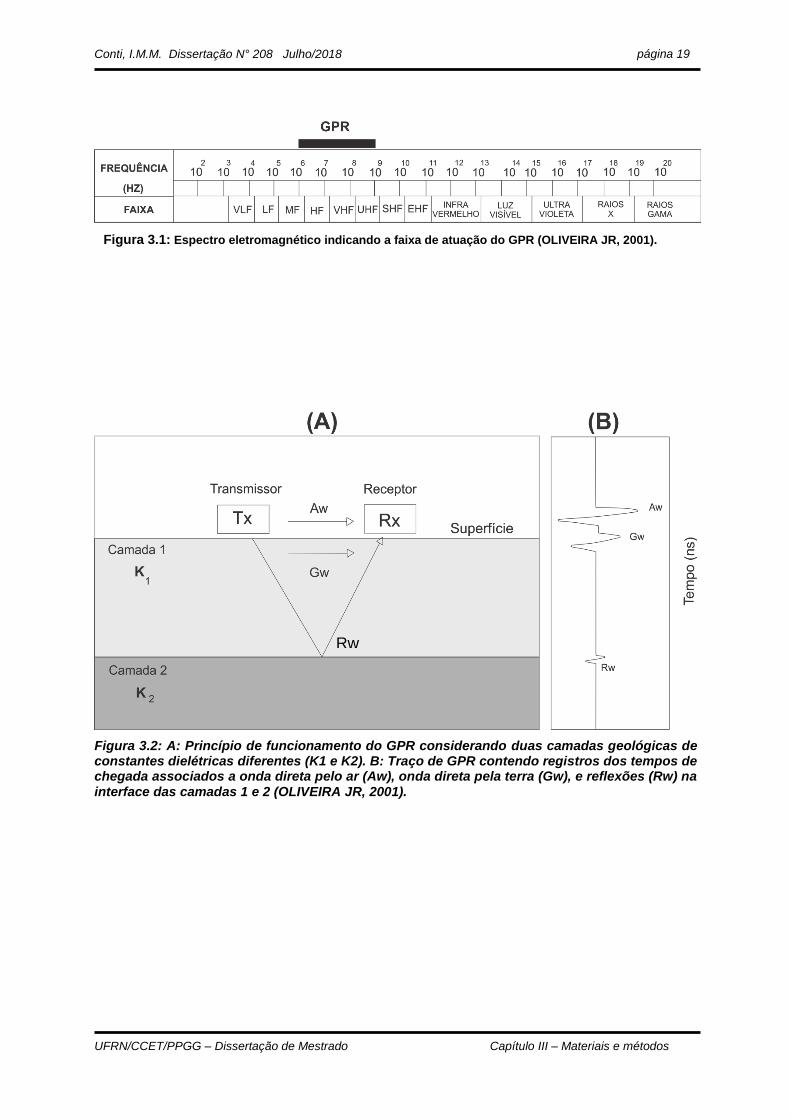
O GPR trabalha com o registro do tempo de viagem de ondas eletromagnéticas,
com frequências entre 1 MHz e 1 GHz (OLIVEIRA, 2001) (Figura 3.1). Um sistema
básico é composto por um gerador de sinal, uma antena transmissora (Tx), uma
antena receptora (RX) e uma unidade de controle digital (REYNOLDS, 1997). A
antena transmissora emite um pulso eletromagnético que percorre o subsolo até
encontrar um material com contraste de permissividade dielétrica relativa (εr), também
chamada de constante dielétrica (K), suficiente para que ocorram reflexões
(OLIVEIRA, 2001). Estas reflexões são captadas pela antena receptora e enviadas
para a unidade de controle digital. Na unidade de controle digital é realizada a medida
do tempo duplo de propagação. A Figura 3.2A ilustra o princípio de funcionamento do
GPR considerando um ambiente composto por dois meios geológicos com constantes
dielétricas diferentes (K1 e K2). A Figura 3.2B ilustra um típico registro do tempo de
propagação. Os eventos Aw, Gw e Rw indicam, respectivamente, os tempos de
chegada da onda eletromagnética se propagando pelo ar, pela terra e após sofrer
reflexões.
A profundidade de investigação do GPR depende da frequência utilizada no
levantamento, quanto mais alta a frequência utilizada menor a penetração do sinal e
maior a resolução (REYNOLDS, 1997; JOL, 2009). Depende também da
condutividade do meio, onde a atenuação do sinal é maior em meios mais condutivos,
e da permissividade dielétrica, que ocasiona as reflexões e refrações da onda pelos
contrates de impedância eletromagnética dos meios em que a onda se propaga
(REYNOLDS, 1997; JOL, 2009; KEAREY, 2009).
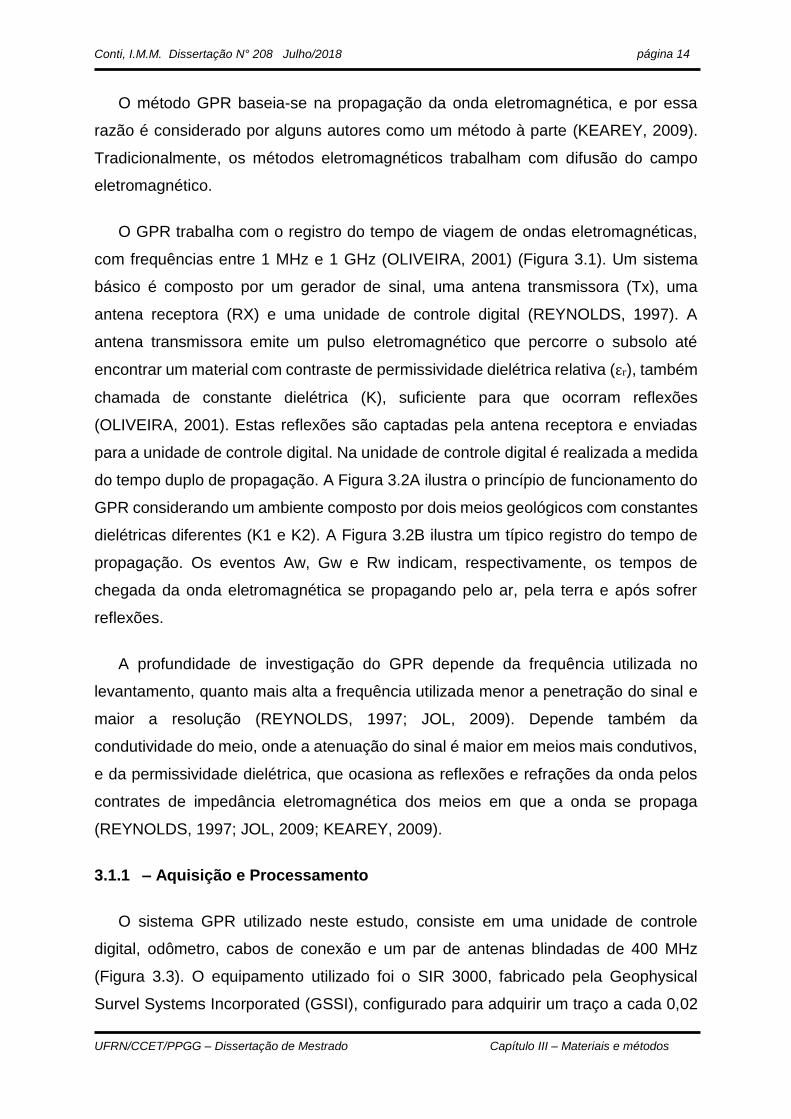
3.1.1 – Aquisição e Processamento
O sistema GPR utilizado neste estudo, consiste em uma unidade de controle
digital, odômetro, cabos de conexão e um par de antenas blindadas de 400 MHz
(Figura 3.3). O equipamento utilizado foi o SIR 3000, fabricado pela Geophysical
Survel Systems Incorporated (GSSI), configurado para adquirir um traço a cada 0,02
Conti, I.M.M. Dissertação N° 208 Julho/2018
UFRN/CCET/PPGG – Dissertação de Mestrado Capítulo III – Materiais e métodos
página 15
m, com janela temporal de 150 e 200 ns. A técnica de aquisição utilizada foi de
afastamento comum, utilizando um odômetro para obter as distâncias de aquisição
dos dados.
Foram adquiridas 14 seções GPR, totalizando 380 m de levantamento 2D. Duas
malhas de aquisição 3D foram realizadas. Para a primeira malha (3D1), levantamos
31 seções com espaçamento de 0,5 m entre elas e para a segunda malha (3D2) 36
seções com espaçamento de 0,15 m, totalizando 765 m de seções 3D (Figura 3.4).
Os dados foram processados com base no trabalho de XAVIER NETO (2006) e
utilizou-se o programa REFLEX 6.1.0 (SANDMEIER, 2000). O processamento tem
como objetivo melhorar a razão sinal/ruído para extrair do conjunto de dados todas as
informações de interesse (XAVIER NETO, 2006; FORTE e PIPAN, 2017). A Figura
3.5 ilustra a seção GPR L053 sem processamento (seção 53).
As etapas que compõe o fluxo de processamento utilizado neste trabalho são
descritas a seguir (Figura 3.6).
a) O ajuste do tempo zero corrige a diferença entre a marca do tempo zero e a
primeira quebra dos traços GPR. Essa diferença se dá em razão do
afastamento não nulo entre as antenas transmissora (Tx) e receptora (Rx).
Estas diferenças ocasionam erros na posição dos alvos em subsuperfície
(XAVIER NETO, 2006) e seu ajuste proporciona a correção desse efeito.
b) O dewow consiste na aplicação de um filtro passa-alta que remove os
componentes difusivos de baixa frequência unidos ao sinal de radar que
causam saturação na seção de GPR (XAVIER NETO, 2006).
c) Background removal é uma etapa do processamento que remove o efeito de
indução eletromagnética entre as antenas (FERNANDES, 2011), que causa
saturação de altas amplitudes no dado.
d) Os ganhos corrigem parte dos efeitos de propagação que são impostos ao
pulso eletromagnético (espalhamento geométrico, absorção, etc) (XAVIER
NETO, 2006). O ganho aplicado nas seções foi o ganho Energy Decay. Antes
da etapa de aplicação de ganhos, foi retirado das seções o ganho dado no
equipamento.
Conti, I.M.M. Dissertação N° 208 Julho/2018
UFRN/CCET/PPGG – Dissertação de Mestrado Capítulo III – Materiais e métodos
página 16
e) Migração: Cada ponto em uma interface atua como um espalhador de energia
durante a propagação do sinal. A migração tem como objetivo refocalizar essa
energia no ponto difrator, fazendo com que os refletores sejam posicionados
corretamente em subsuperfície (XAVIER NETO, 2006). Neste trabalho, a
velocidade de propagação foi determinada com base no ajuste de hipérboles.
f) A filtragem tem como objetivo atenuar dos dados GPR bandas de frequência
que não são de interesse e que estão associadas a transientes de alta ou baixa
frequência (XAVIER NETO, 2006). O filtro utilizado neste trabalho foi do tipo
passa-banda trapezoidal.
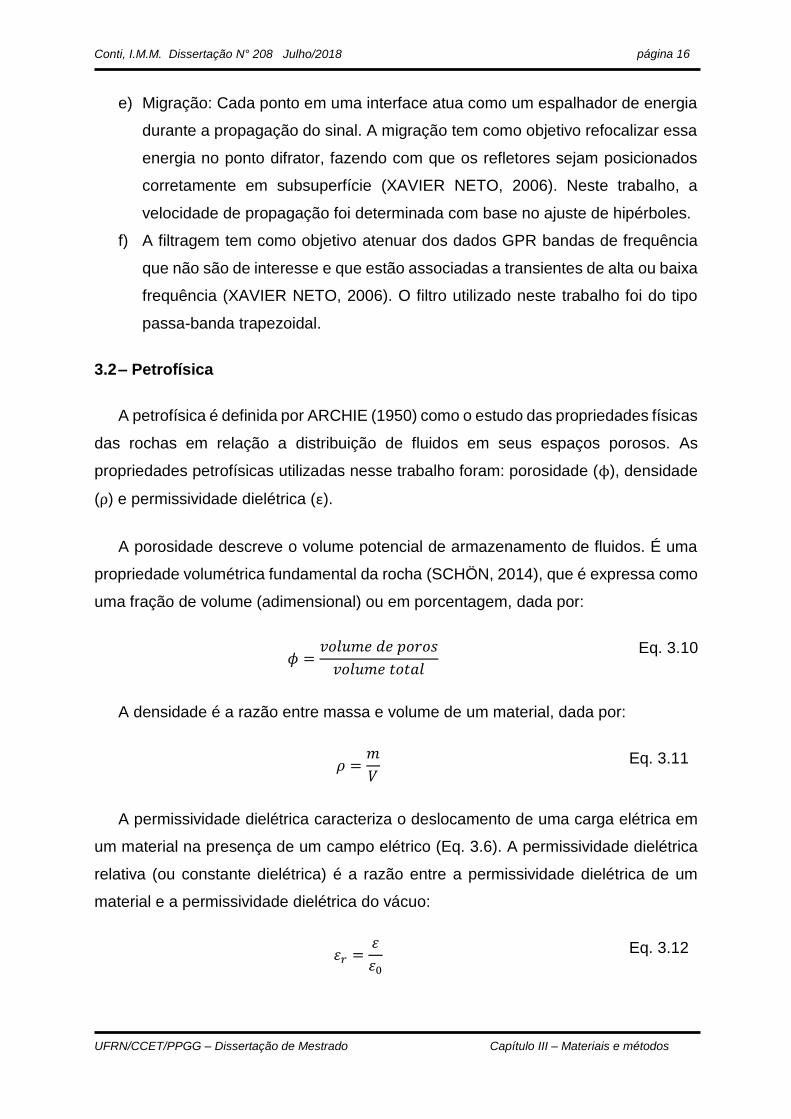
3.2 – Petrofísica
A petrofísica é definida por ARCHIE (1950) como o estudo das propriedades físicas
das rochas em relação a distribuição de fluidos em seus espaços porosos. As
propriedades petrofísicas utilizadas nesse trabalho foram: porosidade (ϕ), densidade
(ρ) e permissividade dielétrica (ε).
A porosidade descreve o volume potencial de armazenamento de fluidos. É uma
propriedade volumétrica fundamental da rocha (SCHÖN, 2014), que é expressa como
uma fração de volume (adimensional) ou em porcentagem, dada por:
𝜙 =𝑣𝑜𝑙𝑢𝑚𝑒 𝑑𝑒 𝑝𝑜𝑟𝑜𝑠
𝑣𝑜𝑙𝑢𝑚𝑒 𝑡𝑜𝑡𝑎𝑙
Eq. 3.10
A densidade é a razão entre massa e volume de um material, dada por:
𝜌 =𝑚
𝑉 Eq. 3.11
A permissividade dielétrica caracteriza o deslocamento de uma carga elétrica em
um material na presença de um campo elétrico (Eq. 3.6). A permissividade dielétrica
relativa (ou constante dielétrica) é a razão entre a permissividade dielétrica de um
material e a permissividade dielétrica do vácuo:
휀𝑟 =휀
휀0 Eq. 3.12

Conti, I.M.M. Dissertação N° 208 Julho/2018
UFRN/CCET/PPGG – Dissertação de Mestrado Capítulo III – Materiais e métodos
página 17
3.2.1 – Medidas petrofísicas
A Petrobras cedeu 28 amostras de rochas carbonáticas coletadas na Pedreira
Sal, extraídas com uma plugadeira portátil (Figura 3.7), além dos ensaios de
porosidade e densidade. Foram coletadas amostras de rochas carbonáticas sãs e
alteradas nas paredes da pedreira. As amostras de rochas sãs apresentam uma
coloração azul acinzentada, enquanto que as amostras alteradas apresentam uma
coloração bege com presença de estilólitos e fraturas.
Para efetuar as medidas de permissividade dielétrica das amostras, foram
confeccionadas pastilhas de cada uma das 28 amostras com aproximadamente 1.5
mm de espessura (Figura 3.8). As leituras foram realizadas em um analisador de
impedância/material modelo E4991A fabricado pela Agilent Technologies (Figura 3.9).
O equipamento é composto por uma fonte de frequência, que varre um intervalo de
1MHz a 1GHz, e acoplado à fonte um acessório de teste para efetuar as medidas de
constante dielétrica. Esse, emprega o método de placas paralelas, no qual dois
eletrodos são separados por um dielétrico, neste caso a amostra de rocha, para formar
um capacitor. O equipamento mede a capacitância criada no acessório de teste.
Para calibrar o equipamento foi utilizada uma amostra teste com 0,77 mm de
espessura. A composição da amostra teste é o teflon que possui uma permissividade
dielétrica igual a 2 F/m (EHRLICH, 1953).
Apesar de obtermos valores de permissividade dielétrica em uma ampla faixa
de frequência, para esta pesquisa selecionamos apenas os valores correspondentes
a frequência de 400 MHz, que é a mesma frequência das antenas GPR utilizadas
nesta pesquisa.
3.2.2 – Modelo de Indice de Refração Complexo (CRIM)
O Modelo de Indice de Refração Complexo (BIRCHAK et al., 1974) é um
modelo petrofísico que relaciona a permissividade dielétrica relativa e a porosidade.
Rochas carbonáticas são materiais de baixa perda, onde podemos aproximar
a permissividade dielétrica relativa a partir da velocidade da onda eletromagnética no

Conti, I.M.M. Dissertação N° 208 Julho/2018
UFRN/CCET/PPGG – Dissertação de Mestrado Capítulo III – Materiais e métodos
página 18
vácuo e da velocidade da onda eletromagnética estimada dos dados GPR (MOUNT e
COMAS, 2014), dada por:
휀𝑟(𝑏) = ( 𝑐
𝑣 )
2
Eq. 3.13
Onde εr(b) é a permissividade dielétrica relativa da rocha carbonática, c a
velocidade da onda eletromagnética no vácuo e v a velocidade estimada a partir do
dos dados GPR. Neste estudo a velocidade dos dados GPR, foi obtida com base no
ajuste de hipérboles.
Para converter a permissividade dielétrica em porosidade utilizamos o CRIM,
que expressa a permissividade dielétrica relativa como:
휀𝑟𝛼
(𝑏)= 𝜙𝑆𝑤휀𝑟
𝛼(𝑤)
+ (1 − 𝜙)휀𝑟𝛼
(𝑠)+ 𝜙(1 − 𝑆𝑤)휀𝑟
𝛼(𝑎)
Eq. 3.14
Onde εr(w), εr(s) e εr(a) são as permissividades dielétricas relativas da água, da
rocha e do ar, respectivamente. A porosidade é dada por ϕ, e a saturação de água da
amostra é Sw. E α é o fator de orientação do campo elétrico que varia de -1 a 1
(MOUNT e COMAS, 2014).
O valor da permissividade dielétrica relativa da água é 79,5 F/m e do ar é 1 F/m.
O valor da saturação de água na amostra varia entre 0 e 1, onde 0 é o valor para
amostra seca e que foi utilizado neste trabalho. O fator de orientação do campo
elétrico (α) utilizado foi de 0,5 que é aceitável para a maioria dos materiais geológicos
(BIRCHAK et al., 1974; MOUNT e COMAS, 2014). Os valores de permissividade
dielétrica relativa da rocha (εr(s)) utilizados neste trabalho, foram obtidos fazendo a
média dos valores de porosidade medidos nas amostras de plugs, para rochas são e
alteradas.
Conti, I.M.M. Dissertação N° 208 Julho/2018
UFRN/CCET/PPGG – Dissertação de Mestrado Capítulo III – Materiais e métodos
página 19
Figura 3.2: A: Princípio de funcionamento do GPR considerando duas camadas geológicas de constantes dielétricas diferentes (K1 e K2). B: Traço de GPR contendo registros dos tempos de chegada associados a onda direta pelo ar (Aw), onda direta pela terra (Gw), e reflexões (Rw) na interface das camadas 1 e 2 (OLIVEIRA JR, 2001).
Figura 3.1: Espectro eletromagnético indicando a faixa de atuação do GPR (OLIVEIRA JR, 2001).
Rw

Conti, I.M.M. Dissertação N° 208 Julho/2018
UFRN/CCET/PPGG – Dissertação de Mestrado Capítulo III – Materiais e métodos
página 20
Figura 3.3: Sistema GPR utilizado na aquisição. Unidade central (SIR 3000), odômetro, cabos de conexão e um par de antenas blindadas de 400 MHz.
Conti, I.M.M. Dissertação N° 208 Julho/2018
UFRN/CCET/PPGG – Dissertação de Mestrado Capítulo III – Materiais e métodos
página 21
Figura 3.4: Mapa de localização do levantamento GPR na Pedreira Sal, com destaque para as linhas L053 e L059, discutidas no texto.
Conti, I.M.M. Dissertação N° 208 Julho/2018
UFRN/CCET/PPGG – Dissertação de Mestrado Capítulo III – Materiais e métodos
página 22
Figura 3.5: Seção GPR L053 não processada, adquirida com as antenas de 400 MHz.
Figura 3.6: Fluxo de processamento dos dados GPR (baseado em XAVIER NETO, 2006).
Ajuste do tempo zero
DewowBackground
removal
Ganhos (Energy Decay)
MigraçãoFiltro
Passa-banda Trapezoidal
Conti, I.M.M. Dissertação N° 208 Julho/2018
UFRN/CCET/PPGG – Dissertação de Mestrado Capítulo III – Materiais e métodos
página 23
Figura 3.7: Amostras de rochas carbonáticas da Pedreira Sal, analisadas neste trabalho.

Conti, I.M.M. Dissertação N° 208 Julho/2018
UFRN/CCET/PPGG – Dissertação de Mestrado Capítulo III – Materiais e métodos
página 24
Figura 3.8: Amostra SAL.01-LB e sua respectiva pastilha de ~ 1,5 mm de espessura, serrada para medidas de permissividade dielétrica.
Conti, I.M.M. Dissertação N° 208 Julho/2018
UFRN/CCET/PPGG – Dissertação de Mestrado Capítulo III – Materiais e métodos
página 25
Figura 3.9: Analisador de impedância utilizado para efetuar as medidas da permissividade dielétrica.

UFRN/CCET/PPGG – Dissertação de Mestrado Capítulo IV – Artigo
Capítulo IV – Artigo
Porosity Estimation and Geometric Characterization of Fractured and Karstified 1
Carbonate Rocks using GPR Data in the Salitre Formation, Brazil 2
3
Iurianne M. M. Conti1, David L. de Castro1, Francisco H.R. Bezerra1, Caroline L. Cazarin2 4
5
1Programa de Pós-graduação em Geodinâmica e Geofísica. Universidade Federal do Rio 6
Grande do Norte, Campus Universitário, 59078-970, Natal, RN, Brazil. 7
2Petrobras, Centro de Pesquisa e Desenvolvimento Leopoldo Américo Miguez de Mello 8
(Cenpes), Av. Horácio Macedo, 950, Cidade Universitária, Rio de Janeiro 21941-915, RJ, 9
Brazil. 10
11
Corresponding Author: David L. de Castro ([email protected]) 12
13
Artigo submetido a Pure and Applied Geophysics em 22/06/2018. 14

Conti, I.M.M. Dissertação N° 208 Julho/2018
UFRN/CCET/PPGG – Dissertação de Mestrado Capítulo IV – Artigo
página 27
Porosity Estimation and Geometric Characterization of Fractured and Karstified 15
Carbonate Rocks using GPR Data in the Salitre Formation, Brazil 16
17
Abstract 18
Three-dimensional distribution of karstic zones and estimated porosity were obtained 19
in fractured carbonate units of the Salitre Formation (Brazil) from GPR data. Low-amplitude 20
(shadow) GPR zones could be associated with mineral dissolution halos that developed 21
around fractures and bedding planes. GPR volumes show a 3D mazelike geometry of the 22
vertical karstified carbonate zones, similar with the set of passages controlled by ~N-S and E-23
W oriented fracture system, observed on surface in unmanned aerial vehicle images. 24
Measurements in plug samples indicate that the mineral dissolution caused bulk 25
density and dielectric permittivity rise and incipient decrease in porosity from 0.95% to 26
1.08%. These changes in the rock properties affect the EM impedance contrasts between 27
carbonate bedding, causing loss of the reflected GPR signal. The correlation between 28
dielectric permittivity and porosity could be analyzed using the complex refractive index 29
model (CRIM), which is computed by EM velocity extracted from GPR data. The CRIM 30
porosities are somewhat lower than plug sample porosities due to different measurement 31
scales. However, the fact that porosity is slightly higher in the dissolved carbonates was 32
maintained. In addition, GPR amplitude and frequency instantaneous attributes were used to 33
estimate spatial variability in porosity throughout the whole GPR data volume. The crossplot 34
of these two GPR attributes show that altered zones generally cluster in narrow ranges of 35
instantaneous GPR amplitude and in broad range of instantaneous GPR frequency. Assuming 36
empirical correlation between physical properties and GPR attributes two predicted porosity 37
volumes were established for the karstified carbonates in the studied area. 38
39
Keywords: Karst, Carbonates, Fractures, Porosity, Dielectric Permittivity, GPR 40
41
1. Introduction 42
Carbonates are typically low primary porosity and permeability rocks (e.g., Agosta et 43
al., 2010). Therefore, secondary porosity and permeability are generated by mineral 44
dissolution (karstification), which is partly controlled by fractures and play a major role in 45
hydrocarbon and ground water storage (Amthor and Friedman, 1991; Lonergan et al., 2007; 46
Questiaux et al., 2010). Dissolution along fractures creates secondary porosity in carbonate 47

Conti, I.M.M. Dissertação N° 208 Julho/2018
UFRN/CCET/PPGG – Dissertação de Mestrado Capítulo IV – Artigo
página 28
rocks, consisting of mega-porosity (centimeter to meter scale), represented by caves, vugs and 48
cavities, and matrix porosity (less than millimeter) (Lucia, 2007). However, an important 49
degree of uncertainty exists in understanding the geometry of fractures and the related 50
secondary porosity in carbonates units. The complex origin and geometry of secondary 51
porosity generated by mineral dissolution makes the modeling of fractured and karstified 52
reservoir a difficult task (Billi, 2005; Agosta et al., 2010). Despite its importance, 53
investigation of porosity in oil reservoirs have been limited to core samples, making it 54
difficult to investigate how preexisting fracture network influence dissolution and the 55
geometry of secondary porosity system. In addition, 3D seismic data do not have sufficient 56
resolution to detect closely spaced dissolution along fractures spaced a few meters apart. The 57
GPR method has been used to bridge the gap between natural examples of reservoir 58
stratigraphic geometry at interwell scale (few to hundreds of meters) and indirectly 59
petrophysical properties (e.g., Gawthorpe et al., 1993; Loucks et al., 2004; Harbi and 60
McMechan, 2011; Reis Jr. et al., 2014; Fernandes Jr. et al., 2015). 3D high-resolution GPR 61
images in outcrop analogs provide detailed information about depositional, structural, and 62
karstic features, whereas GPR attributes contribute for estimating porosity and permeability 63
by means of geostatistical relationships (e.g., Corbeanu et al., 2002; Mount et al., 2014). 64
Recent studies (e.g., Tronicke and Paasche, 2016) have also correlated GPR signal parameters 65
(energy, velocity, attenuation) to physical properties (dielectric permittivity, electrical 66
conductivity) allowing detailed prediction of 3D distribution of petrophysical properties, 67
including porosity, permeability, water saturation, and clay content, in outcrop analogs. 68
However, the models derived from investigation of many natural examples are still a matter of 69
debate. 70
This study investigates the geometry and attributes of porosity associated with karst 71
driven by fractures in the Precambrian Salitre Formation, São Francisco Craton, in Brazil 72
(Fig. 1), which we used as a carbonate reservoir analog. The investigated area hosts the 73
longest cave system in South America and one of the oldest caves in the world (Auler and 74
Smart, 2003; Klimchouk et al., 2016; Auler et al., 2017). The karstification is associated with 75
a pervasive dissolution along fractures and sedimentary bedding in the region. In the present 76
study, we focused on the following points using GPR data: (1) the 3D geometry and volumes 77
of fractured and altered zones; and (2) the correlation among GPR attributes, physical 78
(dielectric permittivity and density) and petrophysical (porosity) data to estimate secondary 79
karst porosity in the low-porosity carbonate units in the Precambrian Salitre Formation. Our 80
results indicate that mineral dissolution along the fractures modified physical and 81
Conti, I.M.M. Dissertação N° 208 Julho/2018
UFRN/CCET/PPGG – Dissertação de Mestrado Capítulo IV – Artigo
página 29
petrophysical properties of the carbonate rocks, creating amplitude shadow zones in the GPR 82
data. Mapping this GPR pattern we are able to characterize the 3D spatial distribution of the 83
altered zones and, using GPR attributes, to estimate porosity in the studied carbonate rocks. 84
85
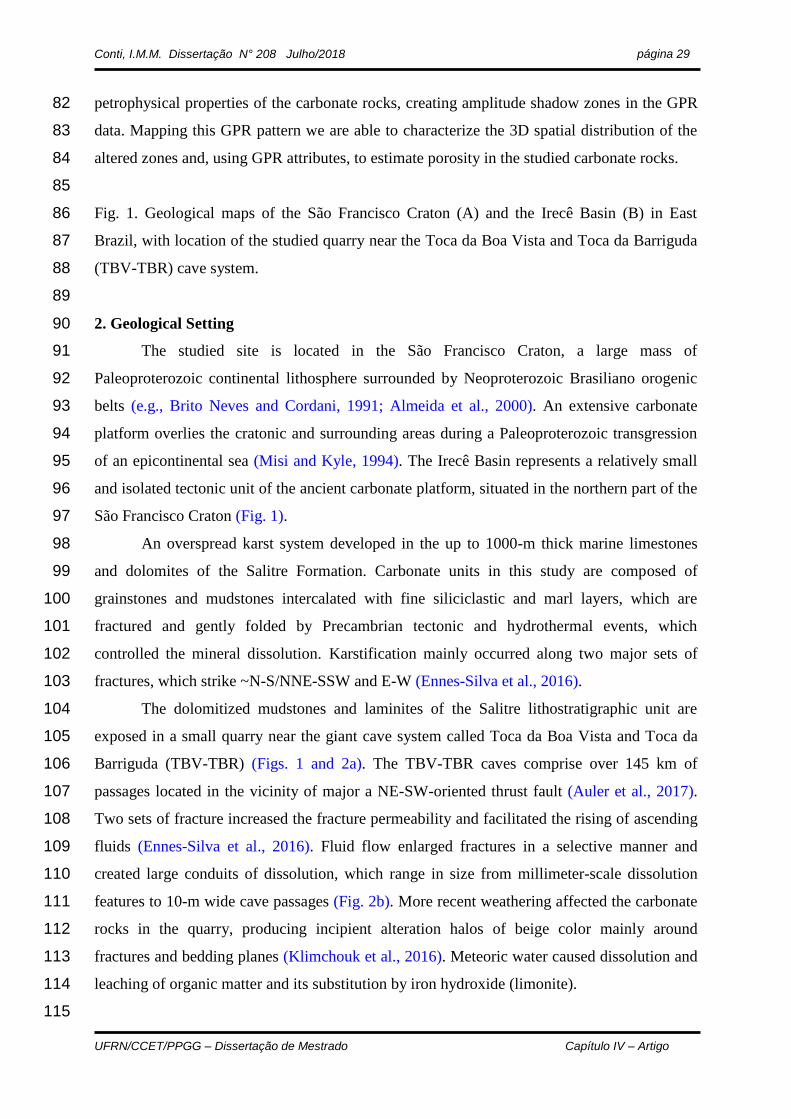
Fig. 1. Geological maps of the São Francisco Craton (A) and the Irecê Basin (B) in East 86
Brazil, with location of the studied quarry near the Toca da Boa Vista and Toca da Barriguda 87
(TBV-TBR) cave system. 88
89
2. Geological Setting 90
The studied site is located in the São Francisco Craton, a large mass of 91
Paleoproterozoic continental lithosphere surrounded by Neoproterozoic Brasiliano orogenic 92
belts (e.g., Brito Neves and Cordani, 1991; Almeida et al., 2000). An extensive carbonate 93
platform overlies the cratonic and surrounding areas during a Paleoproterozoic transgression 94
of an epicontinental sea (Misi and Kyle, 1994). The Irecê Basin represents a relatively small 95
and isolated tectonic unit of the ancient carbonate platform, situated in the northern part of the 96
São Francisco Craton (Fig. 1). 97
An overspread karst system developed in the up to 1000-m thick marine limestones 98
and dolomites of the Salitre Formation. Carbonate units in this study are composed of 99
grainstones and mudstones intercalated with fine siliciclastic and marl layers, which are 100
fractured and gently folded by Precambrian tectonic and hydrothermal events, which 101
controlled the mineral dissolution. Karstification mainly occurred along two major sets of 102
fractures, which strike ~N-S/NNE-SSW and E-W (Ennes-Silva et al., 2016). 103
The dolomitized mudstones and laminites of the Salitre lithostratigraphic unit are 104
exposed in a small quarry near the giant cave system called Toca da Boa Vista and Toca da 105
Barriguda (TBV-TBR) (Figs. 1 and 2a). The TBV-TBR caves comprise over 145 km of 106
passages located in the vicinity of major a NE-SW-oriented thrust fault (Auler et al., 2017). 107
Two sets of fracture increased the fracture permeability and facilitated the rising of ascending 108
fluids (Ennes-Silva et al., 2016). Fluid flow enlarged fractures in a selective manner and 109
created large conduits of dissolution, which range in size from millimeter-scale dissolution 110
features to 10-m wide cave passages (Fig. 2b). More recent weathering affected the carbonate 111
rocks in the quarry, producing incipient alteration halos of beige color mainly around 112
fractures and bedding planes (Klimchouk et al., 2016). Meteoric water caused dissolution and 113
leaching of organic matter and its substitution by iron hydroxide (limonite). 114
115

Conti, I.M.M. Dissertação N° 208 Julho/2018
UFRN/CCET/PPGG – Dissertação de Mestrado Capítulo IV – Artigo
página 30
Fig. 2. Karstic features controlled by NNE-SSW and E-W trending fracture system in the 116 studied quarry with location of the GPR survey: A – unmanned aerial vehicle image with 117 location of GPR lines; B – sub-vertical and orthogonal passage system and karstic cavities 118 along sub-horizontal bedding. 119 120
3. GPR Survey 121
3.1. Data Acquisition and Processing 122
The GPR data were acquired using SIR-3000 equipment (GSSI Inc.) with 400-MHz 123
antennas and time windows of 150 and 200 ns, which allowed us to map karst features and 124
host rocks as deep as 6.0 m, with an estimated vertical resolution of 0.02 m between 125
successive reflections. The GPR traces were equally spaced at 0.02 m, controlled by an 126
odometer. The survey contains a total of 380 m of GPR 2D lines and 765 m of lines 127
distributed in two regular grids (3D), acquired perpendicular and parallel to the NNE-SSW 128
and E-W trending fracture system (Fig. 2a). The spacings between adjacent GPR 3D lines 129
were of 0.5 m and 0.15 m. 130
Processing of the GPR data included trace editing, time zero correction, background 131
removal, dewow filtering, energy decay gain, bandpass filtering, and diffraction stack time 132
migration. An average velocity of 0.075 m/ns was used for diffraction stack migration, 133
calculated from diffraction hyperbolas in the GPR profiles (Fig. 3). No leveling correction 134
was applied since the terrain is fairly flat. In addition, a pseudo-relief attribute that combines 135
the Hilbert Trace attribute with the Energy attribute (Reis Jr et al., 2014) was applied to 136
enhance lateral variation in GPR facies. The result of the GPR data processing is exemplified 137
in the profile L053 (Fig. 4), in which amplitude shadow zones occur either mainly 138
verticalized, with a few meters wide, or horizontalized and broader (light blue areas in Fig. 4). 139
The reflections are plane-parallel, gently undulating and laterally truncated, exhibiting the thin 140
carbonate bedding, affected by sub-vertical fractures and gentle folds. Fernandes Jr. et al. 141
(2015) identified amplitude shadow zones in GPR profiles and associated them with karst 142
structures mapped in a large carbonate outcrop of the Creataceous limestone formation in 143
Potiguar basin (NE Brazil). According to them, empty voids or filled with clay soil are the 144
probable source of the GPR amplitude loss. 145
146
Fig. 3. GPR profile L053 (location in Figure 2a) showing hyperbolic diffractions highlighted 147
with associated estimated EM velocities in m/ns. 148
149

Conti, I.M.M. Dissertação N° 208 Julho/2018
UFRN/CCET/PPGG – Dissertação de Mestrado Capítulo IV – Artigo
página 31
Fig. 4. GPR signature of the fractured and altered carbonate unit (low amplitude zones) in the 150
studied quarry. The location of the Profile L053 is in Figure 2a. Rectangels highlight areas 151
where karstic features, shown in Figure 5, are identified in the GPR data. 152
153
The amplitude shadow zones have direct correlation with hypogenic karstic structures 154
present in the quarry and dissolution halos around fractures and carbonate bedding caused by 155
weathering (Figs. 4 and 5). In hypogenic karsts, the fluids that cause the alteration in the 156
carbonate rocks ascend vertically by fractures until they find low-permeability barriers or 157
baffles, inducing a horizontal flow (Klimchouk et al., 2016). In this way, the karstic zones are 158
preferentially vertical or horizontal. In turn, the downward flow of meteoric water also causes 159
karstification, taking advantage of the same system of fractures and bedding. In the studied 160
quarry, the weathering yielded dissolution halos shown in Figures 5b and 5e. Dissolution 161
changes the mineral content (e.g., dolomitization and limonitization), porosity and 162
permeability of the rock, without, however, substantially modifying the original bedding. The 163
electrical properties, including dielectric permittivity, are also altered, creating low-amplitude 164
reflections due to decrease in reflection coefficients and EM impedance contrasts between bed 165
interfaces. We are taking advantage of these distinct GPR pattern to map the karstic zones in 166
three dimensions and using GPR complex trace attributes to estimate their average porosity 167
based on measurements in plug samples. 168
169
Fig. 5. Karstic features exposed in the studied quarry and identified in the GPR profile (Fig. 170
4): sub-vertical fracture-controlled cavities (A, C and F); non-altered (blue gray) and altered 171
(beige) carbonate zones (B and E) along fractures and bedding planes; and sub-horizontal 172
cavities along bedding planes (C). 173
174
3.2. GPR Atributtes 175
Complex trace attributes have been used to estimate the relationships between seismic 176
(e.g., Taner et al., 1979; Robertson and Nogami, 1984) or GPR (Corbeanu et al., 2002; Harbi 177
and McMechan, 2011) data and physical properties of the subsurface. Instantaneous 178
amplitude and instantaneous frequency are a robust measure of the energy and frequency in 179
the trace at a given time and contain information of petrophysical property as porosity. Thus, 180
we computed these two GPR attributes to identify the dissolved zones (alteration halos of 181
beige color – Figs. 2 and 5) and estimate its porosity indirectly related to changes in the 182
dielectric permittivity of the altered carbonate rocks. The 3D GPR data and its attributes (Fig. 183
Conti, I.M.M. Dissertação N° 208 Julho/2018
UFRN/CCET/PPGG – Dissertação de Mestrado Capítulo IV – Artigo
página 32
6) provide a detailed view of the karstic zones in the studied quarry. The low amplitude 184
coherent responses in the GPR and instantaneous amplitude correlate quite well with vertical 185
and horizontal altered zones observed in the carbonate rocks exposed in the quarry (Figs. 2, 5, 186
6a and 6b). Although the instantaneous frequency shows no obvious GPR pattern of the 187
dissolved areas (Fig. 6c), the frequency content is mainly controlled by contrasts in 188
petrophysical properties and sedimentary features (Corbeanu et al., 2002). In particular we 189
expect no geometric change in the original stratigraphy, but the mineral dissolution should 190
occur preferentially in areas with higher concentrations of fractures, karstic features, stylolites 191
and primary porosity, interfering in the frequency content. 192
193
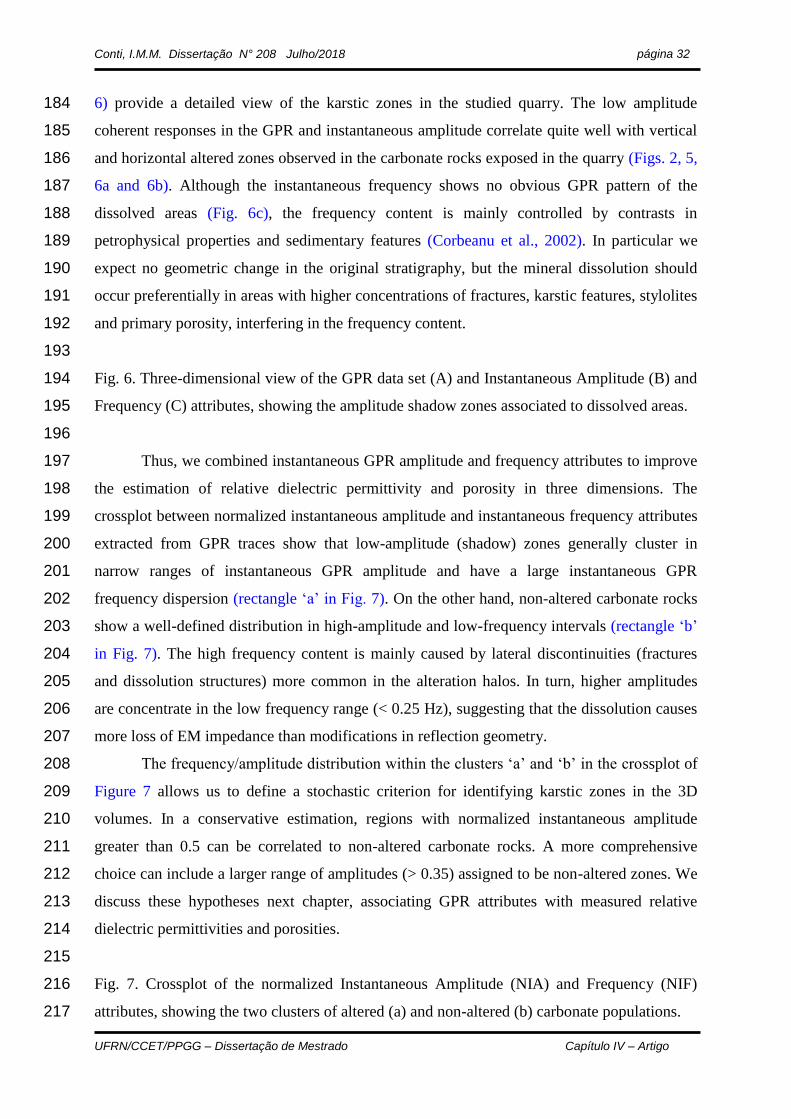
Fig. 6. Three-dimensional view of the GPR data set (A) and Instantaneous Amplitude (B) and 194
Frequency (C) attributes, showing the amplitude shadow zones associated to dissolved areas. 195
196
Thus, we combined instantaneous GPR amplitude and frequency attributes to improve 197
the estimation of relative dielectric permittivity and porosity in three dimensions. The 198
crossplot between normalized instantaneous amplitude and instantaneous frequency attributes 199
extracted from GPR traces show that low-amplitude (shadow) zones generally cluster in 200
narrow ranges of instantaneous GPR amplitude and have a large instantaneous GPR 201
frequency dispersion (rectangle ‘a’ in Fig. 7). On the other hand, non-altered carbonate rocks 202
show a well-defined distribution in high-amplitude and low-frequency intervals (rectangle ‘b’ 203
in Fig. 7). The high frequency content is mainly caused by lateral discontinuities (fractures 204
and dissolution structures) more common in the alteration halos. In turn, higher amplitudes 205
are concentrate in the low frequency range (< 0.25 Hz), suggesting that the dissolution causes 206
more loss of EM impedance than modifications in reflection geometry. 207
The frequency/amplitude distribution within the clusters ‘a’ and ‘b’ in the crossplot of 208
Figure 7 allows us to define a stochastic criterion for identifying karstic zones in the 3D 209
volumes. In a conservative estimation, regions with normalized instantaneous amplitude 210
greater than 0.5 can be correlated to non-altered carbonate rocks. A more comprehensive 211
choice can include a larger range of amplitudes (> 0.35) assigned to be non-altered zones. We 212
discuss these hypotheses next chapter, associating GPR attributes with measured relative 213
dielectric permittivities and porosities. 214
215
Fig. 7. Crossplot of the normalized Instantaneous Amplitude (NIA) and Frequency (NIF) 216
attributes, showing the two clusters of altered (a) and non-altered (b) carbonate populations. 217
Conti, I.M.M. Dissertação N° 208 Julho/2018
UFRN/CCET/PPGG – Dissertação de Mestrado Capítulo IV – Artigo
página 33
218
4. Rock Properties and Porosity Prediction 219
4.1. Plug Samples 220
Physical (relative dielectric permittivity and density) and petrophysical (porosity and 221
permeability) measurements were performed on 28 plugs extracted from fresh carbonate rocks 222
and alteration halos in the studied quarry face at approximately the same stratigraphic 223
position. The bulk density was calculated as the dry weight of the sample divided by its 224
volume. A displacement method was used to measure effective porosity, submerging the dried 225
samples in a water-filled tank and applying constant vacuum to eliminate bubbles. Effective 226
porosity is proportional to all the water displaced by the sample and measured in a graduated 227
cylinder. Permeability measurements were obtained using an electronic probe permeameter, 228
whose values are in milli-Darcy (mD). However, permeability data show no consistent values 229
and were not considered in the present study. Finally, the samples were cut into ~1.5 mm 230
thickness slabs for relative dielectric permittivity measurements using a high-precision 231
impedance analyzer. Measurements of real and imaginary parts of the sample permittivity 232
were made for the 400 MHz frequency to obtain dielectric data for the same GPR antenna 233
frequency used in the field work. 234
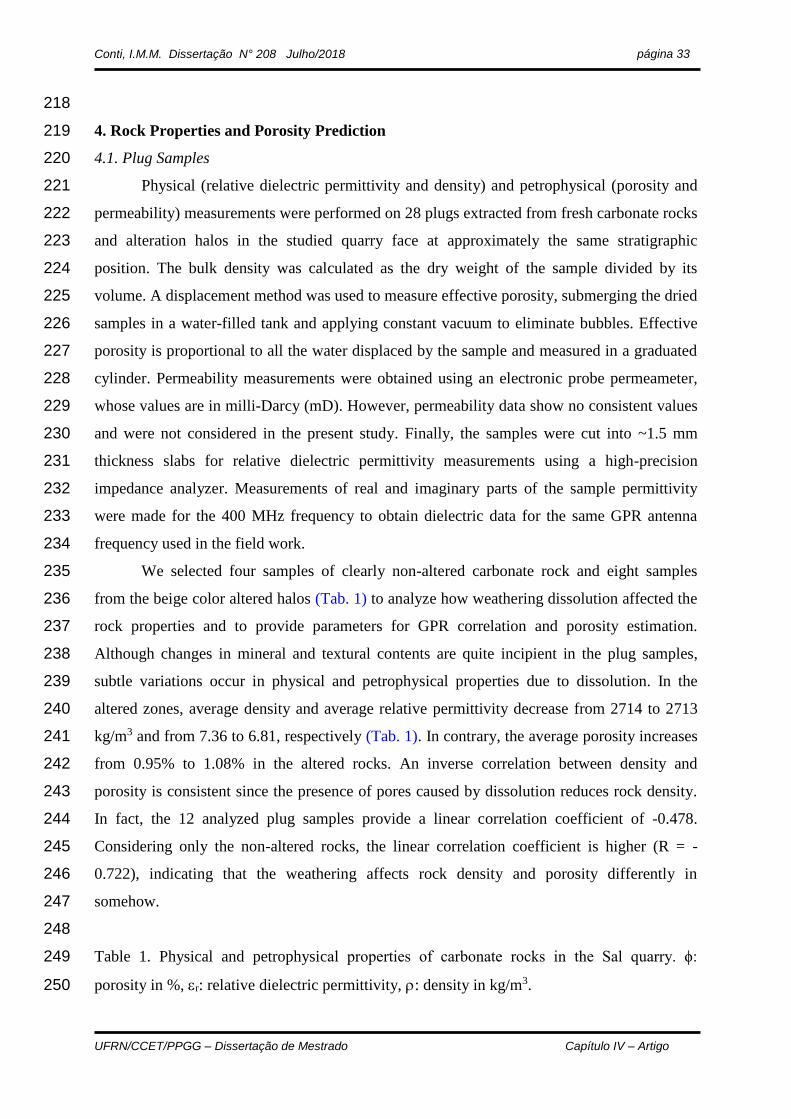
We selected four samples of clearly non-altered carbonate rock and eight samples 235
from the beige color altered halos (Tab. 1) to analyze how weathering dissolution affected the 236
rock properties and to provide parameters for GPR correlation and porosity estimation. 237
Although changes in mineral and textural contents are quite incipient in the plug samples, 238
subtle variations occur in physical and petrophysical properties due to dissolution. In the 239
altered zones, average density and average relative permittivity decrease from 2714 to 2713 240
kg/m3 and from 7.36 to 6.81, respectively (Tab. 1). In contrary, the average porosity increases 241
from 0.95% to 1.08% in the altered rocks. An inverse correlation between density and 242
porosity is consistent since the presence of pores caused by dissolution reduces rock density. 243
In fact, the 12 analyzed plug samples provide a linear correlation coefficient of -0.478. 244
Considering only the non-altered rocks, the linear correlation coefficient is higher (R = -245
0.722), indicating that the weathering affects rock density and porosity differently in 246
somehow. 247
248
Table 1. Physical and petrophysical properties of carbonate rocks in the Sal quarry. ϕ: 249
porosity in %, r: relative dielectric permittivity, : density in kg/m3. 250
Conti, I.M.M. Dissertação N° 208 Julho/2018
UFRN/CCET/PPGG – Dissertação de Mestrado Capítulo IV – Artigo
página 34
251
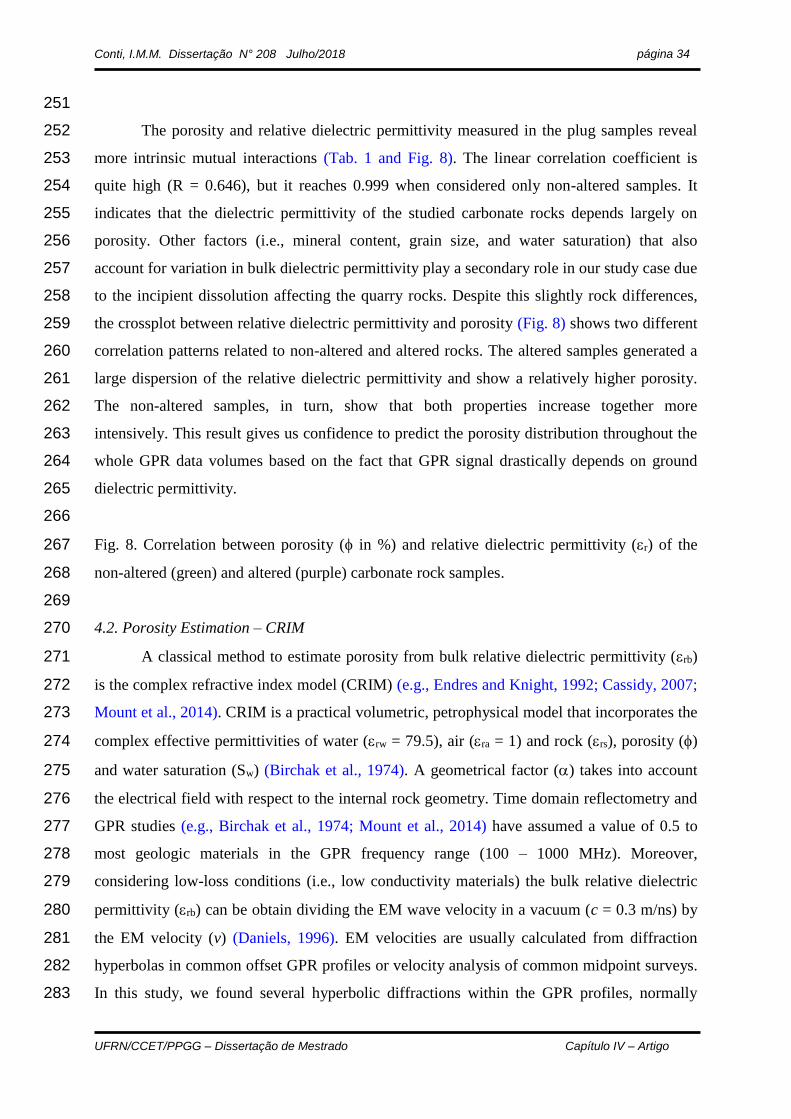
The porosity and relative dielectric permittivity measured in the plug samples reveal 252
more intrinsic mutual interactions (Tab. 1 and Fig. 8). The linear correlation coefficient is 253
quite high (R = 0.646), but it reaches 0.999 when considered only non-altered samples. It 254
indicates that the dielectric permittivity of the studied carbonate rocks depends largely on 255
porosity. Other factors (i.e., mineral content, grain size, and water saturation) that also 256
account for variation in bulk dielectric permittivity play a secondary role in our study case due 257
to the incipient dissolution affecting the quarry rocks. Despite this slightly rock differences, 258
the crossplot between relative dielectric permittivity and porosity (Fig. 8) shows two different 259
correlation patterns related to non-altered and altered rocks. The altered samples generated a 260
large dispersion of the relative dielectric permittivity and show a relatively higher porosity. 261
The non-altered samples, in turn, show that both properties increase together more 262
intensively. This result gives us confidence to predict the porosity distribution throughout the 263
whole GPR data volumes based on the fact that GPR signal drastically depends on ground 264
dielectric permittivity. 265
266
Fig. 8. Correlation between porosity ( in %) and relative dielectric permittivity (r) of the 267
non-altered (green) and altered (purple) carbonate rock samples. 268
269
4.2. Porosity Estimation – CRIM 270
A classical method to estimate porosity from bulk relative dielectric permittivity (rb) 271
is the complex refractive index model (CRIM) (e.g., Endres and Knight, 1992; Cassidy, 2007; 272
Mount et al., 2014). CRIM is a practical volumetric, petrophysical model that incorporates the 273
complex effective permittivities of water (rw = 79.5), air (ra = 1) and rock (rs), porosity () 274
and water saturation (Sw) (Birchak et al., 1974). A geometrical factor () takes into account 275
the electrical field with respect to the internal rock geometry. Time domain reflectometry and 276
GPR studies (e.g., Birchak et al., 1974; Mount et al., 2014) have assumed a value of 0.5 to 277
most geologic materials in the GPR frequency range (100 – 1000 MHz). Moreover, 278
considering low-loss conditions (i.e., low conductivity materials) the bulk relative dielectric 279
permittivity (rb) can be obtain dividing the EM wave velocity in a vacuum (c = 0.3 m/ns) by 280
the EM velocity (v) (Daniels, 1996). EM velocities are usually calculated from diffraction 281
hyperbolas in common offset GPR profiles or velocity analysis of common midpoint surveys. 282
In this study, we found several hyperbolic diffractions within the GPR profiles, normally 283
Conti, I.M.M. Dissertação N° 208 Julho/2018
UFRN/CCET/PPGG – Dissertação de Mestrado Capítulo IV – Artigo
página 35
associated with fractures, vugs and other karstic features (Fig. 3). An average diffraction 284
velocity of 0.075 m/ns was estimated by fitting hyperbolic functions to the diffraction 285
geometry in the GPR profiles, resulting in a bulk relative dielectric permittivity of 16 for the 286
carbonate rocks in the studied quarry. 287
We applied the CRIM method to estimate porosity derived from EM velocities and 288
compare with porosity measured in plug samples. We assumed a completely unsatured 289
carbonate rock (Sw = 0) above the water table (deeper than our GPR investigation depth up to 290
12 m) and used average effective permittivities of non-altered and altered rock (rs) of 7.36 to 291
6.81, respectively (Tab. 1). The CRIM porosity estimates are 0.74% for non-altered rock and 292
0.80% for altered rock, which are consistent with measured average porosities of 0.95% and 293
1.08%, respectively. The bulk GPR porosity estimates are slightly overestimated by plug 294
porosity measurements, but maintain the characteristic of increased porosity in the altered 295
zones. These differences are expected due to the distinct nature of each particular method, 296
scale of measurements and the heterogeneities within the carbonate rocks, and the presence of 297
fractures and karstic features. However, the consistency of the results enables the use of the 298
GPR data to estimate the porosities of the non-altered and altered zones in the studied quarry. 299
300
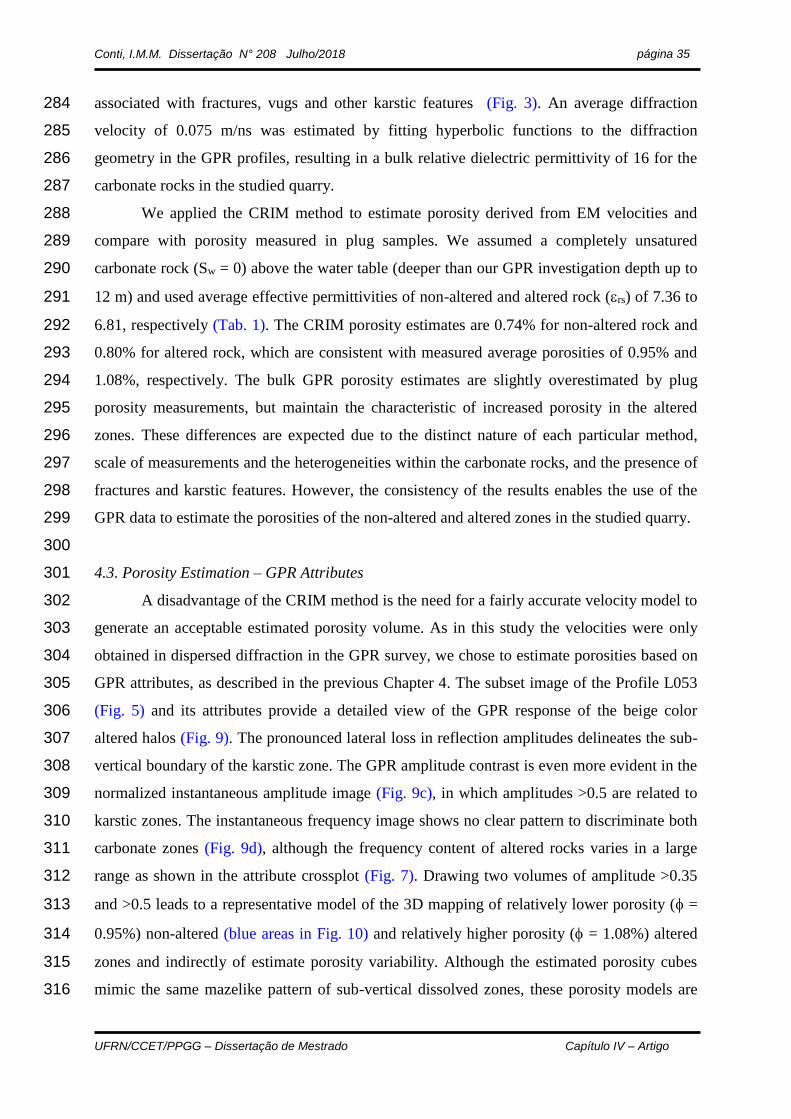
4.3. Porosity Estimation – GPR Attributes 301
A disadvantage of the CRIM method is the need for a fairly accurate velocity model to 302
generate an acceptable estimated porosity volume. As in this study the velocities were only 303
obtained in dispersed diffraction in the GPR survey, we chose to estimate porosities based on 304
GPR attributes, as described in the previous Chapter 4. The subset image of the Profile L053 305
(Fig. 5) and its attributes provide a detailed view of the GPR response of the beige color 306
altered halos (Fig. 9). The pronounced lateral loss in reflection amplitudes delineates the sub-307
vertical boundary of the karstic zone. The GPR amplitude contrast is even more evident in the 308
normalized instantaneous amplitude image (Fig. 9c), in which amplitudes >0.5 are related to 309
karstic zones. The instantaneous frequency image shows no clear pattern to discriminate both 310
carbonate zones (Fig. 9d), although the frequency content of altered rocks varies in a large 311
range as shown in the attribute crossplot (Fig. 7). Drawing two volumes of amplitude >0.35 312
and >0.5 leads to a representative model of the 3D mapping of relatively lower porosity ( = 313
0.95%) non-altered (blue areas in Fig. 10) and relatively higher porosity ( = 1.08%) altered 314
zones and indirectly of estimate porosity variability. Although the estimated porosity cubes 315
mimic the same mazelike pattern of sub-vertical dissolved zones, these porosity models are 316

Conti, I.M.M. Dissertação N° 208 Julho/2018
UFRN/CCET/PPGG – Dissertação de Mestrado Capítulo IV – Artigo
página 36
clearly a quite simplified approximation because this petrophysical property was measured in 317
a few locations on surface. Certainly, new porosity measurements in boreholes may improve 318
the prediction of porosity from GPR data in the studied quarry. 319
320
Fig. 9. Altered halos along bedding planes associated with fractures in the carbonate rocks (A) 321
and their GPR responses (B) and normalized instantaneous amplitude (C) and frequency GPR 322
patterns (D). 323
324
Fig. 10. Predicted porosity cubes derived from GPR data. Blue areas represent lower-porosity, 325
non-altered zones, where normalized instantaneous amplitude (NIA) is greater than 0.5 (A) or 326
0.35 (B). The plan view of the porosity cube in shown in C. A NIA profile (A and B) and a 327
NIA time slice (C) show the higher-porosity, altered halos indicated by orange color (see the 328
color table in Figure 9c). 329
330
5. Geometric Characterization of Altered Zones and Karstic Features 331
The studied quarry is located near the TBV-TBR cave system (Fig. 1). However, no 332
cave is present in this area, only a system of passages spaced 1-3 m in width and 2-4 m in 333
height along NNE-SSW and E-W oriented fractures (Fig. 2). On the other hand, more recent 334
chemical weathering caused mineral dissolution and limonitization along the same conjugate 335
fracture system and carbonate bedding (Fig. 5), which played as preferential pathways for the 336
former karstification. Our GPR survey investigated an area affected by more incipient level of 337
dissolution, comprising centimeter-scale karstic features and altered beige halos (Figs. 4 to 6 338
and 9). 339
The GPR profiles show sequences of sub-horizontal, and sub-parallel reflections, 340
which are slightly undulated and sometimes dipping to SE (Figs. 4 and 11). Undulated and 341
dipping reflections can be associated with gentle folding observed in the TBV-TBR cave 342
system by Klimchouk et al. (2016). These authors related folds in the caves to the Brasiliano 343
orogenic cycle that affected the Salitre carbonate units in the Neoproterozoic. Moreover, GPR 344
shadow zones and centimeter-scale karstic features (vugs and small cavities) were able to be 345
mapped in the GPR profiles (Figs. 4 and 5). 346
347
Fig. 11. GPR Profile L059 showing sub-vertical amplitude shadow zones, related with altered 348
halos and karstic features developed around fractures (light blue areas), and slightly undulated 349
sequences of reflections (red lines). 350
Conti, I.M.M. Dissertação N° 208 Julho/2018
UFRN/CCET/PPGG – Dissertação de Mestrado Capítulo IV – Artigo
página 37
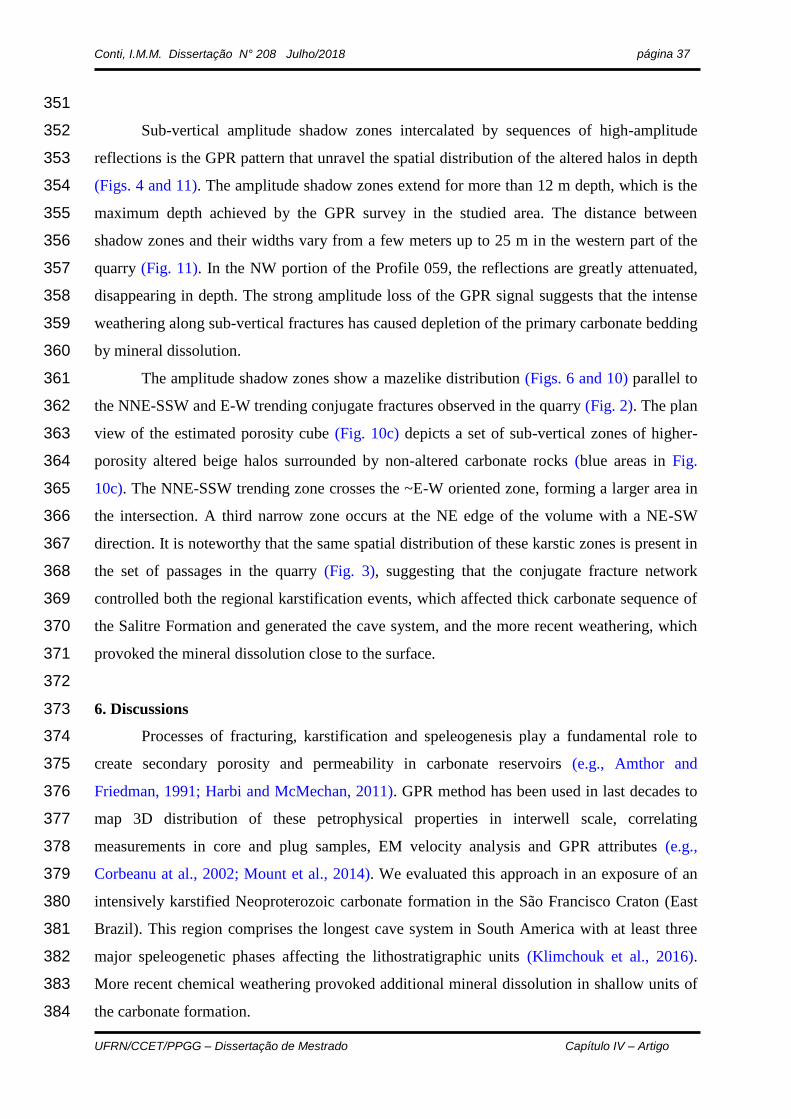
351
Sub-vertical amplitude shadow zones intercalated by sequences of high-amplitude 352
reflections is the GPR pattern that unravel the spatial distribution of the altered halos in depth 353
(Figs. 4 and 11). The amplitude shadow zones extend for more than 12 m depth, which is the 354
maximum depth achieved by the GPR survey in the studied area. The distance between 355
shadow zones and their widths vary from a few meters up to 25 m in the western part of the 356
quarry (Fig. 11). In the NW portion of the Profile 059, the reflections are greatly attenuated, 357
disappearing in depth. The strong amplitude loss of the GPR signal suggests that the intense 358
weathering along sub-vertical fractures has caused depletion of the primary carbonate bedding 359
by mineral dissolution. 360
The amplitude shadow zones show a mazelike distribution (Figs. 6 and 10) parallel to 361
the NNE-SSW and E-W trending conjugate fractures observed in the quarry (Fig. 2). The plan 362
view of the estimated porosity cube (Fig. 10c) depicts a set of sub-vertical zones of higher-363
porosity altered beige halos surrounded by non-altered carbonate rocks (blue areas in Fig. 364
10c). The NNE-SSW trending zone crosses the ~E-W oriented zone, forming a larger area in 365
the intersection. A third narrow zone occurs at the NE edge of the volume with a NE-SW 366
direction. It is noteworthy that the same spatial distribution of these karstic zones is present in 367
the set of passages in the quarry (Fig. 3), suggesting that the conjugate fracture network 368
controlled both the regional karstification events, which affected thick carbonate sequence of 369
the Salitre Formation and generated the cave system, and the more recent weathering, which 370
provoked the mineral dissolution close to the surface. 371
372
6. Discussions 373
Processes of fracturing, karstification and speleogenesis play a fundamental role to 374
create secondary porosity and permeability in carbonate reservoirs (e.g., Amthor and 375
Friedman, 1991; Harbi and McMechan, 2011). GPR method has been used in last decades to 376
map 3D distribution of these petrophysical properties in interwell scale, correlating 377
measurements in core and plug samples, EM velocity analysis and GPR attributes (e.g., 378
Corbeanu at al., 2002; Mount et al., 2014). We evaluated this approach in an exposure of an 379
intensively karstified Neoproterozoic carbonate formation in the São Francisco Craton (East 380
Brazil). This region comprises the longest cave system in South America with at least three 381
major speleogenetic phases affecting the lithostratigraphic units (Klimchouk et al., 2016). 382
More recent chemical weathering provoked additional mineral dissolution in shallow units of 383
the carbonate formation. 384

Conti, I.M.M. Dissertação N° 208 Julho/2018
UFRN/CCET/PPGG – Dissertação de Mestrado Capítulo IV – Artigo
página 38
385
6.1. 3D Porosity Estimation 386
Porosity is a key parameter for the estimation of fluid volume in reservoir 387
characterization (Forster et al., 2004; Harbi and McMechan, 2011). In outcrop scale, 3D 388
porosity distribution can be predicted from GPR data calibrated by porosity measured from 389
rock samples. We used two approaches to establish the relationships between them in the 390
studied quarry: a) CRIM petrophysical modeling; and b) GPR instantaneous attributes. The 391
CRIM derived porosities for the non-altered (0.74%) and weathered (0.8%) carbonate zones 392
are slightly lower than the overall average porosity measured in plug samples (0.95% and 393
1.08%, respectively). However, the porosity estimates from each method correspond very 394
well and the overall different between both carbonate zones was preserved. In addition, GPR 395
instantaneous amplitude and frequency attributes distinguished satisfactorily both carbonate 396
zones and provided predict porosity volumes (Fig. 10). These positive results demonstrate 397
potential implications for assessment of 3D distribution of petrophysical properties at the 398
interwell scale to populate inputs for reservoir simulation in a Salitre carbonate reservoir 399
analog using high-resolution GPR data. Certainly, 3D porosity estimation requires systematic 400
porosity measurements on surface and boreholes, more accurate velocity models to calculate 401
dielectric permittivity, and more effective calibration the relations between the petrophysical 402
properties and GPR attributes using geostatistical analysis. Further studies should introduce 403
these improvements to allow for better constraint of the CRIM petrophysical model and 404
refining 3D estimates of porosity for the carbonate Salitre Formation. 405
In addition to the dissolution caused by weathering, centimeter- to meter-scale cavities 406
and vugs are present in the study area (Fig. 5). These karstic features were generated by the 407
karstification and speleogenesis processes that formed the cave systems. They are important 408
heterogeneities in both porosity and permeability in the carbonate formation, but they were 409
not considered in the present GPR survey. Their geometric and petrophysical characterization 410
should be addressed with other imaging approaches. Therefore, they can be useful to guide 411
seismic signature interpretation and reservoir fluid flow simulation for karstified carbonate 412
reservoirs. 413
414
6.2. 3D Geometric Characterization 415
The relationships between GPR shadow zones and dissolved carbonate rocks were 416
determined based on plug sample analysis. In the studied quarry, the sample measurements 417
reveal that the dissolution along fractures causes changes in physical and petrophysical 418
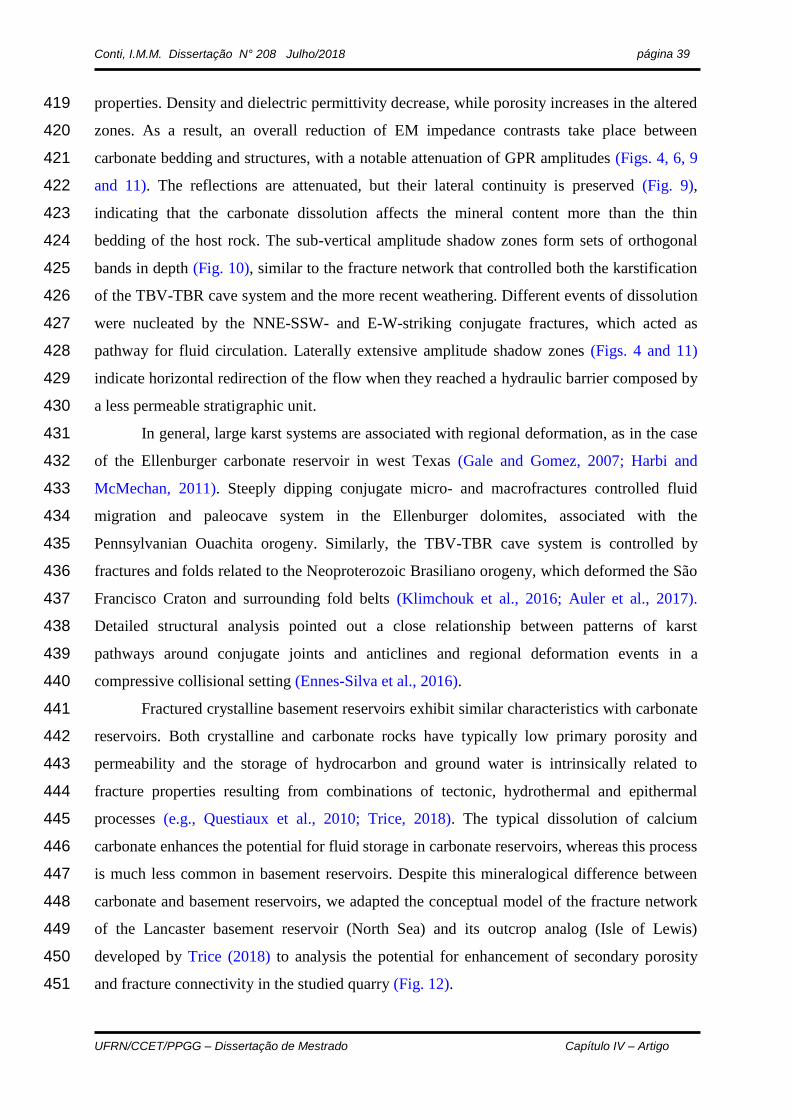
Conti, I.M.M. Dissertação N° 208 Julho/2018
UFRN/CCET/PPGG – Dissertação de Mestrado Capítulo IV – Artigo
página 39
properties. Density and dielectric permittivity decrease, while porosity increases in the altered 419
zones. As a result, an overall reduction of EM impedance contrasts take place between 420
carbonate bedding and structures, with a notable attenuation of GPR amplitudes (Figs. 4, 6, 9 421
and 11). The reflections are attenuated, but their lateral continuity is preserved (Fig. 9), 422
indicating that the carbonate dissolution affects the mineral content more than the thin 423
bedding of the host rock. The sub-vertical amplitude shadow zones form sets of orthogonal 424
bands in depth (Fig. 10), similar to the fracture network that controlled both the karstification 425
of the TBV-TBR cave system and the more recent weathering. Different events of dissolution 426
were nucleated by the NNE-SSW- and E-W-striking conjugate fractures, which acted as 427
pathway for fluid circulation. Laterally extensive amplitude shadow zones (Figs. 4 and 11) 428
indicate horizontal redirection of the flow when they reached a hydraulic barrier composed by 429
a less permeable stratigraphic unit. 430
In general, large karst systems are associated with regional deformation, as in the case 431
of the Ellenburger carbonate reservoir in west Texas (Gale and Gomez, 2007; Harbi and 432
McMechan, 2011). Steeply dipping conjugate micro- and macrofractures controlled fluid 433
migration and paleocave system in the Ellenburger dolomites, associated with the 434
Pennsylvanian Ouachita orogeny. Similarly, the TBV-TBR cave system is controlled by 435
fractures and folds related to the Neoproterozoic Brasiliano orogeny, which deformed the São 436
Francisco Craton and surrounding fold belts (Klimchouk et al., 2016; Auler et al., 2017). 437
Detailed structural analysis pointed out a close relationship between patterns of karst 438
pathways around conjugate joints and anticlines and regional deformation events in a 439
compressive collisional setting (Ennes-Silva et al., 2016). 440
Fractured crystalline basement reservoirs exhibit similar characteristics with carbonate 441
reservoirs. Both crystalline and carbonate rocks have typically low primary porosity and 442
permeability and the storage of hydrocarbon and ground water is intrinsically related to 443
fracture properties resulting from combinations of tectonic, hydrothermal and epithermal 444
processes (e.g., Questiaux et al., 2010; Trice, 2018). The typical dissolution of calcium 445
carbonate enhances the potential for fluid storage in carbonate reservoirs, whereas this process 446
is much less common in basement reservoirs. Despite this mineralogical difference between 447
carbonate and basement reservoirs, we adapted the conceptual model of the fracture network 448
of the Lancaster basement reservoir (North Sea) and its outcrop analog (Isle of Lewis) 449
developed by Trice (2018) to analysis the potential for enhancement of secondary porosity 450
and fracture connectivity in the studied quarry (Fig. 12). 451
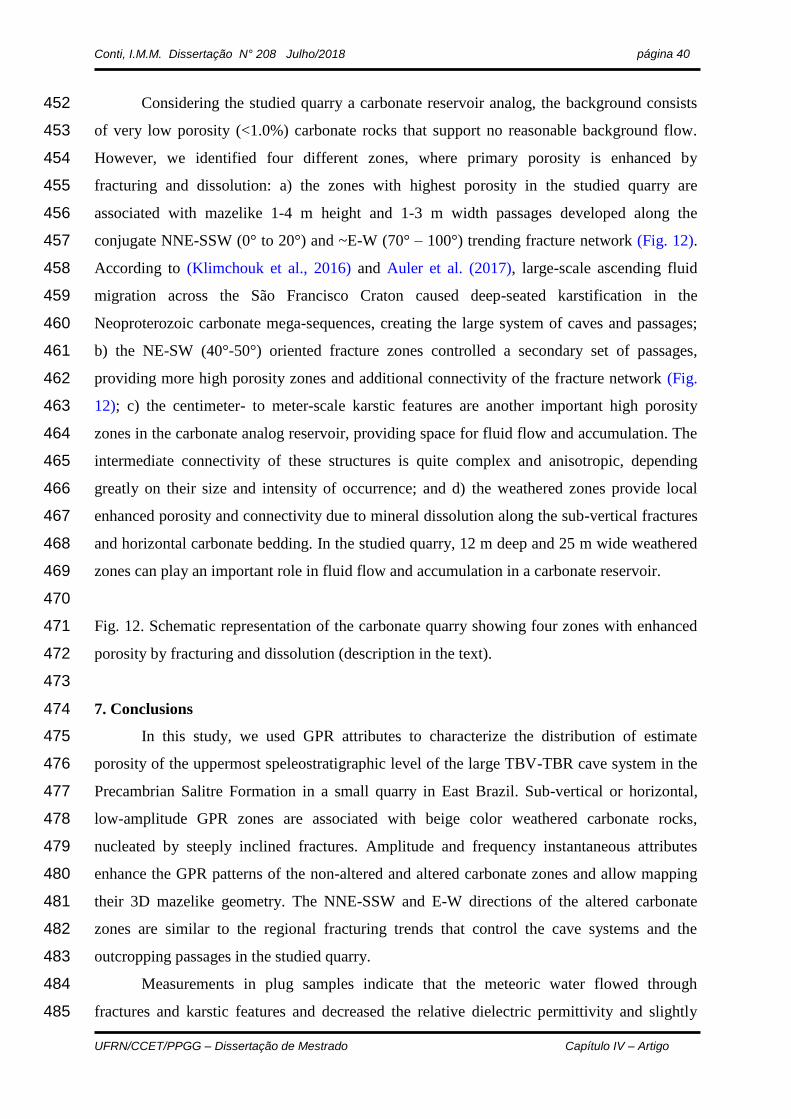
Conti, I.M.M. Dissertação N° 208 Julho/2018
UFRN/CCET/PPGG – Dissertação de Mestrado Capítulo IV – Artigo
página 40
Considering the studied quarry a carbonate reservoir analog, the background consists 452
of very low porosity (<1.0%) carbonate rocks that support no reasonable background flow. 453
However, we identified four different zones, where primary porosity is enhanced by 454
fracturing and dissolution: a) the zones with highest porosity in the studied quarry are 455
associated with mazelike 1-4 m height and 1-3 m width passages developed along the 456
conjugate NNE-SSW (0° to 20°) and ~E-W (70° – 100°) trending fracture network (Fig. 12). 457
According to (Klimchouk et al., 2016) and Auler et al. (2017), large-scale ascending fluid 458
migration across the São Francisco Craton caused deep-seated karstification in the 459
Neoproterozoic carbonate mega-sequences, creating the large system of caves and passages; 460
b) the NE-SW (40°-50°) oriented fracture zones controlled a secondary set of passages, 461
providing more high porosity zones and additional connectivity of the fracture network (Fig. 462
12); c) the centimeter- to meter-scale karstic features are another important high porosity 463
zones in the carbonate analog reservoir, providing space for fluid flow and accumulation. The 464
intermediate connectivity of these structures is quite complex and anisotropic, depending 465
greatly on their size and intensity of occurrence; and d) the weathered zones provide local 466
enhanced porosity and connectivity due to mineral dissolution along the sub-vertical fractures 467
and horizontal carbonate bedding. In the studied quarry, 12 m deep and 25 m wide weathered 468
zones can play an important role in fluid flow and accumulation in a carbonate reservoir. 469
470
Fig. 12. Schematic representation of the carbonate quarry showing four zones with enhanced 471
porosity by fracturing and dissolution (description in the text). 472
473
7. Conclusions 474
In this study, we used GPR attributes to characterize the distribution of estimate 475
porosity of the uppermost speleostratigraphic level of the large TBV-TBR cave system in the 476
Precambrian Salitre Formation in a small quarry in East Brazil. Sub-vertical or horizontal, 477
low-amplitude GPR zones are associated with beige color weathered carbonate rocks, 478
nucleated by steeply inclined fractures. Amplitude and frequency instantaneous attributes 479
enhance the GPR patterns of the non-altered and altered carbonate zones and allow mapping 480
their 3D mazelike geometry. The NNE-SSW and E-W directions of the altered carbonate 481
zones are similar to the regional fracturing trends that control the cave systems and the 482
outcropping passages in the studied quarry. 483
Measurements in plug samples indicate that the meteoric water flowed through 484
fractures and karstic features and decreased the relative dielectric permittivity and slightly 485
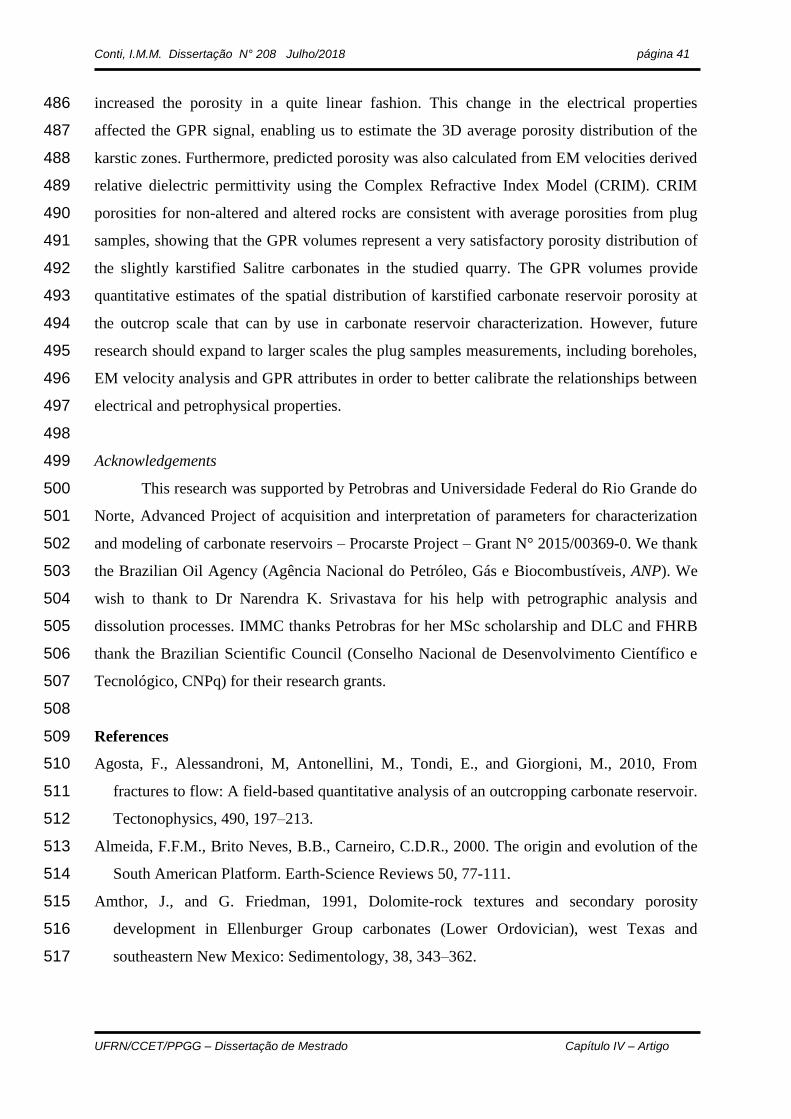
Conti, I.M.M. Dissertação N° 208 Julho/2018
UFRN/CCET/PPGG – Dissertação de Mestrado Capítulo IV – Artigo
página 41
increased the porosity in a quite linear fashion. This change in the electrical properties 486
affected the GPR signal, enabling us to estimate the 3D average porosity distribution of the 487
karstic zones. Furthermore, predicted porosity was also calculated from EM velocities derived 488
relative dielectric permittivity using the Complex Refractive Index Model (CRIM). CRIM 489
porosities for non-altered and altered rocks are consistent with average porosities from plug 490
samples, showing that the GPR volumes represent a very satisfactory porosity distribution of 491
the slightly karstified Salitre carbonates in the studied quarry. The GPR volumes provide 492
quantitative estimates of the spatial distribution of karstified carbonate reservoir porosity at 493
the outcrop scale that can by use in carbonate reservoir characterization. However, future 494
research should expand to larger scales the plug samples measurements, including boreholes, 495
EM velocity analysis and GPR attributes in order to better calibrate the relationships between 496
electrical and petrophysical properties. 497
498
Acknowledgements 499
This research was supported by Petrobras and Universidade Federal do Rio Grande do 500
Norte, Advanced Project of acquisition and interpretation of parameters for characterization 501
and modeling of carbonate reservoirs – Procarste Project – Grant N° 2015/00369-0. We thank 502
the Brazilian Oil Agency (Agência Nacional do Petróleo, Gás e Biocombustíveis, ANP). We 503
wish to thank to Dr Narendra K. Srivastava for his help with petrographic analysis and 504
dissolution processes. IMMC thanks Petrobras for her MSc scholarship and DLC and FHRB 505
thank the Brazilian Scientific Council (Conselho Nacional de Desenvolvimento Científico e 506
Tecnológico, CNPq) for their research grants. 507
508
References 509
Agosta, F., Alessandroni, M, Antonellini, M., Tondi, E., and Giorgioni, M., 2010, From 510
fractures to flow: A field-based quantitative analysis of an outcropping carbonate reservoir. 511
Tectonophysics, 490, 197–213. 512
Almeida, F.F.M., Brito Neves, B.B., Carneiro, C.D.R., 2000. The origin and evolution of the 513
South American Platform. Earth-Science Reviews 50, 77-111. 514
Amthor, J., and G. Friedman, 1991, Dolomite-rock textures and secondary porosity 515
development in Ellenburger Group carbonates (Lower Ordovician), west Texas and 516
southeastern New Mexico: Sedimentology, 38, 343–362. 517
Conti, I.M.M. Dissertação N° 208 Julho/2018
UFRN/CCET/PPGG – Dissertação de Mestrado Capítulo IV – Artigo
página 42
Auler, A.S., Smart, P.L., 2003. The influence of bedrock-derived acidity in the development 518
of surface and underground karst: evidence from the Precambrian carbonates of semi-arid 519
Northeastern Brazil. Earth Surface Processes and Landforms, 28, 157–168. 520
Auler, A.S., Klimchouk, A., Bezerra, F.H.R., Cazarin, C.L., Ennes-Silva, R., Balsamo, F., 521
2017. Origin and Evolution of Toca da Boa Vista and Toca da Barriguda Cave System in 522
North-eastern Brazil. In: Editors: Klimchouk, A., N. Palmer, A., De Waele, J., Auler, A.S., 523
Audra, P. (Org.), Cave and Karst Systems of the World, 1ed. Springer International 524
Publishing, Berlim, 827-840. 525
Billi, A., 2005. Grain size distribution and thickness of breccia and gouge zones from thin (<1 526
m) strike-slip fault cores in limestone. Journal of Structural Geology, 27, 1823–1837. 527
Birchak, J.R., Gardner, C.G., Hipp, J.E., Victor, J.M., 1974. High Dielectric Constant 528
Microwave Probes for Sensing Soil Moisture Proceedings of the Institute of Electrical and 529
Electronics Engineers, 62 (1), 93–98. 530
Brito Neves, B.B., and Cordani, U.G., 1991, Tectonic evolution of South America during the 531
Late Proterozoic. Precambrian Research, 53, 23-40. 532
Cassidy, N.J., 2007, Evaluating LNAPL contamination using GPR and dielectric analysis: 533
Practical implications for signal attenuation and attribute analysis studies. Journal of 534
Contaminant Hydrology, 94 (1–2), 49–75. 535
Corbeanu, R., G. A. McMechan, R. Szerbiak, and K. Soegaard, 2002, Prediction of 3D fluid 536
permeability and mudstone distributions from ground-penetrating radar (GPR) attributes: 537
Example from the Cretaceous Ferron Sandstone Member, east-central Utah: Geophysics, 538
67, 1495–1504. 539
Daniels, D.J., 1996, Surface Penetrating Radar, Radar, Sonar, Navigation and Avionics Series 540
6, The Institute of Electrical Engineers, London, UK. 541
Endres, A. and Knight, R., 1992, A theoretical treatment of the of microscopic fluid 542
distribution on the dielectric properties of partially saturated rocks. Geophysical 543
Prospecting, 37, 531–551. 544
Ennes-Silva, R.A., Bezerra, F.H.R., Nogueira, F.C.C., Balsamo, F., Klimchouk, A., Cazarin, 545
C.L., Auler, A.S., 2016. Superposed folding and associated fracturing influence hypogene 546
karst development in Neoproterozoic carbonates, São Francisco Craton, Brazil. 547
Tectonophysics, 666, 244-259. 548
Fernandes Jr., A.L., Medeiros, W.E., Bezerra, F.H.R., Oliveira, J.G., Cazarin, C.L., 2015. 549
GPR investigation of karst guided by comparison with outcrop and unmanned aerial 550
vehicle imagery. Journal of Applied Geophysics, 112, 268-278. 551

Conti, I.M.M. Dissertação N° 208 Julho/2018
UFRN/CCET/PPGG – Dissertação de Mestrado Capítulo IV – Artigo
página 43
Forster, C. B., H. Snelgrove, S. J. Lim, R. M. Corbeanu, G. A. McMechan, K. Soegaad, R. B. 552
Szerbiak, L. Crossey, and K. Roche, 2004. 3D fluid flow simulation in a clastic reservoir 553
analogue, based in integration 3D GPR and outcrop data from the Ferron Sandstone at 554
Coyote Basin, Utah. In T. C. Chidsey, R. D. Adams, and T. H. Morris, eds., Regional to 555
wellbore analog for fluvial-deltaic reservoir modeling: The Ferron Sandstone of Utah, AAPG 556
in Geology, 50, 405–425. 557
Gale, J., and L. Gomez, 2007, Late opening-mode fractures in karst brecciated dolostones of 558
the Lower Ordovician Ellenburger Group, west Texas: recognition, characterization, and 559
implications for fluid flow: AAPG Bulletin, 91, 1005–1023. 560
Gawthorpe, R.L., Collier, R.E.L., Alexander, J., Bridge, J.S., Leeder, M.R., 1993. Ground-561
penetrating radar: application to sandbody geometry and heterogeneity studies. In North, 562
C.P., Prosser, D.J. Eds., Characterization of Fluvial and Aeolian Reservoirs. The 563
Geological Society, Special Publication No. 73, pp. 421–432. 564
Harbi, H. and McMechan, G.A., 2011, Modeling 3D porosity and permeability from GPR 565
data in the Ellenburger Dolomite, central Texas. Geophysics, 76 (6), J35–J46. 566
Klimchouk, A., Auler, A.S., Bezerra, F.H.R., Cazarin, C.L., Balsamo, F., and Dublyansky, Y., 567
2016, Hypogenic origin, geologic controls and functional organization of a giant cave 568
system in Precambrian carbonates, Brazil. Geomorphology, 253, 385–405. 569
Lonergan, L., Jolly, R.H.J., Rawnsley, K., Sanderson, D.J., 2007. Fractured reservoirs. 570
Geological Society of London, Special Publication, 270, 279pp. 571
Loucks, R.G., Mescher, P., McMechan, G.A., 2004. Three-dimensional architecture of a 572
coalesced, collapsed-paleocave system in the Lower Ordovician Ellenburger Group, 573
Central Texas. Am. Assoc. Pet. Geol. Bull., 88, 545–564. 574
Lucia, F.J., 2007. Carbonate Reservoir Characterization electronic resource: An Integrated 575
Approach. Springer-Verlag Berlin Heidelberg, Berlin, Heidelberg, 226pp. 576
Misi, A., and Kyle, J.R., 1994, Upper Proterozoic carbonate stratigraphy, diagenesis, and 577
stromatolitic phosphorite formation, Ireĉe Basin, Bahia, Brazil. J. Sediment. Res. A64, 578
299–310. 579
Mount, G.J., Comas, X. and Cunningham, K.J., 2014, Characterization of the porosity 580
distribution in the upper part of the karst Biscayne aquifer using common offset ground 581
penetrating radar, Everglades National Park, Florida. Journal of Hydrology, 515, 223–236. 582
Questiaux, J.M., Couples, G.D., Ruby, N., 2010. Fractured reservoirs with fracture corridors. 583
Geophysical Prospecting, 58, 279–295. 584
Conti, I.M.M. Dissertação N° 208 Julho/2018
UFRN/CCET/PPGG – Dissertação de Mestrado Capítulo IV – Artigo
página 44
Reis Jr, J.A., de Castro, D.L., Jesus, T.E.S., Lima Filho, F.P., 2014, Characterization of 585
collapsed paleocave systems using GPR attributes. Journal of Applied Geophysics, 103, 586
43-53. 587
Robertson, J.D. and Nogami, H.H., 1984, Complex seismic trace analysis of thin beds: 588
Geophysics, 49, 344–352. 589
Taner, M.T., Koehler, F. and Sheriff, R.E., 1979, Complex trace analysis. Geophysics, 44, 590
1041-1063. 591
Trice, R., 2014. Basement exploration, West of Shetlands: progress in opening a new play on 592
the UKCS. In Cannon, S. J. C. & Ellis, D. (eds) Hydrocarbon Exploration to Exploitation 593
West of Shetlands. Geological Society, London, Special Publications, 397 (1), 81-106. 594
Tronicke, J., and Paasche, H., 2017, Integrated interpretation of 2D ground-penetrating radar, 595
P-, and S-wave velocity models in terms of petrophysical properties: Assessing 596
uncertainties related to data inversion and petrophysical relations. Interpretation, 5 (1), 597
T121–T130. 598
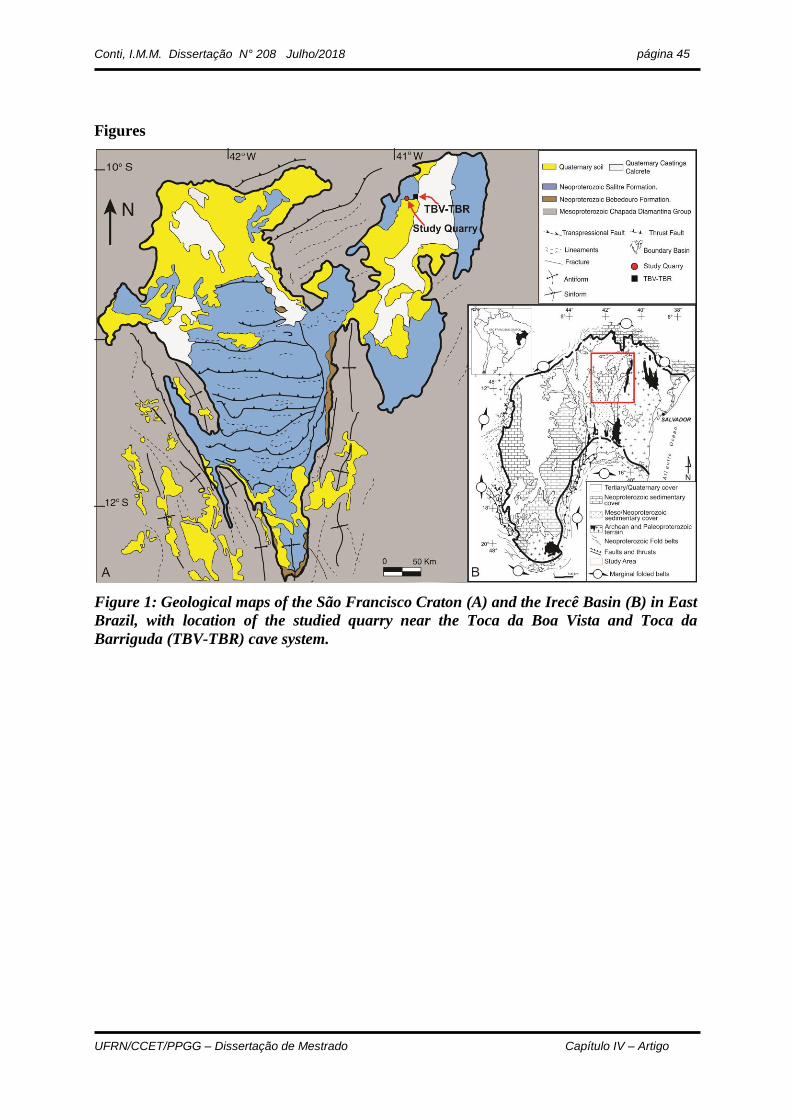
Conti, I.M.M. Dissertação N° 208 Julho/2018
UFRN/CCET/PPGG – Dissertação de Mestrado Capítulo IV – Artigo
página 45
Figures
Figure 1: Geological maps of the São Francisco Craton (A) and the Irecê Basin (B) in East
Brazil, with location of the studied quarry near the Toca da Boa Vista and Toca da
Barriguda (TBV-TBR) cave system.

Conti, I.M.M. Dissertação N° 208 Julho/2018
UFRN/CCET/PPGG – Dissertação de Mestrado Capítulo IV – Artigo
página 46
Figure 2: Karstic features controlled by NNE-SSW and E-W trending fracture system in
the studied quarry with location of the GPR survey: A – unmanned aerial vehicle image
with location of GPR lines; B – sub-vertical and orthogonal passage system and karstic
cavities along sub-horizontal bedding.
Figure 3: GPR profile L053 (location in Figure 2a) showing hyperbolic diffractions
highlighted with associated estimated EM velocities in m/ns.
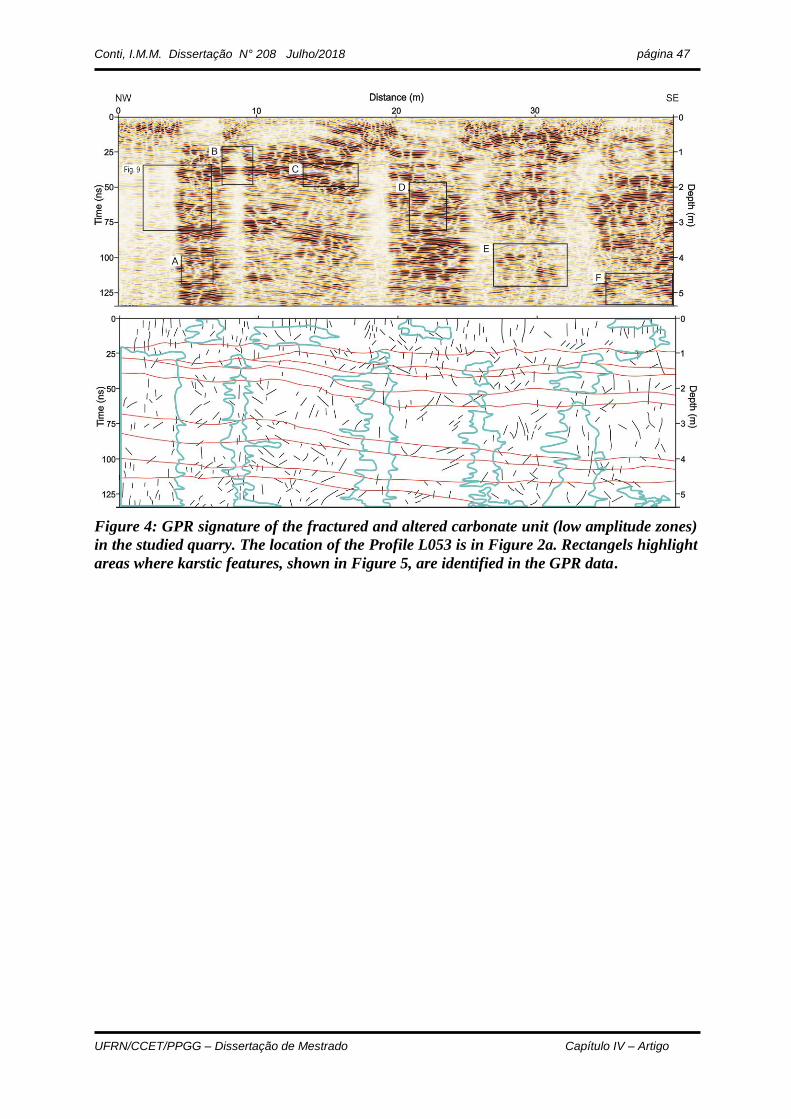
Conti, I.M.M. Dissertação N° 208 Julho/2018
UFRN/CCET/PPGG – Dissertação de Mestrado Capítulo IV – Artigo
página 47
Figure 4: GPR signature of the fractured and altered carbonate unit (low amplitude zones)
in the studied quarry. The location of the Profile L053 is in Figure 2a. Rectangels highlight
areas where karstic features, shown in Figure 5, are identified in the GPR data.

Conti, I.M.M. Dissertação N° 208 Julho/2018
UFRN/CCET/PPGG – Dissertação de Mestrado Capítulo IV – Artigo
página 48
Figure 5: Karstic features exposed in the studied quarry and identified in the GPR profile
(Fig. 4): sub-vertical fracture-controlled cavities (A, C and F); non-altered (blue gray) and
altered (beige) carbonate zones (B and E) along fractures and bedding planes; and sub-
horizontal cavities along bedding planes (C).
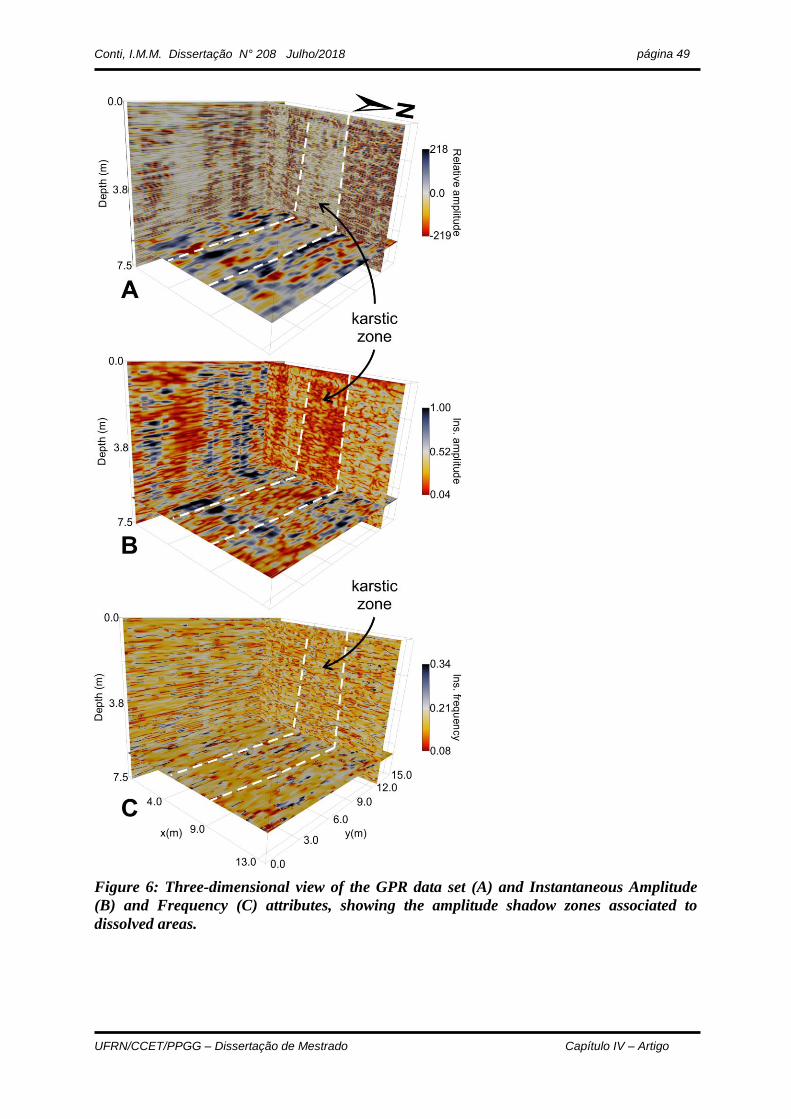
Conti, I.M.M. Dissertação N° 208 Julho/2018
UFRN/CCET/PPGG – Dissertação de Mestrado Capítulo IV – Artigo
página 49
Figure 6: Three-dimensional view of the GPR data set (A) and Instantaneous Amplitude
(B) and Frequency (C) attributes, showing the amplitude shadow zones associated to
dissolved areas.
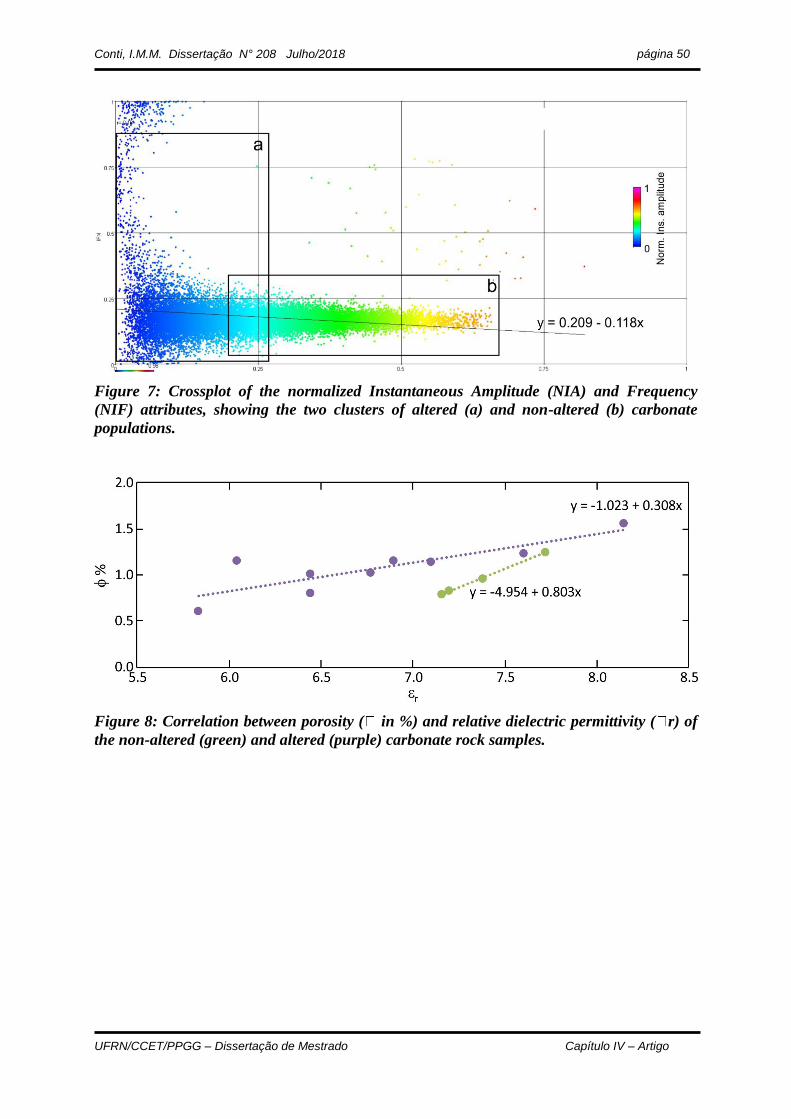
Conti, I.M.M. Dissertação N° 208 Julho/2018
UFRN/CCET/PPGG – Dissertação de Mestrado Capítulo IV – Artigo
página 50
Figure 7: Crossplot of the normalized Instantaneous Amplitude (NIA) and Frequency
(NIF) attributes, showing the two clusters of altered (a) and non-altered (b) carbonate
populations.
Figure 8: Correlation between porosity ( in %) and relative dielectric permittivity ( r) of
the non-altered (green) and altered (purple) carbonate rock samples.
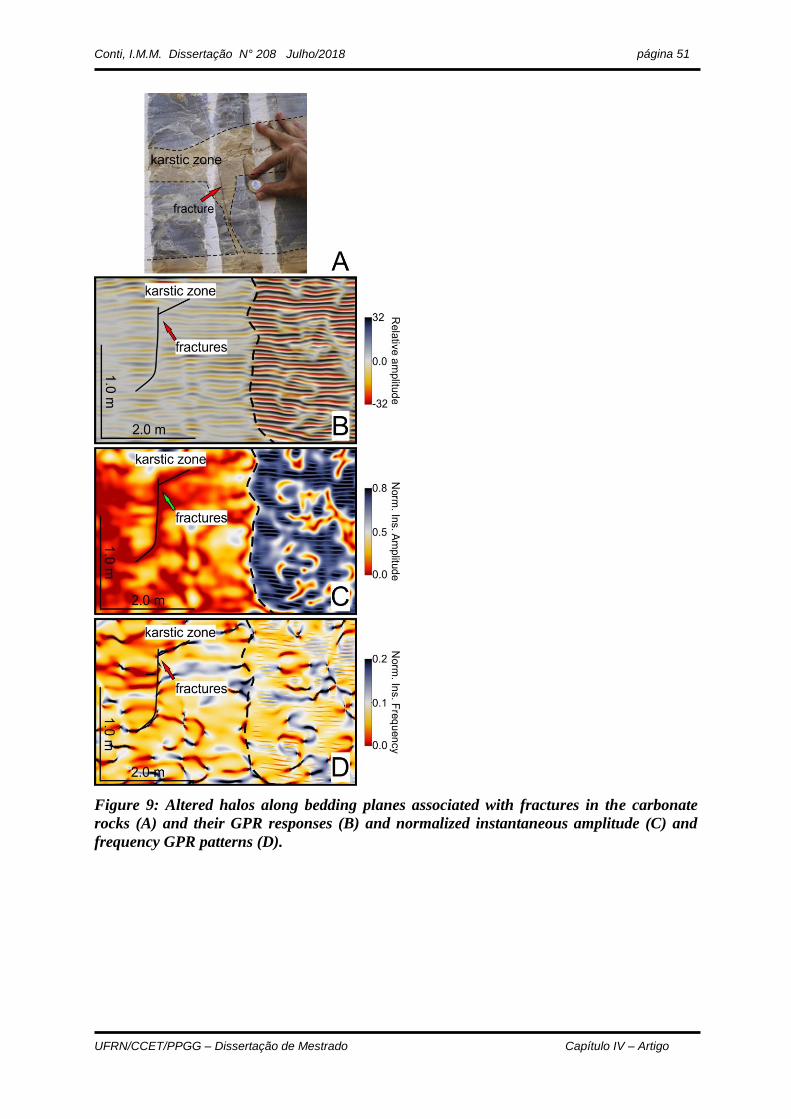
Conti, I.M.M. Dissertação N° 208 Julho/2018
UFRN/CCET/PPGG – Dissertação de Mestrado Capítulo IV – Artigo
página 51
Figure 9: Altered halos along bedding planes associated with fractures in the carbonate
rocks (A) and their GPR responses (B) and normalized instantaneous amplitude (C) and
frequency GPR patterns (D).
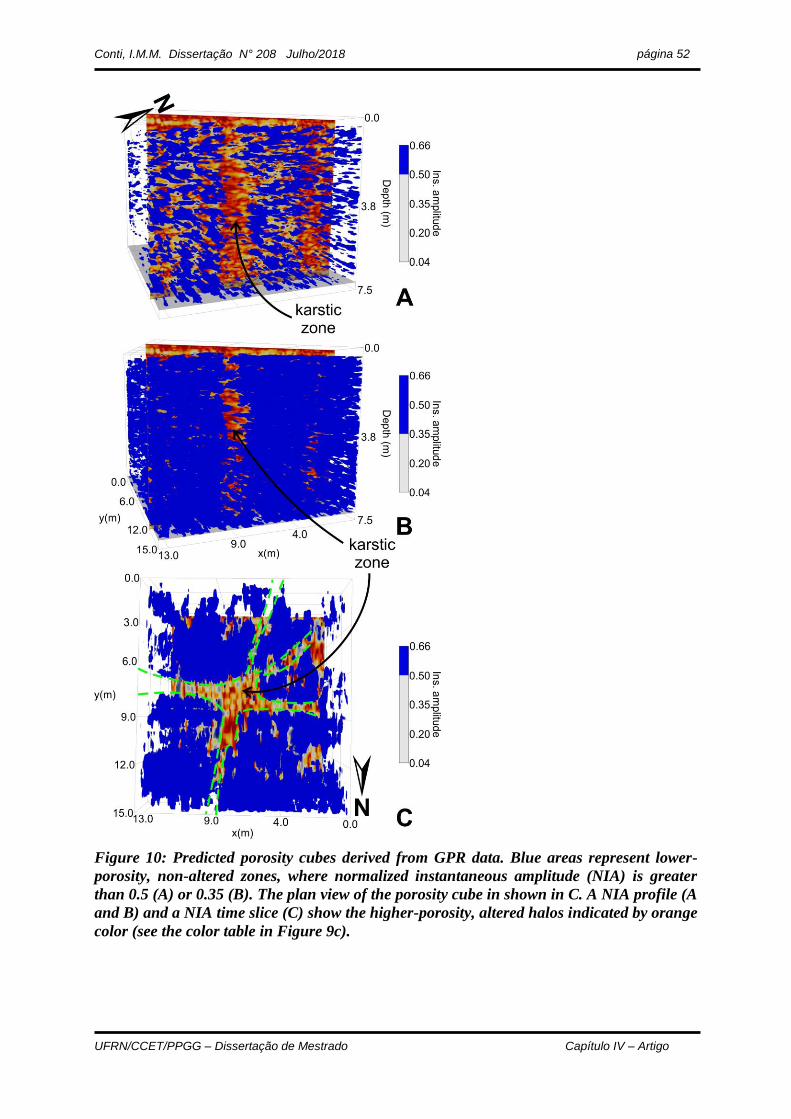
Conti, I.M.M. Dissertação N° 208 Julho/2018
UFRN/CCET/PPGG – Dissertação de Mestrado Capítulo IV – Artigo
página 52
Figure 10: Predicted porosity cubes derived from GPR data. Blue areas represent lower-
porosity, non-altered zones, where normalized instantaneous amplitude (NIA) is greater
than 0.5 (A) or 0.35 (B). The plan view of the porosity cube in shown in C. A NIA profile (A
and B) and a NIA time slice (C) show the higher-porosity, altered halos indicated by orange
color (see the color table in Figure 9c).
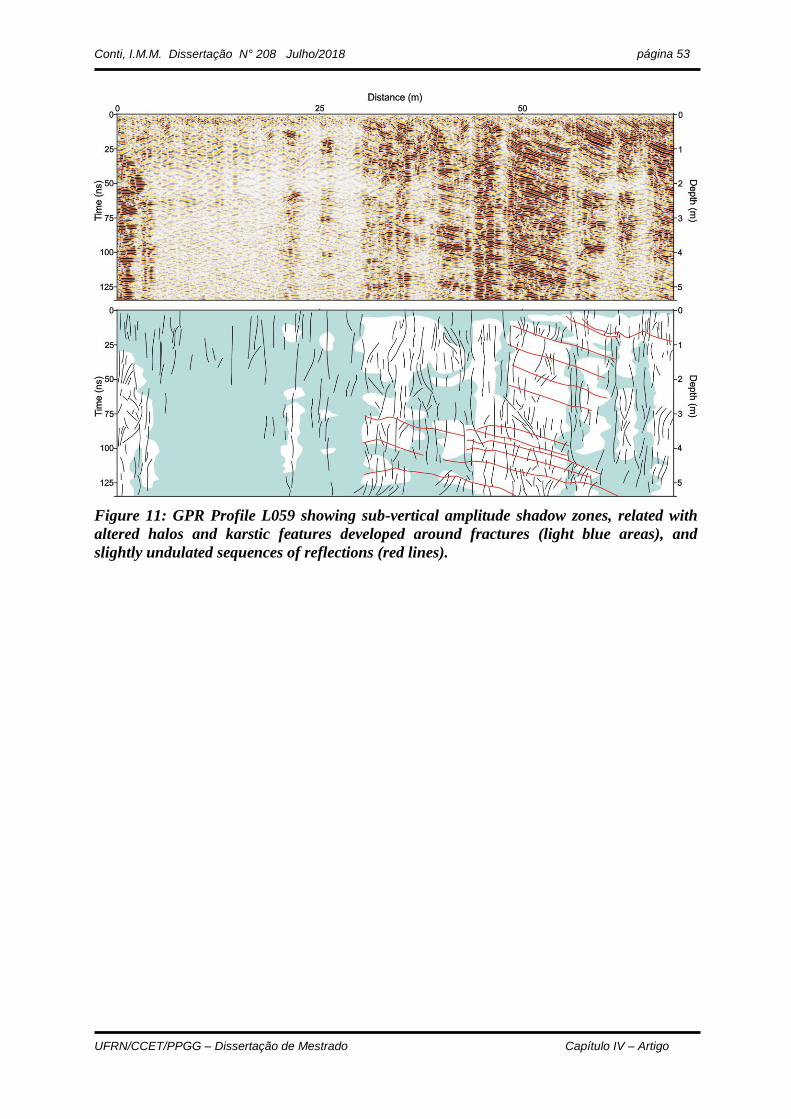
Conti, I.M.M. Dissertação N° 208 Julho/2018
UFRN/CCET/PPGG – Dissertação de Mestrado Capítulo IV – Artigo
página 53
Figure 11: GPR Profile L059 showing sub-vertical amplitude shadow zones, related with
altered halos and karstic features developed around fractures (light blue areas), and
slightly undulated sequences of reflections (red lines).

Conti, I.M.M. Dissertação N° 208 Julho/2018
UFRN/CCET/PPGG – Dissertação de Mestrado Capítulo IV – Artigo
página 54
Figure 12: Schematic representation of the carbonate quarry showing four zones with
enhanced porosity by fracturing and dissolution (description in the text).
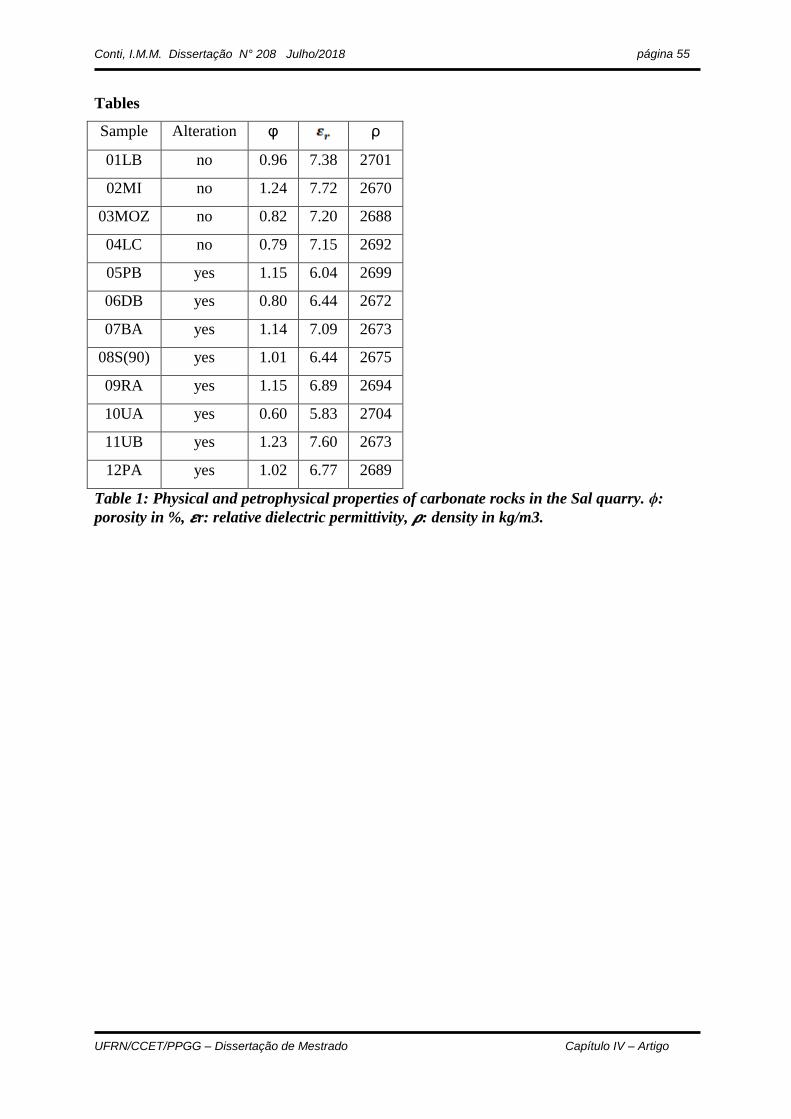
Conti, I.M.M. Dissertação N° 208 Julho/2018
UFRN/CCET/PPGG – Dissertação de Mestrado Capítulo IV – Artigo
página 55
Tables
Sample Alteration φ ρ
01LB no 0.96 7.38 2701
02MI no 1.24 7.72 2670
03MOZ no 0.82 7.20 2688
04LC no 0.79 7.15 2692
05PB yes 1.15 6.04 2699
06DB yes 0.80 6.44 2672
07BA yes 1.14 7.09 2673
08S(90) yes 1.01 6.44 2675
09RA yes 1.15 6.89 2694
10UA yes 0.60 5.83 2704
11UB yes 1.23 7.60 2673
12PA yes 1.02 6.77 2689
Table 1: Physical and petrophysical properties of carbonate rocks in the Sal quarry. ϕ:
porosity in %, 𝜺r: relative dielectric permittivity, 𝝆: density in kg/m3.
UFRN/CCET/PPGG – Dissertação de Mestrado Capítulo V – Conclusões
Capítulo V – Conclusões
Neste trabalho, utilizamos atributos GPR para caracterizar a distribuição da
porosidade estimada em rochas carbonáticas fraturadas e carstificadas da
Formação Salitre no Cráton São Francisco. As rochas carbonáticas que afloram na
Pedreira Sal na região de Laje do Negros (norte da Bahia), correspondem a unidade
estratigráfica mais superior (Fácies 7), que, por sua vez, representa o nível
espeleoestratigráfico superior do sistema de cavernas Toca da Boa Vista e Toca da
Barriguda. Zonas de baixa amplitude nas seções GPR estão associadas as rochas
carbonáticas alteradas (cor bege) ao redor de fraturas sub-verticais. Os atributos de
amplitude instantânea e frequência instantânea realçaram os padrões de reflexão
GPR nas zonas alteradas e não alteradas, permitindo o mapeamento da geometria
interna do análogo de reservatório. As medidas realizadas nas amostras de rochas
indicam que os valores de permissividade dielétrica relativa diminuíram e a
porosidade aumentou de forma linear. Essa diminuição de permissividade afetou o
sinal GPR, o que permitiu estimar a porosidade e caracterizar sua distribuição 3D
nas zonas cársticas. Usando o Modelo de Índice de Refração Complexo (CRIM), foi
calculada a porosidade prevista a partir da permissividade dielétrica relativa derivada
da velocidade estimada de dados GPR. Os valores obtidos para rochas não
alteradas e alteradas são consistentes com a porosidade média medidas nas
amostras de rocha. Isso mostra que a estimativa de porosidade com base nos dados
GPR representara uma distribuição de porosidade muito satisfatória. As zonas de
dissolução mineral vistas nas seções GPR nas direções ~ NNE-SSW e E-W são
semelhantes às tendências regionais de faturamento. Os volumes GPR fornecem
uma estimativa da distribuição espacial da porosidade em escala de afloramento que
pode ser utilizada para a caracterização de reservatórios de carbonáticos.
Para pesquisas futuras, sugere-se que as medidas petrofísicas sejam
expandidas para escalas maiores, como furos de sondagem. Também é importante
obter uma análise de velocidade com maior precisão para gerar um volume de
porosidade estimada mais acurado, assim como, realizar uma análise de atributos
com base em medidas de porosidade de amostras de subsuperfície. Desta forma,

Conti, I.M.M. Dissertação N° 208 Julho/2018
UFRN/CCET – Dissertação de Mestrado Capítulo V – Conclusões
página 57
haverá uma melhor calibração dos dados a fim de se obter uma estimativa de
volume de porosidade preciso para a exploração de reservatórios.

UFRN/CCET/PPGG – Dissertação de Mestrado Referências
Referências
AHR W.M. 2008. Geology of carbonate reservoirs: The identification.
Description, and Characterization of Hydrocarbon Reservoirs. New Jersey: Wiley.
AL-FARES W., BAKALOWICZ M., GUÉRIN R., DUKHAN M. 2002. Analysis of
the karst aquifer structure of the Lamalou area (Hérault, France) with ground
penetrating radar. Journal of Applied Geophysics, 51: 97-106.
ALKMIM F. F. 2004. O que faz de um cráton um cráton? O Cráton do São
Francisco e as revelações almeidianas ao delimitá-lo. In: Mantesso-Neto V.,
Bartorelli A., Carneiro C. D. R, Brito-Neves B. B. (org.) Geologia do Continente Sul
Americano: Evolução da obra de Fernando Flávio Marques de Almeida. Beca, p.17-
35.
ALMEIDA F.F.M. 1967. Origem e evolução da plataforma brasileira. Rio de
Janeiro, DNPM – DGM, Boletim, 241, 36p.
ALMEIDA F.F.M. 1969. Diferenciação tectônica da plataforma brasileira. In:
SBG, Congr. Bras. Geol., 23, Salvador, Anais: 29 – 46.
ALMEIDA F.F.M. 1677. O Cráton do São Francisco. Revista brasileira de
geociências. 7: 349-364.
ALSHARAHI G., DRIOUACH A., FAIZE A. 2016. Performance of GPR
Influenced by Electrical Conductivity and Dielectric Constant. Procedia Technology,
22: 570-575.
ARCHIE G.E. 1950. Introduction to petrophysics of reservoir rocks. AAPG
Bulletin, 34: 943-961.
BARBOSA J.S.F., SABATÉ P., MARINHO M.M. 2003. O Cráton do São
Francisco na Bahia: uma síntese. Revista brasileira de geociências. 33: 3-6.

Conti, I.M.M. Dissertação N° 208 Julho/2018
UFRN/CCET/PPGG – Dissertação de Mestrado Referências
BIRCHAK J.R., GARDNER C.G., HIPP J.E., VICTOR J.M. 1974. High
dielectric constant microwave probes for sensing soil moisture. Proc.IEEE, 62: 93-98.
BRITO NEVES B.B., SANTOS E.J. VAN SCHMUS W.R. 2000. Tectonic
history of the Borborema province. In: U.G. Cordani; E.J. Milani; A Thomaz Filho;
D.A. Campos (eds.) Tectonic Evolution of the South America. 31st International
Geological Congress, 2000, Rio de Janeiro, Brasil, pp. 151 – 182.
CHOPRA S., MARFURT K.J. 2005. Seismic attributes - A historical
perspective. GEOPHYSICS, 70: 5.
CORBEANU R., MCMECHAN G.A., SZERBIAK R. AND SOEGAARD K. 2002.
Prediction of 3D fluid permeability and mudstone distributions from ground-
penetrating radar (GPR) attributes: Example from the Cretaceous Ferron Sandstone
Member, east-central Utah. Geophysics, 67: 1495–1504.
EHRLICH P. 1953. Dielectric properties of Teflon from room temperature to
314° C and from frequencies of 102 to 105 c/s. Journal of Research of the National.
Bureau of Standards, 51(4): 185-188.
ENNES-SILVA R.A., BEZERRA F.H.R., NOGUEIRA F.C.C., BALSAMO F.,
KLIMCHOUK A., CAZARIN C.L., AULER A.S. 2016. Superposed folding and
associated fracturing influence hypogene karst development in Neoproterozoic
carbonates, São Francisco Craton, Brazil. Tectonophysics, 666: 244-259.
FERNANDES A.L. 2014. Interpretação de imagens de GPR em ambiente
cárstico guiada por comparação com afloramentos e imagens de veículo aéreo não
tripulado. Dissertação (Mestrado em Geodinâmica; Geofísica) Universidade Federal
do Rio Grande do Norte, Natal, 2014. 71 p.
FORTE E., PIPAN M. 2017. Review of multi-offset GPR applications: Data
acquisition, processing and analysis. Signal Processing, 132: 210-220.
GUIMARÃES J. T., DOMINGUEZ J. M. L. 1995. Caracterização faciológica da
Formação Bebedouro (Proterozóico Superior) no Estado da Bahia. In: SIMPÓSIO
DE GEOLOGIA DE MINAS GERAIS, 8, 1995, Diamantina. Anais... Diamantina: SBG

Conti, I.M.M. Dissertação N° 208 Julho/2018
UFRN/CCET/PPGG – Dissertação de Mestrado Referências
- Núcleo Minas Gerais, Instituto de Geociências da UFMG, (Boletim, 13) 148p. il. p.
107-108.
INDA H.A.V., BARBOSA J.S.F. 1978. Geologia da Bahia. Texto explicativo
para o mapa geológico ao milionésimo. SICM/SGM, Salvador, 137 p.
JESUS T.E.S., REIS JR J.A., CASTRO D.L., LIMA-FILHO F.P. 2012.
Imageamento digital de paleocavernas colapsadas com ground penetrating radar.
Geologia USP, Série científica, São Paulo, 12 (3): 71-84.
JOL H.M. 2009. Ground penetrating radar: Theory and applications. First
edition. Elsevier Sciences, 524 p.
KEAREY P, HILL I. 2009. Geofísica de exploração. Tradução: Maria Cristina
Moreira Coelho. São Paulo: Oficina de Textos.
KLIMCHOUK A., AULER A.S., BEZERRA F.H.R., CAZARIN C.L., BALSAMO
F., DUBLYANSKY Y. 2016. Hypogenic origin, geologic controls and functional
organization of a giant cave system in Precambrian carbonates, Brazil.
Geomorphology, 253: 385-405.
LEÃO Z.M.A.N., DOMINGUEZ J.M.L. 1992. Plataformas carbonáticas Pré-
Cambrianas: o exemplo da Formação Salitre, Proterozóico Superior, estado da
Bahia. Revista brasileira de geociências. 22: 407-421.
MOUNT G.J., COMAS X. 2014. Estimating porosity and solid dielectric
permittivity in the Miami Limestone using high‐frequency ground penetrating radar
(GPR) measurements at the laboratory scale. Water Resources Research, 50: 7590–
7605.
MOUNT G.J., COMAS X. AND CUNNINGHAM K.J. 2014. Characterization of
the porosity distribution in the upper part of the karst Biscayne aquifer using common
offset ground penetrating radar, Everglades National Park, Florida. Journal of
Hydrology, 515: 223–236.
MOUTINHO DA COSTA L.A. & INDA H.A. V. 1982. O Aulacógeno do
Espinhaço. Ciências da Terra, 2:13-18.
Conti, I.M.M. Dissertação N° 208 Julho/2018
UFRN/CCET/PPGG – Dissertação de Mestrado Referências
MURRAY R.C. 1960. Origin of porosity in carbonate rocks. Journal of
Sedimentary Petrology, 30: 59-84.
OLIVEIRA J.G. 2001. Dois testes de imageamento com GPR em problemas
de controle ambiental em regiões tropicais: migração de dunas e localização de
dutos de óleo enterrados. Dissertação (Mestrado em Geodinâmica; Geofísica) -
Universidade Federal do Rio Grande do Norte, Natal, 2001. 95 p.
OVERMEEREN R.A. Radar facies of unconsolidated sediments in The
Netherlands: A radar stratigraphy interpretation method for hydrogeology. 1998.
Journal of Applied Geophysics, 40: 1-18.
PEDREIRA A.J., ROCHA A.J.D., GUIMARÃES J.T., BOMFIM L.F.C., MORAIS
FILHO J.C., MOTTA A.C. 1985. Projeto Bacia de Irecê: Relatório da Etapa I, Volume
I. Salvador: CPRM.
REPPERT P.M., MORGAN F.D., TOKSÖZ M.N. 2000. Dielectric constant
determination using ground-penetrating radar reflection coefficients. Journal of
Applied Geophysics, 43:189-197.
REYNOLDS JM. 1997. An introduction to applied and environmental
geophysics. New York : John Wiley.
SANDMEIER KJ. 2000. REFLEXW Version 6.0, Windows 9x/2000/NT.
Program for the processing of seismic, acoustic or eletromagnetic reflection,
refraction and transmission data. Germany. 272 p.
SANTOS C.P.M. 2016. Petrologia das fraturas associadas a feições típicas de
dissolução hipogênica na Formação Salitre, bacia de Irecê, Bahia, Brasil.
Dissertação (Mestrado em Ciência e Engenharia do Petróleo) Universidade Federal
do Rio Grande do Norte, Natal, 2016. 469 p.
SCHLUMBERGER. Annual report, p.13, 2009.
SCHÖN J.H. Tradução Edson Furmankiewicz. 2014. Propriedades físicas das
rochas aplicadas à engenharia: fundamentos teóricos e práticos. Rio de Janeiro:
Editora Elsevier.
Conti, I.M.M. Dissertação N° 208 Julho/2018
UFRN/CCET/PPGG – Dissertação de Mestrado Referências
SUGUIO K. Geologia sedimentar. 2003. São Paulo: Editora Blucher.
USSAMI N. 1993. Estudos Geofísicos no Cráton do São Francisco: estágio
atual e perspectivas. In: J.M.L. Dominguez & A. Missi (eds.). In: SBG. Simp. Cráton
do São Francisco, 2, Salvador, Bahia, Brasil. SBG/SGM/CNPq, Spec. Psubl, 35-62.
WYLLIE M.R.J., GREGORY A.R. 1953. Formation Factors of Unconsolidated
Porous Media: Influence of Particle Shape and Effect of Cementation. Society of
Petroleum Engineers, 198: 103 – 110.
XAVIER NETO P. 2006. Processamento e interpretação de dados 2D e 3D de
GPR: aplicações no imageamento de feições kársticas e estruturas de dissolução no
campo de petróleo de Fazenda Belém-CE. Tese (Doutorado em Geodinâmica;
Geofísica) - Universidade Federal do Rio Grande do Norte, Natal, 2006. 191 p.
YANG S. Fundamentals of Petrophysics (Second Edition). 2017. Beijing:
Editora Springer Geophysics.
ZHAO W., FORTE E., PIPAN M., TIAN G. 2013. Ground Penetrating Radar
(GPR) attribute analysis for archaeological prospection. Journal of Applied
Geophysics, 97: 107-117.