geoquimica hidrotermal del campo geotermico de … · 200 que presenta el fndice mas alto de esta...
TRANSCRIPT
GEOQUIMICA HIDROTERMAL DEL CAMPO GEOTERMICO DE CERRO PRIETO
J. J. Fausto L., A. Sanchez A., M. E. Jimenez S., I. Esquer P. y F. Ulloa H. Comisi6n Federal de Electricidad Coordinadora Ejecutiva de Cerro Prieto Mexicali, B. C.
RESUMEN
La planta geotermica de Cerro Prieto tiene, en la actuali·
dad, 150000 kW de capacidad y cuenta con cuatro unida· des turbogeneradoras de 37500 kW cada una. Diecinueve pozos geotermicos abastecen a las unidades 1 y 2, 8 pozos abastecen a las unidades 3 y 4 y otros 3 estan pendientes de entrar en operacion. Se han terminado, adem as, 10 pozos, de un total de 22, que al imentaran a las unidades de otra planta denominada Cerro Prieto II.
En el presente trabajo se exponen los resultados observados a traves del tiempo, principal mente en los dos ultimos anos, en las variaciones qu fmicas y procesos ffsicos ocurridos en el campo geotermico de Cerro Prieto, . debido a su explotacion.
Se utilizaron los datos de los anal isis qufmicos efectuados en muestras de agua recolectadas en los pozos geotermicos.
Se pretende conocer cual es la distribucion de algunos constituyentes qufmicos en el campo, trazandose sus contornos de distribucion, y con base en esto tratar de interpretar cual ha sido el movimiento de fluidos en el acuffero.
En tablas y figuras se presentcln datos de los constituyentes qufmicos encontrados en los fluidos analizados.
LOCALIZACION DE POZOS GEOTERMICOS
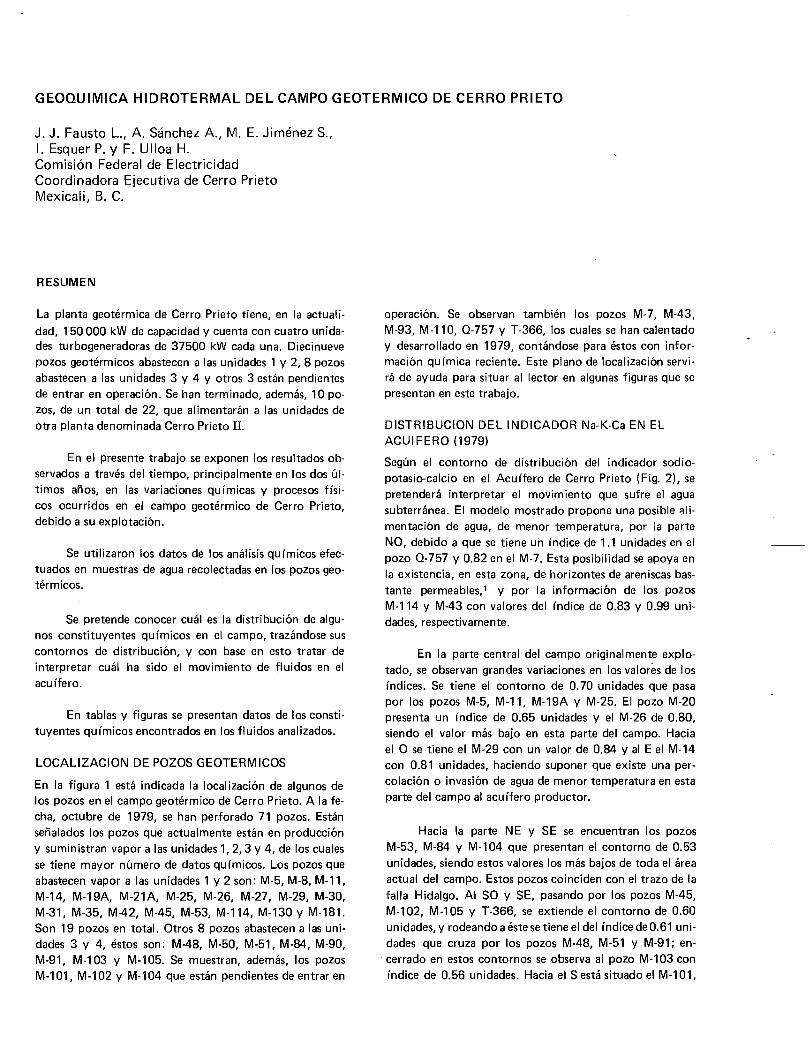
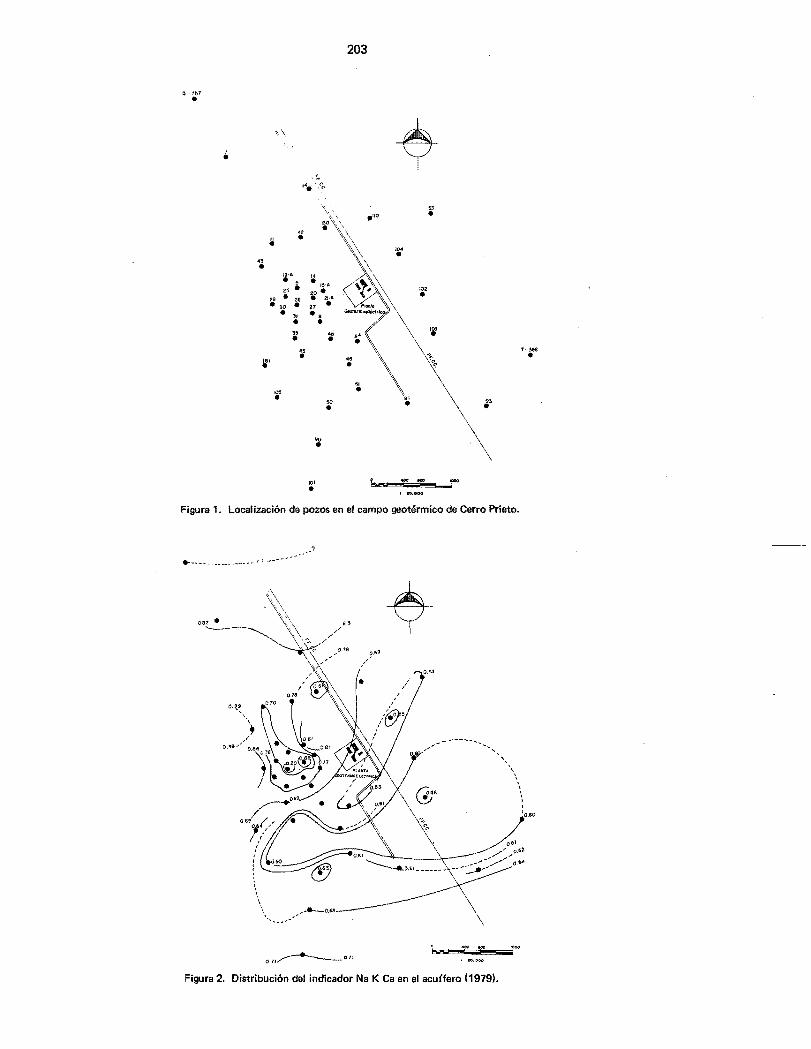
En la figura 1 est a indicada la local izacion de algunos de los pozos en el campo geotermico de Cerro Prieto. A la fecha, octubre de 1979, se han pedorado 71 pozos. Estan senalados los pozos que actual mente estan en produccion y suministran vapor a las unidades 1,2,3 y 4, de los cuales se tiene mayor numero de datos qufmicos. Los pozos que abastecen vapor a las unidades 1 y 2 son: M-5, M-8, M-11, M-14, M-19A, M-21A, M-25, M-26, M-27, M-29, M-30, M-31, M-35, M-42, M-45, M-53, M-114, M-130 y M-181. Son 19 pozos en total. Otros 8 pozos abastecen a las unidades 3 y 4, estos son: M-48, M-50, M-51, M-84, M-90, M-91, M-103 y M-105. Se muestran, ademas, los pozos M-1 01, M-102 y M-104 que estan pendientes de entrar en
operacion. Se observan tambien los pozos M-7, M-43, M-93, M-110, 0-757 y T-366, los cuales se han calentado y desarrollado en 1979, contandose para estos con informacion qufmica reciente. Este plano de localizacion servira de ayuda para situar al lector en algunas figuras que se presentan en este trabajo.
DISTRIBUCION DEL INDICADOR Na-K-Ca EN EL ACUIFERO (1979)
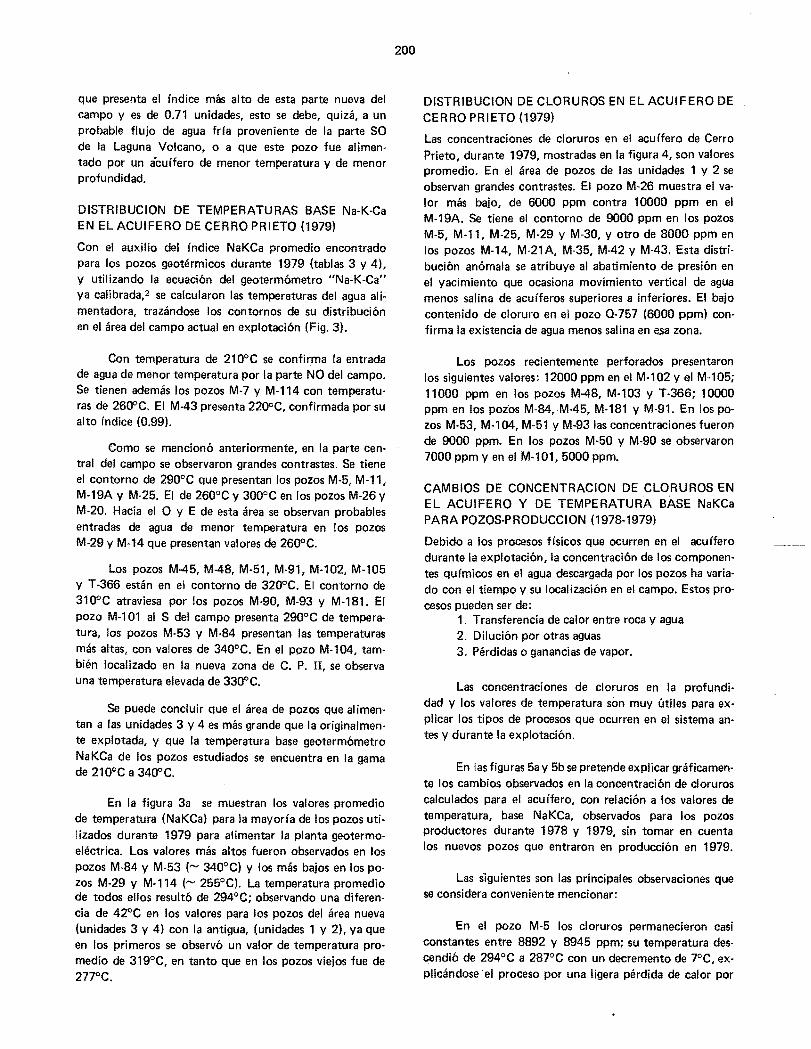
Segun el contorno de distribucion del indicador sodiopotasio-calcio en el Acuffero de Cerro Prieto (Fig. 2), se pretendera interpretar el movimiento que sufre el agua subterranea. EI modelo mostrado propone una posible :=!I imentacion de agua, de menor temperatura, por ia parte NO, debido a que se tiene un fndice de 1.1 unidades en el pozo 0-757 y 0.82 en el M-7. Esta posibilidad se apoya en la existencia, en esta zona, de horizontes de areniscas bastante permeables,l y por la informacion de los pozos M-114 y M-43 con val ores del (ndice de 0.83 y 0.99 unidades, respectivamente.
En la parte central del campo original mente explotado, se observan grandes variaciones en los val ores de los fndices. Se tiene el contorno de 0.70 unidades que pasa por los pozos M-5, M-11, M-19A y M-25. EI pozo M-20 presenta un fndice de 0.65 unidades y el M-26 de 0.80, siendo el valor mas bajo en esta parte del campo. Hacia el 0 se tiene el M-29 con un valor de 0.84 y al Eel M-14 con 0.81 unidades, haciendo suponer que existe una percolacion 0 invasion de agua de menor temperatura en esta parte del campo al acu ffero productor.
Hacia la parte NE y SE se encuentran los pozos M-53, M-84 y M-104 que presentan el contorno de 0.53 unidades, siendo estos val ores los mas bajos de toda el area actual del campo. Estos pozos coinciden con el trazo de la falla Hidalgo. AI SO y SE, pasando por los pozos M-45, M-102, M-105 y T-366, se extiende el contorno de 0.60 unidades, y rodeando a este se tiene el del fndice de 0.61 unidades que cruza por los pozos M-48, M-51 y M-91; encerrado en estos contornos se observa al pozo M-103 con fndice de 0.56 unidades. Hacia el S esta situado el M-101,
200
que presenta el fndice mas alto de esta parte nueva del campo y es de 0.71 unidades, esto se debe, quiza, a un probable flujo de agua frla proveniente de la parte SO de la Laguna Volcano, 0 a que este pozo fue alimentado por un acuifero de menor temperatura y de menor profundidad.
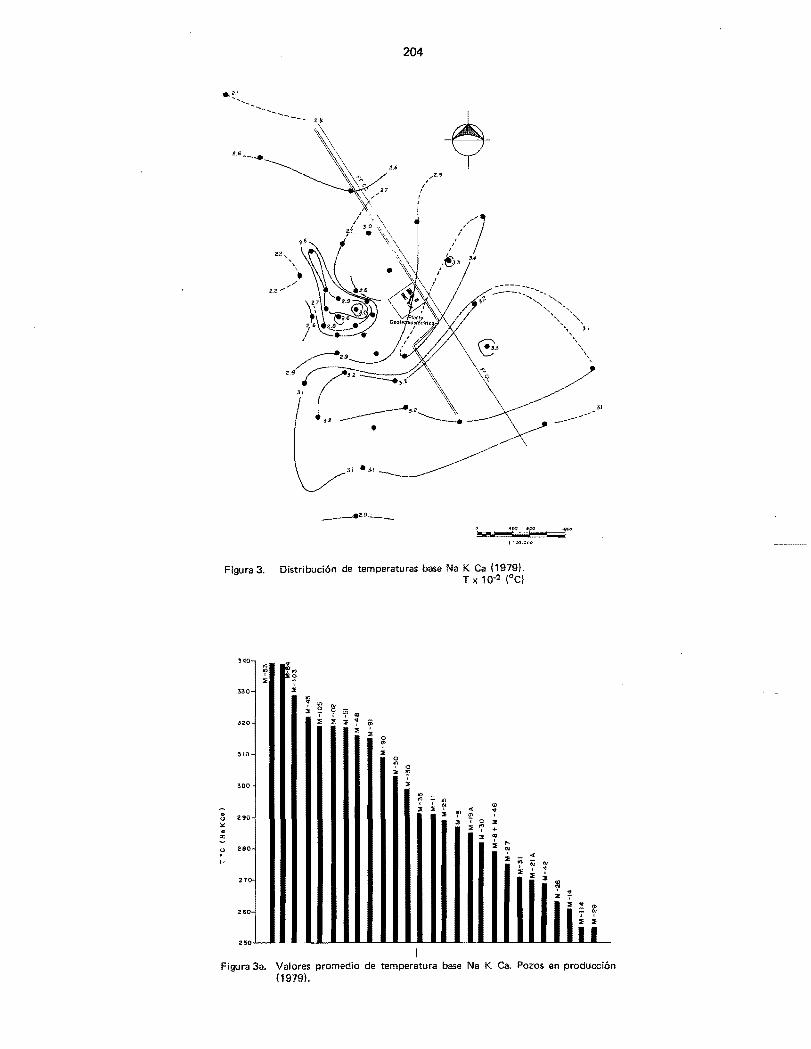
DISTRIBUCION DE TEMPERATURAS BASE Na-K·Ca EN EL ACUIFERO DE CERRO PRIETO (1979)
Con el auxilio del indice NaKCa promedio encontrado para los pozos geotermicos durante 1979 (tablas 3 y 4), y utilizando la ecuacion del geotermometro uNa_K_Ca" ya calibrada,2 se calcularon las temperaturas del agua ali~
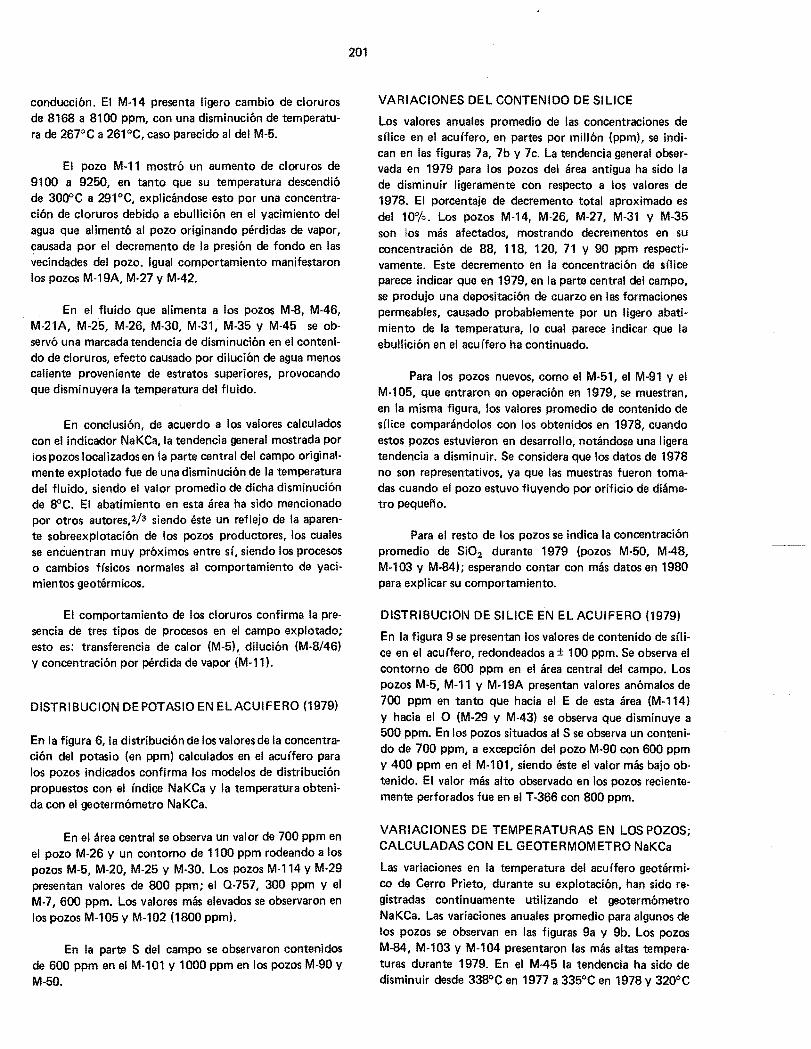
mentadora, trazandose los contornos de su distribucion en el area del campo actual en explotaci6n (Fig. 3).
Con temperatura de 210°C se confirma la entrada de agua de menor temperatura por la parte NO del campo. Se tienen ademas los pozos M-7 y M-114 con temperatu· ras de 2600C. EI M·43 presenta 2200C, confirmada por su alto in dice (0.99).
Como se menciono anteriormente, en la parte cen· tral del campo se observaron grandes contrastes. Se tiene el contorno de 290°C que presentan los pozos M·5, M-ll, M-19A y M-25. EI de 260°C y 300°C en los pozos M-26 Y M-20. Hacia el 0 y E de esta area se observan probables entradas de agua de menor temperatura en los pozos M-29 y M-14 que presentan val ores de 2600C.
Los pozos M·45, M-48, M-51, M-91, M-102, M-l05 y T·366 estan en el contorno de 3200C. EI contorno de 310°C atraviesa por los pozos M-90, M-93 y M-18l. EI pozo M-l0l al S del campo presenta 290°C de temperatura, los pozos M-53 y M-84 presentan las temperaturas mas altas, con valores de 340°C. En el pozo M-l04, tambien localizado en la nueva zona de C. P. II, se observa una temperatura elevada de 330°C.
Se puede concluir que el area de pozos que al imentan a las unidades 3 y 4 es mas grande que la original mente explotada, y que la temperatura base geotermometro NaKCa de los pozos estudiados se encuentra en la gama de 210°C a 340°C.
En la figura 3a se muestran los valores promedio de temperatura (NaKCa) para la mayorfa de los pozos utilizados durante 1979 para atimentar la planta geotermoelectrica. Los valores mas altos fueron observados en los pozos M-84 y M-53 (- 340°C) y los mas bajos en los pozos M-29 y M·114 (- 255°C). La temperatura promedio de todos ellos result6 de 294°C; observando una diferen· cia de 42°C en los valores para los pozos del area nueva (unidades 3 y 4) con la antigua, (unidades 1 y 2), ya que en los primeros se observo un valor de temperatura pro· medio de 319°C, en tanto que en los pozos viejos fue de 277°C.
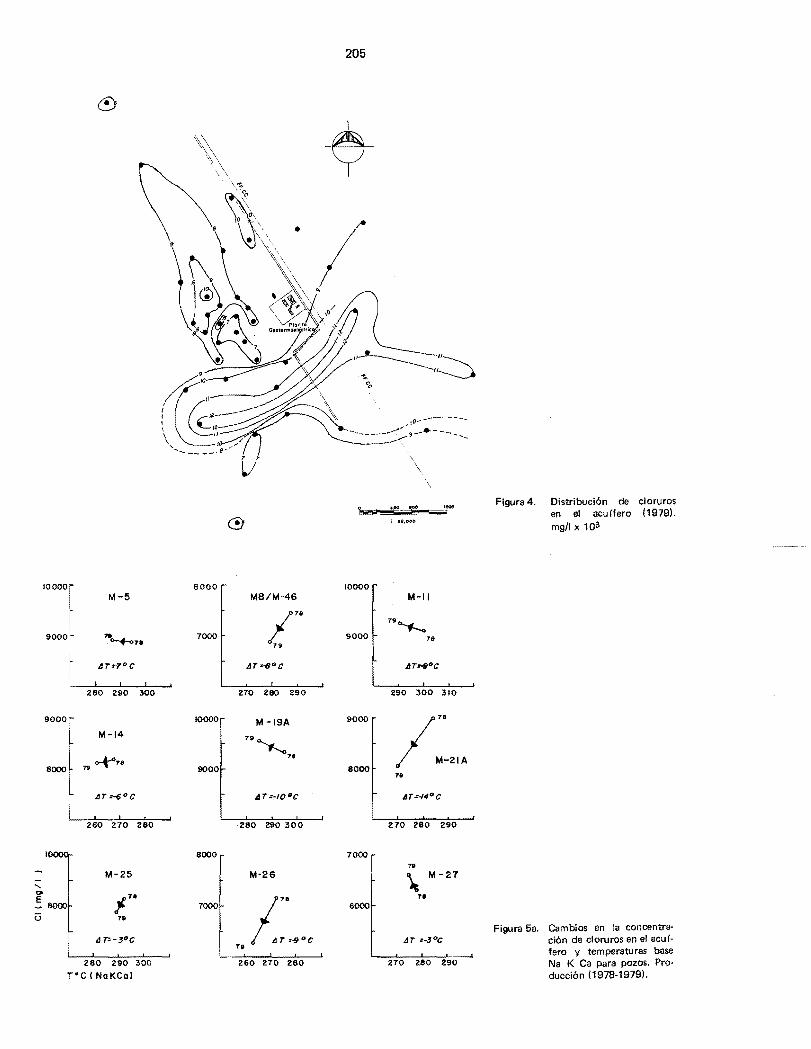
DISTRIBUCION DE CLORUROS EN EL ACUIFERO DE CERRO PRIETO (1979)
Las concentraciones de cloruros en el acuffero de Cerro Prieto, durante 1979, mostradas en la figura 4, son valores promedio. En el area de pozos de las unidades 1 y 2 se observan grandes contrastes. EI pozo M-26 muestra el valor mas bajo, de 6000 ppm contra 10000 ppm en el M-19A. Se tiene el contorno de 9000 ppm en los pozos M-5, M·ll, M·25, M-29 y M-30, Y otro de 8000 ppm en los pozos M·14, M-21A, M-35, M·42 y M·43. Esta distri· bucion an6mala se atribuye al abatimiento de presion en el yacimiento que ocasiona movimiento vertical de agua menos salina de acufferos superiores a inferiores. EI baio contenido de cloruro en el pozo 0-757 (6000 ppm) confirma la existencia de agua menos salina en asa zona.
Los pozos recientemente perforados presentaron los siguientes valores: 12000 ppm en el M·l02 y el M-l05; 11000 ppm en los pozos M·48, M-l03 y T-366; 10000 ppm en los poz"os M-84,M-45, M-181 y M-91. En los pozos M-53, M-l04, M-51 y M-93 las concentraciones fueron de 9000 ppm. En los pozos M-50 y M-90 se observaron 7000 ppm yen el M-101, 5000 ppm.
CAMBIOS DE CONCENTRACION DE CLORUROS EN EL ACUIFERO Y DE TEMPERATURA BASE NaKCa PARA POZOS-PRODUCCION (1978-1979)
Debido a los procesos ffsicos que ocurren en el acu(fero durante la explotaci6n, la concentracion de los componentes quimicos en el agua descargada por los pozos ha variado con el tiempo y su localizaci6n en el campo. Estos procesos pueden ser de:
1. Transferencia de calor entre roca y agua 2. Diluci6n por otras aguas 3. Perdidas 0 ganancias de vapor.
Las concentraciones de cloruros en la profundidad y los valores de temperatura son muy utiles para ex· plicar los tipos de procesos que ocurren en el sistema antes y durante la explotacion.
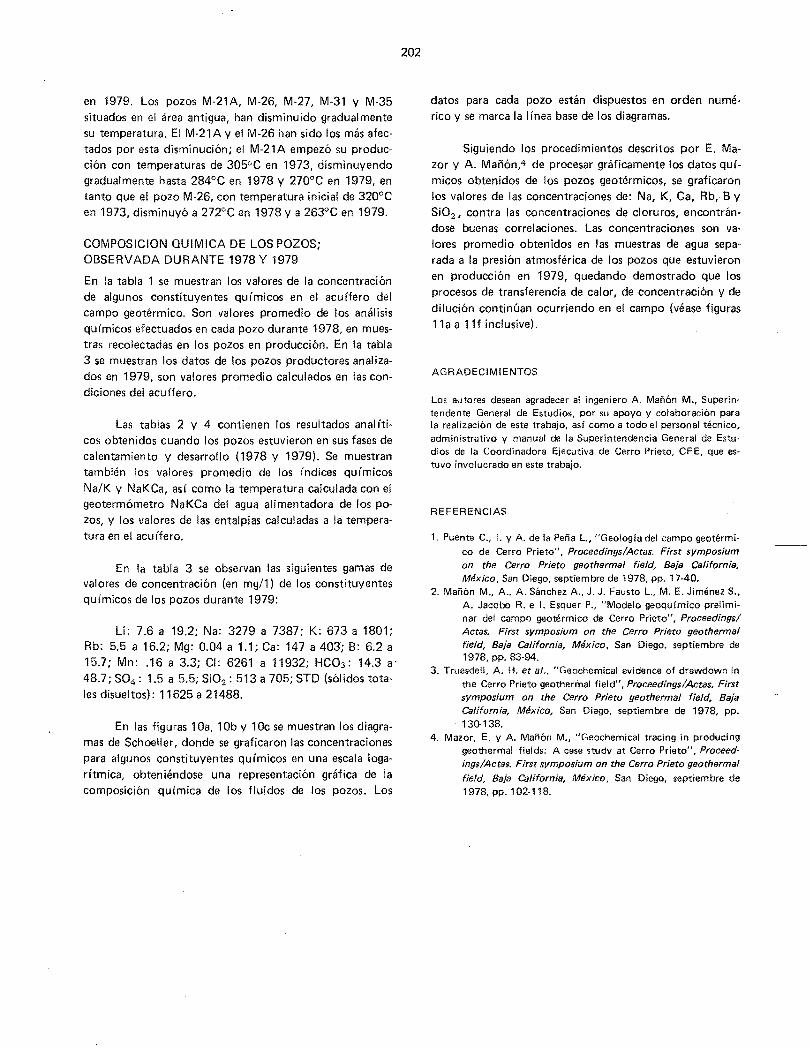
En las figuras 5a y 5b se pretende explicar graficamente los cambios observados en la concentracion de cloruros calculados para el acuifero, con relacion a los valores de temperatura, base NaKCa, observados para los pozos productores durante 1978 y 1979, sin tomar en cuenta los nuevos pozos que entraron en produccion en 1979.
Las slguientes son las principales observaciones que se considera conveniente mencionar:
En el pozo M-5 los cloruros permanecieron casi constantes entre 8892 y 8945 ppm; su temperatura descendio de 294°C a 287°C con un decremento de 7°C, explicandose "el proceso por una ligera perdida de calor por
201
conducci6n. EI M-14 presenta ligero cambio de cloruros de 8168 a 8100 ppm, con una disminuci6n de temperatura de 267"C a 261"C, caso parecido al del M-5.
EI pozo M-1l mostro un aumento de cloruros de 9100 a 9250, en tanto que su temperatura descendio de 300"C a 291°C, explicandose esto por una concentraci6n de cloruros debido a ebullicion en el yacimiento del agua que alimento al pozo originando perdidas de vapor, causada por el decremento de la presion de fonda en las vecindades del pozo. Igual comportamiento manifestaron los pozos M·19A, M·27 y M-42.
En el fluido que alimenta a los pozos M-8, M-46, M-21A, M·25, M·26, M·30, M·31, M·35 y M-45 se observo una marcada tendencia de disminucion en el contenido de cloruros, efecto causado por dilucion de agua menos caliente proveniente de estratos superiores, provocando que disminuyera la temperatura del fluido.
En conclusion, de acuerdo a los val ores calculados con el indicador NaKCa, la tendencia general mostrada por los pozos localizados en la parte central del campo original· mente explotado fue de una disminuci6n de la temperatura del fluido, siendo el valor promedio de dicha disminuci6n de SOC. EI abatimiento en esta area ha sido mencionado por otros autores,zls siendo este un reflejo de la aparente sobreexplotaci6n de los pozos productores, los cuales se encuentran muy proximos entre sl, siendo los procesos o cambios fi'sicos normales al comportamiento de yacimientos geotermicos.
EI comportamiento de los cloruros confirma la presencia de tres tipos de procesos en el campo explotado; esto es: transferencia de calor (M-5), dilucion (M·8/46) y concentracion por perdida de vapor (M·l1).
DISTRIBUCION DEPOTASIO EN ELACUIFERO (1979)
En la figura 6, la distribucion de los valores de la concentracion del potasio (en ppm) calculados en el acu(fero para los pozos indicados confirma los modelos de distribucion propuestos con el {ndice NaKCa y la temperatura obtenida con el geotermometro NaKCa.
En el area central se observa un valor de 700 ppm en el pozo M-26 y un contorno de 1100 ppm rodeando a los pozos M-5, M-20, M-25 y M·30. Los pozos M·114 y M-29 presentan val ores de 800 ppm; el Q·757, 300 ppm y el M·7, 600 ppm. Los val ores mas elevados se observaron en los pozos M·105 y M·102 (1800 ppm).
En la parte S del campo se observaron contenidos de 600 ppm en el M-101 y 1000 ppm en los pozos M-90 Y M-50.
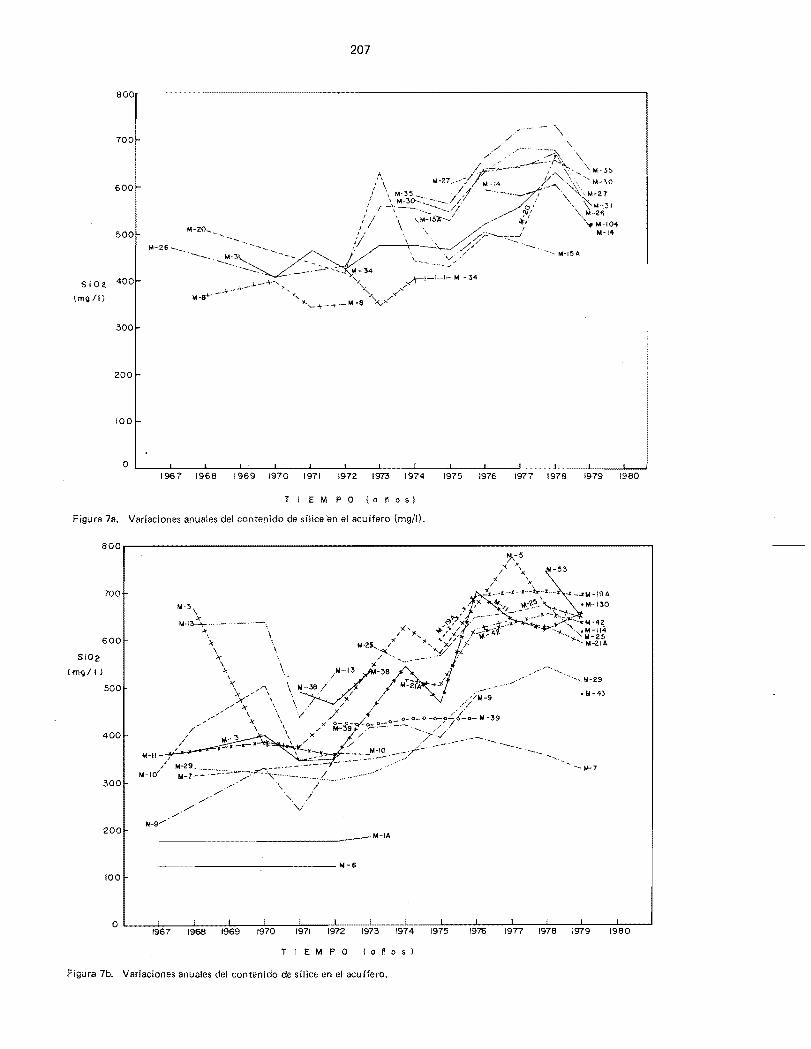
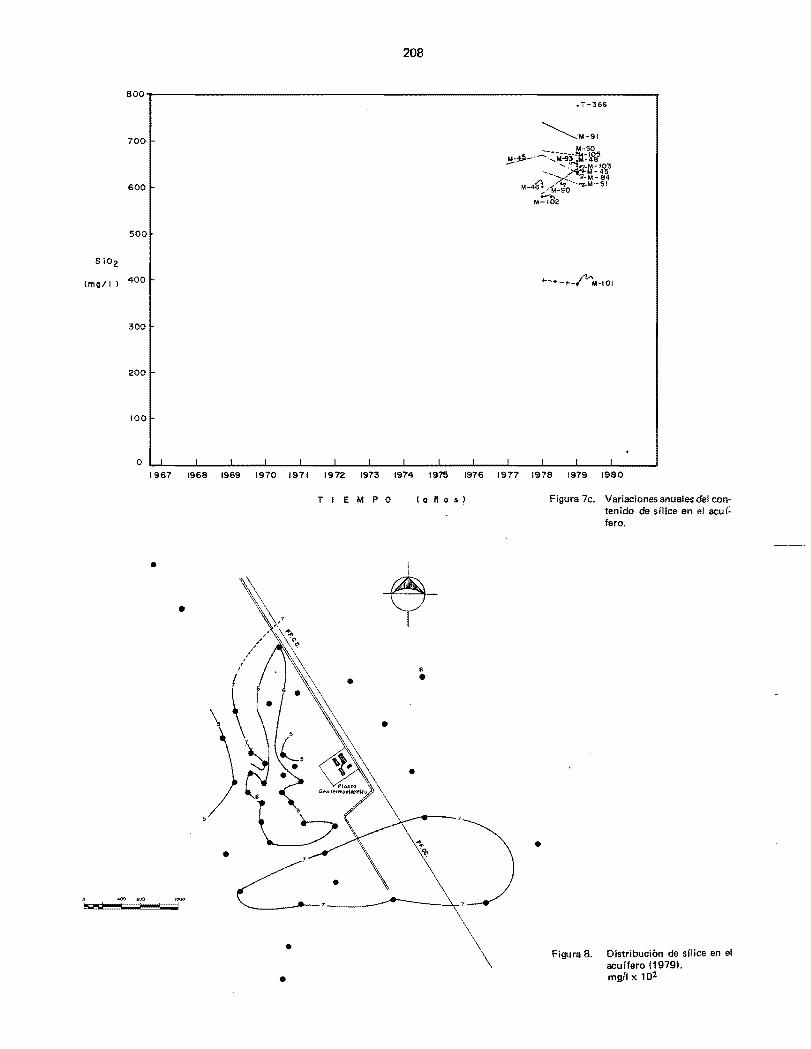
VARIACIONES DEL CONTENIDO DE SILICE
Los valores anuales promedio de las concentraciones de snice en el acu{fero, en partes por millon (ppm), se indican en las figuras 7a, 7b y 7c. La tendencia general observada en 1979 para los pozos del area antigua ha sido la de disminuir ligeramente con respecto a los valores de 1978. EI porcentaje de decremento total aproximado es del 10"/0. Los pozos M-14, M·26, M·27, M-31 y M·35 son los mas afectados, mostrando decrementos en su concentraci6n de 88, 118, 120, 71 y 90 ppm respectivamente. Este decremento en la concentracion de sllice parece indicar que en 1979, en la parte central del campo, se produjo una depositaci6n de cuarzo en las formaciones permeables, causado probablemente por un ligero abatimiento de la temperatura, 10 cual parece indicar que la ebullicion en el acuffero ha continuado.
Para los pozos nuevos, como el M·51, el M-91 y el M·105, que entraron en operacion en 1979, se muestran, en la misma figura, los valores promedio de contenido de sllice comparandolos con los obtenidos en 1978, cuando estos pozos estuvieron en desarrollo, notandose una ligera tendencia a disminuir. Se considera que los datos de 1978 no son representativos, ya que las muestras fueron tomadas cuando el pozo estuvo fluyendo por orificio de diametro pequeno.
Para el resto de los pozos se indica la concentracion promedio de SiOz durante 1979 (pozos M·50, M·48, M-l03 y M·84); esperando contar con mas datos en 1980 para explicar su comportamiento.
DISTRIBUCIOI\I DE SILICE EN EL ACUIFERO (1979)
En la figura 9 se presentan los valores de contenido de sllice en el acu(fero, redondeados a ± 100 ppm. Se observa el contorno de 600 ppm en el area central del campo. Los pozos M·5, M·11 y M·19A presentan valores an6malos de 700 ppm en tanto que hacia el E de esta area (M-114) y hacia el 0 (M·29 y M·43) se observa que disminuye a 500 ppm. En los pozos situados al Sse observa un contenido de 700 ppm, a excepci6n del pozo M-90 con 600 ppm y 400 ppm en el M-l01, siendo este el valor mas bajo obtenido. EI valor mas alto observado en los pozos recientemente perforados fue en el T·366 con 800 ppm.
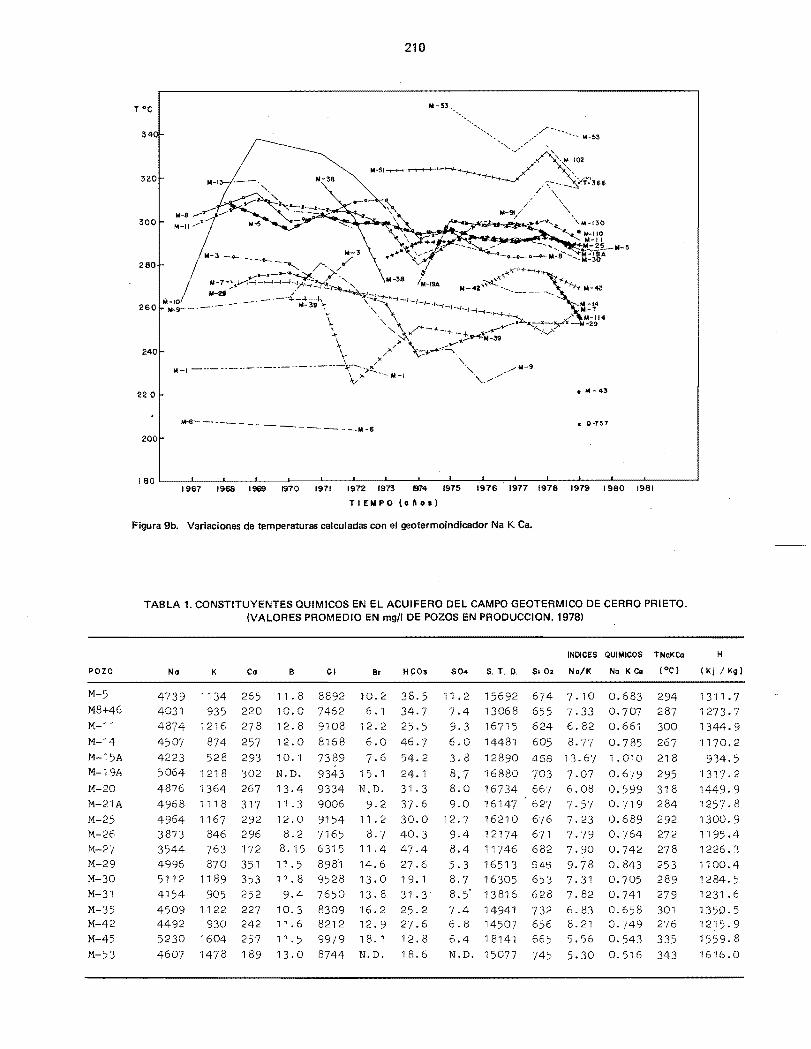
VARIACIONES DE TEMPERATURAS EN LOS POZOS; CALCULADAS CON EL GEOTERMOMETRO NaKCa
Las variaciones en la temperatura del acurfero geotermico de Cerro Prieto, durante su explotacion, han sido registradas continuamente utilizando el geotermometro NaKCa. Las variaciones anuales promedio para algunos de los pozos se observan en las figuras 9a y 9b. Los pozos M-84, M·103 y M-104 presentaron las mas altas temperaturas durante 1979. En el M·45 la tendencia ha sido de disminuir desde 338°C en 1977 a 335°C en 1978 y 320°C
202
en 1979. Los pozos M-21A, M-26, M-27, M-31 y M-35 situ ados en el area antigua, han disminuido gradual mente su temperatura. EI M-21A y el M-26 han sido los mas afectados par esta disminuci6n; el M-21A empezo su produccion con temperaturas de 305°C en 1973, disminuyendo gradual mente hasta 284°C en 1978 y 270°C en 1979, en tanto que el pozo M-26, con temperatura inicial de 320°C en 1973, disminuyo a 272°C en 1978 y a 263°C en 1979.
COIVIPOSICION QUIMICA DE LOS POZOS; OBSERVADA DURANTE 1978 Y 1979
En la tabla 1 se muestran los val ores de la concentracion de algunos constituyentes qufmicos en el aculfero del campo geotEnmico. Son valores promedio de los anal isis quimicos efectuados en cada pozo durante 1978, en muestras recolectadas en los pozos en produccion. En la tabla 3 se muestran los datos de los pozos productores analizados en 1979, son valores promedio calculados en las condiciones del aculfero.
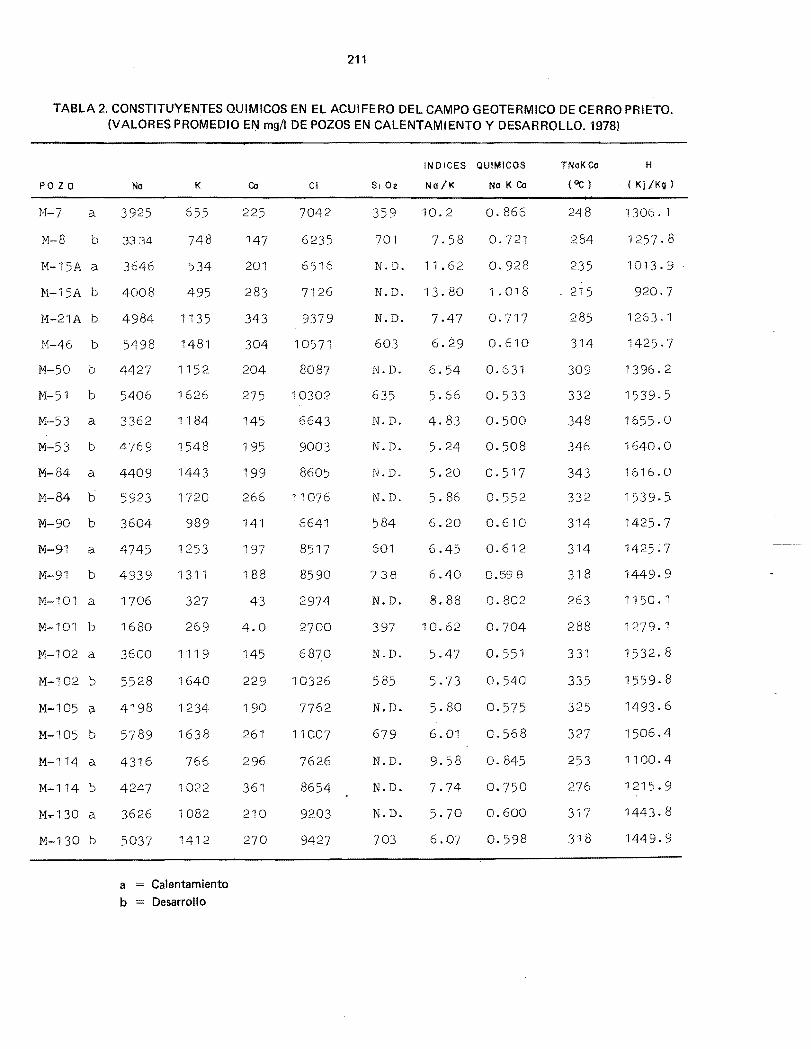
Las tablas 2 y 4 contienen los resultados anallticos obtenidos cuando los pozos estuvieron en sus fases de calentamiento y desarrollo (1978 y 1979). Se muestran tambien los val ores promedio de los Indices qufmicos Na/K y NaKCa, asf como la temperatura calculada con el geotermometro NaKCa del agua alimentadora de los pozos, Y los valores de las entalpias calculadas a la temperatura en el acuifero.
En la tabla 3 se observan las siguientes gamas de valol"es de concentracion (en mg/1) de los constituyentes qufmicos de los pozos durante 1979:
Li: 7.6 a 19.2; Na: 3279 a 7387; K: 673 a 1801; Rb: 5.5 a 16.2; Mg: 0.04 a 1.1; Ca: 147 a 403; B: 6.2 a 15.7; Mn: .16 a 3.3; CI: 6261 a 11932; HC03: 14.3 a' 48.7; S04: 1.5 a 5.5; Si02 : 513 a 705; STD (sol idos totales disueltos): 11625 a 21488.
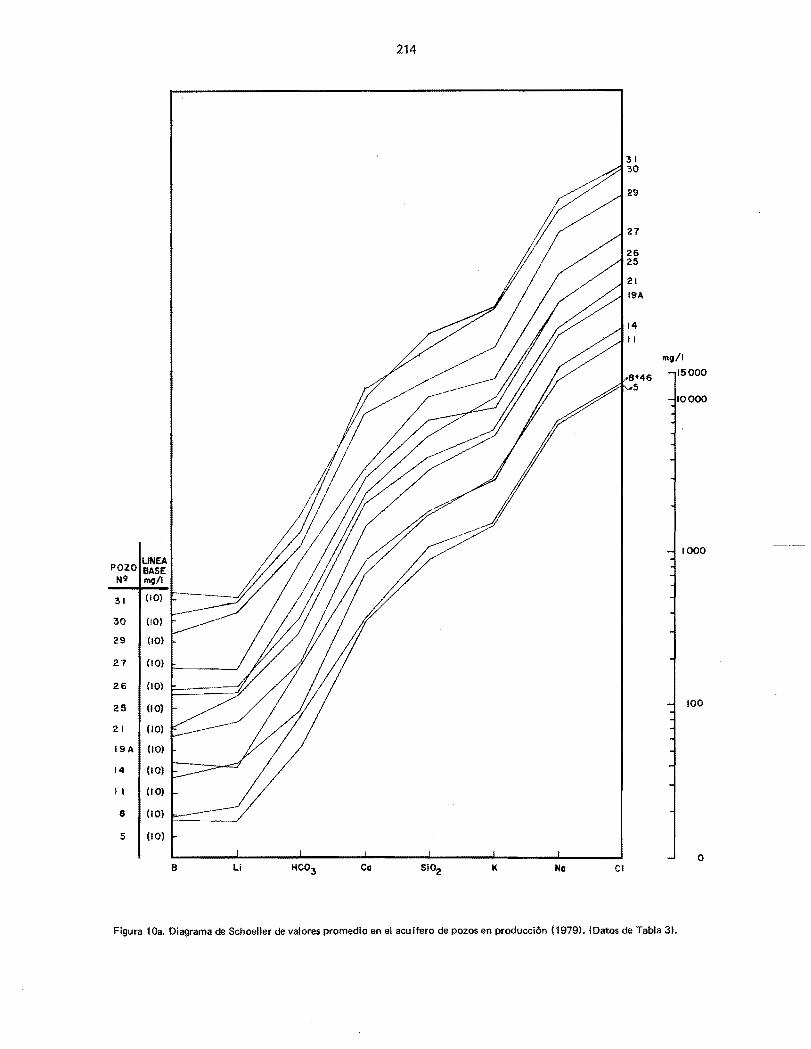
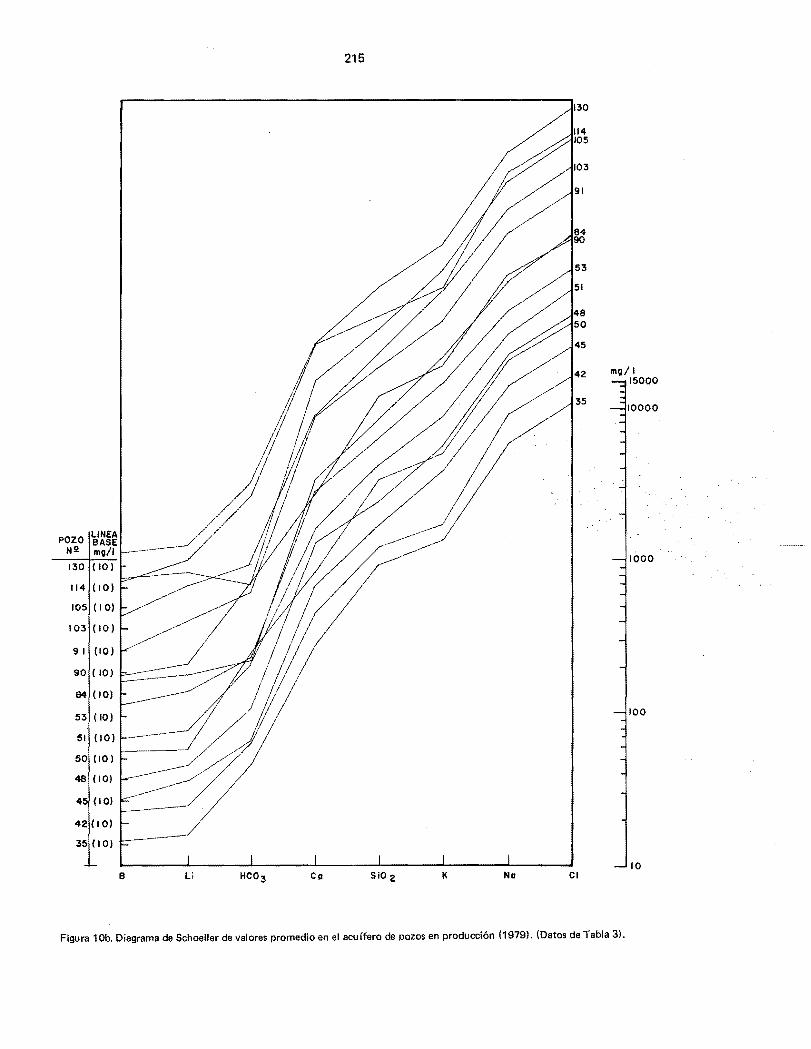
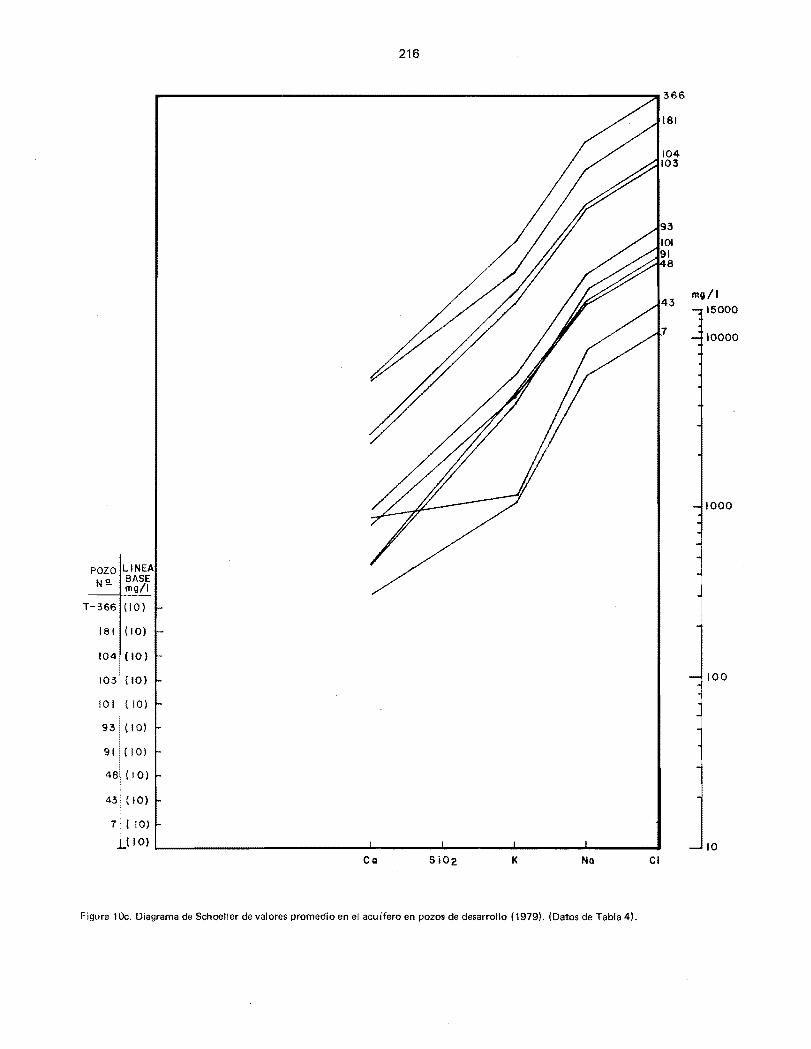
En las figuras 10a, 1 Ob y 10c se muestran los diagra· mas de Schoeller, donde se graficaron las concentraciones para algunos constituyentes qu (micos en una escala logarftmica, obteniendose una representacion grMica de la composicion quimica de los fluidos de los pozos. Los
datos para cada pozo estan dispuestos en orden numerico y se marca la linea base de los diagramas.
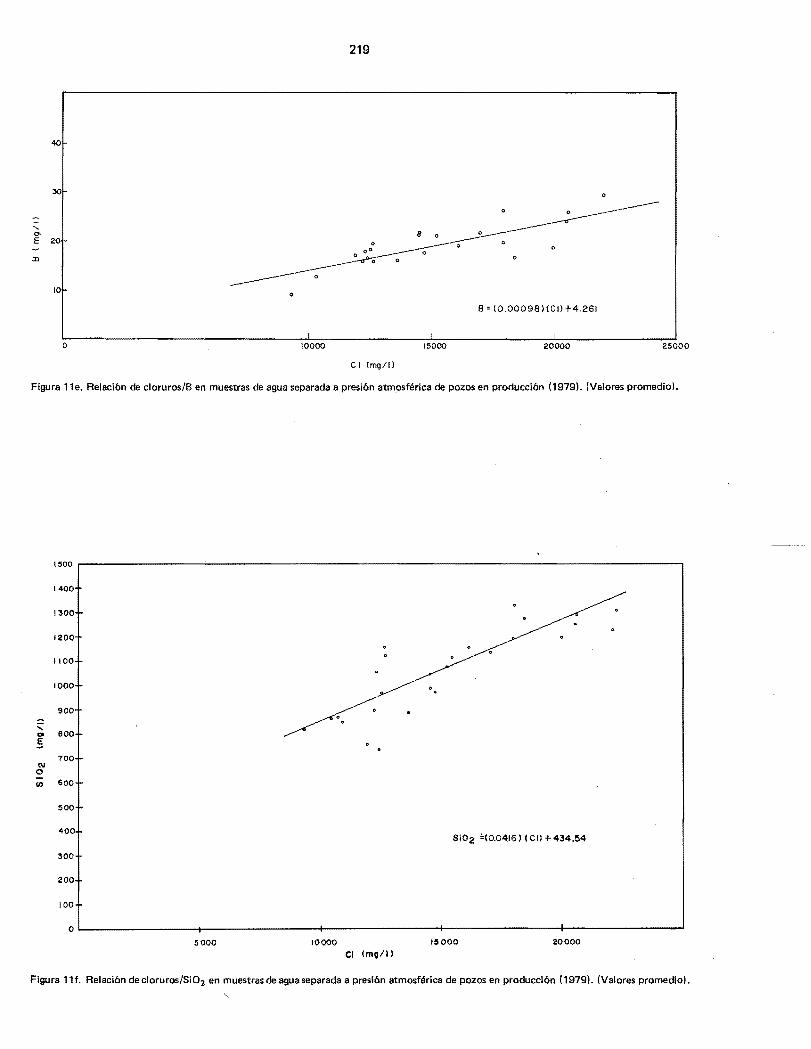
Siguiendo los procedimientos descritos por E. Ma· zor y A. Maf\on,4 de procesar grMicamente los datos qUI' micos obtenidos de los pozos geotermicos, se graficaron los valores de las concentraciones de: Na, K, Ca, Rb, 8 y Si02 , contra las concentraciones de cloruros, encontrandose buenas correlaciones. Las concentraciones son va· lores promedio obtenidos en las muestras de agua separada a la presion atmosferica de los pozos que estuvieron en produccion en 1979, quedando demostrado que los procesos de transferencia de calor, de concentracion y de dilucion continuan ocurriendo en el campo (vease figuras 11 a a 11f inclusive).
AGRADECIMIENTOS
Los autares desean agradecer al ingeniera A. Man6n M., Superintendente General de Estudias, par su apaya y calabaraci6n para la realizacion de este trabajo, asi como a todo el personal tecnico, administrativo y manual de la Superintendencia General de Estudios de la Coordinadora Ejecutiva de Cerro Prieto, CFE, que estuvo involucrado en este trabajo.
REFERENCIAS
1. Puente C., I. y A. de la Pena L., "Geologia del campo geotermico de Cerro Prieto", Proceedings/Aetas. First symposium on the Cerro Prieto geothermal field, Baja California, Mexico, San Diego, septiembre de 1978, pp. 17-40.
2. Manon M., A., A. Sanchez A., J. J. Fausto L., M. E. Jimenez S., A. Jacobo R. e I. Esquer p .. "Modelo geoquimico preliminar del campo geotermico de Cerro Prieto", Proceedings/ Aetas. First symposium on the Cerro Prieto geothermal field, Baja California, Mexico, San Diego, septiembre de 1978, pp. 83·94.
3. Truesdell, A. H. et al., "Geochemical evidence of drawdown in the Cerro Prieto geothermal field", Proceedings/Aetas. First symposium on the Cerro Prieto geothermal field, Baja California, Mexico, San Diego, septiembre de 1978, pp. 130-138.
4. Mazor, E. y A. Manon M., "Geochemical tracing in producing geothermal fields: A case study at Cerro Prieto", Proceedings/Actas. First symposium on the Cerro Prieto geothermal
field, Baja California, Mexico, San Diego, septiembre de 1978, pp. 102·118.
203
Q -151
•
..• '"•
19-1.• •... 2.9 • 2e • 50 •...
•
• 0
•
'04•
53•
'f
T-'"•
•..
,,"• Figura 1. Localizaci6n de pozos en el campo geot~rmico de Cerro Prieto.
06Z •
, to,OOg
Figura 2. Distribuci6n del indicador Na K Ca en el acu(fero (1979).
204
......... "" ..... -.
2.6
•
,/Z.9
/ I,
"-------
Q...,.......:.~-~~
1:$O,<wo
Figura 3. Distribuci6n de temperaturas base Na K Ca (1979).
0
32 0
310
300
~ 290
'". z
28 0
21 0
260
0
'" '? ~~ " ,
" '1 " " 0,. "
'" -.0 '? ..'" " " :l;
T x 10-2 (oC)
" ~
0 ';'
" 0
" '? 0
!!1
" '" ,':' ..'"';' "" " " ~\" !!!
0" " " ':' +
,." '" ,;,
N " N
~ " '"I ':" " " " ~
!
i~ i Figura 3a. Val ores promedio de temperatura base Na K Ca. Pozos en producci6n
( 1979).
••
205
l/ \
Figura 4. Distribuci6n de cloruros ~.~...~~OOO en el acurfero (1979).
I ao,ooo mg/I x 103
10000 M8/M-46M-5 M-II'''''f
8000
/78 79~ 90009000,- 7000 78"'<>-+078
79
AT··r"C AT=-1J°CAT =-e" C
I 1 1 280 290 300 270 280 290 290 300 310
10000 9000M-19A
79~ 78
79
/"M-2IAo-t"u8000 79 9000 8000''''I M-14
AT:-14oCAT~OC AT'.-IOOC
I I I
260 270 280 ·280 290300 270 280 290
8000 7000
\ 7.
M-25 M-26 M -27 ..... 71E ;170 70008000 6000 iJ
'. /." Figura 5a. Cambios en la can centra-
A T=-]oC AT =-3°C ci6n de cloruros en el acurfero y temperatu ras base
AT=.g°C
280 290 300 260 270 280 270 280 290 Na K Ca para pozos. Pro-roc (NaKCal ducci6n (1978-1979).

9000
8000
l!'8"\ M-29
711
IJ T:+20C
250 260 270
10000
9QOO
9000
8000
7000
M-30
/78 711
IJT:-loC
280 290 300
M-42
711"""""78
IJT: -l"C.
260 270 280
206
8000
7000
10
9000
8000
M-31
/7a 78
IJT:-SOC
270 280 290
1.1-45
/7878
AT'~-13"C
320 330 340
IJT: -4"C
330 340 350
•..
Figura 5b. Cambios en la con centraci6n de cloruros en el acu{fero y temperatures base Na K Ca para pozos. Producci6n 11978-1979),
"
.....,...,.---------_.
Figura 6. Distribuci6n de potasio en ¢ el acu{fero (1979). !'l
I to.OQ(J mgtl x 103
_________________
207
800r---------------------------------------------------------------------------,
700
600
500
400SiOa
(mg/lJ M-r--"'
300
200
100
o 1967 1968 1969 1970 1971 1972 1973 1974 1975 1976 1977 1978 1979 1980
TIEMPO (anos)
Figura 7a. Variaciones anuales del contenido de siliceen el acuffero (mg/!).
800r---------------------------------------------------------------------------------~
700
600
Si02
(mll/l)
500
400
--M-II .I , / 101-7
M-!O.... 300
200
------------------------------1.1-6 100
- M-IA
TIEMPO ( a ii 0 S )
Figura 7b. Variaciones anuales del contenido de silice en el acu{fero.
208
800 • T-366
700
600
500
Si02
400(mg/l )
300
200
100
I I I Io 1967 1968 1969 1970 1971 1972 1973 1974 1975 1976 1977 1978 1979 1980
TIEMPO I Q Ii 0 $ ) Figura 7c. Variaciones anuales oel contenido de sllice en el acur: fero .
•
•
•
• Figura 8. Distribuci6n de sflice en el acuifero (1979).
• mgtl x 102

Toe
3401------- ----M·4S····· ...... "_. /~ M-84
M - 84.~..-./ ' M ", 0 M-I04
-lOS '-" ", /M-I03 · ...)/,.x~-181
320 ,/ "":"M-45M-26
__ X ->->- t,," .-100 Moo ~..... \..---'C"x.
/
_ _~./__ H-., ._ ••~" >N-'. )iC., "'\" ..... t--I-/~< " \ "'-~I '1'1" 1,.)(,/,..~'' .......++-+........ ...../ ••-0"..'o(,.lr'" "><'-1
K .-2IA-' --... ..' .-10300 " • '-< .',~ ""'-"_ ,. '. '-. -'.,...~M'"""'-y". -rci 00 \ " M-SO/ '" I 'y
/
); ~)( ,~ ,!o. ! ''y, _ t-- "-. I •••••_-.- ••• _- M - 35
-f--;;!,p...>J.':t'~"-- M-IOJ 280 ~-27 I'":::-~:'>'
I _ ~,-t M- 27M-20 __ I--- '- M-ISA _--
M-34 ///,-, '\~>.;,--'\ --- .-I ~
M-26-"-~. -'-'-'---.' '\260 '-------"'-/ .'''' -~
I\.)
~ "-. _ M-34~,,-
'--..- '"240
",",
220 '\ ISA
200
180 L I I I I I I I I I I 1970 1971 1972 1973 1974 1975 1976 1977 1978 1979 1980
TI EM PO (anos)
Figura 9a. Variaciones de temperaturas calculadas con el geotermoindicador Na K Ca.
210
• M 43220
M-e---_ - - - ____ --11-6 .. 0-751
200
160~__~__-L ~L-__~__-L L- ~__~__~L-~~__~__~~__~__ ~__ __~____ __ ~______
1967 1968 1969 1970 1971 1972 1973 1974 1975 1976 1977 1978 1979 1960 1961
TIEMPO (efte.)
Figura 9b. Variaciones de temperaturas calculadas con el geotermoindicador Na K Ca.
TABLA 1. CONSTITUYENTES QUIMICOS EN EL ACUIFERO DEL CAMPO GEOTERMICO DE CERRO PRIETO. (VALORES PROMEDIO EN mgtl DE POZOS EN PRODUCCION. 1978)
INDICES QUIMICOS TNaKCo H
POZO Na K Ca B CI Br HC03 S04 S. T. D. S. O~ Na/K Na K Co (OC) (Kj I Kg)
M-5 4739 1134 265 11.8 8892 10.2 38.5 11 .2 15692 674 7.10 0.683 294 1311.7 M8+46 4031 935 220 10.0 7462 6.1 34.7 7.4 13068 655 7.33 0.707 287 1273.7 M-ll 4874 1216 278 12.8 9108 12.2 25.5 9.3 16715 624 6.82 0.661 300 1344.9 M-14 4507 874 257 12.0 8.168 6.0 46./ 6.0 14481 605 8.77 0.785 267 1170.2 M-15A 4223 528 293 10.1 7389 7.6 54.2 3.8 12890 458 13.67 1.010 218 934.5 M-19A 5064 1218 302 N.D. 9343 15.1 24.1 8.7 16880 703 7.07 0.679 295 1317.2 M-20 4876 1364 267 13.4 9334 N.D. 31.3 8.0 16734 667 6.08 0.599 318 1449.9 M-21A 4968 1118 317 11.3 9006 9.2 37.6 9.0 16147 627 7.57 0.719 284 1257.8 M-25 4964 1167 292 12.0 9154 11.2 30.0 12.7 16210 676 7.23 0.689 292 1300.9 M-26 3873 846 296 8.2 7165 8.7 40.3 9.4 12174 671 7.79 0.764 272 1195.4 M-27 3544 763 172 8.15 6315 11.4 47.4 8.4 11746 682 7.90 0.742 278 1226.3 M-29 4996 870 351 11.5 8981 14.6 27.6 5.3 16513 545 9.78 0.843 253 1100.4 M-30 5112 1189 353 11. 8 9528 13.0 19.1 8.7 16305 653 7.31 0.705 289 1284.5 M-31 4154 905 252 9.4 7650 13.8 31.3 8.5' 13816 628 7.82 0.741 279 1231.6 M-35 4509 1122 227 10.3 8309 16.2 25.2 7.4 14941 732 6.83 0.658 301 1350.5 M-42 4492 930 242 11.6 8212 12.9 27.6 6.8 14507 656 8.21 0.749 276 1215.9 M-45 5230 1604 257 11. 5 9979 18. 1 12.8 6.4 18141 665 5.56 0.543 335 1559.8
M-53 4607 1478 189 13.0 8744 N.D. 18.6 N.D. 15077 745 5.30 0.516 343 1616.0
211
TABLA 2. CONSTITUYENTES QUIMICOS EN EL ACUIFERO DEL CAMPO GEOTERMICO DE CERRO PRIETO. (VALORES PROMEDIO EN mgtl DE POZOS EN CALENTAMIENTO Y DESARROLLO. 1978)
INDICES QUIMICOS TNaKCp H
PO Z 0 No K Co CI No/K No K Co (OC I ( Kj /KQ)
M-7 a 3925 655 225 7042 359 10.2 0.866 248 1306.1
M-8 b 3334 748 147 6235 701 7.58 0.721 284 1257·8
M-15A a 3646 534 201 6516 N.D. 11.62 0.928 235 1013.9
M-15A b 4008 495 283 7126 N.D. 13.80 1.018 215 920.7
M-21A b 4984 1135 343 9379 N.D. 7.47 0.717 2 1263·1
M-46 b 5498 1481 304 10571 603 6.29 0.610 314 1425·7
M-50 b 4427 1152 204 8087 N.D. 6.54 0.631 309 1396.2
M-51 b 5406 1626 275 10302 635 5.66 0.533 332 1539.5
M-53 a 3362 1184 145 6643 N.D. 4.83 0.500 348 1655·0
M-53 b 4769 1548 195 9003 N.D. 5.24 0.508 346 1640.0
M-84 a 4409 1443 199 8605 N.D. 5.20 0.517 343 1616.0
M-84 b 5923 1720 266 11076 N.D. 5.86 0.552 332 1539.5
M-90 b 3604 989 141 6641 584 6.20 0.610 314 1425·7
M-91 a 4745 1253 197 8517 601 6.45 0.612 314 1425·7
M-91 b 4939 1311 188 90 738 6.40 0.598 318 1449.9
M-101 a 1706 327 43 2974 N.D. 8.88 0.802 263 1150. 1
M-101 b 1680 269 4.0 2700 397 10.62 0.704 288 1279. 1
M-102 a 3600 1119 145 6870 N.D. 5.47 0.551 331 1532.8
M-102 b 5528 1640 229 10326 585 5.73 0.540 335 1559.8
M-105 9. 4198 1234 190 7762 N.D. 5.80 0·575 325 1493.6
M-105 b 5789 1638 261 11007 679 6.01 0.568 327 1506.4
M-114 a 4316 766 296 7626 N.D. 9.58 0.845 253 1100.4
M-114 b 4247 1022 361 8654 N.D. 7.74 0.750 276 1215.9
M.,..130 a 3626 1082 210 9203 N.D. 5.70 0.600 317 1443.8
M-130 b 5037 1412 270 942} 703 6.07 0.598 318 1449.9
a = Calentamiento b Desarrollo
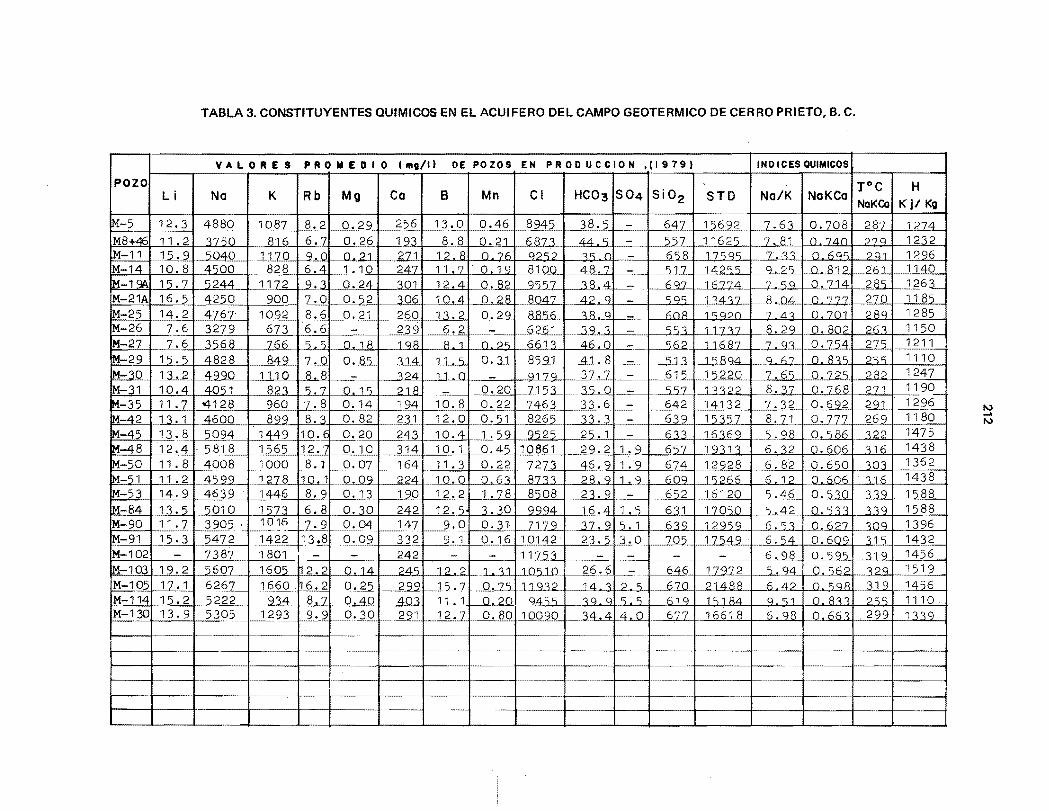
TABLA 3. CONSTITUYENTES QUIMICOS EN EL ACUIFERO DEL CAMPO GEOTERMICO DE CERRO PRIETO, B. C.
VALORES P It 0 .. E D I 0 11119/1 ) DE POZOS EN PRODUCCION .(1979) lNO ICES QUIMICOS
POZO TOC HLi No K Rb Mg Co B Mn CI HC03 S04 Si02 STD No/K NoKCo
NaKCo K j/ Kg
It'!-5 12.3 4~8~ _1087 8.2 0.29 256 13.0 0.46 8945 38.5 - 647 15692 7.63 0.708 28'L J22L M8+4C 11.2 ':17'50 816 6.1~g6 193 8.~~21 687':1 44 ') - 557 1162'5 7.81 o 740 27q 1232 ~-1i 15.9 5040 1170 9.0 021 .271 12 8 . 0 ?~ c)2"i2 ~') n - 6'58 17'iq'i 7.33 o 6Q'i 2Q1 1296 M-14 10.8 4500 828 6.4 1.10 247 11.7 0.19 8J~ 48.7 - '517 142'5') 9 2'1 o 812 261 1140 M-l~ 15.7 5244 11~~.3 0.24 301 12.4 0.82 9'5'57 ':18.4 :----= 6(;£1 16'l'74 7 c;o 0.714 28'5 126.1..... M-21A 16.5 4250 900 7.0 0.52 306 10.4 0.28 BML 32.9 - 59') 1 ~4~7 R n4 n 7?? 270 118'5 M-25 14.2 4767' 1092 8.6 0.21 260 13.2 0.29 81156 ~38._9. ,---=., hnR 1')0:::>n 7 4~ 0.701 28q 1285 M-26 7.6 3279 673 6.6 - 239 6.2 6261 3g ..':1 ')'5':1 11737 ~ ,. O. 802 263 1150 M-27 7.6 3568 766 5.'5 0.18 198 8 1, 0.2'5 6613 46 ...0 - W62, 11 fiR7 7 0'< 0.7'54 27'5 1211 1M-29 15.5 4828 849 7.0 0.8'5 ':114 11 '5 ~Q.n ~B5s.L ,..A.L.Jl ,. -=- 513 .J5804 o (';7 O. WI'i 2") ') 1110 M-30 13.2 4QgO 111Q 811 ,-,
~:::>4 11 n 0170 37.7 615 1'5220 7.6'5 0.72'5 282 1247 M-31 10.4 4051 82.':1 '5 7 0, 1') 218 ,,=- ' 0.20 7J5..3... _35.0 - ')57 1]]22 8.".7 0.768 271 1190 iM-35 11. 7 '4128 96CL ..2:§ ~.1,1..~:14 10.8 0.22 7463 33.6 - 642 14132 7·32 0.6_92 -~ . 1296
IM-42 1..:L...l. 4600 899 8.3 0.82 gj1 12.0 Q...2l 8265 33.3 639 15357 8.71 0.777 269 118Q
1M-45 13.8 5094 1449 10.6 0.20 243 10.4 1 .59 9525 25.1 - 633 16369 _5 . .9lL O~ 322 1475 ~-48 12.4 ' 5818 1565 12. '7 0.10 314 10.1 0.45 10e61 29.2 1.9 6'57 19]11 6.32 0.606 .':1 16 1438 1M-50 11. 8 4008 ~OO ~J ~_Q7, r--1 64 11.3 0.22 7273 46.9 1.9 674 1~ 6.82 0.65.0 301 1362 1M-51 11.2 45...9.L 1278 10.1 0.09 224 10.0 0.63 8733 28.9 1.9 609 1'5266 6 1.2 ° hnfi '<1h 143~
1M-53 14.9 __~§)L ,..1446 8.9 ~,3 r-l90 ~.2 1. 78 8508 23.9 - 652 " 16120 2.~ 0.530 33g 1588
M-84 13.5 5010 ,1573 6.8 0.30 242 12.5 3.30 9994 16.4 1.5 631 17050. 5 42 o '5':1':1 119 158 M-90 11.7 3905 ' 1016 7.9 0.04 147 9.0 0.31 .-TI7.':L .~ ,5.1 6':1g 12c)5c) 6.5lr-O-. 627 ,Og .~-' -M-91 ~ 5472 142~ 13.8 0.09 332 9.1 0.16 10142 23.5 3.0 705 17549 6.54 0.609 315 1432 M-l02 - 7387 1801 - 242 - - 1122.:1. - - - I-----,~.,-I- Q.....9lL .. O~ 319 1£5.6M-103 19.2 5607 1605 n2. 2 0.14 245 12 2 1 '< 1 1nc; 1 n 26.6 - 646 17972 '5 c)4 o 562 ,2Q 1519 M-105 12·1 _!§L .1660 .. ~I Q. 25 299 15.7 o 7'i 11 q,Q 14 , 2 c; 670 21488 6 42 o 'iQR 3J.5l. .H5L M-114 15.2 . ;im.-. 934 8.7 0.40 403 11.1 o 20 9455 ':Ic) C) ') '5 61c) 1'5184 Q 51 o 83] 2'5'5 1110 M-130 13.9 5305 1293 9.9 0.30 291 12.7 0.80 10090 _3LLA 4& 6.77 16618 6.C)8 () 66" . 299 13.3.3
- ,, "'.,, "" '''
. ", '''C' ---- .,,
,-, ,-, 1-----f-. '"'' - ----
L". -
....'" '"

213
TABLA 4. CONSTITUYENTES QUIMICOS EN EL ACUIFERO DEL CAMPO GEOTERMICO DE CERRO PRIETO. (VALORES PROMEDIO EN mg/I DE POZOS EN CALENTAMIENTO Y DESARROLLO. 1979)
INDICES QUIMICOS TNoKCo H
POZO No K Co CI SI02 No /K No K Co (OC) (Kj /KQ)
M-7 c 4381 777 223 7903 331 9.59 0.819 259 11 30. 1
M-20 a 4265 1079 209 7382 N.D. 6.73 0.652 302 1356.2
M-43 b 4523 620 459 8204 490 12.42 0.988 221 948.3
M-48 b 6106 1707 300 10692 N.D. 6.08 0.576 325 1493.6
M-91 b 4636 1307 129 8507 721 6.03 0.542 335 1559.8
M-93 a 3078 803 128 5710 N.D. 6.52 0.651 303 1361. 9
M-93 b 4737 1224 193 8927 649 6.59 0.621 311 1408.0
M-101a 3640 948 152 6907 N.D. 6.53 0.639 306 1378.8
M-101b 2791 600 66 4900 392 7.92 0.706 287 1273.7
M-103a 3932 1247 164 7610 1225 5.36 0.536 337 1573.4
M-103 b 5265 1616 220 10347 591 5.54 0.529 339 1587.6
M-103 b 6000 1679 248 11212 N.D. 6.08 0.563 329 1519.4
M-104 a 1796 568 78 3728 310 5.37 0.605 316 1437.7
M-104 b 4263 1318 189 8073 410 5.50 0.547 333 1546.2
M-104 b 4624 1399 205 8781 523 5.62 0.552 332 1539.5
M-110 a 3569 878 171 6691 N.D. 6.91 0.679 295 1317.2
M-181 a 3729 1130 194 7529 N.D. 5.61 0.582 323 1480.9
M-181 b 5273 1374 303 10196 N.D. 6.53 0.635 307 1384.5
T-366 a 4105 1900 155 7770 N.D. 7.76 0.704 288 1279.1
T-366 a 4323 1209 190 8551 N.D. 6.08 0.596 318 1449.9
T-366 b 5611 1470 229 10546 777 6.49 0.600 317 1443.8
Q-757 a 3253 3f3 190 5747 N.D. 15.20 1.063 206 879.6
a = Calentamiento,
b = Desarrollo
c = Calentamiento + Desarrollo
214
mg!1
15000
10000
1000 UNEA
POZO BASE N9 mo!1
3 I (10)
30 (to)
29 (10)
27 (10)
26 (10)
10025 (10)
2 I (10)
19A (10)
14 {I 0)
I 1 (10)
8 (10)
5 (10)
o Co Si02 K No CI
t-----.-/
E::::=:==="y/
t------"
21
19A
14
II
B Li
Figura lOa. Diagrama de Schoeller de valores promedio en el acuffero de pozos en producci6n (1979). (Datos de Tabla 31.
215
POZO N2
130
114
105
103
91
90
B4
53
51
50
4B
45
42
35
53
51
48 50
45
42
35
moll 15000
10000
LINEA BASE moll
1000 (10 )
(10)
(10)
(10 )
(10)
( 10)
(f0)
100( 10)
(10)
(10 )
(10)
(10)
(10)
(10)
10 B CI
Figura 10b. Diagrama de Schoeller de val ores promedio en el acuffero de pozos en produccion (1979). (Datos de Tabla 3).
216
POZO N2.
T-366
181
104
103
101
93
91
48
43
7
LINEA BASE mg/l
(10)
( 10)
(10 )
( 10)
( 10)
(10)
( 10)
(10)
( 10)
I 10}
110)
mg/l
15000
10COO
J
100
10 CQ SiOZ K No CI
Figura lOc. Diagrama de Schoeller de valores promedio en el acuifero en pozos de desarrollo (1979). (Datos de Tabla 4).

3000
217 "-:.
15000~------------------------------------------------------------------------------------------------------~
10000
co " E
c Z
/.5000 .
Na=(O.5416)(CI) +27_1626
o~----------------~----------------+-----------------~----------------~----------------~ 5000 10000 15000 20000 25000
CI (mg/l)
Figura 11a. Relacion de cloruros/Na en muestras de agua separada a presion atmosferica de pozos en produccion (1979). (Val ores promedio).
2000 0
0
.... co E
0 0
80
:.:
00
00 o 0
K =(O.1926)(CI) - 913.2936
0~------------------5-0LO-O-----------------I-O~0-0~0----------------~1~50~0~O~--------------~2~0~0~0~0-----------------2~5000
CI (mgl I)
Figura 11 b. Relacion cloruros/K en muestras de agua separada a presion atmosf~rica de pozos en produccion (1979). (Valores Promedio).
1000

218
700r--------------------------------------------------------------------------------------------,
600
500
0
0
400
".,. 0E
0 0u 300
200
Co = (Q.0 154HCIl + 189.7218
100
OL-________________~----------------~------------------+-----------------~----------------~ 5000 10000 15000 20000 25000
CI (moll)
Figura 11c. Relaci6n de cloruros/Ca en muestras de agua separada a presi6n atmosferica de pozos en producci6n (1979). (Val ores promedio).
30
20
::::: .,. E
.a OJ::
10
o
o
00
rP 00 o
0 0
0
0
0 0
0
Rb =(O.OOI4HCI) 5.1078
o 5000 10000 15000 20000 25000
Cl!mg/l)
Figura 11d. Relaci6n de cloruros/Rb en muestras de agua separada a presi6n atmosferica de pozos en producci6n (1979). (Val ores promedio).
219
"0>
40
E 20
Q
B = (0.00098 )lCO +4.261
o 10000 15000 20000 25000
CI Img/l)
Figura l1e. Relacion de cloruros/B en muestras de agua separada a presion atmpsferica de pozos en produccion (1979). (Valores promedio).
1500
1400
1300
1200
1100
1000 •. 900 ..= " 800
§'" 700
N 0
<n 600
500
400 SiO;? =(0.0416) (cn +434.54
300
200
100
0
5000 10000 15000 20000
CI (mo/il.
Figura l1f. Relacion de cloruros/Si02 en muestras de agua separada a presion atmosfEirica de pozos en produccion (19791. (Valores promedio).
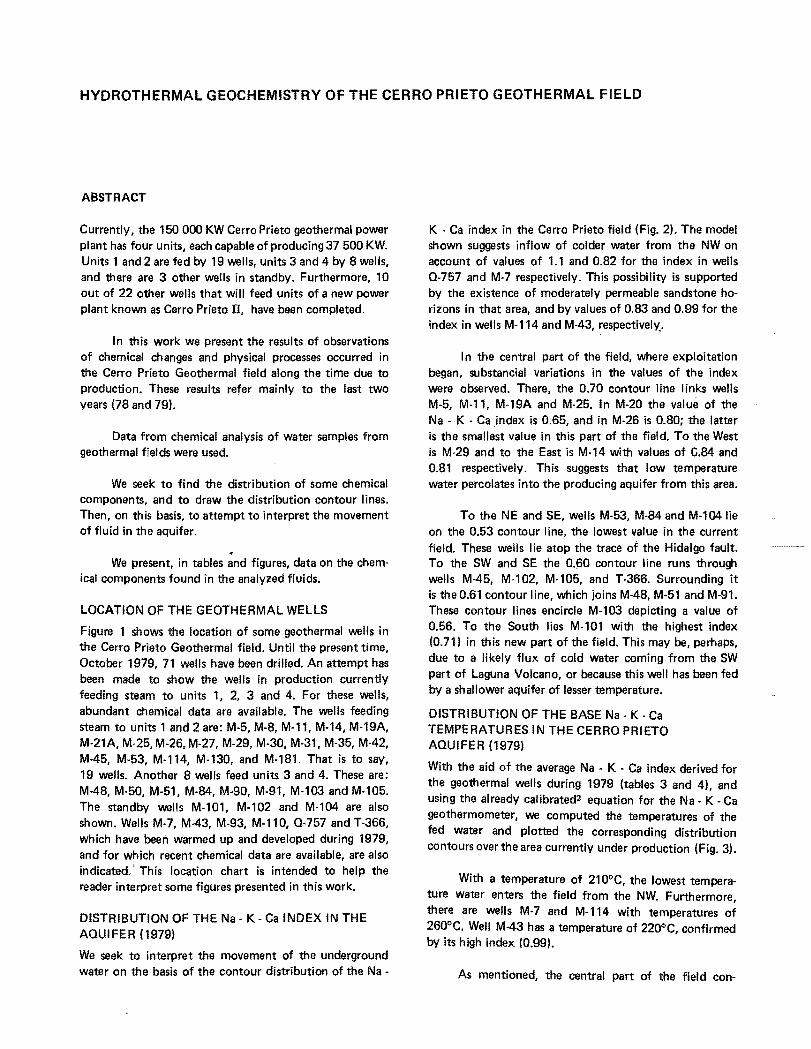
HYDROTHERMAL GEOCHEMISTRY OF THE CERRO PRIETO GEOTHERMAL FIELD
ABSTRACT
Currently, the 150 000 KW Cerro Prieto geothermal power plant has four units, each capable of producing 37 500 KW. Units 1 and 2 are fed by 19 wells, units 3 and 4 by 8 wells, and there are 3 other wells in standby. Furthermore, 10 out of 22 other wells that will feed units of a new power plant known as Cerro Prieto II, have been completed.
In this work we present the results of observations of chemical changes and physical processes occurred in the Cerro Prieto Geothermal field along the time due to production. These results refer mainly to the last two years (78 and 79).
Data from chemical analysis of water samples from geothermal fields were used.
We seek to find the distribution of some chemical components, and to draw the distribution contour lines. Then, on this basis, to attempt to interpret the movement of fluid in the aquifer.
. We present, in tables and figures, data on the chem·
ical components found in the analyzed fluids.
LOCATION OF THE GEOTHERMAL WELLS
Figure 1 shows the location of some geothermal wells in the Cerro Prieto Geothermal field. Until the present time, October 1979, 71 wells have been drilled. An attempt has been made to show the wells in production currently feeding steam to units 1, 2, 3 and 4. For these wells, abundant chemical data are available. The wells feeding steam to units 1 and 2 are: M·5, M·8, M-ll, M-14, M-19A, M-21A, M-25, M-26, M-27, M-29, M·30, M-3l, M-35, M-42, M-45, M-53, M-114, M-130, and M-181. That is to say, 19 wells. Another 8 wells feed units 3 and 4. These are: M-48, M·50, M-51, M-84, M·90, M·91, M-l03 and M-l05. The standby wells M-l01, M-l02 and M-l04 are also shown. Wells M-7, M-43, M-93, M·ll0, Q-757 andT-366, which have been warmed up and developed during 1979, and for which recent chemical data are available, are also indicated.' This location chart is intended to help the reader interpret some figures presented in this work.
DISTRIBUTION OF THE Na . K· Ca INDEX IN THE AQUIFER (1979)
We seek to interpret the movement of the underground water on the basis of the contour distribution of the Na
K . Ca index in the Cerro Prieto field (Fig. 2). The model shown suggests inflow of colder water from the NW on account of values of 1.1 and 0.82 for the index in wells Q-757 and M·7 respectively. This possibility is supported by the existence of moderately permeable sandstone horizons in that area, and by values of 0.83 and 0.99 for the index in wells M-114 and M-43, respectively'.
In the central part of the field, where exploitation began, substancial variations in the values of the index were observed. There, the 0.70 contour line links wells M-5, M·ll, M-19A and M·25. In M-20 the value of the Na - K - Ca .index is 0.65, and in M-26 is 0.80; the latter is the smallest value in this part of the field. To the West is M-29 and to the East is M-14 with values of C.84 and 0.81 respectively. This suggests that low temperature water percolates into the producing aquifer from this area.
To the NE and SE, wells M-53, M-84 and M-l04lie on the 0.53 contour line, the lowest value in the current field. These wells lie atop the trace of the Hidalgo fault . To the SW and SE the 0.60 contour line runs through wells M·45, M-l02, M-l05, and T-366. Surrounding it is the 0.61 contour line, which joins MA8, M-51 and M·9l. These contour lines encircle M-l03 depicting a value of 0.56. To the South lies M-l0l with the highest index (0.71) in this new part of the field. This may be, perhaps, due to a likely flux of cold water coming from the SW part of Laguna Volcano, or because this well has been fed by a shallower aquifer of lesser temperature.
DISTRIBUTION OF THE BASE Na· K· Ca TEMPERATURES IN THE CERRO PRIETO AQUIFER (1979)
With the aid of the average Na - K - Ca index derived for the geothermal wells during 1979 (tables 3 and 4), and using the already calibrated2 equation for the Na - K - Ca geothermometer, we computed the temperatures of the fed water and plotted the corresponding distribution contours over the area currently under production (Fig. 3).
With a temperature of 210°C, the lowest temperature water enters the field from the NW. Furthermore, there are wells M-7 and M-114 with temperatures of 260°C. Well M·43 has a temperature of 220°C, confirmed by its high index (0.99).
As mentioned, the central part of the field con
221
tinued to show big contrasts. Wells M·5, M-ll, M-19A, and M-25 are on the 290°C contour line. The contour lines corresponding to 260°C and 300°C lie on wells M-26 and M-20 respectively. To the East and West of this area, wells M-29 and M-14 with temperatures of 260°C probably indicate influx of cooler waters.
Wells M-45, M-48, M-51, M-91, M-l02, M-l05 and T-366 are on the 320°C contour line. The 310°C contour line goes through wells M-90, M-93 and M- 't81. I n the sourthern part of the field well M-l 0 1 presents a temperature of 290°C. Wells M-53 and M-84 show the highest temperatures: 340°C. In M-l04, which also lies in the new area of Cerro Prieto TI, a high temperature, 330°C, is observed.
One can conclude that the area coresponding to the wells that fed Units 3 and 4 is greater than the area originally under production, and that the temperature of the Na - K - Ca geothermometer for the wells studied is within the range 2100C - 3400C.
Fig. 3 shows the average temperatures (Na K Cal for most wells that fed the power plant during 1979. The highest values were observed in wells M-84 and M-53 (~ 340°C), and the lowest values were found in wells M-29 and M·114 (~ 255°C). The mean temperature, including all the wells, turned out to be 294°C; note that there is a temperature difference of 42°C between the wells located in the new area (U. 3 and 4) and the wells located in the old one (U. 1 and 2), since in the former the observed average temperature is 319°C, and in the latter the mean temperature is 277°C.
DISTRIBUTION OF CHLORIDE IN THE CERRO PRIETO AQUIFER (1979)
Fig. 4 shows the average chloride concentrations in the Cerro Prieto Aquifer for 1979. The area containing the wells corresponding to Units 1 and 2 shows great contrasts. Well M-26 presents the lowest value, 6000 ppm, as compared to 10000 ppm in M-19A. The 9000 ppm contour line extends through wells M-5, M-l1, M-25, M-29 and M-30, and the 8000 ppm contour line runs through wells M-14, M-21A, M-35, M-42 and M-d. This anomalous distribution is interpreted as due to pressure drawdown in the aquifer which induces vertical influx of less saline waters from overlying and underlying aquifers. The low chloride content of well Q-757 (6000 ppm) confirms the existence of low salinity water in this area.
The recently drilled wells showed the following values: 12000 ppm in M-l02 ana in M-l05; 11000 ppm in wells M-48, M-103 and T-366; 10000 ppm in wells M-84, M-45, M-181, and M·91. In wells M-53, M-l04, M-51 and M-93 concentrations were 9000 ppm_ In wells M-50 and M-90 the observed value was 7000 ppm, and in M-l01, 5000 ppm.
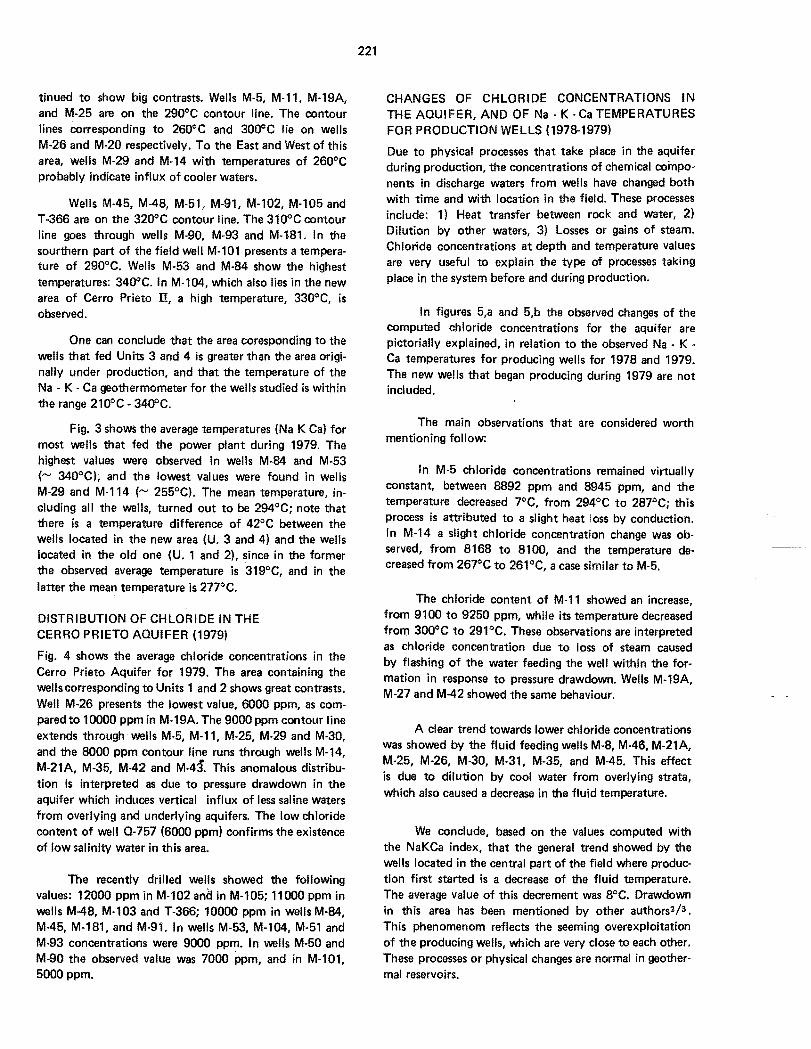
CHANGES OF CHLORIDE CONCENTRATIONS IN THE AQUIFER, AND OF Na - K - Ca TEMPERATURES FOR PRODUCTION WELLS (1978-1979)
Due to physical processes that take place in the aquifer during production, the concentrations of chemical components in discharge waters from wells have changed both with time and with location in the field. These processes include: 1) Heat transfer between rock and water, 2) Dilution by other waters, 3) Losses or gains of steam. Chloride concentrations at depth and temperature values are very useful to explain the type of processes taking place in the system before and during production.
In figures 5,a and 5,b the observed changes of the computed chloride concentrations for the aquifer are pictorially explained, in relation to the observed Na - K -Ca temperatures for producing wells for 1978 and 1979. The new wells that began producing during 1979 are not included.
The main observations that are considered worth mentioning follow:
In M-5 chloride concentrations remained virtually constant, between 8892 ppm and 8945 ppm, and the temperature decreased 7°C, from 294°C to 287°Ci this process is attributed to a slight heat loss by conduction. In M-14 a slight chloride concentration change was observed, from 8168 to 8100, and the temperature decreased from 267°C to 261°C, a case similar to M-5.
The chloride content of M-ll showed an increase, from 9100 to 9250 ppm, while its temperature decreased from 300°C to 291°C. These observations are interpreted as chloride concentration due to loss of steam caused by flashing of the water feeding the well within the formation in response to pressure drawdown_ Wells M-19A, M-27 and M-42 showed the same behaviour.
A clear trend towards lower chloride concentrations was showed by the fluid feeding wells M-8, M-46, M-21A, M-25, M-26, M-30, M-31, M-35, and M-45. This effect is due to dilution by cool water from overlying strata, which also caused a decrease in the fluid temperature.
We conclude, based on the values computed with the NaKCa index, that the general trend showed by the welts located in the central part of the field where production first started is a decrease of the fluid temperature. The average value of this decrement was 8°C. Drawdown in this area has been mentioned by other authors2/ 3 •
This phenomenom reflects the seeming overexploitation of the producing wells, which are very close to each other. These processes or physical changes are normal in geothermal reservoirs.
222
The chloride behaviour confirms the presence of three types of processes in the producing field, namely, heat transfer (M-5), dilution (M-8/46), and concentration by steam losses (M-l1).
POTASSIUM DISTRIBUTION IN THE AOUIFER (1979)
Figure 6 shows the distribution of the computed potassium concentrations (in ppm) in the aquifer for the wells indicated. This figure confirms the distribution models proposed with the NaKCa index and the temperature obtained with the NaKCa geothermometer.
In the central area M-26 shows a value of 700 ppm, and a 1100 ppm contour line surrounds wells M-5, M-20, M-25 and M-30. Wells M·114 and M·29 show values of 800 ppm. The values corresponding to 0-757 and M·7 are 300 ppm and 600 ppm respectively. The highest values (1800 ppm) were observed in M·l05 and in M·l02.
In the Southern part of the field wells M-90 and M·50 presented contents of 600 ppm.
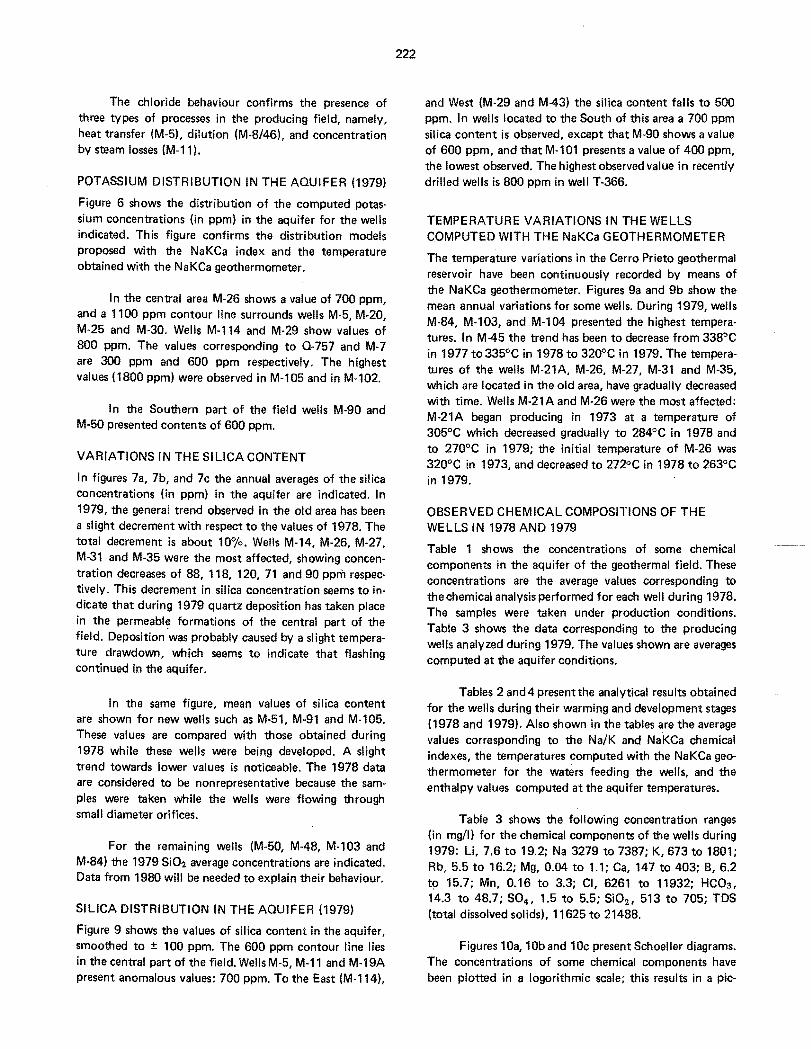
VARIATIONS IN THE SILICA CONTENT
In figures 7a, 7b, and 7c the annual averages of the silica concentrations (in ppm) in the aquifer are indicated. In 1979, the general trend observed in the old area has been a slight decrement with respect to the values of 1978. The total decrement is about 10%. Wells M·14, M·26, M·27, M·31 and M·35 were the most affected, showing concen· tration decreases of 88, 118, 120, 71 and 90 ppm respectively. This decrement in silica concentration seems to in· dicate that during 1979 quartz deposition has taken place in the permeabl~ formations of the central part of the field. Deposition was probably caused by a slight tempera· ture drawdown, which seems to indicate that flashing continued in the aquifer.
In the same figure, mean values of silica content are shown for new wells such as M·51, M·91 and M-l05. These values are compared with those obtained during 1978 while these wells were being developed. A slight trend towards lower values is noticeable. The 1978 data are considered to be nonrepresentative because the sam· pies were taken while the wells were flowing through small diameter orifices.
For the remaining wells (M-50, M-48, M·l03 and M·84) the 1979 Si02 average concentrations are indicated. Data from 1980 will be needed to explain their behaviour.
SILICA DISTRIBUTION IN THE AOUIFER (1979)
Figure 9 shows the values of silica content in the aquifer, smoothed to ± 100 ppm. The 600 ppm contour line lies in the central part of the field. Wells M·5, M·ll and M-19A present anomalous values: 700 ppm. To the East (M·114),
and West (M·29 and M-43) the silica content falls to 500 ppm. In wells located to the South of this area a 700 ppm silica content is observed, except that M-90 shows a value of 600 ppm, and that M-l 01 presents a value of 400 ppm, the lowest observed. The highest observed value in recently drilled wells is 800 ppm in well T·366.
TEMPERATURE VARIATIONS IN THE WELLS COMPUTED WITH THE NaKCa GEOTHERMOMETER
The temperature variations in the Cerro Prieto geothermal reservoir have been continuously recorded by means of the NaKCa geothermometer. Figures 9a and 9b show the mean annual variations for some wells. During 1979, wells M·84, M·103, and M·104 presented the highest temperatures. In M-45 the trend has been to decrease from 338°C in 1977 to 335°C in 1978 to 320°C in 1979. The temperatures of the wells M·21A, M-26, M-27, M·31 and M-35, which are located in the old area, have gradually decreased with time. Wells M·21A and M·26 were the most affected: M·21A began producing in 1973 at a temperature of 305°C which decreased gradually to 284°C in 1978 and to 270°C in 1979; the initial temperature of M-26 was 320°C in 1973, and decreased to 272°C in 1978 to 263°C in 1979.
OBSERVED CHEMICAL COMPOSITIONS OF THE WELLS IN 1978 AND 1979
Table 1 shows the concentrations of some chemical components in the aquifer of the geothermal field. These concentrations are the average values corresponding to the chemical analYSis performed for each well during 1978. The samples were taken under production conditions. Table 3 shows the data corresponding to the producing wells analyzed during 1979. The values shown are averages computed at the aquifer conditions.
Tables 2 and 4 presentthe analytical results obtained for the wells during their warming and development stages (1978 and 1979). Also shown in the tables are the average values corresponding to the Na/K and NaKCa chemical indexes, the temperatures computed with the NaKCa geothermometer for the waters feeding the wells, and the enthalpy values computed at the aquifer temperatures.
Table 3 shows the following concentration ranges (in mg/l) for the chemical components of the wells during 1979: Li, 7.6 to 19.2; Na 3279 to 7387; K, 673 to 1801; Rb, 5.5 to 16.2; Mg, 0.04 to 1.1; Ca, 147 to 403; B, 6.2 to 15.7; Mn, 0.16 to 3.3; CI, 6261 to 11932; HC03, 1'4.3 to 48.7; S04, 1.5 to 5.5; Si02 , 513 to 705; TDS (total dissolved solids), 11625 to 21488.
Figures lOa, 10b and 10c present Schoeller diagrams. The concentrations of some chemical components have been plotted in a logorithmic scale; this results in a pic·
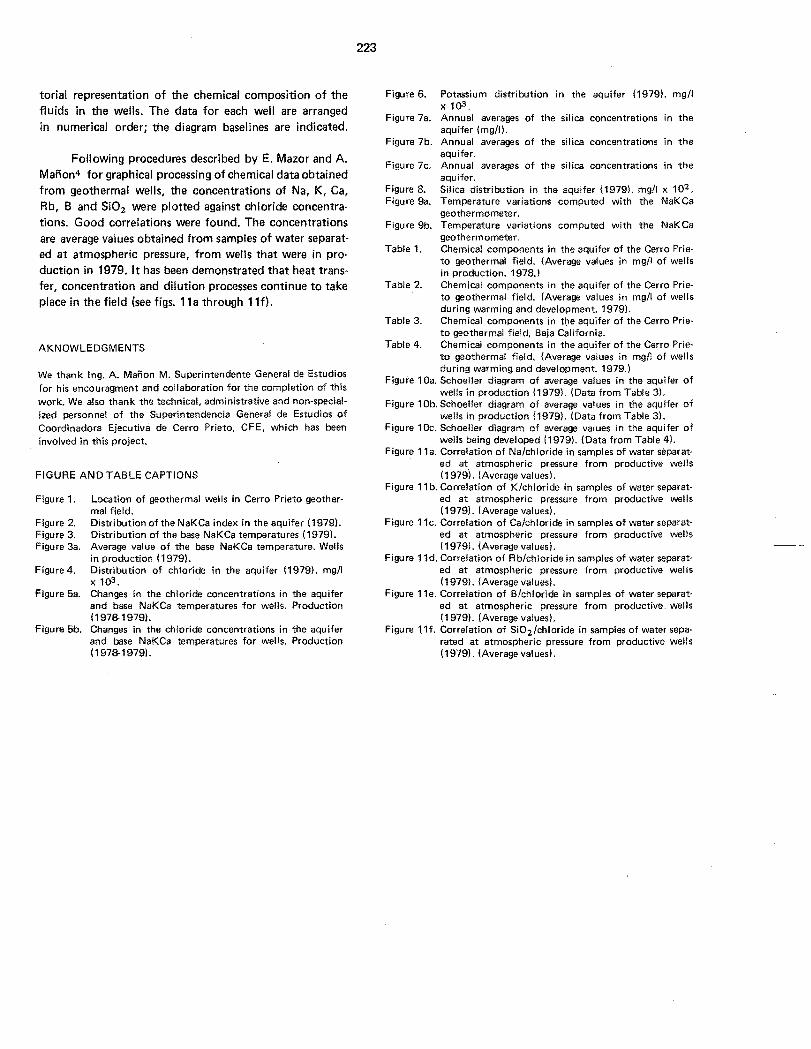
223
torial representation of the chemical composition of the fluids in the wells. The data for each well are arranged in numerical order; the diagram baselines are indicated.
Following procedures described by E. Mazor and A. Manon4 for graphical processing of chemical data obtained from geothermal wells, the concentrations of Na, K, Ca, Rb, Band Si02 were plotted against chloride concentrations. Good correlations were found. The concentrations are average values obtained from samples of water separated at atmospheric pressure, from wells that were in production in 1979. It has been demonstrated that heat transfer, concentration and dilution processes continue to take place in the field (see figs. 11 a through 11f).
AKNOWlEDGMENTS
We thank Ing. A. Manon M. Superintendente General de Estudios for his encouragment and collaboration for the completion of this work. We also thank the technical. administrative and non-specialized personnel of the Superintendencia General de Estudios of Coordinadora Ejecutiva de Cerro Prieto, CFE, which has been involved in this project.
FIGURE AND TABLE CAPTIONS
Figure 1. Location of geothermal wells in Cerro Prieto geothermal field.
Figure 2. Distribution ofthe NaKCa index in the aquifer (1979). Figure 3. Distribution of the base NaKCa temperatures (1979). Figure 3a. Average value of the base NaKCa temperature. Wells
in production (1979). Figure 4. Distribution of chloride in the aquifer (1979). mg/l
x 103 . Figure 5a. Changes in the chloride concentrations in the aquifer
and base NaKCa temperatures for wells. Production (1978-1979).
Figure 5b. Changes in the chloride concentrations in the aquifer and base NaKCa temperatures for wells. Production (1978-1979) .
Figure 6. Potassium distribution in the aquifer (1979). mg/l x 103 .
Figure 7a. Annual averages of the silica concentrations in the aquifer (mg/l).
Figure 7b. Annual averages of the silica concentrations in the aquifer.
Figure 7c. Annual averages of the silica concentrations in the aquifer.
Figure 8. Silica distribution in the aquifer (1979). mg/l x 102 • Figure 9a. Temperature variations computed with the NaKCa
geothermometer. Figure 9b. Temperature variations computed with the NaKCa
geothermometer. Table 1. Chemical components in the aquifer of the Cerro Prie
to geothermal field. (Average values in mgtl of wells in production. 1978.)
Table 2. Chemical components in the aquifer of the Cerro Prie· to geothermal field. (Average values in mgtl of wells during warming and development. 1979).
Table 3. Chemical components in tl:1e aquifer of the Cerro Prie· to geothermal field. Baia California.
Table 4. Chemical components in the aquifer of the Cerro Prieto geothermal field. (Average values in mgtl of wells during warming and development. 1979.l
Figure 10a. Schoeller diagram of average values in the aquifer of wells in production (1979). (Data from Table 3).
Figure 1 Ob. Schoeller diagram of average values in the aquifer of wells in production (1979!. (Data from Table 3).
Figure 1Oc. Schoeller diagram of average values in the aquifer of wells being developed (1979). (Data from Table 4).
Figure 11a. Correlation of Natchloride in samples of water separat· ed at atmospheric pressure from productive wells (1979). (Average values!.
Figure 11 b. Correlation of Ktchloride in samples of water separated at atmospheric pressure from productive wells (1979), (Average valuesl.
Figu re 11c. Correlation of Ca/chloride in samples of water separated at atmospheric pressure from productive wells (1979). (Average values).
Figure 11d. Correlation of Rbtchloride in samples of water separated at atmospheric pressure from productive wells (1979). (Average values).
Figure 11e. Correlation of BIchloride in samples of water separated at atmospheric pressure from productive wells (1979). (Average values).
Figure 11f. Correlation of SiOztchloride in samples of water separated at atmospheric pressure from productive wells (1979). (Average values).