expedição de caixas, acessórios e chapas de papelão ... · expedição de caixas, acessórios e...
TRANSCRIPT

1
ANO 39 / YEAR 39 Nº 462 Outubro 2018 / October, 2018
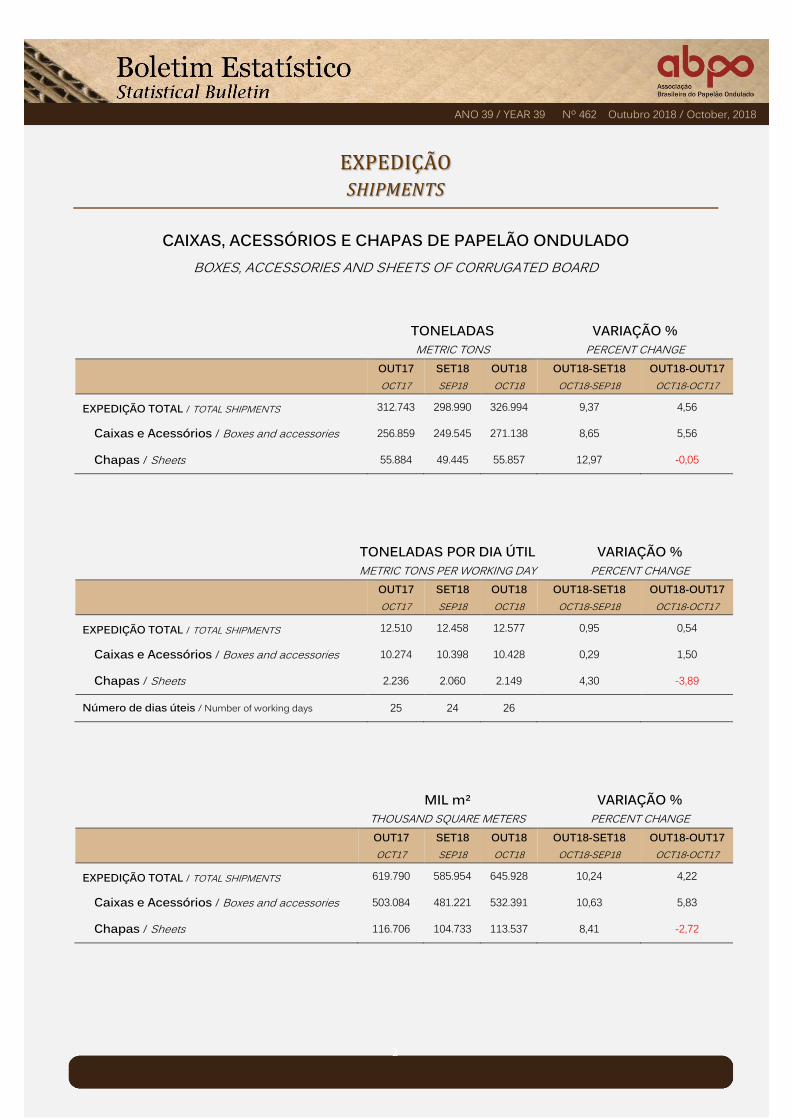
Expedição de caixas, acessórios e chapas de papelão ondulado é de 326.994 toneladas em outubro de 2018.
Volume é 4,56% superior ao de outubro de 2017. Em relação ao mês anterior (setembro de 2018), o volume expedido, ajustado sazonalmente, é 1,00% inferior. A expedição efetuada em outubro de 2018 totalizou 645.928 m². Esta cifra representa acréscimo de 4,22% em relação ao mesmo mês do ano anterior (outubro de 2017).
Shipments of boxes, accessories and sheets of corrugated cardboard reach 326,994 tons in October 2018.
Volume increased 4.56% compared to October 2017. On a seasonally adjusted basis, shipments were 1.00% higher than the volume of the previous month (September
2018). Volume shipped in October 2018 totaled 645,928 m². This figure corresponds to a 4,22% increase over the same month of the previous year (October 2017).
Expedição de caixas, acessórios e chapas de papelão ondulado - em mil toneladas Shipments of boxes, accessories and sheets of corrugated board - in thousand metric tons
282
288300
313
299
327
220
240
260
280
300
320
340
jan fev mar abr mai jun jul ago set out nov dez
201620172018
SUMÁ RIO EXECUTIVO
ANO 39 / YEAR 39 Nº 462 Outubro 2018 / October, 2018
2
ANO 39 / YEAR 39 Nº 462 Outubro 2018 / October, 2018
EXPEDIÇÁ O SHIPMENTS
CAIXAS, ACESSÓRIOS E CHAPAS DE PAPELÃO ONDULADO BOXES, ACCESSORIES AND SHEETS OF CORRUGATED BOARD
TONELADAS METRIC TONS
VARIAÇÃO % PERCENT CHANGE
OUT17 OCT17
SET18 SEP18
OUT18 OCT18
OUT18-SET18 OCT18-SEP18
OUT18-OUT17 OCT18-OCT17
EXPEDIÇÃO TOTAL / TOTAL SHIPMENTS 312.743 298.990 326.994 9,37 4,56
Caixas e Acessórios / Boxes and accessories 256.859 249.545 271.138 8,65 5,56
Chapas / Sheets 55.884 49.445 55.857 12,97 -0,05
TONELADAS POR DIA ÚTIL METRIC TONS PER WORKING DAY
VARIAÇÃO % PERCENT CHANGE
OUT17 OCT17
SET18 SEP18
OUT18 OCT18
OUT18-SET18 OCT18-SEP18
OUT18-OUT17 OCT18-OCT17
EXPEDIÇÃO TOTAL / TOTAL SHIPMENTS 12.510 12.458 12.577 0,95 0,54
Caixas e Acessórios / Boxes and accessories 10.274 10.398 10.428 0,29 1,50
Chapas / Sheets 2.236 2.060 2.149 4,30 -3,89
Número de dias úteis / Number of working days 25 24 26
MIL m² THOUSAND SQUARE METERS
VARIAÇÃO % PERCENT CHANGE
OUT17 OCT17
SET18 SEP18
OUT18 OCT18
OUT18-SET18 OCT18-SEP18
OUT18-OUT17 OCT18-OCT17
EXPEDIÇÃO TOTAL / TOTAL SHIPMENTS 619.790 585.954 645.928 10,24 4,22
Caixas e Acessórios / Boxes and accessories 503.084 481.221 532.391 10,63 5,83
Chapas / Sheets 116.706 104.733 113.537 8,41 -2,72

3
ANO 39 / YEAR 39 Nº 462 Outubro 2018 / October, 2018
EXPEDIÇÁ O SHIPMENTS
CAIXAS, ACESSÓRIOS E CHAPAS DE PAPELÃO ONDULADO BOXES, ACCESSORIES AND SHEETS OF CORRUGATED BOARD
VALORES ACUMULADOS NO ANO ACCUMULATED
TONELADAS
METRIC TONS
OUT17 OCT17
OUT18 OCT18
VARIAÇÃO % PERCENT CHANGE
EXPEDIÇÃO TOTAL / TOTAL SHIPMENTS 2.917.906 2.985.152 2,30
Caixas e Acessórios / Boxes and accessories 2.418.431 2.486.699 2,82
Chapas / Sheets 499.475 498.453 -0,20 Até o mês de referência / Until the reference month
VALORES ACUMULADOS NO ANO ACCUMULATED
MIL m²
THOUSAND SQUARE METERS
OUT17 OCT17
OUT18 OCT18
VARIAÇÃO % PERCENT CHANGE
EXPEDIÇÃO TOTAL / TOTAL SHIPMENTS 5.739.977 5.863.843 2,16
Caixas e Acessórios / Boxes and accessories 4.691.377 4.817.212 2,68
Chapas / Sheets 1.048.600 1.046.631 -0,19 Até o mês de referência / Until the reference month

4
ANO 39 / YEAR 39 Nº 462 Outubro 2018 / October, 2018
EXPEDIÇÁ O SHIPMENTS
CAIXAS E ACESSÓRIOS DE PAPELÃO ONDULADO, DISTRIBUIÇÃO POR CATEGORIA INDUSTRIAL EM % BOXES AND ACCESSORIES OF CORRUGATED BOARD, DISTRIBUTION PER INDUSTRIAL CATEGORY IN %
CATEGORIA INDUSTRIAL INDUSTRIAL CATEGORY
TONELADAS METRIC TONS
MIL m² THOUSAND SQUARE METERS
OUT OCT
JAN-OUT JAN-OCT
OUT OCT
JAN-OUT JAN-OCT
Produtos alimentícios Food products 44,80 45,60 46,16 47,22 Abates e produtos de carne Meat and meat products 16,28 16,22 15,60 15,59 Óleos e gorduras vegetais e animais Fats and oil refining 2,32 2,29 2,57 2,66 Laticínios Milk manufacturing products 6,73 6,91 7,06 7,29 Outros produtos alimentícios Other food products 19,47 20,19 20,92 21,68
Químicos e derivados Chemical & allied products 7,75 8,29 7,60 8,19 Avicultura Poultry 5,21 5,80 5,67 6,20 Horticultura, fruticultura e floricultura Horticulture, fruits & floriculture 11,04 8,56 7,70 6,15 Produtos farmacêuticos, perfumaria e cosméticos Drugs, perfumes & cosmetics 5,50 5,44 5,80 5,82 Produtos plásticos e borrachas Plastic products & Rubber goods 4,35 4,38 4,31 4,37 Bebidas Beverages 3,81 3,44 4,57 4,15 Diversos Miscellaneous 4,63 4,37 4,99 4,37 Papel e papelão Paper & cardboard 2,72 2,70 2,50 2,80 Fumos Tobaccos 0,62 2,58 0,47 1,22 Têxteis, vestuário, couro e calçados em geral Textilles, clothing, leather & allied products 3,28 3,06 3,59 3,37 Vidros e cerâmicas Glassware & ceramics 2,12 1,87 2,64 2,37 Material elétrico e de comunicação Eletrical & communication materials 1,28 1,26 1,17 1,17 Metalúrgica Metallurgy 1,39 1,23 1,32 1,19 Madeiras e mobiliários Lumber & furniture 0,41 0,38 0,50 0,44 Materiais de transportes Transport materials 0,19 0,24 0,19 0,26 Mecânica Machinery 0,90 0,79 0,82 0,72
Total Total 100,00 100,00 100,00 100,00 Percentuais calculados com base na soma dos dados das empresas informantes /Based on the sum of the data of responding companies.
Distribuição setorial da expedição de caixas e acessórios - em mil toneladas (Out 18) Sectorial shipments of boxes and accessories - in thousand metric tons (Oct 18)
Demais categorias / Other categories
25,70%
Químicos e derivados / Chemical & allied products
7,75%
Avicultura / Poultry 5,21%
Horticultura, fruticultura e floricultura / Horticulture, fruits & floriculture
11,04%
Produtos farmacêuticos, perfumaria e cosméticos / Drugs, perfumes & cosmetics
5,50%
Produtos alimentícios / Food products
44,80%
Calculado com base na expedição em toneladas / Based on shipments in metric tons

5
ANO 39 / YEAR 39 Nº 462 Outubro 2018 / October, 2018
CONSUMO DE PÁPEL, PRODUÇÁ O BRUTÁ E MÁ O DE OBRÁ OCUPÁDÁ
PAPER CONSUMPTION, GROSS PRODUCTION AND LABOUR
TONELADAS METRIC TONS
VARIAÇÃO % PERCENT CHANGE
OUT17 OCT17
SET18 SEP18
OUT18 OCT18
OUT18-SET18 OCT18-SEP18
OUT18-OUT17 OCT18-OCT17
Consumo de Papel (t) / Paper consumption (metric tons)
354.991 338.693 371.025 9,55 4,52
Produção bruta das onduladeiras (t) / Gross production of corrugators (metric tons) 361.420 341.466 370.942 8,63 2,63
Produção bruta das onduladeiras (mil m²) / Gross production of corrugators (thousand square meters)
703.599 665.020 724.607 8,96 2,99
VALORES ACUMULADOS NO ANO
ACCUMULATED
OUT17 OCT17
OUT18 OCT18
VARIAÇÃO % PERCENT CHANGE
Consumo de Papel (t) / Paper consumption (metric tons)
3.262.639 3.361.913 3,04
Produção bruta das onduladeiras (t) / Gross production of corrugators (metric tons) 3.328.256 3.388.708 1,82
Produção bruta das onduladeiras (mil m²) / Gross production of corrugators (thousand square meters) 6.455.106 6.603.891 2,30
MÃO DE OBRA LABOUR
VARIAÇÃO % PERCENT CHANGE
OUT17 OCT17
SET18 SEP18
OUT18 OCT18
OUT18-SET18 OCT18-SEP18
OUT18-OUT17 OCT18-OCT17
Número de empregados / Number of employees 24.548 23.448 23.368 -0,34 -4,81
Produtividade (t/homem) / Productivity (tons/empl.) 14,723 14,563 15,874 9,00 7,82
6
ANO 39 / YEAR 39 Nº 462 Outubro 2018 / October, 2018
SE RIES HISTO RICÁS TIME SERIES
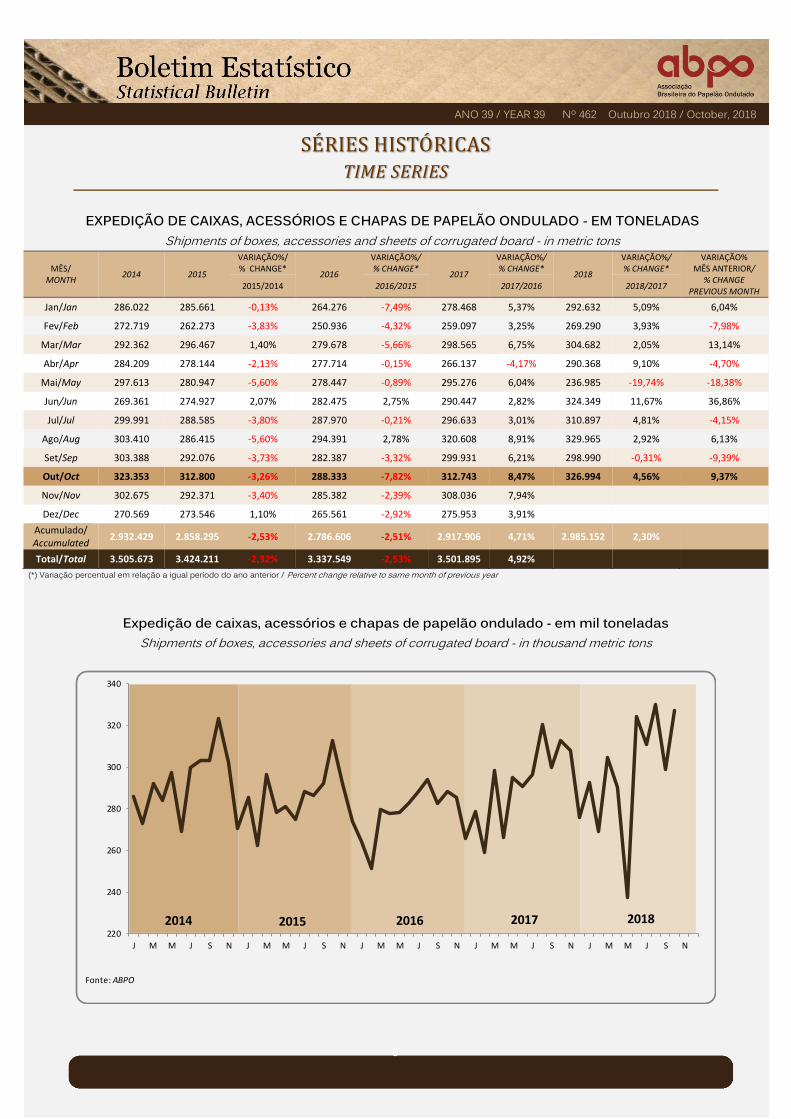
EXPEDIÇÃO DE CAIXAS, ACESSÓRIOS E CHAPAS DE PAPELÃO ONDULADO - EM TONELADAS Shipments of boxes, accessories and sheets of corrugated board - in metric tons
MÊS/ MONTH
2014 2015
VARIAÇÃO%/ % CHANGE*
2016
VARIAÇÃO%/ % CHANGE*
2017
VARIAÇÃO%/ % CHANGE*
2018
VARIAÇÃO%/ % CHANGE*
VARIAÇÃO% MÊS ANTERIOR/
% CHANGE PREVIOUS MONTH
2015/2014 2016/2015 2017/2016 2018/2017
Jan/Jan 286.022 285.661 -0,13% 264.276 -7,49% 278.468 5,37% 292.632 5,09% 6,04%
Fev/Feb 272.719 262.273 -3,83% 250.936 -4,32% 259.097 3,25% 269.290 3,93% -7,98%
Mar/Mar 292.362 296.467 1,40% 279.678 -5,66% 298.565 6,75% 304.682 2,05% 13,14%
Abr/Apr 284.209 278.144 -2,13% 277.714 -0,15% 266.137 -4,17% 290.368 9,10% -4,70%
Mai/May 297.613 280.947 -5,60% 278.447 -0,89% 295.276 6,04% 236.985 -19,74% -18,38%
Jun/Jun 269.361 274.927 2,07% 282.475 2,75% 290.447 2,82% 324.349 11,67% 36,86%
Jul/Jul 299.991 288.585 -3,80% 287.970 -0,21% 296.633 3,01% 310.897 4,81% -4,15%
Ago/Aug 303.410 286.415 -5,60% 294.391 2,78% 320.608 8,91% 329.965 2,92% 6,13%
Set/Sep 303.388 292.076 -3,73% 282.387 -3,32% 299.931 6,21% 298.990 -0,31% -9,39%
Out/Oct 323.353 312.800 -3,26% 288.333 -7,82% 312.743 8,47% 326.994 4,56% 9,37%
Nov/Nov 302.675 292.371 -3,40% 285.382 -2,39% 308.036 7,94%
Dez/Dec 270.569 273.546 1,10% 265.561 -2,92% 275.953 3,91%
Acumulado/ Accumulated
2.932.429 2.858.295 -2,53% 2.786.606 -2,51% 2.917.906 4,71% 2.985.152 2,30%
Total/Total 3.505.673 3.424.211 -2,32% 3.337.549 -2,53% 3.501.895 4,92%
(*) Variação percentual em relação a igual período do ano anterior / Percent change relative to same month of previous year
Expedição de caixas, acessórios e chapas de papelão ondulado - em mil toneladas Shipments of boxes, accessories and sheets of corrugated board - in thousand metric tons
2014 2015 2016 2017 2018220
240
260
280
300
320
340
J M M J S N J M M J S N J M M J S N J M M J S N J M M J S N
Fonte: ABPO
7
ANO 39 / YEAR 39 Nº 462 Outubro 2018 / October, 2018
SE RIES HISTO RICÁS TIME SERIES
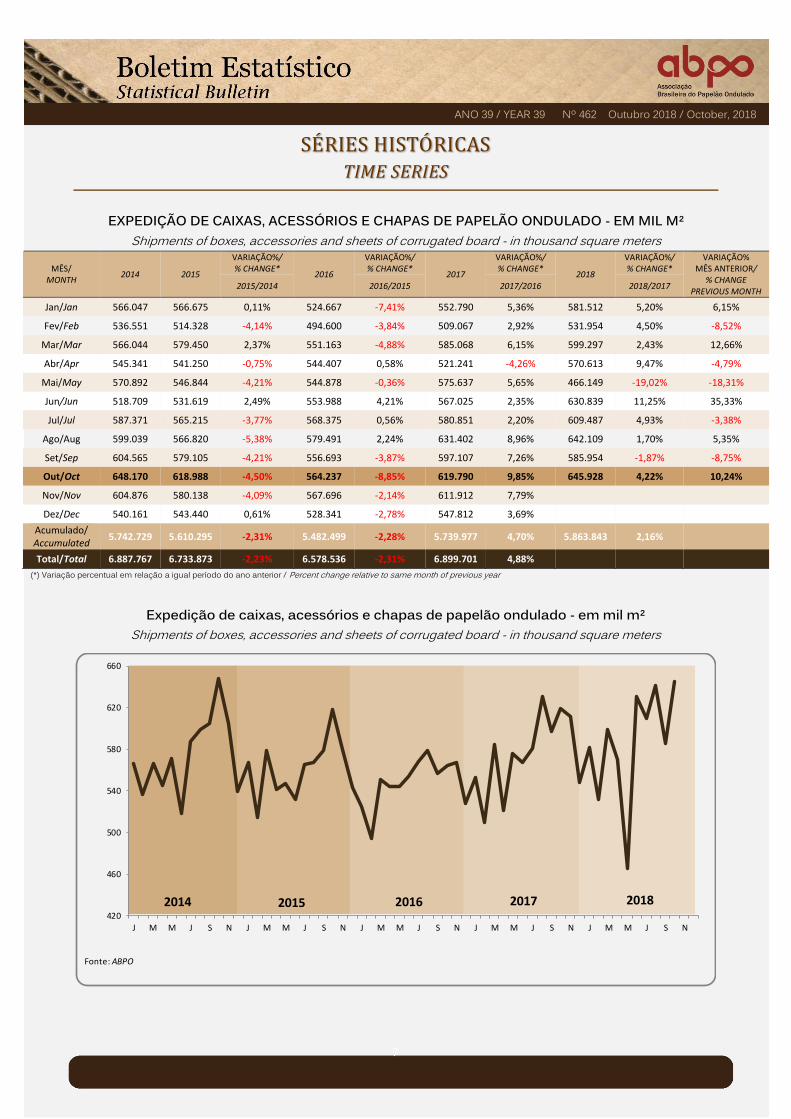
EXPEDIÇÃO DE CAIXAS, ACESSÓRIOS E CHAPAS DE PAPELÃO ONDULADO - EM MIL M² Shipments of boxes, accessories and sheets of corrugated board - in thousand square meters
MÊS/ MONTH
2014 2015
VARIAÇÃO%/ % CHANGE*
2016
VARIAÇÃO%/ % CHANGE*
2017
VARIAÇÃO%/ % CHANGE*
2018
VARIAÇÃO%/ % CHANGE*
VARIAÇÃO% MÊS ANTERIOR/
% CHANGE PREVIOUS MONTH
2015/2014 2016/2015 2017/2016 2018/2017
Jan/Jan 566.047 566.675 0,11% 524.667 -7,41% 552.790 5,36% 581.512 5,20% 6,15%
Fev/Feb 536.551 514.328 -4,14% 494.600 -3,84% 509.067 2,92% 531.954 4,50% -8,52%
Mar/Mar 566.044 579.450 2,37% 551.163 -4,88% 585.068 6,15% 599.297 2,43% 12,66%
Abr/Apr 545.341 541.250 -0,75% 544.407 0,58% 521.241 -4,26% 570.613 9,47% -4,79%
Mai/May 570.892 546.844 -4,21% 544.878 -0,36% 575.637 5,65% 466.149 -19,02% -18,31%
Jun/Jun 518.709 531.619 2,49% 553.988 4,21% 567.025 2,35% 630.839 11,25% 35,33%
Jul/Jul 587.371 565.215 -3,77% 568.375 0,56% 580.851 2,20% 609.487 4,93% -3,38%
Ago/Aug 599.039 566.820 -5,38% 579.491 2,24% 631.402 8,96% 642.109 1,70% 5,35%
Set/Sep 604.565 579.105 -4,21% 556.693 -3,87% 597.107 7,26% 585.954 -1,87% -8,75%
Out/Oct 648.170 618.988 -4,50% 564.237 -8,85% 619.790 9,85% 645.928 4,22% 10,24%
Nov/Nov 604.876 580.138 -4,09% 567.696 -2,14% 611.912 7,79%
Dez/Dec 540.161 543.440 0,61% 528.341 -2,78% 547.812 3,69%
Acumulado/ Accumulated
5.742.729 5.610.295 -2,31% 5.482.499 -2,28% 5.739.977 4,70% 5.863.843 2,16%
Total/Total 6.887.767 6.733.873 -2,23% 6.578.536 -2,31% 6.899.701 4,88%
(*) Variação percentual em relação a igual período do ano anterior / Percent change relative to same month of previous year
Expedição de caixas, acessórios e chapas de papelão ondulado - em mil m² Shipments of boxes, accessories and sheets of corrugated board - in thousand square meters
2014 2015 2016 2017 2018420
460
500
540
580
620
660
J M M J S N J M M J S N J M M J S N J M M J S N J M M J S N
Fonte: ABPO

8
ANO 39 / YEAR 39 Nº 462 Outubro 2018 / October, 2018
SE RIES HISTO RICÁS TIME SERIES
EXPEDIÇÃO DE CAIXAS, ACESSÓRIOS E CHAPAS DE PAPELÃO ONDULADO (NÚMERO ÍNDICE* - BASE: MÉDIA 2005 = 100) SHIPMENTS OF BOXES, ACCESSORIES AND SHEETS OF CORRUGATED BOARD (INDEX NUMBER* - BASE: AVERAGE 2005 = 100)
MÊS/ MONTH
2014
VARIAÇÃO% MÊS ANTERIOR/
% CHANGE** PREVIOUS MONTH
2015
VARIAÇÃO% MÊS ANTERIOR/
% CHANGE** PREVIOUS MONTH
2016
VARIAÇÃO% MÊS ANTERIOR/
% CHANGE** PREVIOUS MONTH
2017
VARIAÇÃO% MÊS ANTERIOR/
% CHANGE** PREVIOUS MONTH
2018
VARIAÇÃO% MÊS ANTERIOR/
% CHANGE** PREVIOUS MONTH
Jan/Jan 127,37 11,49% 127,21 5,58% 117,69 -3,39% 124,01 4,86% 130,32 6,04%
Fev/Feb 121,45 -4,65% 116,80 -8,19% 111,75 -5,05% 115,38 -6,96% 119,92 -7,98%
Mar/Mar 130,19 7,20% 132,02 13,04% 124,55 11,45% 132,96 15,23% 135,68 13,14%
Abr/Apr 126,56 -2,79% 123,86 -6,18% 123,67 -0,70% 118,52 -10,86% 129,31 -4,70%
Mai/May 132,53 4,72% 125,11 1,01% 124,00 0,26% 131,49 10,95% 105,53 -18,38%
Jun/Jun 119,95 -9,49% 122,43 -2,14% 125,79 1,45% 129,34 -1,64% 144,44 36,86%
Jul/Jul 133,59 11,37% 128,51 4,97% 128,24 1,95% 132,10 2,13% 138,45 -4,15%
Ago/Aug 135,11 1,14% 127,55 -0,75% 131,10 2,23% 142,77 8,08% 146,94 6,13%
Set/Sep 135,11 -0,01% 130,07 1,98% 125,75 -4,08% 133,57 -6,45% 133,15 -9,39%
Out/Oct 144,00 6,58% 139,30 7,10% 128,40 2,11% 139,27 4,27% 145,62 9,37%
Nov/Nov 134,79 -6,39% 130,20 -6,53% 127,09 -1,02% 137,17 -1,51%
Dez/Dec 120,49 -10,61% 121,82 -6,44% 118,26 -6,95% 122,89 -10,42%
(*) Índice calculado com base na expedição em toneladas / Based on shipments in metric tons
(**) Variação percentual em relação ao mês imediatamente anterior / Percent change relative to previous month
Expedição de caixas, acessórios e chapas de papelão ondulado (número índice - base: média 2005 = 100)
Shipments of boxes, accessories and sheets of corrugated board (index number - base: average 2005)
2014 2015 2016 2017 201890,00
100,00
110,00
120,00
130,00
140,00
150,00
J M M J S N J M M J S N J M M J S N J M M J S N J M M J S N
Fonte: ABPO

9
ANO 39 / YEAR 39 Nº 462 Outubro 2018 / October, 2018
SE RIES HISTO RICÁS TIME SERIES
EXPEDIÇÃO DE CAIXAS, ACESSÓRIOS E CHAPAS DE PAPELÃO ONDULADO COM AJUSTE SAZONAL (NÚMERO ÍNDICE* - BASE: MÉDIA 2005 = 100)
SHIPMENTS OF BOXES, ACCESSORIES AND SHEETS OF CORRUGATED BOARD, SEASONALLY ADJUSTED (INDEX NUMBER* - BASE: AVERAGE 2005 = 100)
MÊS/ MONTH
2014
VARIAÇÃO% MÊS ANTERIOR/
% CHANGE** PREVIOUS MONTH
2015
VARIAÇÃO% MÊS ANTERIOR/
% CHANGE** PREVIOUS MONTH
2016
VARIAÇÃO% MÊS ANTERIOR/
% CHANGE** PREVIOUS MONTH
2017
VARIAÇÃO% MÊS ANTERIOR/
% CHANGE** PREVIOUS MONTH
2018
VARIAÇÃO% MÊS ANTERIOR/
% CHANGE** PREVIOUS MONTH
Jan/Jan 130,10 1,59% 131,07 0,52% 123,76 -4,79% 126,98 2,05% 132,40 -0,04%
Fev/Feb 129,74 -0,27% 130,29 -0,60% 123,79 0,03% 126,98 0,00% 133,05 0,49%
Mar/Mar 135,03 4,08% 129,25 -0,80% 120,93 -2,31% 128,02 0,81% 132,80 -0,19%
Abr/Apr 128,29 -4,99% 128,17 -0,84% 125,79 4,01% 126,68 -1,04% 132,56 -0,18%
Mai/May 129,26 0,76% 125,77 -1,87% 125,53 -0,20% 130,66 3,14% 108,23 -18,35%
Jun/Jun 125,28 -3,08% 125,14 -0,50% 125,48 -0,04% 130,38 -0,21% 144,74 33,73%
Jul/Jul 130,10 3,85% 124,18 -0,77% 126,45 0,77% 131,45 0,82% 135,15 -6,62%
Ago/Aug 130,39 0,22% 124,27 0,08% 123,44 -2,37% 132,60 0,87% 136,38 0,91%
Set/Sep 130,54 0,12% 125,93 1,33% 121,73 -1,39% 132,80 0,15% 135,53 -0,63%
Out/Oct 129,57 -0,75% 126,89 0,76% 121,74 0,01% 131,81 -0,74% 136,89 1,00%
Nov/Nov 129,83 0,20% 125,53 -1,07% 122,56 0,67% 132,92 0,84%
Dez/Dec 130,39 0,43% 129,99 3,55% 124,43 1,53% 132,46 -0,35%
(*) Índice calculado com base na expedição em toneladas / Based on shipments in metric tons
(**) Variação percentual em relação ao mês imediatamente anterior / Percent change relative to previous month
Expedição de caixas, acessórios e chapas de papelão ondulado com ajuste sazonal (número índice - base: média 2005 = 100)
Shipments of boxes, accessories and sheets of corrugated board, seasonally adjusted (index number - base: average 2005)
2014 2015 2016 2017 2018100,00
105,00
110,00
115,00
120,00
125,00
130,00
135,00
140,00
145,00
150,00
J M M J S N J M M J S N J M M J S N J M M J S N J M M J S N
Fonte: ABPO

10
ANO 39 / YEAR 39 Nº 462 Outubro 2018 / October, 2018
SE RIES HISTO RICÁS TIME SERIES
EXPEDIÇÃO MENSAL ACUMULADA DE CAIXAS, ACESSÓRIOS E CHAPAS DE PAPELÃO ONDULADO - EM TONELADAS MONTHLY ACCUMULATED SHIPMENTS OF BOXES, ACCESSORIES AND SHEETS OF CORRUGATED BOARD - IN METRIC TONS
MÊS/ MONTH
2014 2015 VARIAÇÃO%/
% CHANGE 2016 VARIAÇÃO%/
% CHANGE 2017 VARIAÇÃO%/
% CHANGE 2018 VARIAÇÃO%/
% CHANGE 2015/2014* 2016/2015* 2017/2016* 2018/2017*
Jan/Jan 286.022 285.661 -0,13% 264.276 -7,49% 278.468 5,37% 292.632 5,09%
Fev/Feb 558.741 547.934 -1,93% 515.212 -5,97% 537.565 4,34% 561.922 4,53%
Mar/Mar 851.103 844.401 -0,79% 794.890 -5,86% 836.131 5,19% 866.604 3,64%
Abr/Apr 1.135.312 1.122.545 -1,12% 1.072.604 -4,45% 1.102.268 2,77% 1.156.972 4,96%
Mai/May 1.432.926 1.403.492 -2,05% 1.351.051 -3,74% 1.397.543 3,44% 1.393.957 -0,26%
Jun/Jun 1.702.287 1.678.419 -1,40% 1.633.526 -2,67% 1.687.991 3,33% 1.718.306 1,80%
Jul/Jul 2.002.277 1.967.004 -1,76% 1.921.495 -2,31% 1.984.624 3,29% 2.029.203 2,25%
Ago/Aug 2.305.688 2.253.419 -2,27% 2.215.887 -1,67% 2.305.232 4,03% 2.359.168 2,34%
Set/Sep 2.609.076 2.545.495 -2,44% 2.498.273 -1,86% 2.605.163 4,28% 2.658.158 2,03%
Out/Oct 2.932.429 2.858.295 -2,53% 2.786.606 -2,51% 2.917.906 4,71% 2.985.152 2,30%
Nov/Nov 3.235.104 3.150.665 -2,61% 3.071.988 -2,50% 3.225.942 5,01%
Dez/Dec 3.505.673 3.424.211 -2,32% 3.337.549 -2,53% 3.501.895 4,92%
MÉDIAS MENSAIS
MONTHLY AVERAGES
Jan-Out/Jan-Oct 293.243 285.829 -2,53% 278.661 -2,51% 291.791 4,71% 298.515 2,30%
Jan-Dez/Jan-Dec 292.139 285.351 -2,32% 278.129 -2,53% 291.825 4,92%
(*) Variação percentual em relação a igual período do ano anterior / Percent change relative to same month of previous year
Expedição de caixas, acessórios e chapas de papelão ondulado - em mil toneladas (Out) Shipments of boxes, accessories and sheets of corrugated board - in thousand metric tons (Oct)
2.9322.858
2.7872.918
2.985
100
300
500
700
900
1.100
1.300
1.500
1.700
1.900
2.100
2.300
2.500
2.700
2.900
3.100
2014 2015 2016 2017 2018
Fonte: ABPO