
TH
RA
EX
IN
É
p
D
HÈSE dirigM. SCHAA
APPORTEMme. COCM. NARDIN XAMINATM. SCHLA
NVITES : M. JIERRYM. LAVAL
ÉCOLE D
pour obten
DESIGSU
gée par : AF Pierre
EURS : CHE-GUERN Michel
EUR : ATTER Guy
Y Loïc LE Philipp
UNIVE
DOCTORA
INS
Soute
ir le grade
Discip
GN OFURFA
RENTE Lilia
y
e
ERSIT
RALE DE
STITUT C
Tpré
César enance pré
de : Doct
pline/ Spéc
F MECACES
Pro
ane MaDirMu
Pro
Ma Dir
TÉ DE
PHYSIQ
CHARLE
THÈSésentée pa
RIOS N
évue le : 26
teur de l’
cialité : Ch
CHANAND
ofesseur, U
aître de Conrecteur de reulhouse
ofesseur, U
aître de Conrecteur de re
STRA
QUE ET C
ES SADR
E ar :
NEYRA6 septembr
’Univers
imie-Phy
NOREMATE
niversité de
nférences, Uecherches,
niversité de
nférences, Uecherches,
ASBOU
CHIMIE P
ON
A re 2013
ité de St
ysique
SPONERIAL
e Strasbourg
Université JInstitut des
e Strasbourg
Université dINSERM
URG
PHYSIQU
trasbour
NSIVELS
g
oseph Fours sciences d
g
de Strasbou
UE
g
E
rier, Grenobdes matéria
rg
ble 1 aux de

i
A mi familia,

ii
Acknowledgements
This PhD work was conducted at the laboratories of the Institut Charles Sadron, UPR 22
CNRS within the “Ingénierie Macromoléculaire aux Interfaces” team and at the INSERM
Unit UMR-S 1121 “Biomatériaux et Bioingénierie” in Strasbourg, France.
I would like to express my deepest appreciation to all those that helped and supported me,
thus contributing to the accomplishment of my PhD.
I would like to start by expressing my sincere gratitude to Professor Pierre Schaaf, my PhD
advisor, for giving me the opportunity to be part of his research group. His continuous support
and guidance during my doctoral research was highly appreciated and helpful to work in this
challenging topic.
I would like to express my entire gratitude to my co-advisor, Dr. Loïc Jierry, for the
interesting scientific discussions, personal advices, motivation and patience during my
research work.
I would like to extend my entire gratitude to Dr. Philippe Lavalle, concerning the fluorescence
experiments on the confocal microscope, fluorescence microscope and spectrofluorimeter that
I performed at INSERM labs. His quality of work, scientific discussions, patience, time and
motivation were very appreciated during my thesis.
I also want to thank Dr. Fouzia Boulmedais and Dr. Jean-Claude Voegel for their scientific
discussions during the group meetings, advice and patience during my doctoral thesis.
I would also like to thank Dr. Liliane Coche-Guerente and Dr. Michel Nardin for having
accepted to act as referees for my thesis work and for providing interesting suggestions. I am
also grateful to Professor Guy Schlatter for his participation as president of the advisory
committee.

iii
I would also want to thank the directors of the Institut Charles Sadron, Professor Jean-
François Legrand and Dr. Jean-Michel Guenet for accepting me as a PhD student at the
institut.
I express my sincere gratitude to Dr. Joseph Hemmerlé and Monsieur Karim Benmligh for the
design and implementation of the different stretching devices used during my uncountable
experiments.
I would not forget the important contribution of Dr. Bernard Senger for the scientific
discussions during the group meetings, the FRAP analysis and data treatment of the
fluorescence experiments.
I would like to thank Dr. Joseph Selb for his great help during the fluorescence and
rheological experiments together with the interpretations of the results and scientific
discussions.
I would also like to thank Dr. Jacques Drutz for his time, for teaching me how to use the UV
and IR machines as well as the discussion of the results.
I would like to thank Dr. Pascal Marie for the interesting scientific discussions about
polydimethylsiloxane substrates and polymerization techniques.
I would like to thank Dr. Andreas Reisch and Dr. Benoît Frisch for teaching me the chemical
modification of enzymes and polyelectrolytes and their respective analysis used during my
experiments.
I would like to thank all my colleagues that I met during my thesis work with whom I worked
or shared the fume hoods and had some fun:
My colleagues from my former lab at ISIS: Patty, Jonathan, Adrian, Anton and Vincent.
My colleagues from INSERM lab: Armelle, Géraldine, Christophe, Morgane, Julien, Engin,
Christian, Cédric, Damien, Dominique and Vincent.

iv
My colleagues from IMI lab: Lydie, Johan, Eloïse, Tony, Elodie, Alexandre, Fabien, Thanh,
Clément, Cécile, Gaulthier, Mathias, Gwenaëlle, Audrey, Emmanuelle, Nathalie, Jean-
Nicolas and Prasad.
I would like also to thank my great friends for all the good times in and out of the ICS:
Maria, Diana, Lara, Johanna, David, Patty, Martin, Gaby, Christi, Andru, Franck, Stéphanie,
Akkiz, Dominique, Rémi, Alliny, Nathalie, Anna, Mirella, Olga, Paul, Marek, Souvik,
Christophe, Joseph, Gladys, Tam, Hatice, Christiane, Francine, Heveline, Yasmine, Patrycja,
Arnaud, Camille, Laure, Sisouk and Daniel, I would never forget that good friends are there
when we need them.
Finally, I would like to express my sincere gratefulness to the people who motivate me and
trust me during all this time in France, my family:
My parents Maria and Alberto (R.I.P), my brothers P. Alberto Cristian and Carlos and my
aunt Carmen for the support, advice and enthusiasm during this adventure since it started in
2006 in France for my studies, especially my PhD.
My dear Rebecca, for sharing my life every day, for the support I get from you when I’m
down, the jokes you tell that makes me laugh and for just being like you are.

v
Abstract
In nature, there are plants that can be folded when being touched by animals or insects. At a
lower scale, cells are known to probe the mechanical properties of the surface and adhere on it if it is
appropriate for them. It is also well described that some kinds of proteins can exhibit hidden cryptic
sites to specific ligands when a mechanical stretch is undergone by these proteins. In all these three
examples, a mechanical stimulus starts a cascade of chemical transformations leading to the response
of the living organism, the cell, or the protein, respectively.
In the last decade, these mechanosensitive transduction processes have inspired the scientific
community and the design of smart materials and surfaces has emerged as a growing and very active
field of research. Yet the work described up to now does concern mainly the color switching of
materials when stretched or squeezed. In this context, the goal of my thesis was to develop new
routes to design chemo-mechanoresponsive materials, i.e. materials that respond chemically to a
mechanical stress, in a reversible way.
All the systems designed during my PhD thesis were based on the functionalization of silicone
sheets: a first way was to create cryptic site surfaces by embedding ligands (biotin) into PEG brushes.
The couple streptavidin/biotin was used as a model system. At rest, the surface so-prepared was
antifouling and biotin ligands were specifically recognized by the streptavidin when the surface was
stretched at 50%. Unfortunately, in this first approach, the mechanosensitive surface did not lead to a
reversible process. In a second approach, we modified the silicone surface by using the polyelectrolyte
multilayer (PEM) film deposition. This strategy was based on the covalent cross-linking of modified
enzyme, the β-galactosidase, into the PEM. We succeeded in modulating the enzyme activity in the
film under stretching and this approach appears as partially reversible under stretching/unstretching
cycles. This work represents the first reported system where enzymatic activity can be
modulated by stretching due to modulation of the enzyme conformation. In a last approach, we
also designed a mixed system consisting of a silicone sheet onto which a polyacrylamide hydrogel is
covalently attached with the goal to create a stretchable gel into which one can covalently attach
enzymes or chemical mechanophores. These enzymes or mechanophores can thus be put under
mechanical stress. We succeeded in creating a system that can be stretched up to 150% without
detachment of the gel from the silicone and without inducing cracks in the gel.

vi
Résumé
Dans la nature, il existe des plantes capables de se mouvoir quand elles sont touchées par des
animaux ou des insectes. A une échelle plus petite, il est connu que les cellules sondent leur
environnement pour estimer les propriétés mécaniques de celui-ci et décider d’y adhérer ou non. Il a
même été démontré que lorsque certaines protéines sont étirées sous l’effet d’un stress mécanique,
elles exhibent des sites cryptiques permettant l’adhésion spécifique de ligands. Dans chacun de ses
trois exemples, une cascade de transformations chimiques est amorcée par un stimulus mécanique qui
permet une réponse de la plante, de la cellule ou d’une protéine, respectivement.
Au cours des dix dernières années, ces processus de transduction mécano-sensible ont inspiré
la communauté scientifique et ont participé au développement d’une nouvelle classe de matériaux dits
« intelligents », un domaine très actif et en constante évolution. Il faut cependant noter que dans le cas
des matériaux mécano-sensibles, seul des matériaux capables de changer de couleur sous l’effet d’une
contrainte mécanique ont été décrits. Dans ce contexte, le but de ma thèse a été de mettre au point de
nouvelles voies d’accès à des matériaux chimio-mécano répondants, autrement dit, des matériaux
capables de permettre une transformation chimique réversible lorsqu’ils sont soumis à un stress
mécanique.
Tous les systèmes conçus au cours de ma thèse ont été développés sur des substrats en
silicone : une première approche a consisté à créer des surfaces à sites cryptiques où une biotine est
enfouie dans des brosses de chaines de poly(éthylène glycol) (PEG). Le système streptavidine/biotine
a été utilisé comme modèle. Ces surfaces sont anti-adsorbantes à la streptavidine sauf lorsqu’elles sont
étirées à hauteur de 50% où cette fois la biotine est reconnue. Ces surfaces mécanorépondantes se sont
révélées non réversibles. Dans une seconde approche, nous avons modifiés la surface du silicone par
adsorption d’une multicouche de polyélectrolytes. Cette stratégie est basée sur la réticulation covalente
du film par une enzyme préalablement modifiée. L’enzyme choisie est la β-galactosidase. Nous
sommes ainsi parvenus à créer une surface présentant une activité catalytique modulable par
l’étirement mécanique, et ce, d’une façon partiellement réversible. Ce travail représente le premier
exemple d’un système où une contrainte mécanique imposée à un matériau permet la
déformation conformationnelle d’une enzyme, à l’origine de la diminution de l’activité
catalytique du matériau. Dans une dernière approche, nous avons conçu un système mixte composé
d’un substrat de silicone sur lequel une couche d’épaisseur macroscopique d’un gel de polyacrylamide
est greffée de façon covalente. Des enzymes ou d’autres mécanophores pourront ainsi être inclus dans
le réseau polymérique du gel de polyacrylamide et ainsi être étirés. Nous sommes parvenus à préparer
de tels systèmes où l’hydrogel reste solidaire du film de silicone, sans apparition de craquelures
jusqu’à 150% d’étirement.

vii
Table of contents
Abbreviations 1
General Introduction 3
Chapter 1: State of the art
1.1 A historical perspective 9
1.2 Mechanochemistry in biological systems 13
1.2.1 Enhancement of mechanical forces due to allosteric regulation 14
1.2.2 Cryptic site proteins 16
1.3 Cryptic site substrates 18
1.3.1 Polyelectrolyte multilayer based mechanoresponsive systems 18
1.3.2 Responsive systems based on poly(ethylene oxide) brushes 23
1.4 Summary 24
1.5 References 25
Chapter 2: Materials and methods
2.1 Materials 31
2.1.1 Solutions of polyelectrolytes 31
2.1.2 Fluorescence probes 31
2.1.2.1 Fluorescence polyelectrolytes 31
2.1.2.2 Fluorescence protein 31
2.1.3 Support for construction of films 33
2.1.3.1 Glass slides 33
2.1.3.2 Silicone 33
2.1.4 Stretching devices 34
2.1.4.1 Large stretching device 34
2.1.4.2 Medium stretching device 35

viii
2.1.5 Modification of silicon surfaces 35
2.1.5.1 UV-ozone (UVO) 35
2.1.6 Procedure to prepare PDMS Sylgard-184 36
2.1.6 Silanization procedure of the oxidized silicone sheet by using the
3-mercaptopropyltrimethoxysilane. 36
2.2 Methods 37
2.2.1 Contact angle (CA) measurements 37
2.2.2 Infrared spectroscopy (FTIR) 38
2.2.3 Atomic force microscopy (AFM) 38
2.2.4 Optical microscopy 38
2.2.5 Nuclear magnetic resonance (NMR) 38
2.2.6 Fluorescence based microscopy methods 38
2.2.6.1 Principles of fluorescence 39
2.2.6.2 Fluorescence microscope 40
2.2.6.3 Confocal laser scanning microscope (CLSM) 41
2.2.6.4 Fluorescence recovery after photobleaching (FRAP) 42
2.3 References 45
Chapter 3: Investigation of a bispyrene unit used as a mechanical sensor or a pH probe
3.1 Introduction 48
3.2 Design and synthesis of the bispyrenes 2 and 3 50
3.3 Bispyrene derivative 2 used as a mechanical sensor included in poly(acrylamide) hydrogels 52
3.3.1 Optimization to get a viscous-elastic and stretchable PAM hydrogel 53
3.3.2 Bispyrene 2 cross-linked in the poly(acrylamide) hydrogel 55
3.4 Conclusion 57
3.5 References 58
3.6 Investigations of bispyrene 3 as homobifunctionnal cross-linker and local pH sensor of polyelectrolyte based films 60

ix
Article 1: “Morphogen-driven self-construction of covalent films built from polyelectrolytes and homobifunctional spacers: buildup and pH response”
3.6.1 Supporting Information to article 1 69
Chapter 4: Covalent modifications of poly(dimethylsiloxane)
substrate to design reversible chemo-mechanoresponsive surfaces
4.1 Introduction 83
4.2 Choice of the elastomeric substrate: the PDMS 86
4.2.1 The PDMS Sylgard-184: presentation, principle of synthesis and preparation
4.2.1.1 Introduction 87
4.2.1.2 Methods and mechanism of PDMS reticulation 87
4.2.1.3 The PDMS Sylgard-184 89
4.3 Chemical modification of the PDMS surface 90
4.3.1 Principle of the UVO oxidation process of silicone surface 91
4.3.2 Results of the chemical modifications and characterization of the silicone surface 92
4.3.2.1 UVO oxidation of silicone SMI and PDMS Sylgard-184 92
4.4 Silanization step: introduction of thiol groups onto oxidized silicone surface 97
4.4.1 Chemical modification process and characterization of the PDMS surface with thiols groups 98
4.5 Grafting of biotine groups and PEG brushes on PDMS surfaces 99
4.5.1 Covalent grafting of Biotin groups on silanized PDMS surfaces 101
4.5.1.1 Experimental procedure 101
4.5.1.2 Protein adsorption 101
4.5.1.3 Fluorescence measurements 101
4.5.2 Effect of stretching and irreversibility of the Streptavidin anchored 103
4.5.3 Simultaneous grafting of PEG2000 chains and biotin groups on the substrate 106
4.5.4 Different attempts to increase the density of grafted PEG chains 110

x
4.5.4.1 Covalent grafting of PEG chains and biotin groups on stretched silicone 110
4.5.4.2 Effect of the PEG chain length 113
4.5.4.3 Sequential grafting of PEG and biotin in a stretched state. 114
4.5.4.4 Sequential grafting of biotin and PEG 115
4.6 Conclusion 116
4.7 References 117
Chapter 5: Polyelectrolyte multilayers with mechanically
modulable enzymatic activity (article in preparation)
5.1 Introduction 122
5.2 Results 124
5.3 Conclusion 133
5.4 References 134
5.5 Supporting information 136
Chapter 6: Stretchable polyacrylamide hydrogel covalently
supported onto a silicone substrate: design of an ideal 3D
polymeric network for mechanotransductive investigations
(article in preparation)
6.1 Abstract 153
6.2 Introduction 154
6.3 Material and methods 155
6.3.1 Materials 155
6.3.2 Methods 156
6.4 Results and discussion 158
6.4.1 Design of the PAM hydrogel supported covalently on silicone sheet 158
6.4.2. Elastomeric PAM preparation 159

xi
6.4.3 Silicone sheet modifications 162
6.5 Silanization and PAM hydrogel formation 167
6.6 Conclusion 169
6.7 References 169
6.8 Supporting information 172
Conclusions and perspectives 179
Annex I 182

1
Abbreviations
β-Gal β-Galactosidase
β-GalFITC β-Galactosidase labeled with fluorescein
β-Gal-mal β-Galactosidase-maleimide
β-Gal-malFITC β-Galactosidase-maleimide labeled with fluorescein
Biotin-Mal biotine modified with maleimide groups
CA contact angle
CLSM confocal laser scanning microscope
DCC N, N'-Dicyclohexylcarbodiimide
EDC N-(3-Dimethylaminopropyl)-N’-ethylcarbodiimide hydrochloride
FDG fluorescein di(β-D-galactopyranoside)
FITC fluorescein isothiocyonate
FTIR fourier transform infrared spectroscopy
HA hyaluronic acid
LbL layer by layer
MPS 3-mercaptopropyltrimethoxysilane
NHS N-Hydroxysuccinimide sodium salt
NMR nuclerar magnetic resonance spectroscopy
PBS phosphate buffered saline
PEG poly(ethylene glycol)
PEG-Mal poly(ethylene glycol) modified with maleimide groups
PEM polyelectrolyte multilayers

2
PLL poly(L-lysine)
PLLFITC poly(L-lysine) labeled with fluorescein
PLL-S-TP poly(L-lysine) modified with thiopyridone groups
PDMS poly(dimethylsiloxane)
QCM quartz crystal microbalance
StreptaFITC Streptavidin labeled with fluorescein
TCEP tris(2-carboxyethyl)phosphine hydrochloride
TRIS tris(hydroxymethyl)aminomethane
UVO ultraviolet ozone

3
General introduction
Material science has received over the last years considerable attention due, in
particular, to potential technological applications. Enormous amount of progress has been
made in the improvement in materials of high yield strength, materials with high electrical
storage capacity or in bioactive biomaterials. One also assists in the emergence of new type of
materials called "smart materials", "adaptative materials" or "stimuli responsive materials".
These are materials whose properties adapt to changes of their environment1. In the area of
responsive materials aimed at biomedical applications, the most studied stimuli are
temperature, pH, ionic strength and protein concentration. Also investigated are materials that
respond to an applied magnetic or electric field. A particularly illustrative example of this
type of material is that of surfaces covered by lower critical solution temperature (LCST)
polymers such as poly(N-isoprolacrylamide) (PNIPAM). For this polymer, water is a good
solvent at low temperature (T < LCST 30°C) and becomes a poor solvent at temperatures
above this value. PNIPAM chains thus adopt an extended conformation at low temperature
and a globular conformation above the LCST. Surfaces covered by such a polymer can thus
be used to adhere cells at 37°C, a temperature at which water is a poor solvent and to release
the cells when the temperature is lowered below the LCST, restoring the initial surface.2
Another example of application of these PNIPAM polymers is by modifying them chemically
by anchoring crown ethers onto them. The interaction of these polymers with different ions
changes their LCST. Thus, when working at constant temperature, an increase of ion
concentration can render water a good solvent, decreasing the ion concentration can render
water a poor solvent. This then directly affects the polymer conformation which adopts an
extended coil at high ion concentration and a globule conformation at low ion concentration.
By anchoring these polymers onto porous materials one can create an ion gate that closes as
soon as the concentration of specific ions reaches a critical concentration.3
Using proteins that change conformation in the presence of specific ligand molecules
allows creating another type of responsive materials namely materials that change shape in the
presence of the ligands. Sui et al. used for example calmodulin, a protein that undergoes a
rapid but reversible transformation from an extended dumbbell to a collapsed conformation in
response to binding of small drug or peptide molecules. They created a material where
calmodulin molecules were linked by poly(ethyleneglycol) chains and that changes shape
reversibly in the presence of calmodulin ligands.4 Recently the group of Kumacheva reported
4
a hydrogel that can undergo two different shape changes when submitted to two different
triggers namely a change in temperature and a change in the CO2 concentration of the
contacting liquid.5 These examples represent only a few of a numerous list of reported stimuli
responsive materials.
Despite the great activity in this field, only very few works report materials that
respond to a mechanical stress such as a stretching. Such materials are called
mechanoresponsive. Most of the mechanoresponsive materials reported so far change color
under a mechanical stimulus. This color change can result from structural changes of the
material6 or chemical reactions induced by the mechanical stress7. Since more than 8 years the
group of P. Schaaf at the Institut Charles Sadron in collaboration with the Unité INSERM
"Biomatériaux et bioingénierie" and the Institut des Surfaces et Matériaux de Mulhouse tries
to develop systems that respond chemically or biologically by promoting cell adhesion
triggered by a mechanical stimulus, namely triggered by stretching. Such systems can be
called chemo and/or cyto-mechanoresponsive. Two types of systems can be envisioned:
"bulk" systems and responsive surfaces. In "bulk" systems the active molecules are embedded
in the bulk of the material. These molecules either change their chemical nature or their
conformation during stretching or interact with other molecules that diffuse from outside into
the material, these processes taking place only when the material is under stretching. As far as
surfaces are concerned they can be rendered mechanically active either by becoming
accessible to "ligands" with which they interact or by changing conformation during
stretching.
In order to develop such systems one relies on elastomers. Their surface can be
functionalized to become mechanically responsive or the elastomer can play the role of
mechanical support for another material which is more fragile. Cross-linked
poly(dimethylsiloxane) (PDMS) sheets (silicone) constitute elastomers that appear at first
sight as a good choice to develop such systems: silicones are highly elastic with a high
ultimate strain, they are fairly transparent which is of importance for microscopy techniques
and they are biocompatible which can be of interest for cellular experiments. Yet silicones
have also some drawbacks: they are chemically inert and thus difficult to functionalize. Even
when functionalized, their properties change slowly with time due to diffusion of low
molecular weight PDMS chains out of the material. Nevertheless, we have chosen this
material as substrate to develop mechanically responsive systems. Two main strategies were
followed in the past in our laboratory to modify the silicone surface. The first strategy consists
in creating systems based on polyelectrolyte multilayers that are deposited onto the silicone

5
sheets. By stretching the silicone sheet, the multilayers are also stretched. If active molecules
are embedded in these films they can become accessible to their environment. The other
strategy consists of modifying the silicone sheets by polymer plasma in order to be able to
further functionalize them with polymer brushes. By stretching one modifies the brush density
and eventually exhibits active sites.
The goal of my thesis was to develop new strategies and processes to design chemo-
mechanoresponsive surfaces. Plasma polymerization is a very powerful technique for
surface modification of polymeric materials. Yet it requires a special experimental set-up and
an experience that is not usually available in research laboratories. Our first task was thus to
find an alternative of surface treatment of the silicone substrates that allows grafting polymer
brushes and that leaves the silicone surface elastic (no cracks while stretching). We have
developed a method based on UV-Ozone (UVO) surface exposition and further chemical
surface modification leading to the introduction of versatile chemical groups on substrate:
thiol or methacrylate groups. This way of chemical grafting has been done through a
silanization step realized immediately after the UVO treatment. Several techniques like IR,
contact angle measurements, optical, electronic and atomic force microscopies were
investigated to characterize the resulting modified surface at rest and under stretching. Thus,
by anchoring maleimide-poly(ethylene glycol) (Mal-PEG) chains and maleimide-biotin
ligands onto thiols-covered substrates (by using the maleimide-thiol click reaction) we created
substrates that become adsorptive to streptavidin under stretching (and antifouling at rest).
Yet, our systems were not reversible when returning to the non-stretched state. Moreover, we
could not obtain surfaces that were fully homogeneous. This work is described in chapter 4.
Next we wanted to develop bulk materials that respond to stretching. We selected
poly(acrylamide) (PAM) hydrogels into which we wanted to covalently attach enzymes or
mechanophore molecules. This kind of chemical gel is a very common hydrogel that has been
intensively used to introduce covalent entities in its polymeric network. When stretching the
PAM gel, the enzymes or the mechanophore molecules should change conformation and thus
change their activity or emission spectrum respectively. Polyacrylamide gels prove to be very
fragile and are thus difficult to stretch. For this reason we tried to covalently anchor PAM gels
onto silicone substrates which provide the mechanical resistance. Based on the UV-ozone
silicone treatment introduced to create brush systems, we thus developed a method that allows
getting covalently attached PAM gels onto silicone sheets. A layer of methacrylate groups
was introduced on the silicone substrate through chemical silanization. Then, in presence of
all the constituting partners of the PAM in water, and the methacrylate-modified silicone
6
substrate, the radical polymerisation is initiated. The resulting PAM hydrogel is thus
covalently and strongly attached on the silicone sheet. Under stretching, the gels do not crack
and remain firmly attached to the substrate. This is, to our knowledge, the first reported
method that allows to covalently attach a macroscopic sized hydrogel onto a silicone
substrate. This work is presently under preparation for publication and will be described in
details in chapter 6.
Next we wanted to incorporate mechanophores into this gel. As mechanophore model
we selected bispyrene molecules which can be found in two conformations characterized by
two separate fluorescent emissions: a "closed" or stacked conformation with a characteristic
excimer emission spectrum and an "open" conformation with a characteristic monomer
spectrum. We thus synthesized bispyrene molecules which can both play the role of
mechanophore and pH sensor. These molecules are constituted of two pyrene rings linked
through a triamine linker and flanked by two arms that allow linkage to the polyacrylamide or
eventually to another polymer matrix. The idea was that when the polyacrylamide gel is in the
non-stretched state, the bispyrene molecules adopt a stacked conformation and when brought
under stretching, they adopt an open conformation. Unfortunately our model of
mechanophore has adopted an open conformation already rest. They could thus not be used as
an effective mechanophores. However, in order to value our molecules we used their
properties to be bifunctional and pH sensitive. By ending their two lateral arms with azide
moieties, we could use them as bifunctional linkers to be clicked with alkyne bearing
polyelectrolytes. We made use of such a system to investigate the behaviour of the one-pot
morphogen film driven constructions, a concept recently introduced by our group and that
allows building films at an electrode by generating Cu(I) from Cu(II). Cu(I) acts as a catalyst
for the azide/alkyne click reaction and allows films to build under the presence of an
electrochemical trigger, exclusively from the substrate. Using our bispyrene molecules which
can be found in two conformations, open and closed according to pH, we have shown that
poly(acrylic acid) based film is not sensitive to the external pH on a large scale and has an
interesting swelling/deswelling behaviour during pH variation. This work let to a publication
in "Soft Matter" which is presented in chapter 3.
We also modified enzymes, β-Galactosidase, by grafting on their outer lysine groups,
arms that allow covalently attaching them in a polyacrylamide hydrogel. Unfortunately we did
not achieve creating an enzymatically active polyacrylamide gel. One of the reasons that we
envision for this failure is that the exothermic reaction that takes place during the gel
formation denatures the enzymes. We thus finally decided to use reticulated poly(L-
7
lysine)/hyaluronic acid (PLL/HA) polyelectrolyte multilayers as gel and to covalently attach
the enzymes inside of it, in order to create an enzymatically-mechanoresponsive systems
(chapter 5). An orthogonal bis-reticulation must be used to cross-link the PLL/HA multilayer
on one side, and then, to graft later the modified enzymes into the multilayer film by using
another kind of coupling chemistry. In order to achieve this goal, one has to proceed in three
steps: first, cross-linking the film by using the carbodiimide chemistry, let diffusing the
enzymes into the film and finally cross-linking the enzymes into the film through the
maleimide-thiol click chemistry already used in a previous part of my manuscript (chapter 4).
With this system we achieved creating enzymatically active films whose activity decreases
when stretched. This system appears to be partially reversible when returning to the non-
stretched state. The results relative to this system are currently under preparation for
publication. These results will be presented in details.
Finally, in the chapter 1 will describe the context of my PhD work, including a short
historical development of the mechanoresponsive systems since the end of the 19th century up
to now. A description of the mechanosensitive processes in biological systems and the
contribution of my group in the field of mechanoresponsive systems will complete this first
chapter.
The material and the general methods used to realize the work presented in the
chapters 3, 4, 5 and 6 are reported in chapter 2. It must be noted that to avoid repeating
experimental sections in this chapter, the Material and Methods already described in the
drafts of publication (chapter 5 and 6) or in published work (chapter 3) have not been repeated
in chapter 2.

8
Chapter 1
State of the art

9
1.1 A historical perspective
Mechanical force is a notion that is taught in physics courses but that is rarely
mentioned in chemistry. Does it mean that mechanical forces have no influence on chemical
reactions or chemical processes? Biology proves the contrary. At the end of the 19th century,
Julius Wolff made the first observation that bones develop their structure along force lines.8
This means that cells involved in bone development must be able to sense forces. More
recently researchers became aware of the fact that stem cells develop different phenotypes
depending on the mechanical properties of their environment.9 Again, this requires that stem
cells are able to sense the mechanical properties of a substrate and transduce mechanical
information into intra-cellular chemical signals. The understanding of the molecular
mechanisms behind these sensing processes of cells has become a very active field of research
and these mechanisms can be a source of inspiration to develop mechanoresponsive systems.
We will shortly discuss some of these mechanisms later. Yet, even if chemists seldom refer to
mechanical forces, as early as 1930 Staudinger mentioned a reduction in the molecular weight
of polymers in response to mastication and he suggested that this might be due to homolytic
carbon-carbon bond cleavage induced by mechanical forces.10 Later, in 1940, Kauzmann and
Eyring predicted that stretching specific bonds within a molecule could result in lowering the
activation barrier associated with homolytic dissociation by altering the potential energy
landscape of the reaction coordinates.11 This prediction was further validated experimentally
since and it was found that bond cleavage induced by mechanical stress exerted on polymer
chains occurs more easily for certain chemical bonds than for others. For example, by
applying ultrasounds onto polymeric systems Encina and co-workers have shown that
peroxide links break ten times faster than carbon-carbon bonds.12 Very recently the group of
Fernandez showed, through elegant AFM force experiments, that reduction of disulfide bonds
catalyzed by Escherichia coli thioreredoxin is enhanced when the bond is subjected to strong
enough a pulling force.13 The enhancement of the bond breakage seems to follow Bell type
law as a function of the applied force, TkExFAFr Ba /.exp. , where Fr represents
the unbinding rate as a function of the applied pulling force F, A represents a natural
frequency of attempt to rupture the bond, x is the distance from an equilibrium position to
the transition state of the reaction, aE is the activation energy of the reaction, Bk and T are
respectively the Boltzmann constant and the temperature.14 This law was introduced by Bell
in 1978 to describe ligand/receptor forces acting during cell adhesion.15 Yet it is found that
the reduction of disulfide bonds in proteins does not always increase with the applied tensile

10
force. In the presence of thioredoxin it is decelerated at low pulling forces (below 200 pN)
and it is almost insensitive to the pulling force when the reduction reaction is catalyzed by
metal ions.16 Baldus and Gräter predicted, through hybrid quantum and molecular mechanical
calculations that redox potentials of disulfide bonds increase when pulling forces are
increased from 30 to 3300 pN.17
Ultrasounds applied on polymer chains have proven to be a very efficient source for
activating reactions through mechanical force. The application of ultrasounds generates
cavitation bubbles. During their creation, these bubbles violently aspirate the polymer chains
which are then subject to strong mechanical stress.18 Moore, Sottos and White started
exploring this field by incorporating benzocyclobutene into poly(ethylene glycol) chains such
that the relative stereochemistry of the polymer attachment points on the benzocyclobutene
were either cis or trans.19 These chains were than subjected to ultrasounds and the putative
ortho-quinodimethide products of the mechanical activation were selectively trapped with a
maleimide derivative through a [4+2] cycloaddition. Interestingly, only a single isomer was
observed, regardless of the stereochemistry of the benzocyclobutene starting material. This
indicates that the cis and trans substituted benzocyclobutene underwent a disrotatory
electrocyclic ring opening reaction to afford the same ortho-quinodimethide isomer. Yet this
result is in violation with the Woodward – Hoffmann rule. It thus seems that thermal
activation and mechanical activation reactions do not always follow the same reaction path.
Piermattei et al. used also ultrasounds to show that mechanical forces can be used to
break bonds between a metal and one of its ligands when incorporated into polymer chains.
This can be used to activate a latent organocatalyst which catalyzes a transesterification
reaction for example.20 But most of the advances in this field concern materials that change
colour upon stretching. This property is particularly interesting since it allows developping
materials that report their points of weakness. This is achieved in different ways. The groups
of Sottos and of Moore have incorporated mechanophores into polymer chains that under
tensile stress undergo an internal chemical reaction that leads to a change of colour.21 More
precisely they have introduce spiropyran molecules into poly(methyl acrylate) chains that
were cross-linked into a poly(methyl methacrylate) matrix. Under stress, spiropyran
undergoes an electrocyclic ring-opening reaction and transforms into merocyanine leading to
a strong colour change of the material (figure 1.1).

11
Figure 1.1: Polymethylacrylate sample into which were incorporated chains containing the
mechanophore spiropyrane (left) that reacts internally to become merocyanine under
stretching (right). Images taken from ref 7.
Since this pioneering work many more polymeric systems incorporating
mechanophores based on electrocyclic ring opening reactions have been reported. For
example, in 2009, Craig and co-workers reported that gem-dichlorocyclopropanes
incorporated into polymer backbones could also undergo force-induced electrocyclic ring
opening reactions.22 Using a gem-dichlorocyclopropanated indene incorporated into a cross-
linked poly(methylacrylate) material, the group of Moore reported recently a new type of
material which under compression releases protons (mechanogenerated acid). This is due to a
force dependent rearrangement that results in a proton elimination.23
Clark and co-workers reported a polymer-protein hybrid material which changes its
fluorescence properties when submitted to stress (figure 1.2).24 This material relies on a new
type of protein-based nano-sensor able to report a matrix deformation. This nano-sensor is
composed of two cavities that are covalently coupled one to each other and that permanently
entrap a pair of donor-acceptor fluorescent proteins giving the possibility for FRET to occur.
Under stress, the matrix deforms and these deformations induce a nanometer size separation
of the two cavities. This then leads to a FRET reduction. This reduction is very sensitive to
Angstrom separations in the material.

12
Figure 1.2: Concept of mechano-sensors based on FRET between two fluorescent proteins
encapsulated in two cavities of a thermosome. Deformation increases the distance between the
two fluorescent molecules resulting in a reduced FRET process. Image taken from ref. 25
As already mentioned, AFM offers a unique opportunity to sense the effect of
mechanical force onto single molecules. Gaub was the first to perform single molecule AFM
experiments in which he pulled on single titin proteins. By repeatedly stretching the protein he
showed the reversible unfolding of individual immunoglobulin domains (figure 1.3).26
Figure 1.3: AFM stretching curve of four immunoglobulin domain. One observes the
unfolding of the different domains during stretching. Image taken from ref. 26
This work showed that one can reversibly change the conformation of proteins by
AFM and opened the route towards single molecule stretching experiments. Later on Gaub
and coworkers used this same technique to apply forces onto an enzyme, lipase B from

13
Candida Antartica. They applied a periodic stretching-release protocol on the enzyme and
found that not the force but the release of the force triggers the enzymatic activity.27 This
seems to be due to the release of the constraint on the enzyme allowing the proteins to
rearrange along a given path which goes through activation sites in the free energy landscape.
In 2010 Tseng at al. addressed the problem of the coupling between mechanics and
chemistry in an enzyme through equilibrium experiments.28 The enzyme was deformed
through a DNA molecular spring method (figure 1.4) and the effect on the chemical reaction
it catalyzes was determined.
Figure 1.4: Representation of the DNA molecular spring method. A single stranded DNA is
covalently coupled on an enzyme at two defined positions. When interacting with the
complementary strand, the DNA stiffens inducing tension in the enzyme. The enzymatic
activity of the enzyme is then measured. Image taken from ref. 28
As enzyme they used guanylate kinase that was modified such as to create a protein-
DNA chimera. Depending of the ligation position of the DNA and its length, they found that
the enzyme activity was reduced and the reduction was stronger for shorter DNA (larger
strength exerted by the DNA on the enzyme) even if the effect remains moderate (less than
10% reduction on the kinetic parameters).
1.2 Mechanochemistry in biological systems
One of the great differences between proteins and small molecules is their secondary,
ternary and quaternary structure and their flexibility. These properties allow conformational
changes of the proteins in a predetermined way under external stimuli and in particular under
external forces. There are several mechanisms by which cells transform a force into a

14
chemical signal. One of them is based on force-induced conformational changes in proteins,
and in particular in adhesive proteins. These then modify the interactions between these
proteins and their ligands. There are several different ways in which a force can modify the
affinity of a protein towards its ligand: (1) by modifying the conformation of a domain of the
protein that allosterically regulates the binding site; (2) by exposing active sites that are buried
in the native conformation (cryptic sites).
1.2.1 Enhancement of mechanical forces due to allosteric regulation
Cellular adhesion is mediated through adhesion proteins that bind ligands often in an
external force responsive way. One prominent example is provided by leukocytes which, in
response to an inflammatory process, are recruited from the bloodstream. The adhesion of
leukocytes on blood vessels takes place through a variety of interactions, among them
selectin-ligand and a subset of integrin-ligand interactions support rolling. The whole process
takes place under hydrodynamic shear forces and nature has optimised the structure of the
involved proteins to respond to this stress. Whereas for most ligand-receptor complexes, the
lifetime decreases as a tensile force is applied on them (slip bonds), for selectin and integrins
this bond lifetime first increases when the force strength increases, up to a critical force before
decreasing at even higher forces (catch bonds). Selectins contain a ligand-binding lectin
domain that binds in particular to the primary ligands P-selecting glycoprotein ligand 1
(PSGL-1), an epidermal growth factor-like (EGF) domain, multiple short consensus repeat
domains, a transmembrane domain and a short cytoplasmic domain. They are found in two
different conformations: a bent conformation in which the lectin and the EGF domains form
an angle lying between 116° and 121° corresponding to a low affinity state towards PSGL-1
binding and an extended conformation in which the two domains form an angle lying between
149° and 154° and which corresponds to a high affinity state towards PSGL-1 binding 29.
Forces exerted throughout the length of the receptor/ligand complex favour energetically the
extended conformation and thus induce a transition from the bent to the extended
conformation and thus from the low to the high affinity state (figure 1.5). This explains the
increase of the lifetime of the complex as the force increases.29

15
Figure 1.5: Model for the conformational change of P-selectin under tensile force. In the
absence of force the protein is in a bent conformation. Under tensile force the protein takes an
extended conformation. The binding to receptors is different in these two conformations.
Image taken from ref. 29
A similar force regulated binding strength takes place on integrins binding to
intercellular adhesion molecule-1 (ICAM-1). Integrins are heterodimer molecules constituted
of two units, and , which mediate cell-cell and cell-extracellular matrix interactions. The
integrin subunit contains a domain known as the integrated (I) domain which is a major
binding site. This domain is constituted of seven helices surrounding a central, six-stranded
sheet. The C- and N- termini of the I domain are close one to each other on the "lower"
face whereas the upper face is a metal-ion dependent adhesion site (MIDAS). Domain I can
be found in two different states, a high-affinity and a low affinity state towards ligand.30
When an integrin binds an ICAM-1 on a substrate in shear flow, a tensile force tends to
lengthen the molecules. Due to this force, one of the helices, 7, of the integrin is displaced
axially towards its C-terminus which stabilizes the high affinity conformation of domain I.31
A general picture of conformational changes induced by mechanical forces leading to higher
receptor affinity is presented in figure 1.6.

16
Figure 1.6: (left) schematic representation of the conformational change of domain I of L2
binding to intercellular adhesion molecule-1 (ICAM-1). (right) Representation of the
conformational changes of Integring domain I under tensile force : (A) Bent conformation of
the L2 integrin extracellular domain I with the closed headpiece and low affinity I domain;
(B) Extended conformation with the open headpiece high affinity I domain and bound ICAM-
1. Images taken from ref. 30, 31
Another example of catch bonds is provided by the bacterial adhesive protein, FimH,
which is the terminal adhesin on type 1 fimbriae, and which binds carbohydrate mannose and
mediates weak bacterial adhesion at low flow and strong adhesion at high flow. FimH has
two domains, a pilin domain that integrates FimH into the fimbriae and a lectin domain that
binds to mannose. A linker chain connects the two domains. Steered Molecular Dynamics
suggest that tensile forces applied on the N and C terminus of the lectin domain induce an
extension in the linker domain.32 It was also shown that the disruption between the lectin and
the pilin domains by a structural mutation of the interdomain increases the affinity of the
lectin for mannose by up to 300 times.33 The interdomain thus regulates, in an allosteric way,
the mannose binding domain and this also explains the increase of binding under shear force:
as for selectins, the application of a force induces a conformational change in the protein
which switches allosterically the binding domain from a low to a high affinity state.
1.2.2 Cryptic site proteins
Integrins play a crucial role in mechanostransduction as they are one of the major
adhesion components that transfer a signal from the extracellular matrix to the cytoplasm.
Outside of the cell, integrins are coupled to extracellular matrix proteins such as fibronectin;

17
inside of the cell they are coupled to proteins such as talin or filamins that make the link with
the cytoskeleton. One way in which a force is converted into a biochemical signal, a stronger
bonding for example, is by exhibiting cryptic sites. These sites are buried inside the protein in
its unconstrained state whereas they become accessible when the protein is stretched under a
tensile force. Fibronectin, for example, is constituted of more than 50 module repeats, many
of them possessing an RGD adhesion sequence buried in their interior. Under tensile force,
these modules partially unfold, exposing their adhesion site which is recognized by integrins.
Moreover, the sequential unfolding of the modules can signal the magnitude of the stress that
is acting on the protein.34
Inside of the cell one important adhesion player is talin. Talin couples the cytoskeleton
to the extracellular matrix through integrins. It can bind to vinculin for assembly and
reorganization of the actin cytoskeleton. Talin is constituted of a head that binds and activates
integrins and of a rod that contains bundles of -helices with up to 11 buried vinculin binding
sites. These sites become exposed by the application of a tensile force that stretches the
molecule by a sequential unfolding of the helical bundles (figure 1.7).35
Figure 1.7: Representation of a domain of Talin (A) at rest; (B) under stretch. Under stretch the
domain unfolds exhibiting an interaction domain with Vinculin (C). Image taken from ref 36.
Filamins constitute another family of proteins that connect transmembrane receptors
such as integrins to actin. Filamins are dimeric proteins that consist of an N-terminal actin
binding domain followed by 24 immunoglobulin-like domains (FLNa1-24).37 Filamins bind
the integrins through interactions between the cytoplasmic tails of the integrin chains and

18
CD faces of FLNa19 and FLNa21. However, these CD faces are masked by the A-strand of
the preceding FLNa18 and FLNa20 domains, thus inhibiting integrin binding.14 Steered
Molecular Dynamics (SMD) simulations suggest that the CD faces of FLNa19 and FLNa21
become exposed as a force applies to the filamin rod. The force induces an unraveling of the
filamin fragment structure via a displacement of the A-strand and a dissociation of the
domain-domain interactions. Folding of the integrin binding domains FLNa19 and FLNa21
remain intact. This process exposes the binding of filamin to the integrin cytoplasmic tail
allowing for the interaction to take place.38
1.3 Cryptic site substrates
It thus clearly appears that the first steps of the mechanism by which cells transform
mechanical information into a chemical signal involve conformational changes of proteins by
which cryptic sites become accessible for interaction with other proteins. Exhibiting crytic
sites or molecules by stretching a material or a surface is the strategy followed by the group in
which I performed my PhD work to create chemo or cyto mechanoresponsive substrates. We
will now briefly review the research done in this field since 2005 by our group. Two routes
were followed to develop such substrates: one route was based on polyelectrolyte multilayers
and one route was based on grafting polymer brushes directly on silicone sheets.
1.3.1 Polyelectrolyte multilayer based mechanoresponsive systems
Polyelectrolyte multilayers are obtained by bringing a substrate alternately in contact
with a polyanion and a polycation solution.39 This concept was introduced in 1991 by
Decher.40 There exist two kinds of polyelectrolyte multilayers. The first multilayers that were
discovered correspond to films whose thickness increases linearly with the number of
deposition steps. These films are nicely stratified39 and no polyelectrolyte can diffuse through
the film. The two most studied linearly growing polyelectrolyte multilayers are poly(styrene
sulfonate)/poly(allylamine hydrochloride) (PSS/PAH) and poly(acrylic acid)/poly(diallyl
dimethyl ammonium chloride) (PAA/PDADMA). In 1999 Elbert et al. discovered a second
kind of multilayers, namely films whose thickness increases exponentially with the number of
deposition steps.41 Picart et al. showed that this growth behaviour is due to the fact that at
least one of the two polyelectrolytes participating in the film construction diffuses in and out
of the film at each bilayer deposition step.42 These films correspond in fact to gel-like
structures into which one can incorporate proteins and enzymes which can diffuse in the

19
film.43 It was also found that polyelectrolyte multilayers preserve the enzymatic activity.
Garza et al.44 showed that one can deposit linearly growing films on top of exponentially
growing ones and that the linearly growing film then acts as a barrier towards the diffusion of
polyelectrolytes from the solution into the exponentially growing multilayer. This type of
architecture is called a reservoir-barrier architecture.
In a first study two linearly growing multilayers were deposited one on top of the
other, namely a poly(acrylic acid)/poly(allylamine hydrochloride) film on top of a Nafion/
poly(allylamine hydrochloride). This structure was deposited on a silicone substrate that could
be stretched. Nafion being hydrophobic and the (PAA/PAH) film being hydrophilic, one
observed a reversible hydrophobicity change during stretching/unstretching cycles. The
amplitude of the hydrophobicity changes, measured by changes in the water contact angle,
were important (variations of the water contact angle between 110 and 50°) when the ending
(PAA/PAH) multilayer was constituted of two bilayers whereas changes of less than 10° were
observed when the (PAA/PAH) film was constituted of 4 bilayers. The reversible change in
hydrophobicity was interpreted as being due to a thinning of the ending multilayer under
stretching, leading to the appearance of Nafion that comes in contact with water. Yet when the
outer multilayer becomes too thick, Nafion remains always embedded under the PAA/PAH
multilayer, whatever the stretching degree.45
Next the behaviour under stretching of reservoir-barrier structures was investigated
with the idea to open the barrier under stretching and to close it again when returning to the
non-stretched state. Two types of architectures were investigated (HA/PLL)-(PSS/PAH) and
(HA/PLL)-(PSS/PDADMA) (HA: hyaluronic acid; PLL: poly(L-lysine)) where (HA/PLL) is
an exponentially growing film which plays the role of reservoir and (PSS/PAH) and
(PSS/PDADMA) are two linearly growing films which play the role of barrier. Whereas
stretching the film induced cracks in the (PSS/PAH) multilayer which appears brittle, holes in
the nanometer range formed with the (PSS/PDADMA) multilayer. When returning to the non-
stretched state, the cracks closed and the two sides of the cracks became adjacent for
(PSS/PAH) leading to a partial healing (figure 1.8).

20
Figure 1.8: (left) Confocal laser microscopy image of a (PLL/HA)30/PLLRho/(HA/PLL)/
(PSS/PAH)30/(HA/PLL)30(HA/PLLFITC) under stretching (top) and after coming back to rest
(bottom). Image taken from ref.46 (right): Fluorescence microscopy image of a
(PLL/HA)30/PLLRho/(HA/PLL)/(PSS/PDADMA)5/(HA/PLL)30(HA/PLLFITC) film under
stretching. One observes nanovalves all over the surface. Image taken from ref. 47
For the (PSS/PDADMA) case, the holes disappeared so that the system healed
totally.46, 47 These results were obtained by bringing the film in contact with the
polyelectrolyte solutions during 10 minutes during each deposition step. Yet the linearly
growing film is deposited on top of an exponentially growing one into which polyelectrolytes
can diffuse and even exchange with polyelectrolyte chains already present in the film. This
renders the buildup process sensitive to the contact time between the film and the
polyelectrolyte solutions during the deposition steps. It was shown more recently that by
reducing this contact time, no holes forms anymore under stretching for the (PSS/PDADMA)
barrier and the barrier can remain tied under stretching when the number of bilayers
constituting the barrier exceeds four.48, 49
This observation led to the development of the first substrate that became
enzymatically active under stretching in a partially reversible way.48 This substrate was
constituted of a (HA/PLL)-(PSS/PDADMA) architecture where an enzyme, alkaline
phosphatase, was incorporated in the reservoir. The film was deposited on a silicone sheet.
Alkaline phosphatase is a hydrolase enzyme responsible for dephosphorylation of many types
of molecules, including fluorescein diphosphate (FDP). FDP is a non-fluorescent substrate
and hydrolysis of its two phosphate substituents mediated by alkaline phosphatase yields
weakly fluorescent fluorescein monophosphate followed by strongly fluorescent fluorescein.
FDP was present in the solution in contact with this film. In the absence of stretching, the

21
(PSS/PDADMA) multilayer played the role of barrier towards FDP. When the film was
stretched above 70% a strong fluorescence increase was observed in the solution indicating
that the enzymes became accessible to the substrate and remained active. When returning to
the non-stretched state, the enzymatic activity was again strongly (but not totally) inhibited
indicating reversibility of the system. It was shown that the (PSS/PDADMA) multilayer
remained tied to FDP and that the enzymes present in the reservoir were exhibited through the
barrier. This system can thus be qualified as the first cryptic site substrate. It is schematically
represented in figure 1.9.
Figure 1.9: Schematic representation of the first enzymatic mechano-responsive film.
Enzymes are embedded in a (HA/PLL) multilayer that is capped by a (PSS/PDADMA)
multilayer playing the role of barrier towards the substrate of the enzyme. Under stretching
the enzymes becomes accessible to its substrate and the reaction takes place. This system is
close to reversible. Image taken ref.48
More recently the same concept was applied but in the reverse way, namely by
incorporating the substrate FDP in the reservoir and by anchoring, on top of the
(PSS/PDADMA) barrier the enzyme alkaline phosphatase.50 At rest the film was inactive and
by stretching fluorescein diffused from the film towards the solution. This was due to the fact
that by stretching the FDP substrate could come in contact with the enzymes and that

22
fluorescein, the product of the reaction, diffused into the solution. Unfortunately this system
was not reversible.
Polyelectrolyte multilayers were also used in another way to create chemoresponsive
substrates. Poly(acrylic acid) chains were chemically modified by grafting onto them
phosphorylcholine moieties through short ethylene oxide linkers (EO)3 (PAA-PC chains). The
grafting ratio was about 25%. Phosphorycholine groups cover the outer membrane of red
blood cells and are responsible for their non-thrombogenic character.51 These chains were
then used to built PEI/(PSS/PAH)3/PSS/(PAH/PAA-PC)2 multilayer architectures which were
deposited on silicone sheets. These films proved to be antifouling (no protein adsorption and
no cell adhesion) at rest and under stretching at least up to a stretching degree of 50%.52 These
films were further functionalized by incorporating, between the (PSS/PAH)3 and the
(PAH/PAA-PC)2 multilayers one layer of PAA chains modified by grafting biotin or
(arginine-glycine-aspartactic acid) (RGD) peptides again linked to the PAA chains through an
(EO)3 linker. Biotin is a ligand of streptavidin and the biotin/streptavidin bond is one of the
strongest non-covalent bonds reported in biology (for a schematic representation see figure
1.10).53
Figure 1.10: (top) Schematic representation of the fist cryptic surface film based on
embedding ligands (her RGD peptides) under a multilayer (PAH/PAA-CP). (bottom left)
Cells deposited on a non stretched films do not adhere; (bottom right) When stretched the film
becomes cell adherent due to RGD peptide exhibition. Images taken from ref54.

23
RGD peptides are known to promote cell adhesion through interactions with integrins.
At rest these architectures remain antifouling and no interaction is observed with streptavidin
(in the case of biotin) or cells in the case of RGD. By stretching these films up to 50%, they
become specifically interacting with streptavidin and adherent to cells. The amount of
streptavidin depositing on a stretched film increases linearly with the stretching degree up to
50% of stretching.54 This shows that stretching these architectures renders ligands accessible
to their receptors. Yet this system was not reversible: when returning to the non-stretched
state the substrate remained interactive with streptavidin or cells.
1.3.2 Responsive systems based on poly(ethylene oxide) brushes55
The latter system we just described was based both on polyelectrolyte multilayers and
on short PEO-PC chains extending into the solution. Another strategy to built cryptic site
substrates was based on poly(ethylene oxide) chains of mass of about 2000 (45 monomers)
and NH2-(EO)3-biotin or NH2-(EO)3-RGD peptides that are directly anchored onto silicone
sheets. In order to achieve the grafting onto the silicone sheets, the substrate was first
modified by plasma polymerization of maleic anhydride resulting in an anhydride maleic
polymer film deposited on the silicone substrate. The anhydride maleic groups were then
hydrolysed through contact with water resulting in a surface covered by carboxylic groups.
The difficulty of this type of functionalization is to sufficiently cover the surface yet not to
render the functionalized surface brittle which would result in cracks during stretching.56
Once this functionalization was achieved, PEO chains ending by an amine group were
covalently fixed onto the surface through EDC/NHS chemistry performed under stretching at
60°C. In a second step, ligands, biotin or RGD peptides, terminated by an amine were
covalently anchored onto the remaining non-reacted carboxylic groups under stretching.
When returning to the non-stretched state, this system appeared anti-fouling, non-interacting
with streptavidin and non cell adherent. Under stretching streptavidin interacted with the
surface and cells adhered readily. When returning to the non stretched state the system
returned to its initial state. The postulated mechanism is schematically represented in figure
1.11. The mechanoresponsive process appears that totally reversible and this appears to be the
first reversible cyto and chemo mechanoresponsive system. One of our goals was to achieve a
similar system, yet without using plasma polymerisation, a technique that is readily available
in most chemistry laboratories.

24
Figure 1.11: Schematic representation of the first fully reversible cyto and chemo mechano-
responsive film. The grafting of the PEG chains and the biotin (or RGD) ligands is based on a
first functionalization of the silicone substrate (yellow) by polymer plasma treatment. Image
taken from ref. 55
1.4 Summary
In the last decade, important breakthroughs have been reported in the field of
mechanoresponsive material design. Most of these works does concern exclusively the
transduction of a mechanical force into a changing of colour (or fluorescence emission) of the
material. The reason for this is not a lack of originality but rather due to the impossibility to
get another outcome. Indeed, the mechanophore-contained materials investigated, such as
polyethylene or polymethylmethacrylate, are mainly inert to their environment: they cannot
communicate with the surrounding media through exchange with solution (aqueous or
organic) or air, except displaying a colour. Thus, the transformation of the mechanical stress
undergone by the material cannot lead to a change of a catalytic reaction, a releasing of
compounds or a recognition process: only the emission of light seems to be the response of
these kinds of systems. In all these mecanoresponsive material, the strategy systematically
involved is founded on the molecular incorporation of the mecanophore into the polymeric
architecture of the material. Thus, the host material chosen is of crucial importance because it
must be both resistant to stress and elastic to be reversibly mechanoresponsive. It most cases,
this last feature is not met.
The contribution of my group is based on another strategy inspired from nature: use
cryptic site pocket to design a new kind of mechanoresponsive systems. An important
contribution has been reported since 2005 in the literature, as described in this first chapter. In
this strategy, only the material will undergo the mechanical force. The consequence of this

25
force is to reveal active sites, which were not accessible before the imposition of the stress.
By using multilayer films or PEG brushes, these aqueous based systems in essence can
exchange and thus communicate with their environment through water. This property let
hopes to design a new class of 2D or 3D mechanoresponsive systems able to recognize
molecules specifically and have catalytic activity triggered by a mechanical force. This was
the aim of my PhD project: “Design of mechanoresponsive surfaces and materials”.
1.5 References
1. Stuart, M. A. C.; Huck, W. T. S.; Genzer, J.; Muller, M.; Ober, C.; Stamm, M.;
Sukhorukov, G. B.; Szleifer, I.; Tsukruk, V. V.; Urban, M.; Winnik, F.; Zauscher, S.;
Luzinov, I.; Minko, S., Emerging applications of stimuli-responsive polymer materials.
Nature Materials 9, 101-113.
2. Yamada, N.; Okano, T.; Sakai, H.; Karikusa, F.; Sawasaki, Y.; Sakurai, Y.,
Thermoresponsive Polymeric Surfaces - Control of Attachment and Detachment of Cultured-
Cells. Makromol. Chem-Rapid 1990, 11, 571-576.
3. Ito, T.; Hioki, T.; Yamaguchi, T.; Shinbo, T.; Nakao, S.; Kimura, S., Development of a
molecular recognition ion gating membrane and estimation of its pore size control. Journal of
the American Chemical Society 2002, 124, 7840-7846.
4. Sui, Z. J.; King, W. J.; Murphy, W. L., Dynamic materials based on a protein
conformational change. Advanced Materials 2007, 19, 3377-3380.
5. Lukach, A.; Liu, K.; Therien-Aubin, H.; Kumacheva, E., Controlling the Degree of
Polymerization, Bond Lengths, and Bond Angles of Plasmonic Polymers. Journal of the
American Chemical Society 2013, 134, 18853-18859.
6. Lott, J.; Weder, C., Luminescent Mechanochromic Sensors Based on Poly(vinylidene
fluoride) and Excimer-Forming p-Phenylene Vinylene Dyes. Macromolecular Chemistry and
Physics 2010, 211, 28-34.
7. Davis, D. A.; Hamilton, A.; Yang, J.; Cremar, L. D.; Van Gough, D.; Potisek, S. L.; Ong,
M. T.; Braun, P. V.; Martinez, T. J.; White, S. R.; Moore, J. S.; Sottos, N. R., Force-induced
activation of covalent bonds in mechanoresponsive polymeric materials. Nature 2009, 459, 68
- 72.
8. Wolff, J., The law of bone remodelling, Berlin, Heidelberg, New York, Springer, 1986
(translation of the German 1892 edition)
26
9. Engler, A. J.; Sen, S.; Sweeney, H. L.; Discher, D. E., Matrix elasticity directs stem cell
lineage specification. Cell 2006, 126, 677-689.
10. Staudinger, H.; Bondy, H. F., Uber Isopren und Kautschuk 19. Mitteil.): Uber die
Molekuhlgrosse des Kautschuks und der Balata. Ber. Dtsch. Chem. Ges. 1930, 63, 734.
11. Kauzmann, W.; Eyring, H., The Viscous Flow of Large Molecules. J. Am. Chem. Soc.
1940, 62, 3113-3125.
12. Encina, M. V.; Lissi, E.; Sarasua, M.; Gargallo, L.; Radic, D., Ultrasonic Degradation of
Polyvinylpyrrolidone - Effect of Peroxide Linkages. Journal of Polymer Science Part C-
Polymer Letters 1980, 18, 757-760.
13. Wiita, A. P.; Perez-Jimenez, R.; Walther, K. A.; Grater, F.; Berne, B. J.; Holmgren, A.;
Sanchez-Ruiz, J. M.; Fernandez, J. M., Probing the chemistry of thioredoxin catalysis with
force. Nature 2007, 450, 124-130.
14. Alegre-Cebollada, J.; Perez-Jimenez, R.; Kosuri, P.; Fernandez, J. M., Single-molecule
Force Spectroscopy Approach to Enzyme Catalysis. Journal of Biological Chemistry 2010,
285, 18961-18966.
15. Bell, G. I., Models for Specific Adhesion of Cells to Cells. Science 1978, 200, 618-627.
16. Perez-Jimenez, R.; Li, J. Y.; Kosuri, P.; Sanchez-Romero, I.; Wiita, A. P.; Rodriguez-
Larrea, D.; Chueca, A.; Holmgren, A.; Miranda-Vizuete, A.; Becker, K.; Cho, S. H.;
Beckwith, J.; Gelhaye, E.; Jacquot, J. P.; Gaucher, E.; Sanchez-Ruiz, J. M.; Berne, B. J.;
Fernandez, J. M., Diversity of chemical mechanisms in thioredoxin catalysis revealed by
single-molecule force spectroscopy. Nature Structural & Molecular Biology 2009, 16, 890-
U120.
17. Baldus, I. B.; Grater, F., Mechanical Force Can Fine-Tune Redox Potentials of Disulfide
Bonds. Biophysical Journal 2012, 102, 622-629.
18. Kryger, M. J.; Munaretto, A. M.; Moore, J. S., Structure-Mechanochemical Activity
Relationships for Cyclobutane Mechanophores. Journal of the American Chemical Society
2011, 133, 18992-18998.
19. Hickenboth, C. R.; Moore, J. S.; White, S. R.; Sottos, N. R.; Baudry, J.; Wilson, S. R.,
Biasing reaction pathways with mechanical force. Nature 2007, 446, 423-427.
20. Piermattei, A.; Karthikeyan, S.; Sijbesma, R. P., Activating catalysts with mechanical
force. Nature Chemistry 2009, 1, 133-137.
21. Davis, D. A.; Hamilton, A.; Yang, J. L.; Cremar, L. D.; Van Gough, D.; Potisek, S. L.;
Ong, M. T.; Braun, P. V.; Martinez, T. J.; White, S. R.; Moore, J. S.; Sottos, N. R., Force-

27
induced activation of covalent bonds in mechanoresponsive polymeric materials. Nature
2009, 459, 68-72.
22. Lenhardt, J. M.; Black, A. L.; Craig, S. L., gem-Dichlorocyclopropanes as Abundant and
Efficient Mechanophores in Polybutadiene Copolymers under Mechanical Stress. Journal of
the American Chemical Society 2009, 131, 10818-10819.
23. Diesendruck, C. E.; Steinberg, B. D.; Sugai, N.; Silberstein, M. N.; Sottos, N. R.; White,
S. R.; Braun, P. V.; Moore, J. S., Proton-Coupled Mechanochemical Transduction: A
Mechanogenerated Add. Journal of the American Chemical Society 2012, 134, 12446-12449.
24. Bruns, N.; Pustelny, K.; Bergeron, L. M.; Whitehead, T. A.; Clark, D. S., Mechanical
Nanosensor Based on FRET within a Thermosome: Damage-Reporting Polymeric Materials.
Angewandte Chemie-International Edition 2009, 48, 5666-5669.
25. Bruns, N.; Pustelny, K.; Bergeron, L. M.; Whitehead, T. A.; Clark, D. S., Mechanical
Nanosensor Based on FRET within a Thermosome: Damage-Reporting Polymeric Materials.
Angew. Chem. Int. Ed. 2009, 48, 5666-5669.
26. Rief, M.; Gautel, M.; Oesterhelt, F.; Fernandez, J. M.; Gaub, H. E., Reversible unfolding
of individual titin immunoglobulin domains by AFM. Science 1997, 276, 1109-1112.
27. Gumpp, H.; Puchner, E. M.; Zimmermann, J. L.; Gerland, U.; Gaub, H. E.; Blank, K.,
Triggering Enzymatic Activity with Force. Nano Letters 2009, 9, 3290-3295.
28. Tseng, C. Y.; Wang, A.; Zocchi, G., Mechano-chemistry of the enzyme Guanylate Kinase.
Epl 2010, 91.
29. Springer, T. A., Structural basis for selectin mechanochemistry. Proc. Natl. Acad. Sci.
USA 2009, 106, 91-96.
30. Jin, M.; Andricioaei, I.; Springer, T. A., Conversion between three conformational states
on Integrin I domains with a C-terminal pull spring studied with molecular dynamics.
Structure 2004, 12, 2137-2147.
31. Astrof, N. S.; Salas, A.; Shimaoka, M.; Chen, J.; Springer, T. A., Importance of force
linkage in mechanochemistry of adhesion receptors. Biochemistry 2006, 45, 15020-15028.
32. Yakovenko, O.; Sharma, S.; Forero, M.; Tchesnokova, V.; Aprikian, P.; Kidd, B.; Mach,
A.; Vogel, V.; Sokurenko, E.; Thomas, W., FimH forms catch bonds that are enhanced by
mechanical force due to allosteric regulation. J. Biol. Chem. 2008, 283, 11596-11605.
33. Aprikian, P.; Tchesnokova, V.; Kidd, B.; Yakovenko, O.; Yarov-Yarovoy, V.; Trinchina,
E.; Vogel, V.; Thomas, W.; Sokurenko, E., Interdomain interaction in the FimH adhesin of
Escherichia coli regulates the affinity to mannose. J. Biol. Chem. 2007, 282, 23437-23446.

28
34. Vogel, V.; Sheetz, M., Local force and geometry sensing regulate cell functions. Nat. Rev.
Mol. Cell Biol. 2006, 7, 265-275.
35. del Rio, A.; Perez-Jimenez, R.; Liu, R.; Roca-Cusachs, P.; Fernandez, J. M.; Sheetz, M.
P., Stretching single talin rod molecules activates vinculin binding. Nature 2009, 323, 638-
641.
36. del Rio, A.; Perez-Jimenez, R.; Liu, R.; Roca-Cusachs, P.; Fernandez, J. M.; Sheetz, M.
P., Stretching single talin rod molecules activates vinculin binding. Science 2009, 323, 638-
641.
37. Pudas, R.; Kiema, T.; Butler, P. J. G.; Stewart, M.; Ylänne, J., Structural basis for
vertebrate filamin dimerization. Structure 2005, 13, 111-119.
38. Pentikäinen, U.; Ylänne, J., The regulation mechanism for the auto-inhibition of binding
of human filamin A to integrin. J. Mol. Biol. 2009, 393, 644-657.
39. Decher, G., Fuzzy nanoassemblies: Toward layered polymeric multicomposites. Science
1997, 277, 1232-1237.
40. Decher, G.; Hong, J. D., Buildup of Ultrathin Multilayer Films by a Self-Assembly
Process .2. Consecutive Adsorption of Anionic and Cationic Bipolar Amphiphiles and
Polyelectrolytes on Charged Surfaces. Berichte Der Bunsen-Gesellschaft-Physical Chemistry
Chemical Physics 1991, 95, 1430-1434.
41. Elbert, D. L.; Herbert, C. B.; Hubbell, J. A., Thin polymer layers formed by
polyelectrolyte multilayer techniques on biological surfaces. Langmuir 1999, 15, 5355-5362.
42. Picart, C.; Mutterer, J.; Richert, L.; Luo, Y.; Prestwich, G. D.; Schaaf, P.; Voegel, J.-C.;
Lavalle, P., Molecular basis for the explanation of the exponential growth of polyelectrolyte
multilayers. Proceedings of the National Academy of Sciences of the United States of America
2002, 99, 12531-12535.
43. Vogt, C.; Ball, V.; Mutterer, J.; Schaaf, P.; Voegel, J. C.; Senger, B.; Lavalle, P., Mobility
of Proteins in Highly Hydrated Polyelectrolyte Multilayer Films. Journal of Physical
Chemistry B 2012, 116, 5269-5278.
44. Garza, J. M.; Schaaf, P.; Muller, S.; Ball, V.; Stoltz, J. F.; Voegel, J. C.; Lavalle, P.,
Multicompartment films made of alternate polyelectrolyte multilayers of exponential and
linear growth. Langmuir 2004, 20, 7298-7302.
45. Hemmerle, J.; Roucoules, V.; Fleith, G.; Nardin, M.; Ball, V.; Lavalle, P.; Marie, P.;
Voegel, J. C.; Schaaf, P., Mechanically responsive films of variable hydrophobicity made of
polyelectrolyte multilayers. Langmuir 2005, 21, 10328-10331.
29
46. Mertz, D.; Hemmerle, J.; Boulmedais, F.; Voegel, J. C.; Lavalle, P.; Schaaf, P.,
Polyelectrolyte multilayer films under mechanical stretch. Soft Matter 2007, 3, 1413-1420.
47. Mertz, D.; Hemmerle, J.; Mutterer, J.; Ollivier, S.; Voegel, J. C.; Schaaf, P.; Lavalle, P.,
Mechanically responding nanovalves based on polyelectrolyte multilayers. Nano Letters
2007, 7, 657-662.
48. Mertz, D.; Vogt, C.; Hemmerle, J.; Mutterer, J.; Ball, V.; Voegel, J. C.; Schaaf, P.;
Lavalle, P., Mechanotransductive surfaces for reversible biocatalysis activation. Nature
Materials 2009, 8, 731-735.
49. Mertz, D.; Vogt, C.; Hemmerle, J.; Debry, C.; Voegel, J. C.; Schaaf, P.; Lavalle, P.,
Tailored design of mechanically sensitive biocatalytic assemblies based on polyelectrolyte
multilayers. Journal of Materials Chemistry 2012, 21, 8324-8331.
50. Vogt, C.; Mertz, D.; Benmlih, K.; Hemmerle, J.; Voegel, J. C.; Schaaf, P.; Lavalle, P.,
Layer-by-Layer Enzymatic Platform for Stretched-Induced Reactive Release. Acs Macro
Letters 2012, 1, 797-801.
51. Zwaal, R. F. A.; Comfurius, P.; Vandeenen, L. L. M., Membrane Asymmetry and Blood-
Coagulation. Nature 1977, 268, 358-360.
52. Reisch, A.; Hemmerle, J.; Chassepot, A.; Lefort, M.; Benkirane-Jessel, N.; Candolfi, E.;
Mesini, P.; Letscher-Bru, V.; Voegel, J. C.; Schaaf, P., Anti-fouling phosphorylcholine
bearing polyelectrolyte multilayers: Cell adhesion resistance at rest and under stretching. Soft
Matter 2010, 6, 1503-1512.
53. Teulon, J.-M.; Delcuze, Y.; Odorico, M.; Chen, S. W.; Parot, P.; Pellequer, J. L., Single
and multiple bonds in (strept)avidin-biotin interactions. J. Mol. Recognit. 2010, 24, 490-502.
54. Davila, J.; Chassepot, A.; Longo, J.; Boulmedais, F.; Reisch, A.; Frisch, B.; Meyer, F.;
Voegel, J. C.; Mesini, P. J.; Senger, B.; Metz-Boutigue, M. H.; Hemmerle, J.; Lavalle, P.;
Schaaf, P.; Jierry, L., Cyto-mechanoresponsive Polyelectrolyte Multilayer Films. Journal of
the American Chemical Society 2012, 134, 83-86.
55. Bacharouche, J.; Badique, F.; Fahs, A.; Spanedda, M. V.; Geissler, A.; Malval, J. P.;
Vallat, M. F.; Anselme, K.; Francius, G.; Frisch, B.; Hemmerlé, J.; Schaaf, P.; Roucoules, V.,
Biomimetic Cryptic Site Surfaces for Reversible Chemo- and Cyto Mechanoresponsive
Substrates. ACS Nano 2013, (in press).
56. Roucoules, V.; Ponche, A.; Geissler, A.; Siffer, F.; Vidal, L.; Ollivier, S.; Vallat, M. F.;
Marie, P.; Voegel, J. C.; Schaaf, P.; Hemmerle, J., Changes in silicon elastomeric surface
properties under stretching induced by three surface treatments. Langmuir 2007, 23, 13136-
13145.

30
Chapter 2
Materials and methods

31
In this chapter the materials and methods for the assembly of polyelectrolyte
multilayers and the functionalisation of PDMS surfaces are presented. Due to the fact that
most chapters will be submitted as scientific articles and presented under this form in this
thesis, the experiments details of the materials and methods used for chapter 3.6, chapter 5
and chapter 6 are given in page 62, 136, 155 respectively. Here, we described only the
materials and methods relative to experiments that are not anticipated to be published.
2.1 Materials
2.1.1 Solutions of polyelectrolytes
The polyelectrolytes used for the construction of the multilayers were dissolved in a
0.15 M NaCl solutions prepared with ultrapure water (18.2 MΩ.cm Milli-Q plus system,
Millipore). These commercial polyelectrolytes used are summarized in Table 2.1.
2.1.2 Fluorescence probes
2.1.2.1 Fluorescence polyelectrolytes
In order to visualize the polyelectrolyte films by confocal microscopy (chapter 5), we
used a commercial poly(L-lysine) labeled with fluorescein isothiocyanate (PLLFITC) described
in Table1. PLLFITC solutions were used at 1 mg/mL concentration in TRIS 10 mM / NaCl 0.15
M buffer and at pH 7.4. The solutions were stocked at -20°C until used.
2.1.2.2 Fluorescence protein
Streptavidin is obtained from cultures of the bacterium Streptomyces avidinii.1 It is a
tetramer of four identical subunits that are built up of 159 amino acids and have a molecular
weight of 16.5 kDa each (figure 2.1). The tetramer has an approximately spherical shape with
a diameter of about 5.5 nm and an overall molecular weight of 60 kDa due to postsecretory
degradiation. The isoelectric point of the streptavidin lies between 5 and 6. Streptavidin can
bind four equivalents of the vitamin biotine. The interaction between streptavidin and biotin
is, with a binding constant of the order of 1015 M-1, among the strongest non-covalent
interaction known. The reason for its use here lies exactly in this strong and specific
interaction, as will be explained in more details in chapter 4. For the experiments, streptavidin
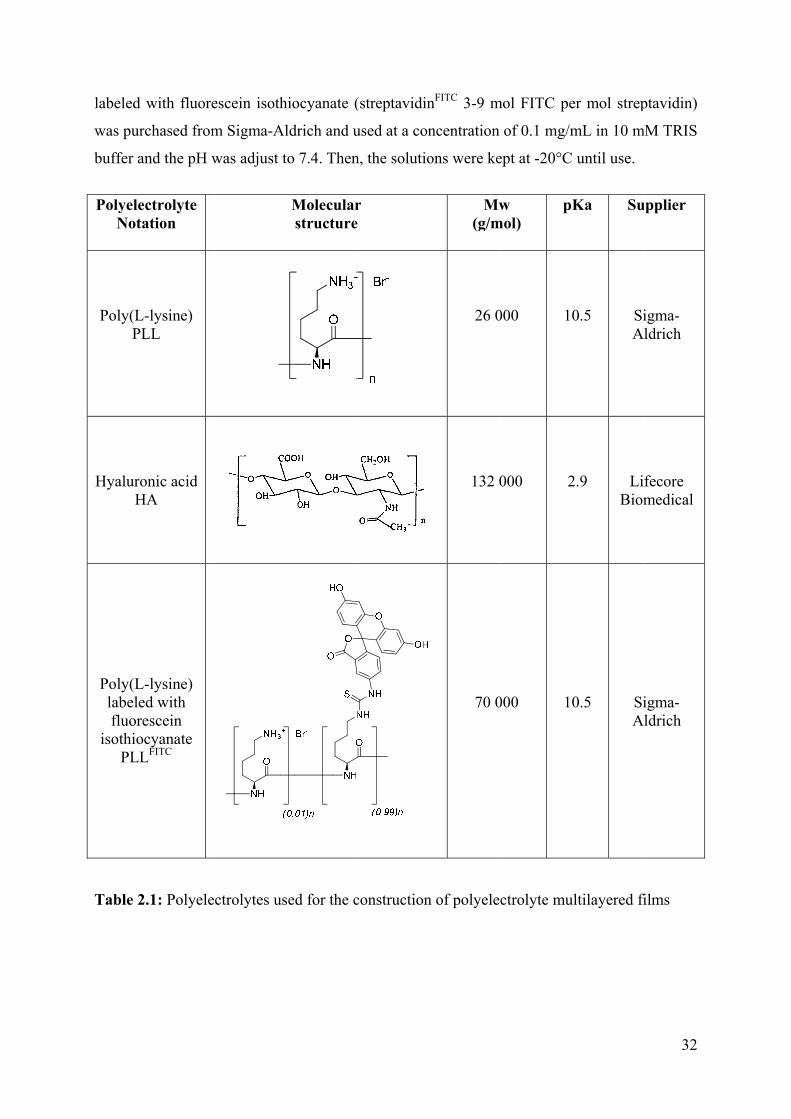
labeled
was pur
buffer a
Polyele
Nota
Poly(LPL
HyaluroH
Poly(Llabelefluore
isothioPLL
Table 2
with fluore
rchased from
and the pH w
ectrolyte ation
L-lysine) LL
onic acid HA
L-lysine) ed with escein
ocyanate LFITC
2.1: Polyele
escein isoth
m Sigma-Al
was adjust t
ctrolytes us
hiocyanate (
ldrich and u
to 7.4. Then
Molecularstructure
sed for the c
(streptavidin
used at a con
n, the solutio
r e
construction
nFITC 3-9 m
ncentration
ons were ke
Mw(g/m
26 0
132 0
70 0
n of polyelec
mol FITC pe
of 0.1 mg/m
ept at -20°C
w mol)
p
000 1
000 2
000 1
ctrolyte mu
er mol strep
mL in 10 m
C until use.
Ka Su
0.5 SiA
2.9 LiBiom
0.5
SiA
ultilayered fi
32
ptavidin)
mM TRIS
upplier
igma-Aldrich
fecore medical
igma-Aldrich
films

33
Figure 2.1: Molecular model of streptavidin tetramer (shown here is the Y43F mutand) from
X-ray diffraction data.2 The four subunits are presented in different colors, secondary
structure elements are indicated.
2.1.3 Support for construction of films
2.1.3.1 Glass slides
The construction of polyelectrolyte multilayers (PEM) films were done in circular
glass slides of 12 mm of diameter, 150 µm of thickness and less than 1 nm of roughness
(Menzel-Gläser, Braunschweig, Germany). They were cleaned with 70% ethanol, 2% (v/v)
Hellmanex® and 0.1 M HCl solutions for 10 min with rinsing steps of Milli-Q water between
each treatment.
2.1.3.2 Silicone
Poly(dimethylsiloxane) (PDMS) sheets of 250 µm of thickness (Specialty
Manufacturing Inc., Saginaw, Michigan, United States) were chosen as support for the
grafting of biotine-poly(ethyleneglycol) brushes (chapter 4), for construction of PEM films
(chapter 5) or for covalently attaching hydrogel materials (chapter 6). This material was
chosen because it is transparent and presents excellent elastomeric properties (figure 2.2). The
sheets were cut to fit the microscope slides in 18 x 18 mm2 and cleaned with 70% ethanol, 2%
(v/v) Hellmanex® and 0.1M HCl solutions for 10 min with rinsing steps of Milli-Q water
between each treatment. They were stocked out of dust to avoid problems during the PEM
films construction.

2.1.4 S
T
enzyma
(chapter
bellow w
2.1.4.1
T
between
figure 2
motor a
where l
experim
position
adapted
Figure
fluoresc
Stretching
The influen
atic activity
r 6) were i
were used t
Large str
The homem
n Streptavid
2.3. It allow
at a velocity
and l0 repr
ments were
n and in a
d in the micr
2.3: Larg
cence micro
Figure
devices
nce of mech
(chapter 5)
investigated
o carry out
etching dev
made stretch
din and Bio
ws to stretch
y of 0.5 mm
resent the le
done at roo
hydrated st
roscope for
ge stretchin
oscope.
e 2.2: Struct
hanical stre
) and covale
d. Different
these exper
vice
hing device
otin on PD
h the PDMS
m/s. The stre
ength of the
om tempera
tate. For al
fluorescenc
ng device
ture of Poly
etching on p
ently bonde
ts kinds of
riments.
used during
DMS modifi
S in an unia
etching rate
e stretched a
ature with t
ll the exper
ce measurem
with the
y(dimethylsi
protein adso
d hydrogel
homemade
g the exper
fied surface
axial directi
(α) is defin
and unstretc
the modifie
riments, the
ments.
modulated
iloxane)
orption (ch
on silicone
e stretching
iment of ho
(chapter 4
on with a m
ned by the re
ched state r
ed side of P
e stretching
motor and
apter 4), co
es modified
g devices p
ost guest int
4) is repres
modulated e
elation α =
respectively
PDMS in th
g device wa
d adaptor
34
ontrolled
surfaces
presented
teraction
ented in
electrical
(l - l0)/l0
y. All the
he upper
as easily
for the

35
2.1.4.2 Medium stretching device
The homemade stretching device used for the experiments of the PDMS surface
modification with hydrogels (chapter 6) is presented in the figure 2.4. It is made of stainless
steel and it allows stretching manually the sample in an unaxial direction.
Figure 2.4: Medium stretching device use for the stretching of PDMS-hydrogel modified
surfaces.
Concerning the UVO activation and chemical modification of PDMS in a stretched
state, a homemade stretching device made in poly(methylmethacrylate) (PMMA) was used,
resisting to the UVO and chemical treatment (figure 2.5).
Figure 2.5: Stretching device used for the experiments where the modification of PDMS
required extreme conditions as UVO activation or chemical contact.
2.1.5 Modification of silicon surfaces
2.1.5.1 UV-ozone (UVO)
A UV-ozone Pro Cleaner Bio Force Nanosciences machine that has a mercury vapor
lamp wavelength of 254 nm and 185 nm with an UV intensity of 14.76 mW/cm2 at 1 cm of
distance from the sample was used for the PDMS’s surface activation. The 185 nm UV

36
wavelength creates ozone gaz which is then transformed to atomic oxygen by the 254 nm
wavelength. The oxygen radical so formed presents unpair electrons which will react in
contact with the PDMS surfaces producing silanol groups and carboxylic groups depending
on the exposition time of the activation. Therefore, a hydrophilic surface is obtained after
treatment of the PDMS surfaces by UVO activation. Nevertheless, the formation of a thin
layer of silicon oxyde (SiOx) can occur depending on the time of exposition and it will be
responsible for the crack formation on the PDMS’s surface under stretching.
2.1.6 Procedure to prepare PDMS Sylgard-184
Poly(dimethylsiloxane) PDMS Sylgard-184 from Dow Corning was prepared using a
mixture of viscous base (part A) and curing agent (part B) in a rate of 10:1. After mixing the
two components cited before they were degased for 1h in an oven under pressure. Then, the
transparent solution was poured into PMMA molds and cured overnight at 90°C and 254
mmHg. Carefully, they were unmold and washed, first with a solution of n-heptane and
dodecanthiol (0.01 %) for 1 h and then two times with only n-heptane for 1h each time. This
washing process will remove the remaining unreacted chaines and the Pt catalyst from the
material. Finally, they were dried in two steps, first under pressure at room temperature during
1h and then in the oven at 60°C for 3h. The poly(dimethylsiloxane) PDMS obtained is a
transparent and elastic material that is stocked avoiding contact with dust.
2.1.6 Silanization procedure of the oxidized silicone sheet by using the 3-
mercaptopropyltrimethoxysilane
After the activation of the 18 x 18 mm2 PDMS surfaces (from SMI or PDMS Sylgard-
184) by UVO for 1h30min, the samples were put in a glass bottle that contains a 1 % v/v
solution of 3-mercaptopropyltrimethoxysilane (HS) in MeOH and stirred overnight at room
temperature. The samples were then rinsed three times with MeOH for 1h under stirring,
changing the solvent every 15 minutes and then kept in MeOH.

37
2.2 Methods
2.2.1 Contact angle (CA) measurements
Contact angle (CA) measurements represent the easiest and quickest method for
examining the properties of surfaces. The method consists in measuring the angle between the
outline tangent of a drop deposited on a solid and the surface of this solid (figure 2.6).
The static contact angle between a liquid drop and a smooth solid surface is given by
Young’s equation which essentially expresses the force balance between the interfacial
tensions at the solid-liquid-vapor interfaces:
SLSVLV )cos( (2.1)
Figure 2.6: Young’s model of sessile drop showing the relationship between interfacial
tensions. θ is the contact angle, is the liquid-vapor interfacial tension, is the solid-
vapor interfacial tension and is the solid-liquid interfacial tension.
If water is used to measure the contact angle it is possible to deduce the hydrophobic
(great angle, low surface energy) or hydrophilic (small angle, high surface energy) character
of the surface.
CA measurements were carried out using the DIGIDROP-GBX® coupled with a
charge-coupled device CCD camera and a total volume of 6 µL high-purity water dropwise.
Measurements were made on both sides of the drop and were averaged. A series of three
experiments were carried out for each treatment.

38
2.2.2 Infrared spectroscopy (FTIR)
An FT-IR spectrometer Bruker Vertex 70 equipped with DTGS detector and an
Attenuated Total Reflectance ATR germanium crystal accessory was used for IR
spectroscopy measurements. All spectra were acquired at 4 cm-1 resolution over 20 scans
within the range 4000 - 600 cm-1.
2.2.3 Atomic force microscopy (AFM)
Atomic force microscopy (AFM) was performed using a multimode scanning probe
microscope (Veeco/Bruker, Santa Barbara, CA). The apparatus was operated in the contact
mode under liquid condition. Silicon nitride cantilevers with a spring constant of 0.03 N.m-1
were used for imaging (MSCT model, Veeco/Bruker, Santa Barbara, CA). For more details
about the experiment see chapter 3.6.
2.2.4 Optical microscopy
White light microscopy images were captured with the inverted optical microscope
Nikon Eclipse TE200 using a x40 objective lenses. Images were acquired with Nikon Digital
Camera DS-Qi1Mc (with NIS-Elements software). This method was particular interesting to
analyze the crack formation on silicone surfaces after UVO treatment under stretching
(chapter 4 and chapter 6).
2.2.5 Nuclear magnetic resonance (NMR)
The nuclear magnetic resonance (NMR) spectra were recorded on a Bruker Advance
400 spectrometer operating at 400 MHz for 1H and 100 MHz for 13C. The NMR spectra were
calibrated using residual undeuterated solvent as an internal reference. The multiplicities of
the peaks were described by singlet (s), doublet (d), triplet (t), multiplet and broad (br). The
degree of substitution (DS) of the polymer after modification was determined from the ratios
of integrals of 1H.
2.2.6 Fluorescence based microscopy methods
We mainly used, throughout this thesis, microscopy methods that rely on fluorescence
experiments. We thus present in more details these methods.

39
2.2.6.1 Principles of fluorescence
Fluorescence is the phenomenon in which a molecule absorbs a photon of a given
wavelength (or energy hEX) followed by the emission of a photon at a smaller energy (hEM)
larger wavelenght (Jablonski diagram, figure 2.7). The fluorescent molecule is excited from
its ground state S0 to a state S1’. At room temperature, the molecule loses some of its energy
by vibrational relaxation or collisions with surrounding molecules, bringing it to a state of
lower energy, S1. When going back to the ground state, a photon of lower energy is emitted,
compared to the excitation photon. The difference between the two wavelengths is called the
Stokes shift.
Figure 2.7: Jablonski diagram. (1) The fluorescent molecule at the ground state absorbs a
photon and is promoted to the excited state S1'. (2) It reaches the lower excited state S1
through non-radiative energy loss. (3) On getting back to the ground state a photon of lower
energy is emitted (hEM < hEX).
The fluorescence intensity and the excitation and emission wavelengths depend on the
molecule, the so called fluorophore. In general, fluorophores are relatively small molecules
that can be covalently attached to the molecules of interest. In our case these molecules of
interest are polyelectrolytes or biological macromolecules like proteins, notably enzymes. The
fluorophores allow for the detection of the labeled species in the polyelectrolyte multilayers
by using confocal laser scanning microscopy for example. In this work the fluorescein
isothiocyanate (FITC) was used as the fluorescent marker which presents a maximum
absorbance and emission at 495 nm and 525 nm, respectively (figure 2.8).

40
Figure 2.8: Molecular structure of the fluorescence probe fluorescein isothiocyanate (FITC)
(λEX = 495 nm / λEX = 525 nm).
2.2.6.2 Fluorescence microscope
Based on the Stokes shift principle, after illumination of the specimen with one
wavelength and filtering the return light, it is possible to observe fluorescent objects (figure
2.9). The sample is illuminated with light either from a mercury arc lamp or a laser directed
on the sample by a dichroic mirror after passing a filter that eliminates light above a certain
wavelength. The light coming from the sample is then directed through a second filter that
blocks light below a given wavelength. Hence, only the light due to emission of the
fluorophore is detected. The contrast corresponding to this kind of observation is superior to
the contrast due to absorption.
The “classical” fluorescence microscope was used to study, in chapter 4, the ligand
accessibility to the silicone surface modified with poly(ethyleneglycol) brushes, biotin and
strepatvidinFITC at the unstretched or stretched state. The experiments were carried out using
an inverted light microscope (Nikon Microphot-FXA, Japan) equipped with a mercury lamp
and operating between 470 nm and 490 nm for excitation and above 500 nm for detection. A
10 dry objective and a digital camera were used.
Image analysis was performed using ImageJ software (Rasband, W. S., ImageJ, U. S.
National Institutes of Health, Bethesda, Maryland, USA, http://imagej.nih.gov/ij/, 1997-
2011).

2.2.6.3
T
in using
point) w
sample
microsc
planes (
T
and y a
The sca
motor. S
3D ima
objectiv
visualiz
(microm
Confocal
The general
g point illum
with an ep
generates
cope uses a
(figure 2.10
The confoc
axes with m
anning along
So, it is pos
age of the s
ve with a 1.
ze exponent
meters) in aq
Figure 2.9
laser scann
l principle o
mination pr
pifluorescen
a parasite
a pinhole to
).
al images a
motorized m
g the z axis
ssible to sca
ample. The
4 numerica
tially growin
queous envi
9: Basic set
ning micro
of the confo
roduced by
ce microsc
fluorescenc
o eliminate
are obtained
mirrors that
s is perform
an different
e resolution
al aperture a
ng polyelec
ironment.
up of a fluo
scope (CLS
ocal microsc
a laser thro
cope. Never
ce out of th
light that
d by scannin
are placed
med by using
focal plane
n in the z di
at a wavelen
ctrolyte mul
orescence m
SM)
cope was pr
ough a prec
rtheless, th
he sample
comes from
ng the samp
through the
g an objecti
es (cross-se
irection is o
ngth of 500
ltilayer film
microscope.
roposed by M
cise point o
e laser pat
plan. There
m planes o
ple point pe
e optical pa
ive mounted
ction) and t
of the orde
0 nm. We u
ms and mea
Minsky3. It
of the samp
thway throu
efore, the c
other than t
er point alo
athway of th
d on a piezo
then recons
r of 500 nm
use this tech
sure their th
41
consists
le (focal
ught the
confocal
the focal
ong the x
he laser.
oelectric
struct the
m for an
hnique to
hickness

Figure
beam is
the sam
parasite
T
Zeiss S
France)
experim
40 wet
on glass
I
Nationa
2011).
2.2.6.4
F
mobility
laser. It
techniqu
molecul
2.10: Repr
s concentrat
mple. The flu
e fuorescenc
The experim
.A.S., Le P
microscop
ments, we us
t objective w
s or silicone
Image analy
al Institutes
Fluoresce
Fluorescenc
y of fluores
t was deve
ue allows e
le5. This te
resentation
ted by the d
uorescence i
ce (point lin
ments were
Pecq, France
pe with HeN
sed an argo
was used to
e substrates
ysis was pe
s of Health
ence recove
ce recovery
scent molecu
loped in th
evaluating q
echnique wa
of the conf
dichroic bea
is then colle
nes), a pinho
performed
e) mounted
Ne (543 nm
n laser, wit
o visualize t
(chapter 5)
erformed us
h, Bethesda
ery after ph
y after photo
ules in an e
he seventies
quantitativel
as also used
focal laser s
am splitter a
ected by the
ole is placed
with the co
d on a Axio
m) and Ar
th 488 nm f
the polyelec
.
ing ImageJ
a, Marylan
hotobleachi
obleaching
environmen
s by Peters
ly the diffus
d for exam
scanning m
and the obj
e photomult
d at the imag
nfocal micr
oVert 100M
r (459, 488
for excitatio
ctrolyte mul
J software (R
nd, USA, h
ing (FRAP)
(FRAP) is
nt that was p
s et al.4. Ax
sion coeffic
mple for the
microscope p
ective lens
tiplier. In or
ge plan of t
roscope LSM
M (Carl Zeis
, and 514
on and 520
ltilayer film
Rasband, W
http://imagej
)
a method u
photobleach
xelrod et a
cient of a fl
e study of t
principal. T
on a focal
rder to elim
the objective
M 510 MET
ss S.A.S., L
nm) lasers
nm for emi
ms after cons
W. S., Image
ej.nih.gov/ij/
used to quan
hed with a p
al. showed
luorescently
the diffusio
42
The laser
point on
inate the
e.
TA (Carl
Le Pecq,
s. In our
ission. A
struction
eJ, U. S.
/, 1997-
ntify the
powerful
that this
y labeled
n of the

43
PLLFITC inside of a PLL/HA film or even more the diffusion of proteins inside the PEM films
of poly(allylamine) / poly(styrene sulfonate).
Experimental protocol
We used the FRAP experiments to investigate the diffusion of fluorescently labeled
proteins in polyelectrolyte multilayer films. These experiments were realized with a confocal
microscope.
In practice, a defined region of the sample, in our case a circular region, is illuminated
with high intensity laser for 20 s causing part of the fluorophores within that region to become
photobleached (permanent destruction of their fluorescence). This creates a darker, bleached
region, within the sample. Then, if at least part of the labeled molecules are mobile, non-
photobleached molecules from the region exterior to the disk diffuse toward the bleached
region. This influx leads to an increase of the fluorescence intensity over time (figure 2.11).
Note that this intensity recovery is in general incomplete because some of the fluorescent
molecules may be immobile or appear as such over the time of observation.
Figure 2.11: FRAP technique uses the high power of a laser to photobleach a defined region
of the sample. The recovery of the fluorescence in this region indicates any kind of movement
(diffusion or transport) of fluorescent molecules. The disc diameter, d, of the bleached region
equals 115.17 µm.
Recovery of fluorescence in the bleached area occurs as a result of the diffusion of
fluorescent molecules from the unbleached region into the bleached one. The fraction of
fluorescent molecules that can participate in this exchange is referred to as the mobile
fraction. On the other hand, the immobile fraction cannot contribute to the recovery.
For a FRAP experiment to provide meaningful data, it is important that the sample is
not photobleached during the pre-bleach or recovery phase of the experiment and that the
detector is not saturated. This is achieved by using weak laser intensities during these phases.

44
In this kind of experiment, we are interested in images parallel to the sample plane
taken at various recovery times after the end of bleaching (t = 0). Image resolution of 512
pixels 512 pixels was obtained with an objective x10, numerical aperture of 0.3 and
numerical zoom 2 corresponding to square images of side length equal to 460 µm. The
fluorescence ratio between the bleached and the unbleached zones is plotted against the
fluorescent recovery time. In chapter 5, FRAP experiments were carried out to study the
diffusion of labeled enzymes with FITC within the polyelectrolyte multilayer film.
Data processing
Images such as those shown in figure 2.11 were analyzed by means of ImageJ. At a
given recovery time, t, this analysis consists in measuring the light intensity within the
bleached disk, I(t), and the mean intensity, Iref (t), within four disks of equal size (i.e. same
radius a located in the corners of the image. The quantity of interest is the ratio I(t) / Iref (t).
This ratio is assumed to be equal to the concentration of fluorescent molecules inside the
bleached region divided by the concentration of fluorescent molecules in regions of the image
that are unaffected by the movement of fluorescent molecules toward the bleached region.
For the sake of simplicity, we assume that at t = 0, the bleached region has a perfectly
sharp contour (see left image in figure 2.11 above). This means that the bleaching time was
sufficiently short to avoid significant diffusion during bleaching and thereby the "corona
effect"6. The initial condition is then expressed by
elsewhere1
if)0,(
0
ar
c
rc (2.2)
where r means the radial distance from the center of the bleached disk, c0 is the concentration
before bleaching or far from the bleached region and represents the proportion of non-
bleached molecules within the disk at t = 0.
Again for the sake of simplicity, we assume that the fluorescent molecules are either
mobile with diffusion coefficient D or immobile. The markers are therefore entirely
characterized by the two parameters D and the proportion of mobile markers, p. In the special
case where p = 1, the time evolution of the relative fluorescent molecule concentration within
a disk of radius a centered on the center of the initially bleached disk is given by (see
Appendix A of Picart C., et al.7 for mathematical details)

45
222exp)1(
)(10
10
IIp
c
c (2.3)
where 2
4
a
Dt . I0 and I1 represent modified Bessel functions of first kind and order 0 and 1,
respectively8. In the general case (p 1), the intensity within the region of interest is still
composed of two parts: one contribution from the non-bleached molecules (first term on the
right hand side in eq. 2.3) and one contribution from the gradually incoming molecules.
However, only a proportion p of the bleached fraction 1 – can be recovered. It follows that
eq. 2.3 becomes
222exp)1(
)(10
0
IIpc
c (2.4)
When t , the concentration ratio tends to
)1()(
0
pc
c (2.5)
which reaches unity only if p = 1 as could be intuitively anticipated.
At short times ( < 0.15), the concentration ratio is approximately given by
)1()(
0
pc
c (2.6)
or
tD
ap
c
tc
2)1(
)(
0
(2.7)
Therefore, as long as the experimental data are located on a straight line when represented as
a function of t, only the product pD can be extracted. Consequently, it is necessary to
follow the recovery over long enough the time to actually need the exact expression (2.4) to
model the observations. Then D and p can be obtained separately.
2.3 References
(1) Waldrop, L. G., Biotin in Encyclopedia of Life Science. John Wiley and Sons: 2001.
(2) Le Trong, I.; Freitag, S.; Klumb, L. A.; Chu, V.; Stayton, P. S.; Stenkamp, R. E. Structural
studies of hydrogen bonds in the high-affinity streptavidin-biotin complex: mutations of
amino acids interacting with the ureido oxygen of biotin Acta Crystallographica Section D-
Biological Crystallography 2003, 59, 1567-1573.

46
(3) Minsky, M. Microscopy apparatus. Patent US/1961/3013467, 1961.
(4) Peters, R.; Peters, J.; Tews, K. H.; Bahr, W. A microfluorimetric study of translational
diffusion in erythrocyte membranes Biochimica et Biophysica Acta (BBA) - Biomembranes
1974, 367, 282-294.
(5) Axelrod, D.; Koppel, D. E.; Schlessinger, J.; Elson, E.; Webb, W. W. Mobility
Measurement by Analysis of Fluorescence Photobleaching Recovery Kinetics Biophys. J.
1976, 16, 1055-1069.
(6) Weiss, M. Challenges and artifacts in quantitative photobleaching experiments Traffic
2004, 5, 662-671.
(7) Picart, C.; Mutterer, J.; Arntz, Y.; Voegel, J. C.; Schaaf, P.; Senger, B. Application of
fluorescence recovery after photobleaching to diffusion of a polyelectrolyte in a multilayer
film Microscopy Research and Technique 2005, 66, 43-57.
(8) Abramowich, M.; Stegun, I., Handbook of mathematical functions. Dover: New York,
1970.

47
Chapter 3
Investigation of a bispyrene unit used as a
mechanical sensor or a pH probe
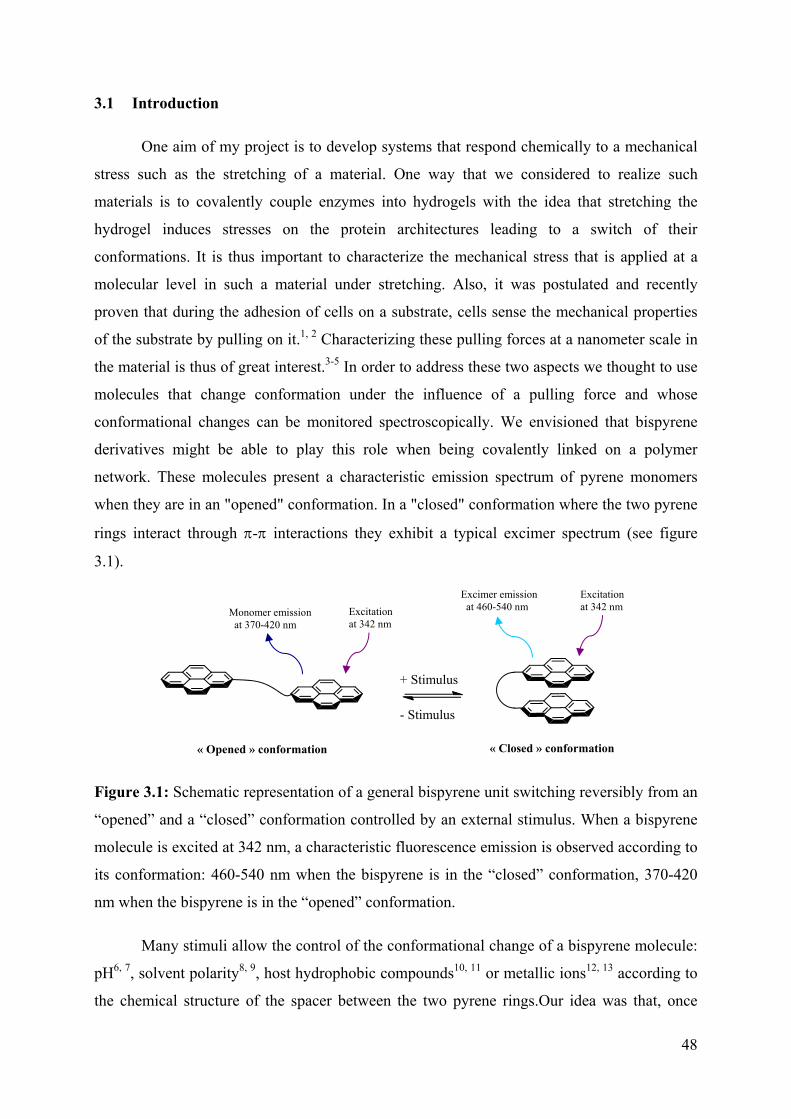
48
3.1 Introduction
One aim of my project is to develop systems that respond chemically to a mechanical
stress such as the stretching of a material. One way that we considered to realize such
materials is to covalently couple enzymes into hydrogels with the idea that stretching the
hydrogel induces stresses on the protein architectures leading to a switch of their
conformations. It is thus important to characterize the mechanical stress that is applied at a
molecular level in such a material under stretching. Also, it was postulated and recently
proven that during the adhesion of cells on a substrate, cells sense the mechanical properties
of the substrate by pulling on it.1, 2 Characterizing these pulling forces at a nanometer scale in
the material is thus of great interest.3-5 In order to address these two aspects we thought to use
molecules that change conformation under the influence of a pulling force and whose
conformational changes can be monitored spectroscopically. We envisioned that bispyrene
derivatives might be able to play this role when being covalently linked on a polymer
network. These molecules present a characteristic emission spectrum of pyrene monomers
when they are in an "opened" conformation. In a "closed" conformation where the two pyrene
rings interact through - interactions they exhibit a typical excimer spectrum (see figure
3.1).
Figure 3.1: Schematic representation of a general bispyrene unit switching reversibly from an
“opened” and a “closed” conformation controlled by an external stimulus. When a bispyrene
molecule is excited at 342 nm, a characteristic fluorescence emission is observed according to
its conformation: 460-540 nm when the bispyrene is in the “closed” conformation, 370-420
nm when the bispyrene is in the “opened” conformation.
Many stimuli allow the control of the conformational change of a bispyrene molecule:
pH6, 7, solvent polarity8, 9, host hydrophobic compounds10, 11 or metallic ions12, 13 according to
the chemical structure of the spacer between the two pyrene rings.Our idea was that, once
Excitation at 342 nm
Monomer emission at 370-420 nm
Excimer emission at 460-540 nm
« Opened » conformation
+ Stimulus
- Stimulus
Excitation at 342 nm
« Closed » conformation

49
covalently linked on a polymer matrix, in the absence of stress, the bispyrene molecules are in
a "closed" conformation which switches to an "opened" conformation under a mechanical
stress. We have prepared and used two original bispyrene molecules 2 and 3, whose the two
pyrene rings are linked together through a diethylenetriamine linker and which can be
covalently crosslinked into a polymer network through two reactive side arms: vinyl groups
for the bispyrene derivative 2 and azido groups for the bispyrene 3. These two arms are on
each pyrene ring(see figure 3.2).
Figure 3.2: Chemical structure of the bispyrene derivatives 1, 2 and 3: compounds 2 and 3
are dedicated to be used in Poly(acrylamide) (PAM) hydrogels and Polyelectrolytes (PE)
based films respectively.
Bispyrene units such as the compound 1 (figure 3.2), without the lateral arms on each
pyrene ring, have been intensively studied in the literature14. It was shown that these
molecules can play the role of local pH sensors because of their pH-sensitive conformation.
Indeed, at high pH when the amines are not protonated, the molecules adopt a "closed"
conformation whereas at low pH, when the amines of the central linker between the two
pyrene rings are positively charged (ammonium groups formation) they adopt an “opened”
conformation12 due to the positive charges repulsion.
This chapter is divided in three parts: we will first describe the syntheses of the
functionalized bispyrene molecules 2 and 3 bearing reactive side arms (Part 3.2). We will then
describe the results relative to the incorporation of bispyrene 2 in poly(acrylamide) hydrogel
Used as crosslinker in PAM hydrogel
Used as crosslinker in PE based film
Part 3.3 Part 3.6
Spacer
Pyrene ring
arm

50
(PAM) networks with the goal to render it mechanoresponsive (Part 3.3). These experiments
were performed in collaboration with a Master II student, Jean-Nicolas Tisserant.
Unfortunately, as we will see, our material was not mechanoresponsive and thus only a brief
description about the results obtained in this project will be given herein. Next, we took
advantage of the fact that our bispyrene molecules, when bearing azide moieties on the two
lateral arms, could serve simultaneously as crosslinking agents between polymer chains
bearing alkynes moieties and pH sensors. This study was intended to better understand the
properties of polyelectrolyte based films (PE) resulting from a one-pot morphogen film self-
construction through covalent bonds formation between polyelectrolytes and
homobifunctional spacers, a concept introduced recently in our group (Part 3.6). Such a
construction was obtained by electrochemical-control of the Huisgen click-chemistry reaction
between poly(acrylic acid) chains modified by attaching alkyne groups (PAA-Alk) and
biazides ethylene glycol spacers (Az-EGn-Az) or our modified bispyrene molecules in the
presence of a CuSO4 solution. The morphogen Cu(I) was generated from Cu(II) after applying
a reduction electric potential and therefore the covalent films were buildup on the electrode
surface. The reversible conformational switch of the bispyrene entity depending on the pH of
its environment, allowed probing the real pH inside the film when the pH outside the film is
changing. The results of this study led to a publication in "Soft Matter".
3.2 Design and synthesis of the bispyrenes 2 and 3
Our synthetic strategy to design the bispyrenes 2 and 3 is based on a convergent
synthesis leading to the disubstitued pyrene ring 4. Indeed, prepared from 1-bromopyrene, the
compound 4 allows the grafting of the desired arms to each pyrene ring through nucleophilic
substitution on the phenol group, followed by a coupling reaction (reductive amination)
between the aldehyde group of the bispyrene derivatives and the diethylenetriamine linker.
These two steps provide the desired bispyrene 2 and 3 (figure 3.3) which experimental details
are described in Annex 1 and in the supporting information of part 3.6 respectively.

51
Figure 3.3: Synthetic strategy to prepare the bispyrenes 2 and 3 from 1-bromopyrene through
the disubstituted precursor 4.
The possibility to disubstitute the pyrene ring is necessary because one substitution
will be involved in the coupling with the second pyrene ring, through the diethylenetriamine
bridge, and the second substitution will provide the chemical group allowing the coupling into
a polymeric network, vinyl (in case of compound 2) or azide group (in case of compound 3).
Few works have been reported concerning the synthesis of pure disubstituted pyrene ring: the
main difficulty encountered is to purify compounds contaminated by several regioisomers.
Recently, Zhou et al.15 developed a convenient preparation of the pyrene derivative 4 (figure
3.4). This pyrene 4 has two reactive functions, a phenol and an aldehyde, that can be involved
for two different coupling reaction. Starting from the commercially available 1-bromopyrene,
the compound 4 is prepared in three steps: Ullman coupling reaction provide the derivative 5
with 92% of yield. Then, ortholithiation in presence of butyllithium followed by the addition
dimethylformamide yield to the compound 6. Demethoxylation with aluminium chloride led
to the disubstituted pyrene 4.
Figure 3.4: Synthesis of the disubstituted pyrene 4 in three steps from 1-bromopyrene.
Then, the arm bearing the functional groups (vinyl or azido groups) can be attached on
compound 4 though the phenol. Oligoethylene glycol derivatives 7 and 8 can be prepared in

52
few steps according to described procedure16. Once the arm introduced to the disubstituted
pyrene ring 9 and 10, the coupling with the diethylentriamine can be done: a bis imine is
formed and reduced in situ in presence of sodium borohydride to afford the desired bispyrene
compounds 2 and 3 with 77% and 59% of yield respectively (figure 3.5).
Figure 3.5: Synthesis of the bispyrenes 2 and 3 from the disubstituted precursor 4.
This convergent strategy to prepare bispyrene-based cross-linker may be used in the
future in various others applications.
3.3 Bispyrene derivative 2 used as a mechanical sensor included in poly(acrylamide)
hydrogels
The use of fluorescent molecules whose emission properties can be modulated by
external stimuli (such as pH, temperature or ionic concentrations) is a powerful tool in the
field of sensor device applications.17-19 Bispyrene-containing molecular systems have been
studied extensively because they demonstrated distinctive monomer and excimer emissions
(figure 3.1). Two pyrene units are attached at both ends of a short chain that responds to
stimuli; in water, the hydrophobic pyrene units induce a folding and the formation of an
excimer characterized by a long-wavelength emission band at 460-540 nm when excited at
342 nm. When an adequate stimulus is applied, the bispyrene molecule is forced into an
extended conformation that disrupts the excimer band. Only monomer fluorescence at 370-
420 nm in purple-blue which arises from locally excited pyrene chromophores is observed.
High sensitivity, selectivity, fast response time, flexibility and experimental simplicity are the
main advantages of this molecular sensor.
In our case, the chemical mechanical sensor that we used is composed of two pyrene
rings both linked together through a polyammonium bridge. Each pyrene unit was attached to

53
reactive functions through a linker (figure 3.2). These reactive functions must allow covalent
binding of the bispyrene entity into 3D matrices as poly(acrylamide) hydrogel (PAM).
Compression of this bispyrene 2 containing materials may lead to a switch of fluorescence
emission.
3.3.1 Optimization to get a viscous-elastic and stretchable PAM hydrogel
The polymer used as a mechano-transductive matrix for the bispyrene should be
transparent to UV-visible wavelengths allowing spectroscopic measurements, resist to
stretching at 50% of initial dimension and should be mostly elastic (reversible) up to 50%
stretching. For these reasons, the system that we chose for testing our mechanical sensor was
the poly(acrylamide) hydrogel (PAM) formed by free radical polymerization in water (figure
3.6).
Figure 3.6: (left) Molecular mechanism of the poly(acrylamide) gel formation in presence of
acrylamide, bisacrylamide, tetramethylethylendiamine (TEMED) and ammonium persulfate
(APS); (right) Schematic representation of the polymerization and crosslinking of PAM
hydrogel.20

54
All hydrogels studied were formed in 3.5 cm of diameter glass petri dishes by addition
of the reactants in the sequence showed in Table 3.1 and stirring vigorously between each
step. Figure 3.6 represents schematically the chemical reactions taking place during the gel
formation.
The PAM gel is polymerized through a radical chain reaction. The first step
corresponds to the activation of the tetramethylethylenediamine (TEMED) by the ammonium
persulfate (APS) which results in a molecule with one unpaired electron. This activated
molecule reacts with an acrylamide molecule which is also activated at its turn. When the
acrylamide units are still growing, the active site moves to the free side. The bisacrylamide,
which consists in two acrylamide units linked together, is incorporated into growing chains,
cross-linking the polymers. The polymer has a gel complex topology formed with
ramifications and interconnections.
Compound 1. Acrylamide
2. Bis-acrylamide
3. Water
4. Tetramethyl-ethylenediamine
(TEMED)
5. Ammonium peroxodisulfate
(APS)
Role
Monomer
Cross-linker
Solvent
Catalyst
Initiator
Amount 800µL of 40wt% in
water
133.3µL of 5mg/mL in water
800µL 4.8µL 66.6µL
54mg/mL in water
Table 3.1: Optimized conditions of PAM hydrogel preparation used in our study. The
numbers next to the compound name show the order of introduction.
Different mechanical properties can be obtained by varying the amount of each
reactants, in particular the ratio and the concentration of acrylamide and bisacrylamide.
Cedric Vogt, PhD student at INSERM UMR 977 of Strasbourg, optimized the gel
composition to get a transparent and elastomeric gel. These conditions are gathered in Table
3.1 and described in details in chapter 6. From a practical point of view, the PAM hydrogel
formation begins within a few minutes after the successive addition of the following reagents,
in the proportion indicated in Table 3.1: acrylamide, bisacrylamide, water, TEMED and APS.
It is important to note that the third constituent added to the gelating solution is pure water:
we decided to introduce later the bispyrene cross-linker at this step, dissolved in MilliQ water.
55
Finally, the samples are left covered overnight at room temperature and then allowed to swell
in water. Excess of monomer and unbound chains are removed by changing the bath water
every hour during 8 hours. Size stability is reached after about 24 h. The resulting PAM
hydrogel is then cut with a blade and despite many problems to handle and adapt it into a
stretching device (see the chapter 2 “Materials and Methods”) and stretch without breaking it,
we observed that this gel was stretchable at least five times at 50% of its initial length.
3.3.2 Bispyrene 2 cross-linked in the poly(acrylamide) hydrogel
The cross-linkable bispyrene 2 is pH responsive and its solubility varies with the pH:
at low pH, the triamine spacer is highly charged and therefore the compound 2 become more
soluble in aqueous medium than at basic pH. To be introduced into the PAM architecture, the
bispyrene 2 was added into the 800 µL of water used as the third reagent in the preparation of
the PAM hydrogel (see Table 3.1 above). Two solutions of bispyrene 2 (0.1 mg/mL) at pH 1
and pH 14 were prepared and exposed to a UV lamp emitting at 360 nm (see figure 3.7a). The
aim of these measurements is to have reference spectra of the two limit conformation of the
bispyrene 2. The acid solution of bispyrene 2 appears violet and the basic one is blue-green.
Thus, the proportion of the two conformations (“opened” and “closed”) of the bispyrene
structure in each solution is not the same. This difference of behaviour can be explained by
the protonation of the diethylenetriamine spacer in acid condition: the spacer adopts a linear
conformation to pull away the positive charges of the three ammonium groups (figure 3.7c).
Thus, the emission of fluorescence observed from the acid solution is identical to the one
recorded from an isolated pyrene ring (figure 3.7b): three intense and characteristic peaks
identified at 395, 375 and 420 nm explain the resulting violet color (figure 3.7a). At pH 14,
the hydrophobic effect occurs and the two pyrene rings are close together leading to the very
broad fluoresecent excimer emission at 480 nm, responsible of the green color (figure 3.7b).
We assumed that if we are able to prepare a PAM hydrogel containing the bispyrene 2 under
its closed conformation and linked in the polymeric architecture, by stretching of this
material, we can switch the closed conformation to the opened one.
According to the previous part 3.3.1 of this chapter 3, the preparation of the suitable
PAM hydrogel require to mix successively together the acrylamide, the bisacrylamide and the
water solution, containing the bispyrene 2 in our case. All solutions were adjusted at pH 14
before polymerization. Then, TEMED and APS were added and the radical polymerization
occurred overnight. The resulting PAM hydrogel was washed up to no fluorescence emission

56
was detected in the washing water. The so-washed gel was still emitting fluorescence, proving
the covalent grafting of bispyrene 2 in the PAM structure, but the color emitted was blue sky
when exposed to a UV lamp (360 nm), which is the characteristic color of the opened
conformation of bispyrene 2 (figure 3.8a). Using an optical probe specially dedicated to the
measurement of the fluorescence of material, we recorded the fluorescence emission spectra
of the PAM hydrogel containing bispyrene 2. As expected, the spectra observed is similar to
the one measured with the bispyrene 2 in pH 1 solution (figure 3.8b). Therefore, the bispyrene
2 has adopted an opened conformation during the PAM polymerization process.
Figure 3.7: (a) Pictures of the bispyrene 2 in aqueous solutions (0.1 mg/mL) at pH 1 and pH
14 when exposed to a UV lamp (360 nm); (b) Fluorescent emission spectra of bispyrene 2
solutions at pH 1 and pH 14 when excited at 342 nm; (c) Schematic representation of the
equilibrium between the “opened” and “closed” conformation of the bispyrene 2, according to
the pH.
a. b.
pH 14
pH 0
480nm
c.
« Opened » conformation « Closed » conformation
420nm
395nm
375nm

57
Figure 3.8: (a) Pictures of the PAM hydrogel containing the bispyrene 2 exposed to sunlight
(left) and under a UV lamp at 360 nm (right); (b) Fluorescence emission spectra of the PAM
hydrogel containing the bispyrene 2 excited at 342 nm; (c) Fluorescence emission spectra of
the bispyrene 2 in aqueous solution (0.1 mg/mL) (blue curve) and in presence of acrylamide
and bisacrylamide (green curve), both at pH 14.
To understand why the bispyrene 2 conformation switches from the closed
conformation to the opened one, we measured the fluorescence emission spectra of the
bispyrene 2 at pH 14, in presence of acrylamide and bisacrylamide compounds. We observed
a complete lost of fluorescence emission (figure 3.8c). We assigned this result to a quenching
fluorescence effect coming from the acrylamide or bisacrylamide. It must be noted that this
phenomena has been already reported in the literature21 and can be explained by the possible
stacking of acrylamide or bisacrylamide molecule between the two pyrene rings.
3.4 Conclusion
In the part 3.3.2 of this chapter, we studied the design and the preparation of
poly(acrylamide) hydrogel containing the bispyrene 2 covalently attached into the polymeric
architecture as mechanotransduction system. Yet the polyacrylamide gels could not be
stretched without breaking them (however, an alternative of this problem is described in
chapter 6). The amount of fluorescent bispyrene 2 which is added to the hydrogel was
optimized and allowed us to measure the fluorescence intensity signal by a
spectrofluorometer. Unfortunately, despite that the bispyrene 2 is readily incorporated into the
a. b.
c.
Acrylamide/bisacrylamide/bispyrene 2 at pH 14
Bispyrene 2 at pH 14

58
PAM network, this sensor 2 cannot play the wished role because it is mainly present in the
open conformation in the resulting PAM hydrogel. We thus failed to use it as mechano
molecular sensor in the chosen hydrogel matrix.
Yet, the bispyrene molecules can also be a pH sensor. We thus decided to make use of
this molecule as pH sensor in one-pot morphogen self-constructed films that were introduced
in 2011 by our team. The idea is to buildup covalent cross-linking films by the electro control
Huisgen click chemistry reaction between modified polyelectrolytes and homobifuntional
spacers in the presence of a catalyst which is generated after applying an electric potential.
Thus, we have prepared the bispyrene 3 described in the previous part 3.2, as
homobifunctional cross-linker and pH sensors. The work represent the part 3.6 of this chapter
3 and have been recently published in Soft Matter.
3.5 References
(1) Engler, A. J.; Sen, S.; Sweeney, H. L.; Discher, D. E. Matrix elasticity directs stem cell
lineage specification Cell 2006, 126, 677-689.
(2) Discher, D. E.; Janmey, P.; Wang, Y.-l. Tissue Cells Feel and Respond to the Stiffness of
Their Substrate Science 2005, 310, 1139-1143.
(3) Rief, M.; Gautel, M.; Oesterhelt, F.; Fernandez, J. M.; Gaub, H. E. Reversible unfolding of
individual titin immunoglobulin domains by AFM Science 1997, 276, 1109-1112.
(4) Kellermayer, M. S. Z.; Smith, S. B.; Granzier, H. L.; Bustamante, C. Folding-unfolding
transitions in single titin molecules characterized with laser tweezers Science 1997, 276,
1112-1116.
(5) del Rio, A.; Perez-Jimenez, R.; Liu, R.; Roca-Cusachs, P.; Fernandez, J. M.; Sheetz, M. P.
Stretching single talin rod molecules activates vinculin binding Nature 2009, 323, 638-641.
(6) Zhang, X.; Rehm, S.; Safont-Sempere, M. M.; Wurthner, F. Vesicular perylene dye
nanocapsules as supramolecular fluorescent pH sensor systems Nat. Chem. 2009, 1, 623-629.
(7) Pérez-Gonzalez, R.; Machi, L.; Inoue, M.; Sanchez, M.; Medrano, F. Fluorescence and
conformation in water-soluble bis(pyrenyl amide) receptors derived from
polyaminopolycarboxylic acids Journal of Photochemistry and Photobiology A: Chemistry
2011, 219, 90-100.
(8) Kanai, M.; Hirano, T.; Azumaya, I.; Okamoto, I.; Kagechika, H.; Tanatani, A. Solvent-
dependent conformational and fluorescence change of an N-phenylbenzohydroxamic acid
derivative bearing two pyrene moieties Tetrahedron 68, 2778-2783.

59
(9) Nagata, Y.; Nishikawa, T.; Suginome, M. Solvent-dependent fluorescence and circular
dichroism properties of poly(quinoxaline-2,3-diyl)s bearing pyrene pendants Chemical
Communications 48, 11193-11195.
(10) Toda, M.; Ogawa, N.; Itoh, H.; Hamada, F. Unique molecular recognition property of
bis-pyrene-modified β-cyclodextrin dimer in collaboration with γ-cyclodextrin Analytica
Chimica Acta 2005, 548, 1-10.
(11) Narita, M.; Mima, S.; Ogawa, N.; Hamada, F. Fluorescent molecular sensory system
based on bis pyrene-modified gamma-cyclodextrin dimer for steroids and endocrine
disrupters Analytical Sciences 2001, 17, 379-385.
(12) Shiraishi, Y.; Ishizumi, K.; Nishimura, G.; Hirai, T. Effects of metal cation coordination
on fluorescence properties of a diethylenetriamine bearing two end pyrene fragments Journal
of Physical Chemistry B 2007, 111, 8812-8822.
(13) Yang, J.-S.; Lin, C.-S.; Hwang, C.-Y. Cu2+-Induced Blue Shift of the Pyrene Excimer
Emission: A New Signal Transduction Mode of Pyrene Probes Organic Letters 2001, 3, 889-
892.
(14) Winnik, F. M. Photophysics of preassociated pyrenes in aqueous polymer solutions and
in other organized media Chemical Reviews 1993, 93, 587-614.
(15) Zhou, Y.; Wang, F.; Kim, Y.; Kim, S. J.; Yoon, J. Cu2+-Selective Ratiometric and "Off-
On" Sensor Based on the Rhodamine Derivative Bearing Pyrene Group Organic Letters 2009,
11, 4442-4445.
(16) Pengo, P.; Polizzi, S.; Battagliarin, M.; Pasquato, L.; Scrimin, P. Synthesis,
characterization and properties of water-soluble gold nanoparticles with tunable core size
Journal of Materials Chemistry 2003, 13, 2471-2478.
(17) de Silva, A. P.; Gunaratne, H. Q. N.; Gunnlaugsson, T.; Huxley, A. J. M.; McCoy, C. P.;
Rademacher, J. T.; Rice, T. E. Signaling Recognition Events with Fluorescent Sensors and
Switches Chemical Reviews 1997, 97, 1515-1566.
(18) Balzani, V.; Credi, A.; Raymo, F. M.; Stoddart, J. F. Artificial molecular machines
Angewandte Chemie-International Edition 2000, 39, 3349-3391.
(19) Czarnik, A. W., Fluorescent Chemosensors for Ion and Molecular Recognition. ACS:
Washington, DC, 1993; Vol. 538.
(20) Tanaka, T. Gels Scientific American 1981, 244, 124-138.
(21) Stramel, R. D.; Nguyen, C.; Webber, S. E.; Rodgers, M. A. J. Photophysical Properties
of Pyrene Covalently Bound to Poly-Electrolytes Journal of Physical Chemistry 1988, 92,
2934-2938.

60
3.6 Investigations of bispyrene 3 as homobifunctionnal cross-linker and local pH
sensor of polyelectrolyte based films
Article 1:
“Morphogen-driven self-construction of covalent films built from polyelectrolytes and
homobifunctional spacers: buildup and pH response”
Article by César Rios, Gaulthier Rydzek, Prasad Polavarapu, Jean-Nicolas Tisserant, Jean-
Claude Voegel, Bernard Senger, Philippe Lavalle, Benoît Frisch, Pierre Schaaf, Fouzia
Boulmedais, Loïc Jierry published in Soft Matter, 2012, 8, 10336.

61

62

63
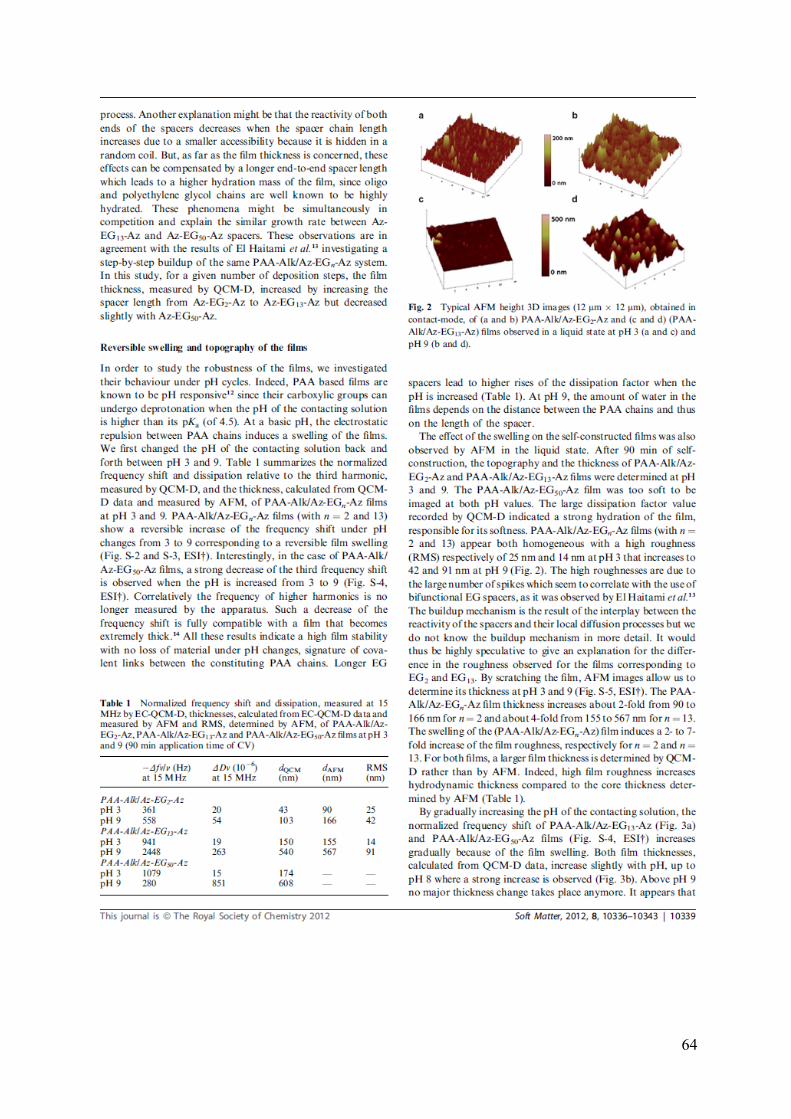
64

65

66

67
68

69
3.6.1 Supporting Information to article 1
SECTION 1: Syntheses of PAA-Alk and homobifunctionnal spacers
General Informations
All starting materials were obtained from commercial suppliers and were used without further
purification. 1H NMR and 13C NMR spectra were recorded on Bruker Advance DPX400 (400
MHz) spectrometers. The NMR chemical shifts are reported in ppm relative to
tetramethylsilane (CDCl3 or MeO-d4) or tert-butanol (1.24 ppm) in D2O (s:singlet, t:triplet,
q:quadruplet, dd:doublet of doublet, br:broad). Infrared spectra were obtained on a Thermo
Electron Corporation Nicolet 380 FT-IR equipped with ATR. Merck RP-18 F254S plates
were used for analytical thin layer chromatography. Silica gel 60 (particle: 40 – 60 m) was
used for flash chromatography.
Synthesis of PAA-Alk 5%. PAA- Alk 5 % was synthesized according to Rydzek, G.;
Thomann, J. S.; Ben Ameur, N.; Jierry, L.; Mésini, P.; Ponche, A.; Contal, C.; El Haitami, A.
E.; Voegel, J.-C.; Senger, B.; Schaaf, P.; Frisch, B.; Boulmedais, F. Langmuir 2009, 26,
2816–2824.
Synthesis of bispyrene has been prepared according to Shiraishi, Y.; Tokitoh, Y.; Hirai, T.
Org. Lett. 2006, 17, 3841-3844.
Synthesis of Az-Bispyrene-Az. 1-(2-(2-(2-azidoethoxy)ethoxy)ethoxy)pyrene-2-carbaldehyde
(3). To a solution of 100 mg (0.41 mmol) of compound 1 (Y. Zhou et al., Org. Lett. 2009, 11,
4442-4445) in 5 mL DMF was added 561 mg (4.06 mmol, 10 eq) of K2CO3 under argon. To
this bright red solution, 147 mg (0.45 mmol, 1.1 eq) of tosylate 2 in 1 mL DMF was added
slowly and heated at 60 oC during overnight. Water was added and solvent evaporated under
reduced pressure. The residue was extracted with CH2Cl2 (3 times) and the combined organic
phase was washed with water, dried over MgSO4, solvent evaporated to give yellowish
residue. This was flashed in a silica gel column eluting with 0-3 % ethyl acetate in CH2Cl2 to
get 110 mg (67 %) of product 3 as light brown semi solid (contains little tosylate starting
material). 1H NMR (400 MHz, CDCl3) : δ = 10.82 (s, 1H), 8.47 (s, 1H), 8.36 (d, 3J = 9.0 Hz,
1H), 8.08 (d, 3J = 7.5 Hz, 1H), 8.04 (d, 3J = 7.5 Hz, 1H), 8.03 (d, 3J = 9.0 Hz, 1H), 7.95 (t, 3J =
7.5 Hz, 1H), 7.90 (d, 3J = 9.0 Hz, 1H), 7.85 (d, 3J = 9.0 Hz, 1H), 4.40 (m, 2H), 3.93 (m, 2H),

70
3.75 (m,2H), 3.72 (m, 2H), 3.68 (t, 3J = 5.0 Hz, 2H), 3.38 (t, 3J = 5.0 Hz, 2H); 13C NMR (100
MHz, CDCl3) : δ = 190.9, 155.7, 131.8, 131.6, 128.9, 127.9, 127.5, 127.5, 127.3, 127.1,
126.1, 125.3, 125.2, 124.5, 124.3, 123.5, 121.2, 70.8, 70.6, 70.2, 70.0, 50.7; MS (ESI) m/z
calcd for C23H21N3NaO4 [M + Na]+ = 426.14, found 426.00; IR (neat, cm-1) : 2921, 2853,
2100, 1683, 1123.
N1-((1-(2-(2-(2-azidoethoxy)ethoxy)ethoxy)pyren-2-yl)methyl)-N2-(2-((1-(2-(2-(2-
azidoethoxy) ethoxy)ethoxy)pyren-2-yl)methylamino)ethyl)ethane-1,2-diamine (Az-
bispyrene-Az). A stirring solution of 110 mg (0.27 mmol, 2 eq) of Pyrene derivative (3) and
14 mg (15 µL, 0.14 mmol) of diethylenetriamine in 12 mL CH2Cl2 with few molecular sieves
was refluxed for 2.5 h under argon. The reaction mixture was cooled down and filtered off the
molecular sieves and the filtrate evaporated. To this semi oily yellow residue 13 mL ethanol
and 31 mg (0.82 mmol, 6 eq) of NaBH4 were added and heated at 60 oC for 4 h and stirring
continued for 16 h at room temperature. Solvent was evaporated under reduced pressure and
the residue was taken into CH2Cl2, washed with 1 M NaOH solution (3 times), water and
concentrated by evaporation to give impure compound Az-bispyrene-Az as light orange
semisolid. This compound was used without further purifications. 1H NMR (400 MHz,
CDCl3) : δ = 8.36 (d, 3J = 9.0 Hz, 2H), 8.11 (m, 4H), 8.03 (m, 4H), 7.92 (m, 6H), 4.22 (m,
6H), 4.00 – 3.30 (m, 22H), 2.81 (m, 8H); 13C NMR (100 MHz, CDCl3) : δ = 155.7, 144.7,
131.0, 130.9, 128.6, 127.4, 127.3, 127.0, 125.9, 124.0 – 125.5 (5C), 121.3, 70.7, 70.6, 70.0,
69.1, 68.7, 50.7, 50.6; MS (Maldi-TOF) m/z calcd for C50H56N9O6 [M + H]+ = 878.435, found
878.669; IR (neat, cm-1) : 2924, 2868, 2104, 1123.

71
SECTION 2: Fluorescence measurements on the film PAA-Alk/Az-Bispyrene-Az.
All fluorescence intensities were measured by using the spectrofluorometer FluoroMax-4
from HORIBA JOBIN YVON at 432 nm of excitation wavelength. Emission fluorescence
intensity of the film PAA-Alk/Az-Bispyrene-Az film was measured as follows:
1. The self-constructed PAA-Alk/Az-Bispyrene-Az film was prepared on an ITO
substrate by using the EC-QCM-D according to the description process given in the
Materials and Methods section of the article. To measure fluorescence, the buildup of
the film studied was stopped when Δfν/ν corresponding to the third overtones reached -
950 Hz by the QCM.
2. The ITO substrate covered with the PAA-Alk/Az-Bispyrene-Az film was dipped in 15
mL of MilliQ solution at desired pH (this pH was obtained by using diluted solutions
of HCl and NaOH).
3. The ITO substrate was deposited on a microscope glass slide with the film on the top.
Then, the film was covered with another, thinner glass slide. This system was
maintained in a home-made adaptor allowing fixing both the ITO substrate and an
optical fiber. Thus, reproducible experiments have been performed.

72
4. The optical fiber F-3000, purchased from HORIBA JOBIN YVON, was fixed in our
home-made adaptor and put in contact with the top glass slide on the ITO substrate by
using a micrometer screw (see picture below).
5. Excitation of the film at 342 nm and fluorescence emission was done through the
optical probe into a dark room.
Micrometer screw Optical fiber
Sample

73
a
Time (min)
0 10 20 30 40 50 60
f /(
Hz)a
t 15
MH
z
0
100
200
300
400
500
600
700
b
Time (min)0 10 20 30 40 50 60
D /
at 1
5 M
Hz
(uni
ts o
f 10
- 6 )
0
10
20
30
Fig. S-1 Evolution of the opposite of the normalized frequency shift (a) and dissipations (b),
measured at 15 MHz (ν = 3) by EC-QCM, during the self-construction of PAA-Alk/Az-EG2-
Az (green line), PAA-Alk/Az-EG13-Az (red line) and PAA-Alk/Az-EG50-Az films (blue line). A
mixture solution (PAA-Alk, Az-EGn-Az and CuSO4) is in contact with the gold substrate
(QCM crystal) and a cyclic voltammetry (CV) between -350 mV and + 600 mV (vs Ag/AgCl,
scan rate of 50 mV/s) is applied. The film is built on a PEI pre-coated surface.

74
Time (min)
270 280 290 300 310
f /
(H
z) a
t 15
MH
z
300
350
400
450
500
550
600
pH 3
pH 9
pH 3
pH 9
Fig. S-2 Evolution of the opposite of the normalized frequency shift, measured at 15 MHz (ν
= 3) by EC-QCM-D, of PAA-Alk/Az-EG2-Az film during pH changes back and forth from 9 to
3. After the film buildup on a PEI precoated surface, aqueous solutions at pH 9 and pH 3 were
put into contact alternately with the film under a flow rate of 1 mL/min. The swelling and
shrinking recorded are attributed to reversible deprotonation/protonation of the carboxylic
functions of PAA.

75
Time (min)
300 310 320 330 340 350
f
/ (
Hz)
at 1
5 M
Hz
1000
1200
1400
1600
1800
2000
2200
2400
pH 3
pH 9pH 9
Fig. S-3 Evolution of the opposite of the normalized frequency shift, measured at 15 MHz (ν
= 3) by EC-QCM-D, of PAA-Alk/Az-EG13-Az film during pH changes back and forth from 9
to 3. After the film buildup on a PEI precoated surface, aqueous solutions at pH 9 and at pH 3
were put into contact alternately with the film under a flow rate of 1 mL/min. The swelling
and shrinking recorded are attributed to reversible deprotonation/protonation of the carboxylic
functions of PAA.

76
Time (min)
260 280 300 320 340 360 380 400 420
f
/(H
z) a
t 15
MH
z
200
400
600
800
1000
1200
1400
pH 3
pH 5 pH 7
pH 9 pH 11
pH 3 pH 3 pH 3 pH 3
Fig. S-4 Evolution of the opposite of the normalized frequency shift, measured at 15 MHz (ν
= 3) by EC-QCM-D, of a PAA-Alk/Az-EG50-Az film during gradual pH increase from pH 3 to
pH 11. After the film buildup on a PEI precoated surface, aqueous solutions at different pH
were put into contact alternately with the film under a flow rate of 1 mL/min. After an
expected increase of the frequency shift with the increase in pH, one observes a strong
decrease of the frequency shift when the pH increases at pH 9 and 11. Correlatively the
frequency of higher harmonics is no longer measured by the apparatus. Such a decrease of the
frequency shift is fully compatible with a film that becomes extremely thick (Xu, F. Yao, G.
D. Fu, E. T. Kang, Biomacromolecules, 2010, 11, 1810).

Fig. S-
profilom
Alk/Az-E
pH 9 (b
0 2
Z (
nm)
0
50
100
150
200
0
Z (
nm)
0
100
200
300
400
-5 Typical
metric secti
EG13-Az) fi
b, d).
a
c
X(µm)4 6
X (µ
2 4
AFM heig
ons profile
ilms obtaine
8 10
m)
6 8
ght 3D im
s of scratch
ed, in conta
0
Z (
nm)
0
100
200
300
10
Z (
nm)
0
400
800
1200
1600
ages (12 µ
hed (a, b)
act-mode, o
b
X (µ2 4
0 2 4
0
0
0
0
0
µm × 12 µ
(PAA-Alk/A
bserved in
d
µm)4 6
X (µm)
4 6 8
µm) and t
Az-EG2-Az)
liquid state
8
10
their corres
) and (c, d)
e at pH 3 (a
77
sponding
) (PAA-
a, c) and

78
a
b
pH of the solution
1 2 3 4 5 6 7 8 9 10 11
Flu
ores
cenc
e in
tens
ities
rat
io
0.4
0.6
0.8
1.0
Fig. S-6 (a) Fluorescence emission spectra of Az-bispyrene-Az molecule in solution measured
at different pH with an excitation wavelength of 342 nm. The concentration of Az-bispyrene-
Az was 0.2 mg/mL prepared in a 80:20 (v/v) water/ethanol solution. (b) Evolution of
fluorescence intensities ratios of Az-bispyrene-Az in solution () between the excimer (480
nm) and a monomer (383 nm) peaks and () between the two monomer peaks (404 and 385
nm) as a function of pH. A calibration curve (red curve) can be plotted with the following
equation: Fluorescence Intensity Ratio of excimer = 0.0832 × pH + 0.2347 (R2 = 0.977).
Wavelenght (nm)
400 450 500 550 600 650
Flu
ores
cenc
e In
tens
itity
(a.
u)
0
50x103
100x103
150x103
200x103
250x103
pH = 2 pH = 3 pH = 4 pH = 5 pH = 8 pH = 9

79
a b
Time (min)0 20 40 60 80 100 120
f
/ a
t 15
MH
z (H
z)
0
50
100
150
200
250
Fig. S-7 (a) Evolution of the opposite of the normalized frequency shift, measured at 15 MHz
(ν = 3) by EC-QCM-D, as a function of time in the presence of (PAA-Alk/Az-bispyrene-Az)
mixture (blue line) and of (PAA-Alk/azide-free bispyrene) mixture (red line) during the CV
application between -350 mV and +600 mV (vs Ag/AgCl, scan rate of 50 mV/s). (b)
Evolution of the calculated thicknesses of PAA-Alk/Az-bispyrene-Az film (blue line) and
PAA-Alk/azide-free bispyrene mixture (red line). The film thickness was calculated using the
Voigt model (M. V. Voinova, M. Rodahl, M. Jonson, B. Kasemo, Physica Scripta 1999, 59,
391) from EC-QCM-D data. The mixture solutions were prepared at pH 4 in water/ethanol
50/50 (v/v) solution with 0.5 g/L of polymer and of Az-bispyrene-Az and 0.6 mM of CuSO4.
The film is built on a PEI precoated surface.
Time (min)
0 20 40 60 80 100 120
Film
th
ickn
ess
(n
m)
0
40
80
120

80
Fig. S-8 AFM 3D images of (a, d) non-scratched (6 µm 6 µm) and (b, e) scratched (12 µm
12 µm) PAA-Alk/Az-bispyrene-Az film with (c, f) their respective profilometric sections
obtained in AFM height mode in liquid state at pH 3 (a, b, c) and pH 9 (d, e, f).
a
b
c
d
e
f
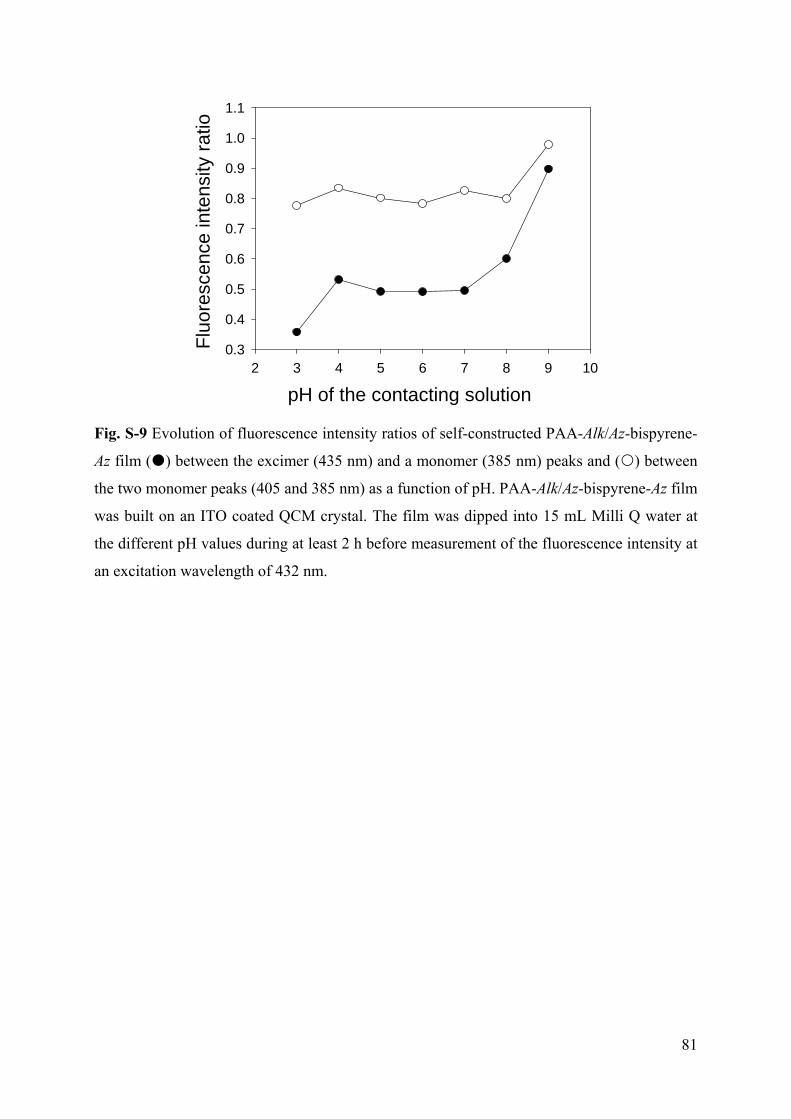
81
Fig. S-9 Evolution of fluorescence intensity ratios of self-constructed PAA-Alk/Az-bispyrene-
Az film () between the excimer (435 nm) and a monomer (385 nm) peaks and () between
the two monomer peaks (405 and 385 nm) as a function of pH. PAA-Alk/Az-bispyrene-Az film
was built on an ITO coated QCM crystal. The film was dipped into 15 mL Milli Q water at
the different pH values during at least 2 h before measurement of the fluorescence intensity at
an excitation wavelength of 432 nm.
pH of the contacting solution
2 3 4 5 6 7 8 9 10
Flu
ores
cenc
e in
tens
ity r
atio
0.3
0.4
0.5
0.6
0.7
0.8
0.9
1.0
1.1

82
Chapter 4
Covalent modifications of
poly(dimethylsiloxane) substrate to design
reversible chemo-mechanoresponsive
surfaces

83
4.1 Introduction
Mechanosensitive transduction processes are frequently encountered in nature.1-3 For
instance, carnivorous plants or Mimosa Pudica species (also commonly called Sensitive or
Touch-me-not) are considered as mechanoresponsive living organisms: in both cases, a
mechanical stimulation, like touching or vibrations, induces chemical transformations4
(figures 4.1a and 4.1b). In the case of cell adhesion on a substrate, the transfer of information
going from a mechanical stimulation to a chemical recognition is now well understood and
accepted by the community.5 Indeed, it has been demonstrated that when the stretching of
specific proteins occurs, buried recognition sites called cryptic sites, are exhibited, leading to
the formation of focal adhesion.6, 7 At the molecular scale, another example is the assembly-
disassembly cycle of the actin polymer responsible of the internal architecture of cells.8 This
process is under the control of the interaction between the talin protein and vinculin, its
natural ligand.9 This interaction occurs only when talin is mechanically stretched as depicted
in figure 4.1c.10 The cryptic binding site of the vinculin ligand is so “discovered” and the
interaction between the receptor and its ligand is allowed. This binding between talin and
vinculin, only possible when talin is unfolded through a mechanical stretching initiates a
chemical process which is the actin cytoskeleton polymerization.
Figure 4.1: (a) The snap traps of this carnivorous plant, called Dionaea muscipula, close
rapidly when the sensitive hairs on the leaf lobes are mechanically triggered11; (b) Mimosa
pudica is mechanosensitive plant native from South America and Central America: its leaves
fold inward and droops when touched or shaken, re-opening minutes later12; (c) Schematic
representation of the talin unfolding when stretched, allowing the binding with vinculin ligand
through the accessibility of a cryptic site.10
a. b. c. Talin at rest Vinculin free
Binding of Vinculin
Talin stretched

84
Inspired from this idea, our group developed recently several strategies based on
multilayer films to design mechanoresponsive materials. Thus, it was introduced the first
example of bio-inspired films becoming enzymatically active under stretching13 and more
recently cyto-mechanoresponsive.14 In these both approaches, active compounds are
embedded in a polyelectrolyte multilayer and a mechanical stretching of the architecture
renders the compounds accessible to their environment. However, none of these alternatives
allows designing fully reversible systems. Thus there is still a further stage to go and
designing reversible chemo-mechanoresponsive materials remains a challenging project. To
take up this challenge, herein I will describe our work concerning the design of cryptic site
surfaces that reproduce closely the behavior of the cryptic site proteins. This concept is
schematically represented in figure 4.2.
Figure 4.2: Schematic representation of the reversible cryptic site mechanoresponsive
surface. At rest (left side), due to the high density of PEG chains grafted onto the substrate,
the ligand (biotin) are not accessible to their receptor (Streptavidin). Under stretching (right
side), the PEG chain density decreases, rendering the ligand (biotin) accessible.
Our goal is to design a material able to switch its ability to adsorb specifically a
protein according to the level of stretching. Indeed, currently the control of protein adsorption
on all kind of surfaces is an important issue in the field of biomaterial development since this
interaction is involved in biocompatibility processes.15-17 We used the Streptavidin-biotin
system as model of couple ligand – receptor. To reach our goal, the surface of a selected
elastomer will be modified with poly(ethylene oxide) (PEG) chains to get PEG brushes,
rendering it antifouling. Despite the simultaneous presence of biotin groups on this surface,
the Streptavidin should not interact with them. When this elastomeric material is stretched in a
longitudinal direction, the density of PEG brushes decreases and then the protein can
recognize its natural ligand. When return at rest, the PEG chains on the surface should
Streptavidin
At rest Under stretching
Biotin PEG chain

85
sterically push away the streptavidin from the biotin, leading to a reversible
mechanoresponsible process.
In the first part of this chapter 4, I will present the different elastomeric silicone
substrates chosen (Scheme 4.1). A long part is dedicated to the description of the PDMS
Sylgard-184 which is the silicone substrate we entirely prepared and characterized (Part 4.2).
Then, the oxydation of the silicone substrate, based on the UV-Ozone (UVO) treatment, will
furnish hydroxyl groups on the surface (Part 4.3). Silanization with a mercaptosilane
derivative on this so-prepared hydroxylated silicone substrate will lead to a thiol-coverage
layer (Part 4.4). By using the thiol-ene click reaction between SH groups and maleimide
moieties, PEG chains and biotin entities will be covalently grafted on the silicone. Finally,
stretching experiments will constitute the last part of this chapter (Part 4.5).
Scheme 4.1: Schematic representation of the different parts 4.2, 4.3, 4.4 and 4.5 constituting
the plan of the chapter 4.
It must be noted that during my PhD work, a similar topic was developed by my group
in collaboration with Dr Vincent Roucoules from the Institut de Science des Matériaux de
Specifications requirements leading to choose silicone as substrate.
Principe and preparation of silicone.
OH
OH OH OH OH OH
Part 4.2
Part 4.3
Part 4.4
Part 4.5
Oxidation of silicone surface.
Silanization providing thiol group layer.
Functionnalization with PEG chains and Biotin groups.
Stretching experiments.

86
Mulhouse (IS2M). This project was running by using another strategy based on the use of
polymer plasma technique.18
4.2 Choice of the elastomeric substrate: the PDMS
The choice of the substrate is of crucial importance for our project. It must fulfill the
following conditions:
- To be transparent to UV and allow fluorescent measurements (no absorption in UV
and no fluorescent emission).
- To be an elastomer (stretchable up to 100% at least).
- To be chemically modified on surface (allowing covalent grafting).
- Commercially available (and cheap also) or easy to prepare.
Thus, the PDMS, or also commonly called silicone, appeared as an ideal candidate.
Several commercial sources of silicone sheets can be found. We decided to work with two
kinds of silicone substrates: the commercially available silicone sheet from Specialty
Manufacturing Inc. (SMI, Michigan, USA) and a home-made silicone Sylgard-184 prepared
from starting compounds purchased from Dow Corning. The silicone sheet SMI is well
known in my group because already used in other projects involving multilayer film buildup.
It is a stretchable elastomer, displaying low auto-fluorescent and guaranteed filler free by the
provider. It can be purchased in large amounts in an A4 format sheets, with a thickness of 250
µm. The silicone Sylgard-184 is a PDMS largely described in the literature and used as an
elastomeric biomaterial.19-21 We decided to prepare our own silicone to control the size of the
resulting silicone sheet. In particular, the thickness of the silicone layer is important for
fluorescence measurement and adaptability into our home-made stretching device. The
stretching ability of the silicone sheet is also dependent of the thickness: thinner silicone
sheets lead to higher stretching level. Furthermore, preparing our own silicone reduces the
risk of adsorbed contamination on the surface. Smooth and defect free silicone surfaces can
also be expected from the home-made silicone sheet.
In the next part of this chapter 4 is reported a short description of PDMS, its principle of
synthesis and the preparation of the PDMS Sylgard-184.

87
4.2.1 The PDMS Sylgard-184: presentation, principle of synthesis and preparation
4.2.1.1 Introduction
Since their introduction in the 1960s, silicone rubbers have steadily gained market
share from porcelain and glass as outdoor insulation and protective materials.22 One of the
most used silicone rubbers is PDMS, which are synthetic polymers containing repetitive units
of Si-O in the principal chain and presents organic groups linked to the silicium atom by a Si-
C bond (figure 4.3).21
Figure 4.3: Chemical structure of a poly(dimethylsiloxane) chain: Si-O bonds ensure the
backbone of the polymer and all the methylene groups are responsible of the strong and
characteristic hydrophobic property of PDMS. n is the repeating unit.
There exists a variety of silicones, depending on the chemical structure, that can
present linear molecules (fluids) or small macromolecular networks after reticulation (solids).
In our case, the reticulated PDMS is of course the most interesting one.
4.2.1.2 Methods and mechanism of PDMS reticulation
In order to obtain a cross-linked elastomer based on poly(dimethylsiloxane), different
methods can be used as for example γ irradiation, electron beam, ultra violet,
polycondensation or hydrosilylation. In my project, we used the hydrosilylation reaction
which consists in the addition of a hydrogen silane bond (Si-H) across an unsaturated double
bond23 (Scheme 4.2).

88
Scheme 4.2: General scheme of hydrosilylation reaction between hydrogen silane and
unsaturated bond on two different PDMS chains. The product of this reaction leads to a new
Si-C bond formation ensuring the cross-linkage between PDMS chains and the reticulation of
the material.
This reaction is typically catalyzed by late transition metals such as rhodium (Rh),
palladium (Pd) and platinum (Pt), the last one is an extremely active catalyst thus commonly
used. The best known hydrosilylation catalyst is the Speier’s catalyst which is a solution of
hexachloroplatine acid (H2PtCl6) in isopropanol.24 In the last years, another active catalyst
have appeared in the literature, the Karstedt’s catalyst which is a Pt(0) complex coordinated
with divinyltetramethyldisiloxane (figure 4.4).25 This catalyst is more reactive than the Speier
one. Therefore we used it in the preparation of our PDMS substrate.
Figure 4.4: Molecular structure of the Karstedt’s catalyst, based on Pt(0).
The catalytic mechanism of hydrosilylation involving the Karstedt’s catalyst is
commonly accepted and called the Chalk-Harrod mechanism.26 This mechanism consists of
catalytic cycles of oxidation addition and reductive elimination (figure 4.5)
Hydrosilylation
Double bond
SiHydrogen silane

89
Figure 4.5: Chalk-Harrod mechanism for the catalytic cycle of hydrosilylation of olefins
using the Karstedt’s catalyst.
The first step of the catalytic cycle (step I in figure 4.5) is the coordination of the Pt(0)
with the olefin followed by the oxidant addition of the HSiR3 (step II) producing a Pt(II)
complex. Then, the coordinated olefin in the complex migrates between the Pt-H bond
(migratory insertion) (step III). The last step (step IV) is the reductive elimination with the
generation of Pt(0) which can coordinate with another olefin and continue the catalytic cycle.
4.2.1.3 The PDMS Sylgard-184
In our experiments, PDMS were made by mixing a viscous base and curing agent of
Sylgard-184 (see chapter 2 Materials and Methods). The base is a poly(dimethyl-
methylvinylsiloxane) prepolymer containing also a small amount of platinum (Pt), the
Karstedt’s catalyst, and the curing agent is a mixture of vinyl-endcapped PDMS precursors
and poly(dimethyl-hydrogenosiloxane) as cross-linkers27 (figure 4.6a). Upon mixing together,
the so-called curing process is started; the vinyl groups and the hydrosilane hydrogens
undergo a hydrosilylation reaction in presence of Pt catalyst, which results in highly cross-
linked three-dimensional networks.
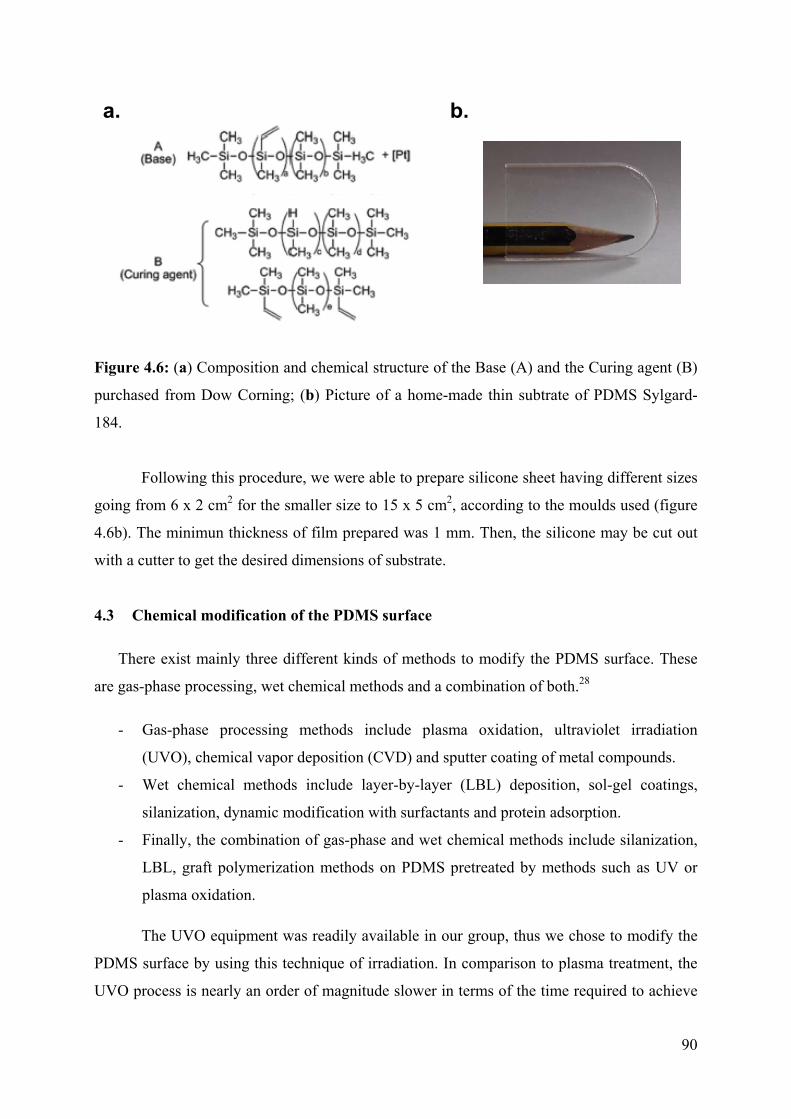
90
Figure 4.6: (a) Composition and chemical structure of the Base (A) and the Curing agent (B)
purchased from Dow Corning; (b) Picture of a home-made thin subtrate of PDMS Sylgard-
184.
Following this procedure, we were able to prepare silicone sheet having different sizes
going from 6 x 2 cm2 for the smaller size to 15 x 5 cm2, according to the moulds used (figure
4.6b). The minimun thickness of film prepared was 1 mm. Then, the silicone may be cut out
with a cutter to get the desired dimensions of substrate.
4.3 Chemical modification of the PDMS surface
There exist mainly three different kinds of methods to modify the PDMS surface. These
are gas-phase processing, wet chemical methods and a combination of both.28
- Gas-phase processing methods include plasma oxidation, ultraviolet irradiation
(UVO), chemical vapor deposition (CVD) and sputter coating of metal compounds.
- Wet chemical methods include layer-by-layer (LBL) deposition, sol-gel coatings,
silanization, dynamic modification with surfactants and protein adsorption.
- Finally, the combination of gas-phase and wet chemical methods include silanization,
LBL, graft polymerization methods on PDMS pretreated by methods such as UV or
plasma oxidation.
The UVO equipment was readily available in our group, thus we chose to modify the
PDMS surface by using this technique of irradiation. In comparison to plasma treatment, the
UVO process is nearly an order of magnitude slower in terms of the time required to achieve
a. b.

91
the same results.29 However, one main advantage of UVO treatment methods is the better
control of the oxidative process: formation of holes on the surface or cracks due to over-
oxydation of silicone can be avoided by controlling the exposition time of UVO.30 Another
important benefit is the simple way to use the UVO device. There is no need to make vacuum
or requirement of gas such as oxygen. All the oxidation treatments by UVO on silicone
substrates were done in normal conditions (atmospheric pressure and room temperature).
4.3.1 Principle of the UVO oxidation process of silicone surface
UVO treatment is a photosensitized oxidation process in which the surface of the
treated PDMS is excited and/or dissociated by the absorption of two short-wavelength UV
radiations. Two distinct UV lamps equip the UVO device. Atomic oxygen is generated when
molecular oxygen is dissociated by λ1 = 185 nm and in presence of molecular oxygen (O2,
coming from the air), the ozone molecule (O3) is formed. A second UV wavelength of λ2 =
254 nm radiation creates radicals species by reaction with organic matter, such as the methyl
groups in the case of the PDMS.29 These radicals react with ozone to form simple oxidized
and volatile molecules (such as carbon dioxide), which desorbs from the surface, leading
mainly to silanol groups (figure 4.7).
Figure 4.7: Schematic and simplified representation of the PDMS oxidation under UVO
treatment: A first lamp emits at λ1 = 185 nm and induces the formation of ozone (O3). Then, a
second lamp (λ2 = 254 nm) forms radicals with methyl groups on the surface of silicone.
Reaction between these radicals and O3 lead to the formation of silanol groups responsible of
the high hydrophilic features of the oxidized PDMS surface.
O2
O3
λ1 = 185 nm
+
λ2 = 254 nm
Silicone surface
(First UV lamp)
(Second UV lamp)
Silanol group
(Ozone)
(Oxygen)

92
4.3.2 Results of the chemical modifications and characterization of the silicone surface
It must be noted that the data shown in the following part 4.3.2.1 relative to the
characterization of oxidized PDMS surfaces are also presented in more detailed in chapter 6.
Indeed, this strategy of PDMS modification was also efficiently used in another project of my
PhD.
4.3.2.1 UVO oxidation of silicone SMI and PDMS Sylgard-184
As mentioned in the beginning of this chapter 4, two kinds of PDMS were used in our
study, both fillers free: a first one was purchased from SMI, and a second one named PDMS
Sylgard-184, prepared from starting precursors provided by Dow Corning. First of all, we
studied the influence of the exposition time of PDMS under UVO on the formation of silanol
groups and potentially presence of cracks. I remind here that this oxidation step of the silicone
substrate will allow the next silanization step. Silanol groups formed through UVO treatment
will change the initial hydrophobic surface of PDMS to hydrophilic. This was evaluated
through contact angle measurement. In figures 4.8a and 4.8b are shown the evolution of
contact angles of water on silicone sheets SMI and PDMS Sylgard-184 respectively according
to the UVO exposition time.
The contact angle measurements have been done from the unexposed silicone sheets
and every 15 minutes of UVO treatment, up to 120 minutes. Starting from highly hydrophobic
surface of SMI and PDMS Sylgard-184, 98° and 107° respectively, we observe in both cases
a roughly linear decrease of the contact angle up to 8-10° after two hours of UVO treatment
(see also figure 4.8c). The surfaces become more and more hydrophilic with the increase of
the exposition time of UVO.
It is well know that the hydrophilic feature of these PDMS surfaces are temporary:
after an oxidation treatment, the surface recovers its hydrophobicity with time due to the
migration of short and uncrosslinked PDMS chains from the bulk to the surface.30-32
Therefore, the next FTIR-ATR measurements and the silanization step, described later in the
part 4.4, were done immediately after this UVO treatment.

93
Figure 4.8: Evolution of the contact angle of water (a) on silicone SMI and (b) PDMS
Sylgard-184 surfaces exposed to UVO treatment at different times up to 120 minutes. All the
contact angle measurements have been done directly after UVO oxidation. Error bars
correspond to at least three measurements realized on various areas of the silicone surface; (c)
Images of water droplet on SMI untreated by UVO and treated during 45, 75, 105 and 120
minutes. The number on the top of each droplet indicates the contact angle measured.
Time (min)
0 20 40 60 80 100 120 140
Mea
n C
onta
ct A
ngle
(°)
0
20
40
60
80
100
120
Time (min)
0 20 40 60 80 100 120 140
Me
an
Co
nta
ct A
ng
le (
°)
0
20
40
60
80
100
120
a. b.
c. 67° 40° 18° 10° 99°
0 min 45 min 75 min 105 min 120 min

94
Figure 4.9: (a) Overlapping of the FTIR-ATR spectra of the silicon surface (SMI) at different
times of UVO exposition; (b) Increasing of the band intensity localized at 3300 cm-1 with the
UVO exposition time going from 0 to 120 min; (c) Decreasing of the band intensity localized
at 1260 cm-1 with the UVO exposition time going from 0 to 120 min; (d) Evolution of the
normalized IR vibration bands localized at 3300, 1725 and 900 cm-1; (e) Evolution of the
normalized vibration bands localized at 2963, 1260 and 1010 cm-1.
The origin of this increasing hydrophilic feature with the exposition time of UVO can
be explained by analysing FTIR-ATR spectrum of the treated silicone surface. A complete
study about the UVO treatment on PDMS Sylgard-184 monitored by several techniques of
analysis, in particular FTIR-ATR, has been reported by Genzer and collaborators.29 In
agreement with this previous work, the monitoring of the FTIR-ATR spectra at different time
of UVO exposition show the formation of polar groups, such as hydroxyl and carbonyl
UVO time (min)
0 20 40 60 80 100 120
No
rmal
ized
abs
orba
nce
(u
. a.
)
0.0
0.2
0.4
0.6
0.8
1.0
1.2
CO peak (1725 cm-1)OH peak (3300 cm-1) Si-OH peak (900 cm-1)
Frequency (cm-2)
300032003400360038004000
Abs
orba
nce
(u. a
)
0.00
0.01
0.02
0.03
no UVO15 min UVO30 min UVO45 min UVO60 min UVO75 min UVO120 min UVO
3300 -OH
Frequency (cm-2)
12201240126012801300
Abs
orba
nce
(u. a
)
0.0
0.1
0.2
0.3
0.4
0.5
no UVO15 min UVO30 min UVO45 min UVO1h UVO1h15 UVO2h UVO
1260 cm-1 -CH3
Frequency (cm-2)
1000200030004000A
bsor
banc
e (u
. a)
0.0
0.2
0.4
0.6
0.8
1.0
1.2
no UVO15 min UVO30 min UVO45 min UVO60 min UVO75 min UVO120 UVO
a.
b. c.
d.
UVO time (min)
0 20 40 60 80 100 120
Nor
mal
ized
abs
orb
ance
(u.
a.)
0.5
0.6
0.7
0.8
0.9
1.0
1.1
CH3 peak (2963 cm-1) CH3 peak (1260 cm-1) Si-O-Si peak (1010 cm-1)
e.

95
derivatives. In figures 4.9a, 4.9b and 4.9c is presented the overlapping of all the IR spectra
measured on Silicone SMI at different exposition times of UVO: 15, 30, 45, 60, 75 and 120
minutes.
As expected, a large band at 3300 cm-1 is growing with the increasing exposition time
of UVO (figure 4.9b). The evolution of the normalized absorbance of this band is represented
in figure 4.9d. This vibration band is assigned to the stretching band of the OH bond, probably
due to the formation of the silanol groups. In the same time, we can observe a decrease in the
intensities of characteristic bands of the –CH3 such as 1200 cm-1, corresponding to the
symmetric deformation band of the C-H bond (figure 4.9c), 2960 and 1010 cm-1 (see figure
4.9e) corresponding to the asymmetric CH3 vibrations. In figure 4.9d is also shown the
evolution of the normalized absorbance of bands at 1725 cm-1 and 900 cm-1. These bands are
attributed to a vibration of the carbonyl groups and to the stretching vibration of Si-O in
silanol groups, respectively. Both of them display an increasing intensity of their band when
the time of UVO exposition increases too, indicating the formation of hydroxyl, aldehyde or
carboxylic groups during the reaction of oxidation. However, between 60 and 120 minutes of
UVO exposition, the normalized absorbance band intensity at 1725 cm-1 decreases slightly,
meaning that a small proportion of carbonyl groups disappear, probably because of CO or
CO2 compounds that desorb from silicone. Therefore, according to the results obtained by
contact angle measurements and FT-IR studies, we can conclude that more the SMI silicone
layer is exposed to UVO more the surface has a hydrophilic feature due to more hydroxyl
group’s formation. All these observations are similar to those reported by Genzer on the
PDMS Sylgard-184.
Before proceeding to the silanization step, we stretched the oxidized silicone sheet
(SMI and Sylgard-184) up to 100% of its initial length with a home-made stretching device
(see chapter 2 Material and Methods). This level of stretching is considered as suitable to
observe a mechanotransductive effect. The silicone is stretched in only one (longitudinal)
direction and observed by scanning electron microscopy (SEM). Our goal is to detect the
eventually silica-like layer formed during the UVO treatment: when this layer is stretched,
cracks must appear on the silicone surface. It must be noted that in some cases, the
observation of very large crack formation can also be done with an optical microscope.

96
a.
Figure 4.10: (a) Series of SEM images of silicone surfaces exposed to 105 minutes of UVO
at rest and stretched at 20%, 40%, 50% and 80%. The white bar scale indicates 200µm; (b)
Diagram showing the presence (red area) or absence (blue area) of cracks observed on
silicone surface (SMI) exposed to a given UVO time and after stretching at a given level.
The use of SEM allows discerning the cracks at the microscopic size. We analysed
several SEM images (1 x 1 mm2) of silicone sheets exposed to various UVO treatment times
up to 120 minutes. A series of SEM images of silicone sheets exposed to UVO during 120
minutes and stretched at 20%, 40%, 50% 80% is shown as a characteristic example in figure
4.10a. In this case, appearance of cracks occurred after 50% of stretching. Stretching up to
50% of the initial length of the silicone sheet leads to more cracks formation, as expected. We
did not stretch more than 100% because it happened sometimes that at this level of stretching,
the silicone break into two pieces. Gathering all our observations did by SEM on silicone
exposed at different times of UVO, we established the diagram shown in figure 4.10b. Two
Cracks
No cracks
b.
Longitudinal direction of stretching
At rest 20% 40% 50% 80%
200µm

97
distinct areas in the diagram appear clearly: a blue one where no cracks can be observed by
SEM for a given UVO time and after a given stretching level, and a pink one where crack
formation occurs. These two areas are separated by almost a straight red line. Under 50
minutes of UVO, we did not observe any cracks on exposed silicone after stretching up to
100%. Over 50 minutes of UVO, the more the exposition time is important, the more cracks
are observed at lower level of stretching. This means that formation of the silica-like layer is
mainly formed from this time limit of 50 minutes. It must be noted that three successive
stretching at a given levels do not change the result observed on the SEM images after only
one stretching. Furthermore, in our case, the UVO process was independent of the origin of
the silicone sheet used because we obtained exactly the same diagram (figure 4.10b) with the
PDMS Sylgard-184 than with the silicone SMI.
4.4 Silanization step: introduction of thiol groups onto oxidized silicone surface
Surface silanization can be performed on various substrates provided they can contain
surface hydroxyl groups which will react with alkoxysilanes to form covalently siloxane
bonds to the underlying substrate.28 By using the commercially available 3-
mercaptopropyltrimethoxysilane (MPS), thiol groups can be introduced onto the oxidized
silicone surfaces (figure 4.11) described above.
Figure 4.11: Schematic representation of the silanization step from the oxidized PDMS sheet.
The use of 3-mercaptopropyltrimethoxysilane compound allows the introduction of a layer of
thiol groups onto the surface.
These thiol groups are interesting chemical function that can react rapidly with double
bonds at room temperature and without secondary products formation.33 This reaction is
OH
OH OH OH OH OH
O
CH3
O
CH3
O
CH3
Si
HS
Oxidized PDMS substrate Silanization step
Layer of thiol groups
3-mercaptopropyltrimethoxysilane

98
considered as “click reaction” and has been used to introduced PEG chains and biotin groups
on silanized silicone surface, as described later in part 4.5.
4.4.1 Chemical modification process and characterization of the PDMS surface with
thiols groups
Immediately after the activation of the 18 x 18 mm2 PDMS surfaces (SMI or PDMS
Sylgard-184) with 90 minutes of UVO, the sample was brought in contact with methanolic
solution containing 1 % v/v of 3-mercaptopropyltrimethoxysilane and stirred gently overnight
at room temperature. Then, the silicone sheet was washed three times with methanol during 1
hour under stirring, changing the solvent every 15 minutes and then kept in methanolic
solution. These conditions, described in more details in chapter 2 Material and Methods, have
been optimized to get a surface of silicone still transparent and not rough, according to
visualization through optical microscopy.
Contact angle and FTIR measurements were carried out to characterize the modified
PDMS surface with thiol groups.
A contact angle of 78° ± 8° has been measured after the silanization step. This high
value can be explained by the disappearance of hydroxyl groups and the presence of propyle
chains bearing the thiol group on the silane derivative used. This value is in agreement with
the ones reported in literature on PDMS.34
The transmission FTIR-ATR spectrum of the silanized PDMS surfaces show the
disappearance of the Si-OH vibrationnal peak between 3700 and 3100 cm-1 (figure 4.12). This
first observation indicates the successful covalent linkage of the trimethoxy functional group
of the MPS to both SMI and Sylgard-184. Furthermore, a characteristic vibrationnal band is
observed at 2850 cm-1. This band is not present in the FTIR-ATR spectra of the UVO treated
silicone surface, and is assigned to symmetric stretch of the bond CH2-SH. Thus, we
considered that there is no ambiguity about the coverage of thiol groups on the PDMS
surface, coming from the covalent grafting of MPS.

99
Figure 4.12: Transmission FTIR-ATR spectra of an unmodified PDMS Sylgard-184 (blue
line), modified PDMS after 90 minutes of UVO treatment (red line) and after the thiol
silanization step (black line).
No significant differences between the silanization of PDMS Sylgard-184 and SMI
were observed by FTIR-ATR study. In the next part of this chapter 4, all experiments
described were done on silicone SMI, except when mentioned.
4.5 Grafting of biotine groups and PEG brushes on PDMS surfaces
As described in the introduction of this chapter, the presence of thiol-covered surfaces
allows using the covalent coupling reaction with maleimide derivatives: this reaction was
chosen because of its simplicity and efficiency to occur and also because of the commercial
availability of compounds such as PEG-Mal and Biotin-Mal derivatives (figure 4.13).
Different molecular weights of PEG-Mal were used in this project: 2000, 5000 and 10 000
Dalton corresponding to a number of ethylene oxide groups of 50, 125 and 250 units. The
maleimide function is linked to the biotin group through a short ethylene oxide spacer
composed of two units. This molecule is denoted as Biotin-Mal.
Wavelenght (cm-1)
240026002800300032003400360038004000
Ab
sorb
anc
e (a
.u)
-0.02
0.00
0.02
0.04
0.06
0.08
0.10
3700 cm-1 2850 cm-1 3100 cm-1
2960 cm-1

100
The thiol-ene click reaction corresponds to a Michael addition of the sulfur atom on
the 1,4-conjugated system of the maleimide group. The resulting product is formed in an
irreversible way.
Figure 4.13: (a) Chemical structure of PEG-Mal derivatives (PEG2000, PEG5000 and
PEG10 000) and Biotin-Mal; (b) Thiol-ene reaction between the thiol groups on silicone
surface and free maleimide derivatives in solution.
a.
b.
Thiol-ene Click reaction
Maleimide derivatives
N
O
O
NH
OO
O
HN
O
S
NHHN
O
Biotin-Mal
N
O
OO O
OO
OO
OO
OOMe
O
PEG-Mal
PEG(2000)-M al, n=5PEG(5000)-M al, n=12PEG(10 000)-M al, n=25
n

101
4.5.1 Covalent grafting of Biotin groups on silanized PDMS surfaces
First of all, we grafted the Biotin-Mal compounds onto the silanized PDMS surface.
Our goal in this step was to check the validity of our grafting conditions. For the rest of this
chapter, before all experiment series, we will shortly describe the experimental procedure
used to modify the silicone substrate, to adsorb the StreptavidinFITC and the fluorescent
measurement set-up when necessary. Indeed, these conditions changed sometimes according
to the experiments.
4.5.1.1 Experimental procedure
After UVO treatment during 90 minutes and further modification of the surface with
thiol groups the substrates were treated with a 5 mM TCEP solution prepared in PBS buffer at
pH 7.4 for 30 min to break the possible disulfide bridges.35 After that, the samples were
washed three times with PBS buffer. Quickly, solutions of 0.1 mg/mL, 0.6 mg/mL and 1.5
mg/mL of Biotin-Mal prepared in PBS buffer at pH 7.4 were added on the modified surface
leaving the reaction between the thiol and maleimide groups to occur overnight at room
temperature. The samples were then rinsed three times with PBS buffer and stocked in the
same buffer until use.
4.5.1.2 Protein adsorption
The sample was then carefully placed on a homemade electric stretching device (see
chapter 2 Materials and Methods) and adapted to a fluorescence microscope. Their edges
were protected with a PDMS STATIS before they were tight on the stretching support. A 0.1
mg/mL StreptavidinFITC solution prepared in TRIS buffer at pH 7.4 was added on the sample’s
surface for 10 min. Then, it was rinsed three times with TRIS buffer followed by the
fluorescence measurements.
4.5.1.3 Fluorescence measurements
The experiments were carried out using an inverted light microscope (Nikon
Microphot-FXA, Japan) equipped with a mercury lamp and operating between 470 nm and
490 nm for excitation and above 500 nm for detection. The measurements were done using a
10 dry objective and a digital camera with 20 s times of exposure under a hydrated state.

B
treated
reduce t
differen
mg/mL,
evaluate
fluoresc
contact
slight li
value ha
4.14 ar
Streptav
contact
distribu
coming
using th
the thre
Figure
Streptav
equals t
I
measure
constan
that a s
also on
Before brin
with a redu
the disulfur
nt concentra
, to determ
ed by using
cence emiss
with the S
ight present
as always b
re shown t
vidinFITC. W
with the
ution of the
from the n
he software
e solutions
4.14: Fl
vidinFITC so
to 100 µm.
In all exper
ed before co
nt in all mea
small non-sp
silicone af
nging Biotin
uctive agen
re bonds th
ations of B
mine the opt
g Streptavid
sion on the
StreptavidinF
t in the roo
been measu
two typical
When excite
labeled Str
e fluorescen
native silico
ImageJ® w
of Biotin-M
uorescence
olution (a) a
riments pres
ontact with
asurements
pecific adso
fter silaniza
n-Mal in co
nt, the tris(2
hat may hav
Biotin-Mal i
timum graft
dinFITC, the n
silicone waFITC, a resid
om and also
ured before
l images o
ed with UV
reptavidin
nce all ove
one. The qu
with a size o
Mal are gath
images
and after co
sented in fig
h Streptavid
and represe
orption of
tion with th
ontact with
2-carboxyet
ve been for
in buffer (P
fting conditi
natural prot
as measured
dual fluores
o because o
all our emi
of silicone
V, the surf
appears gr
r the silico
uantificatio
of images 8
hered in figu
of SMI
ontact with
gure 4.15, t
inFITC. This
ents the blac
Streptavidin
he thiol der
the modifi
thyl)phosph
rmed in con
PBS buffer
ions. The e
tein-recepto
d with a flu
scence was
of auto-fluo
ission fluore
sheets wi
face of biot
reen. We o
on surface
n of the flu
800 x 600 µ
ure 4.15.
silicone su
1.5 mg/mL
the residual
s residual fl
ck bars in t
nFITC occur
rivative. An
fied silicone
hine hydroc
ntact with a
r at pH 7.4
efficiency o
or of the bio
uorescent m
measured,
orescence o
escence exp
th and wit
tinylated si
observed a
probably d
uorescence
µm2. The re
urface bef
L of Biotin-
l emission o
luorescence
the histogra
s on unmod
n increase o
e, this last
chloride (TC
air. We test
4) 0.1, 0.6
of this graft
otin ligand,
microscope.
mainly du
f the silico
periments. I
thout conta
ilicone that
non-homo
due to irreg
level was
esults obtain
fore conta
-Mal (b). B
of fluoresce
emission i
am. We can
dified silico
of this adsor
102
one was
CEP), to
ted three
and 1.5
ting was
and the
Without
ue to the
ne. This
In figure
act with
t was in
ogeneous
gularities
done by
ned with
ct with
Bar scale
ence was
s almost
observe
one, and
rption is

103
measured when the silicon surface has been treated with Biotin-Mal solutions: higher
concentrations of Biotin-Mal lead to higher adsorption of StreptavidinFITC. This corresponds
to an increase of the grafted biotin density leading to a higher amount of Streptavidin
anchored on the surface. However, between 0.6 and 1.5 mg/mL of Biotin-Mal, the increase of
StreptavidinFITC adsorption is not really important: 1350 and 1420 a.u. respectively. One can
assume that we have reached almost the maximum grafting level of biotin groups onto the
surface, in our conditions. Thus, the concentration of 1.5 mg/mL of Biotin-Mal will be
kept for the rest of this chapter 4. P
DM
S
PD
MS
-SH
Bio
tin (0
.1 m
g/m
L)B
iotin
(0.6
mg/
mL)
Bio
tin (1
.5 m
g/m
L)
Flu
ore
scen
ce
inte
nsi
ty (
a.u
.)
0
200
400
600
800
1000
1200
1400
1600
Figure 4.15: Fluorescence emission intensities measured on silicone surfaces when exposed
to UV between 470 nm and 490 nm. Black bars correspond to values measured before contact
with StreptavidinFITC (auto-fluorescence), and the grey bars correspond to fluorescence after
contact with the StreptavidinFITC.
4.5.2 Effect of stretching and irreversibility of the Streptavidin anchored
Our goal is to develop substrates that become reactive to Streptavidin under stretching.
We prepared a silicone surface functionalized with biotin from a 1.5 mg/mL Biotin-Mal
solution as just described. This surface was brought in contact with StreptavidinFITC before
rinsing with 10 mM TRIS buffer solution. The fluorescence was then measured. The substrate
was then stretched from 0% up to a stretching degree of 50% by stretching steps of 10%. No

104
StreptavidinFITC was added. Figure 4.16 shows the evolution of the measured fluorescence as
a function of the stretching degree. One observes a strong increase of the fluorescence after
addition of StreptavidinFITC as already described. The fact that one does not reach the same
level of signal as in figure 4.15 may be due to the different amplification factor of the camera
during use. One can assume, in first approximation, that the fluorescence intensity decreases
linearly with the stretching degree, reaching a decrease of 25% for a stretching degree of 50%.
This effect can be attributed to a change of the fluorophore density with the stretching degree.
This "dilution" effect has to be taken into account when analyzing our results.
Bio
tin B
iotin
, str
ess
0% B
iotin
, str
ess
10%
Bio
tin, s
tres
s 20
% B
iotin
, str
ess
30%
Bio
tin, s
tres
s 40
% B
iotin
, str
ess
50%
Flu
ore
sce
nce
inte
nsi
ty (
a.u
.)
0
100
200
300
400
500
600
700
Figure 4.16: Evolution of the fluorescence intensity as a function of the stretching degree
measured on a sample functionalized with biotin groups and brought at rest in contact with
StreptavidinFITC. The sample is then stretched at different stretching degrees. The black bar
represents the fluorescence intensity measured on the biotinilated sample before contact with
StreptavidinFITC.
Next we wanted to verify the irreversibility of the biotin/Streptavidin interaction
during stretching/unstretching cycles. Indeed, this ligand/receptor interaction is known to be
one of the strongest non-covalent interactions in biology.36 We thus used a biotinylated
substrate prepared in the same conditions as just described. We brought this substrate in
contact with the StreptavidinFITC solution for 10 minutes, rinsed the substrate with TRIS

105
buffer. We then measured the fluorescence intensity of the substrate during the different steps
of 4 stretching/unstretching cycles. The results are summarized in figure 4.17.
Bio
tin
Bio
tin, 1
st s
tres
s 0%
Bio
tin, 1
st s
tres
s 50
%
Bio
tin, 2
nd s
tres
s 0%
Bio
tin, 2
nd s
tres
s 50
%
Bio
tin, 3
rd s
tres
s 0%
Bio
tin, 3
rd s
tres
s 50
%
Bio
tin, 4
th s
tres
s 0%
Bio
tin, 4
th s
tres
s 50
%
Flu
ore
scen
ce i
nte
nsi
ty (
a.u
.)
0
100
200
300
400
500
600
Figure 4.17: Evolution of the fluorescence intensity of a silicone substrate covered with
biotin and brought initially, at rest, in contact with a StreptavidinFITC solution. Four
stretching/unstretching cycles are performed during this experiment. The black bar
corresponds to the fluorescence of the substrate at rest before contact with the StreptavidinFITC
solution.
After the initial contact of the substrate with the StreptavidinFITC solution, followed by
a rinsing with buffer, the surface did no more come in contact with the fluorescent protein.
The fluorescence of the substrate must thus decrease or remain constant. One observes that
each stretching at 50% of the substrate is accompanied by a significant decrease of the order
of 35% of the fluorescence intensity. This decrease is partly due to a decrease of the
StreptavidinFITC density over the substrate. Yet, it cannot be entirely attributed to this effect.
Indeed, we have seen that density changes can account for a decrease of 25% of the
fluorescence. The remaining 10% could originate from some desorption of Streptavidin from
the surface during stretching. Such a desorption could be due to the fact that despite a
decrease of the streptavidin density, stretching is accompanied by a shrinking in the direction
perpendicular to the stretching direction. This effect may induce lateral interactions between

106
Streptavidin molecules which could eventually lead to some desorption. This interpretation is
corroborated by a small decrease of the fluorescence intensity after returning to the non-
stretched state when compared to the fluorescence intensity measured in the first non-
stretched state. A similar effect is observed during the next stretching/unstretching cycles.
Another interpretation of the continuous decrease of the fluorescence intensity observed in the
non-stretched states during consecutive stretching/unstretching cycles and also of the higher
decrease of the fluorescence during stretching when compared to that expected from simple
Streptavidin dilution, might be some bleaching. Indeed, each experiment necessitates the
sample to be irradiated so that some bleaching always exists.
One can thus conclude that the biotin/Streptavidin interactions are extremely strong
even on our substrates and that if desorption occurs during stretching/unstretching cycles due
to lateral Streptavidin interaction, it must be small. By stretching the substrate to 50%, if the
biotin/Streptavidin interaction is irreversible, one can expect a decrease of the fluorescence of
the order of 25-30%.
4.5.3 Simultaneous grafting of PEG2000 chains and biotin groups on the substrate
To reach the goal of our project, we must anchor biotin groups covalently onto the
silicone surface but also graft a suitable density of PEG chains to get PEG brushes that hide
the biotin groups and thus render the surface antifouling at rest. The biotin groups should
become accessible when this density of PEG chains is decreased by stretching the substrate.
We first decided to modify the silicone surface with the simultaneous presence of
Biotin-Mal and PEG-Mal in solution. We first chose PEG-Mal of 2000 Da as molecular
weight, the concentration of Biotin-Mal was kept equal to 1.5 mg/mL. We chose this
molecular weight because preliminary results of the group of Vincent Roucoules from
Mulhouse working on a similar issue but with another grafting method of the PEG found that,
in their case, PEG 2000 was optimal.37 Various concentrations of PEG-Mal were investigated:
60 mg/mL, 120 mg/mL and 180 mg/mL. These solutions were prepared in PBS buffer at pH
7.4 and then added onto the silanized PDMS surface in the unstretched state. The
experimental procedure for the substrate functionalization, the interaction of the substrate
with StreptavidinFITC and the following fluorescence measurements were performed in a
similar way as described for entirely biotinylated substrates besides the replacement of the
Biotin-MAL solution by mixed solutions of 1.5 mg/mL Biotin-Mal + 60 mg/mL PEG(2000)-

107
Mal, 1.5 mg/mL Biotin-Mal + 120 mg/mL PEG(2000)-Mal or 1.5 mg/mL Biotin-Mal + 180
mg/mL PEG(2000)-Mal prepared in PBS buffer at pH 7.4.
Substrate fluorescence intensities have been measured at rest and at a stretching degree
of 50%. Furthermore, we measured the fluorescence intensities before and after contact with
StreptavidinFITC. All results are gathered in figure 4.18.
PD
MS
PD
MS
str
ess
50%
PD
MS
-SH
PD
MS
-SH
str
ess
50%
Peg
200
0 (1
20 m
g/m
L)
Peg
200
0 (1
20 m
g/m
L) s
tres
s 50
%
Peg
200
0 (6
0 m
g/m
L) +
Bio
tin
Peg
200
0 (6
0 m
g/m
L) +
Bio
tin s
tres
s 50
%
Peg
200
0 (1
20 m
g/m
L) +
Bio
tin
Peg
200
0 (1
20 m
g/m
L) +
Bio
tin s
tres
s 50
%
Peg
200
0 (1
80 m
g/m
L) +
Bio
tin
Peg
200
0 (1
80m
g/m
L) +
Bio
tin s
tres
s 50
%
Flu
ore
sc
ence
inte
nsi
ty (
a.u
.)
0
100
200
300
400
500
600
Figure 4.18: Fluorescence intensities of treated silicone surfaces (SMI) with (grey bars) or
without (black bars) treatment with StreptavidinFITC, at rest or at a stretching degree of 50%.
For one kind of experiment set, two different silicone sheets were used (at rest and when
stretched at 50%).
Each pair of reported values in figure 4.18 corresponds to an independent experiment.
The black bars represent the fluorescence of the substrate before being in contact with
StreptavidinFITC (auto-fluorescence). One observes that the auto-fluorescence of treated
PDMS is almost independent of the performed treatment and is, in our case, of the order of
150 a.u. It represents a significant part of the measured intensity and must thus be taken into

108
account for the interpretation of the data. The unmodified PDMS shows a significant
adsorption of StreptavidinFITC at rest: a fluorescence intensity value of 345 a.u. (arbitrary unit)
is measured, compared to the residual fluorescence measured at 226 a.u. Next we brought the
functionalized PDMS with thiol groups (SH) in contact with StreptavidinFITC. The silanized
PDMS surface seems more antifouling than the unmodified PDMS with a very low level of
fluorescence measured (215 a.u.) at rest and a slight increase when stretched (247 a.u.).
Almost the same amount of Streptavidin is adsorbed on the PDMS treated with 120 mg/mL of
PEG(2000)-Mal. It is important to note that when the pegylated surface of PDMS is stretched,
no additional unspecific adsorption of StreptavidinFITC occurs. Next we modified the silanized
PDMS with the simultaneous presence of Biotin-Mal (1.5 mg/mL) and PEG(2000)-Mal in
solution at different PEG concentrations: 60 mg/mL, 120 mg/mL and 180 mg/mL. In all
cases, at rest, one observes a higher fluorescence after contact with StreptavidinFITC than for
the biotin free substrate. This shows that none of our surface totally hinders the Streptavidin
to access the biotin through the PEG layer. The smallest Streptavidin adsorption is obtained
when the surface is functionalized with a 120mg/mL PEG solution. In this case the
fluorescence increase corresponding to specific StreptavidinFITC interaction with biotin
represents of the order of 50% of the non-specific adsorption. When these substrates where
stretched at 50% and brought in contact with StreptavidinFITC one always observes a strong
increase of the fluorescence intensity. This clearly shows that new biotin groups become
accessible to Streptavidin. These surfaces thus act as cryptic site surfaces by exhibiting
ligands under stretching. The optimal cryptic site surface is obtained from the 120mg/mL
PEG solution. In this case the Streptavidin interaction is reduced at rest and maximum under
stretching.
Next we wanted to investigate the reversibility of our system during
stretching/unstretching cycles. We prepared a system in the optimal conditions reported
above. After bringing the system stretched at 50% in contact with a StreptavidinFITC solution
and rinsing, we performed two stretching/unstretching cycles, measured the fluorescence
intensity at each step without never bringing the substrate in contact with StreptavidinFITC
again. The results are summarized in figure 4.19.
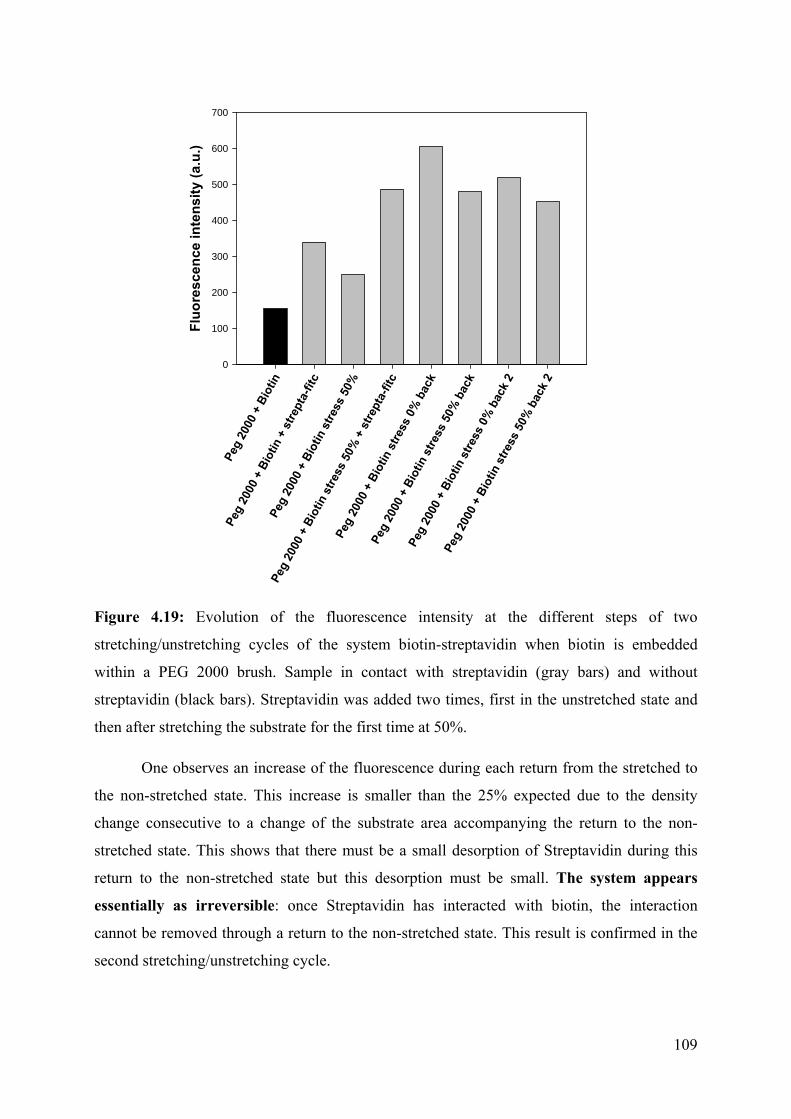
109
Peg
200
0 +
Bio
tin
Peg
200
0 +
Bio
tin +
str
epta
-fitc
Peg
200
0 +
Bio
tin s
tres
s 50
%
Peg
200
0 +
Bio
tin s
tres
s 50
% +
str
epta
-fitc
Peg
200
0 +
Bio
tin s
tres
s 0%
bac
k
Peg
200
0 +
Bio
tin s
tres
s 50
% b
ack
Peg
200
0 +
Bio
tin s
tres
s 0%
bac
k 2
Peg
200
0 +
Bio
tin s
tres
s 50
% b
ack
2
Flu
ore
scen
ce in
ten
sity
(a.
u.)
0
100
200
300
400
500
600
700
Figure 4.19: Evolution of the fluorescence intensity at the different steps of two
stretching/unstretching cycles of the system biotin-streptavidin when biotin is embedded
within a PEG 2000 brush. Sample in contact with streptavidin (gray bars) and without
streptavidin (black bars). Streptavidin was added two times, first in the unstretched state and
then after stretching the substrate for the first time at 50%.
One observes an increase of the fluorescence during each return from the stretched to
the non-stretched state. This increase is smaller than the 25% expected due to the density
change consecutive to a change of the substrate area accompanying the return to the non-
stretched state. This shows that there must be a small desorption of Streptavidin during this
return to the non-stretched state but this desorption must be small. The system appears
essentially as irreversible: once Streptavidin has interacted with biotin, the interaction
cannot be removed through a return to the non-stretched state. This result is confirmed in the
second stretching/unstretching cycle.

110
4.5.4 Different attempts to increase the density of grafted PEG chains
The substrate obtained with the optimal grafting conditions were neither totally
Streptavidin repulsive at rest nor was the interaction with Streptavidin reversible with respect
to stretching/unstretching cycles. This can be attributed to a too small PEG density grafted on
the substrate. We thus tried to increase the density of PEG chains. To do that we investigated
two ways. First, we realized the entire chemical functionalization of the silicone surface under
stretching at 60%. Another strategy investigated was to use longer PEG chains instead of
PEG(2000)-Mal.
4.5.4.1 Covalent grafting of PEG chains and biotin groups on stretched silicone
In the literature, Genzer et al. have reported that the chemical functionalization of
silicone sheets can lead to higher active group densities when the silicone sheet is
functionalized under stretching instead in the non-stretched state.38 Thus, we thought to
oxidize, to silanize and to let react the PEG(2000)-Mal chains and the Biotin-Mal on a
silicone stretched at 60% of its initial length. The coupling reaction onto the silicone substrate
was done with 1.5 mg/mL of Biotin-Mal and 120 mg/mL of PEG(2000)-Mal simultaneously
present in solution. The experimental procedure was similar to that reported above. Figure
4.20 compares the fluorescence intensities measured on substrates functionalized at 60% of
stretching with regularly functionalized (non-stretched state) substrates. Functionalization at a
stretching degree of 60% seems to increase the Streptavidin interaction of the surface at rest.
This procedure does thus not improve the anti-fouling character of our system at rest
and was thus not retained. We nevertheless verified the reversibility of the
biotin/Streptavidin interaction on this system by performing a stretching/unstretching cycle.
The results are given in figure 4.21. As previously, one observes that once the interaction took
place at 50% of stretching between biotin and Streptavidin, no significant reduction of the
fluorescence is observed during retraction and stretching again. This shows that in this case
too, the interaction is irreversible.

111
Peg 2000 + Bio
tin
Peg 2000 + Bio
tin stre
ss 50%
stress 60%
, Peg 2000 + B
iotin
stress 60%,P
eg 2000 + Bio
tin stre
ss 50%
Flu
ore
scen
ce i
nte
nsi
ty (
a.u
.)
0
100
200
300
400
500
600
Figure 4.20: Comparison of the fluorescence intensities after contact with StreptavidinFITC of
silicone sheets functionalized at rest and stretched at 60%. Black bars correspond to the
fluorescence measured before contact with StreptavidinFITC (auto-fluorescence).

112
Str
ess
60%
, Peg
200
0 +
Bio
tin
Str
ess
60%
, Peg
200
0 +
Bio
tin s
trep
ta-f
itc
Str
ess
60%
, Peg
200
0 +
Bio
tin s
tres
s 50
%
Str
ess
60%
, Peg
200
0 +
Bio
tin s
tres
s 50
% +
str
epta
-fitc
Str
ess
60%
, Peg
200
0 +
Bio
tin s
tres
s 0%
bac
k
Str
ess
60%
, Peg
200
0 +
Bio
tin s
tres
s 50
% b
ack
Flu
ore
scen
ce in
ten
sity
(a.
u.)
0
200
400
600
800
1000
1200
1400
Figure 4.21: Evolution of the fluorescence intensity of a system functionalized under
stretching at 60% during a stretching/unstrteching cycle. The black bar represents the auto-
fluorescence of the substrate.

113
4.5.4.2 Effect of the PEG chain length
Next we tried to improve the characteristics of our system by increasing the PEG chain
length. We used PEG(5000)-Mal and PEG(10000)-Mal which correspond respectively to 125
and 250 monomer units. The experimental conditions to functionalize the silicone surface
with PEG(5000)-Mal and PEG(10000)-Mal were the same as those described above with
PEG(2000)-Mal, except that the concentration of the PEG chains of the solution was 300 and
600 mg/mL for the PEG(5000)-Mal and the PEG(10000)-Mal respectively, instead of 120
mg/mL for the PEG(2000)-Mal. By using these mass concentrations, the molar concentrations
are the same in each case. Comparison of the influence of the PEG chain-length is presented
in figure 4.22. Fluorescence intensities coming from the adsorption of StreptavidinFITC
adsorbed onto the modified silicone surface were measured at rest and when the substrates
were stretched at 50%.
Peg 2000 + Bio
tin
Peg 2000 + Bio
tin stre
ss 50%
Peg 5000 + Bio
tin
Peg 5000 + Bio
tin stre
ss 50%
Peg 10000 + Bio
tin
Peg 10000 + Bio
tin stre
ss 50%
Flu
ore
scen
ce in
ten
sity
(a.
u.)
0
100
200
300
400
500
600
Figure 4.22: Fluorescence emission intensities measured onto silicone substrate before
contact with the StreptavidinFITC solution (black bars) and after contact and rinsing (grey
bars). Silicone substrates were functionalized with different lengths of PEG-Mal: PEG(2000)-
Mal, PEG(5000)-Mal and PEG(10000)-Mal. The measurements have been done at rest and
stretched at 50%.

114
At rest, the silicone surfaces modified with the two longer PEG chains (PEG5000 and
PEG10000) displayed a better antifouling effect than the substrate corresponding to
PEG2000: lower values of fluorescence intensities, 200 and 173 a.u., are measured when
using PEG(5000)-Mal and PEG(10000)-Mal respectively. These levels of fluorescence
observed are very close to the residual one measured before contact with the StreptavidinFITC
solution. Thus, these surfaces are both almost completely antifouling to Streptavidin
adsorption. When stretched at 50%, almost no additional fluorescence intensity is measured
compared to the unstretched state. Increasing the PEG chain length seems thus not to be good
way to go and we discarded this strategy.
4.5.4.3 Sequential grafting of PEG and biotin in a stretched state
Next we tried to graft sequentially PEG 2000 and biotin. Three different attempts were
performed:
Sample A: the PDMS surface was treated with UVO for 1h30 followed by the
functionalization with thiols groups. The substrate was then brought in contact with a 120
mg/mL solution of PEG 2000 during 2 h at room temperature. After this time the substrate
was rinsed with buffer, stretched 1.5 times its initial length (50% stretching degree) followed
by the addition of a 1.5 mg/mL solution of Biotin-Mal for 2 h at room temperature. Finally the
sample was returned to its non-stretched state.
Sample B: the PDMS surface was treated with UVO for 1h30 followed by the
functionalization with thiols groups. Then the substrate was stretched 1.4 times its initial
length (stretching degree of 40%) and brought in contact with a 120 mg/mL solution of PEG
2000 during 1 h at 60°C. This was followed by the addition of a 1.5 mg/mL solution of
Biotin-Mal that remained in contact with the substrate during 1h still at 60°C. Finally the
sample was returned to its non-stretched state.
Sample C: The PDMS surface was stretched 1.6 times its initial length. It was then treated by
UVO for 1 h and funtionalized with thiol groups. The functionalized substrate stretched at
60% was then brought in contact with a PEG 2000 solution at a concentration of 120 mg/mL
at room temperature overnight. The surface was then brought a second time in contact with a
similar PEG solution during 9h at 60°C. Then the substrate, still stretched at 60%, was
brought in contact with a 1.5 mg/mL Biotin-Mal solution overnight and at room temperature.
Finally the sample was returned to the non-stretched state.

115
The fluorescence after contact of these samples with StreptavidinFITC is represented in figure
4.23.
Figure 4.23: Fluorescence intensity after contact with StreptavidinFITC of three substrates at
rest and under 50% stretching. Once stretched, each substrate is brought again in contact with
the StreptavidinFITC solution and rinsed with buffer. The construction of the different samples
is described in the text above.
One observes that none of the three buildup conditions is satisfactory. None of these
buildup procedures renders the substrate anti-fouling with respect to Streptavidin, all show a
cryptic site behavior but to a relatively modest degree. Out of the three buildup conditions, the
most optimal one is that where one first grafts the PEG chains with the substrate at rest and
then one grafts the biotin on the pegylated surface that is stretched at 60%. Yet because there
was no real improvement compared to the simultaneous grafting of both PEG and biotin from
a single solution, we did not pursue this strategy.
4.5.4.4 Sequential grafting of biotin and PEG
In these experiments, Biotin-Mal was first grafted on the samples followed by the
grafting of the PEG chains, both procedures taking place in the non-stretched state. We tried
the grafting of PEG of different molecular weights : 2000, 5000 and 10000 respectively. The
A
A stress 50% B
B stress 50% C
C stress 50%
Flu
ore
scen
ce in
ten
sity
(a.
u)
0
200
400
600
800
1000
1200
1400
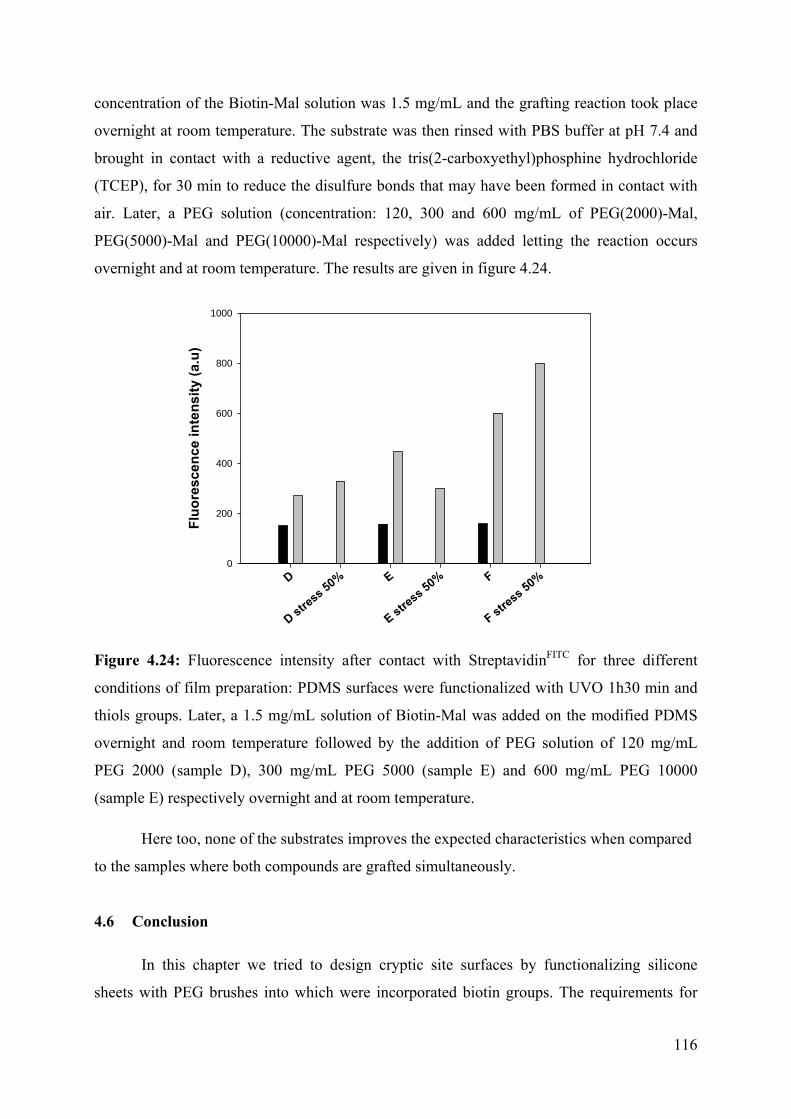
116
concentration of the Biotin-Mal solution was 1.5 mg/mL and the grafting reaction took place
overnight at room temperature. The substrate was then rinsed with PBS buffer at pH 7.4 and
brought in contact with a reductive agent, the tris(2-carboxyethyl)phosphine hydrochloride
(TCEP), for 30 min to reduce the disulfure bonds that may have been formed in contact with
air. Later, a PEG solution (concentration: 120, 300 and 600 mg/mL of PEG(2000)-Mal,
PEG(5000)-Mal and PEG(10000)-Mal respectively) was added letting the reaction occurs
overnight and at room temperature. The results are given in figure 4.24.
Figure 4.24: Fluorescence intensity after contact with StreptavidinFITC for three different
conditions of film preparation: PDMS surfaces were functionalized with UVO 1h30 min and
thiols groups. Later, a 1.5 mg/mL solution of Biotin-Mal was added on the modified PDMS
overnight and room temperature followed by the addition of PEG solution of 120 mg/mL
PEG 2000 (sample D), 300 mg/mL PEG 5000 (sample E) and 600 mg/mL PEG 10000
(sample E) respectively overnight and at room temperature.
Here too, none of the substrates improves the expected characteristics when compared
to the samples where both compounds are grafted simultaneously.
4.6 Conclusion
In this chapter we tried to design cryptic site surfaces by functionalizing silicone
sheets with PEG brushes into which were incorporated biotin groups. The requirements for
D
D stress 50% E
E stress 50% F
F stress 50%
Flu
ore
sce
nc
e in
ten
sit
y (a
.u)
0
200
400
600
800
1000
117
the ideal cryptic substrate are to be anti-fouling, in particular with respect to the receptor of
the ligand, to render the ligands accessible to the receptor under stretching and finally that the
receptor/substrate interaction be reversible during stretching/unstretching cycles. Our strategy
was based on the use of UV Ozone treatment of the silicone sheets for further chemical
grafting of the substrate. We first determined the UVO treatment conditions such that one
does not form a silica layer that breaks under stretching. This is a required condition for the
further development of cryptic site surfaces. We succeeded in this way. We then silanized this
surface and anchored thiol groups on the substrate. We then used a Michael addition between
thiol groups and maleimide groups to graft modified PEG chains and modified biotin groups
on the surface. We tried a large variety of strategies to graft both entities. The optimal strategy
found within all that were tried was the simultaneous grafting of both the PEG chains and the
biotin groups with a PEG molecular weight of 2000. This system, and most of the
investigated systems, behaves as cryptic site surfaces. Yet they are all imperfectly anti-fouling
with respect to Streptavidin. The major issue that is to be solved is that of the reversibility of
the interaction. Up to now our systems behave totally irreversibly with respect to the
streptavidin/substrate interaction. These results are to be compared to those obtained by
Bacharouche et al.18 following a similar strategy as the one developed here but by using
polymer plasma for the silicone treatment instead of UV Ozone. Bacharouche et al. found a
system that is cryptic and that seems totally reversible with respect to stretching/unstretching
cycles. Yet it would be of interest to compare the two approaches by performing experiments
strictly in a similar way (interaction with Streptavidin, rinsing conditions…). One of the
largest difficulties of these studies is that one cannot get access to the surface densities of the
grafted groups. This renders us largely blind so that it is difficult to improve the grafting
procedure. Next studies need to address first this point.
4.7 References
(1) Vogel, V.; Sheetz, M. Local force and geometry sensing regulate cell functions Nature
Reviews Molecular Cell Biology 2006, 7, 265-275.
(2) Bustamante, C.; Chemla, Y. R.; Forde, N. R.; Izhaky, D. Mechanical processes in
biochemistry Annual Review of Biochemistry 2004, 73, 705-748.
(3) Gillespie, P. G.; Walker, R. G. Molecular basis of mechanosensory transduction Nature
2001, 413, 194-202.

118
(4) Coutand, C. Mechanosensing and thigmomorphogenesis, a physiological and
biomechanical point of view Plant Science 2010, 179, 168-182.
(5) Vogel, V. Mechanotransduction involving multimodular proteins: Converting force into
biochemical signals Annual Review of Biophysics and Biomolecular Structure 2006, 35, 459-
488.
(6) Vogel, V.; Thomas, W. E.; Craig, D. W.; Krammer, A.; Baneyx, G. Structural insights into
the mechanical regulation of molecular recognition sites Trends in Biotechnology 2001, 19,
416-423.
(7) Vakonakis, I.; Staunton, D.; Rooney, L. M.; Campbell, I. D. Interdomain association in
fibronectin: insight into cryptic sites and fibrillogenesis EMBO J. 2007, 26, 2575-2583.
(8) Critchley, D. R. Focal adhesions - the cytoskeletal connection Current Opinion in Cell
Biology 2000, 12, 133-139.
(9) Izard, T.; Vonrhein, C. Structural basis for amplifying vinculin activation by talin Journal
of Biological Chemistry 2004, 279, 27667-27678.
(10) del Rio, A.; Perez-Jimenez, R.; Liu, R.; Roca-Cusachs, P.; Fernandez, J. M.; Sheetz, M.
P. Stretching single talin rod molecules activates vinculin binding Nature 2009, 323, 638-641.
(11) Forterre, Y.; Skotheim, J. M.; Dumais, J.; Mahadevan, L. How the Venus flytrap snaps
Nature 2005, 433, 421-425.
(12) Braam, J. In touch: plant responses to mechanical stimuli New Phytologist 2005, 165,
373-389.
(13) Mertz, D.; Vogt, C.; Hemmerle, J.; Mutterer, J.; Ball, V.; Voegel, J.-C.; Schaaf, P.;
Lavalle, P. Mechanotransductive surfaces for reversible biocatalysis activation Nat. Mater.
2009, 8, 731-735.
(14) Davila, J.; Chassepot, A.; Longo, J.; Boulmedais, F.; Reisch, A.; Frisch, B.; Meyer, F.;
Voegel, J.-C.; Mesini, P. J.; Senger, B.; Metz-Boutigue, M.-H.; Hemmerle, J.; Lavalle, P.;
Schaaf, P.; Jierry, L. Cyto-mechanoresponsive Polyelectrolyte Multilayer Films J. Am. Chem.
Soc. 2012, 134, 83-86.
(15) Ratner, B. D.; Bryant, S. J. Biomaterials: Where we have been and where we are going
Annu. Rev. Biomed. Eng. 2004, 6, 41-75.
(16) Mendes, P. M. Stimuli-responsive surfaces for bio-applications Chemical Society
Reviews 2008, 37, 2512-2529.
(17) Mano, J. F. Stimuli-Responsive Polymeric Systems for Biomedical Applications
Advanced Engineering Materials 2008, 10, 515-527.

119
(18) Bacharouche, J.; Badique, F.; Fahs, A.; Spanedda, M. V.; Geissler, A.; Malval, J. P.;
Vallat, M. F.; Anselme, K.; Francius, G.; Frisch, B.; Hemmerle, J.; Schaaf, P.; Roucoules, V.
Biomimetic Cryptic Site Surfaces for Reversible Chemo- and Cyto-Mechanoresponsive
Substrates Acs Nano 2013, 7, 3457-3465.
(19) Whitesides, G. M. The origins and the future of microfluidics Nature 2006, 442, 368-
373.
(20) Ikada, Y. Surface Modification of Polymers for Medical Applications Biomaterials 1994,
15, 725-736.
(21) Colas, A.; Curtis, J., Silicone biomaterials: history, chemistry & Medical Applications of
Silicones. Second ed.; Elsevier: Ratner, London, 2004; p 697-706.
(22) Hillborg, H.; Gedde, U. W. Hydrophobicity changes in silicone rubbers IEEE Trans.
Dielectr. Electr. Insul. 1999, 6, 703-717.
(23) Lewis, L. N.; Stein, J.; Gao, Y.; Colborn, R. E.; Hutchins, G. Platinum catalysts used in
the silicones industry. Their synthesis and activity in hydrosilylation Platinum Met. Rev.
1997, 41, 66-75.
(24) Mehl, G. H.; Saez, I. M. Polyhedral liquid crystal silsesquioxanes Applied
Organometallic Chemistry 1999, 13, 261-272.
(25) Ojima, I.; Li, Z.; Zhu, J., Recent Advances in the Hydrosilylation and Related Reactions.
In The Chemistry of Organic Silicon Compounds, John Wiley & Sons, Ltd: 2003; pp 1687-
1792.
(26) Chalk, A. J.; Harrod, J. F. Homogeneous Catalysis. II. The Mechanism of the
Hydrosilation of Olefins Catalyzed by Group VIII Metal Complexes Journal of the American
Chemical Society 1965, 87, 16-21.
(27) Wu, Y.; Huang, Y.; Ma, H. A Facile Method for Permanent and Functional Surface
Modification of Poly(dimethylsiloxane) Journal of the American Chemical Society 2007, 129,
7226-7227.
(28) Zhou, J.; Ellis, A. V.; Voelcker, N. H. Recent developments in PDMS surface
modification for microfluidic devices Electrophoresis 2010, 31, 2-16.
(29) Efimenko, K.; Wallace, W. E.; Genzer, J. Surface Modification of Sylgard-184
Poly(dimethyl siloxane) Networks by Ultraviolet and Ultraviolet/Ozone Treatment Journal of
Colloid and Interface Science 2002, 254, 306-315.
(30) Berdichevsky, Y.; Khandurina, J.; Guttman, A. s.; Lo, Y. H. UV/ozone modification of
poly(dimethylsiloxane) microfluidic channels Sensors and Actuators B: Chemical 2004, 97,
402-408.
120
(31) Hillborg, H.; Ankner, J. F.; Gedde, U. W.; Smith, G. D.; Yasuda, H. K.; Wikstrom, K.
Crosslinked polydimethylsiloxane exposed to oxygen plasma studied by neutron
reflectometry and other surface specific techniques Polymer 2000, 41, 6851-6863.
(32) Hillborg, H.; Gedde, U. W. Hydrophobicity recovery of polydimethylsiloxane after
exposure to corona discharges Polymer 1998, 39, 1991-1998.
(33) Hermanson, G. T., Bioconjugate Techniques. (Second Edition) ed.; Academic press: New
York, 2008; p 130-131.
(34) Branch, D. W.; Wheeler, B. C.; Brewer, G. J.; Leckband, D. E. Long-term stability of
grafted polyethylene glycol surfaces for use with microstamped substrates in neuronal cell
culture Biomaterials 2001, 22, 1035-1047.
(35) Burns, J. A.; Butler, J. C.; Moran, J.; Whitesides, G. M. Selective Reduction of
Disulfides by Tris(2-Carboxyethyl)Phosphine Journal of Organic Chemistry 1991, 56, 2648-
2650.
(36) Michael Green, N.; Meir Wilchek and Edward, A. B., Avidin and streptavidin. In
Methods in Enzymology, Academic Press: 1990; Vol. 184, 51-67.
(37) Geissler, A.; Vallat, M. F.; Fioux, P.; Thomann, J. S.; Frisch, B.; Voegel, J. C.;
Hemmerle, J.; Schaaf, P.; Roucoules, V. Multifunctional Stretchable Plasma Polymer
Modified PDMS Interface for Mechanically Responsive Materials Plasma Processes and
Polymers 2010, 7, 64-77.
(38) Genzer, J.; Efimenko, K. Creating long-lived superhydrophobic polymer surfaces
through mechanically assembled monolayers Science 2000, 290, 2130-2133.

121
Chapter 5
Polyelectrolyte multilayers with
mechanically modulable enzymatic activity
(article in preparation)

122
5.1 Introduction
Chemo-mechanoresponsive materials constitute a new class of materials that respond
chemically to a mechanical stress. This domain has largely been initiated by the groups of
Moore and Sotos1, 2 who incorporated polymers that contain mechanophores into polymeric
matrices. Mechanophores are molecules that undergo a chemical reaction when brought under
stretching. This usually results in a colour change in the material at regions of high stress. The
first reported example of such material is that of poly(methyl methacrylate) matrices into
which poly(methyl acrylate) chains that contain spiropyrane were incorporated.2 Recently,
using a gem-dichlorocyclopropanated indene incorporated into a cross-linked
poly(methylacrylate) material, the group of Moore reported a new material which under
compression releases protons (mechanogenerated acid).3 This is due to a force dependent
rearrangement that results in proton elimination.
The development of chemo-mechanoresponsive materials relies on
mechanotransduction processes. Such processes are also widely used in Nature, in particular
by cells when sensing their environment.4 Usually Nature does not directly use internal
chemical reactions in molecules to transform a mechanical signal into a chemical response but
rather less energy demanding processes such as small conformational changes of proteins.5
Stretching domain-proteins can lead, for example, to a sequential unravelling of different
domains as it is observed in fibronectin or to the exhibition of cryptic sites that become then
active.6 Enzymes constitute a class of proteins that act through a precise topology of the
different constituting groups of their active site. Moreover dynamic fluctuations of enzyme
conformations appear also to play an important role in their activity. It is thus reasonable to
assume that enzyme activity can be modulated by applying a mechanical stress on them.5
Such a stress should be able to modify both the conformation of the enzyme as well as the
dynamics of their structural fluctuations. This was confirmed by Tseng at al. who used a DNA
molecular spring that was coupled on two positions of an enzyme, guanylate kinase, to create
a protein-DNA chimera.7 Depending of the ligation position of the DNA and its length, and
thus on the stress exerted on the enzyme, they found that the enzyme activity was reduced and
the reduction activity was stronger for shorter DNA (larger strength exerted by the DNA on
the enzyme).
Based on this simple idea, modifying the enzymatic activity by applying a mechanical
tension on an enzyme, we propose to create mechano-modulable enzymatic active materials
by covalently incorporating enzymes into stretchable polymeric films. This requires that the

123
films be elastic, that the enzymes remain active in the film and that the enzyme substrate is
able to diffuse in the film in order to react with the enzyme. We propose to use exponentially
growing polyelectrolyte multilayers into which are embedded enzymes to fulfil these
requirements. Indeed, polyelectrolyte multilayers are known to preserve enzymatic activity, to
be stretchable8 and to be easily processed. They are obtained by the alternate deposition of
polyanions and polycations onto a solid substrate. We used poly-(L-lysine)/hyaluronic acid
(PLL/HA) as exponentially growing multilayer because it is the exponentially growing film
that is best known.9 As we will see, in order to obtain mechano-responsiveness the multilayer
has to be cross-linked and the enzymes have to be covalently anchored onto the cross-linked
multilayer. As enzyme we have used -galactosidase. This enzyme was selected because it is
a tetramer comprised of four polypeptide chains (monomers) held together through non-
covalent interactions10 (see figure 5.1).
Figure 5.1: Image of the -galactosidase from Escherichia coli with the location of the active
sites. Taken from ref10.
Each monomer is made up of five domains, domain 3 having an / barrel structure
with the active site located at the C-terminal end of the barrel. The enzyme has four active
sites that are located at the barrel in domains 3, including residues belonging to loops of
domains 1 and 5 from the same monomer and residues from domain 2 belonging to a different
monomer. The structure of the enzyme and more particularly of the enzymatic active site is
anticipated to be particularly sensitive to mechanical stresses exerted onto the enzyme in
particular because it involves several enzyme components. As substrate we used fluorescein
di(β-D-galactopyranoside) (FDG) which is transformed into fluorescein and β-D-
Active site
Active siteActive site
Active site

124
galactopyranoside through a reaction enzymatically triggered by -galactosidase (see figure
5.2). The reaction can thus be followed by monitoring the fluorescence of the solution in
contact with the film.
Figure 5.2: Reaction of FDG leading to fluorescein in the presence of -galatosidase
5.2 Results
Our first goal was to prepare cross-linked polymeric films that are both stretchable and
enzymatically active. In previous studies it was shown that PLL/HA multilayers can be
deposited on silicone substrates in a step-by step manner.8 The film thickness grows
exponentially with the number of deposition steps and reaches of the order of 7 m after 24
PLL/HA deposition steps.9 We used a similar deposition procedure here (see supporting
information S4.1). Once built, the film was brought in contact with a -galactosidase solution
whose concentration was 0.5 mg/mL. Using fluorescein labelled -galactosidase we could
show that the enzymes diffuse within 60 minutes (contact time of the film with the solution)
into the whole multilayer film (figure 5.3). When this film was brought in contact with a FDG
solution at 0.5 mg/mL we observed a linear increase with time of the fluorescence in the
solution contacting the film (figure 5.4). This indicates that the enzymes remain active in the
multilayer, in accordance with previous studies on other enzyme/multilayer systems.8 When
this system was stretched no change in the fluorescence rate production in solution was
observed under stretching (figure 5.5). This is anticipated since PLL/HA behaves as a
viscoelastic liquid.11

Figure
deposite
image w
thicknes
sheet an
Figure
loaded
EDC/NH
in the m
5.3: Conf
ed on silico
was taken 6
ss of the fil
nd multilaye
Flu
ores
cen
cein
tent
sity
(au)
5.4: Evolut
enzymes in
HS cross-li
multilayer an
focal micro
one sheets b
60 minutes
lm is aroun
er film. This
0
Flu
ores
cen
ce in
tent
sity
(a.
u)
0
20
40
60
80
100
tion with tim
n the (PLL/H
inking. One
nd after cros
oscope sect
brought in c
after conta
nd 7 µm. T
s figure sho
5
me of the fl
HA)24 films
e observes t
ss-linking th
tion (x,z) i
contact with
act between
he dashed
ows that the
Time (min
10
luorescence
s (red curve
that before
he film beco
images of
h a β-GalFIT
n the film a
lines indica
enzymes di
)
15 20
e intensity m
e) before cr
cross-linkin
omes totally
(PLL/HA)2
TC solution
and the enz
ate interface
iffuse into t
25
measured in
ross-linking
ng, the enzy
y inactive en
24 multilay
n at 0.5 mg/
zyme soluti
es between
the whole fi
n solution du
g, (blue curv
ymes remai
nzymaticall
125
er films
/ml. The
ion. The
silicone
ilm.
ue to the
ve) after
in active
ly.

126
Time (min)
0 20 40 60 80 100
Flu
ore
scen
ce in
ten
sity
(a.
u)
0
5
10
15
20
25
30
(1, 0%)(1, 50%)(1, 100%)(2, 0%)(2, 50%)(2, 100%)(3, 0%)(3, 50%)(3, 100%)
Figure 5.5: Evolution with time of the fluorescence in solution for a film (PLL/HA)24-β-Gal
in the presence FDG. The film is stretched at various stretching degrees. No change in the
fluorescence rate increase is observed when the stretching degree of the film is changed.
(X,Y%): X represents the stretching cycles number and Y represents the stretching degree
within the cycle.
Next, we cross-linked the film through carbodiimide chemistry by bringing it in
contact with an EDC-NHS solution. This procedure is known to cross-link the PLL/HA film
by formation of amide bonds.12 We first optimized the cross-linking conditions by changing
the EDC concentration and the cross-linking time with the goal to obtain a film that is
stretchable up to a stretching degree of 100% without crack formation. We found that the
optimum conditions are 20 mmol EDC, 50 mmol NHS with a cross-linking time of 15 hours
at 4°C (see table S1 in supporting information). This led to films which can be stretched up to
160% without breaking. Under stretching, the film remained firmly attached to the silicone
substrate. These conditions were used throughout the whole study. When this procedure was
applied on a film containing -galactosidase, no enzymatic activity was observed anymore
(see figure 5.4). This may be due to the fact that cross-linking the film also affects the
enzymes internally which should greatly modify their conformation, their conformation
fluctuations and thus also their catalytic activity.
In order to circumvent these difficulties we proceeded in two steps. We modified PLL
chains chemically by grafting on them thiopyridone groups leading to PLL-S-TP. The grafting

127
ratio was 27%. The enzymes were modified by grafting maleimide groups through their free
lysines (-Gal-mal). The average grafting ratio was 70%. Details of the chemical
modifications of both PLL and -gal are given in supporting information S1. We constructed
PLL-S-TP/HA films onto silicone substrates similarly to PLL/HA multilayers. The films were
then reticulated through the EDC/NHS cross-linking chemistry before enzyme incorporation.
We then brought the cross-linked PLL-S-TP/HA films in contact with -Gal-mal enzyme
solution. We first verified that the enzymes diffuse into the film, a result that is by far not
obvious since the film is already reticulated. This was verified by using -Gal-mal enzymes
labelled with fluorescein isothiocyanate (FITC) (figure 5.6).
Figure 5.6: Confocal image of a (PLL-S-TP/HA)24 film cross-linked with EDC-NHS and
then brought in contact with -Gal-malFITC before cross-linking by addition of TCEP
The film appears green over 7 m, a thickness that corresponds typically to that of a
(PLL/HA)24 multilayer. By comparing the fluorescence intensity in the film and in different
solutions we could estimate the enzyme concentration in the film to be of the order of 854
µg/mL. This value is to be compared to 0.5 mg/mL in solution (More details are given in
supporting information S4.6). The multilayers thus act as a concentrating media as it was
observed for non-cross-linked PLL/HA multilayers.13 When this film is brought in contact
with a FDG solution, fluorescence in solution increases linearly with time showing again that
the film remains enzymatically active. When this film is stretched at 50% and later at 100%,
no significant change in the fluorescence rate in solution is observed (see figure 5.7). Thus,
even when the film is cross-linked but the enzyme is not coupled to the film, the enzymatic
activity of the film is not affected by stretching.
7 µm
7 µm
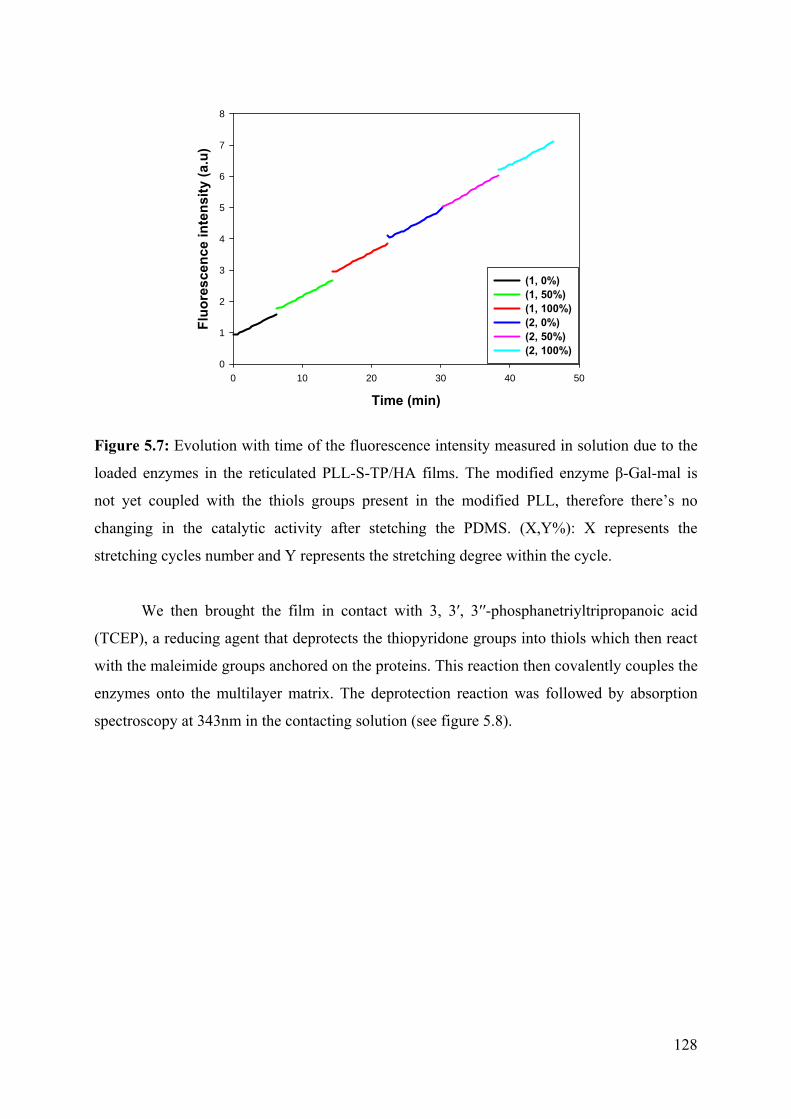
128
Time (min)
0 10 20 30 40 50
Flu
ore
sce
nc
e in
ten
sity
(a.
u)
0
1
2
3
4
5
6
7
8
(1, 0%)(1, 50%)(1, 100%)(2, 0%)(2, 50%)(2, 100%)
Figure 5.7: Evolution with time of the fluorescence intensity measured in solution due to the
loaded enzymes in the reticulated PLL-S-TP/HA films. The modified enzyme β-Gal-mal is
not yet coupled with the thiols groups present in the modified PLL, therefore there’s no
changing in the catalytic activity after stetching the PDMS. (X,Y%): X represents the
stretching cycles number and Y represents the stretching degree within the cycle.
We then brought the film in contact with 3, 3′, 3′′-phosphanetriyltripropanoic acid
(TCEP), a reducing agent that deprotects the thiopyridone groups into thiols which then react
with the maleimide groups anchored on the proteins. This reaction then covalently couples the
enzymes onto the multilayer matrix. The deprotection reaction was followed by absorption
spectroscopy at 343nm in the contacting solution (see figure 5.8).

129
Time (min)
0 5 10 15 20 25 30 35
Abs
orpt
ion
(a.u
)
0.00
0.02
0.04
0.06
0.08
Figure 5.8: Deprotection of the thyopiridone groups in contact with TCEP followed by UV
spectroscopy at 343 nm wavelength. The reaction takes place over 30 minutes.
The increase in absorption corresponds to the release of the pyridinone molecules in
solution. We found that the reaction takes place during approximately 30 minutes. We thus
always kept this coupling time for all the experiments. We also tried to verify the coupling of
the enzymes onto the PLL-S-TP/HA matrix by using fluorescence recovery after
photobleaching experiments (FRAP) (see figure S7 in Supporting Information). We found
that the fraction of mobile enzymes is for -Gal-malFITC and -GalFITC 34% and 42%
respectively. These results are very similar which indicates almost the same number of
immobile between the modified or unmodified enzymes throught the PEM film. It thus seems
that the -GalFITC non-cross-linked enzyme is firmly attached to the PLL-S-TP/HA network,
eventually through strong electrostatic interactions with PLL-S-TP. We thus rely on the
reduction of thiopyridone and the high reactivity of thiol groups with maleimide groups to
argue that the enzymes are covalently linked to the cross-linked PLL-S-TP/HA film.
Films containing covalently attached -Gal-mal enzymes were then brought in contact
with FDG and stretched in a stepwise manner up to 100%. Figure 5.9 shows a typical
evolution of the fluorescence during such a process.

130
Time (min)
0 50 100 150 200 250
Flu
ore
scen
ce in
sten
sity
(a.
u)
0
1
2
3
4
5
6
7
(1, 0%)(1, 50%)(1, 80%)(2, 0%)(2, 80%)(3, 0%)
slop = 3.27e-4
slop = 3.52e-4
slop = 2.76e-4
slop = 3.36e-4
slop = 2.33e-4
slop = 3.63e-4
Figure 5.9: Evolution with time of the fluorescence intensity measured in solution due to the
loaded cross-linked and in the reticulated PLL-S-TP/HA films.Evolution of the fluorescence
intensity in the solution as a function of time during a stretching/unstretching cycle. The rate
of fluorescence increase is given for each stretching degree. (X,Y%): X represents the
stretching cycles number and Y represents the stretching degree within the cycle.
First one observes that the films remain enzymatically active in the non stretched state.
Under stretching, the fluorescence production rate in the solution decreases when the
stretching degree is increased. This evolution of the fluorescence production rate is different
from that observed with non-crosslinked enzymes where the fluorescence production
remained almost constant or even increased slightly under stretching. A summary of the
obtained results is found in figure 5.10 where one plots the fluorescence rate as a function of
the stretching degree, the rate being normalized to the rate measured initially in the non-
stretched state. It clearly appears that stretching the film with the crosslinked enzymes affects
the enzyme activity. One can speculate about the origin of the reduced enzymatic activity, one
highly probable reason being a change of the enzyme conformation, yet this is impossible to
prove with our experimental set-ups. The decrease of the film activity becomes particularly
important at stretching degrees higher than 50%. We reached 3210% reduction of the
fluorescence production at a stretching degree of 80-85%. Due to a constant or even small
increase of the production under stretching for non cross-linked films one can conclude that
the mean enzyme activity is decreased by more than 32% at 80% of stretching. This

131
reduction of the enzyme activity is to be compared to the values of the reduction of the
activity of guanylate kinase found by Tseng et al. using the DNA molecular spring method
and which, to our knowledge, is the only example where the enzymatic activity has been
quantitatively measured for enzymes under mechanical forces.7 Depending upon the DNA
length, these authors found a decrease of the catalytic rate constant kcat entering in the
Michaelis-Menten equation from 9.6 to 6.4 for short DNA (high stress exerted on the enzyme)
and from 9.3 to 8.8 for a longer chain DNA (low stress exerted on the enzyme). It is also
found that the application of a mechanical stress decreases the binding affinity of the enzymes
for ATP and GMP, the two substrates involved in the reaction up to 20%. The reduction of the
catalytic rate constant up to 30% is of the same order of magnitude as that found in our
experiments.
Next we investigated the reversibility of the activity change. The films were stretched
at 80 or 100% and then returned to the non stretched state. Figure 5.10 shows that returning to
the non stretched state leads to an increase of the order of 15% of the fluorescence rate
production. When repeated a second time, the stretching/unstretching process leads again to a
decrease/increase of the fluorescence production rate. This shows that the stretch-induced
change of the enzymatic activity is partially reversible. These results show the enzymatic
mechano-responsive character of the film.
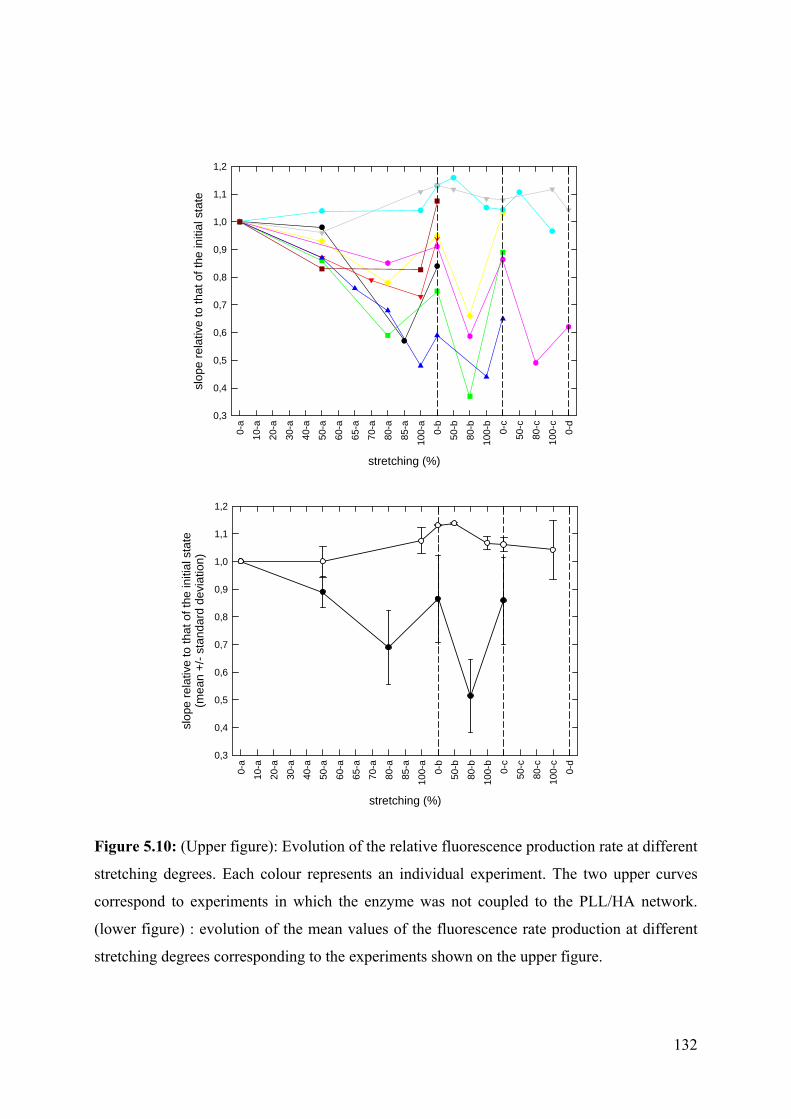
132
stretching (%)
0-a
10-a
20-a
30-a
40-a
50-a
60-a
65-a
70-a
80-a
85-a
100-
a
0-b
50-b
80-b
100-
b
0-c
50-c
80-c
100-
c
0-d
slop
e re
lativ
e to
tha
t of
the
initi
al s
tate
(mea
n +
/- s
tand
ard
devi
atio
n)
0,3
0,4
0,5
0,6
0,7
0,8
0,9
1,0
1,1
1,2
stretching (%)
0-a
10-a
20-a
30-a
40-a
50-a
60-a
65-a
70-a
80-a
85-a
100-
a
0-b
50-b
80-b
100-
b
0-c
50-c
80-c
100-
c
0-d
slop
e re
lativ
e to
that
of
the
initi
al s
tate
0,3
0,4
0,5
0,6
0,7
0,8
0,9
1,0
1,1
1,2
Figure 5.10: (Upper figure): Evolution of the relative fluorescence production rate at different
stretching degrees. Each colour represents an individual experiment. The two upper curves
correspond to experiments in which the enzyme was not coupled to the PLL/HA network.
(lower figure) : evolution of the mean values of the fluorescence rate production at different
stretching degrees corresponding to the experiments shown on the upper figure.

133
5.3 Conclusion
The large variability of the reduction of the enzymatic activity that we find between
different experiments may be due to the large number of parameters entering in the
preparation process of the sample and the experimental difficulties related to the fact that the
stretching-unstretching process is only partially reversible. When the unstretched prepared
sample is introduced in the clamps, unavoidably the film becomes locally slightly folded
which introduces local mechanical stresses. Moreover, slight temperature changes during the
film preparation might slightly influence the film structure, the reticulation reactions which in
turn influence the enzyme behaviour.
In 2009 our group presented a first enzymatic mechano-responsive film8, yet it was
based on a totally different principle. It was based on embedding an enzyme, alkaline-
phosphatase, into a PLL/HA multilayer which was then capped by a linearly growing
multilayer, namely poly(styrene sulfonate)/poly(diallyl dimethyl ammonium). This latter film
played the role of barrier towards fluorescein di-phosphate (FDP), a substrate of alkaline-
phosphatase. By stretching the film, the barrier remained tied towards FDP but some enzymes
became exhibited through the barrier so that the reaction took place. When returning to the
non stretched state, the enzymes were hidden again by the barrier, at least to a large extent, so
that the systems appeared fairly reversible. The present system, which could at first sight
appear quite similar to the one developed by Mertz et al. relies in fact on totally different
physical grounds and is by far more general in its principle. The system presented here is
based on a conformational change of the enzymes under stretching. Even if we could not
directly prove this conformational change of the enzymes under stretching, it appears as the
only explanation for our observations. The system presented here opens the route towards a
class of materials whose active sites have their conformations modified and thus their activity
changed under tensile stress. Our goal is now to generalize this concept to other enzymes and
other supporting hydrogels.

134
5.4 References
1. Hickenboth, C. R.; Moore, J. S.; White, S. R.; Sottos, N. R.; Baudry, J.; Wilson, S. R.,
Biasing reaction pathways with mechanical force. Nature 2007, 446, 423-427.
2. Davis, D. A.; Hamilton, A.; Yang, J. L.; Cremar, L. D.; Van Gough, D.; Potisek, S. L.;
Ong, M. T.; Braun, P. V.; Martinez, T. J.; White, S. R.; Moore, J. S.; Sottos, N. R., Force-
induced activation of covalent bonds in mechanoresponsive polymeric materials. Nature
2009, 459, 68-72.
3. Diesendruck, C. E.; Steinberg, B. D.; Sugai, N.; Silberstein, M. N.; Sottos, N. R.; White, S.
R.; Braun, P. V.; Moore, J. S., Proton-Coupled Mechanochemical Transduction: A
Mechanogenerated Add. Journal of the American Chemical Society 2012, 134, 12446-12449.
4. Orr, A. W.; Helmke, B. P.; Blackman, B. R.; Schwartz, M. A., Mechanisms of
mechanotransduction. Developmental Cell 2006, 10, 11-20.
5. Vogel, V.; Sheetz, M., Local force and geometry sensing regulate cell functions. Nature
Reviews Molecular Cell Biology 2006, 7, 265-275.
6. Vogel, V., Mechanotransduction involving multimodular proteins: Converting force into
biochemical signals. In Annual Review of Biophysics and Biomolecular Structure, Annual
Reviews: Palo Alto, 2006; Vol. 35, pp 459-488.
7. Tseng, C. Y.; Wang, A.; Zocchi, G., Mechano-chemistry of the enzyme Guanylate Kinase.
Epl 2010, 91.
8. Mertz, D.; Vogt, C.; Hemmerle, J.; Mutterer, J.; Ball, V.; Voegel, J. C.; Schaaf, P.; Lavalle,
P., Mechanotransductive surfaces for reversible biocatalysis activation. Nature Materials
2009, 8, 731-735.
9. Picart, C.; Mutterer, J.; Richert, L.; Luo, Y.; Prestwich, G. D.; Schaaf, P.; Voegel, J.-C.;
Lavalle, P., Molecular basis for the explanation of the exponential growth of polyelectrolyte
multilayers. Proceedings of the National Academy of Sciences of the United States of America
2002, 99, 12531-12535.
10. Jacobson, R. H.; Zhang, X. J.; DuBose, R. F.; Matthews, B. W., Three-dimensional
structure of beta-galactosidase from E. coli. Nature 1994, 369, 761-766.
11. Picart, C.; Sengupta, K.; Schilling, J.; Maurstad, G.; Ladam, G.; Bausch, A. R.;
Sackmann, E., Microinterferometric study of the structure, interfacial potential, and
viscoelastic properties of polyelectrolyte multilayer films on a planar substrate. Journal of
Physical Chemistry B 2004, 108, 7196-7205.

135
12. Richert, L.; Boulmedais, F.; Lavalle, P.; Mutterer, J.; Ferreux, E.; Decher, G.; Schaaf, P.;
Voegel, J. C.; Picart, C., Improvement of stability and cell adhesion properties of
polyelectrolyte multilayer films by chemical cross-linking. Biomacromolecules 2004, 5, 284-
294.
13. Vogt, C.; Ball, V.; Mutterer, J.; Schaaf, P.; Voegel, J. C.; Senger, B.; Lavalle, P., Mobility
of Proteins in Highly Hydrated Polyelectrolyte Multilayer Films. Journal of Physical
Chemistry B 116, 5269-5278.
14. Hermanson, G. T., Zero-length crosslinkers - EDC plus sulfo-NHS. In Bioconjugate
Techniques (Second Edition), Academic Press: New York, 2008; pp 219-223.
15. Bacharouche, J.; Badique, F.; Fahs, A.; Spanedda, M. V.; Geissler, A.; Malval, J. P.;
Vallat, M. F.; Anselme, K.; Francius, G.; Frisch, B.; Hemmerlé, J.; Schaaf, P.; Roucoules, V.,
Biomimetic Cryptic Site Surfaces for Reversible Chemo- and Cyto Mechanoresponsive
Substrates. ACS Nano 2013, (in press).
16. Picart, C.; Mutterer, J.; Arntz, Y.; Voegel, J. C.; Schaaf, P.; Senger, B., Application of
fluorescence recovery after photobleaching to diffusion of a polyelectrolyte in a multilayer
film. Microscopy Research and Technique 2005, 66, 43-57.

136
5.5 Supporting Information
S1. Chemicals and chemical modifications of polymers and enzymes
S1.1 Chemicals
The polyelectrolytes Poly(L-lysine) (PLL, Mw = 2.60 x 10⁴ Da) and hyaluronic acid (HA,
Mw = 1.32 x 10⁵ Da) were purchased from Sigma Aldrich and Lifecore Biomedical
respectively. Coupling agents as N,N′-Dicyclohexylcarbodiimide 99% (DCC), N-(3-
Dimethylaminopropyl)-N′-ethylcarbodiimide hydrochloride ≥98% (EDC), N-
Hydroxysuccinimide sodium salt 98% (NHS), and N-Hydroxysulfosuccinimide sodium salt
(sulfo-NHS) ≥98% were all purchased from Sigma Aldrich. The enzyme β-Galactosidase
from Escherichia coli Grade VI, lyophilized powder, 250-600 units/mg protein and the
enzyme substrate fluorescein di(β-D-galactopyranoside) (FDG) were purchased from Sigma
Aldrich. 2,4,6-Trinitrobenzenesulfonic acid (TNBS), Tris(2-carboxyethyl)phosphine
hydrochloride powder, ≥98% (TCEP), tris(hydroxymethyl)aminomethane (TRIS) and 4-(2-
Hydroxyethyl)piperazine-1-ethanesulfonic acid (HEPES), sodium chloride (NaCl), sodium
bicarbonate (NaHCO3) anhydrous solvents for synthesis dichloromethane (CH2Cl2), N,N-
Dimethylformamide (DMF) were all purchased from Sigma Aldrich. Dialysis cellulose ester
membrane (MWCO 3500 Da) was purchased from Roth and Bicinchoninic Assay protein
quantification kit was purchased from Uptima (Montlouçon, France). Thiopyridone
mercaptopropionic acid (TP-MPA) was synthesized by the procedure described by Xie et al.1.
Maleimide succinimide ester was synthetized by the procedure described by Thibaudeau et
al.2. Poly(dimethylsiloxane) PDMS sheets of 250 µm of thickness (Specialty Manufacturing
Inc., Saginaw, Michigan, United States) and circular glass slides of 12 mm of diameter, 150
µm of thickness and less than 1 nm of roughness (Menzel-Gläser, Braunschweig, Germany)
were chosen as substrates for the construction of polyelectrolyte multilayer films.
S1.2 Chemical modification of PLL with thiopyridone protecting groups (PLL-S-TP)
The modified poly(L-Lysine) with thiopyridone groups (PLL-S-TP) was obtained in a
two step reaction. The first step consists in the activation of the thiopyridone
mercaptopropionic acid (TP-MPA) with the N-Hydroxysuccinimide (NHS) followed by the
second step where the amines of the PLL will make a nucleophilic attack on the activated acid
cited before.

137
S1.2.1 First step: activation of the TP-MPA acid with NHS
N S S
O
OH
i) DCCii) NHS
CH2Cl2 N S S
O
O N
O
O
TP-MPA TP-MPA-NHS
The TP-MPA (186 mg, 0.864 mmol) was dissolved in 8 mL of CH2Cl2 followed by
the addition of DCC (178 mg, 0.864 mmol, 1 eq) and NHS (99 mg, 0.864 mmol, 1eq). The
reaction was stirred at room temperature for 24 h. The solution was filtered and the solvent
was removed under pressure until dryness to obtain a yellow solid compound TP-MPA-NHS
in a quantitative yield which will be used in the next step without further purification. The
characterization of this compound is described in Xie et al.1
S1.2.2 Second step: coupling reaction between TP-MPA-NHS and the PLL
The PLL (300 mg, 1.44 mmol) was dissolved in 15 mL of Milli-Q water followed by
the addition of a solution of TP-MPA-NHS (269.9 mg, 0.864 mmol, 0.6 eq) in 3 mL of DMF.
The reaction was stirred at room temperature for 24 h. The solution was filtered and dialyzed
(cellulose ester membrane (MWCO 3500 Da)) against a 2 L solution of NaCl 0.30 M for 1
day at 4°C and then changed two times against 2 L of Milli-Q water for another 2 days at 4°C.
Lyophilisation of the solution afforded PLL-S-TP as a white like foam with a 75 % yield. 1H NMR (D2O, 400 MHz, δ ppm): 8.20 (br s, 1H, Ar), 7.75 (br s, 2H, Ar), 7.20 (br s, 1H, Ar)
4.25 (br s, 1H, CαH), 3.05 (br s, 2H, CH2 thiopyridyl), 2.99 (br s, 4H, NHCH2CH2CH2), 2.60
(br s, 2H, CH2 thiopyridyl) 1.85 (br m, 6H CH2CH2CH2), 1.40 (br s, 6H, CH2CH2CH2).

138
By comparison of the integration of one aromatic signal and the integration of the broad
singlet at 4.25 (H on the carbon α of the lysine amino acid), the percentage of modification on
the PLL by thiopyridone groups is be estimated to be 27%
S1.3 Chemical modification of β-Galactosidase with maleimide groups (β-Gal-mal)
S1.3.1 Chemical modification
β-Galactosidase from Escherichia coli (7 mg, 1.61x10⁻⁵ mmol) was dissolved in 1 mL
of NaHCO3 0.1 M at pH 8.5 followed by 4 mL of HEPES 50 mM at pH 6. Then, 500 µL of a
1 mg/mL (0.5 mg, 1.87x10⁻³ mmol) 3-(Maleimido)propionic acid N-succinimidyl ester (Mal-
Ala-NHS) solution in DMF is added to the β-Galactosidase solution and stirred at room
temperature for 3h. The solution was dialyzed (cellulose ester membrane (MWCO 10 000
Da)) against a 2 L solution of 50 mM HEPES and two times against a 2 L solution 10 mM
HEPES pH 6 at 4°C for 3 days. Aliquots of 250 µL were prepared and conserved at -20°C.
The modified enzymes with thyopiridone groups were not lyophilized after chemical
modification. The reason to avoid the lyophilisation of the modified enzyme is the loss of
enzymatic activity detected in previous experiments after this treatment.
S1.3.2 Determination of the modified enzyme concentration
We used the bicinchoninic acid (BC) Assay test to determine the concentration of the
solutions of the modified enzyme3. A fresh set of protein standards, from 20 µg/mL to 1
mg/mL, were prepared using the Bovine Serum Albumin (BSA) at 2 mg/mL. Solutions of the
sample β-Galactosidase-maleimide and the control β-Galactosidase at 1 mg/mL were prepared
and then diluted to 0.25 mg/mL in an aqueuse solution of NaHCO3 0.1M at pH 8.5. 100 µL of
each standard, control and sample were then pipettes in test tubes. Then 2 mL of BC Assay

139
reagent (mixture of 50 parts of bicinchoninic acid and 1 part of CuSO4) were added to the test
tubes, mixed and incubated at 60°C for 20 min. All the test tubes were mixed at room
temperature and their optical absorbance read at 562 nm against the blank NaHCO3 in a 96
well cell plate. Then the proteins concentration can be calculated with a reference curve
obtained for a standard protein (figure S1). Finally, we obtained a concentration of 0.4 mg/mL
for β-Gal-mal and 0.5 mg/mL for β-Gal.
BSA (mg/mL)
0.0 0.2 0.4 0.6 0.8 1.0 1.2
Ab
sorb
anc
e (a
.u)
0.0
0.5
1.0
1.5
2.0
2.5
Y = 1.828 X + 0.1164r ² = 0.99922
Figure S1: Calibration curve to determine the concentration of enzymes before and after the
chemical modification. Each black point corresponds to a measurement of the absorbance of
different standard solution concentration and the black line is the linear regression of these
values.
S1.3.3 Verification of the catalytic activity of the modified enzyme
The enzymatic activity of the -Gal-mal was verified against the unmodified enzyme
-Gal in presence of the substrate fluorescein di(β-D-galactopyranoside) (FDG). The principle
of this experiment is the hydrolysis in 2 steps of the FDG in the presence of the enzyme to
obtain fluorescein (Scheme S1).
Scheme S1: Sequential hydrolyse reaction of the FDG by the β-Galactosidase

140
This fluorescent product is detected as a function of time giving the enzymatic kinetics
with a multidetector Spectrofluorimeter SAFAS Xenius XC equipped with microplates reader
(λex/em: 495 nm / 519 nm). In a 96 well cell plate, we added 200 µL of FDG at 0.071 mg/mL
and 50 µL of the enzymes separately at 0.0048 mg/mL. Then, the catalytic activity was
recorded with the spectroflorimeter SAFAS. The results are presented in figure S2 where the
slope of the curve indicates the activity of the enzymes. The activities for the unmodified and
modified enzymes are 0.08 a.u and 0.02 a.u respectively. β-Gal-mal appears thus 4 times less
active than non modified -Gal. There was thus a loss in the enzymatic activity of the -Gal
after the chemical modification.
Time (s)
0 200 400 600 800
Flu
ore
sce
nce
inte
nsi
ty (
a.u
)
0
20
40
60
80
-Gal-Gal-mal
Slop = 0.08
Slop = 0.02
Figure S2: Comparison of the enzymatic activity between the modified and unmodified
enzyme β-Galactosidase. The black lines represent the linear regression curves for a same
period of time.
S1.3.4 Free-amines TNBS test
The grafting rate on the modified -Gal with maleimide groups was obtained using the
2,4,6-Trinitrobenzenesulfonic acid (TNBS) also known as picrylsulfonic acid. This test
consists in the complexation between the picrylsulfonic acid and the primaries amines groups
that are present on the protein to form a highly chromogenic derivative4 (Scheme S2).

141
Scheme S2: TNBS may be used to detect or quantify amine groups through the production of
a chromogenic derivative.
Different concentrations of glycine (standard) were prepared ranging from 10-1 mM to
10-3 mM in 0.1 M of NaHCO3 at pH 8.5 from glycine 1 mM. 1 mL of the standard solutions
was mixed with 25 µL of a 30 mM picrylsulfonic acid solution. In the same way, 300 µL of
the control -Gal and sample -Gal-mal at 0.1 mg/mL in 0.1 M of NaHCO3 pH 8.5 and 7.5
µL of a picric sulfonic acid solution were added into the eppendorfs. They were incubated for
40 min at room temperature. After that 200 µL of the standards, control and sample were
transferred into a 96 cells well plate and the optical absorption was measured at 420 nm in a
Spectrofluorimeter SAFAS. In figure S3, the lysine concentration can be calculated with a
reference curve obtained for a standard acid amine glycine. The grafting rate was calculated
from the relation:
where: total and non modified groups represents the UV absorbance of the β-Gal and β-Gal-
mal respectively.
A grafting rate of 70% was obtained after modification of the -Gal with maleimide
groups.

142
Glycine (mM)
0.00 0.02 0.04 0.06 0.08 0.10 0.12
Ab
sorb
ance
(a.
u)
0.0
0.2
0.4
0.6
0.8
1.0
Y = 7.2345 X + 0.118r ² = 0.99
Figure S3: Calibration curve to determine the grafting rate of maleimide groups on the -Gal-
mal. Each black point corresponds to a measurement of the absorbance of different standard
Glycine concentration solution and the black line is the linear regression of these values.
S1.4 Chemical modification of enzymes with fluorophores
S1.4.1 Chemical modification of -Gal with FITC (-GalFITC)
3.1 mg of -Gal was disolve in 3 mL of 100 mM NaHCO3 buffer at pH 8.5 followed
by the addition of 3.75 µg of FITC in methanol solution. The reaction mixture was stirred for
3 h at room temperature and dialysed with a cellulose ester membrane (MWCO 3500) against
a 2L solution of NaCl 0.3 M for 8 h and finally with 2L of Milli-Q water for another 24h.
Lyophilisation of the solution afforded 2.5 mg of -GalFITC as a yellow powder.
S1.4.2 Chemical modification of -Gal-mal with FITC (-Gal-malFITC)
2 mg of -Gal-mal was disolve in 3 mL of 100 mM NaHCO3 buffer at pH 8.5
followed by the addition of 3.75 µg of FITC in methanol solution. The reaction mixture was
stirred for 3 h at room temperature and dialysed with a cellulose ester membrane (MWCO
3500) against a 2L solution of NaCl 0.3 M for 8 h and finally with 2L of Milli-Q water for
another 24h. Lyophilisation of the solution afforded 1.7 mg of -Gal-malFITC as a yellow
powder.

143
S2. Stretching device
Figure S4 represents the homemade stretching device used for the experiments. It is
made on stainless steel and it allows stretching manually the sample in an unaxial direction.
The silicone sheet covered with the enzymatic active film is inserted in two jaws. These jaws
can be moved continuously one with respect to the other. This stretching device is inserted in
a black support made of poly(methylmethacrylate). This support was conceived to use the
minimum amount of enzyme substrate (FDG). It also allows taking fluorescence
measurements in the solution with a multidetector Spectrofluorimeter SAFAS Xenius XC
equipped with microplates reader (λex/em: 495 nm / 519 nm) without any interference of the
stretching device.
The stretching rate (α) is defined by the relation α = (l - l0)/l0 where l and l0 represent
respectively the length of the stretched and unstretched states. All the experiments were done
at room temperature with the PEM coated silicone side facing down.
Figure S4: a) Device used for the stretching of modified silicone sheets. The silicone sheet is
placed between the two clams and stretched manually. b) The black support where the red
arrow indicates the fluorescence measuring with a spectrofluorimeter microplate reader.
S3. Experimental methods
S3.1 Spectrofluorometer with microplate reader
A multidetector Spectrofluorimeter SAFAS Xenius XC equipped with microplates
reader was used to follow the catalytic activity of enzymes within the polyelectrolyte
multilayer films supported on silicone sheets in contact with its substrate FDG (λex/em: 495 nm
/ 519 nm). Thyopyridone group deprotection of PLL-S-TP were also monitored by UV
experiments at 343 nm.

144
S3.2 Confocal laser scanning microscope (CLSM)
Confocal laser scanning microscope (CLSM) observations of polyelectrolyte
multilayer films were carried out with a Zeiss LSM 510 microscope using a x 40/1.3 oil
immersion Objective and with 0.43 µm z-section intervals. FITC fluorescence was detected
after excitation at λ = 488 nm with a cut-off dichroic mirror of 488 nm and an emission band-
pass filter of 505–530 nm (green emission). An average of three images in the same location
was acquired at 256x256 pixels. Virtual film section images were taken from the film in the
presence of liquid (NaCl 0.15 / TRIS 10 mM), hence allowing the determination of the
thickness of the film. All the experiments are performed in the presence of liquid (0.15 M
NaCl/10 mM Tris, pH =7.4) and the multilayer films were never dried.
S4. Mechanoresponsive film construction
S4.1 Multilayer film construction
Multilayers films were built with an automated dipping robot (Riegler & Kirstein
GmbH, Berlin, Germany) on silicone sheets SMI of 254 m thickness or microscope slides.
Silicone sheets of 18×18 mm2 were previously cleaned with ethanol and then extensively
rinsed with water. The polyelectrolytes used for the construction of the multilayers were
dissolved in a 0.15 M NaCl solution prepared with ultrapure water (18.2 MΩ.cm Milli-Q plus
system, Millipore) and used at a concentration of 1 mg/mL. Silicon substrates were first
dipped in a PLL solution (polycation) for 4 min. Then, two rinsing steps were performed by
dipping the sheets two times for 5 min in 0.15 M NaCl solution. The polyanion (HA) was
then deposited in the same manner. The buildup process was pursued by the alternated
deposition of PLL and HA. After deposition of n bilayers, the film is denoted (PLL/HA)n. We
used films constituted of 24 PLL/HA "bilayers”. In the case of the (PLL-S-TP/HA)24 film
construction, the same protocol was used changing the polycation by PLL-S-TP.
S4.2 Reticulation conditions of the PLL/HA films by EDC/NHS
We first determined the best reticulation conditions of PLL/HA multilayers with the
goal to obtain a film that can be stretched without cracking. The PLL/HA films were
constructed as reported above. The last layer constituted of PLLFITC (PLL labelled with

145
fluorescein) was deposited manually under similar conditions. The pH of a 0.15 mol/L NaCl
solution was adjusted to 5.5. The presence of TRIS is to be avoided because TRIS contains
primary amines which can react during the film cross-link. The slightly acidic conditions
constitute a good compromise between activation of the carboxylic acid groups through EDC
and a good amide formation rate5. Different reticulation conditions using different EDC and
sulfo-NHS conditions were then tested in order to fulfil the non-cracking condition up to a
stretching rate of at least 100% observed by fluorescence optical microscopy.
Reticulation was realized by bringing a (PLL/HA)24/PLLFITC film in contact with a
solution containing both EDC and NHS for a given cross-linking time at 4°C. At the end of
the cross-linking step the film was rinsed 3 times during 1h with a NaCl solution. The last
rinsing step was performed with a NaCl/TRIS, pH 7.4 buffer solution. In order to determine
the ultimate stretching degree before cracking, the cross-linked films were fixed in a home-
made stretching device and observed under an epifluorescence microscope. The obtained
results are summarized in table S1 below.
Test n° [EDC]
(10-3 mol/L) [sulfo-NHS] (10-3 mol/L)
Cross-linking time (hours)
Critical stretching rate (± 5%)
1 200 50 1 44 %
2 200 50 2 32 %
3 200 50 19 18 %
4 2 0.5 2 No crack
5 20 50 15 161 %
6 50 50 15 68 %
7 100 50 15 54 %
8 20 50 19 163 %
9 40 50 19 76 %
10 50 50 19 69 %
Table S1: Summary of the experiments performed to determine the optimal conditions of the
PLL/HA film cross-linking through EDC/sulfo-NHS. The columns [EDC] and [sulfo-NHS]
corresponds to the molar concentrations by mixing EDC and sulfo-NHS. The critical
stretching degree was evaluated optically.
Francius et al. have shown that the EDC and sulfo-NHS concentrations corresponding
to tests 1 and 3 lead to a maximum of cross-linking after 18 hours6. It appears that for sample
3 prepared with 19 hours of cross-linking, the critical stretching degree (stretching degree at

146
which one observes the first cracks) is very small. A stretching of 18 % already leads to
cracks perpendicular to the along the entire film in test n° 3. When the concentration of both
compounds is divided by a factor of 100 and the cross-linking time is reduced to 2h (sample
n°4), the films do not break up to a stretching degree of 250 % (the highest stretching degree
that is reachable experimentally). Yet it is expected that this sample is almost identical to the
native one i.e. almost not reticulated. When [sulfo-NHS] = 50 mM and 40 ≤ [EDC] ≤ 100
mM, cracks appear at stretching degrees comprised between 50 and 80 % (figure S5). Yet, to
obtain a stretching degree that exceeds 100 %, the EDC concentration had to be reduced to 20
mM (samples 5 and 8). Diminishing the cross-linking time from 19 to 15h does not seem to
change significantly the result. Finally by using [sulfo-NHS] = 50 mM and [EDC] = 20 mM
and a reaction time of 15 hours, a critical stretching degree of 160 % could be obtained. These
are the conditions that were used throughout this study.
Figure S5: Image realized by epifluorescence microscopy of the surface of sample 10 of table
S1. The film is stretched and cracks appear at a stretching degree of 69%. The stretching is
performed along the direction indicated by the length bar. The image is in grey levels
corresponding to an excitation wavelength between 465-495 nm and emission wavelength
between 515-555 nm.
S4.3 Deprotection of thyopiridone groups on PLL-S-TP
The sample was put in the home made stretching device that was previously coated
with parafilm to prevent leaking of the aqueous solution after its addition. A 100 µL -Gal-
n°10 (α = 69 %)

147
mal (0,4 mg/mL) in NaCl/TRIS solution was added on the sample containing the cross-link
polyelectrolyte multilayer film (PLL-S-TP/HA) supported on PDMS for 1h. Later, the
enzyme solution was pippeted and replaced by 150 µL of TCEP 1 mM solution prepared in
NaCl/TRIS at (t = 0). Sampling 150µL of TCEP solution was done every 5 min and replaced
by other 150 µL of TCEP solution. UV measurements at 343 nm wavelength were performed
with a multidetector Spectrofluorimeter SAFAS Xenius XC equipped with microplates reader
in a 96 well-cell-plate with 100 µL of the sampling solution for each period of time and total
time of 30 min. Full deprotection of thyopiridone groups are completed after 30 min of
treatment with TCEP solution (figure 8 in the publication).
S4.4 Cross-linking of the enzyme β-Galactosidase-maleimide within the PEM film
The reticulated PEM film on silicone sheets was placed in a homemade stretching
device. The homemade device was held together tightly with clips that were previously coated
with parafilm to prevent leaking of the aqueous solution after its addition. 100 µL of -Gal-
mal at 0.4 mg/mL prepared in NaCl/TRIS buffer solution was then added for 1h. The
modified enzyme was later pippeted and replaced by 200 µL of 1 mM TCEP prepared in 0.15
M NaCl/10 mM TRIS buffer solution for 30 min. Finally, the PEM film was rinsed with the
buffer solution 0.15 M NaCl / 10 mM TRIS at pH 7.4.
S4.5 Enzymatic kinetics
The sample in the homemade stretching device was placed in the black support and
then 3.8 mL of FDG at 0.5 mg/mL prepared in the buffer 0.15 M NaCl / 10 mM TRIS at pH
7.4 solution was added. The fluorimetric measurements were then taken with a
Spectrofluorimeter SAFAS Xenius XC (λex/em: 495 nm / 519 nm) at different stretching rates.
The linear regime of the catalytic activity was chosen to plot the data (figure 4, 5, 7, and 9).

148
S4.6 Determination of the amount of -Gal-mal enzymes present in the cross-linked
PLL-S-TP/HA film.
We adapted a method developed by Vodouhe et al.7 to determine the amount of -Gal-
mal enzymes present in the cross-linked PLL-S-TP/HA film.
After PLL-S-TP/HA film construction, cross-linking the film through 20 mM EDC /
50 mM NHS solution as described above, the film was brought in contact with an
ethanolamine 1 M solution prepared in 0.15 M NaCl for 40 min. This treatment will
desactivate the still active carboxylique groups within the film. Later, a 400 µL of -Gal-
malFITC solution at 0.5 mg/mL was added for 1 h, after that the enzyme solution was pippeted
and replaced by 500 µL of 1 mM TCEP solution for 30 min. Finally, the PEM film was rinsed
with the buffer solution 0.15 M NaCl / 10 mM TRIS at pH 7.4. Several images were then
taken by confocal microscopy of the film at different locations in order to determine the mean
fluorescence and thickness in the film equals to 1272 a.u and 7 μm respectly.
We then removed the film from the confocal microscope and replaced it with a glass
slide onto which we deposited 100 µL of -Gal-malFITC at 0.5 mg/mL solution. Successively,
the concentration of the -Gal-malFITC was diluted with the addition of NaCl/TRIS solution.
For each concentration, the fluorescence was measured in the solution again by using the
confocal microscope with the same experimental parameter setups as for the measurements in
the film. This allowed determining a calibration curve (figure S6) and we could calculate the
concentration of -Gal-malFITC inside the polyelectrolyte multilayer using the fluorescence
value recorded in the film. Finally, the concentration of -Gal-malFITC in the PLL-S-TP/HA
film was about 0.85 mg/mL, when 400 µL of -Gal-malFITC at 0.5 mg/mL were deposited on
it.
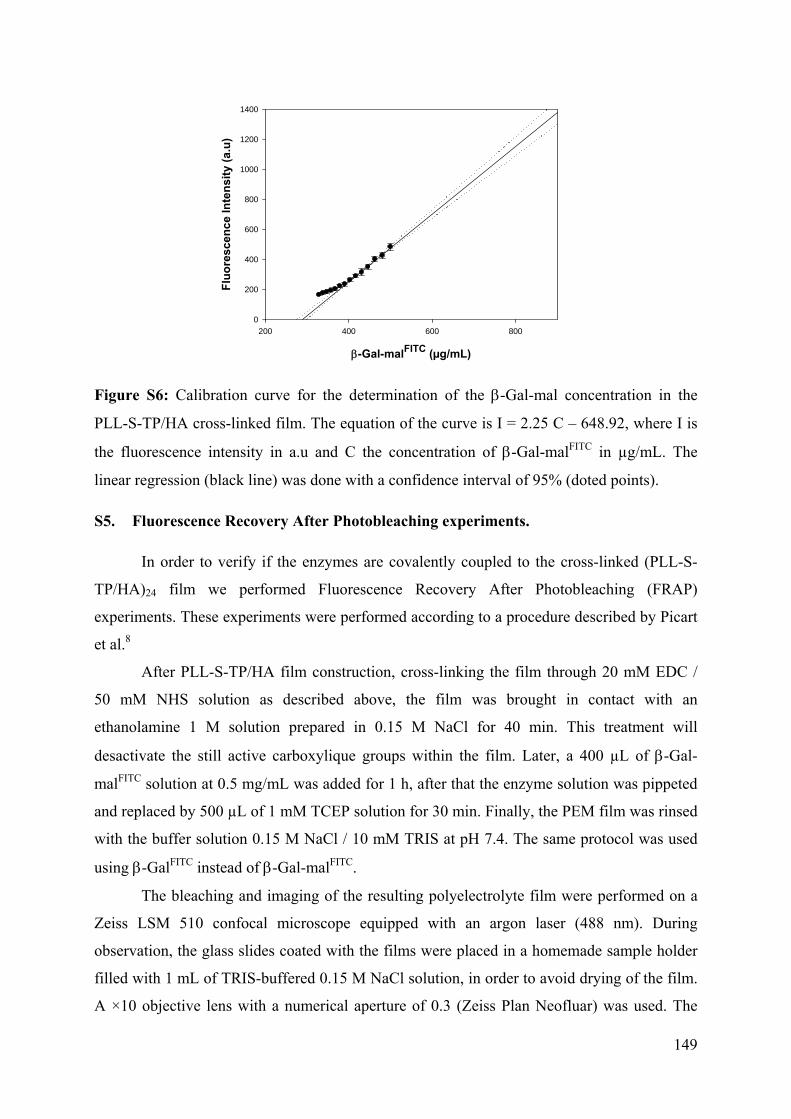
149
-Gal-malFITC (µg/mL)
200 400 600 800
Flu
ore
sce
nc
e In
ten
sity
(a
.u)
0
200
400
600
800
1000
1200
1400
Figure S6: Calibration curve for the determination of the -Gal-mal concentration in the
PLL-S-TP/HA cross-linked film. The equation of the curve is I = 2.25 C – 648.92, where I is
the fluorescence intensity in a.u and C the concentration of -Gal-malFITC in µg/mL. The
linear regression (black line) was done with a confidence interval of 95% (doted points).
S5. Fluorescence Recovery After Photobleaching experiments.
In order to verify if the enzymes are covalently coupled to the cross-linked (PLL-S-
TP/HA)24 film we performed Fluorescence Recovery After Photobleaching (FRAP)
experiments. These experiments were performed according to a procedure described by Picart
et al.8
After PLL-S-TP/HA film construction, cross-linking the film through 20 mM EDC /
50 mM NHS solution as described above, the film was brought in contact with an
ethanolamine 1 M solution prepared in 0.15 M NaCl for 40 min. This treatment will
desactivate the still active carboxylique groups within the film. Later, a 400 µL of -Gal-
malFITC solution at 0.5 mg/mL was added for 1 h, after that the enzyme solution was pippeted
and replaced by 500 µL of 1 mM TCEP solution for 30 min. Finally, the PEM film was rinsed
with the buffer solution 0.15 M NaCl / 10 mM TRIS at pH 7.4. The same protocol was used
using -GalFITC instead of -Gal-malFITC.
The bleaching and imaging of the resulting polyelectrolyte film were performed on a
Zeiss LSM 510 confocal microscope equipped with an argon laser (488 nm). During
observation, the glass slides coated with the films were placed in a homemade sample holder
filled with 1 mL of TRIS-buffered 0.15 M NaCl solution, in order to avoid drying of the film.
A ×10 objective lens with a numerical aperture of 0.3 (Zeiss Plan Neofluar) was used. The

150
numerical zoom was fixed to ×2 in order to define a 460 × 460 μm2 image (L = 460 μm). The
area of an image was virtually subdivided into N × N = 512 pixels × 512 pixels. z-sections of
the films were also obtained after deconvolution and reconstruction of (x, y) stacked images.
The FRAP protocol was as follows: First, a pre-bleach image of the sample was
recorded. Then, using the bleaching tool of the software (Carl Zeiss AIM 510 version 3.2), we
selected a circular area of diameter equal to 115.17 µm. This area was then bleached by
scanning it 1000 times with a laser set at its maximum power. The ×10 objective used for
photobleaching yields optical sections that are thicker than the film thickness itself: from 11
μm up to more than 50 μm, depending on the value of the pinhole diameter used.
Consequently, the film was bleached over its whole thickness during this procedure. The
bleach time was adjusted to achieve sufficient contrast between the bleached and nonbleached
regions. After the bleach, images were acquired at times ranging from ca. 10 s up to ca. 2000
s to monitor the recovery process. These images were acquired by scanning the sample with
the laser power carefully chosen to have an acceptable signal-to-noise ratio while avoiding
strong bleach during image acquisition (“reading” step). The data were analyzed by following
the procedure described by Picart et al.(ref 8).
t (s)
0 500 1000 1500 2000 2500 3000
I (t)
/ I r
ef
0.74
0.76
0.78
0.80
0.82
0.84
0.86
D = 3.38 µm2/s
p = 0.417
a
t (s)
0 500 1000 1500 2000 2500 3000
I (t)
/ I r
ef
0.66
0.68
0.70
0.72
0.74
0.76
0.78
D = 0.773 µm2/s
p = 0.336
b
Figure S7: Fluorescence recovery intensity in function of time for a reticulated
polyelectrolyte multilayer film with -GalFITC (a) and -Gal-malFITC (b). The mobile fraction
population and the diffusion coefficient are represented by p and D respectively.
The results are shown in figure S7. We obtain a mobile fraction population for -Gal-
malFITC and -GalFITC of 34% and 42% respectively. From these values, we cannot be sure

151
certainly that the enzyme is cross-linked inside the bulk. Therefore, we use, as a support, the
results of the deprotection of the thiopyridone as an argument to explain the reaction between
the maleimide and thiols groups present in the modified enzyme and in the PEM film
respectively.
S6. References
(1) Xie, H. Z.; Braha, O.; Gu, L. Q.; Cheley, S.; Bayley, H. Single-molecule observation of
the catalytic subunit of cAMP-dependent protein kinase binding to an inhibitor peptide
Chemistry & Biology 2005, 12, 109-120.
(2) Thibaudeau, K.; Leger, R.; Huang, X. C.; Robitaille, M.; Quraishi, O.; Soucy, C.;
Bousquet-Gagnon, N.; van Wyk, P.; Paradis, V.; Castaigne, J. P.; Bridon, D. Synthesis and
evaluation of insulin-human serum albumin conjugates Bioconjugate Chemistry 2005, 16,
1000-1008.
(3) Smith, P. K.; Krohn, R. I.; Hermanson, G. T.; Mallia, A. K.; Gartner, F. H.; Provenzano,
M. D.; Fujimoto, E. K.; Goeke, N. M.; Olson, B. J.; Klenk, D. C. Measurement of protein
using bicinchoninic acid Analytical Biochemistry 1985, 150, 76-85.
(4)Habeeb, A. Determination of free amino groups in proteins by trinitrobenzenesulphonic
acid Anal Biochem 1966, 14, 328–336.
(5) Hermanson, G. T., Zero-length crosslinkers - EDC plus sulfo-NHS. In Bioconjugate
Techniques. (Second Edition) ed.; Academic press: New York, 2008; p 219-223.
(6) Francius, G.; Hemmerlé, J.; Ohayon, J.; Schaaf, P.; Voegel, J.-C.; Picart, C.; Senger, B.
Effect of crosslinking on the elasticity of polyelectrolyte multilayer films measured by
colloidal probe AFM Microscopy Research and Technique 2006, 69, 84-92.
(7) Vodouhe, C.; Le Guen, E.; Garza, J. M.; Francius, G.; Dejugnat, C.; Ogier, J.; Schaaf, P.;
Voegel, J. C.; Lavalle, P. Control of drug accessibility on functional polyelectrolyte
multilayer films Biomaterials 2006, 27, 4149-4156.
(8) Picart, C.; Mutterer, J.; Arntz, Y.; Voegel, J. C.; Schaaf, P.; Senger, B. Application of
fluorescence recovery after photobleaching to diffusion of a polyelectrolyte in a multilayer
film Microscopy Research and Technique 2005, 66, 43-57.

152
Chapter 6:
Stretchable polyacrylamide hydrogel
covalently supported onto a silicone
substrate: design of an ideal 3D polymeric
network for mechanotransductive
investigations
(article in preparation)

153
6.1 Abstract
Our group is in a strategy to develop chemo-mechano-responsive materials. Among
the different possible ways to achieve this goal, the covalent coupling of mechano-responsive
molecules into stretchable hydrogels constitutes one of the most promising option. Yet,
hydrogels are usually fragile and thus difficult to stretch in particular when fixed into jaws. To
circumvent this problem we propose here the first composite system made out of a silicone
sheet onto which is covalently grafted a poly(acrylamide) gel that can be stretched up to 100%
without breaking. This system is obtained by first treating the silicone substrate by UV ozone
and then further silanizing it in order to graft acrylate groups onto the surface. The UV ozone
treatment has to be optimized such as to avoid the formation of a brittle silicium oxide layer
on top of the silicone substrate. The hydrogel is then formed by radical polymerization on top
of the acrylate bearing surface. The conditions to obtain the poly(acrylamide) hydrogel are
optimized such as to obtain the most stretchable hydrogel. The gels is characterized from a
rheological point of view and has a Young modulus of the order of 5.7 kPa. The resulting
system can be stretched up to 100% a large number of times and can be deformed at will
without cracking the hydrogel and without altering the coupling of the gel on the silicone.
This system constitutes an ideal starting material to develop hydrogel-based mechano-
responsive materials.

154
6.2 Introduction
Smart materials are able to adapt themselves to their environment and thus are
currently of considerable interest because of their potential uses in applications that range
from drug delivery to camouflage systems, artificial muscles or tissue engineering.1 Many
external stimuli like pH2, 3, temperature4, 5, light6, 7 or ionic strength8, 9 may change the matter
in a controlled way.10, 11 Research that focuses on the control of the behaviour of material
under mechanical deformation is a growing research field named mechano-responsive
material.12 To confer the property allowing the switching behaviour of the material under a
mechanical stress one strategy is to insert mechano-responsive molecules into polymeric
materials.13 Mechano-reponsive molecules are force-sensitive entities able to chemically
transform themselves from one molecular structure to another one under a mechanical stress,
like stretching or squeezing.14, 15 Recently, several mechano-sensitive smart materials have
been described. Yet, almost all these studies have described systems able to change color
when stretched.16, 17 An important breakthrough in this field would be to tune the selectivity or
the catalytic activity of a functional material, simply by stretching. To this goal, the selected
material requires communicating with its environment and thus hydrogels appear as ideal
candidates.18 However, hydrogels are fragile and are not easy to handle and manipulate which
are constraining practical problems met when the behaviour of these materials are studied
under a mechanical stress. For example, stretching a hydrogel requires maintaining it between
two crowbars which is often difficult to obtain because of the slippery feature of hydrogels.
Bruns et al.19 have recently reported the first mechano-sensitive polyacrylamide (PAM)
hydrogel containing a green fluorescent protein (GFP) covalently attached to the polymeric
network. Yet, when a very small deformation (up to 5%) is imposed to this chemical gel, little
cracks appear immediately and thus no FRET signals are detected anymore. Several strategies
have been investigated to get gels exhibiting high stretchability: development of hydrogels
containing slide-ring polymers, branched poly(ethylene glycol) chains, double-network
architectures or hybrid gels based on clay and dendritic binders.20
Here, we report the preparation of a robust elastomeric PAM hydrogel covalently
supported on a silicone sheet. Easy and reversible stretching of the silicone sheet induces also
the reversible stretching of the PAM hydrogel. This system is obtained by first functionalizing
the silicone substrates by UV-Ozone (UVO) irradiation. This usually leads to the formation of
a thin brittle silica layer. We first describe the optimization of the UVO treatment in such a
way that stretching levels going up to 100% can be reached without seeing cracks on the

155
silicone surface. Next this surface is silanized in order to graft polymerisable methacrylate
groups on the silicone substrate. We then show that in the presence of acrylamide and bis-
acrylamide solutions, a poly(acrylamide) hydrogel can be obtained which is covalently
attached to the substrate. The optimization of the acrylamide and bis-acrylamide composition
is described in order to get system (silicone sheet + gel) that can be stretched up to 100% of
stretching degree without inducing cracks in the gel. This gel is then characterized by
rheology measurements.
6.3 Material and methods
6.3.1 Materials
Polydimethylsiloxane (PDMS) of 254 µm thick sheets Non-Reinforced Vulcanized (NRV)
gloss/gloss (G/G) was purchased from Specialty Manufacturing Inc. (SMI) Saginaw,
Michigan. Acrylamide powder 98,5% was purchased from Acros Organics. Acrylamide
solution 40%, for electrophoresis, sterile-filtered, bis-acrylamide (N,N’
methylenebisacrylamide) 99%, N,N,N′,N′-Tetramethylethylenediamine (TEMED) 99%,
Ammonium persulfate (APS) 99% and Acetone technical grade were purchased from Sigma
Aldrich. 3-(trimetoxysilyl)propylmethacrylate 97% was purchased from Alfa Aesar. Milli-Q
water with a resistivity of 18.2 MΩ cm-1 was used to prepare the different aqueous solutions.
UV-ozone. An UV-ozone Pro Cleaner Bio Force Nanosciences machine that has a
mercury vapor lamp wavelength of 254 nm and 185nm with an UV intensity of 14.76
mW/cm2 at 1 cm of distance from the sample was used for the measurements.
Contact angle measurements. Contact angle measurements were carried out using the
DIGIDROP-GBX® coupled with a charge-coupled device CCD Camera and a total volume of
6 µL high-purity water dropwise. Measurements were made on both sides of the drop and
were averaged. A series of three experiments were carried out for each treatment.
Infra-red spectroscopy. An FT-IR spectrometer Bruker Vertex 70 equipped with
DTGS detector and an ATR (attenuated total reflectance) germanium crystal accessory was
used for IR spectroscopy measurements. All spectra were acquired at 4 cm-1 resolution over
20 scans between a range of 4000 cm-1 and 600 cm-1.

156
Optical microscopy. White light microscopy images were captured with inverted
optical microscope Nikon Eclipse TE200 using a 40x objective lenses. Images were acquired
with Nikon Digital Camera DS-Qi1Mc (with NIS-Elements software). Pictures were
processed with ImageJ (http://rsb.info.nih.gov/ij/).
Environmental Scanning Electron Microscopy. PDMS’s surface images were obtained
by environmental scanning electron microscopy (ESEM, FEI Quanta 400) after placing the
sample in a stretching home device machine (see Methods part below).
Rheometer. The rheological studies were carried out at 25°C using a controlled-stress
rotational rheometer ThermoScientific-Haake Mars III with 35 mm diameter plate-plate
geometry. The water evaporation of the hydrogels was avoided using a cover designed as a
solvent trap. The Haake Rheowin-4 software was used for controlling the rheometer and
analyzing experimental data. Hydrogel samples for rheological measurements were prepared
by casting (pouring) the reaction mixture (described below) into a glass mold of cylindrical
shape and, after polymerization, disk-shaped samples are obtained (diameter 35 mm matching
the size of the measuring geometry, thickness c.a. 3-4 mm).
Preliminary oscillatory experiments were performed for each sample to determine the
linear regime i.e. the stress range for which the storage modulus (G’) and loss modulus (G’’)
do not depend on the applied stress (see figure S3 in supporting information). Then, the
viscoelastic behavior in the linear regime was characterized by studying the variation of G'
and G" for frequency sweeps ranging from 10 Hz to 0.01 Hz (100 rad/s to 0.1 rad/s). Creep-
recovery experiments were also performed in the linear regime to confirm if the hydrogel
adopt a viscous, an elastic or a viscoelastic behavior.
6.3.2 Methods
PAM gels preparation. Polyacrylamide gels were prepared using acrylamide,
bisacrylamide (cross-linking monomer), tetramethylethylenediamine (TEMED) and
ammonium persulfate (APS). These chemicals were all purchased from Sigma Aldrich except
for the acrylamide and used for preparation of gels. The acrylamide solution was a
commercial 40 % solution (400 g/L, 5.63 mol/L) which was diluted with ultra-pure water to
reach the desired concentration. Bisacrylamide and persulfate solutions were prepared

157
extemporaneously at concentrations of 5 g/L (0.03 mol/L) and 54 g/L (0.24 mol/L)
respectively using ultra-pure water. TEMED was used without dilution.
To prepare a polyacrylamide gel, a given volume of each reagent was successively
introduced in a container in the following order: acrylamide, bisacrylamide, TEMED and
finally the persulfate salt. The introduced volumes of reactants were always calculated to
reach final concentrations of 0.03 mol/L for TEMED and 0.01 mol/L for ammonium
persulfate. The mixture was vigorously shaken between each addition. For example, the
polymerizable mixture could contain 400 µL 20 % acrylamide solution, 33 µL bisacrylamide
solution, 1.8 µL TEMED and 25 µL ammonium persulfate solution, leading to a gel
preparation containing 2.82 mol/L acrylamide, 2.2*10-3 mol/L bisacrylamide, 0.03 mol/L
TEMED and 0.01 mol/L APS.
Preparation of PAM hydrogel covalently linked on silicone sheet. The surface of a
PDMS (3cm x 1cm x 0.2cm) was activated in the UVO machine during the desired time. The
silicone sheet was then gently transferred into a petri glass dish with the activated face up. A
10% (v/v) fresh solution of 3-(trimethoxysilyl)propylmethacrylate in acetone was added until
the silicone’s surface was fully covered. It was left at room temperature on a horizontal
agitation plate for 1h and finally rinsed with a large amount of acetone. The silicone sheet was
then dried with N2 gas and put into another petri glass dish. A solution mixture of acrylamide
(3 mL of 40wt% aqueous solution), bisacrylamide (498 µL of 5 mg/mL aqueous solution),
MilliQ-water (3 mL), TEMED (18µL) and the initiator APS (249 µL of 54 mg/mL aqueous
solution), one after the other in this order, were added covering the surface of silicone sheet.
The solution is then mixed using a pasteur’s pipette without making air bubbles. This was left
at room temperature without stirring. The polymerization reaction occurs during 12 hours.
Finally the hybrid system of silicone-hydrogel was taken out with a scalpel.
Stretching device. The homemade stretching device used for the experiments of the
PDMS surface modification with hydrogels is presented in Supporting Information. It is made
of stainless steel and it allows stretching manually the sample in uniaxial direction. Pictures
are given in figure S1 in Supporting Information (SI). The level of stretching is expressed as
the percentage of the initial length: for instance, stretch at 100% means to double the initial
length of the material.

158
6.4 Results and discussion
6.4.1 Design of the PAM hydrogel supported covalently on silicone sheet
PAM hydrogel is a polymeric network built from acrylamide and bisacrylamide
mixtures by radical polymerisation in water.21 The buildup is initiated with the radical
initiator ammonium persulfate (APS) in the presence of tetramethylethylendiamine
(TEMED): the TEMED reacts with APS to form in situ radical species which are the real
initiators of the polymerisation. To anchor a PAM hydrogel onto a silicone surface, it is
necessary to graft covalently polymerizable groups on this surface. Thus, polyacrylamide
chains can start from the surface and meet some others growing PAM chains in solution and
finally create the polyacrylamide network. The modification of the silicone sheet could be
done in two steps according to methods described in the literature. Treatment by UV-ozone
(UVO) provides a highly hydrophilic silicone surface due to the formation of silanol groups
(Scheme 6.1a). To ensure a robust bonding between the PAM hydrogel and silicone, it is
important to define the best conditions providing the higher density of hydroxyl groups
without loosing the elasticity of the oxydized silicone surface. Then, this surface can be
silanizated with 3-(trimethoxysilyl)propylmethacrylate leading to a surface covered with a
layer of polymerisable methacrylate groups. Finally, PAM hydrogel polymerisation can be
initiated on this modified silicone surface leading to a macroscopic hybrid material
constituted of a layer of PAM gel covalently linked on a layer of silicone (Scheme 6.1b) and
which can be stretched up to 100%.

159
Scheme 6.1: General overview of the synthetic approach to get a stretchable silicone-PAM
hydrogel material; (a) The silicone sheet is oxydized by using UVO treatment and then
silanized with 3-(trimethoxysilyl)propylmethacrylate; (b) The polymeric chains of the PAM
gel are covalently linked to the surface of the silicone.
First of all, we determined the optimum ratio between acrylamide and bisacrylamide
to get a PAM hydrogel that does not break when stretched up to 100%. Next, the conditions of
UVO treatment on the silicone were optimized providing a high density of hydroxyl groups
without formation of a silicium oxide layer which would crack under stretching. Introduction
of methacrylate groups on the silicone substrate was done through silanization. Next, the
PAM gel is formed on the functionalized silicon surface.
6.4.2 Elastomeric PAM preparation
Before preparing PAM covalently anchored on functionalized silicone sheets we first
determined the optimum acrylamide/bis-acrylamide ratio and concentration in order to obtain
a handable and least fragile hydrogel. Because the hydrogels could not be inserted into jaws
without breaking, we could not perform ultimate tensile strain measurements. We thus relied
on a qualitative determination to evaluate if the gels are fragile or stretchable. This was done
by stretching them by hand and appreciating the ultimate tensile strain. We kept the
proportion of TEMED and APS constant and equal to 0.03 mol/L for TEMED and 0.01 mol/L
for ammonium persulfate. Table 6.1 summarizes the obtained results.
Silicone
PAM hydrogel The PAM network is covalently anchored onto the silicone
Silicone
UVO
a.
b.
Silanization

160
[A+B](g/100mL) A/B=60 A/B=1000 A/B=5000
5 1.1 kPa Fragile
(n.d.) Cannot be handled
(n.d.) Cannot be handled
10 16.5 kPa Fragile
0.7 kPa Fragile
(n.d.) Fragile
15 17.5 kPaFragile
2.8 kPa Fragile
(n.d.) Fragile
20 17.5 kPa Fragile
5.7 kPa Stretchable 150%
(n.d.) Fragile
40 (n.d.) Fragile
50.9 kPa Stretchable 80%
5.6 kPa Stretchable 80%
Table 6.1: Summary of the results of the qualitative tests and the Young moduli E determined
of the investigated gels from the storage modulus G' when f0. (n.d.) represent systems for
which G' depended upon f at small value of f so that the relation between G' and E could not
be used. We varied the acrylamide (A) and bisacrylamide (B) concentrations as well as their
ratio. Upper line corresponds to the Young modulus determined by dynamic rheology. By
fragile we mean that rapid rupture occurs after stretching by less than a few percent. When
stretchable, we give the ultimate tensile strain that is roughly estimated from experiments
made by hand.
We performed rheological characterizations of several series of hydrogels prepared at
different acrylamide/bisacrylamide ratio (A/B = 60, 1000, 5000) and different
acrylamide+bisacrylamide concentrations (5, 10, 15, 20 and 40 wt%). Dynamic rheological
properties (storage moduli (G’), loss moduli (G’’)) were studied through oscillation
experiments as a function of frequency, and additional information was gained from creep-
recovery experiments. Furthermore, the Young moduli were determined from the value of G'
extrapolated at f0 (hydrodynamic regime) by using the relation E=3.G'. The raw data from
which the Young moduli were determined are given in supporting information S2. The values
of the Young moduli are given in table 6.1 when determined.
All the hydrogels prepared at the highest bisacrylamide content (A/B = 60) and at
different concentrations (5, 10, 15, 20 wt%) exhibit somewhat similar rheological behaviors.
As an example figure S2 shows the results obtained for the 15 wt% hydrogel. It can be
observed that: (i) the elastic modulus G' is much higher than the viscous modulus G" over the
entire range of oscillation frequency; (ii) G' does not depend on the oscillation frequency;
(iii) G" is also almost independent of frequency. In addition, the phase difference between
stress and strain is very low, < 3°, i.e. tan is close to 0 (data not shown). All these features

161
correspond to a nearly-perfect elastic material. This is confirmed by the creep-recovery
analysis (figure S2) as shown by the very fast and constant deformation under the applied
stress and the almost instantaneous and complete recovery when stress is removed. Such
elastic properties are expected for macromolecular systems sufficiently cross-linked. The
drawback of these strong gels is their low mechanical resistance leading to a rapid rupture
after stretching by less than a few percent. We also obtained a Young moduli which increased
in function of the [acrylamide + bisacrylamide] concentration from 1.1 kPa to 17.5 kPa for
samples ranging from 5 – 20 wt% (table 6.1).
Conversely, the hydrogels prepared at the lowest bisacrylamide content (A/B = 5000)
i.e. with a low cross-linking level exhibit poor elastic properties except when the
concentration is high (40 wt%). In contrast with the previous case: (i) both G' and G" vary
more or less as a function of frequency, depending on the polymer concentration; (ii) G' is
higher than G" only for hydrogels with the highest concentrations (20-40 wt%) whilst the
behavior is dominated by the viscous properties for the lowest concentration (10 wt%).
Except for the 40 wt% hydrogel with good stretching properties, the other samples of this
series are clearly insufficiently chemically cross-linked and behave rather as polymer
solutions. Therefore, the Young moduli was determinated only for the sample of 40 wt%
which is 5.6 kPa (table 6.1).
For the hydrogels prepared at the intermediate bisacrylamide content (A/B = 1000),
the main rheological characteristic are the following (only data for 20 wt% are given as an
example in figure S2): (i) the elastic modulus G' is always higher than the viscous modulus
G" over the entire range of oscillation frequency; (ii) G' does not depend on the oscillation
frequency (for 20 and 40 wt%) or vary slightly (for 10 and 15 wt); (iii) G" increases with the
frequency for all the concentration. In comparison with the first case (A/B = 60), the
viscoelastic behavior is therefore characterized by a lowered elasticity and an enhanced
viscous character. This is more apparent by looking at the values of the phase difference at
low frequencies that are much higher for A/B = 1000 ( ≈ 6-30°, i.e. tan ≈ 0.1-0.6, data not
shown) than for A/B = 60. The creep-recovery experiments confirm that the hydrogels of the
A/B = 1000 series are less strong (figure S2). These gels which are less fragile and withstand
higher stretching (for concentration ≥ 20 wt%) appear both as viscous and elastic. The
Young’s moduli were determined with values of 0.7 kPa to 50.9 kPa from a [acrylamide +
bisacrylamide] concentration ranging from 10 - 40 wt% respectively (see table 6.1).
Because mechanoresponsive materials should be obtained by grafting
mechanosensitive molecules into these gels, it is of interest to use gels with the highest

162
possible Young moduli that remain stretchable. From the above rheological data, it comes out
that the best compromise corresponds to the hydrogel with an [acrylamide + bisacrylamide]
concentration of 20g/100mL and an acrylamide/bisacrylamide concentration ratio of 1000.
This gel was stretchable up to 150%. Then, this hydrogel formulation was selected for the rest
of the study. Yet under this form i.e. non-supported, the gel could not be inserted into
mechanical devices for further experiments. This led us to the development of gels supported
by a silicone elastomer.
6.4.3 Silicone sheet modifications
Following our strategy described above, the preparation of the PAM hydrogel
covalently linked onto the silicone requires the introduction of methacrylate groups on the
surface of a silicone sheet. We used a filler-free PDMS purchased from SMI. Various
approaches can be used to modify the silicone but in almost all of them, the first step is a
surface oxidation allowing the introduction of hydroxyl groups through silanol formation.
Among all the chemical or physical methods described to do that22, the oxygen plasma
treatment is the most widely used method to oxidize the surface of PDMS.23 Highly
hydrophilic surfaces can be obtained but concomitantly one observes the formation of a thin
layer of silicium oxide. This thin glass-like layer is brittle and thus not suitable to design a
mechanotransductive substrate. Techniques using ultraviolet (UV) is another way extensively
used to render hydrophilic the PDMS surface. In particular, using UV light in combination
with ozone (UVO) allows a hydroxylation of silicone surfaces similar to those obtained with
an oxygen plasma treatment. Despite the fact that this method is considerably slower (from
few minutes to one or two hours) than the use of plasma (from few seconds to few minutes)24,
this difference can be advantageously used. It allows to vary the time of UVO exposition to
find the optimum time allowing to both oxidize the silicone surface and to avoid the formation
of glass silicium oxide.25 Designing a mechanotransductive PAM gel requires to avoiding this
silica-like layer in order to avoid cracks under stretching. PAM hydrogel linked onto these
parts of cracked layer would not homogeneously respond when undergoing the mechanical
tension.
First, we studied the influence of exposition time of PDMS under UVO on the
formation of silanol group and the presence of cracks. Figure 6.1a shows the evolution of
water contact angles of silicone sheets treated by UVO for increasing times.

163
Figure 6.1: Evolution of the contact angle of water (a) on silicone SMI and exposed to UVO
treatment at different time. All the contact angle measurements have been done directly after
UVO oxidation. Error bars correspond to at least three measurements realized on various
areas of the silicone surface; (b) Images of water droplet on SMI untreated by UVO and
treated during 45, 75, 105 and 120 minutes. The number on the top of each droplet indicates
the contact angle calculated.
The contact angle measurements have been done starting with an untreated silicone
sheet after every 15 minutes of UVO treatment, up to 120 minutes. From a highly
hydrophobic surface (contact angle of 99°), one observes a roughly linear decrease of the
contact angle up to 8-10° after two hours of UVO treatment (see also figure 6.1b). The surface
becomes more and more hydrophilic with the increase of the exposition time to UVO.
Time (min)
0 20 40 60 80 100 120 140
Mea
n C
onta
ct A
ngle
(°)
0
20
40
60
80
100
120
a.
b.
67° 40° 18° 10° 99°
0 min 45 min 75 min 105 min 120 min

164
Figure 6.2: (a) Overlapping of the FTIR-ATR spectra of the silicon surface (SMI) at different
time of UVO exposition; (b) Increasing of the band intensity localized at 3300 cm-1 with the
UVO exposition time going from 0 to 120 min; (c) Decreasing of the band intensity localized
at 1260 cm-1 with the UVO exposition time going from 0 to 120 min; (d) Evolution of the
normalized IR vibration bands localized at 3300, 1725 and 900 cm-1; (e) Evolution of the
normalized vibration bands localized at 2963, 1260 and 1010 cm-1.
The origin of this increasing hydrophilic feature with the exposition time of UVO can
be explained by doing FTIR-ATR measurements of the treated silicone surface. A complete
study about the UVO treatment on PDMS substrates monitored by several techniques of
analysis, in particular FTIR-ATR, has been reported by Genzer and collaborators.24 In
agreement with their work, the monitoring of the FTIR-ATR spectra at different time of UVO
exposition show the formation of polar groups, such as hydroxyl and carbonyl derivatives. In
figures 6.2a, 6.2b and 6.2c is presented the overlapping of all the IR spectra measured on
UVO time (min)
0 20 40 60 80 100 120
No
rmal
ized
abs
orba
nce
(u
. a.
)
0.0
0.2
0.4
0.6
0.8
1.0
1.2
CO peak (1725 cm-1)OH peak (3300 cm-1) Si-OH peak (900 cm-1)
Frequency (cm-2)
300032003400360038004000
Abs
orba
nce
(u. a
)
0.00
0.01
0.02
0.03
no UVO15 min UVO30 min UVO45 min UVO60 min UVO75 min UVO120 min UVO
3300 -OH
Frequency (cm-2)
12201240126012801300
Abs
orba
nce
(u. a
)
0.0
0.1
0.2
0.3
0.4
0.5
no UVO15 min UVO30 min UVO45 min UVO1h UVO1h15 UVO2h UVO
1260 cm-1 -CH3
Frequency (cm-2)
1000200030004000
Abs
orba
nce
(u. a
)0.0
0.2
0.4
0.6
0.8
1.0
1.2
no UVO15 min UVO30 min UVO45 min UVO60 min UVO75 min UVO120 UVO
a.
b. c.
d.
UVO time (min)
0 20 40 60 80 100 120
Nor
mal
ized
abs
orb
ance
(u.
a.)
0.5
0.6
0.7
0.8
0.9
1.0
1.1
CH3 peak (2963 cm-1) CH3 peak (1260 cm-1) Si-O-Si peak (1010 cm-1)
e.

165
silicone sheets at different exposition time of UVO: 15, 30, 45, 60, 75 and 120 minutes. As
expected, a large band at 3300 cm-1 is growing with increasing the exposition time of UVO
(figure 6.2b). The evolution of the normalized absorbance of this band is represented in figure
6.2d. This vibration band is assigned to the stretching band of the OH bond, probably due to
the formation of the silanol groups. At the same time, one can observe a decrease in the
intensities of characteristic bands of the –CH3 such as 1200 cm-1 corresponding to the
symmetric deformation band of the C-H bond (figure 6.2c), 2960 and 1010 cm-1 (see figure
6.2e) corresponding to the asymmetric CH3 vibrations. Overlapping of FTIR spectra of all
these vibration bands are given in figures S4 to S6. In figure 6.2d is also shown the evolution
of the normalized absorbance of bands at 1725 cm-1 and 900 cm-1. These bands are attributed
to a vibration band of the carbonyl groups and to the stretching vibration of Si-O in silanol
groups, respectively. Both of them display an increasing intensity of their band with the time
of UVO exposition, indicating the formation of hydroxyl, aldehyde or carboxylic groups
during the reaction of oxidation. However, between 60 and 120 minutes of UVO exposition,
the normalized absorbance band intensity at 1725 cm-1 decrease slightly, meaning that a small
proportion of carbonyl groups disappears, probably due to CO or CO2 formation. Therefore,
according to the results obtained by contact angle measurements and FTIR studies, we can
conclude that the more the silicone sheet is exposed to UVO the more its surface has an
hydrophilic feature due to hydroxyl groups formation.
It must be emphasized that this behaviour is very general but the exact time needed to
reach a contact angle of 8-10° or the time evolution of the silanol groups depend upon the UV
radiation intensity and the distance of the silicone surface from the UV source. Moreover, it is
well known that the hydrophilic feature on these PDMS surfaces is temporary: after an
oxidation treatment, the surface recovers its hydrophobicity with time due to the migration of
short and uncrosslinked PDMS chains from the bulk to the surface.25-27 Therefore, the FTIR-
ATR measurements and the silanization process were done immediately after UVO treatment.
Before proceeding to the silanization step, we stretched the oxidized silicone sheet up
to 100% of its initial length. We considered this level of stretching suitable to detect
mechanotransductive effects. The silicone is stretched in only one (longitudinal) direction and
observed by scanning electron microscopy (SEM). Our goal is to detect the eventually silica-
like layer formed during the UVO treatment: when this layer is stretched, cracks must appear
on the silicone surface. It must be noted that in some cases, the observation of very large
crack formation can also be done with an optical microscope.

166
Figure 6.3: (a) Series of SEM images of silicone surfaces exposed to 105 minutes of UVO at
rest and stretched at 20%, 40%, 50% and 80%. The white bar scale indicates 200µm; (b)
Diagram showing the presence (red area) or absence (blue area) of cracks observed on
silicone surface SMI exposed to a given UVO time and after stretching at a given level.
The use of SEM allows discerning the cracks at the microscopic size. We analysed
several SEM images (1 x 1 mm2) of silicone sheets exposed to various UVO treatment time
up to 120 minutes. A series of SEM images of silicone sheet exposed to UVO during 105
minutes and stretched at 20%, 40%, 50% 80% are shown as a characteristic example in figure
6.3a. In this case, appearance of cracks occurred after 50% of stretching. Stretching at higher
stretching degrees than 50% of the initial length of the silicone sheet led to more cracks
formation, as expected. We did not stretch higher than 100% because it happened sometimes
at this level of stretching that the silicone sheet ruptured at the crawbars. Gathering all our
SEM observations of the silicones exposed at different time of UVO, we established the
Cracks
No cracks
b.
Longitudinal direction of stretching
At rest 20% 40% 50% 80%
200µm
a.

167
diagram shown in figure 6.3b. Two distinct areas in the diagram appear clearly: a blue one
where no cracks can be observed by SEM for a given UVO time and after a given stretching
degree and a pink one where crack formation occurs. These two areas are separated by almost
a straight red line. Below 50 minutes of UVO, we did not observe any cracks on exposed
silicone for stretching degrees up to 100%. For exposition times higher than 50 minutes,
cracks form at a critical stretching degree and this critical stretching degree decreases with the
UV exposition time. This means that formation of the silica-like layer is mainly formed after
50 minutes of exposition time. It must be noted that the silicone sheets do not crack after one
stretching process, they can be submitted to at least three stretching/unstretching cycles at the
same stretching degree without showing any crack formation. More than three
stretching/unstretching cycles were not tested.
6.5 Silanization and PAM hydrogel formation
Immediately after the UVO treatment, the freshly oxidized silicone sheet is fully
immersed into a 10% solution of 3-(trimethoxysilyl)propylmethacrylate in acetone during one
hour. Then, the silanized silicone is brought in contact with an aqueous solution containing
acrylamide (A) and bisacrylamide (B) at a molar ratio of A/B=1000 and a concentration of
A+B=20 g/100mL, TEMED and the initiator APS. Twelve hours after the addition of the
radical initiator, the hybrid system of PAM hydrogel on silicone sheet is formed. We observed
that when performing the reaction on a silicone substrate treated by UVO and silanization, the
gel that form strongly adheres to the substrate (see figure 6.4a). When the same reaction is
performed on a non-treated silicone the gel forms but it can easily be removed from the
substrate showing that it is not covalently attached. Thickness of the PAM hydrogel does not
seem to be a limiting parameter for the buildup of this system: by adding more solution of the
acrylamide and bisacrylamide we obtained a grafted gel having 2 cm of thickness. By
stretching this system with a home-made device (figure 6.4b et 6.4c), it was possible to reach
100% of stretching without the formation of cracks or the breaking of the gel or the silicone.
The gel remained anchored on the silicone, even after five cycles of stretching/unstretching
cycles between 0 and 100%. This system can be dried when standing 12 hours under a
fumehood: the resulting gel become a glass-like material and strongly shrinks on itself (see
figure S7). Rehydratation in deionized water allows returning to the initial size and the
integrity of the system is not affected. When the silicone-PAM system is immersed in water,
the gel swells up and the maximum mass of water included in the gel has been measured to be
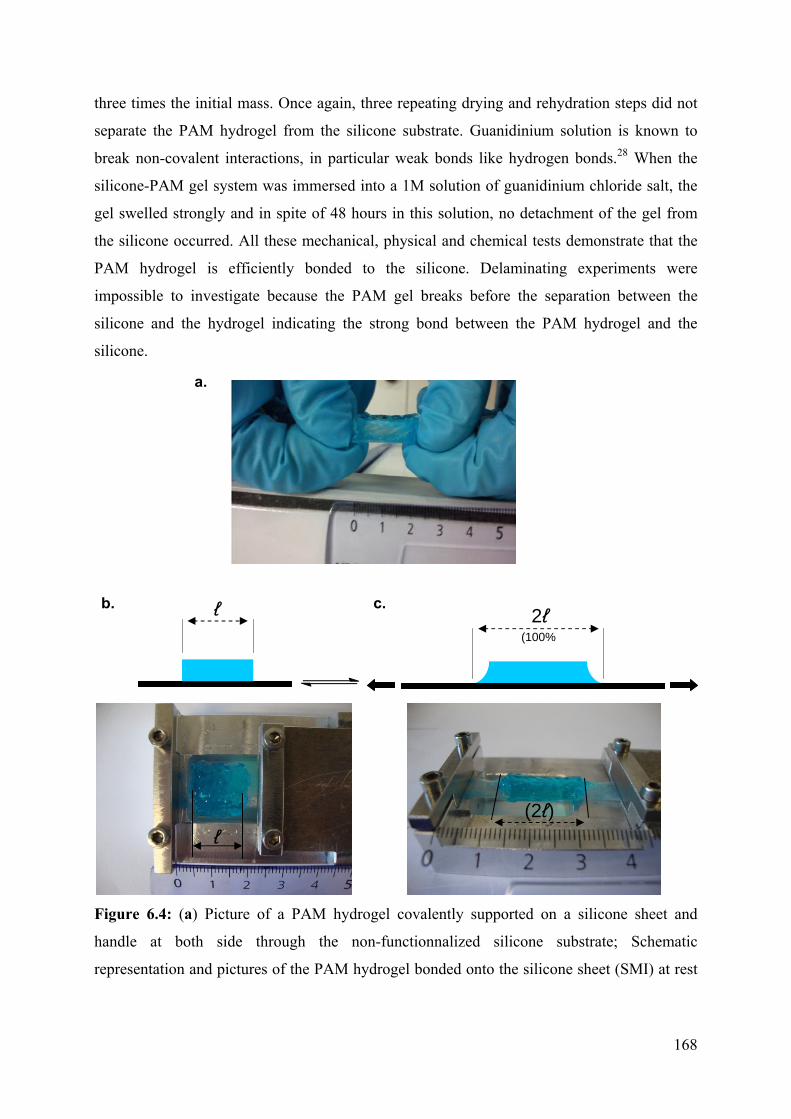
168
three times the initial mass. Once again, three repeating drying and rehydration steps did not
separate the PAM hydrogel from the silicone substrate. Guanidinium solution is known to
break non-covalent interactions, in particular weak bonds like hydrogen bonds.28 When the
silicone-PAM gel system was immersed into a 1M solution of guanidinium chloride salt, the
gel swelled strongly and in spite of 48 hours in this solution, no detachment of the gel from
the silicone occurred. All these mechanical, physical and chemical tests demonstrate that the
PAM hydrogel is efficiently bonded to the silicone. Delaminating experiments were
impossible to investigate because the PAM gel breaks before the separation between the
silicone and the hydrogel indicating the strong bond between the PAM hydrogel and the
silicone.
Figure 6.4: (a) Picture of a PAM hydrogel covalently supported on a silicone sheet and
handle at both side through the non-functionnalized silicone substrate; Schematic
representation and pictures of the PAM hydrogel bonded onto the silicone sheet (SMI) at rest
ℓ (2ℓ)
ℓ 2ℓ (100%
b. c.
a.

169
(b) and under (c) 100% stretch. To be visible, the PAM hydrogel has been coloured with
several drops of 10 µl 1% methylene blue solutions.
6.6 Conclusion
Covalent grafting of polymers on silicone surface leading to thin film or brushes has
been abundantly reported in the literature. Herein, we described the first preparation of a
hybrid system constituted of a macroscopic-sized PAM hydrogel strongly supported onto a
modified silicone substrate through covalent bonds. This bilayered system represents an
original alternative in the development of new mechanosensitive material. Indeed, the need to
design smart materials where the communication (catalysis, recognition, releasing, etc) with
their surrounding environment can be controlled by stretching is of high interest. The
approach proposed in this work allows the easy handling and stretching of the PAM hydrogel
through the fixation of silicone into an adapted stretching device. Despite many cycles of
releasing and stretching at 100%, drying and rehydrating, the PAM hydrogel stays fully
bonded to the silicone surface. We believed that this idea can be helpful for the community
working in smart material design.
6.7 References
(1) Yoshida, M.; Lahann, J. Smart Nanomaterials ACS Nano 2008, 2, 1101-1107.
(2) Ionov, L.; Houbenov, N.; Sidorenko, A.; Stamm, M.; Luzinov, I.; Minko, S. Inverse and
Reversible Switching Gradient Surfaces from Mixed Polyelectrolyte Brushes Langmuir 2004,
20, 9916-9919.
(3) Burke, S. E.; Barrett, C. J. pH-Dependent Loading and Release Behavior of Small
Hydrophilic Molecules in Weak Polyelectrolyte Multilayer Films Macromolecules 2004, 37,
5375-5384.
(4) Motornov, M.; Sheparovych, R.; Lupitskyy, R.; MacWilliams, E.; Minko, S.
Superhydrophobic surfaces generated from water-borne dispersions of hierarchically
assembled nanoparticles coated with a reversibly switchable shell Adv. Mater. 2008, 20, 200-
205.
(5) Fulghum, T. M.; Estillore, N. C.; Vo, C.-D.; Armes, S. P.; Advincula, R. C. Stimuli-
Responsive Polymer Ultrathin Films with a Binary Architecture: Combined Layer-by-Layer
Polyelectrolyte and Surface-Initiated Polymerization Approach Macromolecules 2008, 41,
429-435.
170
(6) Wu, L.; Tuo, X.; Cheng, H.; Chen, Z.; Wang, X. Synthesis, Photoresponsive Behavior,
and Self-Assembly of Poly(acrylic acid)-Based Azo Polyelectrolytes Macromolecules 2001,
34, 8005-8013.
(7) Zakrevskyy, Y.; Richter, M.; Zakrevska, S.; Lomadze, N.; von, K. R.; Santer, S. Stimuli-
Responsive Materials: Light-Controlled Reversible Manipulation of Microgel Particle Size
Using Azobenzene-Containing Surfactant Adv. Funct. Mater. 2012, 22, 5064.
(8) Bajpai, A. K.; Shukla, S. K.; Bhanu, S.; Kankane, S. Responsive polymers in controlled
drug delivery Progress in Polymer Science 2008, 33, 1088-1118.
(9) Bawa, P.; Pillay, V.; Choonara, Y. E.; du, T. L. C. Stimuli-responsive polymers and their
applications in drug delivery Biomed. Mater. 2009, 4, 1-15.
(10) Stuart, M. A. C.; Huck, W. T. S.; Genzer, J.; Muller, M.; Ober, C.; Stamm, M.;
Sukhorukov, G. B.; Szleifer, I.; Tsukruk, V. V.; Urban, M.; Winnik, F.; Zauscher, S.;
Luzinov, I.; Minko, S. Emerging applications of stimuli-responsive polymer materials Nature
Materials 2010, 9, 101-113.
(11) Dipak, K. S., Smart Elastomers. In Current Topics in Elastomers Research, CRC Press:
2008.
(12) Weder, C. Mechanoresponsive Materials J. Mater. Chem. 2011, 21, 8235-8236.
(13) Black, A. L.; Lenhardt, J. M.; Craig, S. L. From molecular mechanochemistry to stress-
responsive materials J. Mater. Chem. 2011, 21, 1655-1663.
(14) Davis, D. A.; Hamilton, A.; Yang, J.; Cremar, L. D.; Van, G. D.; Potisek, S. L.; Ong, M.
T.; Braun, P. V.; Martinez, T. J.; White, S. R.; Moore, J. S.; Sottos, N. R. Force-induced
activation of covalent bonds in mechanoresponsive polymeric materials Nature 2009, 459, 68-
72.
(15) Lenhardt, J. M.; Black, A. L.; Beiermann, B. A.; Steinberg, B. D.; Rahman, F.;
Samborski, T.; Elsakr, J.; Moore, J. S.; Sottos, N. R.; Craig, S. L. Characterizing the
mechanochemically active domains in gem-dihalocyclopropanated polybutadiene under
compression and tension Journal of Materials Chemistry 2011, 21, 8454-8459.
(16) Crenshaw, B. R.; Weder, C. Deformation-Induced Color Changes in Melt-Processed
Photoluminescent Polymer Blends Chemistry of Materials 2003, 15, 4717-4724.
(17) Sagara, Y.; Kato, T. Mechanically induced luminescence changes in molecular
assemblies Nat. Chem. 2009, 1, 605-610.
(18) Peppas, N. A.; Slaughter, B. V.; Kanzelberger, M. A., 9.20 - Hydrogels. In Polymer
Science: A Comprehensive Reference, Elsevier: Amsterdam, 2012; pp 385-395.

171
(19) Bruns, N.; Pustelny, K.; Bergeron, L. M.; Whitehead, T. A.; Clark, D. S. Mechanical
Nanosensor Based on FRET within a Thermosome: Damage-Reporting Polymeric Materials
Angewandte Chemie-International Edition 2009, 48, 5666-5669.
(20) Hoare, T. R.; Kohane, D. S. Hydrogels in drug delivery: Progress and challenges
Polymer 2008, 49, 1993-2007.
(21) Tanaka, T. Gels Scientific American 1981, 244, 124-138.
(22) Zhou, J.; Ellis, A. V.; Voelcker, N. H. Recent developments in PDMS surface
modification for microfluidic devices Electrophoresis 2010, 31, 2-16.
(23) Vickers, J. A.; Caulum, M. M.; Henry, C. S. Generation of Hydrophilic
Poly(dimethylsiloxane) for High-Performance Microchip Electrophoresis Analytical
Chemistry 2006, 78, 7446-7452.
(24) Efimenko, K.; Wallace, W. E.; Genzer, J. Surface Modification of Sylgard-184
Poly(dimethyl siloxane) Networks by Ultraviolet and Ultraviolet/Ozone Treatment Journal of
Colloid and Interface Science 2002, 254, 306-315.
(25) Berdichevsky, Y.; Khandurina, J.; Guttman, A. s.; Lo, Y. H. UV/ozone modification of
poly(dimethylsiloxane) microfluidic channels Sensors and Actuators B: Chemical 2004, 97,
402-408.
(26) Hillborg, H.; Gedde, U. W. Hydrophobicity recovery of polydimethylsiloxane after
exposure to corona discharges Polymer 1998, 39, 1991-1998.
(27) Hillborg, H.; Ankner, J. F.; Gedde, U. W.; Smith, G. D.; Yasuda, H. K.; Wikstrom, K.
Crosslinked polydimethylsiloxane exposed to oxygen plasma studied by neutron
reflectometry and other surface specific techniques Polymer 2000, 41, 6851-6863.
(28) Yang, J. Y.; Xu, C. Y.; Wang, C.; Kopecek, J. Refolding hydrogels self-assembled from
N-(2-hydroxypropyl)methacrylamide graft copolymers by antiparallel coiled-coil formation
Biomacromolecules 2006, 7, 1187-1195.

172
6.8 Supporting Information
Figure S1: Lateral view (a) and top (b) view of the home-made device used for the stretching
of the silicone sheet exposed to UVO and the hybrid system silicone-hydrogel. The complete
device, made in stainless metal, is equipped with two metal grips allowing “to pinch” strongly
the silicone for stretching experiments. A millimeter gauge is used to stretch the desired level.
a. b. micrometer gauge
Metal grips

173
Figure S2: (a) Storage moduli (G’, red) and loss moduli (G’’, blue) of PAM hydrogels as a
function of angular frequency going from 0 to 10 Hz. Dot points and triangles correspond to
the PAM gel prepared from a solution of A/B=60, A+B=15g/100mL and A/B=1000,
A+B=20g/100mL respectively; (b) Creep recovery measurements of the two PAM gel
prepared from a solution of A/B=60, A+B= 15g/100mL (left) and A/B=1000, A+B=
20g/100mL (right).
a.
ω (rad/s)
b. Ratio A/B = 60, A+B = 15 g/100mL
Time (s)
0 100 200 300 400 500 600 700
J (1
/Pa)
0.0
2.0e-5
4.0e-5
6.0e-5
8.0e-5
1.0e-4
1.2e-4
1.4e-4
1.6e-4
1.8e-4 Ratio A/B = 1000, A+B = 20 g/100mL
Time (s)
0 50 100 150 200 250 300 350
J (1
/Pa)
0.0000
0.0002
0.0004
0.0006
0.0008
0.0010
0.0012
0.0014
0.0016
f (Hz)0.01 0.1 1 10
G',
G''
(Pa
)
10
100
1000
10000

174
Figure S3: G’ (red) and G’’ (blues) values as function of an applied force (Pa), at 3 fixed
angular frequencies (0.1, 1 and 10 Hz). Dot points, triangles and upside down triangle
correspond to the PAM gel prepared from a solution of A/B=60, A+B=15g/100mL and
A/B=1000, A+B=20g/100mL respectively. We observed a linear regime allowing to do the
creep recovery experiment for the two selected PAM hydrogel (see figure S2).

175
Frequency (cm-2)
150016001700180019002000
Abs
orba
nce
(u. a
)
0.000
0.005
0.010
0.015
0.020untreated15 min UVO30 min UVO45 min UVO60min UVO75 min UVO120 min UVO
Figure S4: FTIR evolution of the absorbance vibration band observed at 1725 cm-1 on
silicone SMI at various exposition timess of UVO: 15, 30, 45, 60, 75, 120 minutes.
1725

176
Figure S5: FTIR evolution of the absorbance vibration band observed at 900 cm-1 on silicone
SMI at various exposition times of UVO: 15, 30, 45, 60, 75, 120 minutes.
Frequency (cm-2)
860880900920940
Ab
sorb
ance
(u
. a)
0.00
0.05
0.10
0.15
0.20
0.25untreated15 min UVO30 min UVO45 min UVO60 min UVO75 min UVO120 min UVO
900 cm-1
-SiOH
900 cm-1

177
Frequency (cm-2)
2800285029002950300030503100
Abs
orba
nce
(u. a
)
0,00
0,02
0,04
0,06
0,08
0,10untreated15 min UVO30 min UVO45 min UVO60 min UVO75 min UVO120 min UVO
295629582960296229642966296829700,05
0,06
0,07
0,08
0,09
0,10
as(CH3) as(CH3)
Figure S6: FTIR evolution of the absorbance vibration band observed at 2960 cm-1 on
silicone SMI at various exposition times of UVO: 15, 30, 45, 60, 75, 120 minutes.
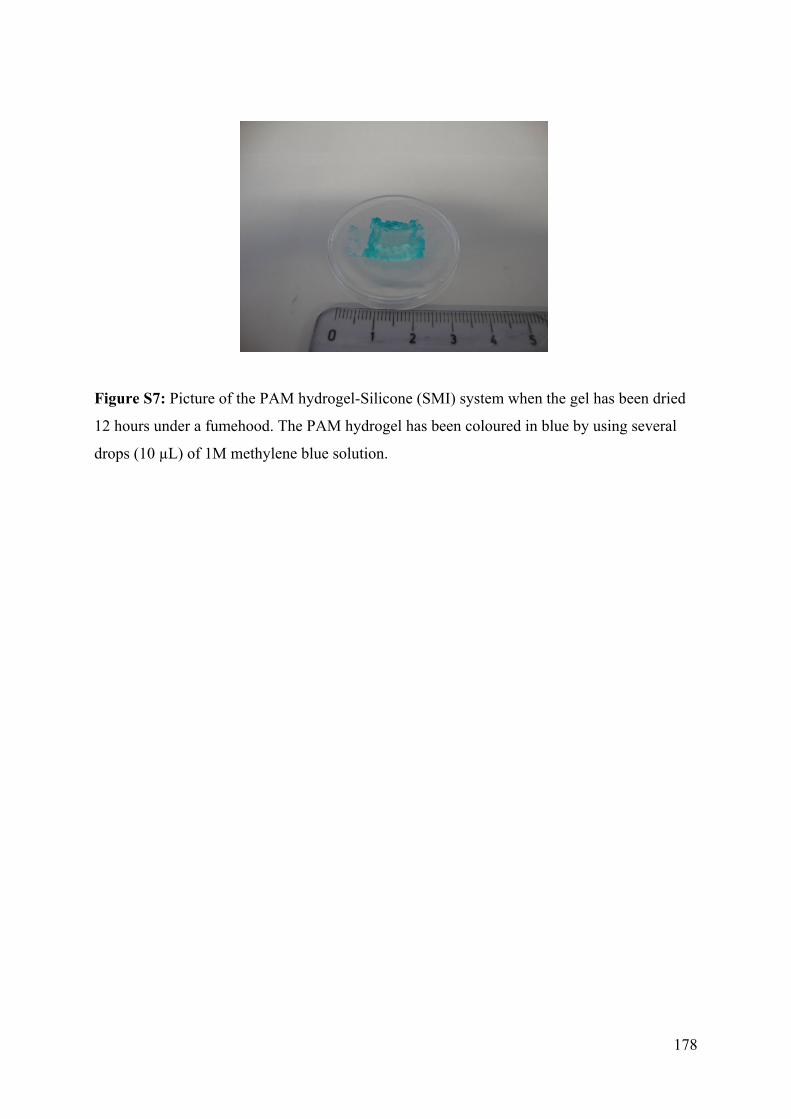
178
Figure S7: Picture of the PAM hydrogel-Silicone (SMI) system when the gel has been dried
12 hours under a fumehood. The PAM hydrogel has been coloured in blue by using several
drops (10 µL) of 1M methylene blue solution.

179
Conclusion
The goal of my thesis was to develop new routes to design chemo-mechano-
responsive materials, materials that respond chemically to a mechanical stress. In the past, my
host group had already developed several strategies to achieve this goal, yet the designed
systems are often difficult to implement or to generalize.
In the case of my work, the mechanical stress is provided by stretching the material.
More precisely I was looking for materials that are inert at rest and which induce chemical
reactions or trigger specific adsorption when stretched. Moreover, we were looking for
systems that are reversible during stretching/unstretching cycles.
All the systems designed during my PhD thesis were based on functionalization of
silicone sheets. Silicones have the great advantage to be elastic and transparent, two essential
properties that are used to develop chemo-mechano-responsive materials, but they are also
chemically difficult to modify. We decided to build on silicone sheets. Three different
strategies were followed.
1) The first strategy is to create cryptic site surfaces by embedding ligands into
PEG brushes. In order to achieve this goal we first had to chemically modify the silicone
surface. This was done by UV-Ozone (UVO) treatment of the surface followed by silanization
to anchor chemically active thiol groups onto the silicone substrate. The difficulty that we had
to overcome was to chemically modify the silicone substrate with enough thiol groups in such
a way that it does not break under stretching. The formation of cracks due to stretching is
usually the case with most of the silicone surface treatments. We established an empiric and
useful diagram showing the appearance of cracks according to the level of stretching and the
exposition time of UVO. The modification of the silicone surface was monitored by IR,
contact angle measurements and electronic microscopy. We achieved the design of a cryptic
site surface by embedding biotin moieties into a PEG brush. This system was mildly
interacting with Streptavidin at rest and more strongly interacting when stretched. Yet we
could not succeed to create a reversible system meaning that by returning to the non-stretched
state the Streptavidin remained anchored on the surface. For comparison, by using the
polymer plasma technique to modify the silicone surface and the same model system
(Biotin/PEG brusches/Streptavidin), Bacharouche at al. succeed to get a reversible behaviour
of the surface. Finally, it must be noted that one major difficulty encountered in this approach

180
lies in the fact that one cannot measure the density of grafted groups on the surface nor of
active groups after UVO treatment. This renders difficult the progress and the improvement of
this system.
2) We then developed a strategy based on the covalent anchoring of enzymes into
gels with the idea that, by stretching the gel, the enzymes change conformation due to applied
mechanical forces and that these conformation changes alter their enzymatic activity. We used
cross-linked (poly-l-lysine/hyaluronic acid) multilayers as gel. We incorporated in this film -
galactosidase that was covalently coupled to the gel. The film was deposited on a silicone
sheet. We succeeded in modulating the enzyme activity in the film under stretching and this
system appears as partially reversible under stretching/unstretching cycles. This work
represents the first reported system where enzymatic activity can be modulated by
stretching due to modulation of the enzyme conformation. Yet the system should still be
improved. As for the cryptic site systems discussed above, one of the difficulty of this study
was that we could neither directly characterize the covalent coupling degree of the enzyme to
the film nor could we prove the enzymatic conformation change. This later issue still
represents a real challenge for the future in surface science. Moreover, the development of
these systems also requires a better characterization of these films under stretching at a
nanometer scale. This will require the development of molecules that act as mechanophores
and that are sensitive to a large range of stresses that are internal to the gel.
3) We made also use of the silicone functionalization by UVO to design a mixed
system consisting of a silicone sheet onto which is covalently attached a polyacrylamide
hydrogel with the goal to create a stretchable gel into which one can covalently fix enzymes.
These enzymes can thus be put under mechanical stress. We succeeded in creating a system
that can be stretched up to 150% without detachment of the gel from the silicone and without
inducing cracks in the gel. This is, to our knowledge the first mixed silicone/hydrogel system
reported so far. Our idea was first to incorporate into the gel mechanophores such as
bispyrene molecules that change their absorption spectrum when undergoing a change from a
staked to an extended conformation. Yet, after incorporation of these molecules in the gel,
even at rest of the gel, the molecules were in the extended conformation so that no stretching
effect could be envisioned any more. Other mechanophore systems could be envisioned in the
future.

181
We nevertheless could make use of the bispyrene compounds as pH sensor in
morphogen driven polyelectrolyte film constructions. This result was published in Soft
Matter.
Perspectives
The development of chemo-mechano-responsive systems is in its infancy and is
intimately related to that of mechano-chemistry. Up to now, mechanical forces are absent
from chemistry and designing molecules or systems that induce chemical reactions under the
application of a force represents a real challenge. But, why addressing this challenge? Biology
offers an answer to this question. First biology was devoted to classify living species. Later
emerged cell biology where it was shown that evolved living organisms are organized in cells.
Then chemistry came into play where one tried to explain the cellular mechanisms entirely by
chemistry. Now one discovers that chemical signals are not the only player of the biological
game but that mechanical forces are also crucial for cell development and adaptation. This
requires that cells convert mechanical information into chemical output and nature developed
a whole bench of strategies for this purpose. What this shows is that mechanical forces are an
integral part of adaptative systems. Over the last years, physical and chemical science has
evolved from the understanding and from the engineering of "simple" systems towards the
development of complex systems, one ultimate goal being to be able to create self-replicating,
self-organizing and self-adapting systems. Mechano-chemistry will play a major role in this
evolution and the systems that we are starting to develop constitute the embryos of this
evolution. But there is still a long way to go.

182
Annex 1
Preparation of Bispyrene 2 from the intermediate 4
The description of the synthesis of the intermediate 4 is already reported in the part 3.6
of chapter 3 (supporting information).
1. Preparation of the oligoethylene glycol derivative 8
Procedure inspired from literature1: To a solution of 200 mg (1.51 mmol) of di(ethylene
glycol) vinyl ether in 0.3 mL triethylamine under argon was added 298 mg (1.56 mmol, 1.03
eq) of p-toluenesulfonyl chloride in 0.25 mL dry CH2Cl2 over 5 min. The reaction mixture
was stirred for 18 hours and 10 mL CH2Cl2 was added. The contents were washed with excess
water (2 times), 5% NaHCO3 solution, and water again, and dried over MgSO4, filtered and
the solvent evaporated to give 378 mg (87 %) of 8 as colourless liquid (contains little starting
material). 1H NMR (CDCl3, 400 MHz) δ (ppm): 7.8 (m, 2H), 7.34 (m, 2H), 6.46 (dd, J=14.3,
6.8 Hz, 1H), 4.18 (m, 3H), 4.01 (dd, J=4.6, 2.2 Hz, 1H), 3.76 (m, 3H), 3.71 (m, 2H), 3.67 (m,
2H), 2.45 (s, 3H).
2. Substitution of the pyrene derivative 4 with the oligoethylene glycol derivative 8
1-(2-(2-(vinyloxy)ethoxy)ethoxy)pyrene-2-carbaldehyde (9). A solution of 100 mg (0.41
mmol) of compound 4 and 561 mg (4.06 mmol, 10 eq) of K2CO3 in 5 mL DMF was heated at
50 oC under argon. To this bright red solution, 140 mg (0.49 mmol, 1.2 eq) of tosylate 8 in 1
mL DMF was added slowly, heating and stirring continued during overnight. Water was
added and solvent evaporated under reduced pressure. The residue was extracted with CH2Cl2
(3 times) and the combined organic phase was washed with water, dried over MgSO4, solvent
8
4 9

183
evaporated to give light green viscous liquid. This was flashed in a silica gel column eluting
with CH2Cl2 to get 108 mg (74 %) of product 9 as light brown semi solid (contains little
tosylate starting material). 1H NMR (CDCl3, 400 MHz) δ (ppm): 10.87 (s, 1H), 8.62 (s, 1H),
8.51 (d, J=9.2 Hz, 1H), 8.23-8.12 (m, 3H), 8.1-8.0 (m, 3H), 6.56 (dd, J=14.3, 6.8 Hz, 1H),
4.51 (m, 2H), 4.25 (dd, J=14.3, 2.2 Hz, 1H), 4.18 (m, 1H), 4.06 (dd, J=6.8, 2.2 Hz, 1H), 4.02
(m, 2H), 3.96 (m, 2H). 3.89 (m, 2H).
N1-((1-(2-(2-(vinyloxy)ethoxy)ethoxy)pyren-2-yl)methyl)-N2-(2-((1-(2-(2-(vinyloxy)-
ethoxy)ethoxy)pyren-2-yl)methylamino)ethyl)ethane-1,2-diamine (7)2. A stirring solution of
108 mg (0.3 mmol, 1 eq) of Pyrene derivative (9) and 14 mg (15 µL, 0.135 mmol, 0.45 eq) of
diethylenetriamine in 13 mL CH2Cl2 with few molecular sieves was refluxed for 5 h under
argon. The reaction mixture was cooled down and filtered off the molecular sieves and the
filtrate evaporated. To this semi oily yellow residue 13 mL ethanol and 34 mg (0.9 mmol, 6
eq) of NaBH4 were added and heated at 60 oC for 4 h and stirring continued for 16 h at room
temperature. Solvent was evaporated under reduced pressure and the residue was taken into
CH2Cl2, washed with 1 M NaOH solution (3 times), water and concentrated by evaporation to
give 80 mg (0.10 mmol, 77%) compound 11 as light yellow semisolid. This compound was
used without further purification. 1H NMR (CDCl3, 400 MHz) δ (ppm): 8.62 (s, 2H), 8.51 (d,
J=9.2 Hz, 2H), 8.3-8.0 (m, 12H), 6.50 (dd, J=14.3, 6.8 Hz, 2H), 4.51 (m, 4H), 4.30 (m, 28H).
References 1. Pengo, P.; Polizzi, S.; Battagliarin, M.; Pasquato, L.; Scrimin, P. J. Mater. Chem. 2003, 13,
2471-2478. 2. Shiraishi, Y.; Tokitoh, Y.; Hirai, T. Org. Lett. 2006, 17, 3841-3844.
9 2

Design of mechanoresponsive surfaces and materials
The goal of my PhD was to develop new routes to design chemo-mechanoresponsive materials, materials that respond chemically to a mechanical stress, in a reversible way. All the systems designed during my PhD thesis were based on the functionalization of silicone sheets. First we created cryptic site surfaces by embedding biotin ligands into PEG brushes. The couple streptavidin/biotin was used as a model system. At rest, the surface so-prepared was antifouling and biotin ligands were specifically recognized by the streptavidin when the surface was stretched at 50%. Unfortunately, in this first approach, the mechanosensitive surface did not lead to a reversible process. In a second approach, we modified the silicone surface by using the polyelectrolyte multilayer (PEM) film deposition. This strategy was based on the covalent cross-linking of modified enzyme, the β-galactosidase, into the PEM. We succeeded in modulating the enzyme activity in the film under stretching and this approach appears as partially reversible under stretching/unstretching cycles. This work represents the first reported system where enzymatic activity can be modulated by stretching due to modulation of the enzyme conformation. In a last approach, we also designed a mixed system consisting of a silicone sheet onto which a polyacrylamide hydrogel is covalently attached with the goal to create a stretchable gel into which one can covalently attach enzymes or chemical mechanophores. These enzymes or mechanophores can thus be put under mechanical stress. We succeeded in creating a system that can be stretched up to 50% without detachment of the gel from the silicone and without inducing cracks in the gel. Keywords : Chemo-mechanoresponsive materials, surface modification, polydimethylsiloxane, polyelectrolyte multilayers, biocatalysis control, polyacrylamide hydrogels, polymerization, soft matter.
Conception des surfaces et des matériaux mécano-répondants
Le but de ma thèse a été de concevoir des matériaux chimio-mécano répondants, des matériaux capables de permettre une transformation chimique réversible lorsqu’ils sont soumis à un stress mécanique. Tous les systèmes conçus ont été développés sur des substrats en silicone. Une première approche a consisté à créer des surfaces à sites cryptiques où une biotine est enfouie dans des brosses de chaines de poly(éthylène glycol). Le système streptavidine/biotine a été utilisé comme modèle. Ces surfaces sont anti-adsorbantes à la streptavidine sauf lorsqu’elles sont étirées à 50% où la biotine est reconnue mais les surfaces sont non réversibles. Dans une seconde approche, nous avons modifiés la surface du silicone par adsorption d’une multicouche de polyélectrolytes. Cette stratégie est basée sur la réticulation covalente du film par l’enzyme β-galactosidase modifiée. Nous sommes ainsi parvenus à créer une surface présentant une activité catalytique modulable par l’étirement mécanique, et ce, d’une façon partiellement réversible. Ce travail représente le premier exemple d’un système où une contrainte mécanique imposée à un matériau permet la déformation conformationnelle d’une enzyme et ainsi la diminution de l’activité catalytique. Dans une dernière approche, nous avons conçu un système mixte composé d’un substrat de silicone sur lequel un gel de polyacrylamide est greffée de façon covalente. Des enzymes ou des mécanophores pourront ainsi être inclus dans le réseau polymérique du gel de polyacrylamide et être étirés. Nous sommes parvenus à préparer de tels systèmes où l’hydrogel reste solidaire du film de silicone, sans apparition de craquelures jusqu’à 50% d’étirement. Mots-clés : matériaux chimio-mécano répondants, traitement de surface, polydiméthylsiloxane, multicouches de polyélectrolytes, biocatalyse contrôlée, hydrogels de polyacrylamides, polymérisation, matériaux mous.


