dna mitocondrial como ferramenta na investigação...
TRANSCRIPT
REDE NORDESTE DE BIOTECNOLOGIA
UNIVERSIDADE FEDERAL DO ESPÍRITO SANTO
CENTRO DE CIÊNCIAS DA SAÚDE
PROGRAMA DE PÓS-GRADUAÇÃO EM BIOTECNOLOGIA
DNA mitocondrial como ferramenta na investigação da
ancestralidade materna e da estrutura populacional no Espírito
Santo
RAQUEL SILVA DOS REIS
VITÓRIA - ES
2019
RAQUEL SILVA DOS REIS
DNA mitocondrial como ferramenta na investigação da
ancestralidade materna e da estrutura populacional no Espírito
Santo
VITÓRIA - ES
2019
Tese apresentada ao Programa de Pós-graduação em
Biotecnologia da Rede Nordeste de Biotecnologia
(RENORBIO) - ponto focal Espírito Santo, como
requisito parcial para obtenção do título de Doutor em
Biotecnologia.
Orientador: Dr. Iúri Drumond Louro
Coorientadora: Leonor Gusmão

Agradecimentos
A Deus Trino, a Nossa Senhora de Fátima, a Santa Hildegarda e ao meu anjo da guarda.
Aos meus queridos pais, irmãos e avós pelo apoio e amor singular, bem como aos
demais familiares que destinam a mim seu afeto e bem querer.
Ao Guilherme, meu marido, que detém em si todos os adjetivos do enamorado, do
amigo e do companheiro de vida.
Ao meu orientador, Iúri Drumond Louro, pela amizade e confiança no meu trabalho.
A Leonor Gusmão, minha coorientadora, por toda dedicação e paciência materna.
Aos membros da banca, professores Elizeu F. de Carvalho, Flavia de Paula, Sonia A.
Gouvea e Valéria Fagundes pela disponibilidade e pelas sugestões voltadas ao
aprimoramento deste trabalho.
Aos meus companheiros de pesquisa no Núcleo de Genética Humana e Molecular
(NGHM), Débora, Diego, Elaine, Elda, Fernanda, Gillian, Jucimara, Lauziene, Lidiane,
Lucas Maia, Lucas Vianna, Maíra, Quézia, Raquel e Victor, assim como aos nossos
alunos de iniciação científica.
A Filipa Simão pela boa vontade em contribuir significativamente para esta tese.
Ao Núcleo de Genética Aplicada à Conservação da Biodiversidade (NGACB),
especialmente a Juliana Justino e Monique Pereira, e ao Laboratório de Diagnósticos
por DNA (LDD), em especial a Silvia Loiola e Marta Correia, pelo suporte técnico e de
infraestrutura.
À Fundação de Amparo à Pesquisa e Inovação do Espírito Santo (Fapes) e ao Conselho
Nacional de Desenvolvimento Científico e Tecnológico (CNPq) pela concessão de
recursos financeiros para o custeio desta pesquisa via Programa de Apoio a Núcleos
Emergentes (Pronem), edital Fapes/CNPq nº 05/2017, termo de outorga 87/2017.
À Fapes pela bolsa de estudos, recebida por determinado período de formação,
vinculada ao termo de outorga 939/2015, processo nº 71896929 do edital Fapes
124/2014 – Bolsa de Doutorado com Taxa de Bancada.
Ao Programa de Pós-graduação em Biotecnologia da UFES, vinculado à Rede Nordeste
de Biotecnologia (Renorbio), pela oportunidade de realizar o curso de doutorado.

...porque sem mim nada podeis fazer.
São João 15, 5b
ESTRUTURA DA TESE
Esta tese é apresentada em formato de artigo científico e de acordo com o exigido pelo
regimento deste programa, a saber, a comprovação de submissão de, no mínimo, dois
artigos em periódico Qualis B1 ou superior em Biotecnologia. Em pelo menos um dos
trabalhos exigidos, o aluno deverá ser o primeiro autor.
O manuscrito “A view of the maternal inheritance of Espírito Santo populations: the
contrast between the admixed and Pomeranian descent groups” corresponde ao produto
principal desta tese e apresenta a candidata como primeiro autor.
Já o artigo “Stratification among European descent and admixed Brazilian populations
of Espírito Santo for 27 Y-STRs” representa uma produção secundária, em coautoria, e
figura apenas na forma de seu comprovante de submissão (ANEXO 2).
RESUMO
REIS, R.S. DNA mitocondrial como ferramenta na investigação da ancestralidade
materna e da estrutura populacional no Espírito Santo. 2019. 83f. Tese (Doutorado
em Biotecnologia) - Programa de Pós-Graduação em Biotecnologia, UFES, Espírito
Santo. Brasil.
Além de sua valiosa utilidade na prática forense, a análise do DNA mitocondrial
(mtDNA) é uma ferramenta confiável para desvendar as origens de populações
miscigenadas, como as brasileiras. O Espírito Santo (ES), assim como os demais
estados costeiros do país, possui uma população moldada por três principais raízes
ancestrais: ameríndios, africanos e europeus. Entre estes últimos, os descendentes da
antiga Pomerânia destacam-se pela preservação dos aspectos tradicionais de sua cultura,
especialmente a língua pomerana. Embora a diversidade genética mitocondrial no ES
tenha investigada por um estudo anterior, a base de dados disponibilizada apresenta
reduzido número amostras (N=97) cuja composição étnica, origem geográfica e
abrangência territorial são desconhecidas. Com o objetivo de aprofundar o
conhecimento sobre a ancestralidade materna e investigar a estratificação genética da
população, dados da região controle do mtDNA foram produzidos para população geral
(N=214) e comunidades pomeranas (N=77), totalizando 291 haplótipos. A amostragem
da população geral incluiu indivíduos das 4 macrorregiões do ES, a saber,
Metropolitana (N=81), Sul (N=62), Central (N=54) e Norte (N=17). Em relação à
população geral, os altos valores de diversidade haplotípica (H = 99,9%) e de diferenças
entre pares de haplótipos (mean number of pairwise diferences - MNPD = 16,9)
encontrados estão de acordo com os relatados para outras populações na região Sudeste
do Brasil. Quanto à herança materna, o ES destacou-se pela predominância de
haplogrupos europeus (49,1%), embora a macrorregião Norte tenha apresentado um
perfil mais africano (47,1%). Embora não estatisticamente significantes, as análises de
distâncias genéticas indicaram uma estratificação genética da população geral, o que
comprometeria a adoção de uma base de dados única de linhagens de mtDNA com
finalidade forense para todo o ES. Entre os pomeranos, o menor valor de MNPD (11,2)
e o alto percentual de haplótipos compartilhados (15%) foram indicativos de eventos
fundadores. A análise de FST demonstrou que os pomeranos (com 98,7% de linhagens
europeias) são geneticamente isolados das outras populações do Brasil. Este estudo
evidenciou que o Estado do ES apresenta singularidades em relação à diversidade intra
e interpopulacional do mtDNA. Mesmo após cinco séculos de miscigenação, a
população atual do Espírito Santo abriga marcas genéticas que remontam aspectos
históricos de sua formação.
Palavras-chave: mtDNA, Brasil, macrorregiões, ancestralidade, estratificação
populacional.
ABSTRACT
REIS, R.S. Mitochondrial DNA as a tool in the investigation of maternal ancestry
and the population structure in Espírito Santo. 2019. 83f. Thesis (PhD in
Biotechnology) - Postgraduate Program in Biotechnology, UFES, Espírito Santo. Brazil.
In addition to its valuable utility in forensic investigations, mitochondrial DNA
(mtDNA) analysis is a reliable tool to uncover the origins of admixed populations, such
as Brazilians. The state of Espírito Santo (ES), similar to other coastal Brazilian states,
has a population shaped by 3 main ancestral roots: Amerindian, African and European.
Among the latter, the Pomeranian descendants stand out due to the preservation of the
traditional aspects of their culture, especially the Pomeranian language. Although the
mitochondrial genetic diversity in ES has been investigated by an earlier study, the
available database presents reduced sample size (N = 97) whose ethnic composition,
geographical origin and territorial coverage are unknown. To increase the knowledge of
maternal ancestry and to investigate the population’s genetic stratification, complete
control region data were produced for the general (N=214) and Pomeranian (N=77)
groups, totaling 291 haplotypes. The sampling of the general population included
individuals from the 4 macroregions of the ES, namely Metropolitan (N = 81), South (N
= 62), Central (N = 54) and North (N = 17). Regarding the general population, the high
values of haplotype diversity (H=99.9%) and pairwise differences (MNPD=16.9) found
are in agreement with those reported for other populations in the southeast region of the
country. Regarding maternal inheritance, the ES populations stood out due to the
predominance of European haplogroups (49.1%), although the North macroregion had a
higher African profile (47.1%). Although not statistically significant, analyses of
genetic distances indicated a genetic stratification of the general population, which
would compromise the adoption of a single forensic database of mtDNA lineages for all
ES. Among the Pomeranians, the lowest MNPD value (11.2) and the high percentage of
shared haplotypes (15%) were indicative of founder events. The FST analysis showed
that the Pomeranians (98.7% of European lineages) are genetically isolated from the
other admixed populations in Brazil. This study demonstrated that the ES state contains
singularities regarding the intrapopulational and interpopulational diversity of mtDNA.
Even after 5 centuries of interethnic admixture, the present-day population of Espírito
Santo harbors genetic marks that trace back to the historical aspects of its formation.
Keywords: mtDNA, Brazil, macroregions, ancestry, population stratification

Sumário
1. INTRODUÇÃO .......................................................................................................................... 10
2. OBJETIVOS ............................................................................................................................... 13
2.1 Objetivo geral .................................................................................................................... 13
2.2 Objetivos específicos ......................................................................................................... 13
3. REVISÃO DE LITERATURA ........................................................................................................ 14
3.1 O DNA mitocondrial humano: características gerais ........................................................ 14
3.2 O estudo da diversidade genética mitocondrial e sua nomenclatura .............................. 16
3.3 Problemas comuns de análise: heteroplasmia e contaminação ....................................... 17
3.4 Aplicabilidade dos dados de mtDNA ................................................................................. 18
3.4.1 Prática forense ........................................................................................................... 19
3.4.2 Ancestralidade materna e genética de populações ................................................... 20
3.5 Estudos populacionais sobre o DNA mitocondrial no Brasil ............................................. 23
4. PRINCIPAL ARTIGO CIENTÍFICO DERIVADO DA TESE ............................................................... 25
5. CONCLUSÕES ........................................................................................................................... 48
6. REFERÊNCIAS ........................................................................................................................... 49
APÊNDICE 1 – Tabelas suplementares do artigo principal .......................................................... 53
Table S1. Haplotypes, haplogroups and continental origin of maternal lineages of 291
unrelated individuals from Espírito Santo state (ES) based on mtDNA control region (16024-
576).. ....................................................................................................................................... 53
Table S2. HVSI and HVSII point heteroplasmies found in 13 haplotypes from Espírito Santo
population. .............................................................................................................................. 65
Table S3. mtDNA ancestry and self-declaration proportions per macro-region in the general
population of ES. ..................................................................................................................... 65
Table S4. Pairwise FST values among populations from Espírito Santo and samples from
previous studies with full CR information................................................................................ 66
Table S5. Pairwise FST values between European and Brazilian populations.. ........................ 67
ANEXO 1 – Comprovante de submissão do artigo “A view of the maternal inheritance of
Espírito Santo populations: the contrast between the admixed and Pomeranian descent
groups”. ....................................................................................................................................... 68
ANEXO 2 – Comprovante de submissão do artigo “Stratification among European descente and
admixed Brazillian populations of Espírito Santo for 27 Y-STRs”. ............................................... 70
ANEXO 3 – Aprovação do Comitê de Ética em Pesquisa ............................................................. 71
10
1. INTRODUÇÃO
Os estudos populacionais são importantes para estimar a variabilidade genética e
evidenciar singularidades intra e interpopulacionais. O perfil genético de um povo é
resultado de seu histórico de eventos demográficos modelados ao longo de sua história
pelos demais fatores evolutivos.
A análise do DNA mitocondrial (mtDNA) apresenta-se como ferramenta molecular
capaz de, conjuntamente, estimar a diversidade genética e revelar as origens das
populações, especialmente as miscigenadas (SIMÃO et al., 2018). Sua versatilidade está
vinculada a uma série de características valiosas, tais como: alto número de cópias,
elevada taxa de mutação, curta sequência nucleotídica e mecanismo de herança
exclusivamente materna (CHAITANYA et al., 2016). Esta última é a que norteia sua
aplicabilidade tanto em investigações forenses e quanto em inferências filogenéticas.
No âmbito da prática forense, a utilidade de um perfil de mtDNA como evidência
científica está atrelada à existência de uma base de dados da população de referência
que permita conhecer as frequências haplotípicas e, consequentemente, o nível de
raridade de um perfil (BRANDSTÄTTER et al., 2007). Até a presente data, o Espírito
Santo (ES) dispõe de uma base de dados composta por apenas 97 perfis com
distribuição espacial e étnica desconhecidas (SANCHES et al., 2014). Considerando
que a abrangência geográfica, o número total de amostras e a composição étnica são
fatores importantes na construção de uma base de dados, faz-se necessária uma
amostragem de referência que leve em consideração os aspectos ora citados para uma
estimativa fidedigna do “peso da evidência” no contexto investigativo do ES.
A população capixaba, tal como as demais distribuídas ao longo da costa brasileira, teve
sua formação grandemente influenciada pela colonização portuguesa do século XVI,
pelo tráfico negreiro do século XVII e pelas ondas de imigração majoritariamente
europeia que permearam o século XIX (FRANCESCHETTO, 2014; IBGE, 2007).
Embora os dados prévios de mtDNA apontem para um perfil geral de 43.3% de
linhagens maternas africanas, 32% de linhagens europeias e 23,7% de ameríndias, não
existem informações quanto à sua distribuição espacial e à existência de alguma espécie
de territorialidade.
11
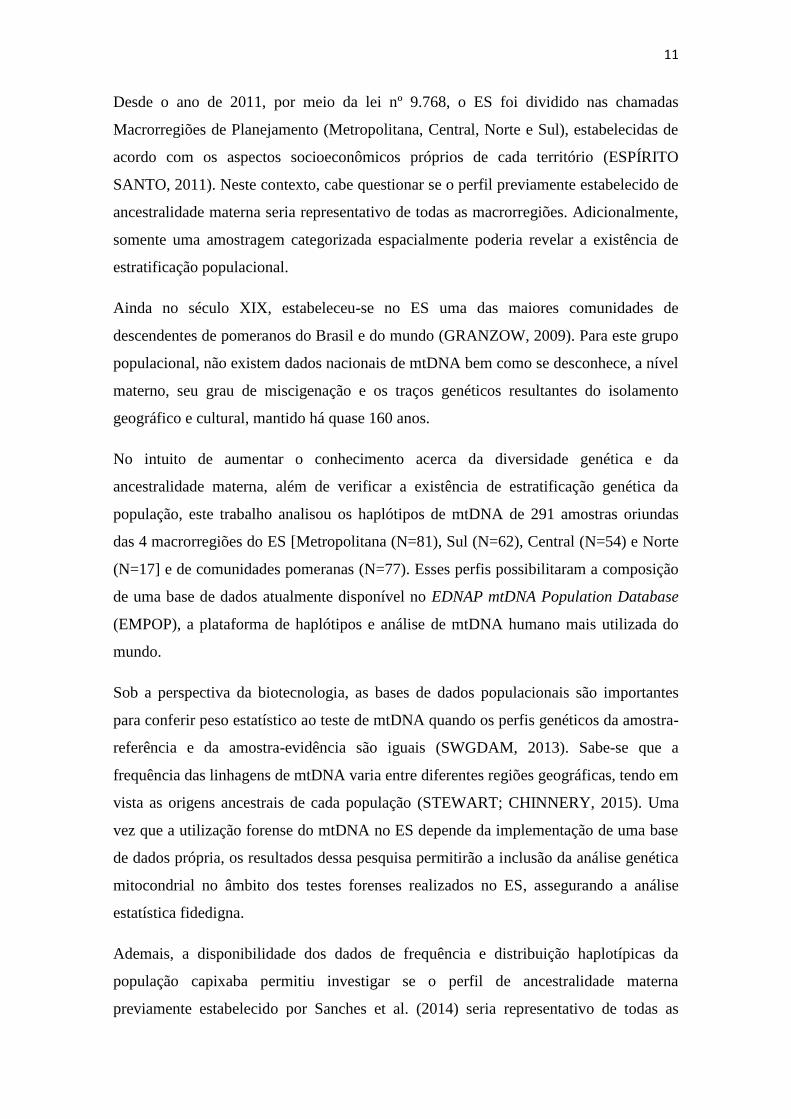
Desde o ano de 2011, por meio da lei nº 9.768, o ES foi dividido nas chamadas
Macrorregiões de Planejamento (Metropolitana, Central, Norte e Sul), estabelecidas de
acordo com os aspectos socioeconômicos próprios de cada território (ESPÍRITO
SANTO, 2011). Neste contexto, cabe questionar se o perfil previamente estabelecido de
ancestralidade materna seria representativo de todas as macrorregiões. Adicionalmente,
somente uma amostragem categorizada espacialmente poderia revelar a existência de
estratificação populacional.
Ainda no século XIX, estabeleceu-se no ES uma das maiores comunidades de
descendentes de pomeranos do Brasil e do mundo (GRANZOW, 2009). Para este grupo
populacional, não existem dados nacionais de mtDNA bem como se desconhece, a nível
materno, seu grau de miscigenação e os traços genéticos resultantes do isolamento
geográfico e cultural, mantido há quase 160 anos.
No intuito de aumentar o conhecimento acerca da diversidade genética e da
ancestralidade materna, além de verificar a existência de estratificação genética da
população, este trabalho analisou os haplótipos de mtDNA de 291 amostras oriundas
das 4 macrorregiões do ES [Metropolitana (N=81), Sul (N=62), Central (N=54) e Norte
(N=17] e de comunidades pomeranas (N=77). Esses perfis possibilitaram a composição
de uma base de dados atualmente disponível no EDNAP mtDNA Population Database
(EMPOP), a plataforma de haplótipos e análise de mtDNA humano mais utilizada do
mundo.
Sob a perspectiva da biotecnologia, as bases de dados populacionais são importantes
para conferir peso estatístico ao teste de mtDNA quando os perfis genéticos da amostra-
referência e da amostra-evidência são iguais (SWGDAM, 2013). Sabe-se que a
frequência das linhagens de mtDNA varia entre diferentes regiões geográficas, tendo em
vista as origens ancestrais de cada população (STEWART; CHINNERY, 2015). Uma
vez que a utilização forense do mtDNA no ES depende da implementação de uma base
de dados própria, os resultados dessa pesquisa permitirão a inclusão da análise genética
mitocondrial no âmbito dos testes forenses realizados no ES, assegurando a análise
estatística fidedigna.
Ademais, a disponibilidade dos dados de frequência e distribuição haplotípicas da
população capixaba permitiu investigar se o perfil de ancestralidade materna
previamente estabelecido por Sanches et al. (2014) seria representativo de todas as

12
macrorregiões do ES e se a população de descendentes de pomeranos apresentaria
redução nos índices de diversidade genética em relação à população geral.
13
2. OBJETIVOS
2.1 Objetivo geral
Gerar uma base de dados de mtDNA com resolução macrorregional para o Espírito
Santo e aprofundar o conhecimento referente à diversidade genética e à ancestralidade
materna de suas subpopulações, investigando particularidades intra e interpopulacionais.
2.2 Objetivos específicos
Determinar os haplótipos de mtDNA em amostras das subpopulações do
Espírito Santo, a saber, das macrorregiões Metropolitana, Sul, Central e Norte
(em conjunto denominadas “população geral”) e de comunidades de
descendentes pomeranos (denominada “população pomerana”);
Classificar os haplótipos em seus respectivos haplogrupos (indicativos da
ancestralidade materna);
Comparar o perfil de ancestralidade materna do Espírito Santo com o de outras
regiões brasileiras;
Comparar as subpopulações capixabas segundo sua herança materna;
Estimar os parâmetros de diversidade genética mitocondrial na população geral e
na população pomerana;
Verificar as distâncias genéticas entre as subpopulações capixabas e destas em
relação a outras populações brasileiras e de referência.
14
3. REVISÃO DE LITERATURA
3.1 O DNA mitocondrial humano: características gerais
Graças a sua origem endossimbiótica, as mitocôndrias são as únicas organelas da célula
eucariótica animal a apresentarem um genoma próprio e distinto do nuclear denominado
DNA mitocondrial (mtDNA). Com mecanismo de replicação independente do ciclo
celular, cada mitocôndria pode conter de 2-10 cópias do mtDNA (BUDOWLE et al.,
2003). Nas células somáticas este número pode chegar a centenas de milhares de
réplicas (CAVELIER et al., 2000).
As moléculas de mtDNA são circulares e possuem 16.569 pares de bases (pb) de
extensão (Figura 1). Organizam-se na forma de nucleoides, cujo principal componente
proteico é o mitochondrial transcription factor A (TFAM), que abrigam 1,4 moléculas
de mtDNA (KUKAT et al., 2011).
As fitas simples do mtDNA apresentam conteúdos distintos de nucleotídeos: a chamada
fita pesada ou fita H (do inglês heavy) possui grande número de guaninas e, portanto,
maior peso molecular que sua complementar, nomeada de fita leve ou fita L (do inglês
light) (BUTLER, 2010).
Sua porção codificante apresenta 15.447 pb e abriga 37 genes envolvidos no
metabolismo energético da organela: 13 deles responsáveis pela produção de proteínas e
outros 24 pela geração de RNAs. Desses, 22 codificam RNAs transportadores e 2
codificam RNAs ribossômicos (BUDOWLE et al., 2003). As demais proteínas
essenciais (aproximadamente 1.500) são codificadas no núcleo (PATANANAN et al.,
2016).
15
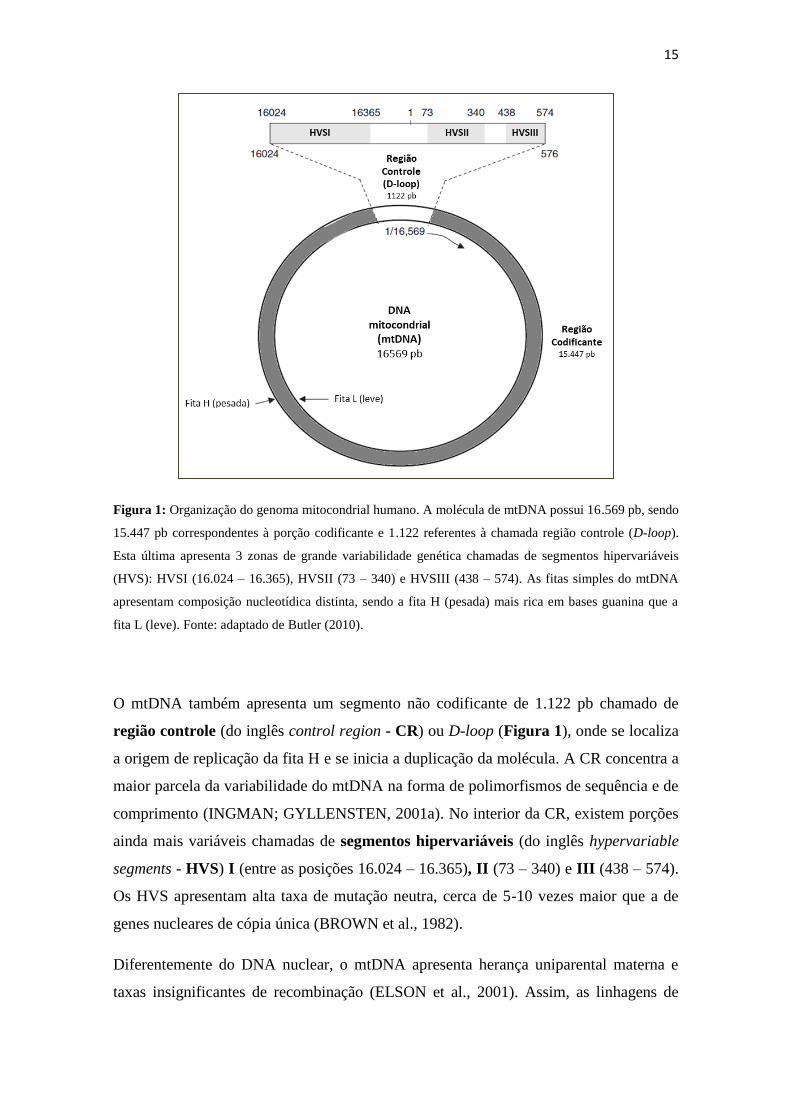
Figura 1: Organização do genoma mitocondrial humano. A molécula de mtDNA possui 16.569 pb, sendo
15.447 pb correspondentes à porção codificante e 1.122 referentes à chamada região controle (D-loop).
Esta última apresenta 3 zonas de grande variabilidade genética chamadas de segmentos hipervariáveis
(HVS): HVSI (16.024 – 16.365), HVSII (73 – 340) e HVSIII (438 – 574). As fitas simples do mtDNA
apresentam composição nucleotídica distinta, sendo a fita H (pesada) mais rica em bases guanina que a
fita L (leve). Fonte: adaptado de Butler (2010).
O mtDNA também apresenta um segmento não codificante de 1.122 pb chamado de
região controle (do inglês control region - CR) ou D-loop (Figura 1), onde se localiza
a origem de replicação da fita H e se inicia a duplicação da molécula. A CR concentra a
maior parcela da variabilidade do mtDNA na forma de polimorfismos de sequência e de
comprimento (INGMAN; GYLLENSTEN, 2001a). No interior da CR, existem porções
ainda mais variáveis chamadas de segmentos hipervariáveis (do inglês hypervariable
segments - HVS) I (entre as posições 16.024 – 16.365), II (73 – 340) e III (438 – 574).
Os HVS apresentam alta taxa de mutação neutra, cerca de 5-10 vezes maior que a de
genes nucleares de cópia única (BROWN et al., 1982).
Diferentemente do DNA nuclear, o mtDNA apresenta herança uniparental materna e
taxas insignificantes de recombinação (ELSON et al., 2001). Assim, as linhagens de
16
mtDNA são caracterizadas por haplótipos que são compartilhados entre indivíduos com
parentesco de mesma origem materna (MONSON et al., 2002).
3.2 O estudo da diversidade genética mitocondrial e sua nomenclatura
Inicialmente, estudos da variabilidade genética mitocondrial eram baseados em análises
de polimorfismos de comprimento de fragmentos de restrição (do inglês restriction
fragment lenght polymorphism – RFLP) (RICHARDS; MACAULAY, 2001). Com
protocolos que empregavam até 14 enzimas distintas, os haplótipos eram definidos com
base em ganhos/perdas de sítios de restrição considerando toda a extensão da molécula
(BUTLER; WILSON; REEDER, 1998; MACAULAY et al., 1999; TORRONI et al.,
1996).
O genoma mitocondrial humano foi sequenciado pela primeira vez por Anderson e
colaboradores em 1981 a partir do material genético de uma mulher com ascendência
europeia, no laboratório Frederick Sanger em Cambridge, Inglaterra (ANDERSON et
al., 1981). Esta sequência ficou conhecida como Sequência Referência de Cambridge
(em inglês Cambridge Reference Sequence - CRS). Posteriormente, em 1999, a CRS foi
ressequenciada por Andrews e colaboradores permitindo a correção de erros da
sequência original e gerando o que hoje é considerada a sequência padrão para
comparações: a CRS revisada (em inglês revised Cambridge Reference Sequence -
rCRS) (ANDREWS et al., 1999).
A análise por sequenciamento de porções CR tornou-se difundida a partir da década de
1990 (BUTLER, 2012). Embora seja atualmente recomendado o sequenciamento
completo da CR (PARSON et al., 2014a), tanto para estudos populacionais quanto
forenses, uma parcela relevante dos dados disponíveis contempla apenas os HVS.
Segundo as diretrizes da Sociedade Internacional de Genética Forense (em inglês
International Society for Forensic Genetics - ISFG), os haplótipos devem conter apenas
as diferenças em relação à rCRS evidenciadas após alinhamento, subentendendo-se que
todo o restante da sequência da amostra é igual a rCRS. Para nomenclatura são
utilizados os códigos de bases nitrogenadas convencionados pela International Union of
Pure and Applied Chemistry (IUPAC) (PARSON et al., 2014a).
17
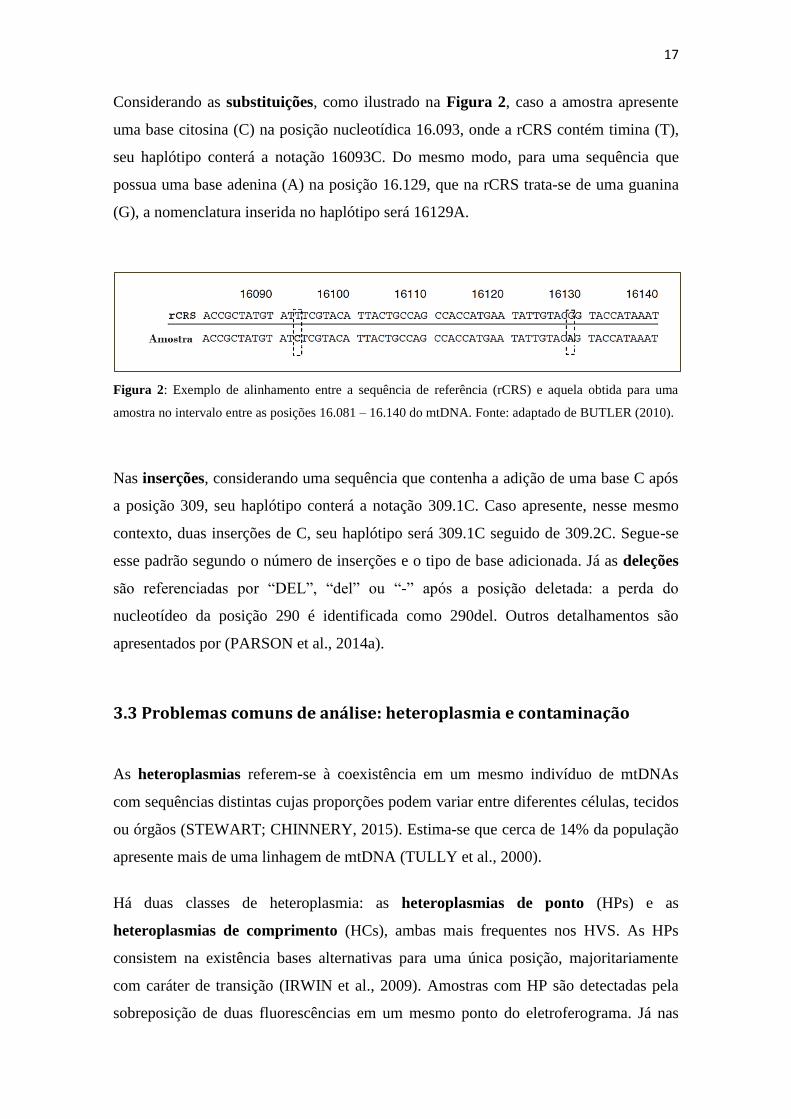
Considerando as substituições, como ilustrado na Figura 2, caso a amostra apresente
uma base citosina (C) na posição nucleotídica 16.093, onde a rCRS contém timina (T),
seu haplótipo conterá a notação 16093C. Do mesmo modo, para uma sequência que
possua uma base adenina (A) na posição 16.129, que na rCRS trata-se de uma guanina
(G), a nomenclatura inserida no haplótipo será 16129A.
Figura 2: Exemplo de alinhamento entre a sequência de referência (rCRS) e aquela obtida para uma
amostra no intervalo entre as posições 16.081 – 16.140 do mtDNA. Fonte: adaptado de BUTLER (2010).
Nas inserções, considerando uma sequência que contenha a adição de uma base C após
a posição 309, seu haplótipo conterá a notação 309.1C. Caso apresente, nesse mesmo
contexto, duas inserções de C, seu haplótipo será 309.1C seguido de 309.2C. Segue-se
esse padrão segundo o número de inserções e o tipo de base adicionada. Já as deleções
são referenciadas por “DEL”, “del” ou “-” após a posição deletada: a perda do
nucleotídeo da posição 290 é identificada como 290del. Outros detalhamentos são
apresentados por (PARSON et al., 2014a).
3.3 Problemas comuns de análise: heteroplasmia e contaminação
As heteroplasmias referem-se à coexistência em um mesmo indivíduo de mtDNAs
com sequências distintas cujas proporções podem variar entre diferentes células, tecidos
ou órgãos (STEWART; CHINNERY, 2015). Estima-se que cerca de 14% da população
apresente mais de uma linhagem de mtDNA (TULLY et al., 2000).
Há duas classes de heteroplasmia: as heteroplasmias de ponto (HPs) e as
heteroplasmias de comprimento (HCs), ambas mais frequentes nos HVS. As HPs
consistem na existência bases alternativas para uma única posição, majoritariamente
com caráter de transição (IRWIN et al., 2009). Amostras com HP são detectadas pela
sobreposição de duas fluorescências em um mesmo ponto do eletroferograma. Já nas
18
HCs, as variantes distinguem-se pelo número de bases, principalmente devido a
inserções. No sequenciamento de Sanger, isso pode ser verificado pela sobreposição
contínua de picos a partir de um determinado ponto da sequência. As HCs são
especialmente frequentes na região de homopolímero de citosina situada no HVSII
(IRWIN et al., 2009).
É importante salientar que diferenças na forma de HPs ou HCs não são utilizadas como
critério de exclusão entre amostras que apresentem correspondência para as demais
posições do haplótipo. Por outro lado, o compartilhamento de uma determinada HP
pode ser um forte indício para atestar “falha na exclusão” (assunto discutido no tópico
4.1) (SWGDAM, 2013).
Embora estudos anteriores tenham relatado a existência de indivíduos com 2 ou 3 HPs
(IRWIN et al., 2009; MELTON et al., 2005; TULLY et al., 2000), esta situação pode
ser indicativa de contaminação, especialmente se detectada várias vezes em um mesmo
conjunto amostral. Diversas e sucessivas publicações têm recomendado a adoção de
práticas laboratoriais preventivas, como a separação de áreas pré e pós-PCR, utilização
de insumos e reagentes distintos para cada etapa, uso de controles (etapas de extração e
amplificação) e a geração de dados de sequenciamento redundantes (com os primers
direto e reverso) (BUTLER, 2012; CARRACEDO et al., 2000; PARSON et al., 2014;
SWGDAM, 2013).
De maneira geral, não são feitas tentativas de elucidar/interpretar casos em que haja
indícios de contaminação. Isso porque a contribuição relativa de cada indivíduo na
mistura não necessariamente tem reflexo nas alturas dos picos no eletroferograma
(BUTLER, 2012).
3.4 Aplicabilidade dos dados de mtDNA
O mecanismo de herança materna sem recombinação permite estabelecer relações entre
indivíduos e entre populações que são de interesse da genética forense e de populações.
19
3.4.1 Prática forense
O mtDNA tem sido usado como ferramenta para identificação forense desde 1993
(HOLLAND et al., 1993).
O compartilhamento de um mesmo haplótipo entre indivíduos com parentesco materno
facilita a obtenção de amostras de referência que são essenciais nos casos de
desaparecimento, desastres naturais e acidentes em massa (LECLAIR et al., 2007).
Graças ao seu elevado número de cópias, o mtDNA é uma opção para obtenção de
dados quando DNA nuclear não está disponível ou encontra-se degradado, permitindo a
análise na maioria das amostras biológicas: fragmentos de ossos e dentes, fios de
cabelo, além dos tipos mais comuns como sangue, fluidos corporais e tecidos sólidos
cuja degradação é acelerada. A geração de dados interpretáveis é possível para vestígios
muito antigos, carbonizados ou em estado de decomposição (BENDER; SCHNEIDER;
RITTNER, 2000; EDSON et al., 2004; LUTZ et al., 1996).
Havendo sucesso no sequenciamento, a interpretação dos resultados do teste de mtDNA
envolve a comparação entre o haplótipo da amostra-caso (Q, de origem desconhecida) e
o da amostra-referência (R, de origem conhecida). Segundo o “Guia de interpretação
para análise de DNA mitocondrial por laboratórios forenses de teste de DNA” elaborado
pelo Scientific Working Group on DNA Analysis Methods (SWGDAM) (SWGDAM,
2013), é possível concluir por: a) exclusão: quando há 2 ou mais diferenças entre os
haplótipos Q e R (exceto as HCs), eliminando-se a hipótese de que as amostras tenham
a mesma origem; b) inconclusivo: quando é detectada apenas uma diferença ou quando
a discordância decorre de HCs, sendo todas as outras bases iguais entre Q e R; c) falha
de exclusão: quando todas as posições são concordantes, incluindo as HCs, e não se
pode excluir a hipótese de que Q e R tenham a mesma origem ou pertençam à mesma
linhagem materna.
Um relatório que ateste “falha na exclusão” precisa estar acompanhado da estimativa de
raridade do haplótipo encontrado, ou seja, sua frequência na população correspondente
(BUDOWLE et al., 2003; BUTLER, 2010). Essa informação é essencial ao se avaliar o
que é chamado de “peso da evidência”, ou seja, a significância do resultado genético em
um contexto investigativo. Sendo assim, a inexistência de uma base de dados
20
representativa de uma população restringe em seu âmbito a utilização forense do
mtDNA (BRANDSTÄTTER et al., 2004). Uma vez que a raridade de um haplótipo
consiste no número de vezes que ele é observado na base de dados (BUTLER, 2012),
quanto maior o número de indivíduos não aparentados nela incluídos, mais confiável
será a estimativa. Outros parâmetros como qualidade das sequências, abrangência
geográfica e distribuição étnica são importantes para composição e seleção de uma base
de dados com finalidade forense.
Preconizando os indicadores ora relatados, foi criado o EDNAP mtDNA Population
Database (EMPOP), o banco de dados de haplótipos de mtDNA mais utilizado do
mundo. O EMPOP disponibiliza dados populacionais de alta qualidade em uma
plataforma de acesso e pesquisa gratuitos para a comunidade científica. Adota critérios
em consonância com as recomendações do SWGDAM e da ISFG e outras relacionadas
à documentação de dados forenses. Além disso, disponibiliza ferramentas como o
EMPcheck e o Network que permitem aos usuários avaliar a qualidade dos dados
gerados (PARSON; DÜR, 2007).
3.4.2 Ancestralidade materna e genética de populações
Os haplótipos correspondem ao conjunto de mutações acumuladas por determinada
linhagem materna ao longo do tempo evolutivo. Linhagens próximas umas das outras
compartilham entre si variantes específicas que permitem agrupá-las com base em seu
ancestral comum mais recente. Esses agrupamentos são chamados de haplogrupos e,
em geral, remetem a populações com origem geográfica específica, a saber, as africanas,
europeias, asiáticas e ameríndias (MITCHELL et al., 2015). Dada a transmissão
uniparental e sem recombinação do mtDNA, o haplogrupo de uma amostra permite
inferir a ancestralidade materna de um indivíduo.
Com base em dados de sequenciamento completo do genoma mitocondrial disponíveis
mundialmente, van Oven e Kayser construíram a Phylotree (VAN OVEN; KAYSER,
2009a), a árvore filogenética de referência para o mtDNA humano, que permite
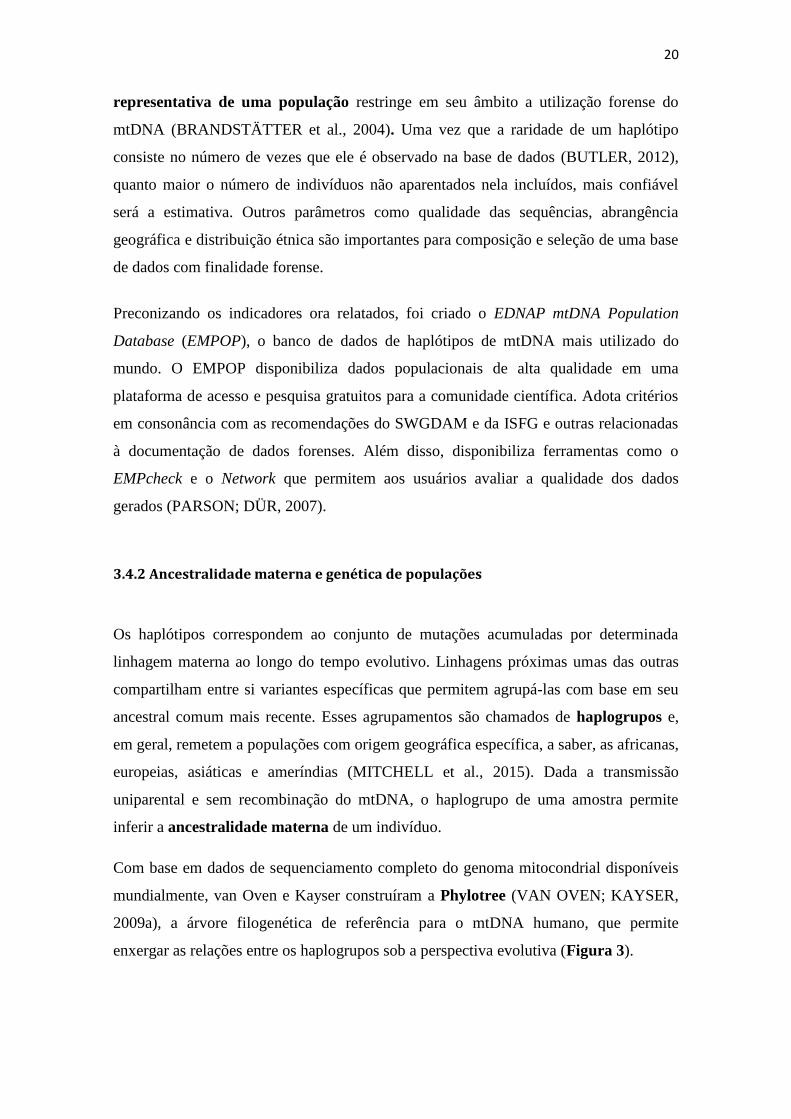
enxergar as relações entre os haplogrupos sob a perspectiva evolutiva (Figura 3).
21
Figura 3: Macroestrutura da Phylotree, a árvore filogenética dos haplogrupos de mtDNA. Sua
configuração atual (versão 17) apresenta 25 subárvores acessíveis por meio de links inclusos nas
extremidades de cada ramo (retângulos). Os ramos L (L0, L1, L2, L3, L4, L5 e L6), mais basais, são
aqueles com origem no continente africano. A partir de L3, os macrohaplogrupos M e N expandiram para
a região da Eurásia. O ramo M deu origem a linhagens asiáticas (C, D, E, G, Z e M1-M40) e australianas
(M42 e Q). O ramo N originou haplogrupos asiáticos (A, O e Y), australianos (S), além dos ramos
europeus à oeste (I, W e X) e o macrohaplogrupo R. Deste último derivaram linhagens na Europa (H, J,
T, U e V), na Ásia (B e F) e na Austrália (P). As linhagens A, B, C e D são características dos povos
nativos da América. O símbolo “*” indica a inclusão no mesmo link de todas as outras linhagens
descendentes do mesmo clado e identificadas pela mesma letra maiúscula, além daquelas já evidentes na
macroestrutura. Como exemplo, N* inclui N5, N12, N13, N14, N21 e N22.
Fonte: http://www.phylotree.org/tree/index.htm
Na Phylotree, os haplogrupos são representados por iniciais maiúsculas do alfabeto, sua
notação tradicional. Os ramos mais basais são os africanos, representados pela letra “L”
(L0, L1, L2, L3, L4, L5 e L6). A partir de L3, os macrohaplogrupos M e N expandiram
para a região da Eurásia. O ramo M deu origem a linhagens asiáticas (C, D, E, G, Z e
M1-M40) e australianas (M42 e Q). O ramo N originou haplogrupos asiáticos (A, O e
Y), australianos (S), além dos ramos europeus à oeste (I, W e X) e o macrohaplogrupo
R. Deste último derivaram linhagens na Europa (H, J, T, U e V), na Ásia (B e F) e na
Austrália (P). Entre os povos nativos da América são encontradas as linhagens A, B, C e
D (STEWART; CHINNERY, 2015).
22
A atribuição dos haplogrupos é feita ao se avaliar a concordância entre o haplótipo e as
mutações diagnósticas previstas para o haplogrupo pela Phylotree (BANDELT; VAN
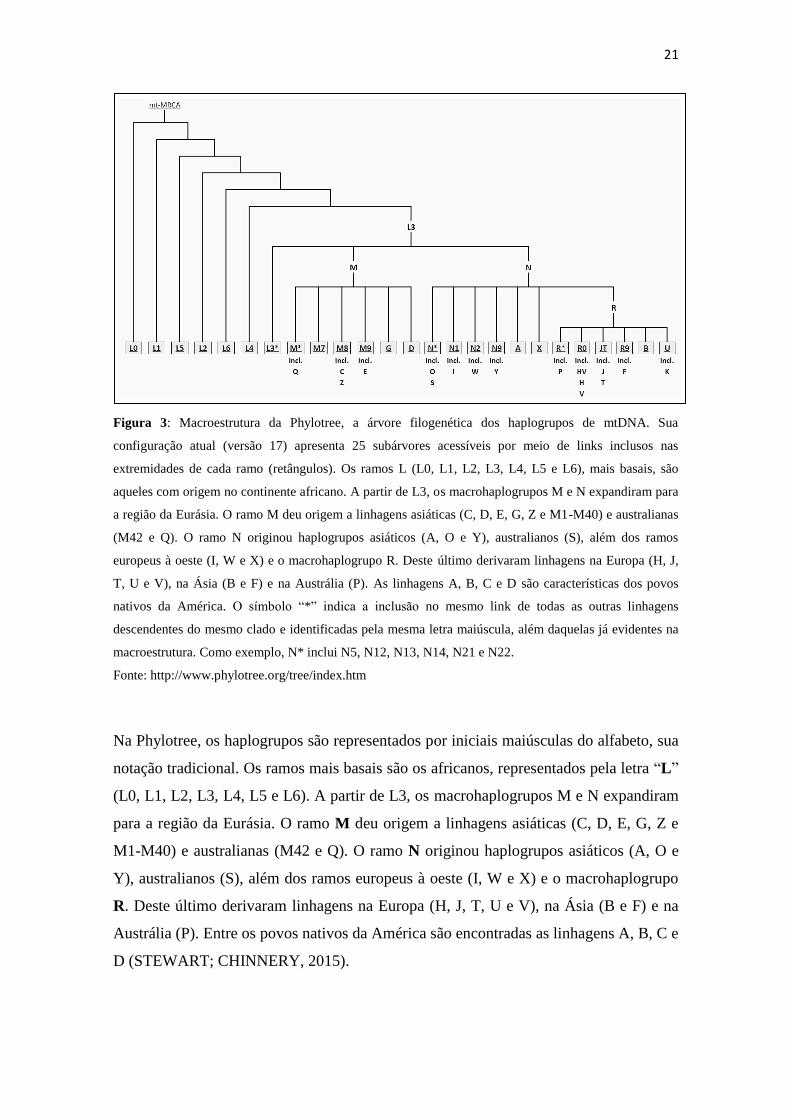
OVEN; SALAS, 2012). Como ilustrado na Figura 4, uma amostra que pertença ao sub-
haplogrupo H1a1c deverá apresentar em seu haplótipo da CR as seguintes notações:
16172C, 16209C, 73G e 16162G. Atualmente existem softwares online gratuitos que
auxiliam na classificação automática por haplogrupos. As plataformas mais utilizadas,
EMPOP e HaploGrep (WEISSENSTEINER et al., 2016), requerem a priori apenas os
dados haplotípicos.
Figura 4: Recorte da Phylotree mostrando parcialmente as relações entre os haplogrupos H. Um
haplótipo pertencente ao sub-haplogrupo H1a1c deverá apresentar todas as variantes indicadas pelas
setas, a saber, 16172C, 16209C, 73G e 16162G. Fonte: http://www.phylotree.org/tree/R0.htm
A classificação por haplogrupos insere as informações da base de dados em seu
contexto filogenético e se estabelece como critério para seleção de grupos populacionais
para comparação. Assim, as análises em genética de populações permitem investigar
sob a perspectiva das linhagens maternas:
- a estrutura genética das populações e seu nível de miscigenação (SIMÃO et al., 2018);
- o padrão de distribuição geográfica das linhagens maternas (BARRAL-ARCA et al.,
2016);
- a existência de isolamento genético (LARRUGA et al., 2001);
23
- os níveis de diferenciação entre subpopulações e a existência de subestrutura
populacional/estratificação (TERREROS et al., 2011) ;
- a conexão entre eventos demográficos do passado com a estrutura genética da
população atual (TORRONI et al., 2001);
- as semelhanças e diferenças entre o perfil genético de uma população em comparação
às demais com as quais apresenta vinculação geográfica (seja regional ou nacional) ou
histórica (SCHAAN et al., 2017).
Seja como for, as inferências populacionais são fundamentadas em métodos estatísticos
para estimativa dos parâmetros de diversidade genética (diversidade haplotípica,
número de haplótipos únicos, número médio de diferenças entre haplótipos) e das
distâncias genéticas (valores de FST) e sua significância.
3.5 Estudos populacionais sobre o DNA mitocondrial no Brasil
O primeiro estudo populacional brasileiro a abordar o mtDNA foi publicado por Santos
e colaboradores em 1996 e incluiu 139 indivíduos de 8 tribos da região amazônica.
Nesse trabalho, foram utilizadas as técnicas de RFLP e de sequenciamento em gel
desnaturante de poliacrilamida (SANTOS et al., 1996). O fragmento sequenciado, de
424 pb, pertencia a CR, porém sua posição não foi especificada.
Desde então, as pesquisas realizadas no Brasil têm evoluído quanto às metodologias
empregadas para genotipagem e análise, e quanto ao volume de dados gerados.
Atualmente, estudos de variabilidade genética mitocondrial compõem bases de dados de
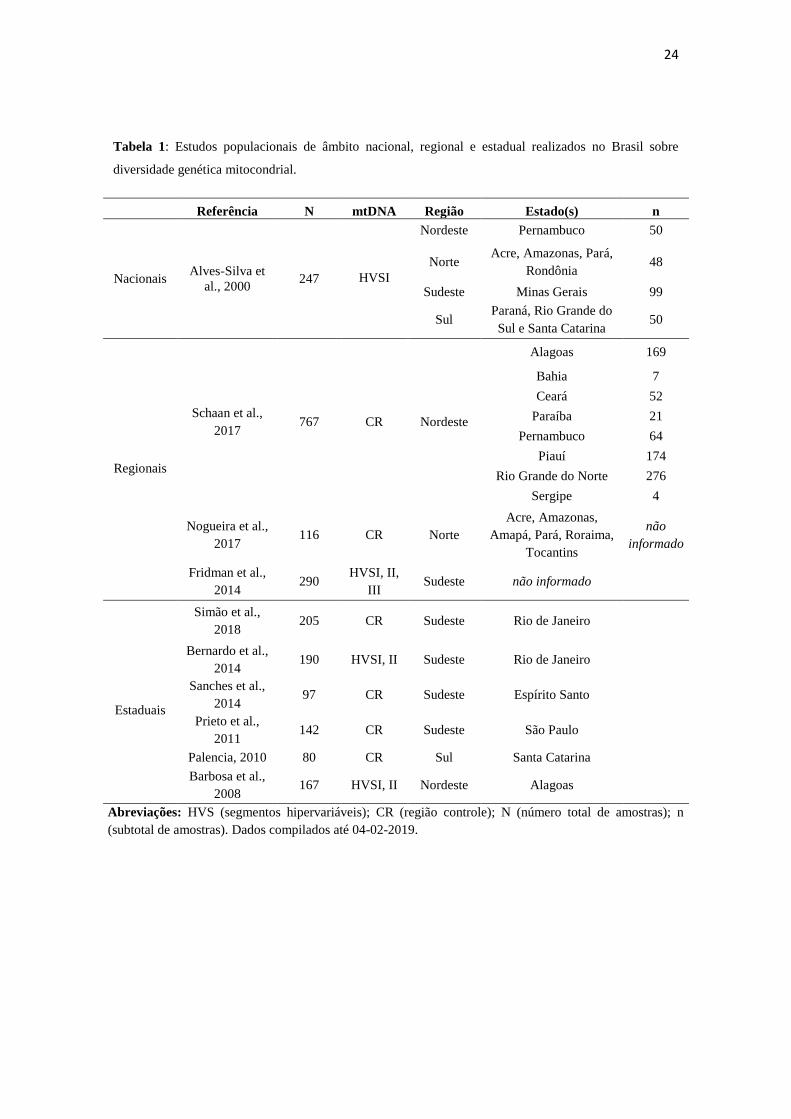
nível nacional ao estadual e variam quanto ao seu grau de cobertura da CR. A Tabela 1
ilustra parcialmente a bibliografia disponível para estudos populacionais de mtDNA,
privilegiando aqueles que adotaram a metodologia de sequenciamento pelo método
Sanger para análise dos HVS separadamente ou da região controle completa.
24
Tabela 1: Estudos populacionais de âmbito nacional, regional e estadual realizados no Brasil sobre
diversidade genética mitocondrial.
Referência N mtDNA Região Estado(s) n
Nacionais Alves-Silva et
al., 2000 247 HVSI
Nordeste Pernambuco 50
Norte Acre, Amazonas, Pará,
Rondônia 48
Sudeste Minas Gerais 99
Sul Paraná, Rio Grande do
Sul e Santa Catarina 50
Regionais
Schaan et al.,
2017 767 CR Nordeste
Alagoas 169
Bahia 7
Ceará 52
Paraíba 21
Pernambuco 64
Piauí 174
Rio Grande do Norte 276
Sergipe 4
Nogueira et al.,
2017 116 CR Norte
Acre, Amazonas,
Amapá, Pará, Roraima,
Tocantins
não
informado
Fridman et al.,
2014 290
HVSI, II,
III Sudeste não informado
Estaduais
Simão et al.,
2018 205 CR Sudeste Rio de Janeiro
Bernardo et al.,
2014 190 HVSI, II Sudeste Rio de Janeiro
Sanches et al.,
2014 97 CR Sudeste Espírito Santo
Prieto et al.,
2011 142 CR Sudeste São Paulo
Palencia, 2010 80 CR Sul Santa Catarina
Barbosa et al.,
2008 167 HVSI, II Nordeste Alagoas
Abreviações: HVS (segmentos hipervariáveis); CR (região controle); N (número total de amostras); n
(subtotal de amostras). Dados compilados até 04-02-2019.
25
4. PRINCIPAL ARTIGO CIENTÍFICO DERIVADO DA TESE
O artigo intitulado “A view of the maternal inheritance of Espírito Santo populations:
the contrast between the admixed and Pomeranian descent groups” foi submetido para
avaliação ao periódico Forensic Science International – Genetics (ISSN: 1872-4973) no
formato original paper. Essa revista apresenta fator de impacto = 5.637 e Qualis A1 em
Biotecnologia. O comprovante de submissão figura como o ANEXO 1 e as tabelas
suplementares são apresentadas como APÊNDICE 1.
26
A view of the maternal inheritance of Espírito Santo populations: the contrast between the 1
admixed and Pomeranian descent groups 2
Raquel Silva dos Reisa,c, Filipa Simãob, Victor dos Santos Stangea,c, Fernanda Mariano Garciaa,c, 3
Raquel Spinassé Dettognia, Elaine Sturc, Adriana Madeira Álvares da Silvac, Elizeu Fagundes de 4
Carvalhob, Leonor Gusmãob*, Iúri Drumond Louroa,c 5
a Núcleo de Genética Humana e Molecular (NGHM), Universidade Federal do Espírito Santo 6
(UFES), Fernando Ferrari Avenue, 514 - Goiabeiras, Vitória - Espírito Santo. Zip Code: 29075-7
910, Brazil. 8
b Laboratório de Diagnósticos por DNA (LDD), Universidade do Estado do Rio de Janeiro (UERJ), 9
São Francisco Xavier Street, 524 - Maracanã, Rio de Janeiro – Rio de Janeiro. Zip code: 20550-10
900, Brazil. 11
c Programa de Pós-Graduacão em Biotecnologia, Universidade Federal do Espírito Santo 12
(UFES), Marechal Campos Avenue, 1468 - Bonfim, Vitória - Espírito Santo. Zip code: 29047-105, 13
Brazil. 14
*Corresponding author at: Laboratório de Diagnósticos por DNA (LDD), Universidade do Estado 15
do Rio de Janeiro (UERJ), São Francisco Xavier Street, 524 - Maracanã, Rio de Janeiro – Rio de 16
Janeiro. Zip code: 20550-900, Brazil. E-mail address: [email protected] (Leonor 17
Gusmão). 18
Declarations of interest: none. 19

27
Highlights 20
This work includes samples from 4 macroregions of Espírito Santo (ES), Brazil. 21
This is the first study of total control region from Pomeranian descendants. 22
The ES stands out due to its high proportion of European ancestry. 23
The North's African heritage indicates stratification in the ES general population. 24
From mtDNA perspective, the Pomeranian descendants are genetically isolated. 25

28
ABSTRACT 26
In addition to its valuable utility in forensic investigations, mitochondrial DNA (mtDNA) analysis 27
is a reliable tool to uncover the origins of admixed populations, such as Brazilians. The state of 28
Espírito Santo (ES), similar to other coastal Brazilian states, has a population shaped by 3 main 29
ancestral roots: Amerindian, African and European. Among the latter, the Pomeranian 30
descendants stand out due to the preservation of the traditional aspects of their culture, 31
especially the Pomeranian language. Despite the genetic data already available, there is no 32
mtDNA database that adequately reflects the diversity, the geographic distribution, and the 33
origins of the maternal lineages from ES. To increase the knowledge of maternal ancestry and 34
to investigate the population’s genetic stratification, a total of 291 samples were collected in 35
the 4 macroregions (Metropolitan, South, Central and North) of ES and in the Pomeranian 36
communities. Complete control region data were produced for the general (N=214) and 37
Pomeranian (N=77) groups. Regarding the general population, the high values of haplotype 38
diversity (H=99.9%) and pairwise differences (MNPD=16.9) found are in agreement with those 39
reported for other populations in the southeast region of the country. Regarding maternal 40
inheritance, the ES populations stood out due to the predominance of European haplogroups 41
(49.1%), although the North macroregion had a higher African profile (47.1%). Among the 42
Pomeranians, the lowest MNPD value (11.2) and the high percentage of shared haplotypes 43
(15%) were indicative of founder events. The FST analysis showed that the Pomeranians (98.7% 44
of European lineages) are genetically isolated from the other admixed populations in Brazil. 45
This study demonstrated that the ES state contains singularities regarding the 46
intrapopulational and interpopulational diversity of mtDNA. Even after 5 centuries of 47
interethnic admixture, the present-day population of Espírito Santo harbors genetic marks that 48
trace back to the historical aspects of its formation. 49
Keywords: mtDNA, Brazil, macroregions, ancestry, population stratification50
29
1. Introduction 51
Although it represents a very small fraction of the entire human genome, mitochondrial DNA 52
(mtDNA) has become a useful tool in forensic and population analyses. Among its valuable 53
characteristics are the high copy number per cell, high mutation rate, small size and maternal 54
inheritance without recombination [1]. Most of the polymorphic content of the molecule 55
resides in the noncoding portion called the control region (CR), which spans 1122 bp [2]. In 56
the CR, there are even more variable fragments, called hypervariable segments (HVS) I, II and 57
III, which have a mutation rate of 5-10 times greater than that of single copy nuclear genes 58
[3]. 59
The mtDNA lineages (represented by haplotypes) are characterized by specific mutations that 60
have accumulated over the evolutionary time period [4,5]. The mtDNA lineages close to each 61
other share a set of variants that allows them to be grouped into haplogroups based on the 62
most recent common ancestry [6]. According to Phylotree [7], a phylogenetic tree of global 63
mtDNA variation, each haplotype can be allocated into one haplogroup that represents 64
African, European, Amerindian or Asian maternal ancestries [8]. Thus, mtDNA is an important 65
genetic marker to reveal the origins of heterogeneous populations. 66
The state of Espírito Santo (ES) is located in the southeast of Brazil, the most developed and 67
populous region of the country. The historical data indicate that, similar to other coastal 68
regions, its population is derived from admixture processes between Amerindians, Europeans 69
and Africans. The establishment of the first colonial nucleus by Vasco Fernandes Coutinho in 70
1535 started the Portuguese colonization of the captaincy, initially inhabited by natives 71
belonging to the Tupi-Guarani (the Tupiniquins group) and Jê (the Botocudos group) linguistic 72
families [9,10]. The direct importation of slaves from Africa dates from the end of 1621 to the 73
mid-19th century [11]. Later, between the 19th and 20th centuries, the ES received several 74
waves of immigrants, of which 97.34% were European (mainly from Italy, Germany, Spain, 75
Poland and the extinct Pomerania) [12]. Ancient Pomerania, on the southern shore of the 76
Baltic Sea, ceased to exist as a geographical unit after the end of the Second World War, and 77
its territory was divided between Germany and Poland [12]. From the second half of the 19th 78
century, many families emigrated mainly to Brazil and the United States [13]. The first 79
immigrants arrived at ES in 1859, and their descendants constitute one of the largest 80
Pomeranian communities in the world, located in the mountains of the Metropolitan 81
macroregion [12,13]. The existing geographic and cultural isolation contributes to the 82
preservation of the traditional aspects of their culture, especially the Pomeranian language, 83
which is an exclusively oral language [13,14]. 84
The last demographic census of the Brazilian Institute of Geography and Statistics (IBGE) in 85
2010 noted that the inhabitants of the ES would be divided, according to self-declaration, 86
into 48.62% Brown, 42.15% White, 8.35% Black, 0.62% Yellow and 0.26% Indigenous (or 87
Amerindian) [15]. However, self-declaration is a subjective concept that takes into account 88
mainly physical characteristics such as skin color, hair type, and nose and lip shape. According 89
to Telles [16], the classification as White, Brown or Black is consistent 79% of the time. 90
Different studies performed in order to correlate genetics and self-declared ancestries in 91
Brazilian populations point to a discrepancy between them and recommending the use of 92
30
genetic markers for a proper assessment of the ancestral genetic background of admixed 93
groups [17,18]. 94
The mtDNA pool of the present-day Brazilian population has been investigated at the local, 95
regional and national levels. The first study addressing ES was performed by Sanches et al. 96
[19], who analyzed the CR haplotypes from 97 individuals. The authors found a 97
predominance of African haplogroups (43.3%), followed by European (32.0%) and 98
Amerindian (23.7%) lineages. In the southeast region, Fridman et al. [20] reported a similar 99
frequency of Amerindian and African haplogroups (36.9% and 35.2%, respectively) followed 100
by European (27.6%) haplogroups. For the Brazilian territory, Alves-Silva et al. [21] analyzed 101
247 samples from 4 regions and found the following lineages: 39% European, 33% 102
Amerindian and 28% African. 103
Because populations can have different genetic backgrounds, specific mtDNA databases are 104
important to reveal the diversity and to estimate the frequency of matrilineal haplotypes in 105
each population. This information allows us to statistically estimate the weight of the 106
evidence in a forensic case [22,23]. Considering that the rarity of a haplotype depends on the 107
number of times it is observed in a database [24], the greater the number of unrelated 108
individuals included, the more reliable the estimate will be. 109
The present study aimed to expand the mtDNA control region data for ES by examining the 110
genetic profiles of 291 unrelated volunteers. It is important to highlight that this is the first 111
study (including population samples) to represent the 4 macroregions of ES and a sample 112
from one of the largest Pomeranian communities in the world. 113
114
2. Materials and Methods 115
2.1. Ethics statement 116
The study design and the written, informed consent form were approved by the Research 117
Ethics Committee of Centro Integrado de Atenção a Saúde – CIAS/Unimed Vitória on March 118
16, 2018 (CAAE: 79664817.4.0000.5061). All volunteers signed the informed consent form, 119
and their samples were analyzed anonymously. 120
121 2.2. Sampling and DNA extraction 122
A total of 291 samples were collected from nonrelated individuals from Espírito Santo, Brazil 123
from the following two major groups: the general and Pomeranian populations. The general 124
population group included 214 samples from the 4 macroregions of the ES state (for a total 125
of 78 cities): North (N = 17 from 7 cities), Central (N = 54 from 12 cities), Metropolitan (N = 81 126
from 15 cities) and South (N = 62 from 21 cities). 127
As recommended by the IBGE [25], all volunteers were classified according to their self-128
declaration of White, Black, Brown, Yellow or Indigenous (or Amerindian). There was no 129
record of Amerindian and Yellows, and only one participant did not declare a color. 130

31
The Pomeranian population was composed of 77 samples from the cities of Santa Maria de 131
Jetibá (N = 56), Laranja da Terra (N = 6), Domingos Martins (N = 5), Santa Leopoldina (N = 4), 132
Vila Pavão (N = 2) and Itaguaçu, Santa Teresa, Serra and Vila Valério (N = 1 for each). The 133
volunteers identified themselves as having Pomeranian descent, in addition to being born 134
and living in well-known Pomeranian communities. 135
The biological samples consisted of buccal swabs and/or peripheral blood. The latter were 136
collected either on FTA® Elute Cards (GE Healthcare) or EDTA Vacutainer® tubes (BD). 137
Genomic DNA was extracted according to the FTA Elute Card® manufacturer protocol or 138
using a standard protocol with proteinase-K digestion followed by phenol-chloroform 139
extraction and ethanol precipitation [26]. 140
2.3. mtDNA typing 141
Conventional PCR was performed to amplify the mtDNA control region (from position 16024 142
to position 576) in an 8 μl final volume reaction composed of 1–5 ng of DNA, 0.5X of Qiagen® 143
Multiplex PCR Kit and 0.2 μM of each primer. Good quality samples were amplified with the 144
L15900 and H639 primer pair (Table 1). For the poor-quality samples, the primers L15997 and 145
H639 were used instead (Table 1). The thermal cycling profile was as follows: initial 146
denaturation at 95 °C for 15 min; 30 cycles of 94 °C for 30 s, 60 °C for 90 s and 72 °C for 60 s; 147
and a final extension at 72 °C for 10 min. After checking the results of the PCR in a 1% 148
agarose-gel electrophoresis, the amplicons were purified using illustra™ ExoProStar™ 1-Step 149
reagent (GE Healthcare). CR sequencing was performed using the BigDye™ Terminator v3.1 150
Cycle Sequencing Kit (Applied Biosystems) and the same primers used for the PCR. When 151
necessary, a second round of sequencing was performed using the following internal primers, 152
described in Table 1: L314, L16268, L16555, H016, H460, H484 and H16175. The thermal 153
cycling protocol was as follows: denaturation at 96 °C for 2 min; followed by 35 cycles of 154
96 °C for 15 s, 50 °C for 9 s and 60 °C for 2 min; and a final extension at 60 °C for 10 min. The 155
Applied Biosystems Veriti™ 96-Well Thermal Cycler was used for all amplification and 156
sequencing reactions. The extension products were cleaned by ethanol/EDTA/sodium 157
acetate precipitation. The capillary electrophoresis was carried out on an ABI 3500 (Applied 158
Biosystems) sequencer using POP-7™ polymer (Applied Biosystems). 159
2.4. Sequence alignment and haplogroup classification 160
The mtDNA sequences were aligned and compared to the revised Cambridge Reference 161
Sequence (rCRS) [27] using SeqScape® software version 2.7 (Applied Biosystems). The 162
haplotypes were determined following the guidelines proposed by the International Society 163
for Forensic Genetics (ISFG) [28]. Haplogroups were assigned to EMPOP v4 [29] and 164
Haplogrep 2.0 (v2.1.13) [30]. The automated haplogrouping was manually checked on 165
Phylotree build 17, February 2016 [7]. The EMPOP tools “Network” [31] and “EMPcheck” 166
(https://empop.online/empcheck) were used to detect potential errors in the dataset. Data 167
were submitted to EMPOP [32] for quality control and will be available for forensic searches 168
under the accession number EMP00748. 169
2.5. Statistical analysis 170
32
The haplogroup frequencies were calculated by direct counting. The conversion of 171
haplotypes into DNA sequences was performed using HaploSearch software 172
(https://haplosearch.com/) [33]. The calculations of genetic diversity, haplotype frequencies, 173
and genetic distances were performed on the Arlequin software [34]. The genetic distances 174
were visualized in two-dimensional plots using the multidimensional scaling (MDS) method 175
included in the STATISTICA v8.0 program (StatSoft, Inc. 2007; www.statsoft.com). 176
177
3. Results and discussion 178
The full list of haplotypes and the corresponding haplogroups obtained in this study are 179
available in Supplementary Table S1. 180
Considering the entire set of haplotypes, point heteroplasmy was detected in 4.4% (13/291) 181
of the samples (Supplementary Table S2). All heteroplasmies occurred within the HVS I and II 182
segments, in accordance with the results described by Irwin et al. [35]. A search in the 183
EMPOP database (on November 2018) showed that the observed point heteroplasmies are 184
all recorded in the database, except for 151Y, which had already been described by Simão et 185
al. [36] in a sample from Rio de Janeiro. The most common point heteroplasmy was 16189Y, 186
(shared by 4 samples) followed by 234R (detected twice). None of these 6 samples presented 187
the same haplogroup, and no individuals were found with more than one point heteroplasmy 188
(Table S2). 189
Length heteroplasmy was frequently observed to be associated with an insertion in the C-190
tracts of HVSI, HVSII and HVSIII and in the AC dinucleotide repeat region. The length 191
heteroplasmy was also associated with the polymorphism 460C in sample F91 and with a TAA 192
insertion at position 241 of sample 96P (see Table S1). 193
194
3.1. Maternal genetic ancestry analysis 195
Regarding maternal ancestry, the most likely continental origin of each haplogroup is 196
indicated in Table S1. The following proportions were obtained for the general population 197
samples from Espírito Santo (excluding the Pomeranians): 49.1% European, 28.5% African 198
and 22.4% Amerindian lineages. 199
By comparing the overall ancestry proportions in different regions of Brazil (Fig. 1A), a 200
decreasing south-east-north gradient can be observed concerning the European lineages. The 201
northern region has the highest frequency of Amerindian haplogroups, and the African 202
haplogroups are more prevalent both in the northern and northeastern regions (Fig. 1A). 203
The ancestry profile of the general sample from Espírito Santo is similar to those from other 204
admixed populations from the southeastern regions of Brazil, namely, Rio de Janeiro, São 205
Paulo and Minas Gerais (Fig. 1B), although ES presents a higher proportion of European 206
ancestry. When studying ancestry informative autosomal indels, Manta et al. [37] found 207
higher levels of African ancestry in all southeast and northeast states than those in the rest of 208
the country, except for Espírito Santo. Therefore, Espírito Santo stands out from the 209
33
remaining east coast populations, showing a lower African influx for both the autosomal and 210
mtDNA genepools. 211
In a previous study of the mtDNA variation in 97 samples from the general population of 212
Espírito Santo [19], the authors found a higher African ancestry (43.0%) than in this study. 213
This can most likely be explained by different sampling strategies, since the haplogroup 214
distributions varied among the 4 macroregions in the present work (see Supplementary Table 215
S3; Fig. 1C). The North macroregion presented the highest proportion of African haplogroups 216
(47.1%) and the lowest European ancestry (35.3%). Indeed, the proportion of African 217
haplogroups in the North macroregion is more similar to that described for populations from 218
the northeast region than from the southeast region (Fig. 1A). This result can be due to the 219
close proximity of the northern macroregion cities to the state of Bahia, which is known to 220
have a high African heritage. In this state, Blanton et al. [38] reported an average African 221
ancestry of 46.6% using autosomal markers. The predominance of an African genetic 222
component in the northeast region was also confirmed in other states, such as Alagoas [39] 223
and Pernambuco [21], with mtDNA markers. It should be noted that the South macroregion 224
showed a slight increase in the proportion of African ancestry compared to the Metropolitan 225
and Central regions, probably due to its geographical proximity to Rio de Janeiro. Regarding 226
the greater presence of African lineages in the North and, to a lesser extent, in the South 227
macroregions, it is also important to note the asymmetric distribution of the Afro-descent 228
communities (known as Quilombos) along the territory, with 26 communities reported in the 229
North (between the cities of Conceição da Barra and São Mateus), 6 in the South, 3 in the 230
Metropolitan area, and just one in the Central region [11,40,41]. 231
The other ES macroregions showed a more uniform maternal ancestry profile, with a 232
predominance of European haplogroups, which is seen in the south of the country (Fig. 1A 233
and 1C). 234
Among the Pomeranians, 98.7% European and 1.3% Amerindian haplogroups were found. As 235
illustrated in Fig. 1C, the genetic structure of the Pomeranians is very different from the 236
other Brazilian regions regarding its maternal heritage. These data point to a genetic 237
footprint of the peculiar lifestyle maintained by the Pomerania descendants, which 238
encompasses geographic and cultural isolation. It is worth mentioning that the most 239
“Pomeranian” town of ES, Santa Maria de Jetibá (where most of the samples were collected), 240
is in the Metropolitan macroregion, only 96 km away from the capital. 241
242
3.2. Genetic distances between Brazilian populations 243
To statistically evaluate the differences observed in the ancestry of the different Brazilian 244
subpopulations, an analysis of genetic distances was performed. In addition to our samples, 245
the available data for the full CRs of other Brazilian population samples were included, 246
namely, from Santa Catarina [42], São Paulo [43], Espírito Santo (ES*) [19] and Rio de Janeiro 247
[36]. The matrix of pairwise FST values was used to design the MDS plot that is presented in 248
Fig. 2. 249

34
The results of the pairwise FST analysis showed large distances between the Pomeranians and 250
all other Brazilian population groups, with statistically significant values of nondifferentiation 251
probability (Supplementary Table S4). For the comparisons involving Santa Catarina, 252
significant p-values of nondifferentiation were found with ES*, São Paulo and Rio de Janeiro. 253
No significant genetic differences were detected among the ES macroregions, ES*, Rio de 254
Janeiro and São Paulo. 255
The results of the genetic distance analysis confirmed the genetic isolation of the 256
Pomeranian descendants, which clearly differentiate from all other Brazilian populations; this 257
includes those from the same region of the country (southeast Brazil) and even from the 258
same macroregion of Espírito Santo (Fig. 2). This distancing from the neighboring populations 259
may be the result of genetic drift enhanced by the small population size and the voluntary 260
endogamy, which results from cultural isolation. 261
262
The smaller genetic distance of the Pomeranians to the Santa Catarina population (Table S4) 263
can be explained by the predominance of the European maternal component in both 264
populations. The current populations of Pomeranian descendants and those from Santa 265
Catarina show genetic similarities dating back to the European immigration waves 266
encouraged by the Brazilian government from the second half of the 19th century [9]. In 267
addition to the German and Italian populations, the state of Santa Catarina has one of the 268
largest Pomeranian communities, which arrived there in the same period in which 269
Pomeranians arrived in ES [13]. However, beyond the present study, no other studies 270
concerning the genetic ancestry of the Pomeranians in Brazil are available. 271
272
No significant genetic differences were found between all samples from the Brazilian 273
southeast region, namely, Espírito Santo, Rio de Janeiro and São Paulo. While the relative 274
number of Amerindians does not vary greatly between the populations compared, the 275
percentage of Europeans and Africans tends to separate the southern population of Santa 276
Catarina from the southeast populations at opposite extremes. This was evidenced by the 277
pairwise comparisons. In this context, the proportions of Europeans and Africans allocate the 278
general population of ES in an intermediate position, with lower FST values (not statistically 279
significant) than those between the south and southeast populations (Table S4). 280
281
It is important to mention that although the size of the samples did not allow for the 282
detection of statistically significant differences among our population samples, the 283
distribution of haplogroups and FST values indicate a genetic stratification of the Espírito 284
Santo population. In Fig. 2, it is possible to see that Rio de Janeiro and São Paulo (2 distinct 285
states) are grouped more closely than the samples belonging to the different macroregions 286
of Espírito Santo. 287
288
As illustrated in Fig. 2, the northern macroregion is closer to the populations of Rio de Janeiro 289
and São Paulo than to the other macroregions of ES. The North presented the highest 290
percentage of African haplogroups (47%), which is consistent with data already reported in 291
neighboring states. An overrepresentation of this macroregion could explain the high 292
proportion of African lineages found in the study by Sanches et al. [19]. However, to test this 293
35
hypothesis, it would be necessary to have more detailed information on the origin of the 294
samples, and it would also be necessary to increase our sample size because the differences 295
were not found to be statistically significant. 296
297
3.3. The European background of Pomeranians 298
To gain deeper insight into the matrilineal background of the Pomeranian population from 299
Espírito Santo, a comparison was performed with the present-day populations from the 300
western Pomeranian region in Germany [44] and from the Pomerania-Kujawy region of 301
Poland [45]. In this analysis, the European populations from Portugal [46], Italy [47], Spain 302
[43] and southern Germany [48] were also included, as were samples from the Brazilian 303
states of Espírito Santo (this study), São Paulo [43], Santa Catarina [42] and Rio de Janeiro 304
[36] (after excluding all non-European haplogroups). Since the published data have different 305
resolution levels, the analysis was reduced to the HVSI and HVSII mtDNA regions, and the 306
indels between the positions of 16189-16194, 302-310 and 310-316 were discarded. 307
All pairwise comparisons resulted in very low genetic distances (FST<0.007), and the 308
nondifferentiation p-values were above the significance value (see Supplementary Table S5). 309
An attempt to represent the pairwise genetic distances in a 2D MDS plot (data not shown) 310
showed inconclusive results (the stress was approximately 16%). Therefore, the lack of 311
structure among the European populations, concerning HVSI and HVSII variation, did not 312
allow for the tracing of the origin of the Pomeranian lineages in Espírito Santo. 313
314
3.4. Self-declared and maternal ancestries 315
When comparing the self-declared and mtDNA continental origins (Fig. 3), different trends 316
among Whites, Blacks and Browns were found. Among self-declared Whites, there was an 317
increase in the proportion of European haplogroups in relation to the general population 318
sample, with a concordance of 70.4% of the time. Although it was the smallest sample, self-319
declared Africans had the highest proportion of African maternal ancestry (64.3%). Notably, 320
the percentage of self-declared Black individuals was lower in the ES macroregions, with the 321
highest proportion of African maternal lineages (in the North and South macroregions) (Table 322
S3). Among the Brown population, there was a more equitable distribution of haplogroups, 323
with an increase in the Amerindian and African lineages compared to other lineages in the 324
total population. 325
The imperfect correlation between the self-declared and mtDNA haplogroups is not 326
surprising, since the genetic ancestry of an individual can only be accessed through the 327
analysis of a large number of recombined autosomal markers. Nevertheless, the observed 328
increase in the frequency of African and Amerindian maternal lineages in the groups self-329
declared as Black or Brown is consistent with the historical data that describes the sex-biased 330
admixture processes between European males and non-European females for most South 331
American populations. 332
36
333
3.5. Haplotype diversity in Espírito Santo 334
Information on the number of unique haplotypes (U), haplotype diversity (H) and mean 335
number of pairwise differences (MNPD) for ES, including the general (with the macroregions) 336
and Pomeranian samples, is depicted in Table 2. In addition, for comparison purposes, the 337
data for the same populations used in the genetic distance analysis were also included in 338
Table 2 (from Santa Catarina, São Paulo, Rio de Janeiro and ES*). 339
In the general population, 201 different haplotypes were found among 214 samples, 340
resulting in an H value of 99.9%. The analysis per region showed similarly high values, 341
especially in the North macroregion, which also presented the highest proportion of African 342
haplogroups (47.0%). Both from the state and regional points of view, the MNPD values 343
found were similar to those observed in other Brazilian admixed populations, such as those 344
from the Southeast region, including Rio de Janeiro and São Paulo, as well as another sample 345
from ES*. The MNPD values found between the samples from the general population of 346
Espírito Santo can be considered high when compared with those from the non-admixed 347
populations, such as Europeans whose MNPD values vary from 7 to 10 [1,49,50]. It is worth 348
mentioning that a slightly lower MNPD value was found in the Central macroregion, which 349
holds the largest relative proportion of Europeans and the lowest relative proportion of 350
Africans. 351
Among the 77 Pomeranians studied, only 56 unique haplotypes were identified, and the H 352
value was 99.5% (Table 2). Taken together, the low MNPD values and the high number of 353
shared haplotypes (15%) are indicative of founder events and inbreeding. According to 354
records from the Public Archive of the state government, the Pomeranian community of the 355
ES began with the arrival of 27 families (117 people); after coming to the capital, these 356
families went directly to "Colonia of Santa Leopoldina", a current city of Santa Maria de 357
Jetibá [13]. 358
359
4. Conclusions 360
Although previous studies have repeatedly shown the highly admixed profile of the 361
Southeastern region with balanced proportions of the major haplogroups, this study provides 362
evidence that Espírito Santo is an exception and appears closer to the South; Espírito Santo 363
showed less genetic distance to European populations than the other populations from the 364
same region did. 365
Our results also indicate a genetic stratification of the general population, with a 366
geographically unequal distribution of maternal lineages. The North macroregion shows a 367
maternal genetic heritage richer in African lineages than the remaining ones. In this sense, 368
the adoption of a single database for ES may not be adequate for forensic purposes. It would 369
be more reasonable to think of the North macroregion and the Central-South Zone as distinct 370
references. 371

37
The mtDNA analyses attest that the Pomeranians are a genetically isolated population with a 372
profile that is clearly distinguishable from the other Brazilian populations due to its strong 373
maternal European ancestry. The genetic data produced by this study support the historical 374
and recent records of the preservation of the isolated and endogamic customs practiced by 375
Pomeranian descendants. This trend began almost 160 years ago, and the difficulty of 376
transportation to urban areas and a language barrier between the Portuguese and 377
Pomeranian populations (Pomeranian is a West Slavic language) limited the contact among 378
neighboring populations. 379
380
Acknowledgments 381
This work was mainly financed by Fundação de Amparo a Pesquisa do Espírito Santo (FAPES) 382
(Grant Term nº 87/2017); the Coordenação de Aperfeiçoamento de Pessoal de Nível Superior 383
– Brazil (CAPES) (Finance Code 001). LG was supported by Conselho Nacional de 384
Desenvolvimento Científico e Tecnológico – CNPq (ref. 305330/2016-0); IDL received financial 385
support from FAPES (Grant Term nº 19/2016). We are grateful to all the sample donors and 386
to the NGHM members for assistance during the sampling campaign. We also thank the 387
teams from the DNA Diagnostic Laboratory (LDD) and the Núcleo de Genética Aplicada à 388
Biodiversidade (NGACB) for their support during DNA analyses. 389
390
References 391
[1] L. Chaitanya, M. Van Oven, S. Brauer, B. Zimmermann, G. Huber, C. Xavier, W. Parson, 392 P. De Knijff, M. Kayser, High-quality mtDNA control region sequences from 680 393 individuals sampled across the Netherlands to establish a national forensic mtDNA 394 reference database, Forensic Sci. Int. Genet. 21 (2016) 158–167. 395 doi:10.1016/j.fsigen.2015.12.002. 396
[2] M. Ingman, U. Gyllensten, Analysis of the complete human mtDNA genome: 397 Methodology and inferences for human evolution, in: J. Hered., 2001. 398 doi:10.1093/jhered/92.6.454. 399
[3] W.M. Brown, E.M. Prager, A. Wang, A.C. Wilson, Mitochondrial DNA sequences of 400 primates: Tempo and mode of evolution, J. Mol. Evol. (1982). 401 doi:10.1007/BF01734101. 402
[4] A. Torroni, A. Achilli, V. Macaulay, M. Richards, H.J. Bandelt, Harvesting the fruit of the 403 human mtDNA tree, Trends Genet. 22 (2006) 339–345. doi:10.1016/j.tig.2006.04.001. 404
[5] D.C. Wallace, Bioenergetics in human evolution and disease: Implications for the 405 origins of biological complexity and the missing genetic variation of common diseases, 406 Philos. Trans. R. Soc. B Biol. Sci. (2013). doi:10.1098/rstb.2012.0267. 407
[6] S.L. Mitchell, R. Goodloe, K. Brown-gentry, S.A. Pendergrass, D.G. Murdock, D.C. 408 Crawford, Characterization of mitochondrial haplogroups in a large population-based 409 sample from the United States, 133 (2015) 861–868. doi:10.1007/s00439-014-1421-410 9.Characterization. 411
38
[7] M. van Oven, M. Kayser, Updated comprehensive phylogenetic tree of global human 412 mitochondrial DNA variation., Hum. Mutat. (2009). doi:10.1002/humu.20921. 413
[8] H.J. Bandelt, M. Van Oven, A. Salas, Haplogrouping mitochondrial DNA sequences in 414 Legal Medicine/Forensic Genetics, Int. J. Legal Med. (2012). doi:10.1007/s00414-012-415 0762-y. 416
[9] Instituto Brasilieiro de Geografia e Estatística (IBGE), Brazil: 500 years of settlement, 417 Rio de Janeiro, 2007. https://biblioteca.ibge.gov.br/visualizacao/livros/liv82844.pdf. 418
[10] P. Ehrenreich, Índios Botocudos do Espírito Santo no século XIX, Arquivo Público do 419 Estado do Espírito Santo, Vitória, 2014. 420 https://ape.es.gov.br/Media/ape/PDF/Livros/MIOLO_LivroIndiosBotocudos_Jun2014_421 041214.pdf. 422
[11] C. Maciel, Negros no Espírito Santo, Arquivo Público do Estado do Espírito Santo, 423 Vitória, 2016. 424 https://ape.es.gov.br/Media/ape/PDF/Livros/MioloLivroNegros_FINAL_BAIXA.pdf. 425
[12] C. Franceschetto, Imigrantes: base de dados da imigração estrangeira no Espírito 426 Santo nos séculos XIX e XX, Arquivo Público do Estado do Espírito Santo, Vitória, 2014. 427 https://ape.es.gov.br/Media/ape/PDF/Livros/Imigrantes_Livro_21_05_14.pdf. 428
[13] K. Granzow, Pomeranos sob o Cruzeiro do Sul: colonos alemães no Brasil, Arquivo 429 Público do Estado do Espírito Santo, Vitória, 2009. 430 https://ape.es.gov.br/Media/ape/PDF/Livros/pomeranos_sob_o_cruzeiro_do_sul.pdf. 431
[14] J. Fehlberg, P.R.M. Menandro, Terra, família e trabalho entre descendentes de 432 pomeranos no Espírito Santo, Barbarói. (2011) 80–100. 433 http://pepsic.bvsalud.org/pdf/barbaroi/n34/n34a06.pdf. 434
[15] Instituto Jones dos Santos Neves (IJSN), Distribuição populacional no espírito santo: 435 resultados do censo demográfico 2010, IJSN. (2011) 1–11. 436 http://www.ijsn.es.gov.br/biblioteca/revistas. 437
[16] E.E. Telles, Racial ambiguity among the Brazilian population, Ethn. Racial Stud. (2002). 438 doi:10.1080/01419870252932133. 439
[17] T.K.M. Leite, R.M.C. Fonseca, N.M. de França, E.J. Parra, R.W. Pereira, Genomic 440 ancestry, self-reported “color” and quantitative measures of skin pigmentation in 441 Brazilian admixed siblings, PLoS One. (2011). doi:10.1371/journal.pone.0027162. 442
[18] M.M.S.G. Cardena, Â. Ribeiro-dos-Santos, S. Santos, A.J. Mansur, A.C. Pereira, C. 443 Fridman, Assessment of the Relationship between Self-Declared Ethnicity, 444 Mitochondrial Haplogroups and Genomic Ancestry in Brazilian Individuals, PLoS One. 445 (2013). doi:10.1371/journal.pone.0062005. 446
[19] N.M. Sanches, G.G. Paneto, R.F. Figueiredo, A.O. de Mello, R.M.B. Cicarelli, 447 Mitochondrial DNA control region diversity in a population from Espirito Santo state, 448 Brazil, Mol. Biol. Rep. 41 (2014) 6645–6648. doi:10.1007/s11033-014-3547-1. 449
[20] C. Fridman, R.S. Gonzalez, A.C. Pereira, M.M.S.G. Cardena, Haplotype diversity in 450 mitochondrial DNA hypervariable region in a population of southeastern Brazil, Int. J. 451 Legal Med. 128 (2014) 589–593. doi:10.1007/s00414-014-1023-z. 452
39
[21] J. Alves-Silva, M. da Silva Santos, P.E.M. Guimarães, A.C.S. Ferreira, H.-J. Bandelt, S.D.J. 453 Pena, V.F. Prado, The Ancestry of Brazilian mtDNA Lineages, Am. J. Hum. Genet. 67 454 (2000) 444–461. doi:10.1086/303004. 455
[22] M. Holland, T. Parsons, Mitochondrial DNA Sequence Analysis - Validation and Use for 456 Forensic Casework, Forensic Sci. Rev. (1999). doi:1042-7201/11-01-99/21-50. 457
[23] A. Brandstätter, H. Niederstätter, M. Pavlic, P. Grubwieser, W. Parson, Generating 458 population data for the EMPOP database-An overview of the mtDNA sequencing and 459 data evaluation processes considering 273 Austrian control region sequences as 460 example, Forensic Sci. Int. (2007). doi:10.1016/j.forsciint.2006.05.006. 461
[24] J.M. Butler, Fundamentals of Forensic DNA Typing, 2010. doi:10.1016/C2009-0-01945-462 X. 463
[25] Instituto Brasileiro de Geografia e Estatística, Pesquisa Nacional por Amostra de 464 Domicílios (PNAD) 2014, 2015. doi:ISSN 0101-6822. 465
[26] J. Sambrook, D.W. Russell, E.F. Fritsch, T. Maniatis, Molecular cloning: a laboratory 466 manual, Cold Spring Harb. Lab. Press. (1989). doi:10.3724/SP.J.1141.2012.01075. 467
[27] R.M. Andrews, I. Kubacka, P.F. Chinnery, R.N. Lightowlers, D.M. Turnbull, N. Howell, 468 Reanalysis and revision of the cambridge reference sequence for human 469 mitochondrial DNA [5], Nat. Genet. (1999). doi:10.1038/13779. 470
[28] W. Parson, L. Gusmão, D.R. Hares, J.A. Irwin, W.R. Mayr, N. Morling, E. Pokorak, M. 471 Prinz, A. Salas, P.M. Schneider, T.J. Parsons, DNA Commission of the International 472 Society for Forensic Genetics: Revised and extended guidelines for mitochondrial DNA 473 typing, Forensic Sci. Int. Genet. (2014). doi:10.1016/j.fsigen.2014.07.010. 474
[29] A. Röck, J. Irwin, A. Dür, T. Parsons, W. Parson, SAM: String-based sequence search 475 algorithm for mitochondrial DNA database queries, Forensic Sci. Int. Genet. (2011). 476 doi:10.1016/j.fsigen.2010.10.006. 477
[30] H. Weissensteiner, D. Pacher, A. Kloss-Brandstätter, L. Forer, G. Specht, H.J. Bandelt, 478 F. Kronenberg, A. Salas, S. Schönherr, HaploGrep 2: mitochondrial haplogroup 479 classification in the era of high-throughput sequencing, Nucleic Acids Res. (2016). 480 doi:10.1093/nar/gkw233. 481
[31] B. Zimmermann, A.W. Röck, A. Dür, W. Parson, Improved visibility of character 482 conflicts in quasi-median networks with the EMPOP NETWORK software, Croat. Med. 483 J. (2014). doi:10.3325/cmj.2014.55.115. 484
[32] W. Parson, A. Dür, EMPOP-A forensic mtDNA database, Forensic Sci. Int. Genet. 485 (2007). doi:10.1016/j.fsigen.2007.01.018. 486
[33] R. Fregel, S. Delgado, HaploSearch: A tool for haplotype-sequence two-way 487 transformation, Mitochondrion. (2011). doi:10.1016/j.mito.2010.11.001. 488
[34] L. Excoffier, G. Laval, S. Schneider, Arlequin (version 3.0): An integrated software 489 package for population genetics data analysis, Evol. Bioinforma. (2005). 490 doi:10.1177/117693430500100003. 491
[35] J.A. Irwin, J.L. Saunier, H. Niederstätter, K.M. Strouss, K.A. Sturk, T.M. Diegoli, A. 492 Brandstätter, W. Parson, T.J. Parsons, Investigation of heteroplasmy in the human 493
40
mitochondrial DNA control region: A synthesis of observations from more than 5000 494 global population samples, J. Mol. Evol. 68 (2009) 516–527. doi:10.1007/s00239-009-495 9227-4. 496
[36] F. Simão, A.P. Ferreira, E.F. de Carvalho, W. Parson, L. Gusmão, Defining mtDNA 497 origins and population stratification in Rio de Janeiro, Forensic Sci. Int. Genet. (2018). 498 doi:10.1016/j.fsigen.2018.02.003. 499
[37] F. Saloum de Neves Manta, R. Pereira, R. Vianna, A. Rodolfo Beuttenmüller de Araújo, 500 D. Leite Góes Gitaí, D. Aparecida da Silva, E. de Vargas Wolfgramm, I. da Mota Pontes, 501 J. Ivan Aguiar, M. Ozório Moraes, E. Fagundes de Carvalho, L. Gusmão, Revisiting the 502 Genetic Ancestry of Brazilians Using Autosomal AIM-Indels, PLoS One. 8 (2013) 1–11. 503 doi:10.1371/journal.pone.0075145. 504
[38] R.E. Blanton, L.K. Silva, V.G. Morato, A.R. Parrado, J.P. Dias, P.R.S. Melo, E.A.G. Reis, 505 K.A.B. Goddard, M.R.T. Nunes, S.G. Rodrigues, P.F.C. Vasconcelos, J.M. Castro, M.G. 506 Reis, M.L. Barreto, M.G. Teixeira, Genetic ancestry and income are associated with 507 dengue hemorrhagic fever in a highly admixed population, Eur. J. Hum. Genet. 16 508 (2008) 762–765. doi:10.1038/ejhg.2008.4. 509
[39] A.B.G. Barbosa, L.A.F.D. Silva, D.A. Azevedo, V.Q. Balbino, L. Mauricio-Da-Silva, 510 Mitochondrial DNA control region polymorphism in the population of Alagoas State, 511 North-Eastern Brazil, J. Forensic Sci. 53 (2008) 142–146. doi:10.1111/j.1556-512 4029.2007.00619.x. 513
[40] Fundação Cultural Palmares, Certidões expedidas às comunidades remanescentes de 514 quilombos (CRQs), (2018). http://www.palmares.gov.br/wp-515 content/uploads/2015/07/COMUNIDADES-CERTIFICADAS-23-11-2018-site.pdf. 516
[41] V.M.L. Moreira, Espírito Santo indígena: conquista, trabalho, territorialidade e 517 autogoverno dos índios, 1798-1860, Arquivo Público do Estado do Espírito Santo, 518 Vitória, 2017. 519 https://ape.es.gov.br/Media/ape/PDF/Espirito_Santo_Indigena_completo_site.pdf. 520
[42] L. Palencia, L. Valverde, A. Álvarez, L.M. Cainé, S. Cardoso, M.A. Alfonso-Sánchez, M.F. 521 Pinheiro, M.M. De Pancorbo, Mitochondrial DNA diversity in a population from Santa 522 Catarina (Brazil): Predominance of the European input, Int. J. Legal Med. 124 (2010) 523 331–336. doi:10.1007/s00414-010-0464-2. 524
[43] L. Prieto, B. Zimmermann, A. Goios, A. Rodriguez-Monge, G.G. Paneto, C. Alves, A. 525 Alonso, C. Fridman, S. Cardoso, G. Lima, M.J. Anjos, M.R. Whittle, M. Montesino, 526 R.M.B. Cicarelli, A.M. Rocha, C. Albarrán, M.M. De Pancorbo, M.F. Pinheiro, M. 527 Carvalho, D.R. Sumita, W. Parson, The GHEP-EMPOP collaboration on mtDNA 528 population data - A new resource for forensic casework, Forensic Sci. Int. Genet. 529 (2011). doi:10.1016/j.fsigen.2010.10.013. 530
[44] M. Poetsch, H. Wittig, D. Krause, E. Lignitz, Mitochondrial diversity of a northeast 531 German population sample, Forensic Sci. Int. (2003). 532 doi:10.1016/j.forsciint.2003.06.001. 533
[45] B.A. Malyarchuk, T. Grzybowski, M. V. Derenko, J. Czarny, M. Woźniak, D. Miścicka-534 Śliwka, Mitochondrial DNA variability in Poles and Russians, Ann. Hum. Genet. (2002). 535 doi:10.1017/S0003480002001161. 536
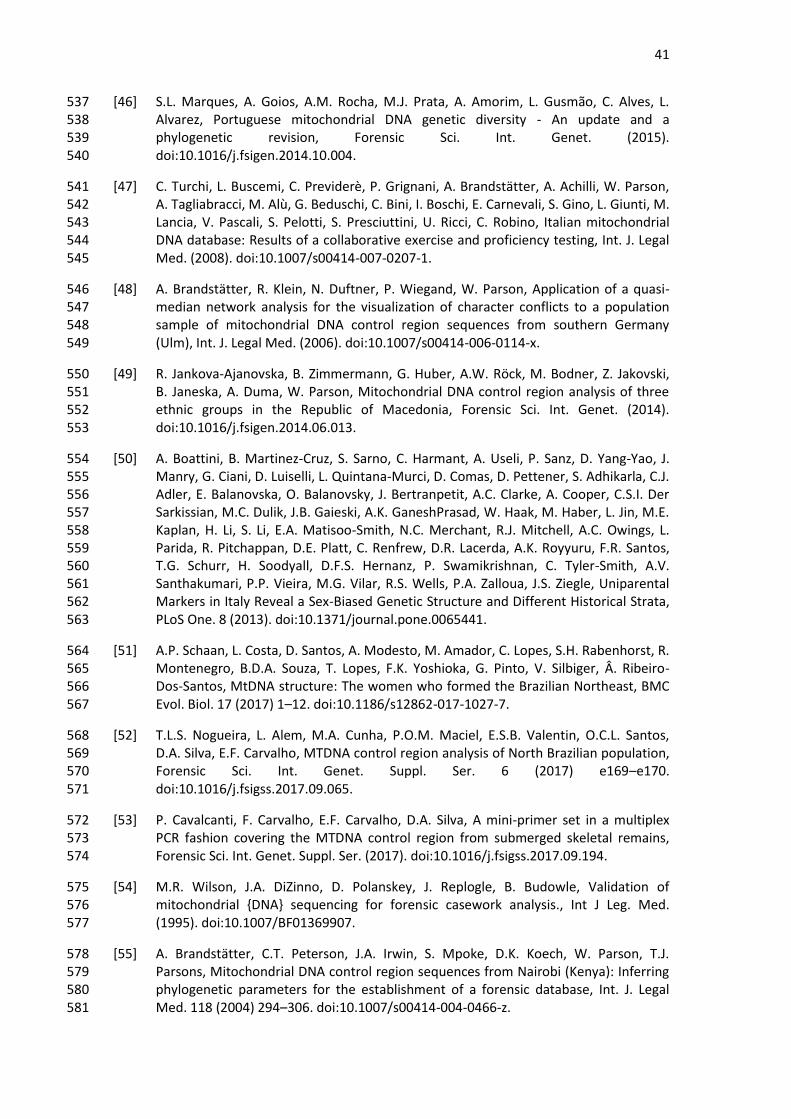
41
[46] S.L. Marques, A. Goios, A.M. Rocha, M.J. Prata, A. Amorim, L. Gusmão, C. Alves, L. 537 Alvarez, Portuguese mitochondrial DNA genetic diversity - An update and a 538 phylogenetic revision, Forensic Sci. Int. Genet. (2015). 539 doi:10.1016/j.fsigen.2014.10.004. 540
[47] C. Turchi, L. Buscemi, C. Previderè, P. Grignani, A. Brandstätter, A. Achilli, W. Parson, 541 A. Tagliabracci, M. Alù, G. Beduschi, C. Bini, I. Boschi, E. Carnevali, S. Gino, L. Giunti, M. 542 Lancia, V. Pascali, S. Pelotti, S. Presciuttini, U. Ricci, C. Robino, Italian mitochondrial 543 DNA database: Results of a collaborative exercise and proficiency testing, Int. J. Legal 544 Med. (2008). doi:10.1007/s00414-007-0207-1. 545
[48] A. Brandstätter, R. Klein, N. Duftner, P. Wiegand, W. Parson, Application of a quasi-546 median network analysis for the visualization of character conflicts to a population 547 sample of mitochondrial DNA control region sequences from southern Germany 548 (Ulm), Int. J. Legal Med. (2006). doi:10.1007/s00414-006-0114-x. 549
[49] R. Jankova-Ajanovska, B. Zimmermann, G. Huber, A.W. Röck, M. Bodner, Z. Jakovski, 550 B. Janeska, A. Duma, W. Parson, Mitochondrial DNA control region analysis of three 551 ethnic groups in the Republic of Macedonia, Forensic Sci. Int. Genet. (2014). 552 doi:10.1016/j.fsigen.2014.06.013. 553
[50] A. Boattini, B. Martinez-Cruz, S. Sarno, C. Harmant, A. Useli, P. Sanz, D. Yang-Yao, J. 554 Manry, G. Ciani, D. Luiselli, L. Quintana-Murci, D. Comas, D. Pettener, S. Adhikarla, C.J. 555 Adler, E. Balanovska, O. Balanovsky, J. Bertranpetit, A.C. Clarke, A. Cooper, C.S.I. Der 556 Sarkissian, M.C. Dulik, J.B. Gaieski, A.K. GaneshPrasad, W. Haak, M. Haber, L. Jin, M.E. 557 Kaplan, H. Li, S. Li, E.A. Matisoo-Smith, N.C. Merchant, R.J. Mitchell, A.C. Owings, L. 558 Parida, R. Pitchappan, D.E. Platt, C. Renfrew, D.R. Lacerda, A.K. Royyuru, F.R. Santos, 559 T.G. Schurr, H. Soodyall, D.F.S. Hernanz, P. Swamikrishnan, C. Tyler-Smith, A.V. 560 Santhakumari, P.P. Vieira, M.G. Vilar, R.S. Wells, P.A. Zalloua, J.S. Ziegle, Uniparental 561 Markers in Italy Reveal a Sex-Biased Genetic Structure and Different Historical Strata, 562 PLoS One. 8 (2013). doi:10.1371/journal.pone.0065441. 563
[51] A.P. Schaan, L. Costa, D. Santos, A. Modesto, M. Amador, C. Lopes, S.H. Rabenhorst, R. 564 Montenegro, B.D.A. Souza, T. Lopes, F.K. Yoshioka, G. Pinto, V. Silbiger, Â. Ribeiro-565 Dos-Santos, MtDNA structure: The women who formed the Brazilian Northeast, BMC 566 Evol. Biol. 17 (2017) 1–12. doi:10.1186/s12862-017-1027-7. 567
[52] T.L.S. Nogueira, L. Alem, M.A. Cunha, P.O.M. Maciel, E.S.B. Valentin, O.C.L. Santos, 568 D.A. Silva, E.F. Carvalho, MTDNA control region analysis of North Brazilian population, 569 Forensic Sci. Int. Genet. Suppl. Ser. 6 (2017) e169–e170. 570 doi:10.1016/j.fsigss.2017.09.065. 571
[53] P. Cavalcanti, F. Carvalho, E.F. Carvalho, D.A. Silva, A mini-primer set in a multiplex 572 PCR fashion covering the MTDNA control region from submerged skeletal remains, 573 Forensic Sci. Int. Genet. Suppl. Ser. (2017). doi:10.1016/j.fsigss.2017.09.194. 574
[54] M.R. Wilson, J.A. DiZinno, D. Polanskey, J. Replogle, B. Budowle, Validation of 575 mitochondrial {DNA} sequencing for forensic casework analysis., Int J Leg. Med. 576 (1995). doi:10.1007/BF01369907. 577
[55] A. Brandstätter, C.T. Peterson, J.A. Irwin, S. Mpoke, D.K. Koech, W. Parson, T.J. 578 Parsons, Mitochondrial DNA control region sequences from Nairobi (Kenya): Inferring 579 phylogenetic parameters for the establishment of a forensic database, Int. J. Legal 580 Med. 118 (2004) 294–306. doi:10.1007/s00414-004-0466-z. 581

42
[56] S.M. Edson, J.P. Ross, M.D. Coble, T.J. Parson, S.M. Barritt, Naming the Dead - 582 Confronting the Realities of Rapid Identification of Degraded Skeletal Remains, 583 Forensic Sci Rev. 16 (2004) 63–90. 584
585
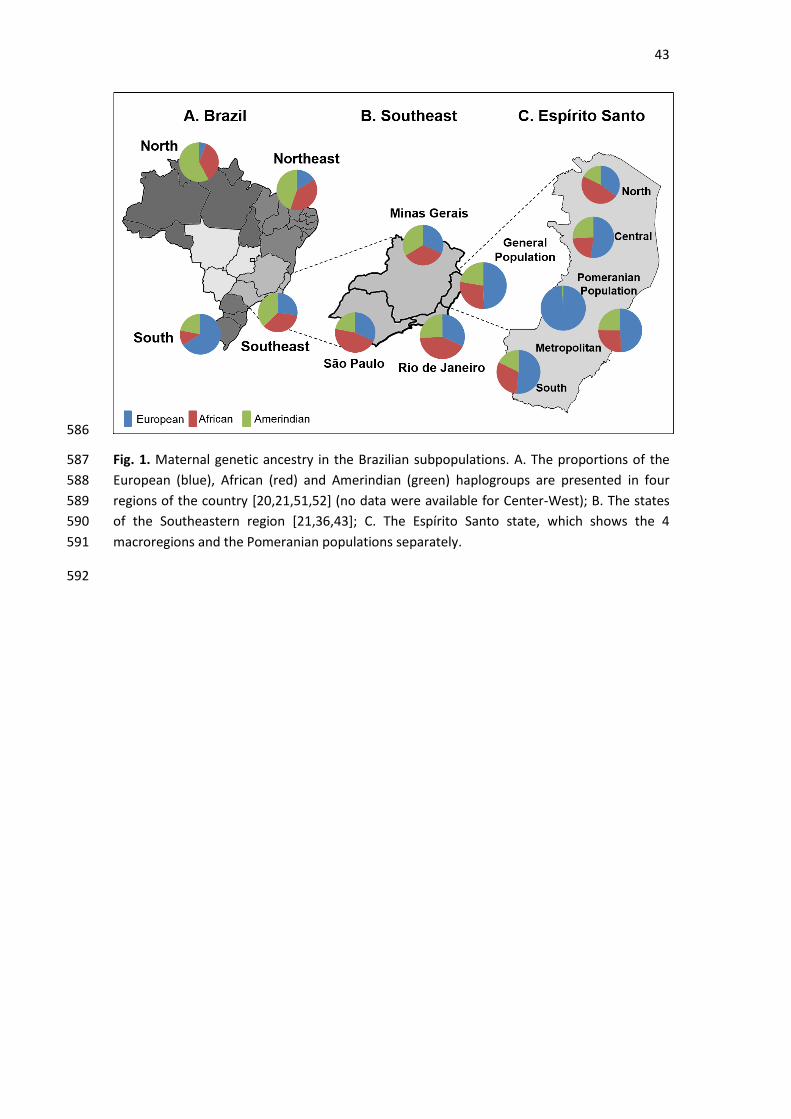
43
586
Fig. 1. Maternal genetic ancestry in the Brazilian subpopulations. A. The proportions of the 587
European (blue), African (red) and Amerindian (green) haplogroups are presented in four 588
regions of the country [20,21,51,52] (no data were available for Center-West); B. The states 589
of the Southeastern region [21,36,43]; C. The Espírito Santo state, which shows the 4 590
macroregions and the Pomeranian populations separately. 591
592
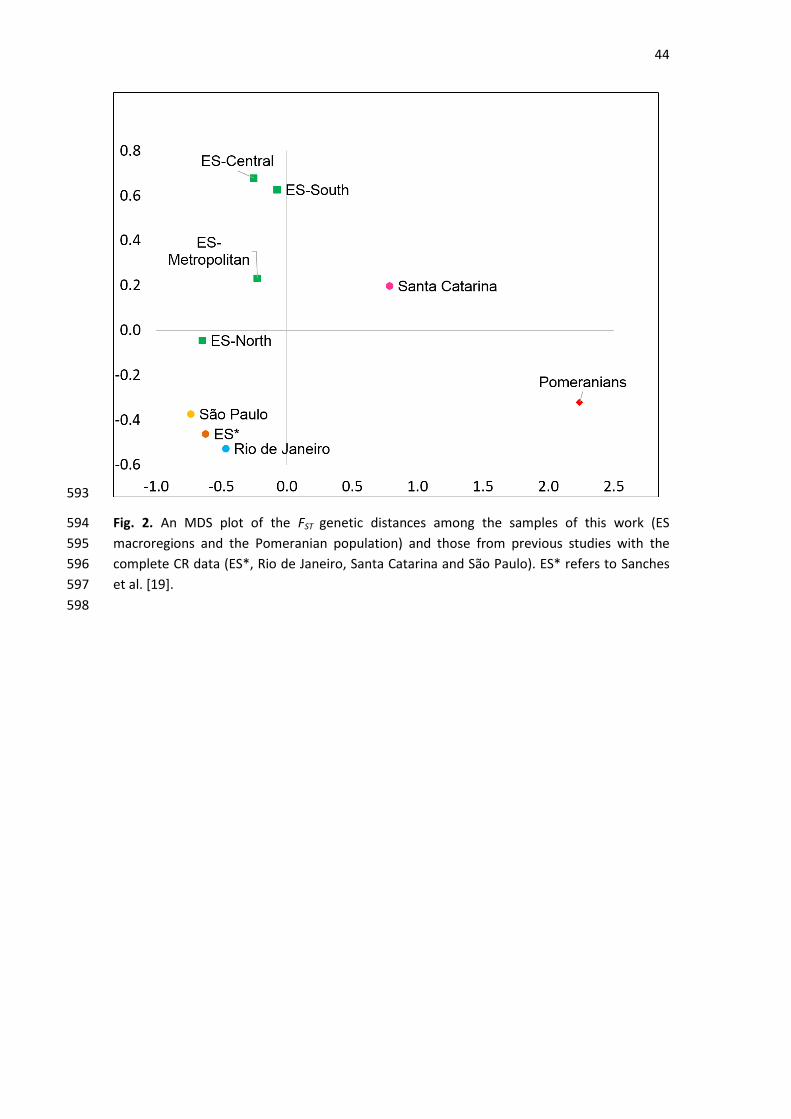
44
593
Fig. 2. An MDS plot of the FST genetic distances among the samples of this work (ES 594
macroregions and the Pomeranian population) and those from previous studies with the 595
complete CR data (ES*, Rio de Janeiro, Santa Catarina and São Paulo). ES* refers to Sanches 596
et al. [19]. 597
598
45
599
600
Fig. 3. A comparison between the self-declared ethnicity data and the maternal ancestry 601
data in the general population of Espírito Santo. 602
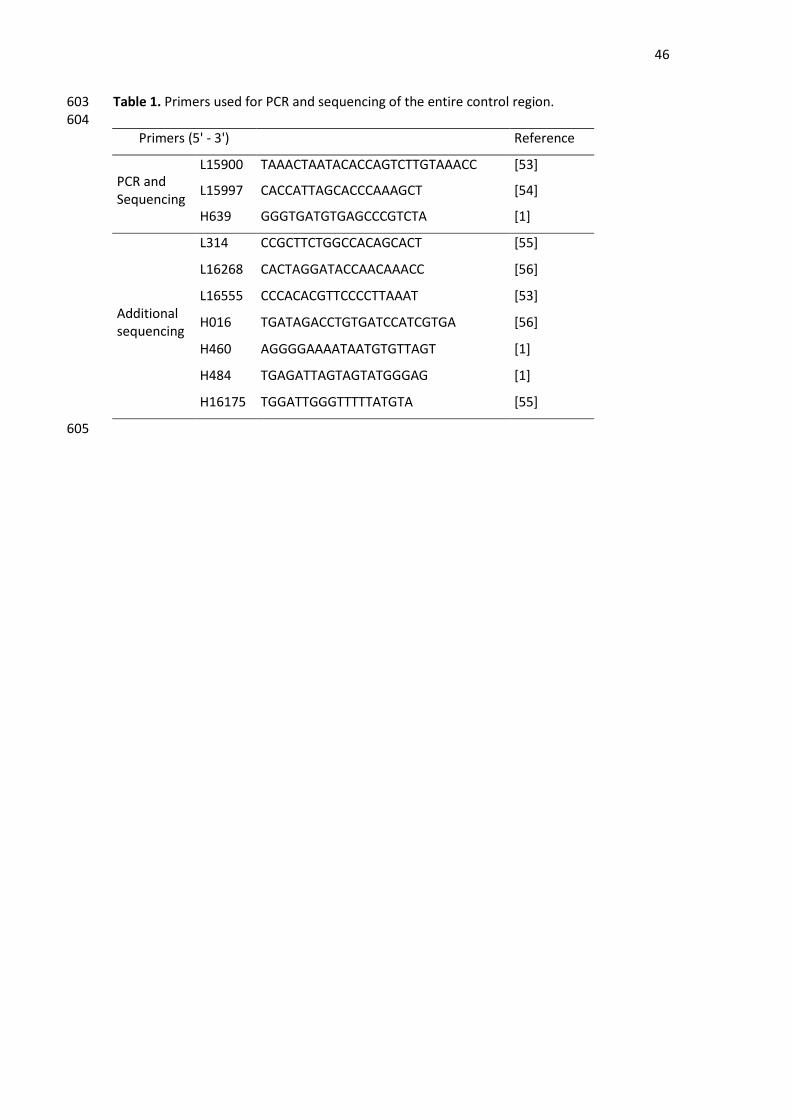
46
Table 1. Primers used for PCR and sequencing of the entire control region. 603 604
Primers (5' - 3')
Reference
PCR and Sequencing
L15900 TAAACTAATACACCAGTCTTGTAAACC [53]
L15997 CACCATTAGCACCCAAAGCT [54]
H639 GGGTGATGTGAGCCCGTCTA [1]
Additional sequencing
L314 CCGCTTCTGGCCACAGCACT [55]
L16268 CACTAGGATACCAACAAACC [56]
L16555 CCCACACGTTCCCCTTAAAT [53]
H016 TGATAGACCTGTGATCCATCGTGA [56]
H460 AGGGGAAAATAATGTGTTAGT [1]
H484 TGAGATTAGTAGTATGGGAG [1]
H16175 TGGATTGGGTTTTTATGTA [55]
605

47
Table 2. Standard diversity indices.
Populations N T U H MNPD Reference
Espírito Santo (ES)
ES-Metropolitan 81 79 77 0.9994 ± 0.0021 17.246 ± 7.746
This study
ES-South 62 59 56 0.9984 ± 0.0033 17.099 ± 7.707
ES-Central 54 53 52 0.9993 ± 0.0037 16.326 ± 7.387
ES-North 17 17 17 1.0000 ± 0.0202 17.566 ± 8.213
General population
214 201 189 0.9994 ± 0.0005 16.893 ± 7.545
Pomeranian population
77 66 56 0.9959 ± 0.0029 11.198 ± 5.140
Espírito Santo (ES*) 95 91 87 0.9991 ± 0.0017 17.732811 ± 7.943552 [19]
Other Brazilian populations
Rio de Janeiro 205 194 184 0.9994 ± 0.0006 18.591 ± 8.274 [36]
São Paulo 142 134 127 0.9991 ± 0.0010 17.134 ± 7.664 [43]
Santa Catarina 80 66 56 0.9943 ± 0.0031 15.704 ± 7.082 [42]
Abbreviations: N (number of samples); T (total number of haplotypes); U (number of unique haplotypes); H (haplotype diversity) and MNPD (mean number of pairwise differences).
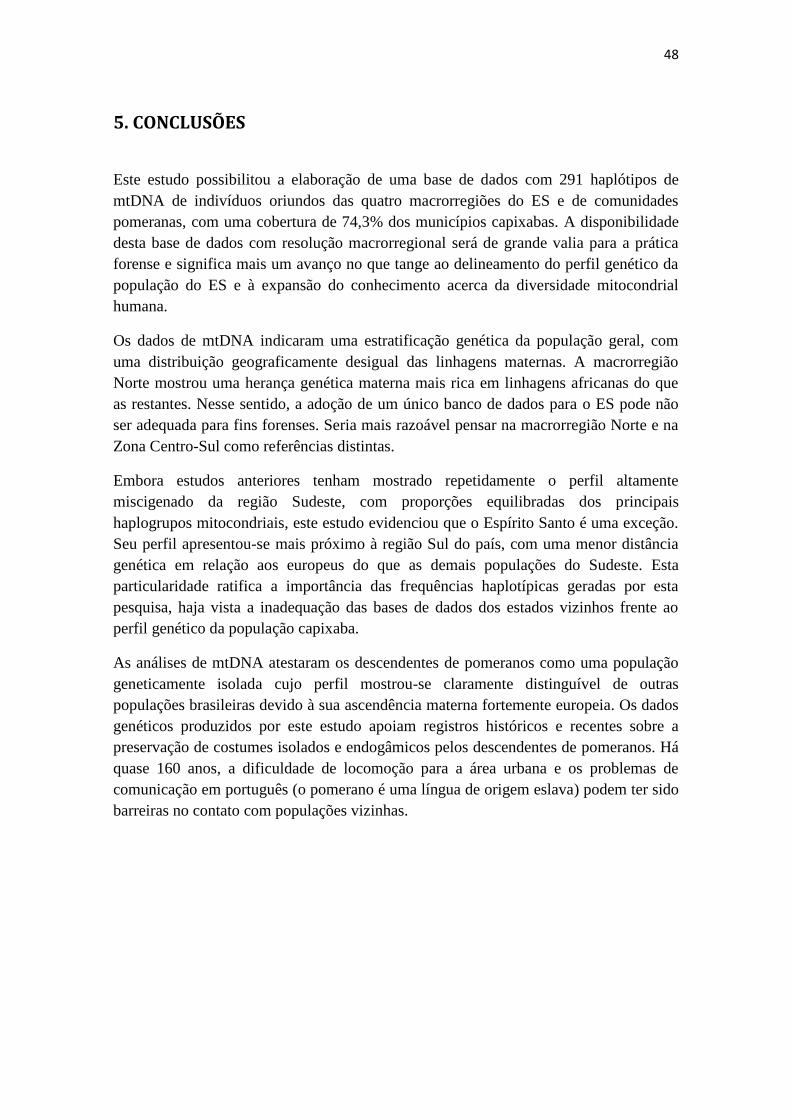
48
5. CONCLUSÕES
Este estudo possibilitou a elaboração de uma base de dados com 291 haplótipos de
mtDNA de indivíduos oriundos das quatro macrorregiões do ES e de comunidades
pomeranas, com uma cobertura de 74,3% dos municípios capixabas. A disponibilidade
desta base de dados com resolução macrorregional será de grande valia para a prática
forense e significa mais um avanço no que tange ao delineamento do perfil genético da
população do ES e à expansão do conhecimento acerca da diversidade mitocondrial
humana.
Os dados de mtDNA indicaram uma estratificação genética da população geral, com
uma distribuição geograficamente desigual das linhagens maternas. A macrorregião
Norte mostrou uma herança genética materna mais rica em linhagens africanas do que
as restantes. Nesse sentido, a adoção de um único banco de dados para o ES pode não
ser adequada para fins forenses. Seria mais razoável pensar na macrorregião Norte e na
Zona Centro-Sul como referências distintas.
Embora estudos anteriores tenham mostrado repetidamente o perfil altamente
miscigenado da região Sudeste, com proporções equilibradas dos principais
haplogrupos mitocondriais, este estudo evidenciou que o Espírito Santo é uma exceção.
Seu perfil apresentou-se mais próximo à região Sul do país, com uma menor distância
genética em relação aos europeus do que as demais populações do Sudeste. Esta
particularidade ratifica a importância das frequências haplotípicas geradas por esta
pesquisa, haja vista a inadequação das bases de dados dos estados vizinhos frente ao
perfil genético da população capixaba.
As análises de mtDNA atestaram os descendentes de pomeranos como uma população
geneticamente isolada cujo perfil mostrou-se claramente distinguível de outras
populações brasileiras devido à sua ascendência materna fortemente europeia. Os dados
genéticos produzidos por este estudo apoiam registros históricos e recentes sobre a
preservação de costumes isolados e endogâmicos pelos descendentes de pomeranos. Há
quase 160 anos, a dificuldade de locomoção para a área urbana e os problemas de
comunicação em português (o pomerano é uma língua de origem eslava) podem ter sido
barreiras no contato com populações vizinhas.
49
6. REFERÊNCIAS
ALVES-SILVA, J. et al. The Ancestry of Brazilian mtDNA Lineages. The American
Journal of Human Genetics, v. 67, n. 2, p. 444–461, 2000.
ANDERSON, S. et al. Sequence and organization of the human mitochondrial genome.
Nature, 1981.
ANDREWS, R. M. et al. Reanalysis and revision of the cambridge reference
sequence for human mitochondrial DNA [5]Nature Genetics, 1999.
BANDELT, H. J.; VAN OVEN, M.; SALAS, A. Haplogrouping mitochondrial DNA
sequences in Legal Medicine/Forensic Genetics. International Journal of Legal
Medicine, 2012.
BARBOSA, A. B. G. et al. Mitochondrial DNA control region polymorphism in the
population of Alagoas State, North-Eastern Brazil. Journal of Forensic Sciences, v. 53,
n. 1, p. 142–146, 2008.
BARRAL-ARCA, R. et al. Meta-analysis of mitochondrial DNA variation in the Iberian
Peninsula. PLoS ONE, v. 11, n. 7, p. 1–17, 2016.
BENDER, K.; SCHNEIDER, P. M.; RITTNER, C. Application of mtDNA sequence
analysis in forensic casework for the identification of human remains. Forensic
Science International. Anais...2000
BERNARDO, S. et al. MtDNA ancestry of Rio de Janeiro population, Brazil.
Molecular Biology Reports, v. 41, n. 4, p. 1945–1950, 2014.
BRANDSTÄTTER, A. et al. Mitochondrial DNA control region sequences from
Nairobi (Kenya): Inferring phylogenetic parameters for the establishment of a forensic
database. International Journal of Legal Medicine, v. 118, n. 5, p. 294–306, 2004.
BRANDSTÄTTER, A. et al. Generating population data for the EMPOP database-An
overview of the mtDNA sequencing and data evaluation processes considering 273
Austrian control region sequences as example. Forensic Science International, 2007.
BROWN, W. M. et al. Mitochondrial DNA sequences of primates: Tempo and mode of
evolution. Journal of Molecular Evolution, 1982.
BUDOWLE, B. et al. FORENSICS ANDMITOCHONDRIAL DNA: Applications,
Debates, and Foundations. Annual Review of Genomics and Human Genetics, v. 4,
n. 1, p. 119–141, 2003.
BUTLER, J. M. Fundamentals of Forensic DNA Typing. [s.l: s.n.].
BUTLER, J. M. Advanced Topics in Forensic DNA Typing: Methodology. [s.l: s.n.].
BUTLER, J. M.; WILSON, M. R.; REEDER, D. J. Rapid mitochondrial DNA typing
using restriction enzyme digestion of polymerase chain reaction amplicons
followed by capillary electrophoresis separation with laser-induced fluorescence
detection. Electrophoresis. Anais...1998
50
CARRACEDO, A. et al. DNA Commission of the International Society for Forensic
Genetics: Guidelines for mitochondrial DNA typing. Forensic Science International,
2000.
CAVELIER, L. et al. MtDNA substitution rate and segregation of heteroplasmy in
coding and noncoding regions. Human Genetics, 2000.
CHAITANYA, L. et al. High-quality mtDNA control region sequences from 680
individuals sampled across the Netherlands to establish a national forensic mtDNA
reference database. Forensic Science International: Genetics, v. 21, p. 158–167, 2016.
EDSON, S. M. et al. Naming the Dead — Confronting the Realities of Rapid
Identification of Degraded Skeletal Remains. Forensic Science Review, v. 16, n. 1, p.
63–90, 2004.
ELSON, J. L. et al. Analysis of European mtDNAs for Recombination. The American
Journal of Human Genetics, v. 68, n. 1, p. 145–153, 2001.
ESPÍRITO SANTO (Estado). Lei no 9.768, de 28 de dezembro 2011Vitória, 2011.
Disponível em:
<http://www3.al.es.gov.br/Arquivo/Documents/legislacao/html/LO9768.html>. Acesso
em: 6 dez. 2018.
FRANCESCHETTO, C. Imigrantes: base de dados da imigração estrangeira no
Espírito Santo nos séculos XIX e XX. Vitória: Arquivo Público do Estado do Espírito
Santo, 2014.
FRIDMAN, C. et al. Haplotype diversity in mitochondrial DNA hypervariable region in
a population of southeastern Brazil. International Journal of Legal Medicine, v. 128,
n. 4, p. 589–593, 2014.
GRANZOW, K. Pomeranos sob o Cruzeiro do Sul: colonos alemães no Brasil.
Vitória: Arquivo Público do Estado do Espírito Santo, 2009.
HOLLAND, M. M. et al. Mitochondrial DNA Sequence Analysis of Human Skeletal
Remains: Identification of Remains from the Vietnam War. Journal of Forensic
Sciences, 1993.
INGMAN, M.; GYLLENSTEN, U. Analysis of the complete human mtDNA genome:
Methodology and inferences for human evolution. Journal of Heredity, v. 92, n. 6, p.
454–461, 2001.
INSTITUTO BRASILIEIRO DE GEOGRAFIA E ESTATÍSTICA (IBGE). Brazil: 500
years of settlement. Rio de Janeiro: [s.n.].
IRWIN, J. A. et al. Investigation of heteroplasmy in the human mitochondrial DNA
control region: A synthesis of observations from more than 5000 global population
samples. Journal of Molecular Evolution, v. 68, n. 5, p. 516–527, 2009.
KUKAT, C. et al. Super-resolution microscopy reveals that mammalian mitochondrial
nucleoids have a uniform size and frequently contain a single copy of mtDNA.
Proceedings of the National Academy of Sciences, 2011.
LARRUGA, J. M. et al. Mitochondrial DNA characterisation of European isolates: The
51
Maragatos from Spain. European Journal of Human Genetics, v. 9, n. 9, p. 708–716,
2001.
LECLAIR, B. et al. Bioinformatics and human identification in mass fatality
incidents: The World Trade Center disaster. Journal of Forensic Sciences.
Anais...2007
LUTZ, S. et al. mtDNA as a tool for identification of human remains: Identification
using mtDNA. International Journal of Legal Medicine, v. 109, n. 4, p. 205–209,
1996.
MACAULAY, V. et al. The Emerging Tree of West Eurasian mtDNAs: A Synthesis of
Control-Region Sequences and RFLPs. The American Journal of Human Genetics, v.
64, n. 1, p. 232–249, 1999.
MELTON, T. et al. Forensic mitochondrial DNA analysis of 691 casework hairs. J
Forensic Sci, 2005.
MITCHELL, S. L. et al. Characterization of mitochondrial haplogroups in a large
population-based sample from the United States. v. 133, n. 7, p. 861–868, 2015.
MONSON, K. L. et al. The mtDNA population database: an integrated software and
database resource for forensic comparison. Forensic Science Communications
(http://www.fbi.gov/hq/lab/fsc/current/index.htm), 2002.
NOGUEIRA, T. L. S. et al. MTDNA control region analysis of North Brazilian
population. Forensic Science International: Genetics Supplement Series, v. 6, n.
September, p. e169–e170, 2017.
PARSON, W. et al. DNA Commission of the International Society for Forensic
Genetics: Revised and extended guidelines for mitochondrial DNA typing. Forensic
Science International: Genetics, v. 13, p. 134–142, 2014.
PARSON, W.; DÜR, A. EMPOP-A forensic mtDNA database. Forensic Science
International: Genetics, 2007.
PATANANAN, A. N. et al. Modifying the Mitochondrial Genome. Cell Metabolism,
v. 23, n. 5, p. 785–796, 2016.
PRIETO, L. et al. The GHEP-EMPOP collaboration on mtDNA population data - A
new resource for forensic casework. Forensic Science International: Genetics, 2011.
RICHARDS, M.; MACAULAY, V. The mitochondrial gene tree comes of age. The
American Journal of Human Genetics, v. 68, n. 6, p. 1315–1320, 2001.
SANCHES, N. M. et al. Mitochondrial DNA control region diversity in a population
from Espirito Santo state, Brazil. Molecular Biology Reports, v. 41, n. 10, p. 6645–
6648, 2014.
SANTOS, S. E. B. et al. Multiple founder haplotypes of mitochondrial DNA in
Amerindians revealed by RFLP and sequencing. Annals of Human Genetics, 1996.
SCHAAN, A. P. et al. MtDNA structure: The women who formed the Brazilian
Northeast. BMC Evolutionary Biology, v. 17, n. 1, p. 1–12, 2017.
52
SIMÃO, F. et al. Defining mtDNA origins and population stratification in Rio de
Janeiro. Forensic Science International: Genetics, 2018.
STEWART, J. B.; CHINNERY, P. F. The dynamics of mitochondrial DNA
heteroplasmy: Implications for human health and disease. Nature Reviews Genetics, v.
16, n. 9, p. 530–542, 2015.
SWGDAM - SCIENTIFIC WORKING GROUP ON DNA ANALYSIS METHODS.
Interpretation Guidelines for Mitochondrial DNA Analysis by Forensic DNA
Testing Laboratories, 2013. Disponível em:
<http://media.wix.com/ugd/4344b0_c5e20877c02f403c9ba16770e8d41937.pdf>
TERREROS, M. C. et al. Mitochondrial DNA and Y-chromosomal stratification in Iran:
Relationship between Iran and the Arabian Peninsula. Journal of Human Genetics, v.
56, n. 3, p. 235–246, 2011.
TORRONI, A. et al. Classification of european mtDNAs from an analysis of three
European populations. Genetics, 1996.
TORRONI, A. et al. A signal, from human mtDNA, of postglacial recolonization in
Europe. American journal of human genetics, v. 69, n. 4, p. 844–52, 2001.
TULLY, L. A. et al. A Sensitive Denaturing Gradient-Gel Electrophoresis Assay
Reveals a High Frequency of Heteroplasmy in Hypervariable Region 1 of the Human
mtDNA Control Region. Am. J. Hum. Genet, 2000.
VAN OVEN, M.; KAYSER, M. Updated comprehensive phylogenetic tree of global
human mitochondrial DNA variation. Human mutation, v. 30, n. 2, p. 386–394, 2009.
WEISSENSTEINER, H. et al. HaploGrep 2: mitochondrial haplogroup classification in
the era of high-throughput sequencing. Nucleic acids research, 2016.
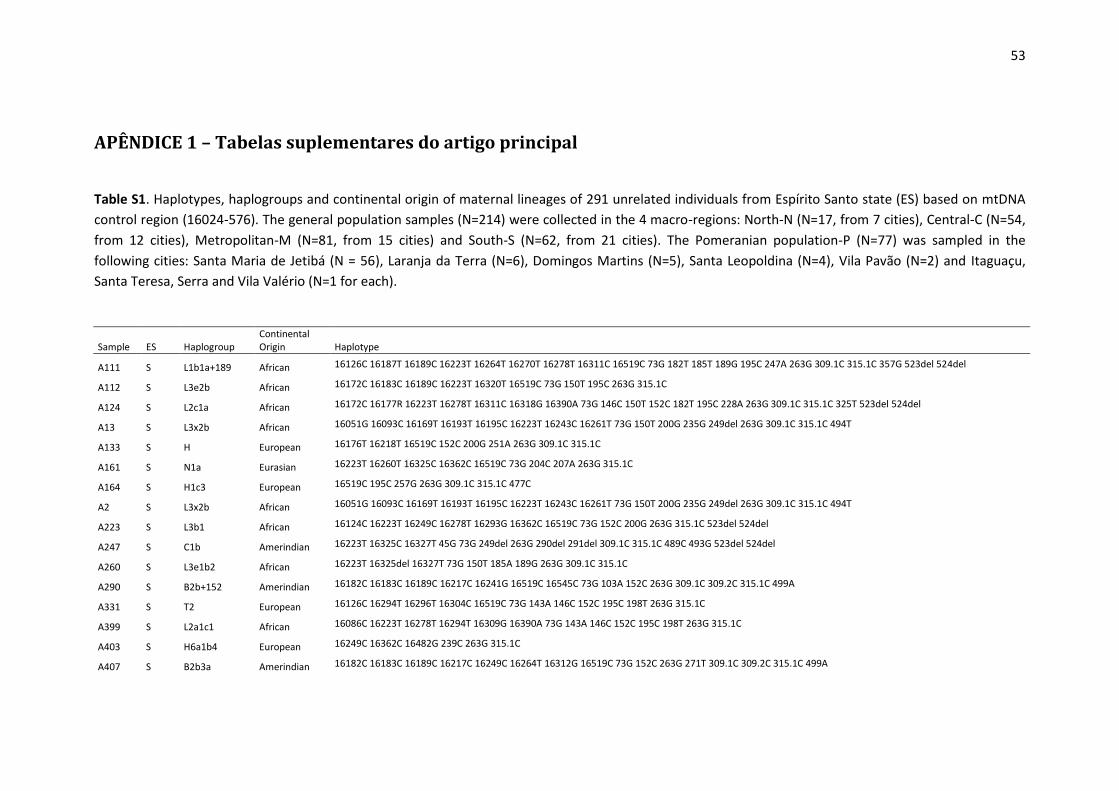
53
APÊNDICE 1 – Tabelas suplementares do artigo principal
Table S1. Haplotypes, haplogroups and continental origin of maternal lineages of 291 unrelated individuals from Espírito Santo state (ES) based on mtDNA
control region (16024-576). The general population samples (N=214) were collected in the 4 macro-regions: North-N (N=17, from 7 cities), Central-C (N=54,
from 12 cities), Metropolitan-M (N=81, from 15 cities) and South-S (N=62, from 21 cities). The Pomeranian population-P (N=77) was sampled in the
following cities: Santa Maria de Jetibá (N = 56), Laranja da Terra (N=6), Domingos Martins (N=5), Santa Leopoldina (N=4), Vila Pavão (N=2) and Itaguaçu,
Santa Teresa, Serra and Vila Valério (N=1 for each).
Sample ES Haplogroup Continental Origin Haplotype
A111 S L1b1a+189 African 16126C 16187T 16189C 16223T 16264T 16270T 16278T 16311C 16519C 73G 182T 185T 189G 195C 247A 263G 309.1C 315.1C 357G 523del 524del
A112 S L3e2b African 16172C 16183C 16189C 16223T 16320T 16519C 73G 150T 195C 263G 315.1C
A124 S L2c1a African 16172C 16177R 16223T 16278T 16311C 16318G 16390A 73G 146C 150T 152C 182T 195C 228A 263G 309.1C 315.1C 325T 523del 524del
A13 S L3x2b African 16051G 16093C 16169T 16193T 16195C 16223T 16243C 16261T 73G 150T 200G 235G 249del 263G 309.1C 315.1C 494T
A133 S H European 16176T 16218T 16519C 152C 200G 251A 263G 309.1C 315.1C
A161 S N1a Eurasian 16223T 16260T 16325C 16362C 16519C 73G 204C 207A 263G 315.1C
A164 S H1c3 European 16519C 195C 257G 263G 309.1C 315.1C 477C
A2 S L3x2b African 16051G 16093C 16169T 16193T 16195C 16223T 16243C 16261T 73G 150T 200G 235G 249del 263G 309.1C 315.1C 494T
A223 S L3b1 African 16124C 16223T 16249C 16278T 16293G 16362C 16519C 73G 152C 200G 263G 315.1C 523del 524del
A247 S C1b Amerindian 16223T 16325C 16327T 45G 73G 249del 263G 290del 291del 309.1C 315.1C 489C 493G 523del 524del
A260 S L3e1b2 African 16223T 16325del 16327T 73G 150T 185A 189G 263G 309.1C 315.1C
A290 S B2b+152 Amerindian 16182C 16183C 16189C 16217C 16241G 16519C 16545C 73G 103A 152C 263G 309.1C 309.2C 315.1C 499A
A331 S T2 European 16126C 16294T 16296T 16304C 16519C 73G 143A 146C 152C 195C 198T 263G 315.1C
A399 S L2a1c1 African 16086C 16223T 16278T 16294T 16309G 16390A 73G 143A 146C 152C 195C 198T 263G 315.1C
A403 S H6a1b4 European 16249C 16362C 16482G 239C 263G 315.1C
A407 S B2b3a Amerindian 16182C 16183C 16189C 16217C 16249C 16264T 16312G 16519C 73G 152C 263G 271T 309.1C 309.2C 315.1C 499A
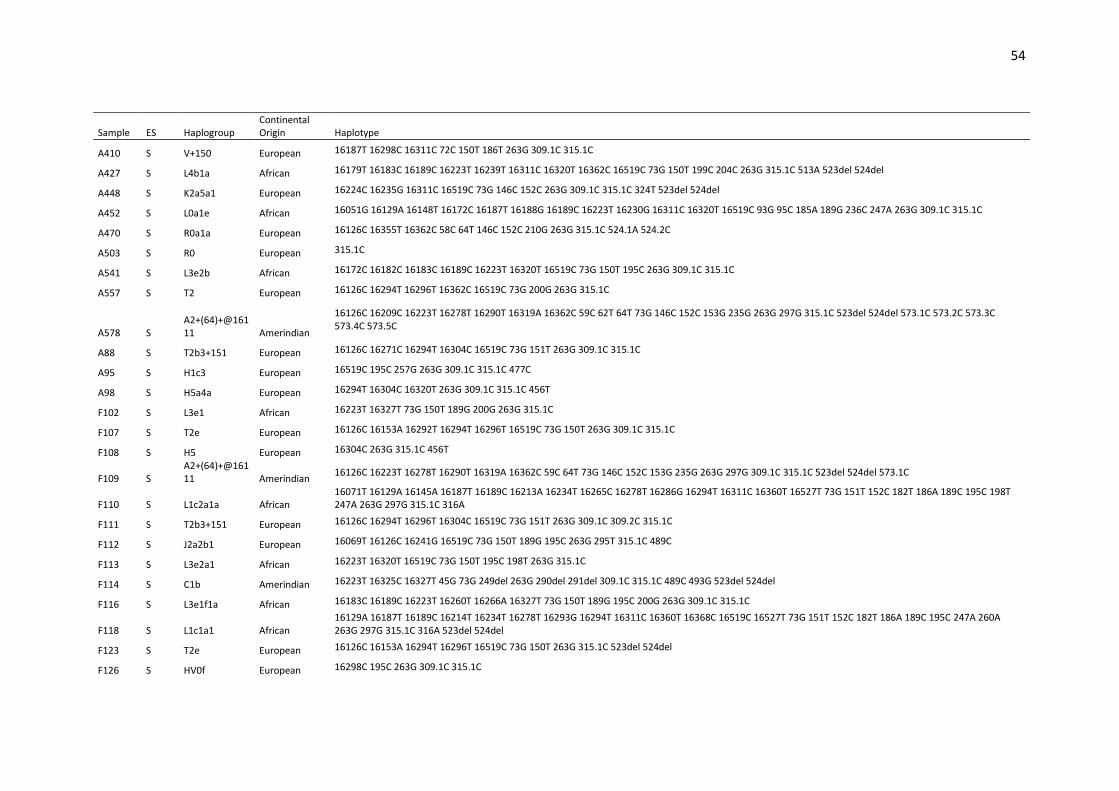
54
Sample ES Haplogroup Continental Origin Haplotype
A410 S V+150 European 16187T 16298C 16311C 72C 150T 186T 263G 309.1C 315.1C
A427 S L4b1a African 16179T 16183C 16189C 16223T 16239T 16311C 16320T 16362C 16519C 73G 150T 199C 204C 263G 315.1C 513A 523del 524del
A448 S K2a5a1 European 16224C 16235G 16311C 16519C 73G 146C 152C 263G 309.1C 315.1C 324T 523del 524del
A452 S L0a1e African 16051G 16129A 16148T 16172C 16187T 16188G 16189C 16223T 16230G 16311C 16320T 16519C 93G 95C 185A 189G 236C 247A 263G 309.1C 315.1C
A470 S R0a1a European 16126C 16355T 16362C 58C 64T 146C 152C 210G 263G 315.1C 524.1A 524.2C
A503 S R0 European 315.1C
A541 S L3e2b African 16172C 16182C 16183C 16189C 16223T 16320T 16519C 73G 150T 195C 263G 309.1C 315.1C
A557 S T2 European 16126C 16294T 16296T 16362C 16519C 73G 200G 263G 315.1C
A578 S A2+(64)+@16111 Amerindian
16126C 16209C 16223T 16278T 16290T 16319A 16362C 59C 62T 64T 73G 146C 152C 153G 235G 263G 297G 315.1C 523del 524del 573.1C 573.2C 573.3C 573.4C 573.5C
A88 S T2b3+151 European 16126C 16271C 16294T 16304C 16519C 73G 151T 263G 309.1C 315.1C
A95 S H1c3 European 16519C 195C 257G 263G 309.1C 315.1C 477C
A98 S H5a4a European 16294T 16304C 16320T 263G 309.1C 315.1C 456T
F102 S L3e1 African 16223T 16327T 73G 150T 189G 200G 263G 315.1C
F107 S T2e European 16126C 16153A 16292T 16294T 16296T 16519C 73G 150T 263G 309.1C 315.1C
F108 S H5 European 16304C 263G 315.1C 456T
F109 S A2+(64)+@16111 Amerindian
16126C 16223T 16278T 16290T 16319A 16362C 59C 64T 73G 146C 152C 153G 235G 263G 297G 309.1C 315.1C 523del 524del 573.1C
F110 S L1c2a1a African 16071T 16129A 16145A 16187T 16189C 16213A 16234T 16265C 16278T 16286G 16294T 16311C 16360T 16527T 73G 151T 152C 182T 186A 189C 195C 198T 247A 263G 297G 315.1C 316A
F111 S T2b3+151 European 16126C 16294T 16296T 16304C 16519C 73G 151T 263G 309.1C 309.2C 315.1C
F112 S J2a2b1 European 16069T 16126C 16241G 16519C 73G 150T 189G 195C 263G 295T 315.1C 489C
F113 S L3e2a1 African 16223T 16320T 16519C 73G 150T 195C 198T 263G 315.1C
F114 S C1b Amerindian 16223T 16325C 16327T 45G 73G 249del 263G 290del 291del 309.1C 315.1C 489C 493G 523del 524del
F116 S L3e1f1a African 16183C 16189C 16223T 16260T 16266A 16327T 73G 150T 189G 195C 200G 263G 309.1C 315.1C
F118 S L1c1a1 African 16129A 16187T 16189C 16214T 16234T 16278T 16293G 16294T 16311C 16360T 16368C 16519C 16527T 73G 151T 152C 182T 186A 189C 195C 247A 260A 263G 297G 315.1C 316A 523del 524del
F123 S T2e European 16126C 16153A 16294T 16296T 16519C 73G 150T 263G 315.1C 523del 524del
F126 S HV0f European 16298C 195C 263G 309.1C 315.1C

55
Sample ES Haplogroup Continental Origin Haplotype
F127 S L2a1f3 African 16189C 16193.1C 16193.2C 16223T 16278T 16294T 16309G 16390A 16519C 73G 146C 152C 195C 198T 263G 315.1C
F128 S U5a2a European 16104A 16114A 16192T 16234A 16256T 16270T 16294T 16526A 73G 263G 309.1C 315.1C
F129 S R0 European 16209C 16519C 263G 315.1C
F132 S U5b1f1 European 16192T 16270T 73G 150T 263G 315.1C 533G
F144 S R0 European 16519C 263G 315.1C
F147 S C1b+16311 Amerindian 16223T 16298C 16311C 16325C 16327T 73G 146C 249del 263G 290del 291del 315.1C 489C 493G 523del 524del
F151 S C1b2 Amerindian 16154C 16223T 16298C 16325C 16327T 16519C 73G 249del 290del 291del 309.1C 309.2C 315.1C 489C 493G 523del 524del
F154 S U1a1a1 European 16183C 16189C 16249C 73G 263G 285T 302C 309.1C 309.2C 315.1C 385G 523del 524del 573.1C
F27 S L3f1b4a African 16209C 16223T 16311C 16519C 73G 150T 189G 200G 263G 309.1C 315.1C
F40 S H5 European 16304C 199C 263G 309.1C 315.1C 456T 523del 524del
F41 S H7i European 16189C 16193.1C 16193.2C 16519C 228A 263G 309.1C 309.2C 315.1C
F55 S A2aa Amerindian 16111T 16218T 16223T 16239A 16266T 16290T 16319A 16362C 64T 73G 146C 153G 235G 263G 309.1C 315.1C 523del 524del
F59 S B4b Amerindian 16183C 16189C 16193.1C 16217C 16519C 73G 263G 309.1C 309.2C 315.1C 499A 524.1A 524.2C
F68 S T2e1 European 16126C 16153A 16294T 16519C 41T 73G 150T 263G 309.1C 315.1C
F71 S K1a European 16224C 16264T 16311C 16519C 73G 263G 315.1C 497T 524.1A 524.2C
F78 S H3c2 European 16176T 195C 263G 315.1C 524.1A 524.2C
F81 S H13b1+200 European 16189C 16193.1C 16193.2C 16261T 16519C 200G 263G 309.1C 309.2C 315.1C
F82 S A2 Amerindian 16111T 16126C 16223T 16259T 16290T 16319A 16325C 16362C 16390A 16519C 73G 146C 153G 235G 263G 309.1C 315.1C 523del 524del
F87 S L0a1'4 African 16129A 16148T 16168T 16172C 16187T 16188G 16189C 16223T 16230G 16311C 16320T 93G 185A 189G 236C 247A 263G 315.1C 523del 524del
F90 S J2b1a European 16069T 16126C 16193T 16258T 16278T 73G 150T 152C 263G 295T 309.1C 315.1C 489C
F95 S L1b African 16126C 16187T 16189C 16223T 16264T 16270T 16278T 16311C 16519C 73G 152C 182T 185T 195C 247A 263G 315.1C 357G 523del 524del
F1 M R0 European 16519C 263G 309.1C 315.1C
F10 M I5a4 European 16129A 16148T 16192T 16223T 16294T 16519C 73G 153G 199C 204C 250C 263G 309.1C 315.1C 573.1C 574C 576C
F100 M L0a1b1 African 16129A 16148T 16168T 16172C 16187T 16188G 16189C 16223T 16230G 16278T 16293G 16311C 16320T 93G 95C 185A 189G 236C 247A 263G 309.1C 309.2C 315.1C 523del 524del
F103 M H7i European 16189C 16519C 228A 263G 309.1C 309.2C 315.1C
F11 M B4b Amerindian 16178C 16183C 16189C 16193.1C 16217C 16519C 73G 263G 309.1C 315.1C 499A
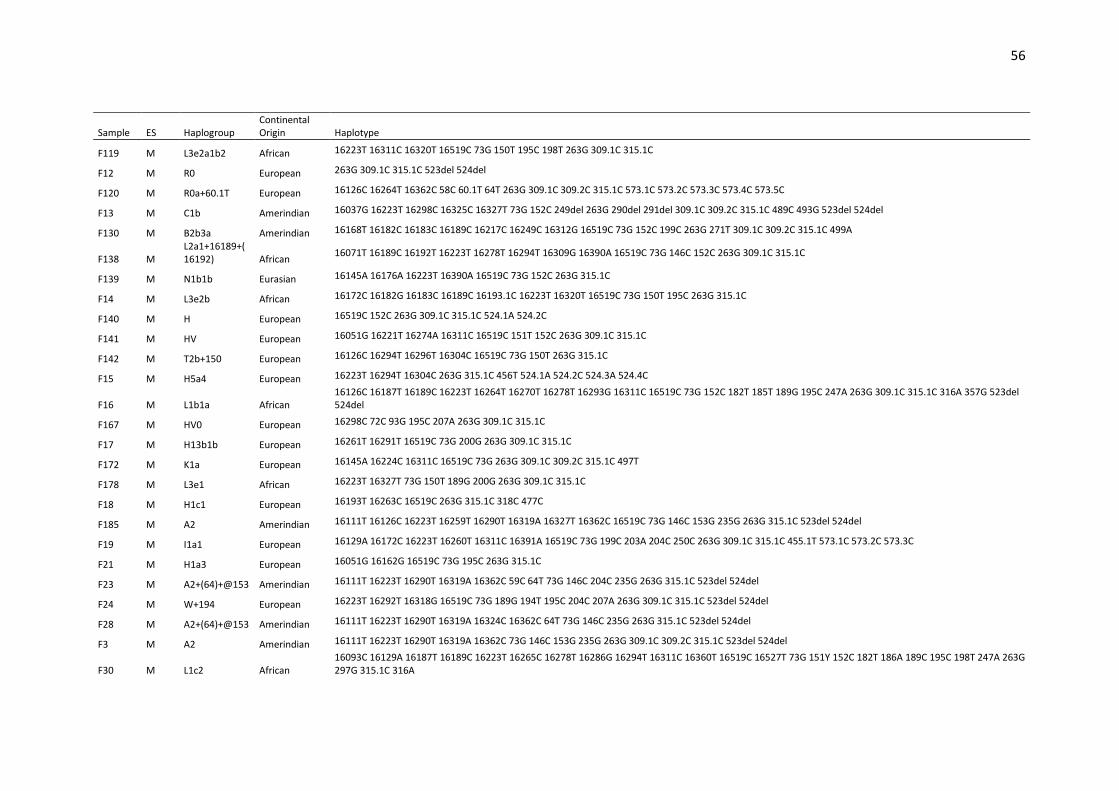
56
Sample ES Haplogroup Continental Origin Haplotype
F119 M L3e2a1b2 African 16223T 16311C 16320T 16519C 73G 150T 195C 198T 263G 309.1C 315.1C
F12 M R0 European 263G 309.1C 315.1C 523del 524del
F120 M R0a+60.1T European 16126C 16264T 16362C 58C 60.1T 64T 263G 309.1C 309.2C 315.1C 573.1C 573.2C 573.3C 573.4C 573.5C
F13 M C1b Amerindian 16037G 16223T 16298C 16325C 16327T 73G 152C 249del 263G 290del 291del 309.1C 309.2C 315.1C 489C 493G 523del 524del
F130 M B2b3a Amerindian 16168T 16182C 16183C 16189C 16217C 16249C 16312G 16519C 73G 152C 199C 263G 271T 309.1C 309.2C 315.1C 499A
F138 M L2a1+16189+(16192) African
16071T 16189C 16192T 16223T 16278T 16294T 16309G 16390A 16519C 73G 146C 152C 263G 309.1C 315.1C
F139 M N1b1b Eurasian 16145A 16176A 16223T 16390A 16519C 73G 152C 263G 315.1C
F14 M L3e2b African 16172C 16182G 16183C 16189C 16193.1C 16223T 16320T 16519C 73G 150T 195C 263G 315.1C
F140 M H European 16519C 152C 263G 309.1C 315.1C 524.1A 524.2C
F141 M HV European 16051G 16221T 16274A 16311C 16519C 151T 152C 263G 309.1C 315.1C
F142 M T2b+150 European 16126C 16294T 16296T 16304C 16519C 73G 150T 263G 315.1C
F15 M H5a4 European 16223T 16294T 16304C 263G 315.1C 456T 524.1A 524.2C 524.3A 524.4C
F16 M L1b1a African 16126C 16187T 16189C 16223T 16264T 16270T 16278T 16293G 16311C 16519C 73G 152C 182T 185T 189G 195C 247A 263G 309.1C 315.1C 316A 357G 523del 524del
F167 M HV0 European 16298C 72C 93G 195C 207A 263G 309.1C 315.1C
F17 M H13b1b European 16261T 16291T 16519C 73G 200G 263G 309.1C 315.1C
F172 M K1a European 16145A 16224C 16311C 16519C 73G 263G 309.1C 309.2C 315.1C 497T
F178 M L3e1 African 16223T 16327T 73G 150T 189G 200G 263G 309.1C 315.1C
F18 M H1c1 European 16193T 16263C 16519C 263G 315.1C 318C 477C
F185 M A2 Amerindian 16111T 16126C 16223T 16259T 16290T 16319A 16327T 16362C 16519C 73G 146C 153G 235G 263G 315.1C 523del 524del
F19 M I1a1 European 16129A 16172C 16223T 16260T 16311C 16391A 16519C 73G 199C 203A 204C 250C 263G 309.1C 315.1C 455.1T 573.1C 573.2C 573.3C
F21 M H1a3 European 16051G 16162G 16519C 73G 195C 263G 315.1C
F23 M A2+(64)+@153 Amerindian 16111T 16223T 16290T 16319A 16362C 59C 64T 73G 146C 204C 235G 263G 315.1C 523del 524del
F24 M W+194 European 16223T 16292T 16318G 16519C 73G 189G 194T 195C 204C 207A 263G 309.1C 315.1C 523del 524del
F28 M A2+(64)+@153 Amerindian 16111T 16223T 16290T 16319A 16324C 16362C 64T 73G 146C 235G 263G 315.1C 523del 524del
F3 M A2 Amerindian 16111T 16223T 16290T 16319A 16362C 73G 146C 153G 235G 263G 309.1C 309.2C 315.1C 523del 524del
F30 M L1c2 African 16093C 16129A 16187T 16189C 16223T 16265C 16278T 16286G 16294T 16311C 16360T 16519C 16527T 73G 151Y 152C 182T 186A 189C 195C 198T 247A 263G 297G 315.1C 316A
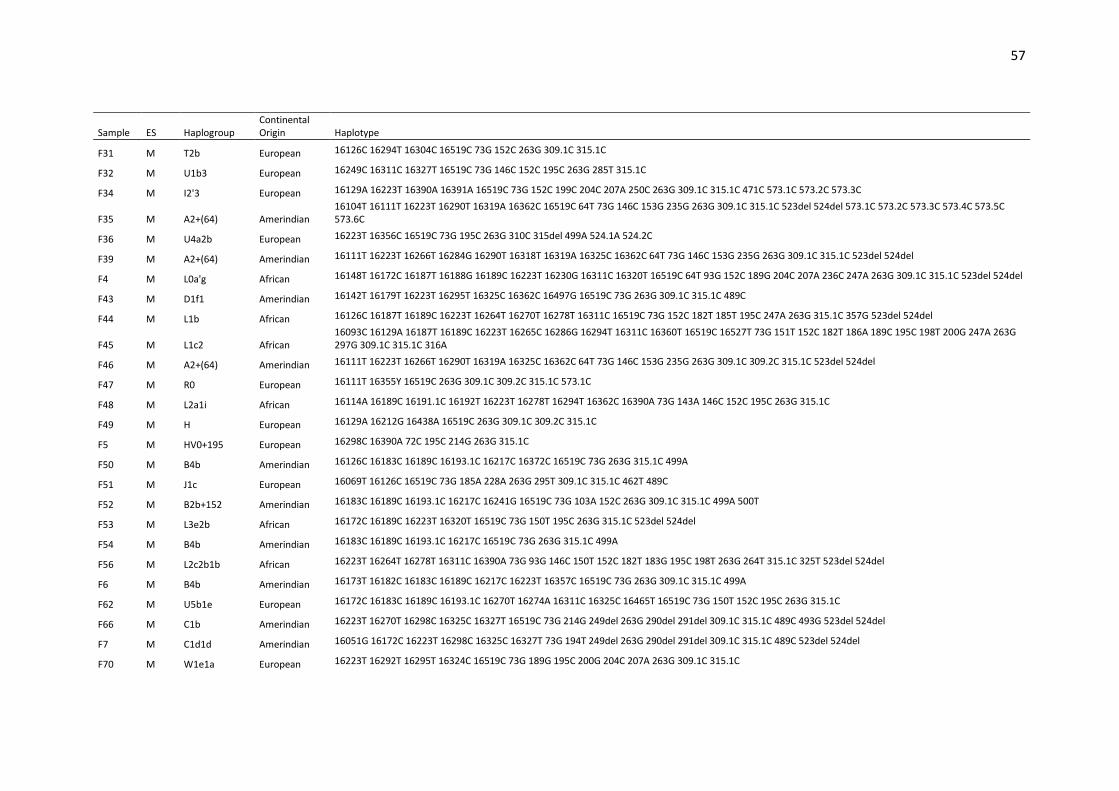
57
Sample ES Haplogroup Continental Origin Haplotype
F31 M T2b European 16126C 16294T 16304C 16519C 73G 152C 263G 309.1C 315.1C
F32 M U1b3 European 16249C 16311C 16327T 16519C 73G 146C 152C 195C 263G 285T 315.1C
F34 M I2'3 European 16129A 16223T 16390A 16391A 16519C 73G 152C 199C 204C 207A 250C 263G 309.1C 315.1C 471C 573.1C 573.2C 573.3C
F35 M A2+(64) Amerindian 16104T 16111T 16223T 16290T 16319A 16362C 16519C 64T 73G 146C 153G 235G 263G 309.1C 315.1C 523del 524del 573.1C 573.2C 573.3C 573.4C 573.5C 573.6C
F36 M U4a2b European 16223T 16356C 16519C 73G 195C 263G 310C 315del 499A 524.1A 524.2C
F39 M A2+(64) Amerindian 16111T 16223T 16266T 16284G 16290T 16318T 16319A 16325C 16362C 64T 73G 146C 153G 235G 263G 309.1C 315.1C 523del 524del
F4 M L0a'g African 16148T 16172C 16187T 16188G 16189C 16223T 16230G 16311C 16320T 16519C 64T 93G 152C 189G 204C 207A 236C 247A 263G 309.1C 315.1C 523del 524del
F43 M D1f1 Amerindian 16142T 16179T 16223T 16295T 16325C 16362C 16497G 16519C 73G 263G 309.1C 315.1C 489C
F44 M L1b African 16126C 16187T 16189C 16223T 16264T 16270T 16278T 16311C 16519C 73G 152C 182T 185T 195C 247A 263G 315.1C 357G 523del 524del
F45 M L1c2 African 16093C 16129A 16187T 16189C 16223T 16265C 16286G 16294T 16311C 16360T 16519C 16527T 73G 151T 152C 182T 186A 189C 195C 198T 200G 247A 263G 297G 309.1C 315.1C 316A
F46 M A2+(64) Amerindian 16111T 16223T 16266T 16290T 16319A 16325C 16362C 64T 73G 146C 153G 235G 263G 309.1C 309.2C 315.1C 523del 524del
F47 M R0 European 16111T 16355Y 16519C 263G 309.1C 309.2C 315.1C 573.1C
F48 M L2a1i African 16114A 16189C 16191.1C 16192T 16223T 16278T 16294T 16362C 16390A 73G 143A 146C 152C 195C 263G 315.1C
F49 M H European 16129A 16212G 16438A 16519C 263G 309.1C 309.2C 315.1C
F5 M HV0+195 European 16298C 16390A 72C 195C 214G 263G 315.1C
F50 M B4b Amerindian 16126C 16183C 16189C 16193.1C 16217C 16372C 16519C 73G 263G 315.1C 499A
F51 M J1c European 16069T 16126C 16519C 73G 185A 228A 263G 295T 309.1C 315.1C 462T 489C
F52 M B2b+152 Amerindian 16183C 16189C 16193.1C 16217C 16241G 16519C 73G 103A 152C 263G 309.1C 315.1C 499A 500T
F53 M L3e2b African 16172C 16189C 16223T 16320T 16519C 73G 150T 195C 263G 315.1C 523del 524del
F54 M B4b Amerindian 16183C 16189C 16193.1C 16217C 16519C 73G 263G 315.1C 499A
F56 M L2c2b1b African 16223T 16264T 16278T 16311C 16390A 73G 93G 146C 150T 152C 182T 183G 195C 198T 263G 264T 315.1C 325T 523del 524del
F6 M B4b Amerindian 16173T 16182C 16183C 16189C 16217C 16223T 16357C 16519C 73G 263G 309.1C 315.1C 499A
F62 M U5b1e European 16172C 16183C 16189C 16193.1C 16270T 16274A 16311C 16325C 16465T 16519C 73G 150T 152C 195C 263G 315.1C
F66 M C1b Amerindian 16223T 16270T 16298C 16325C 16327T 16519C 73G 214G 249del 263G 290del 291del 309.1C 315.1C 489C 493G 523del 524del
F7 M C1d1d Amerindian 16051G 16172C 16223T 16298C 16325C 16327T 73G 194T 249del 263G 290del 291del 309.1C 315.1C 489C 523del 524del
F70 M W1e1a European 16223T 16292T 16295T 16324C 16519C 73G 189G 195C 200G 204C 207A 263G 309.1C 315.1C
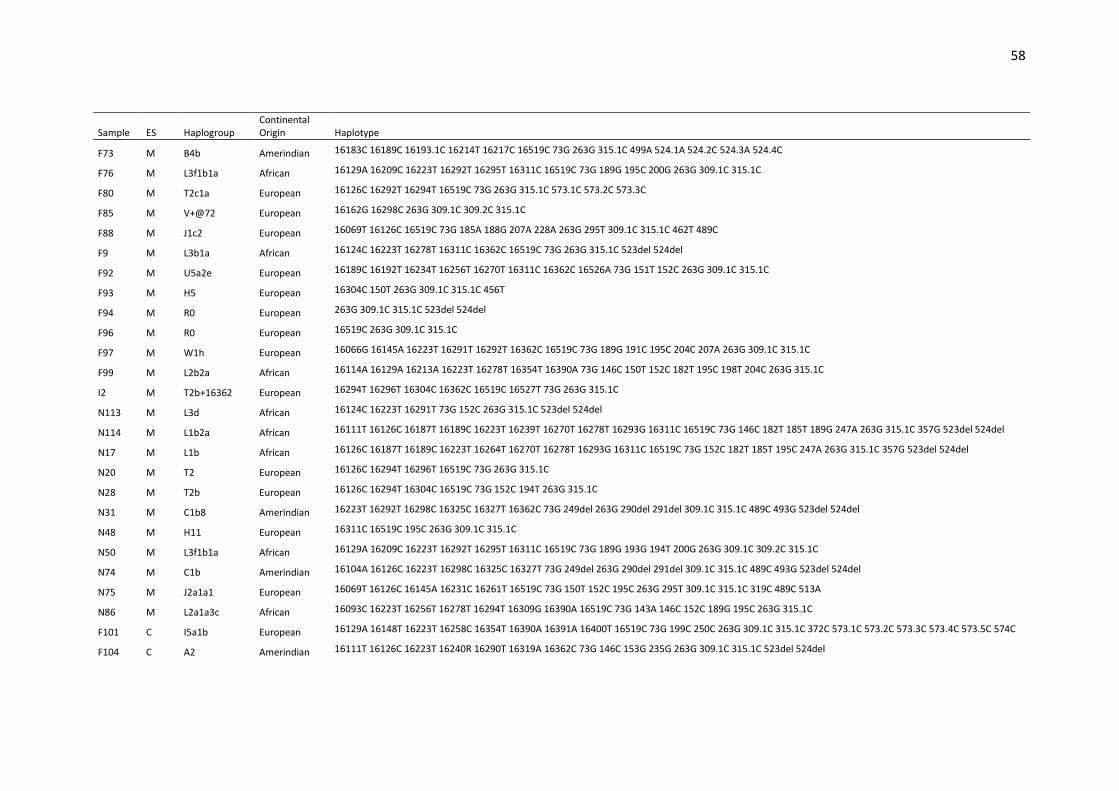
58
Sample ES Haplogroup Continental Origin Haplotype
F73 M B4b Amerindian 16183C 16189C 16193.1C 16214T 16217C 16519C 73G 263G 315.1C 499A 524.1A 524.2C 524.3A 524.4C
F76 M L3f1b1a African 16129A 16209C 16223T 16292T 16295T 16311C 16519C 73G 189G 195C 200G 263G 309.1C 315.1C
F80 M T2c1a European 16126C 16292T 16294T 16519C 73G 263G 315.1C 573.1C 573.2C 573.3C
F85 M V+@72 European 16162G 16298C 263G 309.1C 309.2C 315.1C
F88 M J1c2 European 16069T 16126C 16519C 73G 185A 188G 207A 228A 263G 295T 309.1C 315.1C 462T 489C
F9 M L3b1a African 16124C 16223T 16278T 16311C 16362C 16519C 73G 263G 315.1C 523del 524del
F92 M U5a2e European 16189C 16192T 16234T 16256T 16270T 16311C 16362C 16526A 73G 151T 152C 263G 309.1C 315.1C
F93 M H5 European 16304C 150T 263G 309.1C 315.1C 456T
F94 M R0 European 263G 309.1C 315.1C 523del 524del
F96 M R0 European 16519C 263G 309.1C 315.1C
F97 M W1h European 16066G 16145A 16223T 16291T 16292T 16362C 16519C 73G 189G 191C 195C 204C 207A 263G 309.1C 315.1C
F99 M L2b2a African 16114A 16129A 16213A 16223T 16278T 16354T 16390A 73G 146C 150T 152C 182T 195C 198T 204C 263G 315.1C
I2 M T2b+16362 European 16294T 16296T 16304C 16362C 16519C 16527T 73G 263G 315.1C
N113 M L3d African 16124C 16223T 16291T 73G 152C 263G 315.1C 523del 524del
N114 M L1b2a African 16111T 16126C 16187T 16189C 16223T 16239T 16270T 16278T 16293G 16311C 16519C 73G 146C 182T 185T 189G 247A 263G 315.1C 357G 523del 524del
N17 M L1b African 16126C 16187T 16189C 16223T 16264T 16270T 16278T 16293G 16311C 16519C 73G 152C 182T 185T 195C 247A 263G 315.1C 357G 523del 524del
N20 M T2 European 16126C 16294T 16296T 16519C 73G 263G 315.1C
N28 M T2b European 16126C 16294T 16304C 16519C 73G 152C 194T 263G 315.1C
N31 M C1b8 Amerindian 16223T 16292T 16298C 16325C 16327T 16362C 73G 249del 263G 290del 291del 309.1C 315.1C 489C 493G 523del 524del
N48 M H11 European 16311C 16519C 195C 263G 309.1C 315.1C
N50 M L3f1b1a African 16129A 16209C 16223T 16292T 16295T 16311C 16519C 73G 189G 193G 194T 200G 263G 309.1C 309.2C 315.1C
N74 M C1b Amerindian 16104A 16126C 16223T 16298C 16325C 16327T 73G 249del 263G 290del 291del 309.1C 315.1C 489C 493G 523del 524del
N75 M J2a1a1 European 16069T 16126C 16145A 16231C 16261T 16519C 73G 150T 152C 195C 263G 295T 309.1C 315.1C 319C 489C 513A
N86 M L2a1a3c African 16093C 16223T 16256T 16278T 16294T 16309G 16390A 16519C 73G 143A 146C 152C 189G 195C 263G 315.1C
F101 C I5a1b European 16129A 16148T 16223T 16258C 16354T 16390A 16391A 16400T 16519C 73G 199C 250C 263G 309.1C 315.1C 372C 573.1C 573.2C 573.3C 573.4C 573.5C 574C
F104 C A2 Amerindian 16111T 16126C 16223T 16240R 16290T 16319A 16362C 73G 146C 153G 235G 263G 309.1C 315.1C 523del 524del
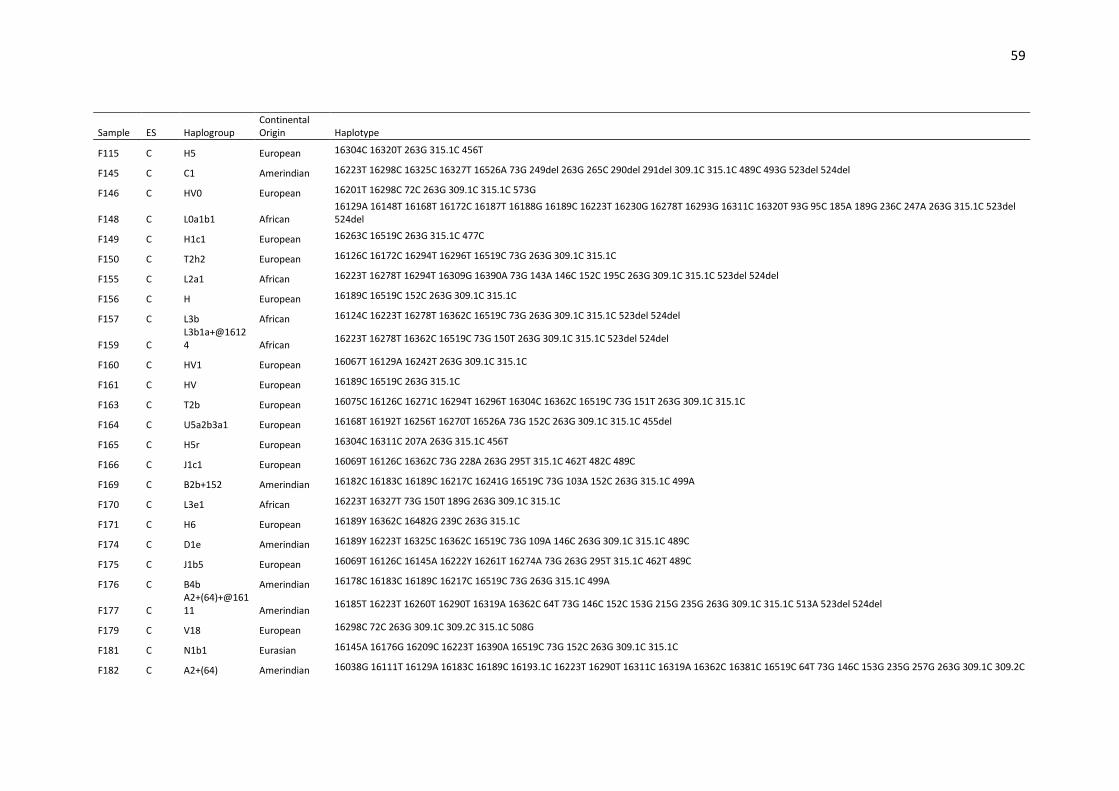
59
Sample ES Haplogroup Continental Origin Haplotype
F115 C H5 European 16304C 16320T 263G 315.1C 456T
F145 C C1 Amerindian 16223T 16298C 16325C 16327T 16526A 73G 249del 263G 265C 290del 291del 309.1C 315.1C 489C 493G 523del 524del
F146 C HV0 European 16201T 16298C 72C 263G 309.1C 315.1C 573G
F148 C L0a1b1 African 16129A 16148T 16168T 16172C 16187T 16188G 16189C 16223T 16230G 16278T 16293G 16311C 16320T 93G 95C 185A 189G 236C 247A 263G 315.1C 523del 524del
F149 C H1c1 European 16263C 16519C 263G 315.1C 477C
F150 C T2h2 European 16126C 16172C 16294T 16296T 16519C 73G 263G 309.1C 315.1C
F155 C L2a1 African 16223T 16278T 16294T 16309G 16390A 73G 143A 146C 152C 195C 263G 309.1C 315.1C 523del 524del
F156 C H European 16189C 16519C 152C 263G 309.1C 315.1C
F157 C L3b African 16124C 16223T 16278T 16362C 16519C 73G 263G 309.1C 315.1C 523del 524del
F159 C L3b1a+@16124 African
16223T 16278T 16362C 16519C 73G 150T 263G 309.1C 315.1C 523del 524del
F160 C HV1 European 16067T 16129A 16242T 263G 309.1C 315.1C
F161 C HV European 16189C 16519C 263G 315.1C
F163 C T2b European 16075C 16126C 16271C 16294T 16296T 16304C 16362C 16519C 73G 151T 263G 309.1C 315.1C
F164 C U5a2b3a1 European 16168T 16192T 16256T 16270T 16526A 73G 152C 263G 309.1C 315.1C 455del
F165 C H5r European 16304C 16311C 207A 263G 315.1C 456T
F166 C J1c1 European 16069T 16126C 16362C 73G 228A 263G 295T 315.1C 462T 482C 489C
F169 C B2b+152 Amerindian 16182C 16183C 16189C 16217C 16241G 16519C 73G 103A 152C 263G 315.1C 499A
F170 C L3e1 African 16223T 16327T 73G 150T 189G 263G 309.1C 315.1C
F171 C H6 European 16189Y 16362C 16482G 239C 263G 315.1C
F174 C D1e Amerindian 16189Y 16223T 16325C 16362C 16519C 73G 109A 146C 263G 309.1C 315.1C 489C
F175 C J1b5 European 16069T 16126C 16145A 16222Y 16261T 16274A 73G 263G 295T 315.1C 462T 489C
F176 C B4b Amerindian 16178C 16183C 16189C 16217C 16519C 73G 263G 315.1C 499A
F177 C A2+(64)+@16111 Amerindian
16185T 16223T 16260T 16290T 16319A 16362C 64T 73G 146C 152C 153G 215G 235G 263G 309.1C 315.1C 513A 523del 524del
F179 C V18 European 16298C 72C 263G 309.1C 309.2C 315.1C 508G
F181 C N1b1 Eurasian 16145A 16176G 16209C 16223T 16390A 16519C 73G 152C 263G 309.1C 315.1C
F182 C A2+(64) Amerindian 16038G 16111T 16129A 16183C 16189C 16193.1C 16223T 16290T 16311C 16319A 16362C 16381C 16519C 64T 73G 146C 153G 235G 257G 263G 309.1C 309.2C

60
Sample ES Haplogroup Continental Origin Haplotype
315.1C 523del 524del
F183 C L1b1a+189 African 16126C 16166G 16187T 16189C 16193T 16223T 16264T 16270T 16278T 16293G 16311C 16519C 73G 152C 182T 185T 189G 195C 247A 263G 315.1C 357G 523del 524del
F184 C L2b2a African 16114A 16129A 16213A 16223T 16278T 16354T 16390A 73G 146C 150T 152C 182T 195C 198T 204C 263G 315.1C
F187 C H10+(16093) European 16093C 263G 315.1C
F188 C A2+(64) Amerindian 16111T 16223T 16266T 16290T 16319A 16325C 16362C 64T 73G 146C 153G 235G 263G 309.1C 309.2C 315.1C 523del 524del
F189 C L1b1a10 African 16126C 16187T 16189C 16223T 16264T 16270T 16278T 16311C 16519C 73G 151T 152C 182T 185T 195C 247A 263G 315.1C 357G 523del 524del
F191 C R0 European 16327T 263G 309.1C 315.1C
F193 C B4b Amerindian 16178C 16183C 16189C 16217C 16519C 73G 263G 315.1C 499A
F194 C L3e2b African 16172C 16183C 16189C 16223T 16320T 16519C 73G 150T 195C 263G 309.1C 315.1C
F2 C K1a5b European 16093C 16224C 16311C 16519C 73G 93G 153G 204C 263G 315.1C 408A 497T 524.1A 524.2C
F20 C L2a1a2 African 16223T 16278T 16286T 16294T 16309G 16390A 16519C 73G 146C 152C 195C 263G 309.1C 315.1C
F25 C T2f1a European 16126C 16182C 16183C 16189C 16294T 16296T 16298C 16519C 73G 195C 263G 309.1C 309.2C 315.1C
F26 C C1b Amerindian 16129A 16223T 16298C 16325C 16327T 73G 146C 234R 249del 263G 290del 291del 315.1C 489C 493G 523del 524del
F29 C H5+16311 European 16304C 16311C 152C 263G 315.1C 456T
F37 C L3e2b African 16172C 16182C 16183C 16189C 16223T 16320T 16519C 73G 150T 195C 263G 315.1C
F38 C U5b1b1+@16192 European
16093C 16189C 16193.1C 16193.2C 16263C 16270T 73G 150T 263G 315.1C
F42 C L2a1 African 16093C 16189C 16192T 16223T 16278T 16294T 16390A 73G 146C 152C 195C 263G 315.1C
F57 C J1c1 European 16069T 16126C 73G 228A 263G 295T 315.1C 462T 482C 489C
F58 C R0a+60.1T European 16126C 16362C 58C 60.1T 64T 263G 309.1C 315.1C 447T 523del 524del
F67 C U2e1 European 16051G 16129C 16183C 16189C 16193.1C 16362C 16519C 73G 152C 217C 263G 309.1C 309.2C 315.1C 340T 508G 524.1A 524.2C
F69 C A2+(64)+@16111 Amerindian
16126C 16223T 16278T 16290T 16319A 16362C 59C 64T 73G 146C 152C 153G 235G 263G 297G 309.1C 309.2C 315.1C 523del 524del 573.1C
F72 C U6a3e European 16172C 16183C 16189C 16193.1C 16219G 16278T 16293G 16362C 16399G 73G 146C 185A 186T 263G 309.1C 315.1C 523del 524del
F79 C X2d Eurasian 16183C 16189C 16193.1C 16223T 16278T 16519C 73G 195C 263G 309.1C 315.1C
F8 C C1d1d Amerindian 16051G 16172C 16223T 16298C 16325C 16327T 73G 194T 249del 263G 290del 291del 309.1C 315.1C 489C 523del 524del 573.1C
F84 C H5 European 16304C 195C 263G 309.1C 315.1C 456T 523del 524del
F89 C A2+(64)+@153 Amerindian 16111T 16223T 16290T 16319A 16362C 59C 64T 73G 146C 204C 235G 263G 315.1C 523del 524del
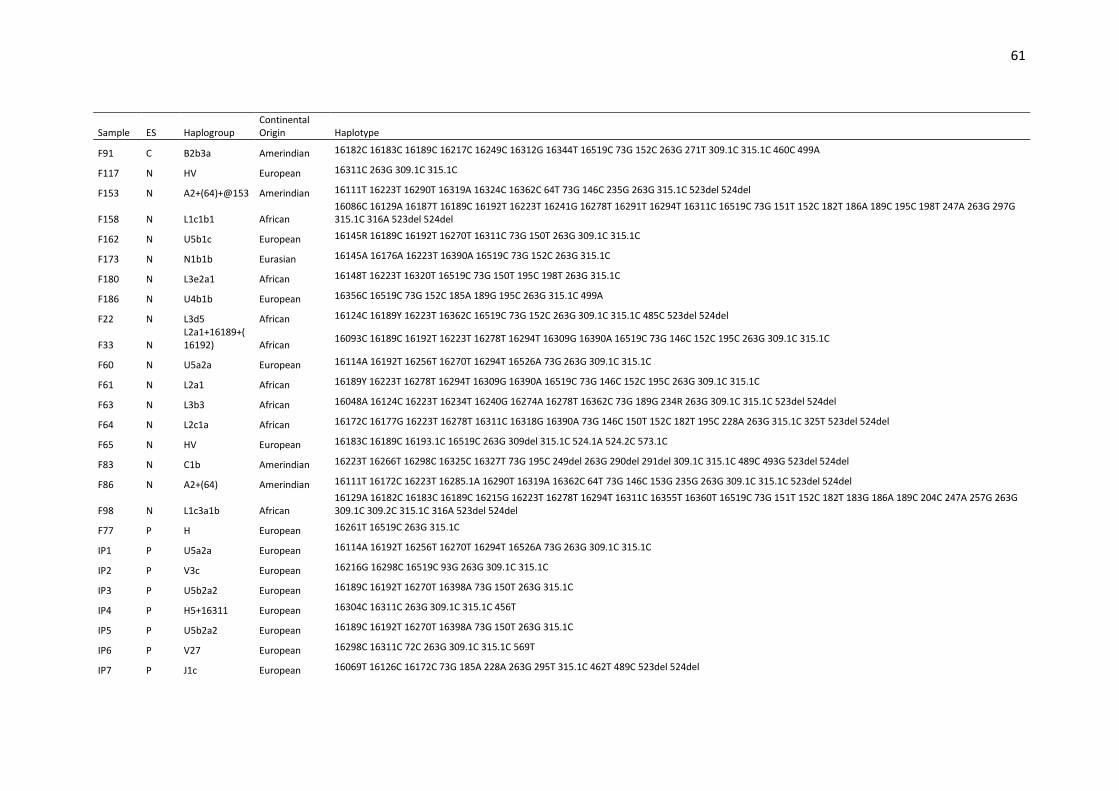
61
Sample ES Haplogroup Continental Origin Haplotype
F91 C B2b3a Amerindian 16182C 16183C 16189C 16217C 16249C 16312G 16344T 16519C 73G 152C 263G 271T 309.1C 315.1C 460C 499A
F117 N HV European 16311C 263G 309.1C 315.1C
F153 N A2+(64)+@153 Amerindian 16111T 16223T 16290T 16319A 16324C 16362C 64T 73G 146C 235G 263G 315.1C 523del 524del
F158 N L1c1b1 African 16086C 16129A 16187T 16189C 16192T 16223T 16241G 16278T 16291T 16294T 16311C 16519C 73G 151T 152C 182T 186A 189C 195C 198T 247A 263G 297G 315.1C 316A 523del 524del
F162 N U5b1c European 16145R 16189C 16192T 16270T 16311C 73G 150T 263G 309.1C 315.1C
F173 N N1b1b Eurasian 16145A 16176A 16223T 16390A 16519C 73G 152C 263G 315.1C
F180 N L3e2a1 African 16148T 16223T 16320T 16519C 73G 150T 195C 198T 263G 315.1C
F186 N U4b1b European 16356C 16519C 73G 152C 185A 189G 195C 263G 315.1C 499A
F22 N L3d5 African 16124C 16189Y 16223T 16362C 16519C 73G 152C 263G 309.1C 315.1C 485C 523del 524del
F33 N L2a1+16189+(16192) African
16093C 16189C 16192T 16223T 16278T 16294T 16309G 16390A 16519C 73G 146C 152C 195C 263G 309.1C 315.1C
F60 N U5a2a European 16114A 16192T 16256T 16270T 16294T 16526A 73G 263G 309.1C 315.1C
F61 N L2a1 African 16189Y 16223T 16278T 16294T 16309G 16390A 16519C 73G 146C 152C 195C 263G 309.1C 315.1C
F63 N L3b3 African 16048A 16124C 16223T 16234T 16240G 16274A 16278T 16362C 73G 189G 234R 263G 309.1C 315.1C 523del 524del
F64 N L2c1a African 16172C 16177G 16223T 16278T 16311C 16318G 16390A 73G 146C 150T 152C 182T 195C 228A 263G 315.1C 325T 523del 524del
F65 N HV European 16183C 16189C 16193.1C 16519C 263G 309del 315.1C 524.1A 524.2C 573.1C
F83 N C1b Amerindian 16223T 16266T 16298C 16325C 16327T 73G 195C 249del 263G 290del 291del 309.1C 315.1C 489C 493G 523del 524del
F86 N A2+(64) Amerindian 16111T 16172C 16223T 16285.1A 16290T 16319A 16362C 64T 73G 146C 153G 235G 263G 309.1C 315.1C 523del 524del
F98 N L1c3a1b African 16129A 16182C 16183C 16189C 16215G 16223T 16278T 16294T 16311C 16355T 16360T 16519C 73G 151T 152C 182T 183G 186A 189C 204C 247A 257G 263G 309.1C 309.2C 315.1C 316A 523del 524del
F77 P H European 16261T 16519C 263G 315.1C
IP1 P U5a2a European 16114A 16192T 16256T 16270T 16294T 16526A 73G 263G 309.1C 315.1C
IP2 P V3c European 16216G 16298C 16519C 93G 263G 309.1C 315.1C
IP3 P U5b2a2 European 16189C 16192T 16270T 16398A 73G 150T 263G 315.1C
IP4 P H5+16311 European 16304C 16311C 263G 309.1C 315.1C 456T
IP5 P U5b2a2 European 16189C 16192T 16270T 16398A 73G 150T 263G 315.1C
IP6 P V27 European 16298C 16311C 72C 263G 309.1C 315.1C 569T
IP7 P J1c European 16069T 16126C 16172C 73G 185A 228A 263G 295T 315.1C 462T 489C 523del 524del

62
Sample ES Haplogroup Continental Origin Haplotype
IP8 P W3 European 16223T 16292T 16519C 73G 189G 194T 195C 199C 204C 207A 263G 309.1C 309.2C 315.1C
IP9 P H1a European 16162G 16519C 73G 263G 315.1C
IP11 P U4 European 16311C 16356C 16519C 73G 195C 263G 315.1C 499A 524.1A 524.2C
IP12 P V3c European 16129A 16216G 16261T 16298C 16519C 72C 263G 309.1C 309.2C 315.1C
IP13 P H11a European 16293G 16311C 195C 263G 309.1C 315.1C
IP14 P J1c2 European 16069T 16126C 16129A 16519C 73G 185A 188G 228A 263G 295T 309.1C 315.1C 462T 489C
IP15 P H1c1+16093 European 16093C 16263C 16519C 263G 315.1C 477C
IP21 P U5a1b1 European 16192T 16256T 16270T 16291T 16399G 16519C 73G 263G 315.1C
IP25 P H1c1 European 16193T 16263C 16519C 263G 315.1C 318C 477C
IP40 P I1a1 European 16129A 16172C 16223T 16311C 16391A 16519C 73G 199C 203A 204C 250C 263G 315.1C 455.1T 573.1C 573.2C 573.3C 573.4C 573.5C
IP48 P H European 16172C 16173T 16354T 263G 309.1C 315.1C
IP49 P U5b2a1a+16311 European
16192T 16311C 73G 150T 263G 309.1C 315.1C
IP50 P U2e1 European 16051G 16129C 16182C 16183C 16189C 16362C 16519C 73G 152C 217C 263G 309.1C 309.2C 315.1C 340T 508G 524.1A 524.2C
61P P U5a1 European 16192T 16256T 16270T 16399G 73G 185A 263G 315.1C
62P P U4a1 European 16134T 16356C 16519C 73G 152C 195C 263G 309.1C 315.1C 499A 524.1A 524.2C
65P P HV European 16221T 16519C 263G 309.1C 309.2C 315.1C
67P P U2e1b European 16051G 16092C 16129C 16182C 16183C 16189C 16256T 16362C 16519C 73G 151T 152C 189R 217C 263G 315.1C 340T 508G
68P P R0 European 16519C 263G 315.1C
69P P J1c1 European 16069T 16126C 16209C 73G 185A 228A 263G 295T 315.1C 462T 482C 489C
70P P H1c1 European 16193T 16263C 16519C 263G 315.1C 318C 477C
71P P K1a European 16224C 16311C 16519C 73G 195C 263G 315.1C 497T 524.1A 524.2C
72P P R European 73G 146C 263G 309.1C 315.1C 523del 524del
73P P HV European 16221T 16519C 263G 309.1C 315.1C
74P P U2e1b European 16051G 16129C 16182C 16183C 16189C 16256T 16362C 16519C 73G 151T 152C 217C 263G 315.1C 340T 508G
75P P H36 European 16070G 16239T 152C 263G 315.1C 456T 524.1A 524.2C

63
Sample ES Haplogroup Continental Origin Haplotype
76P P H3h2 European 16093C 16153A 16311C 263G 309.1C 315.1C
77P P H11 European 16311C 16519C 195C 263G 309.1C 315.1C
78P P H5 European 16145A 16304C 16519C 263G 315.1C 456T 523del 524del
79P P H36 European 16070G 16239T 152C 263G 315.1C 456T 524.1A 524.2C
80P P U4c1 European 16179T 16356C 16519C 73G 195C 263G 315.1C 499A 524.1A 524.2C
81P P N1a1a1a3 Eurasian 16129A 16147A 16154C 16172C 16223T 16248T 16320T 16355T 16519C 73G 143A 152C 182T 199C 204C 234G 263G 309.1C 315.1C 573.1C 573.2C 573.3C
82P P H5 European 16304C 16519C 263G 315.1C 456T
83P P H2a2a1 European 16519C 309.1C 315.1C
84P P T2b4b European 16104T 16294T 16304C 16519C 73G 152C 263G 309.1C 315.1C
85P P U5a1b+16362 European 16192T 16256T 16270T 16362C 16399G 73G 263G 315.1C
87P P HV0 European 16261T 16298C 72C 263G 309.1C 309.2C 315.1C
89P P H1b1+16362 European 16189C 16356C 16362C 16519C 263G 315.1C 523del 524del
90P P U5a1b+16362 European 16192T 16256T 16270T 16362C 16399G 73G 263G 315.1C
91P P H1c1 European 16263C 16519C 263G 309.1C 309.2C 315.1C 477C
92P P T2 European 16126C 16147T 16294T 16296T 16297C 16519C 73G 240G 263G 309.1C 315.1C
93P P H1c European 16519C 263G 309.1C 315.1C 477C
94P P T2b European 16126C 16294T 16304C 16519C 73G 152C 263G 309.1C 315.1C
96P P J1c2b4 European 16069T 16086C 16126C 16519C 73G 185A 188G 228A 241.1T 241.2A 241.3A 263G 295T 309.1C 315.1C 462T 489C
97P P J1c2b4 European 16069T 16086C 16126C 16519C 73G 185A 188G 228A 263G 295T 309.1C 315.1C 462T 489C
98P P H5 European 16304C 263G 309.1C 315.1C 456T
99P P H5 European 16213A 16304C 152C 263G 309.1C 315.1C 456T
100P P R0 European 263G 309.1C 315.1C
101P P C1b2 Amerindian 16223T 16298C 16325C 16327T 16519C 73G 249del 290del 291del 309.1C 315.1C 489C 493G 523del 524del
102P P H1a European 16162G 16519C 73G 263G 315.1C
103P P H5 European 16145A 16304C 16519C 263G 315.1C 456T 523del 524del
104P P I European 16129A 16223T 16391A 16519C 57C 58G 60.1T 73G 199C 204C 250C 263G 309.1C 315.1C 573.1C 573.2C 573.3C
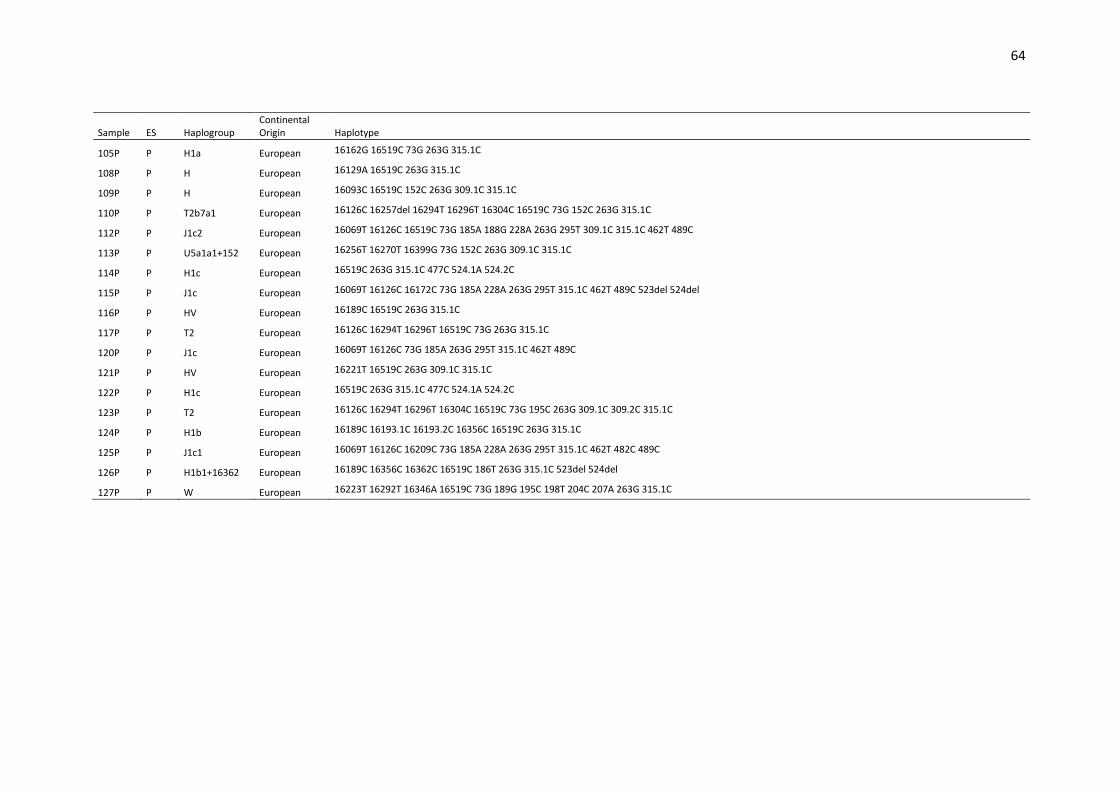
64
Sample ES Haplogroup Continental Origin Haplotype
105P P H1a European 16162G 16519C 73G 263G 315.1C
108P P H European 16129A 16519C 263G 315.1C
109P P H European 16093C 16519C 152C 263G 309.1C 315.1C
110P P T2b7a1 European 16126C 16257del 16294T 16296T 16304C 16519C 73G 152C 263G 315.1C
112P P J1c2 European 16069T 16126C 16519C 73G 185A 188G 228A 263G 295T 309.1C 315.1C 462T 489C
113P P U5a1a1+152 European 16256T 16270T 16399G 73G 152C 263G 309.1C 315.1C
114P P H1c European 16519C 263G 315.1C 477C 524.1A 524.2C
115P P J1c European 16069T 16126C 16172C 73G 185A 228A 263G 295T 315.1C 462T 489C 523del 524del
116P P HV European 16189C 16519C 263G 315.1C
117P P T2 European 16126C 16294T 16296T 16519C 73G 263G 315.1C
120P P J1c European 16069T 16126C 73G 185A 263G 295T 315.1C 462T 489C
121P P HV European 16221T 16519C 263G 309.1C 315.1C
122P P H1c European 16519C 263G 315.1C 477C 524.1A 524.2C
123P P T2 European 16126C 16294T 16296T 16304C 16519C 73G 195C 263G 309.1C 309.2C 315.1C
124P P H1b European 16189C 16193.1C 16193.2C 16356C 16519C 263G 315.1C
125P P J1c1 European 16069T 16126C 16209C 73G 185A 228A 263G 295T 315.1C 462T 482C 489C
126P P H1b1+16362 European 16189C 16356C 16362C 16519C 186T 263G 315.1C 523del 524del
127P P W European 16223T 16292T 16346A 16519C 73G 189G 195C 198T 204C 207A 263G 315.1C
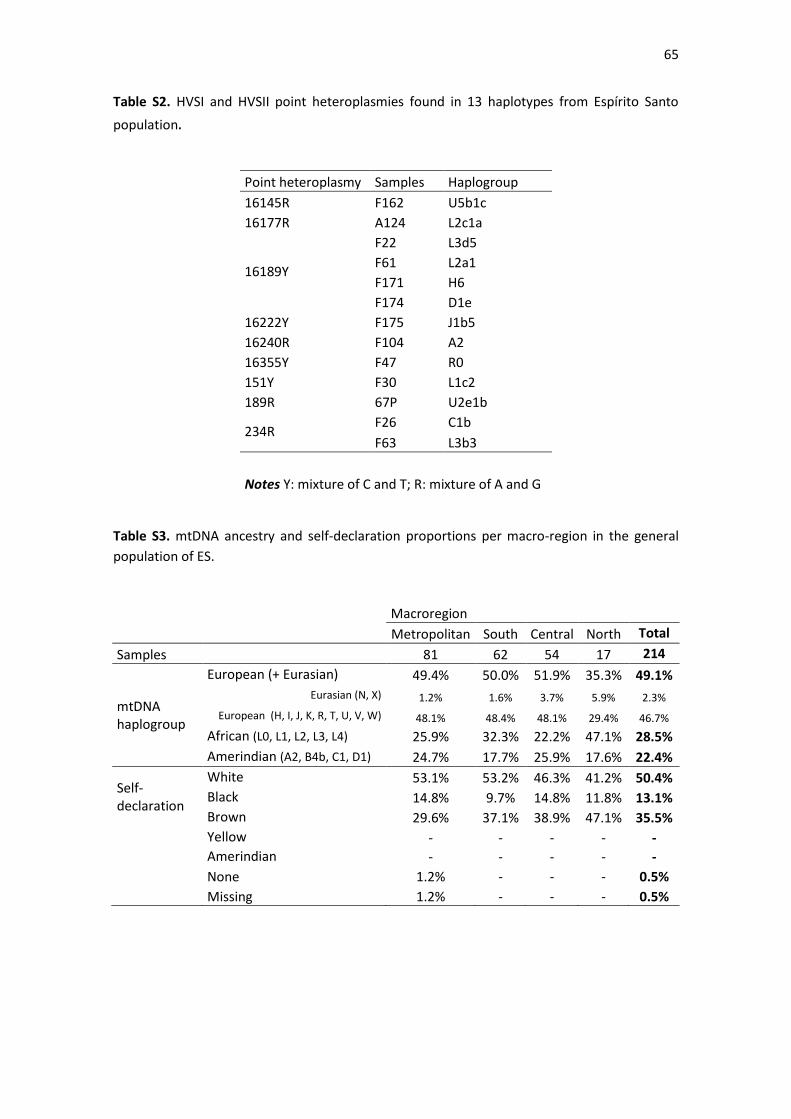
65
Table S2. HVSI and HVSII point heteroplasmies found in 13 haplotypes from Espírito Santo
population.
Point heteroplasmy Samples Haplogroup
16145R F162 U5b1c
16177R A124 L2c1a
16189Y
F22 L3d5
F61 L2a1
F171 H6
F174 D1e
16222Y F175 J1b5
16240R F104 A2
16355Y F47 R0
151Y F30 L1c2
189R 67P U2e1b
234R F26 C1b
F63 L3b3
Notes Y: mixture of C and T; R: mixture of A and G
Table S3. mtDNA ancestry and self-declaration proportions per macro-region in the general
population of ES.
Macroregion
Metropolitan South Central North Total
Samples 81 62 54 17 214
mtDNA haplogroup
European (+ Eurasian) 49.4% 50.0% 51.9% 35.3% 49.1%
Eurasian (N, X) 1.2% 1.6% 3.7% 5.9% 2.3%
European (H, I, J, K, R, T, U, V, W) 48.1% 48.4% 48.1% 29.4% 46.7%
African (L0, L1, L2, L3, L4) 25.9% 32.3% 22.2% 47.1% 28.5%
Amerindian (A2, B4b, C1, D1) 24.7% 17.7% 25.9% 17.6% 22.4%
Self-declaration
White 53.1% 53.2% 46.3% 41.2% 50.4%
Black 14.8% 9.7% 14.8% 11.8% 13.1%
Brown 29.6% 37.1% 38.9% 47.1% 35.5%
Yellow - - - - -
Amerindian - - - - -
None 1.2% - - - 0.5%
Missing 1.2% - - - 0.5%
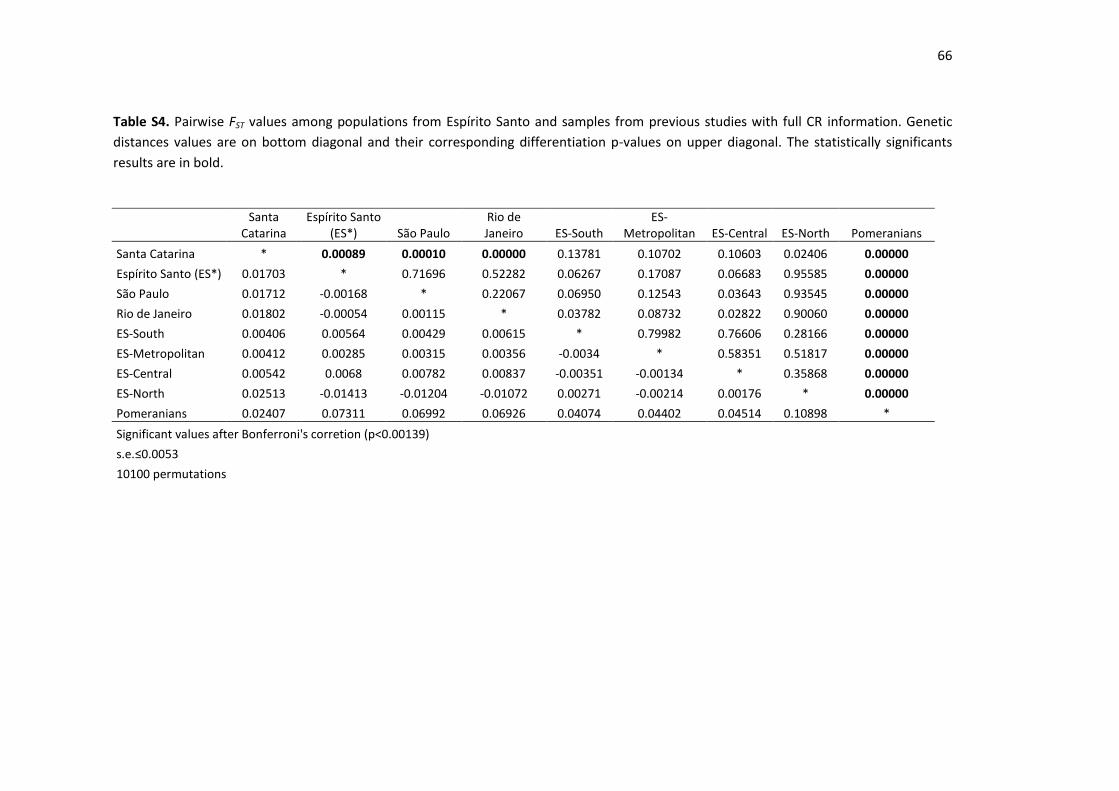
66
Table S4. Pairwise FST values among populations from Espírito Santo and samples from previous studies with full CR information. Genetic
distances values are on bottom diagonal and their corresponding differentiation p-values on upper diagonal. The statistically significants
results are in bold.
Santa
Catarina Espírito Santo
(ES*) São Paulo Rio de Janeiro ES-South
ES-Metropolitan ES-Central ES-North Pomeranians
Santa Catarina * 0.00089 0.00010 0.00000 0.13781 0.10702 0.10603 0.02406 0.00000
Espírito Santo (ES*) 0.01703 * 0.71696 0.52282 0.06267 0.17087 0.06683 0.95585 0.00000
São Paulo 0.01712 -0.00168 * 0.22067 0.06950 0.12543 0.03643 0.93545 0.00000
Rio de Janeiro 0.01802 -0.00054 0.00115 * 0.03782 0.08732 0.02822 0.90060 0.00000
ES-South 0.00406 0.00564 0.00429 0.00615 * 0.79982 0.76606 0.28166 0.00000
ES-Metropolitan 0.00412 0.00285 0.00315 0.00356 -0.0034 * 0.58351 0.51817 0.00000
ES-Central 0.00542 0.0068 0.00782 0.00837 -0.00351 -0.00134 * 0.35868 0.00000
ES-North 0.02513 -0.01413 -0.01204 -0.01072 0.00271 -0.00214 0.00176 * 0.00000
Pomeranians 0.02407 0.07311 0.06992 0.06926 0.04074 0.04402 0.04514 0.10898 *
Significant values after Bonferroni's corretion (p<0.00139)
s.e.≤0.0053
10100 permutations
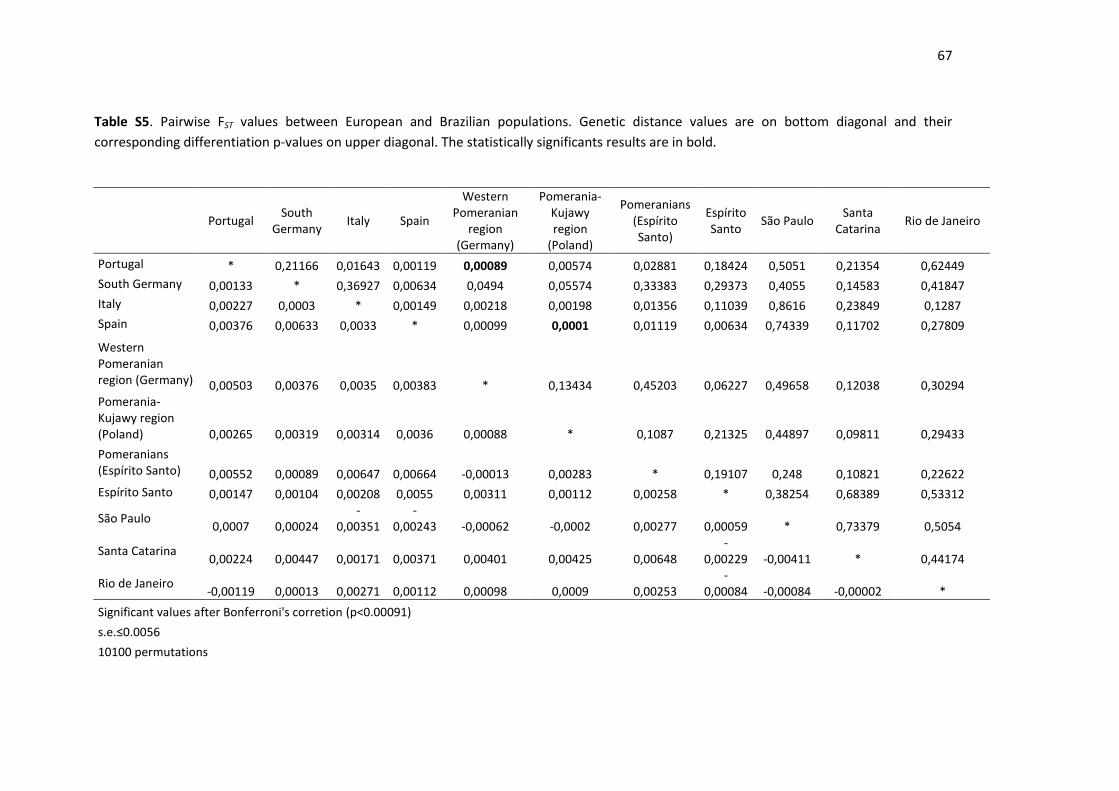
67
Table S5. Pairwise FST values between European and Brazilian populations. Genetic distance values are on bottom diagonal and their
corresponding differentiation p-values on upper diagonal. The statistically significants results are in bold.
Portugal South
Germany Italy Spain
Western Pomeranian
region (Germany)
Pomerania-Kujawy region
(Poland)
Pomeranians (Espírito Santo)
Espírito Santo
São Paulo Santa
Catarina Rio de Janeiro
Portugal * 0,21166 0,01643 0,00119 0,00089 0,00574 0,02881 0,18424 0,5051 0,21354 0,62449
South Germany 0,00133 * 0,36927 0,00634 0,0494 0,05574 0,33383 0,29373 0,4055 0,14583 0,41847
Italy 0,00227 0,0003 * 0,00149 0,00218 0,00198 0,01356 0,11039 0,8616 0,23849 0,1287
Spain 0,00376 0,00633 0,0033 * 0,00099 0,0001 0,01119 0,00634 0,74339 0,11702 0,27809
Western Pomeranian region (Germany) 0,00503 0,00376 0,0035 0,00383 * 0,13434 0,45203 0,06227 0,49658 0,12038 0,30294 Pomerania-Kujawy region (Poland) 0,00265 0,00319 0,00314 0,0036 0,00088 * 0,1087 0,21325 0,44897 0,09811 0,29433
Pomeranians (Espírito Santo) 0,00552 0,00089 0,00647 0,00664 -0,00013 0,00283 * 0,19107 0,248 0,10821 0,22622
Espírito Santo 0,00147 0,00104 0,00208 0,0055 0,00311 0,00112 0,00258 * 0,38254 0,68389 0,53312
São Paulo 0,0007 0,00024
-0,00351
-0,00243 -0,00062 -0,0002 0,00277 0,00059 * 0,73379 0,5054
Santa Catarina 0,00224 0,00447 0,00171 0,00371 0,00401 0,00425 0,00648
-0,00229 -0,00411 * 0,44174
Rio de Janeiro -0,00119 0,00013 0,00271 0,00112 0,00098 0,0009 0,00253
-0,00084 -0,00084 -0,00002 *
Significant values after Bonferroni's corretion (p<0.00091)
s.e.≤0.0056
10100 permutations

68
ANEXO 1 – Comprovante de submissão do artigo “A view of the maternal inheritance of
Espírito Santo populations: the contrast between the admixed and Pomeranian descent
groups”.

69

70
ANEXO 2 – Comprovante de submissão do artigo “Stratification among European descente and
admixed Brazillian populations of Espírito Santo for 27 Y-STRs”.
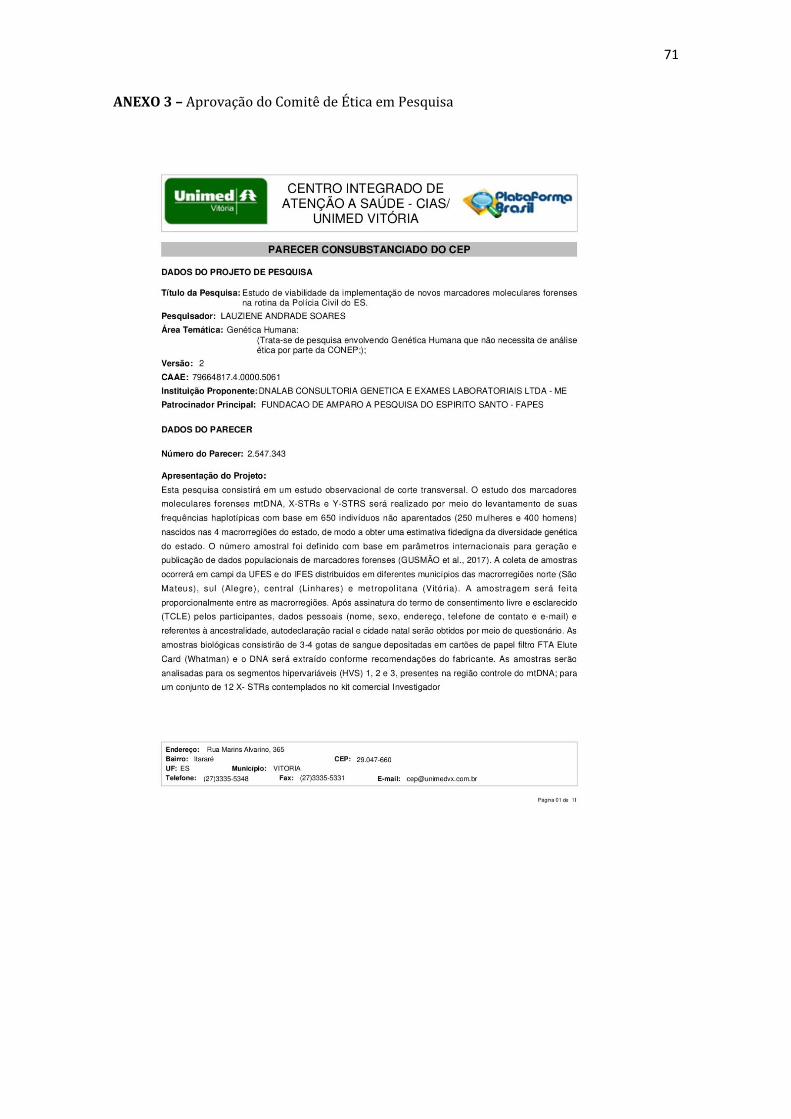
71
ANEXO 3 – Aprovação do Comitê de Ética em Pesquisa
Pesquisa
72

73
74

75
76

77
78
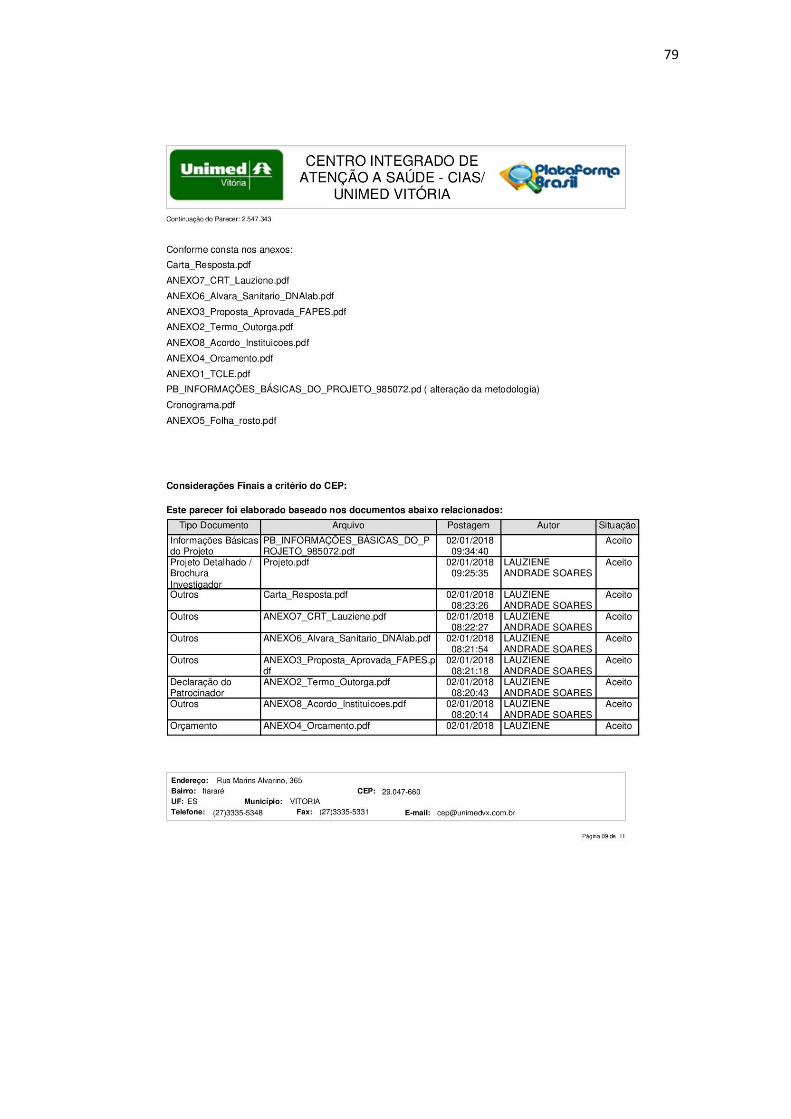
79
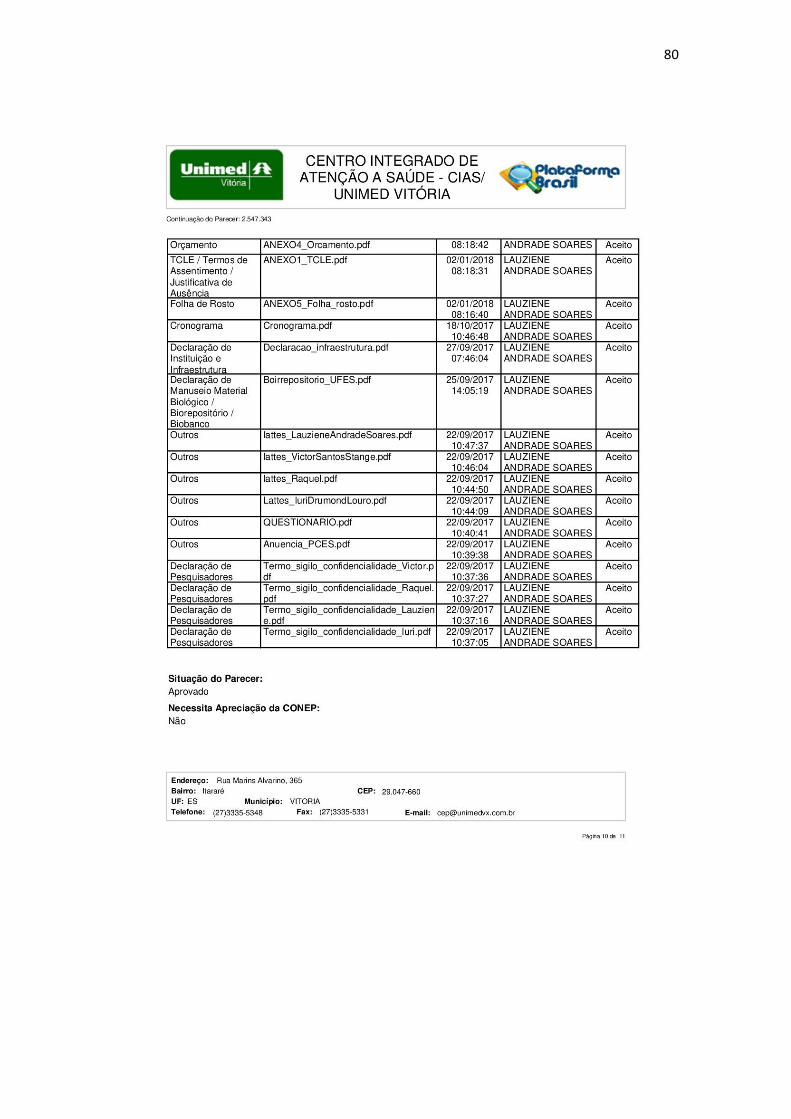
80
81
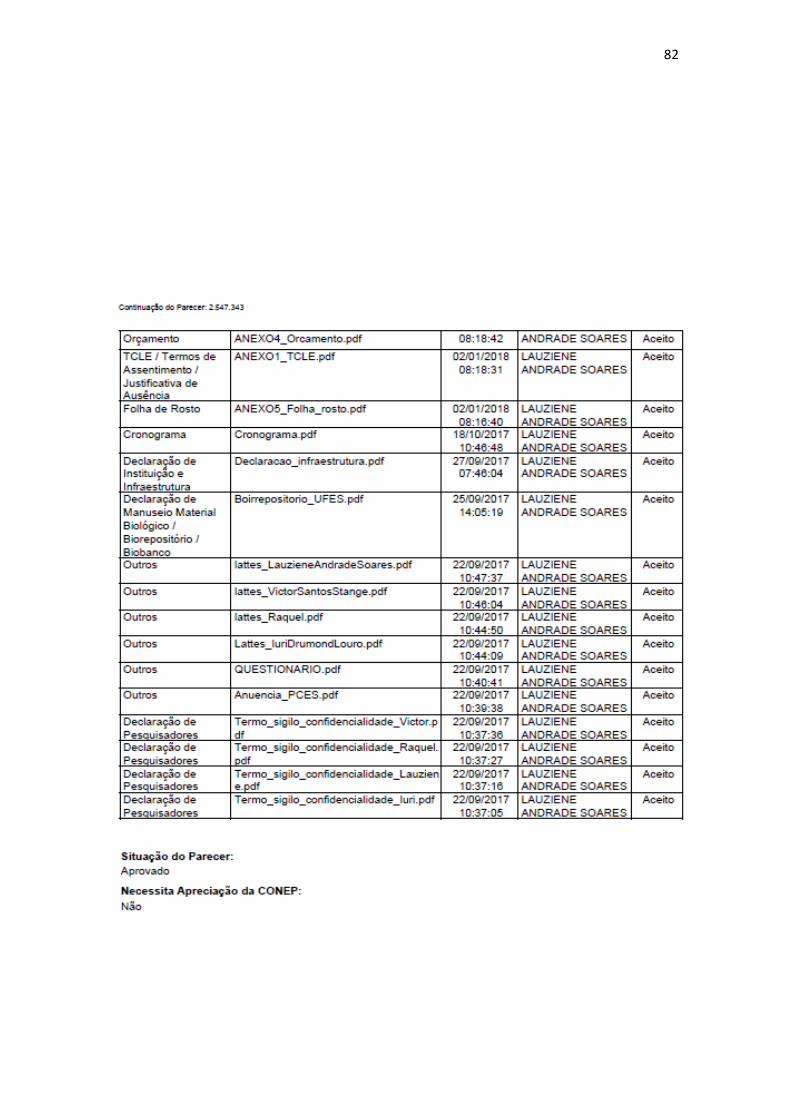
82

83