dep ar tmen o de c iÊn s da v da - estudo geral · p ar tmen o de c iÊn s da v da faculdade de...
TRANSCRIPT

Danijela
Dim
itrije
vić
Feedin
g e
colo
gy o
f ch
inst
rap p
enguin
s Pyg
osc
elis
anta
rctica
at
Liv
ingst
on I
sland (
Anta
rctic)
2015
DEPARTAMENTO DE CIÊNCIAS DA VIDA
FACULDADE DE CIÊNCIAS E TECNOLOGIA UNIVERSIDADE DE COIMBRA
Feeding ecology of chinstrap penguins Pygoscelis antarctica at Livingston Island
(Antarctic)
Danijela Dimitrijević
2015

DEPARTAMENTO DE CIÊNCIAS DA VIDA
FACULDADE DE CIÊNCIAS E TECNOLOGIA UNIVERSIDADE DE COIMBRA
Feeding ecology of chinstrap penguins Pygoscelis antarctica at Livingston Island
(Antarctic)
Dissertação apresentada à Universidade de Coimbra para cumprimento dos requisitos necessários à obtenção do grau de Mestre em Ecologia, realizada sob a orientação científica do Doutor José Carlos Caetano Xavier (Instituto do Mar da Universidade de Coimbra e da British Antarctic Survey) e do Professor Doutor Jaime Albino Ramos (Universidade de Coimbra)
Danijela Dimitrijević
2015

“O snail
Climb Mount Fuji
But slowly, slowly!”
Kobayashi Issa
1
Acknowledgments
Past two years have been one of the best years of my life, full of amazing experiences,
travels and meeting of incredible people. None of this would be possible without
Erasmus Mundus Association and International Master in Applied Ecology. I would
like to say a big thank you to all the coordinators of this Master Program for giving me
this opportunity and financial support.
I would like to express my deep gratitude to my supervisors Jose Xavier and Jaime
Ramos for all the guidance, reviews, comments and patience. Thank you for the
opportunity to get involved into Antarctic science and to work on this amazing project!
I would like to say a special thank you to Jose Seco for helping in collecting all the data
used in my thesis. Thank you also Vitor Paiva and Felipe Ceia for your time and for
helping me improve my work.
Thank you Leonor Keating for the Portuguese translation and for sacrificing your
studying time for me. It really meant a lot to me, and if you ever need translation to
Serbian, I will be there for you!
A truly thank you to my best friends at home: Andjela, Monika, Bilja, Zlata and Jelena
for giving me a precious piece of home whenever we would talk and for being there for
me always, despite the distance!
It is really rare to put 16 people from 15 different countries and to get such a dynamic
and harmonious group. I feel so grateful and proud to be part of it and to know each one
of you (I like to say that I finally found my species). Big thank you to my IMAE family
(cohort 2013-2015) for making this experience so special. But of course even bigger one
to my ―band‖ Anya, Felipe, Sara and Sebastian for all the laughs, dinners, travels and
adventures. Every moment spent with you confirmed that ―Life is Beautiful‖. I am
looking forward to our future band reunions!
And last but not the least I would like to thank to my entire family – grandparents
(Mica, Emka and Čedo), uncle Vladan, aunts (Nevena, Danka, Branka, Sanja) cousins
(Jovana, Bojana, Milica, Ana, Nemanja, Djordje, Nikolina) and Milenica for all your
love and support. Most importantly to my parents Dragoslav and Jelena and to my
brother Nikola – there are no words that can express the gratitude I have for the three of
you, for all the encouragement, love and for believing in me, even when I didn‘t believe
in myself.
Thank you!
Obrigada!
Hvala!
2
Table of contents
Abstract ........................................................................................................................... 4
Resumo ............................................................................................................................ 6
Chapter 1 – Introduction ............................................................................................... 9
1.1 Antarctic and Southern Ocean in the context of climate change .......................... 10
1.2 Climate change and Western Antarctic Peninsula ecosystems ............................. 12
1.3 Chinstrap penguins ............................................................................................... 15
Distribution.............................................................................................................. 16
Breeding .................................................................................................................. 17
Diet and feeding ecology......................................................................................... 18
Objectives of the study ............................................................................................... 21
Chapter 2 - Materials and methods ............................................................................ 22
2.1 Study area and sample collection .......................................................................... 23
2.2 Diet analysis .......................................................................................................... 24
2.3 Stable isotope analysis .......................................................................................... 25
2.4 Food web analysis ................................................................................................. 26
2.5 Statistical analysis ................................................................................................. 27
Chapter 3 - Results ....................................................................................................... 29
3.1 Diet composition ................................................................................................... 30
Adults ...................................................................................................................... 30
Chicks ...................................................................................................................... 30
3.2 Stable Isotope Analysis ......................................................................................... 32
3.3 Antarctic Marine Food Web ................................................................................. 34
Isotopic composition of primary producers ............................................................ 35
Isotope signatures in herbivores .............................................................................. 35
Isotope signatures in secondary consumers ............................................................ 36
Isotope signatures in scavengers ............................................................................. 36
Discriminant factor .................................................................................................. 37

3
Chapter 4 – Discussion ................................................................................................. 40
4.1 Diet composition of chinstrap penguins ............................................................... 41
Overall diet of chinstrap penguins in Livingston Island and differences
between diets of chicks and adults .......................................................................... 41
Diets of chinstrap penguins in Livingston Island in comparison with other islands45
Stable isotopic analyses of different tissues from penguins provide valuable
information about the feeding ecology of chinstrap penguins ................................ 48
4.2 Marine food web around Livingston Island: the role of chinstrap penguins . 53
4.3 Implications of feeding ecology studies of chinstrap penguins in conservation .. 58
References...................................................................................................................... 61
Appendix ....................................................................................................................... 74
Appendix of Tables ..................................................................................................... 75
4
Abstract
Antarctic and Southern Ocean marine ecosystems have been changing for the
past 30 years, along with the global climate change. The most evident changes are
on the Western Antarctic Peninsula, which is warming four times faster than the
average rate of Earth‘s overall warming. Within the Antarctic Peninsula region, one
of the penguin species used to monitor Southern Ocean food web changes is the
chinstrap penguin (Pygoscelis antarctica). The main objective of this study is to
assess the feeding ecology of chinstrap penguins in Livingston Island. This is done
by comparing the diets from adult chinstrap penguins (through fecal samples; scats)
and chicks (through stomach contents from naturally died chicks). To complement
these analyses, different tissues (i.e. feathers, blood, flesh and nails) were collected
from adult penguins and dead chicks and used for stable isotope analyses of 15
N and
13C. Also a snapshot of the marine food web around Livingston Island is provided,
in order to assess chinstrap penguin trophic level in comparison with other
organisms through the stable isotopic analyses of typical, key organisms found in
Livingston Island (i.e. algae, krill, seabirds, seals).
Crustaceans, specifically Antarctic krill comprised the diet 100% by
frequency of occurrence, by mass and by number of both adults and chicks chinstrap
penguins. This confirmed that Antarctic krill dominates the diet of chinstrap
penguins at least during the breeding period. The mean size of collected Antarctic
krill was 38.66 ± 2.56 mm for adults and 39.87 ± 2.69 mm for chicks.
Different tissues reflect different time scales of stable isotope incorporation.
For adults, feathers were more enriched in stable isotope ratios of nitrogen and
carbon than blood, and reflect the diet form the previous year after the breeding
season, while blood reflects the most recent diet. High significant differences were
found between these two tissues, indicating different feeding habits during breeding
and non-breeding periods. In the case of chicks of chinstrap penguins there were two
metabolically inactive tissues – feathers and nails, and metabolically active flesh.
The chicks were 2-3 weeks old when they died, thus for this short period the
5
sampled tissues should accumulate isotopes at the same rates. However, no
correlation was found between these tissues, and high significant differences for
δ15
N were recorded between feathers and all other tissues, which confirm that
different tissues accumulate the same isotopes at different ratios. Regarding the δ13
C
values significant differences between active and inactive tissues (flesh and nails;
flesh and feathers) refer to different foraging habitats during incubation and during
chick-growing period. Also, it was possible to compare stable isotope ratios of
feathers between adult and chicks. Chick feathers indirectly reflect mother‘s diet,
while adult feathers reflect the period after the previous breeding season.
Expectedly, differences in carbon values indicate changed feeding habitat in
summer and in winter, while nitrogen comparison shows that they remain foraging
at the same trophic level.
Analyses of δ15
N and δ13
C of other organisms revealed three main groups in
the marine food web of Livingston Island - higher order predators such as elephant
seal, brown skua, kelp gull and southern giant petrel were at the top of the food
chain, while penguins had increased levels of nitrogen and carbon isotope signatures
compared to their prey – Antarctic krill. The food chain length for Livingston Island
marine food web calculated is 4.7, and it is inside the range calculated for other
marine pelagic ecosystems across the planet.
This study is particularly relevant for monitoring programs under CCAMLR.
It showed that it is possible to contribute to the future monitoring of chinstrap
penguin diets in alternative ways (i.e. not invasive for penguins). In general this kind
of study can contribute to the conservation of this species through protecting their
food resources and feeding habitats and in understanding their future population
processes.
Key words: chinstrap penguins, feeding ecology, Antarctic krill, stable isotopes,
marine food web, Livingston Island.
6
Resumo
Os ecossistemas marinhos do Oceano Antártico têm vindo a mudar nos últimos
30 anos, acompanhando as mudanças climatéricas globais. As alterações mais evidentes
são visíveis na Península Antártica Ocidental, que tem uma taxa de aquecimento quatro
vezes mais alta que a média global. Na região da Península Antártica, uma das espécies
de pinguins usada para monitorizar as alterações nas cadeias alimentares do Oceano
Antártico é o Pinguim-de-barbicha (Pygoscelis antarctica). Os pinguins-de-barbicha são
dos maiores consumidores de krill do Antártico neste ecossistema marinho e as suas
tendências populacionais estão diretamente relacionadas com a disponibilidade de krill.
O principal objetivo deste estudo é avaliar a ecologia alimentar dos pinguins-de-
barbicha na Ilha Livingston. Isto foi feito pela comparação das dietas de pinguins-de-
barbicha adultos (através de amostras fecais) e de pintos (através de conteúdo estomacal
de pintos mortos por causa natural). De modo a complementar estas análises, foram
recolhidos também outros tecidos (i.e. penas, sangue, músculo e unhas) dos pinguins
adultos e dos pintos mortos. Estes tecidos foram usados para análise dos isótopos
estáveis 15
N e 13
C. É apresentada uma análise da cadeia alimentar na zona da Ilha
Livingston de modo a avaliar o nível trófico do pinguim-de-barbicha comparativamente
com outros organismos, através da análise de isótopos estáveis em organismos-chave
nesta ilha (i.e. algas, krill, aves marinhas, focas).
Crustáceos, nomeadamente o krill do Antártico, representaram 100% da dieta
dos pinguins adultos e pintos, por frequência de ocorrência, por massa e por número.
Este facto veio a confirmar que o krill do Antártico domina a dieta dos pinguins-de-
barbicha, pelo menos durante a época de reprodução. O tamanho médio do krill
recolhido foi de 38.66 ± 2.56 mm para os adultos e 39.87 ± 2.69 mm para os pintos.
Tecidos diferentes apresentam escalas temporais diferentes de incorporação de
isótopos estáveis. Nos adultos, as penas mostraram-se mais enriquecidas nos ratios do
azoto e carbono em isótopos estáveis do que o sangue, refletindo a dieta do ano anterior,
enquanto o sangue refletiu a dieta mais recente. Foram encontradas diferenças
significativas entre estes tecidos, indicando hábitos alimentares diferentes durantes as

7
épocas de reprodução e as épocas não-reprodutivas. No caso dos pintos do pinguim-de-
barbicha houve dois tecidos metabolicamente inativos – penas e unhas, e músculos
metabolicamente ativos. Os pintos tinham entre 2 e 3 semanas aquando da morte, sendo
de esperar que para este curto período de tempo os tecidos amostrados tivessem
acumulado isótopos ao mesmo ritmo. No entanto, não foi encontrada nenhuma
correlação entre estes tecidos. Foram registadas diferenças altamente significativas para
δ15
N entre as penas e todos os outros tecidos, confirmando assim que diferentes tecidos
acumulam os mesmos isótopos a diferentes ratios. Relativamente aos valores de δ13
C, as
diferenças significativas encontradas entre tecidos ativos e inativos (músculo e unhas;
músculo e penas) referem-se a diferentes hábitos de forrageamento durante os períodos
de gestação e de crescimento dos pintos. Foi também possível comparar os ratios de
isótopos estáveis entre as penas de adultos e pintos. As penas dos pintos refletem
indiretamente a dieta materna, enquanto as penas dos adultos refletem o período após a
época reprodutiva anterior. Como seria de esperar, as diferenças nos valores de carbono
indicam diferenças nas dietas de verão e inverno, ao passo que o azoto mostra que eles
permanecem no mesmo nível trófico de forrageamento.
A análise de δ15
N e δ13
C noutros organismos revelou três grandes grupos na
cadeia alimentar da Ilha Livingston – os predadores de topo, como o elefante-marinho, a
skua Stercorarius antarcticus, o gaivotão Larus dominicanus e o petrel-gigante-do-sul
encontram-se no topo da cadeia alimentar, enquanto os pinguins aumentaram os níveis
isotópicos das assinaturas de azoto e carbono comparativamente com as suas presas – o
krill do Antártico. O comprimento da cadeia alimentar calculado na Ilha Ligingston é
4.7, valor que se encontra na margem calculada para outros ecossistemas marinhos
pelágicos no planeta.
Este estudo é particularmente relevante para os programas de monitorização da
CCAMLR. Mostrou que é possível contribuir para a futura monitorização do pinguim-
de-barbicha de formas alternativas (i.e. não invasivas para os animais). No geral, este
tipo de estudos pode contribuir para a conservação desta espécie através da proteção dos
seus recursos e hábitos alimentares e na compreensão da futura progressão das
populações.

8
Palavras-chave: Pygoscelis antarctica, ecologia alimentar, krill do Antártico, isótopos
estáveis, cadeia alimentar marinha, Ilha Livingston.
9
Chapter 1 – Introduction

10
1.1 Antarctic and Southern Ocean in the context of climate change
Current anthropogenic activities such as extracting and burning of fossil fuels,
agriculture, deforestation and land use change, increased since the beginning of the
Industrial Revolution. This has caused various environmental changes on a global level.
One of the most evident disturbances, along with biodiversity loss and interference with
nitrogen cycle is climate change (Rockstrom et al., 2009). According to the last
Intergovernmental Panel on Climate Change (IPCC) fifth assessment report, global
climate changed since the mid of 20th
century – the atmosphere and ocean have warmed,
the amounts of snow and ice have reduced and sea level has risen. The main causes of
these changes are the anthropogenic greenhouse gas (CO2, CH4, and N2O) emissions, at
this time highest than ever in Earth‘s history (IPCC, 2014). Although the climate change
is a global phenomenon, some of its impact may occur more rapidly in certain parts of
the Polar Regions where increases in annual mean temperatures and melting of sea ice
are constantly observed (Turner et al., 2009). Indeed, the Antarctic and Southern Ocean
marine ecosystems have been changing for the past 30 years (Constable et al., 2014,
Turner et al., 2009, Turner et al., 2014).
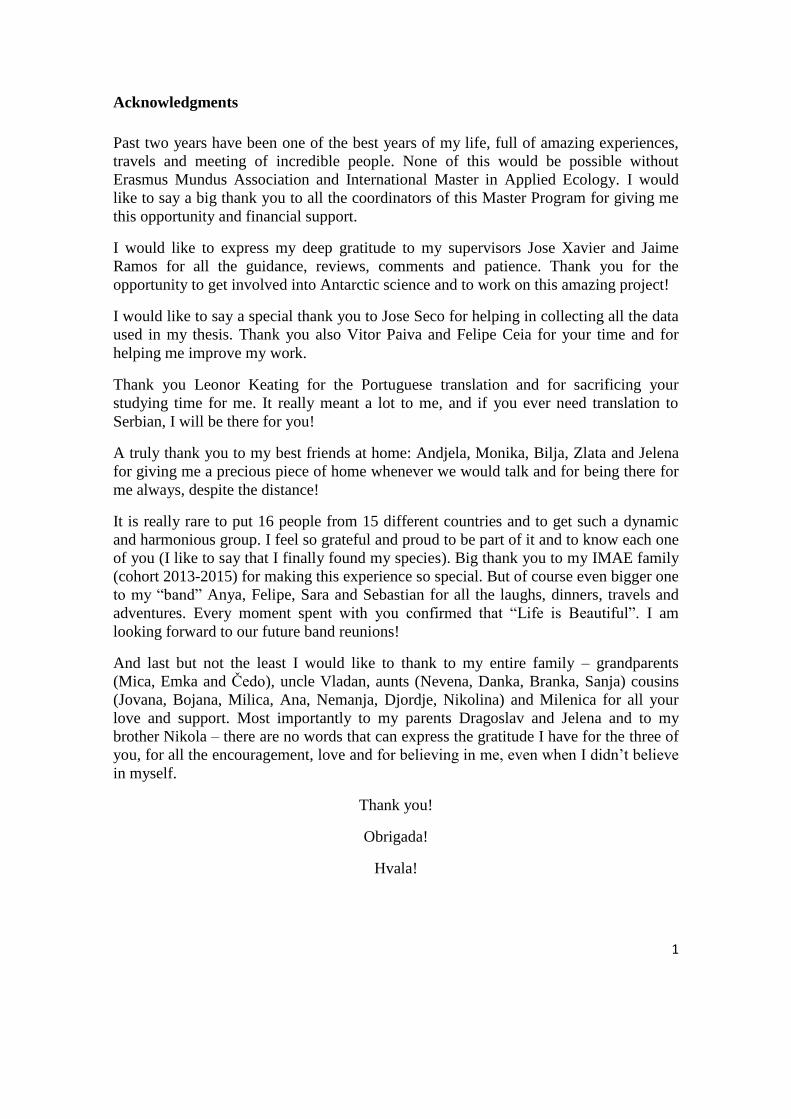
Antarctica is the highest, driest, windiest and coldest continent located on the
highest latitudes region of the south hemisphere of our planet, surrounded by the
Southern Ocean (i.e. defined here as waters south of the Subtropical Front) (Figure 1). It
comprises two main topographic regions - East Antarctica and West Antarctica,
separated by the Transantarctic Mountains (Turner et al., 2009). Antarctic continent
includes about one tenth of the planet‘s land surface, nearly 90% of Earth‘s ice
(Kennicutt et al., 2014) and two thirds of planet‘s fresh water (McClintock et al., 2008).
It is isolated from warmer waters and more temperate atmospheric conditions to the
north by Antarctic Circumpolar Current (ACC) that is flowing from west to east around
the South Pole, cooling the air and the sea (McClintock et al., 2008). Along with polar
seasonality and annual advance and retreat of sea ice, ACC is controlling the ecosystem
dynamics of the Antarctic region (Constable et al., 2014).

11
In a global climate system, Polar Regions function as a sink for a heat
transported pole-wards (Turner et al., 2009). Thus the recent changes in the Antarctic
may impact the planet as a whole because Antarctic continent regulates regional, as well
as Earth‘s overall climate. The Southern Ocean plays an important part in a global
carbon cycle, serving at the same time as a source and a sink for atmospheric carbon
dioxide (Turner et al., 2009, Orr et al., 2005). Besides, Southern Ocean connects
Atlantic Ocean with Pacific and Indian Ocean, tropical with polar latitudes, which
means that impact on this area, can affect the entire planet (Trathan et al., 2007).
Melting of glaciers and sea ice around Antarctica is one of the main factors that will
contribute to the global sea-level rise. Moreover, Antarctica is a unique and
irreplaceable habitat for numerous species that are or will be affected by climate change.
Figure 1. A map of Antarctica (Turner et al., 2009).
12
Certain regions of the Antarctic are so fragile that even small temperature
changes can trigger disturbances of the entire ecosystem (Trathan et al., 2007).
However, even these changes do not have a uniform impact on the Antarctic continent.
Climate induced changes are the most evident on the Western Antarctic Peninsula,
which is warming four times faster than the average rate of Earth‘s overall warming
with a rise of 3°C since the middle of 20th
century (CCAMLR, 2008; Meredith & King,
2005; Turner et al., 2009; Turner et al., 2014). Likewise, waters of the Southern Ocean
are warming faster than the global ocean, for the past 50 years, and this has been above
low physiological limits for the region of Western Antarctic Peninsula (Gutt et al.,
2015). Moreover, the effects of sea warming can be measured to a depth of 100 m
(Meredith & King, 2005). Evident warming of both sea and air temperatures has led to
decrease in the number of cold years with heavy winter sea ice (it decreased by 40%
over the 26 years period (CCAMLR, 2008)), retreat of glaciers during the past 60 years
(Meredith & King, 2005; Cook et al., 2005), collapse of large ice shelves, as well as the
increase in precipitation (Turner et al., 2009; Turner et al. 2014).
1.2 Climate change and Western Antarctic Peninsula ecosystems
A current rapid rate of climate change is a main driver of progressive species
loss globally (Rockstrom et al., 2009). Consequently it poses a new challenge to the
survival of Antarctic wildlife (Croxall et al., 2002; Constable et al., 2014; Gutt et al.,
2015). Even though these changes are less obvious than physical changes, numerous
studies are linking the changing climate in Western Antarctic Peninsula region to
observed changes in ecosystems (Lynch et al., 2012 b; Croxall et al., 2002; Trathan et
al., 2007; Clarke et al., 2007; Ducklow et al., 2007). This happens due to the fact that
climate alteration affects all aspects of the life cycle of a species (Jenouvrier et al.,
2012).
The dynamics of the Antarctic ecosystems are dominated by the seasonal and
annual extent, thickness and duration of sea ice (Ducklow et al., 2007). Thus, changes
13
in sea ice dynamics can cause disturbances of habitats and species that depend of sea ice
at different trophic levels, causing bottom-up and top-down fluctuations in the food web
(Constable et al., 2014; Turner et al., 2009), changes in populations and species
distributions (Jenouvrier et al., 2012). It has been observed that over the past few
decades, changes in species‘ phenology, ranges and abundances have occurred at all
trophic levels (Clucas et al., 2014). One of the major effects of warming and sea ice
retreating is influencing the very bottom of the food chain – phytoplankton.
Phytoplankton depends of the annual cycle of the ice, and represents the base
food for Antarctic krill (Euphausia superba) that passes their energy to higher trophic
levels (Murphy et al., 2007). Antarctic krill is the main trophic link between primary
producers and apex predators and one of the most dominant species in zooplankton
biomass (Ducklow et al., 2007). Antarctic krill juveniles are highly dependent on sea ice
(McClintock et al., 2008). Different studies mention that the abundance of Antarctic
krill populations decreased 80% over the past 30 years due to the ice loss (McClintock
et al., 2008; Quetin & Ross, 2008), particularly in the Antarctic Peninsula region
(Atkinson et al., 2004).
Different Antarctic species can respond in different ways to climate changes, but
one of the most evident responses are coming from the ones placed at higher trophic
levels of food chain such as albatrosses and penguins (Croxall et al., 2002; Xavier et al.,
2013; Constable et al., 2014). Studying the ecology of marine predators, such as
penguins, has recently been identified as one of the 80 priority questions for the future
research in Antarctic and Southern Ocean (Kennicutt et al., 2014). Penguins are adapted
to live in extreme environments, but they can be highly sensitive to climate change
(Forcada & Trathan, 2009; Jenouvrier et al., 2012). Thus they have been addressed as
indicators of environmental change for a long time (Lynch et al. 2012 a). Penguins are
easy assessable and are a representative Antarctic species that we can monitor in the
context of climate change, especially because of the fact that their tolerance to rapid
warming is not going to increase due to the slow microevolution. Penguins are
important part of Southern Ocean food chain as top predators and prey (Knox, 2007).
Changes in their dynamics reflect changes of lower trophic levels that are directly
14
influenced by climate change (Jenouvrier et al., 2012). This occurs due to feeding
behavior of penguins as they rely on areas where prey is available and predictable
(Costa et al., 2010). The reproduction and survival of many marine predators depends
on the high productivity of the foraging regions (Costa et al., 2010). However, if the
stable environmental conditions are disturbed, the prey availability becomes reduced
(Forcada et al., 2006). In order to understand how top predators respond to disturbances,
it is also necessary to understand how the wider food web reacts and which trophic
interactions are the most important (Trathan et al., 2007). Assessing the ecological links
between penguins and Antarctic krill can provide us an insight into how the Southern
Ocean is functioning in a given Antarctic region.
Within the Antarctic Peninsula region, one of the penguin species used to monitor
Southern Ocean food web changes is the chinstrap penguin (Pygoscelis antarctica)
(Agnew, 1997). This species is widely distributed in Antarctic waters (see below),
including in my study island, Livingston Island (62° S 60° W). This island belongs to
the group of islands located on the western part of the Antarctic Peninsula, thus
Livingston Island is highly affected by global warming and so are the species that
inhabit it. There are three species of Pygoscelis penguins breeding on this island that are
feeding sympatrically – chinstrap, Adelie (P. adeliae) and Gentoo (P. papua).
Pygoscelis penguins are important meso-predators in the marine food web of the
Western Antarctic Peninsula (Clucas et al., 2014). Different studies are showing
responses of these penguins to current climate warming (Lynch et al., 2012 a;
Travelpiece et al., 2011; Barbosa et al., 2012). Decreasing of sea ice is affecting them in
different ways: Adelie penguins are breeding on ice so current changes are affecting
them the most. However Gentoo and chinstrap penguins require ice free ground for
nesting. Thus it is expected that both species would benefit from decreasing sea ice
(Lynch et al., 2012 a). Instead, as different studies showed, chinstrap penguins are
declining regionally, while Gentoo penguins are increasing in abundance and expanding
southward (Lynch et al., 2012 a). Moreover, study of Lynch et al., 2012, showed that in
response to warmer temperatures, Gentoo penguins advanced breeding on South
Shetland Islands almost twice as much as either Adelie or chinstraps. Since Adelie and
15
chinstrap penguins are requiring different breeding habitats, but both species are
declining, the population trends of Pygoscelis penguins can be directly linked with the
Antarctic krill availability (Turner et al., 2009; Ducklow et al., 2007; Barbosa et al.,
2012). Antarctic krill is the main prey of Adelie and chinstrap penguins during breeding
season, while Gentoo penguins, apart from Antarctic krill have fish and squid in their
diet (Ratcliff & Trathan, 2011). Hence it is assumed that the decreases in the population
of Adelie and chinstrap penguins are caused by the decline in Antarctic krill. The fact
that these two species increased their population when Antarctic krill was abundant due
to favorable climate conditions and reduced competition with other krill predators only
confirms this theory (Travelpiece et al., 2011; Clucas et al., 2014).
Therefore, assessing the feeding ecology, and methods to better improve to
collect these data, of chinstrap penguins, following the guidelines of the Commission
for the Conservation of Antarctic Living Resources (CCAMLR) monitoring program
(Agnew, 1997), should be a priority to help us understand the cause of such decline (e.g.
related to diet change or not).
1.3 Chinstrap penguins
The chinstrap penguin (Pygoscelis antarctica Forster, 1781) is one of the nine
species that are distributed in the area of the Southern Ocean (Ropert-Coudert et al.,
2014). This species of penguins belong to the genera Pygoscelis, along with Gentoo and
Adélie penguins, and is representing the most numerous species among them (Korzcak
et al., 2012). Like all other penguin species, chinstrap penguins are also monomorphic,
thus it is difficult to differentiate males from females visually (i.e. males are slightly
larger and heavier than females). Adults can grow up to 68-77 cm in length, and their
body mass vary between 3 and 6 kg, depending of the breeding cycle (Martinez et al.,
2013). In fact, they are the heaviest during molting season, but they lose weight while
raising chicks. The main predators of adult penguins are leopard seals (Hydrurga
leptonyx) and orcas (Orcinus orca), while the chicks and eggs can fall prey to seabirds

16
such as brown skua (Catharacta antarctica), southern giant petrel (Macronectes
giganteus) and sheathbill (Chionis albus) (Raferty, 2014).
Distribution
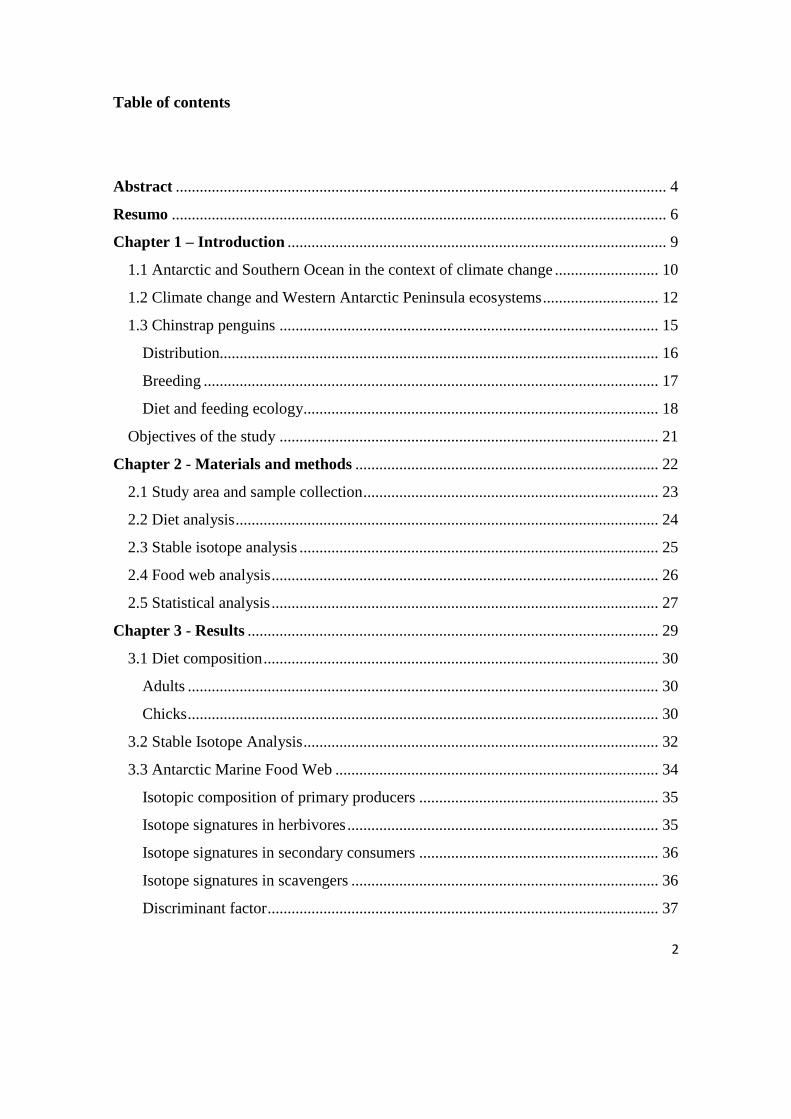
Biogeographically, the range of chinstrap penguin (Figure 2) is circumpolar,
distributed along the north parts of Antarctica, being mostly restricted to Antarctic
Peninsula and its associated archipelagos – South Shetland, the South Orkney, and the
South Sandwich Islands, including South Georgia Island (Forcada et al., 2006), Bouvet
Island and the Balleny Islands (Martinez et al., 2013). Since the range size is extremely
large, and it is established that the population trend is increasing, with the population
size being estimated to around 8 million individuals, this species has a conservation
status of least concern (IUCN 3.1, 2012), but some populations have been declining
regionally (including in Antarctic Peninsula; Lynch et al., 2012 a). This species is
legally protected under the Antarctic Treaty System that states: ―the agreed measures for
the conservation of Antarctic fauna and flora prohibit killing, wounding, capturing, or
molesting any native mammal or bird in Antarctica without a permit."
Figure 2. Geographic range map
of chinstrap penguin (Source:
IUCN -
http://maps.iucnredlist.org/map.ht
ml?id=22697761)
17
Breeding
In the breeding season Chinstrap penguins form large colonies, composed of
hundreds and thousands of birds on the rocky coasts (Martinez et al., 2013). They
exclusively need ice free ground for nesting, preferably on slopes and cliffs. Upon
arrival to colony in October – November (Martinez et al., 2013), they court, and once
the pairs are made, female lays 2 eggs in a shallow, circular nest made of stones. The
nesting starts during November and December. Both males and females are
participating in the incubation, which lasts for 30-40 days. The chicks stay in the nest
for 20-30 days and during this period both chicks are nourished equally. The chicks
fledge after they are 50-60 days old, usually during late February or early March, when
they start going to the sea to feed by themselves. Chinstrap penguins are 4-5 years old
when they mature (Forcada & Trathan, 2009). When the breeding season is over they
travel to the north beyond sea ice zone (McClintock et al., 2008) to spend winter at sea
until the next spring (Martinez et al., 2013).
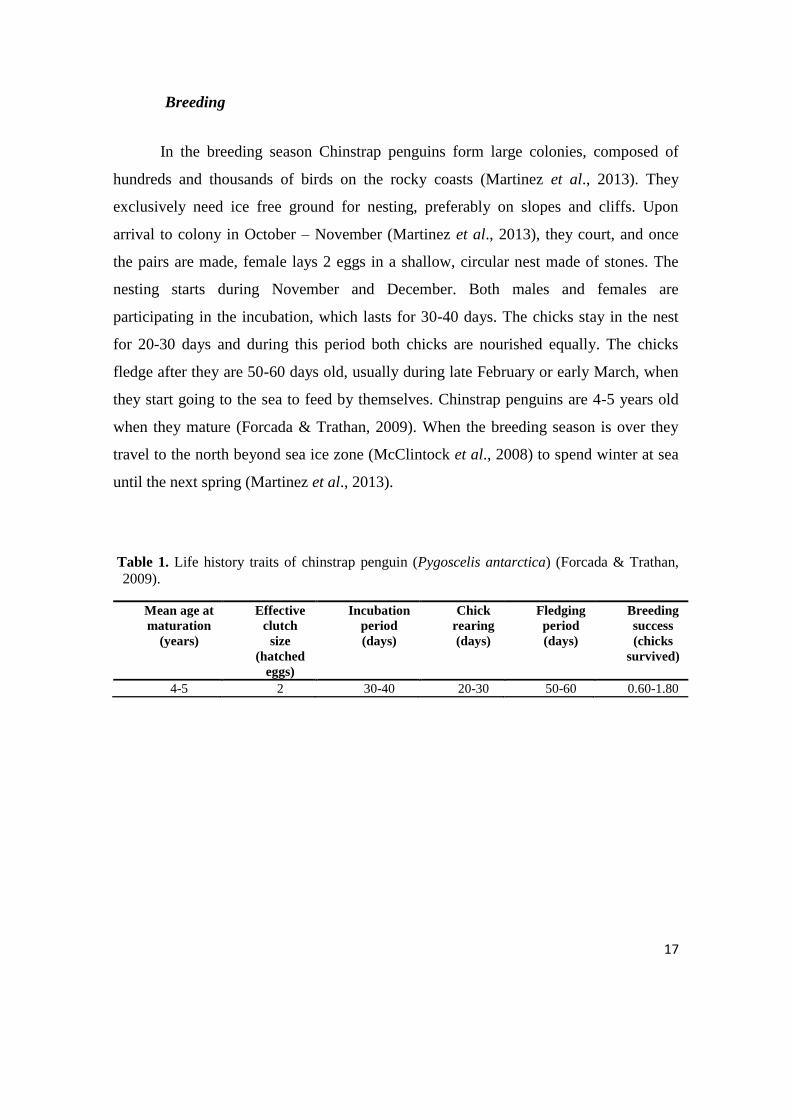
Table 1. Life history traits of chinstrap penguin (Pygoscelis antarctica) (Forcada & Trathan,
2009).
Mean age at
maturation
(years)
Effective
clutch
size
(hatched
eggs)
Incubation
period
(days)
Chick
rearing
(days)
Fledging
period
(days)
Breeding
success
(chicks
survived)
4-5 2 30-40 20-30 50-60 0.60-1.80

18
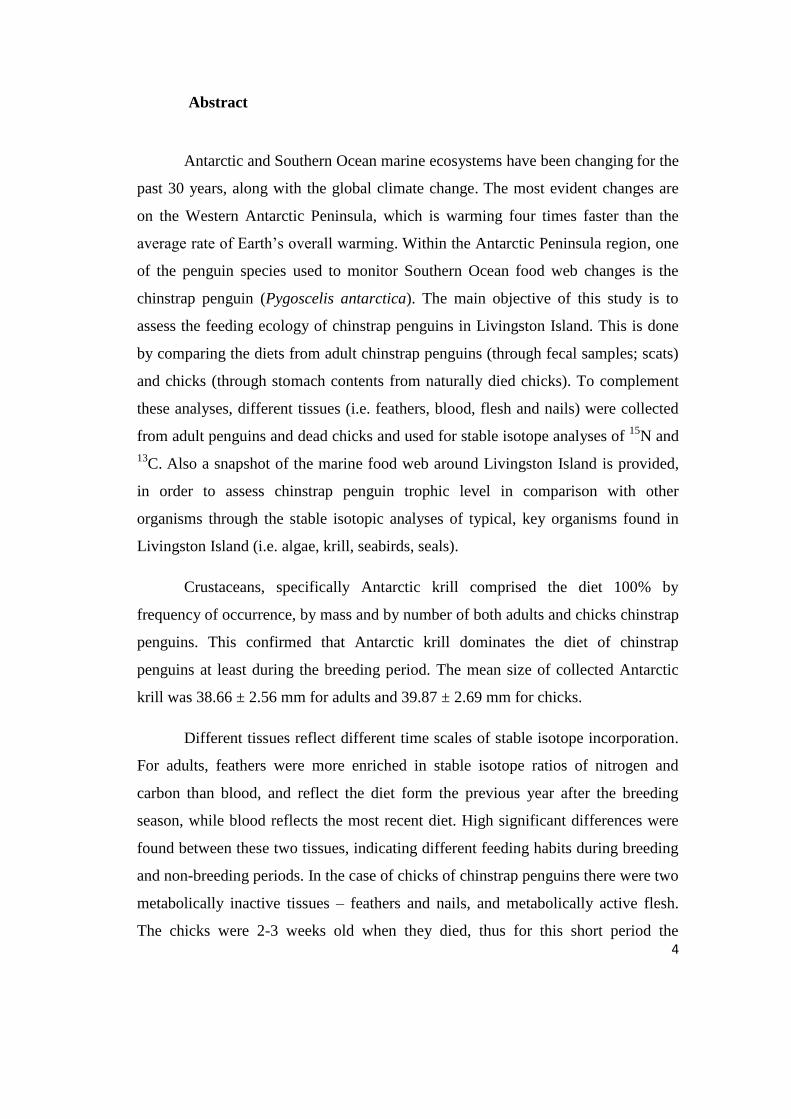
Figure 3. Life cycle of Chinstrap penguin (Source:
http://www.pinguins.info/Engels/Pygoscelis_eng.ht
ml).
Diet and feeding ecology
Chinstrap penguins forage in the pack ice (Wienecke & Robertson, 1997), but
during breeding season they feed mainly within 60 km of the colony (Lynnes et al.
2002). Their foraging ranges at sea are limited during the breeding season as they have
to commute back and forth to feed their chicks (Ropert-Coudert et al., 2014). This
species is a typical pelagic diver that feeds at depths less than 40 m (Bengston et al.
1993; Wilson & Peters 1999; Croll et al. 2006). A study by Miller & Trivelipece (2008)
showed that they feed at night as well. Moreover it was proven that during night,
chinstrap penguins forage more frequently and at greater depths than the sympatric
gentoo and Adélie penguins (Wilson & Peters, 1999).
Chinstrap penguins are one of the major consumers of Antarctic krill in the
Southern Ocean marine ecosystem: their diet is generally composed by Antarctic krill,
small fish and small crustaceans (Wilson, 1995; Rombola et al., 2010). The largest
proportion of the diet is composed of Antarctic krill, especially during the chick rearing
period (Miller & Trivelpiece, 2008). As they tend to spend less time foraging through
19
the chick-rearing period, chinstrap penguins mainly feed on adult Antarctic krill
(Lishman, 1985) - size ranges between 4-6 cm (Martinez et al., 2013). When Antarctic
krill abundance is smaller, alternate prey source is fish (Miller & Trivelpiece, 2008),
primarily myctophids (Jansen et al., 1998; Rombolá et al., 2006). Myctophids are more
nutritionally rich than even the largest Antarctic krill (Clarke, 1984; Van de Putte et al.,
2006). However, myctophids are mainly meso-pelagic and presumably, much less
abundant (Perisonotto & McQuaid, 1992) and penguins most likely have to travel
further offshore to eat myctophids than to catch Antarctic krill (Miller & Trivelpiece,
2008). The study of diving and foraging behavior of chinstrap penguins by Miller and
Trivelpiece (2008) showed that when the proportion of Antarctic krill in samples
increased, the proportion of fish decreased. Moreover, studies in the north part of
Livingston Island (Cape Sherrif), Hinke et al. (2007) found that juvenile chinstrap
penguin recruitment was highest following a year when the size of Antarctic krill was
larger (Miller & Trivelpiece, 2008). Thus, juvenile penguins, which have just begun to
forage for themselves, may not be able to meet the energetic demand of foraging on
small Antarctic krill (Miller & Trivelpiece, 2008). However, no diet data information is
available from the south part of the island, such as in Hannah point. In general little is
known about the diet of chinstraps in Livingston Island.
One of the methods used to assess the diet of penguins is through stomach
contents (Ratcliffe & Trathan, 2011). However, it is an invasive method and alternative
methods (e.g. fecal samples (scats)) could be an option to decrease the direct contact
with live penguins and reduce the impact on penguin populations, in accordance with
CCAMLR monitoring programs. Also dead chicks, from natural causes, could provide
valuable information of the food availability in the region. In this study, I will use both
scats and dead chicks to study the diet and feeding ecology of the population of
chinstrap penguins at Livingston Island. This is important because until now there are
no known studies that use naturally caused dead chicks of chinstrap penguins as a
sampling method. In addition, by using different tissues from dead chicks and adults for
stable isotope analyses, it will be possible to critically evaluate which tissue could best
represent the diet at the particular time.

20
Stable isotope analyses of Carbon (C) and Nitrogen (N) allow the
characterization of the habitat and trophic levels of organisms. The ratio of 15
N to 14
N
(δ15
N) reflects the trophic level of organisms. The ratio is increasing at each trophic
level. Thus the consumer tissues (e.g. chinstrap penguins) have values between 3-5‰
greater than those of the diets from which they were synthetized. Whereas the ratio of
13C to
12C (δ
13C) changes for 0-1‰ over spatial scales as a consequence of variation in
the rates of primary production. The use of stable isotope signatures of different tissues
is reflecting the diet throughout the period of tissue synthesis (Bearhop et al., 2006).
Chick feathers reflect parental diets during the chick-rearing period, while adult feathers
provide information on diets and foraging habitats after the breeding season when adults
undergo molt (Polito, 2012). The analysis of blood (plasma and red blood cells) is going
to reflect the diet of penguins from a few days prior to sample collection to the previous
3–4 weeks, respectively (Hobson & Clark, 1993; Votier et al., 2010). The tissues of
dead chicks such as flesh and nails remain at the level they were when the individual
died, as well as stable isotopes within them, while the unstable isotopes begin to decay.
As nails grow at predictable rates, they reflect an individual's very recent past, and so
does the flesh.
Furthermore, stable isotope signatures of different organisms are going to be
used for building the food web. This will allow extrapolating the position of chinstrap
penguin in relation to other organisms of this part of the Southern Ocean. Moreover this
has never been done for Livingston Island.

21
Objectives of the study
The main objective of this study is to assess the feeding ecology of chinstrap
penguins in Livingston Island. I was particularly interested in:
1. Comparing the diets from adult chinstrap penguins (through fecal samples; scats)
and chicks (through stomach contents from naturally dead chicks).
2. Test if it is possible to obtain valuable information about their feeding ecology,
using stable isotopic analysis of different tissues from dead chicks (i.e. - feathers,
blood, flesh and nails). This is particularly relevant for monitoring programs under
CCAMLR. This study aimed to contribute to the future monitoring of chinstrap
penguin diets in alternative ways (i.e. not invasive for penguins) and will validate
the best tissue type for getting the results. In general this kind of study can
contribute to the conservation of this species through protecting their food resources
and feeding habitats and in understanding their future population processes.
3. Provide a snapshot of the marine food web around Livingston Island, to assess
chinstrap penguin trophic level in comparison with other organisms through the
stable isotopic analyses of typical, key organisms found in Livingston Island (i.e.
algae, krill, seabirds, seals).
22
Chapter 2 - Materials and methods
23
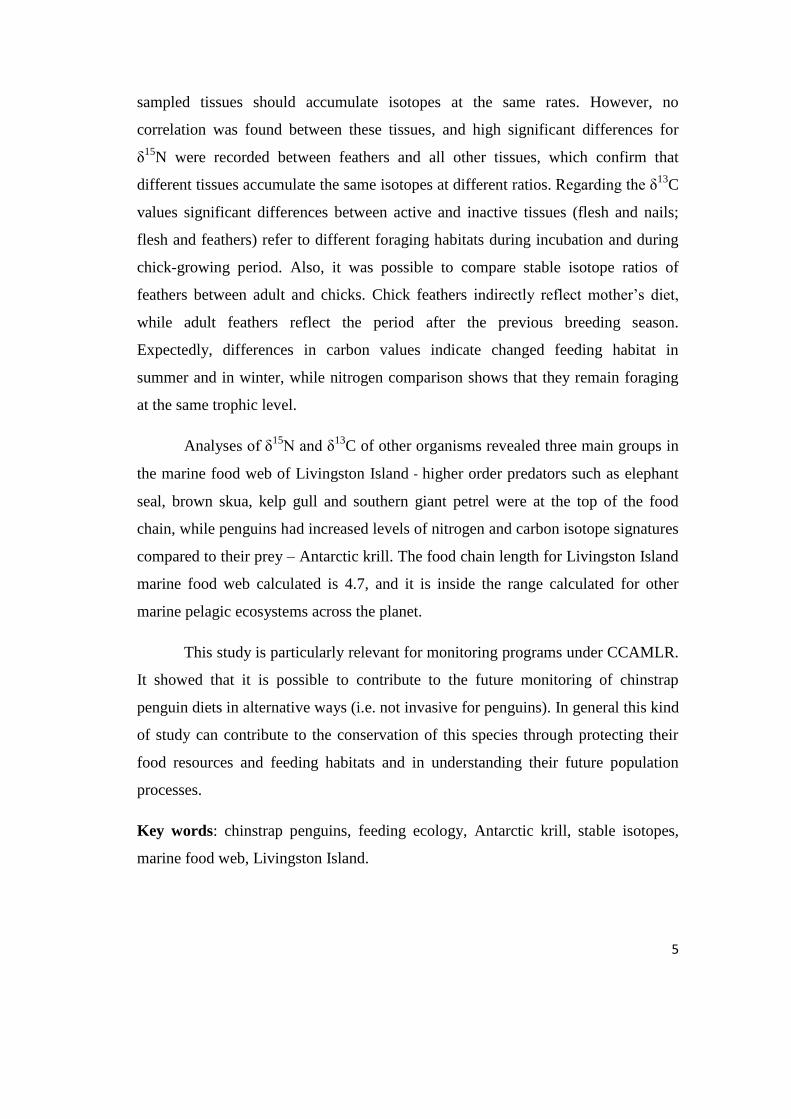
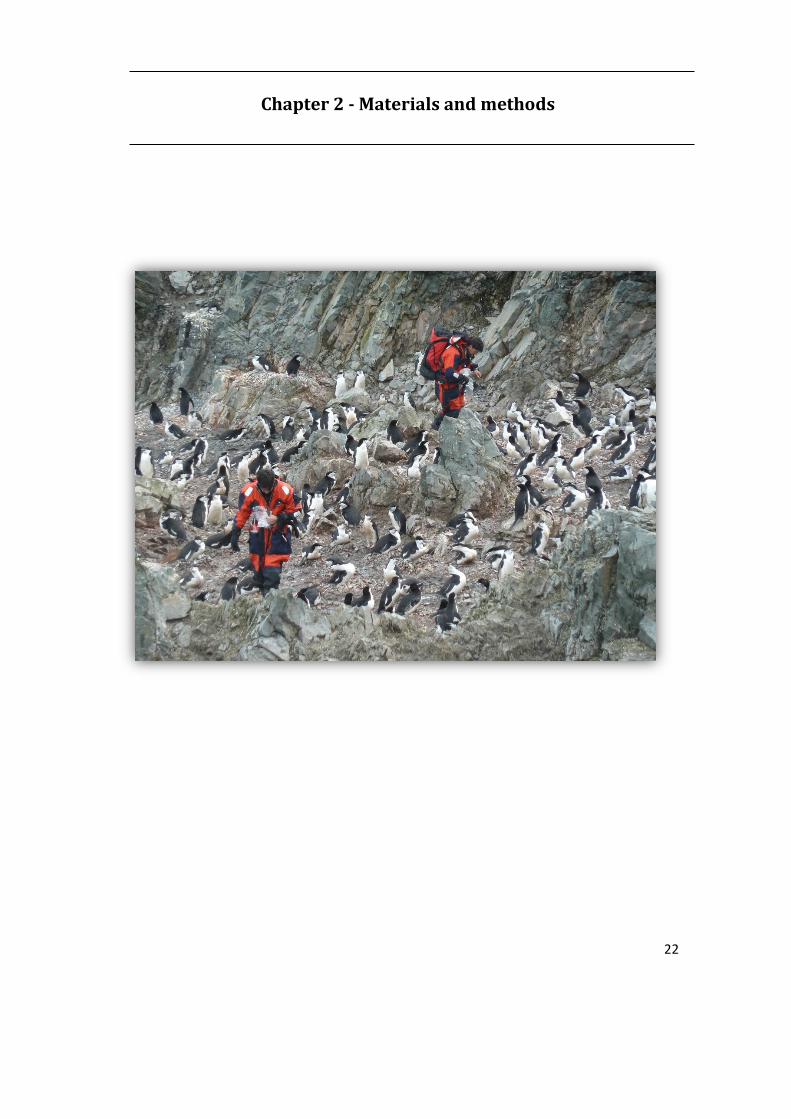
2.1 Study area and sample collection
The fieldwork was conducted at the colony of chinstrap penguins (Pygoscelis
antarctica) in December 2011 and January 2012 at Livingston Island, South Shetland
Islands (Figure 3). Specifically the sampled colony was placed at Miers Bluff, Hurd
Peninsula (60° 25‘ W, 62° 43‘ S), on the south part of the island. The samples of
penguins‘ tissues (i.e. feathers, nails, flesh and stomach contents) from the dead chicks
(died from natural causes) were collected at the colony site. In total 13 dead-chick
individuals were collected from the colony during the brood guard stage. Feathers were
taken from the chest; nails from the mid finger of the left leg, and flesh from the leg
(data available for 12 individuals). The dead-chicks were in a poor state, thus the
sampling of the stomach content was possible for only three individuals. The samples of
nails, flesh and stomach content were stored frozen, while the feathers were stored dry.
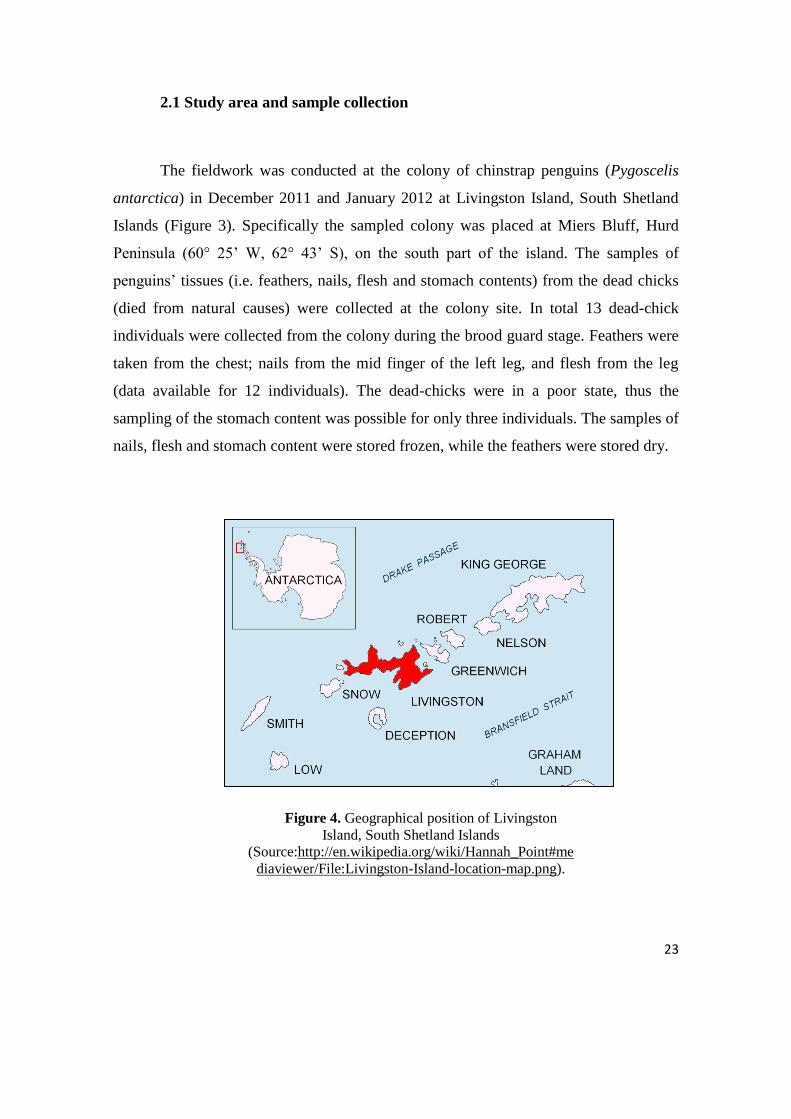
Figure 4. Geographical position of Livingston
Island, South Shetland Islands
(Source:http://en.wikipedia.org/wiki/Hannah_Point#me
diaviewer/File:Livingston-Island-location-map.png).
24
From adults, feathers and blood sampling was performed on 15 randomly
captured adult penguins, while they were traveling between the colony and the sea
(Loureiro et al., 2014). The feathers were collected from the chest, and stored in dry
plastic bags. The blood samples were taken with a 25 ga needle and 1 mL syringe from
the brachial vein on the underside of the flipper and preserved in a -20°C freezer for
further analyses (Loureiro et al., 2014). Furthermore, a total of 59 scats from breeding
adults were collected directly from the rock in the area of the colony, stored frozen and
analyzed within 24h on the laboratory at the Bulgarian base St. Kliment Ohridski.
The sampling was conducted by the same scientist and the sampling methods
used for this research were in accordance with recommendations from the Scientific
Committee for Antarctic Research (SCAR).
For the purposes of building the food web, different organisms were collected in
January 2012 at Livingston Island. The algae (Delesseria antarctica) (n=14) was
collected along the beach in front of the Bulgarian Base St. Kliment Ohridski. Krill was
collected from three different sources – Antarctic krill retrieved from Antarctic fish
(Notothenia coriiceps) (n=14), from marbled rockcod (Notothenia rossii) (n=13) and
from stomach content of chinstrap penguin dead chicks (n=11). The feathers were
collected from adult seabirds: skuas (Catharacta antarctica) (n=5), southern giant
petrels (Macronectes giganteus) (n=15), kelp gulls (Larus dominicanus) (n=13) and
from adults (n=30) and chicks (n=15) of Gentoo penguins. The fur of Elephant seals
(Mirounga leonina) (n=15) was collected at Hannah Point (Livingston Island).
2.2 Diet analysis
Samples of stomachs of dead chicks, and scats from adults were unfrozen and
analyzed at the laboratory at the Bulgarian base St. Kliment Ohridski. The frequency of
occurrence, number and mass were quantified for all of the prey contents. The carapace
lengths of Antarctic krill were measured with the aid of a caliper with a 0.1 mm
25
precision. Allometric equations were used on the values of the measurements of
carapaces of Antarctic krill to estimate their total length (in mm) correspondent to each
individual. Antarctic krill, obtained from the stomach contents were bagged, frozen and
stored for posterior stable isotopic analysis.
2.3 Stable isotope analysis
All the samples (algae, krill, feathers, blood, flesh, nails and fur hair) were
analyzed at Marine and Environmental Sciences Centre (MARE) of the University of
Coimbra.
Prior to stable isotopic analysis samples of:
1. Feathers, algae and fur hair were cleaned of surface lipids and contaminants
using 2:1 chloroform-methanol solution, dried in the oven at 60°C for 24 hours and then
homogenized.
2. Nails and flesh were unfrozen first and then cleaned three times with 2:1
chloroform-methanol solution. Subsequently they were put in the oven for 24 hours.
After drying, the samples were grounded into a fine powder.
3. High lipid concentrations in flesh of krill can lead to depleted δ13
C values,
thus the lipids were removed using successive rinses in a 2:1 chloroform-methanol
solution (Post et al., 2007).
4. The blood samples were separated into plasma and red blood cells (RBC)
using a centrifuge (15 min at 3,000 rpm), stored frozen and later freeze-dried and
homogenized (Ceia et al., 2012). Lipids were removed from plasma using 2:1
chloroform/methanol solution, while the red blood cells do not need lipid extraction
(Cherel et al. 2005).
26
After preparation, all the samples were analyzed in a Continuous Flow Isotope
Ratio Mass Spectrometer Delta V Advantage coupled to an elemental analyzer (Flash
EA1112, Thermo Scientific). Approximately 0.35 mg (range 0.25 to 0.45 mg) of each
sample was combusted in a tin cup for the simultaneous determination of nitrogen and
carbon isotope ratios (Ceia et al., 2012). Results are presented in usual δ notation
relative to Vienna PeeDee Belemnite (V-PDB) and atmospheric N2 (AIR) for δ13
C and
δ15
N, respectively and expressed as ‰. δ13
C or δ15
N = [(Rsample/ Rstandard) − 1] × 1000,
where R = 13
C/12
C or 15
N/14
N, respectively. Replicate measurements of internal
laboratory standards (acetanilide STD: C and N contents of 71.09 and 10.36 %,
respectively) in every batch, indicate measurement errors of < 0.2‰ for both δ13
C and
δ15
N values.
2.4 Food web analysis
For the purpose of food web analysis at the Livingston Island, all collected
organisms were grouped into five trophic categories based on their known diet: primary
producers, herbivores, secondary consumers, predator/scavengers and top predators.
Afterwards mean stable isotope values of δ15
N and δ13
C were calculated for each
organism and formerly for each trophic category. Under the assumption that the isotopic
values of organisms show a general enrichment in the isotopes comparative to their diet,
approximately 2-5‰ for δ15
N (Deniro & Epstein, 1981; Mingawa & Wada, 1984) and
0-1‰ for δ13
C (Deniro & Epstein, 1978; Rounick & Winterbourn, 1986; Peterson &
Fry, 1987) measured values of δ15
N and δ13
C for each organism were used for building
a food web.
To calculate the trophic level (TL) of each species method established by
Cabana and Rasmusen (1996) was used. Trophic levels were calculated as:
TLconsumer=[(δ15
Nconsumer – δ15
Nprimary consumer)/3.4]+2,
27
Where δ15
Nconsumer is the δ15
N for any consumer species, δ15
Nprimary consumer is the
δ15
N reference baseline value at trophic position 2. In this study the average δ15
N value
of Antarctic krill was chosen as the baseline reference level. 3.4 is value of the average
discrimination factor (Minagawa & Wada, 1984) between trophic levels. Maximum
trophic level measured revealed the food chain length. The calculations were done in
accordance with the method proposed by Stowasser et al. (2012).
The discriminant factor for collected tissues of chinstrap chicks and Antarctic
krill retrieved from the stomach content was calculated using following equation:
Δ=δ consumer – δ prey,
Where Δ stands for discriminant factor, δ consumer stands for stable isotopic
signature of consumer, while δ prey stands for stable isotope signature of the food
resource.
2.5 Statistical analysis
Antarctic krill obtained from stomach contents of dead chicks and from scats
were assigned to one of the six classes (20-25 mm, 25-30 mm, 30-35 mm, 35-40 mm,
40-45 mm, and 45-50 mm) according to their total length (mm). In order to establish
which length is occurring more often in the samples, frequency of occurrence was
calculated for each class.
Subsequent statistical analyses were done with the software Statistica 7
(StatSoft, Inc. 2004). At first Pearson correlation analysis were performed to determine
the relation between tissues for δ15
N and δ13
C, respectively. All R-values higher than
0.5 and p-values lower than 0.05 presented significant correlations. Statistical
differences between tissues according to δ15
N and δ13
C were obtained by running one
way ANOVA, where the significance level was set at 95% (p<0.05). Afterwards, post-
hoc Tukey‘s HSD tests were run to determine significant differences between each

28
tissue. To present stable isotope food web data, biplots were used. All results are
reported as mean ± standard deviation (SD) values, unless stated otherwise.
29
Chapter 3 - Results
30
3.1 Diet composition
Adults
A total of 59 scat samples of adult chinstrap penguins were collected at the
colony site. In all samples crustaceans dominated 100% by frequency of occurrence and
by number (n=474 individuals). Specifically the only prey species found was Antarctic
krill. It constituted the diet of all samples 100% by frequency of occurrence and by
number. The total length (mm) of Antarctic krill varied between 22.7 mm and 48.5 mm
(mean length 38.66 ± 2.56 mm; Table A. 1).
Chicks
To assess the diet of chinstrap penguin chicks, 13 individuals were collected
dead (from apparent natural causes) at Miers Bluff on the same day (9th
January) during
brood guarding stage. However, some chicks were in a poor state and found without
stomach, while others were found with empty stomach: only three individuals were used
for the stomach content analysis. To complement these analyses, the diet was also
assessed via stable isotope analyses from tissues of the 13 chicks (see below). The
weight of content varied between 8.5 g and 168 g (98.17 ± 81.58 g). All contents were
composed of crustaceans – 100% frequency of occurrence, by number (n=87) and by
mass. The only prey species found was Antarctic krill. It constituted the stomach
contents 100% by frequency of occurrence, by number and by mass. The length of
Antarctic krill varied between 34.31 mm and 47.21 mm (39.87 ± 2.69 mm; Table A. 1).
Total length (mm) of Antarctic krill was also divided into 6 classes by length
intervals (Table A. 2 for adults‘ scats and Table A. 3 for chicks‘ stomach contents). In
both the highest frequency of length is in the class between 35 and 40 mm – 73.21 % for
scats and 60.92 % for stomachs. Precisely, the most frequent were individuals with 39
31
mm length found in scats and 40 mm found in stomachs. Small krill (<30 mm) formed
0.21% of the adult diet and no such sizes were detected in the stomachs of dead chicks.
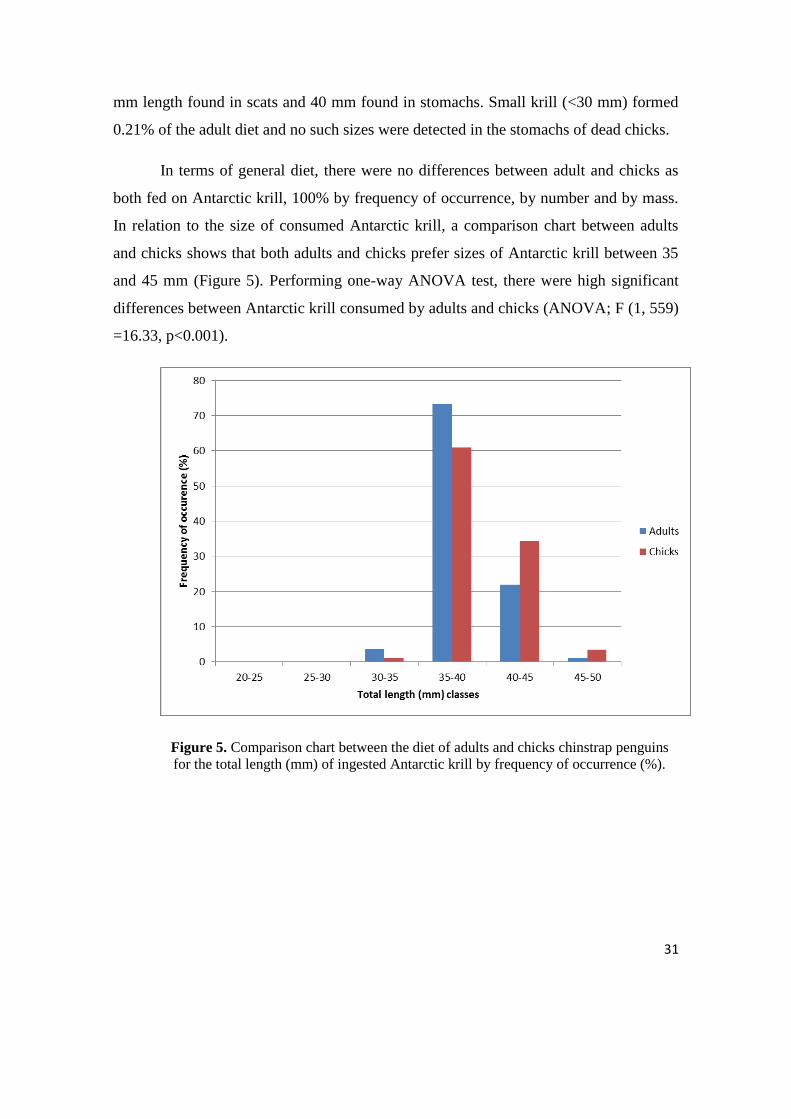
In terms of general diet, there were no differences between adult and chicks as
both fed on Antarctic krill, 100% by frequency of occurrence, by number and by mass.
In relation to the size of consumed Antarctic krill, a comparison chart between adults
and chicks shows that both adults and chicks prefer sizes of Antarctic krill between 35
and 45 mm (Figure 5). Performing one-way ANOVA test, there were high significant
differences between Antarctic krill consumed by adults and chicks (ANOVA; F (1, 559)
=16.33, p<0.001).
Figure 5. Comparison chart between the diet of adults and chicks chinstrap penguins
for the total length (mm) of ingested Antarctic krill by frequency of occurrence (%).
32
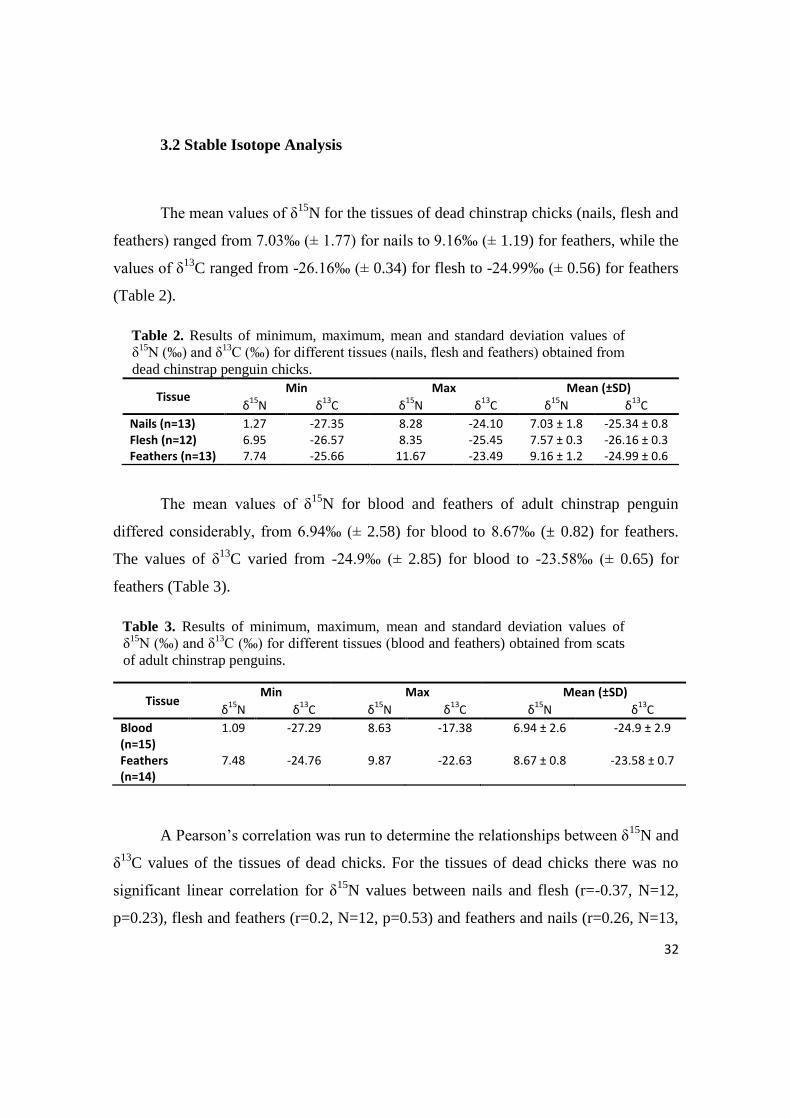
3.2 Stable Isotope Analysis
The mean values of δ15
N for the tissues of dead chinstrap chicks (nails, flesh and
feathers) ranged from 7.03‰ (± 1.77) for nails to 9.16‰ (± 1.19) for feathers, while the
values of δ13
C ranged from -26.16‰ (± 0.34) for flesh to -24.99‰ (± 0.56) for feathers
(Table 2).
Table 2. Results of minimum, maximum, mean and standard deviation values of
δ15
N (‰) and δ13
C (‰) for different tissues (nails, flesh and feathers) obtained from
dead chinstrap penguin chicks.
Tissue Min Max Mean (±SD)
δ15
N δ13
C δ15
N δ13
C δ15
N δ13
C
Nails (n=13) 1.27 -27.35 8.28 -24.10 7.03 ± 1.8 -25.34 ± 0.8 Flesh (n=12) 6.95 -26.57 8.35 -25.45 7.57 ± 0.3 -26.16 ± 0.3 Feathers (n=13) 7.74 -25.66 11.67 -23.49 9.16 ± 1.2 -24.99 ± 0.6
The mean values of δ15
N for blood and feathers of adult chinstrap penguin
differed considerably, from 6.94‰ (± 2.58) for blood to 8.67‰ (± 0.82) for feathers.
The values of δ13
C varied from -24.9‰ (± 2.85) for blood to -23.58‰ (± 0.65) for
feathers (Table 3).
Table 3. Results of minimum, maximum, mean and standard deviation values of
δ15
N (‰) and δ13
C (‰) for different tissues (blood and feathers) obtained from scats
of adult chinstrap penguins.
Tissue Min Max Mean (±SD)
δ15
N δ13
C δ15
N δ13
C δ15
N δ13
C
Blood (n=15)
1.09 -27.29 8.63 -17.38 6.94 ± 2.6 -24.9 ± 2.9
Feathers (n=14)
7.48 -24.76 9.87 -22.63 8.67 ± 0.8 -23.58 ± 0.7
A Pearson‘s correlation was run to determine the relationships between δ15
N and
δ13
C values of the tissues of dead chicks. For the tissues of dead chicks there was no
significant linear correlation for δ15
N values between nails and flesh (r=-0.37, N=12,
p=0.23), flesh and feathers (r=0.2, N=12, p=0.53) and feathers and nails (r=0.26, N=13,
33
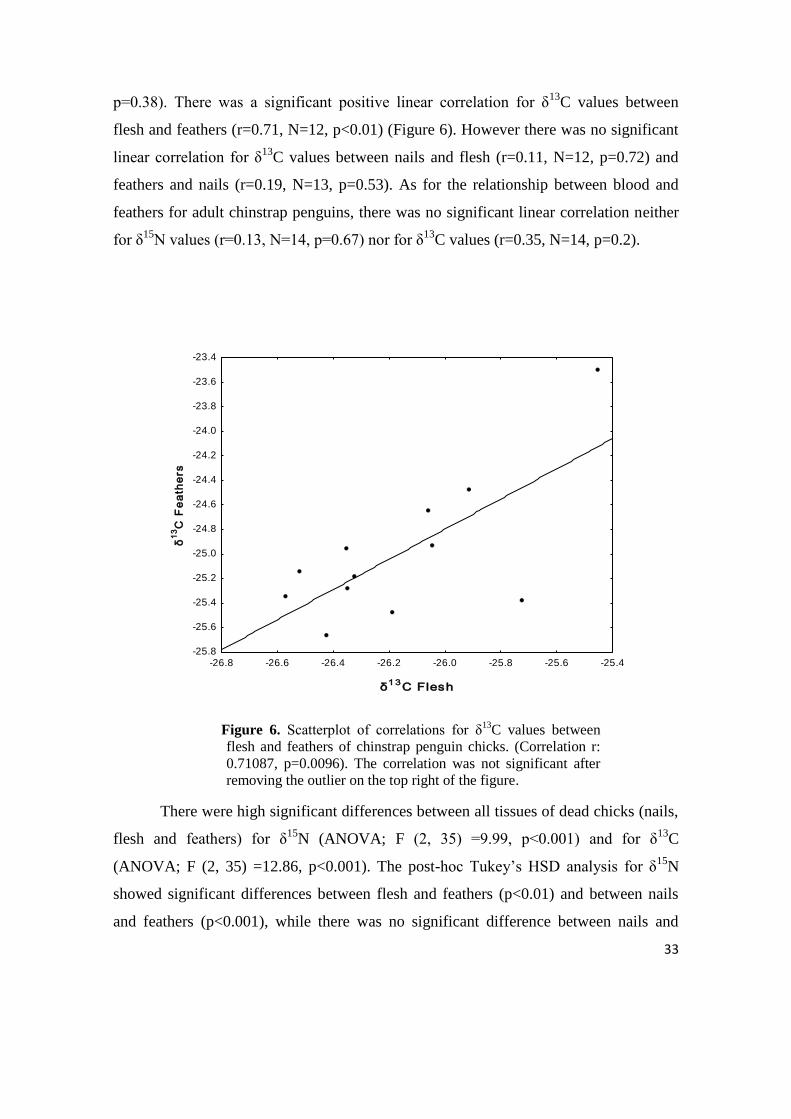
p=0.38). There was a significant positive linear correlation for δ13
C values between
flesh and feathers (r=0.71, N=12, p<0.01) (Figure 6). However there was no significant
linear correlation for δ13
C values between nails and flesh (r=0.11, N=12, p=0.72) and
feathers and nails (r=0.19, N=13, p=0.53). As for the relationship between blood and
feathers for adult chinstrap penguins, there was no significant linear correlation neither
for δ15
N values (r=0.13, N=14, p=0.67) nor for δ13
C values (r=0.35, N=14, p=0.2).
-26.8 -26.6 -26.4 -26.2 -26.0 -25.8 -25.6 -25.4
δ1 3
C Flesh
-25.8
-25.6
-25.4
-25.2
-25.0
-24.8
-24.6
-24.4
-24.2
-24.0
-23.8
-23.6
-23.4
δ1
3C
Fe
ath
ers
Figure 6. Scatterplot of correlations for δ13
C values between
flesh and feathers of chinstrap penguin chicks. (Correlation r:
0.71087, p=0.0096). The correlation was not significant after
removing the outlier on the top right of the figure.
There were high significant differences between all tissues of dead chicks (nails,
flesh and feathers) for δ15
N (ANOVA; F (2, 35) =9.99, p<0.001) and for δ13
C
(ANOVA; F (2, 35) =12.86, p<0.001). The post-hoc Tukey‘s HSD analysis for δ15
N
showed significant differences between flesh and feathers (p<0.01) and between nails
and feathers (p<0.001), while there was no significant difference between nails and
34
flesh (p=0.54). The same analysis for δ13
C showed significant difference between nails
and flesh (p<0.01) and between flesh and feathers (p<0.001), and no significant
difference between nails and feathers (p=0.31). There was also very high significant
difference between collected tissues of adult penguins (blood and feathers) for δ15
N
(ANOVA; F (1, 27) =21.56, p<0.02) and no significant difference for δ13
C (ANOVA; F
(1, 27) =2.85, p=0.1).
A Pearson‘s correlation was run to determine the relationship between adult and
chick values of δ15
N and δ13
C obtained from the feathers. There was no significant
correlation for δ15
N (r=0.73, N=13, p=0.81), nor for δ13
C (r=0.68, N=13, p=0.83). There
were no significant differences for δ15
N values between adults and chicks (ANOVA; F
(1, 26) =1.14, p=0.3), but there were highly significant differences for δ13
C values
between adults and chicks (ANOVA; F (1, 25) =36.41, p<0.001).
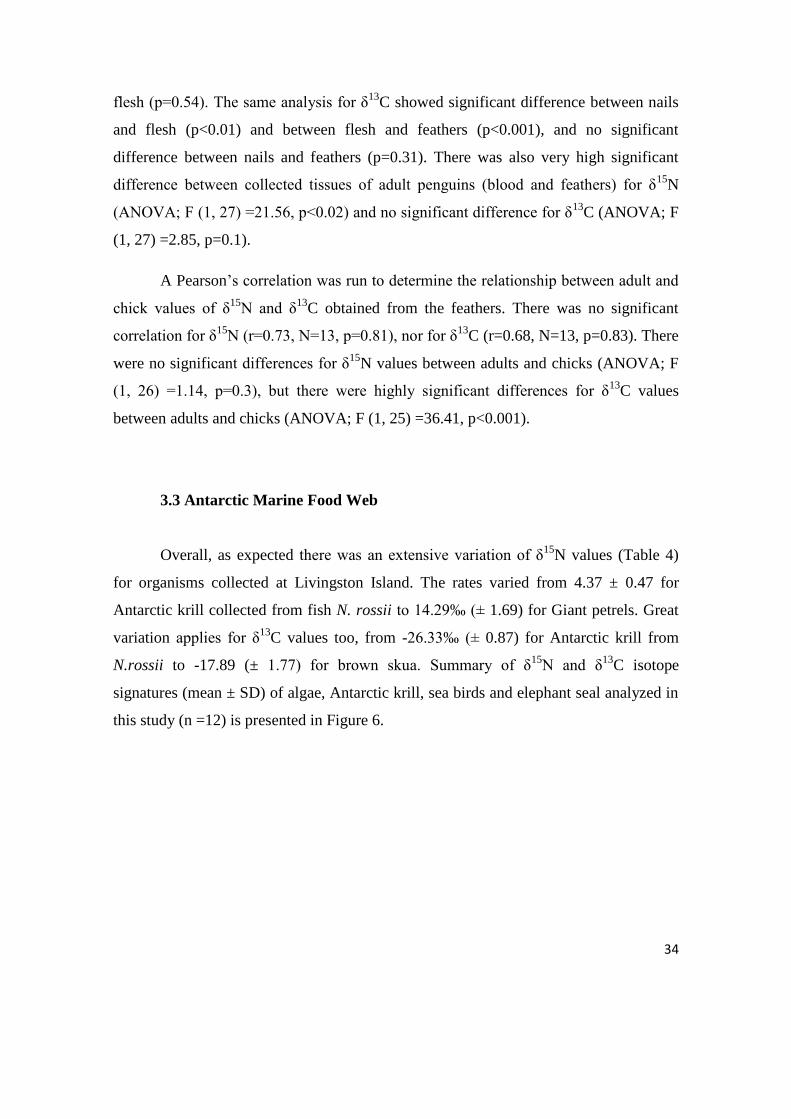
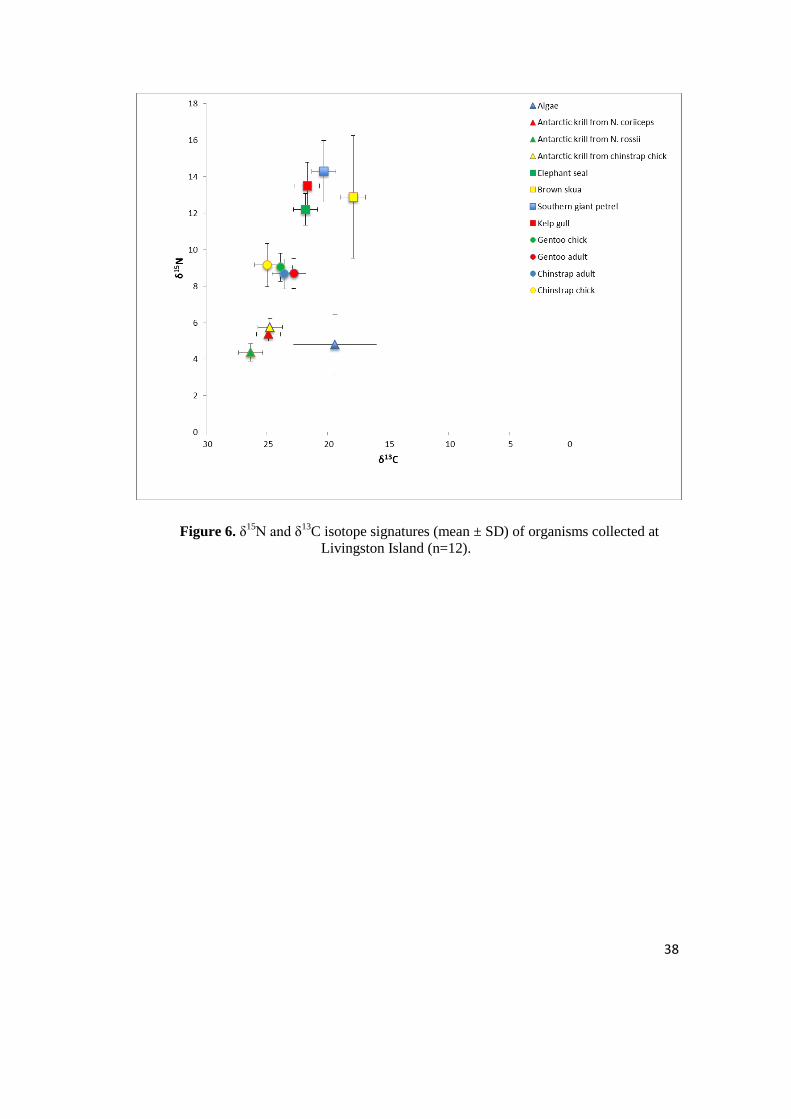
3.3 Antarctic Marine Food Web
Overall, as expected there was an extensive variation of δ15
N values (Table 4)
for organisms collected at Livingston Island. The rates varied from 4.37 ± 0.47 for
Antarctic krill collected from fish N. rossii to 14.29‰ (± 1.69) for Giant petrels. Great
variation applies for δ13
C values too, from -26.33‰ (± 0.87) for Antarctic krill from
N.rossii to -17.89 (± 1.77) for brown skua. Summary of δ15
N and δ13
C isotope
signatures (mean ± SD) of algae, Antarctic krill, sea birds and elephant seal analyzed in
this study (n =12) is presented in Figure 6.
35
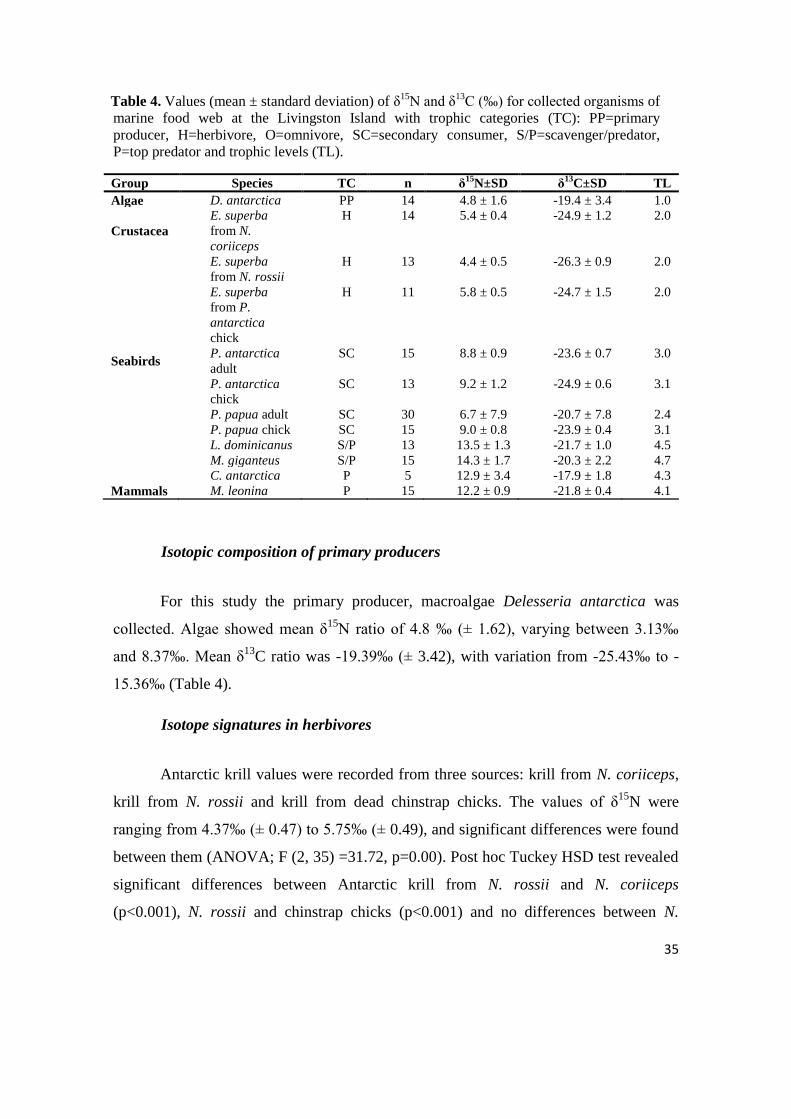
Table 4. Values (mean ± standard deviation) of δ15
N and δ13
C (‰) for collected organisms of
marine food web at the Livingston Island with trophic categories (TC): PP=primary
producer, H=herbivore, O=omnivore, SC=secondary consumer, S/P=scavenger/predator,
P=top predator and trophic levels (TL).
Group Species TC n δ15
N±SD δ13
C±SD TL
Algae D. antarctica PP 14 4.8 ± 1.6 -19.4 ± 3.4 1.0
Crustacea
E. superba
from N.
coriiceps
H 14 5.4 ± 0.4 -24.9 ± 1.2 2.0
E. superba
from N. rossii
H 13 4.4 ± 0.5 -26.3 ± 0.9 2.0
E. superba
from P.
antarctica
chick
H 11 5.8 ± 0.5 -24.7 ± 1.5 2.0
Seabirds P. antarctica
adult
SC 15 8.8 ± 0.9 -23.6 ± 0.7 3.0
P. antarctica
chick
SC 13 9.2 ± 1.2 -24.9 ± 0.6 3.1
P. papua adult SC 30 6.7 ± 7.9 -20.7 ± 7.8 2.4
P. papua chick SC 15 9.0 ± 0.8 -23.9 ± 0.4 3.1
L. dominicanus S/P 13 13.5 ± 1.3 -21.7 ± 1.0 4.5
M. giganteus S/P 15 14.3 ± 1.7 -20.3 ± 2.2 4.7
C. antarctica P 5 12.9 ± 3.4 -17.9 ± 1.8 4.3
Mammals M. leonina P 15 12.2 ± 0.9 -21.8 ± 0.4 4.1
Isotopic composition of primary producers
For this study the primary producer, macroalgae Delesseria antarctica was
collected. Algae showed mean δ15
N ratio of 4.8 ‰ (± 1.62), varying between 3.13‰
and 8.37‰. Mean δ13
C ratio was -19.39‰ (± 3.42), with variation from -25.43‰ to -
15.36‰ (Table 4).
Isotope signatures in herbivores
Antarctic krill values were recorded from three sources: krill from N. coriiceps,
krill from N. rossii and krill from dead chinstrap chicks. The values of δ15
N were
ranging from 4.37‰ (± 0.47) to 5.75‰ (± 0.49), and significant differences were found
between them (ANOVA; F (2, 35) =31.72, p=0.00). Post hoc Tuckey HSD test revealed
significant differences between Antarctic krill from N. rossii and N. coriiceps
(p<0.001), N. rossii and chinstrap chicks (p<0.001) and no differences between N.
36
coriiceps and chinstrap chicks (p=0.09). δ13
C values ranged from -26.33 (± 0.87) to
-24.74 (± 1.54) and were significantly different (ANOVA; F (2, 35) =6.67, p<0.01).
Post hoc analyses showed significant differences between Antarctic krill from N. rossii
and N. coriiceps (p<0.01), Antarctic krill from N. coriiceps and chinstrap chick (p<0.01)
and no significant differences between Antarctic krill from N. coriiceps and chinstrap
chick (p=0.97) (Table 4).
Isotope signatures in secondary consumers
Two secondary consumer species Pygoscelis antarctica and Pygoscelis papua
were used for stable isotope analysis of adults and chicks. The values of δ15
N ranged
from 6.66‰ (± 7.96) (P. papua adult) to 9.16‰ (± 1.19) (P. antarctica chick) and there
were no significant differences between the two species (ANOVA; F (1, 70) =0.23,
p=0.63). Values of δ13
C ranged from -24.99‰ (± 0.56) (P. antarctica chick) to
-20.74‰ (± 7.84) (P. papua adult) and were significantly different between P. papua
and P. antarctica (ANOVA; F (1, 70) =20.97, p <0.01) (Table 4).
Isotope signatures in scavengers
Two scavenger species (Larus dominicanus and Macronectes giganteus) had
mean values of δ15
N 13.49‰ (± 1.28) and 14.29‰ (± 1.69). The values were not
significantly different (ANOVA; F (1, 26) =1.92, p =0.18). Mean δ13
C values were
-21.68‰ (± 1.09) and -20.3‰ (± 2.22) and not significantly different (ANOVA; F (1,
26) =4.09, p =0.05) (Table 4).
Isotope signatures in apex predators
Stable isotope signatures of δ15
N were not significantly different (ANOVA; F (1,
18)=0.56, p=0.46) between two top predator species – Catharacta antarctica and
Mirounga leonina with values of 12.88‰ (± 3.36) and 12.2‰ (± 0.86). Stable isotopic
signatures of carbon were significantly different (ANOVA; F (1, 18) =72.71, p <0.01)
with values -17.89‰ (± 1.77) for Catharacta antarctica and -21.81‰ (± 0.35) for
Mirounga leonina (Table 4).
37
Overall, the marine food web of Livingston Island spanned 4 trophic levels
(Table 4). Under the assumption that the Antarctic krill as a primary consumer belongs
to TL 2, the calculation of TL, based on δ15
N values, for other species showed clear
segregation between penguins and other organisms (i.e. flying seabirds and elephant
seal). Overlap in TL existed between two penguin species (P. antarctica and P. papua),
except for adults of P. papua that had TL 2.4. Other flying seabird species (L.
dominicanus, M. giganteus, C. antarctica) and elephant seal were one trophic level
above penguins.
Discriminant factor
Determining discriminant factor for δ15
N values, between Antarctic krill
obtained from the stomach of dead chinstrap penguin chicks and tissues collected from
dead chicks, resulted in an increase of 1.28‰ for nails, 1.82‰ for flesh and 3.41‰ for
feathers. Discriminant factor for δ13
C values increases by 0.6‰ for nails, 1.42‰ for
flesh and 0.25‰ for feathers.
38
Figure 6. δ15
N and δ13
C isotope signatures (mean ± SD) of organisms collected at
Livingston Island (n=12).
39
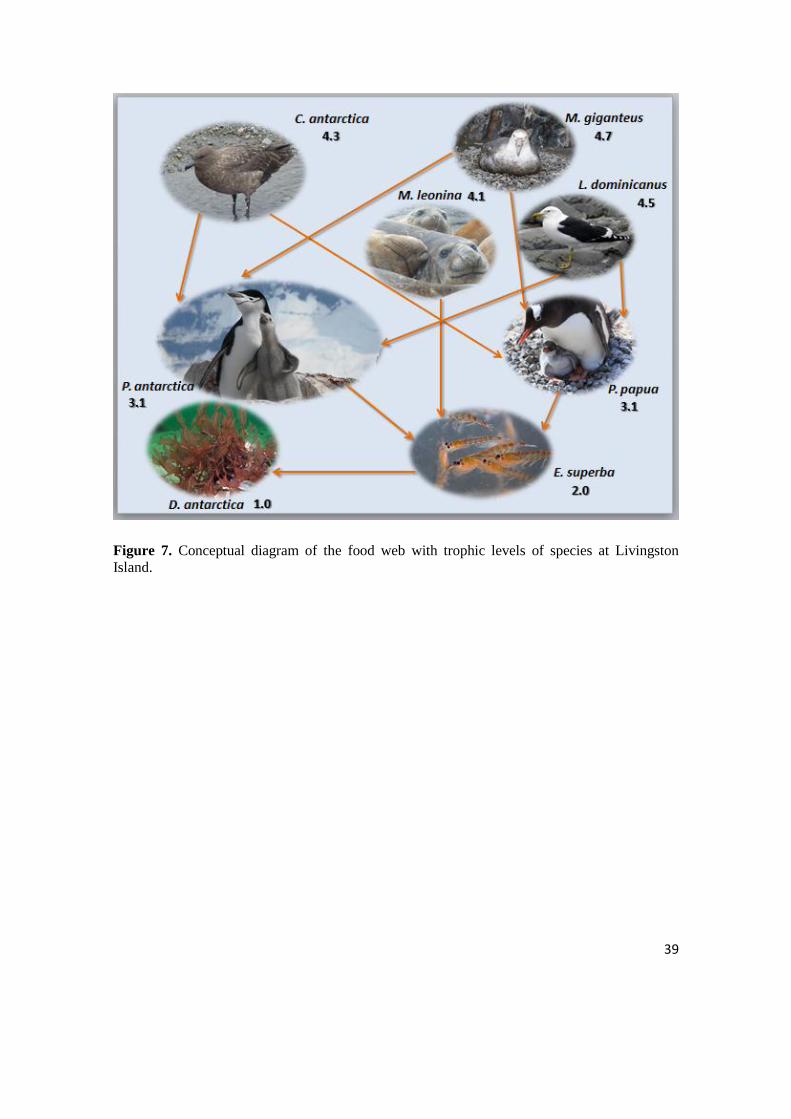
Figure 7. Conceptual diagram of the food web with trophic levels of species at Livingston
Island.
40
Chapter 4 – Discussion

41
4.1 Diet composition of chinstrap penguins
Overall diet of chinstrap penguins in Livingston Island and differences
between diets of chicks and adults
The diet of chinstrap penguins is generally composed of small fish and
crustaceans (Volkman et al., 1980; Croxal & Furse, 1980; Polito et al., 2011). However,
the main source of their food is Antarctic krill, especially during the chick-rearing
period (Miller & Trivelpiece, 2008).
In diet studies of chinstrap penguins carried out in Livingston Island, all, but my
study, were carried on the north part of Livingston Island at Cape Shirreff (Table 5).
Furthermore, all previous studies used stomach-flushing technique of adult breeding
penguins on their return from foraging trips, while I tried to reconstruct the diet
composition using adult feces (i.e. commonly known as scats) and direct observation of
stomach contents of dead chicks (from apparent natural causes). Moreover, to my
knowledge there are no other studies comparing the diet between adults and chicks of
chinstrap penguins. Hence, my study is the first of this kind by the location and
sampling method for this species of penguins.
In all studies from Livingston Island, Antarctic krill compromised 100% of all
chinstrap penguin samples by frequency of occurrence. The second most frequent prey
is fish, followed by other minor prey items such as cephalopods, amphipods and by
other small euphausiids (Table 5). However, our present study did not have any
occurrence of fish or other types of prey (see results).
Antarctic krill was the largest part of stomach contents with more than 99% of
wet mass for all diet studies (Table 5) except for the study of Mudge et al. (2014) when
it compromised 93% of wet mass. Consequently, it registered the highest percentage by
mass of fish (6%), while all other studies registered fish content below 0.6% (Table 5).
In my study, Antarctic krill exclusively dominated the diet of chicks and adults of
chinstrap penguins from Livingston Island. However, it is possible that in some years,
42
in Mudge et al. (2014), adult chinstrap penguins specialize on Antarctic krill for their
chicks, while adult penguins use more profitable resources (i.e. myctophids) for
themselves (Jansen et al. 1998), because they need more energy to transport prey for
their offspring. Also, it could be possible that during their feeding trips, far away from
the colony, chinstrap penguins may consume fish while the Antarctic krill is consumed
closer to colony. In addition to this view, the study of Jansen et al. (1998) detected that
the least energy rich myctophid consumed in their study, could have up to 50% more
energy per unit wet weight than adult Antarctic krill.
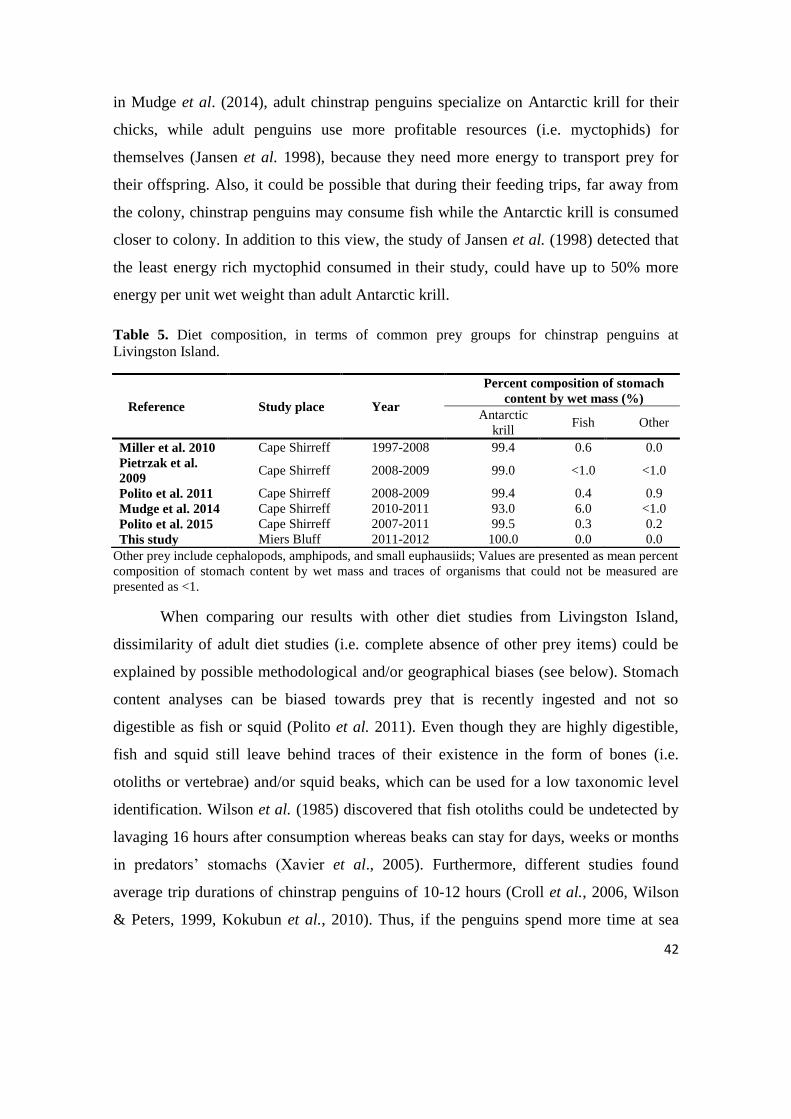
Table 5. Diet composition, in terms of common prey groups for chinstrap penguins at
Livingston Island.
Reference Study place Year
Percent composition of stomach
content by wet mass (%)
Antarctic
krill Fish Other
Miller et al. 2010 Cape Shirreff 1997-2008 99.4 0.6 0.0
Pietrzak et al.
2009 Cape Shirreff 2008-2009 99.0 <1.0 <1.0
Polito et al. 2011 Cape Shirreff 2008-2009 99.4 0.4 0.9
Mudge et al. 2014 Cape Shirreff 2010-2011 93.0 6.0 <1.0
Polito et al. 2015 Cape Shirreff 2007-2011 99.5 0.3 0.2
This study Miers Bluff 2011-2012 100.0 0.0 0.0
Other prey include cephalopods, amphipods, and small euphausiids; Values are presented as mean percent
composition of stomach content by wet mass and traces of organisms that could not be measured are
presented as <1.
When comparing our results with other diet studies from Livingston Island,
dissimilarity of adult diet studies (i.e. complete absence of other prey items) could be
explained by possible methodological and/or geographical biases (see below). Stomach
content analyses can be biased towards prey that is recently ingested and not so
digestible as fish or squid (Polito et al. 2011). Even though they are highly digestible,
fish and squid still leave behind traces of their existence in the form of bones (i.e.
otoliths or vertebrae) and/or squid beaks, which can be used for a low taxonomic level
identification. Wilson et al. (1985) discovered that fish otoliths could be undetected by
lavaging 16 hours after consumption whereas beaks can stay for days, weeks or months
in predators‘ stomachs (Xavier et al., 2005). Furthermore, different studies found
average trip durations of chinstrap penguins of 10-12 hours (Croll et al., 2006, Wilson
& Peters, 1999, Kokubun et al., 2010). Thus, if the penguins spend more time at sea
43
than the time needed to digest fish, there is a high probability that the remains of soft
bodied prey and even their hard parts will not be detected in scats since they pass
through the whole digestion process.
Another cause for dietary differences between this and other studies from
Livingston Island could be geographical differences between north and south part of the
island. Ocean topography can determine the availability and abundance of the prey. In
fact, Cape Shirreff faces north into the Drake Passage, while Miers Bluff, located on the
Hurd Peninsula at the south side of the Livingston Island, is exposed to the much deeper
waters of Bransfield Strait. At Cape Shirreff the benthos, such as fish and squids is in
shallow waters and it is within range for chinstraps, while at the south part it is not,
because the shelf break is closer to the shore (Miller et al., 2010).
In general, low presence or complete absence of fish could be ascribed to several
reasons: the Antarctic krill is easier to catch, since fish are likely to be faster swimmers
(Miller & Trivelpiece, 2007), low availability of fish, its high digestibility, or
intentional consuming of Antarctic krill rather than fish (Rombola et al., 2006). The
most probable reason for exclusive consumption of Antarctic krill in Livingston Island
is its abundance. Antarctic krill is the most abundant species in the Southern Ocean, and
as such is the most available prey to chinstrap penguins. Antarctic Peninsula is one of
the highest Antarctic krill density regions (Atkinson et al., 2008). Furthermore,
Antarctic krill could be the easiest prey to catch between January and March. First of
all, Antarctic krill density is highest in January (Atkinson et al., 2008). Secondly, it is
their spawning season and females are particularly large because of their swollen body
due to the enlarged ovary. Thus, they are easy to spot and capture (Ichii et al., 1996).
However, even though the results show no variability in diet, the size
composition of consumed Antarctic krill can provide information on Antarctic krill
abundance (Lynnes et al. 2004) since changes in Antarctic krill population size structure
have been linked to periods of low Antarctic krill abundance (Reid et al. 1999; Murphy
& Reid 2001; Fraser & Hofmann 2003). The mean size of collected Antarctic krill was
38.66 ± 2.56 mm for adults and 39.87 ± 2.69 mm for chicks. Similar sizes between adult

44
and chicks are expected in this period, since the chicks are entirely dependent on parents
for their provisioning. However, statistics test showed that they were significantly
different, potentially meaning some biases on the effort between the male and female
adults provisioning their chicks. In study by Miller et al. (2010) chinstrap penguin
males carried significantly heavier meals than did females. However, as Volkman
(1980) suggested, the heterogeneity of the diets could be caused by short-term
differences in food availability.
According to Lishman (1985), Antarctic krill greater than 33.4 mm in length are
considered as adults. The energy content of krill increases during summer and adults
weight almost twice as juveniles (Clarke, 1980). Thus, feeding on larger krill is twice as
efficient in filling their stomachs (Ichii et al., 1996). In the area of South Shetland
Islands adult Antarctic krill are present between January and March (Lishamn, 1985).
This is in accordance with energetic demands of chinstrap penguins since they need
high-energy sources during this period. In general, chinstrap penguins do not consume
Antarctic krill below a threshold size of 30 mm (Miller & Trivelipece, 2007). Although
chinstrap penguins on Livingston Island consumed a wide range of size classes (20-50
mm), the largest proportion of Antarctic krill belonged to the group 35-40 mm length
(Figure 5). However, the study by Takahashi et al. (2003) analyzed the diet of chinstrap
penguins from South Orkney Islands, and the mean total length of Antarctic krill varied
from 44.1 to 50.0 mm. This is not surprising, since the data from fisheries shows that
the Antarctic krill captured at South Shetland Islands is among the smallest in the region
(Rombola et al., 2010). This might explain complete absence of large Antarctic krill that
exceed 60 mm in length in this study. Nevertheless, comparison with other studies from
the north part of Livingston Island (Table 6) shows that the mean size of digested
Antarctic krill was never below 43 mm. Furthermore, Reiss et al. (2008) estimated that
Antarctic krill collected in the south part of Livingston Island has lower mean length in
comparison with the area where Cape Shirreff is located. Moreover, in the whole region
of South Shetland Islands there is only one study by Croxal & Furse (1980), where the
length of Antarctic krill was below 40 mm. The minimum length of Antarctic krill
measured at South Orkney Islands was 31.6 ± 3.5 mm (White & Conroy, 1975). The
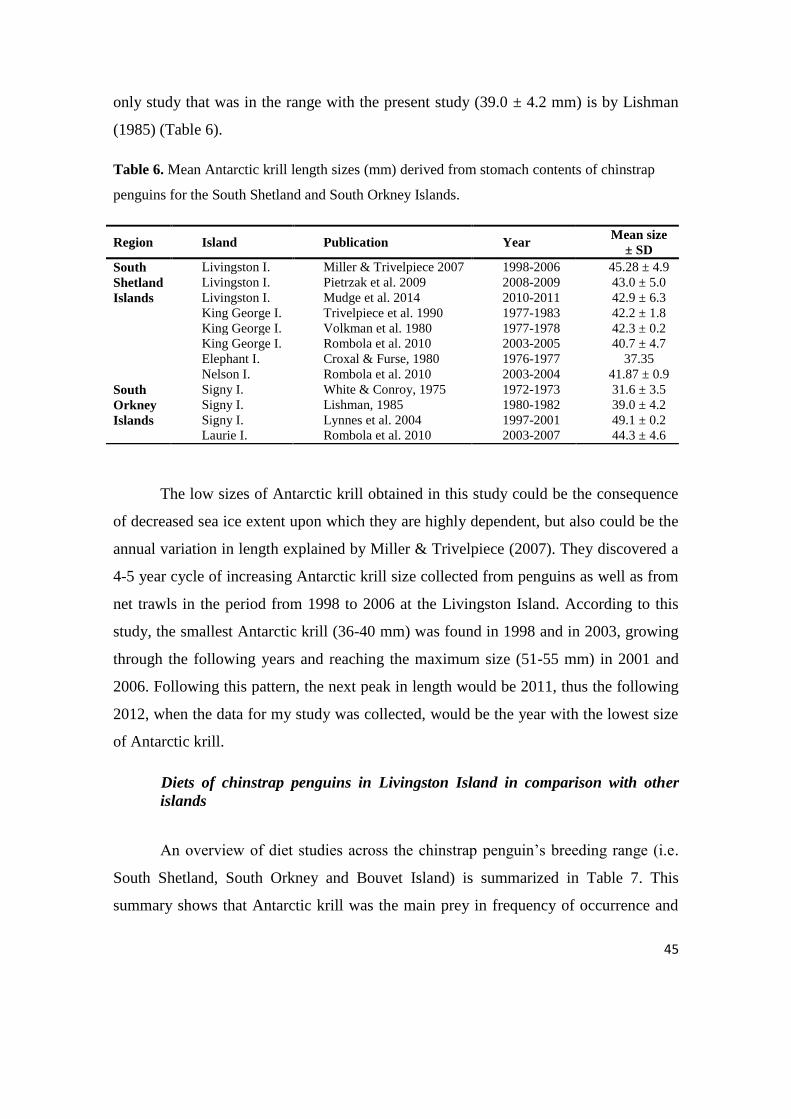
45
only study that was in the range with the present study (39.0 ± 4.2 mm) is by Lishman
(1985) (Table 6).
Table 6. Mean Antarctic krill length sizes (mm) derived from stomach contents of chinstrap
penguins for the South Shetland and South Orkney Islands.
Region Island Publication Year Mean size
± SD
South
Shetland
Islands
Livingston I. Miller & Trivelpiece 2007 1998-2006 45.28 ± 4.9
Livingston I. Pietrzak et al. 2009 2008-2009 43.0 ± 5.0
Livingston I. Mudge et al. 2014 2010-2011 42.9 ± 6.3
King George I. Trivelpiece et al. 1990 1977-1983 42.2 ± 1.8
King George I. Volkman et al. 1980 1977-1978 42.3 ± 0.2
King George I. Rombola et al. 2010 2003-2005 40.7 ± 4.7
Elephant I. Croxal & Furse, 1980 1976-1977 37.35
Nelson I. Rombola et al. 2010 2003-2004 41.87 ± 0.9
South
Orkney
Islands
Signy I. White & Conroy, 1975 1972-1973 31.6 ± 3.5
Signy I. Lishman, 1985 1980-1982 39.0 ± 4.2
Signy I. Lynnes et al. 2004 1997-2001 49.1 ± 0.2
Laurie I. Rombola et al. 2010 2003-2007 44.3 ± 4.6
The low sizes of Antarctic krill obtained in this study could be the consequence
of decreased sea ice extent upon which they are highly dependent, but also could be the
annual variation in length explained by Miller & Trivelpiece (2007). They discovered a
4-5 year cycle of increasing Antarctic krill size collected from penguins as well as from
net trawls in the period from 1998 to 2006 at the Livingston Island. According to this
study, the smallest Antarctic krill (36-40 mm) was found in 1998 and in 2003, growing
through the following years and reaching the maximum size (51-55 mm) in 2001 and
2006. Following this pattern, the next peak in length would be 2011, thus the following
2012, when the data for my study was collected, would be the year with the lowest size
of Antarctic krill.
Diets of chinstrap penguins in Livingston Island in comparison with other
islands
An overview of diet studies across the chinstrap penguin‘s breeding range (i.e.
South Shetland, South Orkney and Bouvet Island) is summarized in Table 7. This
summary shows that Antarctic krill was the main prey in frequency of occurrence and

46
mass in every season and site. The other items such as fish, cephalopods, amphipods
and small euphausids were never above 14% (Table 7). Even though Antarctic krill
dominates the diet over fish, there were no other studies in South Shetland Islands when
the percent composition of stomach content was 100%. However, one of the reasons for
100% presence of Antarctic krill could be the sample size. Due to the bad state of found
dead chicks, it was possible to retrieve stomach contents from only three chicks.
Furthermore, samples for this study were collected over a smaller period than the
samples collected by the other studies (i.e. Miller et al., 2010; Polito et al., 2015;
Jablonski, 1985). If the window to collect the samples is very small, it is more likely to
get a small range of prey than in a study with a larger temporal window. In addition to
this, studies by Ichii et al. (2007) for Elephant Island and Jablonski (1985) for King
George Island stand out with atypical increase in percentage of fish by mass in the diet
composition. Correspondingly to these results, it remains unclear if the chinstrap
penguins are feeding opportunistically on the most available prey species, or they are
changing their diet from fish to Antarctic krill by moving closer to shore. On the
contrary, studies from other regions (South Orkney Islands and Bouvet Island) show
none (White & Conroy, 1975; Takahashi et al., 2003) or very low percentage of fish and
other prey items by mass in the diet of chinstrap penguins. Apart from studies listed in
Table 7, earliest reports of feeding habits of chinstrap penguins exist (Volkman et al.,
1980), but the quantitative data from this literature is not available (authors would rather
report diet wet weight or volume as a description). Murphy (1936) reported diet
composition of chinstrap penguins from South Georgia Island as ―krill‖; Sladen (1955)
for Signy Island used the same description, while Bagashawe (1938) reported ―primarily
krill‖ for Graham Land.
It is most probable that at least during breeding season chinstrap penguins are
typical Antarctic krill feeders, because all the studies found that Antarctic krill
dominates the diet of chinstrap penguins during summer. Miller et al. (2010) suggested,
based on their and results of other studies in Scotia Sea region, that the chinstrap
penguins will maintain a relatively uniform diet of Antarctic krill for their chicks, but
will vary their trip lengths and the distance they travel by site and over time. However,
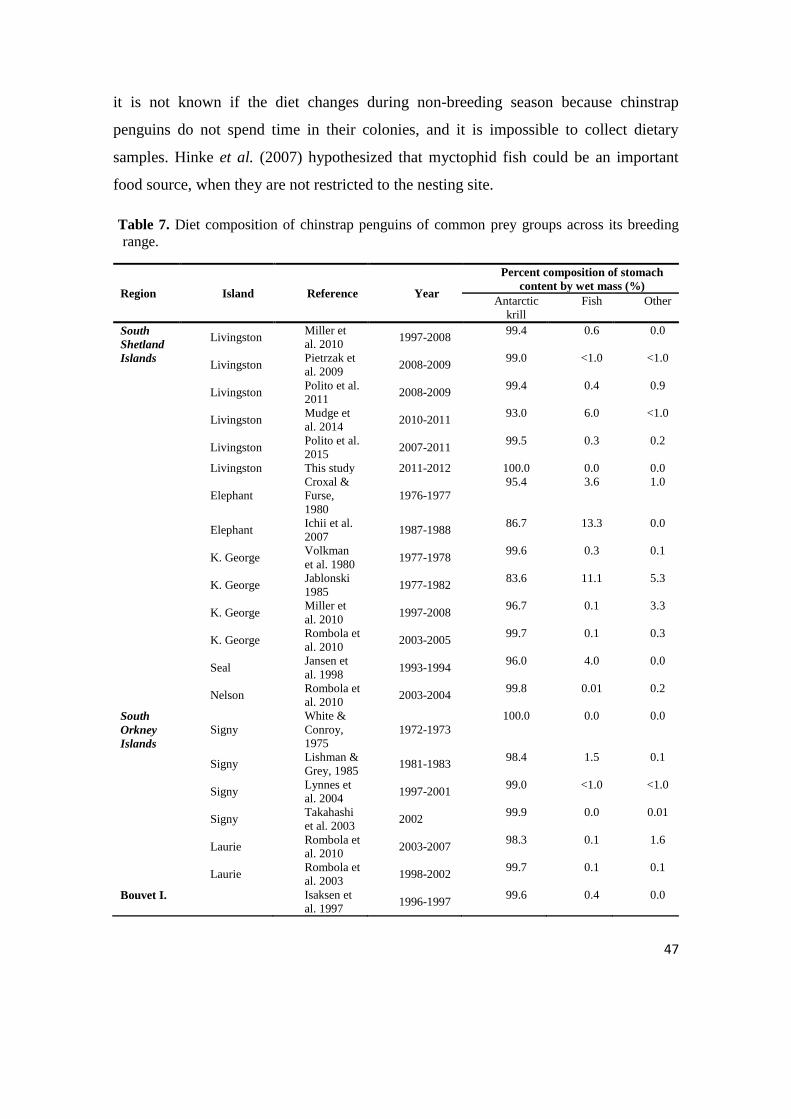
47
it is not known if the diet changes during non-breeding season because chinstrap
penguins do not spend time in their colonies, and it is impossible to collect dietary
samples. Hinke et al. (2007) hypothesized that myctophid fish could be an important
food source, when they are not restricted to the nesting site.
Table 7. Diet composition of chinstrap penguins of common prey groups across its breeding
range.
Region Island Reference Year
Percent composition of stomach
content by wet mass (%)
Antarctic
krill
Fish Other
South
Shetland
Islands
Livingston Miller et
al. 2010 1997-2008
99.4 0.6 0.0
Livingston Pietrzak et
al. 2009 2008-2009
99.0 <1.0 <1.0
Livingston Polito et al.
2011 2008-2009
99.4 0.4 0.9
Livingston Mudge et
al. 2014 2010-2011
93.0 6.0 <1.0
Livingston Polito et al.
2015 2007-2011
99.5 0.3 0.2
Livingston This study 2011-2012 100.0 0.0 0.0
Elephant
Croxal &
Furse,
1980
1976-1977
95.4 3.6 1.0
Elephant Ichii et al.
2007 1987-1988
86.7 13.3 0.0
K. George Volkman
et al. 1980 1977-1978
99.6 0.3 0.1
K. George Jablonski
1985 1977-1982
83.6 11.1 5.3
K. George Miller et
al. 2010 1997-2008
96.7 0.1 3.3
K. George Rombola et
al. 2010 2003-2005
99.7 0.1 0.3
Seal Jansen et
al. 1998 1993-1994
96.0 4.0 0.0
Nelson Rombola et
al. 2010 2003-2004
99.8 0.01 0.2
South
Orkney
Islands
Signy
White &
Conroy,
1975
1972-1973
100.0 0.0 0.0
Signy Lishman &
Grey, 1985 1981-1983
98.4 1.5 0.1
Signy Lynnes et
al. 2004 1997-2001
99.0 <1.0 <1.0
Signy Takahashi
et al. 2003 2002
99.9 0.0 0.01
Laurie Rombola et
al. 2010 2003-2007
98.3 0.1 1.6
Laurie Rombola et
al. 2003 1998-2002
99.7 0.1 0.1
Bouvet I. Isaksen et
al. 1997 1996-1997
99.6 0.4 0.0
48
Other prey include cephalopods, amphipods, and small euphausiids; Values are given as mean percent
composition of stomach content by wet mass and traces of organisms that could not be measured are
presented as <1.
Stable isotopic analyses of different tissues from penguins provide valuable
information about the feeding ecology of chinstrap penguins
Our study showed that for adult chinstrap penguins, both δ15
N and δ13
C were
higher in feathers than in their blood. Therefore, we confirm that, in general, chinstrap
penguins tend to have feathers more enriched in stable isotope ratios of nitrogen and
carbon than blood (Cherel et al. 2013). As a metabolically active tissue blood
continually incorporate isotopic signatures of a prey, and reflect the diet from days to 3-
4 week period (Bearhop et al., 2002; Anderson et al., 2009; Cherel et al., 2013). In
contrast, feathers are metabolically inactive, thus reflect the diet for the time of stable
isotope synthesis during feather growth. Every year, after breeding season chinstrap
penguins undergo molt. As they renew whole plumage, they cannot go to the sea, so
they fast during this period (Riffenburgh, 2007). Thus, the period subsequent to molting
is the period of stable isotope signature incorporation into feathers. In the case of
chinstrap penguins that would be late March of the previous year (Raferty, 2014).
Significant differences in δ15
N values mean that they are not feeding on same prey
during breeding and non-breeding periods. Precisely, higher δ15
N ratios for feathers
mean that they are eating prey of higher trophic level after the breeding season. Higher
trophic level prey could have bigger caloric value, which could prepare them with fat
reserves for winter trips further offshore. The δ13
C ratios between blood and feathers did
not have significant differences, which is not surprising, as stable isotope carbon is not
bio-cumulative element and will not change within different trophic levels. It will give
spatial information that chinstrap penguins stay inside of Antarctic waters, since the
values are within the Antarctic range. However, slightly higher values for feathers
inform us that during winter, chinstrap penguins possibly travel further to the north.
In the case of chicks of chinstrap penguins there were two metabolically inactive
tissues – feathers and nails, and metabolically active flesh. The chicks were 2-3 weeks
old when they died, thus for this short period the sampled tissues should accumulate
isotopes at the same rates. However, no correlation was found between these tissues for

49
δ15
N ratios. The reason for this could be that tissues reflect different time scales of
stable isotope incorporation; Feathers and nails were formed during the incubation
period and they reflect the diet from the moment they were formed (i.e. directly reflect
mother‘s diet), while flesh is constantly accumulating nitrogen and reflects the most
recent diet that can differ from the diet during chick incubation period. Thus it can be
expected not to have any correlation between flesh and feathers or flesh and nails.
However, feathers and nails were neither correlated, which could be connected with a
type of habitat of chinstrap penguins. They live in an ice free, rocky area, so nails can be
grinded by the floor and grow again. In that case they would show ratios that differ from
the feathers. Indeed, statistical analyses showed high significant differences between
feathers and flesh, feathers and nails, and no significant differences between flesh and
nails.
Regarding the δ13
C values, the only correlation found between the tissues was
between flesh and feathers. However, after removing an outlier, the correlation was not
significant any more. This could indicate that the removed point was an odd sample that
does not belong to the real pattern. In view of that, significant differences between
active and inactive tissues (flesh and nails; flesh and feathers) refer to different foraging
habitats during incubation and during chick-growing period. Accordingly, no
differences were found between nails and feathers.
However, having an overall look at nitrogen and carbon stable isotope values for
all tissues, it is not clear why nails show significant differences with flesh for carbon
signatures, when they do not differ in nitrogen signatures. One of the explanations may
be that they do reflect the diet of the growing period, prey from the same trophic level,
but not from the same location. Since they are fed by both parents simultaneously, it
could be that the parents are not using the same feeding habitat (Miller et al., 2010).
This study demonstrated that it is possible to use dead chick tissues to
reconstruct the foraging habits, as each tissue can provide valuable ecological
information, in a different time scale.

50
Finally it was possible to compare stable isotope ratios of feathers between adult
and chicks. As it was previously mentioned chick feathers were formed during
incubation period and they indirectly reflect mother‘s diet, while adult feathers were
formed after the previous breeding season. Expectedly, differences in carbon values
indicate changed feeding habitat in summer and in winter, while nitrogen comparison
shows that they remain foraging at the same trophic level.
To my knowledge, there is only one study by Polito et al. (2015) that uses chicks
of chinstrap penguins for stable isotope analysis. It was possible to compare their results
with my study as they analyzed chick feathers over a five-year period on the north part
of Livingston Island (Cape Shirreff) (Table 8).
Table 8. Stable isotope ratios of δ15
N and δ13
C (mean ± SD; ‰) of chinstrap chick feathers for
Livingston Island.
Reference Site Year n δ15
N δ13
C
Polito et al. 2015 Cape Shirreff 2007 30 8.2 ± 0.3 -23.8 ± 0.3
2008 20 7.8 ± 0.3 -24.7 ± 0.3
2009 20 7.5 ± 0.3 -25.2 ± 0.3
2010 20 7.9 ± 0.2 -24.5 ± 0.5
2011 20 7.6 ± 0.2 -22.0 ± 0.2
This study Miers Bluff 2012 13 9.2 ± 1.2 -25.0 ± 0.6
The values of δ15
N for the north part of Livingston Island are lower than values I
obtained. This infers that chinstrap penguins consume prey from different trophic
position on these two locations. δ13
C values are in accordance with the colony position,
as the higher values for Cape Shirreff colony imply lower latitudes or northern
locations.
To complement the study, it was possible to review and compare the results
obtained here with a similar study by Valente (2014), which analyzes feeding ecology
of sympatric Gentoo penguins at the same site and during the same year, using the same
sampling method of dead chicks. These two species breed concurrently in the Scotia Sea
and Antarctic Peninsula regions (Miller et al., 2010), which means that during the chick
rearing period they have similar nesting habitats and breeding calendars. Moreover,

51
both species feed in open waters, within 5-30 km of the colony, consuming mostly
Antarctic krill (Miller & Trivelpiece, 2007; Miller et al., 2010). Indeed, in both studies
Antarctic krill dominated the diet of these species almost to the exclusion of any other
prey (Table 9), although chinstrap penguin stomach samples had higher percent
contribution of Antarctic krill in their diet than Gentoo penguins. Unlike chinstrap
penguins, in the stomachs of Gentoo penguin minor traces of other prey items were
found, but both species had 100% Antarctic krill by frequency of occurrence. For
Gentoo penguins this is in contrast to previous reports (Polito et al., 2011b; Polito et al.,
2015), when various types of prey such as fish and other high trophic prey items were
recorded in their diet relative to chinstrap penguins. Studies of Gentoo penguins feeding
ecology (Volkman et al., 1980; Miller et al., 2010; Polito et al., 2011b; Polito et al.,
2015) revealed that even if they rely on Antarctic krill in their diet they do not specialize
on Antarctic krill exclusively, but feed on diverse prey items. As major consumers of
Antarctic krill, chinstrap and Gentoo penguins may face potential foraging competition,
especially if the trend of consuming more Antarctic krill by Gentoo penguins continues
in the future.
Size of Antarctic krill taken by Gentoo penguins was larger than Antarctic krill
taken by chinstrap penguins (Table 9). This difference is in agreement with a study by
Miller & Trivelpiece (2007) that have already observed that Gentoo penguins consume
Antarctic krill that is 1-3 mm longer than those eaten by chinstrap penguins. Similarly
as chinstrap penguins they mostly selected Antarctic krill inside 35-40 mm length range,
which only confirms that longer Antarctic krill were absent in the period of sampling
due to the five-year krill cycle as mentioned previously (Miller & Trivelpiece, 2007).
Anyhow, results indicate that both species avoided small Antarctic krill (<30 mm).

52
Table 9. Comparison of diet composition (%) and size of Antarctic krill (mean ±SD) found
in stomachs of dead chicks of Chinstrap penguin (P. Antarctica, this study) and Gentoo
penguin (P. papua, Valente 2014).
Percent composition of stomach content by wet
mass (%) Size of
Antarctic
krill (mm) Antarctic
krill Fish Other
P. antarctica (n=3) 100 0 0 39.9 ± 2.7
P. papua (n=15) 99.67 0 0.33 40.6 ± 3.4
Lower values of δ15
N for chinstrap penguins relative to Gentoo penguins were
recorded for flesh and nails. Chinstrap penguins had higher feather δ15
N values than
Gentoo penguins (Table 10). Higher values of δ15
N for Gentoo penguins refer to their
feeding on higher trophic level prey than Antarctic krill, such as fish.
Gentoo penguins had higher δ13
C values than chinstrap penguins for all tissues
(Table 10). δ13
C values can be used to indicate inshore vs. offshore habitat use because
of differences in fractionation during photosynthesis between benthic macroalgae and
pelagic phytoplankton (France, 1995; Cherel & Hobson, 2007; Polito et al., 2015).
Since the sampling took place at the same site this leads to the conclusion that Gentoo
penguins were feeding more inshore than chinstrap penguins. These results are not
unusual because Gentoo penguins generally dive deeper and forage within a closer
range of the colony than chinstrap penguins (Trivelpiece et al., 1986; Miller et al., 2010;
Kokubun et al., 2010). Furthermore, a study by Miller & Trivelpiece (2008) concluded,
according to the proportion of pelagic fish consumed by chinstrap penguins, that they
forage predominantly offshore, while the higher occurrence of benthic fish in study by
Miller et al. (2009) for Gentoo penguin diets indicated near shore foraging (Polito et al.,
2015).
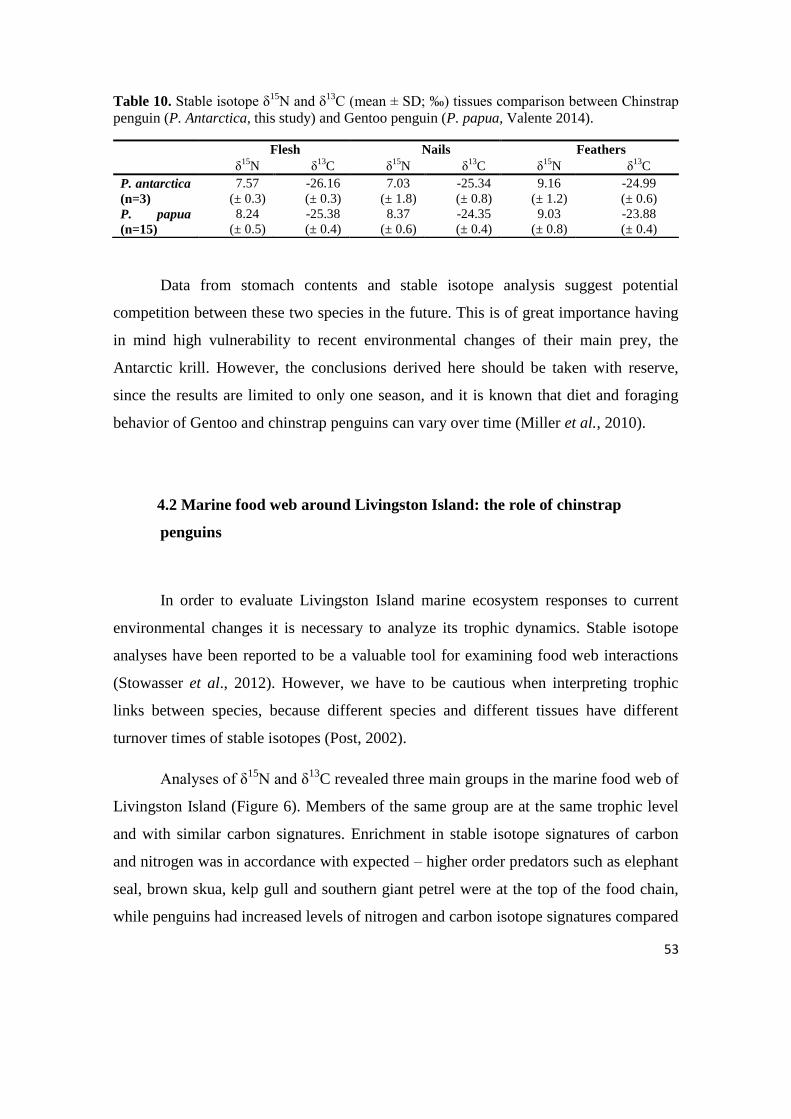
53
Table 10. Stable isotope δ15
N and δ13
C (mean ± SD; ‰) tissues comparison between Chinstrap
penguin (P. Antarctica, this study) and Gentoo penguin (P. papua, Valente 2014).
Flesh Nails Feathers
δ15
N δ13
C δ15
N δ13
C δ15
N δ13
C
P. antarctica
(n=3)
7.57
(± 0.3)
-26.16
(± 0.3)
7.03
(± 1.8)
-25.34
(± 0.8)
9.16
(± 1.2)
-24.99
(± 0.6)
P. papua
(n=15)
8.24
(± 0.5)
-25.38
(± 0.4)
8.37
(± 0.6)
-24.35
(± 0.4)
9.03
(± 0.8)
-23.88
(± 0.4)
Data from stomach contents and stable isotope analysis suggest potential
competition between these two species in the future. This is of great importance having
in mind high vulnerability to recent environmental changes of their main prey, the
Antarctic krill. However, the conclusions derived here should be taken with reserve,
since the results are limited to only one season, and it is known that diet and foraging
behavior of Gentoo and chinstrap penguins can vary over time (Miller et al., 2010).
4.2 Marine food web around Livingston Island: the role of chinstrap
penguins
In order to evaluate Livingston Island marine ecosystem responses to current
environmental changes it is necessary to analyze its trophic dynamics. Stable isotope
analyses have been reported to be a valuable tool for examining food web interactions
(Stowasser et al., 2012). However, we have to be cautious when interpreting trophic
links between species, because different species and different tissues have different
turnover times of stable isotopes (Post, 2002).
Analyses of δ15
N and δ13
C revealed three main groups in the marine food web of
Livingston Island (Figure 6). Members of the same group are at the same trophic level
and with similar carbon signatures. Enrichment in stable isotope signatures of carbon
and nitrogen was in accordance with expected – higher order predators such as elephant
seal, brown skua, kelp gull and southern giant petrel were at the top of the food chain,
while penguins had increased levels of nitrogen and carbon isotope signatures compared

54
to their prey – Antarctic krill. The food chain length for Livingston Island marine food
web calculated is 4.7, and it is inside the range calculated for other marine pelagic
ecosystems across the planet (Table 11). However, with the limited number of species
included in my study, I decided to use Antarctic krill as a baseline reference level.
Antarctic krill is mostly herbivorous (Pinkerton et al., 2013) but it has been recognized
to be carnivorous (Cripps & Atkinson, 2000) or omnivorous (Price et al., 1988), so it is
not a perfect choice as a baseline reference level for determining trophic levels. If more
species had been included in the analysis, it could be more convenient to use salps as
the baseline reference level, following the methods of other studies (Stowasser et al.,
2012; Cherel et al., 2008). The fractionation value of 3.4 ‰ was used for obtaining the
trophic levels. Although fixed trophic enrichment cannot be applied to every predator –
prey relationship (Stowasser et al., 2012), it is the overall average fractionation value
(Minagawa & Wada, 1984) and is applicable for a complex community (Post, 2002).
Table 11. Comparison of a food chain length of marine pelagic ecosystems with this study.
Area Maximum trophic
level measured Reference
Weddell Sea 3.9 Rau et al. (1991, 1992)
Scotia Sea 5.2 Stowasser et al. (2012)
Livingston Island 4.7 This study
Kerguelen 4.6 Cherel et al. (2010)
Bay of Biscay 4.2 Bode et al. (2007)
North Sea 4.4 Das et al. (2003)
Gulf of Alaska 5.1 Hobson et al. (1997)
Barrow Strait/Lancaster Sound 5.4 Hobson & Welch (1992)
New Polynya Greenland 5.1 Hobson et al. (1995)
Analyses of isotopic composition of individual organisms reveal that algae are
placed at the base of the food chain. At the same time, as primary producers, they
represent a reference values for Livingston Island. The δ15
N values are higher in this
study than previously recorded for this species from Anvers Island (Antarctic Peninsula)
(Table 12). Carbon ratios are in accordance with carbon latitudinal enrichment, because

55
Livingston Island is located north from Anvers Island and is expected to have higher
values.
δ15
N values calculated for Antarctic krill were between 4.37‰ and 5.75‰.
These values are higher than the value reported for Anvers Island and north part of
Livingston Island (Cape Shirreff). However they match with the values measured in
Antarctic krill from the Ross Sea (Table 12). For stable carbon isotopic signature,
Antarctic krill showed values of -26.33‰ to -24.84‰, which is in correspondence with
the values within Antarctic range for adults (between -29.3‰ and -25.0‰) (Corbisier et
al., 2004), and larval krill values around -24.5‰ (Corbisier et al., 2004; Frazer, 1996).
However mean carbon values for all three Antarctic krill sources (chinstrap penguin
chick, N. rossii and N. coriiceps) are higher than values found in other studies (Table
12). If considering algae as a reference line for Livingston Island, then the lower carbon
values obtained for Antarctic krill than for algae mean that they are probably drifted to
the north by the current from higher latitudes.
Adults and chicks of chinstrap and Gentoo penguins all stayed within the same
range of nitrogen values, meaning that they forage constantly at the same trophic level.
Interestingly, there is a clear distinction on the graph between adults and chicks. If we
consider that adults reflect the non-breeding season and chicks reflect the breeding
period, it is clear that they forage on similar prey. However, according to carbon values,
Gentoo penguins forage more inshore than chinstrap penguins. More information is
needed on the δ15
N values of other potential prey in the Southern Ocean to better define
isotopic niche of chinstrap penguins.
The apex predators (Elephant seal and seabirds) are expectedly placed at the top
of the food chain. Small variances of the δ15
N and δ13
C values for Elephant seals
obtained in this study indicate that they feed at the same trophic level and on the same
prey in the same area. However, the values differ from the values obtained in a study of
Huckstadt et al. (2011) for Livingston Island and from Cherel et al. (2008) for
Kerguelen Islands (Table 12). The reason could be different turnover rates of stable
isotopes obtained from different tissues. Huckstadt et al. (2011) used vibrissae; Cherel

56
et al. (2008) used blood, while in this study fur was used for stable isotope analyses. Fur
is grown during the winter fasting period, while blood reflects more recent diet.
Moreover, fur tends to be more enriched in δ15
N compared to blood because of the
preferential excretion of δ14
N from the already δ15
N-enriched consumer‘s body (Cherel
et al., 2005; Hobson et al., 1993; Kelly, 2000). On the other hand, vibrissae is a
metabolically slower and continuously growing tissue, thus provides information on
feeding ecology of an individual from several months to years (Huckstadt et al., 2011).
However, it is noticeable that the δ15
N values of Elephant seal were similar in both
Kerguelen and Livingston Island (Table 12). If we count that enrichment obtained in
this study is the consequence of the turnover rate of the tissue and not a real reflection
of the diet, overall results from all three studies suggest little variation in their diet
across the Southern Ocean. Following the conclusions of Cherel et al. (2008) which
studied trophic position of Elephant seals in Kerguelen Islands, δ15
N values indicate that
elephant seals fed on crustacean eating prey, rather than consuming crustaceans. This is
supported with previous studies of stomach contents and milk lipid analyses (Slip, 1995;
Brown et al., 1999; Bradshaw et al., 2003).
Values for Catharacta antarctica were also in accordance with the values
obtained in a study of Phillips et al. (2007) where mean δ15
N and δ13
C values of this
species from Bird Island were 10.4‰ and -17.8‰, respectively (Table 12).
However, there are some distinctions between the top predator species. Brown
skua as a scavenger has expectedly the highest range of nitrogen values, and its carbon
values, in relation to other top predators, imply that it hunts inshore. Southern giant
petrel has a highest value of nitrogen but it stays within the range of Livingston Island,
while kelp gulls and Elephant seals hunt on the higher latitudes.
It should be taken into consideration that the previous understanding of the
Antarctic marine food web as a simple system should be reviewed as it has to be
considered as complex as the food webs in lower latitude ecosystems (Nyssen et al.,
2002). However, it should be born in mind that this is not an analysis of a complete food
web of Livingston Island, and it is necessary to include larger samples of species in
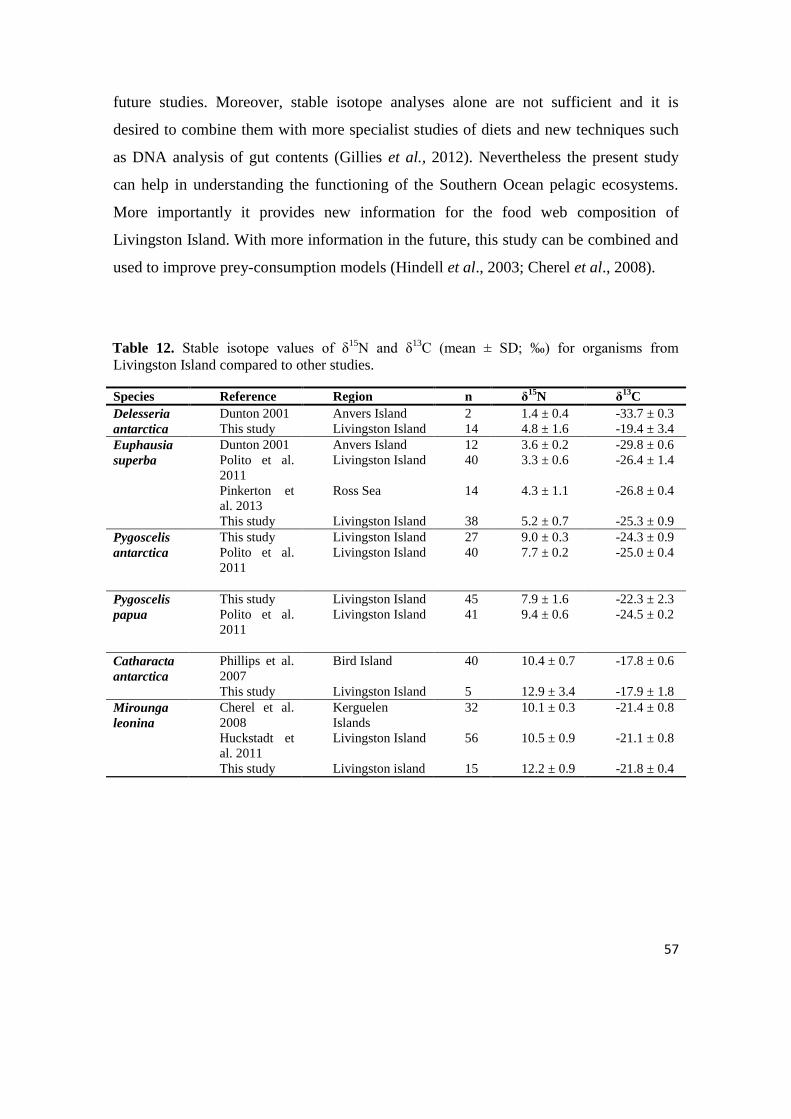
57
future studies. Moreover, stable isotope analyses alone are not sufficient and it is
desired to combine them with more specialist studies of diets and new techniques such
as DNA analysis of gut contents (Gillies et al., 2012). Nevertheless the present study
can help in understanding the functioning of the Southern Ocean pelagic ecosystems.
More importantly it provides new information for the food web composition of
Livingston Island. With more information in the future, this study can be combined and
used to improve prey-consumption models (Hindell et al., 2003; Cherel et al., 2008).
Table 12. Stable isotope values of δ15
N and δ13
C (mean ± SD; ‰) for organisms from
Livingston Island compared to other studies.
Species Reference Region n δ15
N δ13
C
Delesseria
antarctica
Dunton 2001 Anvers Island 2 1.4 ± 0.4 -33.7 ± 0.3
This study Livingston Island 14 4.8 ± 1.6 -19.4 ± 3.4
Euphausia
superba
Dunton 2001 Anvers Island 12 3.6 ± 0.2 -29.8 ± 0.6
Polito et al.
2011
Livingston Island 40 3.3 ± 0.6 -26.4 ± 1.4
Pinkerton et
al. 2013
Ross Sea 14 4.3 ± 1.1 -26.8 ± 0.4
This study Livingston Island 38 5.2 ± 0.7 -25.3 ± 0.9
Pygoscelis
antarctica
This study
Polito et al.
2011
Livingston Island
Livingston Island
27
40
9.0 ± 0.3
7.7 ± 0.2
-24.3 ± 0.9
-25.0 ± 0.4
Pygoscelis
papua
This study
Polito et al.
2011
Livingston Island
Livingston Island
45
41
7.9 ± 1.6
9.4 ± 0.6
-22.3 ± 2.3
-24.5 ± 0.2
Catharacta
antarctica
Phillips et al.
2007
Bird Island 40 10.4 ± 0.7 -17.8 ± 0.6
This study Livingston Island 5 12.9 ± 3.4 -17.9 ± 1.8
Mirounga
leonina
Cherel et al.
2008
Kerguelen
Islands
32 10.1 ± 0.3 -21.4 ± 0.8
Huckstadt et
al. 2011
Livingston Island 56 10.5 ± 0.9 -21.1 ± 0.8
This study Livingston island 15 12.2 ± 0.9 -21.8 ± 0.4

58
4.3 Implications of feeding ecology studies of chinstrap penguins in
conservation
The great advantage of having dead chicks was the possibility of combining
two different dietary methods - stomach content analyses with stable isotope analyses. It
was possible to collect data for different tissues without causing harm to the animals and
to retrieve information from them. Even though in my study the number of sampled
stomachs was from only three individuals, it was still possible to obtain the content,
measure, weight it and compare with adult diets. Moreover, for the chicks that had
preserved stomachs, stable isotope analyses were done for the prey found in them. In
this way, it was possible to get direct, valuable information for discriminant factor
between the predator and prey. Changes in ratios occur through metabolic processes
through which stable isotope ratios of consumers are heavier than that of its prey
(Nyssen et al., 2002). The δ15
N values calculated for nails and flesh were below the
range of 3-5‰, predicted discriminant factor enrichment (DeNiro & Epstein, 1981;
Mingawa & Wada, 1984). On the other hand, feathers perfectly fit in this range with
calculated discriminant factor of 3.41‰. Carbon stable isotope values allow the
determination of the source of organic matter to the food web and have a slight
enrichment rates 0-1‰ per trophic level. Nails (0.6‰) and feathers (0.25 ‰) belong to
this scope, while enrichment of 1.42‰ for flesh is slightly higher than expected from
the literature. According to these results, the best tissue for future analysis is feather, as
it matches with discriminant factor predicted ranges. Moreover, feathers have the
advantage as the tissue that can be used from chicks and from adults in order to compare
them.
Even though it is a risk to plan a data sampling counting on finding dead chicks,
future studies should count on this possibility as an alternative to lavaging technique if
the circumstances for collecting dead chicks are favorable. Sometimes dead chicks can
be found in a bad state, without stomach or with empty stomach, but it is still possible to
collect different tissues for stable isotopic analysis. Presently the most commonly

59
applied technique for estimating the diet is forced regurgitation, and even though it is
not as destructive as sacrificing animals, it is considered invasive (Polito et al., 2011).
Chinstrap penguins are most likely Antarctic krill specialist feeders, and with
such dietary requirements, they are likely to be very sensitive to upcoming changes.
Specialized predators usually change their reproductive success, foraging behavior and
population size as a response to food availability (Lynnes et al., 2004). Every year
chinstrap penguins return to the same breeding site. They stay there for half of the year,
raising their chicks. As the chicks are dependent on their parents for food, adults are
limited to forage close to the colony site. This makes them vulnerable to decreases in
local prey availability (Croll & Treshy, 1998). The distribution of Antarctic krill
depends on several factors and can be affected by their changes. Antarctic krill
reproduction and survival depend on winter sea ice extent (Constable et al., 2014).
Atkinson et al. (2004) showed that Antarctic krill population declined in parallel with
decreases in sea ice. Antarctic krill is sensitive to increasing UV-B rays and ocean
acidification (Constable et al., 2014). Moreover, Antarctic krill fisheries can influence
their populations. Krill fisheries are overlapping with chinstrap penguins foraging areas
in their reproductive period on the north of Livingston Island (Atkinson et al., 2008).
Expansion to the south part of this island and potential competition between chinstrap
penguins and commercial harvesting of Antarctic krill is possible in the future.
Although combined effects of these changes are not yet been investigated, the response
is likely to be negative (Constable et al., 2014).
It is already recorded that the population of chinstrap penguins is declining
across Antarctic Peninsula. Their existence could be threatened in the future by
expanding of sympatrically breeding and dietary competitive Gentoo penguins.
Competition for limited resources is most likely to occur between species with similar
ecological requirements (Ricklefs & Miller, 1999). With population increasing or
remaining stable in comparison with chinstrap penguins, combined with tendency to
more generalist feeding it is more probable that Gentoo penguins have a greater
resilience to recent changes. Thus understanding the foraging ecology of sympatric
penguin species and the degree of their niche or diet overlap, especially during chick
60
rearing period is important, because of the possible reduction of the key prey sources
such as Antarctic krill (Polito et al., 2015).
This study contributes to the conservation of chinstrap penguins (CCAMLR), as
it showed that is possible to use noninvasive methods (scats and stomachs of dead
chicks) to study the diet and foraging ecology of penguins. Monitoring their diet in the
following years will help to determine how it will vary as a response to ecosystem
changes and can help in determining the necessary minimum biomass of food to sustain
healthy populations (Barrett et al., 2007). Particularly important is that the new method
is introduced, as the first one that uses dead chicks (from apparent natural causes) for
studying the diet of chinstrap penguin. Nevertheless, our study shows that dead chicks
can be an option for CCAMLR monitoring programs, to assess Antarctic krill
population dynamics locally.
61
References
62
Agnew, D. J. 1997. Review - The CCAMLR Ecosystem Monitoring Programme.
Antarctic Science 9: 235-242.
Anderson, O. R. J., Phillips, R. A., McDonald, R. A., Shore, R. F., McGill, R. A. R.,
Bearhop, S. 2009. Influence of trophic position and foraging range on mercury
levels within a seabird community. Marine Ecology Progress Series 375: 277–
288.
Atkinson, A., Siegel, V., Pakhomov, E. A., Rothery, P. 2004. Long-term decline in krill
stock and increase in salps within the Southern Ocean. Nature 432: 100-103.
Atkinson, A., Siegel, V., Pakhomov, E. A., Rothery, P., Loeb, V., Ross, R. M., Quetin,
L. B., Schmidt, K., Fretwell, P., Murphy, E. J., Tarling, G. A., Fleming, A. H.
2008. Oceanic circumpolar habitats of Antarctic krill. Marine Ecology Progress
Series 362: 1–23.
Bagshawe, T. W. 1938. Notes on the habits of the Gentoo and Ringed or Antarctic
penguin. Trans. Zool. Soc. Lond. 24(3):185-306.
Barbosa, A., Benzal, J., De Leon, A., Moreno, J. 2012. Population decline of chinstrap
penguins (Pygoscelis antarctica) on Deception Island, South Shetlands,
Antarctica. Polar Biology 35:1453–1457.
Barret, R. T., Camphuysen, C. J., Anker-Nilssen, T., Chardine, J. W., Furness, R. W.,
Garthe, S., Hu¨ppop, O., Leopold, M. F., Montevecchi, W. A., and Veit, R. R.
2007. Diet studies of seabirds: a review and recommendations. – ICES Journal
of Marine Science, 64: 1675–1691.
Bearhop, S., Waldron, S., Votier, S. C., Furness, R. W. 2002. Factors That Influence
Assimilation Rates and Fractionation of Nitrogen and Carbon Stable Isotopes in
Avian Blood and Feathers. Physiological and Biochemical Zoology 75(5):451–
458.
Bearhop, S., Phillips, R. A., McGill, R., Cherel, Y., Dawson, D. D., Croxall, J. P. 2006.
Stable isotopes indicate sex-specific and long-term individual foraging
specialisation in diving seabirds. Marine Ecology Progress Series 311: 157–
164.
Bengtson, J. L., Croll, D. A., Goebel, M. E. 1993. Diving behaviour of chinstrap
penguins at Seal Island. Antarct Science 5: 9–15.
BirdLife International 2012. Pygoscelis antarcticus. The IUCN Red List of Threatened
Species. Version 2014.3. <www.iucnredlist.org>. Downloaded on 08 December
2014.
Bode, A., Alvarez-Ossorio, M.T., Cunha, M.E., Garrido, S., Peleteiro, J.B., Porteiro, C.,
Valdes, L., Varela, M., 2007. Stable nitrogen isotope studies of the pelagic food
web on the Atlantic shelf of the Iberian Peninsula. Progress in Oceanography 74
(2–3), 115–131.
63
Bradshaw, C. J. A., Hindell, M. A., Best, N. J., Phillips, K. L., Wilson, G., Nichols, P.
D. 2003. You are what you eat: describing the foraging ecology of southern
elephant seals (Mirounga leonina) using blubber fatty acids. Proc R Soc Lond B
270:1283–1292.
Brown, D. J., Boyd, I. L., Cripps, G. C., Butler, P. J. 1999. Fatty acid signature analysis
from the milk of Antarctic fur seals and southern elephant seals from South
Georgia: implications for diet determination. Marine Ecology Progressive
Series 187:251–263.
Cabana, G., Rasmussen, J.B., 1996. Comparison of aquatic food chains using nitrogen
isotopes. Proceedings of the National Academy of Sciences of the United States
of America 93 (20), 10844–10847.
CCAMLR, 2008. Impacts of Climate Change on Antarctic Marine Ecosystems: A Call
for Action. CCAMLR Commission, Scientific Committee.
Ceia, F. R., Phillips, R. A., Ramos, J. A., Cherel, Y., Vieira, R. P., Richard, P., Xavier,
J. C. 2012. Short- and long-term consistency in the foraging niche of wandering
albatrosses. Marine Biology 159:1581–1591.
Cherel, Y., Hobson, K. A., Hassani, S. 2005. Isotopic discrimination between food and
blood and feathers of captive penguins: implications for dietary studies in the
wild. Physiological and biochemical zoology 78:106–115.
Cherel, Y., Hobson, K. A. 2007. Geographical variation in carbon stable isotope
signatures of marine predators: a tool to investigate their foraging areas in the
Southern Ocean. Marine Ecology Progress Series 329: 281–287.
Cherel Y. Ducatez, S., Fontaine C., Richard, P., Guinet, C. 2008. Stable isotopes reveal
the trophic position and mesopelagic fish diet of female southern elephant seals
breeding on the Kerguelen Islands. Marine Ecology Progress Series 370: 239–
247.
Cherel, Y., Fontaine, C., Richard, P., Labat, J.P., 2010. Isotopic niches and trophic
levels of myctophid fishes and their predators in the Southern Ocean.
Limnology and Oceanography 55 (1), 324–332.
Cherel, Y., Jaquemet, S., Maglio, A., Jaeger, A. 2013. Differences in δ13C and δ15N
values between feathers and blood of seabird chicks: implications for non‑invasive isotopic investigations. Marine Biology doi 10.1007/s00227-013-2314-
5.
Clarke, A. 1980. The biochemical composition of krill, Euphausia superba Dana, from
South Georgia. Journal of Experimental Marine Biology and Ecology 43 (3):
221–236.
Clarke, A. 1984. Lipid content and composition of Antarctic krill, Euphausia superba
Dana. Journal of Crustacean Biology 4:285–294.
64
Clucas, G. V., Dunn, M. J., Dyke, G., Emslie, S. D., Levy, H., Naveen, R., Polito, M. J.,
Pybus, O. G., Rogers, A. D., Hart, T. 2014. A reversal of fortunes: climate
change ‗winners‘ and ‗losers‘ in Antarctic Peninsula penguins. Scientific
reports 4: 5024.
Constable, A. J., Melbourne-Thomas, J., Corney, S. P., Arrigo, K., Barbraud, C.,
Barnes, D., Bindoff, N., Boyd, P., Brandt, A., Costa, D. P., Davidson, A.,
Ducklow, H., Emmerson, L., Fukuchi, M., Gutt, J., Hindell, M. A., Hofmann, E.
E., Hosie, G., Iida, T., Jacob, S., Johnston, N. M., Kawaguchi, S., Koubbi, P.,
Lea, M-A., Makhado, A., Massom, R., Meiners, K., Meredith, M., Murphy, E.,
Nicol, S., Richerson, K., Riddle, M. J., Rintoul, S. R., Walker Smith Jr. W.,
Southwell, C., Stark, J. S., Sumner, M., Swadling, K., Takahashi, K., Trathan,
P. N., Welsford, D., Weimerskirch, H., Westwood, K., Wienecke, B., Wolf-
Gladrow, D., Wright, S., Xavier, J. C., Ziegler, P. 2014. Change in Southern
Ocean ecosystems I: How changes in physical habitats directly affect marine
biota. Global change biology 20:3004-3025.
Cook, A. J., A. J. Fox, D. G. Vaughan, J. G. Ferrigno. 2005. Retreating glacier fronts on
the Antarctic Peninsula over the past half-century, Science, 308, 541– 544.
Corbisier, T. N., Petti, M. A. V., Skowronski, R. S. P., Brito, T. A. S. 2004. Trophic
relationships in the nearshore zone of Martel Inlet (King George Island,
Antarctica): δ13C stable-isotope analysis. Polar Biology 27: 75–82.
Costa, D. P., Huckstdt, L. A., Crocker, D. E., McDonald, B. I., Goebel, M. E., Fedak,
M. A., 2010. Approaches to Studying Climatic Change and its Role on the
Habitat Selection of Antarctic Pinnipeds. Integrative and Comparative Biology,
pp. 1–13.
Cripps, G. C. & Atkinson, A. (2000). Fatty acid composition as an indicator of
carnivory in Antarctic krill, Euphausia superba. Canadian Journal of Fisheries
and Aquatic Sciences 57, 31–37.
Croll, D. A., Tershy, B. R. 1998. Penguins, fur seals, and fishing: prey requirements and
potential competition in the South Shetland Islands, Antarctica. Polar Biology
19: 365-374.
Croll, D. A., Demer, D. A., Hewitt, R. P., Jansen, J. K., Goebel, M. E., Tershy, B. R.
2006. Effects of variability in prey abundance on reproduction and foraging in
chinstrap penguins (Pygoscelis antarctica). Journal of Zoology 269:506–513.
Croxall, J. P., and J. R. Furse. 1980. Food of Chinstrap Penguins Pygoscelis antarctica
and Macaroni Penguins Eudyptes chrysolophus at Elephant Island Group, South
Shetland Islands. Ibis 122(2):237-245.
Croxall, J. P., Trathan, P. N., Murphy, E. J. 2002. Environmental Change and Antarctic
Seabird Populations. Science 297, 1510.
65
Das, K., Lepoint, G., Leroy, Y., Bouquegneau, J.M., 2003. Marine mammals from the
southern North Sea: feeding ecology data from delta C-13 and delta N-15
measurements. Marine Ecology Progress Series 263, 287–298.
DeNiro, M. J., Epstein, S. 1978. Influence of diet on the distribution of carbon isotopes
in animals. Geochimica et Cosmochimica Acta 42: 495-506.
DeNiro, M. J., Epstein, S. 1981. Influence of diet on the distribution of nitrogen
isotopes in animals. Geochimica et Cosmochimica Acta 45: 341–351.
Ducklow, H. W., Baker, K., Martinson, D. G., Quetin, L. B., Ross, R. M., Smith, R. C.,
Stammerjohn, S. E., Vernet, M., Fraser, W. 2007. Marine pelagic ecosystems:
the West Antarctic Peninsula. Phylosophical Transactions of the Royal Society
B 362, 67–94.
Dunton, K. H. 2001. δ15N and δ13C Measurements of Antarctic Peninsula Fauna:
Trophic Relationships and Assimilation of Benthic Seaweeds. American
Zoologist 41:99–112.
Forcada, J., Trathan, P. N., Reid, K., Murphy, E. J., Croxal, J. P. 2006. Contrasting
population changes in sympatric penguin species in association with climate
warming. Global Change Biology 12, 411–423.
Forcada, J. and Trathan, P. N. 2009. Penguin responses to climate change in the
Southern Ocean. Global Change Biology 15, 1618–1630.
Frazer, T. K. 1996. Stable isotope composition (d13C and d15N) of larval krill,
Euphausia superba, and two of its potential food sources in winter. J. Plankton
Res. 18(8):1413–1426.
France, R. L. 1995. Carbon-13 enrichment in benthic compared to planktonic algae:
foodweb implications. Marine Ecology Progress Series 124: 307-312.
Fraser, W. R., Hofmann, E. E. 2003. A predator‘s perspective on causal links between
climate change, physical forcing and ecosystem response. Marine Ecology
Progress Series 265:1–15.
Gillies, C. L., Stark, J. S., Johnstone, G. J., Smith, S. D. A. 2012. Carbon flow and
trophic structure of an Antarctic coastal benthic community as determined by
δ13C and δ15N. Estuarine, Coastal and Shelf Science 97: 44-57.
Gutt, J., Bertler, N., Bracegirdle, T. J., Buschmann, A., Hosie, G., Isla, E., Schloss, I.,
Smith, C. R., Xavier, J. C. 2015. The Southern Ocean ecosystem under multiple
climate change stresses - an integrated circumpolar assessment. Global Change
Biology 21: 1434-1453.
Hindell, M. A., Bradshaw, C. J. A., Sumner, M. D., Michael, K. J., Burton, H. R. 2003.
Dispersal of female southern elephant seals and their prey consumption during
66
the austral summer: relevance to management and oceanographic zones. Journal
of Applied Ecology 40:703–715.
Hinke, J. T., Salwicka, K., Trivelpiece, S. G., Watters, G. M., Trivelpiece, W. Z. 2007.
Divergent responses of Pygoscelis penguins reveal common environmental
driver. Oecologia 153:845–855.
Hobson, K.A., Welch, H.E., 1992. Determination of trophic relationships within a high
Arctic marine food web using Delta-C13 and Delta-N15 analysis. Marine
Ecology Progress Series 84, 9–18.
Hobson, K. A., Clark, R. G. 1993. Turnover of d13C in cellular and plasma reactions of
blood: implications for nondestructive sampling in avian dietary studies. Auk
110:638–641.
Hobson, K.A., Ambrose, W.G., Renaud, P.E., 1995. Sources of primary production,
benthic–pelagic coupling, and trophic relationships within the Northeast Water
Polynya: insights from delta C-13 and delta N-15 analysis. Marine Ecology
Progress Series 128 (1–3), 1–10.
Hobson, K.A., Sease, J.L., Merrick, R.L., Piatt, J.F., 1997. Investigating trophic
relationships of pinnipeds in Alaska and Washington using stable isotope ratios
of nitrogen and carbon. Marine Mammal Science 13 (1), 114–132.
Huckstadt, L. A., Koch, P. L., McDonald, B. I., Goebel M. E., Crocker, D. E., Costa, D.
P. 2011. Stable isotope analyses reveal individual variability in the trophic
ecology of a top marine predator, the southern elephant seal. Oecologia
169:395–406.
Ichii, T., Naganobu, M., Ogishima T. 1996. Competition between the krill fishery and
penguins in the South Shetland Islands. Polar Biology 16: 63-70.
Ichii, T., Bengtson, J. L., Boveng, P. L., Takao, Y., Jansen, J. K., Hiruki-Raring, L. M.,
Cameron, M. F., Okamura, H., Hayashi, T., Naganobu, M. 2007. Provisioning
strategies of Antarctic fur seals and chinstrap penguins produce different
responses to distribution of common prey and habitat. Marine Ecology Progress
Series 344: 277–297.
IPCC, 2014: Climate Change 2014: Synthesis Report. Contribution of Working Groups
I, II and III to the Fifth Assessment Report of the Intergovernmental Panel on
Climate Change [Core Writing Team, R.K. Pachauri and L.A. Meyer (eds.)].
IPCC, Geneva, Switzerland, 151 pp.
Isaksen, K., Hofmeyr, G., Dyer, B. M., Huyser, O. & Næstvold , A. 1997. Studies of
seabirds and seals at Bouvetøya 1996/97. Pp. 21-29 in Winther, J.-G. (ed.):
Report of the Norwegian Antarctic Research Expedition 1996/97. Norsk
Polarinst. Medd. 148.

67
Jansen, J. K., Boveng, P. L., Bengtson, J. L. 1998. Foraging modes of chinstrap
penguins: contrasts between day and night. Marine Ecology Progress Series
165:161–172.
Jenouvrier, S., Holland, M., Stroeve, J., Barbraud, C., Weimerskirch, H., Serreze, M.,
Caswell, H. 2012. Effects of climate change on an emperor penguin population:
analysis of coupled demographic and climate models. Global Change Biology
18:2756-2770.
Kelly JF (2000) Stable isotopes of carbon and nitrogen in the study of avian and
mammalian trophic ecology. Can J Zool 78:1–27.
Kennicutt, M.C., Chown, S.L. 2014. Six priorities for Antarctic science. Nature 512, 23-
25.
Knox, G. A. 2007. The biology of the Southern Ocean. Boca Raton, Fla.: CRC
Press/Taylor & Francis, USA.
Kokubun, N., Takahashi, A., Mori, Y., Watanabe, S., Shin, H-C. 2010. Comparison of
diving behavior and foraging habitat use between chinstrap and gentoo
penguins breeding in the South Shetland Islands, Antarctica. Marine Biology
157 (4): 811-825.
Korczak-Abshire, M., Chwedorzewska, K. J., Wasowicz, P., Bednarek, P. T. 2012.
Genetic structure of declining chinstrap penguin (Pygoscelis antarcticus)
populations from South Shetland Islands (Antarctica). Polar Biology DOI
10.1007/s00300-012-1210-7.
Lishman, G. S. 1985. The food and feeding ecology of AdClie penguins (Pygoscelis
adeliae) and Chinstrap penguins (P. antarctica) at Signy Island, South Orkney
Islands. Journal of Zoology 205,245-263.
Loureiro, J.,Tavares, D., Ferreira, S., Seco, J.,Valente, T., Trathan, P., Barbosa, A.,
Chipev, N., Xavier, J. C. 2014. Sex identification in Gentoo (Pygoscelis papua)
and Chinstrap (Pygoscelis antarctica) penguins: Can flow cytometry be used as
a reliable identification method? Journal of Experimental Marine Biology and
Ecology 461: 364–370.
Lynch, H. J., Naveen, R., Trathan, P. N., Fagan, W. F. 2012 a. Spatially integrated
assessment reveals widespread changes in penguin populations on the Antarctic
Peninsula. Ecology, 93(6) pp. 1367–1377.
Lynch, H. J., Fagan, W. F., Naveen, R., Trivelipece, S. G., Trivelpiece, W. Z., 2012 b.
Differential advancement of breeding phenology in response to climate may
alter staggered breeding among sympatric pygoscelid penguins. Marine
Ecology Progress Series, Vol. 454: 135–145.
68
Lynnes, A. S, Reid, K., Croxall, J. P, Trathan, P. N. 2002. Conflict or co-existence?
Foraging distribution and competition for prey between Adélie and chinstrap
penguins. Marine Biology 141:1165–1174.
Lynnes, A. S., Reid, K., Croxall, J. P. 2004. Diet and reproductive success of Ade´ lie
and chinstrap penguins: linking response of predators to prey population
dynamics. Polar Biology 27: 544–554.
Martínez, I., Christie, D. A., Jutglar, F. & Garcia, E. F. J. 2013. Chinstrap Penguin
(Pygoscelis antarcticus). In: del Hoyo, J., Elliott, A., Sargatal, J., Christie, D.A.
& de Juana, E. (eds.) (2013). Handbook of the Birds of the World Alive. Lynx
Edicions, Barcelona. (Retrieved from http://www.hbw.com/node/52460 on 3
December 2014).
McClintock, J., Ducklow, H., Fraser, W. 2008. Ecological Responses to Climate
Change on the Antarctic Peninsula. American Scientist, Volume 96.
Meredith, M. P, King, J. C. 2005. Rapid climate change in the ocean west of the
Antarctic Peninsula during the second half of the 20th century. Geophysical
Research Letters 32:L19604.
Miller, A. K., Trivelpiece, W. Z. 2007. Cycles of Euphausia superba recruitment evident
in the diet of Pygoscelid penguins and net trawls in the South Shetland Islands,
Antarctica. Polar Biology 30:1615–1623.
Miller, A. K. and Trivelpiece, W. Z. 2008. Chinstrap penguins alter foraging and diving
behavior in response to the size of their principle prey, Antarctic krill. Marine
Biology 154:201–208.
Miller, A. K., Karnovsky, N. J., Trivelpiece, W. Z. 2009. Flexible foraging strategies of
gentoo penguins Pygoscelis papua over 5 years in the South Shetland Islands,
Antarctica. Marine Biology 156: 2527−2537.
Miller, A. K., Kappes, M. A., Trivelpiece, S. G., Trivelpiece, W. Z. 2010. Foraging-
Niche Separation Of Breeding Gentoo And Chinstrap Penguins, South Shetland
Islands, Antarctica. The Condor 112(4):683–695.
Minagawa, M. & Wada, E. 1984. Stepwise enrichment of 15N along food chains:
further evidence and the relation between δ15N and animal age. Geochimica et
Cosmochimica Acta 48: 1135–1140.
Mudge, M. L., Larned, A. L., Hinke, J. T., Trivelpiece W. Z. 2014. Seabird Research at
Cape Shirreff, Livingston Island, Antarctica. 2010/11 Field Season Report U.S.
Antarctic Marine Living Resources Program.
Murphy, R. C. 1936. Oceanic birds of South America, Vol. 1. American Museum of
Natural History, New York.

69
Murphy, E. J., Reid, K. 2001. Biological processes generating fluctuations in large scale
ecosystems: modelling Southern Ocean krill population dynamics. Marine
Ecology Progress Series 217:175–189.
Murphy, E. J., Watkins, J. L., Trathan, P. N., Reid, K., Meredith, M. P., Thorpe, S. E.,
Johnston, N. M., Clarke, A., Tarling, G. A., Collins, M. A., Forcada, J.,
Shreeve, R. S., Atkinson, A., Korb, R., Whitehouse, M.J., Ward, P., Rodhouse,
P. G., Enderlein, P., Hirst, A. G., Martin, A. R., Hill, S. L., Staniland, I. J.,
Pond, D. W., Briggs, D. R., Cunningham, N. J., Fleming, A. H. 2007. Spatial
and temporal operation of the Scotia Sea ecosystem: a review of large-scale
links in a krill centred food web. Philosophical Transactions of the Royal
Society B 362:113-148.
Nyssen, F., Brey, T., Lepoint, G., Bouquegneau, J.-M., De Broyer, C., Dauby, P. 2002.
A stable isotope approach to the eastern Weddell Sea trophic web: focus on
benthic amphipods. Polar Biology 25: 280–287.
Orr, J. C., Fabry, V. J., Aumont, O. 2005. Anthropogenic ocean acidification over the
twenty-first century and its impact on calcifying organisms. Nature 437: 681-
86.
Perissinotto, R., McQuaid, C. D. 1992. Land based predator impact on vertically
migrating zooplankton and micronekton advected to a Southern Ocean
archipelago. Marine Ecology Progressive Series 80:15–27.
Peterson, B. J., Fry, B. 1987. Stable Isotopes in Ecosystem Studies. Annual Review of
Ecology and Systematics 18: 293-320.
Phillips, R. A., Catry, P., Silk, J. R. D., Bearhop, S., McGill, R., Afanasyev, V., Strange,
I. J. 2007. Movements, winter distribution and activity patterns of Falkland and
brown skuas: insights from loggers and isotopes. Marine Ecology Progress
Series 345: 281–291.
Pietrzak, K. W., Breeden, J. H., Miller, A. K., Trivelpiece, W. Z. 2009. Seabird
Research at Cape Shirreff , Livingston Island, Antarctica, 2008-09. 2008-2009
Field Season Report Chapter 6 Antarctic Marine Living Resources Program.
Pinkerton, M. H., Forman, J., Bury, S. J., Brown, J., Horn, P., O‘Driscoll, R. L. 2013.
Diet and trophic niche of Antarctic silverfish Pleuragramma antarcticum in the
Ross Sea, Antarctica. Journal of Fish Biology 82 (1): 141–164
Polito, J. M., Lynch, H. J., Naveen, R., Emslie, S. D. 2011. Stable isotopes reveal
regional heterogeneity in the pre-breeding distribution and diets of
sympatrically breeding Pygoscelis spp. Penguins. Marine Ecology Progress
Series 421: 265–277.
70
Polito, J. M., Abel, S., Tobias, C. R., Emslie, S. D. 2011 b. Dietary isotopic
discrimination in gentoo penguin (Pygoscelis papua) feathers. Polar Biology
34:1057–1063.
Polito, J. M. 2012. Examining niche partitioning and dietary change in Pygoscelis
penguins using stable isotopes. Department of Biology and Marine Biology
University of North Carolina Wilmington.
Polito, M. J., Trivelpiece, W. Z., Patterson, W. P., Karnovsky, N. J., Reiss, C. S., Emslie
S. D. 2015. Contrasting specialist and generalist patterns facilitate foraging
niche partitioning in sympatric populations of Pygoscelis penguins. Marine
Ecology Progress Series 519: 221–237.
Post, D. M. 2002. Using Stable Isotopes To Estimate Trophic Position: Models,
Methods, And Assumptions. Ecology, 83(3): 703-718.
Post, D. M., Layman, C. A., Arrington, D. A., Takimoto, G., Quattrochi, J., Montaña, C.
G., 2007. Getting to the fat of the matter: models, methods and assumptions for
dealing with lipids in stable isotope analyses. Oecologia 152, 179–89.
Price, H. R., Boyd, K. R. & Boyd, C. M. (1988). Omnivorous feeding behaviour of the
Antarctic krill Euphausia superba. Marine Biology 97, 67–77.
Quetin, L. B., Ross, R. M. 2008. Life under Antarctic Pack Ice: A Krill Perspective, in
Smithsonian at the Poles Contributions to International Polar Year Science.
Smithsonian Institution Scholarly Press, pp 285-298.
Raferty, J. P. 2014. "Chinstrap penguin". Encyclopedia Britannica. Encyclopedia
Britannica Online. Encyclopedia Britannica Inc., 2015. Web. 21 Mar. 2015
<http://www.britannica.com/EBchecked/topic/1655480/chinstrap-penguin>
Ratcliffe, N., Trathan, P. N. 2011. A review of the diet and at sea-distribution of
penguins breeding within the CCAMLR convention area. CCAMLR Science
18:75-114.
Rau, G.H., Sullivan, C.W., Gordon, L.I., 1991. Delta C13 and Delta N15 variations in
Weddell Sea particulate organic matter. Marine Chemistry 35 (1–4), 355–369.
Rau, G.H., Ainley, D.G., Bengtson, J.L., Torres, J.J., Hopkins, T.L., 1992. N15/N14 and
C13/C12 in Weddell Sea birds, seals, and fish—implications for diet and
trophic structure. Marine Ecology Progress Series 84, 1–8.
Reid, K., Watkins, J. L., Croxall, J.P., Murphy, E. J. 1999. Krill population dynamics at
South Georgia 1991–1997, based on data from predators and nets. Marine
Ecology Progress Series 177:103–114.
Reiss, C. S., Cossio, A. M., Loeb, V., Demer, D. A., 2008. Variations in the biomass of
Antarctic krill (Euphausia superba) around the South Shetland Islands, 1996–
2006. ICES Journal of Marine Science, 65: 497–508.

71
Ricklefs, R. E., Miller, G. L. 1999. Ecology. W. H. Freeman & Co Ltd.
Riffenburgh, B. 2007. Encyclopedia of the Antarctic. London, Routledge: Taylor and
Francis Group.
Rockstrom, J., Steffen, W., Noone, K., Persson, A., Chapin, F. S., Lambin, E. F.,
Lenton, T. M., Scheffer, M., Folke, C., Schellnhuber, H. J., Nykvist, B., de Wit,
C. A., Hughes, T., van der Leeuw, S., Rodhe, H., Sorlin, S., Snyder, P. K.,
Costanza, R., Svedin, U., Falkenmark, M., Karlberg, L., Corell, R. W., Fabry,
V. J., Hansen, J., Walker, B., Liverman, D., Richardson, K., Crutzen, P., Foley,
J. A. 2009. A safe operating space for humanity. Nature 461:472-475.
Rombolá, E., Marschov, E., Coria, N. 2006. Interannual study of Chinstrap penguin‘s
diet and reproductive success at Laurie Island, South Orkney Islands,
Antarctica. Polar Biology 29:502–509.
Rombola, E. F., Marschoff, E., Coria, N. 2010. Inter-annual variability in Chinstrap
penguin diet at South Shetland and South Orkneys Islands Emilce Florencia.
Polar Biology 33:799–806.
Ropert-Coudert, Y., Hindell, M. A., Phillips, R., Charrassin, J. B., Trudelle, L.,
Raymond, B. 2014. Chapter 8. Biogeographic patterns of birds and mammals.
In: De Broyer C., Koubbi P., Griffiths H.J., Raymond B., Udekem d‘Acoz C.
d‘, et al. (eds.). Biogeographic Atlas of the Southern Ocean. Scientific
Committee on Antarctic Research, Cambridge, pp. 364-387.
Rounick, J. S., Winterbourn, M. J. 1986. Stable Carbon Isotopes and Carbon Flow in
Ecosystems. BioScience 36 (3): 171-177.
Sladen, W. J. L. 1955. Some aspects of the behavior of the Adelie and Chinstrap
penguins. Proc. XI Int. Ornithol. Congr. (1954):241-246.
Slip, D. J. 1995. The diet of southern elephant seals (Mirounga leonina) from Heard
Islands. Canadian Journal of Zoology 73:1519–1528.
StatSoft, Inc. (2004). STATISTICA (data analysis software system), version 7.
www.statsoft.com.
Stowasser, G., Atkinson, A., McGill, R. A. R., Phillips, R. A., Collins, M. A., Pond, D.
W. 2012. Food web dynamics in the Scotia Sea in summer: A stable isotope
study. Deep-Sea Research II 59-60 208–221.
Takahashi, A., dunn, M. J., Trathan, P. N., Sato, K., Naito, Y., Croxall, J. P. 2003.
Foraging strategies of chinstrap penguins at Signy Island, Antarctica:
importance of benthic feeding on Antarctic krill. Marine Ecology Progress
Series 250: 279–289.
72
Trathan, P. N., Forcada, J., Murphy, E. J. 2007. Environmental forcing and Southern
Ocean marine predator populations: effects of climate change and variability.
Philosphical Transactions of the Royal Society B 362, 2351–2365.
Trivelpiece, W. Z., Bengtson, J. L., Trivelpiece, S. G., Volkman, N. J. 1986. Foraging
Behavior Of Gentoo And Chinstrap Penguins As Determined By New
Radiotelemetry Techniques. The Auk 103: 777-781.
Trivelpiece W. Z., Trivelpiece, S. G., Geupel, G. R., Kjelmyr, J., Volkman, N. J. 1990.
Adelie and Chinstrap Penguins: Their Potential as Monitors of the Southern
Ocean Marine Ecosystem. Antarctic Ecosystems, Ecological Change and
Conservation: 191-202. Springer Berlin Heidelberg.
Trivelpiece, W. Z., Hinke, J. T., Miller, A. K., Reiss, C. S., Trivelpiece, S. G., Watters,
G. M. 2011. Variability in krill biomass links harvesting and climate warming
to penguin population changes in Antarctica. Proceedings of the National
Academy of Sciences vol. 108, no 18: 7625–7628.
Turner, J., Bindschadler, R., Convey, P., di Prisco, G., Fahrbach, E., Gutt, J., Hodgson,
D., Mayewski, P., Summerhayes, C. 2009. Antarctic climate change and the
environment. Scientific Committee for Antarctic Research, Cambridge, UK.
Turner J., Barrand, N. E., Bracegirdle, T. J., Convey, P., Hodgson, D. A., Jarvis, M.,
Jenkins, A., Marshall, G., Meredith, M. P., Roscoe, H., and Shanklin, J. 2014.
Antarctic climate change and the environment: an update. Polar Record 50
(254): 237–259.
Valente, T. 2014. Feeding ecology of Gentoo penguins Pygoscelis papua at Livingston
Island (Antarctic). Dissertação de Mestrado em Ecologia, apresentada ao
Departamento de Ciências da Vida da Faculdade de Ciências e Tecnologia da
Universidade de Coimbra, http://hdl.handle.net/10316/26321.
Van de Putte, A., Flores, H., Volckaert, F., van Franeker, J. A. 2006. Energy content of
Antarctic mesopelagic Wshes: implications for the marine food web. Polar
Biology 29:1045–1051.
Volkman, N. J., Presler, P., Trivelpiece, W. Z. (1980). Diets of pygoscelid penguins at
King George Island, Antarctica. Condor 82: 373–378.
Votier, S. C., Bearhop, S., Witt, M. J., Inger, R., Thompson, D., Newton, J. 2010.
Individual responses of seabirds to commercial fisheries revealed using GPS
tracking, stable isotopes and vessel monitoring systems. Journal of Applied
Ecology 47:487–497.
White, M. G., J. W. H. Conroy. 1975. Aspects of competition between pygoscelid
penguins at Signy Island, South Orkney Islands. Ibis 117:371-373.

73
Wienecke, B., Robertson, G., 1997. Foraging space of emperor penguins Aptenodytes
forsteri in Antarctic shelf waters in winter. Marine Ecology-Progress Series,
159, 249–263.
Wilson, R. P., La Cock, G. D., Wilson, M. P., Mollagee, F. 1985 Differential digestion
of flsh and squid by jackass penguins. Ornis Scand 16:7.
Wilson, R. P. 1995. Foraging ecology. In: Williams TD (ed) The penguins. Oxford
University Press, New York, p 81–106.
Wilson R. P., Peters, G. 1999. Foraging behaviour of the chinstrap penguin Pygoscelis
antarctica at Ardley Island, Antarctica. Marine Ornithology 27:85–95.
Xavier, J. C., Croxall, J. P., and Cresswell, K. A. 2005. Boluses: a simple, cost-effective
diet method to assess the cephalopod prey of albatrosses? Auk 122: 1182-1190
Xavier, J. C., Louzao, M., Thorpe, S. E., Ward, P., Hill, C., Roberts, D., Croxall, J. P.,
Phillips, R. A. 2013. Detecting intra-annual variations in the feeding ecology of
a top predator in relation to environmental change: can they adapt successfully?
Marine Biology 160:1597-1606.

74
Appendix

75
Appendix of Tables
Table A. 1 Number, frequency of occurrence (%), minimum, maximum, mean and
standard deviation of total length (mm) for Antarctic krill obtained from two types of
samples – scats of adult Chinstrap penguins and stomach contents of dead Chinstrap
penguin chicks.
Sample Number Frequency
(%)
Min
(mm)
Max
(mm)
Mean(±SD)
Adults 474 100 22.7 48.5 38.66
(±2.56)
Chicks 87 100 34.31 47.21 39.87
(±2.69)
Table A. 2 Frequency of occurrence and number by length intervals (mm) of
Antarctic krill obtained from scats of adult Chinstrap penguins.
Length
intervals (mm)
Number Frequency (%)
20-25 1 0.21
25-30 0 0
30-35 17 3.59
35-40 347 73.21
40-45 104 21.94
45-50 5 1.05
Table A. 3 Frequency of occurrence and number by length intervals (mm) of Antarctic
krill obtained from stomach contents of dead Chinstrap penguin chicks.
Length intervals Number Frequency (%)
20-25 0 0
25-30 0 0
30-35 1 1.15
35-40 53 60.92
40-45 30 34.48
45-50 3 3.45

76