caça e consumo de carne silvestre na amazônia …+… · À toby gardner, jos barlow e joice...
TRANSCRIPT

Patricia Carignano Torres
Caça e consumo de carne silvestre na Amazônia
Oriental: determinantes e efeitos na percepção do
valor da floresta
Bushmeat hunting and consumption in Eastern
Amazonia: drivers and effects on the perception of
forest value
São Paulo
2014

Patricia Carignano Torres
Caça e consumo de carne silvestre na Amazônia
Oriental: determinantes e efeitos na percepção do
valor da floresta
Bushmeat hunting and consumption in Eastern
Amazonia: drivers and effects on the perception of
forest value
Tese apresentada ao Instituto de Biociências da Universidade de São Paulo, para obtenção de Título de Doutor em Ciências, na área de Ecologia.
Orientadora: Renata Pardini
São Paulo
2014

Torres, Patricia Carignano
Caça e consumo de carne silvestre na Amazônia
Oriental: determinantes e efeitos na percepção do valor da
floresta
Número de páginas: 124
Tese (Doutorado) - Instituto de Biociências da Universidade de São Paulo. Departamento de Ecologia.
1. Fatores econômicos, culturais e ambientais 2. Produto florestal 3. Estratégia de sobrevivência 4. Conservação da biodiversidade 5. Serviços ambientais 6. Valores ambientais I. Universidade de São Paulo. Instituto de Biociências. Departamento de Ecologia.
Comissão Julgadora:
_______________________ ________________________
Prof(a). Dr(a). Prof(a). Dr(a).
_________________________ ___________________________
Prof(a). Dr(a). Prof(a). Dr(a).
_______________________________
Profa. Dra. Renata Pardini
Orientadora

Agradecimentos
Agradeço à minha orientadora Renata Pardini, que me envolveu neste projeto
interessantíssimo e aceitou o desafio de me orientar em um tema novo. Pela
oportunidade de aprender muito e pelo precioso ensinamento, ao longo desses anos, em
como fazer pesquisa. E, também, pela paciência e incentivo nesta fase final de redação.
À minha co-orientadora, Carla Morsello. Sem você, esse projeto também não teria sido
possível. Obrigada por me guiar e incentivar nessa nova (para mim) área de
conhecimento e pela importantíssima orientação em todas as fases dessa tese.
Ao Luke Parry, por também ter me orientado desde o início. Pelas ótimas discussões e
colaboração nos capítulos dessa tese, por ter me recebido tão bem na Universidade de
Lancaster para um estágio, que me proporcionou muitas novas e boas experiências.
À Toby Gardner, Jos Barlow e Joice Ferreira por terem também me ajudado
imensamente no início deste processo, pela colaboração importantíssima no primeiro
manuscrito e, junto com o Luke, terem me dado a oportunidade de participar da Rede
Amazônia Sustentável (RAS). Toby, pela grande disposição e atenção em discutir o
delineamento amostral e me ajudar a resolver problemas com dados e análises. Ao RAS,
por ter possibilitado minhas primeiras idas exploratórias ao campo, pelos dados
coletados, pelas imagens e mapas da região de estudo disponibilizados.
Aos professores do IB-USP. Especialmente ao Paulo Inácio, obrigada mais uma vez
pela grande contribuição na minha formação acadêmica e agora especialmente pela
ajuda com as análises de dados e comentários e sugestões para o primeiro capítulo.

Gostaria de agradecer também ao Jean Paul Metzger e Tiago Quental pelos comentários
e sugestões para o primeiro capítulo desta tese. E também à Vera, secretária da PPGE.
Às meninas que trabalharam no RAS – Amanda (Estefânia), minha primeira impressão
de Santarém não teria sido tão boa sem você! Amandinha e Alessandra, obrigada pelo
grande apoio em Santarém e Belém. Karol, que me ajudou desde o começo e esteve
comigo nas aventuras com Netuninho Tapajós off-road. O campo piloto não teria sido
tão produtivo sem você e sua memória incrível faz muita falta!
Aos amigos do Dicom, que me ajudaram nessa caminhada e especialmente à mulherada:
Camilinha, Cá Cassano, Thais, Cá Pagotto, Paula e Marina. Vocês fazem muita falta!
Aos antigos que ficaram e aos novos integrantes do lab, especialmente a Paulinha, que
topou entrar nesse projeto e ir para o campo sem passagem de volta. Muito obrigada por
toda a ajuda no campo e depois dele, com as imensas planilhas, dados, variáveis e
cartilha. Agradeço também à Liz, do Lepac, que me ajudou muito nas análises.
À Paula e ao Eric, pela grande ajuda no campo, por terem se dedicado tanto desde e o
começo e aguentado firme por quase seis meses. Não teria sido tão bom sem a farofa de
piracuí, o café, as piadas e as notícias policiais da região nas primeiras horas da manhã.
Obrigada equipe Baixa da Égua!
Ao LBA, pelo alojamento/hotel na FLONA Tapajós, ao Louro, pela comida deliciosa e
o bom humor, ao Adão, que faz o melhor bolo do mundo e ao André.
Um “obrigada” especial a todos os moradores e representantes das comunidades que
visitei e entrevistei. Todos muito atenciosos, mesmo com a longa entrevista. Aprendi
muito nessa etapa e vários vão ficar pra sempre na memória.

À minha grande amiga Sâmia, e família (Ângelo, Naná, Irineo e Januca), que sempre
me acolheram no paraíso quando eu precisava descansar um pouco do campo. Ao Diego
e ao Rafa, que me ajudaram com moradia e ótimos momentos em Santarém e Alter.
Aos amigos de Lancaster, Ciça, Mari, André, Jesus, Natalie, Sâmia, Filipe, Ruanny,
Anne, Hannah. Foi um tempo curto, mas muito especial. À Emily, Darren (Tabby e
Leo), que me acolheram tão bem e fizeram da minha estadia ainda melhor.
À minha família paulistana - Memê, grande amiga que eu ganhei no começo do
doutorado e que sempre me ajuda quando eu peço socorro, sejam com conselhos ou
com os mistérios do R. Camilinha, eterna integrante e criadora do refúgio, que também
responde tão bem aos meus pedidos de socorro. Você faz muita falta por aqui! Lari, que
preencheu tão bem o espaço e traz um pouco de barulho (quando não está no campo!).
Aos meus amigos de graduação e mestrado, e que continuam ou não nesse caminho.
Especialmente ao Billy e a Cris, que continuaram me ajudando bastante nessa etapa.
Ao Jordano, por estar sempre junto apesar de toda a correria e meses longe, por sempre
me apoiar, me incentivar e manter a calma nos meus vários momentos de estresse.
Aos meus pais, que sempre me apoiaram e me incentivaram muito em todas as minhas
escolhas, inclusive as de morar (muito) longe. Obrigada por entenderam a minha
ausência durante meses, apesar das saudades (sempre mútuas). À minha irmã Renata, tia
Lola, vó e vô pelo incentivo e ótimos momentos de descanso em Curitiba e Bariloche.
À Fundação de Amparo à pesquisa no Estado de São Paulo (FAPESP), pela bolsa de
doutorado concedida (2011/19606-0) e pelo auxílio à pesquisa (2011/19108-0), que
financiou todo o trabalho de campo durante dois anos. À CAPES, pela bolsa concedida
nos dois primeiros anos de doutorado.

Índice
Resumo 1
Abstract 3
Introdução geral 5
Capítulo 1: Large-scale drivers of bushmeat consumption and hunting in post-frontier tropical landscapes
Abstract 15
Introduction 17
Methods 19
Results 24
Discussion 27
Supporting Information 43
Capítulo 2: Interactions between economic, cultural and environmental drivers of hunting and bushmeat consumption in the Amazon
Abstract 45
Introduction 47
Methods 51
Results 57
Discussion 60
Capítulo 3: Using bushmeat and living close to forest: do they alter people’s perception of utilitarian and intrinsic value of forests?
Abstract 80
Introduction 82
Methods 85
Results 92
Discussion 95
Supporting Information 114
Considerações finais 119

1
Resumo
A extração de produtos florestais é uma estratégia de sustento importante para
populações que vivem próximas a remanescentes de florestas tropicais. Entre estes
produtos, a carne silvestre é fonte importante de proteína e renda monetária. A
sobreçaca, no entanto, pode levar à extinção local de espécies, comprometendo a
integridade das florestas tropicais e o sustento de populações humanas. Como
consequência, pode também levar à diminuição do valor atribuído às florestas pelos
moradores, incentivando a sua conversão a outras formas de uso da terra. Sabe-se que
fatores econômicos, como renda monetária e riqueza, são determinantes importantes da
caça e do consumo de carne silvestre. Porém, tem sido sugerido que o efeito destes
indicadores econômicos dependa do contexto ambiental – em especial, a cobertura
florestal, associada à disponibilidade de animais para caça e a distância ao centro
urbano, associada ao acesso a outras fontes de renda e proteína – e do contexto cultural,
em particular, a região de origem dos moradores. No entanto, estudos prévios não
consideraram todos estes fatores simultaneamente. Além disso, pouco ainda se sabe
sobre qual o valor atribuído às florestas por populações rurais e sua relação com a caça e
o consumo de carne silvestre. Através de questionários estruturados aplicados por meio
de entrevista à população rural de uma região extensa e heterogênea na Amazônia
oriental, esta tese teve como objetivos investigar: (i) o efeito de fatores ambientais em
maior escala como determinantes da caça e do consumo de carne silvestre (Capítulo 1);
(ii) a importância relativa e as interações entre fatores em escalas distintas –
econômicos, culturais e ambientais - na determinação da caça e do consumo de carne
silvestre (Capítulo 2) e; (iii) se a caça e o consumo de carne silvestre, bem como o
desmatamento, que pode comprometer esse recurso, estão associados à percepção do
valor das florestas (Capítulo 3). No Capítulo 1, os resultados indicam que fatores
ambientais são determinantes mais importantes da caça do que do consumo de carne
silvestre, que é mais frequente que a caça, sugerindo a relevância do compartilhamento
e/ou comércio como formas de obtenção de carne silvestre. Enquanto o consumo de
carne de silvestre foi um pouco mais frequente em áreas remotas e mais florestadas, a

2
caça foi mais frequente em áreas mais florestadas, mas também em áreas mais próximas
a centros urbanos. Assim, os resultados sugerem que é improvável que a pressão de caça
diminua com a crescente migração para áreas urbanas que hoje se observa na Amazônia.
O Capítulo 2 traz evidências de que o consumo de carne silvestre, e principalmente a
caça, dependem não só do contexto ambiental, mas também do cultural, e que os efeitos
de indicadores econômicos dependem de fatores ambientais. A caça e o consumo de
carne silvestre foram mais frequentes nas famílias de origem na região Amazônica,
entre aqueles que dependem mais de atividades de subsistência, e ambos aumentaram
com a renda monetária em áreas próximas a centros urbanos e/ou menos florestadas,
mas diminuíram com a renda monetária em áreas remotas e/ou florestadas. Isto sugere
que o sucesso de intervenções econômicas que visem tanto à redução da pobreza quanto
à conservação da biodiversidade depende do contexto ambiental, e é muito mais
provável em áreas mais florestadas e remotas. Os resultados do Capítulo 3 indicam que
a quantidade de carne silvestre consumida influencia positivamente a percepção do
valor utilitário da floresta, enquanto que a quantidade de florestas remanescentes no
entorno influencia positivamente a percepção de seu valor intrínseco. Assim, para além
de estratégias que visem o bem-estar humano via incentivos econômicos, há
oportunidade para iniciativas que considerem outros aspectos do bem-estar associados
aos serviços providos pela floresta - sejam recursos como a carne silvestre ou benefícios
culturais e estéticos. Ao mesmo tempo, os resultados apontam o potencial de um
perigoso ciclo de desvalorização da floresta, em que o desmatamento leva a diminuição
da percepção do seu valor, que, por sua vez, pode agravar o desmatamento, indicando a
urgência de investimentos em iniciativas de conservação nas paisagens mais alteradas.

3
Abstract
The extraction of forest products is an important livelihood strategy for human
populations living in and around tropical forest remnants. Among these products,
bushmeat is an important source of protein and monetary income. However,
overhunting can lead to local species extinction, compromising the integrity of tropical
forests and the livelihoods of human populations. As a consequence, it can also lead to a
decrease in the value local people attribute to forests, further promoting land
conversion. It is well known that economic factors, such as monetary income and asset-
wealth, are important drivers of bushmeat hunting and consumption. However, it has
been suggested that the effect of economic factors depend on the environmental context
– especially forest cover, associated with game availability, and distance to urban
centers, associated with alternative sources of protein and income – and on the cultural
context, particularly the region of origin of residents. Nevertheless, previous studies did
not consider all these factors simultaneously. In addition, little is known about the value
attributed to forests by rural populations and its association with bushmeat hunting and
consumption. Using questionnaire-based interviews with the rural population of a wide
heterogeneous region in eastern Amazonia, this thesis aimed at investigating (i) the
effects of large-scale environmental factors as drivers of bushmeat hunting and
consumption (Chapter 1); (ii) the relative importance and interactions between factors at
different scales – economic, cultural and environmental – in driving bushmeat hunting
and consumption (Chapter 2) and; (iii) whether bushmeat hunting and consumption, as
well as deforestation, which may compromise this resource, are associated with the
perception of forest values (Chapter 3). In Chapter 1, the results indicate that
environmental factors are more important drivers of hunting than of bushmeat
consumption, which is widespread, suggesting significant bushmeat sharing and/ or
trading. While bushmeat consumption was slightly more likely in remote and more
forested areas, hunting was more likely in more forested areas but also in areas closer to
urban centers. These results suggest that hunting pressure is unlikely to decrease with
the increasing migration to urban areas nowadays observed in the Amazon. Chapter 2

4
brings evidences that bushmeat consumption, and especially hunting, depend not only
on the environmental context but also on the cultural context, and that the effects of
economic variables depend on environmental factors. Bushmeat hunting and
consumption were more likely in households with Amazonian origin, with greater
reliance on subsistence activities and both increased with monetary income in less
remote and/or less forested areas, but decreased with monetary income in more remote
and/or more forested areas. This result suggests that the success of economic
interventions aiming at both poverty alleviation and biodiversity conservation depend
on the environmental context, and is more likely in more forested and remote areas. The
results of Chapter 3 indicate that the amount of consumed bushmeat positively
influences the perception of forest instrumental value, while forest cover in the
surroundings positively influences the perception of forest intrinsic value. These results
suggest that, beyond strategies that aim at human well-being through economic
incentives, there is opportunity for initiatives that consider other aspects of well-being
associated with services provided by forests – whether resources such as bushmeat or
cultural and aesthetic benefits. At the same time, the results suggest the potential for a
dangerous reinforcing cycle of forest depreciation, in which deforestation erodes
perceptions of forest values, which may in turn facilitate further deforestation,
indicating the urgent need to invest in conservation initiatives in more altered
landscapes.

5
Introdução geral
A extração de produtos florestais é uma estratégia de sustento importante para
populações que vivem próximas a remanescentes de florestas tropicais (Stoian 2005,
Angelsen et al. 2014). A importância desses recursos para as populações locais pode
influenciar as percepções das pessoas sobre o valor das florestas e da sua conservação
(Gillingham & Lee 1999). Entre esses produtos, a carne silvestre representa uma fonte
importante de proteína e renda monetária (Milner-Gulland et al. 2003, de Merode et al.
2004) e a caça de vertebrados é uma atividade extremamente comum, que requer
contato e conhecimento da floresta e sua fauna (Alves et al. 2009). A sobreçaca, no
entanto, pode levar à redução populacional e mesmo à extinção local de espécies mais
vulneráveis, especialmente aves e mamíferos de maior porte (Peres & Palacios 2007),
comprometendo a integridade das florestas tropicais, a persistência da biodiversidade no
longo prazo e o sustento de populações humanas (Milner-Gulland et al. 2003, Stoner et
al. 2007, Jorge et al. 2013). Como consequência, pode também levar à diminuição do
valor atribuído às florestas pelos moradores locais, o que pode incentivar a sua
conversão para outras formas de uso da terra (Allendorf et al. 2006), desencadeando um
processo de retroalimentação e degradação.
As decisões relativas à caça e ao consumo de carne silvestre são em parte
determinadas pelo retorno que o caçador ou consumidor tem comparado a outras
atividades ou fontes de alimentação (Behrens 1992, Ling & Milner-Gulland 2006). Este
retorno deve ser extremamente variável espacialmente, dependendo do contexto
ambiental em que a pessoa vive, uma vez que o acesso a animais silvestres e outras

6
fontes de carne depende da disponibilidade desses recursos. Assim, é de se esperar que
as condições ecológicas e geográficas tenham papel fundamental em determinar a caça e
o consumo de carne silvestre. Apesar disso, apenas recentemente pesquisadores
começaram a examinar a importância de fatores como cobertura florestal, indicativo da
disponibilidade de caça (Foerster et al. 2012), e distância a centros urbanos, indicativo
da disponibilidade de fontes alternativas de renda e proteína (Brashares et al. 2011,
Foerster et al. 2012, Mgawe et al. 2012), como determinantes da caça e do consumo de
carne silvestre. Grande parte dos trabalhos sobre esse assunto ainda tem como foco
fatores na escala da unidade doméstica, em especial os econômicos (e.g. Godoy et al.
2010, Rentsch & Damon 2013), enquanto fatores culturais também são menos
estudados.
O fato destes fatores ambientais frequentemente não serem considerados pode
estar por trás dos resultados aparentemente contraditórios na literatura sobre a relação
entre fatores econômicos e a caça e consumo de carne silvestre. Os diversos estudos
focados na importância da riqueza e renda monetária, por exemplo, encontraram
resultados divergentes (Wilkie & Godoy 2001, de Merode et al. 2004, Wilkie et al.
2005, Albrechtsen et al. 2006, Fa et al. 2009, Godoy et al. 2010). Contextos ambientais
distintos podem definir diferenças no benefício líquido do consumo de carne silvestre, e
secundariamente, da caça. Em regiões mais remotas e florestadas, não só a
disponibilidade de animais silvestres é maior, mas também o acesso a outros tipos de
carne é menor. Estas diferenças no benefício líquido devem fazer com que a carne
silvestre seja considerada um bem inferior (ou seja, cuja demanda diminui com o
aumento do poder aquisitivo do consumidor) em áreas remotas e florestadas, e um bem
normal (ou seja, cuja demanda aumenta com o aumento do poder aquisitivo do
consumidor) em áreas mais desmatadas próximas a centros urbanos. Além disso, é

7
provável que fatores econômicos também interajam com fatores culturais, podendo
levar, por exemplo, a efeitos opostos da renda e da riqueza sobre o consumo de carne
silvestre em povos de diferentes culturas (Mgawe et al. 2012). Assim, é provável que a
caça e o consumo de carne silvestre resultem da interação de fatores econômicos,
culturais e ambientais.
Entender quais são estes determinantes e suas interações pode ajudar a
identificar quais são e em que contexto vivem os atores que contribuem mais para a
pressão de caça, ou que são mais dependentes de carne silvestre e, portanto, mais
vulneráveis à diminuição deste recurso. Dessa forma, pode ajudar na elaboração de
intervenções que reduzam a caça não sustentável e evitem efeitos negativos no bem-
estar da população que depende desse recurso para subsistência. Além disso, esse
conhecimento é fundamental para propor intervenções adequadas em diferentes
contextos ambientais e culturais, identificando as inter-relações entre redução de
pobreza, mudanças em estratégias de sustento, uso de recursos e conservação da
biodiversidade (Billé et al. 2012) e assim evitando efeitos não desejados de mudanças
em condições econômicas das populações (Damania et al. 2005).
Adicionalmente, entender como o uso deste recurso florestal influencia a
percepção do valor das florestas é importante para a elaboração de intervenções que
sejam aceitas e apoiadas pelas populações locais, aumentando sua chance de sucesso. A
percepção de valores ambientais tem sido associada a atitudes e comportamentos pró-
ambientais (Stern et al. 1995, Schultz & Zelezny 1999, Schultz 2001). Se a carne
silvestre é um recurso importante, que leva à valorização da floresta, então, garantir a
utilização sustentável deste recurso pode favorecer a conservação de florestas.

8
Nesta tese, pretendi investigar (i) o efeito de fatores ambientais (ecológicos e
geográficos) em maior escala – cobertura florestal, densidade demográfica e distância
aos centros urbanos – sobre a caça e o consumo de carne silvestre (Capítulo 1); (ii) a
importância relativa e as interações entre fatores em escalas distintas – econômicos,
culturais, ambientais - na determinação da caça e do consumo de carne silvestre
(Capítulo 2); e por fim, (iii) se a caça e o consumo de carne silvestre, bem como o
desmatamento, que pode comprometer esse recurso, estão associados à percepção do
valor das florestas (Capítulo 3).
O estudo foi realizado em uma região de fronteira agrícola recentemente
consolidada, de aproximadamente um milhão de hectares, na Amazônia oriental,
abrangendo os municípios de Santarém, Belterra e Mojuí dos Campos, no Pará. Como
consequência do desenvolvimento agrícola, a região apresenta um gradiente de
cobertura florestal associado à distância ao maior centro urbano, a cidade de Santarém.
A região é ocupada desde a época pré-colombiana, mas a partir do final do século XIX
tem recebido diversos fluxos migratórios por conta de diferentes ciclos econômicos
(Fonseca 1996). A partir da década de 60, projetos de desenvolvimento do governo
federal, promoveram novo influxo de migrantes, vindos de todas as regiões do país e de
diferentes condições econômicas (Castro et al. 2004, Nepstad et al. 2006). Ambas essas
características, ambiental e socioeconômica, fazem da região uma área particularmente
apropriada para investigar a importância e interação entre fatores ambientais em escala
mais ampla e fatores econômicos e culturais na escala das unidades domésticas na
determinação da caça e do consumo de carne silvestre. Embora seja improvável que os
moradores desta região dependam fundamentalmente de produtos florestais para seu
sustento (Futemma & Brondízio 2003), o suprimento de produtos para alimentação,
especialmente a carne silvestre, que está disponível durante todo o ano, deve representar
9
um recurso importante. Assim, a região também é apropriada para o estudo da relação
entre o uso deste recurso e a percepção dos moradores em relação ao valor da floresta.
Esta tese está dividida em três capítulos, uma introdução geral e considerações
finais. Os três capítulos estão apresentados na forma de artigo científico em inglês. O
primeiro artigo foi submetido para a revista Journal of Applied Ecoloy em agosto de
2014 e no momento está em revisão.
O primeiro capítulo é fruto da parceria com uma rede de pesquisa internacional –
Rede Amazônia Sustentável – RAS (Embrapa, INCT-CNPq, Museu Paraense Emílio
Goeldi - MPEG, University of Cambridge, Lancaster University e Darwin Initiative). A
rede tem por objetivo avaliar a biodiversidade, o fornecimento de serviços
ecossistêmicos, as atividades econômicas e o bem-estar das populações humanas
associados com diferentes tipos de usos da terra em duas regiões na Amazônia oriental
brasileira, nos municípios de Santarém e Paragominas, no Pará. Neste primeiro capítulo,
analisei os dados referentes à caça e ao consumo de carne silvestre, coletados pela rede
de pesquisa através de questionários socioeconômicos aplicados em 2010 e início de
2011. A parte do questionário utilizada nesse trabalho foi elaborada por mim em
colaboração com pesquisadores da rede de pesquisa antes do meu ingresso no programa
de Pós-graduação. Por ser parte de um questionário socioeconômico bastante extenso,
as informações sobre caça e consumo de carne silvestre coletadas foram mais simples,
se comparadas aos dados utilizados nos dois capítulos posteriores. O capítulo contou
com a colaboração dos pesquisadores, coordenadores da rede de pesquisa RAS - Luke
Parry, Toby Gardner, Jos Barlow e Joice Ferreira. A análise desses dados também
possibilitou o aprimoramento do delineamento amostral e do questionário para a coleta

10
de dados que realizei em 2012 e 2013 durante o período do meu doutoramento, e que
foram utilizados nos capítulos 2 e 3.
Nos segundo e terceiro capítulos analisei os dados coletados por mim em
trabalho de campo realizado com financiamento da FAPESP através de auxílio à
pesquisa regular (FAPESP 2011/19108-0). O delineamento amostral foi um pouco
modificado para ampliar as paisagens de estudo, de modo a incluir maior número de
unidades domésticas, bem como abranger áreas não contempladas no delineamento da
rede de pesquisa e que eram importantes para os objetivos desta pesquisa.
Referências
Albrechtsen, L, Fa, J. E., Barry, B. & MacDonald, D. W. (2006) Contrasts in
availability and consumption of animal protein in Bioko Island, West Africa: the
role of bushmeat. Environmental Conservation, 32, 340-348.
Allendorf, T., Swe, K. K., Oo, T., Htut, Y., Aung, M., Aung, M., Allendorf, K., Hayek,
L., Leimgruber, P. & Wemmer, C. (2006) Community attitudes toward three
protected areas in Upper Myanmar (Burma). Environmental Conservation, 33,
344–352.
Alves, R. R., Mendonça, L. E. T., Confessor, M. V. A., Vieira, W. L. S. & Lopez, L. C.
S. (2009) Hunting strategies used in the semi-arid region of northeastern Brazil.
Journal of Ethnobiology and Ethnomedicine, 5 doi:10.1186/1746-4269-5-12.
Angelsen, A., Jagger, P., Babigumira, R., Belcher, B., Hogarth, N. J., Bauch, S., Borner,
J., Smith-Hall, C., & Wunder, S. (2014) Environmental income and rural

11
livelihoods: a global-comparative analysis. World Development,
http://dx.doi.org/10.1016/j.worlddev.2014.03.006.
Behrens, C.A. (1992) Labor specialization and the formation of markets for food in a
Shipibo subsistence economy. Human Ecology, 20, 435-462.
Billé, R., Lapeyre, R. & Pirard, R. (2012) Biodiversity conservation and poverty
alleviation: a way out of the deadlock? S.A.P.I.E.N.S, 5.1. URL :
http://sapiens.revues.org/1452
Brashares, J. S., Golden C. D., Weinbaum K. Z., Barret C. B., & Okello G. V. (2011)
Economic and geographic drivers of wildlife consumption in rural Africa.
Proceedings of the National Academy of Sciences of the United States of
America, 108, 13931–13936.
Castro, E., Monteiro, R., & Castro, C. P. (2004) Dinâmica de atores, uso da terra e
desmatamento na rodovia Cuiabá-Santarém. Paper do NAEA, 179. Available:
http://www.ufpa.br/naea/gerencia/ler_publicacao.php?id=247. Accessed 15
December 2012.
Damania, R., Milner-Gulland, E. J. & Crookes, D. J. (2005) A bioeconomic analysis of
bushmeat hunting. Proceedings of the Royal Society B Biological Sciences, 272,
259-266.
de Merode, E., Homewood, K., & Cowlishaw, G. (2004) The value of bushmeat and
other wild foods to rural households living in extreme poverty in Democratic
Republic of Congo. Biological Conservation, 118, 573–581.
Fa, J. E., Albrechtsen, L., Johnson, P. J., & Macdonald, D. W. (2009) Linkages between
household wealth, bushmeat and other animal protein consumption are not
invariant: evidence from Rio Muni, Equatorial Guinea. Animal Conservation,
12, 599-610.
12
Foerster, S., Wilkie, D. S., Morelli, G. A., Demmer, J., Starkey, M., Telfer, P., Steil, M.
& Lewbel, A. (2012) Correlates of bushmeat hunting among remote rural
households in Gabon, Central Africa. Conservation Biology, 26, 335–344.
Fonseca, W. D. (1996) Santarém: momentos históricos, Editora Tiagão, Santarém,
Brazil.
Futemma, C. &Brondízio, E. S. (2003) Land reform and land-use changes in the lower
Amazon: implications for agricultural intensification. HumanEcology 31, 369-
402.
Gillingham, S., Lee, P. C. (1999) The impact of wildlife-related benefits on the
conservation attitudes of local people around the Selous Game Reserve,
Tanzania. Environmental Conservation, 26, 218–228.
Godoy, R., Undurraga, E. A., Wilkie, D., Reyes-García, V., Huanca, T., Leonard, W.
R., NcDade, T., Tanner, S., Vadez, V., & TAPS Bolivia Study Team. (2010) The
effect of wealth and real income on wildlife consumption among native
Amazonians in Bolivia: estimates of annual trends with longitudinal household
data (2002–2006). Animal Conservation, 13, 265–274.
Jorge, M. L. S. P., Galetti, M., Ribeiro, M. C., & Ferraz, K. M. P. M. B. (2013) Mammal
defaunation as surrogate of trophic cascades in a biodiversity hotspot. Biological
Conservation, 163, 49-57.
Ling, S., Milner-Gulland, E. J. (2006) Assessment of the sustainability of bushmeat
hunting based on dynamic bioeconomic models. Conservation Biology, 20,
1294–1299.
Mgawe, P., Mulder, M. B., Caro, T., Martin, A., & Kiffner, C. (2012) Factors affecting
bushmeat consumption in the Katavi-Rukwa ecosystem of Tanzania. Tropical
Conservation Science, 5, 446-462.

13
Milner-Gulland, E.J., Bennet, E.L. & SCB 2002 Annual Meeting Wild Meat Group
(2003) Wild meat: the bigger picture. Trends in Ecology and Evolution 18, 351-
357.
Nepstad, D., Stickler, C. M., & Almeida, O. T. (2006) Globalization of the amazon soy
and beef industries: opportunities for conservation. Conservation Biology, 20,
1595–1603.
Peres, C. A., & Palacios, E. (2007) Basin-wide effects of game harvest on vertebrate
population densities in Amazonian forests: implications for animal-mediated
seed dispersal. Biotropica, 39, 304-315.
Rentsch, D., & Damon, A. (2013) Prices, poaching, and protein alternatives: an analysis
of bushmeat consumption around Serengeti National Park, Tanzania. Ecological
Economics, 91, 1-9.
Schultz, P. W. &Zelezny, L. (1999) Values as predictors of environmental attitudes:
evidence for consistency across 14 countries. Journal of Environmental
Psychology 19, 255-265.
Schultz, P.W. (2001) The structure of environmental concern: concern for self, other
people, and the biosphere. Journal of Environmental Psychology 21, 327-339.
Stern, P.C., Kalof, L., Dietz, T., Guagnano, G.A. (1995) Values, beliefs, and pro-
environmental action: attitude formation toward emergent attitude objects.
Journal of Applied Social Psychology 25, 1611-1636.
Stoian, D. (2005) Making the best of two worlds: rural and peri-urban livelihood
options sustained by nontimber forest products from the Bolivian Amazon.
World Development, 33, 1473-1490.

14
Stoner, K. E., Vulinec, K., Wright, S. J., & Peres, C. A. (2007) Hunting and plant
community dynamics in tropical forests: a synthesis and future directions.
Biotropica, 39, 385-392.
Wilkie D.S & Godoy R.A. (2001) Meat prices influence the consumption of wildlife by
the Tsimane’ Amerindians of Bolivia. Conservation Biology 15, 761-769.
Wilkie, D. S., Starkey, M., Abernethy, K., Effa, E. N., Telfer, P., & Godoy, R. (2005)
Role of prices and wealth in consumer demand for bushmeat in Gabon, Central
Africa. Conservation Biology, 19, 268-274.

15
Capítulo 1
Large-scale drivers of bushmeat consumption and hunting in post-
frontier tropical landscapes
Patricia Carignano Torres, Carla Morsello, Luke Parry, Jos Barlow, Joice Ferreira, Toby
Gardner & Renata Pardini
Abstract
Identifying the factors that influence bushmeat consumption and hunting is important
for informing conservation strategies and identifying challenges to human food security.
However, current understanding is still largely limited to household-scale socio-
economic drivers, with studies often neglecting large-scale determinants of bushmeat
supply (e.g. game availability) and demand (e.g. access to alternative sources of animal
protein and of cash income). We examine bushmeat consumption and hunting in 292
households across 16 landscapes in a heterogeneous post-frontier region in eastern
Amazonia. We test the hypotheses that bushmeat consumption and hunting are
positively associated with forest cover (as a proxy of game availability) and remoteness
from urban centers (as a proxy of access of alternative sources of animal protein).
Bushmeat had been consumed by 79 % of households within the past 12 months and
was slightly more common in remote and less deforested landscapes, as expected. In
contrast, whilst hunting was more likely in more forested landscapes, when controlling

16
for forest cover, it was more common near urban centers. Our findings demonstrate that
large-scale factors are important determinants of bushmeat consumption and hunting,
even in economically and culturally diverse rural areas, and that bushmeat consumption
makes an important contribution to food security and well-being in post frontier tropical
landscapes. Although people living in remote, forested areas are likely to be the most
dependent on bushmeat for subsistence, rural people living in more populous areas near
to urban centers are the actors contributing most to hunting pressure, due to higher per
capita probability of hunting combined with higher population densities. This finding
undermines the assumption that urbanization in the forested tropics will deliver a much
needed reprieve for many overhunted species. Ensuring the persistence and recovery of
game populations in post-frontier regions requires greater efforts to reduce hunting
activity by people travelling from peri-urban areas.
Keywords: accessibility, alternative source of protein, deforestation, forest products,
game availability, livelihoods, urban center, wild meat

17
Introduction
The extraction of forest products is an important livelihood strategy in developing
countries (Stoian 2005, Angelsen et al. 2014), where hunting forest vertebrates is
widespread and bushmeat is an important source of both animal protein and cash
income (Milner-Gulland et al. 2003, de Merode et al. 2004). Despite its importance for
the livelihoods of many people, hunting can threaten the population viability of game
species, particularly large-bodied mammals and birds, driving widespread depletion and
local and regional extinctions of the most vulnerable taxa (Peres & Palacios 2007).
Since these animals play key roles in ecological processes, including seed dispersal and
herbivory, overhunting can compromise not only the livelihoods of local people but also
affect the integrity of tropical forests, and the long-term persistence of non-hunted
biodiversity (Stoner et al. 2007, Jorge et al. 2013). Understanding the drivers of both
hunting and bushmeat consumption can help identify interventions to reduce
unsustainable hunting whilst also seeking to avoid negative impacts on the well-being
of those most dependent on bushmeat for nutrition.
Bushmeat consumption and hunting decisions are in part determined by the
perceived returns compared to other activities or alternatives (Behrens 1992, Ling &
Milner-Gulland 2006), both of which can be highly variable across space. However,
only recently researchers have begun to examine the importance of large-scale factors
on hunting and bushmeat consumption (Brashares et al. 2011, Foerster et al. 2012,
Mgawe et al. 2012). In contrast, most studies have focused on individual consumer and
hunter preferences or the interplay of demographic, socioeconomic and cultural factors
at the household scale (e.g. Godoy et al. 2010, Rentsch & Damon 2013). Yet the
availability of bushmeat and alternative sources of animal protein at the landscape level

18
may be at least as important drivers of bushmeat consumption and hunting as household
socioeconomic or cultural characteristics (Nyahongo et al. 2009, Brashares et al. 2011).
A failure to account for these large-scale factors may help explain the apparently
inconsistent role of some household factors (e.g. wealth and income) reported by some
studies on bushmeat consumption and hunting (Wilkie & Godoy 2001, Wilkie et al.
2005, Fa et al. 2009).
Large-scale factors are likely to be particularly important in dynamic and
heterogeneous regions such as those found along deforestation frontiers and in relatively
recent post-frontier landscapes in the tropics. In this study we evaluate the importance
of large-scale factors in determining bushmeat consumption and hunting in a
heterogeneous post-frontier tropical region in eastern Amazonia. Game availability,
which should influence both bushmeat consumption and hunting decisions (Fa et al.
2009, Brashares et al. 2011, Foerster et al. 2012), is likely reduced by deforestation
(Michalski & Peres 2007) and high levels of hunting pressure (associated with older
settlements, higher human population density and increased road access) (Poulsen et al.
2009, Suarez et al. 2009). Limited access to alternative sources of animal protein, which
is related to remoteness from urban centers, should also influence both bushmeat
consumption and hunting (Wilkie & Godoy 2001). People in more remote areas are also
likely to have lower monetary income (Zenteno et al. 2013) and make less frequent trips
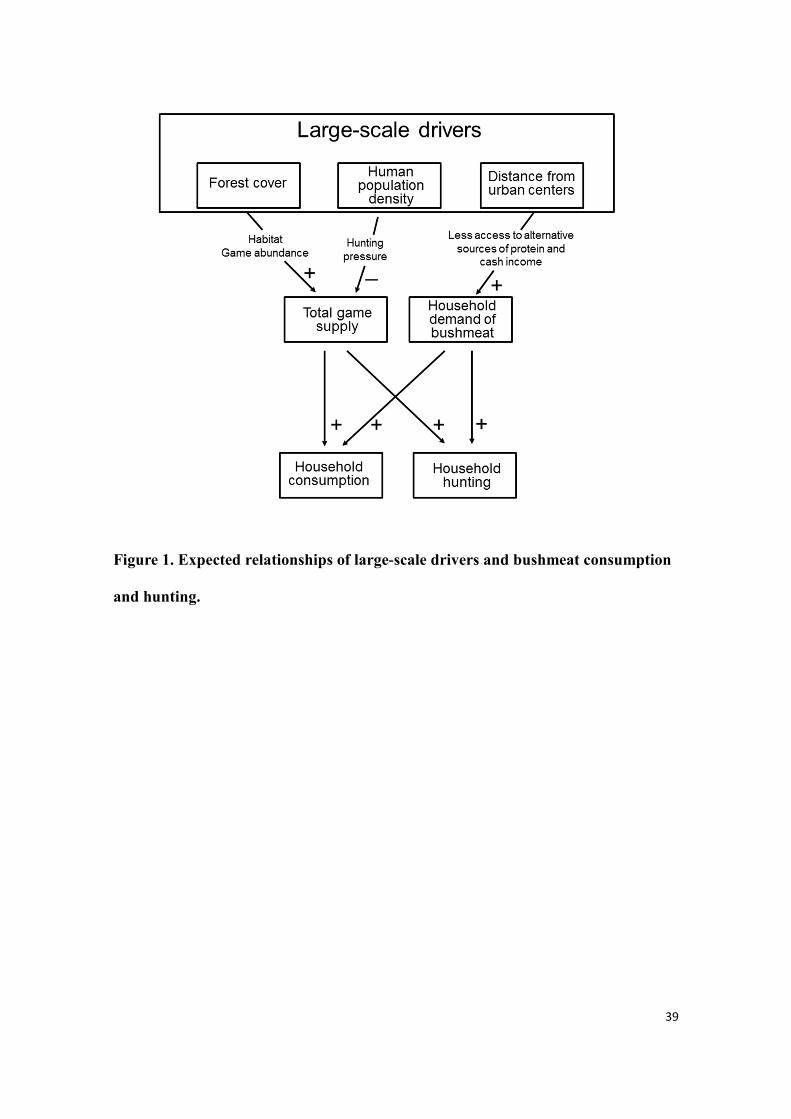
to urban centers (Parry et al. 2010a). We therefore hypothesize that both bushmeat
consumption and hunting are less common in landscapes that (i) have lower forest cover
(either due to deforestation and/or high human population density) and therefore lower
game abundance, (ii) close to urban centers where the availability of alternative sources
of animal protein and of cash income is higher than in remote areas (Fig. 1).

19
To test these hypotheses we focused on a heterogeneous ~1 million ha area south
of the city of Santarém in the Brazilian Amazon, and conducted interviews at 292
households across 16 hydrological catchments or ‘landscapes’ (c. 5000 ha). The
landscapes capture high variation in forest cover, human population and remoteness
from urban centers as a result of rapid agricultural expansion and urban development
(Moran 1993, Fearnside 2005), and are therefore well suited to teasing apart the relative
importance of large-scale correlates of bushmeat consumption and hunting activity.
Specifically, we examine the association of bushmeat consumption and hunting with
three large-scale drivers: (1) forest cover as a proxy of game availability both at the
property scale (the immediate surroundings of the household) and at the landscape
scale, (2) the amount of forest cover per household as a proxy of game availability that
takes into account human population size and associated hunting pressure, and (3) the
remoteness from urban centers, as a proxy of the access to alternative source of protein
and of cash income.
Methods
Study region
We conducted this study in the eastern Brazilian Amazonia, Pará state, in a region of
approximately 1 million ha, bordered by the Amazon, Tapajós and Curuá-Una Rivers
(Fig. 2). It encompasses the rural areas of the municipalities of Santarém (78,790
inhabitants living in rural areas from a total of 294,580), Belterra (6,852 of 16,318) and
Mojuí dos Campos, a recently established municipality with no data on rural population
size (total of 15,232) (IBGE 2010).

20
Santarém was founded in 1661, but the region has been inhabited since pre-
Colombian times and has received different migratory influxes associated with various
economic cycles (D’Antona et al. 2006). Starting around 1958, road construction and
government-led colonization and land reform initiatives promoted the influx of low
income immigrants from the arid northeast, and from the southern part of the country
(Castro et al. 2004, Nepstad et al. 2006). Agriculture mechanization began at the end of
the 1990s, with a new migratory wave of farmers from south and midwest Brazil
(Nepstad et al. 2006). Large-scale, mechanized agriculture has rapidly expanded in the
region in recent years (SAGRI 2013a), as well as cattle ranching, with a 50% increase in
the number of cattle between 2002 and 2012 (SAGRI 2013b). The study region is
therefore home to both recent and long-term in-migrants from various regions of Brazil,
and rural properties that range from small-scale farms based on subsistence agriculture
to large-scale soy farms and cattle ranches.
Sampling design
This study is part of the Sustainable Amazon Network (Rede Amazônia Sustentável,
RAS), which aims to assess social and ecological dimensions of land-use sustainability
in Eastern Brazilian Amazonia (Gardner et al. 2013). The sampling design was
hierarchical, first selecting landscapes (catchments) that captured the variability in
forest loss within the study region, and then a stratified random selection of rural
properties (and households) within them. In total, we sampled 16 hydrological
catchments of third or fourth order (c. 5000 ha) (hereafter landscapes), distributed
across a gradient of current forest cover (24 to 98 %), population density (0.25 to 34
households/ km2) and straight-line distance from the nearest urban center (5 to 92 km)
(Fig. 2).

21
Within each landscape, we sampled only households in rural properties ≥ 1 ha
that were active rural agricultural producers in 2009. We first mapped all such
properties in each landscape, and selected a random sample, stratified by the number of
properties per road branch (to ensure a reasonable spatial spread across the entire
landscape). For those properties that had more than one household (i.e., with workers or
multiple groups of relatives), we sampled additional households according to the total
number of households (two when 2-3, three when 4-6, and four when ≥ 7). We skipped
individual households if the household head declined to take part in the study, or if after
three visits no resident was encountered. In total we sampled 292 households, with 4 to
30 households per landscape. Large soy farms and cattle ranches were scattered across
landscapes and smaller properties were usually < 50 ha while larger ones were usually >
400 ha within landscapes, so that in each landscape there was variation in
socioeconomic characteristics.
Bushmeat consumption and hunting
We used an interview-based survey with the household heads (when possible both
household heads were interviewed), applied by a team of six trained assistants who
conducted the interviews between August 2010 and March 2011. We asked (1) the
month when bushmeat was last consumed in the household and (2) if there was at least
one hunter in the household (even if only occasionally). Bushmeat consumption and
hunting were equal to 1 when, respectively, bushmeat was consumed at least once in the
previous 12 months and there was at least one hunter in the household. The recall period
of 12 months for bushmeat consumption aimed at avoiding variation associated with
seasonality in hunting activity.

22
Large-scale drivers of bushmeat consumption and hunting
As proxies of game availability, we used the percentage of forest cover (Sampaio et al.
2010), as well as forest cover per household (percentage of forest cover divided by the
number of households) to account for hunting pressure from local residents. Both
variables were quantified considering either: only non-degraded primary forest, all
primary forests (degraded and non-degraded), or both primary forests and secondary
forest older than 10 years. Forest cover was calculated at three spatial scales: (1) a
smaller scale of 500-m radius buffer (0.78 km2) around each household, representing
game availability in the immediate surroundings of the household within the property
and neighboring properties (median of property size in the region was 0.25 km2), and at
two wider, landscape scales of (2) 5-km radius (78.5 km2) and (3) a 10-km radius (314
km2) buffers around each household, since local species persistence and abundance is
known to depend on the wider landscape context (Andrén 1994) (Fig. 2). Forest cover
per household was calculated only at the two landscape scales, because human
population density varied little at the property scale. We calculated the cover of each
type of forest through a time-series of Landsat images from 1990 to 2010, using a
decision tree classification procedure that separated primary and secondary forest, as
well as primary forest with a signal of degradation from past logging and fire (Gardner
et al. 2013). To calculate the number of households we used 2010 census data from the
Brazilian Institute of Geography and Statistics (IBGE). In this census, each municipality
is divided into census sectors and, in the majority of cases IBGE provides the
coordinates for all rural households. We estimated the number of households with no
coordinate data by assuming that they had a regular distribution in the census sector,
and that their number in each buffer was proportional to the percentage of the area of
the census sector that overlapped the buffer.

23
As a proxy of access to alternative sources of animal protein and of cash income,
we calculated the remoteness from urban centers. Remoteness was estimated using five
different measures: straight-line distance of households to the (1) largest, (2) nearest and
(3) most visited urban center (the latter being reported in the interviews), and time spent
to get from the household to the most visited urban center in the (4) dry season and (5)
in the wet season (both reported in the interviews).
Data analysis
Our analyses considered four predictors: forest cover at the property scale (different
forest types at 500-m radius buffer), forest cover at the landscape scale (different forest
types at 5-km and 10-km radius buffers), forest cover per household (different forest
types at 5-km and 10-km radius buffers divided by the number of households in the
buffer) and remoteness from urban centers (straight-line distance to the largest, nearest
and most visited urban center, and time spent to get to the most visited urban center in
the dry and wet seasons). Our first step was to select the measure of each of the four
predictors that best explained bushmeat consumption and hunting, using a model
selection approach based on the Akaike’s Information Criterion modified for small
samples (AICc). For each dependent variable (bushmeat consumption [0/1] and hunting
[0/1]), we compared a candidate set of simple models each containing a different
measure for a given predictor, and selected the measure contained in the first-ranked
model (Supporting Information Table S1). To account for the hierarchical nature of the
sampling design, we used generalized linear mixed-effects models (GLMM), with
dependent variables modeled as binary variables using logit as the link function, the
different measures of each predictor as fixed factors, and landscapes as a random factor.

24
Fixed factors were standardized so that each had a mean of zero and a standard
deviation of one (Zuur et al. 2009).
After selecting the best measure for each predictor, we compared a set of
candidate GLMM models of each dependent variable (modeled as a binary variable) as
a function (logit link) of different combinations of the four predictors (standardized,
fixed factors, with landscapes as a random factor). Each set of candidate models
included eight models: an intercept-only model for reference (that does not include any
fixed factors), four simple models with each of the four predictors on their own, and
models combining one of the three predictors of game availability with the predictor
remoteness from urban centers. Alternative models in each set were compared using the
difference in their AICc values in relation to the first-ranked model (∆AICc) (Burnham
& Anderson 2002). A value of ∆AICc ≤ 2 indicates equally plausible models. All
analyses were implemented in R 3.0.3 (R Core Team 2014) using the lme4 package
(Bates et al. 2011).
Results
Bushmeat consumption was far more common than hunting. In the majority of
households (78.8% of sampled households, range = 20 to 100%, mean = 77.5, and SD =
19.4 across landscapes), members reported having consumed bushmeat at least once in
the previous 12 months (Fig. 2). By contrast, the presence of a hunter in the household
was reported in 38.4% of the sampled households, and varied between 0 and 100%
(mean = 37.9, SD = 26.4) across landscapes (Fig. 2). Amongst bushmeat-consuming
households, the majority (59 %) stated that the last bushmeat they ate was a gift, 34%

25
that it was hunted by one of the members of the household and 7% that it was
purchased. In seventy eight percent of households that consumed bushmeat in the last
year, interviewees reported having last consumed either paca or armadillos (Fig. 3).
Large-scale drivers of bushmeat consumption and hunting
For bushmeat consumption, the best measures for all the three proxies of game
availability were those that included all forest types together, and a 10-km radius buffer
was the best buffer size for the two proxies quantified at the landscape scale (Supporting
Information Table S1). The best measure for the remoteness from urban centers was the
time spent to get to the most visited urban center in the wet season (Supporting
Information Table S1). These predictors were then included in the model selection
procedure for analyzing the large-scale drivers of bushmeat consumption. Five models
were selected including the reference model (Table 1). The model including only the
remoteness from urban centers was the first-ranked model, followed by the model
including only forest cover at the landscape scale, the models including remoteness
from urban centers and either forest cover at the landscape scale or forest cover at the
property scale, and the reference model.
As expected, living farther from urban centers was associated with increased
probability of bushmeat consumption (Table 1). Within 60 minutes of urban centers (1st
quintile of the data), 74% of households had consumed bushmeat, whereas for the most
remote households (travel time = 180 to 300 minutes, 5th quintile) 93% had consumed
bushmeat (Fig. 4a). Higher total forest cover at the landscape scale was also positively
associated with bushmeat consumption, as expected (Table 1). In heavily deforested
areas (1st quintile, ≤ 27% forest cover in surrounding landscape), 71% of households
consumed bushmeat compared to 88 % of households within more forested landscapes

26
(5th quintile, 71 - 94% forest cover) (Fig. 4b). When controlling for remoteness from
urban centers, higher forest cover both at the landscape and at the property scale was
associated with an increase in bushmeat consumption probability (Table 1). The
association between bushmeat consumption and the large-scale drivers, however, was
not strong, since the reference model was included among selected models, albeit as the
last-ranked (Table 1).
For bushmeat hunting, the best measure for forest cover at the property scale
was the total primary forest cover (degraded plus non-degraded), while total forest
cover (total primary and secondary forest) in a 10-km radius buffer was the best
measure for the two proxies of game availability quantified at the landscape scale
(Supporting Information table S1). The best measure for the remoteness from urban
centers was the distance to the largest urban center (Supporting Information table S1).
These predictors were then included in model selection procedure for analyzing the
large-scale drivers of hunting. Two models were selected (Table 1). The model
including only forest cover at the landscape scale was the first-ranked model, followed
by the model including forest cover at the landscape scale and remoteness from urban
centers.
As expected, higher forest cover at the landscape scale was positively associated
with hunting (Table 1). Only 20% of the households in heavily deforested areas (1st
quintile, ≤ 27% forest cover in surrounding landscape) had at least one hunter,
compared to 64 % of household within more forested landscapes (5th quintile, 71 - 94%
forest cover) (Fig. 4c). When controlling for forest cover at the landscape scale, in
contrast to our observations for bushmeat consumption, households near urban centers
were more likely to have a hunter (Table 1).

27
Discussion
By investigating both bushmeat consumption and hunting, our findings demonstrate that
large-scale factors are important determinants of these activities. Forest cover and
remoteness from urban centers strongly affected hunting decision, but were less
important in determining bushmeat consumption, which was widespread and more
prevalent than hunting, indicating significant bushmeat sharing and/ or trading. Our
findings thus suggest that bushmeat is an important forest resource even in altered
landscapes of post-frontier regions. In the following paragraphs we discuss in detail the
effects of these large-scale factors and their implications for wildlife conservation and
rural livelihoods.
Our results support the idea that bushmeat consumption is widespread in post-
frontier tropical regions, even in deforested, densely populated landscapes near urban
centers. Hunting was less common than consumption and may be under-reported,
although subsistence hunting in Brazil is not illegal. Gifts and trade certainly provide
important means of acquiring bushmeat other than hunting, and many killed animals are
therefore eventually consumed in households other than those of the hunters (de Merode
et al. 2004). Although game populations seem heavily depleted, since the species
consumed were mostly those with high reproductive rates (e.g. paca and armadillos,
Redford & Robinson1987, Parry et al. 2009) our results support assertions that
bushmeat can continue to play an important role in rural livelihoods in altered areas
(Schulte-Herbrüggen et al. 2013). Moreover, although consumption was slightly more
likely in remote, forested landscapes, total demand for bushmeat is certainly higher in
less remote, deforested landscapes, given the higher human population densities in these
areas.

28
We found that bushmeat consumption was slightly more likely in more remote
and forested areas, as expected, with landscape-scale forest cover and remoteness from
urban centers being similarly important drivers. This is presumably related to people
having less access to domestic marketed meat and to higher game availability, making
bushmeat more important for household food security in more remote and forested
areas. Indeed, studies in Africa have shown that poor access to other types of meat can
drive bushmeat consumption (Brashares et al. 2011), which is also more common in
places close to game sources (Brashares et al. 2011, Foerster et al. 2012, Mgawe et al.
2012). Remoteness has also been linked to greater dependence on hunting for
subsistence (Pangau-Adams et al. 2012). Importantly, levels of bushmeat consumption
may be more variable and strongly related to large-scale drivers, especially remoteness,
within still intact pre-frontier landscapes, where it can take many days for a riverine
household to reach an urban center (Parry et al. 2010a). Moreover, it is possible that a
stronger variation in consumption would be observed among landscapes if the
frequency or quantity (instead of the occurrence) of bushmeat consumption was
measured.
Hunting, while less prevalent than consumption, was more strongly associated
with large-scale factors. In contrast to the observed for consumption, landscape-scale
forest cover was the main driver of hunting, with remoteness from urban centers only
appearing important after controlling for variability in forest cover. Indeed, the
proximity of game sources (such as protected areas) has been associated with higher
hunting rates (Brashares et al. 2011, Nuno et al. 2013). When controlling for forest
cover, however, households far from urban centers were less likely to hunt. This may be
due to co-linearity between remoteness and socioeconomic factors. On the other hand, it
may also be associated with the concentration of bushmeat market and trade near urban

29
centers, stimulating hunting. Although our dataset in not adequate for testing hypotheses
on bushmeat trade and commercial hunting, the literature suggests that the higher
human population density and thus higher demand on bushmeat near urban centers may
support a stronger informal bushmeat trade. Bushmeat trade is frequently reported as
supporting higher profits near urban centers, especially in Africa, where trade is well
developed (Brashares et al. 2011). People living closer to major markets are often
reported as engaging more in commercial bushmeat trade (Espinoza 2009, Pangau-
Adams et al. 2012) and higher purchasing was associated with greater monetary power
by urban consumers (Fa et al. 2009). Although there are few studies on bushmeat trade
in the Brazilian Amazon (Nasi et al. 2011), it has already been reported even in open
markets (Chaves Baía Junior et al. 2010), indicating that it might be important.
By considering different measures of game availability and access to alternative
sources of animal protein, our study also contributes to the identification of the best
proxies of the large-scale drivers of bushmeat consumption and hunting. Forest cover
per household was not associated with either bushmeat consumption or hunting,
confirming that human population density is not always important in determining local
hunting pressure (sensu Urquiza-Haas et al. 2009) and forest cover alone is a better
predictor of game abundance. Importantly, our results highlight that forest cover should
be accessed at the landscape scale rather than at the property scale since persistence and
local abundance of game species depend on ecological processes that occur at the
landscape scale (Andrén 1994). In addition, in post-frontier regions such as our study
area, degraded and secondary forests are prevalent and probably important determinants
of game availability. Within relatively ‘pristine’ pre-frontier regions, however, wildlife
abundance within non-degraded primary forest is probably a more important
determinant of bushmeat consumption and hunting (Parry et al. 2009). In contrast,

30
different measures of remoteness were effective predictors of bushmeat consumption
and hunting, indicating that distinct measures may capture different aspects of
remoteness. While distance to the largest urban center may have a stronger association
with bushmeat trade affecting hunting probability, the time spend to reach an urban
center may be a better proxy of access to alternative sources of protein and income
affecting bushmeat consumption.
Implications for conservation and rural livelihoods
Our study demonstrates that bushmeat consumption is prevalent even in heavily
disturbed post-frontier landscapes. Plausibly, hunters living near urban centers are
exerting impacts on game populations across a much broader area, if they are using the
well-developed road network - characteristic of post-frontier regions - to travel far and
target game in more remote areas. In any case, our results indicate that hunting pressure
is unlikely to decrease with urbanization (Parry et al. 2010b, Wilkie et al. 2011), and
that the rapid agricultural expansion occurring in many areas of Amazonia, associated
with increased in-migration to cities, may not result in reduced pressure on game
species in more preserved areas. While people from remote, forested areas are likely to
be the most dependent on bushmeat for subsistence and thus the most vulnerable to law-
enforcement policies on hunting, people living near urban centers might be the actors
contributing the most to bushmeat hunting, since the probability of hunting was higher
near urban centers, where human population density is also higher.
We have presented strong evidence that large-scale factors are important
determinants of bushmeat consumption and hunting in heterogeneous post-frontier
regions. These factors should therefore be considered when developing strategies and
policies to conserve biodiversity and maintain food security within these regions. In

31
particular, it is important to ensure that the food security and livelihoods of forest-
dependent peoples in remote areas are not compromised by incursions from hunters
from peri-urban areas, as was frequently reported by interviewees in this study.
Acknowledgments
We thank K.S.Gonçalves, A.E.M. Ferreira, C.D.F. Costa, A. Alves and A. Gomes for
helping data collection, S. Nunes and J.V. Siqueira for mapping forest cover, and all the
collaborating landowners and workers unions of Santarém and Belterra for their
support. We are also grateful to the following for financial support: INCT –
Biodiversidade e Uso da Terra na Amazônia (CNPq 574008/2008-0), Embrapa (SEG:
02.08.06.005.00), the UK government Darwin Initiative (17-023), The Nature
Conservancy, NERC (NE/F01614X/1 and NE/G000816/1) and FAPESP (2011/19108-
0). P.C.T. had doctoral scholarships from CAPES and FAPESP (2001/19606-0) and
R.P. a research fellowship from CNPq (306715/2011-2) during the development of this
work. This is publication number XX from the Sustainable Amazon Network series
(www.redeamazoniasustentavel.org).
References
Andrén, H. (1994) Effects of habitat fragmentation on birds and mammals in landscapes
with different proportions of suitable habitat: a review. Oikos, 71, 355-366.
Angelsen, A., Jagger, P., Babigumira, R., Belcher, B., Hogarth, N. J., Bauch, S., Borner,
J., Smith-Hall, C., & Wunder, S. (2014) Environmental income and rural

32
livelihoods: a global-comparative analysis. World Development,
http://dx.doi.org/10.1016/j.worlddev.2014.03.006.
Bates, D., Maechler, M., and Bolker, B. (2011) Lme4: Linear mixed-effects models
using S4 classes. R package version 0.999375-42. http://CRAN.R
project.org/package=lme4
Behrens, C. A. (1992) Labor specialization and the formation of markets for food in a
Shipibo subsistence economy. Human Ecology, 20, 435-462.
Brashares, J. S., Golden C. D., Weinbaum K. Z., Barret C. B., & Okello G. V. (2011)
Economic and geographic drivers of wildlife consumption in rural Africa.
Proceedings of the National Academy of Sciences of the United States of
America, 108, 13931–13936.
Burnhan, K. P., & Anderson, D. (2002) Model selection and multi-model inference: a
practical information-theoretic approach. New York: Springer-Verlag. 488 p.
Castro, E., Monteiro, R., & Castro, C. P. (2004) Dinâmica de atores, uso da terra e
desmatamento na rodovia Cuiabá-Santarém. Paper do NAEA, 179. Available:
http://www.ufpa.br/naea/gerencia/ler_publicacao.php?id=247. Accessed 15
December 2012.
Chaves Baía Júnior, P., Guimarães, D. A., & Le Pendu, Y. (2010) Non-legalized
commerce in game meat in the Brazilian Amazon: a case study. Revista
Biología Tropical, 58, 1079-1088.
D’Antona, A. O., VanWey, L. K., & Hayashi, C. M. (2006) Property size and land
cover change in the Brazilian Amazon. Population and Environment, 27, 373–
396.

33
de Merode, E., Homewood, K., & Cowlishaw, G. (2004) The value of bushmeat and
other wild foods to rural households living in extreme poverty in Democratic
Republic of Congo. Biological Conservation, 118, 573–581.
Espinosa, M. C. (2009) What has globalization to do with wildlife use in the remote
Amazon? Exploring the links between macroeconomic changes, markets and
community entitlements. Journal of Developing Societies, 24, 489-521.
Fa, J. E., Albrechtsen, L., Johnson, P. J., & Macdonald, D. W. (2009) Linkages between
household wealth, bushmeat and other animal protein consumption are not
invariant: evidence from Rio Muni, Equatorial Guinea. Animal Conservation,
12, 599-610.
Fearnside, P. M. (2005) Deforestation in Brazilian Amazonia: history, rates and
consequences. Conservation Biology, 19, 680-688.
Foerster, S., Wilkie, D. S., Morelli, G. A., Demmer, J., Starkey, M., Telfer, P., Steil, M.
& Lewbel, A. (2012) Correlates of bushmeat hunting among remote rural
households in Gabon, Central Africa. Conservation Biology, 26, 335–344.
Gardner, T., et al. (2013) A social and ecological assessment of tropical land-uses at
multiple scales: the Sustainable Amazon Network. Philosophical Transactions of
the Royal Society B Biological Sciences, 368, 20120166.
Godoy, R., Undurraga, E. A., Wilkie, D., Reyes-García, V., Huanca, T., Leonard, W.
R., NcDade, T., Tanner, S., Vadez, V., & TAPS Bolivia Study Team. (2010) The
effect of wealth and real income on wildlife consumption among native
Amazonians in Bolivia: estimates of annual trends with longitudinal household
data (2002–2006). Animal Conservation, 13, 265–274.
Instituto Brasileiro de Geografia e Estatística (IBGE) (2010) Censo Demográfico 2010.
IBGE, Rio de Janeiro, RJ.

34
Instituto Brasileiro de Geografia e Estatística (IBGE) (2013) Cidades. IBGE, Rio de
Janeiro, RJ. Available from
http://www.cidades.ibge.gov.br/xtras/perfil.php?lang=&codmun=150475&searc
h=par|mojui-dos-campos (accessed January 2014).
Jorge, M. L. S. P., Galetti, M., Ribeiro, M. C., & Ferraz, K. M. P. M. B. (2013) Mammal
defaunation as surrogate of trophic cascades in a biodiversity hotspot. Biological
Conservation, 163, 49-57.
Ling, S., & Milner-Gulland, E. J. (2006) Assessment of the sustainability of bushmeat
hunting based on dynamic bioeconomic models. Conservation Biology, 20,
1294–1299.
Mgawe, P., Mulder, M. B., Caro, T., Martin, A., & Kiffner, C. (2012) Factors affecting
bushmeat consumption in the Katavi-Rukwa ecosystem of Tanzania. Tropical
Conservation Science, 5, 446-462.
Michalski, F., & Peres, C. A. (2007) Disturbance-mediated mammal persistence and
abundance-area relationships in Amazonian forest fragments. Conservation
Biology, 21, 1626-1640.
Milner-Gulland E. J., Bennet, E. L., & the SCB 2002 Annual Meeting Wild Meat Group
(2003) Wild meat: the bigger picture. Trends in Ecology and Evolution, 18, 351-
357.
Moran, E. F. (1993) Deforestation and land use in the Brazilian Amazon. Human
Ecology, 21, 1-21.
Nasi, R., Taber, A., & van Vliet, N. (2011) Empty forests, empty stomachs? Bushmeat
and livelihoods in the Congo and Amazon basins. International Forestry Review,
13, 355-368.

35
Nepstad, D., Stickler, C. M., & Almeida, O. T. (2006) Globalization of the Amazon soy
and beef industries: opportunities for conservation. Conservation Biology, 20,
1595–1603.
Nuno , A., Bunnefeld, N., Naiman, L. C., & Milner-Gulland, E. J. (2013) A novel
approach to assessing the prevalence and drivers of illegal bushmeat hunting in
the Serengeti. Conservation Biology, 27, 1355-1365.
Nyahongo, J. W., Holmern, T., Kaltenborn, B. P., & Roskaft, E. (2009) Spatial and
temporal variation in meat and fish consumption among people in the western
Serengeti, Tanzania: the importance of migratory herbivores. Oryx, 43, 258-266.
Pangau-Adams, M., Noske, R., & Muehlenberg, M. (2012) Wildmeat or bushmeat?
Subsistence hunting and commercial harvesting in Papua (West New Guinea),
Indonesia. Human Ecology, 40, 611–621.
Parry, L., Barlow, J., & Peres, C. A. (2009) Allocation of hunting effort by Amazonian
smallholders: implications for conserving wildlife in mixed-use landscapes.
Biological Conservation, 142, 1777-1786.
Parry, L., Barlow, J., & Peres, C. A. (2009) Hunting for sustainability in tropical
secondary forests. Conservation Biology, 23, 1270-1280.
Parry, L., Day, B., Amaral, S., & Peres, C. A. (2010a). Drivers of rural exodus from
Amazonian headwaters. Population and Environment, 32, 137-176.
Parry, L., Peres, C. A., Day, B., & Amaral, S. (2010b) Rural–urban migration brings
conservation threats and opportunities to Amazonian watersheds. Conservation
Letters, 3, 251-259.
Peres, C. A., & Palacios, E. (2007) Basin-wide effects of game harvest on vertebrate
population densities in Amazonian forests: implications for animal-mediated
seed dispersal. Biotropica, 39, 304-315.

36
Poulsen, J. R., Clark, C. J., Mavah, G., & Elkan, P. W. (2009) Bushmeat supply and
consumption in a tropical logging concession in northern Congo. Conservation
Biology, 23, 1597-1608.
Redford, K. H., & Robinson J. G. (1987) The game of choice: patterns of indian and
colonist hunting in the Neotropics. American Anthropologist, 89, 650-667.
Rentsch, D., & Damon, A. (2013) Prices, poaching, and protein alternatives: an analysis
of bushmeat consumption around Serengeti National Park, Tanzania. Ecological
Economics, 91, 1-9.
SAGRI. Dados Agropecuários, Agricultura, Secretaria de Estado de Agricultura
(2013a). http://www.sagri.pa.gov.br/pagina/agricultura#. Acessed in january
2014.
SAGRI. Dados Agropecuários, Agricultura, Secretaria de Estado de Agricultura
(2013b). http://www.sagri.pa.gov.br/pagina/pecuaria. Acessed in january 2014.
Sampaio, R., Lima, A. P., Magnusson, W. E., & Peres, C. A. (2010) Long-term
persistence of midsized to large-bodied mammals in Amazonian landscapes
under varying contexts of forest cover. Biodiversity and Conservation, 19, 2421-
2439.
Schulte- Herbrüggen, B., Cowlishaw, G., Homewood, K., & Rowcliffe, J. M. (2013)
The importance of bushmeat in the livelihoods of West African cash-crop
farmers living in a faunally-depleted landscape. PlosOne, 8, e72807.
Stoian, D. (2005) Making the best of two worlds: rural and peri-urban livelihood
options sustained by nontimber forest products from the Bolivian Amazon.
World Development, 33, 1473-1490.

37
Stoner, K. E., Vulinec, K., Wright, S. J., & Peres, C. A. (2007) Hunting and plant
community dynamics in tropical forests: a synthesis and future directions.
Biotropica, 39, 385-392.
Suarez, E., Morales, M., Cueva, R., Bucheli, V. U., Zapata-Ríos, G., Toral, E., Torres,
J., Prado, W., & Olalla, J. V. (2009) Oil industry, wild meat trade and roads:
indirect effects of oil extraction activities in a protected area in north-eastern
Ecuador. Animal Conservation, 12, 364–373.
Urquiza-Haas, T., Peres, C. A., & Dolman, P. M. (2009) Regional scale effects of
human density and forest disturbance on large-bodied vertebrates throughout the
Yucatán Peninsula, Mexico. Biological Conservation, 142, 134-148.
Wilkie, D. S., & Godoy, R. A. (2001) Income and price elasticities of bushmeat demand
in lowland Amerindian societies. Conservation Biology, 15, 761-769.
Wilkie, D. S., Starkey, M., Abernethy, K., Effa, E. N., Telfer, P., & Godoy, R. (2005)
Role of prices and wealth in consumer demand for bushmeat in Gabon, Central
Africa. Conservation Biology, 19, 268-274.
Wilkie, D. S., Bennett, E., L., Peres, C. A., & Cunningham, A. A. (2011) The empty
forest revisited. Annals of the New York Academy of Science, 1223, 120-128.
Zenteno, M., Zuidema, P. A., Jong, W., & Boot, R. G. A. (2013) Livelihood strategies
and forest dependence: new insights from Bolivian forest communities. Forest
Policy and Economics, 26, 12-21.
Zuur, A. F., Ieno, E. N., Wlaker, N. J., Saveliev, A. A., & Smith, G. M. (2009) Mixed
effects models and extensions in ecology with R. New York: Springer Science
and Business Media. 574 p.

38
Table 1. Model selection results for bushmeat consumption and hunting as a function of large-scale drivers.
Models K logLik AICc ∆AICc ωi Coefficient 1 Coefficient2
Bus
hmea
t con
sum
ptio
n Remoteness from the urban center 3 -147.43 300.86 0.00 0.24 0.37(0.17) Forest cover at landscape-scale 3 -147.85 301.70 0.84 0.16 0.36(0.18)
Forest cover at landscape-scale + remoteness from the urban center 4 -146.85 301.69 0.89 0.15 0.22(0.20) 0.27(0.19)
Forest cover at property-scale + remoteness from the urban center 4 -146.88 301.75 0.95 0.15 0.19(0.18) 0.33(0.17)
Reference model 2 -149.41 302.81 1.91 0.09 Forest cover per household + remoteness from the urban center 4 -147.43 302.85 2.05 0.09 -0.02(0.20) 0.38(0.20)
Forest cover at property-scale 3 -148.49 302.98 2.12 0.08 0.26(0.19) Forest cover per household 3 -149.19 304.37 3.51 0.04 0.15(0.20)
Hun
ting
Forest cover at landscape-scale 3 -179.53 365.05 0.00 0.59 0.68(0.13)
Forest cover at landscape-scale + remoteness from the urban center 4 -179.11 366.21 1.22 0.32 0.84(0.22) -0.19(0.21)
Forest cover at property-scale + remoteness from the urban center 4 -180.71 369.41 4.41 0.07 0.48(0.14) 0.34(0.13)
Forest cover at property-scale 3 -183.80 373.60 8.55 0.01 0.45(0.16) Remoteness from the urban center 3 -184.22 374.43 9.38 0.01 0.43(0.21) Forest cover per household 3 -184.62 375.25 10.20 0.00 0.38(0.20) Reference model 2 -185.89 375.78 10.69 0.00 Forest cover per household + remoteness from the urban center 4 -184.21 376.43 11.43 0.00 -0.04(0.49) 0.47(0.51) Selected models (∆AICc<2) in bold. K: number of parameters, logLik: log-Likelihood of the model, AICc: AICc value, ∆AICc: difference in AICc value compared to the first-ranked model, ωi: Akaike weight, Coefficient 1: coefficient for the first variable in the model, Coefficient 2: coefficient for the second variable in the model when the model has two variables. In parenthesis: standard errors for the coefficients.
39
Figure 1. Expected relationships of large-scale drivers and bushmeat consumption
and hunting.

40
Figure 2. Land cover map of the study region, with percentage of households
where bushmeat was consumed and that had a hunter. (a) Location of the study
region in Amazonia. (b) Land-cover map of the study region indicating the location of
the centroids of the 16 sampled landscapes (circles). Size of circles is proportional to the
percentage of sampled households in a landscape where bushmeat was consumed
(white) and that had a hunter (black). Urban areas in dark grey, forests in grey,
converted land in light grey, and water bodies in white. (c) Distribution of households
(sampled – triangles, not-sampled - dots) within a landscape (solid black line), and the
indication of the three buffers for calculating forest cover for a given household. Solid
grey lines are roads.

41
Figure 3. Game species reported to be the last consumed across households where
bushmeat was consumed in the last year. For armadillos, dark grey indicates Dasypus
novemcinctus, grey Cabassous unicintus and light grey non-identified species. For
brocket deer, dark grey indicates Mazama gouazoubira, grey Mazama americana and
light grey non-identified species. For peccaries, dark grey indicates collared peccary
Pecari tajacu and grey non-identified species. For tortoises (Chelonoids spp.) and sloth,
the species were not identified, with two slot species from different genus occurring in
the region. For Tinamou (Tinamus sp.) and guan (Penelope sp.) species were not
identified. For the remaining game animals the species were Cuniculus paca (paca),
Dasyprocta leporina (agouti), Nasua nasua (coati), Hydrochoerus hydrochaeris
(capybara) and Tapirus terrestris (tapir).

42
Figure 4. Relationships between large-scale drivers and bushmeat consumption
and hunting. Probability of bushmeat consumption as a function of (a) the remoteness
from urban centers and (b) forest cover within a 10-km radius buffer, as predicted by the
first- and second-ranked models in Table 1. (c) Probability of hunting as a function of
forest cover within a 10-km radius buffer as predicted by the first-ranked model in Table
1. Bars represent the proportion of households where bushmeat was consumed in the
last 12 months, or that harbor at least one hunter.

43
Supporting Information
Table S1. Results of the model selection for identifying the best measures of each of
four large-scale predictors for bushmeat consumption and hunting.
Model logLik AICc wAICc Bushmeat consumption
Forest cover at the property scale
All forest types -148.5 303.1 0.54 Degraded and non-degraded primary forest -149.3 304.7 0.24 Non-degraded primary forest -149.4 304.9 0.22
Forest cover at the landscape scale
All forest types at 10-km -147.9 301.8 0.27 Non-degraded primary forest at 10-km -148.1 302.4 0.20 Degraded and non-degraded primary forest at 10-km -148.2 302.5 0.19 All forest types at 5-km -148.6 303.3 0.13 Degraded and non-degraded primary forest at 5-km -148.7 303.5 0.11 Non-degraded primary forest at 5-km -148.8 303.6 0.11
Forest cover per household at the landscape scale
All forest types at 10-km -149.2 304.5 0.18 Non-degraded primary forest at 10-km -149.2 304.5 0.18 Degraded and non-degraded primary forest at 10-km -149.2 304.5 0.18 All forest types at 5-km -149.4 304.9 0.15 Degraded and non-degraded primary forest at 5-km -149.4 304.9 0.15 Non-degraded primary forest at 5-km -149.4 304.9 0.15
Remoteness from urban center
Time spent to get to the most visited urban center in wet season -147.4 300.9 0.38 Time spent to get to the most visited urban center in dry season -147.8 301.6 0.27 Largest urban center -148.3 302.8 0.15 Most visited urban center -148.7 303.5 0.11 Nearest urban center -148.8 303.6 0.10
Hunting
Forest cover at the property scale
Total primary forest -183.8 373.7 0.57 Non-degraded primary forest -184.5 375.1 0.29 All forest types -185.2 376.5 0.14
Forest cover at the landscape scale
All forest types at 10-km -179.6 365.3 0.35 All forest types at 5-km -180.1 366.3 0.20 Non-degraded primary forest at 10-km -180.3 366.7 0.16 Degraded and non-degraded primary forest at 10-km -180.5 367.1 0.13 Non-degraded primary forest at 5-km -181.0 368.0 0.08 Degraded and non-degraded primary forest at 5-km -181.0 368.1 0.08
Forest cover per household at the
All forest types at 10-km -184.6 375.4 0.20 Non-degraded primary forest at 10-km -184.7 375.4 0.19

44
landscape scale Degraded and non-degradedprimary forest at 10-km -184.7 375.6 0.18 Non-degraded primary forest at 5-km -184.9 376.0 0.14 All forest types at 5-km -185.0 376.0 0.14 Degraded and non-degradedprimary forest at 5-km -185.0 376.0 0.14
Remoteness from urban center
Largest urban center -184.2 374.5 0.47 Nearest urban center -185.1 376.3 0.19 Most visited urban center -185.5 377.0 0.13 Time spent to get to the most visited urban center in wet season -185.7 377.6 0.10 Time spent to get to the most visited urban center in dry season -185.8 377.7 0.10

45
Capítulo 2
Interactions between economic, cultural and environmental drivers of
hunting and bushmeat consumption in the Amazon
Abstract
Identifying economic drivers of hunting and bushmeat consumption is essential for
developing coherent strategies that at the same time produce positive outcomes for
poverty alleviation, sustainable resource use and biodiversity conservation. However,
the findings of empirical assessments have been inconsistent, possibly due to
interactions between economic, cultural and environmental drivers. We investigated
hunting and bushmeat consumption in 240 households across 20 landscapes in a
heterogeneous region in eastern Amazonia, addressing three inter-related questions: (i)
Which of the three types of drivers (economic, cultural and environmental) and (ii)
which indicator among each of them are more strongly associated with hunting and
bushmeat consumption?; and (ii) Do the effects of economic variables depend on
cultural and environmental factors? We found that all three types of factors are needed
to understand hunting. In contrast, economic or cultural factors explain bushmeat
consumption, even without considering environmental drivers. Moreover, economic-
environmental interactions were strong for hunting, while less important for bushmeat
consumption. Hunting and bushmeat consumption increased with monetary income near
urban centers and/or in less forested areas, but decreased with monetary income in

46
remote and/or more forested areas. Importantly, reliance on subsistence activities and
being from the Amazon had strong and positive effects on both hunting and bushmeat
consumption. We show that bushmeat can be a different type of economic good in
different environmental contexts - a normal good close to urban contexts but an inferior
good in more remote and forested areas. Win-win solutions for both poverty alleviation
and biodiversity conservation thus depend on the environmental context. Consequently,
poverty reduction is important also for conserving game species in more remote and
forested areas, whereas economic development should be accompanied by stricter forms
of hunting control in deforested areas close to urban centers.
Keywords: animal protein, deforestation, game availability, livelihoods, monetary
income, non-monetary income, poverty, urbanization, wealth, wild meat

47
Introduction
The importance of different economic factors in driving bushmeat consumption has
been widely discussed in the literature (e.g. Wilkie & Godoy 2001, Godoy et al. 2010,
Foerster et al. 2012). Identifying these factors improves our understanding of the effects
of market expansion, market integration, development projects and cash transfer
programs on the interplay between poverty alleviation, livelihood strategies, resource
use and biodiversity conservation (Milner-Gulland et al. 2003, Kumpel et al. 2010,
Brashares et al. 2011). Because some recommendations for reducing hunting and
bushmeat consumption focus on promoting economic development (e.g. investments in
agriculture – Milner-Gulland et al. 2003), it is crucial to determine whether poverty
alleviation and wealth creation inadvertently increase hunting and bushmeat
consumption (Damania et al. 2005).
Competing hypotheses that seek economic explanations for wildlife
consumption make divergent predictions (Milner-Gulland et al. 2003). On the one hand,
when bushmeat is considered an inferior good, consumption should be driven by
poverty and therefore poorer, and typically rural households, should consume more
bushmeat than richer households because it is a cheaper and more accessible source of
protein (de Merode et al. 2004, Wilkie et al. 2005, Fa et al. 2009, Godoy et al. 2010).
On the other hand, when bushmeat is a normal good wealth would lead to greater
consumption (East et al. 2005, Wilkie et al. 2005, Fa et al. 2009, Godoy et al, 2010).
Although hunting may be influenced by factors other than the demand for bushmeat in
the household, such as the available time and resources for hunting and economic
opportunities in trading bushmeat, these economic hypotheses on bushmeat
consumption should also affect hunting. When bushmeat is an inferior good, poorer

48
households should be more engaged in hunting (Nielsen 2006), whereas when bushmeat
is a normal good, increases in income and asset-wealth should lead to higher hunting
activity (Damania et al. 2005).
Indeed empirical assessments of economic drivers of bushmeat consumption and
hunting commonly resulted in contrasting conclusions. Most studies address asset-
wealth and monetary income and disagree over which is the most important economic
driver and also the direction of its relationship with hunting and consumption (e.g.
Wilkie & Godoy 2001, Albrechtsen et al. 2006, Fa et al. 2009, Godoy et al. 2010).
Some authors suggest that these contradictions result from environmental (ecological
and geographical contexts) (e.g., Brashares et al. 2011, Foerster et al. 2012) and cultural
differences among studies (East et al. 2005, Mgawe et al. 2012), which would interact
with economic drivers.
Geographical factors, such as the distance to urban centers, affect the availability
of alternative sources of protein so that in remote areas bushmeat may be an inferior
good replaced when other types of meat become available or when income or asset-
wealth rises. Indeed Brashares and colleagues (2011) found that in more remote
contexts, poorer households consume more bushmeat than wealthier households. In
contrast, they found that near urban centers, wealth increased bushmeat consumption,
indicating that bushmeat is a normal good close to urban contexts. More remote
locations are more likely to maintain large tracts of primary forest, and therefore not
only the availability of alternative sources of protein should be lower but also the
abundance of many game species should be higher. Remote areas with high forest cover
should therefore offer greater net benefits of hunting and bushmeat consumption. Both
environmental factors – distance to urban centers and habitat cover - should thus

49
influence the net benefits of hunting and consuming bushmeat, influencing the effect of
economic drivers.
Cultural differences have received less attention by conservation scientists but
could also alter the effects of economic drivers of hunting and bushmeat consumption.
For instance, Mgawe and collegues (2012) found that bushmeat consumption was more
likely in wealthier than in poorer indigenous households, whereas the opposite pattern
was observed among in-migrant households. Interaction between cultural and economic
factors may result from culturally-determined taste preferences among ethnic groups
(Njiforti 1996, Schenck et al. 2006) or simply food habits (Mbete et al. 2011). Higher
income or asset-wealth would thus lead to more bushmeat consumption only among
those subgroups preferring bushmeat over other types of meat (East et al. 2005).
Recent studies on the effects of economic drivers on bushmeat consumption and/
or hunting have incorporated ecological and geographical variables (herein
environmental variables) into their research design (e.g. Brashares et al. 2011, Foester et
al. 2012, Mgawe et al. 2012). However, only Brashares and colleagues (2011) explicitly
investigated the interactions between environmental and economic factors by addressing
the effects of wealth depending on the distance to urban centers and the proximity to the
nearest consistent source of bushmeat (reported by hunters). Moreover, the available
evidence concerns mainly bushmeat consumption rather than hunting with examples
mainly from central and West Africa, where markets for bushmeat are common and
large. In addition, although studies have found differences in hunting and consumption
patterns among different cultural groups, and an interaction between origin and wealth
has been suggested (Mgawe et al. 2012), this interaction has not yet been tested.

50
In this paper we seek to advance current understanding on the importance of,
and interactions between economic, cultural and environmental drivers of bushmeat
consumption and hunting. Specifically, we examine whether the effects of economic
factors are dependent on cultural and environmental contexts. To do so, we conducted
this study in a recent post-frontier region in eastern Brazilian Amazonia, a former
agricultural frontier where deforestation has been consolidated. Following agricultural
development, the region now has a gradient of current forest cover correlated with
distance from the main city, Santarem. In recent decades of agricultural transition, the
study region has received different migratory waves from all Brazilian regions,
including in-migrants with different economic and cultural backgrounds (Castro et al.
2004, Nepstad et al. 2006). These characteristics make the region particularly
appropriate to investigate the interactions of cultural and environmental factors with
economic drivers. By surveying 240 households distributed in 20 7,850 ha landscapes
across a rural region of approximately 1 million ha, we addressed three inter-related
questions: (i) Which of the three types of drivers (economic, cultural and
environmental) and (ii) which indicators among economic, cultural and environmental
drivers, are more strongly associated with hunting and bushmeat consumption?; and (ii)
Do the effects of economic variables on hunting and bushmeat consumption depend on
environmental and cultural factors?
Drawing on economic theory and previous empirical studies, we expect that both
cultural and environmental factors need to be considered together with economic drivers
to understand the patterns of hunting and bushmeat consumption, and that there are
strong interactions between both factors and economic drivers. In more remote and
forested areas, wealth (whether assets or monetary income) should decrease the
likelihood of hunting and bushmeat consumption, since both have higher net benefits in

51
those areas given the lower access to alternatives and higher game availability. In less
remote and less forested areas, there is easier access to alternative sources of animal
protein, and higher costs of hunting due to lower availability of game, therefore wealth
should increase the likelihood of hunting and bushmeat consumption. The effects of
wealth on hunting and bushmeat consumption may also differ in strength or direction
among people from the Amazon compared to in-migrants, due to differences in
culturally-determined taste preferences.
Methods
Study region
Our study was carried out in rural areas of the municipalities of Santarém (78,790
inhabitants living in rural areas from a total population of 294,580), Belterra (6,852 of
16,318) and Mojuí dos Campos, a recently established municipality with no data on
rural population size (total of 15,232) (IBGE 2010). The study region encompasses
approximately 1 million ha in eastern Brazilian Amazonia and is bordered by the
Amazon, Tapajós and Curuá-Una Rivers (Fig. 1).
The region has been inhabited since pre-Colombian times, but since the end of
the nineteenth century has received many fluxes of migrants due to various economic
cycles. A wave of migration from northeast Brazil arrived in 1877 to work in the
forests, tapping rubber (Fonseca 1996). In the mid-twentieth century road construction
and government-led colonization and land reform initiatives promoted another influx of
low income in-migrants from the arid northeast, and also from the southern part of the
country (Castro et al. 2004, Nepstad et al. 2006). In the 1990’s, agricultural

52
mechanization began and cattle ranching expanded, with a new migratory wave of more
capitalized farmers (including soy-farmers) from states in South and Mid-west Brazil
(Nepstad et al. 2006). More recently, there have been changes in the spatial arrangement
of the rural population and land properties, with some areas under-going urbanization,
and the development of larger rural settlements, which generally enjoy better
infrastructure and public service provision (Côrtes 2012). Therefore, in the study region
there are both recent and long-term in-migrants from diverse regions of Brazil, and rural
properties that range from small-scale farms based on subsistence agriculture to large-
scale soy farms and cattle ranches, as well as more and less dense-populated
communities.
Government policies on colonization and the recent expansion of mechanized
agriculture and cattle ranching increased deforestation in the region (Nepstad et al.
2006). Yet, more than half of the study region is still covered by primary or secondary
forest, with larger tracks of continuous forest mostly further from urban centers (Fig. 1).
Sampling design
We used a hierarchical sampling design. We first selected 20 7,850-ha areas (5-km
radius circumferences), hereafter landscapes, that captured the variability in forest cover
(from 33 to 93%) and road distance from the largest city (Santarém, from 10 to 140 km)
within the study region. Within each landscape we randomly selected 12 households,
resulting in a total of 240 sampled households (Fig. 1).
For selecting households, we first mapped roads, rivers and households within
each landscape in the field and with help of GOOGLE EARTH images. We then
established in ArcGis 9.3 a set of points every 10 m in each stretch of road and river

53
with at least one household (a stretch was defined as the section between two vertices).
From those we randomly drew 12 points per landscape at least 400 m a part from each
other (the maximum possible distance in all landscapes) to ensure a good spatial
distribution of sampled households within landscapes. The selected households were
those nearest to the 12 points. When the same household was the nearest to more than
one of these points, the second point was excluded and another one was randomly
drawn. When one point was at the same distance to more than one household, we
randomly selected one of these household. We skipped individual households if the
household heads declined to take part in the study (n=3), or if after three visits no
resident was encountered (n=4).
Hunting and bushmeat consumption
We conducted an interview-based survey, with household heads (when possible both
heads were interviewed) between July and November 2013. The survey was coordinated
by P.C.T and conducted together with a team of three trained assistants, two of them
from the region. To estimate the dependent variables, we asked (1) if any household
member had gone hunting in the last 30 days and (2) if bushmeat was consumed in the
household in the last 15 days. We reduced the recall period of bushmeat consumption to
15 days because it was more frequent than hunting and the respondents would have
difficulties in answering with accuracy for the previous 30 days.
Economic and cultural drivers
The data on economic and cultural variables were collected through the same interview-
based survey. The economic variables included in this study were per capita monetary
income, reliance on non-monetary income (as a proportion of total income) in the

54
household and per capita asset-wealth; while the cultural variable was region of origin
of the household head. Although not frequently considered in studies about the effects
of economic variables on bushmeat consumption and hunting, the reliance on non-
monetary income in the household was quantified as a proxy of how much the
household economy is dependent on subsistence rather than on commercial activities
and wage labor.
To measure monetary income, we asked about all the monetary earnings in the
household in the previous 30 days, which included wage labor, sales of goods
(agricultural, non-timber forest products and any other products), rents, remittances,
pensions and cash transfer programs). We then divided the total monetary income by
the total number of household residents to estimate monthly per capita monetary
income, the variable used in the analyses.
To estimate the reliance on non-monetary income, we summed the monetary
value of all own-produced goods, extracted forest products and gifts received, which
were consumed by the household members in the 30 days prior to the interview. The
value for each product was the commercial value each respondent declared (own-
reported values). When the respondent was unable to inform the commercial value, we
adopted the mean value declared to the same good by other respondents living in the
same landscape or in the closest landscape. When no one was able to attribute a
commercial value to the good, as frequently occurs with untraded forest products, we
assigned a value based on the closest substitute which had a commercial value
(Cavendish 2002). We then summed the monetary and non-monetary income to
calculate the total income, and then divided the non-monetary income by the total
income to get the reliance on non-monetary income in each household.

55
To estimate asset-wealth, we calculated the monetary value of 51 assets (ranging
from pans to vehicles), including also livestock owned by all people in the household.
The monetary value of the assets was accessed in markets in the largest city (Santarém),
where most people purchase their goods. In the case of livestock, however, we relied on
the values reported by interviewees. After summing the total value of asset-wealth, we
divided it by the total number of household members to get a per capita estimate, which
was then adopted in the analyses. All economic variables were measured in reais (the
Brazilian currency), with a conversion rate at the time of 1 real = 0.45 US dollars.
To estimate the variable “origin”, we asked where the male head of the
household was born (state and municipality) and then considered if he was born in the
Amazon, following the classification by the Brazilian Ministry of Environmental
(MMA 2006). We considered the male head because only men were responsible for
hunting in the region. Households were classified as having an Amazonian origin or a
non-Amazonian origin.
Environmental drivers
The environmental variables considered where forest cover and distance to urban center.
Forest cover was measured as a proxy of game availability and was the amount of total
forest cover (in km2), i.e. non-degraded and degraded primary plus secondary forest
older than 10 years, at 10-km radius buffer (31,400 ha) around each household location
of residence. We considered a large-scale measure of forest cover because local species
persistence and abundance is known to depend on the wider landscape context (Andrén
1994). Moreover, previous work showed that a 10-km buffer was the best scale, and
total forest was the best measure, to explain the variation in hunting and bushmeat
consumption in the study region (Chapter 1). Yet, we also run the analyses considering

56
only non-degraded primary forest and total primary forest (degraded and non-degraded)
and the results did not change. We calculated the cover of each type of forest through a
time-series of Landsat images from 1990 to 2010, using a decision tree classification
procedure that separated primary and secondary forest, as well as primary forest with a
signal of degradation from past logging and fire (Gardner et al. 2013).
Distance to urban center was calculated as the road distances from each
household location of residence and the largest urban center (Santarém city) using
ArcGis 9.3. We considered the largest urban center because it is the most important
economic center, being much larger than the other two urban centers in the study region
and most people purchase their goods, sell their production and receive their pensions
and payments from cash transfer programs there.
Data analysis
To investigate the association between hunting and bushmeat consumption and the
economic, cultural and environmental factors we used generalized linear mixed-effects
models (GLMM) to account for the hierarchical nature of the sampling design, with
landscapes as random factors (Zuur et al. 2009). We run a set of candidate models for
each of the two dependent variables - hunting and bushmeat consumption. We modeled
the dependent variables as binary variables using logit as the link function. Hunting and
bushmeat consumption were equal to 1 when, respectively, at least one household
member have gone hunting in the previous 30 days and bushmeat was consumed at least
once in the previous 15 days in the household.
For each model selection we considered six independent variables (three
economic, one cultural and two environmental variables) as fixed factors. All fixed

57
factors, besides “origin” (which was a categorical variable), were standardized so that
each had a mean of zero and a standard deviation of one, a procedure adopted to help
improving convergence of the fitting algorithm (Zuur et al. 2009). Both sets of
candidate models contained: an intercept-only model for reference (that does not
include any fixed factors), simple models with each of the six independent variables on
their own as fixed factors, models with all possible combinations between the six
independent variables as fixed factors, without accounting for interactions between
them, and all possible combination between the six independent variables with two-way
interactions between the economic variables and either cultural or environmental
variables. Only the two environmental variables were strongly correlated (r = 0.89; p <
0.01) as expected (remote areas are also more forested); the remaining pairwise
correlations between the six independent variables were small, with the correlation
between monetary income and asset-wealth being the highest (r = 0.33; p < 0.01) and
the remaining very low (r < 0.15; p > 0.04).
Alternative models in each set were compared using the difference in their AICc
values in relation to the first-ranked model (∆AICc) (Burnham & Anderson 2002). A
value of ∆AICc ≤ 2 indicates equally plausible models. All analyses were implemented
in R 3.0.3 (R Core Team 2014) using the lme4 package (Bates et al. 2011).
Results
Hunting was carried out at least once in the previous 30 days by members of nearly a
third (31%) of the households. Bushmeat had been consumed in 33% of the households
within the previous 15 days. In total, respondents declared 188 hunting events (mean =

58
2.5, SD = 1.6 across households where hunting was carried out), from which only 88
were successful (hunters caught at least one individual), and declared 208 meals
containing bushmeat (mean = 2.6, SD = 2.5 across households where bushmeat was
consumed). From those meals, in 45% of the cases bushmeat was hunted by a
household member and in the remaining 55% the bushmeat consumed was a gift. Paca
(Cuniculus paca) and nine-banded armadillo (Dasypus novemcinctus) were the most
frequently hunted and consumed species in the region (Fig. 2).
Hunting was strongly associated with four factors – monetary income, reliance
on non-monetary income, forest cover and origin of the household head, as all four
selected models contained these variables (Table 1). This indicates that all three types of
factors – economic, cultural and environmental- are needed to understand the variation
in hunting probability across the region. The interaction between monetary income and
forest cover was also important and included in all four selected models. It indicates that
hunting probability is positively associated with monetary income in less forested areas
but negatively associated with it in more forested areas (Fig. 3a). Moreover, in
households with a greater reliance on non-monetary income and with Amazonian origin
hunting was more likely.
There is some evidence that asset-wealth and distance to urban center may also
be associated with hunting after controlling for the effects of monetary income, reliance
on non-monetary income, forest cover and origin, as each was included in one of the
selected models (Table 1). Residents in less asset-wealthy households and in those
nearer to the urban center were more likely to hunt. Similarly, the interaction between
the reliance on non-monetary income and origin was included in one of the selected
models. This interaction indicates that hunting probability is positively associated with

59
reliance on non-monetary income among households with non-Amazonian origins,
whereas it is only slightly and negatively associated with reliance on non-monetary
income among households with Amazonian origin (Fig.3b).
In contrast to hunting, models containing only economic (one model) or cultural
(one model) factors, only cultural factors and environmental (two models), only
economic and cultural factors (three models), or the three types of factors together (11
models) were equally plausible to explain the variation in bushmeat consumption (Table
3). Moreover, only three of the 18 selected models included interactions, all of which
were between environmental (either distance to urban center or forest cover) and
economic variables (in all cases monetary income).
Origin, the only cultural factor considered, was the most important driver of
bushmeat consumption, being present in 17 of the 18 selected models, including the
simple model containing just this factor (Table 2). Households with Amazonian origin
were more likely to consume bushmeat (Fig. 4a), as also observed for hunting. The
reliance on non-monetary income was the most important economic variable, present in
12 selected models including the simple model with this variable alone (Table 2). In
households with a greater reliance on non-monetary income bushmeat consumption was
more likely (Fig. 4b), as also observed for hunting. However, monetary income and
asset-wealth were also included in seven and four of the selected models, respectively
(Table 2). In contrast to the observed for hunting, both variables had a negative
association with bushmeat consumption. Moreover, three of the seven selected models
containing monetary income included also the interaction of this variable with
environmental variables (Table 2). These interactions indicate that the probability of
bushmeat consumption was positively associated with monetary income in less forested

60
areas and near urban center (similar to the observed for hunting), whereas it was only
slightly and negatively associated with monetary income in more forested and remote
areas (Fig. 3c and 3d).
Differently from the observed for hunting, both distance to urban center and
forest cover were associated with bushmeat consumption, as eight and five selected
models contained these variables, respectively (Table 2). Bushmeat was more likely to
be consumed in more remote households and those located in more forested areas.
Discussion
Previous studies have not considered economic, cultural and environmental drivers
together for understanding hunting and bushmeat consumption. Yet we found that all
three types of drivers are necessary to understand variation in hunting patterns in our
Amazonian study region. In contrast economic or cultural factors explained bushmeat
consumption patterns, even without considering environmental drivers. Supporting our
hypotheses, we found strong evidence that economic and environmental factors interact
to determine hunting probability, while these economic-environmental interactions were
less important in explaining bushmeat consumption probability. The observed
environmental-economic interactions were congruent with our hypotheses, but were
much more drastic for hunting than for bushmeat consumption. For hunting, forest
cover was a more important environmental driver than distance to urban center, and
monetary income a more important economic driver than asset-wealth. Conversely, the
reliance on non-monetary income (a proxy for subsistence in the household economy)
and origin were major drivers for both hunting and bushmeat consumption. In contrast

61
to previous assertions (Mgawe et al. 2012), we did not find evidence of interactions
between cultural factors (origin) and commonly studied economic variables (economic
income and asset-wealth) for determining either bushmeat hunting or consumption.
We discuss next our findings on the drivers of hunting and bushmeat
consumption, as well as their implications for rural livelihoods and biodiversity
conservation.
Drivers of hunting
Our results indicate that two economic variables (monetary income and reliance on non-
monetary income), a cultural factor (origin) and an environmental factor (forest cover)
were major drivers of hunting probability. However, the economic variables interacted
with the environmental or the cultural factor.
The effect of monetary income on hunting probability depended on forest cover.
The proximity of game sources or forest cover as proxies of game availability has
already been associated with higher hunting rates (Brashares et al. 2011, Nuno et al.
2013, Chapter 1). Nevertheless, we found that in areas with low forest cover, and thus
presumably lower game availability, hunting probability increased with monetary
income, while it decreased with monetary income in more forested areas. This
interaction has not been suggested in the literature so far, as studies involving economic
factors and hunting patterns were carried out in more environmentally homogenous
contexts (e.g. Coomes et al. 2004, Nielsen 2006, Coad et al. 2010, Kümpel et al. 2010),
and those including both economic and environmental drivers focused mainly on
bushmeat consumption instead of hunting (Brashares et al. 2011, Foerster et al. 2012).
However, this result was as expected by our hypotheses and similar to studies that

62
focused on bushmeat consumption. In more forested areas bushmeat should be an
inferior good, so that members from poorer households would be more likely to hunt
than those from richer households. As the cost of hunting in more forested areas is low
(due to more game availability), the net benefits of hunting should be higher, increasing
hunting probability among poor households as they are be less able to afford other types
of meat due to economic constraint. In less forested areas, game should be less available
and thus hunting should have a higher cost, making bushmeat less affordable to poorer
households.
We also found that hunting was more likely in households that rely more on
subsistence and have an Amazonian origin. However, we found some evidence that this
positive effect of subsistence reliance on hunting might be observed only among people
with a non-Amazonian origin. Although there is no study that investigated the effects of
subsistence reliance on hunting or bushmeat consumption, our results add to the
evidence that households less involved in cash-income activities may depend on hunting
to acquire food (Loibooki et al. 2002, de Merode et al. 2004, Nielsen 2006, Kümpel et
al. 2010). Differences in geographic origin have also been found to influence hunting
patterns. For instance, Mgawe and colleagues (2012) found higher hunting offtake in
indigenous villages compared to in-migrants in Africa, where bushmeat was apparently
preferred by indigenous people compared to in-migrants. Our results suggest that either
people from the Amazon have better knowledge on the forest or have a stronger culture
of hunting than people from other parts of the country. Thus the probability of hunting
among in-migrants seems to be higher for those relying more on subsistence, i.e. in-
migrants may hunt more only for necessity, whereas people from the Amazon hunt
regardless of the level of subsistence reliance.

63
Finally, we found weaker evidence for negative associations between both
distance to urban center and asset-wealth with hunting, but only after controlling for
forest cover, origin, monetary income and reliance on non-monetary income. The
probability of hunting was higher in households nearer the urban center (see also
Chapter 1). Although some studies in Africa found the opposite relationship between
hunting and distance to urban centers, they did not control for other major drivers
(Loibooki et al. 2002, Coad et al. 2010). Our results are consistent with studies that
found that people living closer to major markets are often more engaged in commercial
bushmeat trade (Espinoza 2009, Pangau-Adams et al. 2012), which would bring higher
returns for hunters compared to more remote areas (Brashares et al. 2011). This
suggests that interviewees may not have reported bushmeat trade in our study because
bushmeat trade is illegal in Brazil. The probability of hunting was also lower among
wealthier households. Previous studies in rural Africa found incongruent effects of
asset-wealth on hunting patterns (Loibooki et al. 2002, Coad et al. 2013). We did not
find evidence that asset-wealth interacts with environmental or cultural factors to
determine hunting in the Amazon, but we have shown that monetary income is a more
important predictor of hunting patterns than asset-wealth in this region.
Drivers of bushmeat consumption
Our results indicate that economic and cultural factors alone are more important in
explaining bushmeat consumption than in explaining hunting, which seems much more
dependent on environmental factors. This may be due to the fact that in many
households where bushmeat was consumed it was not obtained through hunting, which
should be strongly dependent on game availability. Rather, they received bushmeat as a
gift in 55% of the consumption events, and bushmeat sharing is known to be related to
64
economic and cultural factors (Behrens 1992, Henrich et al. 2005, Gurven et al. 2008).
Moreover, although none of the interviewees reported the purchase of bushmeat many
people may disguise it because bushmeat trade is illegal in Brazil, as stated above. Part
of the bushmeat consumed in these events may have been purchased and this form of
acquiring meat is strongly determined by economic factors (Godoy et al. 2010,
Brashares et al. 2011). Thus the high percentage of consumption events that are not
associated with hunting may explain why bushmeat consumption is less dependent than
hunting on environmental factors.
On the other hand, although the reliance on non-monetary income, a proxy of
dependence on subsistence activities, and origin were extremely important for both
hunting and bushmeat consumption, for the later these two variables may explain
consumption patterns alone, irrespective of other economic or of environmental factors.
These major drivers are either not included in previous bushmeat studies (reliance on
subsistence) or less frequently so (origin). People from the Amazon were more likely to
consume bushmeat, perhaps because they prefer bushmeat over other types of meat. A
similar pattern was also found in a logging concession in rural Congo (Poulsen et al.
2009), where bushmeat was more frequent in meals of indigenous households than in
in-migrants and foreigners households. Moreover, in households with a greater reliance
on non-monetary income bushmeat consumption was more likely, consistent with the
idea that households less involved in cash-income activities may depend more on
bushmeat (Loibooki et al. 2002, de Merode et al. 2004, Nielsen 2006, Kümpel et al.
2010). There was, however, no evidence of interaction of these two factors, as we
observed for hunting, meaning that although people from the Amazon are more likely to
hunt irrespective of the level of subsistence reliance, similarly to in-migrants they also
are more likely to consume bushmeat when depending more on subsistence.

65
Although less important than certain economic and cultural variables, both
distance to urban center and forest cover were associated with bushmeat consumption,
regardless of the interactions with economic and cultural factors. Bushmeat was more
likely to be consumed in more remote households and those located in more forested
areas, suggesting that bushmeat is more important for household food security in these
contexts. Indeed, studies in Africa have shown that poor access to other types of meat
can drive bushmeat consumption (Brashares et al. 2011), which is also more common in
places close to game sources (Brashares et al. 2011, Foerster et al. 2012, Mgawe et al.
2012). Moreover, distance to urban center was more important than forest cover for
explaining bushmeat consumption, the same pattern we found in Chapter 1 with a
different data set. This can be related to people having less access to domestic meat
from markets, which can be more important in determining consumption than game
availability, since most bushmeat consumed was a gift instead of hunted.
We found, however, some evidence for the interaction between both
environmental factors and monetary income. The evidence for - and the strength of - the
interaction between monetary income and forest cover was weaker – and less drastic -
for bushmeat consumption than for hunting. This is probably related to the minor
importance of game availability to bushmeat consumption compared to hunting, as
stated above. However, although not strong, we found evidence for the interaction
between monetary income and distance to urban centers for bushmeat consumption,
which was not found for hunting. A similar interaction was also observed by Brashares
and colleagues (2011), who found that people from wealthier households consumed
more bushmeat in settlements nearer urban areas with the opposite pattern in more
isolated settlements. We observed a strong positive effect of monetary income on
bushmeat consumption in areas close to urban centers, and a weaker negative effect of

66
this variable on consumption in remote areas. The observed interaction is consistent
with our hypotheses and the results of Brashares and colleagues (2011) that bushmeat is
an inferior good in remote areas, but a normal good in areas close to urban centers. This
interaction can also explain previous findings in the literature (Apaza et al. 2002, Wilkie
et al. 2005, Godoy et al. 2010). Both Apaza and colleagues (2002) and Godoy and
colleagues (2010) found no association between income and bushmeat consumption,
which can be due to the fact that they sampled households in villages that differed in the
proximity to the market town.
Implications for conservation and rural livelihoods
Our study adds to the evidence that bushmeat hunting and consumption are associated
with a complex set of different factors and involve interactions between economic
variables and both cultural and environmental contexts. It can thus be difficult to find
general patterns of bushmeat hunting and consumption with economic variables
worldwide. Our results suggest that bushmeat can be a different type of good in
economic terms in different environmental contexts - a normal good in altered areas
close to urban centers but an inferior good in more remote and forested areas - and may
be also in different cultural contexts.
As rural populations face changes in their economic conditions through
integration of autarkic communities into markets, through government development
projects and cash transfer programs, it becomes important to understand how these
changes affect livelihood strategies, resource use and biodiversity conservation (Billé et
al. 2012). As for game species, improvements in economic conditions might actually
increase hunting and consumption in some scenarios (Damania et al. 2005). In that
sense, our results suggest that win-win solutions for both poverty alleviation and

67
biodiversity conservation depend on the environmental contexts and that improving
people’s economic conditions and the availability of alternative sources of meat may
help conservation in more remote and forested areas. However, in less forested areas
close to urban centers, economic improvement should be accompanied by stricter forms
of hunting control. Interestingly, for those that rely heavily on subsistence activities, the
increase in income from cash-generating activities might alleviate hunting pressure in
any context. Our results also suggest that strategies for poverty alleviation and
biodiversity conservation should also take into account differences in cultural contexts.
For communities where hunting is a culturally important activity and bushmeat is
preferred, simply increasing monetary income or the availability of alternative sources
of meat might not alleviate hunting pressure. In these cultural contexts, sustainable
hunting may be feasible and more effective for game species conservation in more
forested areas (Peres & Nascimento 2006), whereas hunting control and environmental
education are extremely important in less forested areas.
Acknowledgements
We thank P.E. de Moraes for assistance in data collection and the calculation of some
independent variables; P.C.R de Araújo and E.R. da Silva for assistance in data
collection; K.S. Gonçalves for assistance in mapping roads and households and piloting
the questionnaires; J.V. Siqueira for mapping forest cover; and all the collaborating
residents and representatives of the communities in Santarém, Mojuí dos Campos and
Belterra for their support. We are also grateful to FAPESP (2011/19108-0) for financial
support. P.C.T. had doctoral scholarships from CAPES and FAPESP (2001/19606-0)

68
and R.P. a research fellowship from CNPq (306715/2011-2) during the development of
this study.
References
Albrechtsen, L, Fa, J. E., Barry, B. & MacDonald, D. W. (2006) Contrasts in
availability and consumption of animal protein in Bioko Island, West Africa: the
role of bushmeat. Environmental Conservation, 32, 340-348.
Andrén, H. (1994) Effects of habitat fragmentation on birds and mammals in landscapes
with different proportions of suitable habitat: a review. Oikos, 71, 355-366.
Apaza, L., Wilkie, D., Byron, E., Huance, T., Leonard, W., Pérez, E., Reyes-Garcia, V.,
Valdez, V. & Godoy, R. (2002) Meat prices influence the consumption of
wildlife by the Tsimane’ Amerindians of Bolivia. Oryx 36, 1-7.
Bates, D., Maechler, M., and Bolker, B. (2011) Lme4: Linear mixed-effects models
using S4 classes.R package version 0.999375-42. http://CRAN.R
project.org/package=lme4
Behrens C.A. (1992) Labor specialization and the formation of markets for food in a
Shipibo subsistence economy. Human Ecology, 20, 435-462.
Billé, R., Lapeyre, R. &Pirard, R. (2012) Biodiversity conservation and poverty
alleviation: a way out of the deadlock? S.A.P.I.E.N.S, 5.1.URL :
http://sapiens.revues.org/1452
Brashares, J. S., Golden C. D., Weinbaum K. Z., Barret C. B., & Okello G. V. (2011)
Economic and geographic drivers of wildlife consumption in rural Africa.
Proceedings of the National Academy of Sciences of the United States of

69
America, 108, 13931–13936.
Burnhan, K. P., & Anderson, D. (2002) Model selection and multi-model inference: A
practical information-theoretic approach. New York: Springer-Verlag. 488 p.
Castro, E., Monteiro, R., & Castro, C. P. (2004) Dinâmica de atores, uso da terra e
desmatamento na rodovia Cuiabá-Santarém. Paper do NAEA, 179. Available:
http://www.ufpa.br/naea/gerencia/ler_publicacao.php?id=247. Accessed 15
December 2012.
Cavendish, W. (2002) Quantitative methods for estimating the economic value of
resource use to rural households. In: Campbell, B.M. & Luckert, M. K. (eds)
Uncovering the Hidden Harvest: valuation methods for woodland and forest
resources. Earthscan Publications, London.
Coad, L., Abernethy, K., Balmford, A.,Manica, A., Airey, L. & Milner-Gulland, E. J.
(2010) Distribution and use of income from bushmeat in a rural village, central
Gabon. Conservation Biology, 24, 1510-1518.
Coomes, O. T., Barham, B. L. & Takasaki, Y. (2004) Targeting conservation-
development initiatives in tropical forests: insights from analyses of rain forest
use and economic reliance among Amazonian peasants. Ecological Economics,
51, 47-64.
Côrtes, J. C. (2012) Mobilidade e redistribuição populacional em Santarém, Pará:
recente reconfiguração do meio rural na Amazônia. Masters dissertation in
demography. Universidade Estadual de Campinas, Campinas.
Damania, R., Milner-Gulland, E. J. & Crookes, D. J.(2005) A bioeconomic analysis of
bushmeat hunting. Proceedings of the Royal Society B Biological Sciences, 272,
259-266.
Espinosa, M. C. (2009) What has globalization to do with wildlife use in the remote

70
Amazon? Exploring the links between macroeconomic changes, markets and
community entitlements. Journal of Developing Societies, 24, 489-521.
de Merode, E., Homewood, K., & Cowlishaw, G. (2004) The value of bushmeat and
other wild foods to rural households living in extreme poverty in Democratic
Republic of Congo. Biological Conservation, 118, 573–581.
Fa, J. E., Albrechtsen, L., Johnson, P. J., & Macdonald, D. W. (2009) Linkages between
household wealth, bushmeat and other animal protein consumption are not
invariant: evidence from Rio Muni, Equatorial Guinea. Animal Conservation,
12, 599-610.
Foerster, S., Wilkie, D. S., Morelli, G. A., Demmer, J., Starkey, M., Telfer, P., Steil, M.
& Lewbel, A. (2012) Correlates of bushmeat hunting among remote rural
households in Gabon, Central Africa. Conservation Biology, 26, 335–344.
Fonseca, W. D. (1996) Santarém: momentos históricos, Editora Tiagão, Santarém,
Brazil.
Gardner, T., et al. (2013) A social and ecological assessment of tropical land-uses at
multiple scales: the Sustainable Amazon Network. Philosophical Transactions of
the Royal Society B Biological Sciences, 368, 20120166.
Godoy, R., Undurraga, E. A., Wilkie, D., Reyes-García, V., Huanca, T., Leonard, W.
R., NcDade, T., Tanner, S., Vadez, V., & TAPS Bolivia Study Team. (2010) The
effect of wealth and real income on wildlife consumption among native
Amazonians in Bolivia: estimates of annual trends with longitudinal household
data (2002–2006). Animal Conservation, 13, 265–274.
Gurven, M., Zanolini, A. & Schniter, E. (2008) Culture sometimes matters: Intra-
cultural variation in pro-social behavior among Tsimane Amerindians. Journal
of Economic Behavior & Organization 67, 587-607.

71
Henrich, J., et al. (2005) “Economic man” in cross-cultural perspective: Behavioral
experiments in 15 small-scale societies. Behavioral and Brain Sciences, 28, 795-
855.
Instituto Brasileiro de Geografia e Estatística (IBGE) (2010) Censo Demográfico 2010.
IBGE, Rio de Janeiro, RJ.
Kümpel, N.F., Milner-Gulland, E.J., Cowlishaw, G. & Rowcliffe, J.M. (2010)
Incentives for hunting: the role of bushmeat in the household economy in rural
Equatorial Guinea. Human Ecology 38, 251–264.
Loibooki, M., Hofer, H., Campbell, K. L. I. & East, M., L. (2002) Bushmeat hunting by
communities adjacent to the Serengeti National Park, Tanzania: the importance
of livestock ownership and alternative sources of protein and income.
Environmental Conservation, 29, 391-398.
Mbete, R. A., Banga-Mboko, H., Racey, P., Mfoukou-Ntsakala, A., Nganga, I.,
Vermeulen, C., Doucet, J., Hornick, J.& Leroy, P.(2011) Household bushmeat
consumption in Brazzaville, the Republic of the Congo. Tropical Conservation
Science, 4, 187-202.
Mgawe, P., Mulder, M. B., Caro, T., Martin, A., & Kiffner, C. (2012) Factors affecting
bushmeat consumption in the Katavi-Rukwa ecosystem of Tanzania. Tropical
Conservation Science, 5, 446-462.
Milner-Gulland, E.J., Bennet, E.L. & SCB 2002 Annual Meeting Wild Meat Group
(2003) Wild meat: the bigger picture. Trends in Ecology and Evolution 18, 351-
357.
Ministério do Meio Ambiente (MMA)(2006) Uso e cobertura da terra na Floresta
Amazônica. FUNCATE, São José dos Campos. Available:

72
http://www.mma.gov.br/estruturas/sbf_chm_rbbio/_arquivos/uso_e_cobertura_d
a_terra_na_floresta_amaznica.pdf.
Nepstad, D., Stickler, C. M., & Almeida, O. T. (2006) Globalization of the Amazon soy
and beef industries: opportunities for conservation. Conservation Biology, 20,
1595–1603.
Nielsen, M. R. (2006) Importance, cause and effect of bushmeat hunting in the
Udzungwa Mountains, Tanzania: Implications for community based wildlife
management. Biological Conservation 128, 509-516.
Njiforti, H. L. (1996) Preferences and present demand for bushmeat in north Cameroon:
some implications for wildlife conservation. Environmental Conservation, 23,
149-155.
Nuno, A., Bunnefeld, N., Naiman, L. C., & Milner-Gulland, E. J. (2013) A novel
approach to assessing the prevalence and drivers of illegal bushmeat hunting in
the Serengeti. Conservation Biology, 27, 1355-1365.
Pangau-Adams, M., Noske, R., & Muehlenberg, M. (2012) Wildmeat or bushmeat?
Subsistence hunting and commercial harvesting in Papua (West New Guinea),
Indonesia. Human Ecology, 40, 611–621.
Peres, C. A. & Nascimento, H. S. (2006) Impact of game hunting by the Kayapó of
south-eastern Amazonia: implications for wildlife conservation in tropical forest
indigenous reserves. Biodiversity and Conservation, 15, 2627-2653.
Poulsen, J. R., Clark, C. J., Mavah, G., & Elkan, P. W. (2009) Bushmeat supply and
consumption in a tropical logging concession in northern Congo. Conservation
Biology, 23, 1597-1608.
Redford, K.H. & Robinson, J.G. (1987) The Game of Choice: Patterns of Indian and
Colonist Hunting in the Neotropics. American Anthropologist 89, 650-667.

73
Rentsch, D., & Damon, A. (2013) Prices, poaching, and protein alternatives: An
analysis of bushmeat consumption around Serengeti National Park, Tanzania.
Ecological Economics, 91, 1-9.
Schenck, M., Effa, E.N., Starkey, M., Wilkie, D., Abernethy, K., Telfer, P., Godoy, R.
& Treves, A. (2006) Why people eat bushmeat: results from two-choice, taste
tests in Gabon, Central Africa. Human Ecology, 34, 433-445.
Schulte- Herbrüggen, B., Cowlishaw, G., Homewood, K., & Rowcliffe, J. M. (2013)
The importance of bushmeat in the livelihoods of West African cash-crop
farmers living in a faunally-depleted landscape. PlosOne, 8, e72807.
Wilkie D.S & Godoy R.A. (2001) Meat prices influence the consumption of wildlife by
the Tsimane’ Amerindians of Bolivia. Conservation Biology 15, 761-769.
Wilkie, D. S., Starkey, M., Abernethy, K., Effa, E. N., Telfer, P., & Godoy, R. (2005)
Role of prices and wealth in consumer demand for bushmeat in Gabon, Central
Africa. Conservation Biology, 19, 268-274.
Zuur, A. F., Ieno, E. N., Wlaker, N. J., Saveliev, A. A., & Smith, G. M. (2009) Mixed
Effects Models and Extensions in Ecology with R. New York: Springer Science
and Business Media. 574 p.

74
Table 1. Model selection results for hunting probability among 240 rural households in the study region. All candidate models are GLMM
models with landscapes as a random factor. Only selected models with weight ∆AICc≤2 and the intercept-only model for reference are shown.
Model description K logLik AICc ∆AICc ωi Inc Prop Wea For Urb Orig Inc:For Prop:Orig
Inc+Prop+For+Orig+Inc:For 7 -130.39 275.26 0.00 0.06 -0.40 0.39 0.30 1.23 -1.20
Inc+Prop+Wea+For+Orig+Inc:For 8 -129.91 276.44 1.18 0.04 -0.08 0.38 -0.30 0.28 1.17 -1.34
Inc+Prop+For+Urb+Orig+Inc:For 8 -130.25 277.13 1.86 0.03 -0.42 0.39 0.45 -0.17 1.20 -1.21 Inc+Prop+For+Orig+Inc:For+Prop:Orig 8 -130.28 277.19 1.93 0.02 -0.39 0.48 0.30 1.24 -1.20 -0.14
Intercept-onlymodel 2 -148.26 300.58 25.31 0.00
Inc: per capita monetary income; Prop: reliance on non-monetary income; Wea: per capita asset-wealth; For: forest cover; Urb: distance to urban
center; Orig: origin; K: number of parameters; logLik: log-Likelihood of the model; AICc: AICc value; ∆AICc: difference in AICc value compared to the first-ranked model; ωi: Akaike weight; coefficients for each variable of the model.

75
Table 2. Model selection results for bushmeat consumption probability among 240 rural households in the study region. All candidate
models are GLMM models with landscapes as a random factor. Only selected models with weight ∆AICc≤ 2 and the intercept-only model for
reference are shown.
Modeldescription K logLik AICc ∆AICc ωi Inc Prop Wea For Urb Orig Inc:For Inc:Urb
Prop+Orig 4 -144.04 296.24 0.00 0.03 0.26 0.64 Prop+Urb+Orig 5 -143.06 296.38 0.13 0.03 0.24 0.34 0.72 Urb+Orig 4 -144.31 296.80 0.56 0.03 0.38 0.77 Prop+For+Orig 5 -143.34 296.94 0.70 0.02 0.24 0.29 0.69 Inc+Prop+Orig 5 -143.45 297.15 0.91 0.02 0.19 0.29 0.71 Inc+Prop+Urb+Orig+Inc:Urb 7 -141.36 297.20 0.96 0.02 0.23 0.25 0.34 0.80 -0.33 Orig 3 -145.58 297.27 1.03 0.02 0.70 Prop+Wea+Orig 5 -143.53 297.32 1.08 0.02 0.28 0.17 0.73 Inc+Prop+Urb+Orig 6 -142.49 297.35 1.10 0.02 0.18 0.26 0.35 0.78 For+Orig 4 -144.62 297.41 1.17 0.02 0.33 0.75 Prop+Wea+Urb+Orig 6 -142.57 297.50 1.26 0.02 0.25 0.16 0.35 0.81 Inc+Prop+For+Orig+Inc:For 7 -141.52 297.53 1.28 0.02 0.26 0.26 0.27 0.76 -0.37 Prop 3 -145.81 297.71 1.47 0.02 0.29 Inc+Urb+Orig+Inc:Urb 6 -142.75 297.85 1.61 0.01 0.19 0.37 0.84 -0.34 Inc+Prop+For+Orig 6 -142.78 297.92 1.67 0.01 0.18 0.26 0.29 0.76 Prop+Wea+For+Orig 6 -142.88 298.12 1.88 0.01 0.26 0.16 0.28 0.78 Inc+Urb+Orig 5 -143.94 298.13 1.89 0.01 0.14 0.39 0.83 Wea+Urb+Orig 5 -143.97 298.20 1.96 0.01 0.13 0.39 0.85 Intercept-onlymodel 2 -147.8 299.6 3.31 0.00
Inc: per capita monetary income; Prop: reliance on non-monetary income; Wea: per capita asset-wealth; For: forest cover; Urb: distance to urban
center; Orig: origin; K: number of parameters; logLik: log-Likelihood of the model; AICc: AICc value; ∆AICc: difference in AICc value compared to the first-ranked model; ωi: Akaike weight; coefficients for each variable of the model.

76
Figure 1. Land cover map of the study region. Location of the study region in South
America and land-cover map of the study region, indicating the location of the 20 study
landscapes (circumferences) and the 240 sampled households (black dots). Urban areas
in dark grey, forests in grey, converted land in light grey, and water bodies in white.

77
Figure 2. Species hunted and consumed in the study region. Percentage of hunting
(n=88) and meal (n=208) events where the species was hunted or consumed. Totals sum
to more than 100% because more than one species could have been hunted or consumed
in the same event.

78
Figure 3. Relationship between economic factors and hunting or consumption in
different environmental and cultural contexts. (a) Relationship between per capita
monetary income and hunting probability in contexts of low and high forest cover as
predicted by the first-ranked model in Table 1. (b) Relationship between the reliance on
non-monetary income and hunting probability for households where the residents have
an Amazonian and non-amazonian origin as predicted by the forth-ranked model in
Table 1. (c) Relationship between per capita monetary income and bushmeat
consumption probability in contexts of low and high forest cover as predicted by the
12th-ranked model, and (d) in contexts of proximity and remoteness from the urban
center as predicted by the sixth-ranked model in Table 2. Data for model selection were
standardized and so the values presented in the x-axis are standardized values.

79
Figure 4. Relationship of origin and the reliance on non-monetary income with
bushmeat consumption. (a) Bushmeat consumption probability in households where
residents have different origins, as predicted by the simple selected model in Table 2
(dots). Bars represent the observed proportion of households where bushmeat was
consumed in the last 15 days. (b) Bushmeat consumption probability as a function of the
reliance on non-monetary income as predicted by the simple model selected in Table 2.
Bars represent the observed proportion of households where bushmeat was consumed in
the last 15 days for the quintiles of reliance on non-monetary income.

80
Capítulo 3
Using bushmeat and living close to forest: do they alter people’s
perception of utilitarian and intrinsic value of forests?
Abstract
Environmental values can partly determine people’s willingness to engage in
conservation initiatives. In tropical countries as Brazil, engaging rural people in
conservation is vital, because most remaining forest is in private land, their persistence
depending on landowners’ attitudes and behavior. Although the majority of rural
residents are unlikely to rely primarily on forest products, the provision of food,
particularly bushmeat that is available all year round, can still be a valued resource
influencing the perceived forest instrumental value. However, the availability and use of
these resources likely decline with deforestation, which can also lead to decreased direct
contact with forests, negatively affecting the perception of forest intrinsic value. By
surveying perceptions of forest values among 363 rural residents from 20 landscapes
varying in forest cover across a 1 million-ha region in eastern Amazonia, we tested two
hypotheses: (1) lower bushmeat harvest and consumption, and deforestation by reducing
the supply of this important resource, erode perceptions of forest instrumental value; (2)
deforestation erodes perceptions of forest intrinsic value. As expected, bushmeat
consumption (but not hunting or forest cover) was positively associated with a favorable
perception of forest instrumental value, and deforestation was negatively associated

81
with a favorable perception of forest intrinsic value. Our findings highlight that
bushmeat is indeed a valued forest resource that shapes the perception of forest utility
among people living in altered as well as more forested landscapes. They also provide
evidence for a dangerous reinforcing cycle: deforestation and the loss of contact and
experience with forests erode perceptions of forest intrinsic value, which may in turn
facilitate further deforestation. Engaging rural communities in forest conservation
initiatives are probably more difficult but also more urgent in more altered landscapes,
where the utilitarian value linked to forest products such as bushmeat could be the focus
of such initiatives.
Keywords: ecosystem services, environmental values, forest products, forest
resources, game species, habitat loss, human-modified landscapes, over-exploitation,
tropical forest

82
Introduction
Individual values are deemed fundamental to understand people’s attitudes and behavior
(Rokeach 1973, Azjen 1991, Dietz et al. 2005). In particular, those referring to people’s
perceptions about the environment have been shown to predict pro-environmental
attitudes and behaviors (Stern et al. 1995, Schultz & Zelezny 1999, Schultz 2001). This
assumption has received growing attention in conservation, with the recognition that
understanding how and why people value nature can be a useful tool for the
management and conservation of natural environments. Understanding people’s
perceptions on environmental values is important to identify ways for minimizing
conflicts between stakeholders, promote the social acceptability of management
activities and actively engage people in conservation of natural environments by taking
into consideration people’s uses and preferences (Lockwood 1999, Mascia et al. 2003,
Lockwood 2005, Seymour et al. 2010, Knight et al. 2011, Brown & Reed 2012, Paletto
et al. 2013, Ives & Kendal 2014).
Although there are different theoretical frameworks in environmental
psychology distinguishing the types of environmental values, they hold many aspects in
common and suggest there are multiple ways by which people value the natural
environment (Dietz et al. 2005, Ives & Kendal 2014). Among these, two main kinds of
environmental values are often distinguished: instrumental (or utilitarian), which refers
to the utility of resources and products from natural environments that can fulfill
people’s needs; and intrinsic, those related to people’s moral and aesthetic feelings
about nature regardless of its utility (Sagoff 1991, Bengston 1994, Vilkka 1997).
In the attempt to value the natural environment and the importance to conserve
it, instrumental values are often linked to ecosystem services (i.e., the benefits derived

83
from the ecosystems - Millennium Ecosystem Assessment 2005). It is argued that their
incorporation into environmental conservation strategies, particularly economic
strategies, provide a more efficient way of engaging stakeholders in conservation
(Justus et al. 2009). However, ecosystem services encompass a broader set of value
categories rather than solely instrumental values (Reyers et al. 2012, Jax et al. 2013), as
they include not only provisioning services (e.g. timber, food, fresh water supply) but
also other types of services such as cultural services (Chan et al. 2012) and therefore
nonmaterial benefits such as spiritual enrichment, reflection and aesthetic experiences
(Millennium Ecosystem Assessment 2005). Cultural services are then more clearly
linked to the intrinsic value people attribute to the natural environment and there is
growing awareness that these values are also important to understand people’s
propensity for pro-environmental behavior (Chan et al. 2012, Jax et al. 2013).
From a utilitarian perspective, the provision of bushmeat is an important forest
service to those inhabiting developing countries, providing both animal protein and cash
income (Milner-Gulland et al. 2003, de Merode et al. 2004). We can therefore expect
that a decrease in the level of bushmeat harvesting and consumption lead to less
favorable perceptions about the instrumental value of forests. However, the importance
of bushmeat as an ecosystem service to local inhabitants can be compromised by
deforestation, since forest loss likely decreases the availability of game animals
(Michalski & Peres 2007). Plausibly, deforestation could thus also affect people’s
perceptions of the instrumental value of forests, if hunters and consumers are sensitive
to decreases in the population size of less resistant large-bodied game animals.
Although there is a plethora of studies stating the importance of bushmeat for
livelihoods in virtually all tropical forest regions (Milner-Gulland et al. 2003), the
association between bushmeat harvesting and consumption and people’s perceptions

84
about forest value has been poorly studied (but see Meijaard et al. 2013). While
overhunting have been associated with local decline and extinction of numerous species
(Milner-Gulland et al. 2003, Peres & Palacios 2007), when sustainable the use of this
forest product can be an important factor shaping people valuation of forests and
willingness to conserve them.
From a cultural or aesthetic perspective, deforestation may also affect people’s
perceptions of the intrinsic value of forests. The disconnection and loss of direct contact
with nature has been shown to lead to less favorable perceptions about nature and
biodiversity, reflecting in less favorable attitudes towards biodiversity conservation
(Miller 2005, Zhang et al. 2014). This disconnection leading to less favorable
perceptions has been shown to occur due to increasing urbanization (Turner et al. 2004,
Miller 2005). However, to our knowledge there is no study that focused on the more
subtle process of increasing deforestation, which may as well lead to the loss of contact
with nature in rural landscapes, negatively influencing peoples’ willingness to conserve
forests.
In post-frontier regions in the tropics - areas were deforestation has been
consolidated - it is unlikely that the majority of rural residents rely mostly on forest
products for a living (Futemma & Brondízio 2003), but the provision of food,
particularly bushmeat, which is available all year round, can still be an important
service provided by forests (Chapter 1 and 2). In these regions, the availability and the
use of bushmeat are likely to negatively correlate with deforestation rates (Michalski &
Peres 2007, Foerster et al. 2012, Chapter 1). As these regions are highly heterogeneous,
encompassing a spatial gradient in forest cover as deforestation progresses (Fearnside
2005), they are well-suited to investigate the association of both deforestation and
bushmeat harvest and consumption with people’s perceptions about forest values.

85
We conducted interviews with 363 rural residents living in 20 landscapes
varying in forest cover across a ~1 million ha recent post-frontier region in the eastern
Brazilian Amazon to investigate the association between people’s perceptions of the
instrumental and intrinsic values of forests and deforestation and bushmeat harvest and
consumption. We hypothesize that lower bushmeat harvest and consumption, as well as
deforestation by reducing bushmeat supply, erode people’s perceptions of forest utility
(instrumental value). Deforestation should also be associated with less favorable
perceptions of forest intrinsic value because it reduces people’s direct contact with
forests.
Methods
Study region
We conducted this study in a post-frontier region in eastern Brazilian Amazon, south of
the city of Santarém, in Pará state, a region that has been an agricultural frontier where
deforestation has been consolidated. Santarém region has been inhabited since pre-
Colombian times but the city itself was founded in 1661. Since then, it has received
different migratory influxes associated with various economic cycles (e.g., sugar cane,
cocoa, rubber, timber) (D’Antona et al. 2006), which transformed the municipality into
the main commercial center of the Lower Amazon (Futemma & Brondízio 2003).
Important migratory fluxes started around 1958, with road construction and
government-led colonization and land reform initiatives that promoted the influx of low
income immigrants from the arid northeastern Brazil, and from the southern part of the
country (Castro et al. 2004, Nepstad et al. 2006), but a previous wave of migration from

86
northeastern Brazil had arrived around 1877, to work in the forests, tapping rubber
(Fonseca 1996). Agriculture mechanization began at the end of the 1990s, with a new
migratory wave of farmers from south and Midwest Brazil (Nepstad et al. 2006). The
study region is therefore home to both recent and long-term in-migrants from various
regions of Brazil.
The study region from where we drew our sample was approximately 1 million
ha, bordered by the rivers Amazon, Tapajós and Curuá-Una, and with more than half of
the area covered by primary or secondary forest, with larger tracks of continuous
primary forest mostly further from urban centers (Fig. 1). The area encompasses the
rural and peri-urban areas of the municipalities of Santarém, Belterra and Mojuí dos
Campos, with a total population of 310,898 inhabitants, of which approximately 85,000
live in rural settings (IBGE 2010).
Sampling design
The sampling design was hierarchical, first selecting large areas (landscapes) within the
study region that captured the variability in forest, and then selecting households within
each landscape to interview household heads. In total, we sampled 20 7,850 ha
landscapes (each a 5-km radius circumferences), distributed across a gradient of current
forest cover (from 33 to 93%) (Fig. 1). The 20 sampled landscapes encompassed 70
communities of different sizes, varying from 10 to 400 households.
Within each of the 20 landscapes, we randomly selected 12 households. After
mapping roads, rivers and households within each landscape in the field and with the
help of GOOGLE EARTH images, we used ArcGis 9.3 to establish a set of points every
10 m in each stretch of roads and rivers that had at least one household. A stretch was

87
defined as the section between two vertices and, from them we randomly drew 12 points
per landscape at least 400 m apart from each other (the maximum possible distance in
all landscapes). Selected households were those nearest to these 12 points. When a
certain household was nearest to more than one of these points, the second point was
excluded and another one was randomly drawn. When a certain point was at equal
distance to more than one household, we randomly selected one of these households.
We skipped individual households if the household heads declined to take part in the
study (n = 3), or if after three visits no resident was encountered (n = 4).
In total we selected 240 households, and interviewed both household heads (man
and woman). When one of the household heads was absent, we revisited the household
in one more occasion and conducted the interview with only one of the heads if the
other was again absent. In 77 of the 240 households, we could not interview both
household heads (in 29 we could not interview the woman and in 48 the man). In total,
we interviewed 363 residents, 190 women and 173 men.
Perceptions of forest value and its determinants
We used an interview-based survey (structured questionnaire) with household heads,
applied by PCT and a team of three trained assistants, who conducted the interviews
between July and December 2013. Using the interview-based survey, we quantified: (i)
people’s perceptions of forest value using a Likert-type scale; (ii) independent variables,
i.e. household bushmeat harvest and consumption and (iii) other control variables.
Before data gathering the survey was pre-tested in the field for comprehensiveness and
repetition.

88
Perceptions of forest value
We aimed at investigating two types of environmental values: instrumental and intrinsic
(Bengston 1994). We equate instrumental values with the utility of nature in the sense
that it serves a purpose, satisfies a preference, or meets a need, whereas intrinsic value is
the inherent worth of something as an end in itself rather than the benefits one can
receive from it, including aesthetic and moral components (Sagoff 1991). In this study,
we focused on the aesthetic component of intrinsic values, because moral components
are identifiable only in the context of action (Sagoff 1991).
For each of the two types of values, we constructed a Likert-type scale (hereafter
Likert scale) composed of six statements (items) through which we evaluated the
respondent’s perception of the instrumental and intrinsic values of forest (Supporting
Information 1). A statement is defined as a single sentence that expresses a point of
view, a belief, a preference, a judgment, an emotional feeling or a position for or against
something (Oppenheim 1992). Because an appropriate constructed scale should have an
equal proportion of positive (favorable) and negative (unfavorable) statements
(Oppenheim 1992), for each scale three statements were positive and three negative.
The response to each statement was in a Likert-type response format, i.e. “strongly
agree”, “agree”, “neutral/or could not answer”, “disagree”, and “strongly disagree”. To
each answer, we assigned points from 1 to 5: 5 representing the extreme of favorable
perceptions towards forests, 3 assigned to “neutral/or could not answer” (undecided
position), and 1 representing the extreme of unfavorable perceptions towards forests
(Likert 1932). For each respondent and each type of value (instrumental or intrinsic),
the Likert scale was then the sum of the points attributed to the responses to all the six

89
statements, therefore ranging from 6 to 30, with higher scores reflecting a more
favorable perception of forest values.
Forest cover and bushmeat harvest and consumption
Forest cover was initially measured as the amount of forest cover (in km2) at five
different spatial scales around each household location of residence: 1-km radius buffer
(3.1 km2), 2-km (12.6 km2), 3-km (28.3 km2), 4-km (50.2 km2) and 5-km (78.5 km2).
For each spatial scale, forest cover was quantified considering either: only non-degraded
primary forest, total primary forest (degraded and non-degraded), or total forest (total
primary plus secondary forest older than 10 years). The measure of forest cover that
best explained the variation in the Likert scale for each type of forest value was then
selected in a model selection approach, using Akaike’s Information Criterion modified
for small samples (AICc) (Supporting Information 2). Primary forest at 5-km radius
buffer was selected for the instrumental value, and primary forest at 1-km radius buffer
for the intrinsic value.
Bushmeat harvest was measured as the total hunting offtake (total kilograms of
animals killed) in the household in the previous 30 days, while bushmeat consumption
was total kilograms of bushmeat consumed in the household over the previous 15 days.
There was no correlation between bushmeat harvest and any measure of forest cover
(Person correlation coefficient varying from 0.01 to 0.12), nor between bushmeat
consumption and any measure of forest cover (Person correlation coefficients varying
from 0.06 to 0.1).

90
Gender, origin and forest dependence
To control for confounding factors that could also explain perceptions of forest values,
three additional variables were considered: gender, whether the respondent was born in
the community of residence or not (origin), and an estimate of household-level forest
dependency, all of which had been associated with perceptions of the value of protected
areas and conservation attitudes (Xu et al. 2006, Kijazi & Kant 2010, Sohdi et al. 2010,
Tomicevic et al. 2010, Meijaard et al. 2013). Forest dependency was included to
account for all other forest products that people could extract from forests besides
bushmeat, and we estimated it following Coomes and colleagues (2004) as the
proportion of the total household income in the last 30 days originating from the
extraction of forest products.
A similar number of interviewed men and women were born in the community
of residence (34 and 38 respectively). Mean values of bushmeat harvest, bushmeat
consumption and forest dependency did not differ between genders and origins (p ≥
0.4), but mean values of forest cover (in each of the two scales) were lower for
respondents born in the community of residence (p < 0.01). Forest dependency was only
slightly correlated to bushmeat harvest (r = 0.33, p < 0.01) and it was not correlated
with the other determinants (r ≤ 0.11, p ≥ 0.05).
Data analysis
Scale evaluation
We evaluated our Likert scales in terms of their unidimensionality and internal
consistency (reliability). Unidimensionality indicates weather the scale encompasses
only one concept or construct (Oppenheim 1992). Internal consistency is a measure of

91
item-total correlations and thus reliability of the scale, therefore describing the extent to
which all items in a test measure the same concept or construct (Dunlap et al. 2000,
Tavakol & Dennik 2011). To evaluate the unidimensionality of each of the two Likert
scales (one for each value type), we conducted a principal component analysis (PCA).
To test the internal consistency and thus reliability of each scale, we adopted the
Cronbach’s α (Cortina 1993, Carifio & Perla 2007). All these exploratory analyses were
implemented in R 3.0.3 (R Core Team 2014), using the psych package (Revelle 2014).
From the PCAs, we found that in both cases the first component was more
important in explaining the variation in the dataset (Table 1), whereas the eigenvalue of
the second component was only slightly higher than 1, therefore unimportant from a
variance perspective (Tabachnick & Fidell 2001). As expected when creating a proper
scale (Fig. 2), the items were correlated and the Cronbach’s α revealed an acceptable
degree of fit among the 6-items of each scale (α = 0.64 for the instrumental value of
forests and α = 0.58 for the intrinsic value of forests). Although the unidimensionality of
the scales improved when one item from the instrumental value scale and two items
from the intrinsic value scale were excluded, the Cronbach’s α values did not change for
the scales with fewer items (Supporting Information 3). We then decided to analyze the
data for the 6-items scales, since a higher number of items increases the linearity of the
scale (Carifio & Perla 2007) and because the number of dimensions are often sample
specific and, for this reason, some researchers see unidimensionality as a rather
unrealistic goal (Dunlap et al. 2000).
Determinants of the perceptions of forest values
We investigate the relationship between forest perceptions and its determinants (forest
cover, bushmeat harvest and bushmeat consumption), controlling for gender, origin and

92
forest dependency using a model selection approach. We used generalized linear mixed-
effects models (GLMM) to account for the hierarchical nature of the sampling design,
with landscapes as random factors. We modeled the dependent variables as variables
with normal distribution and used linear function (link identity), because Likert scales,
created by summing up the values of several items, are not considered ordinal scales but
rather produce interval data (Carifio & Perla 2007).
All fixed factors, besides gender and origin (which were categorical), were then
standardized so that each had a mean of zero and a standard deviation of one, a
procedure adopted that helps to improve convergence of the fitting algorithm (Zuur et
al. 2009). We compared a set of candidate models for each type of value: an intercept-
only model for reference (with no fixed factors), six simple models with each of the six
independent variables on their own as fixed factors, and models with all possible
combinations among the six independent variables as fixed factors, without accounting
for interactions between them. Alternative models in each set were compared using the
difference in their AICc values in relation to the first-ranked model (∆AICc) (Burnham
& Anderson 2002), adopting a value of ∆AICc ≤ 2 to indicate equally plausible models.
All analyses were implemented in R 3.0.3 (R Core Team 2014) using the lme4 package
(Bates et al. 2011).
Results
Among interviewees, 52% were women and 48% were men, and 20% were born in the
community of residence. The perceptions of both forest values were more often
favorable (i.e. high values on the Likert scale), indicating that most people see forests as

93
important (instrumental value - range 7 to 30, mean = 24.3, SD = 4.5; intrinsic value –
range 10 to 30, mean = 22.7, SD = 4.7). Perceptions of forest values were more
favorable among men, particularly for the intrinsic value of forests (Fig. 3).
Forest cover varied widely across the 240 households both in the smaller and
larger spatial scales (1-km radius buffer - 0 to 2.78 km2, mean = 0.73, SD = 0.73; 5-km
radius buffer - 2.3 to 73.3 km2, mean = 31.4, SD = 21.1). Bushmeat harvested within the
last 30 days varied from 0 to 120 kg (mean = 4, SD = 13.6), with 26% respondents
declaring harvest in their household. Bushmeat consumption within the last 15 days
varied from 0 to 17 (mean= 0.9, SD = 2.1), with 33% of respondents declaring
bushmeat consumption in their households. Forest dependency (the proportion of the
total household income in the last 30 days originating from the extraction of forest
products) varied from 0 to 99% of total income (mean = 6, SD = 13), with 61% of
respondents declaring some extraction of forest products in their households.
Determinants of the perceptions of forest values
As expected, the instrumental value of forests was positively associated with
bushmeat consumption, but only when controlling for both origin and gender (as the
third-ranked selected model included gender, origin and bushmeat consumption, Table
2). On the other hand, neither bushmeat harvest nor forest cover were associated with
perceptions of the instrumental value of forests (i.e. they were not included in the
selected models). The instrumental value of forests was strongly associated with origin
and gender, but gender was more important when controlling for origin. The model
including origin and gender was the first-ranked among the three selected models,
followed by the model including only origin, and all models that performed better than
the reference model included the variable origin and/or gender (Table 2). Being born in

94
the community and being a male were positively associated with more favorable
perceptions of the instrumental value of forests. The results of the model selection
procedure did not change by altering the scale (i.e. 1, 2, 3, 4 or 5-km radius buffer) and
the type of forest (i.e. non-degraded primary, total primary or total forest) considered
when quantifying forest cover.
In turn, the intrinsic value of forests was strongly and positively associated with
forest cover, as expected, when controlling for gender or gender and origin (both
selected models included forest cover, Table 3). Neither bushmeat harvest nor bushmeat
consumption were associated with perceptions of the intrinsic value of forests (i.e. they
were not included in the selected models). Gender was also strongly associated with the
intrinsic value of forests. As for the instrumental value, being a male was positively
associated with more favorable perceptions of the intrinsic value of forests. Gender was
included with forest cover in both selected models, and gender and/or forest cover were
included in all 40 models that performed better (∆AICc > 2) than the reference model
(Table 3). Origin was only important if controlling for both forest cover and gender
(second-ranked selected model), but its effect was not clear (i.e. the standard deviation
of the coefficient included zero; Table 3). As for the instrumental value, the results of
model selection did not change by altering the type of forest considered when
quantifying forest cover. However, increasing the spatial scale for quantifying forest
cover decreased the importance of forest cover relative to gender.

95
Discussion
We began this article by hypothesizing that lower bushmeat harvest and consumption,
as well as higher deforestation by reducing the supply of this important resource, would
erode people’s perceptions of forest utility. Our results provide evidence that reduced
bushmeat consumption is indeed associated with less favorable perceptions of the
instrumental values of forests, whereas bushmeat harvest and forest cover did not
significantly influence the perception of forest utility. However, the importance of
bushmeat consumption was apparent only when controlling for both origin and gender;
residents born in the community and men have a more favorable perception of the
instrumental values of forests. We also hypothesized that deforestation should be
associated with less favorable perceptions of the intrinsic value of forests, because
deforestation should reduce people direct contact with forests. Our findings indicate that
indeed living in less forested areas is associated with less favorable perceptions of the
intrinsic value of forests, with gender again being an important determinant. In the
following paragraphs, we discuss the three main findings of this study, namely the
association between perceptions of forest instrumental value with bushmeat
consumption, the association between perceptions of forest intrinsic value and forest
cover, and the importance of gender and origin for perceptions of both instrumental and
intrinsic value of forests. We end up by discussing the implications of these findings to
conservation initiatives.
Bushmeat consumption seems more important in shaping people’s perceptions
of forest instrumental value than either bushmeat harvest or the amount of forest cover
in the landscape. To our knowledge there is no previous study that investigated the
association between bushmeat harvest and consumption at the household scale with

96
perceptions of forest value. Nevertheless, the occurrence of hunting at the village scale
(i.e., whether or not hunting was a predominant activity in a village) has been found to
be positively associated with perceived economic values of forests in Borneo (Meijaard
et al. 2013). Likewise, the provision of wild animals for food increased the value
attributed to forests by farmers living nearby forest reserves in Ghana given its
importance for immediate subsistence and livelihoods (Ramcilovic-Suominen et al.
2013). These two studies, however, do not distinguish between bushmeat harvest and
consumption. These two activities are not necessarily correlated because trading and
sharing often provide important means of acquiring bushmeat (de Merode, et al.2004),
making bushmeat consumption typically more widespread than hunting (Chapter 1). In
our study, we show that bushmeat is indeed a valued resource, even for consumers that
did not hunt frequently, and that consumption is a better predictor of perceptions of
utilitarian forest value than hunting.
In contrast to our initial hypothesis, forest cover was not associated with the
perceptions of forest instrumental value. The negative effects of deforestation on the
abundance and persistence of preferred game species is widely accepted (Michalski &
Peres 2007), and thus the availability and rates of harvest and consumption of these
preferred species should decline with deforestation. However, studies on hunting effects
on wildlife have shown that as preferred, large-bodied species are overexploited,
hunters start targeting non-preferred, smaller species (Jerozolimski & Peres 2003).
Indeed, in our sample bushmeat harvest and consumption was not correlated to forest
cover. Thus deforestation may change which species are harvested but not the rates of
bushmeat consumption. Rather bushmeat consumption in more deforested landscapes
are probably sustained by species with high reproductive rates that persist in highly
altered areas (e.g. paca and armadillos -Redford & Robinson 1987, Parry et al. 2009) or

97
by long-distance hunting to adjacent more forested landscapes (Chapter 1). The lack of
association between forest cover and forest utilitarian value may thus result from the
independence between forest cover and bushmeat consumption, when considering a
quantitative measure of consumption.
For perceptions of forest intrinsic value, however, forest cover is an important
determinant, as we hypothesized, regardless of bushmeat consumption or harvest, with
people living in more forested areas reporting more favorable perceptions. We did not
directly test whether those living in areas with more forest remnants had in fact more
direct contact with the forest, for instance by frequently walking along forest trails or
simply contemplating any forest element from outside the forest patch (a tree or
animal). It is noteworthy, however, that the estimate of forest cover that best explained
variations in the perception of the intrinsic value of forests was at the smallest spatial
scale (i.e. within 1 km from the household). This indicates that the proximity to forest is
relevant in this case. Indeed the loss of experience with natural environments, a
consequence of urbanization, has been argued to be the main driver of people no longer
valuing nature (Miller 2005). The gap between humans and nature cause mainly by
urbanization has also been linked to the erosion of the intrinsic value attributed to nature
by children (Zhang et al. 2014). However, to our knowledge, this study is the first to
show that this erosion of the perception of the intrinsic value of nature can also occur in
rural landscapes by a much subtler process when compared to urbanization, i.e. the
decrease in forest cover in people’s living surroundings.
Our findings also highlight that individual characteristics - origin and gender –
are more important determinants of people’s perception of forest utilitarian value than
bushmeat consumption, and gender is as important as forest cover for perception of

98
forest intrinsic value. Origin, as an indicative of long residence in the community, may
be linked to knowledge about the forest, as the acquisition of traditional ecological
knowledge is linked to how long people lived in an area (Necheim et al. 2006). Thus
people born in the locality of residence should display greater awareness of forest
utility. More years of residence in the village has been linked to perceptions of higher
economic importance of forests (Meijaard et al. 2013), although the reasons for this
finding have not been discussed. The association between men and more favorable
perceptions of forest utilitarian value has already been reported elsewhere for people
leaving near protected areas or forests (Brown & Reed 2000, Paletto et al. 2013) as well
as for the general public in developed countries (Tarrant & Cordell 2002). One study
also reported the same relationship for forest intrinsic value (Paletto et al. 2013). They
suggest that the more favorable perceptions of all forest values by men is due to the fact
that men visit forests more frequently than women and spend more time engaged in
traditional activities such as extraction of forest resources for food and fuel. Therefore
they have more knowledge of the environment and stronger connection with the forest.
Forest-related activities in our study region are also usually performed by men, which
could explain why men reported more favorable perceptions of both forest utility and its
intrinsic value.
Implications for conservation
By exploring the factors affecting the diversity of values people may attribute to forests,
we show that most rural residents in a vast and heterogeneous post-frontier region in the
Amazon had favorable perceptions of the intrinsic and utilitarian values of forests.
Because pro-environmental behaviors and attitudes are linked to perceptions of
environmental values (Stern et al. 1995, Schultz & Zelezny 1999, Schultz 2001), our
results suggest there are opportunities for conserving the forest in private lands in

99
altered, human-modified Amazonian regions through initiatives involving rural
communities. Despite the methodological challenges for measuring cultural ecosystem
services (Plieninger et al. 2013), our findings add to the growing literature suggesting
that cultural and aesthetic benefits provided by ecosystems, which are shaped by
intimate human–nature interactions (Bhagwat 2009, Plieninger et al. 2013, Brancalion
et al. 2014), are perceived as equally valuable as the provision of resources. Knowing
why and how people value forests is strategic to conceive initiatives that can be
accepted and hence fomented by local people, increasing the chance of success of such
efforts.
Nevertheless, by comparing the perception of forest values across different
landscape contexts, our study highlights the possibility of a dangerous reinforcing cycle:
deforestation and the subsequent loss of direct contact with forests erode perceptions of
forest intrinsic value, which may in turn facilitate further deforestation. Thus engaging
people in forest conservation initiatives are probably more difficult but also more urgent
in more altered landscapes. The utilitarian value linked to forest resources such as
bushmeat, the consumption of which seems to be independent of forest cover, may then
be the focus for engaging rural communities in forest conservation initiatives in more
altered landscapes.
Acknowledgements
We thank P.E. de Moraes for assistance in data collection and the calculation of some
independent variables; P.C.R de Araújo and E.R. da Silva for assistance in data
collection; K.S. Gonçalves for assistance in mapping roads and households and piloting
the questionnaires; J.V. Siqueira for mapping forest cover; and all the collaborating
residents and representatives of the communities in Santarém, Mojuí dos Campos and

100
Belterra for their support. We are also grateful to FAPESP (2011/19108-0) for financial
support. P.C.T. had doctoral scholarships from CAPES and FAPESP (2001/19606-0)
and R.P. a research fellowship from CNPq (306715/2011-2) during the development of
this study.
References
Azjen, I. (1991) The theory of planned behavior. Organizational behavior and human
decision processes 50, 179-211.
Bates, D., Maechler, M., &Bolker, B. (2011) Lme4: Linear mixed-effects models using
S4 classes.R package version 0.999375-42. http://CRAN.R
project.org/package=lme4
Bengston, D. N. (1994) Changing forest values and ecosystem management. Society &
Natural Resources: An International Journal 7, 515-533.
Bhagwat, S. A. (2009) Ecosystem services and sacred natural sites: reconciling material
and non-material values in nature conservation. Environmental Values 18, 417-
427.
Brancalion, P. H. S., Cardozo, I. V., Camatta, A., Aronson, J. & Rodrigues, R. R.
(2014) Cultural ecosystem services and popular perceptions of the benefits of an
ecological restoration project in the Brazilian Atlantic Forest. Restoration
Ecology 22, 65-71.
Brown, G. &Reed, P. (2000) Validation of a forest values typology foruse in national
forest planning. Forest Science 46, 240–247
Brown, G. & Reed, P. (2012) Values compatibility analysis: using public participation
geographic information systems (PPGIS) for decision support in national forest
management. Applied Spatial Analysis 5, 317-332.

101
Burnhan, K. P., & Anderson, D. (2002) Model selection and multi-model inference: a
practical information-theoretic approach. New York: Springer-Verlag. 488 p.
Carifio, J. & Perla, R. J. (2007) Ten common misunderstandings, misconceptions,
persistent myths and urban legends about Likert scales and Likert response
formats and their antidotes. Journal of Social Sciences 3, 106-116.
Castro, E., Monteiro, R., & Castro, C. P. (2004) Dinâmica de atores, uso da terra e
desmatamento na rodovia Cuiabá-Santarém. Paper do NAEA, 179. Available:
http://www.ufpa.br/naea/gerencia/ler_publicacao.php?id=247. Accessed 15
December 2012.
Chan, K. M. A., Satterfield, T. & Goldstein, J. (2012) Rethinking ecosystem services to
better address and navigate cultural values. Ecological Economics 74, 8-18.
Coomes, O. T., Barham, B. L. & Takasaki, Y. (2004) Targeting conservation –
development initiatives in tropical forests: insights from analyses of rain forest
use and economic reliance among Amazonian peasants. Ecological Economics
51, 47-64.
Cortina, J. M. (1993) What is coefficient alpha? An examination of theory and
applications. Journal of Applied Psychology 78, 98-104.
D’Antona, A. O., Van Wey, L. K., & Hayashi, C. M. (2006) Property size and land
cover change in the Brazilian Amazon. Population and Environment 27, 373–
396.
De Merode, E., Homewood, K., & Cowlishaw, G. (2004) The value of bushmeat and
other wild foods to rural households living in extreme poverty in Democratic
Republic of Congo. Biological Conservation 118, 573–581.
Dietz, T., Fitzgerald, A. & Shwom, R. (2005) Environmental values. Annual Review of
Environmental Resources 30, 335-372.

102
Dunlap, R. E., Van Liere, K., D., Mertig, A., G. & Jones, R. E. (2000) Measuring
endorsement of the new ecological paradigm: a revised NEP scale. Journal of
Social Issues56, 425-442.
Fearnside, P. M. (2005) Deforestation in Brazilian Amazonia: History, rates and
consequences. Conservation Biology 19, 680-688.
Foerster, S., Wilkie, D. S., Morelli, G. A., Demmer, J., Starkey, M., Telfer, P., Steil, M.
& Lewbel, A. (2012) Correlates of bushmeat hunting among remote rural
households in Gabon, Central Africa. Conservation Biology 26, 335–344.
Fonseca, W. D. (1996) Santarém: momentos históricos, Editora Tiagão, Santarém,
Brazil.
Futemma, C. & Brondízio, E. S. (2003) Land reform and land-use changes in the lower
Amazon: implications for agricultural intensification. Human Ecology 31, 369-
402.
Instituto Brasileiro de Geografia e Estatística (IBGE) (2010) Censo Demográfico 2010.
IBGE, Rio de Janeiro, RJ.
Ives, C. D. & Kendal, D. (2014) The role of social values in the management of
ecological systems. Journal of Environmental Management 144, 67-72.
Jax, K. et al. (2013) Ecosystem services and ethics. Ecological Economics 93, 260-268.
Jerozolimski, A. & Pares, C.A. (2003) Bringing home the biggest bacon: a cross-site
analysis of the structure of hunter-kill profiles in Neotropical forests. Biological
Conservation, 111, 415-425.
Justus, J., Colyvan, M., Regan, H. & Maguire, L. (2009) Buying into conservation:
intrinsic versus instrumental value.Trends in Ecology and Evolution 24, 187-
191.

103
Kijazi, M. H. & Kant, S. (2010) Forest stakeholders' value preferences in Mount
Kilimanjaro, Tanzania. Forest Policy and Economics 12, 357-369.
Knight, A. T., Sarkar, S., Smith, R. J., Strange, N. & Wilson, K. A. (2011) Engage the
hodgepodge: management factors are essential when prioritizing areas for
restoration and conservation action. Diversity and Distributions 17, 1234-1238.
Kollmus, A. & Agyeman, J. (2002) Mind the gap: why do people act environmentally
and what are the barriers to pro-environmental behavior? Environmental
Education Research 8, 239-260.
Kumar, S. & Kant, S. (2007) Exploded logit modeling of stakeholders’preferences for
multiple forest values. Forest Policy and Economics 9, 516–526
Likert, R. (1932) A technique for the measurement of attitudes. Archives of Psychology
140, 3-55.
Lockwood, M. (1999) Humans valuing nature: synthesizing insights from philosophy,
psychology and economics. Environmental Values 8, 381-401.
Lockwood, M. (2005) Integration of natural areas values: conceptual foundations and
methodological approaches. Australasian Journal of Environmental Management
12, 8-19.
Ludewigs, T. & Brondízio, E. S. (2009) Paths of diversification: land-use, livelihood
strategies and social learning along the aging of a land reform settlement in
Acre, Brazil. Amazônica 1, 330-367.
Mascia, M. B., Brosius, J. P., Dobson, T. A., Forbes, B. C., Horowitz, L., McKean, M.
A. & Turner, N., J. (2003) Conservation and the social sciences. Biological
Conservation 17, 649-650.

104
Meijaard, E., Abram, N. K., Wells, J. A., Pellier, A.S., Ancrenaz, M., Gaveau, D. L. A.,
Runting, R. K. & Mengersen, K. (2013) People’s perceptions about the
importance of forests on Borneo. Plos One 8 (9) e73008.
Michalski, F., & Peres, C. A. (2007) Disturbance-mediated mammal persistence and
abundance-area relationships in Amazonian forest fragments. Conservation
Biology 21, 1626-1640.
Millennium Ecosystem Assessment(2005) Ecosystems and human well-being:
synthesis. Island Press, Washington D.C.
Miller, J. R. (2005) Biodiversity conservation and the extinction of experience. Trends
in Ecology and Evolution 20, 430-434.
Milner-Gulland E. J., Bennet, E. L., & the SCB 2002 Annual Meeting Wild Meat Group
(2003) Wild meat: the bigger picture. Trends in Ecology and Evolution 18, 351-
357.
Necheim, I., Dhillion, S. S. & Stolen, K. A. (2006) What happens to traditional
knowledge and use of natural resources when people migrate? Human Ecology
34, 99-131.
Nepstad, D., Stickler, C. M., & Almeida, O. T. (2006) Globalization of the Amazon soy
and beef industries: opportunities for conservation. Conservation Biology 20,
1595–1603.
Oppenheim, A. N. (1992) Questionnaire design, interviewing and attitude measurement.
New Your. Continuum. 303 pp.
Paletto, A., Maino, F., De Meo, I. &Ferretti, F. (2013) Perception of forest value in the
alpine community of Trentino region (Italy). Environmental Management 51,
414-422.
Parry, L., Barlow, J., & Peres, C. A. (2009) Hunting for sustainability in tropical

105
secondary forests. Conservation Biology 23, 1270-1280.
Peres, C. A., & Palacios, E. (2007) Basin-wide effects of game harvest on vertebrate
population densities in Amazonian forests: implications for animal-mediated
seed dispersal. Biotropica 39, 304-315.
Plieninger, T., Dijks, S., Oteros-Rozas, E. & Bieling, C. (2013) Assessing, mapping, and
quantifying cultural ecosystem services at community level. Land Use Policy 33,
118-129.
Ramcilovic-Suominen, S., Matero, J. & Shannon, M. A. (2013) Do forest values
influence compliance with forest legislation? The case of farmers in the fringes
of forest reserves in Ghana. Small-scale Forestry 12, 235-256.
Redford, K. H., & Robinson J. G. (1987) The game of choice: patterns of indian and
colonist hunting in the Neotropics. American Anthropologist 89, 650-667.
Revelle, W. (2014) psych: procedures for personality and psychological research,
Northwestern University, Evanston, Illinois, USA, http://CRAN.R-
project.org/package=psych Version = 1.4.8.
Reyers, B., Polasky, S., Tallis, H., Mooney, H. A. & Larigaudarie, A. (2012) Finding
common ground for biodiversity and ecosystem services. BioScience 62, 503-
507.
Rokeach, M. (1973) The nature of human values. Free Press, New York.
Sagoff, M. (1991) Zuckerman’s dilemma: a plea for environmental ethics. Hastings
Center Report 32-40.
Schultz, P. W. & Zelezny, L. (1999) Values as predictors of environmental attitudes:
evidence for consistency across 14 countries. Journal of Environmental
Psychology 19, 255-265.
106
Schultz, P.W. (2001) The structure of environmental concern: concern for self, other
people, and the biosphere. Journal of Environmental Psychology 21, 327-339.
Seymour, E., Curtis, A., Pannell, D. (2010) Understanding the role of assigned values in
natural resource management. Australasian Journal of Environmental
Management 17, 142-153.
Sohdi, N. S., Lee, T. M., Sekercioglu, C. H., Webb, E. L., Prawiradilaga, D. M.,
Lohman, D. J., Pierce, N. E., Diesmos, A. C., Rao, M. & Ehrlich, P. R. (2010)
Local people value environmental services provided by forested parks.
Biodiversity and Conservation 19, 1175-1188.
Stern, P.C., Kalof, L., Dietz, T., Guagnano, G.A. (1995) Values, beliefs, and pro-
environmental action: attitude formation toward emergent attitude objects.
Journal of Applied Social Psychology 25, 1611-1636.
Tabachnick, B. G. & Fidell, L. S. (2001) Using multivariate statistics. New Jersey.
Pearson Education. 983 pp.
Tarrant, M. A., Cordell, H. K. (2002) Amenity values of public and privateforests:
examining the value-attitude relationship. Environmental Management 30, 692–
703.
Tavakol, M. & Dennik, R. (2011) Making sense of Cronbach’s alpha. International
Journal of Medical Education 2, 53-55.
Tomicevic, J., Shannon, M. A. & Milovanovic, M. (2010) Socio-economic impacts on
the attitudes towards conservation of natural resources: case study from Serbia.
Forest Policy and Economics 12, 157-162.
Turner, W. R., Nakamura, T. & Dinetti, M. (2004) Global urbanization and the
separation of humans from nature. BioScience, 54, 585-590.
Vilkka, L. (1997) The intrinsic value of nature. Value Inquiry BookSeries, Helsinki.

107
Xu, J., Chen, L., Lu, Y. & Fu, B. (2006) Local people’s perceptions as decision support
for protected area management in Wolong Biosphere Reserve, China. Journal of
Environmental Management 78, 362-372.
Zhang, W., Goodale, E. & Chen, J. (2014) How contact with nature affects children’s
biophilia, biophobia and conservation attitude in China. Biological Conservation
177, 109-116.
Zuur, A. F., Ieno, E. N., Wlaker, N. J., Saveliev, A. A., & Smith, G. M. (2009) Mixed
effects models and extensions in ecology with R. New York: Springer Science
and Business Media. 574 pp.

108
Table 1. Results for the principal component analysis of the two Likert scales for
the perception of the instrumental and intrinsic values of forest with six items
each.
Factor Eigenvalue
Proportion explained
Cumulative proportion
Inst
rum
enta
l val
ue 1 2.25 0.37 0.37 2 1.12 0.19 0.56 3 0.82 0.14 0.70 4 0.71 0.12 0.82 5 0.63 0.11 0.92 6 0.47 0.08 1.00
Intr
insi
c va
lue
1 1.97 0.33 0.33 2 1.24 0.21 0.53 3 0.87 0.14 0.68 4 0.75 0.12 0.80 5 0.65 0.11 0.91 6 0.53 0.09 1.00

109
Table 2. Model selection results for the determinants of the perception of the instrumental value of forests among 363 rural residents in
the study region. All candidate models are GLMM models with landscapes as a random factor. Only candidate models with weight ≥ 0.02 are
shown.
Model description K logLik AICc ∆AICc ωi Origin Gender Bushmeat
Consumption Forest Cover
Bushmeat Harvest
Forest Dependency
Origin+gender 5 -1058.0 2126.2 0.0 0.18 1.26 (0.59) 0.79 (0.47) - - - -
Origin 4 -1059.6 2127.3 1.1 0.10 1.26 (0.59) - - - - -
Origin+gender+consumption 6 -1058.0 2128.2 2.0 0.07 1.25 (0.59) 0.80 (0.47) 0.25 (0.23) - - -
Origin+gender+forest cover 6 -1058.1 2128.4 2.2 0.06 1.09 (0.62) 0.81 (0.47) - -0.22 (0.25) - -
Origin+gender+harvest 6 -1058.2 2128.7 2.5 0.05 1.26 (0.59) 0.19 (0.23) - - 0.80 (0.47) -
Origin+gender+forest dependency 6 -1058.5 2129.2 3.0 0.04 1.25 (0.59) 0.79 (0.47) - - - 0.09 (0.23)
Origin+consumption 5 -1059.6 2129.3 3.1 0.04 1.24 (0.59) - 0.25 (0.24) - - -
Gender 4 -1060.7 2129.5 3.3 0.03 0.79 (0.47) - - - -
Origin+forest cover 5 -1059.7 2129.6 3.4 0.03 1.10 (0.62) - - -0.21 (0.25) - -
Origin+harvest 5 -1059.8 2129.8 3.6 0.03 1.26 (0.59) - - - 0.18(0.24) -
Origin+gender+consumption+forest cover
7 -1057.9 2130.1 3.9 0.02 1.05 (0.62) 0.82 (0.47) 0.28 (0.24) -0.25 (0.25) - -
Origin+forest dependency 5 -1060.0 2130.3 4.1 0.02 1.25 (0.59) - - - - 0.09 (0.24)
Gender+forest cover 5 -1060.1 2130.4 4.2 0.02 - 0.81 (0.47) - -0.35 (0.24) - -
Reference 3 -1062.2 2130.5 4.3 0.02 - - - - - -
Origin+gender+forestcover+harvest 7 -1058.2 2130.7 4.5 0.02 1.07 (0.62) 0.82 (0.47) - -0.25 (0.25) 0.22 (0.24) -
Origin+gender+consumption+harvest 7 -1058.3 2130.8 4.6 0.02 1.25 (0.59) 0.80 (0.47) 0.23 (0.24) - 0.16 (0.24) - Selected models (∆AICc<2) in bold; K: number of parameters; logLik: log-Likelihood of the model; AICc: AICc value; ∆AICc: difference in AICc value compared to the first-ranked model; ωi: Akaike weight; coefficients for each variable of the model.

110
Table 3. Model selection results for the determinants of the perception of the intrinsic value of forests among 363 rural residents in the study region. All candidate models are GLMM models with landscapes as a random factor. Only candidate models with weight ≥ 0.02 are shown.
Model description K logLik AICc ∆AICc ωi Forest Cover
Gender Origin Bushmeat Harvest
Bushmeat Consumption
Forest Dependency
Forest cover+gender 5 -1044.1 2098.4 0.0 0.29 0.72
(0.35) 3.35
(0.45) - - - -
Forest cover+gender+origin 6 -1043.4 2099.1 0.7 0.21 0.76
(0.27) 3.35
(0.45) 0.47
(0.59) - - -
Forest cover+gender+harvest 6 -1044.6 2101.5 3.1 0.06 0.72
(0.27) 3.36
(0.45) -
0.08 (0.23)
- -
Forest cover+gender+consumption 6 -1044.6 2101.5 3.1 0.06 0.73
(0.27) 3.35
(0.45) - - -0.06 (0.23) -
Forest cover+gender+forest dependency 6 -1044.7 2101.6 3.2 0.06 0.72
(0.27) 3.35
(0.45) - - - 0.04 (0.23)
Forest cover+gender+origin+harvest 7 -1043.9 2102.1 3.7 0.04 0.76
(0.27) 3.36
(0.45) 0.47
(0.59) 0.08
(0.23) - -
Forest cover+gender+origin+ consumption
7 -1043.9 2102.2 3.7 0.04 0.76
(0.27) 3.35
(0.45) 0.48
(0.59) - -0.06(0.23) -
Forest cover+gender+origin+forest dependency
7 -1044.0 2102.2 3.8 0.04 0.76
(0.27) 3.35
(0.45) 0.46
(0.59) - - 0.03 (0.23)
Gender 4 -1047.2 2102.5 4.1 0.04 - 3.41
(0.45) - - - -
Gender+origin 5 -1046.7 2103.5 5.1 0.02 - 3.42
(0.45) 0.27
(0.60) - - -
Selected models (∆AICc<2) in bold; K: number of parameters; logLik: log-Likelihood of the model; AICc: AICc value; ∆AICc: difference in AICc value compared to the first-ranked model; ωi: Akaike weight; coefficients for each variable of the model.

111
Figure 1. Land cover map of the study region. Location of the study region in South
America and land-cover map of the study region, indicating the location of the 20 study
landscapes (circumferences) and the 240 sampled households (black dots). Urban areas
in dark grey, forests in grey, converted land in light grey, and water bodies in white.

112
Figure 2. PCA biplots showing the variation in the values of the Likert scales for
the perception of instrumental and intrinsic values of forests among 363 rural
residents in the study region. Residents are shown as dots and the six items (three
positive – POS and three negative – NEG) as vectors.

113
Figure 3. Variation in the perception of forest values between men and women
among residents in the study region. Perceptions of (a) the instrumental and (b) the
intrinsic value of forest showing Likert scale values. Boxplot showing the data median
(horizontal line), 1st quartile (lower whisker), 2nd quartile (lower box), 3rd quartile
(upper box) and 4th quartile (upper whisker).
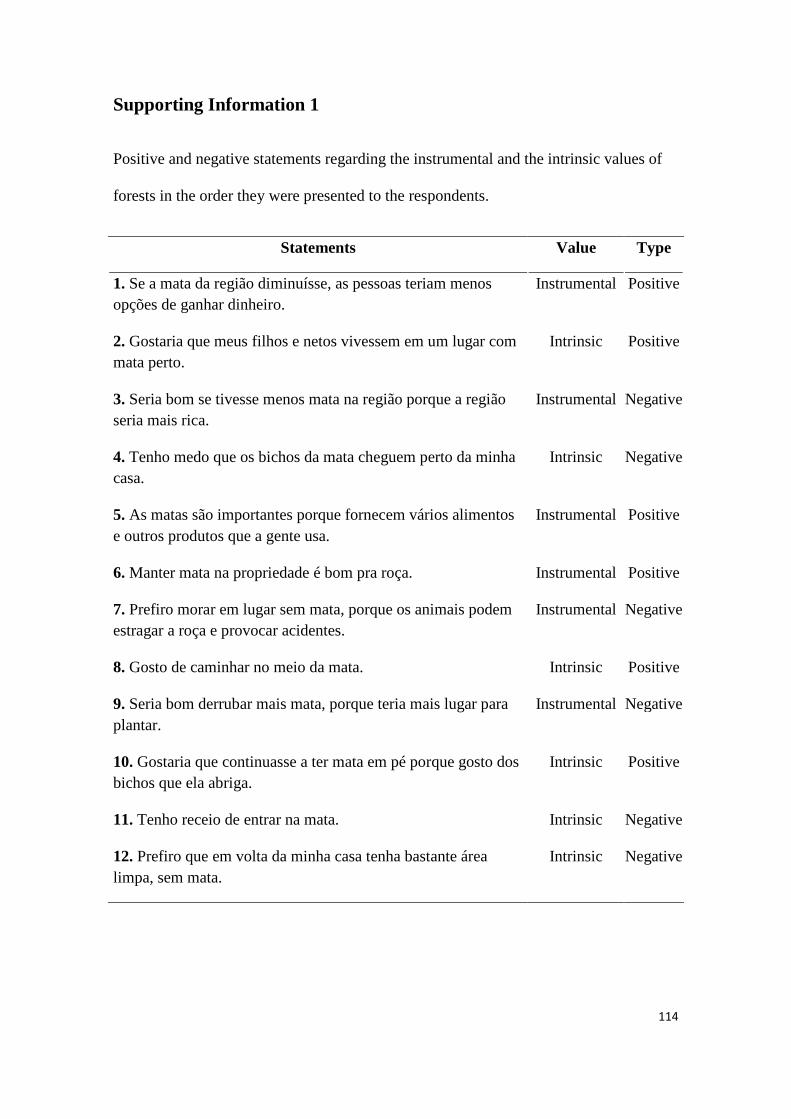
114
Supporting Information 1
Positive and negative statements regarding the instrumental and the intrinsic values of
forests in the order they were presented to the respondents.
Statements Value Type
1. Se a mata da região diminuísse, as pessoas teriam menos opções de ganhar dinheiro.
Instrumental Positive
2. Gostaria que meus filhos e netos vivessem em um lugar com mata perto.
Intrinsic Positive
3. Seria bom se tivesse menos mata na região porque a região seria mais rica.
Instrumental Negative
4. Tenho medo que os bichos da mata cheguem perto da minha casa.
Intrinsic Negative
5. As matas são importantes porque fornecem vários alimentos e outros produtos que a gente usa.
Instrumental Positive
6. Manter mata na propriedade é bom pra roça. Instrumental Positive
7. Prefiro morar em lugar sem mata, porque os animais podem estragar a roça e provocar acidentes.
Instrumental Negative
8. Gosto de caminhar no meio da mata. Intrinsic Positive
9. Seria bom derrubar mais mata, porque teria mais lugar para plantar.
Instrumental Negative
10. Gostaria que continuasse a ter mata em pé porque gosto dos bichos que ela abriga.
Intrinsic Positive
11. Tenho receio de entrar na mata. Intrinsic Negative
12. Prefiro que em volta da minha casa tenha bastante área limpa, sem mata.
Intrinsic Negative

115
Supporting Information 2
We selected the measure of forest cover that best explained the variation in the Likert
scale for each type of forest value in a model selection using Akaike’s Information
Criterion modified for small samples (AICc). For each dependent variable (Likert scale
of instrumental and intrinsic value of forests), we compared a candidate set of simple
models each containing a different measure of forest cover, and selected the measure
contained in the first-ranked model (Table S1). To account for the hierarchical nature of
the sampling design, we used generalized linear mixed-effects models (GLMM). We
modeled the dependent variables as a variable with normal distribution and used a linear
function (link identity), since Likert scale, which should be constructed summing the
values of several items, are not considered ordinal scales, but rather produce interval
data (Carifio & Perla 2007). We modeled the different measures of forest cover as fixed
factors, and landscapes as a random factor. Fixed factors were standardized so that each
had a mean of zero and a standard deviation of one, a procedure adopted to help
improving convergence of the fitting algorithm (Zuur et al. 2009). Primary forest at 5-
km radius buffer was selected for the perception of the instrumental value of forests,
and primary forest at 1-km radius buffer for the perception of the intrinsic value of
forests.

116
Table S1. Model selection results for choosing the best measures of forest cover for
the perception of instrumental and intrinsic value of forests among 363 rural
residents in the study region. All candidate models are GLMM models with
landscapes as a random factor.
Model logLik AICc wAICc
Inst
rum
enta
l val
ue
Non-degraded primary forest at 5-km -1061.7 2131.6 0.088 Degraded and non-degraded primary forest at 5-km -1061.7 2131.6 0.087 All forest types at 5-km -1061.8 2131.7 0.084 Non-degraded primary forest at 4-km -1061.9 2131.8 0.078 Degraded and non-degraded primary forest at 4-km -1061.9 2131.8 0.078 Degraded and non-degraded primary forest at 3-km -1062.0 2132.0 0.071 Non-degraded primary forest at 3-km -1062.0 2132.0 0.070 Non-degraded primary forest at 2-km -1062.0 2132.1 0.069 All forest types at 4-km -1062.0 2132.1 0.068 Degraded and non-degraded primary forest at 2-km -1062.0 2132.1 0.068 All forest types at 3-km -1062.2 2132.5 0.056 Degraded and non-degraded primary forest at 1-km -1062.3 2132.8 0.048 Non-degraded primary forest at 1-km -1062.3 2132.8 0.048 All forest types at 2-km -1062.4 2132.9 0.045 All forest types at 1-km -1062.5 2133.1 0.042
Intr
insi
c va
lue
Non-degraded primary forest at 1-km -1070.0 2148.2 0.242 All forest types at 1-km -1070.1 2148.4 0.224 Degraded and non-degraded primary forest at 1-km -1070.6 2149.3 0.143 All forest types at 2-km -1071.2 2150.6 0.075 All forest types at 3-km -1071.9 2151.9 0.038 All forest types at 4-km -1072.0 2152.1 0.035 Degraded and non-degraded primary forest at 2-km -1072.0 2152.2 0.033 All forest types at 5-km -1072.1 2152.3 0.031 Non-degraded primary forest at 2-km -1072.2 2152.5 0.029 Non-degraded primary forest at 4-km -1072.3 2152.7 0.026 Degraded and non-degraded primary forest at 4-km -1072.3 2152.7 0.026 Non-degraded primary forest at 5-km -1072.3 2152.7 0.025 Degraded and non-degraded primary forest at 5-km -1072.3 2152.7 0.025 Non-degraded primary forest at 3-km -1072.3 2152.8 0.025 Degraded and non-degraded primary forest at 3-km -1072.4 2152.9 0.023
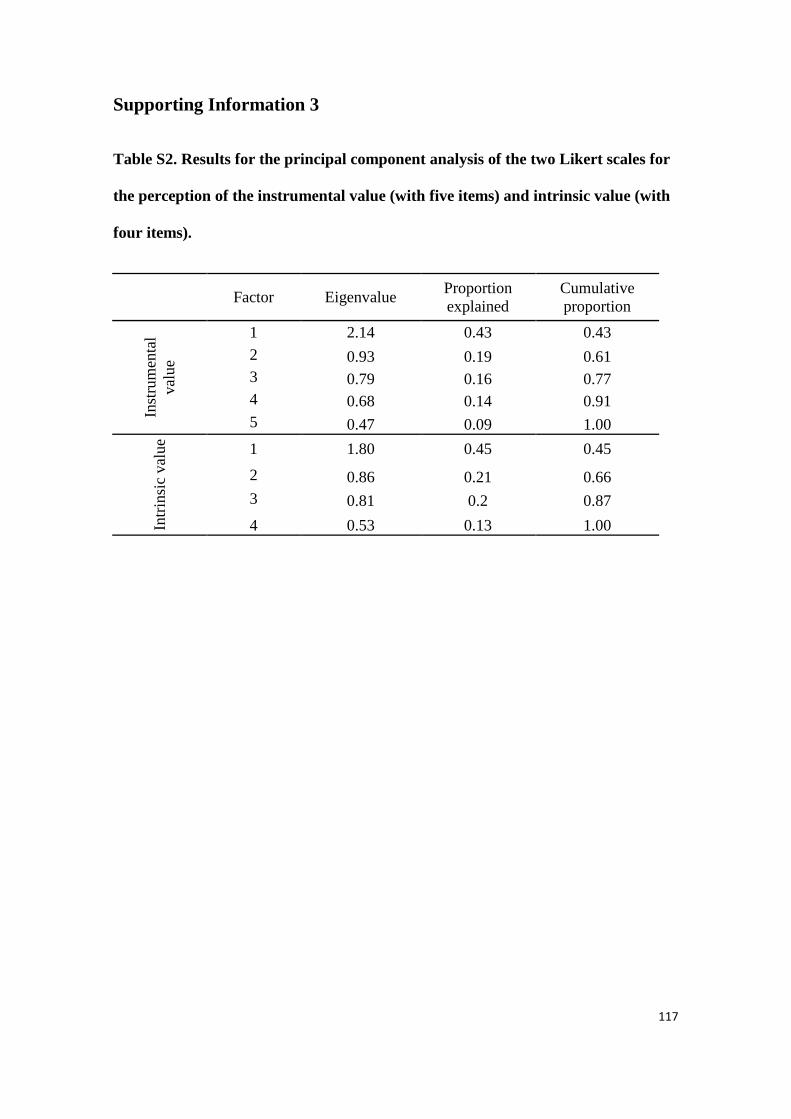
117
Supporting Information 3
Table S2. Results for the principal component analysis of the two Likert scales for
the perception of the instrumental value (with five items) and intrinsic value (with
four items).
Factor Eigenvalue Proportion explained
Cumulative proportion
Inst
rum
enta
l va
lue
1 2.14 0.43 0.43
2 0.93 0.19 0.61 3 0.79 0.16 0.77 4 0.68 0.14 0.91 5 0.47 0.09 1.00
Intr
insi
c va
lue
1 1.80 0.45 0.45
2 0.86 0.21 0.66 3 0.81 0.2 0.87
4 0.53 0.13 1.00

118
Figure S1. PCA biplots showing the variation in the values of the Likert scales for
the perception of instrumental value (with five items) and intrinsic value (with four
items) of forests among 363 rural residents in the study region. Residents as dots
and the items (positive – POS and negative – NEG) as vectors.

119
Considerações finais
Esta tese contribui para preencher a lacuna de conhecimento sobre os determinantes da
caça e consumo de carne silvestre, trazendo evidências de que fatores ambientais,
culturais e econômicos, em conjunto, são necessários para entender os padrões de
variação nessas atividades em regiões heterogenias, como as de fronteira agrícola
recentemente consolidada. Traz evidências também de que o consumo de carne silvestre
é um serviço importante provido pela floresta aos moradores da zona rural, em especial,
mas não apenas, àqueles que vivem em áreas mais remotas e florestadas, e está
positivamente relacionado à percepção das pessoas em relação ao valor da floresta.
No primeiro capítulo, os resultados indicam que fatores ambientais em maior
escala são determinantes importantes da caça. Porém, menos importantes para
determinar o consumo, que parece ser mais frequente que a caça, indicando a
importância do compartilhamento e/ou comércio na obtenção de carne silvestre. O
consumo de carne silvestre foi um pouco mais frequente em áreas remotas e mais
florestadas. A caça, por sua vez, foi bem mais frequente em áreas florestadas, mas
também em áreas mais próximas a centros urbanos, quando controlada a variação na
cobertura florestal. Caçadores próximos a centros urbanos podem estar se beneficiando
da extensa malha viária, característica de regiões de fronteira consolidada, para se
deslocar e caçar em áreas mais afastadas, onde o retorno da caça é provavelmente maior
(Fa et al. 2009, Brashares et al. 2011, Foerster et al. 2012), possivelmente contribuindo
para diminuir a população de animais caçados em áreas mais remotas. Assim, os
resultados sugerem que é improvável que a pressão de caça, mesmo em áreas mais
120
remotas, diminua com a migração para áreas urbanas (Parry et al. 2010, Wilkie et al.
2011), processo que vem se acentuando na Amazônia.
O segundo capítulo - primeiro estudo a avaliar diversos tipos de fatores em
conjunto - traz evidências de que a caça depende não só do contexto ambiental, mas
também do cultural, e ambos definem os efeitos de fatores econômicos. Para o consumo
de carne silvestre, fatores econômicos e culturais parecem mais importantes que os
fatores ambientais e podem sozinhos explicar a variação no uso deste recurso. Ainda
assim é possível que o efeito dos fatores econômicos dependa do contexto ambiental
também para o consumo de carne silvestre. De maneira geral, a caça e o consumo de
carne silvestre aumentaram com a renda monetária em áreas próximas a centros urbanos
e/ou menos florestadas, mas diminuíram com a renda monetária em áreas remotas e/ou
florestadas. Assim, os resultados indicam que a carne silvestre é considerada um tipo de
bem diferente a depender do contexto geográfico e ecológico, sendo um bem normal (ou
seja, cuja demanda aumenta com o aumento do poder aquisitivo do consumidor) em
áreas rurais alteradas próximas a centros urbanos e um bem inferior (ou seja, cuja
demanda diminui com o aumento do poder aquisitivo do consumidor) em áreas remotas
e florestadas. Além disso, os resultados ressaltam a enorme importância de dois fatores
raramente considerados em estudos anteriores – a dependência de atividades de
subsistência e a origem dos moradores. A caça e o consumo de carne silvestre foram
mais frequentes nas famílias de origem na região Amazônica e entre os que dependem
mais de atividades de subsistência para seu sustento.
Assim, estratégias que visem aumentar a renda dos habitantes da zona rural
podem ter um efeito não desejado na fauna dos animais mais comumente caçados – aves
e mamíferos de maior porte. Muitas vezes essas estratégias são fundamentais para

121
reduzir a pobreza em regiões rurais, mas também têm sido sugeridas como forma de
diminuir a pressão de caça em áreas rurais na África (Milner-Gulland et al. 2003) e, de
uma forma geral, o risco de extinção de espécies (McPherson & Nieswiadomy 2005).
Os resultados deste trabalho sugerem que o sucesso de intervenções econômicas que
visem tanto à redução da pobreza quanto à conservação da biodiversidade depende do
contexto ecológico e geográfico. O aumento da renda pode ser muito importante em
áreas mais florestadas e remotas, diminuindo a pressão de caça. Porém, em áreas mais
desmatadas e próximas a centros urbanos esse efeito pode ser contrário e, portanto,
devem vir acompanhados de maior controle da caça, em especial daquela voltada para o
comércio. Interessantemente, nas comunidades mais dependentes de atividades de
subsistência, aumentar a renda monetária pode diminuir a atividade de caça em qualquer
contexto ambiental. Por fim, os resultados sugerem que é provável que a caça exercida
por moradores originários da Amazônia se mantenha mesmo com o aumento de renda
ou de fontes alternativas de proteína. Para esses moradores, embora a caça possa ser
sustentável em áreas mais florestadas, controle da caça e educação ambiental são
necessários em áreas mais desmatadas.
Os resultados do terceiro capítulo desta tese indicam que a quantidade de carne
silvestre consumida influencia positivamente a percepção do valor utilitário da floresta.
Já a percepção do valor intrínseco da floresta está relacionada à quantidade de florestas
remanescentes no entorno imediato da residência dos moradores, sugerindo que o
contato com a floresta é importante nesse caso (Miller 2005, Zhang et al. 2014). Apesar
disso, há evidências de que fatores individuais são mais importantes que o consumo de
carne silvestre para a percepção do valor utilitário da floresta e tão importantes quando a
cobertura florestal no entorno para a percepção de seu valor intrínseco. Homens tendem
a valorizar mais a floresta sob ambos os aspectos, enquanto moradores que nasceram na

122
comunidade onde vivem tendem a valorizar mais a floresta por seu valor utilitário. De
fato, homens têm maior contato com a mata, são eles que no geral desenvolvem as
atividades de extração de produtos florestais, em especial a caça e, assim como
moradores que nasceram na comunidade, tem maior conhecimento sobre os seus
recursos (Brown & Reed 2000, Necheim et al. 2006, Paletto et al. 2013).
Estes resultados sugerem que, para além de estratégias que visem o bem-estar
humano via incentivos econômicos, há ampla oportunidade para iniciativas que
considerem outros aspectos do bem-estar associados aos serviços providos pela floresta
- sejam eles recursos como a carne de caça ou benefícios culturais e estéticos - uma vez
que em geral a percepção do valor das florestas foi bastante favorável. O estudo também
indica que um processo mais sutil que a urbanização – a perda de habitat em áreas rurais
– também pode levar a erosão do valor intrínseco da natureza. Nesse sentido, aponta
para a urgência em se implantar iniciativas de conservação que incluam as pessoas e
seus valores nas áreas mais alteradas, uma vez que é provável que haja um perigoso
ciclo de desvalorização da floresta, em que o desmatamento leva a diminuição da
percepção do valor das florestas, que, por sua vez, pode agravar o desmatamento.
Nessas áreas, o valor utilitário atribuído às florestas pela provisão de carne silvestre
pode ser importante, já que essa valorização não parece depender da cobertura florestal.
Referências
Brashares, J. S., Golden C. D., Weinbaum K. Z., Barret C. B., & Okello G. V. (2011)
Economic and geographic drivers of wildlife consumption in rural Africa.
Proceedings of the National Academy of Sciences of the United States of

123
America, 108, 13931–13936.
Brown, G. & Reed, P. (2000) Validation of a forest values typology for use in national
forest planning. Forest Science 46, 240–247
Fa, J. E., Albrechtsen, L., Johnson, P. J., & Macdonald, D. W. (2009) Linkages between
household wealth, bushmeat and other animal protein consumption are not
invariant: evidence from Rio Muni, Equatorial Guinea. Animal Conservation,
12, 599-610.
Foerster, S., Wilkie, D. S., Morelli, G. A., Demmer, J., Starkey, M., Telfer, P., Steil, M.
& Lewbel, A. (2012) Correlates of bushmeat hunting among remote rural
households in Gabon, Central Africa. Conservation Biology, 26, 335–344.
McPherson, M. A. & Nieswiadomy, M. L. (2005) Environmental Kuznets curve:
threatened species and spatial effects. Ecological Economics, 55, 395-407.
Miller, J. R. (2005) Biodiversity conservation and the extinction of experience. Trends
in Ecology and Evolution 20, 430-434.
Milner-Gulland, E.J., Bennet, E.L. & SCB 2002 Annual Meeting Wild Meat Group
(2003) Wild meat: the bigger picture. Trends in Ecology and Evolution 18, 351-
357.
Necheim, I., Dhillion, S. S. & Stolen, K. A. (2006) What happens to traditional
knowledge and use of natural resources when people migrate? Human Ecology
34, 99-131.
Paletto, A., Maino, F., De Meo, I. &Ferretti, F. (2013) Perception of forest value in the
alpine community of Trentino region (Italy). Environmental Management 51,
414-422.
Parry, L., Peres, C. A., Day, B., & Amaral, S. (2010) Rural–urban migration brings
conservation threats and opportunities to Amazonian watersheds. Conservation

124
Letters, 3, 251-259.
Wilkie, D. S., Bennett, E., L., Peres, C. A., & Cunningham, A. A. (2011) The empty
forest revisited. Annals of the New York Academy of Science, 1223, 120-128.
Zhang, W., Goodale, E. & Chen, J. (2014) How contact with nature affects children’s
biophilia, biophobia and conservation attitude in China. Biological Conservation
177, 109-116.