bio-valorization of crude glycerol through ... · este crescimento na produção global de...
TRANSCRIPT

André Correia Freches
Licenciado em Bioquímica
Bio-valorization of crude glycerol through
polyhydroxyalkanoates production
Dissertação para obtenção do Grau de Mestre em Biotecnologia
Orientador: Doutor Paulo Costa Lemos
Setembro 2015

André Correia Freches
Licenciado em Bioquímica
Bio-valorization of crude glycerol through
polyhydroxyalkanoates production
Dissertação para obtenção do Grau de Mestre em Biotecnologia
Orientador: Doutor Paulo Costa Lemos
Setembro 2015
I
Bio-valorization of crude glycerol through polyhydroxyalkanoates production
Copyright – André Correia Freches, Faculdade de Ciências e Tecnologia, Universidade Nova de
Lisboa
A Faculdade de Ciências e Tecnologia e a Universidade Nova de Lisboa têm o direito, perpétuo e
sem limites geográficos, de arquivar e publicar esta dissertação através de exemplares impressos
reproduzidos em papel ou de forma digital, ou por qualquer outro meio conhecido ou que venha a ser
inventado, e de a divulgar através de repositórios científicos e de admitir a sua cópia e distribuição
com objectivos educacionais ou de investigação, não comerciais, desde que seja dado crédito ao
autor e editor.

II

III
Agradecimentos Em primeiro lugar gostaria de agradecer ao Doutor Paulo Costa Lemos pela oportunidade que
me deu em realizar o meu trabalho experimental inserido no seu grupo de investigação, por toda a ajuda prestada ao longo desse período, pelas várias discussões de resultados que fizemos, por todas as vezes que tinha uma palavra de incentivo e apoio quando os resultados não estavam a ser os melhores e por toda a preocupação demonstrada de forma a ter a certeza de que nada me faltava. Tenho a consciência que sem esse apoio, não teria sido possível obter os resultados desta dissertação.
Agradeço também à Doutora Rita Moita Fidalgo por todo o apoio, pela constante disponibilidade em ajudar e ensinar, pelos brainstormings constantes no gabinete e pelas horas passadas em conjunto a fazer diárias e cinéticas, e a analisar resultados. Tenho a noção que grande parte do que aprendi sobre reactores biológicos durante este período se deve à tua persistência e gosto em ensinar.
Ao restante grupo de investigação com o qual convivi durante este período, Joana Ortigueira, Marília Santos e Rita Pontes, um obrigado carinhoso, além de terem uma boa disposição diária difícil de igualar, sempre que precisei de ajuda vocês foram impecáveis.
Uma palavra de agradecimento também para a Doutora Helena Santos pela disponibilidade em usar o laboratório e equipamento do seu grupo de investigação no ITQB quando assim o necessitei. Agradeço também à Doutora Ana Lúcia Carvalho por toda a assistência prestada sempre que necessitei.
Agradeço à Faculdade de Ciências e Tecnologia da Universidade Nova de Lisboa por ter sido sempre bem tratado por todo e qualquer funcionário, os anos de faculdade são os melhores na vida de qualquer pessoa e recordarei estes tempos com saudade. Ao corpo docente da Faculdade, um agradecimento por sempre terem feito o seu máximo para chegar a cada aluno e pelo gosto de ensinar inerente a todos.
Em último lugar, mas não menos importante, quero agradecer a todos os meus familiares
pelo apoio, em especial aos meus pais que sempre fizeram tudo para que nada me faltasse
mostrando-me, ao mesmo tempo, que ninguém nos oferece nada na vida e que temos que trabalhar
por aquilo que queremos.

IV

V
Abstract
Due to the prospective partial replacement of fossil fuels by biodiesel, its production has
continuously grown in the last decade. The increase in global biodiesel production demands the
development of sustainable applications of its main by-product, crude glycerol. In this thesis the
feasibility of producing polyhydroxyalkanoates (PHA) by a mixed microbial community using crude
glycerol as feedstock was investigated. Several incubation conditions were studied in order to
maximize PHA production. The microbial population selected under aerobic dynamic feeding
conditions had the ability to consume both major carbon fractions present in the crude, glycerol and
methanol. Two biopolymers were stored, poly-3-hydroxybutyrate (PHB) and glucose biopolymer (GB),
apparently using glycerol as the only carbon source for their production. The microbial enrichment
obtained was able to accumulate up to 47% PHB of cell dry weight with a productivity of 0.24 g HA/L
d. The overall PHA yield on total substrate consumed (0.32 g COD HB/g COD crude glycerol) was in
the middle range of those reported in literature (0.08–0.58 g COD PHA/g COD real waste). The
increase of temperature from 23ºC to 30ºC favored the culture fraction that accumulates glucose
biopolymer with a maximum accumulation value of 25% of cell dry weight, which is an interesting
value but not the main goal of this thesis. The fact that crude glycerol can be used to produce PHA
without any pre-treatment step, makes the overall production process economically more competitive,
reducing polymer final cost. This was the first study that demonstrates the valorization of the glycerol
fraction present in the crude glycerol into PHA using an aerobic mixed microbial consortium.

VI

VII
Resumo
A produção mundial de biodiesel tem verificado um crescimento contínuo na última década,
principalmente devido a este biocombustível se apresentar com alternativa viável aos combustíveis
fósseis. Este crescimento na produção global de biodiesel requer o desenvolvimento de aplicações
sustentáveis para o seu principal subproduto, o glicerol crude. Nesta tese será estudada a utilização
de glicerol crude como fonte de alimentação numa cultura microbiana mista com o objectivo de
produzir biopolímeros, os polihidroxialcanoatos. Para este efeito, diversas condições de crescimento
e selecção de cultura foram avaliadas. A população microbiana seleccionada em regime de
alimentação aeróbica dinâmica revelou capacidade de consumir as duas principais fracções de
carbono presentes no glicerol crude, o glicerol e o metanol. Verificou-se a acumulação de dois
polímeros distintos, o poli-3-hidroxibutirato (PHB) e o biopolímero de glucose (GB). A cultura
seleccionada demonstrou ser capaz de acumular até 47% de PHB em peso seco da célula com uma
produtividade de 0.24 g HB/L.d. O rendimento global de PHA em relação ao substrato consumido
(0.32 g COD HB/g COD glicerol crude) situa-se no intervalo referenciado na literatura (0.08–0.58 g
COD PHA/g COD resíduo real). O aumento da temperatura, de 23ºC para 30ºC, revelou um
favorecimento da fracção da cultura microbiana que acumula biopolímero de glucose, sendo que a
sua capacidade de acumulação máxima situou-se nos 25% de GB em peso seco da célula. Apesar
de este valor ser interessante e merecer investigação adicional, o objectivo principal desta tese não
passa por estudar a acumulação de polímero de glucose. Ficou demonstrado que o glicerol crude
pode ser utilizado para a produção de PHA sem necessitar de qualquer passo adicional de
tratamento, facto que reduz o preço final do polímero, tornando este processo economicamente mais
competitivo. Este foi o primeiro estudo que demonstrou a valorização da fracção do glicerol presente
no glicerol crude, através da produção de PHA utilizando a cultura microbiana aeróbica mista.

VIII
IX
List of Contents
1. Introduction …………………………………………………………………………………………………....1
Biodiesel – a future solution …………………………………………………………………………..1
Biodiesel – composition and production methods ………………………………………………….2
Refined glycerol – a world of applications …………………………………………………………..7
Crude Glycerol – characterization and applications ………………………………………………..9
Crude glycerol as feed supplement ………………………………………………………...9
Chemicals produced via biological conversions …………………………………………..9
Polyhydroxyalkanoates ………………………………………………………………………………11
PHA production methods …………………………………………………………………………….15
Mixed microbial cultures ……………………………………………………………………17
Important process parameters ………………………………………………………….....23
2. Materials and Methods ……………………………………………………………………………………..27
PHA-accumulation culture enrichment ……………………………………………………………..27
Batch accumulation assays ………………………………………………………………………….28
Crude glycerol versus pure substrate: influence on the biopolymers production ……………...28
Maximizing storage capacity of the selected culture ……………………………………………..29
Analytical Methods ……………………………………………………………………………………29
Calculations …………………………………………………………………………………………...30
3. Results and Discussion …………………………………………………………………………………….31
Culture selection phase for PHA production ………………………………………………………31
Culture selection phase for glycogen production ………………………………………………….40
Preliminary PHA accumulation tests ……………………………………………………………….42
Maximum PHA storage capacity tests ……………………………………………………………..47
4. Conclusions and Futurework ………………………………………………………………………………53
Bibliography …………………………………………………………………………………………………….55

X

XI
List of Figures
Figure 1.1 - European Biodiesel Production (ktonnes), from European Biodiesel Board ....................... 1 Figure 1.2 - Number of scientific publications and patents published on biodiesel................................. 2 Figure 1.3 - Transesterification reaction scheme .................................................................................... 3 Figure 1.4 - Possible biodiesel production approaches .......................................................................... 4 Figure 1.5 - Selective hydrogenation of polyunsaturated methyl esters of linseed (MELO), sunflower (MESO) and soybean oils (MESBO) ....................................................................................................... 5 Figure 1.6 – Glycerol industrial applications ............................................................................................ 7 Figure 1.7 – Glycerol possible derivatives ............................................................................................... 8 Figure 1.8 – A. - Intracellular granules of PHA (Laycock et al., 2013) ; B. - Chemical structure of PHA family: a) polyhydroxybutyrate; b) polyhydroxyvalerate; c) polyhydroxybutyrate-co-valerate ............... 11 Figure 1.9 - PHA accumulation pathways ............................................................................................. 13 Figure 1.10 - Comparison of economic and environmental performance ............................................. 17 Figure 1.11 - Three-step PHA production process by mixed microbial cultures ................................... 19 Figure 1.12 – PHA metabolic pathway in PAO/GAO Anaerobic systems.. ........................................... 20 Figure 1.13 - Possible metabolic pathway for acetate consumption under feast/famine conditions..... 21 Figure 1.14 - Aerobic Dynamic Feeding method ................................................................................... 22 Figure 2.1 – Experimental setup ........................................................................................................... 30
Figure 3.1 - Working timeline of the reactor …………………………………………………………………31
Figure 3.2 - Nile blue staining image (400x) – filamentous bacteria (stage 1)…………………………..32
Figure 3.3– Nile blue staining (400x) – filamentous bacteria sporulating (stage 4)……………………..34
Figure 3.4 – Feast/famine ratio (60 days) …………………………………………………………………...35
Figure 3.5 – A: variation of glycerol, methanol, ammonia, HB and GB in a typical daily cycle; B: Dissolved oxygen (DO) and pH variation during a typical daily cycle ……………………………………36
Figure 3.6 - Active Biomass variation during a typical daily cycle ………………………………………..38
Figure 3.7 – Important parameters of the daily cycles ……………………………………………………..39
Figure 3.8 – A: Comparison between GB yield and GB content; B: Typical cycle of the reactor (first five hours) ……………………………………………………………………………………………………………40
Figure 3.9 - Maximum glycogen and PHB contents achieved in each pulse (% of cell dry weight)…...41
Figure 3.10 - Variation of consumed glycerol (Cmmol/L) in the three assays (GM1, GM2 and GM3 – 3 pulses) ………………………………………………………………………………………………………......42

XII
Figure 3.11 - Variation of produced HB (Cmmol/L) in the three assays (GM1, GM2 and GM3 – 3 pulses)……………………………………………………………………………………………………………44
Figure 3.12 - Variation of produced GB (Cmmol Glu/L) in the three assays (GM1, GM2 and GM3 – 3 pulses)……………………………………………………………………………………………………………44
Figure 3.13 - GA1 assay evolution……………………………………………………………………………47
Figure 3.14 - GA2 assay evolution……………………………………………………………………………48
Figure 3.15 - GA3 assay evolution ........................................................................................................ 49
Figure 3.16 – A and B: Nile blue staining observation (400x); C and D: phase contrast………………52

XIII
List of Tables
Table 1.1 - The current and potential large volume manufacturers of polyhydroxyalkanoates …...…..16
Table 1.2 - Comparison of several PHAs production process in recombinant E. coli ……...…………..16
Table 3.1 - Working conditions of the several stages ……………………………………………………...31
Table 3.2 – SVI-30 index (stage 2) …………………………………………………………………………..33
Table 3.3 – SVI-30 index (stage 3) …………………………………………………………………………..34
Table 3.4 - Relevant kinetic and stoichiometric parameters analysis of the preliminary PHA accumulation tests ……………………………………………………………………………………………..46
Table 3.5 - Relevant kinetic and stoichiometric parameters analysis of the maximum PHA storage capacity tests …………………………………………………………………………………………………...50
Table 3.6 - Important studies on PHA accumulation ……………………………………………………....51

XIV

XV
List of Abbreviations FFA – free fatty acids ……………………………………………………………………………………………2
FAME – free acyl methyl esters …………………………………………………………………………….....5
FT – Fischer-Tropsch …………………………………………………………………………………………...6
BC – bacterial cellulose ……………………………………………………………………………………….10
PTT – polytrimethylene terephthalate …………………………………………………………………….....10
PET – polyethylene terephthalate ……………………………………………………………………………10
PBT – polybutylene terephthalate ……………………………………………………………………………10
DHA – decohexanoic acid …………………………………………………………………………………….10
PHA – polyhydroxyalkanoate …………………………………………………………………………………11
scl-PHA – short chain length PHA ……………………………………………………………………………11
mcl-PHA – medium chain length PHA ……………………………………………………………………….11
P3HB – poly-3-hydroxybutirate ……………………………………………………………………………….12
P(3HB-co-3HV) – poly-3-hydroxybutirate-co-3-hydroxyvalerate ………………………………………….12
PLA – polylactic acid …………………………………………………………………………………………..14
MMC – mixed microbial culture ………………………………………………………………………………17
OMEs – oil mill effluents ………………………………………………………………………………………18
VFAs – volatile fatty acids …………………………………………………………………………………….18
HV – hydroxyvalerate ………………………………………………………………………………………….18
HB – hydroxybutirate …………………………………………………………………………………………..18
RBCOD - readily biodegradable carbon sources …………………………………………………………..19
PAOs – Phosphorous Accumulating Organisms …………………………………………………………...20
GAOs – Glycogen Accumulating Organisms ……………………………………………………………….20
ADF – aerobic dynamic feeding ………………………………………………………………………………20
SBR – sequence batch reactor ……………………………………………………………………………….22
DO – dissolved oxygen ………………………………………………………………………………………..23
SRT – sludge retention time …………………………………………………………………………………..23
OLR – organic loading rate ……………………………………………………………………………………24
TOC – total organic carbon …………………………………………………………………………………...27
HRT – hydraulic retention time ……………………………………………………………………………….27
OUR – oxygen uptake rate ……………………………………………………………………………………28

XVI

1
1. Introduction Biodiesel – a future solution
Biodiesel production has continuously grown in the last decade (Total EU27 biodiesel
production for 2010 was over 9.5 million metric tons - European Biodiesel Board). Biodiesel is a fuel
much less contaminant for the environment than conventional diesel because it is a safe, renewable,
non-toxic and biodegradable fuel which represents a strategic source of energy. Despite having a
production cost greater than diesel from petroleum, many governments sustain this production for
reducing the environmental impact. For example, an European Directive imposes a 10% volume of
biofuels in the transport sector by 2020 (Santacesaria et al. 2012).
As observed in Figure 1.1, the production of biofuels, and biodiesel more specifically, has
increased in the last few years. This increase was driven mainly by Germany which is the major
biodiesel producer (2750 k tons in 2011). Nevertheless, others EU members are making important
efforts to keep up with the biofuel production directives. For example, in Portugal there is an installed
production capacity of 483 k tons.
However, biodiesel production process still struggles against some key problems, such as the
reduction of the production costs and the competition between the production of energy and food.
Many researchers are working for solving both these problems. As it can be seen in Figure 1.2, there
was an exponential growth of published papers and patents related to biodiesel in the last few years.
Figure 1.1 - European Biodiesel Production (k tons), from European Biodiesel Board

2
Figure 1.2 - Number of scientific publications and patents published on biodiesel (data obtained from Web of Science
TM and European Patents Office website)
Biodiesel – composition and production methods
Biodiesel is defined as a fuel comprised of mono-alkyl esters of long chain fatty acids derived
from vegetable oils or animal fats, either in pure form or mixed in any combination with petroleum-
based diesel fuel. The first generation biodiesels can be obtained by transesterification of vegetable
oils with methanol in the presence of a catalyst. Vegetable oils are composed of tri-glycerides of fatty
acids (a mixture of linear fatty acids, with an average number of 18 carbon atoms) (Santacesaria et al.
2012). Vegetable oils can be used directly in diesel engines; however, there are a number of
disadvantages of pure vegetable oils, including high viscosity, low volatility, and engine problems
(including coking on the injectors, carbon deposits, oil ring sticking, and thickening of lubricating oils).
These problems require that vegetable oils be upgraded if they are to be used as a fuel. The most
common way of upgrading vegetable oils to a fuel is transesterification of triglycerides into alkyl-fatty
esters (bio-diesel). Waste vegetable oils, like frying oils, can be used as feedstocks; however,
changes in the process need to be made as waste vegetable oils contain free fatty acid (FFA) and
water impurities. Vegetable oils can also be blended with diesel fuel or upgraded by other methods
including zeolite upgrading and pyrolysis (Huber et al. 2006).

3
The transesterification reaction occurs in three successive steps forming progressively di-
glycerides, mono-glycerides and glycerol. The simplified reaction scheme is the following one:
There are many catalysts used in this processes, since there are several ways to perform the
transesterification reaction, each one of them with its own advantages and disadvantages. The
catalysts can be divided into five categories: homogeneous base catalysts, heterogeneous base
catalysts, homogeneous acid catalysts, heterogeneous acid catalysts and enzymes. Using
homogenous base catalysts, such as NaOH or KOH, high conversions can be achieved at fast
reaction rates. Regarding the use of heterogeneous base catalysts (CaO or MgO) it is known that
there is a high possibility to reuse and regenerate the catalyst since the separation of catalyst from
product is easy. However, both catalysts have the disadvantage of excessive soap formation which
will reduce the biodiesel yield and cause problems during product purification. Homogeneous acid
catalysts, such as H2SO4 or HCl, can be also used in this reaction with the advantage that
esterification and transesterification can occur simultaneously. The use of heterogeneous acid
catalysts (TiO2 or zeolites) carries the advantage that the washing step of biodiesel is eliminated. Both
acid catalysts have in common the insensitiveness to FFA content and water content in the oil, but
high reaction temperatures are required. Last but not least, enzymes, such as Lipozym IM 60, can be
used as catalysts with several advantages such as the insensitiveness to FFA and water content in
the oil, the low reaction temperature and the simple product purification process. However, the
reaction rate is lower than other catalysts and there is a high sensitivity to alcohol (methanol can
deactivate the enzyme) (Tan et al. 2013).
The selection of proper feedstock is important to ensure the low biodiesel production cost
since the cost of feedstock accounts for about 75% of the total cost of biodiesel production (Tan et al.
2013). In general, biodiesel feedstock can be categorized into three groups: first generation, second
generation and third generation biodiesel feedstock. The first generation includes several oils such as
palm oil, rapessed, soybean oil, peanut oil and sunflower oil. These oils are known as food feedstock,
are limited and caused the competition with the edible oil market. Their utilization as biodiesel
feedstock has also a high impact on food markets and security as well as a negative environmental
impact as large portions of land were required to plant the biodiesel crops. The second generation
integrates Jatropha oil, sea mango, tobacco seed oil, salmon oil, waste cooking oils and tallow. These
feedstocks have reduced competition for food and feedstock and are environmentally friendly as less
Figure 1.3 - Transesterification reaction scheme (Tan et al. 2013)
4
farmland is required. However, the resulting biodiesel has poor performance in cold temperature and
the use of animal fats brings a biosafety issue as they may obtain from contaminated animals. The
third generation biodiesel feedstock is composed by microalgae. It is an economic, renewable and
carbon neutral source of biofuel with enhanced cost efficiencies due to it fast reproduction as they are
easier to cultivate. Microalgae are also environmentally friendly because they do not compete for
farmland with crop. The use of microalgae can also bring the advantage of producing valuable by-
products in the process such as biopolymers and proteins (Tan et al. 2013).
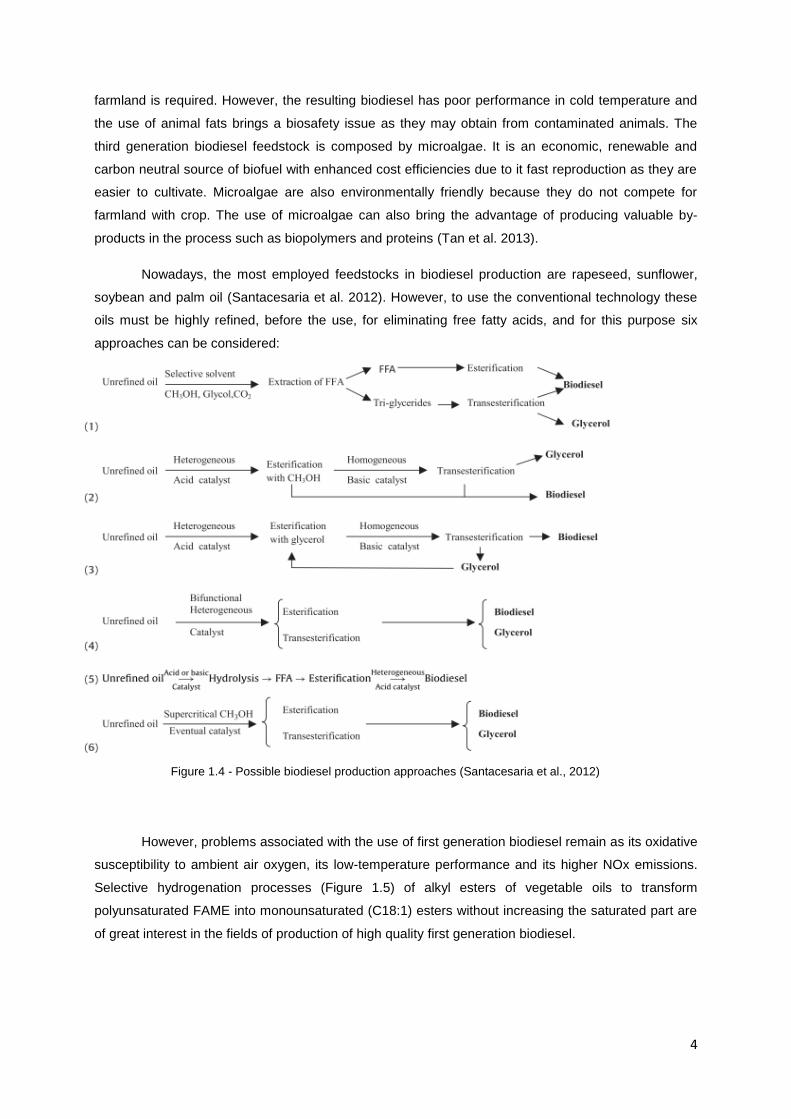
Nowadays, the most employed feedstocks in biodiesel production are rapeseed, sunflower,
soybean and palm oil (Santacesaria et al. 2012). However, to use the conventional technology these
oils must be highly refined, before the use, for eliminating free fatty acids, and for this purpose six
approaches can be considered:
However, problems associated with the use of first generation biodiesel remain as its oxidative
susceptibility to ambient air oxygen, its low-temperature performance and its higher NOx emissions.
Selective hydrogenation processes (Figure 1.5) of alkyl esters of vegetable oils to transform
polyunsaturated FAME into monounsaturated (C18:1) esters without increasing the saturated part are
of great interest in the fields of production of high quality first generation biodiesel.
Figure 1.4 - Possible biodiesel production approaches (Santacesaria et al., 2012)

5
The first aim of these processes is to improve oxidative stability as selective hydrogenation of
polyunsaturated free acyl methyl esters (FAME) to C18:1 esters substantially increases their oxidation
stabilities and greatly improve the ageing/storage properties of biodiesel which makes the addition of
synthetic antioxidants superfluous. The second aim of selective hydrogenation to C18:1 esters is to
avoid deterioration in low-temperature behavior such as on the pour point because of the higher
melting point of the saturated part, i.e. methyl stearate (MS). The third aim is to increase the
performance of biofuel. The fourth aim is to combat the NOx-effect: the increase of NOx emissions
observed in most studies of biodiesel. Pure biodiesel (B 100) increases NOx emissions by 12%
compared with pure petrodiesel and conventional B20 blends (20% biodiesel in petrodiesel) produced
a NOx increase of 3–5% compared to petroleum diesel (Bouriazos et al. 2010).
Figure 1.5 - Selective hydrogenation of polyunsaturated methyl esters of linseed (MELO), sunflower (MESO) and soybean oils (MESBO) (Bouriazos et al. 2010)

6
The Fischer-Tropsch (FT) process is an industrial process to produce alkanes from syn-gas
using Co-, Fe
-, or Ru-based catalysts (Huber et al. 2006) and also another interesting source of
biofuels, as this fuel option has several notable advantages. First, the FT process can produce
hydrocarbons of different length (also known as FT liquids) from any carbonaceous feedstock, such as
coal, natural gas (including stranded gas), or biomass, which can then be refined to easily
transportable liquid fuels. Secondly, because of their functional similarities to conventional refinery
products, FT products (i.e., final products refined from FT liquids) can be handled by existing
transportation, storage, and refueling infrastructure for petroleum products, are largely compatible with
current vehicles, and are blendable with current petroleum fuels. Thirdly, FT products are of high
quality, being free of sulfur, nitrogen, aromatics, and other contaminants typically found in petroleum
products, which is especially true for FT-diesel with a very high cetane number (Takeshita & Yamaji
2008). Nevertheless, drawbacks also exist for the FT process: the capital costs of FT conversion
plants are relatively higher and the energy efficiency of producing FT liquids is relatively lower than for
other alternative fuels such as hydrogen, methanol, dimethyl ether, and conventional biofuels
(Takeshita & Yamaji 2008).
In most approaches of biodiesel production, it can be observed that glycerol is obtained as by-
product. As a matter of fact, biodiesel production will generate about 10% (w/w) of crude glycerol as
the main byproduct (Santacesaria et al. 2012). This surplus of crude glycerol from biodiesel production
will impact the refined glycerol market, a topic to be assessed further ahead.

7
Refined glycerol – a world of applications
Glycerol is a valuable by-product as it has a wide range of industrial applications. At present,
glycerol has over two thousand different applications, especially in pharmaceuticals, personal care,
foods and cosmetics, as shown in Figure 1.6.
Glycerol is a nontoxic, edible, biodegradable compound, thus, it will provide important
environmental benefits to the new platform products. Glycerol is widely used in the manufacture of
drugs, medicine and pharmaceuticals for the purpose of dissolving drugs, giving the pills humidity and
increasing the viscosity of liquid drugs. It is used in cough syrups, ear infection medicines, as a carrier
for antibiotics and antiseptics and plasticizers for medicine capsules (Tan et al. 2013).
Figure 1.6 – Glycerol industrial applications (Tan et al. 2013)
Moreover, glycerol is used in personal care formulations, mainly as a means of providing
lubrication, improving smoothness, and as a humectant and moistener in many skin and hair care
products where moisturization is desired (Tan et al. 2013). Glycerol is also the major ingredient in
toothpastes to prevent hardening and drying out in the tube, thus, toothpastes are estimated to make
up almost one-third of the personal care market for glycerol. In the food and beverage industry,
glycerol acts as a solvent, sweetener and preservative agent. It is normally ingested in manufacturing
extracts of tea, coffee, ginger and other vegetable substances. It is also used as a softening agent in
bread, cakes, meats, cheese and candy. There is no objection to the use of glycerol in food and
beverage industry, provided it is purified and quantity suitable for food use (Tan et al. 2013). Glycerol
can be used as well to preserve the freshness of tobacco and regulate the moisture content of tobacco
in order to eliminate the unpleasant irritating taste. In paper production, glycerol is used as a
plasticizer and lubricant. In the textile industry, it is used in sizing, lubricating and softening yarn and
fabric (Tan et al. 2013). Although many other uses have been developed, most product markets are
small and fragmented, reflecting glycerol’s relatively high price. If prices drop, glycerol might become a
major building block for the biorefinery industry.

8
Figure 1.7 – Glycerol possible derivatives
In fact, many derivatives can be obtained using glycerol as a building block. When oxidized
glycerol forms glyceric acid which can be used as polyester fibers with better polymeric properties.
Glycerol can be also submitted to hydrogenolysis, or bond breaking, and form propylene glycol and
1,3-propanediol, derivatives that can be used to produce antifreeze and sorona fiber, respectively. The
direct polymerization of glycerol is another strategy to produce derivatives with economic interest such
as branched polyesters and polyols that can be used to produce unsaturated polyurethane and resins.
The use of glycerol as a building block has several technical barriers which include the alcohols (ROH)
to acids (RCOOH) transformation in oxidation reactions, the specificity for carbon-carbon and carbon-
oxygen bonds in bond breaking and the selective esterification to control branching in direct
polymerization (Fernando et al. 2006). Nevertheless, a significant increase in the applications of
glycerol, ranging from the small lab to the full industrial scale, both as a solvent and a building block is
in progress. The main driving forces behind this success in chemical processes and synthesis are
safety issues, easy storage, handling and disposal, low environmental impact and cost (Cintas et al.
2014). Figure 1.7 describes the wide potential of glycerol as a starting material or building block.
The worldwide production of glycerol is estimated to be around 750,000 t per year, almost
entirely produced from triglycerides; only 12% of the worldwide production is made synthetically (Tan
et al. 2013). The market of glycerol is volatile and its prices are strongly dependent on the supply. In
the near future, the supply of crude glycerol might be greatly dependent on the biodiesel plant due to
the growth of biodiesel plant whereby glycerol is produced as the by-product. Since purified glycerol is
a high-value and commercial chemical, the crude glycerol presents great opportunities for new
applications. The interest in crude glycerol resides in its low production cost, since it is a biodiesel
production by-product, as demonstrated before. For that reason, attention is being paid to the

9
utilization of crude glycerol from biodiesel production in order to defray the production cost of biodiesel
and to promote biodiesel industrialization on a large scale.
Crude Glycerol – characterization and applications
The chemical composition of crude glycerol varies with the type of catalyst used to produce
biodiesel, the transesterification efficiency, recovery efficiency of the biodiesel, other impurities in the
feedstock, and whether the alcohol and catalysts were recovered. All of these considerations
contribute to the composition of the crude glycerol fraction.
A study that investigated the chemical compositions of 11 crude glycerol collected from 7
Australian biodiesel producers indicated that the glycerol content ranged between 38% and 96%, with
some samples including more than 14% methanol and 29% ash (Yang et al. 2012). Accordingly,
methanol, soap, catalysts, salts, non-glycerol organic matter, and water impurities usually are
contained in the crude glycerol. For example, crude glycerol from sunflower oil biodiesel production
had the following composition (w/w): 30% glycerol, 50% methanol, 13% soap, 2% moisture,
approximately 2-3% salts (primarily sodium and potassium), and 2-3% other impurities (Yang et al.
2012). Recently, numerous papers have been published on direct utilization of crude glycerol from
biodiesel production.
Crude glycerol as animal feed supplement
Glycerol has high absorption rates and is a good energy source. Once absorbed, it can be
converted to glucose for energy production in the liver of animals by the enzyme glycerol kinase (Yang
et al. 2012). However, excess glycerol in the animal diet may affect normal physiological metabolism.
A few manuscripts have been published that focused on the levels of crude glycerol fed and the
performance of crude glycerol in animal feeds. Crude glycerol, added at up to 15% dry matter in the
diets of finishing lambs, could improve feedlot performance and had no associated effect on carcass
characteristics (Gunn et al. 2010). In addition, the inclusion of purified glycerol at up to 15% of the dry
matter ration of lactating dairy cows was possible, without deleterious effects on feed intake, milk
production, and yield (Donkin et al. 2009). When crude glycerol was added at levels of 8% or less,
based on dry matter in cattle finishing diets, it improved weight gain and feed efficiency (Parsons et al.
2009). In all, the use of crude glycerol as an animal feed component has great potential for replacing
corn in diets, and is gaining increasing attention. However, one must be aware of the presence of
potential hazardous impurities in crude glycerol from biodiesel (Yang et al. 2012).
Chemicals produced via biological conversions
Several processes for producing chemicals from crude glycerol via biotransformations have
been developed, such as succinic acid production by Basfia succiniciproducens DD1. The process
was characterized as having great stability and attractive production cost. However, the final
production strain needs to be examined further for commercial succinic acid production (Scholten et
al. 2009). Crude glycerol also could be an economic carbon and nutrient source for bacterial cellulose

10
(BC) production. BC presents very interesting properties such as high purity, unique physical and
mechanical properties that arise from its tridimensional and branched nano and micro-fibrillar structure
and biocompatibility. These singular characteristics triggered considerable interest on BC, particularly
in the biomedical area. Some examples of applications are as wound healing membranes for
substituting natural skin, cirurgical implants but also other high added value applications such as
membranes for audio devices and optically transparent nanocomposites. (Carreira et al. 2011) studied
the utilization of several residues to produce bacterial cellulose and the BC amount obtained using
crude glycerol was about 0.1 g/L after 96 h incubation. The addition of other nutrient sources (yeast
extract, nitrogen and phosphate) to crude glycerol culture media increased the BC production by
~200% (Carreira et al. 2011).
Crude glycerol has also been demonstrated as one suitable substrate for anaerobic
fermentative production of 1, 3-propanediol, which is one of the most promising options for biological
conversion of glycerol. 1,3-propanediol is a monomer having potential utility in the manufacture of
polyurethanes, cyclic compounds and a new type of polyester, PTT (polytrimethylene terephthalate).
PTT fibers display outstanding mechanical and chemical resistance compared with PET (polyethylene
terephthalate) and PBT (polybutylene terephthalate). Mu et al., demonstrated that crude glycerol could
be used directly for the production of 1, 3-propanediol in fed-batch cultures of Klebsiella pneumoniae.
The differences between the final 1, 3-propanediol concentrations were small for crude glycerol (51.3
g/L) and lipase-catalysis (53 g/L) which implied that the composition of crude glycerol had little effect
on the biological conversion and a low fermentation cost could be expected (Mu et al. 2008).
A promising use of crude glycerol is in the production of hydrogen, under development as a
future fuel. In fact, (Sabourin-Provost & Hallenbeck 2009)demonstrated that the bacterium
Rhodopseudomonas palustris could convert crude glycerol in hydrogen via photofermentation. The
productions obtained from crude glycerol and pure glycerol were nearly equal. Up to 6 moles H2 per
mole glycerol were obtained, which was 75% of theoretical. However, some obstacles still need to be
solved, such as enhancing the efficiency of light utilization by the organisms and developing effective
photobioreactors (Sabourin-Provost & Hallenbeck 2009). Another fermentation process using crude
glycerol as main substrate is the production of docosahexaenoic acid (DHA)-rich algae by
fermentation of the alga Schizochytrium limacinum, as demonstrated by the work of Chi et al. In fact,
DHA is an important omega-3 polyunsaturated fatty acid with medically established therapeutic
capabilities against cardiovascular diseases, cancers, schizophrenia, and Alzheimer. It is also an
essential nutrient during early human development. With the purpose of supporting alga growth and
DHA production, 75-100 g/L concentration of crude glycerol was recommended as the optimal range.
The factors that influenced algal DHA yield significantly were temperature and ammonium acetate
concentration with optimal amounts of 19.2°C and 1.0 g/L, respectively. The highest DHA yield
obtained was 4.91 g/L under the optimized culture conditions (Chi et al. 2007).
Another example of the utilization of crude glycerol as the sole carbon source is the production
of lipids, which might be a sustainable biodiesel feedstock. For example, crude glycerol could be used
for culturing the algae Schizochytrium limacinum SR21 and Cryptococcus curvatus. Algal growth and

11
lipid production were affected by the concentrations of glycerol, since higher concentrations of glycerol
had negative effects on cell growth. The optimal glycerol concentrations for untreated and treated
crude glycerol were, respectively, 25 and 35 g/L, regarding the batch culturing of crude glycerol. With
35 g/L, the obtained highest cellular lipid content was 73.3% (Liang et al. 2010).
As can be seen, crude glycerol has a great variety of applications, every single one of them
being interesting and industrially relevant. Last but certainly not least, crude glycerol can be used as
substrate for polyhydroxyalkanoates production. Polyhydroxyalkanoates represent a complex class of
naturally occurring bacterial polyesters and have been recognized as good substitutes for non-
biodegradable petrochemically produced polymers.
Polyhydroxyalcanoates
Polyhydroxyalkanoates (PHAs) are a unique family of polymers that act as a carbon/energy
store for more than 300 species of Gram-positive and Gram-negative bacteria as well as a wide range
of Archaea. Synthesized intracellularly as insoluble cytoplasmic inclusions in the presence of excess
carbon when other essential nutrients such as oxygen, phosphorous or nitrogen are limited, these
polymeric materials are able to be stored at high concentrations within the cell since they do not alter
its osmotic state. The resulting polymers are piezoelectric and perfectly isotactic/optically active
(having only the (R)-configuration). They are hydrophobic, water-insoluble and inert. These
biopolymers are also thermoplastic and/or elastomeric, non-toxic and have very high purity within the
cell. PHA has a much better resistance to UV degradation than polypropylene but is less solvent
resistant. Most importantly, these biopolymers are completely biodegradable (Laycock et al. 2013).
Figure 1.8 – A. - Intracellular granules of PHA (Laycock et al. 2013) ; B. - Chemical structure of PHA family: a) polyhydroxybutyrate; b) polyhydroxyvalerate; c) polyhydroxybutyrate-co-valerate (Bugnicourt 2014)
In general, PHAs can be divided into two main groups, these being the short-chain-length
PHAs (scl-PHAs) that contain monomer units with 3–5 carbon atoms, and the medium-chain-length
PHAs (mcl-PHAs) that contain monomer units of 6–18 carbon atoms. The most common PHAs are

12
poly(3-hydroxybutyrate (P3HB) and poly(3- hydroxybutyrate-co-3-hydroxyvalerate) (P(3HB-co-3HV)).
PHB is a homo polymer of 3-hydroxybutyrate and is the most widespread and best characterized
member of the polyhydroxyalkanoate family (Figure 1.8, B., a)). Other family members are displayed
in Figure 1.8, B., b) and c).
The synthesis of the PHA polymer chain takes place within the cytoplasm of the bacterial cell,
within inclusions known as granules and with a complex biology: PHA accumulation is controlled by
many genes that encode a range of enzymes that are directly or indirectly involved in PHA synthesis.
So far, biosynthesis of PHA can be summarized in eight pathways. The most studied pathway
(Pathway I – Figure 1.9) is the one used by Cupriavidus necator. It involves the three key enzymes ß-
ketothiolase, NADPH-dependent acetoacetyl-CoA reductase, and PHA synthase (Laycock et al.
2013). An associated pathway involving PHA degradation catalyzed by PHA depolymerase, dimer
hydrolase, 3-hydroxybutyrate dehydrogenase, and acetoacetyl-CoA synthase helps regulate PHA
synthesis and degradation. The associated pathway was found in strains of Aeromonas hydrophila,
Pseudomonas stutzeri and Pseudomonas oleovorans. The carbon source is initially converted into
coenzyme A thioesters of (R)-hydroxyalkanoic acid. ß-ketothiolase then catalyzes the condensation of
two coenzyme A thioester monomers (acetyl-CoA and a propionyl-CoA monomer). This is followed by
an (R)-specific reduction to give (R)-3-hydroxybutyryl-CoA (or (R)-3-hydroxyvaleryl- CoA) (catalyzed
by acetoacetyl-CoA reductase), which is then converted by PHA synthase into PHA (Laycock et al.
2013). Pathway II is associated with fatty acid uptake by microorganisms and can be used for the
synthesis of mcl-PHA. Following fatty acid ß -oxidation to give acyl-CoA, the precursor is then
converted to 3-hydroxyacyl-CoA which can then form PHA under synthase catalysis. Known enzymes
involved in this pathway include 3-ketoacyl-CoA reductase, epimerase and (R)-enoyl-CoA
hydratase/enoyl-CoA hydratase I. Two others are also believed to be involved: acyl-CoA oxidase and
enoyl-CoA hydratase (Laycock et al. 2013). Pathway III involves 3-hydroxyacyl-ACP-CoA transferase
and malonyl-CoA-ACP transacylase, which help supply 3-hydroxyacyl-ACP to form the PHA monomer
3-hydroxyacyl-CoA, leading to PHA formation under the action of PHA synthase. Pathway IV uses
NADH-dependent acetoacetyl-CoA reductase to oxidize (S)-(+)-3-hydroxybutyryl-CoA. A high ratio of
NADPH to NADP+ could enhance the delivery of the reductant to nitrogenase in Rhizobium (Cicer) sp.
strain CC 1192. This could also favor the reduction of acetoacetyl-CoA for poly[(R)-3-hydroxybutyrate]
(PHB) synthesis. Pathway V uses succinic semialdehyde dehydrogenase, 4-hydroxybutyrate
dehydrogenase, and 4-hydroxybutyrate-CoA:CoA transferase to synthesize 4-hydroxybutyryl-CoA for
forming 4-hydroxybutyrate-containing PHA. Pathway V was reported in Clostridium kluyveri. Pathway
VI employs putative lactonase and hydroxyacyl-CoA synthase to turn 4,5-alkanolactone into 4,5-
hydroxyacyl-CoA for PHA synthesis. Pathway VII is based on the putative alcohol dehydrogenase
found in A. hydrophila 4AK4. In pathway VII, 1,4-butanediol is oxidized to 4-hydroxybutyrate, then to 4-
hydroxybutyryl-CoA for 4-hydroxybutyratecontaining PHA synthesis. Pathway VIII turns 6-
hydroxyhexanoate into 6-hydroxyhexanoate-containing PHA under the actions of eight enzymes
(Chen 2010).

13
Figure 1.9 - PHA accumulation pathways (adapted from Chen, 2010)

14
The physical and mechanical properties of PHA polymers, such as high melting temperature
(175°C) and relatively high tensile strength (30–35 MPa), resemble those of petroleum-derived
polypropylene, polyethylene, and polystyrene, which make PHAs potential substitutes to these non-
biodegradable plastics. P(3HB) is the most common type of PHAs produced by microorganisms. The
P(3HB) homopolymer is a highly crystalline, stiff, yet relatively brittle material dependent on the
molecular weight. The incorporation of different PHA monomeric units, such as 3-hydroxyhexanoate,
4-hydroxybutyrate, 3-hydroxyoctanoate, 3-hydroxydecanoate, and 3-hydroxydodecanoate, with 3-
hydoxybutyrate results in copolymers with varying material properties with numerous applications as
packaging materials, textiles, plastics, fuel additives, medical implant materials, and drug delivery
carriers. Compared to polylactic acid (PLA) which is a popular and commercially available renewable
and biodegradable polymer, diverse combinations of PHA monomeric subunits offer a wide range of
material properties as compared to PLA homopolymers. It is feasible to manipulate material properties
of PHAs by changing the mole fractions of the co-monomer in the copolymers. The similarity of both
monomers in P(3HB-co-3HV) allows 3HB and 3HV to participate in a co-crystallization process, in
which 3HV could be incorporated into the 3HB crystal lattice and viceversa. This phenomenon is
termed isodimorphism. As a result of the incorporation, the melting temperatures of the P(3HB-co-
3HV) copolymers decrease to a minimum point as the ratio of 3HV to 3HB repeating units increases
and after this minimum melting temperature is reached, increases as the 3HV mole fraction further
increases. Therefore, the isodimorphic phenomenon and the transition from the 3HB crystal lattice to
the 3HV crystal lattice typically exhibit a V-shaped pattern. PHA copolymers with lower melting
temperatures have an important advantage for industrial applications that require melt processing at
lower temperatures (Zhu et al. 2013).
PHA polymers display a rather slow crystallization process due to high purity and limited
heterogeneous nuclei, which results in a longer manufacturing process time and less efficient
industrial fabrication cycle for finished products. A number of external nucleating agents, such as
boron nitride, saccharin and phthalimide have been studied to increase the crystallization rate of PHA
polymers. Inclusion of nucleating agents resulted in increased numbers of nuclei which led to the
formation of spherulites of relatively small size, with improved material properties. Nucleating agents
should be considered as a supplement during hot melt processing of PHA biopolymers (Zhu et al.
2013).

15
PHA production
PHAs have attracted much attention for their potential use in a variety of industries. Like nylon,
PHAs can be processed into fibers in for textiles. PHAs are polyesters which can be easily stained and
may be used in printing and photographic industry. PHAs are biodegradable and biocompatible,
therefore, can be developed into implant materials (cardiovascular patches, articular cartilage, bone
marrow scaffolds,) and drug controlled-release matrices. PHA oligomers have been studied as food
supplements to obtain ketone bodies. In addition, PHAs could be hydrolyzed into monomers, which
can be converted to hydroxyalkanoate methyl esters for combustion as biofuels. PHA monomers also
demonstrated clinical therapy on Alzheimer’s and Parkinson’s diseases, and memory improvement.
The history of commercialized PHAs goes back to 1959. W. R. Grace and Company produced
PHB in U.S.A. for possible commercial applications. However, the company shut down the process
due to low production efficiency and a lack of suitable purification methods. In 1970, PHBV was
commercialized by Imperial Chemical Industries Ltd. under the trade name of Biopol™. In 1996, the
technology was sold to Monsanto and then to Metabolix, Inc. Procter and Gamble, in partnership with
Kaneka Corporation and the Riken Institute in Japan, has developed a wide range of applications for
PHB and PHBHV (Nodax™) as fibers, nonwoven materials, aqueous dispersions, and disposable
products. Recently, Kaneka Corporation has announced its plan to launch the production of a
plantderived soft polymer called Kaneka PHBH, with a production capacity of 1000 tons per year. A
German company, Biomer Inc. produces PHB on a commercial scale for special applications. In
Brazil, one of the largest sugar-exporting countries, PHB Industrial S.A. uses sugar cane to
manufacture PHB (Biocycle™) in a joint venture started in 1992 between a sugar producer and an
alcohol producer. The company has been running a pilot plant at 50 tons per year and plans to
increase production capacity to 3000 tons per year. In Canada, Biomatera Inc. specializes in the
manufacture of PHA by fermentation of agricultural residues. The biopolymers are used in the
manufacture of creams and gels that are used as slow-release agents in drug manufacturing and as
cosmetic agents and tissue matrix regeneration. In Japan, Mitsubishi Gas Chemical has made
progress on the production of PHB from methanol fermentation (BioGreen™) (Chanprateep 2010).
.

16
Every single one of these large volume manufacturers (Table 1.1) use chemically defined
substrates. Moreover, each one of these companies use pure or genetically modified cultures which
require innumerous sterilization protocols, with the respective costs attached. Li et al. (2007) reviewed
the production of polyhydroxyalkanoates using recombinant Escherichia coli in a metabolic
engineering, fermentation and downstream process aiming perspective (Table 1.2). The conclusions
were that production cost is highly sensitive to fermentation process and recovery strategy, and
moderately sensitive to medium cost and cell growth yield. Thus, the use of PHA in packaging and
disposable products as a potential solution to a significant environmental problem depends heavily on
further reducing the cost and establishing a novel PHA production strategy. Using agro-industrial
residues as alternatives substrates, the cost could be reduced (Li et al. 2007). As a matter of fact, cost
effectiveness has prevented the use of PHAs as a biodegradable commodity plastic. As stated before,
the use of waste materials (including crude glycerol) should help reducing the cost of PHA production.
Table1. 2 - Comparison of several PHAs production process in recombinant E. coli (adapted from Li et al., 2007)
Table 1.1 - The current and potential large volume manufacturers of polyhydroxyalkanoates (Chanprateep 2010)
17
For this purpose several studies have been published using pure microbial cultures and crude
glycerol. Ashby et al. (2004) studied the bacterial synthesis of poly(3-hydroxybutyrate) (PHB) and
medium-chain-length poly(hydroxyalkanoate) (mcl-PHA) polymers using Pseudomonas oleovorans
NRRL B-14682 and P. corrugata 388. The substrate used was a co-product stream from soy-based
biodiesel production (CSBP) containing glycerol, fatty acid soaps, and residual fatty acid methyl esters
(FAME). The results showed that PHA cellular productivity was 13–27% of the bacterial cell dry weight
with P. oleovorans whereas P. corrugata reached maximum PHA cellular productivity of 42% of the
CDW at 3% CSBP (Ashby et al. 2004). Teeka et al. (2012) studied PHA accumulation by isolated
Novosphingobium sp. THA_AIK7 using crude glycerol. Polymer content of 45% cell dry weight was
achieved in 72 h with maximum product yield coefficient of 0.29 g PHAs g-1
glycerol (Teeka et al.
2012). Naranjo et al. (2013) used Bacillus megaterium for valorization of crude glycerol via PHA
production. Compared to glucose, glycerol showed a 10% and 20% decrease in the PHB production
costs using two different separation schemes respectively. Moreover, a 20% profit margin in the PHB
sales price using glycerol as substrate resulted in a 166% valorization of crude glycerol. The feasibility
of glycerol as feedstock for the production of PHB at laboratory (up to 60% PHB accumulation) and
industrial (2.6US$/kgPHB) scales were demonstrated (Naranjo et al. 2013).
Mixed microbial cultures (MMC)
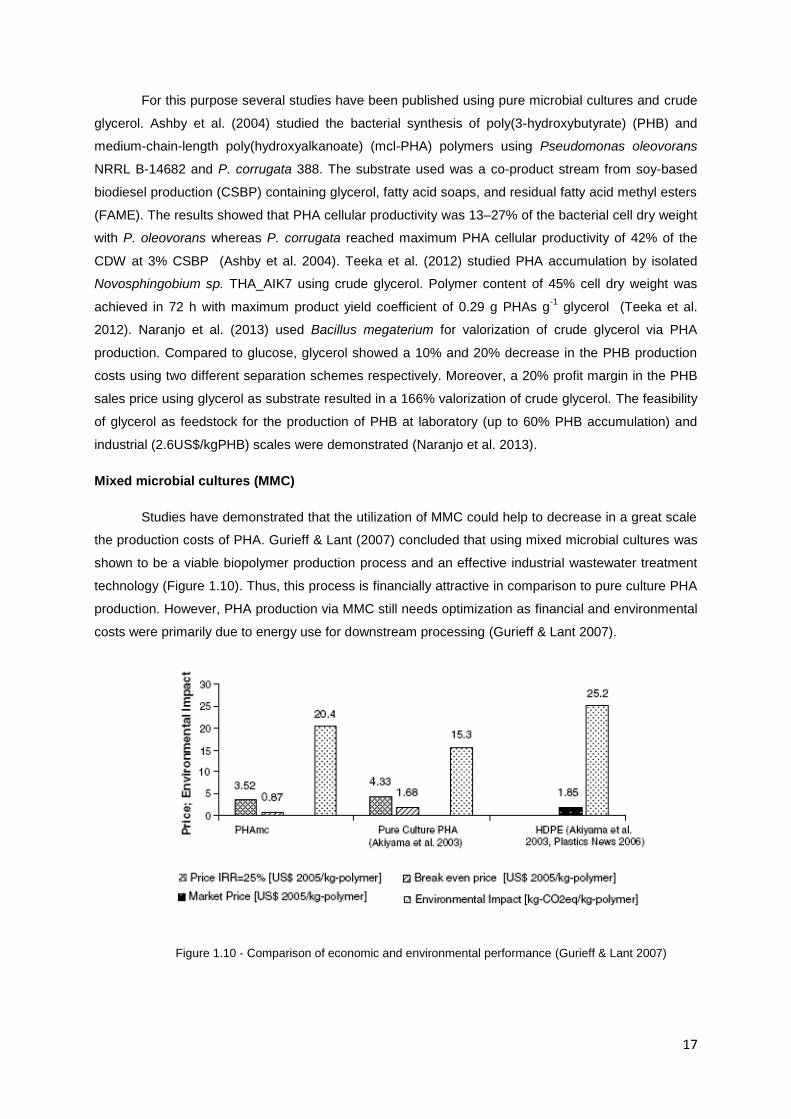
Studies have demonstrated that the utilization of MMC could help to decrease in a great scale
the production costs of PHA. Gurieff & Lant (2007) concluded that using mixed microbial cultures was
shown to be a viable biopolymer production process and an effective industrial wastewater treatment
technology (Figure 1.10). Thus, this process is financially attractive in comparison to pure culture PHA
production. However, PHA production via MMC still needs optimization as financial and environmental
costs were primarily due to energy use for downstream processing (Gurieff & Lant 2007).
Figure 1.10 - Comparison of economic and environmental performance (Gurieff & Lant 2007)

18
Several papers are published regarding the study of diverse substrates using MMC for PHA
production. The maximum content of PHA using MMC and a chemically defined substrate was
established by Jiang et al. (2011) at 90% of cell dry weight using lactate as substrate. The yield in
PHA was 0.46 (gPHA/gsubstrate) with a polymer production rate of 1.76 g PHA/g biomass h-1
(Jiang
et al. 2011). These results demonstrate that is possible to use MMC to produce PHA with identical
contents of those using pure microbial cultures. However, as stated before the process can be further
developed in order to reduce production costs, and for that the use of agro-industrial by-products are
in order. Dionisi et al. (2005) researched the feasibility of using other agro-industrial by-product, such
as olive oil mill effluents (OMEs) as a substrate for PHA production. The OMEs were fermented to
obtain volatile fatty acids (VFAs) which are the most used substrate for polyhydroxyalkanoates
production by mixed cultures. The maximum hidroxyvalerate (HV) content within the copolymer (P(HB-
HV)) was about 11% on a molar basis (Dionisi et al. 2005). Bengtsson et al. (2008) treated paper mill
wastewater via biopolymer production and the results showed that after batch accumulation PHA
consisted of 31-47 mol% hydroxybutirate (HB) and 53-69mol% HV. The maximum PHA content
achieved was 48% of the sludge dry weight (Bengtsson et al. 2008).
Moita & Lemos (2012) studied the production of biopolymers from mixed cultures using
pyrolysis by-products (bio-oil) as substrate. The maximum content of PHA achieved was 9.2% (g/g cell
dry weight) on a culture selective sequencing batch reactor. The copolymer obtained was composed
by 70% HB and 30% HV (Moita & Lemos 2012). In 2010, Albuquerque et al. (2010) established the
maximum content of PHA using mixed microbial cultures and by-products as substrate at 74.6% of cell
dry weight. These authors used sugar cane molasses at several concentrations (30-60 Cmmol
VFA/L). At 30 and 45 Cmmol VFA/L, substrate concentration impacted on the process kinetics through
a substrate dependent kinetic limitation effect. However, further increasing the carbon substrate
concentration to 60 Cmmol VFA/L, resulted in an unforeseen growth limitation effect associated with a
micronutrient deficiency of the fermented feedstock (magnesium) and high operating pH (Albuquerque
et al. 2010).
There are few research completed on this field, using crude glycerol and mixed microbial
cultures for PHA production. Dobroth et al. (2011) investigated PHA production on crude glycerol
using mixed microbial consortia (MMC) and determined that the enriched MMC produced exclusively
polyhydroxybutyrate (PHB) utilizing the methanol fraction. PHB synthesis appeared to be stimulated
by a macronutrient deficiency. Intracellular concentrations remained relatively constant over an
operational cycle, with microbial growth occurring concurrent with polymer synthesis. PHB average
molecular weights ranged from 200–380 kDa, while thermal properties compared well with commercial
PHB. The resulting PHB material properties and characteristics would be suitable for many
commercial uses. Considering full-scale process application, it was estimated that a 38 million L per
year biodiesel operation could potentially produce up to 19 metric ton of PHB per year (Dobroth et al.
2011). Moralejo-Gárate et al. (2011) studied PHA production from synthetic glycerol achieving 67 wt%
and 10 wt% of polyglucose polymer. The results indicated that the strategies used were comparably
19
successful to obtain a microbial community compared to fatty acids based enrichment (Moralejo-
Gárate et al. 2011).
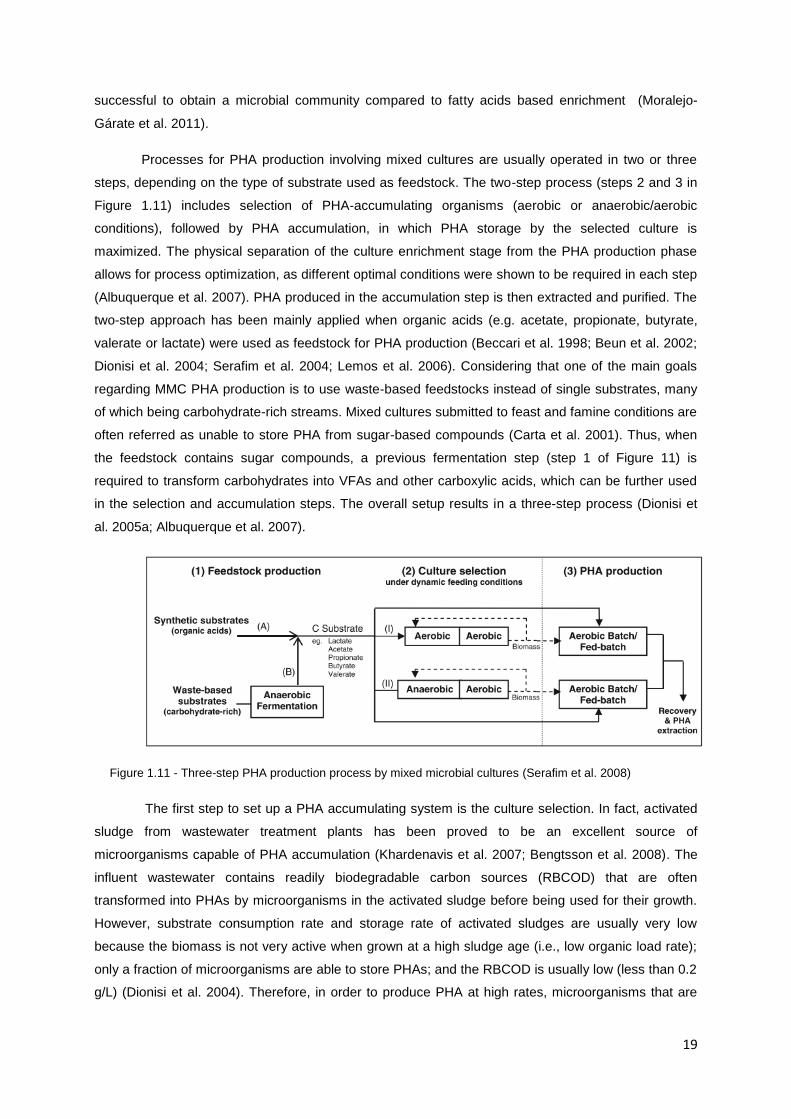
Processes for PHA production involving mixed cultures are usually operated in two or three
steps, depending on the type of substrate used as feedstock. The two-step process (steps 2 and 3 in
Figure 1.11) includes selection of PHA-accumulating organisms (aerobic or anaerobic/aerobic
conditions), followed by PHA accumulation, in which PHA storage by the selected culture is
maximized. The physical separation of the culture enrichment stage from the PHA production phase
allows for process optimization, as different optimal conditions were shown to be required in each step
(Albuquerque et al. 2007). PHA produced in the accumulation step is then extracted and purified. The
two-step approach has been mainly applied when organic acids (e.g. acetate, propionate, butyrate,
valerate or lactate) were used as feedstock for PHA production (Beccari et al. 1998; Beun et al. 2002;
Dionisi et al. 2004; Serafim et al. 2004; Lemos et al. 2006). Considering that one of the main goals
regarding MMC PHA production is to use waste-based feedstocks instead of single substrates, many
of which being carbohydrate-rich streams. Mixed cultures submitted to feast and famine conditions are
often referred as unable to store PHA from sugar-based compounds (Carta et al. 2001). Thus, when
the feedstock contains sugar compounds, a previous fermentation step (step 1 of Figure 11) is
required to transform carbohydrates into VFAs and other carboxylic acids, which can be further used
in the selection and accumulation steps. The overall setup results in a three-step process (Dionisi et
al. 2005a; Albuquerque et al. 2007).
The first step to set up a PHA accumulating system is the culture selection. In fact, activated
sludge from wastewater treatment plants has been proved to be an excellent source of
microorganisms capable of PHA accumulation (Khardenavis et al. 2007; Bengtsson et al. 2008). The
influent wastewater contains readily biodegradable carbon sources (RBCOD) that are often
transformed into PHAs by microorganisms in the activated sludge before being used for their growth.
However, substrate consumption rate and storage rate of activated sludges are usually very low
because the biomass is not very active when grown at a high sludge age (i.e., low organic load rate);
only a fraction of microorganisms are able to store PHAs; and the RBCOD is usually low (less than 0.2
g/L) (Dionisi et al. 2004). Therefore, in order to produce PHA at high rates, microorganisms that are
Figure 1.11 - Three-step PHA production process by mixed microbial cultures (Serafim et al. 2008)

20
most able to store PHA must be enriched in the activated sludge under more appropriate organic load
rates and carbon sources.
A critical factor for the development of a competitive PHA production method using MMC is
the selection of the microorganisms with the major polymer accumulation capacity. Anaerobic/ aerobic
processes can be used to select a culture with PHA storage ability. The two main groups of organisms
selected, Phosphorous Accumulating Organisms (PAOs) and Glycogen Accumulating Organisms
(GAOs), under these conditions have been extensively studied. It was shown that, in comparison with
PAOs, GAOs are believed to be more robust, reaching higher PHA contents and to easily produce
copolymers of P(3HB-co-3HV) from simple substrates. GAOs are less efficient than PAOs in getting
energy from glycogen due to the utilisation of different glycolytic pathways (Serafim et al. 2008).
Since GAOs consume more glycogen in order to maintain the redox balance, they need to drift
part of the glycolytic intermediates for the production of propionyl-CoA, and consequently, more PHA
is synthesized during the anaerobic phase (Serafim et al. 2008). Figure 1.12 illustrates the metabolic
pathway of GAOs and PAOs to produce PHA.
However, the most well-known PHA storage process is Aerobic Dynamic Feeding (ADF).
When submitted to ADF, a mixed microbial culture can be selected in a way that only the
microorganisms with accumulation capacity survive in the reactor. This method alternates between
stages of carbon availability (feast) and carbon withdrawal (famine). It is well known that sludge
submitted to consecutive periods of external substrate accessibility (feast) and unavailability (famine),
generates an unbalanced growth. Under these dynamic conditions, during excess of external carbon
substrate, the uptake is driven to simultaneous growth of biomass and polymer storage, and after
substrate exhaustion, stored polymer can be used as energy and as a carbon source. In these cases
Figure 1.12 – PHA metabolic pathway in PAO/GAO Anaerobic systems. The metabolism represented inside the rectangle is only valid for PAOs, all the rest is shared by both groups. (Reis et al. 2003)
21
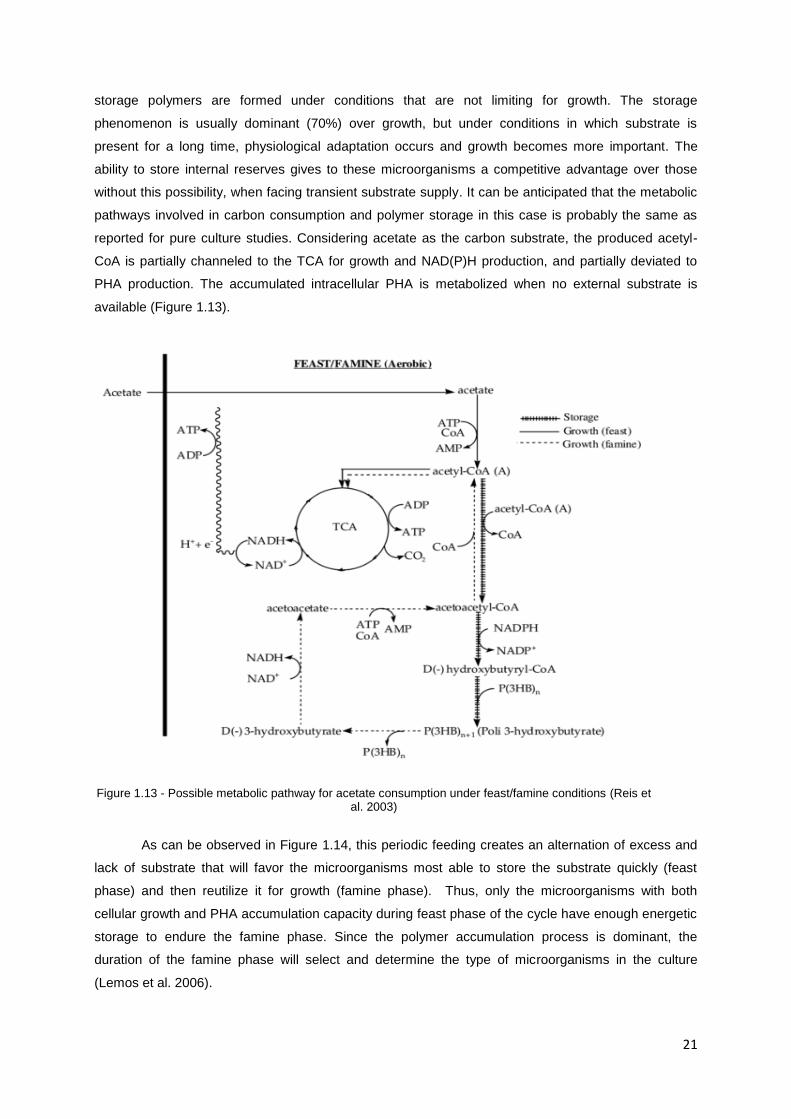
storage polymers are formed under conditions that are not limiting for growth. The storage
phenomenon is usually dominant (70%) over growth, but under conditions in which substrate is
present for a long time, physiological adaptation occurs and growth becomes more important. The
ability to store internal reserves gives to these microorganisms a competitive advantage over those
without this possibility, when facing transient substrate supply. It can be anticipated that the metabolic
pathways involved in carbon consumption and polymer storage in this case is probably the same as
reported for pure culture studies. Considering acetate as the carbon substrate, the produced acetyl-
CoA is partially channeled to the TCA for growth and NAD(P)H production, and partially deviated to
PHA production. The accumulated intracellular PHA is metabolized when no external substrate is
available (Figure 1.13).
As can be observed in Figure 1.14, this periodic feeding creates an alternation of excess and
lack of substrate that will favor the microorganisms most able to store the substrate quickly (feast
phase) and then reutilize it for growth (famine phase). Thus, only the microorganisms with both
cellular growth and PHA accumulation capacity during feast phase of the cycle have enough energetic
storage to endure the famine phase. Since the polymer accumulation process is dominant, the
duration of the famine phase will select and determine the type of microorganisms in the culture
(Lemos et al. 2006).
Figure 1.13 - Possible metabolic pathway for acetate consumption under feast/famine conditions (Reis et al. 2003)

22
Figure 1.14 - Aerobic Dynamic Feeding method
Sequencing Batch Reactor (SBR) processes are the most used in culture selection phase.
SBR are compact systems where the full feast and famine cycle may be performed in one single
reactor, and the length of each phase may be varied, maintaining the same sludge retention time and
the organic loading rate. As an alternative to SBR, continuous reactors were also used to produce
PHA (Serafim et al. 2008) Usually, the reactor operates in 12 to 24 hours cycles with a feast phase
lasting, ideally, 1-2 hours. This stage has to be operated at the highest organic load that still allows
strong selective pressure to be maintained on the sludge. After the culture selection phase, the
excess sludge that is produced has a high storage response that is exploited in a third stage, which is
again operated in a SBR but at a considerably higher organic load in order to saturate the sludge
storage capacity. The increase in organic loading rate can be in principle an advantage for the process
productivity, as it increases the biomass concentration. However, it has to be verified whether the
produced biomass maintains high storage rates also at higher loads. Indeed, it is possible that at
higher loads there is not enough selective pressure to enrich the biomass of microorganisms with high
storage rates (Dionisi et al. 2006). This PHA production stage is defined according to the optimal
conditions for each system. The PHA-rich sludge then flows to the downstream processing for
extraction and purification of PHAs. An example was the process used by Bengtsson et al. (2008) to
produce PHA from fermented paper mill effluent. This system, including two sequentially disposed
continuous reactors followed by a settler, simulates a wastewater treatment plant configuration. In the
first reactor, that mimics the feast phase, the value of hydraulic retention time is set up in order to
ensure that no carbon source is transferred to the second reactor. In the latter, corresponding to the
famine phase, the sludge retention time guarantees that almost all the intracellular PHA is consumed
for cell growth and maintenance. Albuquerque et al. (2008) compared the performance of a SBR and
a continuous system, similar to the one used by Bengtsson et al. (2008), for culture selection using
fermented molasses as carbon source. The PHA content, polymer yield on substrate and specific
productivity obtained were similar for both reactor configurations (Albuquerque et al. 2008). This result
supports the possibility of using the facilities already existing in conventional wastewater treatment
plants (except for the downstream) to produce PHA from industrial or municipal effluents (Serafim et
al. 2008).

23
Important process parameters
Generally, microbial cultures are sensitive to variations on the growth conditions, and there are several
important process parameters in PHA production that must be optimized, such as sludge retention
time, substrate concentration, pH, dissolved oxygen (DO) and micronutrients concentration (nitrogen
and phosphorous). Sludge retention time (SRT) is the average time the activated-sludge solids are in
the system. The SRT is an important design and operating parameter for the activated-sludge process
and is usually expressed in days. Chua et al. (2003) studied the effect of SRT in the production of
PHA by activated sludge treating municipal wastewater. It was found that activated sludge with an
SRT of 3 days possessed better PHA production capability than sludge with an SRT of 10 days. In
fact, a short SRT (3 days) could achieve PHA content about 10% more than sludge with a long SRT
(10 days). The study stated that SRT theoretically determines mean microbial life-time, and hence
microbial population. Thus, shorter SRT may select microbial community with bigger PHA production
capacity than that selected under longer SRT. As the second possible mechanism, the SRT might
have affected the PHA accumulation capability of activated sludge via the difference in organic loading
to biomass. Generally, longer SRT means higher biomass concentration in the reactor. Apart from the
reason that short SRT sludge possessed higher PHA production capability, sludge acclimatization with
a short SRT may also be preferable for PHA production purpose. This is because the sludge yield
under a shorter SRT is higher than that under a longer SRT. Therefore, activated sludge process
operated with a short SRT can supply sufficient amount of sludge for PHA production compared to
that with a long SRT (Chua et al. 2003). Chang et al. (2011) also studied the effect of SRT in PHA
production by comparing the behavior of sludges from the anaerobic and oxic phases of an enhanced
biological phosphorus removal system. Experimental results indicated that the oxic sludge with 5 days
of SRT exhibited better PHA production performance than anaerobic sludge but the anaerobic sludge
with 15 days of SRT had superior PHA production than the oxic sludge. These comparisons suggest
that PHA production depends mainly on the operating SRT of the system (Chang et al. 2011).
Substrate concentration is also an important process parameter and Albuquerque et al. (2010)
studied the effect of the influent substrate concentration on culture selection for the production of PHA
by a mixed microbial culture using fermented sugarcane molasses. The tested concentrations ranged
between 30 and 60 C-mmolVFA/L. At 30 and 45 Cmmol VFA/L, substrate concentration impacted on
the process kinetics through a substrate dependent kinetic limitation effect. However, further
increasing the carbon substrate concentration to 60 Cmmol VFA/L, resulted in an unforeseen growth
limitation effect associated with a micronutrient deficiency of the fermented feedstock (magnesium)
and high operating pH. Kinetic (limiting concentration of carbon source) and physiological (loss of
internal growth limitation due to the shorter length of famine phase) effects, resulting from variation of
the influent substrate concentration, were subsequently demonstrated in batch studies. The culture
selected at an influent substrate concentration of 45 Cmmol VFA/L showed the best PHA-storing
capacity since neither substrate concentration nor feast to famine ratio were limiting factors
(Albuquerque et al. 2010). Venkateswar Reddy & Venkata Mohan (2012) also assessed substrate
load in aerobic mixed consortia acquired from an operating activated sludge process treating 10

24
million liters per day of composite wastewater. The results showed that PHA accumulation was directly
proportional to the organic load where higher carbon concentration depicted higher accumulation.
However, the time taken for high PHA accumulation increased with increase in organic load and
decreased thereafter. This means that during the feast phase, the external substrate uptake is mainly
driven towards internal PHA storage, while after substrate exhaustion, the accumulated PHA will be
used as energy and carbon source for cell growth and maintenance. Henceforth, the higher organic
loading rate (OLR) took more time for maximum PHA accumulation due to the available higher
substrate, while, lower OLR showed maximum PHA accumulation in shorter time due to the lower
substrate availability ((Venkateswar Reddy & Venkata Mohan 2012)).
Venkateswar Reddy & Venkata Mohan also assessed the effect of varying nitrogen
concentration on PHA accumulation. Since nitrogen is a micronutrient and it is a component of protein,
enzymes and nucleic acids, increased utilization of nitrogen would benefit overall function of the cell
(Sharma et al., 2004). Experimental results showed that lower nitrogen concentration (N1 - 100 mg/ml)
showed higher PHA accumulation (45.1%) and vice versa (N2 – 200 mg/ml, 41.5%; N3 – 300 mg/ml,
38%). This study also revealed that lower phosphorous concentration favored PHA accumulation. As it
is well known, phosphorus is important for the utilization of carbohydrates and fats for energy
production and also in protein synthesis for the growth, maintenance and cell repair. As inorganic
phosphate in ATP involves in protein synthesis as well as in the production of the nucleic acids (DNA
and RNA), which carry the genetic code for all cells. Phosphorous is also essential for maintaining the
buffering capacity of cell and to control fluctuations in the redox values. At optimum carbon (4,53
kgCOD/m3-day) and nitrogen (100 mg/ml) concentrations, further experiments were carried out
towards optimization of phosphorous concentration. As stated before lower phosphorous
concentration showed higher (P1 – 50 mg/ml, 54.2%) PHA accumulation and higher concentrations
showed lower PHA accumulation (P2 – 100 mg/ml, 49.3%; P3 – 150 mg/ml, 45.5%). Even though a
minimal level of internal phosphate is essential for PHA accumulation, low concentration of
phosphorous and nitrogen are favorable for the enhancement of PHB production. The most important
conclusion of this study is that when growth is limited by an essential nutrient other than the carbon
and energy source, the complexity of the metabolism that occurs in the cell is reduced and the flow of
carbon is channeled into unidirectional path such as PHA synthesis. The resulting increase in NADH
concentration inhibits some enzymes of the TCA cycle, such as citrate synthase and isocitrate
dehydrogenase, which leads to an accumulation of acetyl-CoA, which relieves the inhibition exerted by
CoASH, leading to PHB formation (Venkateswar Reddy & Venkata Mohan 2012).
The effect of pH in production of polyhydroxyalkanoates by activated sludge treating municipal
wastewater was studied by Chua et al. (2003). Sludge acclimatized under pH 7 and 8 conditions in
sequencing batch reactors (SBRs) exhibited similar PHA production capability. However, in PHA
production batch experiments, pH value influenced significantly the PHA accumulation behaviour of
activated sludge. When pH of batch experiments was controlled at 6 or 7, a very low PHA production
was observed. The production of PHA was stimulated when pH was kept at 8 or 9 (Chua et al. 2003).
Villano et al. (2010) also investigated the effect of pH on polyhydroxyalkanoate (PHA) production by

25
mixed cultures enriched in a SBR starting from activated sludge. The enrichment was performed with
a mixture of acetic (85% on COD basis) and propionic (15%) acid, at an organic load rate of 8.5
gCOD/L/day over the range of pH from 7.5 to 9.5. The enriched cultures were all able to store the
copolymer poly(3-hydroxybutyrate/3-hydroxyvalerate) but, opposing with the results of Chua et al.
(2003), this study revealed higher polymer production rates and yields when the pH in the SBR was
controlled at 7.5. This contradiction could be related to the type of feed used in both studies (municipal
wastewater in Chua et al. (2003) and mixture of acetic and propionic acid for Villano et al. (2010).
Another possibility is that the culture response to variations in pH may vary according to the mixed
microbial consortia selected.
Regarding the dissolved oxygen in the system, Pratt et al. (2012) studied the effect of oxygen
limitation in PHA production by mixed microbial cultures. In an effort to maximize the fraction of
feedstock that ends up as polymer, and minimize biomass growth, oxygen limitation was applied.
Intracellular PHA content in mixed cultures in batch systems operated with low and high DO was
compared. Results showed that in microaerophilic conditions a higher fraction of substrate is
accumulated as PHA in comparison to high DO conditions, evidenced by elevated intracellular PHA
content: in the order of 50% higher in the early stages of accumulation. However, the accumulation
capacity is not affected by DO. The PHA content in biomass in both the low and high DO systems
reached approximately 35%. The time taken for the PHA content in the low DO system to reach
capacity was three times longer than in the high DO system (Pratt et al. 2012). (Moralejo-Gárate,
Kleerebezem, Mosquera-Corral, & van Loosdrecht (2013) also studied the impact of oxygen limitation
in bacterial accumulation of biopolymer. Since two different types of polymers (polyglucose and
polyhydroxybutirate) can be formed in the production of biopolymers from glycerol, the authors tried to
assess effect of limiting the oxygen supply rate on the polymer distribution with the aim of defining the
conditions that favor the conversion of glycerol in one single polymer.
However, the results showed that the decrease of the oxygen transfer coefficient during the
accumulation step of biomass enriched under non limiting oxygen conditions lowered the overall
metabolism of the community, but did not significantly affect glycerol partitioning among PHB and PG.
The enrichment of a community with high PHA accumulating capacity from glycerol under rate-limiting
oxygen concentrations led to a different composition of the bacterial enrichment and to worse
accumulation performances compared to the enrichment under non limiting conditions. Moreover,
polyglucose storage was favored over polyhydroxybutirate production when oxygen limiting conditions
were applied. When glycerol was used as substrate for the enrichment of a biopolymer producing
community in a feast famine system, controlling the rate of the biochemical conversions by the
limitation of the oxygen supply lead to lower accumulation capacities compared to biomass enriched in
excess of oxygen (Moralejo-Gárate et al. 2013).
In summary, the application of fermentation technologies as an alternative solution for disposal
of crude glycerol demonstrates a potentially significant advantage for biodiesel manufacturers to
efficiently dispose of waste glycerol and gain profitable compensation from the value-added

26
biodegradable plastics. Crude glycerol has been acknowledged as renewable and inexpensive
feedstocks for bacterial growth and PHA production. It is promising that the production costs of PHA in
the near future could be reduced significantly when using crude glycerol as a carbon source.

27
2. Materials and Methods The crude glycerol used in this study was kindly provided by Sovena, S.A. a biodiesel
production company located in Almada, Portugal. Several vegetable oil sources are used in their
industrial biodiesel manufacturing plant. The crude glycerol was removed after the biodiesel
production and before any purification step. Preliminary results revealed the composition of the
glycerol used in this study: glycerol (72%, g C/g TOC) and methanol (26%, g C/g TOC). Crude
glycerol also contained a small fraction (2.58% w/w) of free fatty acids and fatty acids methyl esters
(FFA/FAME).
PHA-accumulation culture enrichment
In this study a sequential batch reactor (SBR) was inoculated with activated sludge from a
wastewater treatment plant in Beirolas, Lisbon. The reactor has a working volume of 1500 ml,
operated under feast and famine conditions. The reactor went under five stages of different operating
conditions (Figure 3.1). Stage 1 was operated under 30 CmM of crude glycerol, with SRT and
hydraulic retention time (HRT) of 2 days. Stage 2 was operated under 30 CmM of crude glycerol, with
SRT of 2 days and HRT of 1.5 days. Stage 3 was operated under 15 CmM of crude glycerol, with SRT
and HRT of 2 days. Stage 4 was operated under 30 CmM of crude glycerol, with SRT of 2 days and
HRT of 1.5 days – the difference between reactor 2 and reactor 4 is the late addition of NH4+
and PO4-
). Stage 5 was inoculated with a PHA-accumulating mixed culture acclimatized to bio-oil as feedstock
(Moita Fidalgo et al. 2014). The SBR was operated with aerobic dynamic substrate feeding. Each SBR
cycle (24h) consisted of four periods: fill (15min); aerobiosis (feast and famine) (23h); settling (20 min)
and withdraw (15min). A peristaltic pump was calibrated to purge mixed liquor at the end of the
aeration period in order to maintain the desired SRT and after the settling phase to maintain the
desired HRT. An additional reactor (reactor 6) was operated under 30 C-mmol of organic loading rate,
SRT of 5 days, HRT of 2 days. However, in an effort to understand the temperature effect on the
polymer produced by the MMC this system was kept at 30ºC, while all the other were operating at
approximately 22ºC.
At the beginning of each cycle the reactor was fed with the correspondent organic loading rate
of crude glycerol. A mineral nutrients solution was added separately to the reactor. The mineral
nutrients medium included nitrogen and phosphorus source (NH4Cl and KH2PO4/Na2HPO4) to keep
the C/N/P ratio (on a molar basis) at 100:8:1. The solution was prepared in tap water and thiourea (10
mg/l) was added to inhibit nitrification. Air was sparged through a ceramic diffuser and stirring was
kept at 400 rpm. pH was controlled between 7.2 and 8.2 with NaOH 1M and HCl 1M. The reactors in
stage 1, 2, 3, 4 and 5 stood in a temperature-controlled room (20 – 23ºC). Pumping (fill and draw),
aeration and mixing were automatically controlled by BioCTR and LabView with Data Acquisition
Control (National Instruments, NI USB-6009)). In addition, the software was also used to acquire pH
and DO data. At given times, samples were taken periodically from the reactor in order to determine
glycerol, methanol and ammonia uptake; PHA and glycogen storage and biomass growth.

28
Batch accumulation assays
Two different sets of batch accumulation assays were performed. In the first one the influence
of the single synthetic substrates composing crude glycerol (methanol and/or glycerol), on the
biopolymers production was investigated. In the second one, the storage capacity of the selected
culture was studied using different feeding strategies. All the batch experiments were carried out using
sludge from the SBR (400 ml), collected at the end of the famine phase, after the system reached
steady-state. These assays were carried out in a 900 mL working volume reactor. With the exception
of one batch assay where crude glycerol continuous feeding was tested, all substrates (crude glycerol,
synthetic glycerol, synthetic methanol and a synthetic mixture of glycerol and methanol) were added to
the system using a pulse-wise feeding method to avoid potential substrate inhibition. In order to
maximize storage, the accumulation assays were carried out under ammonia limitation. When crude
glycerol was used as substrate, the mineral nutrients medium was prepared with tap water and
included only a phosphorus source to keep the C/P ratio equal to the condition imposed in the SBR.
When synthetic substrates were used, 2 ml/L of a trace micronutrients solution was added to the
mineral nutrients medium. The trace solution consisted of (per liter of distilled water): 1500 mg
FeCl3·6H2O, 150 mg H3BO3, 150 mg CoCl2·6H2O, 120 mg MnCl2·4H2O, 120 mg ZnSO4·7H2O, 60 mg
Na2MoO4·2H2O, 30 mg CuSO4·5H2O and 30 mg of KI. Thiourea (10 mg/l) was added in all the assays
to inhibit nitrification. Air was supplied by a ceramic diffuser and mixing was provided by magnetic
stirring at the same condition as the SBR. pH and oxygen uptake rate (OUR) were monitored over
time. The determination of OUR was achieved by recirculation of the mixed liquor through a
respirometer (using a peristaltic pump), where mixing was provided by magnetic stirring and an
oxygen probe was inserted. Recirculation was stopped at given intervals and the decrease in
dissolved oxygen concentration in the respirometer was registered and used to determine the OUR.
The accumulation assays were conducted in a temperature controlled room (20 - 23 ºC).
Crude glycerol versus pure substrate: influence on the biopolymers production
In addition to glycerol and methanol, crude glycerol contains FFA/FAME, salts and other
impurities. To study the influence of synthetic substrates in the storage capacity of the selected
culture, four different assays were performed with 3 pulses (3X30CmM) of each tested substrate:
Crude glycerol (GM1), synthetic glycerol (GM2), synthetic methanol (GM4) and a synthetic mixture of
glycerol and methanol (GM4) at the same proportion existing in the crude glycerol.
Maximizing storage capacity of the selected culture
To maximize the storage capacity of the selected culture crude glycerol and synthetic glycerol
were used and compared. The effect of feeding regimen (pulse-wise and continuous) was assessed in
assays GA1 and GA2 with crude glycerol as carbon source. The accumulation assay with synthetic
glycerol (GA3) was performed in pulse wise feeding mode and serve as a control. In the pulse wise

29
feeding regime accumulation assays (GA1 and GA3) the substrate was added in pulses of 30 CmM
until the carbon consumption had ceased. In the accumulation assay (GA2) with continuous feeding a
peristaltic pump added crude glycerol with the same rate to which it was consumed (0.55 CmM/min).
The accumulation assays were stopped when the OUR achieved a similar value to the endogenous
OUR measured in the beginning of the assay. Reactor 6 was submitted to a ten pulse feeding regime
of 30 C-mmol in order to study the maximum glycogen storage capacity of the selected mixed
microbial culture.
Analytical Methods
Biomass concentration was determined using the volatile suspended solid (VSS) procedure
described in Standard Methods (APHA, 1995). Glycerol and methanol concentrations were
determined by high performance liquid chromatography (HPLC) using a Refractive Index detector
(Merck, Germany) and Aminex HPX-87H column (Bio-Rad Laboratories, CA, USA). Sulphuric acid
0.01M was used as the eluent at a flow rate of 0.6 ml/min and 50ºC operating temperature.
Polyhydroxyalkanoate concentrations were determined by gas chromatography using the method
adapted from Lemos (2006). Lyophilized biomass was incubated for 3.5h at 100ºC with 1:1 solutions
of chloroform with heptadecane as internal standard and a 20% acidic methanol solution. After the
digestion step, the organic phase of each sample was extracted and injected into a gas
chromatograph coupled to a Flame Ionization Detector (GC-FID, Bruker 400-GC). A Bruker BR-SWAX
column (60m•~0.53mm•~1μm) was used with nitrogen as the carrier gas (14.5 Psi). Split injection at
280ºC with a split ratio of 1:10 was used. The oven temperature program was as follows: 40ºC; then
20ºC/min until 100ºC; then 3ºC/min until 155ºC; and finally 20ºC/min until 220ºC. The detector
temperature was set at 250◦C. Hydroxybutyrate and hydroxyvalerate were calibrated using standards
of a commercial P(HB-HV) polymer (88/12 %, Aldrich). Glycogen biopolymer (GB) was determined as
total glucose and it was extracted from lyophilized cells trough an acidic digestion (1 mL HCl 0.6 M, 2
hours, 100ºC). Samples were analyzed by HPLC at the same condition of glycerol and methanol
analysis using different glucose concentrations as standard for calibration. Ammonia concentrations
were determined using an ammonia gas sensing combination electrode (ThermoOrion 9512).
Calibration was conducted with NH4Cl standards (0.01–10 Nmmol/L). Total nitrogen was analyzed
using a Vario TOC select (Elementar) and a mixture of ammonium chloride and sodium nitrate as
standard for calibration following the equipment instruction. FFA/FAME fraction present in the crude
glycerol (10 g) was extracted three times with hexane (50/100/150 ml). The hexane extracts (300 mL)
were collected together and dried in a rotavapor at 40ºC. The residues remain corresponded to the
FFA/FAME extracted from the crude glycerol.
Intracelular PHA granules were shown by Nile blue staining (Rees et. al, 1992) using an
Olympus BX51 microscope.

30
Calculations
SVI30 (mL/g) is a calculation that indicates the tendency of activated sludge solids (aerated
solids) to thicken or to become concentrated during the sedimentation/thickening process. SVI30 is
calculated in the following manner: (1) allow a mixed liquor sample (100 ml) from the aeration basin to
settle for 30 minutes; (2) determine the suspended solids concentration for a sample of the same
mixed liquor; (3) calculate SVI30 by dividing the measured (or observed) wet volume (mL/L) of the
settled sludge by the dry weight concentration in g/L.
The sludge HB and GB content was calculated as a percentage of Total Suspended Solids
(TSS) on a mass basis (% HB=HB/TSS*100, in g HB/g TSS and % GB=glucose/TSS*100, in g
glucose/g TSS, respectively). Active biomass (X) was obtained by subtracting the storage products
from the VSS as: X = VSS - PHA - GB (in g/L). It was assumed that all the ammonia consumed was
used for growth and it was the only possible source of nitrogen. Active biomass elemental composition
was represented by the molecular formula C5H7NO2 (Henze et al., 1995). The maximum specific
glycerol uptake (−qGly in Cmmol S/Cmmol X.h), methanol uptake (−qMeth in Cmmol S/Cmmol X.h),
ammonia uptake (qN in Nmmol/Cmmol X.h), oxygen uptake (qO2 in Cmmol O2/Cmmol X.h), HB
storage (qP in Cmmol HB/CmmolX h) and GB storage rates (qGB in Cmmol glucose (Glu)/CmmolX.h)
were determined by adjusting a function to the experimental data for each variable concentration
divided by the biomass concentration at that point along time, and calculating the first derivative at
time zero. The yields of HB (YHB/S in Cmmol HB/Cmmol S), GB (YGB/S in Cmmol Glu/Cmmol S) and
active biomass (YX/S in Cmmol X/Cmmol S) on substrate were calculated by dividing the amount of
each parameter by the total amount of substrate consumed (S). When only glycerol was consumed
the substrate contribution was defined as Sg. The respiration yield on substrate (YO2/S in
Cmmol/Cmmol S) was calculated by integrating the curve of the experimental OUR (in mmol O2/l.h)
over time and dividing the value thus obtained by the amount of substrate consumed (in Cmmol S/L).
The material mass balance for a given accumulation study can be represented by: ΔY =YHB/S +
YGB/S +YX/S +YO2/S. The global yield (ΔY) accounts for all the carbon recovered from the material
mass balance (it is one if all the carbon is recovered).
Figure 2.15 – Experimental setup
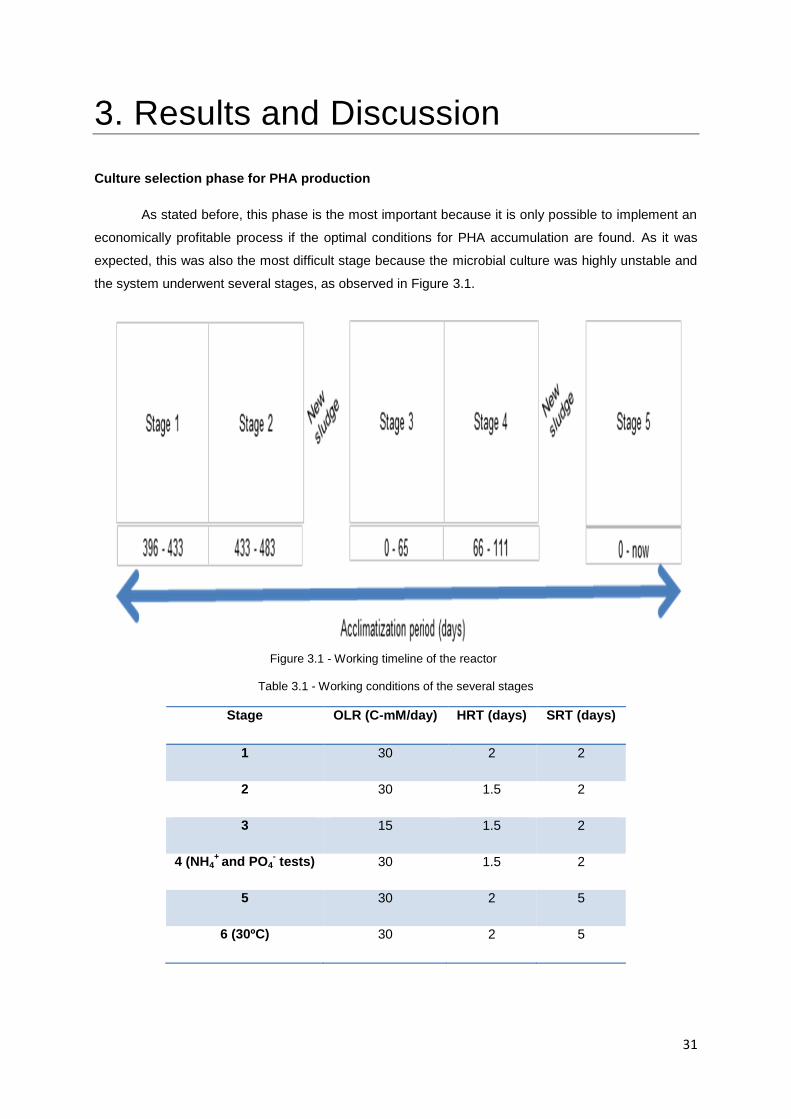
31
3. Results and Discussion
Culture selection phase for PHA production
As stated before, this phase is the most important because it is only possible to implement an
economically profitable process if the optimal conditions for PHA accumulation are found. As it was
expected, this was also the most difficult stage because the microbial culture was highly unstable and
the system underwent several stages, as observed in Figure 3.1.
Table 3.1 - Working conditions of the several stages
Stage OLR (C-mM/day) HRT (days) SRT (days)
1 30 2 2
2 30 1.5 2
3 15 1.5 2
4 (NH4+
and PO4- tests) 30 1.5 2
5 30 2 5
6 (30ºC) 30 2 5
Figure 3.1 - Working timeline of the reactor

32
On the initial stage (1), the reactor was inoculated with sludge from an aerobic wastewater
treatment plant and fed with 30 C-mM of crude glycerol. It is important to say that by the time this
experimental work began, this was already an ongoing experiment included in a PhD research project;
hence for this thesis the acclimatization period begins at day 396. The solids retention time (SRT) and
the hydraulic retention time (HRT) were selected by the previous operator of the system for 2 days,
which means that every 2 days both the liquid fraction and the solids fraction of the reactor were
renewed. However, this first strategy was not successful as the appearance of filamentous bacteria
was observed overtaking the system. Figure 3.2 illustrates the presence of filamentous bacteria. The
appearance of said type of bacteria can be considered as a contamination of the system,
notwithstanding that this is a mixed microbial culture, because the filamentous bacteria compete for
the substrate and are often related to the decrease of the maximum PHA accumulated value. Until
now, many operational factors influencing the competition between filaments and floc-formers have
been investigated, including F/M ratio, substrate concentration gradient, dissolved oxygen (DO)
concentration, temperature, and nutrient deficiency (Guo et al. 2014). In particular, DO deficiency is
one of the most typical factors responsible for filamentous bulking in activated sludge process.
However, DO deficiency can be ruled out since it was rarely verified in this system.
In order to overcome the proliferation of filamentous bacteria in the system, the enrichment
strategy in the reactor had to be adapted. Since the filamentous bacteria agglomerate with each other
forming networks, the strategy was to decrease the hydraulic retention time to 1.5 days (stage 2). This
decrease should favor the bacteria that decant faster. The SVI-30 index (Table 3.2) of the system was
measured to verify the settling capability of the system, which can be related to the presence of
filamentous bacteria. The optimal range for this index is between 80-150 ml/g, and for higher values
the system shows defective settling capability. As observed on Table 3.2, the values of the SVI-30
Figure 3.2 - Nile blue staining image (400x) – filamentous bacteria (stage 1)
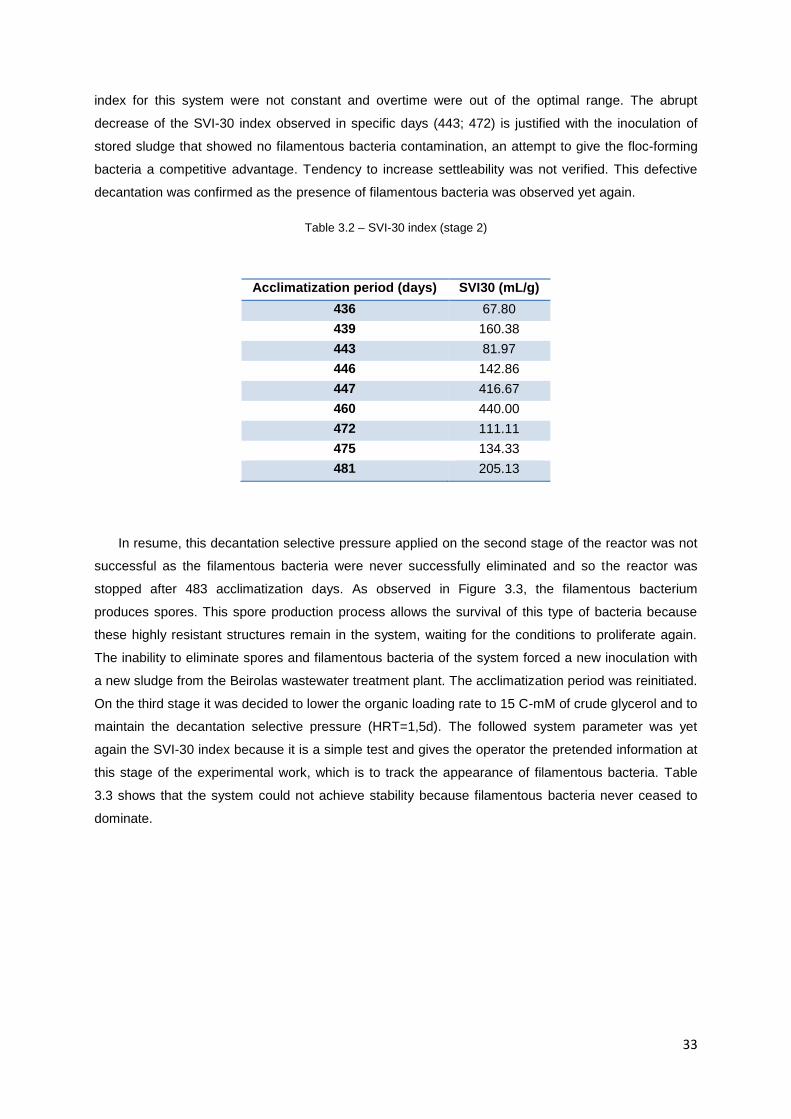
33
index for this system were not constant and overtime were out of the optimal range. The abrupt
decrease of the SVI-30 index observed in specific days (443; 472) is justified with the inoculation of
stored sludge that showed no filamentous bacteria contamination, an attempt to give the floc-forming
bacteria a competitive advantage. Tendency to increase settleability was not verified. This defective
decantation was confirmed as the presence of filamentous bacteria was observed yet again.
Table 3.2 – SVI-30 index (stage 2)
In resume, this decantation selective pressure applied on the second stage of the reactor was not
successful as the filamentous bacteria were never successfully eliminated and so the reactor was
stopped after 483 acclimatization days. As observed in Figure 3.3, the filamentous bacterium
produces spores. This spore production process allows the survival of this type of bacteria because
these highly resistant structures remain in the system, waiting for the conditions to proliferate again.
The inability to eliminate spores and filamentous bacteria of the system forced a new inoculation with
a new sludge from the Beirolas wastewater treatment plant. The acclimatization period was reinitiated.
On the third stage it was decided to lower the organic loading rate to 15 C-mM of crude glycerol and to
maintain the decantation selective pressure (HRT=1,5d). The followed system parameter was yet
again the SVI-30 index because it is a simple test and gives the operator the pretended information at
this stage of the experimental work, which is to track the appearance of filamentous bacteria. Table
3.3 shows that the system could not achieve stability because filamentous bacteria never ceased to
dominate.
Acclimatization period (days) SVI30 (mL/g)
436 67.80
439 160.38
443 81.97
446 142.86
447 416.67
460 440.00
472 111.11
475 134.33
481 205.13

34
Table 3.3 – SVI-30 index (stage 3)
Acclimatization period (days) SVI30 (mL/g)
17 192.30
18 250.00
19 277.77
20 176.47
25 205.88
33 187.50
45 1293.33
56 213.59
61 512.19
Since the common strategies applied to eliminate filamentous bacteria (organic loading rate and
HRT) did not work, it was decided to study the effect of depletion of ammonia or phosphate during the
feast phase (stage 4 – Figure 3.1). For this purpose, the NH4+ or PO4
- was added to the reactor only
after the feast phase. These tests had no significant outcome as the filamentous bacteria and its
spores remained on the system, as can be observed in Figure 3.3. After 45 days of acclimatization the
reactor was stopped.
Figure 3.3– Nile blue staining (400x) – filamentous bacteria sporulating (stage 4)
The establishment of a stable PHA productive microbial culture has proven to be extremely
difficult due to the constant contamination of the system by filamentous bacteria and its spores. After
the discovery of a potential source of contamination (ventilation) a final attempt to achieve this
objective was put into practice. A different sludge was inoculated with an organic loading rate of 30 C-
mM of crude glycerol, a SRT of 5 days and a HRT of 2 days (stage 5 – Figure 3.1). The sludge and
hydraulic retention times were different since this inoculum was obtained from a PHA producing
reactor using biomass pyrolysis bio-oil as substrate, adapted to the former conditions (Moita & Lemos
2012). Moita & Lemos (2012) concluded that the PHA production in this system was mainly obtained

35
via volatile fatty acids (VFA) consumption. Since bio-oil is complex substrate with several available
carbon sources (organic acids, sugars, phenolic and other aliphatic compounds) there was a high
probability of existing a fraction of the microbial culture with the capacity to utilize a defined substrate
such as crude glycerol. As a matter of fact this assumption proven to be right as the capability of PHA
accumulation was observed in the new reactor. The adaptation of the inoculum to the crude glycerol
as new substrate was initially followed by the variation on the ratio of the feast/famine duration.
Following the dissolved oxygen (DO) concentration along time inside the reactor the feast phase can
be monitored. At the beginning of a cycle DO decreases, due to substrate consumption and as the
carbon source is consumed, an increase of DO occurs, indicating the transition between the feast and
the famine phase. Figure 3.4 illustrates the variation of the feast and famine ratio (F/F) during the first
60 days of SBR operation. In the first 5 days no significant changes in the DO were observed,
indicating poor substrate consumption. However, after this initial period a clear feast and famine
pattern was established.
Figure 3.4 – Feast/famine ratio (60 days)
Several authors have demonstrated that the F/F ratio is an important factor regarding the selection
of a culture with good polymer accumulation capacities (Dionisi et al. 2006; Albuquerque et al. 2010;
Jiang et al. 2011). All these studies reported that low F/F ratios (≤0.28) allow the PHA accumulating
organisms to compete with non-accumulating bacteria and that the selected culture has a good
storage response. With F/F ratios higher than 0.55 the selected microbial culture reveals a preferential
growth response instead of a polymer storage response. In this work, after the culture had been
acclimatized to the crude glycerol, the F/F ratio was maintained within the range of 0.04-0.12 (Figure
3.4), indicating that the SBR was operated under appropriate conditions to select organisms with
preferential storage capacity.

36
A typical daily cycle under steady operational conditions is shown in Figure 3.5-A. Since, no
significant changes were verified after 5 h of the cycle, only this fraction of time was relevant for the
daily monitoring. The cycle evolution of the reactor can be tracked by the variation of pH and dissolved
oxygen (DO) in Figure 3.5-B. Usually, the end of the feast phase is characterized by the shift of DO
and pH to higher values which is confirmed because the preferential carbon source (glycerol) ceases
to exist at the exact same time as the observed shift (approximately 45 minutes).
Figure 3.5 – A: variation of glycerol, methanol, ammonia, HB and GB in a typical daily cycle; B: Dissolved oxygen (DO) and pH variation during a typical daily cycle
The crude glycerol used mainly contains two different carbon sources: glycerol and methanol. In
the first hour of the cycle, glycerol was totally consumed at a specific rate of -0.32 Cmmol S/Cmmol
X.h. As can be observed in Figure 3.5-A, the consumption of glycerol is directly related to the
accumulation of two different microbial internal carbon reserves, PHA (only HB) and glycogen (GB)
A.
B.
37
are the two main polymers produced. Since glycerol is entering the metabolic pathways of the cell in
the glycolytic pathway, it was anticipated that besides PHA, glycogen, could be formed as storage
polymer as well. Comparing the specific production rates of both biopolymers, GB synthesis was
almost two times faster than PHB (0.11 Cmmol GB/Cmmol X.h and 0.06 Cmmol HB/Cmmol.X.h,
respectively). Also GB storage yield (0.42 Cmmol GB/Cmmol S) was higher than the PHB storage
yield (0.22 Cmmol HB/Cmmol S). Moralejo-Gárate et al. (2011) also reported the production of PHB
and a glucose polymer (PG) using synthetic glycerol and MMC. However, in this last case specific
PHB uptake rate and PHB storage yield were higher than the specific PG uptake rate and PG storage
yield. In a later study Moralejo-Gárate et al. (2013) compared the enrichment of the previous SBR
operated with 24h cycle length with an identical one but operated with 6h. In this last SBR the selected
culture preferred the PG storage over PHB storage. The authors suggested that the reduction of F/M
ratio verified in the 6h cycle, from 1.94 Cmol S/Cmol X to 0.25 Cmol S/Cmol X, led the selective
pressure to favor the fastest storage polymer, glucosepolymer. The SBR operated in this study was
very similar to the one reported by Moralejo-Gárate et al. (2011). The main differences were the use of
crude glycerol, room temperature and higher C/N ratio. Considering that the F/M ratio in this system is
similar to the one reported in the 6h cycle reactor of Moralejo-Garáte et al. (2013), the favoured GB
storage over PHB verified may be due to the low F/M ratio imposed to the SBR. The consumption of
both polymers in famine phase was related to biomass growth as illustrated in Figure 3.6.
Methanol was also consumed in the SBR, but at a lower rate when compared to glycerol (Figure
3.5-A). However, accurate determination of methanol consumption rates was not possible. The
analysis of methanol present in crude glycerol showed some inconsistencies that were not observed
when using pure methanol, suggesting the presence of interfering compounds in the crude glycerol.
Contrary to what happened with glycerol, after 1.33h methanol consumption was considered
negligible. Once glycerol was depleted both stored polymers began to be consumed, regardless of the
presence of methanol. This fact suggests that polymers accumulation is mainly associated to glycerol
consumption. As such, the biopolymers yields were calculated only based in glycerol consumption. In
order to understand methanol disappearance pattern, either being biological consumed or being
stripped by the aeration of the system, an assay with similar SBR conditions but with no biomass was
performed. Samples were taken during the first 4 hours of operation and no methanol stripping was
detected (data not shown). The observed methanol consumption can be related to a second microbial
community that was able to grow and persist in the SBR.

38
Figure 3.6 - Active Biomass variation during a typical daily cycle
Figure 3.6 illustrates the active biomass growth profile during the represented daily cycle.
Three different stages (I, II and III) can be clearly distinguished. During the biopolymers production
phase (I) the biomass growth rate was 2.13 Cmmol X/L.h. However, once the biopolymers began to
be consumed (II), the growth rate increases to a maximum of 6 Cmmol X/L.h. These results suggest
that, as said before, biomass growth occurs mainly from the biopolymers (HB and GB) consumption
during the famine phase of the cycle. Comparing the growth yield (YX/S =0.13 Cmmol X/Cmmol S)
during the feast using glycerol, with the growth yield (YX/Polymers =0.53 Cmmol X/Cmmol S), during
the famine from both polymers, it can be concluded that glycerol uptake is directed for polymers
storage and that their later consumption, during the famine phase, allows a growth response. The final
stage of the growth profile (III) is explained by the limiting concentration of ammonia present in the
system, hence the decrease in the biomass growth rate. Albuquerque et al. (2010) also observed the
difficulty of MMC to grow in the beginning of the cycle suggesting that it was due to the physiological
adaptation of the cells after a long starvation period.
The analysis of several daily cycles (Figure 3.7) demonstrates a clear tendency on the preferential
substrate storage, as shown by the increase in the biopolymers production yield (YHB/S and YGB/S)
during the culture enrichment, followed by a decrease in biomass production yield (YX/S). These
results confirm that the condition imposed in the SBR developed a community specialized on PHB and
GB storage through the consumption of crude glycerol.
I.
II.
III.

39
Figure 3.7 – Important parameters of the daily cycles
Moreover, taking into account that after 43 days no significant changes in the kinetic and
stoichiometric parameters were observed, it was considered that the system reached a steady-state
(8.5 SRT). Moralejo-Gárate et al. (2011) had reported a longer stabilization period of 19 SRT and 20
SRT for two SBR fed with synthetic glycerol but different time cycle (6 and 24h, respectively). The
shorter stabilization period verified in this study can be related to the fact that the used inoculum was
already rich in PHA accumulating organisms; therefore the use of crude glycerol as feedstock caused
only minor changes (cycle length 24h) in the operational conditions during the acclimatization of the
system.

40
Culture selection phase for glycogen production
In an effort to establish a PHA productive system the effect of incubation at a different temperature
was studied. This system had similar characteristics with the fifth stage (Table 3.1), except for the fact
that this system was kept at 30ºC. However, instead of developing a stable PHA productive system it
was observed that this conditions favoured the glycogen (GB) accumulative fraction of the mixed
microbial culture. Figure 3.8.A shows the increasing capability of the system to accumulate glycogen
overtime. This capability is demonstrated by the increase of the glycogen/glycerol yield. A 0.57 yield at
119 acclimatization days shows that more than half of the glycogen consumed was destined to the
production of glycogen. Since the contents of PHB produced by this culture were always in the low
range (1-3% of cell dry weight), the yield on PHB production is irrelevant.
Figure 3.8 – A: Comparison between GB yield and GB content; B: Typical cycle of the reactor (first five hours)
Figure 3.8-B illustrates a typical daily cycle of the culture. As can be observed the system has
the capability to utilize both fractions of crude glycerol (glycerol and methanol) to produce glycogen as
carbon storage. The glycogen accumulated during the feast phase (0-2 hours) is then used in the
famine phase to maintain the molecular machinery required for the culture to endure. The substrate
uptake rate in this cycle was -0.1608 Cmmol S/Cmmol X.h, with a glycogen production rate of 0.0765
A.
B.

41
Cmmol Glu/Cmmol X.h. The content of 17.15 wt.% of glycogen was obtained with Y GB/S of 0.56
Cmmol Glu/Cmmol S. Since the selected culture seems to have a good response in terms of glycogen
accumulation instead of PHB production (1-2% of cell dry weight), it was decided to perform an assay
to achieve the maximum glycogen content possible.
An accumulation test was performed with ten pulses of 30 C-mmol of crude glycerol and the
results show that maximum content was achieved at 26.92% of cell dry weight during the fifth pulse
(Figure 3.9). The highest yield on glycogen production was obtained in the first pulse (0.46 C-mmol
Glu/C-mmol S) with the respective production rate of 0.13 C-mmol Glu/C-mmol X.h. However, the
largest fraction of available carbon was directed towards respiration with yields ranging between 0.25
and 0.38 mmol-O2/C-mmol S during the entire assay, in contrast with the accumulation of glycogen
which drastically decreased its production yields overtime. In terms of PHB storage capacity, the
highest PHB content achieved was only 6% of cell dry weight thus the kinetic and stoichiometric
parameters (production rate and yield) for this polymer were not considered.
It has been reported that glycogen has an antitumor effect, probably through its
immunomodulating activity. Such activity may suggest a health benefit from the consumption of
glycogen as a food ingredient. Glycogen has also been used as a raw material in the cosmetic
industry, and as a carrier to enhance the yield of DNA during precipitation with organic solvent (Kajiura
et al. 2010). Even though this system presents interesting initial accumulation values to meet the
demand for glycogen for industrial applications, since the aim of this thesis is the production of
polyhydroxyalkanoates, the reactor was stopped. However, further investigation on other process
parameters, such as pH or SRT, could improve the glycogen accumulation even further. Nevertheless,
it has been demonstrated that in this mixed microbial culture the increase of the incubation
temperature favors the GB accumulative fraction.
Figure 3.9 - Maximum glycogen and PHB contents achieved in each pulse (% of cell dry weight)

42
Preliminary PHA accumulation tests
The main objective of the preliminary accumulation tests is to study the influence of each
substrate present in crude glycerol during the biopolymers storage mechanism. In order to achieve
this objective, four batch accumulation assays were performed: crude glycerol (GM1); synthetic
glycerol (GM2), synthetic methanol (GM3) and a synthetic mixture of glycerol and methanol (GM4) in
the same proportions to those in crude glycerol. The glycerol consumption rate (-qS) in GM1 is similar
along the three pulses (Figure 3.10; Table 3.4) which indicates a good substrate consumption
response by the selected culture and also a good acclimatization to the crude glycerol as feedstock.
As it was observed during the daily cycles, methanol was also consumed but at a lower rate than
glycerol in all pulses (data not show). Concerning the biopolymers production, Table 3.4 indicates an
increase on HB production rate from the first pulse to the second which remains relatively constant in
the third pulse. On the other hand, the GB production rate decreases during the entire assay. At the
end of the assay the selected culture was able to store 17.46% of HB (cell dry weight) and the HB
storage yield increased to 0.41 Cmmol HB/ Cmmol S. Even though a higher GB content was achieved
(19.51% of cell dry weight), the culture seems to lose GB storage capacity in the third pulse since the
GB storage yield decreased from 0.34 to 0.22 Cmmol GB/ Cmmol S. This result shows that although
glycogen is stored at a faster rate than HB in the beginning of the assay the selected culture reduces
its GB storage rate and yield along the experiment (Figure 3.12).
Figure 3.10 - Variation of consumed glycerol (Cmmol/L) in the three assays (GM1, GM2 and GM4 – 3 pulses)

43
In order to prevent biomass growth, the collected biomass from the main reactor was washed
twice with mineral solution (without any carbon source) to remove almost all supernatant. Even though
no ammonia was detected in the soluble fraction, nitrogen was present at the concentration of 2.92 N-
mmol/L in the sample before the addition of the substrate and it remain constant during the entire
assay. These results suggest that some particulate nitrogen coming from the SBR and/or ammonia
absorbed into the biomass may be responsible for the verified growth. Further work will be necessary
to understand the nitrogen source used by the selected culture for growing during the accumulation
assays. Comparing the kinetic and stoichiometric parameters of the daily cycle with GM1 (Table 3.4) it
can be observed that biopolymers production is affected. The HB storage rate (qHB) and HB
production yield (YHB/S) in GM1 is higher than in the daily cycle but GM1 presented a lower GB
production yield (YGB/S) than the daily cycle. Being that as it may, the lack of ammonia in the feed
seems to favour the HB production over the glycogen storage by the selected culture.
In GM2 synthetic glycerol was used as single substrate to better understand the contribution of
this carbon source in the biopolymers production. The specific glycerol uptake rates were relatively
constant (average value of 0.34 Cmmol S/CmmolX.h) during the first two pulses and then decreased
significantly (0.22 Cmmol S/Cmmol X.h) along with the increase on the respiration yield (Table 3.4).
However, PHB storage yield was maintained constant along the three pulses with an average value of
0.36 Cmmol HB/Cmmol Sg. The results show that similar specific glycerol uptake rates were obtained
with the first two pulses of GM2 and the entire GM1 assay (0.34 Cmmol S/CmmolX.h and 0.33 Cmmol
S/CmmolX.h, respectively on average) (Figure 3.11). Moreover, the PHB storage yield obtained in
each pulse of synthetic glycerol is very similar to the one obtained in the second and third pulses of
crude glycerol (0.39-0.41 Cmmol HB/Cmmol S) (Figure 3.11). These results suggest that the culture is
fully adapted to the carbon source and that the crude glycerol composition does not have a negative
influence on the biopolymers production. In GM2 glycogen biopolymer production shows lower
production rates and yields than the HB biopolymer (Table 3.4). In fact GB production ceased during
the second pulse of synthetic glycerol. The decrease on the GB storage of the culture, which was
already observed in GM1, is highlighted when synthetic glycerol was used as carbon source (Figure
3.11).

44
Figure 3.11 - Variation of produced HB (Cmmol/L) in the three assays (GM1, GM2 and GM4 – 3 pulses)
The response of the selected culture to the synthetic methanol as the only carbon source available
was study in GM3 assay. After the pulse of 30 CmM of synthetic methanol the accumulation batch
was followed during 2h and no methanol consumption was observed (data not show). Since high
methanol concentrations can negatively impact bacterial growth, the 30 CmM of methanol used in this
assay may have had a toxic effect on the microbial community.
Figure 3.12 - Variation of produced GB (Cmmol Glu/L) in the three assays (GM1, GM2 and GM4 – 3 pulses)

45
To better understand the roles of each carbon source present in the crude glycerol, a synthetic
mixture of glycerol and methanol was used (GM4). The mixture of synthetic glycerol and methanol is
in the same proportions as in the crude glycerol, which ensures that methanol is not present in an
inhibiting concentration. As it was observed in GM3, synthetic methanol was not consumed during the
entire GM4 assay (data not show). The fact that this culture is only able to consume methanol present
in the crude glycerol suggests that a specific compound present in the crude glycerol composition can
act as a co-factor for the methanol consumption. In GM4 the specific glycerol consumption rate was
higher in the first pulse (-0.21 Cmmol S/Cmmol X.h) and then decreases (-0.17 Cmmol S/Cmmol X.h)
in the other pulses, possibly due to an inhibition effect of cumulative methanol concentration.
Comparing with the other assays, the GM4 presented the lowest specific glycerol consumption rate,
which can be explain by the presence of synthetic methanol that apparently cannot be consumed by
the selected culture. The high respiration yield observed during this assay also supports these
findings, mainly in the last two pulses where the YO2/S was 0.51 Cmmol/Cmmol S. The synthetic
mixture allowed reaching a PHB content of 23% (cell dry weight) after 3 pulses and a HB production
yield on the higher range during the entire assay (Table 3.4). The comparison between the GM4 assay
and the others accumulation assays (GM1 and GM2) shows that despite the lowest glycerol uptake
rate (Figure 3.10, Table 3.4), it presents the highest HB content (Figure 3.11, Table 3.4) and similar
production yields (Table 3.4). However, taking in consideration the PHB productivity, the GM4 is the
only assay were the PHB production decreased along the pulses (ΔHB, 10.71 CmM HB in the first
pulse and 9.41 CmM HB in the third). Hence, the cumulative methanol not only seemed to slow down
the glycerol uptake rate but also interfere with the PHB accumulation capacity. Regarding the
glycogen production the same effect as the one reported in GM2 was observed. The maximum
specific glycogen production rate was obtained in the first pulse followed by a drastic decrease on the
production in the following pulses, reaching a step were no glycogen production was observed (Figure
3.12).

46
Table 3.4 - Relevant kinetic and stoichiometric parameters analysis of the preliminary PHA accumulation tests
Assay Substrate -qS qHB qGB % HB (max)
% GB (max)
ΔHB ΔGB Xi Y HB/S Y GB/S Y O2/S Y X/S
Daily cycle
Crude Glycerol
- 0.32 (0.046)
0.060 (0.021)
0.111 (0.052)
5.57 15.30 4.31 8.26 98.23 0.22 0.42 0.18 0.13
GM1
Crude Glycerol
1st Pulse
2nd
Pulse
3rd
Pulse
0.035 (0.024)
0.33
(0.029)
0.32 (0.055)
0.092 (0.022)
0.127
(0.019)
0.118 (0.040)
0.122 (0.018)
0.106
(0.040)
0.062 (0.022)
6.25
11.26
17.46
11.82
18.33
19.51
6.25
8.91
9.49
7.24
7.23
5.13
83.12
0.29
0.39
0.41
0.34
0.32
0.22
0.23
0.27
0.27
0.10
0.09
0.09
GM2
Synthetic Glycerol
1st Pulse
2nd
Pulse
3rd
Pulse
0.36 (0.023)
0.32
(0.023)
0.22 (0.012)
0.116 (0.021)
0.0950 (0.018)
0.0666 (0.026)
0.078 (0.008)
nd
nd
10.20
15.91
20.53
11.53
12.84
10.41
8.40
9.74
10.13
7.22
3.07
nd
83.12
0.37
0.35
0.36
0.22
0.13
nd
0.23
0.25
0.42
nd
nd
0.10
GM4
Synthetic Mixture of Glycerol and
Methanol
1st Pulse
2nd
Pulse
3rd
Pulse
0.21 (0.016)
0.17
(0.017)
0.17 (0.005)
0.064 (0.006)
0.104
(0.015)
0.061 (0.017)
0.071 (0.013)
0.051
(0.016)
nd
9.62
18.13
23.43
12.97
14.00
14.78
10.71
9.14
9.41
6.24
3.36
nd
79.05
0.31
0.39
0.37
0.27
0.12
nd
0.38
0.51
0.52
nd
0.05
0.16
Legend: (st deviation); nd – not determined; -qS (Cmmol S/Cmmol X.h); qHB (Cmmol HB/Cmmol X.h); qGB (Cmmol Glu/Cmmol X.h); %HBmax (% g/g cell dry weight); %GBmax (%/g cell dry weight); ΔHB (Cmmol HB/L); ΔGB (Cmmol Glu/L); Xi (Cmmol/L); Y HB/S (Cmmol HB/Cmmol S); Y GB/S (Cmmol Glu/Cmmol S); YO2/S (mmol O2/Cmmol S); Y X/S (Cmmol X/Cmmol S)

47
Maximum PHA storage capacity tests
In order to investigate the maximum storage capacity of the selected culture a multiple pulse
addition of crude glycerol was used (GA1). Figure 3.13 plots the results from the crude glycerol pulse
feeding assay GA1. As it has been reported before, glycerol and methanol were simultaneously
consumed by the selected culture and HB was produced with a maximum storage rate of 0.034
Cmmol HB/Cmmol X.h and a production yield of 0.46 Cmmol HB/Cmmol S from glycerol consumption.
After 30h, the accumulation assay has been stopped and a maximum PHB content of 46.91% (cell dry
weight) was achieved. The fact that the HB production rate decreased in the last hours indicates that
under these conditions the culture was near the maximum storage capacity.
Figure 3.13 - GA1 assay evolution
With the objective to study the system response to the continuous abundance of a carbon source
an accumulation assay with continuous feeding of crude glycerol (GA2) was performed. The maximum
glycerol uptake rate was 0.16 Cmmol S/Cmmol X.h. The rate at which the substrate was added to the
system was previous determined by the glycerol uptake rate measured in other assays (GM1).
However, the culture showed a much lower rate and the substrate accumulated over time (data not
shown). After 9h of assay, HB ceased to be produced (Figure 3.14) and a maximum HB content of
32.08% (cell dry weight) was achieved. The HB production yield in this assay was 0.28 Cmmol
HB/Cmmol S. The lower PHB content and storage yield obtained in GA2, when compared to GA3, can
be associated to a potential substrate inhibition. Notwithstanding, the maximum content achieved for
HB was higher than in preliminary tests which could signify that without the substrate inhibitions it may
be possible to obtain an even higher maximum content of HB.

48
Figure 3.14 - GA2 assay evolution
Synthetic glycerol was also used as substrate in a pulse feeding strategy (GA3) to evaluate the
maximum storage capacity of the selected culture using a pure and defined carbon source and it was
consumed at maximum rate of 0.20 Cmmol S/Cmmol X.h. The selected culture was able to
accumulate PHB with a production yield of 0.51 Cmmol HB/Cmmo S, reaching a maximum PHB
content of 53.31% (cell dry weight).
Comparing the GA1 with the GA3 shows that although the maximum glycerol uptake rate was
similar in both assays (Table 3.5), the glycerol uptake rate decreased faster in GA3 (after 7h) than in
GA1 (after 15h) (Figures 3.13 and 3.15). This effect was also verified in the performed batch assays
GM1 and GM3. Nevertheless, the highest PHB storage yield and PHB content were achieved using
synthetic glycerol in GA3. Considering the assumptions of Moralejo-Gárate et al. (2011) which stated
that the simultaneous occurrence of a glucose polymer and growth could explain the difference
between the theoretical (0.67 Cmmol HB/Cmmol glycerol) and the observed yield of PHB over
glycerol, the glycogen storage (YGB/S= 0.02 Cmmol GB/CmmolS) and growth (YX/S= 0.13 Cmmol X/
CmmolS) yields of this study complements the mentioned difference. In the same study, Moralejo-
Gárate et al. reported a maximum PHB storage yield of 0.57 Cmmol HB/ Cmmol S and a PHB content
of 67% (cell dry weight) after 6h. In GA3 even though the accumulation test was stopped after 20h, the
maximum storage capacity of the enriched culture had not been achieved, considering that HB seems
to have a linear producing capacity at this stage (Figure 3.15).

49
Figure 3.15 - GA3 assay evolution
It can be concluded that a higher HB content could be achieved using the selected culture and
synthetic glycerol as carbon source. Glycogen biopolymer was also produced during the three
accumulation assays performed (Figures 3.13, 3.14 and 3.15) but rapidly started to be consumed and
remained low during the rest of the assays. The reason why the selected microbial community stops
the glycogen storage while continuing accumulating PHB through glycerol consumption is still unclear
and future work will be necessary to better understand the PHB/glycogen metabolism of this culture.

50
Table 3.5 - Relevant kinetic and stoichiometric parameters analysis of the maximum PHA storage capacity tests
Assay Substrate Feeding
Regime
-qs qHB qGB % HB (max)
% GB (max)
ΔHB ΔGB Xi Y
HB/S Y
GB/S Y O2/S Y X/S
GA1
Crude Glycerol
(14X 30CmM)
Pulse Feeding
0.20
(0.046)
0.034
(0.008)
0.131
46.91
16.69
137.27
12.71
67.64
0.46
0.04
0.45
0.11
GA2
Crude Glycerol
(0.55 CmM/min)
Continuous
Feeding
0.16
(0.025)
0.056
(0.011)
0.047
(0.014)
32.08
14.17
59.16
9.72
82.08
0.28
0.05
0.42
0.19
GA3
Synthetic
Glycerol
(12X 30CmM)
Pulse Feeding
0.20
(0.035)
0.070
(0.017)
0.059
(0.021)
53.31
12.88
160.34
7.68
60.95
0.51
0.02
0.45
0.13
Legend: (st deviation); -qS (Cmmol S/Cmmol X.h); qHB (Cmmol HB/Cmmol X.h); qGB (Cmmol Glu/Cmmol X.h); %HBmax (% g/g cell dry weight); %GBmax (%/g cell dry weight); ΔHB (Cmmol HB/L); ΔGB (Cmmol Glu/L); Xi (Cmmol/L); Y HB/S (Cmmol HB/Cmmol S); Y GB/S (Cmmol Glu/Cmmol S);YO2/S (mmol O2/Cmmol S); Y X/S (Cmmol X/Cmmol S)

51
Table 3.6 - Important studies on PHA accumulation
Substrate Maximum PHA content (%)
Reference
Acetate 89 Johnson et al. 2009
Lactate 90 Jiang et al. 2011
Acetate 67 Serafim et al. 2004
Synthetic Glycerol 67 Moralejo-Gárate et al. 2011
Olive oil mill 48 Dionisi et al. 2005
Paper mill 48 Bengtsson et al. 2008
Fermented molasses 75 Albuquerque et al. 2010
Crude Glycerol 47 This study
Recently, Jiang et al. (2011) enriched a community using lactate as carbon source. The
enrichment could accumulate over 90 wt.% PHB, currently the highest value reported in mixed
community process. Johnson et al. (2009) reached 89% of PHA content using acetate as carbon
source, after community selection during years. Also using acetate as carbon source, the work of
Serafim et al. (2004) reported 67 wt.% of polymers accumulated. Moralejo-Gárate et al. (2011)
achieved 67 wt.% using synthetic glycerol as carbon source. However, as stated before, the use of
chemically defined substrates increases the costs of PHA production. Therefore, several processes
using MMC and real complex wastes have been reported (Table 3.6). Dionisi et al. (2005) reached 54
wt.% using fermented olive mills effluent, Bengtsson et al. (2008) achieved 48 wt.% using fermented
paper mill effluent, Albuquerque et al. (2010) reported 78 wt.% using fermented molasses. All of these
studies have in common the fact that a pre-fermentation step is required in order to increase the
volatile fatty acids (VFAs) content of the feedstock. VFAs are considered as the main precursors to
produce PHAs from MMC, thus feedstocks with high VFA content are more suitable to achieve high
PHA content. the aforementioned studies reported not only PHA contents higher than those obtained
in this study with crude glycerol, but also higher PHA production yield during the PHA production step,
a fact that can be explained by the absence of any pre-fermentation step in this study. Nevertheless
for the industrial scale-up of any process it is important to consider the overall efficiency and
determine the PHA yield over the entire process accounting for all the carbon added, being consumed
or not. Thus, PHA yield (0.30 g COD HB/g COD crude glycerol) of this study was within the overall
PHA yields reported by those works (0.26-0.44 g COD PHA/g COD real waste).
The pre-fermentation step involves an additional reactor and usually an ultrafiltration system to
separate biomass from the effluent. The separation procedure usually allows the recovery of 90-95%
of the effluent, with high maintenance costs. Therefore, although the overall PHA yield of this study is
not the highest reported so far, the fact that crude glycerol can be used to produce PHA without any
pre-treatment step makes the overall production process economically interesting, reducing PHB final
cost.

52
Only few works reported PHA production using MMC and real waste substrate with non-VFA
organic matter. Gurieff et al. (2007) enriched a mixed culture using primary sludge as the feedstock
and in the accumulation step obtain a PHA content of 20% (cell dry weight) with primary sludge and
39% with fruit cannery wastewater. Liu et al. (2008) reported a PHA content of 20% (cell dry weight)
using tomato cannery wastewater. The PHB content of 47% (cell dry weight) obtained with crude
glycerol in this work is the highest PHB content reported with aerobic mixed cultures and a real waste
substrate with non-VFA organic matter. The microbial community observed using nile blue staining
techniques (Figure 3.16) revealed similarity to the one reported by Moralejo-Gárate et. al (2011). This
is the first study that shows the valorization of glycerol present in the crude into PHAs using an aerobic
microbial consortium.
Figure 3.16 – A and B: Nile blue staining observation; C and D: phase contrast (400x)
A B
C D

53
4. Conclusions and future work In this work crude glycerol was used as a feedstock to produce PHB, in an effort to create a
value added product using an industrial by-product. When temperature was tested as a selective
parameter the system revealed the ability to accumulate glycogen as main product. This reactor
showed interesting GB contents (25%) and further investigation is required to understand if it is
possible to achieve higher polymer contents. The study of higher incubation temperatures and
different SRT and HRT of the system could be considered interesting future work.
However, the main objective of this study was the accumulation of PHB and even though the
final objective was achieved, this system has proven to be difficult to establish due to the constant
contaminations observed. Therefore, the selection strategies applied to give PHB-accumulating
bacteria the competitive advantage (variations on HRT, SRT and later addition of nutrients) were not
successful at first. The main reason these strategies did not succeed was due to a contamination
coming from the aeration system. Once this source of contamination was detected and resolved, it
was observed that the mixed microbial culture evolved in the PHB accumulation direction. Since bio-oil
is a complex substrate with several available carbon sources, the possibility of existing enzymatic
machinery able to use crude glycerol to produce polyhydroxyalkanoates was tested, therefore the last
working reactor was inoculated with biomass from a system using bio-oil as substrate (Moita & Lemos
2012). After the stabilization of the accumulating culture, preliminary tests revealed that the
abundance of crude glycerol did not affected the production of PHB, the lack of ammonia favors the
HB production over GB production and methanol by itself is not a suitable feedstock to this culture, as
a toxic effect was observed. The maximum accumulation tests showed that the culture achieved its
maximum accumulating capacity with crude glycerol (GA1) but higher polymer content was achieved
when synthetic glycerol was used (GA3). The main study showed that crude glycerol was used to
produce PHB from aerobic mixed cultures achieving the highest PHB content using real waste
substrate with non-VFA fraction. The overall PHA yield on substrate was in the same range as others
studies with MMC and real wastes. The fact that crude glycerol does not need a pre-fermentation step
to be converted into PHB makes the overall production process economically more sustainable. This
is the first study that shows the valorization of crude glycerol into PHAs using an aerobic mixed
microbial consortium and since the longer duration of the cultivation of a mixed microbial culture in
feast–famine regime, improves its PHA-producing capacity and rate due to the continuous selective
pressure and competition, it may be possible to improve these results even further. The study of
HB/GB accumulation dynamics could provide interesting results as well as the use of higher organic
loading rates. The microbial community analysis (FISH and DGGE) could also provide valuable
information regarding the types and groups of bacteria present in this system.

54

55
Bibliography Albuquerque, M.G.E., Torres, C. a V & Reis, M. a M., 2010. Polyhydroxyalkanoate (PHA) production
by a mixed microbial culture using sugar molasses: effect of the influent substrate concentration
on culture selection. Water research, 44(11), pp.3419–33.
Ashby, R.D., Solaiman, D.K.Y. & Foglia, T. a., 2004. Bacterial Poly(Hydroxyalkanoate) Polymer
Production from the Biodiesel Co-product Stream. Journal of Polymers and the Environment,
12(3), pp.105–112.
Bengtsson, S. et al., 2008. Production of polyhydroxyalkanoates by activated sludge treating a paper
mill wastewater. Bioresource technology, 99(3), pp.509–16.
Bouriazos, A. et al., 2010. Catalytic conversions in green aqueous media: Part 4. Selective
hydrogenation of polyunsaturated methyl esters of vegetable oils for upgrading biodiesel. Journal
of Organometallic Chemistry, 695(3), pp.327–337.
Bugnicourt, E., 2014. Polyhydroxyalkanoate (PHA): Review of synthesis, characteristics, processing
and potential applications in packaging. Express Polymer Letters, 8(11), pp.791–808.
Carreira, P. et al., 2011. Utilization of residues from agro-forest industries in the production of high
value bacterial cellulose. Bioresource technology, 102(15), pp.7354–60.
Chang, H.-F. et al., 2011. Comparison of polyhydroxyalkanoates production by activated sludges from
anaerobic and oxic zones of an enhanced biological phosphorus removal system: effect of
sludge retention time. Bioresource Technology, 102(9), pp.5473–5478.
Chanprateep, S., 2010. Current trends in biodegradable polyhydroxyalkanoates. Journal of bioscience
and bioengineering, 110(6), pp.621–32.
Chen, G., 2010. Plastics Completely Synthesized by Bacteria : Polyhydroxyalkanoates. , 14, pp.17–38.
Chi, Z. et al., 2007. A laboratory study of producing docosahexaenoic acid from biodiesel-waste
glycerol by microalgal fermentation. Process Biochemistry, 42(11), pp.1537–1545.
Chua, A.S.M. et al., 2003. Production of polyhydroxyalkanoates (PHA) by activated sludge treating
municipal wastewater: effect of pH, sludge retention time (SRT), and acetate concentration in
influent. Water research, 37(15), pp.3602–11.
Cintas, P. et al., 2014. Glycerol: a solvent and a building block of choice for microwave and ultrasound
irradiation procedures. Green Chemistry, 16(3), p.1056.
Dionisi, D. et al., 2004. Biodegradable polymers from organic acids by using activated sludge enriched
by aerobic periodic feeding. Biotechnology and bioengineering, 85(6), pp.569–79.
Dionisi, D. et al., 2006. Effect of the applied organic load rate on biodegradable polymer production by
mixed microbial cultures in a sequencing batch reactor. Biotechnology and bioengineering, 93(1),
pp.76–88.
Dionisi, D. et al., 2005. Olive oil mill effluents as a feedstock for production of biodegradable polymers.
Water research, 39(10), pp.2076–84.
Dobroth, Z.T. et al., 2011. Polyhydroxybutyrate synthesis on biodiesel wastewater using mixed
microbial consortia. Bioresource technology, 102(3), pp.3352–9.
Donkin, S.S. et al., 2009. Feeding value of glycerol as a replacement for corn grain in rations fed to
lactating dairy cows. Journal of dairy science, 92(10), pp.5111–9.

56
Fernando, S. et al., 2006. Biorefineries: Current Status, Challenges, and Future Direction. Energy &
Fuels, 20(4), pp.1727–1737.
Gunn, P.J. et al., 2010. Effects of crude glycerin on performance and carcass characteristics of
finishing wether lambs. Journal of animal science, 88(5), pp.1771–6.
Guo, J. et al., 2014. Effects of feeding pattern and dissolved oxygen concentration on microbial
morphology and community structure: The competition between floc-forming bacteria and
filamentous bacteria. Journal of Water Process Engineering.
Gurieff, N. & Lant, P., 2007. Comparative life cycle assessment and financial analysis of mixed culture
polyhydroxyalkanoate production. Bioresource technology, 98(17), pp.3393–403.
Huber, G.W., Iborra, S. & Corma, A., 2006. Synthesis of transportation fuels from biomass: chemistry,
catalysts, and engineering. Chemical reviews, 106(9), pp.4044–98.
Jiang, Y. et al., 2011. Polyhydroxybutyrate production from lactate using a mixed microbial culture.
Biotechnology and bioengineering, 108(9), pp.2022–35.
Kajiura, H. et al., 2010. Structure and solution properties of enzymatically synthesized glycogen.
Carbohydrate Research, 345(6), pp.817–824.
Khardenavis, A. a et al., 2007. Biotechnological conversion of agro-industrial wastewaters into
biodegradable plastic, poly beta-hydroxybutyrate. Bioresource technology, 98(18), pp.3579–84.
Laycock, B. et al., 2013. The chemomechanical properties of microbial polyhydroxyalkanoates.
Progress in Polymer Science, 38(3-4), pp.536–583.
Lemos, P.C., Serafim, L.S. & Reis, M. a M., 2006. Synthesis of polyhydroxyalkanoates from different
short-chain fatty acids by mixed cultures submitted to aerobic dynamic feeding. Journal of
biotechnology, 122(2), pp.226–38.
Li, R., Zhang, H. & Qi, Q., 2007. The production of polyhydroxyalkanoates in recombinant Escherichia
coli. Bioresource technology, 98(12), pp.2313–20.
Liang, Y. et al., 2010. Batch stage study of lipid production from crude glycerol derived from yellow
grease or animal fats through microalgal fermentation. Bioresource technology, 101(17),
pp.6745–50.
Moita Fidalgo, R. et al., 2014. Bio-oil upgrading strategies to improve PHA production from selected
aerobic mixed cultures. New biotechnology, 31(4), pp.297–307.
Moita, R. & Lemos, P.C., 2012. Biopolymers production from mixed cultures and pyrolysis by-
products. Journal of biotechnology, 157(4), pp.578–83.
Moralejo-Gárate, H. et al., 2013. Impact of oxygen limitation on glycerol-based biopolymer production
by bacterial enrichments. Water research, 47(3), pp.1209–17.
Moralejo-Gárate, H. et al., 2011. Microbial community engineering for biopolymer production from
glycerol. Applied microbiology and biotechnology, 92(3), pp.631–9.
Mu, Y., Xiu, Z.-L. & Zhang, D.-J., 2008. A combined bioprocess of biodiesel production by lipase with
microbial production of 1,3-propanediol by Klebsiella pneumoniae. Biochemical Engineering
Journal, 40(3), pp.537–541.
Naranjo, J.M. et al., 2013. Valorization of glycerol through the production of biopolymers: The PHB
case using Bacillus megaterium. Bioresource technology, 133C, pp.38–44.
Parsons, G.L., Shelor, M.K. & Drouillard, J.S., 2009. Performance and carcass traits of finishing
57
heifers fed crude glycerin. Journal of animal science, 87(2), pp.653–7.
Pratt, S. et al., 2012. Microaerophilic conditions support elevated mixed culture polyhydroxyalkanoate
(PHA) yields, but result in decreased PHA production rates. Water science and technology : a
journal of the International Association on Water Pollution Research, 65(2), pp.243–6.
Reis, M. a M. et al., 2003. Production of polyhydroxyalkanoates by mixed microbial cultures.
Bioprocess and biosystems engineering, 25(6), pp.377–85.
Sabourin-Provost, G. & Hallenbeck, P.C., 2009. High yield conversion of a crude glycerol fraction from
biodiesel production to hydrogen by photofermentation. Bioresource technology, 100(14),
pp.3513–7.
Santacesaria, E. et al., 2012. Main technologies in biodiesel production : State of the art and future
challenges. , 195, pp.2–13.
Scholten, E., Renz, T. & Thomas, J., 2009. Continuous cultivation approach for fermentative succinic
acid production from crude glycerol by Basfia succiniciproducens DD1. Biotechnology letters,
31(12), pp.1947–51.
Serafim, L.S. et al., 2008. Strategies for PHA production by mixed cultures and renewable waste
materials. Applied microbiology and biotechnology, 81(4), pp.615–28.
Takeshita, T. & Yamaji, K., 2008. Important roles of Fischer–Tropsch synfuels in the global energy
future. Energy Policy, 36(8), pp.2773–2784.
Tan, H.W., Abdul Aziz, a. R. & Aroua, M.K., 2013. Glycerol production and its applications as a raw
material: A review. Renewable and Sustainable Energy Reviews, 27, pp.118–127.
Teeka, J. et al., 2012. Characterization of polyhydroxyalkanoates (PHAs) biosynthesis by isolated
Novosphingobium sp. THA_AIK7 using crude glycerol. Journal of industrial microbiology &
biotechnology, 39(5), pp.749–58.
Venkateswar Reddy, M. & Venkata Mohan, S., 2012. Effect of substrate load and nutrients
concentration on the polyhydroxyalkanoates (PHA) production using mixed consortia through
wastewater treatment. Bioresource technology, 114, pp.573–82.
Villano, M. et al., 2010. Effect of pH on the production of bacterial polyhydroxyalkanoates by mixed
cultures enriched under periodic feeding. Process Biochemistry, 45(5), pp.714–723.
Yang, F., Hanna, M. a & Sun, R., 2012. Value-added uses for crude glycerol--a byproduct of biodiesel
production. Biotechnology for biofuels, 5(1), p.13.
Zhu, C. et al., 2013. Bioplastics from waste glycerol derived from biodiesel industry. Journal of Applied
Polymer Science, 130(1), pp.1–13.