avisos legais - fibria – relações com investidores itour _final_port_271016.pdf · avisos...
TRANSCRIPT


Avisos Legais
As informações contidas nesta apresentação podemincluir afirmações que constituem estimativas,conforme o significado disposto na Seção 27A do U.S.Securities Act de 1933 e emendas ao mesmo e naSeção 21E do U.S. Securities Exchange Act de 1934 eemendas ao mesmo.
Tais estimativas envolvem um certo grau de risco eincerteza em relação às previsões empresariais,financeiras, de tendências, estratégicas e outras,podendo estar baseadas em premissas, dados oumétodos que, apesar de considerados razoáveis pelaempresa naquele dado momento, podem se revelarincorretos, imprecisos ou mesmo infactíveis.
A empresa não dá qualquer garantia deque as expectativas expostas nesta apresentação seconfirmarão.
Os investidores em potencial ficam desde já avisadosque as referidas estimativas não são garantias dedesempenho futuro e envolvem riscos e incertezas.
Ficam também avisados que os resultados reaispoderão ser bastante diferentes daqueles dados nasestimativas, devido a vários fatores que incluem, masnão se limitam aos riscos inerentes dos negóciosinternacionais e outros riscos previstos nosdocumentos arquivados pela empresa junto à CVM e àSEC.
Fica desde já declarado que a empresa não assumiráqualquer obrigação de atualizar as estimativas, asquais representam apenas a data na qual foram feitas.

THE FUTURE OF MARKET PULP
5TH INVESTOR TOURARACRUZ, 21-22 SEPTEMBER 2016
A PRESENTATION BY MR. JOÃO CORDEIRO

COPYRIGHT©PÖYRY
FIBRIA INVESTOR TOUR 2016
SEPTEMBER 2016FIBRIA INVESTOR TOUR 2016
COPYRIGHT©PÖYRYSEPTEMBER 2016
FIBRIA INVESTOR TOUR 2016
THE FUTURE OF MARKET PULP
“What drives demand for market pulp ?”1
“How substitution of fibres will evolve ?”2
“Where will the new supply come from ?”3
“What is happening in the next five years ?”4
“How to create long-lasting shareholder value ?”5

COPYRIGHT©PÖYRYSEPTEMBER 2016
FIBRIA INVESTOR TOUR 2016
“What drives the demand for
market pulp?”1

COPYRIGHT©PÖYRY
DEMAND DRIVERS FOR BEKP:
FIRST…
SEPTEMBER 2016FIBRIA INVESTOR TOUR 2016
Organic Growth• A multitude of applications
• The geography of megatrends
COPYRIGHT©PÖYRY
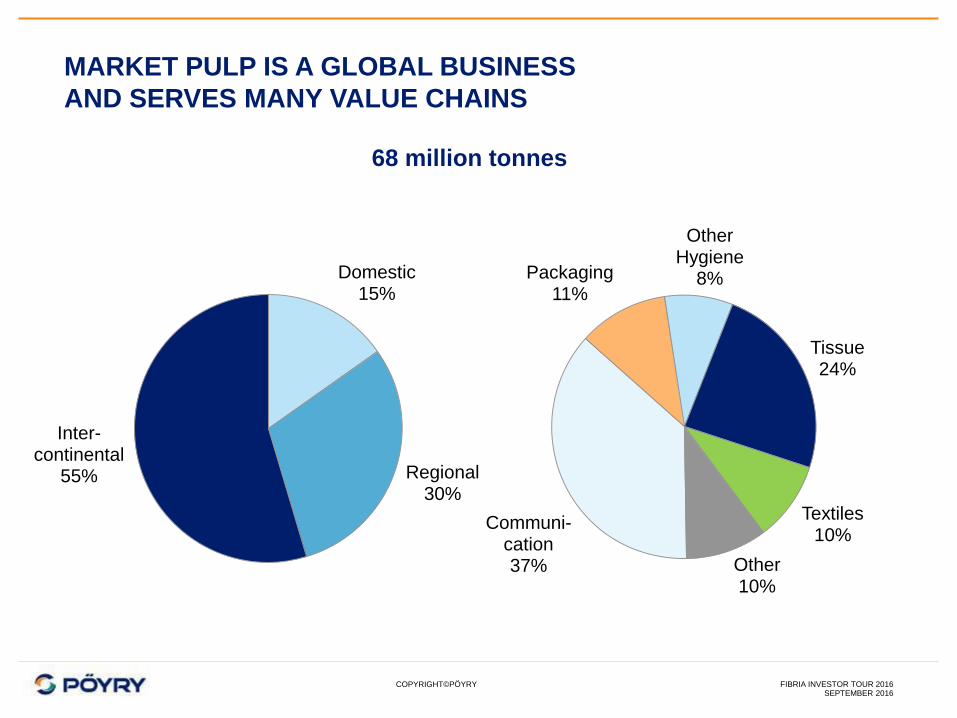
MARKET PULP IS A GLOBAL BUSINESS
AND SERVES MANY VALUE CHAINS
SEPTEMBER 2016FIBRIA INVESTOR TOUR 2016
Domestic15%
Regional30%
Inter-continental
55%
Communi-cation37%
Packaging11%
Other Hygiene
8%
Tissue24%
Textiles10%
Other10%
68 million tonnes

COPYRIGHT©PÖYRYSEPTEMBER 2016
FIBRIA INVESTOR TOUR 2016
CONSUMPTION PATTERNS ARE RAPIDLY CHANGING
Total Paper & Board Demand
in the “West”
0
100
200
300
2000 2010 2020 2030
Mil
ha
res
Million tonnes
0
100
200
300
2000 2010 2020 2030
Mil
ha
res
Million tonnes
Graphic Papers
Packaging Papers
Tissue
Graphic Papers
Packaging Papers
Tissue
West = North America, Western Europe, Japan, Oceania
East = All other world regions
Total Paper & Board Demand
in the “East”

COPYRIGHT©PÖYRY
0
10
20
30
40
50
0
2
4
6
8
10
1980 1995 2010
Ctd. Mech., W. Europe (left)
Mech. pulp, Global (right)
Mechanical
pulp
Ctd Mech
Papers
SEPTEMBER 2016FIBRIA INVESTOR TOUR 2016
Growth
FROM A LIFE CYCLE PERSPECTIVE
BEKP AND TISSUE ARE GROWTH SEGMENTS
0
10
20
30
40
50
0
5
10
15
20
25
1980 1995 2010
Tissue, China (left)
Market BEKP, Global (right)
Tissue
China
Market BEKP
0
5
10
15
20
25
0
4
8
12
16
20
1980 1995 2010
Newsprint, North Am. (left)
Sulfite pulp (right)
Newsprint
North America
Sulphite pulp
Demand M t/a
Maturity Decline

COPYRIGHT©PÖYRY
GROWING PRODUCTION OF TISSUE AND PACKAGING PAPERS
COMPENSATES FOR THE DECLINE IN GRAPHIC SEGMENT
SEPTEMBER 2016FIBRIA INVESTOR TOUR 2016
0
50
100
150
200
Graphic
PapersTissue
White
Packaging
Papers
Specialties
Million tonnes
196
-15.6
+13.3 +6.4 +2.1 202
Paper and Paperboard Production Development
grades using Bleached Kraft Pulp only
2014 2025

COPYRIGHT©PÖYRYSEPTEMBER 2016
IMPROVED HYGIENE STANDARDS
AND MORE WHITE PACKAGING
23,528,7
+3.6 -2.4 +2.8+1.2
0
20
40
60
2014 Fluff Graphic Tissue Pack. &Spec.
2030
Million tonnes
Demand
Decline 2014-2030
Increment 2014-2030
28,9
44,6
+0.4
+12.5+2.8
0
20
40
60
2014 Graphic Tissue Pack. &Spec.
2030
Million tonnes
Global demand growth for
BSKP Market Pulp
Global demand growth for
BHKP Market Pulp
FIBRIA INVESTOR TOUR 2016

COPYRIGHT©PÖYRYSEPTEMBER 2016
CHINA IS RESPONSIBLE FOR MORE THAN 60%
OF THE WORLD’S INCREMENTAL DEMAND
Demand for papermaking market pulps
61
82
1
13
62 1
0
15
30
45
60
75
90
2014 NorthAmerica
WesternEurope
Japan EasternEurope
China Rest ofAsia
LatinAmerica
Others 2030
Million tonnes
FIBRIA INVESTOR TOUR 2016
Demand
Decline 2014-2030
Increment 2014-2030

COPYRIGHT©PÖYRYSEPTEMBER 2016
FIBRIA INVESTOR TOUR 2016
Global Middle Class
GROWTH IN ASIA IS EMPOWERED BY URBANIZATION
AND INCREASING DISPOSABLE INCOME
Urban Population in China and India
0,0
0,2
0,4
0,6
0,8
1,0
1,2
2000 2015 2030 2045
Billion people living in cities
+165 Mi
+220 Mi
0
1
2
3
4
5
2000 2010 2020 2030
Middle class population – billion
China
India
China
India
OECD
Rest of the World
COPYRIGHT©PÖYRY
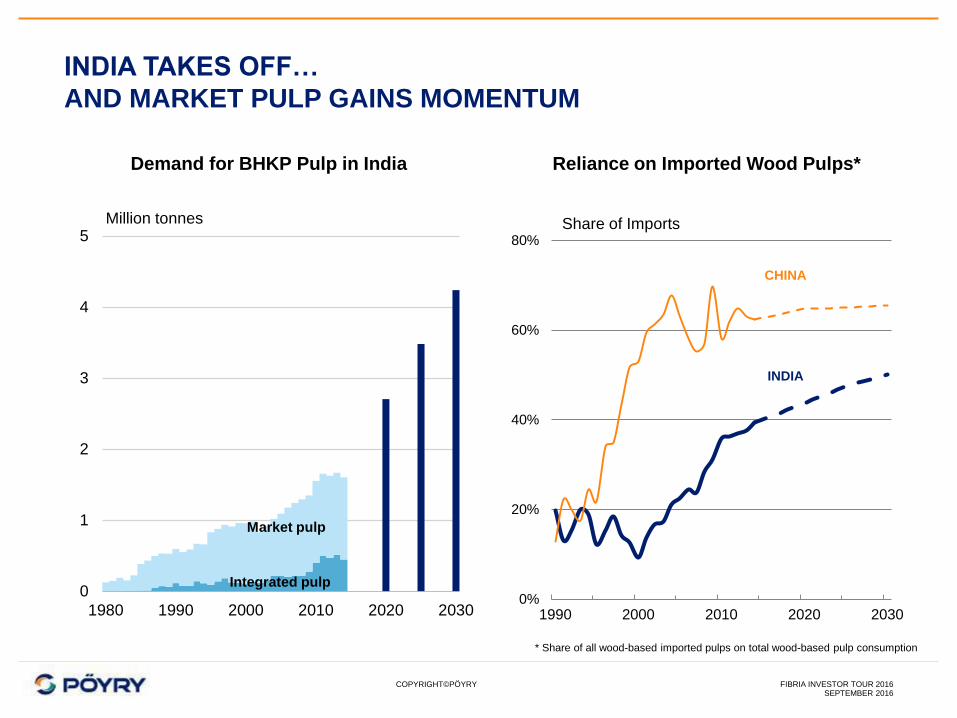
INDIA TAKES OFF…
AND MARKET PULP GAINS MOMENTUM
SEPTEMBER 2016FIBRIA INVESTOR TOUR 2016
Demand for BHKP Pulp in India
0
1
2
3
4
5
1980 1990 2000 2010 2020 2030
Milh
are
s
Million tonnes
Integrated pulp
Market pulp
0%
20%
40%
60%
80%
1990 2000 2010 2020 2030
INDIA
CHINA
Reliance on Imported Wood Pulps*
Share of Imports
* Share of all wood-based imported pulps on total wood-based pulp consumption

COPYRIGHT©PÖYRY
“How substitution of fibres
will evolve ?”2
SEPTEMBER 2016FIBRIA INVESTOR TOUR 2016
COPYRIGHT©PÖYRY
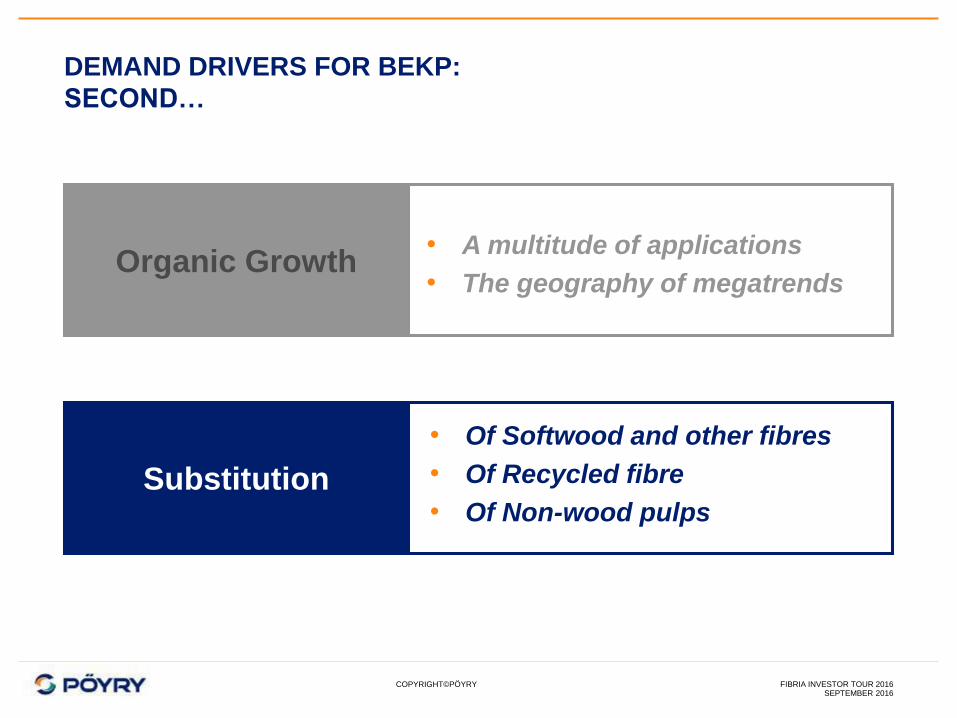
DEMAND DRIVERS FOR BEKP:
SECOND…
SEPTEMBER 2016FIBRIA INVESTOR TOUR 2016
Organic Growth
Substitution
• A multitude of applications
• The geography of megatrends
• Of Softwood and other fibres
• Of Recycled fibre
• Of Non-wood pulps

COPYRIGHT©PÖYRY
BHKP MARKET PULP
A HUGE POTENTIAL TO SUBSTITUTE OTHER FIBRES
SEPTEMBER 2016FIBRIA INVESTOR TOUR 2016
0
50
100
150
200
Brownrecycled
fibres
Othervirginfibres
Whiterecycled
fibres
BHKPintegrated
BSKPNon-woodfibres
Other P&B
Packaging Papers
Tissue
Graphic Papers
Million tonnes
Other virgin fibres include mechanical, semi-chemical and unbleached kraft pulps
Current Global Consumption of Papermaking Fibres
BHKP
Market pulp
13
3032
6470
165
29

COPYRIGHT©PÖYRY
0%
50%
100%
150%
2015e Future
SUPPLY OF WHITE RECYCLED FIBRE IS UNDER STRESS
SEPTEMBER 2016FIBRIA INVESTOR TOUR 2016
Virgin
Fibre
Recycled
Fibre
Example European Tissue Furnish
Fibre Migration
• Shift from recycled towards virgin fibre
Substitution between grades
• Limited attractiveness to invest in new
deinking capacity
Organic growth
• Tissue demand at 2%/a
• Sofwood looses share to hardwood
1
2
3

COPYRIGHT©PÖYRY
THE SHARE OF NON-WOOD PULP WILL DECLINE
SEPTEMBER 2016FIBRIA INVESTOR TOUR 2016
Share of Non-Wood Pulp in ChinaConsumption of Non-Wood Pulp by Region
0
5
10
15
20
2000 2005 2010 2015 2020 2025 2030
Million tonnes
China
Rest of Asia-Pacific
Rest of the World
0%
2%
4%
6%
8%
10%
2013 2020 2025 2030
Bamboo
Straw
Bagasse
Other
In total papermaking fibre
8.3 M t
5 M t

COPYRIGHT©PÖYRYSEPTEMBER 2016
FIBRIA INVESTOR TOUR 2016
“Where will the new supply
come from?”3

COPYRIGHT©PÖYRY
THERE ARE LIMITED SPOTS IN THE WORLD
FOR LARGE-SCALE COMPETITIVE MARKET PULP PRODUCTION
SEPTEMBER 2016FIBRIA INVESTOR TOUR 2016
Predominantly
softwood
Predominantly
hardwood
Availability of
softwood
plantations,
good for fluff
Some capacity
increase in
BSKP
Large land
availability, but
only a few spots
for large-scale
competitive
platforms
Major demand
increase in
construction: wood
panels, sawnwood,
Plantation development
potential –
regional challenges
Mountain pine
beetle
infestation
Supply shifting
from natural forest
to fast-growing
plantations –
limited industrial
sites
Wood export
platform to Asia,
eucalyptus
availability will
diminish
Good long-fibre wood availability
but logistics challenges
Bio-energy
usage
increasing

COPYRIGHT©PÖYRYSEPTEMBER 2016
FIBRIA INVESTOR TOUR 2016
Chinese Wood Demand by Sector
CHINESE WOOD DEFICIT MAY INCREASE FURTHER
0
50
100
150
SupplyDemand SupplyDemand
For pulp industry For other uses
Imports Domestic Supply
Index, 2014= 100
2014 2025
Chinese Pulpwood Costs
• The pulp making sector accounts for only
some 10% of the total demand, has little
bargaining power
• Wood imports will double in ten years
• Expansion of domestic market pulp supply
is rather limited
• Pulpwood costs are bound to increase
further

COPYRIGHT©PÖYRY
ASIAN PULP INDUSTRY HAS GROWN, BUT BASED ON
INCREASING DEPENDENCE ON IMPORTED WOOD CHIPS
SEPTEMBER 2016FIBRIA INVESTOR TOUR 2016
0
5
10
15
20
25
1995 2000 2005 2010 2015
Japan
China
Taiwan
South Korea
India
Million BDMT
Hardwood Wood Chip Imports
Africa
Australia
Indonesia
Chile
& BrazilVietnam
Thailand

COPYRIGHT©PÖYRYSEPTEMBER 2016
FIBRIA INVESTOR TOUR 2016
Development of Wood Chip
Imports in Asia-Pacific
THERE ARE NEW PRESSURES ON ASIAN WOOD CHIP MARKETS
69
M m3
141
M m3
40
58
0
5
10
15
20
25
30
35
2015 2025 f
Japan
China
Other
250
300
350
400
450
500
2009 2010 2011 2012 2013 2014 2015 2016*
From Australia
From Vietnam
USD/ADT of pulp
Imported Fibre Costs
to Chinese Pulp Mills
Emerging Asia-Pacific wood chip demand drivers:
• Japanese nuclear power policy and guaranteed electricity price incentives to support bio-energy
• New pulp capacity in Indonesia reshuffles the wood chip markets
• Expansion of pulp production within China, Vietnam and Thailand
Million BDMT

COPYRIGHT©PÖYRY
TIGHTENING PLANTATION WOOD AND CHIP SUPPLY
COULD ADD TO THE CASH COST OF ASIAN PULP MILLS
SEPTEMBER 2016FIBRIA INVESTOR TOUR 2016
Source: PöyryNote: Cash delivered costs include: wood costs (stumpage, harvesting, transport), chemicals, energy, labour, other manufacturing costs, pulp logisitic costs (mill to port, sea freight, insurance), mill overheads.
Excludes other SG&A, corporate costs, depreciation and capital charges.
0
250
500
750
0 5 10 15 20 25 30 35
Selected Mills in South
America
Selected Mills in
South East Asia
USD/ADt
BHKP Market Pulp Cash Costs to Shanghai – 2Q 2016

COPYRIGHT©PÖYRYSEPTEMBER 2016
FIBRIA INVESTOR TOUR 2016
“What is happening in
the next five years ?”4

COPYRIGHT©PÖYRY
0
5
10
15
20
25
1970 1975 1980 1985 1990 1995 2000 2005 2010 2015 2020
Capacity year end
Decided expansion
FOUR INVESTMENT WAVES: TRIGGERED BY ACCESS TO
LOW COST CAPITAL AND AVAILABLE FOREST LAND
SEPTEMBER 2016FIBRIA INVESTOR TOUR 2016
1977-1979
• Cenibra
• Aracruz A
• Jari
Earlier
• Suzano
• Ripasa 1972
1991-1998
• Aracruz B
• Suzano Mucuri
• Cenibra
• Simao Jacareí
• Arauco
• CMPC
2002-2009
• Aracruz C
• Jacareí expansion
• Ripasa expansion
• Lwarcel expansion
• Veracel
• Mucuri B
• Fibria Três Lagoas I
• UPM Fray Bentos
1st wave 2nd wave 3rd wave
2012-2018
• Eldorado I
• Suzano Imperatriz
• CMPC Guaíba II
• Klabin Puma
• MdP
• Fibria Tres Lagoas II
Million tonnes of BHKP capacity
8% 18% 47% 57%
4th wave
Share of South America in global BHKP supply

COPYRIGHT©PÖYRY
1 MILLION TONNES OF MARKET CAPACITY
ARE REMOVED ANNUALLY
SEPTEMBER 2016FIBRIA INVESTOR TOUR 2016
-2
-1
0
1
2
3
4
5
2005 2006 2007 2008 2009 2010 2011 2012 2013 2014 2015
Expansion New line
New mill Shut down
Decrease Net cap change
Capacity Exits 2005-15:
Total 1.0 M t/a
• Shut-downs 0.45 M t/a
• Other exits: 0.55 M t/a
New capacity exits will come from:
• Conversions to other grades
• Decreases in production
• Integration into papermaking
• Further shut-downs
Historical Market BHKP Capacity Changes
million tonnes
COPYRIGHT©PÖYRY
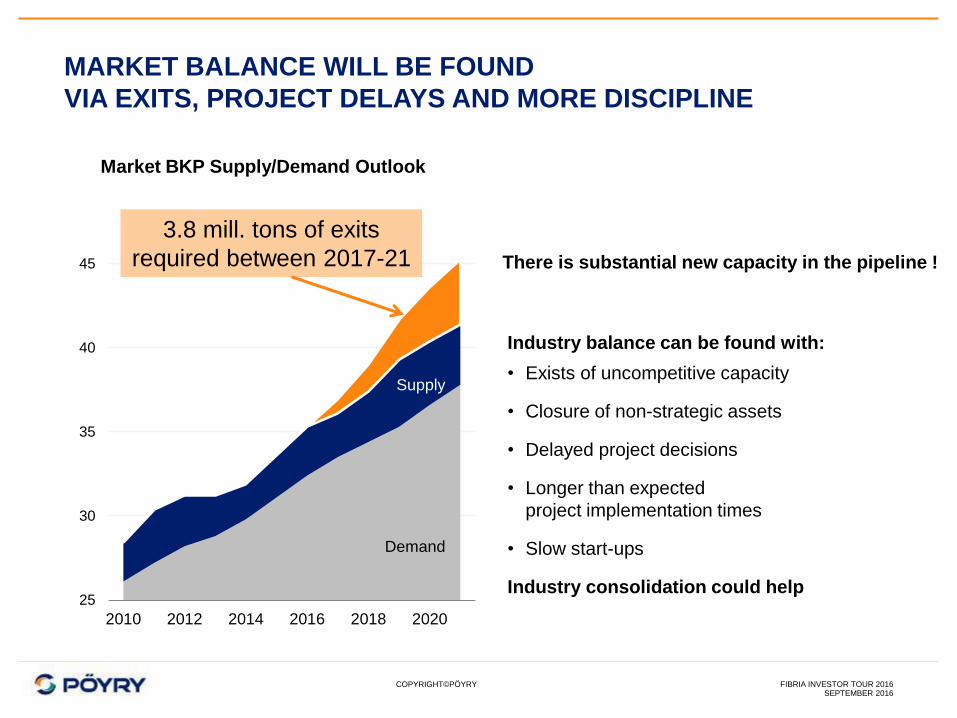
MARKET BALANCE WILL BE FOUND
VIA EXITS, PROJECT DELAYS AND MORE DISCIPLINE
SEPTEMBER 2016FIBRIA INVESTOR TOUR 2016
Market BKP Supply/Demand Outlook
Industry balance can be found with:
• Exists of uncompetitive capacity
• Closure of non-strategic assets
• Delayed project decisions
• Longer than expected
project implementation times
• Slow start-ups
Industry consolidation could help25
30
35
40
45
2010 2012 2014 2016 2018 2020
3.8 mill. tons of exits
required between 2017-21 There is substantial new capacity in the pipeline !
Demand
Supply

COPYRIGHT©PÖYRYSEPTEMBER 2016
FIBRIA INVESTOR TOUR 2016
“How to create long-lasting
shareholder value?”5

COPYRIGHT©PÖYRY
0 5.000 10.000 0 5.000 10.000 15.000
THE BEST PROTECTION TO PRICE EROSION
IS COMPETITIVENESS AND INVESTMENT DISCIPLINE
SEPTEMBER 2016FIBRIA INVESTOR TOUR 2016
Financial health, competitiveness and the pacing of investments determine the
ability of the industry to create shareholder value
Illustrative only
Cumulative capacity, 1000 t/a
USD / t
Cash Costs
Capital Costs
Value Creation
Value destruction !Price Level
475

COPYRIGHT©PÖYRYSEPTEMBER 2016
FIBRIA INVESTOR TOUR 2016
Pulp
Seller
Pulp
Buyer
Is it only about price ?
COPYRIGHT©PÖYRY
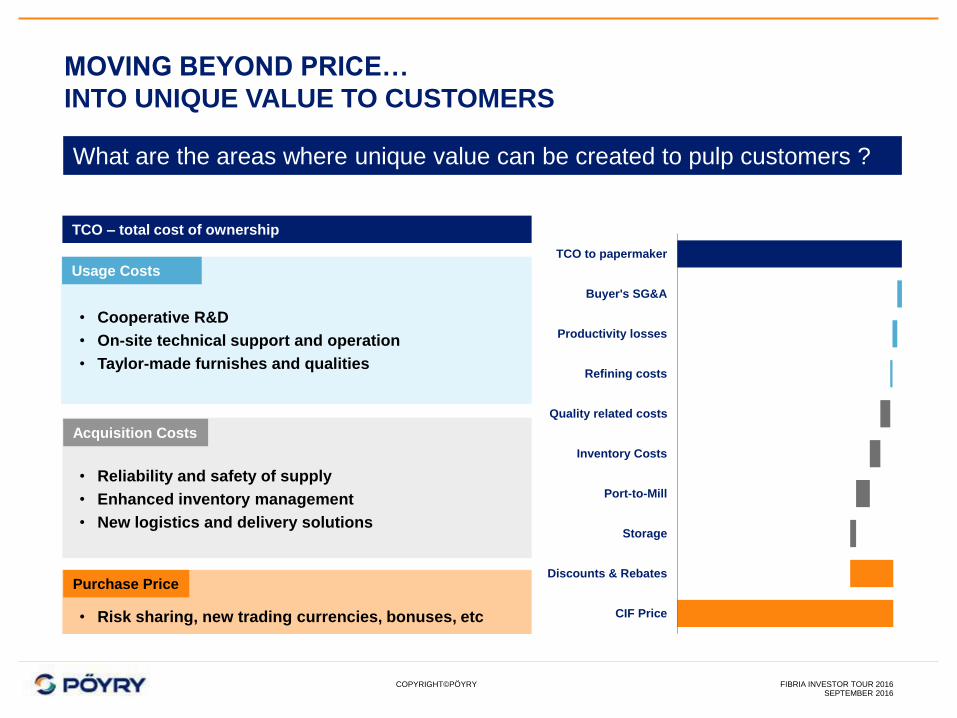
MOVING BEYOND PRICE…
INTO UNIQUE VALUE TO CUSTOMERS
SEPTEMBER 2016FIBRIA INVESTOR TOUR 2016
0 200 400 600
CIF Price
Discounts & Rebates
Storage
Port-to-Mill
Inventory Costs
Quality related costs
Refining costs
Productivity losses
Buyer's SG&A
TCO to papermaker
Purchase Price
• Cooperative R&D
• On-site technical support and operation
• Taylor-made furnishes and qualities
What are the areas where unique value can be created to pulp customers ?
• Reliability and safety of supply
• Enhanced inventory management
• New logistics and delivery solutions
Usage Costs
Acquisition Costs
TCO – total cost of ownership
• Risk sharing, new trading currencies, bonuses, etc

COPYRIGHT©PÖYRYSEPTEMBER 2016
FIBRIA INVESTOR TOUR 2016
TO BEAT THE MARKETS
Differentiate1
2 Consolidate
Innovate3


COPYRIGHT©PÖYRY
DISCLAIMER AND RIGHTS
This presentation material has been prepared by Pöyry Management Consulting Oy (“Pöyry”) for Fibria S.A. All other use is strictly prohibited and
no other person or entity is permitted to use this presentation, unless otherwise agreed in writing by Pöyry. By accepting delivery of this
presentation material, the Recipient acknowledges and agrees to the terms of this disclaimer.
NOTHING IN THIS REPORT IS OR SHALL BE RELIED UPON AS A PROMISE OR REPRESENTATION OF FUTURE EVENTS OR RESULTS.
PÖYRY HAS PREPARED THIS REPORT BASED ON INFORMATION AVAILABLE TO IT AT THE TIME OF ITS PREPARATION AND HAS NO
DUTY TO UPDATE THIS REPORT.
Pöyry makes no representation or warranty, expressed or implied, as to the accuracy or completeness of the information provided in this report or
any other representation or warranty whatsoever concerning this report. This report is partly based on information that is not within Pöyry’s
control. Statements in this report involving estimates are subject to change and actual amounts may differ materially from those described in this
report depending on a variety of factors. Pöyry hereby expressly disclaims any and all liability based, in whole or in part, on any inaccurate or
incomplete information given to Pöyry or arising out of the negligence, errors or omissions of Pöyry or any of its officers, directors, employees or
agents. Recipients' use of this report and any of the estimates contained herein shall be at Recipients' sole risk.
Pöyry expressly disclaims any and all liability arising out of or relating to the use of this report except to the extent that a court of competent
jurisdiction shall have determined by final judgment (not subject to further appeal) that any such liability is the result of the willful misconduct or
gross negligence of Pöyry. Pöyry also hereby disclaims any and all liability for special, economic, incidental, punitive, indirect, or consequential
damages. Under no circumstances shall Pöyry have any liability relating to the use of this report in excess of the fees actually received
by Pöyry for the preparation of this report.
All information contained in this report is confidential and intended for the exclusive use of the Recipient. The Recipient may transmit the
information contained in this report to its directors, officers, employees or professional advisors provided that such individuals are informed by the
Recipient of the confidential nature of this report. All other use is strictly prohibited.
All rights (including copyrights) are reserved to Pöyry. No part of this report may be reproduced in any form or by any means without prior
permission in writing from Pöyry. Any such permitted use or reproduction is expressly conditioned on the continued applicability of each of the
terms and limitations contained in this disclaimer.
SEPTEMBER 2016FIBRIA INVESTOR TOUR 2016


Sustainability – Risks and Opportunities for the Pulp and Paper Sector
Rod Taylor
WWF International
Fibria Investors Forum
September, 2016
© A
dri
ana
Gam
bar
ini/
WW
F-B
razi
l

Forests for Life
Overview
1. A global perspective
2. Deep dive on Asia
3. Market signals and opportunities for leadership
Sustainability – Risks and Opportunities for the Pulp and Paper Sector

Forests for Life
Overview
1. A global perspective
2. Deep dive on Asia Market signals
3. Market signals and opportunities for leadership

Unsustainable
forestry
Market Transformation in the pulp and paper sector
Well-managed
forests or
plantations
Recycled Fibre
High GHG
emissions
High Water
Pollution
Waste to
landfill
Zero Water
Pollution
Zero
Waste
Low GHG
emissions
Powered by
renewables
Unsustainable Best Practice

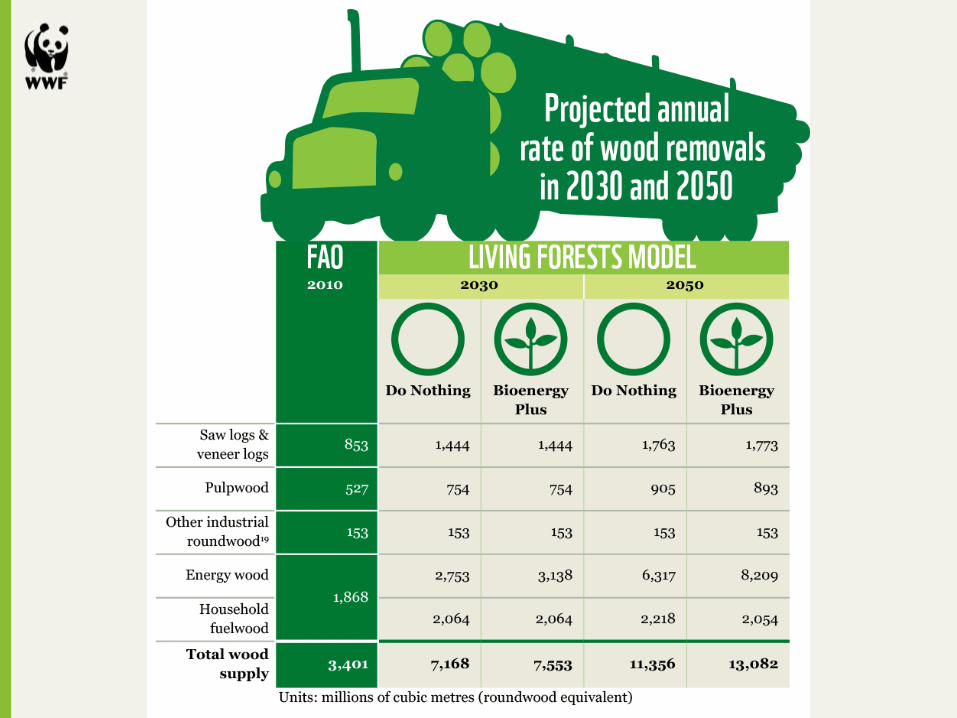
WWF Projections
www.panda.org/livingforests
Between 2010 and 2050 –
Increased population and wealth will
demand volume of annual wood removals to
increase 3x, while producing 70% more
food
240 to 300 million additional hectares of
natural forest managed for commercial
harvesting
Around 250 million hectares of new
plantations
Produce more with LESS land, LESS water,
and LESS pollution, while maximizing
efficiency, and minimizing raw-material
inputs

Projected expansion in forestry plantations 2010 to 2050
Living Forests Report
Projected expansion
in forestry plantations
between 2010 and 2050
(millions of hectares)

The big squeeze
Farmland
Plantation Other ecosystems
Unlogged forest
Logged forest
Land use between now and
2050.
Each segment
represents a current
land use or a
natural state
(not to scale)

The big squeeze
Land use between now and
2050. High greenhouse
gas emissions
Huge decline
in biodiversity


Commodities impacting WWF priority places

Risks related to sustainability span
the whole supply chain

Deforestation pressures

Using more wood could be good for the planet…
Using low footprint materials
Wood is renewable, biodegradable and nature
does the engineering and synthesis, often resulting
in a lower footprint than materials made through
heavy industrial processes.

Tennis Racket: made with carbon fibre
produced from wood-based precursor
Sponge: separates oil from water, made by
“silyated” nanocellulose
Furniture: built with MDF and MDP using
wood based resins.
Body armour: High-strength yet lightweight using nanocellulose
Textiles: wood pulp and recycled material
Medicine: prepared with nanocellulose for controlled release of drugs in the body drugs controlled released
New wood-based materials and the bio-economy

Efficiency in the forest
Improved management practices in natural forests and plantations enable more wood
extraction with less social and environmental impact.
© W
WF-C
ano
n / D
ado
Gald
ieri

Bio-technology (including GMOs)
For
Against

More efficient processing and recycling can help reduce
pressure to extract more wood from forests
Good for the planet:
seven possible lives
Wasted opportunity:
life and death
virgin
fibre

More equitable consumption patterns
© K
jell-Arn
e Larsson
/ WW
F
The affluent reduce wasteful paper use so the poor can consume more for education,
hygiene and food safety.

Forests for Life
Overview
1. A global perspective
2. Deep dive on Asia
3. Market signals and opportunities for leadership

Indonesia - Draining rainforests on deep peatlands

Southeast Asia - Fire and Haze
Fires in Sumatra

Source: WWF-Singapore
Fires in Indonesia & Haze Much Beyond
Haze across the Straits in Singapore

APP products being pulled off Singapore retailers’
shelves in protest over links to haze from Sumatra
NTUC FairPrice staff removing Asia Pulp & Paper Group-related products from shelves at a Nex shopping mall outlet on Oct 7, 2015.
Photo: Lim Yaohui For The Straits Times

Impacts: Burnt peat, natural forests and plantations; health
and livelihoods; reduced farm yields; GHG emissions.

Deforestation in Sumatra

1985
Forest Deforestation
1990 2000 2008/2009
Historical forest loss and location of
pulp mills in Sumatra
Source: WWF Indonesia
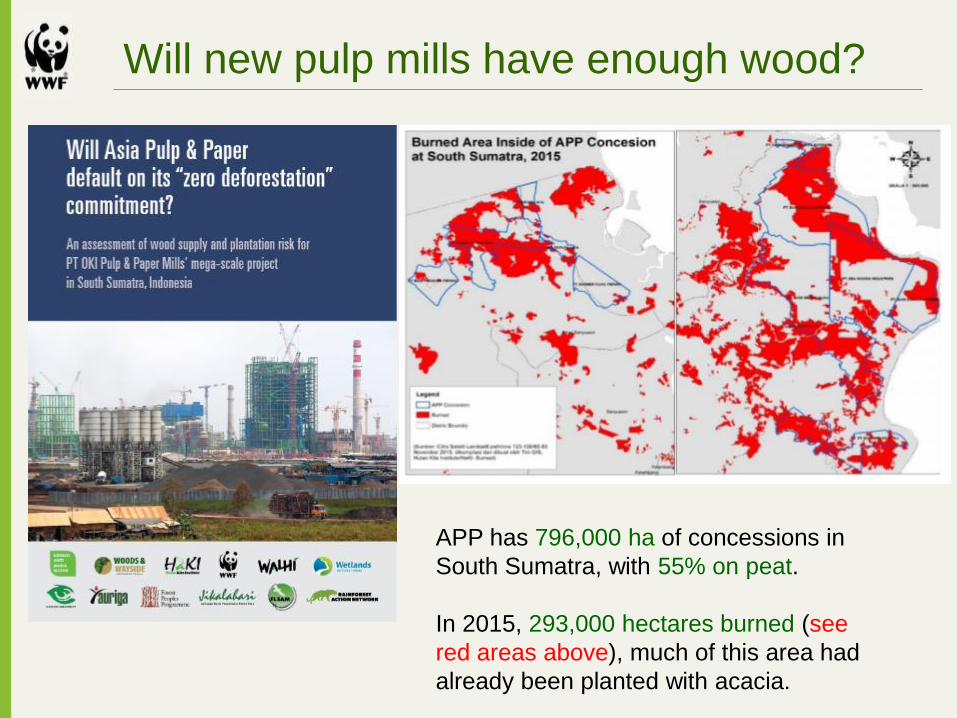
Will new pulp mills have enough wood?
APP has 796,000 ha of concessions in
South Sumatra, with 55% on peat.
In 2015, 293,000 hectares burned (see
red areas above), much of this area had
already been planted with acacia.

Sinar Mas/APP supplier concessions in South Sumatra
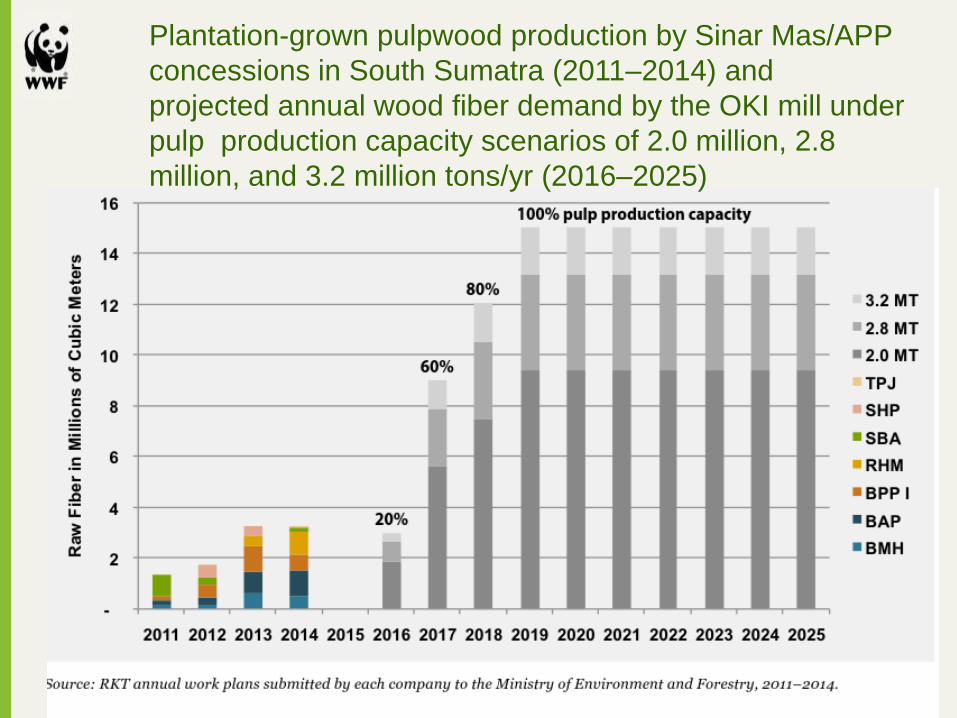
Plantation-grown pulpwood production by Sinar Mas/APP
concessions in South Sumatra (2011–2014) and
projected annual wood fiber demand by the OKI mill under
pulp production capacity scenarios of 2.0 million, 2.8
million, and 3.2 million tons/yr (2016–2025)

Sinar Mas/APP concessions overlaid onto fire risk map
of South Sumatra Forestry Department
Provincial Forestry DepartmentMas/APP supplier
concessions in South Sumatra

Forests for Life
Overview
1. A global perspective
2. Deep dive on Asia
3. Market signals and opportunities for leadership

The Sustainable Development Goals

Issue
LEGAL
PRODUCTION
OCC. HEALTH &
SAFETY
LABOUR RIGHTS
WATER
MANAGEMENT
Commercial implications
• Operating licenses revoked or concessions repossessed;
• Risk of customer and consumer boycotts
• Incidents can affect profitability in ways including stoppages;
• A poor reputation makes it harder to attract workers
• A poor reputation makes it harder to attract workers;
• Unrest can lead to production stoppages;
• Well treated workforce is more productive and turnover is lower
• Bad water management can affect ability to transport products;
• It also can reduce water availability on long-term
• Mills: Bad water management can reduce water availability;
Pollution can cause communities’ protests: reputational risk,
risk of operational stoppage and license being revoked
Organizations sourcing forestry products: Lack of sustainability
can mean higher costs, and higher price volatility on the long-term
Impact on
cashflow/Bal S
Commercial case for action on sustainability issues in forestry
Revenue Yield Value of collateralOperating costs Closure of
business

More and more brands and retailers are
committing to deforestation-free sourcing


Commitment by 11 companies to
increase demand and supply of certified
and recycled paper products, particularly
FSC certified products
Objectives are to:
• Increase demand and supply of certified
and recycled paper products,
particularly FSC certified products
• Eliminate illegal and controversial
sources in the supply chain
• Increase supply chain transparency

Pre-competitive platform for paper buyers:
• Established in 2013• 5 companies and WWF-Japan
Objectives:
• Eliminating illegal and controversial sources in the supply chain• Increase demand and supply of certified and recycled paper products,
particularly FSC certified products• Encourage suppliers to understand and support responsible procurement
Consortium for Sustainable Paper Use - Japan

• Impacts on forest ecosystems from fibre sourcing
• Emissions from manufacturing processes such as water pollution and
greenhouse gas emissions
• Reporting and Environmental Management System
See results of EPCI 2015 at http://epci.panda.org/
WWF Environmental Paper Company Index
For more information,
please visit:
panda.org/livingforests
Obrigado

Estratégia e Novos Negócios

MANUTENÇÃO DA
RENTABILIDADECRESCIMENTO
COM DISCIPLINADIVERSIFICAÇÃO
COM FOCO
Principais tendências no Setor de Papel e Celulose
Demanda não é uma preocupação. Papéis sanitários, embalagens e a China lideram o crescimento sólido que vislumbramos para o futuro.
A fragmentação do setor leva à indisciplina nos investimentos.
O acesso a recursos de madeira é fundamental para a competitividade. A América do Sul continuará sendo o principal provedor de novos volumes de celulose no futuro próximo.
O aumento nos custos e a valorização monetária oferecem riscos à rentabilidade.
Impacto crescente da sustentabilidade. Oportunidades e ameaças devido à crescente pressão por soluções.

RENTABILIDADE
CRESCIMENTO
DIVERSIFICAÇÃO
Excelência Operacional
Disciplina Financeira
Governança Sólida
Sustentabilidade
Transparência
Cultura de Alto Desempenho
Ambiente Organizacional
Opções
IMEDIATO CURTO PRAZO MÉDIO PRAZO LONGO PRAZO
A estratégia da Fibria
Excelência Operacional
Modernização
Biotecnologia
Formação da Base Florestal
Crescimento Orgânico
Consolidação
Bio Estratégia
Logística
Imobiliário

Ativamente e preferencialmente buscar a consolidação com o objetivo de criar um setor mais saudável.
Continuar com a promoção de crescimento por meio de expansões e parcerias de forma disciplinada.
Manter a formação ativade florestas para estarmos prontos para oportunidades de crescimento.
Consolidar nossa posição entre os 10% dos participantes do mercado com menor custo
caixa no setor ao:
• Alcançar IMACEL de15.0 toneladas/ha/ano de celulose até 2025 para novas florestas plantadas.
• Tentar obter um mínimo de 10% de volume de
celulose diferenciadaprecificado com prêmio.
Diversificar seu fluxo de caixa por meio de investimentos focados em outros negócios que não a celulose, alavancando os ativos chave e as competências da Fibria.
Alcançar um fluxo de caixa livre mensurável de novos negócios em comparação ao negócio de celulose.
Principais Aspirações
RENTABILIDADE CRESCIMENTO DIVERSIFICAÇÃO
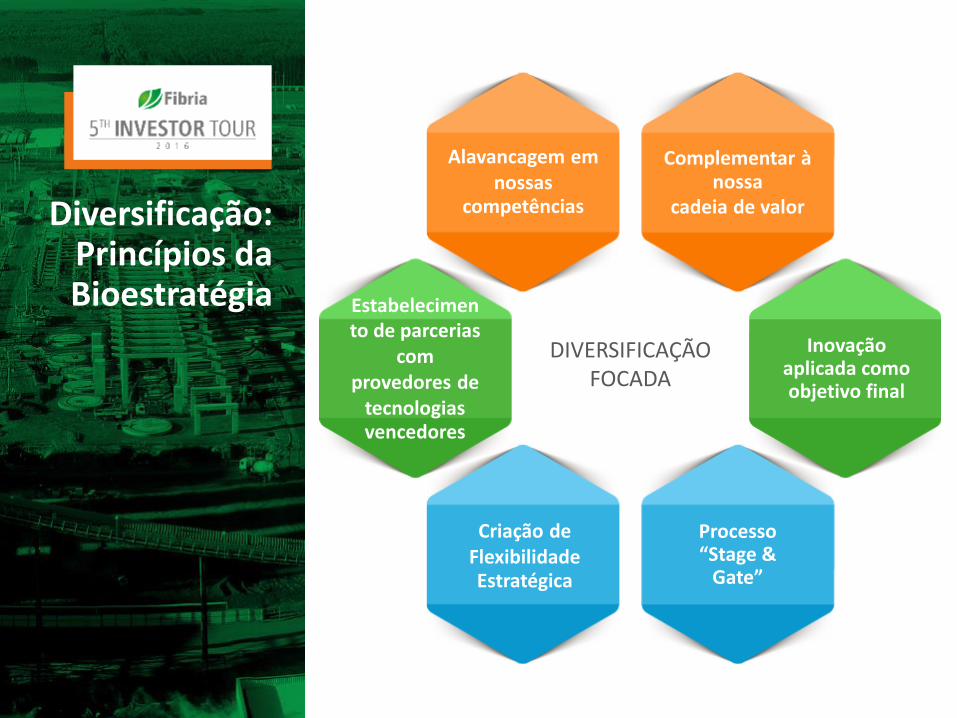
Complementar ànossa
cadeia de valor
Alavancagem emnossas
competências
Estabelecimento de parcerias
comprovedores de
tecnologiasvencedores
Inovação aplicada como objetivo final
Processo “Stage &
Gate”
Criação deFlexibilidadeEstratégica
DIVERSIFICAÇÃO FOCADA
Diversificação: Princípios da Bioestratégia

Rentabilidade: Desenvolvimento de Produto
Parte da Estratégia Comercial da Fibria
Para oferecer serviços e produtos (celulose) diferenciados e/ou customizados em engenharia de aplicação que gerem valor na cadeia “global”
Idade
Densidade
Material Genético
FLORESTAFÁBRICA
CLIENTE Cozimento
Branqueamento
Aditivos Refinamento
Co-refinamento
Mistura personalizada de insumos (furnish)
ALAVANCAS DE GERAÇÃO DE VALOR:
Custo Reduzido
Desempenho de Produto
Sustentabilidade Geral do Produto
CONSUMIDOR FINAL

Celulose totalmente livre de cloro desenvolvida para atender à
necessidade do mercado
Exemplo de Produtos Desenvolvidos - TCF
Idealização com o uso de várias tecnologias em uso na Fibria:
‣ 3 diferentes regiões no Brasil
‣ 6 tecnologias de cozimento
‣ 8 linhas de branqueamento combinando diferentes estágios.
Tempo entre a introdução do desafio e a entrega do produto: <1 ano
TRÊS LAGOAS - Mato Grosso do Sul 1,3 milhões t/ano
ARACRUZ - Espírito Santo2,3 milhões t/ano
JACAREÍ - São Paulo 1,1 milhões t/ano
VERACEL - Bahia
1,1 milhões t/ano (50% da produção)
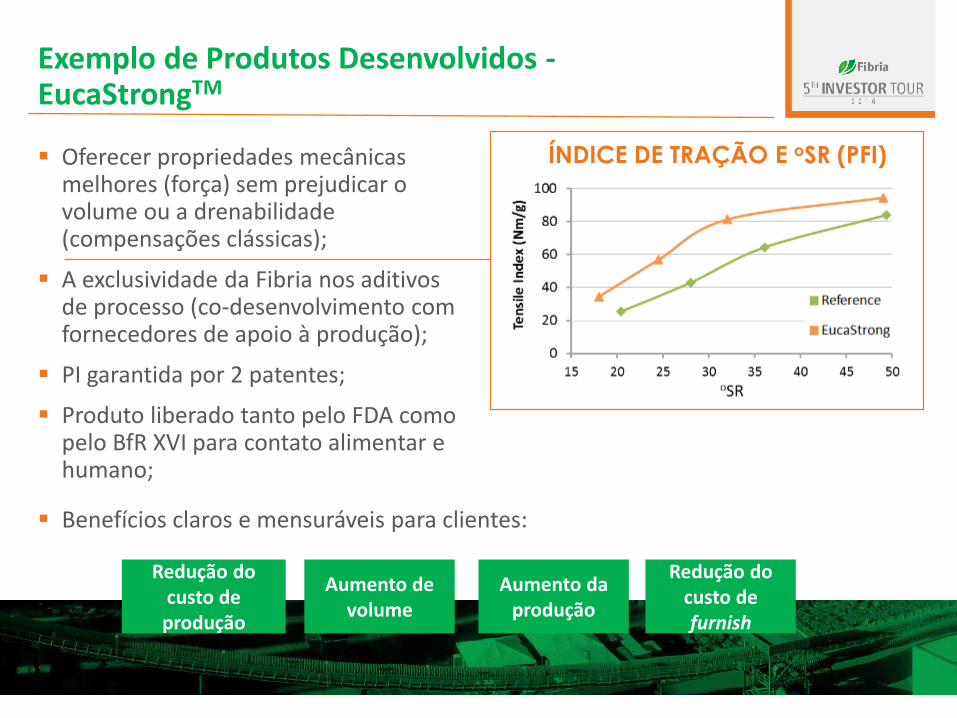
Exemplo de Produtos Desenvolvidos -EucaStrongTM
Oferecer propriedades mecânicas melhores (força) sem prejudicar o volume ou a drenabilidade (compensações clássicas);
A exclusividade da Fibria nos aditivos de processo (co-desenvolvimento com fornecedores de apoio à produção);
PI garantida por 2 patentes;
Produto liberado tanto pelo FDA como pelo BfR XVI para contato alimentar e humano;
Aumento da produção
Redução do custo de furnish
Aumento de volume
Redução do custo de produção
ÍNDICE DE TRAÇÃO E oSR (PFI)
Benefícios claros e mensuráveis para clientes:

Caminhos da tecnologia priorizados por maturidade e atratividade econômica
PIRÓLISE
LIGNINA
NANO-CELULOSE
BIOCOMPÓSITOS
Caminhos Priorizados
Fonte: Projeto de Bio-Estratégia da Fibria
Mat
uri
dad
e Te
cno
lógi
ca
Atratividade Econômica
Prioridade 1
Prioridade 2
TamanhoRelativo do Mercado
Tecnologia A
Tecnologia B
Tecnologia E
Tecnologia F
Tecnologia C
Tecnologia D
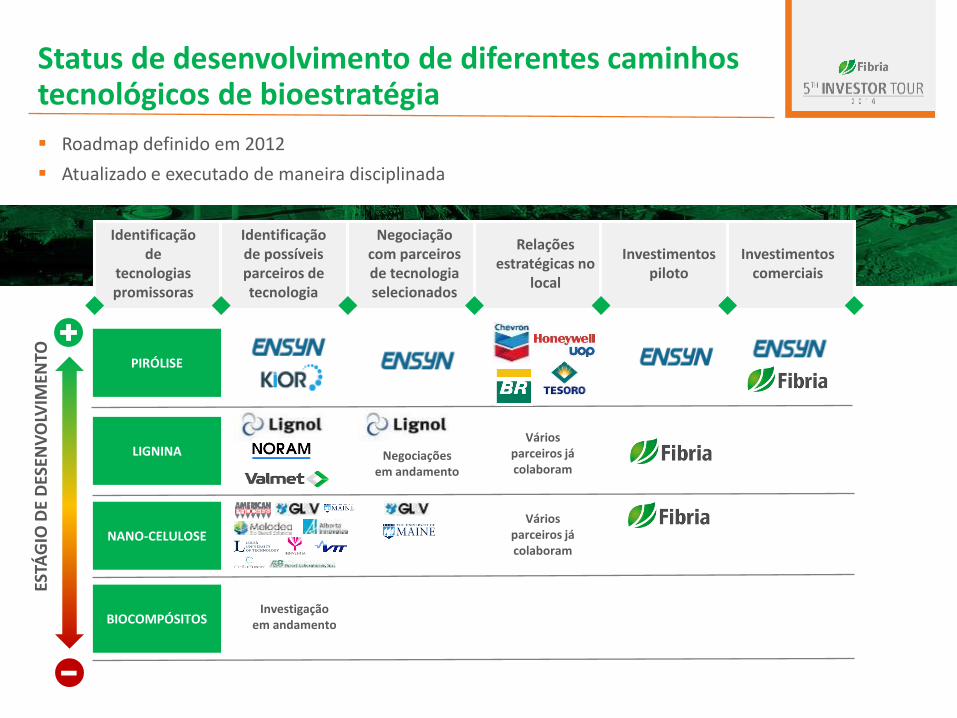
Status de desenvolvimento de diferentes caminhos tecnológicos de bioestratégia
Roadmap definido em 2012
Atualizado e executado de maneira disciplinada
Identificação de possíveis parceiros de tecnologia
Relações estratégicas no
local
Investimentos piloto
Identificação de
tecnologias promissoras
Negociação com parceiros de tecnologia selecionados
Investimentos comerciais
PIRÓLISE
LIGNINA
NANO-CELULOSE
BIOCOMPÓSITOS
ESTÁ
GIO
DE
DES
ENV
OLV
IMEN
TO
Vários parceiros já colaboram
Váriosparceiros já colaboram
Investigação em andamento
Negociaçõesem andamento

Flexibilidade no usode matérias primas
Tecnologia comercialmente
comprovadaProduto
Renovável
Negócio de Pirólise com base na plataforma de tecnologia RTP da Ensyn
Biomassa entregue
na planta
Biomassa convertida em bio-
óleo na planta de RTP
Bio-óleo entregue
aos clientes
MATÉRIA PRIMA PROCESSO DE RTP ÓLEO COMBUSTÍVEL
SUBSTITUTO
Flexibilidade do mercado consumidor
MERCADOS CONSUMIDORES
Aquecimento e
Resfriamento
Co-processamento na
Refinaria
Ingredientes Alimentares e
Produtos Químicos Renováveis
Já
comercial

O co-processamento é uma das poucas opções de compliance para que refinadores atendam a requisitos regulatórios
O co-processamento é a solução de compliance com o menor custo para refinadores, permitindo que economizem milhões de dólares em compliance por ano
• Venda de bio-óleo para refinarias - com base em seu desempenho em comparação ao petróleo
• Monetização de créditos no âmbito do Programa RFS2
• O preço dos créditos varia de maneira inversa em relação ao preço do petróleo
• Monetização de créditos gerada por refinarias californianas no âmbito do Programa LCFS
• Monetização de créditos gerada por refinarias californianas no âmbito do Programa de Comércio de Emissões de Carbono
RECEITA DE BIO-ÓLEO RECEITA DE RIN RECEITA DE LCFS RECEITA DE COMÉRCIO
DE EMISSÕES
ProduçãoUnidade de
petróleo
CraqueamentoCatalítico Fluido
(FCC)DistribuiçãoDistribuição Vendas no varejo
Diesel / Gasoline
Diesel / Gasoline
Biocombustível misturadoBio-Óleo
Bio-Óleo
Petróleo

97% 3%
VGO Biocrude
O mercado de Refinarias de Craqueamento Catalítico Fluido (FCC) dos EUA é de 5,6 milhões bpd e pouco explorado
O mercado de refinarias dos EUA oferece uma significativa oportunidade de demanda de mercado
A atual capacidade diária de FCC do mercado dos EUA é de 5,6 milhões de barris
Uma taxa de mistura conservadora de 3% exigiria 170.000 bpd ou 2,6 bilhões gpy de bio-óleo
Não existem concorrentes comercialmente fornecendo bio-óleo para o mercado de FCC em refinarias
Capacidade de Óleo Combustível Renovável (RFO) para Fornecimento de 3%
do Mercado de FCC dos EUA
Refinaria dos EUA Capacidade de FCC
5,6M bpd
85,8B gpy
170.000 bpd
2,6B gpyFontes: Oil and Gas Journal, RFA
130 unidades de RTP da
Aracruz

A Fibria e a Ensyn criaram uma JV no Brasil com a tecnologia RTP
Fonte: Análise da Equipe Estratégica da Fibria
VANTAGEM DO CUSTO DA CARGA
Potencial para utilizar a área de um milhão de ha da Fibria para o fornecimento de resíduos florestais
Possíveis parceiros nos setores de florestas, agricultura e serraria
Alavancagem do conhecimento da Fibria em operações de logística florestal
Acesso à tecnologia de pirólise da Ensyn, protegida por uma robusta PI
Acesso atual a mercados consumidores na América do Norte e no Brasil
Conhecimento sobre o ambiente regulatório nos EUA
EXCELÊNCIA EM LOGÍSTICA DE BIOMASSA
ACESSO À TECNOLOGIA
ACESSO AO MERCADO

Destaques do Projeto de RTP
FLEXIBILIDADE COMERCIAL
Cenário Base: exportação para os EUA para co-processamento
Cenário Alternativo: exportação para os EUA para aquecimento
Cenário Desfavorável: uso interno – substituto do GN
POTENCIAL LOCALIZAÇÃO
FAVORÁVEL
Sinergias com a localização da Fibria‣ Integração operacional‣ Utilização dos resíduos florestais
disponíveis‣ Alternativas logísticas identificadas
SITUAÇÃO FINANCEIRA
SÓLIDA
TEMPO DE COLOCAÇÃO
NO MERCADO
Implementação em 24 meses a partir da data de aprovação
Sólida situação financeira mesmo em cenários de variação cambial desfavoráveis
Baixa volatilidade com correlação negativa: preços do petróleo e benefícios regulatórios
Disponibilidade de financiamento de baixo custo
STATUS
Engenharia básica terminada
Contratos de compra e venda em negociação
com as refinarias americanas
Necessidade de aprovação pelos conselhos da
Fibria e da Ensyn

Vídeo - RTPRecebimento e fragmentação
da madeira
Silo de biomassa
E-houseSala de
Controle -Armazém
Filtragem
Moagem e Triagem
SecadoraMáquinas de
Gás
Silo de Biomassa Seca
RTP Torre de Resfriame
nto
Armazenamento de
RFO

Atualmente a lignina é queimada como combustível
Potencial para a aplicação da lignina a outros usos de
valor agregado
25%-30% DA
COMPOSIÇÃO TÍPICA EM ÁRVORES DE EUCALIPTO
QUEIMADA PARA PRODUZIR ENERGIA
PRODUTOS DE VALOR AGREGADO
Agregando valor com o desenvolvimento do negócio de lignina
LIGNINA

Laboratórios totalmente equipados
Planta piloto no processo Organosolv
20 famílias de patentes existentes
85 patentes
Mais de 10 anos de dados de pesquisa
10 funcionários em tempo integral
Integração total com o Centro de Tecnologia no Brasil(kraft + Organosolv)
Recursos Humanos Portfólio de Pesquisa e Patente Equipamento
Fibria InnovationsBritish Columbia, Canadá
A aquisição da Lignol em 2014acelera o tempo de colocação no mercado

CommodityPetroquímica
Fricção
Reforçando oPreenchimento para Borracha
Isolamento
FundiçãoMoldagem deCompostos
Produtos deMadeira
Adesivos
MateriaisCompostos
Filmes
RevestimentosFibra de Carbono
O portfólio de lignina da Fibria permite o desenvolvimento de diferentes aplicações
Desenvolvimento de Possíveis AplicaçõesFibria Innovations + Parceiros
Lignina Kraft Lignina Organosolv

Mercado de Nicho
Valor da Lignina
Fibra de Carbono
Vanilina
Resina FF
Carbono Negro
Epóxi
Aditivos de Cimento
Biocombustível
Resina de PU
FenolLigno-sulfonatos
Lignina de Baixa Pureza
BTX
Polímeros
Os processos Kraft e Organosolv possuem características diferentes que os tornam mais adequados a diferentes aplicações
Mercado de Commodities
Energia
Volume
Esta diversidade permite que a Fibria atue em diferentes mercados
Organosolv
Kraft

VISÃO GERAL
Fonte: RISI Relatório “NANOCELLULOSE: Technology, Applications and Markets” 2014; Poyry
Desenvolvimento de Negócio de Nano-celulose
NANO FILAMENTOSFIBRILASFIBRA
PROPRIEDADES
RESISTENTE
LEVE
ALTAMENTE ABSORVENTE
MUDANÇAS REOLÓGICAS
BIODEGRADÁVEL
RENOVÁVEL

Possível criação de valor com clientes em setores novos e já existentes
Licenciamento de Tecnologia
Produtores Externos
FIBRIA Jacarei Aracruz 3L
Cadeias de valor atuais ou
contíguas
Novas cadeias de valor
Petróleo e Gás
Tintas
Papel Especial
Embalagem
Higiene
Compósitos
Cimento
SETOR
As características da Fibria permitem que a companhia
tenha um papel de ligação na cadeia de valor

Em definiçãoLicenciamento
Aquisição e construção de uma planta piloto de 2 t/dia
Início das operações no 1T17
Desenvolvimento em curso das aplicações R$ em papéis sanitários, papel de escrever e para impressão (P&W) e outros
CNCCNF
PARCEIROS
STATUS
RELACIONAMENTO
O posicionamento da Fibria em nano-celulose
Negociações em Andamento

VISÃO DE LONGO PRAZOAMBICIOSA
PLANO DE AÇÃO PRUDENTE, FOCADO E DISCIPLINADO EM
EXECUÇÃO
Principais conclusões sobre a bio-estratégia da Fibria
Complementar ànossa
cadeia de valor
Alavancagem em
nossascompetências
Estabelecimento
de parcerias
com provedores
de tecnologiasvencedores
Inovação aplicada como objetivo final
Processo “Stage &
Gate”
Criação de
FlexibilidadeEstratégica
DIVERSIFICAÇÃO FOCADA

Projeto Horizonte 2
Visão Geral do Local
R$ 2,5 bilhõesde execução financeira
(32%)
53,7%do total terminado
140trabalhadores diretos contratados para as
operações (800 esperados
até Dez/16)
6.000trabalhadores no local
(pico de 8.000 a 10.000 em Dez/16)
7.000.000 de horas
trabalhadas

Atualização de Capex do Horizonte 2
1,80 1,71
0,650,48
0,05
0,11
2,52,3
Original Revisado
R$ EUR US$ e outros
72%
26%
2%
77%
19%
4%
CAPEX (US$ bilhões)(1)
3%
55%
39%
4%
2015 2016 2017 2018
Capex Total em reais: R$ 7,7 bilhões
Cronograma atual

DESAFIOSBENEFÍCIOS
A consolidação traz desafios, mas os benefícios são indiscutíveis
Motivação estratégica
Momento da outra parte
Avaliação relativa
Governança Corporativa
Possibilidade de grande sinergia
Consolidação de mercado e do portfólio de clientes
Racionalização do pipeline de novos projetos
O CRESCIMENTO A PARTIR DA CONSOLIDAÇÃO É UM FATOR CHAVE DE INCENTIVO À CRIAÇÃO DE VALOR

868
535
236301
542
853711
556
61
291
633
32
Liquidez 2016 2017 2018 2019 2020 2021 2022 2023 2024 2025
PPE BNDES
NCE ACC/ACE
Voto IV Bonds
Finnvera CRA and Outros
Caixa(1)
Revolver
1,403
Outras atualizações importantes– Liquidez
0,4
2,3
0,2
0,7
0,3
0,2
0,2
0,2
Pré-Pgto Exportação CRA BNDES FDCO ECA Working capitalrelease (2)
Total
0,2 - 2S16
3T153T15
.
0,1 - 2S160,2 - 20170,2 - 2S16
0,5 - 2017
0,2 - 2017
0,1
Capex H2 (2):
(2) Liberação decorrente do contrato de Klabin e fornecedores
Financiamento do Projeto Horizonte 2 (US$ bilhões)
(1) Não inclui US$30 milhões relativos ao MtM de operações de hedge. | (2) Execução financeira do Capex de US$747 milhões até 31 de agosto de 2016 | (3) Considerando R$/US$ em 15/set/16 = 3.3326.
Recursos sacados até 15/set/2016. Recursos contratados a sacar
82901
Liquidez(1) e Cronograma de Amortização da Dívida(3) em 15 de setembro de 2016 (US$ milhões)
524

CHALLENGESBENEFITS
Outras atualizações importantes – Suprimento de Madeira(1)
788
Mad
eira
de
Terc
eiro
s(%
)
0
50
100
150
200
250
300
350
400
0%
5%
10%
15%
20%
25%
30%
35%
40%
45%
50%
2009 2010 2011 2012 2013 2014 2015 2016 2017 2018 2019 2020 2021 2022 2023 2024 2025
Distância média da floresta para a fábrica Madeira de Terceiros
Aumento na previsão de madeira de terceiros devido ao baixo nível de chuvas na região da Unidade Aracruze otimização da base florestal de Três Lagoas
A distância média vai cair drasticamente gerando uma redução de Opex
(1) Não inclui Veracel, mas considera a base florestal de H2 | (2) Taxa de câmbio R$/USD: 3,33.
Distân
ciam
edia d
a floresta
para a Fáb
rica(km
)
68%34% 63% 73% 67% 75% 67%% Plantado
VPL de pico a nível normalizado(2):CAPEX: R$1,3 bilhões (US$ 0,4 milhão) | OPEX: R$0,9 bilhão (USD 0,3 milhão)
VPL Total : R$2,2 Bi ou US$ 0,7 Bi