atividade física e câncer: evidências epidemiológicas e ... · agradecimentos ao meu...
TRANSCRIPT

LEANDRO FÓRNIAS MACHADO DE REZENDE
Atividade física e câncer:
evidências epidemiológicas e perspectivas para prevenção do
câncer no Brasil
Tese apresentada à Faculdade de Medicina da Universidade
de São Paulo para obtenção do título de Doutor em Ciências
Programa de Saúde Coletiva
Orientador: Prof. Dr. José Eluf Neto
São Paulo
2018


DEDICATÓRIA
À minha família

AGRADECIMENTOS
Ao meu orientador, José Eluf Neto, pela confiança, dedicação e incentivo.
Aos meus queridos pais, pelo amor, pelos valores e ensinamentos preciosos e as
oportunidades proporcionadas.
Ao meu irmão, Guilherme, meu orgulho e admiração.
À Ju, pelo amor, parceria e por estar sempre ao meu lado, mesmo quando a distância se
fez presente.
Ao Ringo, pelo amor incondicional e os lambeijos, todos os dias.
Aos professores Alicia Matijasevich Manitto, Victor Wünsch Filho e Moyses Szklo,
pelas preciosas contribuições no exame de qualificação de doutorado.
Aos amigos/co-orientadores/conselheiros Renata Levy, Maria Fernanda, Marcia Couto,
Catarina Azeredo, Thiago de Sá, Leandro Garcia, Maria Carolina Borges, Fernando
Adami, Juan Pablo Rey-López, Rafael Claro, Alexandre Grangeiro, Olinda Luiz e
Euclides Castilho.
Aos colaboradores dos manuscritos que compuseram esta tese.
Ao CELAFISCS, especialmente ao Dr. Victor Matsudo, onde tudo começou.
Aos amigos e colegas Edward Giovannucci, Donghoon Lee, NaNa Keum, Kana Wu e
Mingyang Song, pela recepção, experiência e aprendizados em Boston.
A todos alunos, professores, pesquisadores e funcionários do Departamento de
Medicina Preventiva da Faculdade de Medicina da Universidade de São Paulo, pelos
valiosos aprendizados e oportunidades.
Às amigas Maria Laura, Giovanna, Camila, Priscila, Carla, Maria, e Larissa, pelos
aprendizados, ajudas e celebrações.
Aos membros do Núcleo de Pesquisas Epidemiológicas em Nutrição e Saúde, pelos
aprendizados acadêmicos
À Fundação de Amparo à Pesquisa do Estado de São Paulo (FAPESP), pela bolsa de
doutorado no país (processo no 2014/25614-4) e pela bolsa de estágio de pesquisa no
exterior (processo no 2016/21390-0).

Death in old age is inevitable, but before old age is not
Richard Doll, 1994

Esta tese está de acordo com as seguintes normas, em vigor no momento desta
publicação:
Referências: adaptado de International Committee of Medical Journals Editors
(Vancouver). Universidade de São Paulo. Faculdade de Medicina. Divisão de Biblioteca
e Documentação. Guia de apresentação de dissertações, teses e monografias. Elaborado
por Anneliese Carneiro da Cunha, Maria Julia de A. L. Freddi, Maria F. Crestana,
Marinalva de Souza Aragão, Suely Campos Cardoso, Valéria Vilhena. 3a ed. São Paulo:
Divisão de Biblioteca e Documentação; 2011.
Abreviaturas dos títulos dos periódicos de acordo com List of Journals Indexed in Index
Medicus.

SUMÁRIO
RESUMO
APRESENTAÇÃO
1. INTRODUÇÃO .................................................................................................................. 1
1.1. A CARGA DO CÂNCER NO BRASIL E NO MUNDO .......................................... 1
1.2. CAUSAS DO CÂNCER E INFERÊNCIA CAUSAL EM EPIDEMIOLOGIA........ 6
1.3. PREVENTABILIDADE DE CÂNCER ................................................................... 18
1.4. ATIVIDADE FÍSICA E CÂNCER: ANTECEDENTES E
JUSTIFICATIVAS .......................................................................................................... 22
1.5. REFERÊNCIAS ....................................................................................................... 39
2. OBJETIVO ....................................................................................................................... 47
3. AVALIAÇÃO DA EVIDÊNCIA E INDÍCIOS DE VIÉS NA LITERATURA
EPIDEMIOLÓGICA SOBRE ATIVIDADE FÍSICA E CÂNCER ................................ 48
ABSTRACT .................................................................................................................... 49
3.1. INTRODUCTION .................................................................................................... 50
3.2. METHODS ............................................................................................................... 51
3.3. RESULTS ................................................................................................................. 56
3.3. DISCUSSION........................................................................................................... 64
3.5. REFERENCES ......................................................................................................... 69
4. ATIVIDADE FÍSICA DURANTE A ADOLESCÊNCIA E RISCO DE
ADENOMA COLORRETAL NA FASE ADULTA .......................................................... 74
ABSTRACT .................................................................................................................... 76
4.1. INTRODUCTION .................................................................................................... 77
4.2. METHODS ............................................................................................................... 77
4.3. RESULTS ................................................................................................................. 81
4.4. DISCUSSION........................................................................................................... 88
5.5 REFERENCES .......................................................................................................... 90
5. ASSOCIAÇÃO ENTRE TIPO E INTENSIDADE DA ATIVIDADE FÍSICA E
BIOMARCADORES DE INFLAMAÇÃO E RESPOSTA À INSULINA
RELACIONADOS AO RISCO DE CÂNCER .................................................................. 97
ABSTRACT .................................................................................................................... 99
5.1. INTRODUCTION .................................................................................................. 100
5.2. METHODS ............................................................................................................. 101
5.3. RESULTS ............................................................................................................... 105
5.4. DISCUSSION......................................................................................................... 116
5.5. REFERENCES ....................................................................................................... 120
6. PREVENTABILIDADE DE CÂNCER MEDIANTE AUMENTO DA
ATIVIDADE FÍSICA NO BRASIL .................................................................................. 129
ABSTRACT .................................................................................................................. 131
6.1. INTRODUCTION .................................................................................................. 132
6.2. METHODS ............................................................................................................. 133
6.3. RESULTS ............................................................................................................... 137
6.4. DISCUSSION......................................................................................................... 145
6.5. REFERENCES ....................................................................................................... 148
7. PREVENTABILIDADE DE CÂNCER E ESTILO DE VIDA NO BRASIL .......... 154
ABSTRACT .................................................................................................................. 156
7.1. INTRODUCTION .................................................................................................. 157
7.2. METHODS ............................................................................................................. 158
7.3. RESULTS ............................................................................................................... 163
7.4. DISCUSSION......................................................................................................... 174
7.5. REFERENCES ....................................................................................................... 179
8. CONSIDERAÇÕES FINAIS ......................................................................................... 199
8.1. EVIDÊNCIAS EPIDEMIOLÓGICAS SOBRE ATIVIDADE FÍSICA E
CÂNCER ....................................................................................................................... 199
8.2. UMA VISÃO INTEGRATIVA SOBRE O ATIVIDADE FÍSICA,
ADIPOSIDADE E O RISCO DE CÂNCER ................................................................ 202
8.3. PERSPECTIVAS PARA PREVENÇÃO DO CÂNCER NO BRASIL ................. 205
8.4. UMA VISÃO OTIMISTA PARA O DESAFIO DO CONTROLE DO
CÂNCER ....................................................................................................................... 208
8.5. REFERÊNCIAS ..................................................................................................... 208
APÊNDICE A

RESUMO
Rezende LFM. Atividade física e câncer: evidências epidemiológicas e perspectivas
para prevenção do câncer no Brasil [tese]. São Paulo: Faculdade de Medicina,
Universidade de São Paulo; 2018.
Câncer é a segunda maior causa de morte no Brasil e no mundo. Esse cenário tende a se
agravar devido ao crescimento e envelhecimento populacional e ao aumento da
prevalência das causas de câncer na população. Compreender o papel da atividade física
na redução do risco de câncer é de grande interesse na literatura epidemiológica. Os
objetivos deste estudo foram (i) avaliar a associação entre atividade física e o risco de
câncer na população; (ii) estimar a potencial contribuição da atividade física na
prevenção e controle do câncer no Brasil. Cinco manuscritos compuseram essa tese. O
primeiro apresentou revisão de literatura sobre a consistência da evidência
epidemiológica sobre a associação entre atividade física e 22 tipos de câncer. Os
resultados indicaram que a atividade física em adultos está associada com menor risco
de sete tipos de câncer. No entanto, houve evidência consistente apenas para os cânceres
de cólon e mama pós-menopausa. Evidência para outros tipos de câncer apresentou
indícios de viés e heterogeneidade na literatura. O segundo manuscrito avaliou a
associação entre atividade física durante a adolescência e risco de adenoma colorretal,
um precursor de câncer colorretal. Os resultados indicaram que a atividade física
durante a adolescência também pode contribuir para menor risco de câncer colorretal,
independentemente da atividade física na fase adulta. Mulheres que praticaram mais
atividade física na adolescência apresentaram menor risco de adenoma colorretal do que
aquelas que praticaram menos atividade física. O terceiro manuscrito investigou a
influência do tipo e intensidade da atividade física para redução de biomarcadores
inflamatórios e de resposta à insulina relacionados ao risco de câncer. A atividade física
foi associada com menor concentração desses biomarcadores. As associações foram
mais fortes em participantes que praticaram atividade física aeróbica e de força
combinadas. Não houve benefício adicional de atividades físicas de intensidade
vigorosa, comparado com atividades moderadas. O quarto e o quinto avaliaram,
respectivamente, a preventabilidade de câncer mediante o aumento da atividade física
no Brasil; a magnitude dessa preventabilidade vis-à-vis a redução de fatores de risco

relacionados ao estilo de vida. Aproximadamente 10 mil casos de câncer (12% dos
casos de câncer de mama pós-menopausa e 19% dos casos de câncer de cólon)
poderiam ser prevenidos por ano mediante o aumento da atividade física. No entanto,
tabagismo ainda é a principal causal de câncer no Brasil, seguido de excesso de
peso/obesidade e consumo de álcool. A redução de todos fatores de risco relacionados
ao estilo de vida (tabagismo, excesso de peso, consumo de álcool, falta de atividade
física, e alimentação não saudável) poderia prevenir até 27% de todos os casos de
câncer e 34% de todas as mortes por câncer no Brasil. Em conclusão, atividade física,
desde a infância até a fase adulta, pode reduzir o risco de alguns tipos de câncer.
Mecanismos biológicos corroboram essas associações e indicam maior benefício para
atividades aeróbicas e de força combinadas. Resultados das estimativas de
preventabilidade de câncer mediante aumento da atividade física podem ser úteis para
estratégias de prevenção e controle do câncer no Brasil.
Descritores: atividade física; neoplasias; prevenção de doenças; epidemiologia; saúde
pública; causalidade

ABSTRACT
Rezende LFM. Physical Activity and cancer: epidemiological evidence and perspectives
for cancer prevention in Brazil. [thesis]. São Paulo: “Faculdade de Medicina,
Universidade de São Paulo”; 2018.
Cancer is the second leading cause of death in Brazil and worldwide. This scenario has
an aggravating effect due to expected population aging and growth and the increasing
prevalence of cancer causes. To understand the role of physical activity in reducing the
risk of cancer is of high interest in epidemiological literature. The objectives of this
study were: (i) to evaluate the association between physical activity and risk of cancer in
the population; (ii) to estimate the potential contribution of physical activity for cancer
prevention and control in Brazil. Five manuscripts composed this thesis. The first
presented a review of the literature on the consistency of epidemiological evidence
between physical activity and 22 types of cancer. The results showed that physical
activity in adults was associated with a lower risk of seven types of cancer. However,
only breast post-menopausal and colon cancers were supported by convincing evidence.
Evidence for the other types of cancer presented hints of bias and heterogeneity in the
literature. The second manuscript examined the association between physical activity
during the adolescence and risk of colorectal adenomas, a precursor of colorectal
cancer. Physical activity during the adolescence was associated with lower the risk of
colorectal cancer, independent of physical activity during adulthood. Women with high
physical activity during adolescence presented lower risk of adenomas later in life
compared to those with lower physical activity. The third manuscript investigated the
influence of type and intensity of physical activity with cancer biomarkers of
inflammatory and insulin response. High physical activity was associated with favorable
concentration of cancer biomarkers. Associations were stronger for combined aerobic
and resistance training. There were no additional benefits of engaging in vigorous
physical activity over moderate activities. The fourth and fifth manuscripts evaluated,
respectively, the preventability of cancer by increasing physical activity in Brazil; and
the magnitude of this preventability vis-à-vis the reduction of other lifestyle risk factors.
About 10 thousand cancer cases per year (12% of postmenopausal cancers and 19% of
colon cancers) could be avoided by increasing population-wide physical activity in

Brazil. However, smoking is still the major cause of cancer in Brazil, followed by
overweight/obesity and alcohol consumption. The reduction of all lifestyle risk factors
(smoking, overweight/obesity, alcohol consumption, lack of physical activity and
unhealthy diet) could potentially avoid up to 27% of all cancer cases and 34% of all
cancer deaths in Brazil. In conclusion, physical activity, from childhood to adulthood,
may reduce the risk of some types of cancer. Biological mechanisms corroborate these
associations and indicate more favorable outcomes for combined aerobic and resistance
training. Our findings on preventability of cancer by increasing population-wide
physical activity may be useful for cancer prevention strategies in Brazil.
Descriptors: physical activity; neoplasms; disease prevention; epidemiology; public
health; causality

APRESENTAÇÃO
Desde os idos de 1920, a epidemiologia, ciência responsável por identificar as
causas das doenças e condições de saúde em populações, avalia o efeito putativo da
atividade física na redução do risco do câncer. Naquele contexto, já se reconhecia que,
se os achados preliminares de fato refletissem uma relação de causa e efeito, a atividade
física poderia contribuir com a prevenção dessa doença: “If muscular activity has an
intimate relationship to carcinoma, the value of it will be most apparent in
prophylaxsis, the field which to date promises the most in the attack on this malady”
(Sivertsen; Dahlstrom, 1922, p. 365-6). Doravante, compreender essa relação é ainda
mais necessário. Atualmente, a carga do câncer é alta, e tende a se agravar nas próximas
décadas tendo vista o aumento e envelhecimento populacional projetados para as
próximas décadas, especialmente em países de baixa e média renda. Ademais,
populações modernas, altamente urbanizadas e industrializadas, têm apresentado modos
de vida com baixos níveis de atividade física no cotidiano. No Brasil, por exemplo,
aproximadamente metade da população pratica menos de 30 minutos de atividade física
por dia.
Posto isto, essa pesquisa, iniciada em 2014 com meu ingresso no doutorado
junto ao Departamento de Medicina Preventiva da Faculdade de Medicina da
Universidade de São Paulo, forjou-se na (i) investigação da evidência epidemiológica
sobre atividade física e câncer; (ii) quantificação de casos e mortes por câncer
potencialmente preveníveis mediante o aumento da atividade física no Brasil. Pretendo
com isso, contribuir com o conhecimento e o debate científicos acerca do efeito protetor
da atividade física no risco de câncer, e, consecutivamente, fornecer elementos que
embasem estratégias de prevenção e controle do câncer no Brasil.
No primeiro capítulo, exponho o contexto científico em que essa pesquisa está
inserida. Apresento, inicialmente, um panorama geral da magnitude do problema, isto é,
“a carga do câncer no Brasil e no mundo” em termos de incidência e mortalidade. O
cenário é alarmante. Em 28 países do mundo, o câncer já é a principal causa de morte.
Em outros, como países de baixa e média renda, ambas taxas de incidência e
mortalidade por câncer são altas - porém menores do que países de alta renda - e o

acesso ao tratamento adequado é escasso, de modo que a prevenção se configura como a
maneira mais realista e efetiva para o controle da doença. Nesse sentido, identificar e
intervir nas principais causas que aumentam o risco de câncer na população é
imperativo.
Nas seções de “causas do câncer e inferência causal em epidemiologia” e
“preventabilidade do câncer” apresento os principais fatores que atuariam no processo
complexo, não linear e de múltiplas etapas da carcinogênese. Seriam a má sorte e o
fatores hereditários os principais fatores envolvidos no risco de câncer? Fatores
ambientais e de estilo de vida também importam? Como e em que medida a
epidemiologia contribuiu para a identificação das causas do câncer na população? É
possível estimar a proporção e número de casos de câncer potencialmente preveníveis,
isto é, que não teriam acontecido ou aconteceriam tardiamente, mediante a redução das
causas do câncer? São alguns dos tópicos que procurei abordar nessas seções.
Na seção “atividade física e câncer: antecedente e justificativas” apresento um
breve histórico dos estudos epidemiológicos sobre atividade e câncer. A International
Agency for Research on Cancer, o World Cancer Research Fund International e
dezenas de publicações realizadas por grupos independentes de pesquisadores ao redor
do mundo, apontam uma possível relação causal entre atividade e a diminuição de
alguns tipos de câncer. Mas quais são os principais mecanismos biológicos pelos quais a
atividade física poderia reduzir o risco de câncer? Existem explicações alternativas à
causalidade que poderiam explicar as associações observadas nesses estudos
epidemiológicos? Espero responder essas inquietações ao final desse tópico.
Finalmente, destaco as perguntas de pesquisa que motivaram e nortearam o
desenvolvimento dessa pesquisa, e que, ao meu ver, tem recebido pouco destaque na
literatura. Essas perguntas de pesquisa compuseram os objetivos da tese (Capítulo 2),
concretizados em cinco manuscritos, brevemente apresentados a seguir.
O capítulo 3 consiste no manuscrito intitulado “Physical activity and cancer: an
umbrella review of the literature including 22 major anatomical sites and 770,000
cancer cases”, que avaliou a consistência da evidência epidemiológica, bem como
indícios de viés na literatura, que, por ventura, favoreceriam a publicação de “resultados
positivos” sobre o efeito da atividade física nos diferentes tipos de câncer.
O capítulo 4 trata-se do manuscrito “Physical activity during adolescence and
risk of colorectal adenoma in women”, que avaliou o possível papel da atividade física

no início da vida para redução o risco de câncer na fase adulta. Nesse manuscrito
investigamos a associação entre atividade física na adolescência e risco de adenoma
colorretal, um precursor do câncer colorretal, utilizando dados da coorte Nurses’ Health
Study II. Esse trabalho foi produto do estágio de pesquisa no exterior realizado no
Departamento de Nutrição da Harvard T.H. Chan School of Public Health no ano de
2017/2018, sob supervisão do Professor Edward Giovannucci.
O capítulo 5 trata-se do manuscrito “Association of type and intensity of physical
activity with plasma biomarkers of inflammation and insulin response”, que avaliou a
influência do tipo e intensidade da atividade física para redução de biomarcadores
inflamatórios e de resposta à insulina relacionados ao risco de câncer. Avaliamos ainda
se essas associações diferem segundo padrão de alimentação e adiposidade dos
indivíduos. Nesse trabalho, também fruto do estágio de pesquisa descrito anteriormente,
utilizamos dados do Health Professionals Follow-up Study.
Nos capítulos 6 e 7, numa tentativa de traduzir os conhecimentos obtidos nos
capítulos anteriores para a prática, procurei utilizar o instrumental da epidemiologia
para gerar informações potencialmente úteis para gestão em saúde pública. Explico. Nos
manuscritos “Preventable fractions of colon and breast cancers by increasing physical
activity in Brazil: perspectives from plausible counterfactual scenarios” e “Proportion
of cancer cases and deaths attributable to lifestyle risk factors in Brazil” estimei o
potencial de prevenção de câncer (preventabilidade) no Brasil mediante o aumento da
atividade física na população. Posteriormente, comparei essas estimativas de
preventabilidade vis-à-vis a outros fatores de risco relacionados ao aumento do risco de
câncer (tabagismo, consumo de álcool, excesso de peso/obesidade e alimentação não
saudável). Para isso, foram utilizadas informações de pesquisas com amostras
representativas do Brasil, informações do risco relativos do câncer e estimativas de
casos e mortes por câncer no Brasil.
No capítulo de considerações finais, discuto as principais implicações dos
achados dessas pesquisas para o avanço do conhecimento acerca do efeito protetor da
atividade física no risco de câncer e para estratégias de prevenção do câncer no Brasil.

1
1. INTRODUÇÃO
1.1. A CARGA DO CÂNCER NO BRASIL E NO MUNDO
Cancer is costly. First and foremost, there is the human cost,
comprising the uncertainty and suffering that a diagnosis of
cancer brings in its wake. Behind each statistic of a new cancer
case is an individual face, accompanied by the faces of family
and friends drawn into this singular event. The harrowing
experience of a cancer diagnosis is a truly universal one, played
out in every community worldwide, every day (Wild, 2014a, p.
x).
O último levantamento da Agência Internacional de Pesquisa em Câncer
(International Agency for Research on Cancer - IARC) estimou que, em 2018,
ocorreram 18,1 milhões casos de câncer (excluindo câncer de pele não-melanoma) e 9,6
milhões de mortes por câncer no mundo. A taxa de incidência de câncer, ajustada por
idade, foi aproximadamente 20% maior em homens (218,6 casos por 100 000) do que
em mulheres (182,6 casos por 100 000). Em homens, observou-se grande variação nas
taxas de incidência de câncer entre os continentes, com maiores taxas na Oceania (509,9
por 100 000) e menores taxas na África (121,9 por 100 000). Em mulheres, houve
menor variação nas taxas de incidência de câncer entre os continentes, com maiores
taxas na Oceania (335,2 por 100 000) e menores taxas na África (139,2 por 100 000)
(Bray et al., 2018; Ferlay et al., 2018). Vale ressaltar que, as diferenças nas taxas de
incidência segundo os continentes, pode ser explicada tanto pela distribuição das causas
dos diferentes tipos de câncer, quanto pela disponibilidade de programas e serviços de
detecção da doença, que por sua vez se refletem na qualidade dos registros de câncer.
Em relação às taxas de mortalidade por câncer, houve menor variação segundo
os diferentes continentes. Em homens, a taxas de mortalidade por câncer variou de 90,2
por 100 000 na África a 144,0 por 100 000 na Europa. Em mulheres, a taxa de
mortalidade por câncer variou de 80,0 por 100 000 na Ásia a 86,9 por 100 000 na
Oceania (Figura 1) (Bray et al., 2018; Ferlay et al., 2018).

2
Figura 1 - Taxas de incidência e mortalidade por câncer, segundo sexo e
continentes do mundo, 2018
Taxas padronizadas por idade por 100.000 habitantes. Excluindo câncer de pele não melanoma. Fonte:
Ferlay J, Ervik M, Lam F, Colombet M, Mery L, Piñeros M, Znaor A, Soerjomataram I, Bray F (2018).
Global Cancer Observatory: Cancer Today. Lyon, France: International Agency for Research on Cancer.
Disponível em https://gco.iarc.fr/today, acessado em 17/09/2018.

3
Diferenças nas taxas de mortalidade por câncer entre regiões podem estar
relacionadas tanto com a incidência de câncer quanto com a sobrevida de pacientes.
Portanto, não apenas a distribuição das causas do câncer e dos programas e serviços de
rastreamento podem explicar a variabilidade das taxas de mortalidade por câncer, como
também o acesso ao tratamento adequado da doença (Ezzati et al., 2018).
As taxas de incidência e mortalidade por câncer, ajustadas por idade, são de 2 a
3 vezes maiores em países de alta renda comparado aos países de baixa e média renda.
Apesar de países de baixa e média renda representarem mais de 80% da população
mundial, apenas 43% dos casos diagnosticados e 65% das mortes por câncer ocorrem
nesses países (Bray et al., 2018; Ferlay et al., 2018). Entretanto, a carga do câncer tende
a se agravar em países de baixa e média renda devido a mudança na composição
demográfica – crescimento e envelhecimento populacional (Bray; Moller, 2006).
Estimativas apontam que entre 2018 e 2040 haverá um aumento de 63% no total de
casos de câncer diagnosticados no mundo, com maior magnitude de aumento em países
de baixa e média renda (Bray et al., 2018; Ferlay et al., 2018). Na América do Sul, por
exemplo, estima-se um aumento de 76% (85,5% em homens e 67,4% nas mulheres) no
total de casos de câncer diagnosticados no período (Bray et al., 2018; Ferlay et al.,
2018).
Em relação aos tipos de câncer, no mundo, os tumores de
pulmão/brônquios/traqueia e mama foram os tipos mais frequentemente diagnosticados
e as principais causas de morte por câncer em homens e mulheres, respectivamente.
Além desses, os tumores de próstata, colorretal e estômago também apresentaram altas
taxas de incidência e mortalidade em homens. Em mulheres, destacaram-se ainda os
cânceres colorretal, pulmão e colo de útero (Figura 2) (Bray et al., 2018; Ferlay et al.,
2018).

4
Figura 2 - Incidência e mortalidade por câncer no mundo, segundos sexo e tipos de
câncer, 2018
Taxas padronizadas por idade por 100.000 habitantes. Fonte: Ferlay J, Ervik M, Lam F, Colombet M,
Mery L, Piñeros M, Znaor A, Soerjomataram I, Bray F (2018). Global Cancer Observatory: Cancer
Today. Lyon, France: International Agency for Research on Cancer. Disponível em
https://gco.iarc.fr/today, acessado em 17/09/2018.

5
No Brasil, ocorreram aproximadamente 560 mil casos de câncer em 2018
(excluindo câncer de pele não-melanoma), dos quais 279 mil em homens e 281 mil em
mulheres (Tabela 1). Em homens, os tipos de câncer mais frequentemente
diagnosticados foram próstata, cólon e reto e pulmão. Em mulheres, câncer de mama,
colo do útero e colorretal foram os mais frequentes. Em relação à mortalidade por
câncer, aproximadamente 244 mil mortes ocorreram em 2018, das quais mais da metade
(129 mil) em homens. As maiores taxas de mortalidade segundo tipos de câncer foram
pulmão, próstata e colorretal em homens, e mama, pulmão e colorretal em mulheres
(Ferlay et al., 2018).
Tabela 1 - Incidência e mortalidade por câncer no Brasil, 2018
Indicador Masculino Feminino Ambos sexos
População 103 599 314 107 268 645 210 867 959
Incidência
Número de novos casos de câncer 278 607 280 764 559 317
Taxa de incidência padronizada por idade* 240,9 201,5 217,2
Tipos de câncer mais frequentes
Próstata
Colorretal
Pulmão
Estômago
Bexiga
Mama
Colorretal
Tireoide
Colo do útero
Pulmão
Mama
Próstata
Colorretal
Pulmão
Tireoide
Mortalidade
Número de mortes por câncer 129 134 114 454 243 588
Taxa de mortalidade padronizada por idade* 109,7 77,9 91,3
Tipos de câncer mais frequentes Pulmão
Próstata
Colorretal
Estômago
Esôfago
Mama
Pulmão
Colorretal
Colo do útero
Pâncreas
Pulmão
Colorretal
Mama
Próstata
Estômago *Taxa padronizada por idade por 100.000 habitantes. Excluindo câncer de pele não melanoma. Adaptado
e traduzido de Ferlay J, Ervik M, Lam F, Colombet M, Mery L, Piñeros M, Znaor A, Soerjomataram I,
Bray F (2018). Global Cancer Observatory: Cancer Today. Lyon, France: International Agency for
Research on Cancer. Disponível em https://gco.iarc.fr/today, acessado em 17/09/2018.
Em síntese, altas taxas de incidência e mortalidade por câncer acometem a
população mundial. Os canceres de pulmão e mama são os mais frequentes em homens
e mulheres, respectivamente, mas existe grande variação na incidência e mortalidade
dos tipos de câncer segundo regiões. Aproximadamente 40% dos casos e 65% das
mortes por câncer ocorrem em países de baixa e média renda, justamente onde os casos

6
de câncer são detectados em estádios mais avançados e o acesso ao tratamento da
doença é escasso. Ainda que tais recursos estivessem disponíveis, como ocorre em
alguns países de alta renda, o “custo humano e social” do câncer é alto (Wild, 2014a).
Portanto, identificar, compreender e intervir nas principais causas que aumentam o risco
de câncer é necessário para prevenção e controle da doença na população.
1.2. CAUSAS DO CÂNCER E INFERÊNCIA CAUSAL EM EPIDEMIOLOGIA
Is there any other way of explaining the set of facts before us, is
there any other answer equally, or more, likely than cause and
effect? (Hill, 1965, p. 299)
A epidemiologia é a ciência responsável por identificar as causas das doenças e
das condições de saúde em populações. O processo de inferência causal, isto é, de
sugerir relações de causa e efeito para ocorrência da doença na população, sofreu
mudanças substanciais ao longo da história. Do miasma ao modelo de multicausalidade
das doenças, foram muitos os estudiosos que problematizaram, revisaram e propuseram
novas formas de compreensão da causalidade, cada qual contribuindo com o debate à
luz dos conhecimentos vigentes e dos problemas e condições de saúde enfrentados à
época (Susser, 1991).
Em epidemiologia, entende-se por causa um fator, característica ou condição
que, necessariamente precede, e contribui para a ocorrência da doença em alguns
indivíduos da população (Rothman, 1976). Outra maneira de conceitualizar causa é por
meio da abordagem de desfechos potenciais ou desfechos contrafactuais. Esse conceito
tem sido abordado por pensadores e pesquisadores de diversas áreas desde, pelo menos,
o filósofo David Hume:
We may define a cause to be an object, followed by another, and
where all objects, similar to the first, are followed by objects
similar to the second. Or in other words, where, if the first
object had not been, the second never had existed (Hume, 1748
apud Lewis, 1973, p. 556).

7
Nesse contexto, dizemos que há uma relação de causa e efeito se o desfecho
(doença = 1) fosse diferente em alguns indivíduos da população (doença = 0) tivesse o
fator, característica ou condição sido diferente (causa = 0) do que foi (causa = 1). Esse
conceito foi formalizado na literatura estatística por Neyman (1923), no contexto de
experimentos randomizados em agricultura, Rubin (1974), em estudos epidemiológicos
observacionais, e mais recentemente por Robins (1986) e Pearl (1995) em teoria de
diagramas causais ou gráficos acíclicos direcionados (VanderWeele, 2015).
Essa relação de causa e efeito deve ser entendida em termos probabilísticos, uma
vez que são raras, se existentes, as causas que contribuem isoladamente para ocorrência
da doença. Se assim o fosse, essa causa poderia ser considerada suficiente e necessária.
Entende-se por causas suficientes, fatores que produzem inevitavelmente a ocorrência
de uma doença. Em seu modelo de causas suficientes e causas componentes (Rothman’s
Pie model), Rothman define causa suficiente como constelação de fenômenos, ou
causas componentes, que quando acumulados produzem a doença (Rothman, 1976). Por
exemplo, pessoas que fumam apresentam, em média, risco de desenvolver câncer de
pulmão 23 vezes maior do que pessoas que não fumam (Carter et al., 2015). Entretanto,
o tabagismo não é causa suficiente do câncer de pulmão, uma vez que nem todos
indivíduos que fumam terão a doença. Portanto, o hábito de fumar deve ser entendido
como uma causa componente importante, presente em diversas, mas não em todas,
causas suficientes que produzem o câncer de pulmão. Por fim, algumas pessoas que não
fumam ao longo da vida também desenvolvem câncer de pulmão e, portanto, o hábito
de fumar não é causa necessária da doença (Keyes; Galea, 2014).
Causa necessária pode ser entendida como uma causa componente que está
presente em todas as causas suficientes que produzem a doença (Rothman, 1976). Um
exemplo de causa necessária em epidemiologia do câncer é o papiloma vírus humano
(Human papillomavirus – HPV), pois este estaria presente em todas as causas
suficientes do câncer de colo do útero. Em outras palavras, todas as mulheres com
câncer de colo do útero teriam sido infectadas pelo HPV antes da ocorrência da doença.
Caso o HPV fosse eliminado, 100% dos casos de câncer de colo do útero seriam
evitados. Entretanto, o HPV não é capaz de influenciar de forma isolada a ocorrência do
câncer de colo do útero (não é causa suficiente), pois a grande maioria das mulheres
infectadas pelo vírus não desenvolvem a doença (Lagiou et al., 2008).
8
Identificar todas as causas componentes, apesar de importante para compreensão
da etiologia, é desnecessário do ponto de vista da prevenção das doenças. Para atuar na
prevenção das doenças, Rothman (1976) argumenta que bastaria intervir nas principais
causas componentes da doença, ou seja, nas causas componentes que estão presentes em
diversas causas suficientes. Dessa forma, removendo ou reduzindo essas causas, o
conjunto das demais causas componentes seria insuficiente para produzir a doença
(Rothman, 1976). Richard Peto define essas causas componentes como “as grandes
causas”, e argumenta que “a moderate reduction in a big cause can prevent far more
deaths than a big reduction in a small cause” (Peto et al., 2014; The, 2016, p. 414).
Esse conceito é especialmente relevante no modelo de multicausalidade das doenças,
atualmente utilizado na compreensão da etiologia do câncer.
Entendemos que a ocorrência do câncer (efeito) se deve a diversos fatores,
características e condições (causas componentes), acumulados ao longo da vida, que
iniciam e promovem mutações genéticas de células normais, até que uma causa
suficiente seja completada e ocorra a formação e progressão do tumor maligno
(Rothman, 1976; Hanahan; Weinberg, 2011). Com efeito, a realidade é mais complexa
do que isso. A carcinogênese é um processo complexo, não linear e de múltiplas etapas
(iniciação, promoção e progressão), em que células normais sofrem alterações genéticas
e adquirem fenótipos malignos. Câncer é um grupo de doenças heterogêneas, que
ocorrem em diferentes tecidos, e que apresentam biologia, características e etiologia
distintas. Até mesmo tumores que ocorrem em um mesmo sítio (câncer de mama)
apresentam heterogeneidade biológica marcante. Não obstante, algumas “marcas
registradas” (The Hallmarks of Cancers) - capacidades biológicas desenvolvidas pelas
células tumorais ao longo do processo de carcinogênese - auxiliam na definição desse
grupo de doenças. São elas: a capacidade de i) sustentar sinais de proliferação; ii) evitar
supressão do crescimento; iii) evitar destruição pelo sistema imune; iv) permitir
imortalidade replicativa; v) ativar sinais de invasão e metástase; vi) induzir
angiogênese; vii) resistir a sinais de morte celular; e viii) desregulação energética da
célula. Essas capacidades são facilitadas por duas características do tumor,
desenvolvidas durante o processo de carcinogênese: i) instabilidade genética e mutação
e ii) inflamação pró-tumorigênese (Hanahan; Weinberg, 2011).

9
São três os principais grupos de causas descritos na literatura que atuariam na
iniciação e promoção dessas mutações genéticas: processos estocásticos, fatores
genéticos/hereditários e fatores ambientais e de estilo de vida (Song et al., 2018).
Recentemente publicada por Tomasetti e Vogelstein (2015), a teoria de
processos estocásticos na causação do câncer sugere que o risco de diferentes tipos de
câncer está associado com o número total de divisões de células tronco que ocorrem no
sítio ao longo da vida. O conceito por de trás dessa teoria é que mudanças genômicas
ocorreriam aleatoriamente durante o processo de replicação do ácido
desoxirribonucleico (deoxyribonucleic acid - DNA). Portanto, as taxas de mutação das
células tronco nos diferentes tecidos explicariam a variação da incidência de câncer
entre os órgãos. Segundo os autores, esse modelo sugere que a maioria dos casos de
câncer (65%) seria atribuível ao acaso. Essa teoria tem importantes implicações na
compreensão da etiologia e prevenção do câncer, uma vez que, se genuína, apenas um
terço dos casos de câncer seria atribuível às demais causas – hereditariedade e fatores
ambientes e estilo de vida.
O efeito da susceptibilidade hereditária no risco de câncer está bem
documentado na literatura. Em meados do século passado, estudos indicavam agregados
de casos de câncer em famílias grandes, nomeada síndrome do câncer hereditário,
corroborando com a hipótese de que fatores genéticos estão presentes na causação do
câncer (Lynch et al., 1966). Famílias afetadas por essas síndromes apresentavam
características peculiares, como casos de câncer raros, ocorrência de câncer em idades
mais jovens, múltiplos tipos de câncer num mesmo indivíduo, câncer em ambos pares
de órgãos e câncer infantil em irmãos (ACS, 2014). A partir da década de 80, com o
desenvolvimento da biologia molecular, diversos genes de câncer inerentes (inherited
cancer genes) foram identificados. Análises de linkage, em que membros familiares são
categorizados quanto à presença ou ausência de determinados genes, permitiram
identificar mutações em oncogenes e genes supressores de tumor que estariam
associadas com a ocorrência do câncer (Cavenee et al., 1983). No entanto, essa relação
entre a mutação genética e a ocorrência de câncer depende da presença de outros genes,
bem como de fatores ambientais e de estilo de vida que poderiam influenciar o risco do
câncer. Portanto, a presença de uma mutação genética inerente não deve ser entendida
como causa suficiente do câncer (Fearon, 1997; ACS, 2014).

10
Além das mutações de alguns genes, a herança de outros genes raros e que
apresentam menor risco para câncer (com menor penetração) também fornecem
evidências sobre a susceptibilidade hereditária como causa de câncer. O conhecimento
acerca da relação desses genes raros e a ocorrência de câncer foi obtido por meio dos
genomewide studies (GWAS), em que milhares de polimorfismos de nucleotídeo único
(single-nucleotide polymorphisms – SNPS) são investigados simultaneamente (Foulkes,
2008). Entretanto, esses estudos sugerem que apenas 5 a 10% dos tipos de câncer
apresentariam algum componente hereditário (ACS, 2014).
Estudos sobre divisão de células tronco nos diferentes tecidos ao longo da vida e
da susceptibilidade hereditária têm contribuído para o entendimento da etiologia do
câncer. No entanto, esses estudos são, por vezes, interpretados e comunicados de
maneira isolada, negligenciando evidências extensas sobre o papel de fatores de risco
ambientais e de estilo de vida para câncer. Por exemplo, o estudo de Tomasetti e
Vogelstein foi amplamente divulgado pela mídia, que por sua vez enalteceu que 65%
dos casos de câncer são atribuíveis à má sorte/acaso, sendo apenas o complemento
(35%) potencialmente prevenível (Tomasetti; Vogelstein, 2015; Davey Smith et al.,
2016). A repercussão desses achados foi prontamente replicada por epidemiologistas
que destacaram que diferenças nas taxas de câncer ao longo tempo e entre populações,
bem como mudanças nas taxas de incidência de câncer em migrantes semelhantes às da
população local, sugerem fortemente papel etiológico de fatores ambientes e de estilo de
vida (Wild et al., 2015). Claramente, a mudança na má sorte não deve explicar essas
diferenças nas taxas segundo pessoa, tempo e espaço (Davey Smith et al., 2016). Para
estimar a proporção de casos de câncer que poderia ser potencialmente prevenida é
necessário comparar as taxas de incidência de câncer entre as populações com
diferentes padrões de fatores de risco (alto risco versus baixo risco), ao invés de
comparar taxas de incidência de câncer em diferentes tecidos de um mesmo indivíduo
(Doll; Peto, 1981; Song; Giovannucci, 2015). Isso porque as causas do câncer em
indivíduos são distintas das causas do câncer nas populações (Rose, 1985; Davey Smith
et al., 2016).
Além disso, é incorreta a afirmação de que 65% das diferenças das taxas de
incidência de câncer entre as localizações são atribuíveis ao processo de divisão de
células tronco ao longo dos anos e, portanto, apenas 35% dos casos estariam
relacionados às demais causas (Tomasetti; Vogelstein, 2015). Ao afirmar isso, os

11
autores presumem que a fração da doença atribuível ao conjunto de causas componentes
deve somar 100%. Entretanto, as doenças na população são causadas por diversas
causas componentes, que se sobrepõem nas diferentes causas suficientes possíveis.
Portanto, a soma da fração atribuível de cada fator causal (causa componente) pode ser
maior que a unidade (Rothman, 1976; Song; Giovannucci, 2015).
A compreensão de que o câncer pode ser prevenido e controlado não é recente.
A primeira referência que se tem notícia sobre a possibilidade de controle do câncer
surgiu em 1913 com a criação da American Society for the Control of Cancer, que
posteriormente se tornaria a American Cancer Society. Na época, o conceito de controle
do câncer estava voltado às intervenções médicas, principalmente cirúrgicas, a fim de
remover o tumor em estádios precoce da doença (Hiatt; Rimer, 2006). Já em novembro
de 1963, o World Health Organization Expert Committee on the Prevention of Cancer
já evidenciava o potencial de prevenção do câncer por meio da mudança do ambiente e
do estilo de vida (WHO, 1964):
The potential scope of cancer prevention is limited by the
proportion of human cancers in which extrinsic factors are
responsible. These include all environmental carcinogens
(whether already identified or not) as well as “modifying
factors” that favour neoplasia of apparently intrinsic origin
(e.g., hormonal imbalances, dietary deficiencies and metabolic
defects). The types of cancer that are thus influenced, directly or
indirectly, by extrinsic factors include many tumors of the skin
and mouth, the respiratory, gastro-intestinal and urinary tracts,
hormone-dependent organs (such as the breast, thyroid and
uterus), haematopoietic and lymphopoietic systems - which,
collectively, account for more than three-quarters of human
cancers. It would seem, therefore, that the majority of human
cancer is potentially preventable (WHO, 1964 apud Doll; Peto,
1981, p. 1197).
Atualmente existem evidências convincentes sobre o papel de diversos fatores
ambientais e de estilo de vida que atuam na causação do câncer. A IARC já catalogou
mais de 400 fatores de risco (Quadro 1), entre fatores ambientais, químicos, exposições
ocupacionais, agentes físicos e biológicos, que apresentam evidência convincente ou
provável sobre carcinogenicidade (IARC, 1971-2015):

12
Quadro 1 - Evidência de fatores ambientais potencialmente carcinogênicos
segundo a Agência Internacional de Pesquisa em Câncer (IARC, 1971-2015)
Evidência sobre potencial carcinogênico
Número de agentes
cancerígenos
classificados
Grupo 1 - Agente cancerígeno para humanos: evidências
suficientes de carcinogenicidade para humanos 120
Grupo 2A - Agente provavelmente cancerígeno para humanos:
evidências limitadas de carcinogenicidade para humanos, mas
evidências suficientes em animais
82
Grupo 2B - Agente possivelmente cancerígeno para humanos:
evidências limitadas de carcinogenicidade em humanos e
evidências insuficientes em animais
299
Grupo 3 - Agente não classificável em relação ao potencial
cancerígeno para humanos: evidências de carcinogenicidade são
inadequadas em humanos e insuficientes em animais.
502
Grupo 4 - Agente provavelmente não cancerígeno para humanos:
evidências sugerindo que não há efeito cancerígeno em humanos e
em animais
1
A epidemiologia teve um papel central na identificação dessas causas do câncer,
ainda que a interpretação dos resultados dos estudos seja inerentemente desafiadora. O
pressuposto de comparabilidade (exchangeability) entre os grupos exposto e não
exposto à causa putativa é essencial no processo de inferência causal. Utilizando o
conceito de desfecho contrafactual descrito anteriormente, seria possível identificar
relações de causa e efeito, bem como estimar a magnitude do efeito causal no risco de
câncer na população, se fosse possível comparar: (a) as taxas de incidência de câncer
quando todos indivíduos da população são expostos ao fator causal com (b) as taxas de
câncer que seriam observadas se os mesmos indivíduos da população não tivessem sido
expostos a esse fator; mantendo os demais causais estáveis. Se as taxas de câncer
obtidas nessas duas situações fossem diferentes, poderíamos dizer que há uma relação
de causa e efeito entre a exposição e o câncer (Greenland et al., 2008; Hernán et al.,
2004).

13
Em estudos epidemiológicos, no entanto, conseguimos comparar taxas de câncer
em grupos diferentes (grupo exposto v.s. grupo não exposto) relativamente à exposição
sob investigação. Dizemos que há uma associação quando a probabilidade de ocorrência
da doença é diferente entre os grupos comparados. O contraste das taxas de câncer entre
os grupos, expressa em diferenças absolutas ou relativas das taxas de câncer, é chamada
de medida de associação. Quando há diferença entre a (real) magnitude do efeito causal
da exposição no câncer e a magnitude de associação obtida no estudo, dizemos que
associação ≠ causação. Em outras palavras, há viés na magnitude de associação
encontrada no estudo (Greenland et al., 2008; Hernán et al., 2004).
Nesse sentido, ensaios clínicos randomizados, estudo de intervenção em que
dois ou mais grupos de pessoas são alocados de forma aleatória (randomização) para
receber (grupo intervenção) ou não receber (grupo controle) determinada intervenção
relacionada ao potencial fator causal, forneceriam a melhor evidência sobre causalidade.
Pelo processo de randomização, os grupos intervenção e controle se tornariam
comparáveis no que diz respeito à distribuição de outras causas (conhecidas e
desconhecidas) da doença. Portanto, a diferença no risco da doença entre os grupos
estaria relacionada apenas à exposição/intervenção sob investigação (Lagiou et al.,
2008). No entanto, em diversos contextos, ensaios clínicos randomizados não podem ser
conduzidos por questões éticas e/ou logísticas e, portanto, estudos observacionais são
frequentemente utilizados para investigar as causas da doença.
Em estudos observacionais, a interpretação causal das associações observadas
torna-se mais difícil, devido a erros aleatórios, sistemáticos e confundimento. Ao passo
que erros aleatórios podem ser solucionados com o aumento do tamanho da amostra e,
consequentemente, da precisão das estimativas, vieses e confundimento ocorrem por
insuficiência do delineamento do estudo durante a seleção dos participantes (viés de
seleção), a coleta das informações sobre exposição e desfecho (viés de informação) e a
análise e apresentação dos resultados (Lagiou et al., 2008; Rothman et al., 2008; Szklo;
Nieto, 2014a).
Confundimento é particularmente preocupante em estudos observacionais.
Entende-se por confundimento um efeito aparente da exposição na doença distorcido
pelo efeito de uma outra variável - variável de confusão ou confundidor (Rothman et al.,
2008; Szklo; Nieto, 2014b). A mistura de efeitos introduzida pela variável de confusão

14
pode distorcer a estimativa do efeito da exposição no desfecho, que pode ser inclusive
nula, conforme apresentado na Figura 3.
Figura 3 - Diagrama causal representando associação espúria entre exposição (E) e
desfecho (D) devido à confundimento (C)
Essa distorção da medida de associação dependerá da direção das associações
entre a variável de confusão e exposição/desfecho, conforme apresentado abaixo na
Tabela 2 (Rothman et al., 2008; Szklo; Nieto, 2014b):
Tabela 2 - Impacto do confundimento na associação entre exposição e desfecho
segundo direção das associações entre variável de confusão e exposição e desfecho
Associação entre exposição
e variável de confusão
Associação entre variável
de confusão e desfecho
Mudança esperada na
medida de efeito
Positiva Positiva RRbruto > RRAjustado
Positiva Negativa RRbruto < RRAjustado
Negativa Negativa RRbruto > RRAjustado
Negativa Positiva RRbruto < RRAjustado
Associação positiva: a presença da variável de confusão está associada com aumento na probabilidade da
exposição/desfecho; Associação negativa: a presença da variável de confusão está associada com a
diminuição na probabilidade da exposição/desfecho; RR: risco relativo. Fonte: Szklo M, Nieto J.
Identifying Noncausal Associations: Confounding. In: Szklo M, Nieto J. Epidemiology: Beyond the
Basics. 3rd edition. Jones & Bartlett Learning: Burlington; 2014b
Frequentemente, essas limitações (vieses e confundimento) não conseguem ser
superadas em estudos epidemiológicos, gerando associações espúrias entre exposições e
câncer. Entende-se que há viés na literatura quando o conjunto de estudos que
investigam determinada relação entre exposição e desfecho apresentam resultados que,
em média, diferem da real magnitude de efeito (Szklo; Nieto, 2014a).
O viés na literatura também ocorre por más práticas ao longo do processo
hipotético-dedutível de produção do conhecimento científico: hipótese → delineamento
do estudo → coleta dos dados → análise dos dados e teste de hipótese → interpretação

15
dos resultados → publicação. Análise dos dados com fins a mostrar resultados
estatisticamente significante (P-hacking), conflitos de interesse e viés de publicação são
alguns exemplos dessas práticas que podem impactar a validade e credibilidade da
literatura (Munafò et al., 2018). O viés de publicação ocorre quando fatores outros, que
não a qualidade metodológica dos estudos, influenciam a probabilidade da publicação
dos achados. A presença de resultados estatisticamente significantes (P<0,05) ou
clinicamente favoráveis é um exemplo desses fatores que influenciam a disseminação e
publicação dos estudos. Esse processo torna estimativas de efeito disponíveis na
literatura enviesadas e, consequentemente, podem sugerir tomadas de decisões clínicas e
em saúdes públicas incorretas (Dickersin, 1990; Young; Ioannidis, 2008; Munafò et al.,
2018; Rezende et al., 2018).
Viés de publicação em estudos sobre causas do câncer tem sido investigado,
identificado e problematizado na literatura. Por exemplo, resultados dos primeiros
estudos sobre o potencial efeito de poluentes em câncer de mama, bem como exposição
ocupacional à acrilonitrila em câncer de pulmão, não foram replicados em estudos
subsequentes (Boffetta et al., 2008). De fato, os primeiros estudos em determinado
campo de investigação tendem a superestimar a magnitude do efeito da exposição no
desfecho em comparação aos estudos subsequentes. Esse fenômeno de regressão à
média das estimativas de efeito pode ser explicado, entre outros fatores, pela diminuição
do viés de publicação ao longo do tempo (Fanelli et al., 2017).
Diversas revisões de literatura têm identificado indícios de viés de publicação
em meta-análises sobre associação entre alimentação, diabetes tipo 2, biomarcadores e o
risco de câncer (Tsilidis et al., 2012; 2015; Schoenfeld; Ioannidis, 2013). O estudo
publicado por Schoenfeld e Ioannidis (2013) é um exemplo particularmente interessante
dessas revisões de literatura. Nesse estudo, foram obtidas informações a respeito das
conclusões, significância estatística e reprodutibilidade na literatura sobre alimentos
específicos e risco de câncer por meio de uma “revisão sistemática de livros de
receitas”. Foram selecionados de forma aleatória 50 ingredientes de receitas e,
posteriormente, uma revisão da literatura sobre a relação desses ingredientes com o
risco de câncer foi conduzida. Aproximadamente 80% dos ingredientes selecionados
tinham artigos na literatura sugerindo a relação com risco de câncer. Desses artigos
(n=264), 72% (n=191) concluíram que o ingrediente estava associado com aumento
(n=103) ou diminuição (n=88) no risco de câncer. A mediana e intervalos interquartis

16
das medidas de associação (riscos relativos) obtidas nos estudos variou de 2,20 (1,60 a
3,44) a 0,52 (0,39 a 0,66), sugerindo magnitude de efeito implausível quando
comparadas com a síntese meta-analítica obtida em revisões sistemáticas sobre a mesma
pergunta de pesquisa. Os resultados reportados nos resumos desses estudos
apresentaram, com maior frequência, resultados estatisticamente significantes do que na
seção de resultados do artigo. Esses achados sugerem o favorecimento da publicação de
estudos com resultados estatisticamente significantes e com efeitos superestimados da
alimentação no risco de câncer (Schoenfeld; Ioannidis, 2013). Portanto, é prudente
analisar a possível influência de viés de publicação durante a investigação e
interpretação da evidência sobre as possíveis causas do câncer na população.
Considerando que diversos vieses podem interferir na validade e credibilidade
dos resultados de estudos epidemiológicos, diversos critérios têm sido utilizados para
avaliação e interpretação da evidência. Os nove pontos de vista (ou critérios), descritos
por Austin Bradford Hill para distinguir associação de causação, são os mais
comumente utilizados e difundidos em epidemiologia (Tabela 3). Hill (1965) reconhece,
no entanto, que nenhum desses critérios é condição sine qua non para discernir
associações espúrias de causalidade, mas esses podem oferecer elementos importantes
durante a avaliação da evidência.

17
Tabela 3 - Critérios de Austin Bradford Hill para discernir associação de causação,
1965
Critérios Definição
Força de
associação
Quanto maior a magnitude da associação, maior a evidência de que o fator é
causal. A magnitude da associação pode ser medida pela razão da ocorrência
do desfecho (efeito) entre grupo exposto e não exposto ao fator causal (risco
relativo)
Consistência Resultados evidenciados de forma semelhante em diferentes populações e
circunstâncias reforçam a hipótese de causalidade
Especificidade Quando o fator está associado especificamente a um determinado efeito (tipo
de câncer), é mais provável que o mesmo seja um fator causal
Temporalidade A causa deve necessariamente preceder o efeito
Gradiente
biológico
Aumento na frequência ou intensidade da causa produz um aumento na
ocorrência do desfecho (efeito). O gradiente pode ser medido pela função da
relação dose-resposta entre causa e efeito
Plausibilidade Evidências sobre a biologia da doença corroboram com a hipótese de
causalidade
Coerência A interpretação da relação de causa e efeito não deve ser conflituosa com o
estado da arte sobre a biologia e a distribuição da doença na população e no
tempo
Experimento Evidência experimental com intervenção no fator causal modifica a
ocorrência da doença (efeito)
Analogia Existência de uma analogia que ajude a explicar a associação, reforça a
hipótese de causalidade
Os critérios de Hill têm sido utilizados, por exemplo, pela IARC para avaliação
da evidência de possíveis agentes cancerígenos para humanos (IARC, 2016). Além
desses critérios, a IARC avalia estudos em humanos segundo (1) o tipo de estudo
epidemiológico (coorte, caso-controle, ecológicos e ensaios clínicos randomizados); (2)
qualidade metodológica dos estudos com ênfase no risco de vieses, confundimento e
erro aleatório na interpretação dos resultados; (3) síntese meta-analítica das medidas de
associação dos estudos (revisões sistemáticas e meta-análises) e meta-análise de dados
individuais de participantes (meta-analysis of individual participant data); (4) análise
detalhada da temporalidade das relações entre as causas e o câncer; e (5) resultados de

18
estudos epidemiológicos sobre biomarcadores moleculares e celulares do câncer. Além
desses critérios, a IARC também considera evidências oriundas de estudos
experimentais com animais e outros estudos mecanísticos sobre carcinogênese (IARC,
2006). Entretanto, vale ressaltar que a avaliação de vieses na literatura oriunda de
práticas que favorecem a publicação de resultados estatisticamente significantes (viés de
publicação), não faz parte dos critérios utilizados pela IARC para classificação de
agentes cancerígenos para humanos, apesar da clara implicação desses vieses na
validade e credibilidade da evidência.
Em síntese, identificar e compreender as causas do câncer é essencial para
informar tomadas de decisão clínica e em saúde pública, bem como comunicar
adequadamente o potencial de intervenções voltadas à prevenção de câncer. As causas
do câncer diferem a nível individual e populacional. Processos estocásticos, fatores
genéticos/hereditários, ambientais e de estilo de vida atuam em conjunto ao longo da
vida, alterando o risco de desenvolver e morrer por câncer na população. O processo de
inferência causal em epidemiologia do câncer é complexo. Erros aleatórios e
sistemáticos em estudos epidemiológicos, bem como práticas que favorecem a
disseminação e publicação de resultados estatisticamente significantes, podem distorcer
a evidência científica sobre causas do câncer. Essas limitações devem ser levadas em
consideração durante a interpretação da evidência.
1.3. PREVENTABILIDADE DE CÂNCER
Relative risk is only for researchers; decisions call for absolute
measures (Rose, 1992, p.19).
Identificar as causas do câncer na população é um dos objetivos centrais da
epidemiologia. No entanto, mais informações são necessárias para que esses
conhecimentos sobre etiologia sejam aplicados para a prevenção e o controle da doença.
Por exemplo, estimar a relação dose-resposta entre fatores de risco e câncer é crítico. O
formato da curva dose-resposta (exemplo: linear, exponencial, em “U”, em “J”) implica

19
diretamente nas ações de políticos, gestores e tomadores de decisão (Rose, 1992). A
relação linear entre tabagismo e câncer de pulmão sugere que não há nível seguro de
consumo de cigarro e que, portanto, políticas públicas devem focar na cessação do
tabaco para diminuição do risco de câncer de pulmão (Carter et al., 2015). A estimativa
da relação dose-resposta é usualmente calculada em termos relativos, uma vez que o
risco (incidência ou taxa) da doença é estimado segundo estratos da exposição de
interesse e comparado a um grupo de referência não exposto ou com baixos níveis de
exposição. Exemplos dessas medidas de associação baseadas em diferenças relativas
são risco relativo e odds ratio (Greenland et al., 2008).
Outra informação relevante para planejamento de ações em prevenção é a
distribuição da população segundo estratos da exposição, dado que, uma alta magnitude
do risco relativo da doença pode ter um baixo impacto populacional se o fator de risco
em questão for raro. Por outro lado, riscos relativos de menor magnitude podem refletir
em grande impacto populacional quando a exposição é mais frequente na população.
Este célebre axioma da medicina preventiva, conhecido como paradoxo da prevenção,
foi descrito por Geoffrey Rose em 1985: “A large number of people at small risk may
give rise to more cases of disease than a small number of people at high risk” (Rose,
1985, p.37). Com efeito, medidas de associação baseadas em diferenças absolutas da
ocorrência da doença são necessárias para estimar o excesso do risco da doença
associado à exposição (Rose, 1992). Essas oferecem a possibilidade de estimar o
potencial de prevenção (preventabilidade) da doença por meio da redução/eliminação do
fator de risco na população (Greenland et al., 2008).
Estudos sobre a preventabilidade de câncer são importantes para informar
políticas públicas e intervenções voltadas ao controle da doença. Conforme descrito
anteriormente, a preventabilidade pode ser estimada por meio de medidas de associação
baseadas em diferenças absolutas do risco de câncer. Por exemplo, comparando
populações com altas taxas de câncer com populações com baixas taxas de câncer.
Diferenças entre as taxas seriam, portanto, atribuíveis a diferenças no padrão de
exposição à fatores de risco ambientais e estilo de vida entre as populações (Song;
Giovannucci, 2015; Davey Smith et al., 2016). Um exemplo clássico da aplicação desse
método foi publicado pelos eminentes epidemiologistas, Richard Doll e Richard Peto.
Doll e Peto (1981) estimaram a proporção de mortes por câncer que seria
potencialmente evitável nos Estados Unidos da América (EUA) comparando as taxas de

20
mortalidade por câncer do país com as de Connecticut - população de referência com
baixas taxas de mortalidade por câncer. Eles encontraram que, aproximadamente, 75% a
80% das mortes por câncer nos EUA em 1970 poderiam ser potencialmente evitadas. O
tabagismo foi o fator de risco modificável que contribuiu com maior fração das mortes
por câncer nos EUA, apesar de estimativas apontarem para uma fração equivalente,
porém menos precisa, aos fatores relacionados à alimentação (Tabela 4) (Doll; Peto,
1981).
Tabela 4 - Proporções (%) de mortes por câncer atribuíveis a diferentes fatores.
Estados Unidos, 1978*
Fatores ou classe de fatores Melhor estimativa Variação aceitável das
estimativas
Tabagismo 30 25 – 40
Álcool 3 2 – 4
Dieta 35 10 – 70
Aditivos alimentares <1 -5a – 2
Reprodutivos e sexuais 7 1 – 13
Ocupacionais 4 2 – 8
Poluição 2 <1 – 5
Produtos Industriais <1 <1 – 2
Procedimentos médicos e medicamentos 1 0,5 – 3
Geográficosb 3 2 – 4
Infecções 10 ? 1 - ?
*Adaptação e tradução da Tabela 20 do artigo “Doll R, Peto R. The causes of cancer: quantitative
estimates of avoidable risks of cancer in the United States today. J Natl Cancer Inst. 1981;66(6):1191-
308”. a Assumindo a possibilidade de efeitos protetores de antioxidantes e outros preservantes. b Apenas 1%, e não 3%, pode ser razoavelmente descrito como evitável. Fatores geográficos também
causam uma grande proporção de câncer não letal (até 30% de todos os casos de câncer, dependendo
da miscigenação étnica e latitude) por causa da importância dos raios UV na causação de carcinoma
basocelular e escamoso em peles expostas à luz solar.
Recentemente, a preventabilidade de câncer tem sido calculada pelo método de
fração atribuível populacional (Olsen et al., 1997; Bofetta et al., 2009; Inoue et al.,
2012; Whiteman et al., 2015; Azevedo e Silva et al., 2016; Islami et al., 2017; 2018;
Brown et al., 2018). A fração atribuível populacional fornece estimativa da proporção
dos casos de câncer potencialmente prevenível caso determinado fator causal fosse
eliminado. No Apêndice A apresento uma breve descrição de como as estimativas de

21
fração atribuível populacional podem ser calculadas por meio de dados secundários,
bem como nuances metodológicos e pressupostos dessas análises, a fim de fornecer
importantes elementos para planejamento de ações de prevenção e controle de doenças.
Brevemente, esse método depende de informações disponíveis sobre i) evidência
convincente de que o fator causal aumenta/diminui o risco de câncer; ii) distribuição do
fator causal na população); iii) magnitude do risco relativo do câncer associado ao fator
causal, ajustado por potenciais variáveis de confusão; iv) número de casos e mortes por
câncer na população de interesse (Rezende; Eluf-Neto, 2016).
Por meio desse método, a preventabilidade de câncer foi estimada na Finlândia,
Noruega França, Reino Unido, Japão, China, EUA, Austrália e Brasil (Olsen et al.,
1997; Boffetta et al., 2009; Inoue et al., 2012; Whiteman et al., 2015; Azevedo e Silva
et al., 2016; Islami et al., 2017; 2018; Brown et al., 2018). Nesses países, a proporção
do total de casos câncer atribuível à fatores de risco modificáveis variou de 27% em
países Nórdicos (Finlândia e Noruega) (Olsen et al., 1997) a 42% nos Estados Unidos
(Islami et al., 2018), enquanto a fração das mortes variou de 35% na França (Boffetta et
al., 2009) a 52% na China (Islami et al., 2017).
No tocante ao estudo conduzido no Brasil, a fração do total de casos e mortes
por câncer atribuível a fatores de risco modificáveis foi estimada para o ano de 2020.
Para tanto, foram considerados 25 tipos de câncer e 32 exposições pertencentes às
seguintes categorias: tabagismo, uso de álcool, alimentação, excesso de peso e
obesidade, falta de atividade física, infecções, histórico reprodutivo, riscos ocupacionais
e ambientais. Aproximadamente 34% e 42% dos casos e mortes por câncer,
respectivamente, que ocorrerão em 2020 são atribuíveis a fatores de risco modificáveis
citados. Dentre esses fatores, tabagismo, infeções, alimentação, falta de atividade física
e obesidade são os principais responsáveis pela carga do câncer no país (Azevedo e
Silva et al., 2016).
Em conclusão, investigar as causas do câncer é uma função central da
epidemiologia. Medidas de associação baseadas em diferenças relativas das taxas de
câncer entre subgrupos da população são utilizadas para estudo da etiologia do câncer.
Medidas de associação baseadas em diferenças absolutas das taxas de câncer, como a
fração atribuível populacional, fornecem informações sobre a preventabilidade de
câncer na população. Essas informações são importantes para planejamento de
intervenções e políticas públicas voltadas à prevenção da doença.

22
1.4. ATIVIDADE FÍSICA E CÂNCER: ANTECEDENTES E JUSTIFICATIVAS
We believe that the carcinoma problem may also be simplified
by the recognition of the value of muscular activity in those
periods of life most affected by carcinoma, those periods of life
when we are prone to “let down” and check our pace. If
muscular activity has an intimate relationship to carcinoma, the
value of it will be most apparent in prophylaxsis, the field which
to date promises the most in the attack on this malady
(Sivertsen; Dahlstrom, 1922, p. 365-6).
A relação entre atividade física e a diminuição no risco de câncer foi aventada
por Bernardino Ramazzini (1633-1714). Ramazzini acreditava que os casos de câncer
em trabalhadores estavam associados com a exposição aos materiais tóxicos, e eram
acelerados por movimentos violentos ou irregulares e posturas não naturais ao corpo.
Por isso, recomendava que trabalhadores interrompessem posturas prolongadas com
caminhadas e exercícios físicos (Dishman et al., 2013).
No entanto, apenas em 1922, foram realizados os primeiros estudos
epidemiológicos que avaliaram a associação entre atividade física e o risco de câncer.
Em artigo intitulado “A theory of cancer”, o australiano Cherry (1922) reportou maior
mortalidade por câncer entre indivíduos com menor intensidade de atividade muscular
no trabalho em comparação àqueles com maior atividade física. De maneira semelhante,
no mesmo ano, em Minnesota, EUA, Sivertsen e Dahlstrom publicaram artigo intitulado
“The relation of muscular activity to carcinoma: a preliminary report”, que apresentou
resultados semelhantes ao estudo australiano1 (Sivertsen; Dahlstrom, 1922). Nesse
estudo, os autores agruparam as atividades ocupacionais comuns à época segundo níveis
de exigência de atividade muscular da seguinte maneira: (1) atividade muscular alta:
pedreiros, ferreiros, caldeiros e moldadores; (2) atividade muscular moderada:
carpinteiros, marceneiros, pedreiros e encanadores; (3) Atividade muscular média:
1 Apesar dos estudos terem sido desenvolvidos de forma independente, Sivertsen e Dahlstrom tinham conhecimento
dos achados de Cherry, e citam em sua publicação: “It is interesting to us to find that in another part of the world
similar ideas have been advanced almost simultaneously. Cherry, of Melbourne, on March 1, 1922, read a paper on
A Theory of Cancer in which he attributes the recent increase of cancer to deficient muscular activity, overnutrition,
arid lessened skin activity, as a result of modem living conditions of civilized peoples.” (Sivertsen; Dahltrom, 1922).

23
capatazes, moleiros e cervejeiros; (4) Atividade muscular baixa: professores e
atividades de escritório; (5) atividade muscular sazonal: fazendeiros; (6) Sem atividade
profissional remunerada: desempregados, aposentados e hospitalizados. Em geral, a taxa
de mortalidade por câncer foi menor em trabalhadores com maior atividade muscular no
trabalho comparado aos trabalhadores com menor atividade muscular. É interessante
notar ainda que os autores descreveram que a presença de uma relação dose-resposta
entre atividade muscular e mortalidade por câncer reforça a hipótese de causalidade
(Tabela 5).
Tabela 5 - Atividade ocupacional segundo nível de atividade muscular e
mortalidade por câncer, 1922*
Nível de atividade muscular Número de
pessoas
Número de
Mortes
Taxa
mortalidade**
Risco
relativo
Atividade muscular alta 46 736 20,0 43,0 1
Atividade muscular moderada 168 460 128,0 75,8 1,7
Atividade muscular média 84 523 77,0 91,1 2,1
Atividade muscular baixa 211 824 213,9 100,8 2,3
Atividade ocupacional sazonal 170 483 267,7 156,6 3,6
Sem atividade profissional
remunerada
64 503 330,0 510,0 11,8
* Adaptado de Sivertsen e Dahlstrom. The relation of muscular activity to carcinoma. A preliminary
report. J Cancer Res. 1922;6,365-78; ** Por 100.000 homens
Após a publicação dos estudos pioneiros de Cherry, Sivertsen e Dahlstrom, o
tema atividade física e câncer praticamente desaparece do cenário científico
internacional. Somente na década 1980, o tema volta a chamar a atenção de
pesquisadores que, a partir de então, produzem grande quantidade de estudos
epidemiológicos (Lee; Oguma, 2006).
Atualmente, devido ao grande volume de estudos publicados, os grupos
consultivos da IARC e da World Cancer Research Fund International (WCRF) avaliam
periodicamente a consistência da evidência sobre as possíveis causas do câncer,
incluindo o possível efeito protetor da atividade física em câncer. Em 2002, a IARC
publicou o primeiro relatório voltado especificamente à avaliação da evidência de
estudos epidemiológicos e experimentais sobre peso corporal, atividade física e câncer.
Nesse relatório, a IARC concluiu que há evidência suficiente em humanos sobre o efeito
protetor da atividade física na redução do risco de câncer de mama pós-menopausa e o
câncer de cólon, além de evidência limitada para o câncer de endométrio e o câncer de

24
próstata. Essas associações poderiam ocorrer independentemente da redução do peso
corporal/adiposidade. Para os demais tipos de câncer, no entanto, a evidência foi
considerada insuficiente/inadequada para assumir causalidade (IARC, 2002).
A WCRF (2018), de modo semelhante, em seu último projeto de atualização da
avaliação da evidência, concluiu que existe evidência consistente de que atividade física
está associada com diminuição do risco de câncer de cólon, e evidência provável para
redução do risco de câncer de mama pós-menopausa e câncer de endométrio. Ainda, há
evidência limitada/sugestiva para associação entre atividade física e redução do risco de
câncer de esôfago, fígado, pulmão e mama pré-menopausa.
Além desses documentos, estudos independentes, incluindo diversas revisões
sistemáticas, apontaram uma possível relação entre a atividade física e a diminuição do
risco de diversos tipos de câncer: próstata, rim, bexiga, estômago/gástrico, esôfago,
ovário, endométrio, glioma, meningioma, pâncreas, pulmão, cólon e reto, mama,
leucemias e linfomas (Liu et al., 2011; Behrens et al., 2013; 2014; 2015; Keimling et al.,
2014; Zhong et al., 2014; Schmid et al., 2015; Niedermaier et al., 2015; Brenner et al.,
2016). Caso essas associações sejam causais, o aumento da atividade física na
população pode contribuir substancialmente com a diminuição da carga do câncer. Por
outro lado, há pelo menos 5 explicações alternativas à causalidade para que estudos
epidemiológicos observacionais reportem essas associações: (1) câncer causa
inatividade física; (2) chance; (3) viés de seleção; (4) viés de informação; (5)
confundimento (Rothman et al., 2008).
Portanto, para melhor interpretação da evidência epidemiológica em atividade
física e câncer é oportuno compreender, entre outros aspectos: (1) Por quais
mecanismos biológicos a atividade física poderia reduzir o risco desses tipos de câncer?
(2) Quais vieses poderiam explicar as associações observadas entre atividade física e
esses tipos de câncer?
1.4.1. Mecanismos biológicos entre atividade física e câncer
A redução da adiposidade é um mecanismo central do possível efeito da
atividade física na prevenção de câncer (Figure 4) (Giovannucci, 2018a; 2018b). Ambas
IARC e WCRF concluem que há evidências consistentes na literatura mostrando que o
excesso de peso e a obesidade estão associados com aumento do risco de diversos tipos

25
de câncer: estômago, pâncreas, vesícula biliar, fígado, colorretal, mama pós-menopausa,
ovário, endométrio, próstata (estádio avançado apenas), rim, tireoide, mieloma múltiplo
e adenocarcinoma de esôfago (Lauby-Secretan et al., 2016; WCRF, 2018). Os principais
mecanismos biológicos pelos quais a redução da adiposidade poderia prevenir o risco
desses tipos de câncer são: 1) redução de fatores pró-inflamatórios; 2) alteração de
adipocitocinas; 3) redução de insulina e fatores de crescimento semelhantes à insulina
(insulin-like growth fator, IGF); 4) redução de hormônios sexuais; 5) e melhora da
função imune (McTiernan et al., 2008; Renehan et al., 2015). Vale ressaltar que, embora
a atividade física possa auxiliar na manutenção do peso (Donnelly et al., 2009), ensaios
clínicos randomizados de longa duração têm mostrado que 150 a 250 minutos de
atividades aeróbicas por semana produzem apenas reduções modestas de peso corporal
(Thorogood et al., 2011). Apenas treinamento aeróbico e de força muscular
combinados, acompanhado de alimentação saudável, têm se mostrado efetivos na perda
de peso e melhora da composição corporal (aumento da massa magra e redução da
adiposidade) (Miller et al., 2013; Romieu et al., 2017). No entanto, exercício físico pode
reduzir a gordura visceral, um forte preditor de doenças crônicas não transmissíveis e
mortalidade, independentemente da mudança no índice de massa corporal (IMC)/peso
corporal (Verheggen et al., 2016).
Figura 4 - Mecanismos biológicos para a associação entre atividade física e risco de
câncer

26
A inflamação tem se mostrado um importante fator pelo qual células normais
adquirem as características marcantes (Hallmarks of cancer) de fenótipos malignos. A
inflamação está envolvida na iniciação e/ou promoção de fenótipos malignos de células
por meio da bioativação de moléculas no microambiente tumoral responsáveis pela
proliferação celular, apoptose celular, angiogênese, invasão e metástase (Hanahan;
Weingberg, 2011). Com efeito, estudos epidemiológicos têm encontrado associação
entre níveis elevados de fatores pró-inflamatórios - proteína C-reativa, interleucina 6
(IL-6), fator de necrose tumoral alpha (TNF-α)) - e o aumento no risco de câncer. A
atividade física, por sua vez, quando praticada de forma regular, está associada com
redução dos níveis sistêmicos desses fatores pró-inflamatórios, direta e indiretamente
pela redução da adiposidade (McTiernan et al., 2008).
O eixo insulina/IGF é outro importante mecanismo biológico pelo qual a
atividade física poderia prevenir o risco de diversos tipos de câncer. Células tumorais
expressam receptores de insulina e IGF-1, que por sua vez estão associados com
múltiplas vias de sinalização intracelular. Uma vez ativadas, essas vias podem estimular
a proliferação celular, inibição da apoptose, invasão e metástase (Giovannucci et al.,
2001; 2010). Por exemplo, insulina e IGF sinalizam vias de sinalização celulares como
PI3K-AKT, MAPK e MYC, responsáveis pela absorção de nutrientes que auxiliam a
proliferação celular (Koelwyn et al., 2017). Além disso, a hiperinsulinemia está
associada ao aumento da disponibilidade biológica de hormônios sexuais relacionados
ao aumento do risco de alguns tipos de câncer (McTiernan et al., 2008; Giovannucci et
al., 2001; 2010). Ambas American Diabetes Association e American Cancer Society
sugerem que há evidências consistentes sobre a associação entre diabetes tipo 2 e
aumento do risco de câncer de mama, cólon, endométrio, bexiga, fígado, pâncreas e
próstata (Giovannucci et al., 2010). A atividade física, por sua vez, está fortemente
associada à redução da resistência à insulina e do risco de diabetes tipo 2 (Smith et al.,
2016).
Níveis elevados de hormônios sexuais estão associados a um aumento no risco
de alguns tipos de câncer (McTiernan et al., 2008). Estudos com mulheres atletas
sugerem que a atividade física pode influenciar no atraso da idade da menarca,
amenorreia e baixos níveis de progesterona e estrogênio. No entanto, o efeito da
atividade física no milieu hormonal de mulheres pré-menopausadas não tem sido
consistentemente reproduzido por ensaios clínicos randomizados (McTiernan et al.,

27
2008). De fato, estudos epidemiológicos sobre atividade física em mulheres pré-
menopausadas e risco de câncer de mama e endométrio não tem apresentado resultados
consistentes na literatura (IARC, 2012; WCRF, 2018). Por outro lado, atividade física
pós-menopausa está associada a uma menor concentração de hormônios sexuais. No
período após a menopausa, a principal fonte de estrogênio é oriunda do tecido adiposo.
Ensaios clínicos randomizados têm mostrado que mulheres pós-menopausadas
envolvidas em atividades físicas de intensidade moderada à vigorosa apresentam
redução nos níveis de hormônios sexuais após um ano de intervenção. Esse efeito foi
observado principalmente em mulheres que tiveram redução no percentual de gordura,
reforçando a hipótese de que a redução da adiposidade é um mecanismo central do
possível efeito da atividade física na prevenção de câncer (McTiernan et al., 2008;
Giovannucci et al., 2018a; 2018b).
Outro possível efeito da atividade física na prevenção do câncer seria mediado
pela melhora da função imune. A atividade física aumentaria em número e função
células do sistema imune que, por sua vez, teriam uma função supressora de tumor,
reconhecendo e eliminando células com fenótipos malignos. No momento, resultados de
ensaios clínicos randomizados sobre esse mecanismo ainda são inconclusivos
(McTiernan, 2008; Koelwyn et al., 2017).
1.4.2. Vieses em estudos epidemiológicos sobre atividade física e câncer
As evidências epidemiológicas sobre a relação entre atividade física e câncer são
eminentemente oriundas de estudos observacionais. Conforme abordado anteriormente,
a falta de validade da evidência de estudos epidemiológicos observacionais pode
emergir de vieses e confundimento. A teoria de diagramas causais ou gráficos acíclicos
direcionados (directed acyclic graphs – DAGs) é uma ferramenta útil para apresentação
e análise das possíveis fontes de viés e incerteza nos resultados de estudos
epidemiológicos. Os DAGs são representações gráficas, hipotéticas e qualitativas sobre
os processos causais que, em última instância, dão origem aos dados e às associações
observadas nos estudos. Esses diagramas são construídos a partir do conhecimento
prévio das relações sobre as variáveis e, portanto, são importantes para a formalização
das hipóteses e pressupostos sobre os quais associações observadas nos dados referem-
se a causalidade e/ou vieses. Diversos artigos metodológicos e capítulos de livro têm

28
abordado a teoria dos DAGs detalhadamente (Greenland et al., 1999; Hernán et al.,
2004; Glymour; Greenland, 2008; Cortes et al., 2016). Apresento abaixo algumas
noções básicas necessárias para o entendimento de DAGs, com o objetivo de
exemplificar situações em que associações entre atividade física e câncer poderiam ser
atribuíveis, parcial ou inteiramente, a vieses.
Os DAGs são gráficos compostos por variáveis (vértices), medidas ou não pelo
estudo, e setas que denotam relações entre variáveis. A seta representa um efeito causal
direto (direct causal effect) entre duas variáveis, denominadas em teorias dos gráficos
de variáveis ancestral/pai e descendente/filha. O caminho entre variáveis é representado
por um conjunto de setas, usualmente, mas não necessariamente, apresentado de
maneira temporal, da esquerda (passado) para a direita (futuro). O caminho entre
variáveis é indireto quando há uma variável intermediária, também chamada de
mediadora, entre a variável ancestral e a descendente. Na Figura 4, por exemplo, o
caminho atividade física → adiposidade → câncer é indireto, uma vez que a variável
adiposidade (mediadora) está entre as variáveis atividade física e câncer. Quando, num
mesmo caminho causal, uma variável recebe duas ou mais setas de variáveis ancestrais,
essa recebe o nome de colisora (collider). A ausência de setas entre variáveis implica
em conhecimento prévio suficiente sobre ausência de causalidade e, consequentemente,
pressuposto de independência entre variáveis no modelo estatístico (Greenland et al.,
1999; Hernán et al., 2004; Glymour; Greenland, 2008; Cortes et al., 2016).
Além de estruturas causais, os DAGs são representações de associações
estatísticas entre variáveis, que serão observadas quando uma ou mais das seguintes
“estruturas causais” estiverem presentes (Hernán et al., 2004):
a) Causa e efeito: se a exposição causa o desfecho, ou vice e versa, essas
variáveis estarão estatisticamente associadas (Figura 5a).
b) Causas comuns: se exposição (E) e desfecho (D) compartilharem uma causa
comum (L), esses estarão estatisticamente associados mesmo que não haja uma
estrutura de causa e efeito entre E e D (Figura 5b).
c) Efeitos comuns: Se exposição (E) e desfecho (D) exercerem um efeito comum
numa terceira variável (C), esses estarão estatisticamente associados quando a
análise for computada segundo estratos da variável C ou de uma variável
descendente de C (Figura 5c).

29
Figura 5 – Associação estatística entre exposição e desfecho produzidas por 3
estruturas causais: (a) causa e efeito; (b) causas comuns; (c) efeitos comuns
Chance é outra fonte de associações estatísticas encontradas em estudos
epidemiológicos. No entanto, conforme descrito anteriormente, o erro aleatório é
reduzido na medida em que aumenta o tamanho da amostra e, nesse cenário, erros
sistemáticos tornam-se a principal fonte de associações espúrias. Assumindo tamanho
de amostra infinito (erro padrão = 0) e variáveis do estudo mensuradas perfeitamente
(não há viés de informação), associação ≠ causação se um ou mais os seguintes vieses
estiverem presentes no estudo (Hernán et al., 2004):
1) Causalidade reversa: se o desfecho (D) causar a exposição (E), ao invés do
contrário, esses estarão associados e haverá viés na medida de associação
entre exposição e desfecho.
2) Causas comuns: se exposição (E) e desfecho (D) compartilharem uma causa
comum (L), e a análise não for computada segundo estratos da variável L,
haverá viés na medida de associação. Em epidemiologia, esse viés na medida
de associação é chamado de confundimento.
3) Condicionamento por efeitos comuns: Se a exposição (E) e desfecho (D)
exercerem um efeito comum numa terceira variável (C), e a análise for
computada segundo estratos de C ou de uma variável descendente de C,
haverá viés na medida de associação. Em epidemiologia, esse viés é
chamado de viés de seleção ou estratificação por variável colisora (Collider
stratification bias).
Apresento abaixo exemplos em que a associação entre atividade física e câncer
pode ser devida à causalidade reversa, causas comuns (confundimento) e
condicionamento por efeitos comuns (viés de seleção).

30
Causalidade reversa em atividade física e câncer
Câncer é uma doença de longo período de latência, tempo que corresponde à
exposição a causa suficiente (acumulo de causas componentes) e a manifestação da
doença (Rothman, 1976). Durante esse período, condições pré-clínicas podem causar
mudanças no estado nutricional e hábitos alimentares, entre outros fatores, antes do
diagnóstico da doença. Por exemplo, a perda de peso não intencional antes do
diagnóstico de alguns tipos de câncer está bem documentada na literatura. Estudos
observacionais sobre obesidade e câncer têm reportado um aparente paradoxo nas
associações observadas, uma vez que indivíduos com menor IMC apresentam maior
risco de câncer comparados aos indivíduos com alto IMC (“paradoxo da obesidade”).
No entanto, esse resultado se dá pelo fato de que o grupo de referência (baixo IMC)
inclui, de maneira desproporcional, indivíduos com perda de peso não intencional
causada pelo câncer - essa perda de peso pode ocorrer até 16 anos antes do diagnóstico
do câncer (Yu et al., 2017). Consequentemente, a causalidade reversa tende a distorcer a
medida de associação do estudo - IMC alto associado (de maneira espúria) com
diminuição do risco de câncer (Park et al., 2018).
Estudos epidemiológicos sobre atividade física e câncer também estão sujeitos à
causalidade reversa, no entanto, o impacto do viés na medida de associação tende a ser
mais sutil. É plausível que durante o período pré-clínico do câncer, ocorra, por exemplo,
aumento de fadiga e diminuição do nível de atividade física causados pela doença
(Figura 6) (Bower, 2014).
Figura 6 - Causalidade reversa e a associação entre atividade física e câncer
Esse viés tenderá a superestimar a magnitude de associação entre atividade física
e diminuição no risco de câncer. Nesse caso, ao contrário do paradoxo da obesidade, o
grupo de referência incluirá, de maneira desproporcional, pessoas com baixo nível de
atividade física causado pelo câncer. Consequentemente, a magnitude da associação
encontrada no estudo será maior do que o (real) efeito causal. Estudos de coorte com
curto período de seguimento e com apenas uma medida de atividade física ao longo do

31
tempo, estão mais sujeitos a esse tipo de viés. Em estudos caso-controle, a causalidade
reversa tende a se “manifestar” na forma de viés de informação, especificamente, erro
de classificação diferencial. Devido ao diagnóstico do câncer, casos tendem a reportar
menor nível de atividade física do que controles nos anos anteriores ao diagnóstico da
doença (recall bias). Não obstante, parte do efeito da diminuição do nível de atividade
física no grupo de casos foi causado pelo próprio câncer.
Causas comuns da atividade física e câncer
Confundimento é uma preocupação importante em estudos sobre atividade física
e câncer, de modo que ajustar pelas causas comuns da exposição e desfecho é condição
sine qua non para estimar efeitos causais. Por exemplo, para estimar o efeito da
atividade física no risco de câncer de pulmão é necessário computar a associação
ajustada do tabagismo, uma vez que fumantes (1) tendem a praticar menos atividade
física por diminuição da capacidade respiratória (Brenner et al., 2016); (2) e têm maior
risco de câncer de pulmão (Carter et al., 2015), comparado aos indivíduos que nunca
fumaram (Figura 7).
Figura 7 - Confundimento por tabagismo na associação entre atividade física e
câncer
Assumindo que não há outras fontes de viés, seria possível estimar o efeito
causal da atividade física no câncer de pulmão computando a associação ajustada por
tabagismo. O problema é que, na maioria das vezes, o pressuposto de ausência de outros
vieses é irrealista. Viés de informação é ubíquo em estudos epidemiológicos (o impacto
desse viés é descrito mais à frente). Portanto, mesmo após ajuste, a estimativa de
associação entre atividade física e câncer de pulmão pode estar enviesada devido à
confundimento residual por tabagismo. De fato, estudos epidemiológicos que
analisaram a associação entre atividade física e risco de câncer de pulmão em
indivíduos que nunca fumaram - análise menos sujeita a viés de informação e

32
confundimento residual por tabagismo - encontraram associação nula (Moore et al.,
2016). Esse resultado sugere fortemente que a estrutura causal que produziu a
associação observada entre atividade física e câncer de pulmão foi a presença de uma
causa comum (Figura 5b), ao invés de existência de uma relação de causa e efeito
(Figura 5a). Esse DAG foi simplificado a título de exemplo, de modo que uma miríade
de outras causas comuns não observadas/conhecidas poderia enviesar a associação entre
atividade física no risco de câncer de pulmão. O problema é ainda mais complexo, posto
que as causas comuns tendem a diferir por tipos de atividade física (atividade física no
lazer v.s. atividade física no trabalho) e de câncer (câncer de pulmão v.s. câncer de
cólon). Portanto, uma análise detalhada das causas comuns da atividade física e dos
diversos tipos de câncer é desejável para obtenção de estimativas de associação corretas
(não enviesada).
Condicionamento por efeitos comuns da atividade física e do câncer
Viés de seleção é uma distorção das associações observadas em estudos
epidemiológicos decorrente dos procedimentos utilizados na seleção, bem como de
fatores que influenciam a participação/retenção, e, em última instância, na análise dos
dados dos participantes do estudo. São exemplos de viés de seleção a seleção
inapropriada de controles em um estudo caso-controle, perda de seguimento diferencial
em estudos de coorte, viés do voluntário (volunteer bias) e viés do trabalhador saudável
(healthy worker bias) (Hernán et al., 2004; Rothman et al., 2008). Em diagramas
causais, esses tipos de viés de seleção podem ser sintetizados mediante a definição de
“condicionamento por efeitos comuns”, descrita anteriormente.
Na Figura 8 apresento exemplo hipotético de estudo caso-controle de base
hospitalar sobre o efeito putativo da atividade física de transporte no risco de câncer de
ovário. Em estudos caso-controle, idealmente, a seleção dos controles deve cumprir os
seguintes critérios: (1) os controles devem ser selecionados da mesma população que
deu origem aos casos e (2) segundo estratos das variáveis que serão utilizadas para
estratificação na análise, os controles devem ser selecionados independentemente do
status da exposição, de modo que o processo de amostragem dos controles não varie
com a exposição (Rothman et al., 2008). Quando isso não ocorre, a seleção inadequada
de controles pode produzir estimativas incorretas do efeito da atividade física no câncer,

33
mesmo em contextos em que o efeito causal é nulo (selection bias under the null)
(Hernán et al., 2004).
Figura 8 - Viés de seleção devido a seleção inadequada de controles em estudo
caso-controle sobre atividade física e risco de câncer de ovário
Nesse exemplo, assume-se que o efeito da atividade física de transporte no
câncer de ovário é nulo – não há seta entre atividade física e câncer de ovário. A seta
entre as variáveis câncer de ovário e seleção indicam que casos tem maior probabilidade
de serem selecionados para o estudo do que controles, característica inerente ao desenho
caso-controle. Casos de câncer de ovário foram selecionados do Instituto do Câncer do
Estado de São Paulo e controles do Instituto de Traumatologia e Ortopedia do Hospital
das Clínicas da Faculdade de Medicina da Universidade de São Paulo.
Consequentemente, a fratura óssea é mais frequente em controles do que em casos,
representado na Figura 8 pela seta entre fratura óssea e seleção. O retângulo ao redor da
variável seleção significa que a associação entre atividade física de transporte e câncer
de ovário foi computada apenas em participantes selecionados para o estudo
(condicionada à seleção para o estudo). Por fim, há uma seta indicando que atividade
física de transporte aumenta o risco de fratura óssea em decorrência de acidentes de
trânsito. Nesse exemplo, o condicionamento por um efeito comum da atividade física de
transporte e do câncer de ovário - seleção dos participantes do estudo - produzirá uma
estimativa de efeito causal enviesada. Em outras palavras, devido ao processo de
seleção dos participantes do estudo, controles têm maior probabilidade de fratura óssea
do que os casos. Uma vez que a atividade física de transporte está associada com
aumento no risco de fratura óssea, controles apresentam, em média, maior nível de
atividade física de transporte do que os casos. Nesse exemplo, a associação inversa
entre atividade física de transporte e câncer de ovário diferirá do real efeito causal
(nulo).

34
Viés de informação em estudos de atividade física e câncer
Viés de informação é ubíquo em estudos epidemiológicos. Esse viés ocorre
quando há erro na mensuração das variáveis de interesse do estudo (Rothman et al.,
2008). No contexto de estudos epidemiológicos que visam investigar relações de causa
e efeito, assumindo ausência de confundimento e viés de seleção, há viés de informação
quando a associação entre exposição e desfecho, mensurados no estudo com erro, diferir
do verdadeiro efeito da real exposição no real desfecho (Hernán; Cole, 2009). Esse viés
não foi apresentado anteriormente porque não há uma única “estrutura causal” (Figura
5) capaz de representar o viés de informação. Isso porque viés de informação decorre da
presença de erro de classificação da exposição e do desfecho, e há quatro formas
(definições) distintas de erro de classificação: (1) não diferencial e independente, (2)
não diferencial e dependente, (3) diferencial e independente, e (4) diferencial e
dependente (Rothman et al., 2008; Hernán; Cole, 2009). Detalhes metodológicos sobre
diagramas causais e viés de informação foram descritos em outras publicações (Hernán;
Cole, 2009; VanderWeele; Hernán, 2012). Abaixo apresento uma breve definição de
atividade física e métodos de mensuração. Em seguida, apresento exemplos de viés de
informação em estudos sobre atividade física e câncer. Por simplicidade, considerarei
apenas a definição de erro de classificação diferencial e não diferencial, assumindo que
os erros de mensuração da exposição e do desfecho são independentes (não
correlacionados).
Medir a atividade física em populações é uma tarefa particularmente difícil, em
que erros de mensuração são inevitáveis. O desafio se inicia pela definição do construto
atividade física. Classicamente, atividade física é definida por movimento corporal
realizado pelo músculo esquelético que aumenta o gasto energético acima dos níveis de
repouso (Caspersen et al., 1985). O volume ou quantidade dessas atividades pode ser
caracterizado por três componentes: frequência (número de seções – ex: dias/semana),
duração (tempo) e intensidade (gasto energético por unidade de tempo). A intensidade é
frequentemente expressa em equivalentes metabólicos (metabolic equivalente of tasks –
MET), que corresponde à razão do consumo de oxigênio da atividade física pelo
consumo de oxigênio em repouso (3,5 ml/quilo/min = 1 MET). Dessa maneira, as
atividades são classificadas com intensidade leve (1,6 a 2,9 MET), moderada (3,0 a 5,9
MET) e vigorosa (≥6 MET). Além dos componentes descritos acima, usualmente
utiliza-se 4 categorias/domínios de atividades físicas para descrever o contexto em que

35
estas ocorrem: lazer, transporte, ocupacionais e domésticas (Leitzmann et al., 2015).
Vale ressaltar, no entanto, que essa definição de atividade física baseada em gasto
energético é bastante restrita, e utilizada apenas como um indicador desse
comportamento multidimensional e complexo, composto por múltiplas facetas
(motivações, significados, padrões, etc.) (Silva et al., 2017).
Para medir a atividade física na população, dois métodos principais para coleta
de dados têm sido utilizados: métodos subjetivos e métodos objetivos. Dentre os
métodos subjetivos destacam-se os questionários de atividade física, como, por
exemplo, o International Physical Activity Questionnaire (IPAQ) e Global Physical
Activity Questionnnaire (GAP), além dos recordatórios e diários de atividades
realizadas no passado (na última semana, mês ou ano). Pedômetros, acelerômetros e
métodos de mensuração do gasto energético (água duplamente marcada) são exemplos
de métodos objetivos para mensuração da atividade física. Métodos objetivos permitem
medir a atividade física em condições do dia a dia (free-living), além de apresentarem
melhor acurácia do que métodos subjetivos. No entanto, esses métodos são raramente
utilizados em estudos epidemiológicos dado o alto custo e difícil logística para
utilização dessas ferramentas (Leitzmann et al., 2015).
Métodos subjetivos são mais frequentemente utilizados em estudos
epidemiológicos sobre a atividade física e câncer. Em estudos de coorte, em que a
atividade física é medida por questionário décadas antes da ocorrência do câncer, é
plausível assumir que o erro de classificação não diferencial da atividade física seja
mais frequente do que o erro de classificação diferencial (Figura 9). Este tipo de viés de
informação é particularmente relevante pois, ao contrário dos demais tipos descritos
anteriormente, a direção do viés na estimativa de efeito frequentemente tenderá à
nulidade. Ainda, este tipo de viés não produz associação espúria quando o verdadeiro
efeito causal sob investigação é nulo (Hernán; Cole, 2009; VanderWeele; Hernán,
2012). Consequentemente, o impacto do viés de informação nos resultados obtidos em
estudos de coorte tenderá a subestimar o efeito da atividade física nos diferentes tipos de
câncer.

36
Figura 9 - Erro de classificação não diferencial em estudo de coorte sobre a relação
entre atividade física e câncer
Em estudos caso-controle, em que casos e controles reportam de maneira
retrospectiva a presença/ocorrência da exposição no passado, o erro de classificação da
atividade física pode ser diferencial (Figura 10) (Rothman et al., 2008). Isso porque o
erro na classificação da atividade física pode ser dependente do status da doença, de
modo que a sensibilidade e a especificidade da classificação da exposição são diferentes
entre casos e controles. O erro de classificação diferencial pode distorcer a associação
tanto em direção quanto ao contrário da nulidade (Rothman et al., 2008). Por exemplo,
se casos de câncer de cólon reportarem menor nível de atividade física do que controles,
justamente por terem a doença - possivelmente por terem pesquisado as causas do
câncer de cólon após receberem o diagnóstico da doença - a associação entre atividade
física e câncer de cólon será superestimada em relação ao real efeito causal. Dessa
maneira, o impacto do viés de informação em estudos caso-controle pode superestimar
o real efeito da atividade física nos diferentes tipos de câncer. Além disso, espera-se
maior heterogeneidade nas associações entre estudo caso-controle, uma vez que a
direção do viés (difícil de prever) resultará de uma relação complexa entre
sensibilidade, especificidade e prevalência da exposição nas diferentes populações
estudadas (Szklo; Nieto, 2014a).
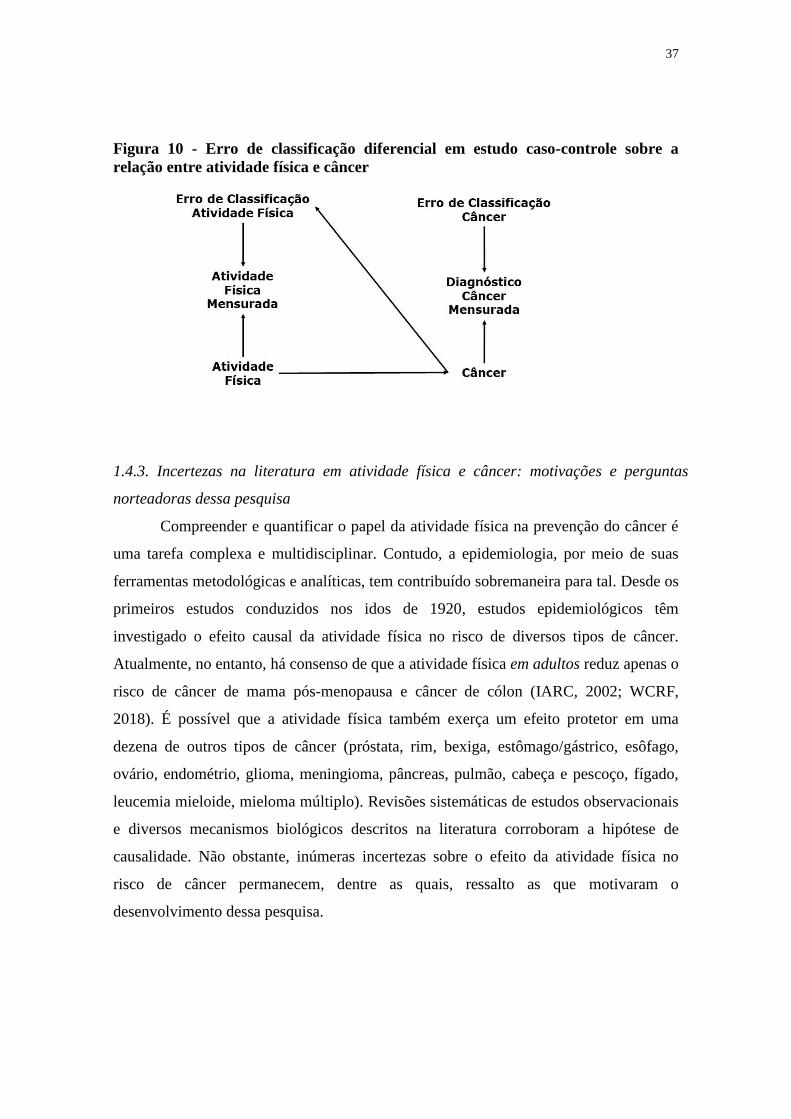
37
Figura 10 - Erro de classificação diferencial em estudo caso-controle sobre a
relação entre atividade física e câncer
1.4.3. Incertezas na literatura em atividade física e câncer: motivações e perguntas
norteadoras dessa pesquisa
Compreender e quantificar o papel da atividade física na prevenção do câncer é
uma tarefa complexa e multidisciplinar. Contudo, a epidemiologia, por meio de suas
ferramentas metodológicas e analíticas, tem contribuído sobremaneira para tal. Desde os
primeiros estudos conduzidos nos idos de 1920, estudos epidemiológicos têm
investigado o efeito causal da atividade física no risco de diversos tipos de câncer.
Atualmente, no entanto, há consenso de que a atividade física em adultos reduz apenas o
risco de câncer de mama pós-menopausa e câncer de cólon (IARC, 2002; WCRF,
2018). É possível que a atividade física também exerça um efeito protetor em uma
dezena de outros tipos de câncer (próstata, rim, bexiga, estômago/gástrico, esôfago,
ovário, endométrio, glioma, meningioma, pâncreas, pulmão, cabeça e pescoço, fígado,
leucemia mieloide, mieloma múltiplo). Revisões sistemáticas de estudos observacionais
e diversos mecanismos biológicos descritos na literatura corroboram a hipótese de
causalidade. Não obstante, inúmeras incertezas sobre o efeito da atividade física no
risco de câncer permanecem, dentre as quais, ressalto as que motivaram o
desenvolvimento dessa pesquisa.

38
1) Vieses na literatura favorecem a publicação de “resultados positivos” sobre o efeito
da atividade física nos diferentes tipos de câncer?
Vieses podem afetar a validade e credibilidade dos resultados de estudos
epidemiológicos. Numa perspectiva teórica, descrevi anteriormente que vieses e
confundimento poderiam afetar a validade dos estudos epidemiológicos sobre atividade
física e câncer. É incerto, no entanto, em que medida há viés na literatura decorrente do
favorecimento da publicação de estudos com resultados estatisticamente significantes
e/ou efeitos superestimados da atividade física no risco de câncer. Quantificar a
magnitude desses vieses é importante para avaliar a validade e credibilidade do conjunto
de evidência disponível na literatura.
2) Atividade física na adolescência está associada com redução no risco de câncer
colorretal na fase adulta?
Considerando o longo período de latência do câncer, é plausível que exposições
no início da vida modifiquem o risco de câncer na população. No entanto, atualmente,
por motivos metodológicos, financeiros e logísticos, a maioria dos estudos
epidemiológicos sobre atividade física e câncer utilizou dados de adultos de meia idade
e idosos (Moore et al., 2016). É possível, por exemplo, que a atividade física durante a
adolescência reduza o risco de câncer de cólon, uma vez que há evidência consistente
dessa relação em adultos (IARC, 2002; WCRF, 2018). No entanto, extrapolar
associações entre exposições em adultos e risco de câncer para populações mais jovens
não é apropriado, uma vez que a fisiologia humana modifica substancialmente ao longo
da vida (IOM, 2000). Compreender o papel da atividade física nos diferentes estágios da
vida na redução do risco de câncer pode fornecer elementos importantes para
formulação de intervenções e políticas públicas para prevenção de câncer.
3) Qual a influência do volume, tipo, e intensidade da atividade física para redução de
marcadores biológicos relacionados ao risco de câncer? A associações entre atividade
física e marcadores biológicos relacionados ao risco de câncer diferem segundo
padrão de alimentação e adiposidade dos indivíduos?
A atividade física está associada com redução de biomarcadores metabólicos e
endócrinos envolvidos na carcinogênese. Há evidência consistente na literatura,
inclusive de ensaios clínicos randomizados, sobre o papel da atividade física na redução

39
de fatores pró-inflamatórios e de resposta à insulina (Giovannucci, 2018a; WCRF,
2018). Entretanto, é desconhecida a importância de componentes específicos da
atividade física (volume, tipo e intensidade), bem como a presença de interações entre
atividade física, alimentação e adiposidade nos biomarcadores relacionados ao risco de
câncer. Compreender essas nuances é importante para implementação de intervenções
efetivas de atividade física em indivíduos e populações.
4) Quantos casos e mortes por câncer poderiam ser evitados no Brasil mediante o
aumento da atividade física na população? Qual a magnitude dessa prevenção vis-à-vis
a redução de outros fatores de risco relacionados ao estilo de vida?
Atualmente, há evidência consistente de que a atividade física reduz o risco de
câncer de mama pós-menopausa e cólon, além de informação detalhada do formato da
curva dose-resposta oriunda de dezenas de estudos de coorte (IARC, 2002; Kyu et al.,
2016; WCRF, 2018). Estimar a preventabilidade de câncer mediante o aumento da
atividade física na população pode fornecer informações úteis para planejamento de
ações de promoção da atividade física para prevenção de câncer no Brasil. Outrossim,
comparar a magnitude dessa preventabilidade de câncer vis-à-vis a redução de outros
fatores de risco relacionados ao estilo de vida é importante para planejamento e
priorização de ações e recursos para prevenção de câncer no país.
1.5. REFERÊNCIAS
American Cancer Society (ACS). Family Cancer Syndromes [online]; 2014. [citado 1
ago. 2016]. Disponível em:
http://www.cancer.org/cancer/cancercauses/geneticsandcancer/heredity-and-cancer.
Azevedo e Silva G, de Moura L, Curando MP, Gomes FS, Rezende LFM, Daumas,
Guimarães RM, Meira KC, Leite IC, Valente JG, Moreira RI, Koifman R, Malta DC,
Mello MS, Guedes TW, Boffetta P. The Fraction of Cancer Attributable to Ways of
Life, Infections, Occupation, and Environmental Agents in Brazil in 2020. PLoS One.
2016;11:e0148761.
Behrens G, Leitzmann MF. The association between physical activity and renal cancer:
systematic review and meta-analysis. Br J Cancer. 2013;108:798–811.
Behrens G, Jochem C, Keimling M, Ricci C, Schmid D, Leitzmann MF. The association
between physical activity and gastroesophageal cancer: systematic review and meta-
analysis. Eur J Epidemiol. 2014;29:151-70.

40
Behrens G, Jochem C, Schmid D, Keimling M, Ricci C, Leitzmann MF. Physical
activity and risk of pancreatic cancer: a systematic review and meta-analysis. Eur J
Epidemiol. 2015;30:279-98.
Boffetta P, McLaughlin JK, La Vecchia C, Tarone RE, Lipworth L, Blot WJ. False-
positive results in cancer epidemiology: a plea for epistemological modesty. J Natl
Cancer Inst. 2008;100:988-95.
Boffetta P, Tubiana M, Hill C, Boniol M, Aurengo A, Masse R, Valleron AJ, Monier R,
de Thé G, Boyle P, Autier P. The causes of cancer in France. Ann Oncol. 2009;20:550-
5.
Bower JE. Cancer-related fatigue--mechanisms, risk factors, and treatments. Nat Rev
Clin Oncol. 2014;11:597-609.
Bray F, Moller B. Predicting the future burden of cancer. Nat Rev Cancer. 2006;6:63-
74.
Bray F, Ferlay J, Soerjomataram I, Siegel RL, Torre LA, Jemal A.. Global Cancer
Statistics 2018: GLOBOCAN Estimates of Incidence and Mortality Worldwide for 36
Cancers in 185 Countries. CA Cancer J Clin. 2018;68:394-424.
Brenner DR, Yannitsos DH, Farris MS, Johansson M, Friedenreich CM. Leisure-time
physical activity and lung cancer risk: A systematic review and meta-analysis. Lung
Cancer. 2016;95:17-27.
Brown KF, Rumgay H, Dunlop C, Ryan M, Quartly F, Cox A, Deas A, Elliss-Brookes
L, Gavin A, Hounsome L, Huws D, Ormiston-Smith N, Shelton J, White C, Parkin DM.
The fraction of cancer attributable to modifiable risk factors in England, Wales,
Scotland, Northern Ireland, and the United Kingdom in 2015. Br J Cancer. 2018;118:
1130-41.
Carter BD, Abnet CC, Feskanich D, Freedman ND, Hartge P, Lewis CE, Ockene JK,
Prentice RL, Speizer FE, Thun MJ, Jacobs EJ. Smoking and mortality—beyond
established causes. N Engl J Med. 2015;372:631-40.
Caspersen CJ, Powell KE, Christenson GM. Physical activity, exercise, and physical
fitness: definitions and distinctions for health-related research. Public Health Rep.
1985;100:126-31.
Cavenee WK, Dryja TP, Phillips RA, Benedict WF, Godbout R, Gallie BL, Murphree
AL, Strong LC, White RL. Expression of recessive alleles by chromosomal mechanisms
in retinoblastoma. Nature. 1983;305:779-84.
Cherry TA. A theory of cancer. Med J Aust. 1922;1:425-38
Cortes TR, Faerstein E, Struchiner CJ. Utilização de diagramas causais em
epidemiologia: um exemplo de aplicação em situação de confusão. Cad Saude Publica.
2016;32:e00103115.
Davey Smith DG, Relton CL, Brennan P. Chance, choice and cause in cancer aetiology:
individual and population perspectives. Int J Epidemiol. 2016;45:605-13.
Dickersin K. The existence of publication bias and risk factors for its occurrence.
JAMA. 1990;263:1385-89.

41
Dishman RK, Heath GW, Lee IM. Origins of Physical Activity Epidemiology. In:
Dishman RK, Heath GW, Lee IM. Physical Activity Epidemiology. 2nd ed. Champaign:
Human Kinetics; 2013. p.25-38
Doll R, Peto R. The causes of cancer: quantitative estimates of avoidable risks of cancer
in the United States today. J Natl Cancer Inst. 1981;66:1191-308.
Donnelly JE, Blair SN, Jakicic JM, Manore MM, Rankin JW, Smith BK; American
College of Sports Medicine. American College of Sports Medicine Position Stand.
Appropriate physical activity intervention strategies for weight loss and prevention of
weight regain for adults. Med Sci Sports Exerc. 2009;41:459-71.
Ezzati M, Pearson-Stuttard J, Bennett JE, Mathers CD. Acting on non-communicable
diseases in low- and middle-income tropical countries. Nature. 2018;559:507-16.
Fanelli D, Costas R, Ioannidis JP. Meta-assessment of bias in science. Proc Natl Acad
Sci U S A. 2017;114:3714-19.
Fearon ER. Human cancer syndromes: clues to the origin and nature of cancer. Science.
1997;278:1043-50.
Ferlay J, Ervik M, Lam F, Colombet M, Mery L, Piñeros M, Znaor A, Soerjomataram I,
Bray F. Global Cancer Observatory: Cancer Today [online]. Lyon: International Agency
for Research on Cancer; 2018. Disponível em https://gco.iarc.fr/today, acessado em
17/09/2018.
Giovannucci E. Insulin, insulin-like growth factors and colon cancer: a review of the
evidence. J Nutr. 2001;131:3109S-20S.
Giovannucci E, Harlan DM, Archer MC, Bergenstal RM, Gapstur SM, Habel LA,
Pollak M, Regensteiner JG, Yee D. Diabetes and cancer: a consensus report. Diabetes
Care. 2010;33:1674-85.
Giovannucci E. A framework to understand diet, physical activity, body weight, and
cancer risk. Cancer Causes Control. 2018a;29(1):1-6.
Giovannucci E. An Integrative Approach for Deciphering the Causal Associations of
Physical Activity and Cancer Risk: The Role of Adiposity. J Natl Cancer Inst.
2018b;110:935-941.
Glymour MM, Greenland S. Causal diagrams. In: Rothman KJ, Greenland S, Lash TL,
editors. Modern epidemiology. 3rd ed. Philadelphia: Lippincott Williams & Wilkins;
2008. p.183-209.
Greenland S, Pearl J, Robins JM. Causal diagrams for epidemiologic research.
Epidemiology. 1999;10:37-48
Greenland S, Rothman KJ, Lash T. Measures of effect and measures of association. In:
Rothman KJ, Greeland S, Lash TL. Modern Epidemiology. 3rd edition. Philadelphia:
Lippincott Williams & Wilkins; 2008. p.52-70.
Hanahan D, Weinberg RA. Hallmarks of cancer: the next generation. Cell.
2011;144:646-74.
Hernán MA, Hernández-Díaz S, Robins JM. A structural approach to selection bias.
Epidemiology. 2004;15:615-25.

42
Hernán MA, Cole SR. Invited Commentary: Causal diagrams and measurement bias.
Am J Epidemiol. 2009;170:959-62
Hiatt RA, Rimer BK. Principles and applications of cancer prevention and control
interventions. In: Schottenfled D, Fraumeni JF. Cancer Epidemiology and Prevention.
3rd edition. New York: Oxford University Press; 2006. p.1283-91.
Hill AB. The environment and disease: association or causation? J R Soc Med.
1965;108:32-7.
Inoue M, Sawada N, Matsuda T, Iwasaki M, Sasazuki S, Shimazu T, Shibuya K,
Tsugane S. Attributable causes of cancer in Japan in 2005--systematic assessment to
estimate current burden of cancer attributable to known preventable risk factors in
Japan. Ann Oncol. 2012; 23:1362-69.
Institute of Medicine (IOM). Similarities and dissimilarities in physiology, metabolism,
and disease states and responses to therapy in children and adults. Roundtable on
research and development of drugs, biologics, and medical devices. Workshop summary
Washington: National Academies Press; 2000.
International Agency for Research on Cancer (IARC). IARC Handbook of Cancer
Prevention. Volume 6: Weight control and physical activity. Lyon: IARC; 2002.
International Agency for Research on Cancer (IARC). Preamble. IARC Monographs on
the Evaluation of Carcinogenic Risks to Humans. Lyon: IARC; 2016.
International Agency for Research on Cancer. IARC Monographs on the Evaluation of
Carcinogenic Risks to Humans [online]. Vol. 1–110. Lyon, IARC, 1971–2015.
Disponível em: http://iarc.fr/en/publications/list/monographs/index.php.
Islami F, Chen W, Yu XQ, Lortet-Tieulent J, Zheng R, Flanders WD, Xia C, Thun MJ,
Gapstur SM, Ezzati M, Jemal A. Cancer deaths and cases attributable to lifestyle factors
and infections in China, 2013. Ann Oncol. 2017;28:2567-74.
Islami F, Goding Sauer A, Miller KD, Siegel RL, Fedewa SA, Jacobs EJ, McCullough
ML, Patel AV, Ma J, Soerjomataram I, Flanders WD, Brawley OW, Gapstur SM, Jemal
A. Proportion and number of cancer cases and deaths attributable to potentially
modifiable risk factors in the United States. CA Cancer J Clin. 2018;68:31-54.
Keimling M, Behrens G, Schmid D, Jochem C, Leitzmann MF. The association
between physical activity and bladder cancer: systematic review and meta-analysis. Br J
Cancer. 2014;110:1862-70.
Keyes K, Galea S. What is a cause? In: Keyes K, Galea S. Epidemiology matters: a new
introduction to methodological foundations. New York: Oxford University Press, 2014.
Koelwyn GJ, Quail DF, Zhang X, White RM, Jones LW. Exercise-dependent regulation
of the tumour microenvironment. Nat Rev Cancer. 2017;17:620-632.
Kyu HH, Bachman VF, Alexander LT, Mumford JE, Afshin A, Estep K, Veerman JL,
Delwiche K, Iannarone ML, Moyer ML, Cercy K, Vos T, Murray CJ, Forouzanfar MH.
Physical activity and risk of breast cancer, colon cancer, diabetes, ischemic heart
disease, and ischemic stroke events: systematic review and dose-response meta-analysis
for the Global Burden of Disease Study 2013. BMJ. 2016;354:i3857.

43
Lagiou P, Trichopoulos D, Adami HO. Concepts in Cancer Epidemiology and Etiology.
In: Adami HO, Hunter D, Trichopoulos D. Textbook of Cancer Epidemiology. 2nd
edition. New York: Oxford University Press; 2008.
Lauby-Secretan B, Scoccianti C, Loomis D, Grosse Y, Bianchini F, Straif K,
International Agency for Research on Cancer Handbook Working Group. Body Fatness
and Cancer--Viewpoint of the IARC Working Group. N Engl J Med. 2016;375:794-8.
Lee IM, Oguma Y. Physical activity. In: Schottenfeld D, Fraumeni JF. Cancer
epidemiology and prevention. 3rd edition. UK: Oxford University Press; 2006.
Leitzmann M, Powers H, Anderson AS, Scoccianti C, Berrino F, Boutron-Ruault MC,
Cecchini M, Espina C, Key TJ, Norat T, Wiseman M, Romieu I. European Code against
Cancer 4th Edition: Physical activity and cancer. Cancer Epidemiol. 2015;39 Suppl
1:S46-55.
Lewis D. Causation. J Philos. 1973:70:556-67.
Liu Y, Hu F, Li D, Wang F, Zhu L, Chen W, Ge J, An R, Zhao Y. Does Physical
Activity Reduce the Risk of Prostate Cancer? A Systematic Review and Meta-analysis.
Eur Urol. 2011;60:1029-44.
Lynch HT, Shaw MW, Magnuson CW, Larsen AL, Krush AJ. Hereditary factors in
cancer. Study of two large midwestern kindreds. Arch Intern Med. 1966;117:206-12.
McTiernan A. Mechanisms linking physical activity with cancer. Nat Rev Cancer.
2008;8:205-11.
Miller CT, Fraser SF, Levinger I, Straznicky NE, Dixon JB, Reynolds J, Selig SE. The
effects of exercise training in addition to energy restriction on functional capacities and
body composition in obese adults during weight loss: a systematic review. PloS One.
2013;8:e81692.
Moore S1, Lee IM, Weiderpass E, Campbell PT, Sampson JN, Kitahara CM, Keadle
SK, Arem H, Berrington de Gonzalez A, Hartge P, Adami HO, Blair CK, Borch KB,
Boyd E, Check DP, Fournier A, Freedman ND, Gunter M, Johannson M, Khaw KT,
Linet MS, Orsini N, Park Y, Riboli E, Robien K, Schairer C, Sesso H, Spriggs M, Van
Dusen R, Wolk A, Matthews CE, Patel AV. Association of Leisure-Time Physical
Activity With Risk of 26 Types of Cancer in 1.44 Million Adults. JAMA Intern Med.
2016;176:816-825.
Munafò MR, Nosek BA, Bishop DVM, Button KS, Chambers CD, Sert NP, Simonsohn
U, Wagenmakers EJ, Ware JJ, Ioannidis JPA. A manifesto for reproducible science.
Nature Hum Behav. 2017;1:0021.
Niedermaier T, Behrens G, Schmid D, Schlecht I, Fischer B, Leitzmann MF. Body mass
index, physical activity, and risk of adult meningioma and glioma: A meta-analysis.
Neurology. 2015;85:1342-50.
Olsen JH, Andersen A, Dreyer L, Pukkala E, Tryggvadottir L, Gerhardsson de Verdier
M, Winther JF. Summary of avoidable cancers in the Nordic countries. APMIS.
1997;76:141–6.
Park Y, Peterson LL, Colditz GA. The Plausibility of Obesity Paradox in Cancer-Point.
Cancer Res. 2018;78:1898-1903.
Peto R, Lopez AD, Norheim OF. Halving premature death. Science. 2014;345:1272.

44
Renehan AG, Zwahlen M, Egger M. Adiposity and cancer risk: new mechanistic
insights from epidemiology. Nat Rev Cancer. 2015;15:484-98.
Rezende LFM, Eluf-Neto. Fração atribuível populacional: planejamento de ações de
prevenção de doenças no Brasil. Rev Saúde Pública. 2016;50:S0034-
89102016000100601.
Rezende LFM, Rey-López JP, Sá TH, Chartres N, Fabbri A, Powell L, Stamatakis E,
Bero L. Reporting bias in the literature on the associations of health-related behaviors
and statins with cardiovascular disease and all-cause mortality. PLoS Biol.
2018;16:e2005761.
Romieu I, Dossus L, Barquera S, Blottière HM, Franks PW, Gunter M, Hwalla N,
Hursting SD, Leitzmann M, Margetts B, Nishida C, Potischman N, Seidell J, Stepien M,
Wang Y, Westerterp K, Winichagoon P, Wiseman M, Willett WC; IARC working
group on Energy Balance and Obesity. Energy balance and obesity: what are the main
drivers? Cancer Causes Control. 2017;28:247-58.
Rose G. Sick individuals and sick populations. Int J Epidemiol. 1985;14:32-8.
Rose G. The strategy of preventive medicine. Oxford: Oxford University Press, 1992.
Rothman KJ. Causes. Am J Epidemiol. 1976;104:587-92.
Rothman KJ, Greenland S, Lash TL. Validity in Epidemiologic Studies. In: Rothman
KJ, Greeland S, Lash TL. Modern Epidemiology. 3rd edition. Philadelphia: Lippincott
Williams & Wilkins; 2008.
Schmid D, Behrens G, Keimling M, Jochem C, Ricci C, Leitzmann M.. A systematic
review and meta-analysis of physical activity and endometrial cancer risk. Eur J
Epidemiol. 2015;30:397-412.
Schoenfeld JD, Ioannidis JP. Is everything we eat associated with cancer? A systematic
cookbook review. Am J Clin Nutr. 2013;97:127-34.
Silva KS, Garcia LM, Rabacow FM, Rezende LFM, Sá TH. Physical activity as part of
daily living: Moving beyond quantitative recommendations. Prev Med. 2017;96:160-2.
Sivertsen I, Dahlstrom AW. The relation of muscular activity to carcinoma. A
preliminary report. J Cancer Res. 1922;6:365-78.
Smith AD, Crippa A, Woodcock J, Brage S. Physical activity and incident type 2
diabetes mellitus: a systematic review and dose-response meta-analysis of prospective
cohort studies. Diabetologia. 2016;59:2527-45.
Song M, Giovannucci EL. Cancer risk: many factors contribute. Science. 2015;347:728-
9.
Song M, Vogelstein B, Giovannucci EL, Willett WC, Tomasetti C. Cancer prevention:
Molecular and epidemiologic consensus. Science. 2018;361:1317-8.
Susser M. What is a cause and how do we know one? A grammar for pragmatic
epidemiology. Am J Epidemiol. 1991;133:635-48.
Szklo M, Nieto J. Understanding lack of validity: Bias. In: Szklo M, Nieto J.
Epidemiology: Beyond the Basics. 3rd edition. Burlington: Jones & Bartlett Learning;
2014a

45
Szklo M, Nieto J. Identifying Noncausal Associations: Confounding. In: Szklo M, Nieto
J. Epidemiology: Beyond the Basics. 3rd edition. Burlington: Jones & Bartlett Learning;
2014b
The big causes of death from noncommunicable disease. Bull World Health Organ.
2016;94:413-4.
Thorogood A, Mottillo S, Shimony A, Filion KB, Joseph L, Genest J, Pilote L, Poirier
P, Schiffrin EL, Eisenberg MJ.. Isolated aerobic exercise and weight loss: a systematic
review and meta-analysis of randomized controlled trials. Am J Med. 2011;124:747–55.
Tomasetti CB, Vogelstein. Cancer etiology. Variation in cancer risk among tissues can
be explained by the number of stem cell divisions. Science. 2015;347:78-81.
Tsilidis KK, Papatheodorou SI, Evangelou E, Ioannidis JP.. Evaluation of excess
statistical significance in meta-analyses of 98 biomarker associations with cancer risk. J
Natl Cancer Inst. 2012;104:1867-78.
Tsilidis KK, Kasimis JC, Lopez DS, Ntzani EE, Ioannidis JPA. Type 2 diabetes and
cancer: umbrella review of meta-analyses of observational studies. BMJ.
2015;350:g7607.
VanderWeele T. Explanation in causal inference: methods for mediation and
interaction. Oxford University Press; 2015.
VanderWeele TJ, Hernán MA. Results on differential and dependent measurement error
of the exposure and the outcome using signed directed acyclic graphs. Am J Epidemiol.
2012;175:1303-10
Verheggen RJ, Maessen MF, Green DJ, Hermus AR, Hopman MT, Thijssen DH. A
systematic review and meta-analysis on the effects of exercise training versus
hypocaloric diet: distinct effects on body weight and visceral adipose tissue. Obes Rev.
2016;17:664-90.
Whiteman DC, Webb PM, Green AC, Neale RE, Fritschi L, Bain CJ, Parkin DM,
Wilson LF, Olsen CM, Nagle CM, Pandeya N, Jordan SJ, Antonsson A, Kendall BJ,
Hughes MC, Ibiebele TI, Miura K, Peters S, Carey RN. Cancers in Australia in 2010
attributable to modifiable factors: summary and conclusions. Aust N Z J Public Health.
2015;39:477-84.
Wild C. Preface. In: International Agency for Research on Cancer (IARC). World
Cancer Report 2014. Lyon: IARC press; 2014.
Wild CP, Brennan P, Plummer M, Bray F, Straif K, Zavadil J. Cancer risk: role of
chance overstated. Science. 2015;347:728.
World Cancer Research Fund/American Institute for Cancer Research. Diet, Nutrition,
Physical Activity and Cancer: a Global Perspective. Continuous Update Project Expert
Reported 2018; 2018.
World Health Organization (WHO). Prevention of Cancer (WHO Tech. Rep. 276).
Geneva, WHO; 1964.
Young, NS, Ioannidis JP, Al-Ubaydli O. Why current publication practices may distort
science. PLoS Med. 2008;5:e201.

46
Yu E, Ley SH, Manson JE, Willett W, Satija A, Hu FB, Stokes A. Weight History and
All-Cause and Cause-Specific Mortality in Three Prospective Cohort Studies. Ann
Intern Med. 2017;166:613-20.
Zhong S, Chen L, Lv M, Ma T, Zhang X, Zhao J. Nonoccupational physical activity and
risk of ovarian cancer: a meta-analysis. Tumour Biol. 2014;35:11065-73.

47
2. OBJETIVO
O objetivo desta pesquisa foi avaliar a associação entre atividade física e o risco
de câncer, bem como estimar a potencial contribuição da atividade física na prevenção
dos casos e mortes por câncer no Brasil.
OBJETVOS ESPECÍFICOS
1) Avaliar a consistência da evidência epidemiológica sobre a associação entre atividade
física e risco de desenvolver e morrer por diferentes tipos de câncer, bem como indícios
de viés e incerteza na literatura.
2) Avaliar a associação entre atividade física durante a adolescência e risco de adenoma
colorretal na fase adulta.
3) Investigar a associação entre diferentes tipos e intensidades de atividade física com
biomarcadores de inflamação e resposta à insulina relacionados com risco de câncer.
4) Estimar a preventabilidade de câncer mediante o aumento da atividade física no
Brasil.
5) Comparar a preventabilidade de câncer mediante aumento da atividade física com a
redução de demais fatores de risco relacionados ao estilo de vida no Brasil.

48
3. AVALIAÇÃO DA EVIDÊNCIA E INDÍCIOS DE VIÉS NA
LITERATURA EPIDEMIOLÓGICA SOBRE ATIVIDADE FÍSICA E
CÂNCER
Este capítulo apresenta o artigo “Physical activity and cancer: an umbrella review of
the literature including 22 major anatomical sites and 770,000 cancer cases” de autoria
de Leandro Fórnias Machado de Rezende, Thiago Hérick de Sá, George Markozannes,
Juan Pablo Rey-López, I-Min Lee, Konstantinos K Tsilidis, John P. A. Ioannidis e José
Eluf-Neto. O artigo foi originalmente publicado na revista British Journal of Sports
Medicine e pode ser acessado gratuitamente no link
https://bjsm.bmj.com/content/52/13/826. Essa publicação apresenta material
suplementar extenso, disponível apenas no link da revista.
Para citação: Rezende LFM, Sá TH, Markozannes G, Rey-López JP, Lee IM, Tsilidis
KK, Ioannidis JPA, Eluf-Neto J. Physical activity and cancer: an umbrella review of the
literature including 22 major anatomical sites and 770,000 cancer cases. Br J Sports
Med. 2018;52(13):826-833. doi: 10.1136/bjsports-2017-098391

49
ABSTRACT
Objective: To provide an overview of the breadth and validity of claimed associations
between physical activity and risk of developing or dying from cancer.
Design: Umbrella review.
Data Sources: We searched Medline, Embase, Cochrane Database, and Web of Science.
Eligibility criteria for selecting studies: Systematic reviews about physical activity and
cancer incidence and cancer mortality in different body sites among general population.
Results: We included nineteen reviews covering 22 cancer sites, 26 exposure-outcome
pairs comparisons, and 541 original studies. Physical activity was associated with lower
risk of seven cancer sites (colon, breast, endometrial, lung, esophageal, pancreas, and
meningioma). Only colon (a protective association with recreational physical activity)
and breast cancer (a protective association with overall physical activity) were
supported by strong evidence and highly suggestive evidence, respectively. Evidence
from endometrial, lung, esophageal, pancreas, and meningioma presented hints of
uncertainty and bias in the literature (e.g., not reaching P values <10-6), showing large
between-study heterogeneity, and/or not demonstrating a definite direction for the effect
when 95% prediction intervals were considered). Four of the 26 meta-analyses showed
small study effects and 4 showed excess significance.
Conclusion: Physical activity is associated with a lower risk of several cancers, but only
colon and breast cancer associations were supported by strong or highly suggestive
evidence, respectively. Evidence from other cancer sites was less consistent, presenting
hints of uncertainty and/or bias.

50
3.1. INTRODUCTION
Physical activity has been traditionally linked with lower risks of colon and
breast cancer (IARC, 2002; WCRF, 2018; Wolin et al., et al. 2009; Boyle et al., 2012;
Neilson et al., 2016; Pizot et al., 2016). Annually, thousands of new epidemiological
studies are conducted and published to examine whether physical activity may also
decrease risk of other types of cancer. Recently, prospective cohort studies (Keum et al.,
2016; Moore et al., 2016) and meta-analyses have claimed that physical activity might
be additionally associated with cancer of bladder (Keimling et al., 2014), endometrial
(Schmid et al., 2015), esophageal (Behrens et al., 2014), gastric (Psaltopoulos et al.,
2016), glioma (Niedermaier et al., 2015), kidney (Behrens; Leitzmann, 2013), lung
(Behrens et al., 2016), meningioma (Niedermaier et al., 2015), ovarian (Zhong et al.,
2014), pancreas (Behrens et al., 2015), and prostate (Liu et al., 2011). If these
associations are causal, a substantial burden of cancer could be avoided worldwide
given the high prevalence of physical inactivity (Hallal et al., 2012).
Another possibility is that some claimed associations about physical activity and
cancer could be explained by biases in the literature. There is strong evidence that
studies showing positive and significant results are more likely to be published than
studies with negative and non-significant findings (Dwan et al., 2013). These sorts of
publication bias and outcome reporting bias threat validity of scientific evidence
(Ioannidis, 2005; Young et al., 2008) causes general public anxiety and skepticism
(Taubes, 1995), and misguide clinical and public health decisions. In fact, bias has been
suspected in cancer epidemiology literature about presumed risk and prognostic factors,
biomarkers, and multiple carcinogens (Kyzas et al., 2007; Bofetta et al., 2008; Tsilidis
et al., 2012; Schoenfeld; Ioannidis, 2013; Ioannidis et al., 2014, Tsilidis et al., 2015,
Markozannes et al., 2016, Kyrgiou et al., 2017). Nevertheless, neither the international
organizations (e.g., International Agency for Research on Cancer – IARC; World
Cancer Research Fund – WCRF) nor the most comprehensive systematic reviews and
meta-analyses on physical activity and cancer have considered the array of analytical
procedures available to detect hints of uncertainty and bias in the body of evidence to
state their conclusions (Table S1).
We performed an umbrella review of systematic reviews and meta-analyses to
provide an overview of the breadth and validity of claimed association between physical

51
activity and risk of developing or dying from cancer. We comprehensively evaluated the
robustness of evidence between physical activity and cancer, appraising hints of
uncertainty and bias in the body of literature.
3.2. METHODS
Literature Search
We searched Medline, Embase, Cochrane Database of systematic reviews, and
Web of Science for systematic reviews published up to 22th November 2016, aiming to
investigate the association between physical activity and risk of cancer incidence and
cancer mortality. Table S2 in the appendix shows the search strategy. We also reviewed
the references list of the eligible reviews.
Selection of reviews and methodological quality assessment
We only selected systematic reviews (irrespective of performing meta-analyses)
evaluating the association between physical activity and cancer among the general
(healthy) population. Whenever more than one eligible systematic review addressed the
association between physical activity and the same cancer site, we selected the review
with the largest number of studies included. We selected more than one review per
cancer site whenever the reviews with the largest number of individual studies were
restricted by study design or cancer subsite. In these cases (i.e., breast, colon, and
rectum cancers), data analyses were performed separated by review to avoid overlap of
studies. We excluded systematic reviews of prognostic studies, reviews that did not
systematically search the literature, and reviews that did not provided comprehensive
data from individual studies (specifically information listed in the data extraction
section). Two researchers (LFMR and JPRL) independently selected the eligible
reviews after screening consequently titles, abstracts and full texts. A third researcher
(THS) settled disagreements between authors. The list of included and excluded reviews
is available in the Table S3 in the appendix.
We assessed the methodological quality of the included reviews using the
AMSTAR tool (Shea et al., 2007) and gathering data on statistical analyses used to
assess hints of uncertainty and bias in the body of evidence.

52
Data extraction
We extracted author’s name, year of publication, number of studies included (by
study design), physical activity domains (e.g., recreational, occupational, total), and
maximally-adjusted summary estimates from the systematic reviews. For each
individual study in a systematic review, we extracted authors, year of publication, study
design (case-control or cohort), sex, physical activity domain, period in life which of
physical activity was measured, number of cases and controls (for case-control studies),
number of cases and sample size (for cohort studies), cancer indicator (incidence,
mortality, or incidence and mortality), maximally-adjusted measure of association and
its respective 95% confidence intervals (95% CI) comparing high versus low categories
of physical activity. Data extraction was independently performed by two researchers
(LFMR and JPRL), with discrepancies solved by a third researcher (THS).
Statistical analysis
Primary analysis
The primary analysis in this umbrella review focused on two approaches to
evaluate the association between physical activity and cancer. 1) ‘Any physical
activity’: if individual study presented multiple measures of association by physical
activity domains, we selected one based on the following order: total physical activity,
multiple physical activity domains, recreational, commuting, occupational, and
household physical activity. We considered ‘total physical activity’ any estimate with
all four physical activity domains, and ‘multiple physical activity’ an estimate with a
combination of at least two, but not all, domains. The ‘any physical activity’ approach
was the most comprehensive analysis since it included the largest number of estimates
per meta-analysis; 2) Recreational physical activity: we performed data analysis using
all individual studies presenting recreational physical activity estimates. Recreational
physical activity is the most studied and the more easily modifiable physical activity in
comparison to other domains.
Both approaches used in the primary analysis included only cohort studies (i.e.
case-control results were considered in the stratified and subgroup analyses) and one
measure of association per individual study. Whenever a measure of association was not
available for the total sample in an individual study (e.g., men and women relative risks
[RR] estimates were provided separately), we performed fixed effect models to estimate

53
summary effects between categories, and included the latter in the meta-analysis. In
addition, one systematic review (Behrens et al., 2015) presented multiple estimates
based on timing in life measures for the same physical activity domain (e.g., distant
past, recent, consistent over time) and we selected the consistent over time measure
(same criteria used by the authors).
Stratified and subgroup analyses
We also performed stratified analyses combining estimates by study design
(case-control and all study design – cohort and case-control), sex, and other physical
activity domains (e.g., total physical activity, occupational physical activity) within and
across studies. In addition, considering all study designs, we re-performed subgroup
analysis conducted in the original meta-analyses.
Estimation of summary effect
We standardized the least active category as reference group across meta-
analyses and then performed the meta-analysis of physical activity (i.e., high vs low
category) and each cancer site according to cancer indicators. We estimated summary
effect measures and its 95% confidence intervals using random effect models.
Heterogeneity between studies
Heterogeneity between studies was estimated using the I2 measure of
inconsistency (Hardy; Thompson, 1998; Ioannidis et al., 2007) and 95% prediction
intervals. The 95% prediction interval accounts for heterogeneity between studies and
represents the range in which a future study will lie (Riley et al., 2011).
Small study effect and excess significance biases
Bias in the body of evidence was assessed by small study effect and excess
significance tests. The presence of small study effects bias was assessed for each meta-
analysis based on the regression asymmetry test proposed by Egger and colleagues
(Egger et al., 1997). We considered small study effect bias when the Egger’s test P
value<0.10 and the magnitude of association in the largest study (smaller standard error)
of a meta-analysis was more conservative than the meta-analysis random effects
estimate (Sterne et al., 2011).

54
The excess significance test was used to evaluate whether the expected number
of studies (E) differs from the actual observed number of studies (O) with statistically
significant results (P<0.05) included in each meta-analysis, regardless of the direction of
the association (Ioannidis; Trikalinos, 2007). The difference between O and E is
evaluated using a two-sided binomial test considering P<0.10 for O greater than E (one-
sided P<0.05) as the statistical significance threshold (Ioannidis; Trikalinos, 2007).
All statistical analyses were performed using Stata version 13.0 (College Station,
TX).
Grading the evidence
As proposed by previous umbrella reviews (Ioannidis et al., 2014, Tsilidis et al.,
2015; Bellou et al., 2016; Markozannes et al., 2016; Kyrgiou et al., 2017), we classified
the evidence from meta-analysis with nominally statistically significant results (P<0.05)
as strong, highly suggestive, suggestive, or weak, following the criteria described in
Table 1.

55
Table 1 - Summary of evidence grading for meta-analyses of cohort studies associating physical activity and risk of developing or dying
from cancer
Evidence Criteria used
Decreased Risk
Any
physical activity
Recreational
physical activity
Strong
P*<10-6; >1,000 cases; P<0.05 of the largest study in a meta-
analysis; I2<50%; no small study effect¶; prediction interval
excludes the null value; no excess significance bias†
None Colon cancer, inc. or
mort.
Highly
suggestive
P*<10-6; >1,000 cases; P<0.05 of the largest study in a meta-
analysis
Breast cancer, inc. and
All cancer, mort.
None
Suggestive P*<10-3; >1,000 cases Colon cancer, inc. or mort., Lung
inc., and Endometrial, inc.
All cancer, mort., and
Lung, inc.
Weak P*<0.05
Meningioma, inc. or mort.,
Multiple cancer sites, inc, or
mort., Pancreas, inc.
Esophageal, inc. and
Meningioma, inc. or
mort.
Abbreviations: inc., incidence; mort., mortality;
*P indicates the p-values of the meta-analysis random effects model. ¶Small study effect is based on the P-value from the Egger’s regression asymmetry test (P0.1) where the random effects summary estimate was larger compared to the
point estimate of the largest study (smallest standard error) in a meta-analysis.
†Based on the p-value (P>0.1) of the excess significance test using the largest study (smallest standard error) in a meta-analysis as the plausible effect size.

56
Sensitivity analyses
We performed credibility ceilings sensitivity analyses for associations showing
at least weak evidence (P<0.05). Credibility ceilings evaluate potential spurious
precision of the combined effect estimates (Salanti; Ioannidis, 2009). This tool re-
estimates the meta-analysis pooled effect size using inflated variances for each study.
The variance is inflated by considering the number of studies showing effects on the
same direction and the probability of each study for its true effect size to be in different
direction from the one suggested by its point estimate (Salanti; Ioannidis, 2009). We
evaluated a series of values to examine what credibility ceiling would be necessary to
make the associations non-significant at the 0.05 level (Salanti; Ioannidis, 2009). Lastly,
we performed a sensitivity analyses excluding each criterion used for grading the
evidence to analyze the impact in the results.
3.3. RESULTS
Description of meta-analyses
Of the 2,975 records retrieved from the search in databases, we finally selected a
total of 19 systematic reviews of observational studies (Figure 1). Systematic reviews of
randomized controlled trials were eligible, but were not found in the literature search.
Eleven out of 19 reviews (58%) scored ≥ 6 points in the 11-items AMSTAR criteria,
indicating a moderate to high methodological quality (Table S4). Limited statistical
tests and sensitivity analyses were performed in original meta-analyses. Statistical
significance was assessed in all reviews through the fixed/random effect 95% CI (i.e.,
none reported the exact P-value). None of the reviews performed excess significance,
credibility ceiling, and 95% prediction intervals tests. I2 heterogeneity estimates (n=17,
90%), small study effect test (n=18, 95%), and number of cases (n=18, 95%) were
reported in the majority of the original meta-analyses (Table S1).

57
Figure 1 - Flow chart of systematic reviews and meta-analyses selection

58
Reviews included associations on 22 different cancer sites using 541 original
studies, of which 297 (55%) were cohort and 244 (45%) case-control studies. Most of
the original studies, 344 (64%), had cancer incidence as outcome, 35 (6%) mortality,
and 162 (30%) incidence and mortality. A total of 725,074 cancer cases and 42,428
cancer deaths were included in these meta-analyses. All except for six comparisons
(gastric mortality, esophageal mortality, meningioma risk, kidney mortality, Hodgkin
lymphoma risk, pancreatic mortality) included more than 1,000 cases in the meta-
analyses (Table S5-S6).
Results presented below are based on the primary analysis (‘any physical
activity’ and recreational physical activity approaches), which included only cohort
studies.
Summary effect size
Eight out of the 26 comparisons (31%) based on the any physical activity
approach showed statistically significant associations (P<0.05) in the random effect
model. From those cancer sites, summary random effect size showed a 0.93 to 0.71
relative risk of cancer among those in the most active category as compared with the
least active group. When the random effects P<10-6 was used as a threshold, only
overall cancer mortality (RR 0.79; 95% CI 0.75-0.85), colon cancer (RR 0.81; 95% CI
0.75-0.88), and breast cancer incidence (RR 0.87; 95% CI 0.84-0.90) remained
statistically significant (Figure 2 and Table S7).

59
Figure 2 - Robustness of evidence grading for meta-analyses of cohort studies associating any physical activity and risk of
developing or dying from cancer
*Figure 2 Footnote: I, incidence; M, mortality; I+M, incidence and mortality; NS, association not statistically significant (P>0.05); +, yes; -, no; Number of studies refers to number of studies included in the
random effect model; Random effect P refers to P-value of the summary random effects estimate; Number of cases refers to number of cancer cases or deaths included in the analysis; Largest study with P<0.05
refers to P-value of the largest study (smallest SE) in each meta-analysis; Small study bias is based on the P-value from the Egger’s regression asymmetry test (P<0.1) where the random effects summary
estimate was larger compared to the point estimate of the largest study in a meta-analysis; Excess significance bias is based on the p-value (P<0.1) of the excess significance test using the largest study (smallest
standard error) in a meta-analysis as the plausible effect size; Evidence grading refers to robustness evidence grading criteria;

60
For recreational physical activity, five (25%) out of 20 comparisons showed
statistically significant associations based on the P<0.05 threshold. Among those, only
colon cancer (RR 0.79; 95% CI 0.71-0.86) remained statistically significant at P<10-6
threshold (Figure 3 and Table S8).

61
Figure 3 - Robustness of evidence grading for meta-analyses of cohort studies associating recreational physical activity and risk of
developing or dying from cancer
*Figure 3 Footnote: I, incidence; M, mortality; I+M, incidence and mortality; NS, association not statistically significant (P>0.05); +, yes; -, no; Number of studies refers to number of studies included in the
random effect model; Random effect P refers to P-value of the summary random effects estimate; Number of cases refers to number of cancer cases or deaths included in the analysis; Largest study with P<0.05
refers to P-value of the largest study (smallest SE) in each meta-analysis; Small study bias is based on the P-value from the Egger’s regression asymmetry test (P<0.1) where the random effects summary
estimate was larger compared to the point estimate of the largest study in a meta-analysis; Excess significance bias is based on the p-value (P<0.1) of the excess significance test using the largest study (smallest
standard error) in a meta-analysis as the plausible effect size; Evidence grading refers to robustness evidence grading criteria.

62
Heterogeneity between studies - I2 and 95% prediction intervals
Half (n=13) of the meta-analyses of the ‘any physical activity’ approach had I2
smaller than 25%, whereas seven (27%) (all cancer mortality, colon, lung, gastric,
bladder, multiple myeloma, and ovary) showed moderate to high heterogeneity (I2
≥50%). Only all cancer mortality and breast cancer presented a definite direction for the
effect size (i.e., the intervals did not include the null value) when 95% prediction
intervals were considered (Figure 2 and Table S7).
Regarding recreational physical activity, seven out of 20 meta-analyses (35%)
had I2 >50%, and 18 (90%) included null value when 95% prediction intervals
presented a definite direction for the effect size (Figure 3 and Table S8).
Small study effects and excess significance biases
Out of the 26 studies, four (15%) (breast, all cancer mortality, colon, and
pancreas) had a P<0.1 on the Egger asymmetry test and the effect estimate of the largest
study was more conservative compared to the summary random effects estimate,
indicating potential small-study effect bias. Regarding the excess of significance bias,
four (15%) cancer sites (all cancer mortality, colon, lung, gastric) had observed number
of studies showing statistically significant results higher beyond chance than the
expected (Figure 2 and Table S7).
For recreational physical activity, only multiple myeloma meta-analysis showed
small-study effect bias, whereas only lung cancer presented evidence of excess
significance bias (Figure 3 and Table S8).
Robustness of evidence
None of the associations were supported by strong evidence in the ‘any physical
activity’ analyses. The associations between physical activity and breast cancer
incidence and all cancer mortality were supported by highly suggestive evidence. Colon
cancer, endometrial, and lung cancers were judged as suggestive evidence. Two other
cancer sites (meningioma, pancreas, and multiple cancer sites) were supported by weak
evidence (Table 1, Figure 2 and Table S7).
There was strong evidence for an association between recreational physical
activity and colon cancer (RR 0.79; 95% CI 0.71-0.86). Lung cancer (RR 0.79; 95% CI
0.70-0.90) and all cancer mortality (RR 0.81; 95% CI 0.74-0.90) were supported by a

63
suggestive evidence. Esophageal cancer presented only weak evidence (Table 1, Figure
3 and Table S8).
Stratified and subgroup analyses
The stratified analyses results are presented in the appendix (Tables S9-S17).
Most of the associations found in the analysis stratified by sex (Table S9-S12) and
physical activity domains (total, occupation, and ‘other physical activity’ domains)
(Table S13-S15) were graded as weak evidence or were not statistically significant, but
data were generally more limited and many studies had not provided separate effects for
men and women. Considering case-control studies, the association between any
physical activity and colon and breast cancers were supported by highly suggestive
evidence (Table S16). For recreational physical activity, only breast cancer was
supported by highly suggestive evidence in case-control studies (Table S17).
The majority of the subgroup analyses conducted for each cancer were also
supported by weak evidence or were not statistically significant. We found strong
evidence for the associations between physical activity and distal colon cancer, breast
cancer among women that never used hormone replacement therapy (for estimates
based on physical activity measured in hours/week and METs-h/week, adjusted by
adiposity), endometrial cancer (e.g., for studies with number of cases higher than 3,500
and with occupational physical activity measures), and non-cardia gastric cancer (Table
S18-S39).
Sensitivity analyses
Of the eight meta-analyses showing random effects P<0.05 in the ‘any physical
activity’ approach, 4 (breast, colon, endometrial, and all cancer mortality) would remain
statistically significant even with a 10% credibility ceiling, and two (breast cancer and
all cancer mortality) even with a 20% credibility ceiling (Table S7 and Figure S1). Two
(colon cancer and all cancer mortality) out of five meta-analyses of recreational physical
activity showing random effects P<0.05 remained statistically significant when 10%
credibility was used (Table S8 and Figure S2), but none of those survived to 20%
credibility ceiling.
When we performed sensitivity analyses excluding sequentially each criterion
used in the grading of evidence, the association between any physical activity and breast

64
cancer, stemming from cohort studies, was supported by strong evidence after excluding
the small study effects criterion (Table S40).
3.3. DISCUSSION
Principal findings and possible explanations
In this umbrella review summarizing the evidence of associations between
physical activity and different cancer sites, we synthesized data from 22 different cancer
sites, 725,074 cancer cases and 42,428 cancer deaths, and evaluated the credibility of
the epidemiological evidence. In our primary analysis, stemming from cohort studies,
physical activity showed a negative and statistically significant association (P<0.05)
with seven cancer sites (colon, breast, endometrial, lung, esophageal, pancreas, and
meningioma). However, we found that only the associations with colon cancer and
breast cancer were supported by strong evidence and highly suggestive evidence,
respectively.
The association between physical activity and incidence of breast and colon
cancers was recognized long ago (IARC, 2002; WCRF, 2018), whereas associations
with other cancer sites has emerged in the last decade (Behrens; Leitzmann, 2013;
Behrens et al., 2014; 2015; Keimling et al., 2014; Zhong et al., 2014; Niedermaier et al.,
2015; Schmid et al., 2015; Brenner et al., 2016; Psaltopoulou et al., 2016). However, it
is also plausible these associations may be flawed due to biases in the literature,
overestimating the potential effect of physical activity on the incidence and mortality of
cancer. In fact, this phenomenon has been as detected by previous umbrella reviews on
other subjects (Ioannidis et al., 2014; Tsilidis et al., 2015; Bellou et al., 2016;
Markozannes et al., 2016, Kyrgiou et al., 2017).
Through an array of statistical analyses, we found substantial uncertainty in the
literature of physical activity and cancer. When stringent P-value was considered
(P<10-6), only colon cancer, breast cancer, and all cancer mortality associations
remained statistically significant. Moderate to high heterogeneity (I2 ≥50%) was found
in a third of the meta-analyses. When such heterogeneity was considered in the 95%
prediction intervals, only colon cancer, breast cancer, and all-cancer mortality presented
a definite direction for the effect size. We identified few additional hints of bias in the

65
literature though the small study effect and excess significance tests.
Comparison with other studies
Criteria for evaluating the evidence have been proposed by different researchers
(Hill, 1965; Guyatt et al., 2008; Ioannidis, 2016; Lawlor et al., 2017) and organizations
(USDHEW, 1964; IARC, 2002; WCRF, 2018). The umbrella review approach
evaluates the credibility of evidence using an array of statistical tests and sensitivity
analyses to obtain hints of uncertainty and bias in the body of literature. Although is not
possible to estimate the exact extent or source of bias that affects the evidence on
physical activity and cancer, the criteria that we use aim to capture indirectly the
potential effect of biases. The IARC and the WCRF have their own group of experts
and criteria to judge the evidence of potential carcinogens to humans, which do not
include detailed evaluation of bias in the body of literature. On the other hand, both
organizations consider the biological mechanisms evidence, which is beyond the scope
of this umbrella review.
Both IARC and WCRF found convincing evidence to support the association
between physical activity and colon cancer, in agreement with the conclusions of our
umbrella review for recreational physical activity. In the subgroup analysis, we found
that only the association with distal colon cancer was supported by strong evidence,
whereas proximal colon cancer evidence was judged as suggestive. Colon cancer had
suggestive evidence for association with any physical activity with hints of
heterogeneity and bias. There are plausible biological mechanisms supporting the
association between physical activity and colon cancer, such as reducing body fatness,
inflammation, insulin levels and insulin resistance (WCRF, 2018).
The IARC and WCRF classified the association between physical activity and
breast cancer as sufficient (highest grade) and probable (second highest grade),
respectively. We found highly suggestive evidence that physical activity decreases the
risk of breast cancer, albeit we also observed small-study effect bias for this association.
Small-study effect may either be related to bias or random error or heterogeneity (Sterne
et al., 2011). Regarding the heterogeneity, the WCRF, but not the IARC, provides
separate grading of evidence for menopausal status, suggesting limited evidence for the
association between moderate to vigorous physical activity and premenopausal breast
cancer and convincing evidence for postmenopausal breast cancer. Similarly, we found

66
that premenopausal and postmenopausal breast cancers were supported by weak and
highly suggestive evidence, respectively. Hormone replacement therapy (HRT) is
associated with increased risk of breast cancer and may be an important confounder in
postmenopausal breast cancer studies (WCRF, 2010). We found strong evidence
supporting a negative association between physical activity and breast cancer among
never HRT users (i.e., analysis less prone to confounding). Additional biological
evidence supporting the association between physical activity and breast cancer includes
postulated effects on body fatness, certain hormone metabolisms (e.g., fasting insulin,
estrogens and androgens) and strengthening of the immune system (WCRF, 2010).
Our findings are in agreement with IARC and WCRF, except for endometrial
cancer, for which the association with physical activity is considered as probable
evidence (second highest grade) by the WCRF. We found only suggestive evidence to
support the association between any physical activity and endometrial cancer, because
the most stringent P threshold (P<10-6) and 95% prediction interval criteria were not
satisfied. The P-value criteria might be due to small number of cohort studies on
endometrial cancer (n=18) as compared to breast (n=38) and colon cancer (n=28)
literature. In fact, when we considered both cohort and case-control designs, and
therefore increased the statistical power, the association between physical activity and
endometrial cancer was supported by highly suggestive evidence. However, case-
control studies presented higher effect size estimates than cohort studies, probably
reflecting more bias. The source of heterogeneity (i.e., reflected in the 95% prediction
intervals) in our results on endometrial cancer might be due to obesity status.
Endometrial cancer is an obesity-related cancer (Kyrgiou et al., 2017) and BMI may
mediate the association between physical activity and endometrial cancer (Moore et al.,
2016). For instance, Moore et al. (2016) found that leisure-time physical activity
(LTPA) was associated with endometrial cancer only among individuals with high BMI.
Other mechanisms suggested for this association are hormone-related, such as reducing
insulin level and insulin resistance, decreasing estradiol and regulating estrogen
metabolism (WCRF, 2013).
Other cancer sites (esophageal, meningioma, lung, pancreas) showed less
consistent results with substantial uncertainty in the literature. None of these cancer
sites supported more stringent P thresholds used to avoid spurious precision results
derived from meta-analyses of observational studies. Three (esophageal, meningioma,

67
pancreas) out of four did not have more than 1000 cases to state conclusion.
Heterogeneity (I2 and 95% prediction intervals) and/or bias (small-study effect and
excess significant biases) were present in all these meta-analyses. Finally, other cancer
sites (bladder, chronic/small lymphocytic lymphoma, diffuse large B-cell lymphoma,
follicular lymphoma, gastric, glioma, Hodgkin and non-Hodgkin lymphoma, kidney,
leukemia, multiple myeloma, ovary, rectum, thyroid) did not showed statistically
significant associations at P<0.05 threshold. IARC and WCRF also have also
considered these associations between physical activity and these cancer sites with
limited evidence. However, a recent pooled data from 12 cohorts examined the
association between leisure-time physical activity (LTPA) and 26 types of cancer and
187 thousand cancer cases. LTPA was inversely associated (at P<0.05) with 13 cancer
sites (colon, breast, endometrial, esophageal adenocarcinoma, liver, kidney, gastric
cardia, myeloid leukemia, myeloma, head and neck, rectal, and bladder), and positively
associated with melanoma and prostate cancer (Moore et al., 2016). Although this paper
was not included in our umbrella review, as did not meet the eligibility criteria (i.e., was
not a systematic review of literature), we recognize its importance to the physical
activity and cancer literature. Thus, we applied our grading evidence criteria to their
findings. We found that only the association between LTPA and breast, kidney,
melanoma, and lung cancers were supported by strong evidence (Table S41). Therefore,
despite the uncertainty or bias that was found for many malignancies, these associations
could be confirmed as genuine in the future.
Physical activity is associated with obesity and diabetes, and these phenotypes
have also been associated to cancer at several sites (Giovannucci et al., 2010; Tsilidis et
al., 2015; Lauby-Secretan et al., 2016). Deciphering the exact causal contribution of
each of these factors is not easy. Both low within-population variability of and
measurement error for physical activity are also important concerns. Future prospective
cohort studies with objective measures (e.g., through accelerometers) of physical
activity trajectories may reduce misclassification and, therefore, reduce current
uncertain evidence for some cancer sites. In parallel, randomized controlled trials of
physical activity may help address directly the causal effects. Given the very long
follow-up required to study cancer outcomes, these studies are difficult to conduct.
However, given its potential major importance, physical activity interventions may need
to be studied with large randomized trials, much like other interventions (e.g., drugs)

68
have been studied (Naci; Ioannidis, 2013; Dal-Re et al., 2015).
Limitations
Umbrella reviews rely on methodological quality and report transparency of
meta-analysis. Despite the fact that the systematic reviews included in our umbrella
were of moderate to high methodological quality and were published on average in
2014 (2005 to 2017), some studies may have not been included either because
systematic reviews did not identify them or they were too recent to be included (Moore
et al., 2016). We re-performed most of the analysis reported in systematic reviews,
however substantial data were missing from some subgroup analyses (Table S42-S46).
We encourage future systematic reviews to report each individual-study estimate
included in its primary and main subgroup (sex, cancer location, histology) meta-
analyses.
Our analyses are based on the comparison between most active and least active
groups. A limitation of this approach is that measurement and classification of physical
activity across studies are heterogeneous and might not be comparable. Finally, tests
used to obtain hints of bias in the body of evidence (small-study effect and excess
significance tests) have low power if the meta-analyses include less than ten studies,
and they may not identify the exact source of bias (Lau et al., 2006; Sterne et al., 2011).
Conclusions
Despite the fact that physical activity has been associated with a lower risk of
several cancers in the literature, the associations for only colon and breast were
supported by strong or highly suggestive evidence, respectively. Evidence from other
cancer sites was less consistent, presenting hints of uncertainty and/or bias, but could be
confirmed as genuine in the future.

69
What is already known:
- Physical activity has been traditionally linked with lower risks of breast and colon
cancer
- Recently, multiple meta-analyses have showed that physical activity might be
additionally associated with lower risk of several other cancer sites.
- If these associations are causal, a substantial burden of cancer could be avoided
worldwide, but it is also plausible that some associations may be flawed due to biases in
the literature.
What are the new findings:
- This umbrella review synthesizes and evaluates the robustness of evidence and
appraises uncertainty and bias in the body of literature of the association between
physical activity and the risk of developing or dying from cancer.
- Of the 22 major anatomical cancer sites included in our primary analysis, only colon
cancer and breast cancer were supported by strong or highly suggestive evidence.
- Evidence from other cancer sites was less consistent, presenting hints of uncertainty
and bias in the literature.
3.5. REFERENCES
Behrens G, Jochem C, Keimling M, Ricci C, Schmid D, Leitzmann MF. The association
between physical activity and gastroesophageal cancer: systematic review and meta-
analysis. Eur J Epidemiol. 2014;29:151-70.
Farris MS, Mosli MH, McFadden AA, Friedenreich CM, Brenner DR. Physical activity
and risk of pancreatic cancer: a systematic review and meta-analysis. Eur J Epidemiol.
2015;30:279-98.
Behrens G, Leitzmann MF. The association between physical activity and renal cancer:
systematic review and meta-analysis. Br J Cancer. 2013;108:798-811.
Bellou V, Belbasis L, Tzoulaki I, Middleton LT, Ioannidis JPA, Evangelou E.
Systematic evaluation of the associations between environmental risk factors and
dementia: An umbrella review of systematic reviews and meta-analyses. Alzheimers
Dement. 2017;13:406-18.
Boffetta P, McLaughlin JK, La Vecchia C, Tarone RE, Lipworth L, Blot WJ. False-
positive results in cancer epidemiology: a plea for epistemological modesty. J Natl
Cancer Inst. 2008;100:988-95.

70
Boyle T, Keegel T, Bull F, Heyworth J, Fritschi L. Physical activity and risks of
proximal and distal colon cancers: a systematic review and meta-analysis. J Natl Cancer
Inst. 2012;104:1548-61.
Brenner DR, Yannitsos DH, Farris MS, Johansson M, Friedenreich CM. Leisure-time
physical activity and lung cancer risk: A systematic review and meta-analysis. Lung
Cancer. 2016;95:17-27.
Dal-Re R, Bracken MB, Ioannidis JP. Call to improve transparency of trials of non-
regulated interventions. BMJ. 2015;350:h1323.
Dwan K, Gamble C, Williamson PR, Kirkham JJ; Reporting Bias Group. Systematic
Review of the Empirical Evidence of Study Publication Bias and Outcome Reporting
Bias - An Updated Review. PLoS ONE. 2013;8:e66844.
Egger M, Davey Smith G, Schneider M, Minder C. Bias in meta-analysis detected by a
simple, graphical test. BMJ. 1997;315:629-34.
Giovannucci E, Harlan DM, Archer MC, Bergenstal RM, Gapstur SM, Habel LA,
Pollak M, Regensteiner JG, Yee D. Diabetes and cancer: a consensus report. Diabetes
Care. 2010;33:1674-85.
Guyatt GH, Oxman AD, Vist GE, Kunz R, Falck-Ytter Y, Alonso-Coello P,
Schünemann HJ; GRADE Working Group. GRADE: an emerging consensus on rating
quality of evidence and strength of recommendations. BMJ. 2008;336:924-26.
Hallal PC, Andersen LB, Bull FC, Guthold R, Haskell W, Ekelund U; Lancet Physical
Activity Series Working Group. Global physical activity levels: surveillance progress,
pitfalls, and prospects. Lancet. 2012;380:247-57.
Hardy RJ, Thompson SG. Detecting and describing heterogeneity in meta-analysis. Stat
Med. 1998;17:841-56.
Hill AB. The Environment and Disease: Association or Causation? Proc R Soc Med.
1965;58:295-300.
International Agency for Research on Cancer. IARC Handbook of Cancer Prevention.
Volume 6: Weight control and physical activity. Lyon: IARC press; 2002.
Ioannidis JP, Patsopoulos NA, Evangelou E. Uncertainty in heterogeneity estimates in
meta-analyses. BMJ. 2007;335:914-16.
Ioannidis JP, Trikalinos TA. An exploratory test for an excess of significant findings.
Clin Trials. 2007;4:245-253.
Ioannidis JP, Zhou Y, Chang CQ, Schully SD, Khoury MJ, Freedman AN. Potential
increased risk of cancer from commonly used medications: an umbrella review of meta-
analyses. Ann Oncol. 2014;25:16-23.
Ioannidis JP. Exposure-wide epidemiology: revisiting Bradford Hill. Stat Med.
2016;35:1749-62.
Ioannidis JP. Why most published research findings are false. PLoS Med. 2005;2:e124.
Keimling M, Behrens G, Schmid D, Jochem C, Leitzmann MF. The association
between physical activity and bladder cancer: systematic review and meta-analysis. Br J
Cancer. 2014;110:1862-70.

71
Keum N, Bao Y, Smith-Warner SA, Orav J, Wu K, Fuchs CS, Giovannucci EL.
Association of physical activity by type and intensity with digestive system cancer risk.
JAMA Oncol. 2016;2:1146-53.
Kyrgiou M, Kalliala I, Markozannes G, Gunter MJ, Paraskevaidis E, Gabra H, Martin-
Hirsch P, Tsilidis KK. Adiposity and cancer at major anatomical sites: umbrella review
of the literature. BMJ. 2017;356:j477.
Kyzas PA, Denaxa-Kyza D, Ioannidis JP. Almost all articles on cancer prognostic
markers report statistically significant results. Eur J Cancer. 2007;43:2559-79.
Lau J, Ioannidis JP, Terrin N, Schmid CH, Olkin I. The case of the misleading funnel
plot. BMJ. 2006;333:597-600.
Lauby-Secretan B, Scoccianti C, Loomis D, Grosse Y, Bianchini F, Straif K;
International Agency for Research on Cancer Handbook Working Group. Body Fatness
and Cancer-Viewpoint of the IARC Working Group. NEJM. 2016;375:794-98.
Lawlor DA, Tilling K, Davey Smith G. Triangulation in aetiological epidemiology. Int
J Epidemiol. 2016;45:1866-86.
Liu Y, Hu F, Li D, Wang F, Zhu L, Chen W, Ge J, An R, Zhao Y. Does physical
activity reduce the risk of prostate cancer? A systematic review and meta-analysis. Eur
Urol. 2011;60:1029-44.
Markozannes G, Tzoulaki I, Karli D, Evangelou E, Ntzani E, Gunter MJ, Norat T,
Ioannidis JP, Tsilidis KK. Diet, body size, physical activity and risk of prostate cancer:
An umbrella review of the evidence. Eur J Cancer. 2016;69:61-69.
Moore SC, Lee IM, Weiderpass E, Campbell PT, Sampson JN, Kitahara CM, Keadle
SK, Arem H, Berrington de Gonzalez A, Hartge P, Adami HO, Blair CK, Borch KB,
Boyd E, Check DP, Fournier A, Freedman ND, Gunter M, Johannson M, Khaw KT,
Linet MS, Orsini N, Park Y, Riboli E, Robien K, Schairer C, Sesso H, Spriggs M, Van
Dusen R, Wolk A, Matthews CE, Patel AV4. Association of Leisure-Time Physical
Activity With Risk of 26 Types of Cancer in 1.44 Million Adults. JAMA Intern Med.
2016;176:816-25.
Naci H, Ioannidis JP. Comparative effectiveness of exercise and drug interventions on
mortality outcomes: metaepidemiological study. BMJ. 2013;347:f5577.
Neilson HK, Farris MS, Stone CR, Vaska MM, Brenner DR, Friedenreich CM.
Moderate-vigorous recreational physical activity and breast cancer risk, stratified by
menopause status: a systematic review and meta-analysis. Menopause. 2017;24:322-44.
Niedermaier T, Behrens G, Schmid D, Schlecht I, Fischer B, Leitzmann MF. Body mass
index, physical activity, and risk of adult meningioma and glioma: A meta-analysis.
Neurology. 2015;85:1342-50.
Pizot C, Boniol M, Mullie P, Koechlin A, Boniol M, Boyle P, Autier P. Physical
activity, hormone replacement therapy and breast cancer risk: A meta-analysis of
prospective studies. Eur J Cancer. 2016;52:138-54.
Psaltopoulou T, Ntanasis-Stathopoulos I, Tzanninis IG, Kantzanou M, Georgiadou D,
Sergentanis TN. Physical Activity and Gastric Cancer Risk: A Systematic Review and
Meta-Analysis. Clin J Sport Med. 2016;26:445-64.

72
Riley RD, Higgins JP, Deeks JJ. Interpretation of random effects meta-analyses. BMJ.
2011;342:d549.
Salanti G, Ioannidis JP. Synthesis of observational studies should consider credibility
ceilings. J Clin Epidemiol. 2009;62:115-22.
Schmid D, Behrens G, Keimling M, Jochem C, Ricci C, Leitzmann M. A systematic
review and meta-analysis of physical activity and endometrial cancer risk. Eur J
Epidemiol. 2015;30:397-12.
Schoenfeld JD, Ioannidis JP. Is everything we eat associated with cancer? A systematic
cookbook review. Am J Clin Nutr. 2013;97:127-34.
Shea BJ, Grimshaw JM, Wells GA, Boers M, Andersson N, Hamel C, Porter AC,
Tugwell P, Moher D, Bouter LM. Development of AMSTAR: a measurement tool to
assess the methodological quality of systematic reviews. BMC Med Res Methodol.
2007;7:10.
Sterne JA, Sutton AJ, Ioannidis JP, Terrin N, Jones DR, Lau J, Carpenter J, Rücker G,
Harbord RM, Schmid CH, Tetzlaff J, Deeks JJ, Peters J, Macaskill P, Schwarzer G,
Duval S, Altman DG, Moher D, Higgins JP. Recommendations for examining and
interpreting funnel plot asymmetry in meta-analyses of randomised controlled trials.
BMJ. 2011;343:d4002.
Taubes G. Epidemiology faces its limits. Science. 1995;269:164-69.
Tsilidis KK, Kasimis JC, Lopez DS, Ntzani EE, Ioannidis JP. Type 2 diabetes and
cancer: umbrella review of meta-analyses of observational studies. BMJ.
2015;350:g7607.
Tsilidis KK, Papatheodorou SI, Evangelou E, Ioannidis JP. Evaluation of excess
statistical significance in meta-analyses of 98 biomarker associations with cancer risk. J
Natl Cancer Inst. 2012;104:1867-78.
US Department of Health Education and Welfare. Smoking and Health. Report of the
Advisory Committee to the Surgeon General of the Public Health Service. Publication
1103. Washington: US Government Printing Office; 1964.
Wolin KY, Yan Y, Colditz GA, Lee IM. Physical activity and colon cancer prevention:
a meta-analysis. Br J Cancer. 2009;100:611-16.
World Cancer Research Fund/American Institute for Cancer Research. Food, Nutrition,
Physical Activity, and the Prevention of Cancer: A Global Perspective. Washington:
American Institute for Cancer Research; 2007.
World Cancer Research Fund/American Institute for Cancer Research. Continuous
Update Project Report. Food, Nutrition, Physical Activity, and the Prevention of
Colorectal Cancer; 2011.
World Cancer Research Fund/American Institute for Cancer Research. Continuous
Update Project Report. Continuous Update Project Report. Food, Nutrition, Physical
Activity, and the Prevention of Breast Cancer; 2010.
World Cancer Research Fund/American Institute for Cancer Research. Continuous
Update Project Report. Food, Nutrition, Physical Activity, and the Prevention of
Endometrial Cancer; 2013.

73
World Cancer Research Fund/American Institute for Cancer Research. Diet, Nutrition,
Physical Activity and Cancer: a Global Perspective. Continuous Update Project Expert
Report; 2018.
Young NS, Ioannidis JP, Al-Ubaydli O. Why current publication practices may distort
science. PLoS Med. 2008;5:e201.
Zhong S, Chen L, Lv M, Ma T, Zhang X, Zhao J. Nonoccupational physical activity and
risk of ovarian cancer: a meta-analysis. Tumour Biol. 2014;35:11065-73.

74
4. ATIVIDADE FÍSICA DURANTE A ADOLESCÊNCIA E RISCO
DE ADENOMA COLORRETAL NA FASE ADULTA
Este capítulo apresenta o artigo “Physical activity during adolescence and risk of
colorectal adenoma in women” de autoria de Leandro Fórnias Machado de Rezende,
Dong Hoon Lee, NaNa Keum, Katharina Nimptsch, Mingyang Song, I-Min Lee, José
Eluf-Neto, Shuji Ogino, Charles Fuchs, Jeffrey Meyerhardt, Andrew T Chan, Walter
Willett, Edward Giovannucci, Kana Wu. O artigo foi submetido para publicação na
revista British Journal of Cancer.
Esse manuscrito foi elaborado durante o estágio de pesquisa no exterior na Harvard
T.H. Chan School of Public Health. Donghoon Lee e eu trabalhamos em parceria nesse
manuscrito e contribuímos igualmente na elaboração do mesmo, de modo que
compartilhamos a primeira autoria.
Para citação: Rezende LFM, Lee DH, Keum N, Nimptsch K, Song M, Lee IM, Eluf-
Neto J, Ogino S, Fuchs C, Meyerhardt, Chan AT, Willett W, Giovannucci E, Wu K.
Physical activity during adolescence and risk of colorectal adenoma in women. In
preparation.

75
Physical activity during adolescence and risk of colorectal adenoma in
women: results from the Nurses’ Health Study II
Leandro Fórnias Machado de Rezende1,2#, Dong Hoon Lee2#, NaNa Keum2,3*, Katharina
Nimptsch2,4, Mingyang Song2,5,6, I-Min Lee7,8, José Eluf-Neto1, Shuji Ogino8,9,10,
Charles Fuchs11,12, Jeffrey Meyerhardt13, Andrew T Chan5,6,10,11, Walter Willett2,8,11,
Edward Giovannucci2,8,11, Kana Wu2
1 Departamento de Medicina Preventiva, Faculdade de Medicina FMUSP, Universidade
de Sao Paulo, Sao Paulo, SP, Brazil
2 Department of Nutrition, Harvard T.H. Chan School of Public Health, Boston, MA,
USA
3 Department of Food Science and Biotechnology, Dongguk University, Goyang, South
Korea
4 Molecular Epidemiology Research Group, Max Delbrück Center for Molecular
Medicine (MDC), Berlin, Germany
5 Division of Gastroenterology, Massachusetts General Hospital and Harvard Medical
School, Boston, MA, USA
6 Clinical and Translational Epidemiology Unit, Massachusetts General Hospital and
Harvard Medical School, Boston, MA, USA
7 Division of Preventive Medicine, Brigham and Women’s Hospital, Harvard Medical
School, Boston, MA, USA
8 Department of Epidemiology, Harvard T.H. Chan School of Public Health, Boston,
MA, USA
9 Department of Oncologic Pathology, Dana-Farber Cancer Institute, Boston, MA, USA
10 Broad Institute of MIT and Harvard, Cambridge, MA, USA
11 Channing Division of Network Medicine, Brigham and Women's Hospital and
Harvard Medical School, Boston, MA, USA
12 Yale Cancer Center, New Haven, CT, USA
13 Dana Farber Cancer Institute, Boston, MA, USA
# These authors contributed equally to this paper
*Corresponding author contact:
Dr. NaNa Keum, Department of Food Science and Biotechnology, Dongguk University,
Goyang, South Korea.
Address: DongGuk University, SangMyung building Room 543
Siksa-dong, Ilsandong-gu, Goyang-si Gyeonggi-do 10326
Email: [email protected]
Phone: 82-31-961-5145

76
ABSTRACT
Background: Physical activity during adulthood has been consistently associated with
lower risk of colorectal adenomas and cancer (particularly colon), but whether physical
activity during adolescence may also play a role in colorectal carcinogenesis is unclear.
Methods: We used data from 28,250 women in the Nurses’ Health Study II who
provided data on physical activity during adolescence (12-22 years) in 1997, a validated
high-school food frequency questionnaire in 1998 and underwent at least one lower
bowel endoscopy from 1998 to 2011. We used logistic regression models for clustered
data to examine the association between physical activity during adolescence and risk of
adenomas later in life. We also evaluated the joint associations of physical activity
during adolescence and adulthood with regard to risk of colorectal adenoma.
Results: Physical activity during adolescence was inversely associated with risk of
colorectal adenomas (2373 cases), independent of physical activity during adulthood.
The multivariable-adjusted odds ratio (OR) of all adenomas was 0.89 (95% CI 0.77 to
1.02; Ptrend = 0.03) comparing women with ≥72 metabolic equivalent of tasks-
hours/week (MET-h/week) to <21 MET-h/week. Women with high physical activity
during both adolescence (≥53.3 MET-h/week) and adulthood (≥23.1 MET-h/week) had
the lowest risk of adenoma later in life (all adenoma: OR 0.71; 95% CI 0.58 to 0.87;
advanced adenoma: 0.61; 95% CI 0.45 to 0.82).
Conclusions: Our findings suggest that physical activity during adolescence may lower
risk of colorectal adenoma; those who maintained higher levels of physical activity both
early and later in life had the lowest risk of adenoma.

77
4.1. INTRODUCTION
Most of the evidence on risk factors for colorectal cancer is based on
epidemiological studies including mid-to late life populations (WCRF, 2018).
Considering the long process of colorectal carcinogenesis, it is biologically plausible
that early-life exposures (e.g., those affecting insulin-IGF pathways) may contribute to
colorectal cancer risk (Vogelstein et al., 1988; Leslie et al., 2002). However, studies
examining a role of early-life exposures (other than body fatness) on colorectal
carcinogenesis are limited (Nimptsch et al., 2011; 2013; 2014; Clarke; Joshu, 2017).
Physical activity during adulthood is one of the most consistent factors
associated with reduced risk of colorectal cancer (IARC, 2002; WCRF, 2018; Rezende
et al., 2018). Evidence suggests that physical activity may potentially act during the
early stages of colorectal carcinogenesis as it is associated with lower risk of adenoma,
especially advanced adenoma (Wolin et al., 2011), an established precursor of colorectal
cancer (Vogelstein et al., 1988; Leslie et al., 2002; Strum, 2016). Notwithstanding, there
is limited evidence regarding early-life physical activity and risk of colorectal adenomas
and cancer (Lee et al., 1991; Levi et al., 1999; Tavani et al., 1999). We hypothesize that
higher physical activity during adolescence is associated to lower risk of colorectal
adenomas later in life, which may have important public health implications for
adolescents in terms of cancer prevention. To test this hypothesis, we utilized data from
a large cohort study of US women, the Nurses’ Health Study II (NHSII).
4.2. METHODS
Study population
The NHSII enrolled 116,608 female nurses residing in the US aged 25-42 years
old in 1989, when participants completed a baseline self-administered questionnaire
about lifestyle risk factors and diagnosed conditions. Since then, biennial questionnaires
were sent to update this information, with response rates over 93%. More details about
the NHS II are described elsewhere (Bao et al., 2016; 2018). This study was approved
by the Institutional Review Boards of the Brigham and Women's Hospital and the
Harvard T.H. Chan School of Public Health.

78
Assessment of physical activity
The 1997 questionnaire inquired about physical activity during adolescence and
early adulthood. Participants reported average hours a week (none, 1, 2-5, 6-10, 11-20,
21-40, 41-60, 61-90, 90+ h/week) of walking to and from school or work, moderate
recreational activities (e.g., hiking, walking for exercise, casual cycling, yard work), and
strenuous recreational activities (e.g., running, aerobics, lap swimming) during grades
7-8 (12-13 years), grades 9-12 (14-17 years), ages 18-22, ages 23-29, and ages 30-34.
We assigned average metabolic equivalent of task (MET) for each of these activities to
classify intensities (i.e., walking 3 MET, moderate 4.5 MET, and strenuous 7 MET)
based on the compendium of physical activities (Ainsworth et al., 1993; 2011). We
summed MET-h/week in each of these activities to obtain total physical activity. In this
study, we calculated average of total physical activity from ages 12 to 22 to estimate the
engagement in physical activities during adolescence.
Adult recreational physical activity (32-64 years of age) was assessed in 1989,
1991, 1997, 2001, 2005, and 2009 (Wolf et al., 1994). Participants reported average
time spent per week on a variety of recreational activities. We assigned MET values for
each of these activities (Ainsworth et al., 1993; 2011) to obtain average total physical
activity (in MET-h/week) in each questionnaire cycle where physical activity was
assessed. More details regarding reproducibility and validity of the physical activity
questionnaires are described in the Supplemental Material as well as in previous
publications (Jacobs et al., 1993; Ainsworth et al., 1993; Wolf et al., 1994; Hunter et al.,
1994, Chasan-Taber et al., 1996, Baer et al., 2005, Maruti et al., 2008). Cumulative
average adult physical activity was calculated using all available data up to and
including the questionnaire 2-years prior to the follow-up cycle at which the most recent
endoscopy was reported. Total physical activity during adolescence (12 to 22 years) and
cumulative average adult physical activity were weakly correlated (Spearman r = 0.19;
P<0.001).
Assessment of dietary factors and other covariates
In 1991 and every 4 years thereafter, diet was assessed through a validated semi-
quantitative food frequency questionnaire (FFQ) (Yuan et al. 2017; 2018). In addition,
in 1998, 47,355 participants (55% of the cohort), at that time 34-51 years old,
completed a validated FFQ inquiring about diet during high school. Previous analyses

79
showed that the risk factor profiles of this subsample were similar to those who did not
respond to the high school FFQ (Nimptsch et al., 2013).
Height and current weight were obtained on the 1989 baseline questionnaire
which also included a 9-level figure on body shape representing body fatness (the
higher the values, the higher body fatness) at age 5, 10 and 20 years. Weight and other
relevant covariates such as lifestyle factors (e.g., aspirin use, smoking status, alcohol
intake, family history of colorectal cancer) were updated every 2 years (Nimptsch et al.,
2011).
Outcome ascertainment
Polyps are often asymptomatic and detected during a lower bowel endoscopy
(i.e., either sigmoidoscopy or colonoscopy). Between 1998 and 2011, participants were
asked on their biannual follow-up questionnaire whether they underwent a lower bowel
endoscopy, the reasons for endoscopy (symptoms or screening) and whether colorectal
polyps were diagnosed. Participants who reported a diagnosis of colorectal polyps were
mailed a form requesting permission to obtain and review medical records. Study
investigators who were blinded to exposure status (e.g., physical activity) reviewed
medical records and recorded anatomical location (proximal, distal, and rectum),
subtype (adenoma only, serrated lesions only, both adenoma and serrated lesions) (East
et al., 2015), and histology and size (advanced: defined as size ≥1cm or any mention of
villous histology or high-grade dysplasia; non-advanced: < 1cm and tubular adenomas)
of colorectal polyps.
Statistical analysis
For this analysis, we included 28,250 women who responded to a) the 1997
questionnaire, which included information about physical activity during adolescence
and adulthood, b) the 1998 FFQ high school questionnaire, and c) underwent at least
one lower bowel endoscopy during our follow-up period, i.e., 1998 to 2011. To consider
individuals who underwent multiple endoscopies between 1998 and 2011 and reduce
potential bias due to time-varying exposure, we used an Anderson-Gill data set structure
with a new record for each 2-year follow-up during which participants underwent an
endoscopy. Therefore, participants who underwent multiple endoscopies during follow-
up could have multiple observations in the dataset. Exposure and covariates were set at

80
one cycle (2 years) prior the endoscopy. Once polyps were diagnosed, participants were
censored for later follow-up cycles.
We used multivariable logistic regression (PROC GENMOD) for clustered data
(i.e., each participant was defined as a cluster, therefore accounting for multiple
endoscopies) to estimate odds ratios (OR) and 95% confidence intervals for the
association between total physical activity during adolescence (<21, 21 to 35.9, 36 to
47.9, 48 to 71.9, ≥72 MET-h/week) and risk of adenoma. Categories of physical activity
were derived based on its distribution and informative cutoffs (Maruti et al., 2008). We
also estimated associations per 21 MET-h/week (i.e., equivalent to 1 hour of moderate
intensity physical activity every day, which is the recommended physical activity level
for children and adolescents (WHO, 2010) and tested for trend via a Wald test by
including the median of physical activity in each category as a single continuous
exposure variable into the models.
We ran different multivariable models adjusting for several adolescent and adult
covariates selected based on the literature on risk factors for colorectal adenomas or
cancer (Nimptsch et al., 2011; 2013; 2014; Clarke; Joshu, 2017; WCRF, 2018). The
first model (age-adjusted) included age at baseline, time period of endoscopy, number
of reported endoscopies, time in years since most recent endoscopy and reason for
current endoscopy. The second multivariable model was additionally adjusted for height
(continuous), body fatness (1, 2, 3, 4, 5, ≥6) at 5 years (i.e., body shape at age 5 was the
strongest predictor of adenoma (Nimptsch et al., 2011), total calories (quintiles),
unprocessed red meat and processed meat (quintiles), total dairy (quintiles), and total
fiber (quintiles) during adolescence and current (adult) aspirin use (yes/no), alcohol
intake (<4.9, 5-9.9, 10-14.9, ≥15 g/d), pack-years of smoking (never, 0-10, >10-20,
>20-40, >40 pack-years), and family history of colorectal cancer (yes/no). We also ran
additional analyses including cumulative average adult physical activity (quintiles),
adult body mass index (BMI, <25, 25 to 29.9, ≥30 kg/m2), and television viewing
during adolescence (<3.5, 3.5 to 6.9, 7 to 10.4, 10.5 to 13.9, ≥14 h/week) to examine
whether the associations were independent of these exposures. Finally, we tested the
influence of other potential confounders during adolescence (i.e., total folate intake,
total calcium intake and western dietary pattern during high school, pack-years of
smoking before age 20, and BMI at age 18) and adulthood (postmenopausal hormone
use, total fiber, red and processed meat intake) by including these variables separately

81
(i.e., one by one) to the multivariable model. These covariates did not alter the
magnitude of associations found in the multivariable model, therefore, we excluded
them from the final model. We used missing indicator for participants with missing
information on covariates.
To explore whether the association between physical activity during adolescence
and adenomas differ by potential effect modifiers, we performed subgroup analyses by
family history of colorectal cancer, age at adenoma diagnosis (<50 years and ≥50
years), BMI at 18 years (<23 kg/m2 and ≥23 kg/m2), and smoking status (never and
ever). Tests for interaction were performed by including the multiplicative term (cross-
product term) of the exposure and each of the stratified variables in the model. We also
evaluated joint associations of physical activity during adolescence and adulthood with
regard to risk of adenoma. Distribution of physical activity level differed between
adolescence (median 40.1 MET-week; interquartile range from 23.8 to 70.4) and
adulthood (median 26.4 MET-week; interquartile range from 8.7 to 28.6). Therefore, we
classified participants into four groups according to physical activity and stage of life
defining high physical activity a priori as highest tertile (≥53.3 MET-h/week for
adolescence and ≥23.1 MET-h/week for adulthood) and low physical activity as the
bottom two tertiles. We used SAS 9.4 for all analyses (SAS institute Inc., Cary, NC,
USA). A P-value of <0.05 was considered statistically significant.
4.3. RESULTS
Among 28,250 women included in the study, 2373 adenoma cases were
diagnosed between 1998 and 2011 (proximal colon: 1171, distal colon: 1029, rectum:
398). Characteristics of the participants by level of physical activity during adolescence
are shown in Table 1. Participants with higher levels of physical activity during
adolescence were more likely to have lower body fatness at 5-20 years and lower BMI
at 18 years. On the other hand, they were more likely current smokers and to have
higher total energy and unprocessed red meat intake during both adolescence and
adulthood (Table 1).

82
Table 1 - Baseline characteristics of participants by total physical activity during adolescence, Nurses'
Health Study II, 1997
Characteristic*
Total physical activity during adolescence (in MET-h/week)
<21
(n=5,689)
21 to <36
(n=6,589)
36 to <48
(n=4,568)
48 to <72
(n=6,019)
72+
(n=5,385)
Age at 1997 questionnaire return, yrs.† 51.4 (4.8) 51.0 (4.9) 50.8 (5.0) 50.7 (5.1) 50.5 (5.1)
Number of endoscopies during the
study period (n)
1.6 (0.8) 1.6 (0.8) 1.5 (0.8) 1.5 (0.8) 1.6 (0.8)
Height (baseline) (inches) 64.8 (2.5) 64.8 (2.6) 65.0 (2.6) 65.0 (2.6) 65.1 (2.7)
BMI at age 18 years (kg/m2) 21.4 (3.5) 21.2 (3.2) 21.1 (3.1) 21.0 (3.0) 20.8 (2.8)
Current BMI (kg/m2) 25.7 (5.6) 25.6 (5.4) 25.7 (5.7) 25.7 (5.4) 26.0 (5.5)
Waist (inches) 30.9 (5.1) 30.8 (5.1) 30.7 (5.0) 30.5 (4.8) 30.7 (5.0)
Hip (inches) 39.4 (4.4) 39.4 (4.4) 39.3 (4.3) 39.2 (4.3) 39.3 (4.3)
Waist/hip ratio 0.78(0.08) 0.78(0.08) 0.78(0.08) 0.78(0.08) 0.78(0.08)
Body shape§ (% of ≥5)
At 5 years of age 8.6 7.1 6.3 6.6 5.0
At 10 years of age 16.5 13.2 11.6 10.9 8.4
At 20 years of age 14.3 10.8 9.6 8.4 6.8
Smoking
Before 20 years of age (%) 24.4 22.7 22.9 21.7 23.5
Current smokers (%) 5.9 6.7 7.3 8.3 10.0
Current alcohol intake (g/d), 3.9 (6.3) 4.2 (6.5) 4.2 (6.4) 4.1 (6.3) 4.2 (6.5)
Current physical activity (MET/week) 17.2 (17.9) 19.0 (18.1) 20.6 (20.5) 22.2 (20.4) 26.0 (24.0)
Time spent watching television
During adolescence (hours/week) 7.6 (6.3) 7.5 (6.0) 7.5 (5.8) 7.7 (6.0) 8.1(6.2)
Current (hours/week) 8.9 (6.9) 8.8 (6.4) 8.8 (6.4) 9.1 (6.6) 9.3 (6.8)
Premenopausal (%) 52.5 52.9 52.2 52.5 52.1
Family history of colorectal cancer (%) 27.7 27.4 25.6 26.3 27.9
Current Aspirin use (≥2 twice a week) 8.8 8.7 9.8 9.2 9.4
Dietary intake during adolescence
Total energy intake (kcal/day) 2609 (778) 2692 (756) 2739 (767) 2797 (775) 2934 (799)
Unprocessed red meat (g/day) 105.3 (49.2) 107.7 (52.2) 107.1 (51.2) 108.3 (51.7) 111.5 (52.7)
Processed meat (g/day) 23.5 (20.1) 22.6 (18.3) 22.7 (17.9) 22.5 (18.1) 23.9 (19.8)
Total dairy (servings/day) 2.6 (1.5) 2.8 (1.4) 2.8 (1.5) 3.0 (1.5) 3.1 (1.6)
Total fiber (g/day) 19.8 (4.9) 20.5 (5.2) 20.8 (5.1) 21.2 (5.3) 21.5 (5.5)
Total calcium (mg/day) 1057 (358) 1078 (344) 1088 (343) 1097 (340) 1091 (342)
Total folate (μg/day) 304 (88) 317 (91) 318 (90) 326 (98) 328 (96)
Adult dietary intake (baseline**)
Total energy intake (kcal/day) 1707 (474) 1766 (470) 1793 (479) 1817 (489) 1886 (508)
Unprocessed red meat (g/day) 51.8 (40.6) 54.0 (39.3) 55.3 (41.6) 56.1 (42.5) 61.0 (44.7)
Processed meat during (g/day) 6.3 (10.0) 6.2 (8.8) 6.6 (9.7) 6.5 (8.6) 7.4 (10.1)
Total fiber (g/day) 18.8 (5.4) 19.2 (5.5) 19.2 (5.3) 19.4 (5.3) 19.2 (5.2)
Total calcium (mg/day) 1072 (433) 1074 (415) 1072 (423) 1064 (420) 1041 (404)
Total folate (μg/day) 473 (236) 480 (230) 478 (228) 482 (235) 474 (224)

83
Physical activity during adolescence was inversely associated with risk of
adenoma, independent of physical activity during adulthood (Table 2). The magnitude
of association was modest, with multivariable-adjusted OR of 0.89 (95% CI 0.77 to
1.02) comparing ≥72 MET-h/week to <21 MET-h/week (reference group). The OR of
adenoma per 21 MET-h/week was 0.96 (95% CI 0.93 to 0.99; Ptrend = 0.02). Results
were similar after further adjustment for physical activity and BMI during adulthood
and television watching during adolescence (Table S1).

84
Table 2 - Odds ratio of colorectal adenoma associated with total physical activity during adolescence by colorectal location. Nurses' Health Study II,
1997-2011
Total physical activity during adolescence (in MET-h/week)
<21 21 to <36 36 to <48 48 to <72 72+ Per 21 MET-
h/week Ptrend
All adenomas
N Cases 503 579 416 466 409
Age-adjusted* 1 1.01(0.90-1.15) 1.06(0.93-1.22) 0.90(0.79-1.03) 0.88(0.77-1.01) 0.96(0.93-0.99) 0.01
Multivariable† 1 1.02(0.90-1.16) 1.07(0.94-1.23) 0.91(0.80-1.04) 0.89(0.77-1.02) 0.96(0.93-0.99) 0.02
Multivariable† plus adult physical activity 1 1.02(0.90-1.16) 1.08(0.94-1.23) 0.92(0.80-1.05) 0.90(0.78-1.03) 0.96(0.93-1.00) 0.03
Location
Proximal adenomas
N Cases 252 290 205 227 197
Age-adjusted* 1 1.02(0.85-1.21) 1.05(0.87-1.27) 0.88(0.73-1.06) 0.85(0.70-1.03) 0.95(0.91-0.99) 0.03
Multivariable† 1 1.02(0.85-1.21) 1.06(0.87-1.28) 0.89(0.73-1.07) 0.86(0.70-1.04) 0.95(0.91-1.00) 0.04
Multivariable† plus adult physical activity 1 1.02(0.86-1.22) 1.06(0.88-1.29) 0.90(0.74-1.08) 0.87(0.72-1.07) 0.96(0.91-1.00) 0.07
Distal adenomas
N Cases 219 255 174 193 188
Age-adjusted* 1 1.03(0.85-1.23) 1.02(0.83-1.25) 0.86(0.71-1.05) 0.93(0.76-1.14) 0.97(0.92-1.02) 0.21
Multivariable† 1 1.04(0.87-1.26) 1.04(0.85-1.28) 0.88(0.72-1.07) 0.94(0.76-1.15) 0.97(0.92-1.02) 0.22
Multivariable† plus adult physical activity 1 1.04(0.86-1.26) 1.04(0.85-1.28) 0.88(0.72-1.08) 0.94(0.77-1.16) 0.97(0.92-1.02) 0.26
Rectal adenomas
N Cases 84 86 73 81 74
Age-adjusted* 1 0.90(0.66-1.21) 1.11(0.80-1.52) 0.93(0.68-1.27) 0.94(0.69-1.30) 0.99(0.92-1.07) 0.80
Multivariable† 1 0.91(0.67-1.24) 1.13(0.82-1.55) 0.94(0.69-1.29) 0.94(0.68-1.30) 0.99(0.91-1.07) 0.76
Multivariable† plus adult physical activity 1 0.92(0.68-1.25) 1.15(0.84-1.58) 0.96(0.70-1.32) 0.97(0.69-1.35) 0.99(0.92-1.08) 0.90
*Adjusted for age, time period of endoscopy, number of reported endoscopies, time in years since most recent endoscopy and reason for current endoscopy.
†Additionally adjusted for height (inches), body shape at 5 years (1, 2, 3, 4, 5, ≥6), total calories during adolescence (quintiles), unprocessed red meat and processed meat during
high school (quintiles), total dairy during adolescence (quintiles), total fiber during adolescence (quintiles), current (adult) aspirin use (yes/no), current (adult) alcohol intake (<4.9,
5-9.9, 10-14.9, 15+ g/d), current (adult) pack-years of smoking (never, 0-10, >10-20, >20-40, 40+ pack-years), and family history of colorectal cancer (yes/no).

85
When we analyzed data separately by location, physical activity during
adolescence was associated with lower risk of proximal adenomas, but not rectal and
distal adenomas (Table 2). Furthermore, we observed inverse associations for adenoma
only, but not for serrated lesions only (Table 3). The inverse associations also appeared
to be stronger among women with no family history of colorectal cancer and age at
adenoma diagnosis ≥50 years, although the interaction was only statistically significant
for the later (P<0.01) (Table S2).
We assessed joint associations of physical activity during adolescence and
adulthood with regard to risk of adenomas. We observed non-significant lower risk of
adenoma among women with high physical activity during adolescence only (OR 0.93;
95% CI 0.83 to 1.04) and during adulthood only (OR 0.91; 95% CI 0.82 to 1.02)
compared to women with low physical activity in both stages of life. The strongest
inverse association was found for women with high physical activity during both
adolescence and adulthood (OR 0.76; 95% CI 0.66 to 0.88) (Figure 1). Inverse
associations were more pronounced for advanced adenoma than for non-advanced
adenoma. Participants with high physical activity during both adolescence and
adulthood had a 39% lower risk of advanced adenomas (0.61; 95% CI 0.45 to 0.82)
compared to women with low physical activity during both stages of life.

86
Table 3 - Odds ratio of colorectal adenoma associated with total physical activity during adolescence by stage and subtype of colorectal
polyp. Nurses' Health Study II, 1997-2011
Total physical activity during adolescence (in MET-h/week)
<21 21 to <36 36 to <48 48 to <72 72+ Per 21 MET-
h/week Ptrend
Colorectal adenomas
By Stage
Advanced
N Cases 105 156 110 106 89
Age-adjusted* 1 1.31(1.02-1.69) 1.34(1.02-1.76) 0.98(0.75-1.29) 0.92(0.69-1.23) 0.94(0.88-1.00) 0.07
Multivariable† 1 1.34(1.04-1.73) 1.36(1.03-1.78) 1.00(0.76-1.32) 0.91(0.68-1.23) 0.94(0.88-1.00) 0.06
Multivariable† plus adult physical activity 1 1.35(1.05-1.74) 1.38(1.05-1.81) 1.02(0.77-1.35) 0.94(0.70-1.27) 0.95(0.88-1.01) 0.11
Non-advanced
N Cases 294 318 225 257 247
Age-adjusted* 1 0.95(0.81-1.12) 0.98(0.82-1.17) 0.85(0.71-1.01) 0.90(0.76-1.07) 0.97(0.93-1.01) 0.16
Multivariable† 1 0.96(0.81-1.13) 0.99(0.83-1.19) 0.86(0.72-1.02) 0.91(0.76-1.09) 0.97(0.93-1.02) 0.21
Multivariable† plus adult physical activity 1 0.96(0.81-1.13) 0.99(0.83-1.19) 0.86(0.72-1.03) 0.92(0.77-1.10) 0.97(0.93-1.02) 0.24
By Subtype
Adenoma only
N Cases 406 490 341 363 331 Age-adjusted* 1 1.06(0.93-1.22) 1.08(0.93-1.26) 0.87(0.75-1.01) 0.88(0.76-1.03) 0.95(0.92-0.99) 0.01
Multivariable† 1 1.07(0.94-1.23) 1.10(0.95-1.28) 0.88(0.76-1.02) 0.90(0.77-1.05) 0.95(0.92-0.99) 0.01
Multivariable† plus adult physical activity 1 1.07(0.94-1.23) 1.10(0.95-1.28) 0.89(0.76-1.03) 0.90(0.77-1.06) 0.96(0.92-0.99) 0.02
Serrated lesions only
N Cases 339 378 272 347 309
Age-adjusted* 1 0.98(0.84-1.14) 1.02(0.87-1.21) 0.99(0.85-1.16) 0.98(0.83-1.15) 1.00(0.96-1.04) 0.85
Multivariable† 1 0.99(0.85-1.16) 1.04(0.88-1.23) 1.01(0.86-1.18) 0.97(0.82-1.14) 0.99(0.95-1.03) 0.69
Multivariable† plus adult physical activity 1 0.99(0.85-1.15) 1.04(0.88-1.23) 1.01(0.86-1.18) 0.97(0.83-1.15) 0.99(0.96-1.03) 0.77
Both adenoma and serrated lesions
N Cases 97 89 75 103 78
Age-adjusted* 1 0.81(0.61-1.09) 1.01(0.74-1.36) 1.04(0.79-1.38) 0.89(0.65-1.20) 1.00(0.93-1.07) 0.91
Multivariable† 1 0.81(0.61-1.09) 0.99(0.72-1.35) 1.03(0.77-1.37) 0.84(0.61-1.14) 0.98(0.91-1.06) 0.60
Multivariable† plus adult physical activity 1 0.82(0.61-1.10) 1.00(0.73-1.36) 1.05(0.79-1.40) 0.86(0.63-1.17) 0.99(0.92-1.06) 0.74
*Adjusted for age, time period of endoscopy, number of reported endoscopies, time in years since most recent endoscopy and reason for current endoscopy.
†Additionally adjusted for height (inches), body shape at 5 years (1, 2, 3, 4, 5, ≥6), total calories during adolescence (quintiles), unprocessed red meat and
processed meat during adolescence (quintiles), total dairy during adolescence (quintiles), total fiber during adolescence (quintiles), current (adult) aspirin use
(yes/no), current (adult) alcohol intake (<4.9, 5-9.9, 10-14.9, 15+ g/d), current (adult) pack-years of smoking (never, 0-10, >10-20, >20-40, 40+ pack-years),
and time spent watching television during adolescence (0.5, 0.5-1, 1-1.5, 1.5-2, 2+ h/day)

87
Figure 1 - Joint association of total physical activity during adolescence and
adulthood with regard to risk of colorectal adenoma - Nurses' Health Study II,
1997-2011
Footnote: High physical activity (PA) at adolescence was defined as the highest tertile (≥53.3 MET-h/week); low was
defined as the two bottom tertiles (<53.5 MET-h/week). High PA at adulthood was defined as highest tertile (≥23.1
MET-h/week); low was defined as two bottom tertiles (<23.1 MET-h/week).
Number of all adenomas: Low PA adolescence- Low PA adulthood (n=1192); Low PA adolescence- High PA
adulthood (n=453); High PA adolescence- Low PA adulthood (n=463); High PA adolescence- High PA adulthood
(n=265);
Number of non-advanced adenomas: Low PA adolescence- Low PA adulthood (n=659); Low-high (n=258); High-low
(n=261); High-high (n=163);
Number of advanced adenomas: Low PA adolescence- Low PA adulthood (n=305); Low PA adolescence- High PA
adulthood (n=105); High PA adolescence- Low PA adulthood (n=103); High PA adolescence- High PA adulthood
(n=53)

88
4.4. DISCUSSION
In this large study, physical activity during adolescence was inversely associated
with risk of colorectal adenomas, independent of physical activity during adulthood. We
also found that women who were physically active during both adolescence and
adulthood had the lowest risk of colorectal adenoma later in life.
Physical activity may potentially affect carcinogenesis by decreasing body
fatness, inflammation, and insulin levels (Friedenreich; Orenstein, 2002; McTiernan,
2008; Giovannucci, 2018). High levels of insulin and insulin resistance, which can
stimulate proliferation and apoptosis (Giovannucci, 2001), are associated with higher
risk of adenoma in adults (Yoon et al., 2015). Physical activity throughout life,
including during adolescence, may decrease insulin resistance and increase glucose
uptake by skeletal muscle (McTiernan, 2008; Giovannucci, 2018), especially by
improving body composition (i.e., reducing visceral adipose tissue (Verheggen et al.,
2016). In addition, recent data suggest that physical activity may affect composition and
diversity of gut microbiota resulting in more favorable metabolic and inflammatory
profiles (Clarke et al., 2014; O'Sullivan et al., 2015; Blottière, 2017). However, more
human studies on that topic are needed, especially accounting for possible confounding
by diet.
In adults, physical activity is considered an established risk factor for colon but
not rectal cancer (IARC, 2002; Rezende et al., 2018; WCRF, 2018). The association
between physical activity during adulthood and colorectal adenomas supports a
potential protective effect of physical activity on earlier stages of carcinogenesis. A
meta-analysis including 20 case-control and cohort studies found a 16% (RR 0.84; 95%
CI 0.77 to 0.90) lower risk of colon adenomas among most active individuals during
adulthood as compared to the least active group. Observed inverse associations were
stronger for large or advanced adenomas, a subtype more likely to progress to colorectal
cancer than small or non-advanced adenomas (Wolin et al., 2011). Nonetheless, studies
examining the association between early-life physical activity and cancer risk, including
colorectal adenomas and colorectal cancer, are sparse (Clarke; Joshu, 2017). To the best
of our knowledge, only two case-control studies investigated the association between
early-life physical activity and colorectal cancer later in life. A hospital-based case-
control study conducted in Italy, including 1225 cases and 4154 controls, found that

89
high levels of occupational physical activity, but not leisure activities, at 15 to 19 years
was associated with lower risk of colon cancer when compared least active group
(Tavani et al., 1999). Similarly, another hospital-based case-control study conducted
between 1992 and 1997 in the Swiss canton of Vaud also observed an inverse
association between occupational physical activity, but not leisure activity at age 15 to
19 with regard to colorectal cancer (Levi et al., 1999).
To our knowledge, our study is the first to show an inverse association between
physical activity during both adolescence and adulthood on risk of colorectal adenoma.
These associations were also stronger for advanced adenomas. Similarly, in the Harvard
Alumni Health Study, a cohort study including 17,148 adults, physical activity was
assessed in 1962/1966, when participants were 30-79 years of age, and again 1977 (45
to 94 years) (Lee et al., 1991). In that study, only high levels of physical activity during
both periods, but not in either one, was associated with lower risk of colon cancer.
Despite differences in age group, results from Harvard Alumni study are in accordance
with our findings about a possible role of physical activity throughout life on colon
carcinogenesis.
Some limitations should be considered while interpreting our results. Physical
activity during both adolescence and adulthood was self-reported and some
misclassification of exposure is inevitable. However, both adolescent and adult physical
activity questionnaires showed reasonable reproducibility, and the adult questionnaire
was also validated (Jacobs et al., 1993; Wolf et al., 1994; Chasan-Taber et al., 1996;
Baer et al., 2005). Additionally, physical activity during adolescence and adulthood
were only weakly correlated (r=0.19). Misclassification of physical activity is likely to
be non-differential because information was collected prior to diagnosis of colorectal
adenomas, and therefore would bias associations towards the null. Although our
analyses considered a large number of potential lifestyle and dietary confounders during
both adolescence and adulthood, residual confounding due to imperfect adjustment or
unmeasured confounders cannot be ruled out.
In conclusion, we found an inverse association between physical activity during
adolescence and risk of colorectal adenomas in women, independent of physical activity
during adulthood. Associations were slightly stronger for advanced adenomas.
Participants with high levels of physical activity during both adolescence and adulthood
had the lowest risk of colorectal adenomas relative to groups least active in both or

90
either periods. Our findings suggest that physical activity during adolescence may play
a role in early stages of colorectal carcinogenesis, which have important implications
for cancer prevention.
Conflict of Interest: none.
Funding: The Nurses’ Health Study II was funded by the National Cancer Institute,
National Institutes of Health (UM1 CA176726 and R01 CA67262).
Leandro Fórnias Machado de Rezende receives a doctoral fellowship from Sao Paulo
Research Foundation (FAPESP), grant #2016/21390-0 and #2014/25614-4.
NIH/NCI grant R03 CA197879 and by an investigator-initiated grant from the
American Institute for Cancer Research (AICR) to Kana Wu.
Acknowledgments: The authors would like to thank the Channing Division of Network
Medicine, Department of Medicine, Brigham and Women’s Hospital and Harvard
Medical School.
The authors would like to thank the participants and staff of the Nurses’ Health Study II
for their valuable contributions as well as the following state cancer registries for their
help: AL, AZ, AR, CA, CO, CT, DE, FL, GA, ID, IL, IN, IA, KY, LA, ME, MD, MA,
MI, NE, NH, NJ, NY, NC, ND, OH, OK, OR, PA, RI, SC, TN, TX, VA, WA and WY.
The authors assume full responsibility for analyses and interpretation of these data.
Key Message
Physical activity during adolescence was associated with lower risk of colorectal
adenomas, independent of physical activity during adulthood. Women who were
physically active during both adolescence and adulthood had the lowest risk of
colorectal adenoma later in life. Our findings suggest that physical activity during
adolescence may play a role in early stages of colorectal carcinogenesis, which have
important implications for cancer prevention.
5.5 REFERENCES
Ainsworth BE1, Haskell WL, Herrmann SD, Meckes N, Bassett DR Jr, Tudor-Locke C,
Greer JL, Vezina J, Whitt-Glover MC, Leon AS. 2011 Compendium of Physical
Activities: a second update of codes and MET values. Med Sci Sports Exerc.
2011;43:1575-81.

91
Ainsworth BE, Haskell WL, Leon AS, Jacobs DR Jr, Montoye HJ, Sallis JF,
Paffenbarger RS Jr. Compendium of physical activities: classification of energy costs of
human physical activities. Med Sci Sports Exerc. 1993;25:71-80.
Baer HJ, Schnitt SJ, Connolly JL, Byrne C, Willett WC, Rosner B, Colditz GA. Early
life factors and incidence of proliferative benign breast disease. Cancer Epidemiol
Biomarkers Prev. 2005;14:2889-97.
Bao Y, Bertoia ML, Lenart EB, Stampfer MJ, Willett WC, Speizer FE, Chavarro JE.
Origin, Methods, and Evolution of the Three Nurses' Health Studies. Am J Public
Health. 2016;106:1573-81.
Blottière HM. The gut microbiota and obesity. In: Romieu I, Dossus L, Willet WC.
Energy Balancer and Obesity (IARC Working Group Reports; 10). Lyon: International
Agency for Research on Cancer; 2017.
Chasan-Taber S, Rimm EB, Stampfer MJ, Spiegelman D, Colditz GA, Giovannucci E,
Ascherio A, Willett WC. Reproducibility and validity of a self-administered physical
activity questionnaire for male health professionals. Epidemiology. 1996;7:81-6.
Clarke MA, Joshu CE. Early Life Exposures and Adult Cancer Risk. Epidemiol Rev.
2017;39:11-27.
Clarke SF, Murphy EF, O'Sullivan O, Lucey AJ, Humphreys M, Hogan A, Hayes P,
O'Reilly M, Jeffery IB, Wood-Martin R, Kerins DM, Quigley E, Ross RP, O'Toole PW,
Molloy MG, Falvey E, Shanahan F, Cotter PD. Exercise and associated dietary
extremes impact on gut microbial diversity. Gut. 2014;63:1913-20.
East JE, Vieth M, Rex DK. Serrated lesions in colorectal cancer screening: detection,
resection, pathology and surveillance. Gut. 2015;64:991-1000.
Friedenreich CM, Orenstein MR. Physical activity and cancer prevention: etiologic
evidence and biological mechanisms. J Nutr. 2002;132:3456S-3464S.
Giovannucci E. A framework to understand diet, physical activity, body weight, and
cancer risk. Cancer Causes Control. 2018;29:1-6.
Giovannucci E. Insulin, insulin-like growth factors and colon cancer: a review of the
evidence. J Nutr. 2001;131:3109S-3120S.
International Agency for Research on Cancer (IARC). Weight Control and Physical
Activity. IARC Handbook of Cancer Prevention Volume 6. Lyon: IARC press; 2002.
Jacobs DR, Jr., Ainsworth BE, Hartman TJ, Leon AS. A simultaneous evaluation of 10
commonly used physical activity questionnaires. Med Sci Sports Exerc. 1993;25:81-91.
Lee IM, Paffenbarger RS, Jr., Hsieh C. Physical activity and risk of developing
colorectal cancer among college alumni. J Natl Cancer Inst. 1991;83:1324-29.
Leslie A, Carey FA, Pratt NR, Steele RJ. The colorectal adenoma-carcinoma sequence.
Br J Surg. 2002;89:845-60.

92
Levi F, Pasche C, Lucchini F, Tavani A, La Vecchia C. Occupational and leisure-time
physical activity and the risk of colorectal cancer. Eur J Cancer Prev. 1999;8:487-93.
Maruti SS, Willett WC, Feskanich D, Rosner B, Colditz GA. A prospective study of
age-specific physical activity and premenopausal breast cancer. J Natl Cancer Inst.
2008;100:728-37.
McTiernan A. Mechanisms linking physical activity with cancer. Nat Rev Cancer.
2008;8:205-11.
Nimptsch K, Bernstein AM, Giovannucci E, Fuchs CS, Willett WC, Wu K. Dietary
intakes of red meat, poultry, and fish during high school and risk of colorectal
adenomas in women. Am J Epidemiol. 2013;178:172-83.
Nimptsch K, Giovannucci E, Willett WC, Fuchs CS, Wei EK, Wu K. Body fatness
during childhood and adolescence, adult height, and risk of colorectal adenoma in
women. Cancer Prev Res. 2011;4:1710-18.
Nimptsch K, Malik VS, Fung TT, Pischon T, Hu FB, Willett WC, Fuchs CS, Ogino S,
Chan AT, Giovannucci E, Wu K. Dietary patterns during high school and risk of
colorectal adenoma in a cohort of middle-aged women. Int J Cancer. 2014;134:2458-
67.
Nurses' Health Study (NHS) [online]. 2018. Available at: http://nurseshealthstudy.org/.
Accessed 02/07, 2018.
O'Sullivan O, Cronin O, Clarke SF, Murphy EF, Molloy MG, Shanahan F, Cotter PD.
Exercise and the microbiota. Gut Microbes. 2015;6:131-6.
Rezende LFM, Sá TH, Markozannes G, Rey-López JP, Lee IM, Tsilidis KK, Ioannidis
JPA, Eluf-Neto J. Physical activity and cancer: an umbrella review of the literature
including 22 major anatomical sites and 770 000 cancer cases. Br J Sports Med.
2018;52:826-33.
Strum WB. Colorectal Adenomas. N Engl J Med. 2016;374:1065-75.
Tavani A, Braga C, La Vecchia C, Conti E, Filiberti R, Montella M, Amadori D, Russo
A, Franceschi S. Physical activity and risk of cancers of the colon and rectum: an Italian
case-control study. Br J Cancer. 1999;79:1912-6.
Verheggen RJ, Maessen MF, Green DJ, Hermus AR, Hopman MT, Thijssen DH. A
systematic review and meta-analysis on the effects of exercise training versus
hypocaloric diet: distinct effects on body weight and visceral adipose tissue. Obes Rev.
2016;17:664-690.
Vogelstein B, Fearon ER, Hamilton SR, Kern SE, Preisinger AC, Leppert M, Nakamura
Y, White R, Smits AM, Bos JL. Genetic alterations during colorectal-tumor
development. N Engl J Med. 1988;319:525-32.
Wolf AM, Hunter DJ, Colditz GA, Manson JE, Stampfer MJ, Corsano KA, Rosner B,
Kriska A, Willett WC. Reproducibility and validity of a self-administered physical
activity questionnaire. Int J Epidemiol. 1994;23:991-9.

93
Wolin KY, Yan Y, Colditz GA. Physical activity and risk of colon adenoma: a meta-
analysis. Br J Cancer. 2011;104:882-5.
World Cancer Research Fund/American Institute for Cancer Research. Continuous
Update Project Expert Report 2018. Physical activity and risk of cancer. Available at
dietandcancerreport.org
World Health Organization (WHO). Global recommendations on physical activity for
health. Geneva: WHO Press; 2010.
Yoon YS, Keum N, Zhang X, Cho E, Giovannucci EL. Hyperinsulinemia, insulin
resistance and colorectal adenomas: A meta-analysis. Metabolism. 2015;64:1324-33.
Yuan C, Spiegelman D, Rimm EB, Rosner BA, Stampfer MJ, Barnett JB, Chavarro JE,
Rood JC, Harnack LJ, Sampson LK, Willett WC. Relative Validity of Nutrient Intakes
Assessed by Questionnaire, 24-Hour Recalls, and Diet Records as Compared With
Urinary Recovery and Plasma Concentration Biomarkers: Findings for Women. Am J
Epidemiol. 2018;187:1051-63.
Yuan C, Spiegelman D, Rimm EB, Rosner BA, Stampfer MJ, Barnett JB, Chavarro JE,
Subar AF, Sampson LK, Willett WC. Validity of a Dietary Questionnaire Assessed by
Comparison With Multiple Weighed Dietary Records or 24-Hour Recalls. Am J
Epidemiol. 2017;185:570-84.

94
SUPPLEMENTARY FILE
Reproducibility and validity of physical activity questionnaires
In 2000, a sample of 160 participants that completed the 1997 questionnaire on
physical activity was asked about again their average of physical activity during
adolescence and early adulthood for sake of examine reproducibility. On average, the
correlations between the 1997 and the 2000 assessment was 0.64 for total physical
activity, 0.76 for strenuous, 0.70 for strenuous plus moderate. By age group, spearman
rho correlation for hours/week in strenuous activity was 0.63 in grade 7 to 8, 0.71 in
grades 9 to 12, and 0.69 at ages 18 to 22. Walking activity presented similar
reproducibility results, whereas moderate physical activity was lower across all periods
(0.37 for grades 7 and 8, 0.36 for grades 9 to 12, and 0.52 for ages 18 to 22).[1]
In adults, physical activity questionnaire showed good validity when comparing
physical activity in the previous year to both recall of physical activity in the previous
week (r = 0.79) and activity in diaries (r = 0.62). Similar physical activity questions has
also showed a have a moderate correlation with maximal oxygen consumption (r =
0.54)[2] and lower resting pulse (r = 0.45).[3]
REFERENCES
1. Baer HJ, Schnitt SJ, Connolly JL, Byrne C, Willett WC, Rosner B, Colditz GA.
Early life factors and incidence of proliferative benign breast disease. Cancer Epidemiol
Biomarkers Prev. 2005;14:2889-97.
2. Jacobs DR, Jr., Ainsworth BE, Hartman TJ, Leon AS. A simultaneous
evaluation of 10 commonly used physical activity questionnaires. Med Sci Sports Exerc.
1993;25:81-91.
3. Chasan-Taber S, Rimm EB, Stampfer MJ, Spiegelman D, Colditz GA,
Giovannucci E, Ascherio A, Willett WC. Reproducibility and validity of a self-
administered physical activity questionnaire for male health professionals.
Epidemiology. 1996;7:81-86.

95
Table S1 - Odds ratio of colorectal adenoma associated with total physical activity during adolescence by location, stage and subtype of colorectal polyps. Nurses' Health Study II, 1997-2011
Total physical activity during adolescence (in MET-h/week)
<21 21 - <36 36 - <48 48 - <72 72+ Per 21
MET-h/week Ptrend
All adenomas
Multivariable† plus adult PA and BMI, and television watching during adolescence 1 1.03(0.91-1.17) 1.07(0.94-1.23) 0.91(0.80-1.05) 0.88(0.77-1.02) 0.96(0.93-0.99) 0.01
Multivariable† plus adult BMI 1 1.02(0.90-1.16) 1.07(0.93-1.22) 0.90(0.79-1.03) 0.88(0.76-1.01) 0.96(0.92-0.99) 0.01
Multivariable† plus adult PA and BMI 1 1.02(0.90-1.16) 1.07(0.93-1.23) 0.91(0.79-1.04) 0.88(0.77-1.01) 0.96(0.93-0.99) 0.01
By Location
Proximal adenomas
Multivariable† plus adult PA and BMI, and television watching during adolescence 1 1.02(0.86-1.22) 1.06(0.87-1.28) 0.89(0.74-1.08) 0.86(0.70-1.05) 0.95(0.90-1.00) 0.04 Multivariable† plus adult BMI 1 1.01(0.85-1.21) 1.05(0.87-1.27) 0.88(0.73-1.06) 0.85(0.69-1.03) 0.95(0.90-0.99) 0.03
Multivariable† plus adult PA and BMI 1 1.02(0.85-1.21) 1.05(0.87-1.28) 0.89(0.73-1.07) 0.86(0.70-1.05) 0.95(0.90-1.00) 0.04
Distal adenomas Multivariable† plus adult PA and BMI, and television watching during adolescence 1 1.05(0.87-1.27) 1.03(0.84-1.27) 0.88(0.71-1.07) 0.92(0.74-1.13) 0.96(0.91-1.01) 0.14
Multivariable† plus adult BMI 1 1.04(0.86-1.25) 1.04(0.84-1.27) 0.87(0.71-1.06) 0.92(0.75-1.13) 0.97(0.92-1.02) 0.17
Multivariable† plus adult PA and BMI 1 1.04(0.86-1.25) 1.03(0.84-1.27) 0.87(0.71-1.06) 0.92(0.75-1.13) 0.97(0.92-1.02) 0.18 Rectal adenomas
Multivariable† plus adult PA and BMI, and television watching during adolescence 1 0.93(0.68-1.27) 1.19(0.86-1.64) 0.98(0.71-1.35) 0.97(0.69-1.36) 0.99(0.92-1.08) 0.89
Multivariable† plus adult BMI 1 0.91(0.67-1.24) 1.13(0.82-1.55) 0.94(0.69-1.29) 0.94(0.67-1.30) 0.99(0.91-1.07) 0.74 Multivariable† plus adult PA and BMI 1 0.92(0.68-1.25) 1.15(0.83-1.58) 0.96(0.70-1.32) 0.96(0.69-1.35) 0.99(0.92-1.08) 0.88
By Stage
Advanced Multivariable† plus adult PA and BMI, and television watching during adolescence 1 1.36(1.05-1.75) 1.37(1.04-1.81) 1.02(0.78-1.35) 0.94(0.70-1.26) 0.94(0.88-1.01) 0.09
Multivariable† plus adult BMI 1 1.34(1.04-1.72) 1.35(1.03-1.78) 0.99(0.76-1.31) 0.90(0.67-1.21) 0.94(0.88-1.00) 0.05
Multivariable† plus adult PA and BMI 1 1.35(1.05-1.74) 1.37(1.04-1.80) 1.01(0.77-1.34) 0.93(0.69-1.25) 0.94(0.88-1.01) 0.08 Non-advanced
Multivariable† plus adult PA and BMI, and television watching during adolescence 1 0.96(0.81-1.13) 0.99(0.82-1.19) 0.86(0.72-1.02) 0.90(0.75-1.08) 0.97(0.92-1.01) 0.16
Multivariable† plus adult BMI 1 0.95(0.81-1.12) 0.99(0.82-1.18) 0.85(0.71-1.02) 0.90(0.75-1.08) 0.97(0.93-1.01) 0.17 Multivariable† plus adult PA and BMI 1 0.95(0.81-1.12) 0.99(0.82-1.18) 0.85(0.71-1.02) 0.90(0.75-1.08) 0.97(0.93-1.01) 0.18
By subtype
Adenoma only
Multivariable† plus adult PA and BMI, and television watching during adolescence 1 1.08(0.94-1.24) 1.10(0.95-1.29) 0.89(0.76-1.03) 0.90(0.77-1.05) 0.95(0.92-0.99) 0.01 Multivariable† plus adult BMI 1 1.07(0.93-1.23) 1.10(0.95-1.28) 0.88(0.76-1.02) 0.89(0.76-1.04) 0.95(0.92-0.99) 0.01
Multivariable† plus adult PA and BMI 1 1.07(0.93-1.23) 1.10(0.95-1.28) 0.88(0.76-1.02) 0.90(0.77-1.05) 0.95(0.92-0.99) 0.02
Serrated lesions only Multivariable† plus adult PA and BMI, and television watching during adolescence 1 0.98(0.84-1.14) 1.03(0.88-1.22) 0.99(0.85-1.16) 0.94(0.79-1.11) 0.98(0.95-1.02) 0.44
Multivariable† plus adult BMI 1 0.99(0.85-1.15) 1.03(0.88-1.22) 0.99(0.85-1.16) 0.95(0.80-1.11) 0.99(0.95-1.03) 0.49 Multivariable† plus adult PA and BMI 1 0.98(0.84-1.14) 1.03(0.87-1.21) 0.99(0.84-1.15) 0.94(0.80-1.11) 0.98(0.95-1.02) 0.44
Both adenoma and Serrated lesions
Multivariable† plus adult PA and BMI, and television watching during adolescence 1 0.81(0.60-1.09) 0.98(0.71-1.34) 1.03(0.77-1.38) 0.81(0.59-1.12) 0.97(0.90-1.05) 0.50 Multivariable† plus adult BMI 1 0.81(0.60-1.08) 0.97(0.71-1.32) 1.01(0.76-1.35) 0.81(0.59-1.10) 0.97(0.90-1.05) 0.45
Multivariable† plus adult PA and BMI 1 0.81(0.60-1.09) 0.98(0.72-1.33) 1.02(0.76-1.35) 0.81(0.59-1.11) 0.97(0.90-1.05) 0.48
*Adjusted for age, time period of endoscopy, number of reported endoscopies, time in years since most recent endoscopy and reason for current endoscopy.
†Additionally adjusted for height (inches), body shape at 5 years (1, 2, 3, 4, 5, ≥6), total calories during adolescence (quintiles), unprocessed red meat and processed meat during adolescence (quintiles), total dairy during adolescence (quintiles), total fiber during adolescence (quintiles), current (adult) aspirin use (yes/no), current (adult) alcohol intake (<4.9, 5-9.9, 10-14.9, 15+ g/d), current (adult) pack-years of smoking (never, 0-10, >10-20,
>20-40, 40+ pack-years), time spent watching television during adolescence (0.5, 0.5-1, 1-1.5, 1.5-2, 2+ h/day)

96
Table S2 - Stratified analysis: Association between total physical activity during
adolescence and risk of colorectal adenoma. Nurses' Health Study II, 1997-2011
Total physical activity during adolescence
(Per 21 MET-h/week)
Odds ratio 95% Confidence interval Pinteraction
All adenomas
Family history of colorectal cancer 0.14
No (N cases = 1807) 0.95 (0.91 to 0.98)
Yes (N cases = 564) 1.01 (0.94 to 1.08)
Age at diagnosis <0.01
<50 years (N cases = 538) 1.01 (0.94 to 1.08)
≥50 years (N cases = 1833) 0.94 (0.90 to 0.98)
BMI at 18 years 0.65
<23 kg/m2 (N cases = 1855) 0.98 (0.94 to 1.01)
≥23 kg/m2 (N cases = 499) 0.91 (0.84 to 0.98)
Smoking 0.79
Never (N cases = 1492) 0.97 (0.93 to 1.01)
Ever (N cases = 877) 0.95 (0.90 to 1.00)
†Adjusted for age, time period of endoscopy, number of reported endoscopies, time in years since most
recent endoscopy and reason for current endoscopy, height (inches), body shape at 5 years (1, 2, 3, 4, 5,
≥6), total calories during adolescence (quintiles), unprocessed red meat and processed meat during high
school adolescence (quintiles), total dairy during adolescence (quintiles), total fiber during adolescence
(quintiles), current (adult) aspirin use (yes/no), current (adult) alcohol intake (<4.9, 5-9.9, 10-14.9, 15+
g/d), current (adult) pack-years of smoking (never, 0-10, >10-20, >20-40, 40+ pack-years).

97
5. ASSOCIAÇÃO ENTRE TIPO E INTENSIDADE DA ATIVIDADE
FÍSICA E BIOMARCADORES DE INFLAMAÇÃO E RESPOSTA À
INSULINA RELACIONADOS AO RISCO DE CÂNCER
Este capítulo apresenta o artigo “Association of type and intensity of physical activity
with plasma biomarkers of inflammation and insulin response” de autoria de Dong
Hoon Lee*, Leandro Fórnias Machado de Rezende*, José Eluf-Neto, Kana Wu, Fred K.
Tabung, Edward L. Giovannucci. O artigo foi submetido para publicação na revista
International Journal of Cancer.
Esse manuscrito foi elaborado durante o estágio de pesquisa no exterior na Harvard
T.H. Chan School of Public Health. Donghoon Lee e eu trabalhamos em parceria nesse
manuscrito, e contribuímos igualmente na elaboração do mesmo, de modo que
compartilhamos a primeira autoria.
Para citação: Lee DH, Rezende LFM, Eluf-Neto J, Wu K, Tabung FK, Giovannucci E.
Association of type and intensity of physical activity with plasma biomarkers of
inflammation and insulin response. In preparation.

98
Association of type and intensity of physical activity with plasma biomarkers of
inflammation and insulin response
Dong Hoon Lee1*, Leandro Fórnias Machado de Rezende1,2*, José Eluf-Neto2, Kana
Wu1, Fred K. Tabung1,4, Edward L. Giovannucci1,3,5
1Department of Nutrition, Harvard T.H. Chan School of Public Health, Boston, MA,
USA
2Departamento de Medicina Preventiva, Faculdade de Medicina FMUSP, Universidade
de Sao Paulo, Sao Paulo, SP, Brazil
3Department of Epidemiology, Harvard T.H. Chan School of Public Health, Boston,
MA, USA
4Division of Medical Oncology, The Ohio State University Wexner Medical Center,
Columbus, OH, USA
5Channing Division of Network Medicine, Department of Medicine, Brigham and
Women's Hospital and Harvard Medical School, Boston, MA, USA
*These authors contributed equally to this work

99
ABSTRACT
Background: Several biological mechanisms linking physical activity with cancer have
been proposed. However, the influence of specific components of physical activity (i.e.,
volume, type and intensity), as well as interaction with adiposity and diet, on
inflammatory and insulin levels remain unclear. Methods: We used cross-sectional data
from 7,219 men who provided plasma samples in the Health Professionals Follow-up
Study, 1992-1994. Details on physical activity were assessed using questionnaires. C-
reactive protein (CRP), interleukin 6 (IL6), tumor necrosis factor α receptor 2
(TNFαR2), adiponectin, C-peptide and triglycerides/high density lipoprotein cholesterol
ratio (TG/HDL) were assessed. Results: Total physical activity was favorably associated
with all biomarkers. Comparing the highest (63+ MET-h/week) to the lowest (0 to 9
MET-h/week) physical activity groups, the multivariable-adjusted percent relative
difference in concentration of biomarkers was -32% for CRP, -22% for IL6, -7% for
TNFαR2, +9% for adiponectin, -22% for C-peptide, and -20% for TG/HDL. These
differences were modestly attenuated after adjustment for body mass index (BMI). For
the same volume of physical activity, the association was stronger for men engaging in
both aerobic and resistance exercises compared to those engaging in aerobic only.
However, for the same volume of physical activity, we did not find additional benefit of
engaging in vigorous activities (≥20% of the total volume) as compared to those who
did smaller amount of vigorous activities. Physical activity showed similar benefits for
these biomarkers regardless of BMI and dietary pattern. Conclusion: High physical
activity, preferably aerobic plus resistance training, was associated with favorable
cancer-related biomarker profiles.

100
5.1. INTRODUCTION
Deciphering the role of physical activity on cancer prevention is of high interest
(Giovannucci, 2018). Currently, convincing evidence from epidemiological studies
supports the association between physical activity and cancers of the colon and breast,
and possibly endometrium (IARC, 2002; WCRF, 2018; Rezende et al., 2018). Recently,
findings from a pooled data from 12 prospective cohort studies including 1.44 million
participants suggested a protective effect of physical activity on 13 types of cancers
(Moore et al. 2016). Most of these cancers (esophageal adenocarcinoma, gallbladder,
liver, kidney, small intestine, gastric cardia, endometrial, myeloid leukemia, myeloma,
colon, rectum, breast, and non-hodgkin lymphoma) are established related to body
fatness (WCRF, 2018; Lauby-Secretan et al., 2016), which is the major candidate for
mediating physical activity and cancer risk (McTiernan et al., 2008; Giovannucci,
2018a; 2018b). To explore the biological mechanisms of these associations is important
to support or to refute putative effects of physical activity on cancer risk (McTiernan et
al., 2008).
Several biological mechanisms linking physical activity and cancer have been
proposed. High physical activity is associated with long-term weight management and
control (Donnelly et al., 2009) and lower visceral adiposity (Verheggen et al., 2016),
which may reduce levels of several metabolic and endocrine biomarkers involved in
carcinogenesis (Iyengar et al., 2016; Olson et al., 2017; Giovannucci, 2018a; 2018b;
WCRF, 2018). For instance, adiposity is associated with insulin resistance and elevated
fasting insulin, which stimulate cell proliferation and inhibit apoptosis (Iyengar et al.,
2016; O’Flanagan et al., 2017; Olson et al., 2017; WCRF, 2018). Obesity-associated
inflammation may also promote tumorigenesis and disease progression (Iyengar et al.,
2016; O’Flanagan et al., 2017; Olson et al., 2017; WCRF, 2018). Of note, fasting
biomarkers of inflammation (e.g., C-reactive protein (CRP), interleukin-6 (IL6),
adiponectin, tumor necrosis factor alpha receptor 2 (TNFαR2)) and insulin response
(e.g., C-peptide, triglycerides/high-density lipoprotein-cholesterol ratio (TG/HDL))
have been associated with higher risk of cancers in prospective studies (Giovannucci,
2001; Roddam et al., 2008; Al-Lamki et al., 2010; Waldner et al., 2012; Bao et al.,
2013; Chen et al., 2013; Wang et al., 2015).
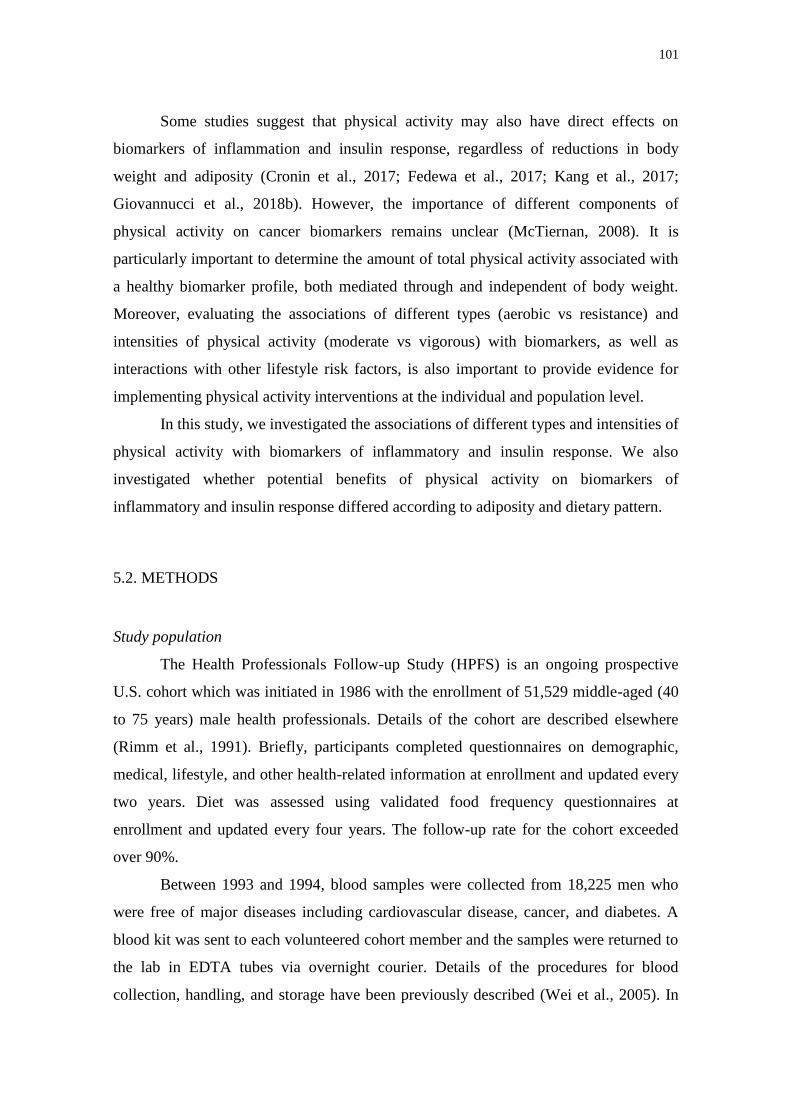
101
Some studies suggest that physical activity may also have direct effects on
biomarkers of inflammation and insulin response, regardless of reductions in body
weight and adiposity (Cronin et al., 2017; Fedewa et al., 2017; Kang et al., 2017;
Giovannucci et al., 2018b). However, the importance of different components of
physical activity on cancer biomarkers remains unclear (McTiernan, 2008). It is
particularly important to determine the amount of total physical activity associated with
a healthy biomarker profile, both mediated through and independent of body weight.
Moreover, evaluating the associations of different types (aerobic vs resistance) and
intensities of physical activity (moderate vs vigorous) with biomarkers, as well as
interactions with other lifestyle risk factors, is also important to provide evidence for
implementing physical activity interventions at the individual and population level.
In this study, we investigated the associations of different types and intensities of
physical activity with biomarkers of inflammatory and insulin response. We also
investigated whether potential benefits of physical activity on biomarkers of
inflammatory and insulin response differed according to adiposity and dietary pattern.
5.2. METHODS
Study population
The Health Professionals Follow-up Study (HPFS) is an ongoing prospective
U.S. cohort which was initiated in 1986 with the enrollment of 51,529 middle-aged (40
to 75 years) male health professionals. Details of the cohort are described elsewhere
(Rimm et al., 1991). Briefly, participants completed questionnaires on demographic,
medical, lifestyle, and other health-related information at enrollment and updated every
two years. Diet was assessed using validated food frequency questionnaires at
enrollment and updated every four years. The follow-up rate for the cohort exceeded
over 90%.
Between 1993 and 1994, blood samples were collected from 18,225 men who
were free of major diseases including cardiovascular disease, cancer, and diabetes. A
blood kit was sent to each volunteered cohort member and the samples were returned to
the lab in EDTA tubes via overnight courier. Details of the procedures for blood
collection, handling, and storage have been previously described (Wei et al., 2005). In

102
the current study, we included participants who were previously selected for nested
case-control studies within the HPFS that measured plasma biomarkers of CRP, IL6,
TNFαR2, adiponectin, C-peptide, TG, and HDL. A total of 7,219 participants who
provided valid physical activity data and blood samples were included in the final
analysis.
This study was approved by the Institutional Review Board of the Brigham and
Women’s Hospital and the Human Subjects Committee Review Board of the Harvard
T.H. Chan School of Public Health.
Assessment of physical activity
Physical activity was assessed by questionnaires in 1986 and every 2 years. In
each cycle, participants reported their average time spent per week in walking, jogging,
running, bicycling, swimming, tennis, squash/racket ball, calisthenics/rowing, and
outdoor work. In 1990 and every 2 years, participants were asked to report their average
weekly amount of weight lifting/weight machine. Each activity was assigned a
metabolic equivalent task (MET) which represent metabolic rates for specific activity
divided by metabolic rates at rest (Ainsworth et al., 1993). All activities were summed
to derive total physical activity in units of MET-hours per week. By intensity of
physical activity, vigorous activities, defined as MET ≥6, were calculated by summing
MET hours of activities including jogging, running, bicycling, swimming, tennis,
squash/racquetball, and calisthenics/rowing. Moderate activities, defined as MET <6,
included walking, heavy outdoor work, and weight lifting/weight machine. By type of
physical activity, aerobic activities were calculated by including walking, stair climbing,
jogging, running, bicycling, swimming, tennis, squash/racquetball, calisthenics/rowing,
and heavy outdoor work. Resistance training included weight lifting/weight machine.
The validity and reproducibility of the physical activity questionnaire with four 1-week
activity diaries across different seasons has been previously described (Chasa-Taber et
al., 1996).
Biomarker assessment
We assessed CRP, IL6, TNFαR2, and adiponectin as markers of inflammation.
Moreover, C-peptide and TG/HDL were assessed as markers of hyperinsulinemia and
insulin resistance, respectively. The laboratory procedures were described in detail

103
previously (Pai et al., 2004; Song et al., 2013). Briefly, CRP was measured by a high
sensitivity immunoturbidimetric assay (Denka Seiken Co, Tokyo, Japan). IL6 and
TNFαR2 were measured by enzyme-linked immunosorbent assays (R&D systems,
Minneapolis, MN). Adiponectin was measured with the use of a competitive
radioimmunoassay (Linco Research, St. Charles, MO). C-peptide was measured using
ELISA (Diagnostic Systems Laboratories/Beckman Coulter). TG and HDL were
measured using standard methods with the use of reagents from Roche Diagnostics
(Indianapolis, IN) and Genzyme (Cambridge, MA). The mean intra-assay coefficient of
variation for most assays was <10%.
Assessment of covariates
Self-reported questionnaires were used to collect medical and lifestyle
information in 1986 and every 2 years. We calculated BMI using self-reported height
(m) and weight (kg). Smoking status and regular aspirin/NSAID use (≥2 standard
tablets of aspirin (325 mg) or NSAID per week) were reported. Chronic disease
comorbidity score was calculated by summing the number of prevalent diseases and
conditions including hypercholesterolemia, high blood pressure, diabetes, heart disease,
cancer, rheumatoid/other arthritis. For this analysis, we used 1992 and 1994
questionnaires for these variables (data collected closest to blood draw). Diet was
assessed using a validated semiquantitative food frequency questionnaire (FFQs) in
1986 and every 4 years. Participants reported their dietary intake (>130 food items) in
the previous year. Using the 1994 FFQ, we calculated three dietary pattern scores which
were developed to capture the inflammatory or insulin potential of the diet: empirical
dietary inflammatory pattern (EDIP), empirical dietary index for hyperinsulinemia
(EDIH), and empirical dietary index for insulin resistance (EDIR). The development
and validation of these dietary patterns have been previously described (Tabung et al.,
2016a; 2016b). Distinct from the biennial questionnaires, participants were asked to
report their waist circumference using a provided tape following the same instruction in
1987 and 1996. Lastly, we calculated predicted fat mass and percent fat using
previously developed anthropometric prediction equations based on age, race, height,
weight, and waist circumference. These equations were previously validated using dual-
energy x-ray absorptiometry (DXA) and obesity-related biomarkers in an independent
dataset (Lee et al., 2017).

104
Statistical analyses
The distribution of biomarkers was tested for normality and then natural log
transformed. Descriptive statistics for continuous variable were presented as means and
standard deviations, and categorical variables were presented as proportions according
to total physical activity categories.
Generalized linear models were used to examine the association between
physical activity and biomarker concentrations. We recalibrated all biomarkers using
the method previously described by Rosner et al. (2008) to accounted for variation in
sample handling and laboratory drift between batches. To reduce measurement errors in
physical activity, we used average of physical activity questionnaires collected in 1992
and 1994. Total physical activity was categorized into 5 groups (i.e., 0 to 8.9, 9 to 20.9,
21 to 41.9, 42 to 62.9, and 63+ MET-hour/week). The cut-offs were based on multiples
of 3 MET-hour/week which corresponds to 1 hour per week of normal walking for
easier interpretation (Keum et al., 2016). All multivariable models adjusted for the
potential confounders including age at blood draw (continuous, years), race (white or
non-white), case-control status, smoking status (never, former or current), regular
aspirin/NSAID use (yes or no), chronic diseases/conditions (0, 1, 2 or 3+) and dietary
pattern (quintiles). Of note, we adjusted for EDIP score for biomarkers of inflammation
(i.e., CRP, IL6, TNFαR2, adiponectin), EDIH score for a biomarker of
hyperinsulinemia (i.e., C-peptide), and EDIR score for a biomarker of insulin resistance
(i.e., TG/HDL). Since adiposity is likely a potential mediator between physical activity
and biomarkers, we additionally ran a model further adjusting for BMI (18.5-24.9, 25-
29.9 or ≥30 kg/m2). For a sensitivity analysis, we adjusted for predicted fat mass and
percent fat, instead of BMI, to better adjust for adiposity. To explore whether the
associations between physical activity and biomarkers vary by diet quality and/or
adiposity, we conducted stratified analyses by dietary pattern (below or above median)
and/or BMI (below or above median; 25.4 kg/m2). We tested for interaction by
including the cross-terms of physical activity (continuous) and stratification variables
(binary).
For the same volume of physical activity, the association between physical
activity and biomarkers may be different by type and intensity of activities. Thus, we
examined the joint association of total physical activity and type (aerobic only vs.
aerobic plus resistance training) and intensity (moderate plus little vigorous activities

105
(<20% of total volume; median of 0.2 MET-h/week) vs. moderate plus moderate
vigorous activity (≥20% of the total volume; median of 17.4 MET-h/week) of activities
in relation to plasma biomarkers. To examine the independent association of type
(aerobic vs. resistance training) and intensity (moderate vs. vigorous activity) of
physical activity, we further conducted analyses mutually adjusting for each other.
All tests were two-sided and P<0.05 was considered to be statistically
significant. All data analyses were performed using SAS software, version 9.4 for
UNIX (SAS Institute, Inc).
5.3. RESULTS
The characteristics of study population according to total physical activity are
presented in Table 1. Participants with higher physical activity had lower BMI and diets
with lower inflammatory and insulinemic potential. The lowest EDIP, EDIH, and EDIR
were found in the second highest physical activity group (42-62.9 MET-h/week). The
proportions of current smokers and participants with 3 or more chronic
disease/condition were lower with higher physical activity.

106
Table 1 - Characteristics of the study population by categories of total physical activity, Health Professionals
Follow-up Study, 1992-1994
Characteristic Total physical activity (MET-h/week)
0 to <9 9 to <21 21 to <42 42 to <63 63+
Participants, N 1178 1603 2132 1101 1205
Age at 1994 questionnaire return, yrs 62.0 (8.8) 61.4 (8.7) 62.2 (8.8) 61.8 (8.5) 63.0 (8.5)
Plasma biomarkers
C-reactive protein (mg/L) 1.2 (4.5) 0.9 (3.0) 0.9 (3.0) 0.7 (2.7) 0.7 (3.0)
Interleukin-6 (pg/L) 1.6 (2.2) 1.5 (2.2) 1.3 (2.0) 1.2 (5.5) 1.2 (2.0)
Tumor necrosis factor alpha receptor 2 (ng/mL) 2.7 (1.3) 2.7 (1.3) 2.7 (1.3) 2.7 (1.3) 2.7 (1.2)
Adiponectin (μ/mL) 6.0 (1.6) 6.0 (1.6) 6.0 (1.6) 6.7 (1.6) 6.7 (1.6)
C-peptide (ng/mL) 2.7 (1.8) 2.2 (1.8) 2.2 (1.8) 2.0 (1.8) 2.0 (1.8)
Triglyceride/High-density lipoproteins ratio 3.3 (2.2) 3.0 (2.0) 2.7 (2.0) 2.5 (2.0) 2.5 (2.2)
Lifestyle risk factors
Body mass index (kg/m2) 26.9 (4.1) 26.2 (3.4) 25.7 (3.2) 25.4 (2.9) 25.2 (2.9)
Empirical dietary Inflammatory pattern
(% above median) 23.9 20.5 18.9 17.7 19.8
Empirical dietary index for hyperinsulinemia
(% above median) 23.0 20.6 19.0 17.8 20.3
Empirical dietary index for insulin resistance
(% above median) 20.4 20.0 20.0 19.4 20.3
Smoking status (%)
Never 39.3 45.0 47.0 48.3 47.5
Former 49.8 49.0 48.3 47.4 48.3
Current 11.0 6.0 4.7 4.3 4.2
Regular aspirin/NSAID user (%) 14.0 14.9 13.0 13.9 14.8
Chronic diseases/conditions comorbidity score
No chronic diseases/conditions 36.3 38.5 42.5 45.1 44.2
1 chronic diseases/conditions 31.5 33.3 31.6 31.3 31.5
2 chronic diseases/conditions 19.3 18.0 16.4 15.9 16.6
≥3 chronic diseases/conditions 13.0 10.2 9.5 7.7 7.7
Values are presented as mean (SD) for continuous variables and percentage for categorical variables.

107
There was a decreasing trend of CRP, IL6, TNFαR2, C-peptide and TG/HDL (all
Ptrend<0.001) and an increasing trend of adiponectin with higher total physical activity
level (Ptrend=0.002) (Table 2). The concentrations of biomarkers were favorable in the
highest (63+ MET-h/week) compared to lowest (0 to 9 MET-h/week) physical activity
groups, though these differences were modestly attenuated after adjustment for BMI.
The multivariable-adjusted percent relative difference (RD) in concentration of
biomarkers unadjusted and adjusted for BMI, respectively were -32% and -24% for
CRP, -22% and -18% for IL6, -7% and -7% for TNFαR2, +9% and +6% for
adiponectin, -22% and -16% for C-peptide, and -20% and -14% for TG/HDL (Figure 1).
Adjusting for adiposity using predicted fat mass or percent fat, instead of BMI, showed
similar but slightly larger attenuations of the associations for all biomarkers (data not
shown).

108
Table 2 - Association between total physical activity and plasma biomarkers of inflammation and insulin response, HPFS 1992-1994 Total physical activity (MET-h/week)
0 to <9 9 to <21 21 to <42 42 to <63 63+ Ptrend‡
C-reactive protein (mg/L)
Number of participants 802 1033 1319 673 742
Multivariable† 1.12(1.04, 1.21) 0.95(0.88, 1.01)* 0.91(0.86, 0.97)* 0.75(0.69, 0.82)* 0.77(0.71, 0.83)* <0.001
Interleukin-6 (pg/L)
Number of participants 462 597 796 407 441
Multivariable† 1.61(1.48, 1.75) 1.46(1.36, 1.57)* 1.31(1.23, 1.40)* 1.20(1.10, 1.31)* 1.25(1.14, 1.36)* <0.001
Tumor necrosis factor alpha receptor 2 (ng/mL)
Number of participants 647 808 1065 521 561
Multivariable† 2.78(2.73, 2.84) 2.68(2.63, 2.73)* 2.71(2.66, 2.75) 2.64(2.58, 2.70)* 2.57(2.52, 2.63)* <0.001
Adiponectin (μ/mL)
Number of participants 705 882 1098 555 607
Multivariable† 5.91(5.71, 6.13) 6.17(5.98, 6.36)* 6.26(6.09, 6.44)* 6.43(6.18, 6.68)* 6.46(6.22, 6.71)* 0.002
C-peptide (ng/mL)
Number of participants 540 745 1052 564 602
Multivariable† 2.58(2.46, 2.71) 2.32(2.22, 2.42)* 2.16(2.08, 2.24)* 2.10(2.00, 2.20)* 2.02(1.93, 2.12)* <0.001
Triglyceride/High-density lipoproteins ratio
Number of participants 572 723 916 471 484
Multivariable† 3.04(2.86, 3.22) 2.84(2.69, 2.99)* 2.67(2.54, 2.79)* 2.44(2.29, 2.61)* 2.44(2.28, 2.60)* <0.001
† Values are multivariable-adjusted absolute biomarker concentrations adjusted for: age at blood draw (continuous), smoking (never, past or current smokers), race (White
or non-White), chronic diseases/conditions (0, 1, 2 or 3+), case/control status, dietary pattern (empirical dietary inflammatory pattern for c-reactive protein, interleukin-6
and tumor necrosis factor alpha receptor 2; empirical dietary index for hyperinsulinemia for C-peptide; empirical dietary index for insulin resistance for triglyceride/High-
density lipoproteins ratio).
‡ P value for linear trend test was obtained using physical activity as a continuous variable.
* P<0.05 (significant difference in plasma biomarker against the reference group (lowest total physical activity)).

109
Joint associations of total physical activity and type of activity (aerobic only vs.
aerobic plus resistance training) with plasma biomarkers of inflammation and insulin
response are shown in Tables 3 and S1 and Figure 1. The concentrations of biomarkers
were favorable in the highest (63+ MET-h/week) compared to lowest (0 to 9 MET-
h/week) physical activity groups. For the same volume of physical activity, these
associations were stronger for men engaging in both aerobic plus resistance training
compared to those engaging in aerobic only. The multivariable-adjusted percent RD in
concentration of biomarkers associated with aerobic only and aerobic plus resistance
training, respectively were -29% and -36% for CRP, -20% and -29% for IL6, -8% and -
8% for TNFαR2, +7% and +11% for adiponectin, -18% and -30% for C-peptide, and -
19% and -19% for TG/HDL. Higher aerobic activity was associated with decreasing
trends of CRP, IL6, TNFaR2, C-peptide, TG/HDL (all Ptrend<0.001) and an increasing
trend of adiponectin (Ptrend=0.006), independent of resistance training. On the other
hand, higher resistance training did not show a significant trend with those plasma
biomarkers, independent of aerobic activity (Table S2).

110
Table 3 - Joint association of total physical activity and type of activity with plasma biomarkers of inflammation and insulin response,
HPFS 1992-1994 Total physical activity (MET-h/week)
0 to <9 9 to <21 21 to <42 42 to <63 63+
C-reactive protein (mg/L)
Aerobic only 1.13 (1.05, 1.23) 0.96 (0.89, 1.04)* 0.93 (0.87, 1.00)* 0.81 (0.73, 0.89)* 0.80 (0.72, 0.88)*
Aerobic plus resistance training 0.95 (0.68, 1.34)* 0.86 (0.73, 1.02)* 0.86 (0.76, 0.97)* 0.65 (0.55, 0.75)* 0.72 (0.63, 0.82)*
Interleukin-6 (pg/L) Aerobic only 1.63 (1.50, 1.78) 1.48 (1.37, 1.60) 1.32 (1.23, 1.43)* 1.20 (1.08, 1.34)* 1.30 (1.17, 1.45)*
Aerobic plus resistance training 1.21 (0.82, 1.79) 1.37 (1.14, 1.64) 1.28 (1.13, 1.45)* 1.20 (1.02, 1.41)* 1.16 (1.00, 1.33)*
Tumor necrosis factor alpha receptor 2 (ng/mL)
Aerobic only 2.79 (2.74, 2.85) 2.69 (2.64, 2.74) 2.72 (2.67, 2.77) 2.66 (2.59, 2.73)* 2.58 (2.52, 2.65)*
Aerobic plus resistance training 2.64 (2.43, 2.87) 2.64 (2.53, 2.76) 2.67 (2.59, 2.75) 2.58 (2.48, 2.69)* 2.56 (2.47, 2.65)*
Adiponectin (μ/mL)
Aerobic only 5.95 (5.73, 6.17) 6.13 (5.92, 6.34) 6.29 (6.09, 6.50) 6.52 (6.21, 6.83) 6.39 (6.09, 6.70)
Aerobic plus resistance training 5.40 (4.65, 6.26) 6.36 (5.89, 6.86) 6.16 (5.83, 6.51) 6.23 (5.80, 6.69) 6.60 (6.19, 7.03)*
C-peptide (ng/mL)
Aerobic only 2.60 (2.47, 2.73) 2.34 (2.24, 2.45)* 2.18 (2.09, 2.27)* 2.18 (2.05, 2.31)* 2.14 (2.02, 2.27)*
Aerobic plus resistance training 2.39 (1.95, 2.91)* 2.20 (1.98, 2.44)* 2.11 (1.97, 2.25)* 1.96 (1.81, 2.13)* 1.82 (1.68, 1.97)*
Triglyceride/High-density lipoproteins ratio
Aerobic only 3.01 (2.83, 3.21) 2.90 (2.73, 3.07) 2.64 (2.50, 2.79)* 2.33 (2.16, 2.53)* 2.43 (2.24, 2.64)*
Aerobic plus resistance training 3.38 (2.64, 4.31) 2.60 (2.29, 2.94) 2.73 (2.48, 3.00) 2.70 (2.40, 3.04) 2.44 (2.19, 2.72)*
† Values are multivariable-adjusted absolute biomarker concentrations adjusted for: age at blood draw (continuous), smoking (never, past or current smokers), race (White or
non-White), chronic diseases/conditions (0, 1, 2 or 3+), case/control status, dietary pattern (empirical dietary inflammatory pattern for c-reactive protein, interleukin-6 and
tumor necrosis factor alpha receptor 2; empirical dietary index for hyperinsulinemia for C-peptide; empirical dietary index for insulin resistance for triglyceride/High-density
lipoproteins ratio).
* P<0.05 (significant difference in plasma biomarker against the reference group (lowest total physical activity group with aerobic only)).

111
Figure 1 - Multivariable-adjusted percent relative difference in biomarker
concentrations comparing the highest (63+ MET-h/week) with the lowest (0 to <9
MET-h/week) physical activity groups
Legend: A) with additional adjustment for BMI (B) by type of physical activity and (C)
by intensity of physical activity; HPFS 1992-1994. Abbreviation: CRP, C-reactive
protein; IL6, interleukin 6; TNFαR2, tumor necrosis factor α receptor 2; TG/HDL,
triglycerides/high density lipoprotein cholesterol ratio.

112
Joint associations of total physical activity and intensity of activity (mostly
moderate activities vs. moderate plus vigorous activities (≥20% of the total volume))
with plasma biomarkers of inflammation and insulin response are shown in Tables 4
and S3 and Figure 1. Comparing the highest (mostly moderate activities) to lowest
(mostly moderate activities) physical activity groups, the multivariable-adjusted percent
RD in concentration of biomarkers was -42% for CRP, -43% for IL6, -8% for TNFαR2,
+10% for adiponectin, -18% for C-peptide, and -26% for TG/HDL. For the same
volume of physical activity, we did not find additional benefit of engaging in vigorous
intensity as compared to those who did smaller amount of vigorous activities. Higher
moderate activity was associated with decreasing trends of all biomarkers (all
Ptrend<0.001) and an increasing trend of adiponectin (Ptrend=0.006), independent of
vigorous activity. Moreover, higher vigorous activity was associated with decreasing
trend of CRP, TNFαR2, C-peptide, and TG/HDL, independent of moderate activity
(Table S4).

113
Table 4 - Joint association of total physical activity and intensity with plasma biomarkers of inflammation and insulin response, HPFS
1992-1994 Total physical activity (MET-h/week)
0 to <9 9 to <21 21 to <42 42 to <63 63+
C-reactive protein (mg/L)
<20% vigorous 1.20 (1.08, 1.33) 0.94 (0.84, 1.07)* 0.87 (0.75, 1.00)* 0.89 (0.72, 1.10) 0.70 (0.56, 0.88)*
≥20% vigorous 1.04 (0.92, 1.16) 0.95 (0.87, 1.03)* 0.92 (0.86, 0.99)* 0.73 (0.67, 0.80)* 0.78 (0.71, 0.85)*
Interleukin-6 (pg/L)
<20% vigorous 1.64 (1.47, 1.84) 1.39 (1.21, 1.60) 1.33 (1.15, 1.54) 0.85 (0.68, 1.06)* 0.93 (0.72, 1.20)*
≥20% vigorous 1.56 (1.38, 1.77) 1.49 (1.37, 1.62) 1.31 (1.22, 1.40)* 1.29 (1.17, 1.42)* 1.29 (1.18, 1.42)*
Tumor necrosis factor alpha receptor 2 (ng/mL)
<20% vigorous 2.78 (2.71, 2.85) 2.67 (2.58, 2.75) 2.66 (2.57, 2.75) 2.62 (2.49, 2.77) 2.56 (2.41, 2.72)
≥20% vigorous 2.78 (2.70, 2.87) 2.69 (2.63, 2.75) 2.72 (2.67, 2.76) 2.64 (2.58, 2.71)* 2.58 (2.52, 2.64)*
Adiponectin (μ/mL)
<20% vigorous 5.82 (5.55, 6.10) 6.15 (5.82, 6.49) 6.33 (5.93, 6.74) 6.38 (5.77, 7.05) 6.40 (5.76, 7.11)
≥20% vigorous 6.03 (5.73, 6.36) 6.18 (5.94, 6.42) 6.24 (6.05, 6.44) 6.43 (6.16, 6.72)* 6.47 (6.21, 6.74)*
C-peptide (ng/mL)
<20% vigorous 2.61 (2.43, 2.80) 2.33 (2.16, 2.52) 2.24 (2.08, 2.42)* 1.90 (1.68, 2.15)* 2.15 (1.87, 2.47)
≥20% vigorous 2.55 (2.38, 2.74) 2.31 (2.20, 2.43)* 2.14 (2.05, 2.22)* 2.13 (2.03, 2.25)* 2.01 (1.91, 2.11)*
Triglyceride/High-density lipoproteins ratio
<20% vigorous 2.98 (2.75, 3.23) 2.90 (2.64, 3.18) 2.63 (2.35, 2.94) 2.51 (2.11, 2.98) 2.22 (1.84, 2.68)*
≥20% vigorous 3.10 (2.84, 3.40) 2.81 (2.64, 3.00) 2.67 (2.54, 2.82) 2.43 (2.26, 2.61)* 2.47 (2.30, 2.65)*
† Values are multivariable-adjusted absolute biomarker concentrations adjusted for: age at blood draw (continuous), smoking (never, past or current smokers), race (White or
non-White), chronic diseases/conditions (0, 1, 2 or 3+), case/control status, dietary pattern (empirical dietary inflammatory pattern for c-reactive protein, interleukin-6 and
tumor necrosis factor alpha receptor 2; empirical dietary index for hyperinsulinemia for C-peptide; empirical dietary index for insulin resistance for triglyceride/High-density
lipoproteins ratio).
* P<0.05 (significant difference in plasma biomarker against the reference group (lowest total physical activity group with <20% vigorous activity)).

114
We further examined the association between total physical activity and the
aforementioned plasma biomarkers stratified by diet and BMI (Figure 2). Participants
with poor diet or high BMI had higher inflammation and insulin profiles than those with
good diet or low BMI, respectively. We generally observed greater differences in
plasma biomarkers when stratified by BMI than diet. Physical activity showed similar
benefits for these biomarkers across diet and BMI groups, except for C-peptide which
showed slightly higher reduction among those with poor diet (Pinteraction=0.01).
Similar patterns were shown when stratified by both diet and BMI (Figure S1).

115
Figure 2 - Joint association of total physical activity, diet and body mass index with plasma markers of inflammation and insulin
response, HPFS 1992-1994.
Abbreviation: CRP, C-reactive protein; IL6, interleukin 6; TNFαR2, tumor necrosis factor α receptor 2; TG/HDL, triglycerides/high density lipoprotein cholesterol
ratio.

116
5.4. DISCUSSION
In this large cross-sectional study, we found that high volume of physical
activity was associated with favorable cancer-related biomarker profiles. Given the
same volume of physical activity, engaging in moderate intensity exercises or aerobic
plus resistance exercises may offer additional beneficial changes in the circulating
levels of biomarkers of inflammation and insulin compared to engaging in higher
vigorous intensity exercises or aerobic exercises alone, respectively. Moreover, the
combined influence of physical activity, good diet and low adiposity may provide
substantial improvement in circulating biomarkers related to cancer risk.
Comparison with previous studies
Consistent with our findings, a number of intervention studies have shown the
effect of physical activity on improving biomarkers of inflammation and insulin (BIRD;
Hawley, 2017; Fedewa et al., 2017; Kang et al., 2017). However, the influence of
specific components of physical activity (e.g., volume, intensity, and type) on these
biomarkers remains is unclear. Moreover, majority of previous studies were done
among unhealthy populations with diseases. In the current study of generally healthy
7,219 men at blood draw, we found that increase in total physical activity was
associated with lower levels of circulating biomarkers of inflammation and insulin
response. We observed the benefit of engaging in physical activity even for the low
volume of PA (after 9 MET-h/week). The biomarkers of inflammation and insulin
response gradually decreased with higher physical activity until 63 MET-h/week,
showing a linear trend. Over 63 MET-h/week of physical activity, we found a relatively
small benefit for TNFαR2, C-peptide, and adiponectin, no change in CRP and TG/HDL,
and even slightly increased IL6. This finding suggests that higher volume of physical
activity is associated with linearly decreasing trend of inflammatory and insulin related
biomarkers. There was no harmful influence of engaging in high volume of physical
activity, although we found slightly increased IL6 in the most active group (63+ MET-
h/week) compared to the second most active group (42-62.9 MET-h/week). Because
IL6 is a sensitive cytokine that increases substantially but acutely in response to
exercise (Astrom et al., 2010), the most active group with very high volume of physical
activity may have reflected this acute change in our analysis.

117
When we adjusted for BMI, the associations between physical activity and the
biomarkers of inflammation and insulin were modestly attenuated but remained
statistically significant. Given that BMI is an imperfect measure of adiposity, we
conducted additional analysis by adjusting for predicted fat mass and percent fat to
better control adiposity but we found similar moderate attenuation of the estimates.
Growing evidence suggests that high adiposity increases cancer risk through several
mechanisms including upregulation of inflammation and insulin response (Giovannucci,
2001; Kitahara et al., 2014; Iyengar et al., 2016). Physical activity may act on
inflammation and insulin pathways by reduction of adiposity which is likely a mediator
in the relationship between physical activity and the biomarkers of inflammation and
insulin response (McTiernan, 2008). Thus, adjustment of adiposity could be an over
adjustment in the aforementioned relationship to some extent. In our study, we found
evidence that high physical activity has both direct (independent) and indirect (mediated
through adiposity) influence on improving the biomarkers of inflammation and insulin
response.
Type and intensity are important aspects of physical activity which may allow us
to provide detailed and effective physical activity guideline for the general population.
Regarding the types of physical activity, a recent review of the literature on physical
activity and insulin sensitivity in humans suggested that combination of aerobic and
resistance training may be more effective to improve insulin resistance than either
modality alone (Bird; Hawley, 2017). In our study, for the same amount of MET-hours
per week, aerobic plus resistance training was associated with a lower levels of CRP,
IL6, and C-peptide, and higher levels of adiponectin, than aerobic training only. On the
other hand, we did not find evidence of additional benefits of vigorous intensity
physical activity over moderate intensity in regards to the biomarker levels. Similarly, a
recent systematic review found that high-intensity interval training suggested similar
benefits to moderate-intensity continuous training for body fat reduction (Keating et al.,
2017).
Physical activity, adiposity, and diet have complex interrelationships
(Giovannucci, 2018b). Physical activity and diet may influence adiposity but they also
have direct influence on the circulating cancer-related biomarkers. Moreover, physical
activity may interact with adiposity and dietary pattern. Therefore, it is crucial to
understand how these ‘triad’ of physical activity, diet, and adiposity influence the

118
biomarkers of inflammation and insulin response. As expected, participants with high
adiposity or poor dietary pattern had higher levels of inflammation and insulin response
compared to those with low adiposity or good dietary pattern, respectively. In addition,
the combined influence of physical activity, dietary pattern, and adiposity was
substantial. Lean people with high physical activity and good dietary pattern had
approximately 2 to 3 folds lower CRP, IL6, C-peptide, and TG/HDL than
overweight/obese people with low physical activity and poor dietary pattern.
Interestingly, we found the decrease in inflammatory and metabolic markers per unit
increment of physical activity was broadly similar across adiposity level or dietary
pattern. Thus, physical activity improves biomarkers on all groups stratified by diet and
adiposity.
Biological mechanisms
The biological mechanisms linking physical activity and cancer risk are not fully
elucidated, and may differ for inflammatory and insulin related pathways. Inflammation
is strongly associated with adiposity level. While the results for physical activity were
only attenuated moderately by controlling for BMI, it is possible that physical activity
may lower biomarkers largely through reductions in visceral adiposity, and measures of
BMI may be too crude to distinguish this. For example, relatively short-term (months,
one year) physical activity interventions can cause substantial reductions in visceral
adiposity which correlates with biomarkers but have little effect on overall BMI
(Verheggen et al., 2016). It is important to consider the role of adiposity while
interpreting the association between physical activity and cancer biomarkers
(Giovannucci, 2018a; 2018b). Similarly, physical activity may influence insulin
biomarkers through changes in visceral adiposity and fatty liver, but also acutely
through immediate (e.g., one day) improvements in muscle insulin sensitivity (Hawley;
Lessard, 2008; Pedersen; Febbraio, 2012).
The effects of higher physical activity on inflammatory and insulin markers are
likely to strongly affect cardiometabolic diseases such as cardiovascular diseases and
diabetes directly, but may also decrease the risk of several types of cancer
(Giovannucci, 2001; 2010). Chronic inflammatory state induced by obesity, both at the
systemic and the tissue level (white adipose tissue), may increase susceptibility to tumor
development and growth via angiogenesis, enhanced hormone signaling and metabolic
119
disorders (Iyengar et al., 2016; O’Flanagan et al., 2017; Olson et al., 2017; WCRF,
2018). Insulin can stimulate resisting cell deaths, sustaining proliferative signaling and
evading growth suppressors (Iyengar et al., 2016; O’Flanagan et al., 2017; Olson et al.,
2017; WCRF, 2018).
Strengths and limitations
Our study has several strengths. First, a large sample provided sufficient power
to examine the independent and joint associations of physical activity (type and
intensity) and also interaction with diet and adiposity in relation to various biomarkers
of inflammation and insulin response. Second, we collected detailed information on
lifestyle factors and medical history which allowed us to finely control for potential
confounding. Third, average of two repeated measures of physical activity with detailed
information on volume, type, and intensity of activities reduced within-person
measurement errors and allowed us to study the important aspects of physical activity in
relation to the biomarkers.
There are several limitations to our study. Our study included predominantly
white male health professionals which may limit the generalizability. However, it
strengthens the internal validity and the characteristics of participants were similar to
the large multi-ethnic cohorts in the U.S. Moreover, measurement errors from two
questionnaires based physical activity and a single measure of biomarkers are inevitable
but such measurement errors are likely to be non-differential which may have attenuated
the associations. The advantage of relying on highly medically educated health
professionals is that they manifest a wide range of physical activity and in general report
fairly accurately. In Women’s Lifestyle validation study, objective measures of physical
activity showed consistent but slightly stronger associations with cardiometabolic and
endocrine biomarkers compared to questionnaire-based physical activity, though the use
of two questionnaires in our study may have improved assessment of physical activity
(Alessa et al., 2017).
Public health implications
Our results require confirmation but have several important implications. First,
for these cancer-related biomarkers, the effect of physical activity was fairly linear, up
to a level of 63 MET-hours per week. Thus, while improvement is seen at any level, a

120
high level is required for optimization. Second, while aerobic activity constitutes the
vast majority of the activity and benefits, incorporating some resistance training may
have additional benefits for the same level of total MET-hours. Third, benefits are
similar for the same accumulated MET-hours for vigorous and non-vigorous activity.
Importantly, this allows some flexibility in the amount of time spent and intensity of
work-out if one wants to attain a certain MET-hours. For example, if a goal is to attain
50 MET-hours per week, this can be done with 11 hours of brisk walking (moderate
activity), 7 hours of running, or 8 hours of moderate and 2 hours of vigorous activity.
Lastly, our results indicate that physical activity has relatively similar benefits for these
biomarkers across different strata of BMI and diet, and optimal results are achieved by
maximizing all three.
Funding: This work was supported by the National Institutes of Health (UM1
CA167552 and R01 HL35464).
Conflict of interest disclosures: The authors declared no conflicts of interest.
5.5. REFERENCES
Ainsworth BE, Haskell WL, Leon AS, Jacobs DR Jr, Montoye HJ, Sallis JF,
Paffenbarger RS Jr. Compendium of physical activities: classification of energy costs of
human physical activities. Med Sci Sports Exerc. 1993;25:71-80.
Alessa HB, Chomistek AK, Hankinson SE, Barnett JB, Rood J, Matthews CE, Rimm
EB, Willett WC, Hu FB, Tobias DK. Objective Measures of Physical Activity and
Cardiometabolic and Endocrine Biomarkers. Med Sci Sports Exerc. 2017;49:1817-25.
Al-Lamki RS, Sadler TJ, Wang J, Reid MJ, Warren AY, Movassagh M, Lu W, Mills
IG, Neal DE, Burge J, Vandenebeele P, Pober JS, Bradley JR. Tumor necrosis factor
receptor expression and signaling in renal cell carcinoma. Am J Pathol. 2010;177:943-
54.
Astrom M-B, Feigh M, Pedersen BK. Persistent low-grade inflammation and regular
exercise. Front Biosci. 2010;2:96-105.
Bao Y, Giovannucci EL, Kraft P, Stampfer MJ, Ogino S, Ma J, Buring JE, Sesso HD,
Lee IM, Gaziano JM, Rifai N, Pollak MN, Cochrane BB, Kaklamani V, Lin JH,
Manson JE, Fuchs CS, Wolpin BM. A prospective study of plasma adiponectin and
pancreatic cancer risk in five US cohorts. J Natl Cancer Inst. 2013;105:95-103.
Bird SR, Hawley JA. Update on the effects of physical activity on insulin sensitivity in
humans. BMJ Open Sport Exerc Med. 2017;2:e000143.
121
Chasan-Taber S, Rimm EB, Stampfer MJ, Spiegelman D, Colditz GA, Giovannucci E,
Ascherio A, Willett WC. Reproducibility and validity of a self-administered physical
activity questionnaire for male health professionals. Epidemiology. 1996;7:81-6.
Chen L, Li L, Wang Y, Li P, Luo L, Yang B, Wang H, Chen M. Circulating C-peptide
level is a predictive factor for colorectal neoplasia: evidence from the meta-analysis of
prospective studies. Cancer Causes Control. 2013;24:1837-47.
Cronin O, Keohane DM, Molloy MG, Shanahan F. The effect of exercise interventions
on inflammatory biomarkers in healthy, physically inactive subjects: a systematic
review. QJM. 2017;110:629-37.
Donnelly JE, Blair SN, Jakicic JM, Manore MM, Rankin JW, Smith BK; American
College of Sports Medicine. American College of Sports Medicine Position Stand.
Appropriate physical activity intervention strategies for weight loss and prevention of
weight regain for adults. Med Sci Sports Exerc. 2009;41:459-71.
Fedewa MV, Hathaway ED, Ward-Ritacco CL. Effect of exercise training on C reactive
protein: a systematic review and meta-analysis of randomised and non-randomised
controlled trials. Br J Sports Med. 2017;51:670-6.
Giovannucci E. Insulin, insulin-like growth factors and colon cancer: a review of the
evidence. J Nutr. 2001;131:3109S-20S.
Giovannucci E, Harlan DM, Archer MC, Bergenstal RM, Gapstur SM, Habel LA,
Pollak M, Regensteiner JG, Yee D. Diabetes and cancer: a consensus report. Diabetes
Care. 2010;33:1674-85.
Giovannucci E. An Integrative Approach for Deciphering the Causal Associations of
Physical Activity and Cancer Risk: The Role of Adiposity. J Natl Cancer Inst.
2018;110:935-941.
Giovannucci E. A framework to understand diet, physical activity, body weight, and
cancer risk. Cancer Causes Control. 2018;29(1):1-6.
Hawley JA, Lessard S. Exercise training‐induced improvements in insulin action. Acta
Physiol. 2008;192:127-35.
International Agency for Research on Cancer (IARC). Weight Control and Physical
Activity. IARC Handbook of Cancer Prevention Volume 6. Lyon: IARC Press; 2002.
Iyengar NM, Gucalp A, Dannenberg AJ, Hudis CA. Obesity and Cancer Mechanisms:
Tumor Microenvironment and Inflammation. J Clin Oncol. 2016;34:4270-6.
Kang DW, Lee J, Suh SH, Ligibel J, Courneya KS, Jeon JY. Effects of Exercise on
Insulin, IGF Axis, Adipocytokines, and Inflammatory Markers in Breast Cancer
Survivors: A Systematic Review and Meta-analysis. Cancer Epidemiol Biomarkers
Prev. 2017;26:355-65.
Keating SE, Johnson NA, Mielke GI, Coombes JS. A systematic review and meta-
analysis of interval training versus moderate-intensity continuous training on body
adiposity. Obes Rev. 2017;18:943-64.
Keum N, Bao Y, Smith-Warner SA, Orav J, Wu K, Fuchs CS, Giovannucci EL.
Association of physical activity by type and intensity with digestive system cancer risk.
JAMA Oncol. 2016;2:1146-53.

122
Kitahara CM, Trabert B, Katki HA, Chaturvedi AK, Kemp TJ, Pinto LA, Moore SC,
Purdue MP, Wentzensen N, Hildesheim A, Shiels MS. Body mass index, physical
activity, and serum markers of inflammation, immunity, and insulin resistance. Cancer
Epidemiol Biomarkers Prev. 2014;23:2840-9.
Lauby-Secretan B, Scoccianti C, Loomis D, Grosse Y, Bianchini F, Straif K,
International Agency for Research on Cancer Handbook Working Group. Body Fatness
and Cancer--Viewpoint of the IARC Working Group. N Engl J Med. 2016;375:794-8.
Lee DH, Keum N, Hu FB, Orav EJ, Rimm EB, Sun Q, Willett WC, Giovannucci EL.
Development and validation of anthropometric prediction equations for lean body mass,
fat mass and percent fat in adults using the National Health and Nutrition Examination
Survey (NHANES) 1999–2006. Br J Nutr. 2017;118:858-66.
McTiernan A. Mechanisms linking physical activity with cancer. Nat Rev Cancer.
2008;8:205-11.
Moore S1, Lee IM, Weiderpass E, Campbell PT, Sampson JN, Kitahara CM, Keadle
SK, Arem H, Berrington de Gonzalez A, Hartge P, Adami HO, Blair CK, Borch KB,
Boyd E, Check DP, Fournier A, Freedman ND, Gunter M, Johannson M, Khaw KT,
Linet MS, Orsini N, Park Y, Riboli E, Robien K, Schairer C, Sesso H, Spriggs M, Van
Dusen R, Wolk A, Matthews CE, Patel AV. Association of Leisure-Time Physical
Activity With Risk of 26 Types of Cancer in 1.44 Million Adults. JAMA Intern Med.
2016;176:816-825.
O’Flanagan CH, Bower LW, Allott EH, Hursting SD. Molecular and metabolic
mechanisms underlying the obesity–cancer link. In: Romieu I, Dossus L, Willet WC,
editors. Energy Balancer and Obesity (IARC Working Group Reports; 10). Lyon: IARC
Press; 2017.
Olson OC, Quail DF, Joyce JA. Obesity and the tumor microenvironment. Science.
2017;358:1130-1.
Pai JK, Pischon T, Ma J, Manson JE, Hankinson SE, Joshipura K, Curhan GC, Rifai N,
Cannuscio CC, Stampfer MJ, Rimm EB. Inflammatory markers and the risk of coronary
heart disease in men and women. N Engl J Med. 2004;351:2599-610.
Pedersen BK, Febbraio MA. Muscles, exercise and obesity: skeletal muscle as a
secretory organ. Nat Rev Endocrinol. 2012;8(8):457-65.
Rezende LFM, Sá TH, Markozannes G, Rey-López JP, Lee IM, Tsilidis KK, Ioannidis
JPA, Eluf-Neto J. Physical activity and cancer: an umbrella review of the literature
including 22 major anatomical sites and 770 000 cancer cases. Br J Sports Med.
2018;52:826-33.
Rimm EB, Giovannucci EL, Willett WC, Colditz GA, Ascherio A, Rosner B, Stampfer
MJ. Prospective study of alcohol consumption and risk of coronary disease in men.
Lancet. 1991;338:464-8.
Roddam AW, Allen NE, Appleby P, Key TJ, Ferrucci L, Carter HB, Metter EJ, Chen C,
Weiss NS, Fitzpatrick A, Hsing AW, Lacey JV Jr, Helzlsouer K, Rinaldi S, Riboli E,
Kaaks R, Janssen JA, Wildhagen MF, Schröder FH, Platz EA, Pollak M, Giovannucci
E, Schaefer C, Quesenberry CP Jr, Vogelman JH, Severi G, English DR, Giles GG,
Stattin P, Hallmans G, Johansson M, Chan JM, Gann P, Oliver SE, Holly JM, Donovan
J, Meyer F, Bairati I, Galan P. Insulin-like growth factors, their binding proteins, and

123
prostate cancer risk: analysis of individual patient data from 12 prospective studies. Ann
Int Med. 2008;149:461-71.
Rosner B, Cook N, Portman R, Daniels S, Falkner B. Determination of blood pressure
percentiles in normal-weight children: some methodological issues. Am J Epidemiol.
2008;167:653-66.
Song M, Zhang X, Wu K, Ogino S, Fuchs CS, Giovannucci EL, Chan AT. Plasma
adiponectin and soluble leptin receptor and risk of colorectal cancer: a prospective
study. Cancer Prev Res. 2013;6:875-85.
Tabung FK, Smith-Warner SA Chavarro JE, Wu K, Fuchs CS, Hu FB, Chan AT,
Willett WC, Giovannucci EL. Development and validation of an empirical Dietary
Inflammatory Index. J Nutr. 2016;146:1560-70.
Tabung FK, Wang W, Fung TT, Hu FB, Smith-Warner SA, Chavarro JE, Fuchs CS,
Willett WC, Giovannucci EL. Development and validation of empirical indices to
assess the insulinaemic potential of diet and lifestyle. Br J Nutr. 2016;116:1787-98.
Verheggen RJ, Maessen MF, Green DJ, Hermus AR, Hopman MT, Thijssen DH. A
systematic review and meta-analysis on the effects of exercise training versus
hypocaloric diet: distinct effects on body weight and visceral adipose tissue. Obes Rev.
2016;17:664-90.
Waldner MJ, Foersch S, Neurath MF. Interleukin-6--a key regulator of colorectal cancer
development. Int J Biol Sci. 2012;8:1248-53.
Wang J, Lee IM, Tworoger SS, Buring JE, Ridker PM, Rosner B, Hankinson SE.
Plasma C-reactive protein and risk of breast cancer in two prospective studies and a
meta-analysis. Cancer Epidemiol Biomarkers Prev. 2015;24:1199-206.
Wei EK, Giovannucci E, Fuchs CS, Willett WC, Mantzoros CS. Low plasma
adiponectin levels and risk of colorectal cancer in men: a prospective study. J Natl
Cancer Inst. 2005;97:1688-94.
World Cancer Research Fund/American Institute for Cancer Research. Continuous
Update Project Expert Report 2018. Physical activity and risk of cancer. Available at
dietandcancerreport.org
World Cancer Research Fund/American Institute for Cancer Research. Continous
Update Project Expert Report 2018. Body fatness and weight gain and the risk of
cancer. Available from: dietandcancerreport.org

124
SUPPLEMENTARY FILE
Table S1 - Joint association of total physical activity and type of activity with plasma biomarkers of
inflammation and insulin response, HPFS 1992-1994 Total physical activity (MET-h/week)
0 to <9 9 to <21 21 to <42 42 to 63 63+
C-reactive protein (mg/L)
Multivariable† Aerobic only 1.13 (1.05, 1.23) 0.96 (0.89, 1.04)* 0.93 (0.87, 1.00)* 0.81 (0.73, 0.89)* 0.80 (0.72, 0.88)*
Aerobic plus resistance training 0.95 (0.68, 1.34)* 0.86 (0.73, 1.02)* 0.86 (0.76, 0.97)* 0.65 (0.55, 0.75)* 0.72 (0.63, 0.82)*
Multivariable† plus adult BMI Aerobic only 1.21 (1.12, 1.31) 1.08 (1.00, 1.17) 1.07 (1.00, 1.15) 0.93 (0.84, 1.03)* 0.93 (0.84, 1.02)*
Aerobic plus resistance training 1.12 (0.80, 1.55) 1.02 (0.86, 1.20) 1.01 (0.90, 1.14) 0.78 (0.67, 0.91)* 0.90 (0.79, 1.03)*
Interleukin-6 (pg/L) Multivariable†
Aerobic only 1.63 (1.50, 1.78) 1.48 (1.37, 1.60) 1.32 (1.23, 1.43)* 1.2 (1.08, 1.34)* 1.30 (1.17, 1.45)*
Aerobic plus resistance training 1.21 (0.82, 1.79) 1.37 (1.14, 1.64) 1.28 (1.13, 1.45)* 1.2 (1.02, 1.41)* 1.16 (1.00, 1.33)* Multivariable† plus adult BMI
Aerobic only 1.70 (1.56, 1.86) 1.59 (1.46, 1.73) 1.43 (1.33, 1.55)* 1.31 (1.17, 1.46)* 1.42 (1.27, 1.58)
Aerobic plus resistance training 1.34 (0.91, 1.98) 1.51 (1.26, 1.82) 1.40 (1.24, 1.59) 1.32 (1.12, 1.56) 1.30 (1.12, 1.50)* Tumor necrosis factor alpha receptor 2 (ng/mL)
Multivariable†
Aerobic only 2.79 (2.74, 2.85) 2.69 (2.64, 2.74) 2.72 (2.67, 2.77) 2.66 (2.59, 2.73)* 2.58 (2.52, 2.65)* Aerobic plus resistance training 2.64 (2.43, 2.87) 2.64 (2.53, 2.76) 2.67 (2.59, 2.75) 2.58 (2.48, 2.69)* 2.56 (2.47, 2.65)*
Multivariable† plus adult BMI
Aerobic only 2.81 (2.75, 2.87) 2.72 (2.67, 2.77) 2.75 (2.70, 2.80) 2.7 (2.63, 2.77) 2.62 (2.55, 2.69)* Aerobic plus resistance training 2.68 (2.47, 2.92) 2.68 (2.57, 2.80) 2.71 (2.63, 2.79) 2.63 (2.53, 2.74)* 2.61 (2.51, 2.71)*
Adiponectin (μ/mL)
Multivariable† Aerobic only 5.95 (5.73, 6.17) 6.13 (5.92, 6.34) 6.29 (6.09, 6.50) 6.52 (6.21, 6.83) 6.39 (6.09, 6.70)
Aerobic plus resistance training 5.40 (4.65, 6.26) 6.36 (5.89, 6.86) 6.16 (5.83, 6.51) 6.23 (5.80, 6.69) 6.60 (6.19, 7.03)*
Multivariable† plus adult BMI Aerobic only 5.87 (5.66, 6.09) 5.97 (5.76, 6.18) 6.08 (5.88, 6.29) 6.28 (5.99, 6.59) 6.15 (5.86, 6.45)
Aerobic plus resistance training 5.22 (4.51, 6.05) 6.08 (5.64, 6.56) 5.93 (5.62, 6.27) 5.93 (5.52, 6.36) 6.20 (5.82, 6.61)
C-peptide (ng/mL) Multivariable†
Aerobic only 2.60 (2.47, 2.73) 2.34 (2.24, 2.45)* 2.18 (2.09, 2.27)* 2.18 (2.05, 2.31)* 2.14 (2.02, 2.27)*
Aerobic plus resistance training 2.39 (1.95, 2.91)* 2.20 (1.98, 2.44)* 2.11 (1.97, 2.25)* 1.96 (1.81, 2.13)* 1.82 (1.68, 1.97)* Multivariable† plus adult BMI
Aerobic only 2.71 (2.57, 2.85) 2.51 (2.39, 2.63) 2.38 (2.28, 2.49)* 2.39 (2.25, 2.54)* 2.37 (2.23, 2.51)*
Aerobic plus resistance training 2.68 (2.21, 3.26) 2.47 (2.23, 2.74) 2.33 (2.18, 2.49)* 2.19 (2.02, 2.37)* 2.06 (1.90, 2.23)* Triglyceride/High-density lipoproteins ratio
Multivariable†
Aerobic only 3.01 (2.83, 3.21) 2.90 (2.73, 3.07) 2.64 (2.50, 2.79)* 2.33 (2.16, 2.53)* 2.43 (2.24, 2.64)* Aerobic plus resistance training 3.38 (2.64, 4.31) 2.60 (2.29, 2.94) 2.73 (2.48, 3.00) 2.70 (2.40, 3.04) 2.44 (2.19, 2.72)*
Multivariable† plus adult BMI
Aerobic only 3.10 (2.92, 3.30) 3.06 (2.88, 3.24) 2.85 (2.70, 3.01) 2.56 (2.37, 2.77)* 2.65 (2.45, 2.87)* Aerobic plus resistance training 3.68 (2.91, 4.66) 2.70 (2.40, 3.05) 2.99 (2.73, 3.28) 3.05 (2.71, 3.42) 2.76 (2.48, 3.07)
† Multivariable model including age at blood draw (continuous), smoking (never, past or current smokers), race (White or non-White), chronic
diseases/conditions (0, 1, 2 or 3+), case/control status, dietary pattern (empirical dietary inflammatory pattern for c-reactive protein, interleukin-6 and tumor necrosis factor alpha receptor 2; empirical dietary index for hyperinsulinemia for C-peptide; empirical dietary index for insulin resistance for triglyceride/High-
density lipoproteins ratio).
* P<0.05 (significant difference in plasma biomarker against the reference group (lowest total physical activity group with aerobic only)).

125
† Multivariable model including age at blood draw (continuous), smoking (never, past or current smokers), race (White or non-White), chronic diseases/conditions (0, 1, 2 or 3+), case/control status, dietary
pattern (empirical dietary inflammatory pattern for c-reactive protein, interleukin-6 and tumor necrosis factor alpha receptor 2; empirical dietary index for hyperinsulinemia for C-peptide; empirical dietary
index for insulin resistance for triglyceride/High-density lipoproteins ratio) and mutually adjusted for aerobic and resistance trainings.‡ P value for linear trend test was obtained using physical activity as a
continuous variable. * P<0.05 (significant difference in plasma biomarker against the reference group (lowest aerobic or resistance training group).
Table S2 - Association of resistance training and aerobic physical activity with plasma biomarkers of inflammation and insulin response, HPFS 1992-1994 Physical activity (MET-h/week)
0 >1 to <4.5 4.5 to <9 9 to <13.5 13.5 to <21 21 to <42 42 to 63 63+ Ptrend‡
C-reactive protein (mg/L)
Multivariable† Resistance training 0.97 (0.91, 1.04) 0.86 (0.77, 0.96) 0.86 (0.73, 1.01) 0.87 (0.71, 1.06) 0.71 (0.53, 0.97) 0.06
Aerobic 0.94 (0.60, 1.47) 1.14 (0.99, 1.32) 0.88 (0.77, 1.00) 0.86 (0.76, 0.99) 0.84 (0.75, 0.95) 0.80 (0.73, 0.88) 0.72 (0.65, 0.81) 0.69 (0.62, 0.77) <0.001
Multivariable† plus adult BMI Resistance training 1.09 (1.02, 1.17) 1.01 (0.91, 1.13) 1.01 (0.86, 1.20) 1.06 (0.87, 1.29) 0.85 (0.64, 1.15) 0.34
Aerobic 1.13 (0.73, 1.75) 1.26 (1.09, 1.44) 1.00 (0.87, 1.14) 1.02 (0.90, 1.17) 0.99 (0.88, 1.11) 0.96 (0.87, 1.06) 0.87 (0.78, 0.97) 0.85 (0.76, 0.95) <0.001
Interleukin-6 (pg/L) Multivariable†
Resistance training 1.46 (1.35, 1.57) 1.32 (1.17, 1.49) 1.32 (1.10, 1.58) 1.36 (1.10, 1.68) 1.40 (1.05, 1.87) 0.51
Aerobic 1.58 (0.93, 2.69) 1.68 (1.44, 1.95) 1.40 (1.21, 1.61) 1.32 (1.15, 1.52) 1.45 (1.29, 1.64) 1.26 (1.15, 1.39) 1.14 (1.02, 1.29) 1.19 (1.07, 1.34) <0.001
Multivariable† plus adult BMI
Resistance training 1.56 (1.44, 1.69) 1.45 (1.28, 1.64) 1.45 (1.20, 1.74) 1.51 (1.22, 1.87) 1.53 (1.14, 2.04) 0.80
Aerobic 1.75 (1.04, 2.97) 1.77 (1.52, 2.06) 1.50 (1.30, 1.74) 1.46 (1.27, 1.68) 1.58 (1.40, 1.79) 1.39 (1.26, 1.54) 1.26 (1.12, 1.42) 1.33 (1.18, 1.49) 0.004 Tumor necrosis factor alpha receptor 2 (ng/mL)
Multivariable†
Resistance training 2.71 (2.66, 2.75) 2.63 (2.56, 2.71) 2.64 (2.53, 2.76) 2.70 (2.56, 2.84) 2.60 (2.43, 2.79) 0.50 Aerobic 2.70 (2.41, 3.02) 2.73 (2.64, 2.83) 2.74 (2.65, 2.83) 2.64 (2.55, 2.72) 2.65 (2.58, 2.73) 2.67 (2.61, 2.73) 2.60 (2.53, 2.67) 2.53 (2.46, 2.60) <0.001
Multivariable† plus adult BMI
Resistance training 2.74 (2.70, 2.79) 2.67 (2.60, 2.75) 2.68 (2.56, 2.80) 2.75 (2.61, 2.90) 2.65 (2.47, 2.84) 0.72 Aerobic 2.75 (2.46, 3.08) 2.76 (2.66, 2.86) 2.77 (2.68, 2.87) 2.68 (2.59, 2.77) 2.69 (2.61, 2.77) 2.71 (2.65, 2.78) 2.65 (2.57, 2.72) 2.58 (2.51, 2.65) <0.001
Adiponectin (μ/mL)
Multivariable† Resistance training 6.22 (6.04, 6.40) 6.11 (5.81, 6.43) 6.30 (5.83, 6.80) 6.20 (5.66, 6.80) 6.94 (6.06, 7.95) 0.44
Aerobic 6.64 (5.43, 8.12) 5.75 (5.39, 6.13) 6.30 (5.93, 6.70) 6.23 (5.87, 6.62) 6.33 (6.00, 6.67) 6.44 (6.16, 6.72) 6.54 (6.21, 6.88) 6.60 (6.28, 6.93) 0.006
Multivariable† plus adult BMI Resistance training 6.05 (5.87, 6.24) 5.86 (5.57, 6.17) 6.02 (5.58, 6.50) 5.91 (5.40, 6.47) 6.67 (5.84, 7.63) 0.60
Aerobic 6.29 (5.16, 7.67) 5.65 (5.30, 6.01) 6.11 (5.75, 6.49) 6.01 (5.66, 6.38) 6.09 (5.78, 6.42) 6.16 (5.89, 6.43) 6.24 (5.93, 6.57) 6.25 (5.95, 6.58) 0.04
C-peptide (ng/mL) Multivariable†
Resistance training 2.36 (2.26, 2.47) 2.13 (1.99, 2.27)* 2.21 (2.00, 2.44) 2.21 (1.96, 2.49) 1.98 (1.69, 2.33) 0.12
Aerobic 2.36 (1.75, 3.19) 2.33 (2.13, 2.55) 2.44 (2.26, 2.65) 2.23 (2.06, 2.42) 2.10 (1.97, 2.25) 2.03 (1.92, 2.14) 2.02 (1.90, 2.16) 1.92 (1.81, 2.04) <0.001 Multivariable† plus adult BMI
Resistance training 2.53 (2.42, 2.64) 2.34 (2.19, 2.50)* 2.45 (2.23, 2.71) 2.45 (2.18, 2.76) 2.13 (1.82, 2.49) 0.19
Aerobic 2.53 (1.89, 3.39) 2.46 (2.26, 2.69) 2.63 (2.43, 2.85) 2.45 (2.27, 2.66) 2.30 (2.15, 2.46) 2.26 (2.14, 2.38) 2.25 (2.11, 2.40) 2.16 (2.03, 2.30) 0.003 Triglyceride/High-density lipoproteins ratio
Multivariable†
Resistance training 2.71 (2.59, 2.84) 2.79 (2.57, 3.03) 2.89 (2.53, 3.30) 2.49 (2.11, 2.94) 2.34 (1.81, 3.02) 0.20 Aerobic 2.38 (1.73, 3.27) 3.15 (2.82, 3.53) 2.78 (2.50, 3.09) 2.90 (2.61, 3.23) 2.66 (2.43, 2.92) 2.57 (2.37, 2.78) 2.41 (2.20, 2.64) 2.35 (2.15, 2.56) <0.001
Multivariable† plus adult BMI
Resistance training 2.88 (2.75, 3.02) 3.04 (2.81, 3.30) 3.11 (2.74, 3.54) 2.73 (2.32, 3.20) 2.52 (1.97, 3.23) 0.48 Aerobic 2.67 (1.97, 3.63) 3.27 (2.93, 3.64) 2.92 (2.63, 3.24) 3.06 (2.76, 3.40) 2.85 (2.60, 3.11) 2.81 (2.60, 3.04) 2.67 (2.44, 2.92) 2.61 (2.39, 2.85) <0.001

126
Table S3 - Joint association of total physical activity and intensity with plasma biomarkers of
inflammation and insulin response, HPFS 1992-1994 Total physical activity (MET-h/week)
0 to <9 9 to <21 21 to <42 42 to 63 63+
C-reactive protein (mg/L)
Multivariable†
<20% vigorous 1.20 (1.08, 1.33) 0.94 (0.84, 1.07)* 0.87 (0.75, 1.00)* 0.89 (0.72, 1.10) 0.70 (0.56, 0.88)*
≥20% vigorous 1.04 (0.92, 1.16) 0.95 (0.87, 1.03)* 0.92 (0.86, 0.99)* 0.73 (0.67, 0.80)* 0.78 (0.71, 0.85)* Multivariable† plus adult BMI
<20% vigorous 1.29 (1.17, 1.43) 1.06 (0.94, 1.20) 1.01 (0.88, 1.16)* 1.03 (0.84, 1.27) 0.83 (0.67, 1.05)*
≥20% vigorous 1.11 (0.99, 1.24) 1.07 (0.99, 1.17)* 1.07 (1.00, 1.14)* 0.86 (0.78, 0.94)* 0.93 (0.85, 1.01)* Interleukin-6 (pg/L)
Multivariable†
<20% vigorous 1.64 (1.47, 1.84) 1.39 (1.21, 1.60) 1.33 (1.15, 1.54) 0.85 (0.68, 1.06)* 0.93 (0.72, 1.20)* ≥20% vigorous 1.56 (1.38, 1.77) 1.49 (1.37, 1.62) 1.31 (1.22, 1.40)* 1.29 (1.17, 1.42)* 1.29 (1.18, 1.42)*
Multivariable† plus adult BMI
<20% vigorous 1.71 (1.53, 1.92) 1.50 (1.30, 1.72) 1.44 (1.24, 1.67) 0.94 (0.75, 1.17)* 1.03 (0.80, 1.32)* ≥20% vigorous 1.64 (1.44, 1.86) 1.61 (1.47, 1.76) 1.42 (1.32, 1.53)* 1.40 (1.27, 1.55) 1.43 (1.30, 1.57)
Tumor necrosis factor alpha receptor 2
(ng/mL)
Multivariable†
<20% vigorous 2.78 (2.71, 2.85) 2.67 (2.58, 2.75) 2.66 (2.57, 2.75) 2.62 (2.49, 2.77) 2.56 (2.41, 2.72)
≥20% vigorous 2.78 (2.70, 2.87) 2.69 (2.63, 2.75) 2.72 (2.67, 2.76) 2.64 (2.58, 2.71)* 2.58 (2.52, 2.64)* Multivariable† plus adult BMI
<20% vigorous 2.80 (2.73, 2.88) 2.70 (2.61, 2.79) 2.69 (2.60, 2.79) 2.67 (2.53, 2.81) 2.61 (2.46, 2.77)
≥20% vigorous 2.80 (2.72, 2.89) 2.72 (2.66, 2.78) 2.75 (2.71, 2.80) 2.68 (2.62, 2.75) 2.62 (2.56, 2.68)* Adiponectin (μ/mL)
Multivariable†
<20% vigorous 5.82 (5.55, 6.10) 6.15 (5.82, 6.49) 6.33 (5.93, 6.74) 6.38 (5.77, 7.05) 6.40 (5.76, 7.11) ≥20% vigorous 6.03 (5.73, 6.36) 6.18 (5.94, 6.42) 6.24 (6.05, 6.44) 6.43 (6.16, 6.72)* 6.47 (6.21, 6.74)*
Multivariable† plus adult BMI
<20% vigorous 5.73 (5.47, 6.01) 6.00 (5.68, 6.34) 6.09 (5.71, 6.49) 6.14 (5.57, 6.78) 6.12 (5.52, 6.79) ≥20% vigorous 5.96 (5.66, 6.28) 5.99 (5.76, 6.22) 6.04 (5.84, 6.23) 6.18 (5.92, 6.45) 6.18 (5.93, 6.44)
C-peptide (ng/mL)
Multivariable† <20% vigorous 2.61 (2.43, 2.80) 2.33 (2.16, 2.52) 2.24 (2.08, 2.42)* 1.90 (1.68, 2.15)* 2.15 (1.87, 2.47)
≥20% vigorous 2.55 (2.38, 2.74) 2.31 (2.2, 2.43)* 2.14 (2.05, 2.22)* 2.13 (2.03, 2.25)* 2.01 (1.91, 2.11)* Multivariable† plus adult BMI
<20% vigorous 2.72 (2.54, 2.91) 2.51 (2.33, 2.72) 2.47 (2.30, 2.67) 2.14 (1.9, 2.42)* 2.41 (2.11, 2.75)
≥20% vigorous 2.69 (2.51, 2.89) 2.50 (2.37, 2.63) 2.34 (2.24, 2.44)* 2.35 (2.22, 2.48)* 2.24 (2.12, 2.35)*
Triglyceride/High-density lipoproteins ratio
Multivariable†
<20% vigorous 2.98 (2.75, 3.23) 2.90 (2.64, 3.18) 2.63 (2.35, 2.94) 2.51 (2.11, 2.98) 2.22 (1.84, 2.68)* ≥20% vigorous 3.10 (2.84, 3.40) 2.81 (2.64, 3.00) 2.67 (2.54, 2.82) 2.43 (2.26, 2.61)* 2.47 (2.30, 2.65)*
Multivariable† plus adult BMI
<20% vigorous 3.08 (2.85, 3.33) 3.04 (2.77, 3.34) 2.88 (2.58, 3.21) 2.71 (2.29, 3.20) 2.45 (2.04, 2.94) ≥20% vigorous 3.20 (2.93, 3.49) 2.96 (2.78, 3.15) 2.88 (2.73, 3.04) 2.69 (2.51, 2.89) 2.72 (2.53, 2.91)
† Multivariable model including age at blood draw (continuous), smoking (never, past or current smokers), race (White or non-White), chronic
diseases/conditions (0, 1, 2 or 3+), case/control status, dietary pattern (empirical dietary inflammatory pattern for c-reactive protein, interleukin-6 and tumor
necrosis factor alpha receptor 2; empirical dietary index for hyperinsulinemia for C-peptide; empirical dietary index for insulin resistance for triglyceride/High-density lipoproteins ratio).
* P<0.05 (significant difference in plasma biomarker against the reference group (lowest total physical activity group with <20% vigorous activity)).

127
Table S4 - Association of moderate and vigorous physical activities with plasma biomarkers of inflammation and
insulin response, HPFS 1992-1994 Total physical activity (MET-h/week)
0 to <9 9 to <21 21 to <42 42 to 63 63+ Ptrend‡
C-reactive protein (mg/L) Multivariable†
Moderate 0.92 (0.87, 0.98) 0.82 (0.77, 0.88)* 0.79 (0.73, 0.86)* 0.77 (0.67, 0.88) 0.66 (0.53, 0.82)* <0.001
Vigorous 0.91 (0.85, 0.97) 0.85 (0.79, 0.93) 0.72 (0.66, 0.79)* 0.73 (0.64, 0.84)* 0.75 (0.66, 0.85)* 0.002 Multivariable† plus adult BMI
Moderate 1.04 (0.98, 1.11) 0.96 (0.90, 1.02) 0.94 (0.86, 1.01) 0.93 (0.81, 1.06) 0.80 (0.65, 0.99) <0.001
Vigorous 1.04 (0.97, 1.11) 1.01 (0.93, 1.09) 0.85 (0.78, 0.94)* 0.86 (0.76, 0.98)* 0.90 (0.79, 1.02) 0.02 Interleukin-6 (pg/L)
Multivariable† Moderate 1.45 (1.36, 1.55) 1.34 (1.25, 1.44) 1.25 (1.15, 1.36)* 1.03 (0.88, 1.20)* 1.16 (0.92, 1.47) <0.001
Vigorous 1.30 (1.20, 1.40) 1.24 (1.14, 1.36) 1.19 (1.08, 1.32) 1.25 (1.1, 1.44) 1.21 (1.05, 1.38) 0.40
Multivariable† plus adult BMI Moderate 1.56 (1.46, 1.67) 1.45 (1.35, 1.57) 1.38 (1.26, 1.5)* 1.14 (0.98, 1.33)* 1.30 (1.03, 1.64) <0.001
Vigorous 1.40 (1.30, 1.52) 1.36 (1.24, 1.50) 1.32 (1.19, 1.46) 1.37 (1.19, 1.57) 1.33 (1.16, 1.53) 0.55
Tumor necrosis factor alpha receptor 2 (ng/mL) Multivariable†
Moderate 2.72 (2.68, 2.77) 2.66 (2.61, 2.70) 2.60 (2.55, 2.65)* 2.53 (2.44, 2.63)* 2.57 (2.44, 2.71) <0.001
Vigorous 2.65 (2.60, 2.69) 2.66 (2.60, 2.72) 2.61 (2.55, 2.68) 2.60 (2.51, 2.68) 2.57 (2.48, 2.66) 0.02 Multivariable† plus adult BMI
Moderate 2.75 (2.71, 2.80) 2.69 (2.65, 2.74) 2.64 (2.58, 2.69)* 2.58 (2.49, 2.67)* 2.61 (2.48, 2.76) <0.001
Vigorous 2.68 (2.63, 2.73) 2.70 (2.64, 2.76) 2.65 (2.59, 2.72) 2.63 (2.55, 2.72) 2.61 (2.52, 2.70) 0.03 Adiponectin (μ/mL)
Multivariable†
Moderate 6.16 (5.99, 6.34) 6.36 (6.17, 6.56) 6.40 (6.17, 6.63) 6.46 (6.06, 6.89) 6.99 (6.34, 7.72) 0.006 Vigorous 6.30 (6.10, 6.50) 6.45 (6.21, 6.70) 6.56 (6.28, 6.85) 6.55 (6.16, 6.96) 6.49 (6.11, 6.90) 0.18
Multivariable† plus adult BMI
Moderate 5.98 (5.81, 6.16) 6.13 (5.94, 6.33) 6.12 (5.89, 6.35) 6.15 (5.76, 6.56) 6.68 (6.06, 7.36) 0.06 Vigorous 6.10 (5.91, 6.31) 6.20 (5.96, 6.44) 6.26 (5.99, 6.54) 6.30 (5.93, 6.69) 6.18 (5.82, 6.57) 0.28
C-peptide (ng/mL)
Multivariable† Moderate 2.26 (2.18, 2.34) 2.08 (2.01, 2.16)* 2.08 (1.99, 2.17)* 1.90 (1.75, 2.07)* 2.24 (1.99, 2.53) 0.001
Vigorous 2.31 (2.22, 2.41) 2.12 (2.02, 2.22)* 2.09 (1.98, 2.20)* 1.97 (1.83, 2.13)* 2.07 (1.92, 2.23)* 0.007
Multivariable† plus adult BMI Moderate 2.44 (2.35, 2.54) 2.28 (2.19, 2.37)* 2.32 (2.22, 2.44) 2.14 (1.97, 2.32)* 2.54 (2.26, 2.85) 0.07
Vigorous 2.53 (2.43, 2.64) 2.36 (2.24, 2.48)* 2.33 (2.20, 2.45)* 2.19 (2.03, 2.36)* 2.31 (2.15, 2.50) 0.01
Triglyceride/High-density lipoproteins ratio Multivariable†
Moderate 2.76 (2.63, 2.89) 2.59 (2.46, 2.73) 2.44 (2.30, 2.60)* 2.26 (2.03, 2.52)* 2.37 (2.00, 2.82) <0.001
Vigorous 2.68 (2.54, 2.83) 2.49 (2.33, 2.65) 2.46 (2.29, 2.64) 2.34 (2.10, 2.60) 2.45 (2.21, 2.71) 0.01 Multivariable† plus adult BMI
Moderate 2.92 (2.79, 3.07) 2.82 (2.68, 2.97) 2.68 (2.51, 2.85) 2.50 (2.24, 2.78)* 2.64 (2.23, 3.12) 0.001
Vigorous 2.86 (2.70, 3.02) 2.70 (2.53, 2.88) 2.72 (2.54, 2.92) 2.57 (2.32, 2.86) 2.70 (2.44, 2.98) 0.06
† Multivariable model including age at blood draw (continuous), smoking (never, past or current smokers), race (White or non-White), chronic diseases/conditions (0, 1, 2 or 3+), case/control status, dietary pattern (empirical dietary inflammatory pattern for c-reactive protein, interleukin-6 and tumor necrosis factor alpha receptor 2;
empirical dietary index for hyperinsulinemia for C-peptide; empirical dietary index for insulin resistance for triglyceride/High-density lipoproteins ratio) and mutually
adjusted for moderate and vigorous activities. ‡ P value for linear trend test was obtained using physical activity as a continuous variable
* P<0.05 (significant difference in plasma biomarker against the reference group (lowest moderate or vigorous activity group)).

128
Figure S1 - Joint associations of total physical activity, diet and body mass index with plasma markers of inflammation and insulin
response, HPFS 1992-1994
Abbreviation: CRP, C-reactive protein; IL6, interleukin 6; TNFαR2, tumor necrosis factor α receptor 2; TG/HDL, triglycerides/high density lipoprotein cholesterol ratio.

129
6. PREVENTABILIDADE DE CÂNCER MEDIANTE AUMENTO
DA ATIVIDADE FÍSICA NO BRASIL
Este capítulo apresenta o artigo “Preventable fractions of colon and breast cancers by
increasing physical activity in Brazil: perspectives from plausible counterfactual
scenarios” de autoria de Leandro Fórnias Machado de Rezende, Leandro Martim Totaro
Garcia, Grégore Iven Mielke, Dong Hoon Lee, Kana Wu, Edward Giovannucci e José
Eluf-Neto. O artigo foi originalmente publicado na revista Cancer Epidemiology e pode
ser acessado gratuitamente no link:
https://www.sciencedirect.com/science/article/pii/S1877782118303436.
Essa publicação apresenta material suplementar extenso, disponível apenas no link da
revista.
Para citação: Rezende LFM, Garcia LMT, Mielke GI, Lee DH, Wu K, Giovannucci E,
Eluf-Neto J. Preventable fractions of colon and breast cancers by increasing physical
activity in Brazil: perspectives from plausible counterfactual scenarios. Cancer
Epidemiol. 2018;56:38-45.

130
Preventable fractions of colon and breast cancers by increasing physical activity in
Brazil: perspectives from plausible counterfactual scenarios
Leandro Fórnias Machado de Rezende1*, Leandro Martin Totaro Garcia2, Grégore Iven
Mielke3,4, Dong Hoon Lee5, Kana Wu5, Edward Giovannucci5,6,7,#, José Eluf-Neto1,#
1 Departamento de Medicina Preventiva, Faculdade de Medicina FMUSP, Universidade
de Sao Paulo, Sao Paulo, SP, BR
2 UKCRC Centre for Diet and Activity Research, MRC Epidemiology Unit, University
of Cambridge School of Clinical Medicine, Cambridge, United Kingdom.
5 School of Human Movement and Nutrition Sciences, University of Queensland,
Brisbane, Australia
4 Postgraduate Program in Epidemiology, Federal University of Pelotas, Brazil
5 Department of Nutrition, Harvard T.H. Chan School of Public Health, Boston,
Massachusetts;
6 Department of Epidemiology, Harvard T.H. Chan School of Public Health, Boston,
Massachusetts
7 Channing Division of Network Medicine, Brigham and Women's Hospital and
Harvard Medical School, Boston, Massachusetts.
# These authors contributed equally to this paper
*Corresponding author contact:
Address: Av Dr Arnaldo 455, 2nd floor. Sao Paulo, SP, Brazil. 01246-903
Email: [email protected]; Tel: +55 11 997209262
ORCID: 0000-0002-7469-1399
Word count
Abstract: 250
The total manuscript: 2986
Highlights: 80

131
ABSTRACT
Background: Physical activity is associated with lower risk of colon and breast cancers.
Herein we estimated preventable fractions of colon and breast cancers in Brazil by
increasing population-wide physical activity to different counterfactual scenarios.
Methods: We used data from a representative national survey in Brazil and
corresponding relative risks of colon and postmenopausal breast cancers from a meta-
analysis. Estimated cancer incidence was retrieved from GLOBOCAN and Brazilian
National Cancer Institute. Five counterfactual scenarios for physical activity were
considered: (i) theoretical minimum risk exposure level (≥8,000 metabolic equivalent of
tasks-minute/week – MET-min/week); (ii) physical activity recommendation (≥600
MET-min/week); (iii) a 10% reduction in prevalence of insufficient physical inactivity
(<600 MET-min/week); (iv) physical activity level in each state equals the most active
state in Brazil; (v) closing the gender differences in physical activity. Results: About
19% (3,630 cases) of colon cancers and 12% (6,712 cases) of postmenopausal breast
cancers could be prevented by increasing physical activity to ≥8,000 MET-min/week.
Plausible counterfactual scenarios suggested the following impact on cancer prevention:
reaching physical activity recommendation: 1.3% (1,113 cases) of breast and 6% (1,137
cases) of colon; 10% reduction in physical inactivity prevalence: 0.2% (111 cases) of
breast and 0.6% (114 cases) of colon; most active state scenario: 0.3% (168 cases) of
breast and 1% (189 cases) of colon; reducing gender differences in physical activity:
1.1% (384 cases) of breast and 0.6% (122 cases) of colon. Conclusions: High levels of
physical activity are required to achieve sizable impact on breast and colon cancer
prevention in Brazil.

132
6.1. INTRODUCTION
Convincing evidence supports the association between physical activity and
lower risk of colon and breast cancers (IARC, 2002; WCRF, 2018, Rezende et al.,
2018). Potential protective effect of physical activity for other cancer sites has been
recently suggested (Liu et al., 2011, Behrens; Leitzmann, 2013; Behrens et al., 2013;
2014; Zhong et al., 2014; Farris et al., 2015; Niedermaier et al., 2015; Schmid et al.,
2015; Brenner et al., 2016; Moore et al., 2016, Psaltopoulou et al., 2016), but the
evidence is less consistent and dose-response shape unknown (Rezende et al., 2018).
Physical activity may exert major influences on cancer risk mainly through weight
management and adiposity level (Donnelly et al., 2009; Giovannucci, 2018), and
additionally via direct effects on hormones and inflammatory markers (McTiernan,
2008; Koelwyn et al., 2017; Giovannucci, 2018). To obtain these health benefits the
World Health Organization (WHO) recommends at least 600 metabolic equivalents of
tasks-minute per week (MET-min/week) of total physical activity, which has been
translated as 150 min/week in activities with moderate intensity (3 to 6 MET) or 75
min/week in vigorous activities (>6 MET) (WHO, 2010). However, higher levels of
total physical activity (i.e., ≥8,000 MET-min/week) have been recently suggested to
provide optimum risk reduction returns in non-communicable diseases (NCDs),
especially for breast and colon cancers (Kyu et al., 2016).
Globally, lack physical activity accounts for, on average, 12% of breast cancer
and 18% of colon cancer (Whiteman; Wilson, 2016). To calculate the fraction of
cancers due to lack of physical activity, both the distribution of physical activity at the
population level (e.g., prevalence of exposure) and the relative risk (RR) of cancer are
required (Murray et al., 2003, Rezende; Eluf-Neto, 2016). Frequently, studies have
obtained RR from meta-analyses comparing the most and the least active groups, which
is heterogeneously defined across primary studies. Therefore, definition of lack of
physical activity cannot be consistently used to estimate the exposure level at the target
population.
Studies on preventable fractions usually report the proportion of cancer that
could be potentially avoided if exposure to a certain risk factor were eliminated (i.e.,
theoretical minimum risk exposure level) (Murray et al., 2003, Rezende; Eluf-Neto,
2016). Notwithstanding informative, this scenario is unlikely to be reached at the

133
population level. On the other hand, alternative scenarios considering plausible
reductions in exposure level are sparse in the literature, despite its importance to inform
policy makers and cancer prevention strategies. For instance, the WHO Global Action
Plan for the Prevention and Control of NCDs (WHO 25x25) targeted a 10% reduction
in the prevalence of insufficient physical activity for 2025 (WHO, 2014). Reducing
gender inequality in physical activity is also important (Althoff et al., 2017; Mielke et
al., 2017). Globally, the prevalence of insufficient physical inactivity is, on average,
20% lower in women than in men (Mielke et al., 2017). There are also great disparities
in insufficient physical activity within countries. For instance, prevalence of insufficient
physical activity ranges from 41% to 58% in Brazilian states (Mielke et al., 2015).
Reducing disparities in physical activity between gender and geographic areas may have
a positive impact in population levels of physical activity. However, the extent to which
these alternative scenarios of physical activity could potentially reduce the burden of
cancer is unknown.
Herein we estimated preventable fractions of colon and breast cancer cases in
Brazil by increasing population-wide physical activity to five different counterfactual
scenarios: (i) reaching the theoretical minimum risk exposure level (≥8,000 MET-
min/week), (ii) reaching the WHO recommendation for physical activity (≥600 MET-
min/week)(World Health Organization (WHO, 2010) (iii) a 10% reduction in
prevalence of insufficient physical activity(WHO, 2014), (iv) increasing physical
activity in each Brazilian state to levels observed in the most active state in Brazil, and
(v) reducing gender differences in physical activity by increasing physical activity in
women.
6.2. METHODS
Physical activity data: current distribution and counterfactual scenarios
We used data from the National Health Survey (PNS, 2013), the most recent
nationally representative survey in Brazil, including 60,202 individuals aged 18 years
and older. Further information about PNS has been reported elsewhere (IBGE, 2013;
Szwarcwald et al., 2014). In this study, we used information from 57,962 adults aged 20
years or older that responded the physical activity questionnaire.
Weekly frequency and duration (hours and minutes) of recreational,

134
occupational, commuting (walking or cycling) to work, commuting to other daily
activities, and household activities in a typical week were self-reported. The most
frequent type of recreational activity (e.g., walking, cycling, running, soccer) was also
collected. We assigned MET for each domain of physical activity (recreational,
occupational, commuting and household) according to 2011 compendium of physical
activities (Table S1) (Ainsworth et al., 2011). To obtain total volume of physical
activity, we summed-up MET-min/week across domain of physical activity. We
estimated total physical activity by sex, age-group (20-34, 35-44, 45-54, 65-74, and ≥75
years), and federative units in Brazil (e.g., 26 states and 1 federal district). Total
physical activity was categorized into four groups (<600, 600 to 3,999, 4,000 to 7,999,
and ≥8,000 MET-min/week) according to cut-offs used in the RR estimates.
We calculated the following counterfactual scenarios of physical activity (Figure
1):
- Theoretical minimum risk exposure level: everyone reaches ≥8,000 MET-
min/week (Kyu et al., 2016);
- WHO recommendation for physical activity: everyone achieves ≥600 MET-
min/week (WHO, 2010);
- WHO 25x25: a 10% reduction in the prevalence of insufficient physical activity
(<600 MET-min/week) (WHO, 2014);
- Most active state: physical activity level in each federative unit equals the most
active state in Brazil (Minas Gerais for women and Amapá for men);
- Gender equality: physical activity level is equal between women and men
(reference group). Physical activity level in women was increased to levels
observed in men.
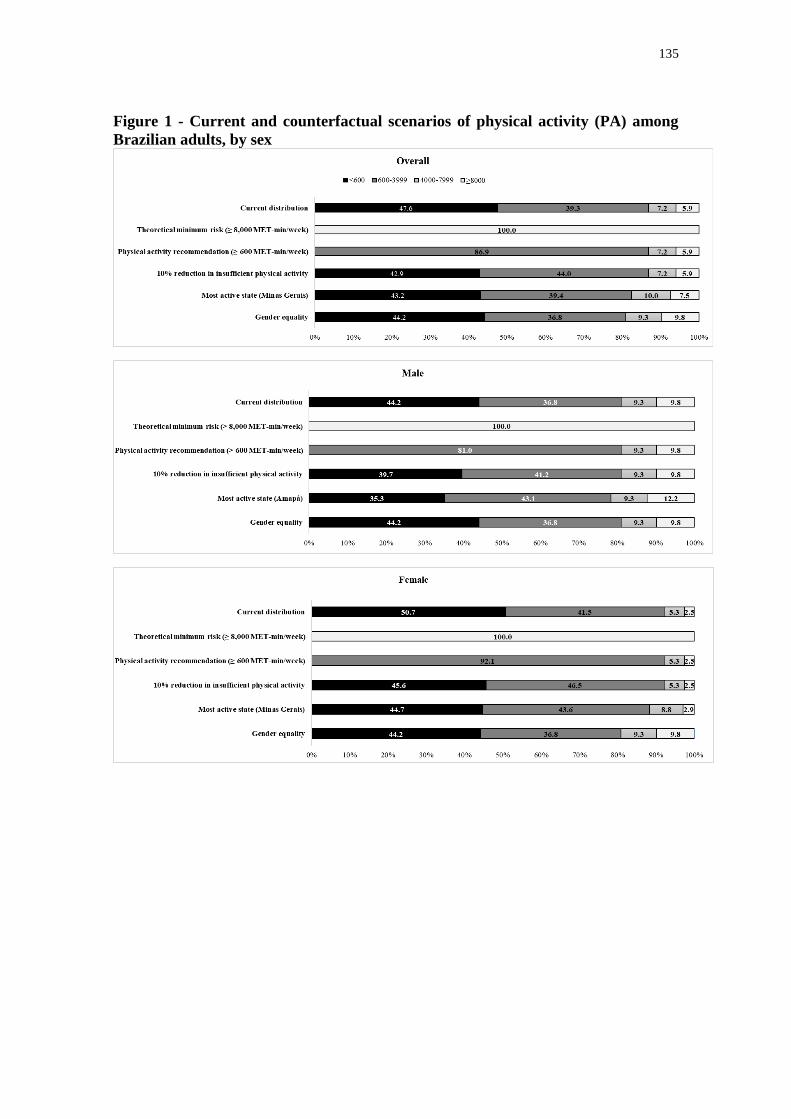
135
Figure 1 - Current and counterfactual scenarios of physical activity (PA) among
Brazilian adults, by sex

136
Cancer data: Relative Risk and Estimated Cancer Incidence
We included in our study only types of cancer with strong or highly suggestive
evidence to be associated with physical activity, namely breast cancer in women
(postmenopausal) and colon cancer (IARC, 2002; WCRF, 2018; Rezende et al., 2018).
We extracted RR and 95% confidence intervals from a recent dose-response meta-
analysis of prospective cohort studies (35 studies for breast cancer and 19 studies for
colon cancer) (GBD Risk Factor Collaborators, 2016; Kyu et al., 2016) synthesizing the
associations of total physical activity (<600, 600 to 3,999, 4000 to 7,999, and ≥8,000
MET-min/week) with breast cancer (postmenopausal) and colon cancer (Table S2).
Estimated number of colorectal and breast cancer cases diagnosed in Brazil in
2012 by sex and age-group (20-34, 35-44, 45-54, 65-74, and ≥ 75 years) were retrieved
from the GLOBOCAN project (Ferlay et al., 2013). Estimated cancer cases for each
federative unit in 2012 by sex was obtained from Brazilian National Cancer Institute
(IBGE, 2011). Both sources have been used to inform cancer prevention strategies in
Brazil. Details about these estimated cancer incidence data have been published
elsewhere (INCA, 2011; Ferlay et al., 2013). To obtain colon cancer cases only, we
applied the proportion of this subtype by sex to total number of colorectal cancer cases
(i.e., colon, rectum, and anus) as reported in Cancer in Five Continents Volume X
(Forman et al., 2013). Breast cancer (postmenopausal) was defined as cases in women
aged ≥45 years as reported in the GLOBOCAN 2012 (Ferlay et al., 2013) (Table S3).
Data analysis
Preventable fractions of colon and breast cancers by sex and age-group were
estimated for country and by sex for each federative unit using the following potential
impact fraction (PIF) equation (Murray et al., 2003, Rezende; Eluf-Neto, 2016):
where Pi is the proportion of the population at the level i of physical activity, P'i is the
proportion of the population at the level i of physical activity in the counterfactual
scenario, and RRi is the relative risk of postmenopausal breast cancer and colon cancer
at the level i of physical activity. Levels i of physical activity were <600, 600 to 3,999,
4,000 to 7,999, and ≥8,000 MET-min/week (reference group). PIF for the theoretical

137
minimum risk exposure level scenario will be referred hereinafter as population
attributable fraction (PAF), a special case of PIF where the exposure is eliminated
(Murray et al., 2003, Rezende; Eluf-Neto, 2016).
To calculate the number of avoidable cancer cases in each counterfactual
scenario of physical activity, we applied PIF estimates to total number of
postmenopausal breast cancer cases and colon cancer cases in 2012. We summed up
number of avoidable breast and colon cancer cases and divided by total number of
cancer cases (excluding non-melanoma skin) to obtain preventable fraction of all cancer
cases due to increase in population-wide physical activity in the corresponding
counterfactual scenario.
Recent studies on preventable fractions of cancer due to physical activity have
considered about 10-year latency period to account for population aging and time since
exposure (Table S4). We performed sensitivity analysis using number of new cancer
cases projected for 2025 in Brazil by sex from GLOBOCAN (Ferlay et al., 2013).
Projections of cancer incidence were calculated by multiplying age-specific cancer
incidence in 2012 by the population structure expected for 2025 (Ferlay et al., 2013).
Data analysis was performed in Stata version 15.0. Data input and scripts used in
our study are available at https://osf.io/5ut4z/.
6.3. RESULTS
Current distribution and counterfactual scenarios of physical activity
Nearly half (47.6%) of the Brazilian adults did not achieve the WHO
recommendation of 600 MET-min/week, with a higher proportion of women (50.7%)
than men (42.7%). Only 6% were engaged in ≥8,000 MET-min/week, the reference
group used in our study to represent the theoretical minimum risk exposure level. The
prevalence of ≥8,000 MET-min/week in men was almost 4 times as high as the
prevalence in women (Figure 1). Counterfactual scenarios of physical activity by sex
are presented in the Figure 1.
Theoretical minimum risk exposure level scenario
We estimated that 12.3% (6,712 cases) of postmenopausal breast cancers and
19.0% (3,630 cases) of colon cancers could be potentially avoided in Brazil in 2012 by

138
reaching ≥8,000 MET-min/week. In women, preventable fractions of colon (19.6%) and
postmenopausal breast cancers (12.3%) represented about 8,645 avoidable cancer cases.
In men, preventable fractions of colon cancer (18.5%) represented 1,697 avoidable
cancer cases. Avoidable cancer cases represented around 4.1% and 0.8% of all cancer
cases diagnosed in 2012 in women and men, respectively (Table 1). The highest PAFs
for all cancers were found in the richest states of Brazil, namely Rio de Janeiro (0.8% in
men; 2.6% in women), São Paulo (0.9% in men; 2.4% in women) and Distrito Federal
(0.8% in men; 3.8% in women) (Figure 2, Table S5-S7).

139
Table 1 - Theoretical minimum risk exposure level (≥8,000 MET-min/week of physical activity): population attributable
fraction (PAF) and number of avoidable cancer cases in Brazil in 2012, by sex, age, and cancer site
Sex & age
Breast, postmenopausal Colon All Cancers*
Cases (n) PAF (%) Avoidable
cases (n) Cases (n) PAF (%)
Avoidable
cases (n) Cases (n) PAF (%)
Avoidable
cases (n)
Overall
Total 54,598 12.29 6,712 19,063 19.04 3,630 429,657 2.41 10,342
20 to 34 NA NA NA 538 16.55 89 23,066 0.39 89
35 to 44 NA NA NA 1,049 16.97 178 30,920 0.58 178
45 to 54 17,739 11.75 2,084 2,991 17.22 515 70,777 3.67 2,599
55 to 64 15,986 12.12 1,937 4,266 18.10 772 99,762 2.72 2,709
65 to 74 11,314 12.65 1,432 4,942 19.57 967 102,793 2.33 2,399
75+ 9,559 13.17 1,259 5,277 21.02 1,109 102,339 2.31 2,368
Men
Total NA NA NA 9,189 18.47 1,697 219,026 0.77 1,697
20 to 34 NA NA NA 261 15.31 40 7,285 0.55 40
35 to 44 NA NA NA 421 16.29 69 9,766 0.70 69
45 to 54 NA NA NA 1,462 16.51 241 29,154 0.83 241
55 to 64 NA NA NA 2,266 17.53 397 54,248 0.73 397
65 to 74 NA NA NA 2,459 19.14 471 61,143 0.77 471
75+ NA NA NA 2,320 20.66 479 57,429 0.83 479
Women
Total 54,598 12.29 6,712 9,874 19.58 1,933 210,631 4.10 8,645
20 to 34 NA NA NA 277 17.82 49 15,780 0.31 49
35 to 44 NA NA NA 628 17.38 109 21,154 0.52 109
45 to 54 17,739 11.75 2,084 1,529 17.89 273 41,623 5.66 2,357
55 to 64 15,986 12.12 1,937 2,000 18.75 375 45,514 5.08 2,312
65 to 74 11,314 12.65 1,432 2,483 19.99 497 41,650 4.63 1,928
75+ 9,559 13.17 1,259 2,957 21.30 630 44,910 4.21 1,889
* PAF and avoidable cases accounting only for postmenopausal breast cancer in women and colon cancer; PAF: population attributable fraction; NA: not applicable

140
Figure 2 - Estimated cancer cases and its preventable fractions by increasing
physical activity in Brazil in 2012
Footnote:
- PAF of all cancers in Brazil by increasing physical activity to theoretical minimum risk exposure level (everyone reaches ≥8,000 MET-min/week);
- 27 Federative units: AC, Acre; AL, Alagoas; AP, Amapá; AM, Amazonas; BA, Bahia; CE, Ceará; DF, Distrito Federal; ES, Espírito Santo; GO,
Goiás; MA, Maranhão; MT, Mato Grosso; MS, Mato Grosso do Sul; MG; Minas Gerais; PA; Pará; PB, Paraíba; PR, Paraná; PE, Pernambuco; PI,
Piauí; RJ, Rio de Janeiro; RN, Rio Grande do Norte; RS, Rio Grande do Sul; RO, Rondônia; RR, Roraima; SC, Santa Catarina; SP, São Paulo; SE,
Sergipe; TO, Tocantins; - Region-level: Bold lines represents five regions: North (AC, RO, AM, RR, AP, PA, TO), Northeast (MA, PI, CE, RN, PB,
PE, AL, SE, BA), Mid-west (MT, MS, GO, DF), Southeast (MG, SP, ES, RJ), and South (PR, SC, RS)

141
Plausible counterfactual scenarios
Plausible counterfactual scenarios of physical activity suggested number of
avoidable cancer cases 5 to 46-fold lower than the theoretical minimum risk exposure
level scenario. By achieving the physical activity recommendation, about 1.7% (1,113
cases) of postmenopausal breast cancers and 6% (1,137 cases) of colon cancers could be
potentially avoided in 2012. Other plausible counterfactual scenarios of physical
activity showed modest impact on cancer prevention. Eliminating gender differences in
physical activity by increasing physical activity in women to levels observed in men
could have avoided 1.1% (384 cases) of postmenopausal breast cancers and 0.6% (122
cases) of colon cancers. Increasing physical activity levels in Brazil to levels observed
in the most active state could have avoided 0.3% (168 cases) of postmenopausal breast
cancers and 1% (189 cases) of colon cancers. The WHO 25x25 goal for physical
activity was the scenario with the worst performance, suggesting that about 0.2% (111
cases) of postmenopausal breast cancers and 0.6% (114 cases) of colon cancers could be
potentially avoided (Table 2).

142
Table 2 - Preventable fractions of cancers and number of avoidable cancer cases in Brazil in 2012 by increasing physical activity, according
to sex, cancer site, and scenario
Cancer site & Sex Cases
(n)
TMREL
(≥8,000 MET-min/week)
PA recommendation
(≥600 MET-min/week)
10% reduction in
insufficient PA** Most active state# Gender equality±
PAF (%) Avoidable
cases (n) PIF (%)
Avoidable
cases (n) PIF (%)
Avoidable
cases (n) PIF (%)
Avoidable
cases (n) PIF (%)
Avoidable
cases (n)
Breast, postmenopausal
Overall 54,598 12.29 6,712 1.74 1,113 0.17 111 0.33 168 1.09 384
Men NA NA NA NA NA NA NA NA NA NA NA
Women 54,598 12.29 6,712 1.74 1,113 0.17 111 0.33 168 1.09 384
Colon
Overall 19,063 19.04 3,630 5.97 1,137 0.60 114 0.99 189 0.64 122
Men 9,189 18.47 1,697 5.72 525 0.57 53 1.15 105 0.00 0
Women 9,874 19.58 1,933 6.20 612 0.62 61 0.85 84 1.23 122
All Cancers*
Overall 429,657 2.41 10,342 0.52 2,250 0.05 225 0.08 358 0.12 505
Men 219,026 0.77 1,697 0.24 525 0.02 53 0.05 105 0.00 0
Women 210,631 4.10 8,645 0.82 1,725 0.08 173 0.12 252 0.24 505
* PIF and avoidable cases accounting only for postmenopausal breast cancer and colon cancer. ** Insufficient physical activity defined as <600 MET-min/week. # physical activity levels in Brazil
as observed in the most active federative unit (Minas Gerais for women and Amapá for men); ± physical activity level in women was increased to levels observed in men (reference group).
PA: physical activity; PAF: population attributable fraction; PIF: population impact fraction. TMREL: theoretical minimum risk exposure level; NA: not applicable

143
Sensitivity analysis
Sensitivity analysis using number of new cancer cases projected for 2025
showed preventable fractions of breast and colon slightly lower than in the primary
analysis. In the theoretical minimum risk exposure level scenario, avoidable cancer
cases represented 1.0% and 5.6% of all cancer cases projected for 2025 in men and
women, respectively. We estimated that increasing physical activity could potentially
avoid 14,076 cancer cases in 2025, compared to 10,342 cancer cases estimated in the
primary analysis (Table 3).

144
Table 3 - Preventable fractions of cancers and number of avoidable cancer cases in Brazil in 2025§ by increasing physical activity,
according to sex, cancer site, and scenario
Cancer site & Sex Cases
(n)
TMREL
(≥8,000 MET-
min/week)
PA recommendation
(≥600 MET-min/week)
10% reduction in
insufficient PA** Most active state# Gender equality±
PAF (%) Avoidable
cases (n) PIF (%)
Avoidable
cases (n) PIF (%)
Avoidable
cases (n) PIF (%)
Avoidable
cases (n) PIF (%)
Avoidable
cases (n)
Breast, postmenopausal
Overall 76,115 11.91 9,060 1.75 1,325 0.17 132 0.32 253 0.81 832
Men NA NA NA NA NA NA NA NA NA NA NA
Women 76,115 11.91 9,060 1.75 1,325 0.17 132 0.32 253 0.81 832
Colon
Overall 28,737 17.54 5,016 5.03 1,364 0.50 136 1.20 313 0.73 299
Men 13,789 16.89 2,287 4.85 615 0.48 61 1.65 173 0.00 0
Women 14,948 18.15 2,729 5.20 749 0.52 75 0.79 140 1.41 299
All Cancers*
Overall 639,763 3.28 14,076 0.63 2,688 0.06 269 0.13 566 0.26 1,131
Men 333,843 1.04 2,287 0.28 615 0.03 61 0.08 173 0.00 0
Women 305,920 5.60 11,789 0.98 2,074 0.10 207 0.19 393 0.54 1,131
* PIF and avoidable cases accounting only for postmenopausal breast cancer and colon cancer. ** Insufficient physical activity defined as <600 MET-min/week. # physical activity levels in
Brazil as observed in the most active federative unit (Minas Gerais for women and Amapá for men); ± physical activity level in women was increased to levels observed in men (reference
group).
PA: physical activity; PAF: population attributable fraction; PIF: population impact fraction. TMREL: theoretical minimum risk exposure level; NA: not applicable
§We used projected cancer cases for 2025 to account for about 10-year latency period between physical activity and breast and colon cancers.

145
6.4. DISCUSSION
In this study we estimated preventable fractions of breast and colon cancer in
Brazil by increasing population-wide physical activity to different counterfactual
scenarios. About 12% of breast post-menopausal cancers and 19% of colon cancers in
2012 could be potentially avoided by reaching ≥8,000 MET-min/week. When plausible
counterfactual distributions of physical activity were considered, number of avoidable
cancer cases were 5 to 46-fold lower than the aforementioned estimates. At best, about
1.3% of breast cancers and 6% colon cancers could be avoided by achieving the
physical activity recommendation. Other counterfactual scenarios showed modest
impact on cancer prevention.
Previous studies suggested that, on average, 12% of breast cancers and 18% of
colon cancers are attributable to lack physical activity (Friedenreich et al., 2010; Parkin
et al., 2011; Inoue et al., 2012; Lee et al., 2012; Wang et al., 2012; Hayes et al., 2013;
Brenner, 2014; Park et al., 2014; Rezende et al., 2015; Olsen et al., 2015; Van Gemert
et al., 2015; Azevedo e Silva et al., 2016; Whiteman; Wilson, 2016; Brenner et al.,
2017; Charafeddine et al., 2017; Islami et al., 2017; Naing et al., 2017). These results
are similar to our PAF estimates, although comparing results is challenging due to
methodological heterogeneity between studies (Table S4). Three different equations
have been used to estimate PIF/PAF, but Levin’s formula (Levin, 1953) has been most
frequently used. Friedenreich and colleagues’ study was the only study that estimated
potential impact of different counterfactual scenarios of physical activity (i.e., ≥3,000
MET-min/week and ≥600 MET-min/week) on cancer prevention (FRIED Friedenreich
ENREICH et al., 2010). Achieving the WHO recommendation for physical activity is
the most frequent threshold used to define the theoretical minimum risk exposure level.
Prevalence of total and leisure-time physical activity have been used to estimate the
proportion of the population exposed to lack of physical activity (i.e., below theoretical
minimum risk exposure level). In this study, we used several categories of total physical
activity (<600, 600-3,999, 4,000-7,999, and ≥8,000 MET-min/week) to estimate
preventable colon and breast cancer cases. Importantly, additional benefits of physical
activity on cancer prevention were found far beyond the recommended level of 600
MET-min/week.
Cancer sites included in previous studies are also a concern. PAF estimates

146
underlies a causal relationship assumption that physical activity decreases the risk of
cancer. While the association between physical activity and colon cancer and breast
cancer are unanimous in the PAF literature, other cancer sites, such as endometrial,
lung, ovary, gastric-esophagus, bladder, and prostate have also been included in some
studies (Table S4). Currently, the World Cancer Research Fund consider convincing the
evidence for the association between physical activity and colon cancer; and probable
for breast and endometrial cancers (WCRF, 2018). The last statement from the
International Agency for Research on Cancer support the association for colon and
breast cancers only (IARC, 2002). Recently, a pooled analysis from 12 cohort studies
(Moore et al., 2016) and several systematic reviews suggested that physical activity is
associated with lower risk of bladder, breast, colon, endometrial, oesophageal, gastric,
glioma, kidney, lung, ovarian, pancreas, prostate (Woling et al., 2009; Liu et al., 2011;
Boyle et al., 2012; Behrens, Leitzmann, 2013; Zhong et al., 2014; Keimling et al., 2014;
Behrens et al., 2014; Schmid et al., 2015; Niedermaier et al., 2015; Farris et al., 2015;
Kyu et al., 2016; Pizot et al., 2016; Psaltopoulou et al., 2016; Brenner et al., 2016;
Neilson et al., 2017). Although physical activity could be confirmed with convincing
protective effect for these cancers in the future, it’s also likely presence of bias in the
literature favoring positive results (Boffetta et al., et al., 2008). In fact, a recent umbrella
review of literature on physical activity and cancer found hints of reporting bias (i.e.,
small study effect and excess of significance bias) in about 15% of these meta-analyses.
Consequently, only associations between physical activity and colon and breast cancers
were supported by strong and highly suggestive evidence, respectively. Evidence of
association with other cancer sites were not statistically significant (bladder,
chronic/small lymphocytic lymphoma, diffuse large B-cell lymphoma, follicular
lymphoma, gastric, glioma, Hodgkin and non-Hodgkin's lymphoma, kidney, leukaemia,
multiple myeloma, ovary, rectum, and thyroid) or were considered less consistent
(endometrial, oesophageal, meningioma, lung, and pancreas) due to hints of uncertainty
and/or bias in literature (Rezende et al., 2018).
We included in our estimates only cancer sites with convincing evidence to be
associated with physical activity, as well with available estimates of dose-response
relationship. These criteria may have underestimated the overall contribution of
physical activity on cancer prevention if associations with other cancer sites turn out to
be confirmed genuine. Triangulation of evidence from multiple methodologies,

147
approaches, and disciplines may help to strengthen causal inference on physical activity
and cancer (Lawlor et al., 2016; Munafò; Davey Smith, 2018). Further results on type,
intensity, and volume of physical activity from The Physical Activity Collaboration of
the National Cancer Institute’s Cohort Consortium (Moore et al., 2016); cohort studies
with repeated measures of physical activity over time; and studies exploring biological
mechanisms linking physical activity and cancer may play an important role on
appraisal of the evidence.
Our study has several limitations and assumptions. RR estimates for the
association between physical activity and cancer in the Brazilian population are
inexistent. We used RR derived from a recent dose-response meta-analysis using data
from cohort studies conducted mainly in US and European countries. These estimates
might not be applicable to Brazil, especially if the prevalence of effect modifiers differs
between settings (Rothman, 1976). Some RR estimates included in this meta-analysis
were adjusted by body mass index. Therefore, our preventable fractions estimates are
likely to be underestimated by not considering the overall effect of physical activity
mediated through adiposity, which is an established risk factor for breast and colon
cancers (Lauby-Secretan et al., 2016; WCRF, 2018).
In our study, physical activity level was self-reported and therefore
misclassification may have occurred. However, the PNS questionnaire showed
reasonable reliability and validity compared to the Global Physical Activity
Questionnaire, a validated questionnaire for physical activity surveillance recommended
by the WHO (Moreira et al., 2017). Participants were asked about frequency and
duration of physical activity in a typical week, but the questionnaire did not include
information about intensity of activities. To define intensity of activities, we used a
standard method by applying MET (Table S1) related to each domain of physical
activity as described in the 2011 compendium of physical activities (Ainsworth et al.,
2011). Questionnaires assessing physical activity level in the typical week tend to
overestimate total energy expenditure compared to objective-measures (e.g., doubly
labelled water) (Dowd et al., 2018). Therefore, our estimates of preventable fractions
due to physical activity may be underestimated. We used prevalence data from the most
recent representative population-based survey conducted in Brazil in 2013, assuming
that trends of physical activity have remained unchanged over time. In fact, leisure-time
physical activity slightly increased in the 27 federative units in Brazil over the past few

148
year, while a decrease in transportation physical activity was also observed (Mielke et
al., 2014). Whether these changes affected total physical activity level in the whole
country remains unknown and a matter of future studies.
Finally, attributable cancer cases were estimated using cancer cases from 2012
in Brazil. However, physical activity may not have an immediate impact on breast and
colon cancers given the relatively long latency period of cancer. Therefore, we
performed sensitivity analysis using projected cancer cases for 2025 in Brazil.
Considering about 10-year latency period between physical activity and cancers, we
estimated that about 3.3% (14,000 cases) of all cancers could be potentially avoided.
In conclusion, our estimates suggest that physical activity may play an important
role in cancer prevention strategies by avoiding up to 12% of postmenopausal breast
cancers and 19% of colon cancers in Brazil. Alternative scenarios considering plausible
increases in physical activity level showed limited to moderate impact on cancer
prevention, suggesting that high levels of physical activity are required to obtain sizable
impact on breast and colon cancer prevention in Brazil.
Acknowledgment: none.
Funding: Leandro Fórnias Machado de Rezende receives a doctoral scholarship from
Sao Paulo Research Foundation (FAPESP), grant #2014/25614-4 and #2016/21390-0.
Leandro Martin Totaro Garcia has undertaken this work under the auspices of the
Centre for Diet and Activity Research (CEDAR), a UKCRC Public Health Research
Centre of Excellence which is funded by the British Heart Foundation, Cancer Research
UK, Economic and Social Research Council, Medical Research Council, the National
Institute for Health Research, and the Wellcome Trust.
Conflict of Interest: none.
6.5. REFERENCES
Ainsworth BE1, Haskell WL, Herrmann SD, Meckes N, Bassett DR Jr, Tudor-Locke C,
Greer JL, Vezina J, Whitt-Glover MC, Leon AS. 2011 Compendium of Physical
Activities: a second update of codes and MET values. Med Sci Sports Exerc.
2011;43:1575-81.
Althoff T, Sosič R, Hicks JL, King AC, Delp SL, Leskovec J. Large-scale physical
activity data reveal worldwide activity inequality. Nature. 2017;547:336-9.

149
Azevedo e Silva G, de Moura L, Curando MP, Gomes FS, Rezende LFM, Daumas,
Guimarães RM, Meira KC, Leite IC, Valente JG, Moreira RI, Koifman R, Malta DC,
Mello MS, Guedes TW, Boffetta P. The Fraction of Cancer Attributable to Ways of
Life, Infections, Occupation, and Environmental Agents in Brazil in 2020. PLoS One.
2016;11:e0148761.
Behrens G, Jochem C, Keimling M, Ricci C, Schmid D, Leitzmann MF. The association
between physical activity and gastroesophageal cancer: systematic review and meta-
analysis. Eur J Epidemiol. 2014;29:151-70.
Behrens G, Leitzmann MF. The association between physical activity and renal cancer:
systematic review and meta-analysis. Br J Cancer. 2013;108:798–811.
Boffetta P, McLaughlin JK, La Vecchia C, Tarone RE, Lipworth L, Blot WJ. False-
positive results in cancer epidemiology: a plea for epistemological modesty. J Natl
Cancer Inst. 2008;100:988-95.
Boyle T, Keegel T, Bull F, Heyworth J, Fritschi L. Physical activity and risks of
proximal and distal colon cancers: a systematic review and meta-analysis. J Natl Cancer
Inst. 2012;104:1548-61.
Brenner DR, Poirier AE, Grundy A, Khandwala F, McFadden A, Friedenreich CM.
Cancer incidence attributable to inadequate physical activity in Alberta in 2012. CMAJ
Open. 2017;5:E338-E344.
Brenner DR, Yannitsos DH, Farris MS, Johansson M, Friedenreich CM. Leisure-time
physical activity and lung cancer risk: A systematic review and meta-analysis. Lung
Cancer. 2016;95:17-27.
Brenner DR. Cancer incidence due to excess body weight and leisure-time physical
inactivity in Canada: implications for prevention. Prev Med. 2014;66:131-139.
Charafeddine MA, Olson SH, Mukherji D, Temraz SN, Abou-Alfa GK, Shamseddine
AI. Proportion of cancer in a Middle eastern country attributable to established risk
factors. BMC Cancer. 2017;17:337.
Donnelly JE, Blair SN, Jakicic JM, Manore MM, Rankin JW, Smith BK; American
College of Sports Medicine. American College of Sports Medicine Position Stand.
Appropriate physical activity intervention strategies for weight loss and prevention of
weight regain for adults. Med Sci Sports Exerc. 2009;41:459-71.
Dowd KP, Szeklicki R, Minetto MA, Murphy MH, Polito A, Ghigo E, van der Ploeg H,
Ekelund U, Maciaszek J, Stemplewski R, Tomczak M, Donnelly AE. A systematic
literature review of reviews on techniques for physical activity measurement in adults: a
DEDIPAC study. Int J Behav Nutr Phys Act. 2018;15:15.
Farris MS, Mosli MH, McFadden AA, Friedenreich CM, Brenner DR. The Association
between Leisure Time Physical Activity and Pancreatic Cancer Risk in Adults: A
Systematic Review and Meta-analysis. Cancer Epidemiol Biomarkers Prev.
2015;24:1462-73.
Ferlay J SI, Ervik M, Dikshit R, Eser S, Mathers C, Rebelo M, Parkin DM, Forman D,
Bray, F. GLOBOCAN 2012 v1.0, Cancer Incidence and Mortality Worldwide. IARC
CancerBase No. 11 [Internet]. Lyon: IARC; 2013.

150
Forman D, Bray F, Brewster DH, Gombe Mbalawa C, Kohler B, Piñeros M, Steliarova-
Foucher E, Swaminathan R. Cancer Incidence in Five Continents, Vol. X. IARC
Scientific Publications No. 164. Lyon: IARC; 2013.
Friedenreich CM, Neilson HK, Lynch BM. State of the epidemiological evidence on
physical activity and cancer prevention. Eur J Cancer. 2010;46:2593-2604.
GBD Risk Factors Collaborators. Global, regional, and national comparative risk
assessment of 79 behavioural, environmental and occupational, and metabolic risks or
clusters of risks, 1990-2015: a systematic analysis for the Global Burden of Disease
Study 2015. Lancet. 2016;388:1659-1724.
Giovannucci E. A framework to understand diet, physical activity, body weight, and
cancer risk. Cancer Causes Control. 2018;29(1):1-6.
Giovannucci E. An Integrative Approach for Deciphering the Causal Associations of
Physical Activity and Cancer Risk: The Role of Adiposity. J Natl Cancer Inst.
2018;110:935-941.
Hayes J, Richardson A, Frampton C. Population attributable risks for modifiable
lifestyle factors and breast cancer in New Zealand women. Intern Med J. 2013;43:1198-
1204.
Inoue M, Sawada N, Matsuda T, Iwasaki M, Sasazuki S, Shimazu T, Shibuya K,
Tsugane S. Attributable causes of cancer in Japan in 2005--systematic assessment to
estimate current burden of cancer attributable to known preventable risk factors in
Japan. Ann Oncol. 2012; 23:1362-69.
Instituto Brasileiro de Geografia e Estatística (IBGE). Pesquisa Nacional de Saúde
2013: Percepção do estado de saúde, estilo de vida e doenças crônicas. Brasil, Grandes
Regiões e Unidades da Federação. Rio de Janeiro: IBGE; 2013.
Instituto Nacional de Câncer José Alencar Gomes da Silva (INCA). Coordenação Geral
de Ações Estratégicas. Coordenação de Prevenção e Vigilância. Estimativa 2012:
incidência de câncer no Brasil. Rio de Janeiro: INCA; 2011.
International Agency for Research on Cancer (IARC). Weight Control and Physical
Activity. IARC Handbook of Cancer Prevention Volume 6. Lyon: IARC Press,2002.
Islami F, Goding Sauer A, Miller KD, Siegel RL, Fedewa SA, Jacobs EJ, McCullough
ML, Patel AV, Ma J, Soerjomataram I, Flanders WD, Brawley OW, Gapstur SM, Jemal
A. Proportion and number of cancer cases and deaths attributable to potentially
modifiable risk factors in the United States. CA Cancer J Clin. 2018;68:31-54.
Keimling M, Behrens G, Schmid D, Jochem C, Leitzmann MF. The association
between physical activity and bladder cancer: systematic review and meta-analysis. Br J
Cancer. 2014;110:1862-70.
Kyu HH, Bachman VF, Alexander LT, Mumford JE, Afshin A, Estep K, Veerman JL,
Delwiche K, Iannarone ML, Moyer ML, Cercy K, Vos T, Murray CJ, Forouzanfar MH.
Physical activity and risk of breast cancer, colon cancer, diabetes, ischemic heart
disease, and ischemic stroke events: systematic review and dose-response meta-analysis
for the Global Burden of Disease Study 2013. BMJ. 2016;354:i3857.
Lauby-Secretan B, Scoccianti C, Loomis D, Grosse Y, Bianchini F, Straif K,
International Agency for Research on Cancer Handbook Working Group. Body Fatness
and Cancer--Viewpoint of the IARC Working Group. N Engl J Med. 2016;375:794-8.

151
Lawlor DA, Tilling K, Davey Smith G. Triangulation in aetiological epidemiology. Int
J Epidemiol. 2016;45:1866-86.
Lee IM, Shiroma EJ, Lobelo F, Puska P, Blair SN, Katzmarzyk PT; Lancet Physical
Activity Series Working Group. Effect of physical inactivity on major non-
communicable diseases worldwide: an analysis of burden of disease and life
expectancy. Lancet. 2012;380:219-29.
Levin ML. The occurrence of lung cancer in man. Acta Unio Int Contra Cancrum.
1953;9:531-541.
Liu Y, Hu F, Li D, Wang F, Zhu L, Chen W, Ge J, An R, Zhao Y. Does physical
activity reduce the risk of prostate cancer? A systematic review and meta-analysis. Eur
Urol. 2011;60:1029-44.
McTiernan A. Mechanisms linking physical activity with cancer. Nat Rev Cancer.
2008;8:205-11.
Mielke GI, da Silva ICM, Kolbe-Alexander TL, Brown WJ. Shifting the Physical
Inactivity Curve Worldwide by Closing the Gender Gap. Sports Med. 2018;48:481-9.
Mielke GI, Hallal PC, Malta DC, Lee IM. Time trends of physical activity and
television viewing time in Brazil: 2006-2012. Int J Behav Nutr Phys Act. 2014;11:101.
Mielke GI, Hallal PC, Rodrigues GBA et al. Physical activity and television viewing
among Brazilian adults: National Health Survey 2013. Epidemiol Serv Saude. 2015;24:
277-86.
Moore S1, Lee IM, Weiderpass E, Campbell PT, Sampson JN, Kitahara CM, Keadle
SK, Arem H, Berrington de Gonzalez A, Hartge P, Adami HO, Blair CK, Borch KB,
Boyd E, Check DP, Fournier A, Freedman ND, Gunter M, Johannson M, Khaw KT,
Linet MS, Orsini N, Park Y, Riboli E, Robien K, Schairer C, Sesso H, Spriggs M, Van
Dusen R, Wolk A, Matthews CE, Patel AV. Association of Leisure-Time Physical
Activity With Risk of 26 Types of Cancer in 1.44 Million Adults. JAMA Intern Med.
2016;176:816-825.
Moreira AD, Claro RM, Felisbino-Mendes MS, Velasquez-Melendez G. Validity and
reliability of a telephone survey of physical activity in Brazil. Rev Bras Epidemiol.
2017;20:136-46.
Munafo MR, Davey Smith G. Robust research needs many lines of evidence. Nature.
2018;553:399-401.
Murray CJ, Ezzati M, Lopez AD, Rodgers A, Vander Hoorn S. Comparative
quantification of health risks: Conceptual framework and methodological issues. Popul
Health Metr. 2003;1(1):1.
Naing C, Lai PK, Mak JW. Immediately modifiable risk factors attributable to
colorectal cancer in Malaysia. BMC Public Health. 2017;17:637.
Neilson HK, Farris MS, Stone CR, Vaska MM, Brenner DR, Friedenreich CM.
Moderate-vigorous recreational physical activity and breast cancer risk, stratified by
menopause status: a systematic review and meta-analysis. Menopause. 2017;24:322-44.
Niedermaier T, Behrens G, Schmid D, Schlecht I, Fischer B, Leitzmann MF. Body mass
index, physical activity, and risk of adult meningioma and glioma: A meta-analysis.
Neurology. 2015;85:1342-50.

152
Olsen CM, Wilson LF, Nagle CM, Kendall BJ, Bain CJ, Pandeya N, Webb PM,
Whiteman DC. Cancers in Australia in 2010 attributable to insufficient physical
activity. Aust N Z J Public Health. 2015;39:458-63.
Park S, Kim Y, Shin HR, Lee B, Shin A, Jung KW, Jee SH, Kim DH, Yun YH, Park
SK, Boniol M, Boffetta P. Population-attributable causes of cancer in Korea: obesity
and physical inactivity. PLoS One. 2014;9:e90871.
Parkin DM. 9. Cancers attributable to inadequate physical exercise in the UK in 2010.
Br J Cancer. 2011;105 Suppl 2:S38-41.
Pizot C, Boniol M, Mullie P, Koechlin A, Boniol M, Boyle P, Autier P. Physical
activity, hormone replacement therapy and breast cancer risk: A meta-analysis of
prospective studies. Eur J Cancer. 2016;52:138-54.
Psaltopoulou T, Ntanasis-Stathopoulos I, Tzanninis IG, Kantzanou M, Georgiadou D,
Sergentanis TN. Physical Activity and Gastric Cancer Risk: A Systematic Review and
Meta-Analysis. Clin J Sport Med. 2016;26:445-64.
Rezende LFM, Eluf-Neto J. Population attributable fraction: planning of diseases
prevention actions in Brazil. Rev Saude Publica. 2016;50: S0034-89102016000100601.
Rezende LF, Rabacow FM, Viscondi JY, Luiz Odo C, Matsudo VK, Lee IM. Effect of
physical inactivity on major noncommunicable diseases and life expectancy in Brazil. J
Phys Act Health. 2015;12:299-306.
Rezende LFM, Sá TH, Markozannes G, Rey-López JP, Lee IM, Tsilidis KK, Ioannidis
JPA, Eluf-Neto J. Physical activity and cancer: an umbrella review of the literature
including 22 major anatomical sites and 770 000 cancer cases. Br J Sports Med.
2018;52:826-33.
Rothman KJ. Causes. Am J Epidemiol. 1976;104:587-92.
Schmid D, Behrens G, Keimling M, Jochem C, Ricci C, Leitzmann M.. A systematic
review and meta-analysis of physical activity and endometrial cancer risk. Eur J
Epidemiol. 2015;30:397-412.
Szwarcwald CL, Malta DC, Pereira CA, Vieira ML, Conde WL, Souza Júnior PR,
Damacena GN, Azevedo LO, Azevedo E Silva G, Theme Filha MM, Lopes Cde S,
Romero DE, Almeida Wda S, Monteiro CA. National Health Survey in Brazil: design
and methodology of application. Cien Saude Colet. 2014;19:333-42.
van Gemert WA, Lanting CI, Goldbohm RA, van den Brandt PA, Grooters HG,
Kampman E, Kiemeney LALM, van Leeuwen FE, Monninkhof EM, de Vries E, Peeters
PH, Elias SG. The proportion of postmenopausal breast cancer cases in the Netherlands
attributable to lifestyle-related risk factors. Breast Cancer Res Treat. 2015;152:155-62.
Wang D, Zheng W, Wang SM, Wang JB, Wei WQ, Liang H, Qiao YL, Boffetta P.
Estimation of cancer incidence and mortality attributable to overweight, obesity, and
physical inactivity in China. Nutr Cancer. 2012;64:48-56.
Whiteman DC, Wilson LF. The fractions of cancer attributable to modifiable factors: A
global review. Cancer Epidemiol. 2016; 44:203-21.
Wolin KY, Yan Y, Colditz GA, Lee IM. Physical activity and colon cancer prevention:
a meta-analysis. Br J Cancer. 2009;100:611-16.

153
World Cancer Research Fund/American Institute for Cancer Research. Continuous
Update Project Expert Report 2018. Physical activity and risk of cancer. Available at
dietandcancerreport.org
World Cancer Research Fund/American Institute for Cancer Research. Continuous
Update Project Expert Report 2018. Body fatness and weight gain and the risk of
cancer. Available at dietandcancerreport.org
World Health Organization (WHO). Global recommendations on physical activity for
health. Geneva: WHO Press; 2010.
World Health Organization (WHO). Global status report on noncommunicable diseases
2014. Geneva: WHO Press; 2014.
Zhong S, Chen L, Lv M, Zhao J. Nonoccupational physical activity and risk of ovarian
cancer: a meta-analysis. Tumour Biol. 2014;35:11065-73.

154
7. PREVENTABILIDADE DE CÂNCER E ESTILO DE VIDA NO
BRASIL
Este capítulo apresenta o artigo “Proportion of cancer cases and deaths attributable to
lifestyle risk factors in Brazil” de autoria de Leandro Fórnias Machado de Rezende,
Dong Hoon Lee, Maria Laura da Costa Louzada, Mingyang Song, Edward
Giovannucci, José Eluf-Neto. O artigo foi submetido para publicação na revista Cancer
Epidemiology.
Para citação: Rezende LFM, Lee DH, Louzada MLC, Song M, Giovannucci E, Eluf-
Neto J. Proportion of cancer cases and deaths attributable to lifestyle risk factors in
Brazil. In preparation.

155
Proportion of cancer cases and deaths attributable to lifestyle risk factors in Brazil
Leandro Fórnias Machado de Rezende1,2*, Dong Hoon Lee2, Maria Laura da Costa
Louzada3,4, Mingyang Song2,5,6,7, Edward Giovannucci2,7,8#, José Eluf-Neto1,#
1 Departamento de Medicina Preventiva, Faculdade de Medicina FMUSP, Universidade
de Sao Paulo, Sao Paulo, SP, Brazil.
2 Department of Nutrition, Harvard T.H. Chan School of Public Health, Boston,
Massachusetts, USA.
3 Center for Epidemiological Research in Nutrition and Health, University of São
Paulo, Sao Paulo, SP, Brazil.
4 Departamento de Políticas Públicas e Saúde Coletiva, Universidade Federal de São
Paulo (UNIFESP), Sao Paulo, Brazil.
5 Division of Gastroenterology, Massachusetts General Hospital and Harvard Medical
School, Boston, Massachusetts, USA
6 Clinical and Translational Epidemiology Unit, Massachusetts General Hospital and
Harvard Medical School, Boston, Massachusetts, USA
7 Department of Epidemiology, Harvard T.H. Chan School of Public Health, Boston,
Massachusetts, USA.
8 Channing Division of Network Medicine, Brigham and Women's Hospital and
Harvard Medical School, Boston, Massachusetts, USA.
# These authors contributed equally to this paper
*Corresponding author contact:
Address: Av Dr Arnaldo 455, 2nd floor. Sao Paulo, SP, Brazil. 01246-903
Email: [email protected]; Tel: +55 11 997209262
ORCID: 0000-0002-7469-1399
Word count
Abstract: 220
The total manuscript: 4027
Novelty & Impact Statements
Lifestyle risk factors (tobacco smoking, alcohol consumption, overweight and obesity,
unhealthy diet, and lack of physical activity) has been consistently associated with
increased risk of at least 20 types of cancer. This study showed that, in Brazil, about
26.5% of all cancer cases and 33.6% of all cancer deaths were attributable to lifestyle
risk factors and could be potentially avoided. These findings are useful to inform
strategies for cancer prevention and control in Brazil.

156
ABSTRACT
Lifestyle risk factors (tobacco smoking, alcohol consumption, overweight and
obesity, unhealthy diet, and lack of physical activity) have been associated with
increased risk of at least 20 types of cancer. We estimated the proportion of cancer cases
and deaths that could be potentially avoided by eliminating or reducing lifestyle risk
factors in Brazil. We obtained the distribution of lifestyle risk factors by sex and age
from recent representative health surveys in Brazil; relative risks from pooled analyses
of prospective studies and meta-analyses; and cancer cases and deaths in 2012 from
GLOBOCAN. We found that 26.5% (114,497 cases) of all cancer cases and 33.6%
(63,371 deaths) of all cancer deaths could be potentially avoided by eliminating lifestyle
risk factors in Brazil. Plausible reductions in these exposures based on policy targets
and cancer prevention recommendations could have potentially avoided 4.5% (19,731
cases) and 6.1% (11,480 deaths) of all cancer cases and deaths, respectively. Tobacco
smoking accounted for most of the preventable cancer cases and deaths, followed by
high body mass index and alcohol consumption. Larynx, lung, oral cavity/pharynx,
esophagus and colorectum cancer cases and deaths could be at least halved by
eliminating these lifestyle risk factors. Findings from this study may be useful to inform
strategies for cancer prevention and control across Brazil.
157
7.1. INTRODUCTION
Cancer is the second leading cause of death in Brazil (Brasil 2018). In 2012,
224,000 cancer deaths occurred and 437,000 new cancer cases were diagnosed (Ferlay
et al., 2013). By 2025, the burden of cancer is projected to increase by 50% due to
population growth and aging (Ferlay et al., 2013). Besides changes in the population
structure, the increasing prevalence of lifestyle risk factors may pose additional
challenges to cancer control. (NCD Risk Factor Collaborators, 2013; Martins et al., et
al. 2013; Mielke et al., 2014; Rezende et al., 2018) Lifestyle risk factors (tobacco
smoking, alcohol consumption, overweight and obesity, unhealthy diet, and lack of
physical activity) have been associated with increased risk of at least 20 types of cancer
(IARC, 2002; 2018 Bagnardi et al., 2015; Bouvard et al., 2015; Carter et al., 2015;
Lauby-Secretan et al., 2016; Rezende et al., 2018a; WCRF, 2018a; 2018b; 2018c;
2018d; 2018e). Therefore, cancer prevention through lifestyle modification is one of the
most attractive and realistic approaches for cancer control in Brazil.
Quantitative estimation of preventable cancer cases and deaths is useful to
inform cancer prevention strategies (Colditz; Wei, 2012). The preventability of cancer
can be estimated by contrasting cancer rates between low- and high-risk populations,
although deciphering the contribution of each risk factor might be difficult using this
method (Colditz; Wei, 2012). Thus, the classical population attributable fraction (PAF)
approach has been extensively used to estimate the proportion of cancer that could be
potentially avoided by eliminating or reducing modifiable risk factors (Whiteman;
Webb et al., 2015; Azevedo e Silva et al., 2016; Rezende; Eluf-Neto, 2016; Islami;
2017; 2018; Brown et al., 2018).
In Brazil, previous studies on preventability of cancer have focused on single
risk factors (Thuler et al., 2016; Rezende et al., 2018b), cancer outcome (either
incidence or mortality) (Thuler et al., 2016; Rezende et al., 2018b), historical exposure
profile (Azevedo e Silva et al., 2016), or single exposure estimate for all age groups
(Azevedo e Silva et al., 2016, Thuler et al., 2016). In addition, despite the large land
mass of Brazil and massive regional disparities in cancer mortality, preventability of
cancer has been estimated for the country as a whole (Azevedo e Silva et al., 2016,
Thuler et al., 2016).

158
Herein, we estimated the proportion and number of cancer cases and deaths
attributable to lifestyle risk factors in Brazil in 2012. We provided estimates of
preventability of cancer due to lifestyle risk factors, individually and in combination, by
sex and cancer site, sex in Brazil. We also considered two counterfactual (alternative)
exposure scenarios for the lifestyle risk factors at the population level.
7.2. METHODS
Lifestyle exposure data: current distribution and counterfactual scenarios
We included in our study lifestyle risk factors with convincing evidence for
causing cancer in humans according to the International Agency for Research on Cancer
(IARC), the World Cancer Research Fund (WCRF), results from recent meta-analyses,
and for which exposure data were available (Table 1) IARC, 2002; 2018; Taylor et al.,
2007; Bagnardi et al., 2015; Bouvard et al., 2015; Carter et al., 2015; Lauby-Secretan et
al., 2016; Rezende et al., 2018a; WCRF, 2018a; 2018b; 2018c; 2018d). Data on the
distribution of lifestyle risk factors were calculated from the most recent nationally
representative surveys conducted in Brazil. The distribution of lifestyle risk factors was
estimated by sex and age groups (20-44, 45-54, 55-64, 65-74, and ≥75 years), while
accounting for the complex sample design.

159
Table 1 - Lifestyle risk factors associated with cancer incidence and mortality considered
in this study Exposure Distribution and theoretical
minimum risk exposure level
(in bold and italic)
Cancer sites-related (ICD-10)
Alcohol consumption (%)8 Abstainer (0 g/day)
Light (1 to 12.5 g/day)
Moderate (12.6 to 49.9 g/day)
Heavy (≥50 g/day)
Lip, oral cavity, pharynx (C00-C14); Esophagus
(C15; squamous cell carcinoma only); Colorectum
(C18-C20); Liver (C22); Gallbladder (C23);
Pancreas (C25); Larynx (C32); female Breast (C50)
High body mass index (in kg/m2)9, 10 Mean and
standard deviation
(22kg/m2 and 1 sd)
Esophagus (C15; adenocarcinoma only); Stomach
(C16.0; cardia only); Colorectum (C18-C20); Liver
(C22); Gallbladder (C23); Pancreas (C25); female
Breast (C50; postmenopausal cancers only); Corpus
uteri (C54-C55); Ovary (C56); Kidney, renal pelvis
(C64-C66); Thyroid (C73); Multiple myeloma
(C90), Prostate (C61; advanced only)
Low dietary calcium consumption (%)12 ≥1000 mg/day
800-999 mg/day
600-799 mg/day
400-599 mg/day
200-399 mg/day
0-199 mg/day
Colorectum (C18-C20)
Low dietary fiber consumption (%)13 ≥30 g/day
20-29 g/day
10-19 g/day
0-9 g/day
Colorectum (C18-C20)
Low fruits and vegetables consumption
(%)13
≥400 g/day
300-399 g/day
200-299 g/day
100-199 g/day
0-99 g/day
Oral cavity, pharynx (C00-C14); Larynx (C32)
Low fruit consumption only (%)13 ≥250 g/day
200-249 g/day
150-199 g/day
100-149 g/day
50-99 g/day
0-49 g/day
Lung, bronchus, trachea (C33-C34)
Red meat consumption (%)11, 12 0-99 g/day
100-199 g/day
200-299 g/day
300-399 g/day
≥400 g/day
Colorectum (C18-C20)
Processed meat consumption (%)11, 12 0-49 g/day
50-99 g/day
100-149 g/day
150-199 g/day
200-249 g/day
≥250 g/day
Colorectum (C18-C20); Stomach (C16; non-cardia
only)
Lack of physical activity (%)15-17 ≥8000 MET-min/week
4000-7999 MET-min/week
600-3999 MET-min/week
<600 MET-min/week
Colon (C18); female Breast (C50; post-menopausal
cancers only)
Passive smoking (%)26 No
Yes
Lung, bronchus, trachea (C33-C34)
Smoking (%)7 Never
Former
Current
Oral cavity, pharynx (C00-C14); Esophagus (C15);
Stomach (C16); Colorectum (C18-C20); Liver
(C22); Pancreas (C25); Nasal cavity/paranasal sinus
(C30-C31); Larynx (C32); Lung, bronchus, trachea
(C33-C34); Cervix (C53); Kidney, renal pelvis,
ureter (C64-C66); Urinary bladder (C67); Myeloid
leukemia (C92)

160
The National Health Survey (Pesquisa Nacional de Saúde - PNS) enrolled
57,962 adults aged ≥20 years in 2013, when participants completed a questionnaire
about alcohol consumption, body mass index (BMI), fruits and vegetables consumption,
physical activity, tobacco smoking, and passive smoking in Brazil (Szwarcwald et al.,
2014). Alcohol consumption was calculated based on average frequency consumption
(days/week) and number of drinks a day. One drink (dose) or 12.5 grams (g) of pure
alcohol was considered equivalent to one can of beer, one glass of wine or one shot of
any distilled spirit. Consumption of fruits and vegetables (raw and grilled salad,
vegetables or legumes in g/day) was estimated based on average frequency (days/week)
and number of servings per day (i.e., each serving defined as 80g). Anthropometric
measurements for BMI (weight and height) were objectively obtained from a trained
researcher using portable electronic scales and stadiometers. Total physical activity (in
metabolic equivalent of tasks-minutes/week (MET-min/week)) was assessed using self-
reported data (days/week and duration) on recreational, occupational, household, and
commuting activities (walking or cycling to and/or from work; walking or cycling to
and/or from other daily activities). The compendium of physical activities was used to
assign MET to each domain of physical activity (Ainsworth et al., 2011). Prevalence of
smoking (never, former, and current) was calculated based on reports of current and
prior use of any product derived from tobacco (i.e., cigar, pipe, clove or Bali cigarettes
and narghile). Smokeless products such as snuff and chewing tobacco were not
considered. Passive smoking among never smokers (yes, no) was defined based on
either daily, weekly or monthly exposure at home and work environments.
We used data from the National Household Budget Survey (Pesquisa de
Orçamentos Familiares – POF) conducted in 2008–2009 to obtain an estimated
consumption of dietary consumption of fiber, calcium, red and processed meat. POF
collected two 24-hour real-time food records from 26,390 individuals aged ≥20 years
(IBGE, 2011a). Reported food amounts were converted into grams or milligrams (mg)
based on a food portion table (IBGE, 2011b) Total fiber and calcium intakes (expressed
in g/day and mg/day, respectively) were estimated based on the Brazilian food
composition table (IBGE, 2011c). Red meat consumption (g/day) was estimated based
on the intake of beef, pork and lamb, whereas processed meat (g/day) on the intake of

161
meat preserved by smoking, curing, salting, addition of chemical preservatives (e.g.,
ham, bacon, pastrami, sausages and hot dogs).
We calculated the preventability of cancer by comparing the burden of cancer
due to the observed distribution of lifestyle risk factors (Tables S1-S2) with two
counterfactual (alternative) exposure scenarios:
- Theoretical minimum risk exposure level: lifestyle risk factors eliminated in the
whole population as defined in Table 1.
- Plausible reduction in exposure level: This alternative exposure scenario was
based on policy targets and cancer prevention recommendations, whenever
available (WCRF, 2018; WHO, 2014). It included a 10% relative reduction in
heavy alcohol consumption (≥50.0 g/day) (WHO, 2014); 1 kg/m2 reduction of
BMI mean at the population level; dietary calcium consumption of at least 200-
399 mg/day; dietary fiber consumption of at least 10-19g/day; fruits and
vegetables consumption of at least 100-199g/day (for fruit only: at least 50-
99g/day); red meat consumption <300g/day (WCRF, 2018); processed meat
consumption <100g/day (WCRF, 2018); reaching the physical activity
recommendation for adults of at least 600 MET-min/week (WHO, 2010); a 30%
relative reduction in prevalence of current tobacco use (i.e., then considered
former smoker) and consequently in passive smoking among never smokers
(WHO, 2014).
Cancer data: Relative Risk and Estimated Cancer Incidence and Deaths
We retrieved relative risks (RR) of exposure-cancer pairs from meta-analyses
and large pooled analyses of cohort studies conducted worldwide due to lack of
prospective studies to study cancer etiology in Brazil. We retrieved the maximally-
adjusted RR (adjusted for the greatest number of potential confounders) by sex (Table
S3).
Estimated number of new cancer cases diagnosed in Brazil in 2012 by sex and
age-group were retrieved from the GLOBOCAN project (Ferlay et al., 2013). To obtain
separate estimates for cancers of the colon and rectum, cardia and non-cardia stomach,
and esophagus adenocarcinoma and squamous cell carcinoma, we used the
corresponding proportion of these subtypes in Brazil by sex (Table S4) (Forman et al.,
2013; Arnold et al., 2015; Colquhoun et al., 2015). We considered advanced prostate

162
cancer cases with stage 3-4 and postmenopausal breast cancer cases older than 45 years,
as performed in other study (Rezende et al., 2018). Cancer deaths in Brazil in 2012 by
sex and age-group were obtained from the Brazilian Mortality Information System
(Brasil, 2018).
Statistical analysis
Preventability of cancer cases and death by sex and age-group was estimated
using the following equation for potential impact fraction (PIF) (Murray et al., 2003):
where Pi is the proportion of the population at the level i of exposure, P'i is the
proportion of the population at the level i of exposure in the counterfactual scenario, and
RRi is the relative risk of cancer at the level i of exposure. Level i for each exposure is
presented in Table 1.
For BMI, we calculated preventability of cancer using equation for continuous
exposures (Murray et al., 2003):
where P(x) is the population distribution of BMI (mean and standard deviation), P*(x)
distribution of BMI in the counterfactual scenario (Table 1), RR(x) is the relative risk of
cancer per one increment unit in BMI, and dx indicates that the integration was done
with respect to the BMI level. We used a log-logit function to represent each RR value
across BMI units (REZENDE et al., 2018).
Preventability of each cancer site attributable to combined lifestyle risk factors
were estimated using the joint PIF equation (MURRAY et al., 2003):
Where PIFi is each individual lifestyle risk factor PIF.

163
Number of cancer cases and deaths attributable to lifestyle risk factors were
obtained by applying PIF estimates to cancer cases and cancers deaths in the
corresponding cancer site or subsite, as defined in the Table 1. Then, we divided the
number of attributable cases and deaths by total number of cancers in the corresponding
cancer site. We summed-up the number of cancer cases and deaths attributable to
combined lifestyle risk factors across cancer sites to obtain the number of all cancer
cases and deaths that could be potentially avoided. Proportion of all cancer attributable
to exposures was obtained by dividing the total number of attributable cases and deaths
by total number of cancer cases (excluding non-melanoma skin cancer) and deaths,
respectively.
All data analysis was performed in Stata version 15.0. Data input, scripts, and
spreadsheet with all results are available at the Open Science Framework (OSF)
webpage https://osf.io/y5ar8/.
7.3. RESULTS
Cancer Incidence
Lifestyle risk factors combined
Lifestyle risk factors accounted for 26.5% of all cancer cases (114,497 of
431,557 cases) in adults in Brazil (Figure 1). Tobacco smoking was the single most
important risk factor in both men (20.8%; 45,654 cases) and women (10.1%; 21,357
cases). Alcohol consumption had the second highest PAF (5.9%) in men, although
combined dietary factors (low consumption of fruits and vegetables, fiber, calcium, and
consumption of red and processed meat) accounted for similar cancer burden (6.2%).
High BMI had the second highest PAF in women (6.6%), followed by lack of physical
activity (4.1%) and combined dietary factors (4.0%). The preventable cases accounted
by combination of high BMI, alcohol consumption, lack of physical activity, and dietary
factors was higher than cases accounted by smoking in women (15.2% vs 10.1%), but
not in men (14.2% vs 20.8%).

164
Figure 1 - Proportion and number of all cancer cases attributable to lifestyle risk
factors in Brazil in 2012, by exposure

165
The proportion of cancer cases accounted by all lifestyle risk factors combined ranged
from 1.6% for prostate cancer to 86.6% for larynx cancer (Figure 2). From the 18 cancer
sites considered in the cancer incidence analysis, five cancer sites (larynx, lung, oral
cavity, esophagus and colorectum) had PAF >50%. Lung (17,944 cases) and breast
cancers (14,350 cases) had the highest number of cases attributable to lifestyle risk
factors in men and women, respectively.
Figure 2 - Proportion and number of cancer cases and deaths attributable to lifestyle risk
factors in Brazil in 2012, by cancer site

166
Considering the plausible reduction in lifestyle risk factors, 4.6% of all cancer
cases (19,850 of 431,557 cases) could be potentially avoided. Smoking had the highest
PAF (2.1%), followed by high BMI (0.8%), and lack of physical activity (0.5%). Cancer
sites with highest PAF were larynx (21.1%), oral cavity (16.4%), and lung (14.8%) in
men, and larynx (16.3%), lung (12.7%), and colorectum (11.4%) in women
(Supplementary file online).
Tobacco smoking and passive smoking
Lung cancer had the highest PAF (82.3%) and number of attributable cases
(28,214) of smoking-related cancers, followed by cancers of the larynx (77.1%; 5,496
cases), oral cavity (49.1%; 8,132 cases) and esophagus (49.1%; 6,334 cases). Passive
smoking accounted for 1.9% (375 cases) and 1.8% (255 cases) of lung cancer cases in
men and women, respectively (Table 2).

167
Table 2 - Proportion and number of cancer cases attributable to lifestyle risk factors in Brazil in 2012, by exposure, sex, and cancer site Men Women Both
Exposure/
cancer site Number of cases
PAF
(%)
Attributable
cases Number of cases
PAF
(%)
Attributable
cases Number of cases
PAF
(%) Attributable cases
Smoking
Lung 20,229 86.5 17,490 14,041 76.4 10,724 34,270 82.3 28,214
Larynx 6,281 78.5 4,934 850 66.2 563 7,131 77.1 5,496
Oral cavity/pharynx 11,901 53.1 6,313 4,653 39.1 1,819 16,554 49.1 8,132
Esophagus 9,713 52.6 5,106 3,191 38.5 1,228 12,904 49.1 6,334
Bladder 7,033 50.7 3,566 2,869 34.3 983 9,902 45.9 4,550
Liver 5,726 29.5 1,691 3,870 9.0 349 9,596 21.3 2,040
Stomach 12,606 25.8 3,251 7,078 8.2 578 19,684 19.5 3,829
Kidney 3,611 24.2 873 2,307 5.7 131 5,918 17.0 1,004
Cervix - - - 18,503 15.7 2,907 18,503 15.7 2,907
Pancreas 4,640 9.6 444 5,222 11.2 586 9,862 10.4 1,030
Colorectum 16,359 12.1 1,986 17,579 8.5 1,489 33,938 10.2 3,475
High Body mass index
Corpus uteri - - - 6,366 36.5 2,326 6,366 36.5 2,326
Kidney 3,611 19.9 718 2,307 22.9 529 5,918 21.1 1,247
Gallbladder 1,456 15.9 231 2,593 20.9 542 4,049 19.1 773
Liver 5,726 15.0 858 3,870 17.9 692 9,596 16.2 1,550
Breast* - - - 67,307 9.9 6,660 67,307 9.9 6,660
Colorectum 16,359 12.2 2,002 17,579 7.6 1,334 33,938 9.8 3,336
Pancreas 4,640 9.6 446 5,222 9.1 475 9,862 9.3 921
Multiple myeloma 1,866 8.4 156 1,642 6.6 109 3,508 7.6 265
Esophagus 9,713 6.4 626 3,191 7.7 247 12,904 6.8 873
Thyroid 2,576 12.3 316 11,210 4.5 502 13,786 5.9 818
Ovary - - - 5,745 5.7 325 5,745 5.7 325
Stomach* 12,606 5.3 667 7,078 3.7 259 19,684 4.7 925
Prostate* 72,536 1.6 1,162 - - - 72,536 1.6 1,162
Alcohol consumption
Oral cavity/pharynx 11,901 46.8 5,572 4,653 11.5 536 16,554 36.9 6,108
Esophagus* 9,713 34.3 3,328 3,191 12.0 383 12,904 28.8 3,711
Larynx 6,281 26.0 1,632 850 3.0 26 7,131 23.3 1,658

168
Gallbladder 1,456 20.6 300 2,593 4.0 105 4,049 10.0 405
Liver 5,726 9.6 552 3,870 6.9 268 9,596 8.5 820
Colorectum 16,359 9.1 1,483 17,579 0.8 137 33,938 4.8 1,620
Breast - - - 67,307 3.1 2,116 67,307 3.1 2,116
Pancreas 4,640 3.1 146 5,222 0.5 25 9,862 1.7 171
Lack of Physical activity
Colorectum* 16,359 11.1 1,811 17,579 11.8 2,067 33,938 11.4 3,878
Breast* - - - 67,307 10.0 6,712 67,307 10.0 6,712
Low Fruits and vegetables consumption
Larynx 6,281 26.3 1,652 850 23.9 203 7,131 26.0 1,855
Oral cavity/pharynx 11,901 26.5 3,152 4653 24.0 1,117 16,554 25.8 4,269
Lung 20,229 15.3 3,089 14,041 14.2 1,995 34,270 14.8 5,084
Low dietary calcium consumption
Colorectum 16,359 11.6 1,902 17,579 10.8 1,893 33,938 11.2 3,795
Low dietary fiber consumption
Colorectum 16,359 11.8 1,923 17,579 9.3 1,626 33,938 10.5 3,550
Processed meat consumption
Stomach* 12,606 5.0 626 7,078 5.6 393 19,684 5.2 1,019
Colorectum 16,359 5.4 883 17,579 4.7 833 33,938 5.1 1,716
Red meat consumption
Colorectum 16,359 6.5 1,069 17,579 4.8 842 33,938 5.6 1,911
Passive smoking
Lung 20,229 1.9 375 14,041 1.8 255 34,270 1.8 630

169
High body mass index
Corpus uteri (36.5%) had the highest PAF of BMI-related cancers, followed by
kidney (21.1%), gallbladder (19.1%), and liver (16.2%). Most of the cancer cases
attributable to BMI (58.2%) were from breast (6,660 cases), colorectum (3,336 cases),
and corpus uteri (2,326 cases) (Table 2).
Alcohol consumption
Oral cavity had both the highest PAF (36.9%) and number of cases (6,108) due
to alcohol. By sex, cancer sites with highest number of cases attributable to alcohol
consumption were oral cavity (5,572 cases) and esophagus (3,328 cases) in men, and
breast (2,116 cases) and oral cavity (536 cases) in women (Table 2).
Dietary factors
Low consumption of fruits and vegetables accounted for 26.0% (1,855 cases) of
larynx, 25.8% (4,269 cases) of oral cavity/pharynx and 14.8% (5,084 cases) of lung
cancer cases (Table 2). Low consumption of calcium and fiber, and high consumption
of red and processed meat, accounted for 28.7% (9,755 cases) of colorectal cancer
cases.
Lack of Physical activity
In women, colorectum cancer (11.8%; 2,067 cases) had the highest PAF,
whereas breast cancer (10.0%; 6,712 cases) had the highest number of attributable
cases. In men, 11.1% (1,811 cases) of colorectal cancers were due to lack of physical
activity (Table 2).
Cancer Mortality
Lifestyle risk factors accounted for 33.7% of all cancer deaths (63,417 of
188,379 deaths) in Brazil (Figure 3). Ranking of lifestyle risk factors was similar to
those observed for cancer incidence. Tobacco smoking accounted for the greatest
proportion and number of cancer deaths in both men (28.4%; 28,404 deaths) and
women (13.5%; 11,907 deaths). High BMI had the second highest PAF (6.9%; 13,011
deaths), with differences between men (6.5%; 6,543 deaths) and women (7.3%; 6,468
deaths) less pronounced than those observed in the incidence estimates. Dietary factors

170
and alcohol consumption accounted for 6.7% (12,692 deaths) and 4.5% (8,547 deaths)
of all cancer deaths, respectively. Proportion and number of deaths of cancer sites
attributable to each lifestyle risk factor are shown in Table 3.
Figure 3 - Proportion and number of total cancer deaths attributable to lifestyle
risk factors in Brazil in 2012, by exposure and sex

171
In 13 out of the 20 cancer sites included in the cancer mortality analysis, the
proportion of deaths that could be potentially avoided was higher than 20% (Figure 2).
By cancer site, proportion of cancer deaths attributable to lifestyle risk factors ranged
from 5.4% for prostate to 86.1% for larynx cancer. Lung cancer (19,956 deaths),
colorectum cancer (8,872 deaths), and esophageal cancer (6,034 deaths) had the highest
number of deaths due to lifestyle risk factors (Table 3).

172
Table 3 - Proportion and number of cancer deaths attributable to lifestyle risk factors in Brazil in 2012, by exposure, sex, and cancer site
Men Women Both
Exposure/cancer site Cancer
deaths
PAF
(%)
Attributable
deaths Cancer
deaths
PAF
(%)
Attributable
deaths Cancer
deaths
PAF
(%)
Attributable
deaths
Smoking
Lung 14,246 86.3 12,295 9,208 75.9 6,991 23,454 82.2 19,286
Larynx 3,780 78.4 2,962 552 64.9 358 4,332 76.6 3,320
Oral cavity/pharynx 5,510 53.1 2,924 1,512 39.4 596 7,022 50.1 3,520
Esophagus 5,983 52.9 3,164 1,760 38.3 674 7,743 49.6 3,838
Nasal cavity/paranasal sinus 115 51.4 59 71 39.3 28 186 46.8 87
Bladder 2,231 50.5 1,127 1,061 32.4 344 3,292 44.7 1,471
Liver 4,986 29.5 1,469 3,761 8.8 331 8,747 20.6 1,801
Stomach 8,708 25.7 2,235 4,984 7.8 390 13,692 19.2 2,625
Kidney 1,694 24.8 421 1,028 5.6 58 2,722 17.6 479
Cervix - - - 5,258 16.2 850 5,258 16.2 850
Myeloid leukemia 1,333 22.3 298 1,277 2.8 35 2,610 12.8 333
Colorectum 8,533 12.6 1,076 9,112 8.7 793 17,645 10.6 1,869
Pancreas 4,014 9.3 374 4,201 10.9 459 8,215 10.1 833
High body mass index
Corpus uteri - - - 3,416 36.1 1,233 3,416 36.1 1,233
Esophagus* 5,983 33.9 2,028 1,760 35.1 617 7,743 34.2 2,645
Kidney 1,694 19.7 333 1,028 22.8 234 2,722 20.8 567
Gallbladder 233 15.8 37 784 20.8 163 1,017 19.7 200
Stomach* 8,708 15.8 1,380 4,984 19.1 950 13,692 17.0 2,330
Liver 4,986 14.9 741 3,761 17.8 670 8,747 16.1 1,411
Breast - - - 13,587 10.3 1,400 13,587 10.3 1,400
Pancreas 4,014 9.5 382 4,201 9.0 380 8,215 9.3 762
Colorectum* 8,533 9.4 806 9,112 6.0 547 17,645 7.7 1,352
Multiple myeloma 1,212 8.1 99 1,190 6.6 78 2,402 7.4 177
Thyroid 176 11.9 21 423 4.6 20 599 6.8 41
Ovary - - - 3,106 5.7 177 3,106 5.7 177
Prostate* 13,344 5.4 716 - - - 13,344 5.4 716
Alcohol consumption
Oral cavity/pharynx 5,510 45.8 2,522 1,512 11.1 168 7,022 38.3 2,690

173
Esophagus* 5,983 41.5 2,483 1,760 15.3 270 7,743 35.6 2,753
Larynx 3,780 25.4 958 552 2.8 16 4,332 22.5 974
Liver 4,986 9.4 467 3,761 6.5 245 8,747 8.1 712
Gallbladder 233 20.1 47 784 3.8 30 1,017 7.6 77
Colorectum 8,533 8.9 759 9,112 0.7 67 17,645 4.7 826
Breast - - - 13,587 2.8 377 13,587 2.8 377
Pancreas 4,014 3.0 121 4,201 0.4 19 8,215 1.7 139
Lack of physical activity
Breast* - - - 13,587 10.6 1,444 13,587 10.6 1,444
Colorectum* 8,533 9.6 820 9,112 10.6 963 17,645 10.1 1,782
Low fruits and vegetables consumption
Larynx 3,780 26.3 992 552 23.8 132 4,332 25.9 1,124
Oral cavity/pharynx 5,510 26.4 1,453 1512 24.0 362 7,022 25.9 1,815
Lung 14,246 15.2 2,172 9,208 14.2 1,305 23,454 14.8 3,477
Low dietary calcium consumption
Colorectum 8,533 12.1 1,031 9,112 11.7 1,068 17,645 11.9 2,099
Low dietary fiber consumption
Colorectum 8,533 12.1 1,032 9,112 9.9 906 17,645 11.0 1,938
Processed meat consumption
Stomach* 8,708 7.3 639 4,984 6.9 343 13,692 7.2 982
Colorectum 8,533 5.4 464 9,112 5.1 465 17,645 5.3 928
Red meat consumption
Colorectum 8,533 6.6 560 9,112 5.1 469 17,645 5.8 1,029
Passive smoking
Lung 14,246 1.9 264 9,208 1.8 167 23,454 1.8 431

174
Considering the plausible reduction in the lifestyle risk factors, 6.1% of all
cancer deaths (11,561 of 188,379 deaths) could be potentially avoided, with a higher
proportion in men (7.3%; 7,289 deaths) than in women (4.8%; 4,272 deaths). The
combination of high BMI, alcohol consumption, lack of physical activity and dietary
factors accounted for more cancer deaths (3.3%; 6,230 deaths) than smoking (2.9%;
5,426 deaths) (Supplementary file online).
7.4. DISCUSSION
Main results and comparison with previous studies
In this study we found that 27% (114,497 cases) of all cancer cases and 34%
(63,371 deaths) of all cancer deaths were attributable to lifestyle risk factors in Brazil in
2012. Tobacco smoking was the single major cause of cancer, accounting for more than
half of all preventable cancer cases and deaths estimated. High BMI and alcohol
consumption were the second most important lifestyle factors for women and men,
respectively. Larynx, lung, oral cavity/pharynx, esophagus and colorectum cancer cases
and deaths could be at least halved by eliminating lifestyle risk factors included in our
analysis.
Preventability of cancer may vary by the method used to estimate it (Colditz;
Wei, 2012). The classical PAF approach relies on information about (i) risk factors with
convincing evidence for causing cancer, (2) exposure profile, (3) RR of cancer
associated with exposure, and (4) number of cases/deaths. Variation in any of these
parameters over time and populations may explain PAF differences between study’s
findings. Nonetheless, our results for PAF for all cancers due to lifestyle risk factors are
comparable to recent studies, using similar methods, conducted in the Australia, China,
United Kingdom (UK), and United States (US) (Whiteman et al., 2015; Islami et al.,
2017; 2018; Brown et al. 2018). For instance, tobacco smoking was the leading factor
contributing to cancer cases in all countries: 19.4% in US, 15.5% in Brazil (our study),
15.1% in UK, 14.8% in China, and 13.4% in Australia (Whiteman et al., 2015; Islami et
al., 2017; 2018; Brown et al. 2018). Smoking-related cancer cases were higher in men
than women, ranging from 43% in UK to 20-fold in China (Whiteman et al., 2015;
Islami et al., 2017; 2018; Brown et al. 2018). High BMI had the second highest PAF
among lifestyle factors in US (7.8%), UK (6.3%) and Brazil (4.9%), and the third

175
highest PAF in China (3.5%) and Australia (3.4%) (Whiteman et al., 2015; Islami et al.,
2017; 2018; Brown et al. 2018). Alcohol consumption had the second highest PAF in
Australia (2.8%), the third in UK (3.1%), US (5.6%) and Brazil (5.6%), and the fourth
in China (3.1%) (Whiteman et al., 2015; Islami et al., 2017; 2018; Brown et al. 2018).
Our findings slightly differ from previous studies quantifying the preventability
of cancer due to lifestyle risk factors in Brazil (Azevedo e Silva et al., 2016; Thuler et
al., 2016; Rezende et al., 2018). For example, compared to our study, Azevedo e Silva
and colleagues (2016) reported lower proportion of cancer cases due to smoking in both
men (14.4% vs 20.8% in our study) and women (7.2% vs 10.1%). Tobacco smoking is
constantly declining in Brazil (Monteiro et al., 2007) and our study used the most recent
prevalence data, which would lead to lower estimates. However, our study also
considered RR of cancers among former smokers, relative to never smokers, which
were not considered by Azevedo e Silva and colleagues (2016). RR of lung cancer
among heavy former smokers may remain at least threefold higher than never smokers
after 25 years since quitting (Tindler et al., 2018). Azevedo e Silva and colleagues
(2016) also reported lower PAF for all cancer cases due to high BMI (2.1% men; 3.3%
women) compared to ours (3.3% men; 6.6% women). These differences could be relate
to our use of continuous rather than categorical to estimates PAF, but mainly due to
cancer sites considered with convincing evidence to be associated with high BMI (6 vs
13 cancer sites in our study) (Lauby-Secretan et al., 2016; WCRF, 2018). In addition,
BMI has constantly increased over the last years in Brazil (Rezende et al., 2018), and
anthropometrics measurements were considered five years apart (2008 vs 2013).
Implications for cancer prevention and control
Our estimates of preventability of cancer used recent exposure profile in Brazil.
These estimates reflect the expected impact on cancer cases and deaths by
eliminating/reducing current prevalence of lifestyle risk factors, but it does not account
for cancers that have already been prevented by avoidance of ever being exposed. For
instance, in Brazil, the broad framework of laws to control tobacco introduced in the
late 1980s (e.g., advertising tobacco products is prohibited; alerts about health risks of
smoking are placed on cigarette packets; several tobacco control bills were approved;
smoking in places of collective use, public or private indoor, is prohibited) was
responsible for halving the prevalence of tobacco smoking between 1989 (30%) and

176
2013 (15%) (Monteiro et al., 2007). Thus, current preventability of cancer due to
smoking is lower than it was in the 1980s, but it does not mean cancer prevention
strategies should be less vigilant about tobacco control. In fact, a full range of
interventions and tools have been proposed to address the challenges of tobacco control
in the 21st century (Glynn et al., 2010). For instance, regulation of flavored and candy-
like tobacco products, among other youth-specific marketing strategies, is important to
prevent tobacco addiction in the future generations (Glynn et al., 2010).
High BMI, alcohol consumption, unhealthy diet and lack physical activity are
important targets for cancer prevention. We found that these lifestyle factors accounted
for the highest proportion of cancer cases and deaths in women, but not in men. These
lifestyle risk factor may increase cancer risk through several inflammatory and
hormonal pathways, some of which are likely causal for cancer in women only (e.g.,
estrogen and breast and endometrial cancer) (WCRF, 2018). As opposed to smoking,
the prevalence of these lifestyle risk factors is constantly increasing in Brazil (NCD
Risk Factor Collaborators, 2013; Martins et al., 2013; Mielke et al., 2014). For instance,
the caloric share of ultra-processed food and products increased from 20.8% in
2002/2003 to 25.4% in 2008/2009 (Martins et al., 2013). In the same period,
consumption of vegetables, red and processed meat remained stable, dairy products
decreased, and fruit intake slightly increased. High consumption of ultra-processed
products is associated with an overall unhealthy dietary profile characterized by high
consumption of free sugars and fat and low dietary fiber consumption (Louzada et al.,
2017). Moreover, ultra-processed food intake has been recently linked with higher BMI,
waist circumference and cancer risk (Fiolet et al., 2018; Silva et al., 2018). Public health
actions aiming to reduce the intake of these products (e.g., taxation, food labeling) are
necessary for obesity and cancer prevention. Further regulations in regard to alcohol
sales and marketing (i.e., in Brazil, it is prohibited advertisements for alcoholic
beverages on the radio and television between 6:00 AM to 9:00 PM; sell alcohol for
people under 18 years of age; to drink and drive) would also be highly beneficial for
cancer prevention in Brazil, especially for men. Rising prices of alcohol have shown to
be an effective measure to reduce drinking (Wagenaar et al., 2009). Finally, despite
modest increase in leisure-time physical activity over the past few years, commuting
activities have steeply declined, and the prevalence of physical inactivity remains high
in Brazil (Mielke et al., 2014). Expansion of physical activity programs in the Brazilian

177
primary health care system and improvement of built environment of public spaces
(e.g., schools, cycle lanes, parks, sidewalks) towards active modes of living are key to
increase population levels of physical activity in a sustainable manner (Gomes et al.,
2014).
Limitations
Our study has some limitations that should be considered while interpreting the
results. We used RR from meta-analyses and large pooled data from cohort studies
conducted worldwide (Table S3). The RR might not be applicable to the Brazilian
population if the (1) exposure, (2) latency of the disease, or (3) prevalence of effect
modifiers are different between populations (Rezende; Eluf-Neto, 2016). For instance,
the effect of high BMI on cancer risk may differ by smoking status due to residual
confounding and reverse causation. Lean non-smokers tend to be different than lean
smokers in terms of visceral adiposity and metabolic profiles. In addition, lean smokers
also tend to have more preclinical malignancies and other chronic illnesses than lean
non-smokers (Song; Giovannucci, 2016). Therefore, differences in the prevalence of
current smokers between populations where RR were estimated and the Brazilian
population may have biased our results. Future prospective studies to study etiologic
factors of cancer in Brazil are desired.
Furthermore, we opted to estimate the preventability of cancer using the most
recent exposure data in Brazil, which may not have properly accounted for the latency
between exposures and cancer. This approach has been used in the literature due to
uncertainty and variation in regard to latency of lifestyle exposures to cancer occurrence
and deaths (Islami et al., 2018). We used data from POF 2008/09 and PNS 2013 in
order to estimate the prevalence of lifestyle risk factors, although cancer cases and
deaths were estimated for 2012. Depending on trends of cancer incidence and risk
factors over time, this may have underestimated or overestimated the preventability of
cancer.
We limited our estimates to associations supported by convincing evidence
according to the IARC and the WCRF, and results from recent meta-analyses (IARC,
2002; 2018 Bagnardi et al., 2015; Bouvard et al., 2015; Carter et al., 2015; Lauby-
Secretan et al., 2016; Rezende et al., 2018a; WCRF, 2018a; 2018b; 2018c; 2018d;
2018e) Our PAF estimates might be underestimated, especially for lifestyle exposures
178
with recent promise findings in regard to cancer prevention. For instance, a recent
pooled analysis found that leisure-time physical activity was associated with lower risk
of 13 types of cancer (Moore al., 2016). If these associations turn out to be confirmed
causal, our estimates on proportion of cancer cases and deaths due to lack of physical
activity are underestimated. Regarding the dietary factors, calcium was the only nutrient
considered in our analysis. The WCRF report assessed the association between
consumption of dairy products (e.g., total dairy, milk, cheese) as well as calcium
supplements as probable protective against colorectal cancer (WCRF, 2018). One
potential interpretation is that both results on dairy products and calcium supplements
supports calcium as the key protective component. In fact, a meta-analysis of
prospective studies found that calcium supplements and non-dairy products fortified
with calcium may play a role in colorectal cancer prevention (Keum et al., 2014). In our
study, we considered exposure as total dietary calcium consumption only.
PAF estimates did not either account for interaction between lifestyle risk factors
nor exposures at earlier stages of life, which may also have underestimated the actual
preventability of cancer in Brazil. Finally, this study focused on lifestyle risk factors,
but reductions in other modifiable risk factors (e.g., infections) may certainly play an
important role in cancer prevention. These modifiable risk factors were considered in a
previous study in Brazil (Azevedo e Silva et al., 2016), but since then its prevalences
have not been updated.
Conclusions
Lifestyle risk factors accounted for nearly 27% of cancer cases and one-third of
cancer deaths in Brazil in 2012. Preventive actions focusing on tobacco control and
prevention of overweight and obesity are likely to have the greatest impact on cancer
prevention. Findings from this study may be useful to inform strategies for cancer
prevention and control in Brazil.
Acknowledgment: none.
Funding: Leandro Fórnias Machado de Rezende receives a doctoral scholarship from
Sao Paulo Research Foundation (FAPESP), grants 2014/25614-4 and 2016/21390-0.
Conflict of Interest: none.

179
7.5. REFERENCES
Ainsworth BE1, Haskell WL, Herrmann SD, Meckes N, Bassett DR Jr, Tudor-Locke C,
Greer JL, Vezina J, Whitt-Glover MC, Leon AS. 2011 Compendium of Physical
Activities: a second update of codes and MET values. Med Sci Sports Exerc.
2011;43:1575-81.
Arnold M, Soerjomataram I, Ferlay J, Forman D. Global incidence of oesophageal
cancer by histological subtype in 2012. Gut. 2015;64:381-7.
Azevedo e Silva G, de Moura L, Curando MP, Gomes FS, Rezende LFM, Daumas,
Guimarães RM, Meira KC, Leite IC, Valente JG, Moreira RI, Koifman R, Malta DC,
Mello MS, Guedes TW, Boffetta P. The Fraction of Cancer Attributable to Ways of
Life, Infections, Occupation, and Environmental Agents in Brazil in 2020. PLoS One.
2016;11:e0148761.
Bagnardi V, Rota M, Botteri E, Tramacere I, Islami F, Fedirko V, Scotti L, Jenab M,
Turati F, Pasquali E, Pelucchi C, Galeone C, Bellocco R, Negri E, Corrao G, Boffetta P,
La Vecchia C. Alcohol consumption and site-specific cancer risk: a comprehensive
dose-response meta-analysis. Br J Cancer. 2015;112:580-93.
Bouvard V, Loomis D, Guyton KZ, Grosse Y, Ghissassi FE, Benbrahim-Tallaa L, Guha
N, Mattock H, Straif K, International Agency for Research on Cancer Monograph
Working G. Carcinogenicity of consumption of red and processed meat. Lancet Oncol.
2015;16:1599-600.
Brasil. Ministério da Saúde. Sistema de Informações sobre Mortalidade (SIM) de 1996
a 2016. Brasília: MS/SVS/CGIAE; 2018.
Brown KF, Rumgay H, Dunlop C, Ryan M, Quartly F, Cox A, Deas A, Elliss-Brookes
L, Gavin A, Hounsome L, Huws D, Ormiston-Smith N, Shelton J, White C, Parkin DM.
The fraction of cancer attributable to modifiable risk factors in England, Wales,
Scotland, Northern Ireland, and the United Kingdom in 2015. Br J Cancer. 2018;118:
1130-41.
Carter BD, Abnet CC, Feskanich D, Freedman ND, Hartge P, Lewis CE, Ockene JK,
Prentice RL, Speizer FE, Thun MJ, Jacobs EJ. Smoking and mortality--beyond
established causes. N Engl J Med. 2015;372:631-40.
Colditz GA, Wei EK. Preventability of Cancer: The Relative Contributions of Biologic
and Social and Physical Environmental Determinants of Cancer Mortality. Annu Rev
Public Health. 2012;33:137-56.
Colquhoun A, Arnold M, Ferlay J, Goodman KJ, Forman D, Soerjomataram I. Global
patterns of cardia and non-cardia gastric cancer incidence in 2012. Gut. 2015;64:1881-8.
Ferlay J SI, Ervik M, Dikshit R, Eser S, Mathers C, Rebelo M, Parkin DM, Forman D,
Bray, F. GLOBOCAN 2012 v1.0, Cancer Incidence and Mortality Worldwide. IARC
CancerBase No. 11 [Internet]. vol. 2017 Lyon: IARC; 2013.
Fiolet T, Srour B, Sellem L, Kesse-Guyot E, Alles B, Mejean C, Deschasaux M, Fassier
P, Latino-Martel P, Beslay M, Hercberg S, Lavalette C, Monteiro CA, Julia C, Touvier
M. Consumption of ultra-processed foods and cancer risk: results from NutriNet-Sante
prospective cohort. BMJ. 2018;360:k322.

180
Forman D, Bray F, Brewster DH, Gombe Mbalawa C, Kohler B, Piñeros M, Steliarova-
Foucher E, Swaminathan R. Cancer Incidence in Five Continents, Vol. X. IARC
Scientific Publications No. 164. Lyon: IARC; 2013.
Glynn T, Seffrin JR, Brawley OW, Grey N, Ross H. The globalization of tobacco use:
21 challenges for the 21st century. CA Cancer J Clin. 2010;60:50-61.
Gomes GA, Kokubun E, Mieke GI, Ramos LR, Pratt M, Parra DC, Simões E, Florindo
AA, Bracco M, Cruz D, Malta D, Lobelo F, Hallal PC. Characteristics of physical
activity programs in the Brazilian primary health care system. Cad Saude Publica.
2014;30:2155-68.
Instituto Brasileiro de Geografia e Estatística (IBGE). Pesquisa de Orçamentos
Familiares 2008-2009: Análise do consumo alimentar pessoal no Brasil. Rio de
Janeiro: IBGE; 2011a.
Instituto Brasileiro de Geografia e Estatística (IBGE). Tabela de Composição
Nutricional dos Alimentos Consumidos no Brasil. Rio de Janeiro: IBGE, 2011b.
Instituto Brasileiro de Geografia e Estatística (IBGE). Tabela de Medidas Referidas
para os Alimentos Consumidos no Brasil. Rio de Janeiro: IBGE, 2011c.
Instituto Nacional de Câncer José Alencar Gomes da Silva (INCA). Coordenação Geral
de Ações Estratégicas. Coordenação de Prevenção e Vigilância. Estimativa 2012:
incidência de câncer no Brasil. Rio de Janeiro: INCA; 2011.
International Agency for Research on Cancer (IARC). Agents Classified by the IARC
Monographs, Volumes 1-120. IARC Monographs on the Evaluation of Carcinogenic
Risks to Humans. Lyon: IARC, 2018.
International Agency for Research on Cancer (IARC). Weight Control and Physical
Activity. IARC Handbook of Cancer Prevention Volume 6.ed. Lyon: IARC Press; 2002.
Islami F, Chen W, Yu XQ, Lortet-Tieulent J, Zheng R, Flanders WD, Xia C, Thun MJ,
Gapstur SM, Ezzati M, Jemal A. Cancer deaths and cases attributable to lifestyle factors
and infections in China, 2013. Ann Oncol. 2017;28:2567-74.
Islami F, Goding Sauer A, Miller KD, Siegel RL, Fedewa SA, Jacobs EJ, McCullough
ML, Patel AV, Ma J, Soerjomataram I, Flanders WD, Brawley OW, Gapstur SM, Jemal
A. Proportion and number of cancer cases and deaths attributable to potentially
modifiable risk factors in the United States. CA Cancer J Clin. 2018;68:31-54.
Keum N, Aune D, Greenwood DC, Ju W, Giovannucci EL. Calcium intake and
colorectal cancer risk: dose-response meta-analysis of prospective observational studies.
Int J Cancer. 2014;135:1940-8.
Lauby-Secretan B, Scoccianti C, Loomis D, Grosse Y, Bianchini F, Straif K,
International Agency for Research on Cancer Handbook Working G. Body Fatness and
Cancer--Viewpoint of the IARC Working Group. N Engl J Med. 2016;375:794-8.
Louzada MLC, Ricardo CZ, Steele EM, Levy RB, Cannon G, Monteiro CA. The share
of ultra-processed foods determines the overall nutritional quality of diets in Brazil.
Public Health Nutr. 2017;21:94-102.
Martins AP, Levy RB, Claro RM, Moubarac JC, Monteiro CA. Increased contribution
of ultra-processed food products in the Brazilian diet (1987-2009). Rev Saude Publica.
2013;47:656-65.

181
Mielke GI, Hallal PC, Malta DC, Lee IM. Time trends of physical activity and
television viewing time in Brazil: 2006-2012. Int J Behav Nutr Phys Act. 2014;11:101.
Monteiro CA, Cavalcante TM, Moura EC, Claro RM, Szwarcwald CL. Population-
based evidence of a strong decline in the prevalence of smokers in Brazil (1989-2003).
Bull World Health Organ. 2007;85:527-34.
Moore S1, Lee IM, Weiderpass E, Campbell PT, Sampson JN, Kitahara CM, Keadle
SK, Arem H, Berrington de Gonzalez A, Hartge P, Adami HO, Blair CK, Borch KB,
Boyd E, Check DP, Fournier A, Freedman ND, Gunter M, Johannson M, Khaw KT,
Linet MS, Orsini N, Park Y, Riboli E, Robien K, Schairer C, Sesso H, Spriggs M, Van
Dusen R, Wolk A, Matthews CE, Patel AV. Association of Leisure-Time Physical
Activity With Risk of 26 Types of Cancer in 1.44 Million Adults. JAMA Intern Med.
2016;176:816-825.
Murray CJ, Ezzati M, Lopez AD, Rodgers A, Vander Hoorn S. Comparative
quantification of health risks: Conceptual framework and methodological issues. Popul
Health Metr. 2003;1(1):1.
NCD Risk Factor Collaboration. Trends in adult body-mass index in 200 countries from
1975 to 2014: a pooled analysis of 1698 population-based measurement studies with
19.2 million participants. Lancet. 2016;387:1377-96.
Rezende LFM, Eluf-Neto J. Population attributable fraction: planning of diseases
prevention actions in Brazil. Rev Saude Publica. 2016;50: S0034-89102016000100601.
Rezende LFM, Arnold M, Rabacow FM, Levy RB, Claro RM, Giovannucci E, Eluf-
Neto J. The increasing burden of cancer attributable to high body mass index in Brazil.
Cancer Epidemiol. 2018;54:63-70.
Rezende LFM, Sá TH, Markozannes G, Rey-López JP, Lee IM, Tsilidis KK, Ioannidis
JPA, Eluf-Neto J. Physical activity and cancer: an umbrella review of the literature
including 22 major anatomical sites and 770 000 cancer cases. Br J Sports Med.
2018;52:826-33.
Silva FM, Giatti L, de Figueiredo RC, Molina M, de Oliveira Cardoso L, Duncan BB,
Barreto SM. Consumption of ultra-processed food and obesity: cross sectional results
from the Brazilian Longitudinal Study of Adult Health (ELSA-Brasil) cohort (2008-
2010). Public Health Nutr. 2018;21:2271-9
Song M, Giovannucci E. Estimating the Influence of Obesity on Cancer Risk:
Stratification by Smoking Is Critical. J Clin Oncol. 2016;34:3237-9.
Szwarcwald CL, Malta DC, Pereira CA, Vieira ML, Conde WL, Souza Júnior PR,
Damacena GN, Azevedo LO, Azevedo E Silva G, Theme Filha MM, Lopes Cde S,
Romero DE, Almeida Wda S, Monteiro CA. National Health Survey in Brazil: design
and methodology of application. Cien Saude Colet. 2014;19:333-42.
Taylor R, Najafi F, Dobson A. Meta-analysis of studies of passive smoking and lung
cancer: effects of study type and continent. Int J Epidemiol. 2007;36:1048-59.
Thuler LC, de Menezes RF, Bergmann A. Cancer cases attributable to alcohol
consumption in Brazil. Alcohol. 2016;54:23-6.
Tindle HA, Stevenson Duncan M, Greevy RA, Vasan RS, Kundu S, Massion PP,
Freiberg MS. Lifetime Smoking History and Risk of Lung Cancer: Results From the
Framingham Heart Study. J Natl Cancer Inst. 2018;110;1201-7.
182
Wagenaar AC, Salois MJ, Komro KA. Effects of beverage alcohol price and tax levels
on drinking: a meta-analysis of 1003 estimates from 112 studies. Addiction.
2009;104:179-90.
Whiteman DC, Webb PM, Green AC, Neale RE, Fritschi L, Bain CJ, Parkin DM,
Wilson LF, Olsen CM, Nagle CM, Pandeya N, Jordan SJ, Antonsson A, Kendall BJ,
Hughes MC, Ibiebele TI, Miura K, Peters S, Carey RN. Cancers in Australia in 2010
attributable to modifiable factors: summary and conclusions. Aust N Z J Public Health.
2015;39:477-84.
World Cancer Research Fund International/American Institute for Cancer Research.
Continuous Update Project Expert Report 2018. Meat, fish and dairy products and the
risk of cancer. Available at: dietandcancerreport.org
World Cancer Research Fund International/American Institute for Cancer Research.
Continuous Update Project Expert Report 2018. Wholegrains, vegetables and fruit and
the risk of cancer. Available at: dietandcancerreport.org
World Cancer Research Fund/American Institute for Cancer Research. Continous
Update Project Expert Report 2018. Body fatness and weight gain and the risk of
cancer. Available at: dietandcancerreport.org
World Cancer Research Fund/American Institute for Cancer Research. Diet, Nutrition,
Physical Activity and Cancer: a Global Perspective. Continuous Update Project Expert
Reported 2018. Available at: dietandcancerreport.org
World Cancer Research Fund/American Institute for Cancer Research. Continuous
Update Project Expert Report 2018. Physical activity and risk of cancer. Available at:
dietandcancerreport.org
World Health Organization (WHO). Global recommendations on physical activity for
health. Geneva: WHO Press; 2010.
World Health Organization (WHO). Global status report on noncommunicable diseases
2014. Geneva: WHO Press; 2014.

183
SUPPLEMENTARY MATERIAL
Table S1 - Distribution of lifestyle risk factors included in analysis by sex, adults
≥20 years
Men Women
Alcohol consumption (%)
Abstainer 63.2 87.2
Light (<12.5 g/day) 2.2 2.3
Moderate (12.6 to 49.9 g/day) 9.7 4.9
Heavy (≥50 g/day) 24.9 5.6
High body mass index (in Kg/m2) Mean (standard deviation) 26.2 (4.5) 27.0 (5.5)
Low dietary calcium consumption (%) ≥1000 mg/day 7.7 11.8
800-999 mg/day 29.6 32.8
600-799 mg/day 26.4 26.2
400-599 mg/day 15.8 13.8
200-399 mg/day 8.5 6.7
0-199 mg/day 12.0 8.7
Low dietary fiber consumption (%) ≥30 g/day 7.4 13.7
20-29 g/day 37.5 52.4
10-19 g/day 31.0 23.3
0-9 g/day 24.1 10.6
Low fruits and vegetables consumption (%) ≥400 g/day 4.5 7.7
300-399 g/day 8.5 11.7
200-299 g/day 18.8 22.6
100-199 g/day 38.3 36.9
0-99 g/day 29.9 21.1
Low Fruits consumption only (%) ≥250 g/day 3.6 6.2
200-249 g/day 0.3 0.4
150-199 g/day 9.1 14.5
100-149 g/day 5.2 4.9
50-99 g/day 24.6 29.1
0-49 g/day 57.1 44.9
Passive smoking (%) No 84.3 85.8
Yes 15.7 14.2
Lack of physical activity (%) ≥8000 MET-h/week 9.8 2.5
4000-7999 MET-h/week 9.3 5.3
600-3999 MET-h/week 36.8 41.5
<600 MET-h/week 44.2 50.7
Processed meat consumption (%) 0-49 g/day 84.3 89.1
50-99 g/day 6.9 5.2
100-149 g/day 2.5 1.1
150-199 g/day 0.8 0.4
200-249 g/day 0.8 0.4
≥250 g/day 4.7 3.7
Read meat consumption (%) 0-99 g/day 59.4 71.4
100-199 g/day 25.8 20.5
200-299 g/day 7.7 3.9
300-399 g/day 2.2 0.6
≥400 g/day 5.0 3.6
Smoking (%) Never 58.5 74.1
Former 22.1 14.6
Current 19.4 11.3

184
Table S2 - Distribution of lifestyle risk factors included in analysis by age-group and sex Men Women
20-44 years 45-54 years 55-64 years 65-74 years ≥75 years 20-44 years 45-54 years 55-64 years 65-74 years ≥75 years
Alcohol consumption (in g/day)
Abstainer 59.1 62.6 66.3 77.2 84.4 83.8 87.5 91.0 95.0 97.4
Light (<12.5 g/day) 1.6 2.0 3.6 4.6 2.9 2.4 2.3 2.5 2.0 0.8
Moderate (12.6 to 49.9 g/day) 10.9 9.6 8.7 6.0 3.8 6.2 4.8 3.6 1.3 1.1
Heavy (≥50 g/day) 28.4 25.8 21.4 12.2 8.9 7.5 5.4 2.9 1.8 0.6
High body mass index (in Kg/m2) Mean (standard deviation) 25.8 (4.5) 26.8 (4.5) 26.9 (4.6) 26.5 (4.5) 25.0 (4.2) 26.2 (5.5) 27.9 (5.4) 28.1 (5.3) 27.6 (5.5) 26.5 (4.8)
Low dietary calcium consumption (in mg/day) ≥1000 6.9 8.2 9.0 10.3 9.5 11.6 12.2 12.4 14.5 7.6
800-999 28.5 32.3 32.7 27.1 31.2 33.6 32.8 31.5 31.8 29.1
600-799 26.8 24.8 26.6 25.1 29.8 26.5 26.9 25.0 23.2 26.8
400-599 16.1 16.0 14.3 17.7 10.3 13.4 14.2 14.9 13.3 14.9
200-399 9.4 7.3 5.4 9.0 8.1 6.3 6.1 7.5 7.2 10.3
0-199 12.4 11.4 12.0 10.8 11.1 8.6 7.8 8.7 10.0 11.3
Low dietary fiber consumption (in g/day) ≥30 6.6 7.2 8.5 9.8 12.9 12.8 15.1 13.3 16.0 15.7
20-29 37.1 36.4 37.5 39.2 46.5 53.1 53.5 48.1 53.8 49.4
10-19 30.8 31.9 32.5 29.8 28.0 23.0 21.4 27.1 21.5 26.2
0-9 25.6 24.4 21.5 21.1 12.6 11.1 9.9 11.4 8.7 8.8
Low fruits and vegetables consumption (in
g/day)
≥400 3.5 4.7 5.7 7.2 8.3 6.3 7.4 11.0 11.0 9.2
300-399 7.3 9.3 10.4 10.6 9.4 10.7 12.5 13.5 13.2 10.5
200-299 17.4 19.2 22.9 20.6 19.4 20.1 24.4 24.6 28.5 27.6
100-199 38.6 39.0 37.1 37.7 36.5 37.8 37.3 35.4 32.6 36.3
0-99 33.2 27.8 24.1 23.8 26.4 25.0 18.4 15.6 14.6 16.4
Low fruits consumption only (in g/day)
≥250 3.1 3.3 4.3 5.3 6.3 5.3 6.4 8.4 7.4 6.9
200-249 0.3 0.3 0.6 0.3 0.2 0.3 0.4 0.6 0.4 0.4
150-199 7.3 8.5 12.4 14.5 15.8 11.8 15.5 18.7 19.1 19.6

185
100-149 4.9 5.8 6.3 4.4 4.4 5.1 4.4 4.7 5.9 3.0
50-99 22.3 27.3 27.0 27.6 28.4 26.9 29.6 30.1 35.7 37.0
0-49 62.1 54.8 49.4 47.9 44.9 50.6 43.6 37.6 31.4 33.1
Passive smoking No 82.4 83.5 87.3 91.7 89.6 84.7 85.9 85.8 90.2 89.5
Yes 17.6 16.5 12.7 8.3 10.4 15.3 14.1 14.2 9.8 10.5
Lack of physical activity (in MET-h/week) ≥8000 12.0 10.6 6.7 2.5 0.8 3.1 3.0 1.9 0.5 0.2
4000-7999 10.3 10.0 9.0 4.9 1.8 6.4 6.2 3.9 1.7 1.0
600-3999 40.4 34.2 33.5 31.3 21.6 45.4 43.4 39.5 31.3 16.2
<600 37.3 45.1 50.8 61.3 75.8 45.1 47.4 54.7 66.5 82.7
Processed meat consumption (in g/day) 0-49 83.2 83.7 88.6 84.9 90.6 88.3 91.4 88.8 87.9 91.6
50-99 7.9 6.6 4.0 5.2 3.5 5.9 4.1 5.3 4.4 2.1
100-149 2.3 3.0 2.3 3.8 1.9 1.2 1.2 0.9 0.9 1.1
150-199 0.9 0.8 0.3 1.3 1.2 0.5 0.3 0.2 0.8 0.3
200-249 0.8 0.6 1.1 0.3 0.6 0.3 0.5 0.5 0.9 0.4
≥250 4.8 5.4 3.7 4.5 2.1 3.7 2.7 4.3 5.1 4.5
Read meat consumption (in g/day) 0-99 57.5 58.5 63.0 62.4 76.0 69.8 73.0 73.1 75.2 74.5
100-199 26.1 27.4 25.8 23.2 16.5 21.4 20.5 18.6 17.4 19.4
200-299 8.6 6.8 5.3 8.3 4.5 4.4 3.5 4.4 2.4 1.2
300-399 2.5 1.7 2.2 1.5 0.7 0.7 0.4 0.5 0.5 0.5
≥400 5.2 5.5 3.7 4.6 2.3 3.7 2.7 3.4 4.4 4.4
Smoking Never 68.6 53.1 41.4 38.2 44.3 82.3 61.6 61.3 68.9 77.5
Former 13.1 23.5 35.7 46.1 44.9 9.0 19.9 23.1 22.3 18.2
Current 18.3 23.4 22.9 15.7 10.8 8.7 18.5 15.6 8.8 4.3

186
Table S3 - Relative risks for the associations between lifestyle risk factors and
cancer sites
Exposure/cancer site (ICD-10) Categories of
exposure Relative risk (95% CI)
Men Women
Alcohol consumption
Lip, oral cavity, pharynx (C00-C14)[1] abstainer 1 1
light 1.10 1.00
moderate 2.01 1.67
heavy 5.33 5.70
Esophagus (C15; squamous cell carcinoma only)[1] abstainer 1 1
light 1.20 1.07
moderate 2.25 2.18
heavy 4.69 8.32
Colorectum (C18-C20)[1] abstainer 1 1
light 1.03 1.00
moderate 1.21 1.07
heavy 1.53 1.24
Liver (C22)[1] abstainer 1 1
light 1.03 1.00
moderate 1.08 1.24
heavy 1.59 3.89
Gallbladder (C23)[1] abstainer 1 1
light 1.12 1.12
moderate 1.00 1.00
heavy 2.64 2.64
Pancreas (C25)[1] abstainer 1 1
light 1.00 1.00
moderate 1.08 1.04
heavy 1.16 1.17
Larynx (C32)[1] abstainer 1 1
light 1.00 1.00
moderate 1.50 1.59
heavy 2.77 1.55
Breast (C50)[1] abstainer - 1
light - 1.02
moderate - 1.23
heavy - 1.61
Smoking
Lung, bronchus, trachea (C33-C34)[2] never 1 1
former 6.80 6.80
current 25.30 22.90
Oral cavity, pharynx (C00-C14)[2] never 1 1
former 1.70 2.20
current 5.70 5.60
Larynx (C32)[2] never 1 1
former 2.78 2.78
current 17.40 17.40
Esophagus (C15)[2] never 1 1
former 2.60 2.20
current 3.90 5.10
Stomach (C16)[2] never 1 1
former 1.50 1.10

187
current 1.90 1.70
Colorectum (C18-C20)[2] never 1 1
former 1.20 1.20
current 1.40 1.60
Pancreas (C25)[2] never 1 1
former 1.00 1.20
current 1.60 1.90
Liver (C22)[2] never 1 1
former 1.50 1.10
current 2.30 1.80
Kidney, renal pelvis, ureter (C64-C66)[2] never 1 1
former 1.50 1.20
current 1.80 1.20
Urinary bladder (C67)[2] never 1 1
former 2.40 2.30
current 3.90 3.90
Myeloid leukemia (C92)[2] never 1 1
former 1.40 1.10
current 1.90 1.10
Cervix (C53)[3] never - 1
former - 1.50
current - 1.90
Nasal cavity/paranasal sinus (C30-C31)[2] never 1 1
former 1.70 2.20
current 5.70 5.60
Passive smoking
Lung, bronchus, trachea (C33-C34)[4] no 1 1
yes 1.27 1.27
Low consumption of fruits
Lung, bronchus, trachea (C33-C34)[5, 6] ≥250g 1 1
200-249g 1.04 1.04
150-199g 1.09 1.09
100-149 1.13 1.13
50-99g 1.18 1.18
0-49g 1.23 1.23
Low consumption of fruits and vegetables
Oral cavity, pharynx (C00-C14)[7, 8] ≥400g 1 1
300-399g 1.12 1.12
200-299g 1.25 1.25
100-199g 1.40 1.40
0-99g 1.56 1.56
Larynx (C32)[7, 8] ≥400g 1 1
300-399g 1.12 1.12
200-299g 1.25 1.25
100-199g 1.40 1.40
0-99g 1.56 1.56
Consumption of red meat
Colorectum (C18-C20)[8, 9] 0-99g 1 1
100-199g 1.12 1.12
200-299g 1.25 1.25
300-399g 1.40 1.40
≥400g 1.57 1.57
Consumption of processed meat

188
Stomach (C16; non-cardia only)[8, 10] 0-49g 1 1
50-99g 1.18 1.18
100-149 1.39 1.39
150-199g 1.64 1.64
200-249g 1.94 1.94
≥250g 2.29 2.29
Colorectum (C18-C20)[8, 9] 0-49g 1 1
50-99g 1.14 1.14
100-149 1.30 1.30
150-199g 1.48 1.48
200-249g 1.69 1.69
≥250g 1.93 1.93
Low dietary consumption of fiber
Colorectum (C18-C20)[8, 9] ≥30g 1 1
20-29g 1.08 1.08
10-19g 1.17 1.17
0-9g 1.27 1.27
Low dietary consumption of calcium
Colorectum (C18-C20)[8, 9] ≥1000mg 1 1
800-999mg 1.06 1.06
600-799mg 1.12 1.12
400-599mg 1.19 1.19
200-399mg 1.26 1.26
0-199mg 1.34 1.34
Lack of physical activity
Colon (C18)[11] ≥8000 1 1
4000-7999 1.07 1.07
600-3999 1.17 1.17
<600 1.29 1.29
Breast (C50; post-menopausal cancers only)[11] ≥8000 - 1.00
4000-7999 - 1.09
600-3999 - 1.12
<600 - 1.16
High Body Mass Index
Breast (C50; post-menopausal cancers only)[12] Per 1Kg/m2 – 1.02
Colon (C18)[9] Per 1Kg/m2 1.04 1.02
Corpus uteri (C54-C55)[13] Per 1Kg/m2 – 1.08
Gallbladder (C23)[14] Per 1Kg/m2 1.04 1.05
Kidney, renal pelvis (C64-C66)[14] Per 1Kg/m2 1.05 1.05
Liver (C22)[15] Per 1Kg/m2 1.04 1.04
Multiple myeloma (C90)[16] Per 1Kg/m2 1.04 1.04
Esophagus (C15; adenocarcinoma only)[14] Per 1Kg/m2 1.09 1.08
Ovary (C56)[17] Per 1Kg/m2 – 1.01
Pancreas (C25)[18] Per 1Kg/m2 1.02 1.02
Prostate (C61; advanced only)[19] Per 1Kg/m2 1.02 –
Rectum (C20)[9] Per 1Kg/m2 1.02 1.01
Stomach (C16; cardia only)[10] Per 1Kg/m2 1.04 1.04
Thyroid (C73)[16] Per 1Kg/m2 1.03 1.01

189
REFERENCES
1. Bagnardi V, Rota M, Botteri E, Tramacere I, Islami F, Fedirko V, Scotti L,
Jenab M, Turati F, Pasquali E, Pelucchi C, Galeone C, Bellocco R, Negri E, Corrao G,
Boffetta P, La Vecchia C. Alcohol consumption and site-specific cancer risk: a
comprehensive dose-response meta-analysis. Br J Cancer. 2015;112:580-93.
2. Carter BD, Abnet CC, Feskanich D, Freedman ND, Hartge P, Lewis CE, Ockene
JK, Prentice RL, Speizer FE, Thun MJ, Jacobs EJ. Smoking and mortality--beyond
established causes. N Engl J Med. 2015;372:631-40.
3. Roura E1, Castellsagué X, Pawlita M, Travier N, Waterboer T, Margall N,
Bosch FX, de Sanjosé S, Dillner J, Gram IT, Tjønneland A, Munk C, Pala V, Palli D,
Khaw KT, Barnabas RV, Overvad K, Clavel-Chapelon F, Boutron-Ruault MC,
Fagherazzi G, Kaaks R, Lukanova A, Steffen A, Trichopoulou A, Trichopoulos D,
Klinaki E, Tumino R, Sacerdote C, Panico S, Bueno-de-Mesquita HB, Peeters PH,
Lund E, Weiderpass E, Redondo ML, Sánchez MJ, Tormo MJ, Barricarte A, Larrañaga
N, Ekström J, Hortlund M, Lindquist D, Wareham N, Travis RC, Rinaldi S, Tommasino
M, Franceschi S, Riboli E. Smoking as a major risk factor for cervical cancer and pre-
cancer: results from the EPIC cohort. Int J Cancer. 2014; 135: 453-466.
4. Taylor R, Najafi F, Dobson A. Meta-analysis of studies of passive smoking and
lung cancer: effects of study type and continent. Int J Epidemiol. 2007;36:1048-59..
5. Vieira AR, Abar L, Vingeliene S, Chan DS, Aune D, Navarro-Rosenblatt D,
Stevens C, Greenwood D, Norat T. Fruits, vegetables and lung cancer risk: a systematic
review and meta-analysis. Ann Oncol. 2016; 27: 81-96.
6. Islami F, Chen W, Yu XQ, Lortet-Tieulent J, Zheng R, Flanders WD, Xia C,
Thun MJ, Gapstur SM, Ezzati M, Jemal A. Cancer deaths and cases attributable to
lifestyle factors and infections in China, 2013. Ann Oncol. 2017;28:2567-74..
7. Boeing H, Dietrich T, Hoffmann K, Pischon T, Ferrari P, Lahmann PH,
Boutron-Ruault MC, Clavel-Chapelon F, Allen N, Key T, Skeie G, Lund E, Olsen A,
Tjonneland A, Overvad K, Jensen MK, Rohrmann S, Linseisen J, Trichopoulou A,
Bamia C, Psaltopoulou T, Weinehall L, Johansson I, Sánchez MJ, Jakszyn P, Ardanaz
E, Amiano P, Chirlaque MD, Quirós JR, Wirfalt E, Berglund G, Peeters PH, van Gils
CH, Bueno-de-Mesquita HB, Büchner FL, Berrino F, Palli D, Sacerdote C, Tumino R,
Panico S, Bingham S, Khaw KT, Slimani N, Norat T, Jenab M, Riboli E. Intake of fruits
and vegetables and risk of cancer of the upper aero-digestive tract: the prospective
EPIC-study. Cancer Causes Control. 2006;17:957-69.
8. Islami F, Goding Sauer A, Miller KD, Siegel RL, Fedewa SA, Jacobs EJ,
McCullough ML, Patel AV, Ma J, Soerjomataram I, Flanders WD, Brawley OW,
Gapstur SM, Jemal A. Proportion and number of cancer cases and deaths attributable to
potentially modifiable risk factors in the United States. CA Cancer J Clin. 2018;68:31-
54.
9. World Cancer Research Fund International/American Institute for Cancer
Research. Continuous Update Project Report: Diet, Nutrition, Physical Activity and
Colorectal Cancer; 2017.
10. World Cancer Research Fund/American Institute for Cancer Research.
Continuous Update Project Report: Diet, Nutrition, Physical Activity, and Stomach
Cancer; 2014.

190
11. Kyu HH, Bachman VF, Alexander LT, Mumford JE, Afshin A, Estep K,
Veerman JL, Delwiche K, Iannarone ML, Moyer ML, Cercy K, Vos T, Murray CJ,
Forouzanfar MH. Physical activity and risk of breast cancer, colon cancer, diabetes,
ischemic heart disease, and ischemic stroke events: systematic review and dose-
response meta-analysis for the Global Burden of Disease Study 2013. BMJ.
2016;354:i3857.
12. World Cancer Research Fund/American Institute for Cancer Research.
Continuous Update Project Report: Diet, Nutrition, Physical Activity and Breast
Cancer; 2017.
13. World Cancer Research Fund/American Institute for Cancer Research.
Continuous Update Project Report: Food, Nutrition, Physical Activity, and the
Prevention of Endometrial Cancer; 2013.
14. Renehan AG, Tyson M, Egger M, Heller RF, Zwahlen M. Body-mass index and
incidence of cancer: a systematic review and meta-analysis of prospective observational
studies. Lancet. 2008;371:569-78.
15. World Cancer Research Fund/American Institute for Cancer Research.
Continuous Update Project Report: Diet, Nutrition, Physical Activity and Liver Cancer;
2015.
16. Lauby-Secretan B, Scoccianti C, Loomis D, Grosse Y, Bianchini F, Straif K,
International Agency for Research on Cancer Handbook Working G. Body Fatness and
Cancer--Viewpoint of the IARC Working Group. N Engl J Med. 2016;375:794-8.
17. World Cancer Research Fund/American Institute for Cancer Research.
Continuous Update Project Report: Food, Nutrition, Physical Activity, and the
Prevention of Ovarian Cancer; 2014.
18. World Cancer Research Fund/American Institute for Cancer Research.
Continuous Update Project Report: Food, Nutrition, Physical Activity, and the
Prevention of Pancreatic Cancer; 2012.
19. World Cancer Research Fund/American Institute for Cancer Research.
Continuous Update Project Report: Diet, Nutrition, Physical Activity and Prostate
Cancer; 2018.

191
Table S4 - Proportions cancer subtypes in Brazil, by sex
Fraction (%) of cancer site
Cancer site Source Men Women
Breast (postmenopausal) GLOBOCAN 2012[1] – 81 Colon Cancer in Five Continents Volume X[2] 60 60 Rectum Cancer in Five Continents Volume X[2] 40 40
Esophageal adenocarcinoma Cancer in Five Continents Volume X[2, 3] 19 22 Esophagus Squamous Cell Carcinoma Cancer in Five Continents Volume X[2, 3] 81 78
Prostate (advanced stage) Hospital Cancer Registry of the State of São Paulo[4] 27 – Stomach cardia Cancer in Five Continents Volume X[2, 5] 33 19 Stomach non-cardia Cancer in Five Continents Volume X[2, 5] 67 81
REFERENCES
1. Ferlay J SI, Ervik M, Dikshit R, Eser S, Mathers C, Rebelo M, Parkin DM, Forman D, Bray, F. GLOBOCAN 2012 v1.0, Cancer
Incidence and Mortality Worldwide: IARC CancerBase No. 11 [Internet]. In. Lyon, France: International Agency for Research on Cancer;
2013.
2. Forman D, Bray F, Brewster DH, Gombe Mbalawa C, Kohler B, Piñeros M, Steliarova-Foucher E, Swaminathan R. Cancer
Incidence in Five Continents, Vol. X. IARC Scientific Publications No. 164. Lyon: IARC; 2013.
3. Arnold M, Soerjomataram I, Ferlay J, Forman D. Global incidence of oesophageal cancer by histological subtype in 2012. Gut
2015; 64: 381-387.
4. Hospital Cancer Registry of the State of São Paulo. Sao Paulo: Fundação Oncocentro de São Paulo; 2012.
5. Colquhoun A, Arnold M, Ferlay J, Goodman KJ, Forman D, Soerjomataram I. Global patterns of cardia and non-cardia gastric
cancer incidence in 2012. Gut. 2015;64:1881-8.

192
Table S5 - Proportion and number of cancer cases attributable to plausible reduction in lifestyle risk factors in Brazil in 2012, by
exposure, sex, and cancer site Men Women Both
Exposure/
cancer site Number of cases
PIF
(%) Attributable cases Number of cases
PIF
(%) Attributable cases Number of cases
PIF
(%) Attributable cases
Smoking
Larynx 6,281 17.2 1,083 850 14.5 123 7,131 16.9 1,206
Lung 20,229 12.6 2,545 14,041 10.9 1,524 34,270 11.9 4,069
Oral cavity/pharynx 11,901 10.7 1,275 4,653 5.6 260 16,554 9.3 1,535
Esophagus 9,713 3.5 337 3,191 5.0 160 12,904 3.9 497
Bladder 7,033 3.6 251 2,869 2.9 83 9,902 3.4 334
Liver 5,726 3.0 174 3,870 1.9 73 9,596 2.6 247
Pancreas 4,640 2.9 133 5,222 1.8 93 9,862 2.3 226
Stomach 12,606 1.6 196 7,078 1.6 116 19,684 1.6 312
Cervix - - - 18,503 1.2 213 18,503 1.2 213
Colorectum 16,359 0.9 145 17,579 1.0 181 33,938 1.0 326
Kidney 3,611 1.3 46 2,307 0.0 0 5,918 0.8 46
High Body mass index
Corpus uteri - - - 6,366 5.9 375 6,366 5.9 375
Kidney 3,611 3.8 138 2,307 3.6 83 5,918 3.7 221
Gallbladder 1,456 3.1 45 2,593 3.3 85 4,049 3.2 130
Liver 5,726 2.9 163 3,870 2.8 109 9,596 2.8 272
Colorectum* 16,359 2.3 383 17,579 1.2 206 33,938 1.7 589
Pancreas 4,640 1.8 85 5,222 1.4 74 9,862 1.6 158
Breast - - - 67,307 1.5 994 67,307 1.5 994
Multiple myeloma 1,866 1.6 29 1,642 1.0 16 3,508 1.3 46
Esophagus 9,713 1.3 122 3,191 1.3 40 12,904 1.3 162
Thyroid 2,576 2.3 60 11,210 0.7 78 13,786 1.0 138
Stomach 12,606 1.0 128 7,078 0.6 41 19,684 0.9 169
Ovary - - - 5,745 0.9 49 5,745 0.9 49
Prostate 72,536 0.3 223 - - - 72,536 0.3 223
Alcohol consumption
Oral cavity/pharynx 11,901 3.3 389 4,653 0.9 40 16,554 2.6 429
Esophagus* 9,713 2.0 191 3,191 0.9 27 12,904 1.7 218
Larynx 6,281 1.7 105 850 0.0 0 7,131 1.5 105

193
Gallbladder 1,456 2.0 30 2,593 0.4 10 4,049 1.0 39
Liver 5,726 0.8 45 3,870 0.6 23 9,596 0.7 67
Colorectum 16,359 0.5 76 17,579 0.0 8 33,938 0.2 84
Breast - - - 67,307 0.1 96 67,307 0.1 96
Pancreas 4,640 0.1 6 5,222 0.0 2 9,862 0.1 8
Lack of Physical activity
Colorectum* 16,359 3.4 559 17,579 3.7 655 33,938 3.6 1,214
Breast* - - - 67,307 1.7 1,113 67,307 1.7 1,113
Low Fruits and vegetables consumption
Larynx 6,281 3.1 195 850 2.1 18 7,131 3.0 213
Oral cavity/pharynx 11,901 3.2 379 4653 2.1 99 16,554 2.9 478
Lung 20,229 2.1 417 14,041 1.6 219 34,270 1.9 635
Low dietary calcium consumption
Colorectum 16,359 0.7 119 17,579 0.6 106 33,938 0.7 225
Low dietary fiber consumption
Colorectum 16,359 1.6 267 17,579 0.8 139 33,938 1.2 405
Processed meat consumption
Stomach 12,606 3.5 445 7,078 4.2 295 19,684 3.8 740
Colorectum 16,359 3.7 613 17,579 3.5 611 33,938 3.6 1224
Red meat consumption
Colorectum 16,359 1.4 221 17,579 1.2 204 33,938 1.3 425
Passive smoking
Lung 20,229 1.9 375 14,041 1.8 255 34,270 1.8 630

194
Table S6 - Proportion and number of cancer deaths attributable to reduction in lifestyle risk factors in Brazil in 2012, by exposure,
sex, and cancer site Men Women Both
Exposure/cancer site Cancer
deaths
PAF
(%)
Attributable
deaths Cancer
deaths
PAF
(%)
Attributable
deaths Cancer
deaths
PAF
(%)
Attributable
deaths
Smoking
Larynx 3,780 17.1 645 552 14.1 78 4,332 16.7 722
Lung 14,246 12.4 1,764 9,208 10.6 977 23,454 11.7 2,741
Oral cavity/pharynx 5,510 10.6 583 1,512 5.6 85 7,022 9.5 668
Nasal cavity/paranasal sinus 115 10.0 12 71 5.6 4 186 8.3 16
Esophagus 5,983 3.4 204 1,760 5.0 88 7,743 3.8 291
Bladder 2,231 3.3 74 1,061 2.5 27 3,292 3.0 100
Liver 4,986 3.0 148 3,761 1.8 69 8,747 2.5 217
Pancreas 4,014 2.8 112 4,201 1.7 72 8,215 2.2 184
Stomach 8,708 1.5 132 4,984 1.6 77 13,692 1.5 210
Cervix - - - 5,258 1.2 61 5,258 1.2 61
Myeloid leukemia 1,333 2.0 27 1,277 0.0 0 2,610 1.0 27
Colorectum 8,533 0.9 75 9,112 1.0 94 17,645 1.0 169
Kidney 1,694 1.2 20 1,028 0.0 0 2,722 0.7 20
High body mass index
Esophagus* 5,983 6.6 395 1,760 5.7 101 7,743 6.4 496
Corpus uteri - - - 3,416 5.9 201 3,416 5.9 201
Kidney 1,694 3.8 64 1,028 3.6 37 2,722 3.7 102
Gallbladder 233 3.1 7 784 3.3 26 1,017 3.2 33
Stomach* 8,708 3.1 268 4,984 3.0 152 13,692 3.1 419
Liver 4,986 2.8 142 3,761 2.8 106 8,747 2.8 248
Pancreas 4,014 1.8 73 4,201 1.4 59 8,215 1.6 132
Breast - - - 13,587 1.6 212 13,587 1.6 212
Colorectum* 8,533 1.8 156 9,112 0.9 86 17,645 1.4 242
Multiple myeloma 1,212 1.6 19 1,190 1.0 12 2,402 1.3 31
Thyroid 176 2.3 4 423 0.7 3 599 1.2 7
Prostate* 13,344 1.1 147 - - - 13,344 1.1 147
Ovary - - - 3,106 0.9 27 3,106 0.9 27
Alcohol consumption

195
Oral cavity/pharynx 5,510 3.2 176 1,512 0.8 13 7,022 2.7 188
Esophagus* 5,983 2.4 142 1,760 1.1 19 7,743 2.1 162
Larynx 3,780 1.6 62 552 0.0 0 4,332 1.4 61
Gallbladder 233 2.0 5 784 0.4 3 1,017 0.7 7
Liver 4,986 0.8 38 3,761 0.5 21 8,747 0.7 58
Colorectum 8,533 0.5 39 9,112 0.0 4 17,645 0.2 43
Breast - - - 13,587 0.1 17 13,587 0.1 17
Pancreas 4,014 0.1 5 4,201 0.0 1 8,215 0.1 6
Lack of physical activity
Colorectum 8,533 3.0 258 9,112 3.4 314 17,645 3.2 571
Breast - - - 13,587 1.8 247 13,587 1.8 247
Low fruits and vegetables consumption
Larynx 3,780 3.1 117 552 2.1 11 4,332 3.0 128
Oral cavity/pharynx 5,510 3.1 173 1512 2.1 32 7,022 2.9 205
Lung 14,246 2.1 292 9,208 1.5 142 23,454 1.9 434
Low dietary calcium consumption
Colorectum 8,533 0.8 65 9,112 0.7 60 17,645 0.7 125
Low dietary fiber consumption
Colorectum 8,533 1.6 139 9,112 0.8 76 17,645 1.2 216
Processed meat consumption
Stomach* 8,708 5.2 453 4,984 5.2 259 13,692 5.2 712
Colorectum 8,533 3.8 321 9,112 3.8 344 17,645 3.8 665
Red meat consumption
Colorectum 8,533 1.3 115 9,112 1.3 116 17,645 1.3 230
Passive smoking
Lung 14,246 0.5 67 9,208 0.5 49 23,454 0.5 116
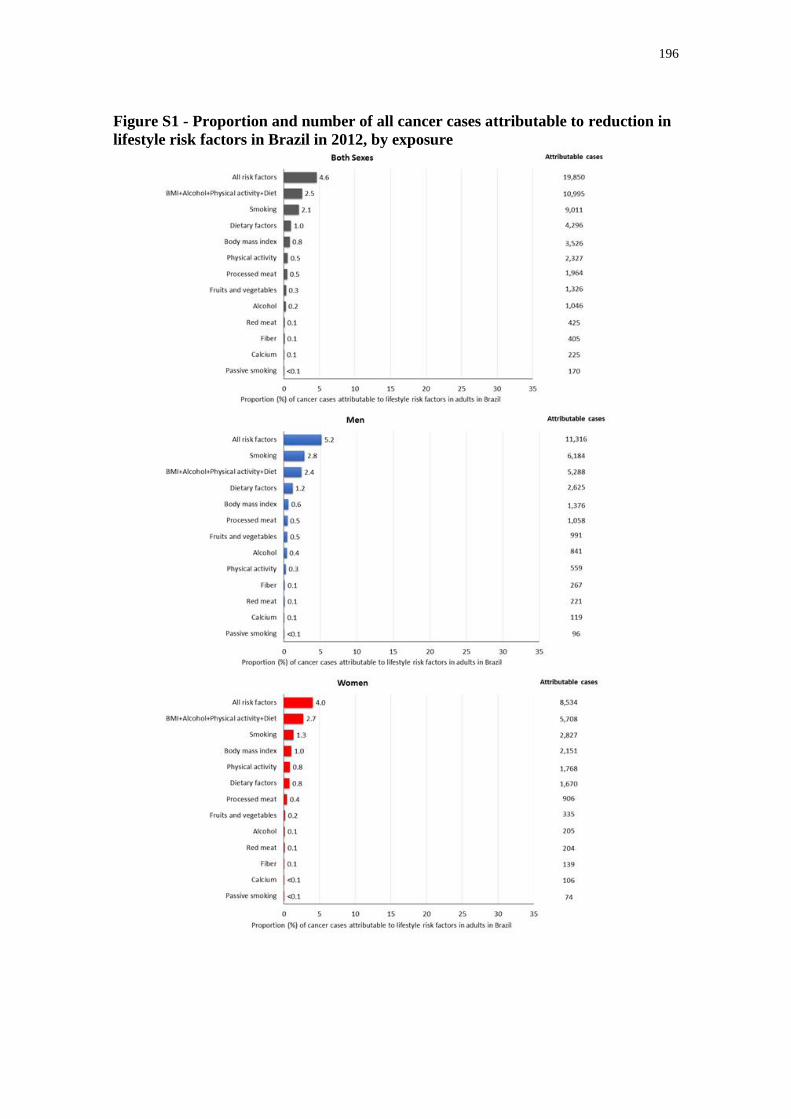
196
Figure S1 - Proportion and number of all cancer cases attributable to reduction in
lifestyle risk factors in Brazil in 2012, by exposure

197
Figure S2 - Proportion and number of cancer cases and deaths attributable to
reduction in lifestyle risk factors in Brazil in 2012, by cancer site

198
Figure S3 - Proportion and number of total cancer deaths attributable to reduction
in lifestyle risk factors in Brazil in 2012, by exposure and sex

199
8. CONSIDERAÇÕES FINAIS
All scientific work is incomplete - whether it be observational or
experimental. All scientific work is liable to be upset or modified
by advancing knowledge. That does not confer upon us a
freedom to ignore the knowledge we already have, or to
postpone the action that it appears to demand at a given time.
(Hill, 1965: p. 300).
8.1. EVIDÊNCIAS EPIDEMIOLÓGICAS SOBRE ATIVIDADE FÍSICA E CÂNCER
A investigação do efeito putativo da atividade física na redução do risco do
câncer se iniciou, ao que tudo indica, nos idos de 1920. Desde então, cada linha de
evidência (Munafò; Davey Smith, 2018) tem oferecido indícios, por vezes, favoráveis à
hipótese de causalidade, outras, no entanto, sugerindo efeito nulo ou associações
espúrias oriundas de artefatos metodológicos e analíticos que resultaram em viés nos
resultados. É a partir desse corpo de evidência, cinza, incompleto, passível de erro e
mudança com o avanço do conhecimento que deduzimos causalidade, com maior ou
menor confiança, mas nunca como prova definitiva. O desafio da inferência causal está,
portanto, em “to capture some objective truths about the material world in which we
live, and any theory of inference should ideally be evaluated by how well it leads us to
these truths”(Rothman et al., 2008, p.22). Diante do exposto, apresento minha avaliação
do corpo da evidência sobre atividade física e câncer à luz dos estudos conduzidos nessa
pesquisa.
O conjunto de artigos apresentados nessa tese reforça a hipótese de que a
atividade física praticada de maneira regular ao longo da vida pode reduzir o risco de
alguns tipos de câncer na população. No Capítulo 3, avaliamos a associação entre
atividade física e 22 tipos de câncer utilizando resultados de 541 estudos que, em
conjunto, analisaram mais de 700 mil casos e mortes por câncer. Para examinar o
resultado desses estudos, utilizamos uma miríade de análises e critérios estatísticos
aplicados à síntese da evidência e avaliação de incerteza e viés na literatura. Evidências
epidemiológicas convincentes de estudos realizados com adultos de meia idade e idosos
que sugerem associação causal entre atividade física e redução do risco de câncer de

200
cólon e de mama pós-menopausa. Esses resultados são semelhantes às conclusões da
IARC e da WCRF, que, por sua vez, utilizam critérios próprios para avaliação da
evidência (IARC, 2002; WCRF, 2018).
Ainda não é claro, no entanto, se atividade física no início da vida (infância e
adolescência) produz semelhante efeito protetor nesses tipos de câncer (cólon e mama).
Estudos epidemiológicos que avaliaram essas associações são escassos na literatura.
Nossos resultados, no entanto, oferecem algumas perspectivas iniciais relativamente ao
câncer de cólon (Capítulo 4). Encontramos menor risco de adenoma colorretal,
especialmente adenomas avançados, que apresentam maior probabilidade de progredir
para câncer, em mulheres que praticaram ≥72 MET-h/semana do que aquelas que
praticavam <21 MET-h/semana. Outro resultado sugestivo foi a associação encontrada
entre atividade física ao longo da vida (da adolescência à fase adulta) e o risco de
adenomas. Mulheres que se mantiveram fisicamente ativas durante a adolescência e a
fase adulta apresentam menor risco de adenomas em comparação àquelas que foram
menos fisicamente ativas em um dos, ou em ambos os, períodos.
No tocante ao câncer de mama, resultados de um estudo anterior (também com
dados do Nurses’ Health Study II) sugeriu efeito protetor da atividade realizada em
estágios iniciais da vida (Maruti et al., 2008). Mulheres com maior nível de atividade
física (≥72 MET-h/semana) dos 12 aos 22 anos apresentaram menor risco de câncer de
mama pré-menopausa relativamente às mulheres com menor nível de atividade física
(<21 MET-h/semana) no mesmo período. Também se observou menor risco de câncer
de mama em mulheres que praticaram mais atividade física (≥ 39 MET-h/semana) dos
12 aos 55 anos em comparação àquelas que praticaram menos atividade física (<21
MET-h/semana) no mesmo período (Maruti et al., 2008).
Em conjunto, esses resultados sugerem que atividade física no início da vida
também pode reduzir o risco de câncer de cólon e mama, atuando, possivelmente, em
estágios iniciais da carcinogênese. Esses achados, se confirmados causais, podem
fornecer informações úteis sobre a importância de estímulos à prática de atividade física
no início da vida para redução do risco de câncer na população.
O efeito protetor da atividade física em outros tipos de câncer (bexiga,
endométrio, esôfago, estômago, fígado, glioma, leucemia, linfomas, meningioma,
mieloma múltiplo, ovário, pâncreas, próstata, pulmão, reto, rim, tireoide, vesícula biliar)
também é possível de ser genuíno. Não obstante, os resultados disponíveis na literatura

201
epidemiológica são menos consistentes, com possibilidade de resultados falso positivos
e indícios de heterogeneidade e viés (Capítulo 3). Estudos de coorte que avaliaram
associação entre atividade física e esses tipos de câncer, comparativamente aos canceres
de cólon e mama, são menos frequentes na literatura, além de menores em relação ao
tamanho da amostra e número de casos estudados, resultando em menor precisão nas
estimativas. Por exemplo, quando adotamos valores mais rígidos de significância
estatística (P<10-3) de modo a reduzir a probabilidade de resultados falso positivos e
considerar, de alguma maneira, a “precisão espúria” de meta-analises de estudos
observacionais (Egger et al., 1998), mantiveram-se apenas as associações entre
atividade física e os cânceres de cólon, mama pós-menopausa, endométrio e pulmão.
Avaliar a totalidade da evidência sobre determinada pergunta de pesquisa é
essencial para inferência causal. No entanto, encontramos indícios de viés na literatura
epidemiológica de alguns tipos de câncer (pulmão, estômago e pâncreas). Evidência de
efeito de estudos pequenos e excesso de significância pode ser reflexo de viés na
literatura, erro aleatório e/ou heterogeneidade entre os estudos (Sterne et al., 2011). A
ocorrência de viés na literatura pode ter diversas causas. Uma explicação possível seria
o favorecimento à disseminação e publicação de resultados que sugerem um efeito
causal da atividade física na redução do risco do câncer. Diferentes atores envolvidos no
processo de produção de conhecimento científico, como pesquisadores, revisores e
editores, poderiam influenciar a ocorrência de viés de publicação (Dickersin, 1990).
Consistência nos achados de estudos realizados em diferentes populações e
delineamentos metodológicos é desejável para inferir causalidade (Hill, 1965).
Entretanto, encontramos evidência de heterogeneidade entre estudos (I2>50% e
intervalos de predição incluindo a nulidade) para a associação entre atividade física e
alguns tipos de câncer (pulmão, estômago, bexiga, mieloma múltiplo e ovário). Esses
resultados devem ser interpretados com cautela. Evidência estatística de
heterogeneidade entre os resultados dos estudos pode ser de ordem clínica/biológica
e/ou metodológica (Thompson, 1994; Higgins et al., 2003). Por exemplo,
heterogeneidade entre estudos pode ser resultante de uma variação real no efeito da
atividade física em câncer, como também de diferentes graus de confundimento, vieses
(de informação e seleção), intensidade e variabilidade da exposição, prevalência de
modificadores de efeito, ou mesmo ao acaso (Szklo; Nieto, 2014).

202
8.2. UMA VISÃO INTEGRATIVA SOBRE O ATIVIDADE FÍSICA, ADIPOSIDADE
E O RISCO DE CÂNCER
O fato dos estudos epidemiológicos sobre atividade física e diversos tipos de
câncer apresentarem resultados pouco consistentes na literatura perpassa, além dos
fatores descritos anteriormente, pela complexa interdependência da atividade física,
adiposidade e o risco desses cânceres na população. Nesse contexto, a visão integrativa
da literatura epidemiológica e dos mecanismos biológicos da doença, proposta por
Giovannucci (2018), pode auxiliar no entendimento dessas relações e indicar elementos
complementares para interpretação e avaliação da evidência.
Primeiramente, é importante considerar a relação entre atividade física e
adiposidade. Essa relação pode ser compreendida considerando, pelo menos, três
abordagens metodológicas:
Comparação ecológica da distribuição da atividade física e do IMC entre
populações ao longo da experiência humana: Em populações modernas (definidas
relativamente aos modos de viver e das atividades cotidianas), o nível de atividade física
é baixo e as atividades são realizadas majoritariamente no (pouco) tempo de lazer; as
atividades sedentárias e uso de tecnologias são ubíquas; o IMC é uma boa medida
populacional de adiposidade e apresenta altos níveis e variabilidade na população.
Contrariamente, populações tradicionais apresentam altos níveis de atividade física,
realizada majoritariamente nas atividades ocupacionais, de transporte e domésticas; uso
de tecnologias e atividades sedentárias estão menos presentes no cotidiano; o IMC é
baixo e tem pouca variabilidade. Essas comparações ecológicas sugerem uma relação
entre atividade física e IMC na população (Giovannucci, 2018).
Efeito da atividade física na adiposidade entre indivíduos em uma mesma
população: Ensaios clínicos randomizados de 6 a 12 meses de duração sugerem que
atividade física pode auxiliar na manutenção do peso corporal (Donnelly et al., 2009).
Intervenções de longa duração são difíceis de conduzir, mas é plausível que grupos de
indivíduos com altos níveis de atividade física ao longo dos anos/décadas ganhem
menos peso comparados àqueles com menor nível de atividade física (Giovannucci,
2018).

203
Efeito da atividade física na redução da gordura visceral: não há evidência
consistente sobre o efeito da atividade física na redução do peso corporal (Donnelly et
al., 2009). No entanto, a atividade física pode reduzir a gordura visceral, um forte
preditor de biomarcadores relacionados ao risco de câncer, outras doenças crônicas não
transmissíveis e mortalidade, a despeito da ausência de perda de peso (Verheggen et al.,
2016; Giovannucci, 2018).
Diante desses resultados e observações teóricas, é biologicamente plausível
inferir que a atividade física poderia reduzir o risco dos tipos de câncer relacionados
com adiposidade. Atualmente, IARC e WCRF concluem que há evidências
convincentes de que adiposidade está associada com o aumento no risco de pelo menos
13 tipos de câncer: estômago, pâncreas, vesícula biliar, fígado, colorretal, mama após
menopausa, ovário, endométrio, próstata (estádio avançado), rim, tireoide, mieloma
múltiplo e adenocarcinoma de esôfago (Lauby-Secretan et al., 2016; WCRF, 2018).
A aparente inconsistência de resultados de estudos epidemiológicos sobre
atividade física e esses 13 tipos de câncer (exceto cólon e mama pós-menopausa) deve
estar relacionada com a distribuição da atividade física e da adiposidade na população.
Estudos epidemiológicos sobre atividade física e câncer incluem predominantemente
populações modernas. Nesse contexto em que a grande parte da população passa a
maior parte do tempo em atividades sedentárias, a atividade física aparenta ser um fator
irrelevante, enquanto outros fatores se sobressaem, para explicar a variabilidade do IMC
na população. Consequentemente, espera-se que os 13 tipos de câncer estejam mais
fortemente associados com o IMC do que com a atividade física. Em populações
tradicionais, por outro lado, esses tipos de câncer estariam mais fortemente associados
com a atividade física do que com o IMC - devido ao baixo nível e variabilidade do
IMC (Giovannucci, 2018).
De fato, essas observações convergem com o conceito de “força de associação
de um fator de risco causal” descrito por Rothman (1976) em seu modelo de causas
componentes e causas suficientes:
204
A component cause which requires, to complete the sufficient
cause, other components with low prevalence is thereby a
“weak” (component) cause. The presence of such a component
cause modifies the probability of the outcome only slightly, from
zero to an average value just slightly greater than zero,
reflecting the rarity of the complementary component cause. On
the other hand, a component cause which requires, to complete
the sufficient cause, other components which are nearly
ubiquitous is a “strong” (component) cause. In epidemiologic
terms, a weak cause confers only a small increment in disease
risk, whereas a strong cause will increase disease risk
substantially (Rothman, 1976, p. 589-590).
Se essas observações estiverem corretas, espera-se que estudos com tamanho de
amostra suficientemente grande para capturar alta variabilidade da atividade física entre
os indivíduos da população consigam identificar associações com os 13 tipos de câncer.
Com efeito, o maior estudo epidemiológico sobre atividade física e câncer conduzido
até o momento reuniu 1,44 milhão de participantes e 187 mil casos de câncer de 12
coortes realizadas nos EUA e Europa. Nesse estudo, a atividade física esteve associada
com 17 tipos de câncer, dentre os quais, os 13 tipos associados à adiposidade (Moore et
al., 2016). As associações entre atividade física e os demais tipos de câncer (pulmão,
esôfago, bexiga e cabeça e pescoço) sugeridas nesse estudo, possivelmente, devem-se a
confundimento residual por tabagismo, uma vez que a análise restrita a pessoas que
nunca fumaram mostrou associação nula (Moore et al., 2016). Apesar dos resultados
desse estudo não oferecerem respostas definitivas, o forte padrão encontrado nas
associações entre atividade física, IMC e os 13 tipos de câncer reforçam a hipótese de
causalidade (Giovannucci, 2018).
Conhecimento sobre mecanismos biológicos que operam nas associações entre
atividade física, adiposidade e câncer também pode fornecer informações úteis para essa
triangulação de evidências (Lawlor et al., 2016; Munafò; Davey Smith, 2018;
Giovannucci, 2018). No capítulo 5, evidenciamos que atividade física está associada
com menor concentração de biomarcadores inflamatórios (proteína C-reativa, IL-6,
TNF-αR2) e de resposta à insulina (peptídeo C e razão triglicerídeos/lipoproteína de alta
densidade) relacionados ao risco de câncer. Comparando grupos extremos de atividade
física (≥63 MET-h/semana v.s. 0 a 9 MET-h/semana), houve uma diferença relativa de
7% a 32% na concentração desses biomarcadores favorável ao grupo com maior nível
de atividade física. Considerando o mesmo volume de atividade física (MET-h/semana),

205
encontramos uma otimização na diferença relativa da concentração desses
biomarcadores em participantes que realizaram atividade física aeróbica e de força
combinadas comparativamente aos que realizaram apenas atividade física aeróbica. Não
houve benefícios adicionais na concentração desses biomarcadores em participantes que
realizaram atividades de intensidade moderada e vigorosa comparativamente àqueles
que realizaram apenas atividades moderadas.
Esses resultados corroboram com a hipótese de que a atividade física poderia
reduzir os 13 tipos de câncer associados à adiposidade. A concentração desses
biomarcadores está fortemente associada à adiposidade, sugerindo, portanto, que ambos
- atividade física e obesidade - operam por mecanismos carcinogênicos semelhantes.
Em populações modernas, espera-se que esses biomarcadores estejam mais fortemente
associados com a adiposidade do que com a atividade física, padrão semelhante ao
observado em relação ao risco dos 13 tipos de câncer (Giovannucci, 2018). De fato,
encontramos maior diferença nesses biomarcadores quando comparamos grupos com
diferentes níveis de IMC (do que atividade física). No entanto, vale ressaltar que as
associações entre atividade física e os biomarcadores se mantiveram após ajuste por
IMC, sugerindo existência de efeitos (indiretos) independentes da mudança no IMC (ex:
gordura visceral).
A integração da evidência de estudos (i) epidemiológicos sobre atividade física,
adiposidade e câncer; (ii) sobre padrões epidemiológicos da distribuição da atividade
física e da adiposidade ao longo da experiência humana (populações tradicionais v.s.
populações modernas); (iii) sobre o efeito da atividade física na adiposidade em
indivíduos de uma mesma população; (iv) e sobre mecanismos biológicos envolvidos
nas associações entre atividade física, adiposidade e câncer, sugerem que atividade
física poderia reduzir o risco de até 13 tipos de câncer na população (Giovannucci,
2018).
8.3. PERSPECTIVAS PARA PREVENÇÃO DO CÂNCER NO BRASIL
Por mais que evidências fortes e convincentes sobre causalidade sejam
desejáveis antes de decidirmos influenciar a vida das pessoas e da coletividade, isso não
significa, necessariamente, que precisamos “cruzar todos os t’s e responder a todas as

206
críticas antes de agirmos” (Hill, 1965). Decisões clínicas e em saúde pública precisam
ser tomadas.
Com efeito, a epidemiologia tem a missão de informar e auxiliar na tomada de
decisão de políticas públicas e intervenções voltadas à melhoria da saúde da população
(Galea, 2014). Foi com esse intuito que procuramos traduzir os conhecimentos descritos
na literatura sobre o efeito da atividade física na redução do risco de câncer em
informações potencialmente úteis para planejamento de intervenções e políticas
públicas voltadas à prevenção de câncer no Brasil. Para tal, no capítulo 6, estimamos a
preventabilidade de câncer mediante o aumento da atividade física. Consideramos
nessas análises que atividade física poderia reduzir apenas o risco do câncer de cólon e
de mama pós-menopausa, dado que os resultados para esses tipos de câncer são mais
consistentes na literatura e o formato da curva dose-resposta conhecido. A partir dessas
informações, e de dados da distribuição da atividade física na população, foi possível
estimar a proporção e o número de casos de câncer de câncer de mama pós-menopausa
e cólon que poderiam ser evitados mediante o aumento do nível de atividade física no
Brasil.
Mostramos que o aumento da atividade física pode reduzir até 10 mil casos de
câncer por ano (2,4% do total de casos de câncer, excluindo pele não melanoma; 12.3%
do câncer de mama pós-menopausa; 6% do câncer de cólon) mediante aumento
contrafactual de ≥8000 MET-minutos/semana (aproximadamente 5 horas de atividade
física de intensidade moderada por dia!). É evidente que em populações modernas esse
nível de atividade física é demasiado alto e, portanto, improvável de ser atingido pela
maioria da população. De fato, dados da Pesquisa Nacional de Saúde mostram que
apenas 6% da população brasileira atinge esse nível de atividade física. Nesse sentido,
as análises considerando outros cenários contrafactuais foram úteis para estimar o
impacto de aumentos plausíveis no nível de atividade física na prevenção dos casos de
câncer. Por exemplo, se toda a população atingisse a recomendação de 150 minutos de
atividade física por semana, poderíamos prevenir aproximadamente 2250 casos de
câncer por ano. Esses casos correspondem a 1,7% do câncer de mama pós-menopausa e
6% do câncer de cólon. Em geral, outros cenários contrafactuais indicaram um potencial
modesto de prevenção da doença, sugerindo, portanto, que altos níveis de atividade
física são necessários para obter um impacto maior nos casos de câncer de mama e
cólon - possivelmente refletindo a interrelação entre atividade física, adiposidade e risco

207
de câncer descrita anteriormente (Giovannucci, 2018). Por fim, os resultados
apresentados por sexo e unidades federativas permitiu evidenciar populações que
potencialmente se beneficiaram mais com o aumento da atividade física. O número de
casos de câncer preveníveis em mulheres, por exemplo, foi aproximadamente 5 vezes
maior do que em homens. Também encontramos maior preventabilidade de câncer em
São Paulo, Rio de Janeiro e Distrito Federal, comparado às demais unidades federativas.
É importante ressaltar que estas estimativas consideraram apenas a redução no risco do
câncer de cólon e de mama pós-menopausa associada à prática de atividade física em
adultos. Portanto, esses resultados podem estar subestimados caso a associação entre
atividade física durante a adolescência e a redução no risco de câncer de cólon (Capítulo
4), e a relação entre atividade física e outros tipos de câncer, se confirmarem causais.
Comparada a outros fatores de risco relacionados ao estilo de vida (tabagismo,
consumo de álcool, alimentação não saudável, excesso de peso/obesidade), a atividade
física apresenta um menor preventabilidade de câncer. A eliminação do tabagismo (15%
da população brasileira é fumante atualmente), por exemplo, poderia evitar 67 mil casos
por ano no Brasil (15% do total de casos de câncer diagnosticados, excluindo pele não
melanoma), equivalente a 6 vezes o número de casos que poderiam ser evitados
mediante o aumento da atividade física (≥8000 MET-minutos/semana). Outros fatores
como alimentação não saudável, IMC alto e consumo de álcool também se mostraram
mais importantes para prevenção de câncer. Esses resultados são importantes na medida
em que recursos direcionados ao controle do câncer são finitos, e prioridades precisam
ser estabelecidas.
Não obstante, parece-me que a maneira mais realista e efetiva de controle do
câncer no nosso país perpassa, inevitavelmente, pela priorização e incentivo da
prevenção primária, de modo que a redução de todos fatores listados acima, indica ser o
caminho mais próspero. No capítulo 7, estimamos que, aproximadamente, 27% dos
casos de câncer e um terço das mortes por câncer poderiam ser evitados por ano
mediante a eliminação desses fatores de risco no Brasil. Esses resultados são
expressivos dado que outras formas de prevenção/ detecção precoce do câncer, como
algumas estratégias de rastreamento, apresentam efeito limitado (Gøtzsche, 2015). É
improvável, no entanto, que consigamos prevenir um número significativo de casos e
mortes por câncer com estratégias de prevenção primária voltadas exclusivamente aos
indivíduos, ao invés de populações. O enfrentamento dos determinantes sociais da saúde

208
- condições sociais em que indivíduos nascem, crescem, trabalham e envelhecem - é
imperativo nesse sentido (Vineis; Wild, 2014). No tocante à atividade física, por
exemplo, mudanças no ambiente construído de cidades (calçadas, ciclovias e parques),
escolas, e locais de trabalho podem aumentar as oportunidades de realização de
atividades físicas no cotidiano de maneira sustentável, segura, conveniente e prazerosa
(Rezende; Rey-López, 2015).
8.4. UMA VISÃO OTIMISTA PARA O DESAFIO DO CONTROLE DO CÂNCER
Parafraseando Richard Doll (1994): “Death (from cancer) in old age is
inevitable, but before old age is not”. É evitável, pois décadas de pesquisas propiciaram
conhecer as causas do câncer na população – ao que tudo indica, a falta de atividade
física parece ser uma delas. Nesse contexto, sem dúvida alguma, a epidemiologia
exerceu um papel de protagonismo. Há certamente outras causas, ainda não
identificadas, e quantificações de efeitos causais incorretas, que precisam ser corrigidas.
O mundo continuará se transformando, as sociedades mudarão seus modos de viver, e
novas ameaças colocarão em risco a saúde da população. Por essas razões, a
epidemiologia continuará sendo necessária. No entanto, temos a possibilidade de
utilizar as informações obtidas até o momento para tomar decisões baseadas em
evidência e propor ações que reduzam o risco de câncer na população. O Estado,
instituições acadêmicas e a sociedade civil, indústria, mídia, cientistas, profissionais de
saúde e diversos outros atores devem fazer parte da solução. O desafio é enorme, mas
nunca estivemos tão preparados.
8.5. REFERÊNCIAS
Dickersin K. The existence of publication bias and risk factors for its occurrence.
JAMA. 1990;263:1385-89.
Doll R. Foreword. In: Peto R, Lopez AD, Boreham J, Thun M. Mortality from smoking
in developed countries 1950–2000. Oxford: Oxford University Press; 1994.
Donnelly JE, Blair SN, Jakicic JM, Manore MM, Rankin JW, Smith BK; American
College of Sports Medicine. American College of Sports Medicine Position Stand.
Appropriate physical activity intervention strategies for weight loss and prevention of
weight regain for adults. Med Sci Sports Exerc. 2009;41:459-71.

209
Egger M, Schneider M, Davey Smith G. Spurious precision? Meta-analysis of
observational studies. BMJ. 1998;316:140-4.
Galea S. An argument for a consequentialist epidemiology. Am J Epidemiol.
2013;178:1185-91.
Giovannucci E. An Integrative Approach for Deciphering the Causal Associations of
Physical Activity and Cancer Risk: The Role of Adiposity. J Natl Cancer Inst.
2018;110:935-941.
Gøtzsche PC. Commentary: Screening: a seductive paradigm that has generally failed
us. Int J Epidemiol. 2015;44:278-80.
Higgins JP, Thompson SG, Deeks JJ, Altman DG. Measuring inconsistency in meta-
analyses. BMJ. 2003;327:557–60.
Hill AB. The environment and disease: association or causation? J R Soc Med.
1965;108:32-7.
International Agency for Research on Cancer (IARC). IARC Handbook of Cancer
Prevention. Volume 6. Weight control and physical activity. Lyon: IARC; 2002.
Lauby-Secretan B, Scoccianti C, Loomis D, Grosse Y, Bianchini F, Straif K,
International Agency for Research on Cancer Handbook Working G. Body Fatness and
Cancer--Viewpoint of the IARC Working Group. N Engl J Med. 2016;375:794-8.
Lawlor DA, Tilling K, Davey Smith G. Triangulation in aetiological epidemiology. Int
J Epidemiol. 2016;45:1866-86.
Maruti SS, Willett WC, Feskanich D, Rosner B, Colditz GA. A prospective study of
age-specific physical activity and premenopausal breast cancer. J Natl Cancer Inst.
2008;100:728-37.
Moore SC, Lee IM, Weiderpass E, Campbell PT, Sampson JN, Kitahara CM, Keadle
SK, Arem H, Berrington de Gonzalez A, Hartge P, Adami HO, Blair CK, Borch KB,
Boyd E, Check DP, Fournier A, Freedman ND, Gunter M, Johannson M, Khaw KT,
Linet MS, Orsini N, Park Y, Riboli E, Robien K, Schairer C, Sesso H, Spriggs M, Van
Dusen R, Wolk A, Matthews CE, Patel AV4. Association of Leisure-Time Physical
Activity With Risk of 26 Types of Cancer in 1.44 Million Adults. JAMA Intern Med.
2016;176:816-25.
Munafò MR, Smith GD. Robust research needs many lines of evidence. Nature.
2018;553:399-401.
Rezende LFM, Rey-López JP. Environmental Interventions Are Needed to Provide
Sustained Physical Activity Changes. Exerc Sport Sci Rev. 2015;43:238.
Rothman KJ. Causes. Am J Epidemiol. 1976;104:587-92.
Rothman KJ, Greenland S, Poole C, Lash TL. Causation and Causal Inference. In:
Rothman KJ, Greeland S, Lash TL. Modern Epidemiology. 3rd edition. Philadelphia:
Lippincott Williams & Wilkins; 2008.

210
Sterne JA, Sutton AJ, Ioannidis JP, Terrin N, Jones DR, Lau J, Carpenter J, Rücker G,
Harbord RM, Schmid CH, Tetzlaff J, Deeks JJ, Peters J, Macaskill P, Schwarzer G,
Duval S, Altman DG, Moher D, Higgins JP. Recommendations for examining and
interpreting funnel plot asymmetry in meta-analyses of randomised controlled trials.
BMJ. 2011;343:d4002.
Szklo M, Nieto J. Defining and assessing heterogeneity of effects: interaction. In: Szklo
M, Nieto J. Epidemiology: Beyond the Basics. 3rd edition. Burlington: Jones & Bartlett
Learning; 2014
Thompson SG. Why sources of heterogeneity in meta-analysis should be investigated.
BMJ. 1994;309:1351-5.
Verheggen RJ, Maessen MF, Green DJ, Hermus AR, Hopman MT, Thijssen DH. A
systematic review and meta-analysis on the effects of exercise training versus
hypocaloric diet: distinct effects on body weight and visceral adipose tissue. Obes Rev.
2016;17:664-90.
Vineis P, Wild CP. Global cancer patterns: causes and prevention. Lancet.
2014;383:549-57.
World Cancer Research Fund/American Institute for Cancer Research. Diet, Nutrition,
Physical Activity and Cancer: a Global Perspective. Continuous Update Project Expert
Reported 2018. Available at: dietandcancerreport.org

APÊNDICE A
Fração atribuível populacional: planejamento de ações de prevenção de doenças
no Brasil
Comentário publicado na Revista de Saúde Pública em 2016, volume 50, páginas 1-6.
Acesso disponível em http://www.ncbi.nlm.nih.gov/pubmed/27305404.
Autores: Leandro Fórnias Machado de Rezende1 e José Eluf Neto1
1 Departamento de Medicina Preventiva, Faculdade de Medicina da Universidade de
São Paulo
RESUMO
Epidemiologia é o estudo da ocorrência, distribuição e determinantes de eventos
relacionados à saúde da população, incluindo a aplicação desse conhecimento para a
prevenção e o controle dos problemas de saúde. Entretanto, estudos epidemiológicos, na
maioria das vezes, têm limitado suas perguntas de pesquisa aos fatores determinantes de
desfechos em saúde. Pesquisas relacionadas à aplicação do conhecimento para ações de
prevenção e controle de doenças têm sido negligenciadas. Nesse comentário,
apresentamos uma descrição de como as estimativas de fração atribuível populacional
podem fornecer importantes elementos para planejamento de ações de prevenção e
controle de doenças no Brasil.
Palavras-chave: Epidemiologia. Prevenção & Controle. Risco Atribuível. Medidas de
Associação, Exposição, Risco ou Desfecho. Avaliação de Resultado de Ações
Preventivas.

INTRODUÇÃO
Epidemiologia é o estudo da ocorrência e distribuição de eventos relacionados à
saúde da população, incluindo seus determinantes, e a aplicação desse conhecimento
para a prevenção e o controle dos problemas de saúde (Porta, 2008). Em outras
palavras, a epidemiologia tem 2 ações centrais: 1) identificar as causas dos eventos
relacionados à saúde; 2) promover, proteger e restaurar a saúde da população (Galea,
2013). Um dos mais claros exemplos dessa dupla ação da epidemiologia ficara evidente
no combate à cólera em Londres. Em 1849, John Snow, ao mapear os casos de cólera
em Londres, identificou que a incidência da doença estava relacionada com a
distribuição de água, contrariando a teoria dos miasmas, então predominante na época.
Em um segundo momento, John Snow esteve envolvido diretamente nas ações de
prevenção e controle da cólera, inclusive na remoção da Broad Street pump (Galea,
2013; Snow, 1986). Recentemente, essa transferência do conhecimento oriundo de
estudos epidemiológicos para o planejamento de políticas e ações de prevenção
populacional de doenças tem recebido o nome de “epidemiologia translacional”
(Khoury et al., 2010).
Depois de Snow, muitos outros exemplos ao longo da história conseguiram
preencher a lacuna entre o saber e o fazer (Galea, 2013). Entretanto, na história recente,
a segunda ação da epidemiologia tem sido negligenciada. Desde o início da chamada
“Epidemiologia Moderna”, epidemiologistas têm focado suas ações, quase que de forma
obsessiva, em encontrar relações causais, utilizando para isso os métodos
epidemiológicos (Galea, 2013). É compreensível que o campo tenha tomado tal
caminho no passado, pois pouco se conhecia sobre os fatores determinantes das doenças
na população, e obviamente, não se pode combater o que não se conhece. Entretanto,
mesmo após a identificação desses determinantes, não se tem percebido o mesmo
engajamento com a segunda ação relacionada à epidemiologia – aplicação do
conhecimento para ações de prevenção e controle de doenças (Fine, 2013).
A dupla ação da epidemiologia está presente nas medidas de associação
utilizadas em estudos populacionais. As medidas de associação utilizadas para estimar o
real efeito da exposição na ocorrência da doença (teórico) (Rothman et al., 2008) são de
dois tipos: 1) diferença relativa ou razão da incidência da doença entre expostos e não

expostos ao fator; 2) diferença absoluta da incidência da doença entre expostos e não
expostos ao fator. As medidas de associação baseadas em diferenças relativas ou razões
dão uma ideia de força de associação, e estão predominantemente presentes em estudos
etiológicos, em que o objetivo principal é investigar as causas de desfechos relacionados
à saúde. Já as medidas de associação baseadas em diferenças absolutas trazem uma
perspectiva de estratégias de prevenção populacional ou impacto em saúde pública, uma
vez que informam o excesso do risco da doença associado à exposição. Para uma maior
compreensão das medidas de associação utilizadas em estudos epidemiológicos, uma
vasta e detalhada literatura encontra-se disponível em livros texto de epidemiologia
(Rothman et al., 2008; Gordis, 2014; Szklo; Nieto, 2014).
Para ilustrar a predominância de estudos etiológicos em epidemiologia,
realizamos uma busca no Medline no dia 15/06/2015, sem limite de data, utilizando
como descritores as medidas de associação baseadas em diferenças relativas e absolutas
(material suplementar 1). No mundo, encontramos 268.750 registros de artigos baseados
em diferenças relativas e somente 4.784 registros de artigos sobre diferenças absolutas.
No Brasil, encontramos 4.352 registros de artigos sobre diferenças relativas e apenas 82
sobre diferenças absolutas. Vale ressaltar que, possivelmente, parte dos documentos
(artigos, relatórios, livros e outras produções) que utilizam medidas de associação
baseadas em diferenças absolutas esteja na literatura cinza. Entretanto, é improvável que
a grande predominância encontrada em prol das medidas de associação de diferenças
relativas seja muito menor quando considerada a literatura cinza.
Nesse contexto, apresentamos nesse comentário uma breve descrição de como as
estimativas de fração atribuível populacional (FAP) podem ser calculadas a fim de
fornecer importantes elementos para planejamento de ações de prevenção e controle de
doenças no Brasil, possibilitando aproximar epidemiologistas do serviço de saúde e,
consequentemente, de uma epidemiologia translacional.
ESTIMATIVAS DE FRAÇÃO ATRIBUÍVEL POPULACIONAL
A FAP, baseada em diferenças absolutas, estima a proporção da doença ou
evento relacionado à saúde que seria prevenido na população caso o fator de risco fosse
eliminado. Para tanto, a FAP fornece uma perspectiva de ações de prevenção da doença

considerando o risco da doença em indivíduos expostos e a prevalência da exposição na
população. Nesse sentido, uma alta magnitude do risco da doença em indivíduos
expostos, medida baseada em diferença relativa ou razão, pode ter um baixo impacto
populacional se os fatores de risco a ela associados forem raros, ao passo que baixos
riscos poderão refletir em um grande impacto em saúde pública quando as exposições
forem frequentes. Esse conceito remete à celebre frase de Geoffrey Rose: “A large
number of people at small risk may give rise to more cases of disease than a small
number of people at high risk” (Rose, 1985). Nesse sentido, assim como as demais
medidas de associação baseadas em diferenças absolutas, a FAP fornece importantes
informações sobre o potencial impacto de programas de prevenção e intervenções em
saúde pública, sendo extremamente útil para políticos, gestores e tomadores de decisão
(Rockhill et al., 1998; Steenland; Armstrong, 2006; Darrow, 2014).
A FAP, em geral, é estimada em estudos de coorte, em que indivíduos expostos
e não expostos ao fator de risco são acompanhados ao longo do tempo, permitindo
medir a incidência do desfecho em ambos os grupos. A FAP pode ser estimada a partir
da equação (Levin, 1953; 1978):
Em que Ipop é a incidência da doença em toda população, e Io é a incidência da
doença no grupo não exposto.
Entretanto, no Brasil, ainda são incipientes/inexistentes os estudos de coorte que
permitem a mensuração da FAP, mas existem algumas equações que permitem estimá-
la por meio de dados secundários disponíveis.
Em 1953, Morton Levin, mostrou que a equação 1 é uma função do risco
relativo e da frequência do fator de risco na população. Portanto, a FAP também poderia
ser estimada por meio da seguinte equação (Levin, 1953; 1978):
(1)
(2)

Em que Pe é a prevalência da exposição na população e RR é o risco relativo.
Assim, seria possível estimar a FAP através de dados epidemiológicos sobre a
prevalência da exposição no Brasil, e o risco relativo da doença para a exposição de
interesse. Diversos inquéritos representativos da população do Brasil disponibilizam
informações de prevalência de fatores de risco e proteção, permitindo inclusive a
estratificação pelas cinco grandes regiões do país, unidades da federação, capitais e não
capitais. São exemplos de inquéritos nacionais: Pesquisa de Orçamento Familiar (IBGE,
2010), Sistema de Vigilância de Fatores de Risco e Proteção para Doenças Crônicas por
Inquérito Telefônico (Brasil, 2014), Pesquisa Nacional de Saúde do Escolar (BRASIL,
2013) e Pesquisa Nacional de Saúde (Szwarcwald, 2014).
Em relação ao risco relativo, idealmente, esses deveriam ser obtidos de estudos
longitudinais com baixo risco de erros sistemáticos e confundimento. Além disso,
estimativas de odds ratio de estudos caso-controle também têm sido utilizadas para
estimar FAP (Levin, 1953; 1978). Essas medidas de associação deveriam ser oriundas
de estudos que tivessem a mesma população alvo para a qual as estimativas de FAP
seriam calculadas. Entretanto, com frequência, esses estudos não estão presentes em
países de baixa e média renda, incluindo o Brasil. Portanto, na prática, utilizam-se
estimativas disponíveis em revisões sistemáticas com meta-análise, além de estudos de
coorte internacionais bem conduzidos. Essa “portabilidade” do RR oriundo de outra
população alvo assume alguns pressupostos (Steenland; Armstrong, 2006): 1) exposição
medida nas coortes e 2) latência da doença são similares à da população onde a FAP
será estimada; 3) ausência de modificação de efeito.
A limitação inerente à equação 2 é a necessidade da utilização do RR bruto.
Entretanto, na maioria das vezes, associações medidas em estudos epidemiológicos são
acometidas por confundimento, e estratégias para ajuste são incorporadas. Quando
estimativas de RR ajustadas são utilizadas na equação 2, ocorre um viés na medida de
FAP. Na presença de confundimento positivo (RR bruto > RR ajustado) a FAP será
subestimada, ao passo que para confundimento negativo (RR bruto < RR ajustado) a
FAP será superestimada. O viés da FAP dependerá então da magnitude do
confundimento (quanto maior a magnitude, maior o viés), da prevalência da variável de
confusão (menor prevalência, maior o viés) e da força de associação entre exposição e
desfecho (quanto menor a magnitude de associação, maior o viés) (Darrow; Steenland,
2011).

Na presença de confundimento, recomenda-se a utilização da seguinte equação:19
Em que Pc é a prevalência da exposição entre os casos da doença e o RRadj é o
risco relativo ajustado por variáveis de confusão.
Sendo assim, para obter a Pc faz-se necessário medir a prevalência do fator de
risco em subgrupos populacionais, ou pelo menos considerar a variação possível da
exposição nesse subgrupo. Uma forma de obtê-la é medir a razão da prevalência da
exposição entre a população de casos e a população geral, reportada nos estudos de
coorte. Conhecendo a diferença relativa da prevalência da exposição entre casos da
doença e a população geral, poder-se-á aplicar esse fator de correção sobre a prevalência
da exposição na população geral, a fim de se obter a prevalência da exposição entre os
casos da doença. Por exemplo, a exposição à inatividade física entre casos de câncer de
cólon é 1,22 vezes a da população geral (Lee et al., 2012). Dessa forma, se a prevalência
de inatividade física no Brasil é de aproximadamente 20%, estima-se que a prevalência
de inatividade física entre os casos de câncer de cólon no Brasil seja de 24,4%.
Quando os dados de exposição estão disponíveis de forma contínua (ex:
grama/dia) e os valores de risco relativo por unidade de aumento na exposição (RR
dose-resposta), utiliza-se a seguinte fórmula para obter a FAP:
Em que R = exp[In(RRdose) x ]
RRdose = risco relativo da doença por unidade de aumento da exposição.
= media da exposição na população alvo.
(3)
(4)

Essa equação assume uma relação log-linear entre exposição e desfecho
(Boffetta et al., 2009).
Essas medidas de impacto em saúde pública têm sido utilizadas por diversas
organizações ao redor do mundo a fim de priorizar intervenções, determinar metas e
iniciar políticas públicas. São exemplos disso: a Organização Mundial da Saúde, que
por meio do Global Burden of Disease study, fornece informações dos principais fatores
de risco modificáveis para doenças e agravos, utilizadas, inclusive, para determinação
das metas de redução de doenças crônicas não transmissíveis para 2025 (WHO, 2014).
Na América, desde 2009, a Organização Pan-americana de Saúde, a partir da publicação
das estimativas de mortes atribuíveis ao consumo de sódio (PAHO, 2013), apoia um
Grupo Consultivo Técnico que visa mobilizar políticas e intervenções para redução do
consumo de sal. Nos Estados Unidos, o Centers for Disease Control and Prevention
(CDC) fornece informações de anos de vida perdidos, anos de vida perdidos ajustado
por incapacidade, e custos econômicos atribuíveis a alguns fatores de risco (por
exemplo, o tabagismo) (CDC, 2005).
Para exemplificar a utilização das estimativas no Brasil, calculamos a FAP de
mortalidade por doença cardiovascular associada à baixa ingestão de hortaliças.
Segundo dados da Pesquisa de Orçamento Familiar realizada em 2008, a
disponibilidade média de hortaliças nos domicílios brasileiros foi de 74,2 gramas per
capita por dia (IBGE, 2010). A recomendação mínima de ingestão de frutas e hortaliças
é de 400g/dia, que podem ser distribuídos em 240g de hortaliças e 160g de frutas. Uma
recente meta-análise encontrou uma associação inversa entre o consumo de hortaliças e
mortalidade por doenças cardiovasculares (HR 0,96 para cada porção de hortaliças/dia,
equivalente a 77g/dia) (Wang et al., 2014). Utilizando a equação 4, estimamos que
aproximadamente 9,6% dos casos de mortes por doenças cardiovasculares seriam
evitados se a recomendação mínima diária de hortaliças fosse atingida no Brasil.
Para uma maior compreensão sobre estimativas de FAP, uma vasta literatura
pode ser consultada a fim de obter maiores detalhes sobre as diferentes equações,
limitações, pontos fortes e perspectivas do método (Greenland; Robins, 1988; Rockhill,
1998; Benichou, 2001; Steenland; Armstrong, 2006; Darrow; Steenland, 2011; Darrow,
2014). A partir disso, é possível compreender algumas medidas de impacto em saúde
pública derivadas da FAP como: anos de vida perdidos, anos de vida perdidos por
incapacidade e anos de vida ajustado por incapacidade (Steenland; Armstrong, 2006).

Também é possível obter subsídios para estimar intervalos de confiança da FAP, por
meio do cálculo da variância da FAP ou mesmo por simulações de Monte Carlo
(Steenland; Armstrong, 2006).
CONCLUSÃO
O objetivo desse comentário foi debater as possibilidades de utilização das
estimativas de FAP por epidemiologistas no Brasil, e a sua importância para o
planejamento de políticas e ações de prevenção de doenças. Entendemos que
epidemiologistas têm um papel fundamental nessas ações, muitas vezes negligenciadas,
e que através da utilização de dados secundários disponíveis, as estimativas de FAP
configuram-se como uma importante via de aproximação e trabalho entre
epidemiologistas e os serviços de saúde.
REFERÊNCIAS
Benichou J. A review of adjusted estimators of attributable risk. Stat Methods Med Res.
2001;10(3):195-216.
Boffetta P, Tubiana M, Hill C, Boniol M, Aurengo A, Masse R, et al. The causes of
cancer in France. Ann Oncol. 2009; 20(3):550-555. DOI:10.1093/annonc/mdn597
Brasil. Ministério da Saúde. Instituto Brasileiro de Geografia e Estatística. Pesquisa
Nacional de Saúde do Escolar (PENSE). Rio de Janeiro: Ministério da Saúde, Instituto
Brasileiro de Geografia e Estatística; 2013.
Brasil. Ministério da Saúde. Secretaria de Vigilância em Saúde. Vigitel Brasil 2013:
Vigilância de fatores de risco e proteção para doenças crônicas por inquérito telefônico.
Brasília: Ministério da Saúde, Secretaria de Vigilância em Saúde; 2014.
Centers for Disease Control and Prevention (CDC). Annual smoking-attributable
mortality, years of potential life lost, and productivity losses—United States, 1997-
2001. MMWR Morb Mortal Wkly Rep. 2005;54(25):625-8
Darrow LA, Steenland NK. Confounding and bias in the attributable fraction.
Epidemiology. 2011;22(1):53-8. DOI: 10.1097/EDE.0b013e3181fce49b.
Darrow LA. Commentary: errors in estimating adjusted attributable fractions.
Epidemiology. 2014;25(6):917-8. DOI: 10.1097/EDE.0000000000000177.
Fine P, Victora CG, Rothman KJ, Moore PS, Chang Y, Curtis V, et al. John Snow's
legacy: epidemiology without borders. Lancet. 2013;381(9874):1302-11. DOI:
10.1016/S0140-6736(13)60771-0.
Galea S. An argument for a consequentialist epidemiology. Am J Epidemiol.
2013;178(8):1185-91. DOI: 10.1093/aje/kwt172.

Gordis L. Epidemiology. 5th edition. Philadelphia, PA: Elsevier Saunders; 2014.
Greenland S, Robins JM. Conceptual problems in the definition and interpretation of
attributable fractions. Am J Epidemiol. 1988;128(6):1185-97.
Instituto Brasileiro de Geografia e Estatística (IBGE). Pesquisa de orçamentos
familiares, 2008-2009. Análise do consumo alimentar pessoal no Brasil. Rio de Janeiro:
IBGE; 2010.
Khoury MJ, Gwinn M, Ioannidis JP. The emergence of translational epidemiology:
from scientific discovery to population health impact. Am J Epidemiol.
2010;172(5):517-24. DOI: 10.1093/aje/kwq211.
Lee IM, Shiroma EJ, Lobelo F, Puska P, Blair SN, Katzmarzyk PT. Effect of physical
inactivity on major non-communicable diseases worldwide: an analysis of burden of
disease and life expectancy. Lancet. 2012;380(9838):219-29. DOI: 10.1016/S0140-
6736(12)61031-9.
Levin M. The occurrence of lung cancer in man. Acta Unio Int Contra Cancrum.
1953;9:531–541.
Levin ML, Bertell R. RE: “simple estimation of population attributable risk from case-
control studies.” Am J Epidemiol. 1978;108:78-79.
Pan American Health Organization. A Guide for Setting Targets and Timelines to
Reduce the Salt Content of Food. Washington, DC: Pan American Health Organization;
2013.
http://www.paho.org/hq/index.php?option=com_docman&task=doc_view&gid=21493+
&Ite
Porta M. A Dictionary of Epidemiology. 5th edition. New York, NY: Oxford University
Press; 2008.
Rockhill B, Newman B, Weinberg C. Use and misuse of population attributable
fractions. Am J Public Health. 1998;88:15–19.
Rose G. Sick individuals and sick populations. Int J Epidemiol. 1985;14(1):32-8.
Rothman, KJ, Greenland S, Lash TL. Modern Epidemiology. 3rd edition. Philadelphia,
PA: Lippincott, Williams & Wilkins; 2008.
Snow J. On the mode of communication of cholera, 2nd edition. London: John
Churchill; 1860.
Steenland K, Armstrong B. An overview of methods for calculating the burden of
disease due to specific risk factors. Epidemiology. 2006;17(5):512-9.
Szklo M, Nieto FJ. Epidemiology: beyond basics. 3rd edition. Burlington, MA: Joes &
Bartlett Learning; 2014.
Szwarcwald CL, Malta DC, Pereira CA, Vieira MLFP, Conde WN, Junior PRBS, et al.
Pesquisa Nacional de Saúde no Brasil: concepção e metodologia de aplicação. Ciênc.
Saúde Coletiva. 2014;19(2):333-342. DOI: 10.1590/1413-81232014192.14072012
Wang X, Ouyang Y, Liu J, Zhu M, Zhao G, Bao W, et al. Fruit and vegetable
consumption and mortality from all causes, cardiovascular disease, and cancer:
systematic review and dose-response meta-analysis of prospective cohort studies. BMJ.
2014;349:g4490. DOI: 10.1136/bmj.g4490.