aspectos ergonômicos e biomecânicos da atividade de manuseio...
TRANSCRIPT

UNIVERSIDADE FEDERAL DE SÃO CARLOS CENTRO DE CIÊNCIAS BIOLÓGICAS E DA SAÚDE
PROGRAMA DE PÓS-GRADUAÇÃO EM FISIOTERAPIA
Aspectos ergonômicos e biomecânicos da atividade de manuseio de carga com ênfase no membro
superior.
Ana Beatriz de Oliveira
São Carlos 2008
1

Livros Grátis
http://www.livrosgratis.com.br
Milhares de livros grátis para download.
UNIVERSIDADE FEDERAL DE SÃO CARLOS CENTRO DE CIÊNCIAS BIOLÓGICAS E DA SAÚDE
PROGRAMA DE PÓS-GRADUAÇÃO EM FISIOTERAPIA
Aspectos ergonômicos e biomecânicos da atividade de manuseio de carga com ênfase no membro
superior.
Ana Beatriz de Oliveira Tese apresentada ao Programa de Pós-Graduação em Fisioterapia do Centro de Ciências Biológicas e da Saúde da Universidade Federal de São Carlos, como parte dos requisitos para obtenção do título de Doutor em Fisioterapia. Área de concentração: Processos de Avaliação e Intervenção em Fisioterapia.
Orientação: Profª. Drª. Helenice Jane Cote Gil Coury Apoio Financeiro: Fapesp – Processo N. 05/53804-3
São Carlos 2008
2
Ficha catalográfica elaborada pelo DePT da Biblioteca Comunitária/UFSCar
O489ae
Oliveira, Ana Beatriz de. Aspectos ergonômicos e biomecânicos da atividade de manuseio de carga com ênfase no membro superior / Ana Beatriz de Oliveira. -- São Carlos : UFSCar, 2008. 194 f. Tese (Doutorado) -- Universidade Federal de São Carlos, 2008. 1. Fisioterapia preventiva. 2. Ergonomia. 3. Manuseio de carga. 4. Ombro. 5. Eletromiografia. 6. Postura. I. Título. CDD: 615.82 (20a)


“There are places I'll remember
All my life though some have changed
Some forever not for better
Some have gone and some remain
All these places have their moments
With lovers and friends I still can recall
Some are dead and some are living
In my life I've loved them all”
John Lennon & Paul McCartney
3
DEDICATÓRIA
Dedico este trabalho aos meus pais, Izabel e Adilson, e ao meu irmão
Juninho. Vocês foram, são e sempre serão fundamentais nessa caminhada! Foram
muitos sacrifícios e abnegações para que esta etapa da minha formação fosse
concluída. Dedicar este trabalho a vocês é o mínimo que eu poderia fazer em
retribuição. Agradeço sempre a Deus por tê-los como minha família, amo muito
vocês!
P.S.: Juninho, obrigada pelas inúmeras ilustrações e pela paciência em entender
exatamente o que eu queria e ainda fazer tudo sempre pra ontem!
“Se todos fossem
Iguais a vocêS
Que maravilha viver”
Tom Jobim & Vinícius de Moraes
4
AGRADECIMENTO ESPECIAL
Agradeço em especial a Profª. Helenice, por ter plantado em mim a
semente da pesquisa, por ter me acolhido e confiado em meu trabalho nesses sete
anos. Você é a grande responsável pelo que se concretiza hoje e não tenho
palavras para agradecer todas as oportunidades que você me ofereceu, todos os
ensinamentos e toda a paciência, mesmo diante de tanta teimosia! Só posso dizer
que lhe serei eternamente grata. Muito obrigada!
“Feliz aquele que transfere o que sabe
e aprende o que ensina”.
Cora Coralina
5
AGRADECIMENTOS
Primeiramente a Deus, que de uma forma ou de outra esteve sempre
presente em minha vida. Agradeço por ter sempre me trazido à convivência de
pessoas maravilhosas, por me fazer estar sempre na hora certa, no lugar certo,
com as pessoas certas.
À Coordenação de Aperfeiçoamento de Pessoal de Nível Superior (Capes)
e à Fundação de Amparo à Pesquisa do Estado de São Paulo (Fapesp) pela bolsa
de estudo concedida no período.
Aos membros da banca, por aceitarem participar da avaliação e pela
disponibilidade em contribuir com a finalização do trabalho.
A todos os professores e funcionários do Programa de Pós-Graduação em
Fisioterapia da UFSCar. Em especial à Vanessa, Tania, Catai, Stela, Fabio e Paula.
Aos meus tios Rosana e Evandro, pelo apoio, incentivo e ajuda, sempre. É
difícil dizer o quanto vocês são especiais. Obrigada também pela Juju, pelo Lucas
e pelo grande presente de ter o Lucas como meu afilhado.
A toda a minha família: pais, irmão, avós (presentes e ausentes), tios,
primos e primas. Obrigada pelo incentivo e apoio, sempre!
Aos amigos de projeto: Rosimeire, Rodrigo, Luciana e Ethel. Foram
muitos longos dias de coleta e de discussões produtivas! Muito obrigada!
Agradeço em especial o Rodrigo por toda a ajuda com a EMG (foi difícil driblar o
60Hz!).
6
A todos os amigos do Lafipe: Cris, Jeronimo, Lê, Lu, Luis, Patt, Rô,
Rodrigo, Rosi, Tati. Obrigada pelo ambiente de trabalho único que sempre
tivemos e sobretudo pela amizade de vocês! Sempre digo que queria levar vocês
comigo (só não sei pra onde..., ainda!).
À Iolanda, pela alegria de viver que contagia a todos! Obrigada pelos
chás e pelos cafés que sempre embalam os dias de trabalho no laboratório!
À minha irmã de coração e amiga Anielle. Obrigada por sempre ser toda
ouvidos, pelos sábios conselhos, apoio, incentivo, por sempre compartilhar
comigo as alegrias e as tristezas. É difícil dizer com palavras o quanto você é
importante pra mim.
Ao meu amigo-irmão Thiago, pela amizade, pelos conselhos (muitas
vezes indiscretos!), pelas críticas e pela cafeteira italiana! Não sei o que seria de
mim sem ela!
À querida amiga Paula, pela amizade, pelo carinho, por me ligar quando
precisa de alguma coisa, e pelas sempre longaaaaas conversas! Você faz falta por
aqui!
À querida amiga Lúcia, que está sempre no coração! Saudades do G4!
À Tania, pela amizade, pela consideração, pelos conselhos e por sempre
se lembrar de mim!
Aos amigos do Nupef: Victor, Michel, Ruth, Robson, Pozzi, Daniel,
Luciana, Mali, Karla, Poliana, Valéria. Obrigada pela amizade!
Aos amigos do Laiot: Karina, Gilmar e Flávio, pelas incontáveis
discussões sobre EMG e pela luta contra o 60Hz! Obrigada por tudo!
Aos amigos: Carol e Charlinho, Renata e Thiago, Carlinha e Didi, Lígia e
Tó, Carol e Amauri, Taís, Camila, Davilene, Fernandas (Romaguera e Coral),
7
Thereza, Guilherme, Ligia, Graziela, Marília, Tatu, Neto, Bigas, Vito, Chan,
Passoca, Fível, Minhoca, Aninha, Érica, Sabrina. Enfim, aos meus amigos de perto
e aos meus amigos de longe. Aos amigos de Monte Azul, aos amigos de Bauru,
aos amigos de São Carlos, aos amigos de Piracicaba, o meu muito obrigada!
Ao Prof. Gert-Åke e à Karen Søgaard pelas discussões ajuda no
processamento e apresentação dos dados.
À Ana e ao Barela, muito obrigada pela ajuda nas várias etapas deste
trabalho. Obrigada pelos ensinamentos e pela disponibilidade em ajudar a
resolver os problemas.
Aos professores e participantes do treinamento Occupational Safety and
Health & Development, em especial aos professores Eva e Ocka, e aos amigos
Carla, Miranda, Orlando e Claudio.
Aos voluntários que dedicaram parte do seu tempo para contribuir com a
realização deste trabalho e aos funcionários da UFSCar, que me receberam de
braços abertos para realização de um projeto de intervenção. Agradeço pelo
acolhimento e espero ter, de alguma forma, contribuído com o dia-a-dia de
vocês.
“Talvez a existência de certas pessoas explique a minha razão de
viver feliz. É nessas pessoas que me inspiro para construir meus
ideais e a cada dia conquistá-los com bravura”.
Richard Bach
8
RESUMO
Apesar da grande tendência à automação de tarefas, o manuseio de carga ainda é
amplamente realizado em ambientes ocupacionais. Esta atividade tem sido
bastante estudada, com o foco sendo quase sempre mantido na coluna lombar. O
acometimento do membro superior de sujeitos que realizam tarefas de manuseio
indica a necessidade de melhor entendimento a respeito da interação deste
segmento com os fatores de risco físicos do ambiente de trabalho. Além dos
fatores físicos, a sobrecarga musculoesquelética durante o manuseio parece ser
também influenciada pela experiência dos trabalhadores. Para contribuir com o
entendimento dos efeitos dos fatores do ambiente de trabalho no comportamento
do membro superior durante o manuseio de cargas, dois estudos foram
desenvolvidos. O primeiro estudo teve como objetivo avaliar o efeito da altura da
superfície-alvo e massa da carga na atividade muscular e postura do segmento
durante manuseio de carga, realizado por sujeitos experientes e inexperientes.
Tanto a atividade muscular quanto os movimentos do ombro foram afetados pela
variação da massa da carga e da altura da superfície-alvo. No entanto, não houve
diferença para a comparação entre indivíduos experientes e inexperientes. Este
fato foi associado à homogeneidade no tipo de preensão adotada pelos sujeitos
para a realização da tarefa, o que foi atribuído ao desenho da caixa utilizada.
Para melhor entender as características da preensão adotada por sujeitos
experientes e inexperientes no manuseio de uma caixa que permite livre acesso
às faces para posicionamento das mãos, o segundo estudo foi conduzido. Os
objetivos foram (1) avaliar como sujeitos experientes e inexperientes
manuseariam uma caixa quando todas as superfícies desta estavam livres para o
contato; (2) descrever a força de preensão e movimentos do punho de acordo
com a preensão realizada, considerando diferentes alturas de superfície-alvo; (3)
avaliar as amplitudes de movimento do punho registradas de acordo com a
amplitude de movimento segura proposta pela literatura. Movimentos do punho e
força de preensão foram registrados durante a atividade. Sujeitos experientes e
inexperientes pegaram a caixa a partir do posicionamento das mãos na face
lateral e dedos na face inferior, em todas as condições avaliadas. Parece que
quando a caixa permite livre acesso à face inferior, todos os sujeitos,
9
independentemente do nível de experiência, preferem posicionar as mãos nesta
superfície. Os dados de postura e força sugerem que este tipo de pega possa ser
biomecanicamente mais vantajoso para o sistema musculoesquelético e deveria
estar disponível nos manuseios. De maneira geral, os resultados dos estudos
indicam que fatores físicos do ambiente de trabalho, como altura da superfície-
alvo e massa da caixa manuseada, são determinantes da carga final imposta ao
sistema musculoesquelético. Considerando a demanda imposta ao membro
superior, a superfície alta (em torno da altura do ombro) parece fornecer maior
risco para o desenvolvimento de lesão neste segmento. Para melhor
entendimento da carga imposta ao membro superior, estudos envolvendo
diferentes layouts, assim como manuseios assimétricos e ambientes ocupacionais
reais devem ser conduzidos.
Palavras-chave: manuseio de carga; ombro; eletromiografia; postura.
10
ABSTRACT
Despite the large tendency to task automation, manual material handling (MMH)
is still performed in occupational settings. This activity has been widely studied
but the focus has been kept on the low back. Besides the lower back, the
incidence of musculoskeletal disorders also on upper limb, among workers who
perform MMH, shows that there is a need to achieve a better understanding on
the interaction between this segment and physical risk factors in the workplace.
Besides physical factors, the musculoskeletal load during the MMH seems to be
also influenced by the workers’ experience. In order to contribute with
information on the effects of workplace factors on the upper limb behavior during
MMH, two studies were developed. The objective of the first study was to
evaluate the effects of height of the target surface and load mass on the muscular
activity and movements during MMH performed by experienced and
inexperienced subjects. Both muscular activity and movements were influenced
by the variation of the load mass and height of the target surface. However, there
was any difference for the comparison between experienced and inexperienced
subjects. This fact was probably related to the homogeneity of the grip used by
the subjects to carry out the handling, which has probably an association with the
design of the box used in the experiment. In order to better understand the
characteristics of the grip used by the subjects to perform the task, another study
was conduced. The objectives were (1) to evaluate how experienced and
inexperienced subjects would grasp a box when all sides were free to be
approached; (2) to describe grip force and wrist movements according to each
kind of hand grip, attempting to different heights of the destination surface; (3) to
check for safe range of motion recorded for wrist movements in all conditions.
Wrist movements and grip force were recorded during the task. Experienced and
inexperienced subjects grasped the box by placing their hands on the lateral side
and fingers on bottom side. This pattern was observed in all assessed conditions. It
seems that when the box allows the free access to the bottom side, both
experienced and inexperienced subjects prefer to use that side to position their
hands/fingers. Data on movements and grip force has suggested that this grip can
provide biomechanical advantage and should be available in occupational
11

settings. In general, the results have shown that physical factors, like height of
target surface and load mass, are determinants on the musculoskeletal load.
Considering the demand required from the upper limbs, the high surface (around
shoulder level) seems to produce higher risk to the development of disorders on
this segment. To provide a better understanding on the upper limbs load, studies
considering different layouts, as well as asymmetrical tasks and real occupational
settings should be conduced.
Keywords: manual material handling; shoulder; electromyography; posture.
12
LISTA DE FIGURAS
Figura 1. Layout da atividade de manuseio realizada pelos sujeitos. A linha cheia indica o manuseio da caixa da superfície intermediária para a alta (SI → SA) e a linha pontilhada indica o manuseio da superfície intermediária para a baixa (SI → SB).......
11
Figura 2. Ilustração do posicionamento dos marcadores e sistema de coordenadas utilizado para cálculo do deslocamento articular angular........................................................................................
14
Figura 3. Níveis estático, médio e de pico (média ± um desvio-padrão) de EMG normalizado pelo manuseio de referência, para os músculos dos 32 sujeitos durante o manuseio da caixa com massa de 7 e 15 kg da superfície intermediária (SI) para a alta (SA) e da intermediária para a baixa (SB). O asterisco indica diferença significante (p <0.05) entre 7 e 15 kg e o círculo (ο) indica diferença significante (p <0.05) entre SA e SB...................
18
Figura 4. Níveis estático, médio e de pico (média ± um desvio-padrão) da ADM (em graus) para abdução e flexão do ombro e flexão do cotovelo, dos 32 sujeitos durante o manuseio da caixa com massa de 7 e 15 kg da superfície intermediária (SI) para a alta (SA) e da intermediária para a baixa (SB). O asterisco indica diferença significante (p <0.05) entre 7 e 15 kg e o círculo (ο) indica diferença significante (p <0.05) entre SA e SB...................
20
Figura 5. Dados de ADM (y’) e EMG (y”) membro superior direito, de um sujeito representativo, normalizados em função do tempo, coletados com a caixa de 7 kg manuseada para a superfície alta (A) e baixa (B) e da caixa de 15 kg para a superfície alta (C) e baixa (D).....................................................................................
21
Figura 6. Pega látero-inferior típica (A) e variação (B) observada entre sujeitos experientes e inexperientes.............................................
38
Figura 7. Distribuição dos movimentos de flexo-extensão (A) e desvios (B) do punho direito de sujeitos experientes e inexperientes quando manuseando uma caixa de 11 kg da superfície intermediária para superfícies alta e baixa. A área cinza indica a amplitude de movimento segura de acordo com a literatura.............................
40
13
Figura 8. Valores médios e desvios-padrão da força de preensão aplicada em cada face da caixa durante a atividade de manuseio realizada por sujeitos experientes e inexperientes. A caixa foi transferida da superfície intermediária para superfície alta (A) e baixa (B). Os símbolos indicam P<0,05 para a comparação post-hoc de cada altura: asteriscos (∗) indicam diferença entre face lateral esquerda e face inferior direita; triângulos (Δ) em B (na vertical) apontam diferença entre faces laterais e inferiores...
41
Figura 9. Resumo dos principais resultados referentes à postura e força de preensão, registrados durante o manuseio da caixa, partindo da superfície intermediária em direção às superfícies alta e baixa. Os dados são apresentados em valores médios e desvios-padrão (DP). Os valores positivos (+) indicam flexão, enquanto os negativos (-) indicam extensão. O desvio ulnar é representado pelos valores positivos (+) e o radial pelos negativos (-)...............
43
Figura 10. Novos modelos de caixa/recipiente propostos para possibilitar a pega da caixa a partir da superfície inferior. A: caixa com fundo falso e livre acesso aos dedos (área cinza); B: caixa com bordas inferiores arredondadas; C: caixa com espaço livre nas bordas inferiores. Os modelos B e V visam facilitar o posicionamento das mãos na face inferior.............................................................
51
14
SUMÁRIO
CONTEXTUALIZAÇÃO…………………………………………………………. 1
ESTUDO 1………………………………………………………………………... 6
Introdução………………………………………………………………........ 7
Métodos......................................................................................................... 10
Resultados..................................................................................................... 16
Discussão....................................................................................................... 21
DESDOBRAMENTOS A PARTIR DO ESTUDO INICIAL................................. 29
ESTUDO 2........................................................................................................... 31
Introdução………………………………………………………………........ 32
Métodos......................................................................................................... 34
Resultados..................................................................................................... 38
Discussão....................................................................................................... 44
CONSIDERAÇÕES FINAIS................................................................................ 53
Considerações sobre os estudos................................................................. 53
Atividades realizadas durante o período do doutorado direto................ 54
REFERÊNCIAS BIBLIOGRÁFICAS...................................................................... 57
ANEXO I.............................................................................................................. 70
ANEXO II............................................................................................................. 102
ANEXO III............................................................................................................ 129
ANEXO IV............................................................................................................ 131
ANEXO V............................................................................................................. 139
ANEXO VI............................................................................................................ 148
ANEXO VII.......................................................................................................... 158
ANEXO VIII......................................................................................................... 168
ANEXO IX............................................................................................................ 171
ANEXO X............................................................................................................. 194
15
CONTEXTUALIZAÇÃO
A atividade de manuseio de materiais tem sido foco de estudo de muitos
relatos científicos. Considerada como qualquer atividade que requeira uso de
força exercida por uma pessoa para levantar, abaixar, puxar, empurrar, carregar,
segurar um objeto, animal ou pessoa (STRAKER, 1999), o manuseio de materiais é
freqüentemente realizado por trabalhadores em suas atividades ocupacionais.
A relação entre manuseio de cargas e desenvolvimento de distúrbios e
doenças musculoesqueléticas tem sido bastante documentada na literatura
(YEUNG et al, 2002). De maneira geral, os distúrbios desenvolvidos a partir desta
atividade compreendem de 25 a 36% das queixas de distúrbios relacionados ao
trabalho (DRURY et al, 1982; STRAKER, 1999; CIRIELLO, 2001). De fato, muitos
estudos foram desenvolvidos demonstrando esta associação e, a partir de então,
muito esforço tem sido aplicado para o melhor entendimento da sobrecarga
presente na região lombar quando os indivíduos manuseiam cargas (JÄGER e
LUTTMANN, 1992; MARRAS et al, 1995; HASIANG e McGORRY, 1997;
CIRIELLO et al, 1999; KUMAR, 1999; GAGNON et al, 2002; PADULA e COURY,
2003a; PADULA e COURY, 2003b).
No entanto, os estudos epidemiológicos apontam a presença de
sobrecarga também em outros segmentos além da coluna lombar. Um
levantamento realizado por Straker (1999) na Austrália entre os anos de 1994-
1995 identificou que 30% dos casos de distúrbio ou doença registrados neste
período estavam relacionados à atividade de manuseio de cargas e eram
localizados no tronco (65,4% entre homens e 54,4% entre as mulheres), seguidos
1
pelo membro superior (23,3% entre homens e 27,9% entre as mulheres). Ainda,
outras regiões foram mencionadas, como membros inferiores e pescoço, além da
ocorrência de forma associada em diferentes segmentos. O acometimento de
membros superiores assim como a associação de segmentos foi também
encontrado no estudo desenvolvido por Yeung et al (2002) e em estudos que
avaliaram profissionais da área de enfermagem (LUSTED et al, 1996; MENZEL et
al, 2004; SMITH et al, 2004).
A prevalência de sintomas musculoesqueléticos em múltiplas regiões do
corpo em trabalhadores que realizam o manuseio de materiais aponta a
necessidade de maior atenção aos fatores físicos que afetam outras regiões do
corpo além da coluna lombar (YEUNG et al, 2002 e 2003). Pope et al (2001)
destacam o manuseio de cargas como um dos fatores ocupacionais que aumenta
o risco do desenvolvimento de dores no ombro. Eles encontraram associação
significativa entre as atividades de levantar, carregar e puxar cargas e o
surgimento de dor incapacitante no ombro. Estes autores também destacam a
carência de estudos que avaliem a demanda física desta atividade sobre a
articulação do ombro, afirmando que os estudos que avaliam o manuseio de
carga estão mais voltados para avaliação da sobrecarga da coluna lombar.
Em um dos poucos estudos avaliando a sobrecarga no ombro e
manuseio, Nielsen et al (1998) estudaram carteiros que realizavam transporte de
caixas de correspondência e relataram os sintomas apresentados por estes
profissionais. A prevalência de distúrbios no ombro em carteiros com idade
inferior a 50 anos foi de 53% em um ano, enquanto a prevalência desses
distúrbios na população em geral foi de 27%. Com relação à sobrecarga, foi
encontrada associação entre a altura de manuseio e o local de acometimento. Os
2
manuseios realizados a partir de superfícies altas parecem estar relacionados à
sobrecarga do ombro, enquanto que aqueles realizados próximos do chão
tendem a acometer a coluna lombar.
A sobrecarga imposta ao ombro em atividades ocupacionais diversas tem
sido registrada na literatura (PUNNET et al, 2000; MING et al, 2004; HOSTENS e
RAMON, 2005), sendo comumente associada à repetitividade, uso de força e
manutenção de posturas extremas (GRIECO et al, 1998). Este último fator
compromete a ação muscular. Apesar de a postura extrema permitir a ativação e
a contração muscular, o músculo encontra-se em posição de desvantagem
biomecânica, o que limita o desenvolvimento de força e, conseqüentemente, o
desempenho na tarefa realizada estará comprometido (GALLAGHER, 2005).
A avaliação da sobrecarga de segmentos corporais pode ser feita a partir
de vários indicadores. A medida da amplitude de movimento (ADM) e análise da
atividade muscular são indicadores comumente utilizados para este propósito. De
acordo com Aaras et al (1988), a posição do braço é o fator mais importante na
determinação da carga ativa e passiva em estruturas da articulação gleno-umeral.
Estes autores sugerem que os valores dos ângulos posturais do braço associados
ao valor da carga externa podem ser o único indicador de carga para estruturas
do ombro. Em estudos ergonômicos, a atividade eletromiográfica dos músculos
do ombro tem sido utilizada como um indicador indireto da sobrecarga de
trabalho (SPORRONG et al, 1999; HERBERTS et al, 1980). Esta técnica tem se
mostrado importante no entendimento da função muscular quando são utilizados
posturas ou movimentos específicos (LUTTMANN, 1996).
Além dos fatores físicos, a sobrecarga durante o trabalho pode ser
influenciada por outros fatores, como os organizacionais e psicossociais. Na
3
atividade de manuseio de carga, o esforço imposto ao sistema
musculoesquelético parece ser também influenciado pelo nível de experiência
dos indivíduos. Alguns estudos têm avaliado a relação entre esforço e experiência
(AUTHIER et al, 1996; GAGNON, 1997). Gagnon (1997) identificou que a
inclinação da carga realizada pelos indivíduos experientes diminui a sobrecarga
na coluna e ombros. No entanto, nenhum parâmetro específico foi avaliado para
esta última articulação. Authier et al (1996) avaliaram diferenças no
posicionamento da coluna, joelhos, pés e orientação pélvica entre trabalhadores
novos e experientes. O único fator avaliado para o membro superior foi o
posicionamento das mãos.
Assim, fica clara a carência de estudos que auxiliem na compreensão do
comportamento do membro superior durante atividades de manuseio de carga.
Ainda, o fator experiência tem sido pouco estudado, sobretudo quando se trata de
estratégias envolvendo ombro e cotovelo. Desta forma, foram realizados 2
estudos. O primeiro estudo foi desenvolvido para avaliar o efeito de variações da
altura de manuseio e massa da carga na atividade muscular e movimentos das
articulações do membro superior durante manuseio de carga realizado por
sujeitos experientes e inexperientes. Os resultados desse estudo levaram a
questionamentos sobre o tipo de preensão utilizado pelos sujeitos. A partir disso
foi realizado o estudo 2, o qual teve três objetivos: (1) descrever os tipos de
preensão realizados por sujeitos experientes e inexperientes no manuseio de uma
caixa que possibilita livre acesso a todas as faces; (2) descrever a força de
preensão e movimentos do punho de acordo com a preensão realizada,
considerando diferentes alturas de superfície-alvo; (3) avaliar as amplitudes de
4
movimento do punho registradas de acordo com a amplitude de movimento
segura proposta pela literatura.
Os estudos desenvolvidos são apresentados a seguir. O primeiro estudo
foi submetido ao periódico Ergonomics e o segundo encontra-se em fase final de
redação para ser submetido ao periódico Applied Ergonomics. O texto completo
do primeiro e segundo manuscritos são apresentados nos ANEXOS I e II,
respectivamente.
5
ESTUDO 1
COMPORTAMENTO MUSCULAR E POSTURAL DO MEMBRO SUPERIOR
DURANTE TAREFAS DE MANUSEIO DE MATERIAIS.
OLIVEIRA AB, COURY HJCG. Upper limb muscular and postural behavior during
manual material handling tasks. Manuscrito submetido ao periódico
ERGONOMICS.
6
Introdução
As atividades de manuseio de carga são amplamente realizadas em
ambiente ocupacional. A relação entre estas atividades e Distúrbios
Osteomusculares Relacionados ao Trabalho (DORTs) tem sido estabelecida na
literatura (CHAFFIN e PARK, 1973; AYOUB et al, 1992; STRAKER, 1999; YEUNG
et al, 2002). Em geral, de 25 a 36% das DORTs registradas são relacionadas a
atividades de manuseio de cargas (DRURY et al, 1982; STRAKER, 1999;
CIRIELLO, 2001). A região mais afetada é a coluna lombar, com uma prevalência
que varia de 50 a 70%. Estudos epidemiológicos têm também relatado alta
incidência de DORTs em outros segmentos. A segunda região mais afetada é o
ombro, que apresenta prevalência de DORTs, associadas a atividades de
manuseio de carga, variando de 38 a 60%.
Para reduzir a ocorrência e prevenir a incidência de DORTs relacionadas
ao manuseio de cargas, o melhor entendimento das cargas musculoesqueléticas e
o efeito dos parâmetros da tarefa durante este tipo de atividade é crucial. O layout
das atividades de manuseio de carga tem sido estudado a partir de abordagens
biomecânicas – avaliação de força, atividade muscular e movimentos, e
subjetivas – uso de escalas de percepção de esforço (DAVIS e MARRAS, 2005;
NASTASIA et al, 2007; CIRIELLO et al, 2008). Enquanto a carga espinhal durante
vários tipos de atividade de manuseio de carga tem sido bem estudada (JÄGER e
LUTTMANN, 1992; HASIANG e MCGORRY, 1997; PADULA e COURY, 2003a,
2003b; HOOZEMANS et al, 2008), a carga no membro superior não tem
recebido tal atenção. A literatura apresenta estudos que avaliam a carga física nos
7
membros superiores durante o manuseio de cargas, mas, em geral, eles são
restritos a condições específicas de trabalho e layout.
Habes et al (1985) estudaram o efeito da altura-alvo, da massa da carga e
do alcance na fadiga muscular dos músculos dos ombros e coluna durante uma
tarefa repetitiva de levantamento. Todos os fatores apresentaram efeito nas
variáveis estudadas, mas os autores não investigaram alturas abaixo do nível da
cintura e os sujeitos manusearam um objeto cilíndrico. Esses fatores podem não
permitir generalização dos resultados a outras condições industriais. Nielsen et al
(1998) avaliaram as cargas musculares nos ombros e coluna lombar a partir da
análise da Função de Probabilidade de Distribuição de Amplitude (FPDA) de
eletromiogramas de superfície (EMGs), durante tarefas de levantamento usando
uma caixa de 10Kg em diferentes alturas e freqüências. Eles encontraram
diferenças na carga muscular de acordo com a mudança na altura e variação de
frequência. No entanto, eles não exploraram o efeito da mudança da massa na
carga muscular do ombro. Davis e Marras (2005) avaliaram a influência da altura
da origem e destino do levantamento na resposta da coluna lombar. A carga
lombar tridimensional foi influenciada pela altura de origem e destino da carga.
Os autores reconheceram a importância do estudo do layout do posto de trabalho
e resposta biomecânica durante o levantamento, mas eles tiveram como foco de
estudo apenas a coluna lombar. Hoozemans et al (2008) também estudaram o
efeito da altura do levantamento e massa na carga lombar e relataram que ambos
apresentam efeito neste segmento. No entanto, eles não avaliaram nenhuma
variável relacionada aos membros superiores. A literatura disponível indica que
tanto a altura quanto a massa da carga têm um papel importante na carga
musculoesquelética durante atividades de manuseio. Entretanto, os estudos que
8
avaliam estes fatores são limitados a poucas condições ou ainda relacionados
apenas ao comportamento da região lombar.
Outro fator importante que pode influenciar a carga musculoesquelética
durante o manuseio de cargas é a experiência prévia do indivíduo em atividades
desta natureza. De acordo com estudos realizados por Gagnon (2005), as
estratégias utilizadas por trabalhadores experientes na realização de tarefas de
manuseio de carga apresentam um potencial seguro do ponto de vista
biomecânico. Em geral, eles apresentam estratégias relacionadas ao manuseio do
objeto (caixa) e posicionamento dos pés que os diferem de trabalhadores novatos.
Estas estratégias podem reduzir cargas na coluna, assimetrias do tronco e trabalho
mecânico, podendo gerar diferentes perfis de carga musculoesquelética nestes
indivíduos.
Então, no planejamento de atividades e postos de trabalho que envolvam
atividades de manuseio de carga, certas variáveis devem ser controladas, para
reduzir e prevenir fatores de risco importantes no desenvolvimento de lesões da
coluna lombar e também do membro superior. Com relação à prevenção de
lesões no membro superior, associadas às tarefas de manuseio de carga, pouca
informação é disponível na literatura, particularmente referente a postos de
trabalhos reais ou simulados levando em conta a experiência dos sujeitos.
Considerando que a disposição espacial do posto de trabalho, massa do
objeto e experiência prévia em manuseio podem interferir na carga do ombro, o
objetivo deste estudo foi avaliar o efeito de modificações da altura de manuseio e
massa da carga na atividade muscular e posturas nas articulações do membro
superior durante manuseio de carga realizado por sujeitos experientes e
inexperientes.
9
Métodos
Sujeitos
Homens com e sem experiência ocupacional em atividades de manuseio
de carga foram recrutados. Os critérios de inclusão compreenderam a ausência
de sintomas ou distúrbios musculoesqueléticos, doenças gerais, limitação na
amplitude de movimentos, desvios posturais aparentes ou problemas de equilíbrio
relatados pelos sujeitos. Trinta e dois sujeitos, com idade média de 22,6 (± 4.3)
anos, altura média de 1,69 (± 0,04) cm e peso médio de 68,3 (± 8,7) kg, foram
recrutados para participar do estudo. Dezesseis sujeitos eram experientes (no
mínimo 6 meses de trabalho em atividades que incluíam o manuseio manual de
cargas em estoques de supermercados e outras lojas de varejo) e 16 inexperientes
(estudantes, sem experiência profissional em manuseio manual de caixas). Eles
assinaram um Termo de Consentimento Formal, Livre e Esclarecido, previamente
aprovado pelo comitê de ética local (Processo 059/04).
Protocolo
Os sujeitos manusearam uma caixa (com massa de 7 e 15 kg) em uma
estante fixa, de uma prateleira (superfície intermediária – SI – 102,5 cm, próxima
ao nível da cintura) para outra, sendo alta (superfície alta – SA – 142,5 cm,
próxima ao nível dos ombros) e baixa (superfície baixa – SB – 62,5 cm, próxima
ao nível dos joelhos). As massas utilizadas no experimento foram determinadas a
partir de observações de situações ocupacionais reais relacionadas a estoques e
lojas de varejo. Os dados referentes a estas quatro condições (duas massas da
caixa e duas alturas) foram registrados (Figura 1). Os sujeitos sempre pegaram a
10
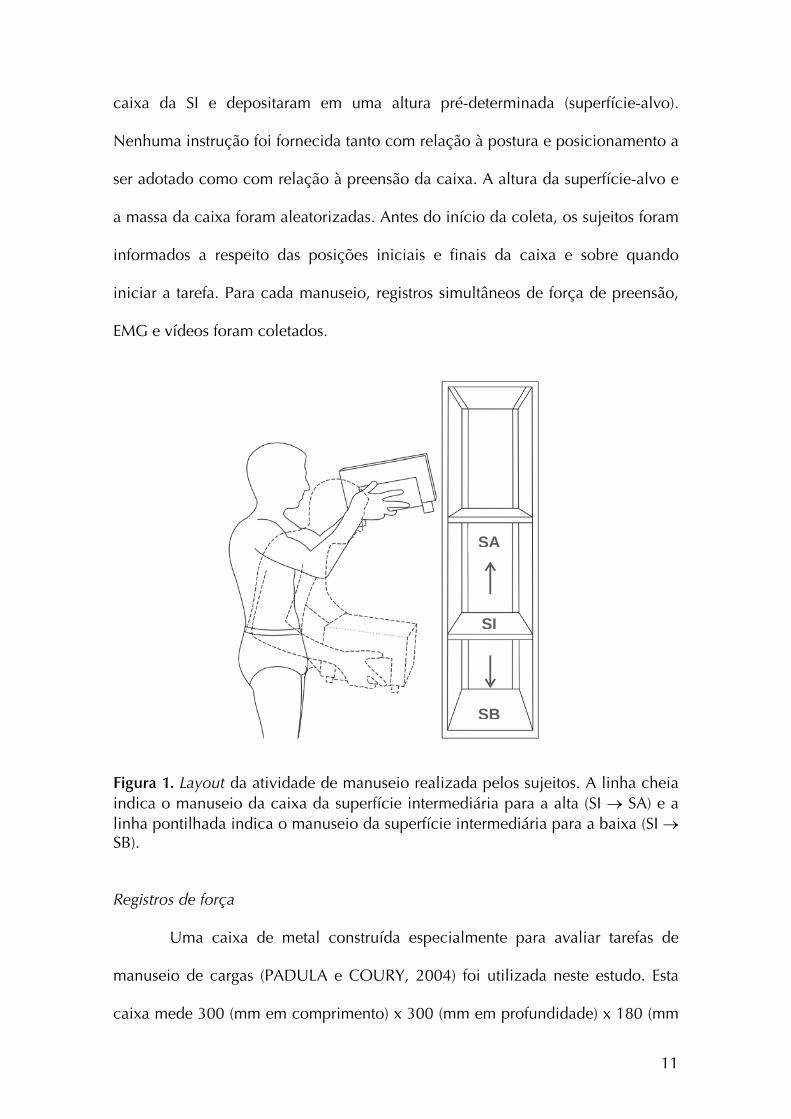
caixa da SI e depositaram em uma altura pré-determinada (superfície-alvo).
Nenhuma instrução foi fornecida tanto com relação à postura e posicionamento a
ser adotado como com relação à preensão da caixa. A altura da superfície-alvo e
a massa da caixa foram aleatorizadas. Antes do início da coleta, os sujeitos foram
informados a respeito das posições iniciais e finais da caixa e sobre quando
iniciar a tarefa. Para cada manuseio, registros simultâneos de força de preensão,
EMG e vídeos foram coletados.
SA
SI
SB
Figura 1. Layout da atividade de manuseio realizada pelos sujeitos. A linha cheia indica o manuseio da caixa da superfície intermediária para a alta (SI → SA) e a linha pontilhada indica o manuseio da superfície intermediária para a baixa (SI → SB).
Registros de força
Uma caixa de metal construída especialmente para avaliar tarefas de
manuseio de cargas (PADULA e COURY, 2004) foi utilizada neste estudo. Esta
caixa mede 300 (mm em comprimento) x 300 (mm em profundidade) x 180 (mm
11
em altura) e foi instrumentada com duas células de carga nas laterais, e duas no
fundo da caixa, para permitir registro da força de preensão durante a realização
da atividade (ilustração detalhada no ANEXO III). Cada célula de carga foi
conectada à unidade de aquisição DataLink (Biometrics Ltd, Gwent, UK) e os
dados foram coletados a partir do programa DataLink (2.0, Biometrics Ltd), com
freqüência de amostragem de 100 Hz. Os dados de força de preensão foram
utilizados para determinar o início e fim de cada manuseio.
Eletromiografia
A Eletromiografia de superfície dos músculos bíceps e deltóide (fibras
acromiais) foi registrada bilateralmente. Eletrodos ativos simples diferencial
(Modelo #DE-2.1, DelSys®, Boston, USA) com geometria de detecção em duas
barras paralelas (1 mm2 x 1 cm) de prata (99,9%), separadas por 1 cm, foram
fixados à pele a partir de um adesivo dupla-face (DelSys®). As características dos
eletrodos utilizados foram: RRMC > 80 dB; impedância de entrada >1015Ω em
paralelo, com 0.2 pF; ganho de voltagem de 10; ruído de 1.2 µV (RMS). Eles
foram posicionados na região mais saliente do deltóide, alinhado à linha entre o
acrômio e o epicôndilo lateral do úmero; e no bíceps sobre a linha entre o
acrômio medial e a fossa cubital no terço a partir da fossa cubital. O eletrodo de
referência foi colocado sobre a superfície dorsal da mão esquerda. Antes de fixar
os eletrodos, a pele das regiões delimitadas foi tricotomizada e limpa com álcool.
O local de posicionamento dos eletrodos e os procedimentos de fixação foram
determinados a partir das recomendações do SENIAM (FRERIKS e HERMENS
1999). Os sinais foram acondicionados pelo amplificador principal (Bagnoli-8
12
EMG System, DelSys®) com ganho definido em 1000, banda de freqüência de 20–
450 Hz e ruído de 1.2 µV (RMS). Os dados foram coletados com frequência de
amostragem de 2000 Hz utilizando um computador com placa A/D de 16-bits
A/D (PCI-6034E, National Instruments Corporation, Austin, USA) e o programa
EMGworks® (versão 3.0, DelSys®).
Registro de imagem
Durante o experimento, os movimentos dos sujeitos no plano sagital
(vista direita) e frontal (vista posterior) foram registrados a 50 Hz usando duas
câmeras digitais (GR-DV 1800, JVC). As câmeras foram posicionadas
perpendicularmente e a 1,5 m do chão. Marcadores passivos foram fixados ao
corpo dos sujeitos nas seguintes posições: ombro: face posterior do acrômio
(direito e esquerdo); cotovelo: epicôndilo lateral (direito e esquerdo); punho:
processo estilóide da ulna (direito); quadril: trocânter maior do fêmur (direito e
esquerdo) (OKUNRIBIDO e HASLEGRAVE, 2003). Estes marcadores foram
utilizados para reconstruir os movimentos de abdução do ombro direito e
esquerdo (AO), flexão do ombro direito (FO) e flexão do cotovelo direito (FC).
Análise dos dados
Força de preensão, EMG e imagem foram coletados durante todo o
experimento, mas apenas a fase de manuseio foi analisada. A fase de manuseio
foi definida como o tempo durante o qual o sujeito permaneceu com as mãos em
contato com a caixa. O início e final de cada fase foram estabelecidos a partir dos
dados de força de preensão. A análise foi realizada utilizando-se o programa
MatLab® (versão 7.0.1, MathWorks Inc., Natick, USA). O início foi determinado
13
como o momento em que a soma das forças aplicadas nas faces inferiores direita
e esquerda foi igual ou superior a 3 N. O final da fase foi determinado quando
esta soma reduziu-se a 3 N ou menos. Estes eventos foram utilizados para
selecionar os dados de EMG e imagem, referentes a cada manuseio.
Os dados de cinemática foram digitalizados, filtrados e reconstruídos a
partir do programa Ariel Performance Analysis System software (APAS®, Ariel
Dynamics, Inc., Trabuco Canyon, USA). Os dados foram filtrados com filtro
digital passa-baixa de 5 Hz. A reconstrução das coordenadas reais foi realizada
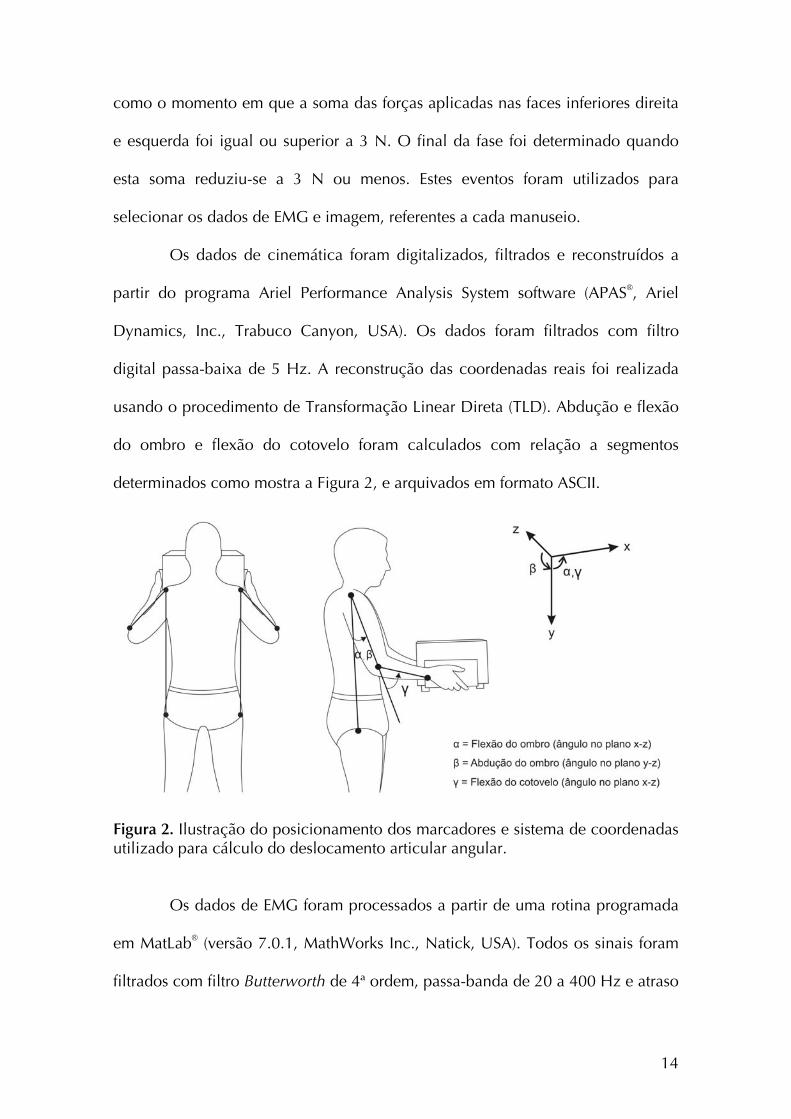
usando o procedimento de Transformação Linear Direta (TLD). Abdução e flexão
do ombro e flexão do cotovelo foram calculados com relação a segmentos
determinados como mostra a Figura 2, e arquivados em formato ASCII.
Figura 2. Ilustração do posicionamento dos marcadores e sistema de coordenadas utilizado para cálculo do deslocamento articular angular.
Os dados de EMG foram processados a partir de uma rotina programada
em MatLab® (versão 7.0.1, MathWorks Inc., Natick, USA). Todos os sinais foram
filtrados com filtro Butterworth de 4ª ordem, passa-banda de 20 a 400 Hz e atraso
14
de fase zero. Subsequencialmente foram retificados (retificação de onda
completa) e novamente filtrados com passa-baixa de 5 Hz para obtenção do
envoltório linear (BARELA e DUARTE, 2008). Os sinais foram então recortados de
acordo com os dados de força de preensão, como previamente descrito, e foram
normalizados com relação a um manuseio de referência. No manuseio de
referência os sujeitos transferiram a mesma caixa, com massa de 11 kg, da
superfície intermediária para a superfície alta.
A FPDA foi calculada para os dados de EMG e cinemática. De acordo
com Jonsson (1982), níveis de probabilidade de 10, 50 e 90% representam a
carga muscular estática, média e de pico, respectivamente. O método FPDA é um
procedimento amplamente utilizado para descrever cargas ocupacionais (HÄGG
et al, 2000; SØGAARD et al, 2001) e, embora os dados tenham sido registrados
por um curto período de tempo, a análise realizada mostrou resultados
consistentes. Para realizar análise qualitativa dos dados e identificar diferenças
entre condições e padrões entre os sujeitos, o envoltório linear de cada sinal EMG
bruto foi normalizado no tempo, de 0 a 100% em intervalos de 1%. O mesmo
procedimento foi realizado para os dados de flexão e abdução do ombro, flexão
do cotovelo, que foram também descritos em termos do 10º, 50º e 90º percentis.
Estatística
Todos os dados foram testados para normalidade a partir do teste de
Shapiro Wilk. Diante da não normalidade na distribuição dos dados, testes não
paramétricos foram utilizados. O teste de Mann-Whitney foi aplicado para testar
diferenças entre os grupos (experientes e inexperientes). O teste pareado de
15
Wilcoxon foi aplicado para testar diferenças nas variáveis avaliadas entre lados
direito e esquerdo referente à EMG, o movimento de abdução do ombro, altura
da superfície-alvo, massa da carga de 7 e 15 kg. O alfa de 0,05 foi utilizado para
todos os testes estatísticos, que foram aplicados a partir do programa Statistica®
(versão 7, StatSoft, Inc., Tulsa, USA).
Resultados
Os dados de EMG e ADM coletados de sujeitos experientes e
inexperientes não apresentaram diferenças estatísticas significantes. Desta forma,
as duas categorias de sujeitos passaram a ser trabalhados como um único grupo.
Não houve diferença significante entre EMG e ADM (abdução do ombro)
registrados para os lados direito e esquerdo. Desta maneira, apenas dados
referentes ao hemicorpo direito são descritos.
EMG
Dados da FPDA para EMG são apresentados na Figura 3. A atividade
elétrica dos músculos avaliados foi modificada pela massa da carga e pela altura
da superfície-alvo. Houve um aumento significante (*) nos níveis de carga
estática, média e de pico quando a massa da caixa aumentou de 7 para 15 kg. O
aumento variou de 50 a 77% para o bíceps, e de 32 a 63% para o deltóide. O
aumento mais expressivo ocorreu no nível de carga de pico e variou entre 73 e
77% (bíceps) e entre 60 e 65% (deltóide).
16
A atividade EMG foi significativamente maior (ο) quando a caixa foi
transferida em direção à superfície alta, em relação ao manuseio para a superfície
baixa, exceto para o bíceps no nível de carga estática. Em ambos os níveis médio
e de pico, a EMG mostrou aumentos similares (de 7 a 18% para o bíceps e de 10
a 38% para o deltóide) quando a caixa foi movida para a superfície alta,
comparado ao manuseio da mesma para a superfície baixa. Então,
comparativamente, o deltóide apresentou maior atividade elétrica no nível de
carga de pico que o bíceps.
17
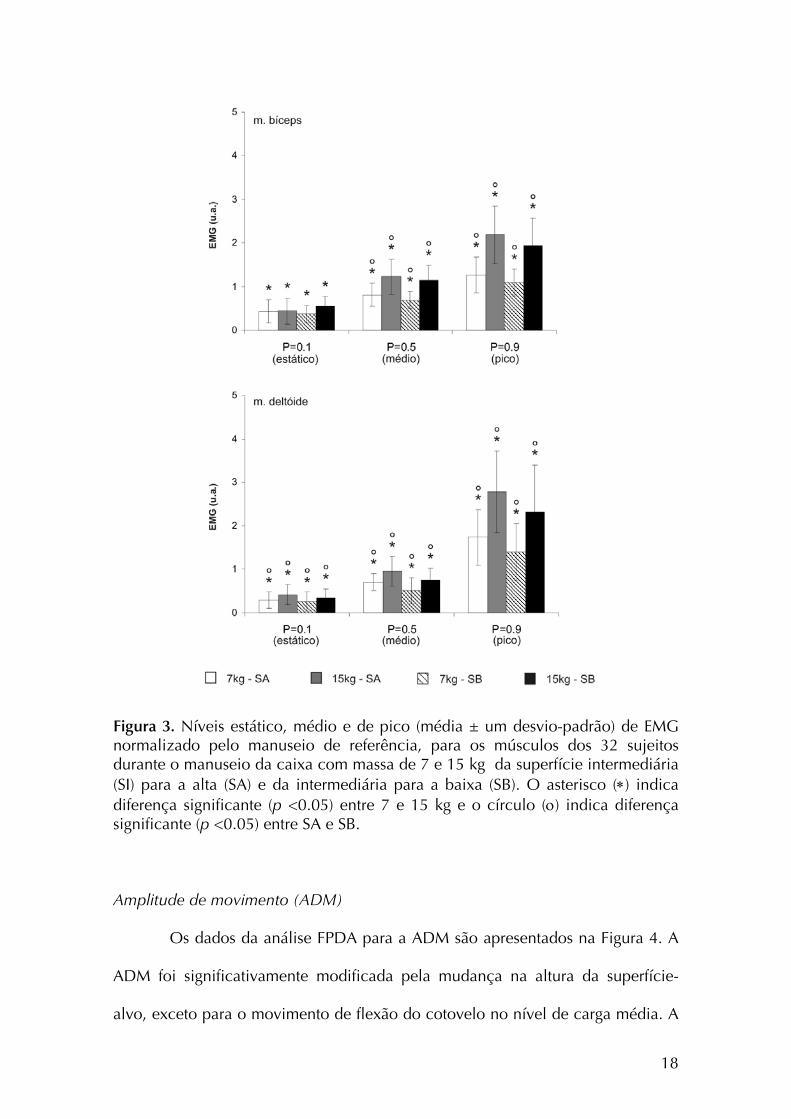
Figura 3. Níveis estático, médio e de pico (média ± um desvio-padrão) de EMG normalizado pelo manuseio de referência, para os músculos dos 32 sujeitos durante o manuseio da caixa com massa de 7 e 15 kg da superfície intermediária (SI) para a alta (SA) e da intermediária para a baixa (SB). O asterisco (∗) indica diferença significante (p <0.05) entre 7 e 15 kg e o círculo (ο) indica diferença significante (p <0.05) entre SA e SB. Amplitude de movimento (ADM)
Os dados da análise FPDA para a ADM são apresentados na Figura 4. A
ADM foi significativamente modificada pela mudança na altura da superfície-
alvo, exceto para o movimento de flexão do cotovelo no nível de carga média. A
18
ADM apresentou grande aumento quando a caixa foi transferida para a superfície
alta, comparado com o manuseio realizado para a superfície baixa. O aumento
mais expressivo foi em relação à abdução do ombro. No nível de carga estática, a
abdução aumentou 7° e nos níveis de carga média e de pico o aumento foi de 25
e 35°, respectivamente.
A mudança da massa causou efeito na ADM em quatro de nove
condições. Estas alterações significantes variaram entre 2 e 7° e ocorreram na
flexão do ombro e cotovelo no nível de carga estática; abdução do ombro no
nível de carga média; na flexão do ombro no nível de carga de pico.
19
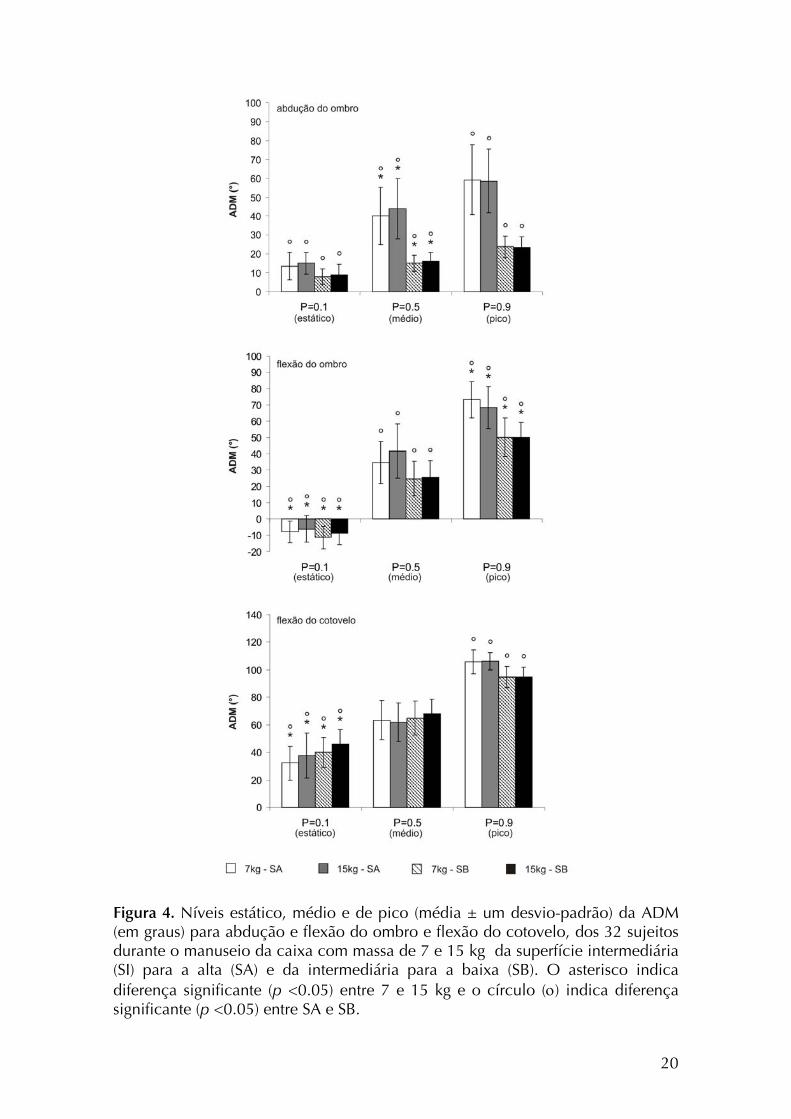
Figura 4. Níveis estático, médio e de pico (média ± um desvio-padrão) da ADM (em graus) para abdução e flexão do ombro e flexão do cotovelo, dos 32 sujeitos durante o manuseio da caixa com massa de 7 e 15 kg da superfície intermediária (SI) para a alta (SA) e da intermediária para a baixa (SB). O asterisco indica diferença significante (p <0.05) entre 7 e 15 kg e o círculo (ο) indica diferença significante (p <0.05) entre SA e SB.
20
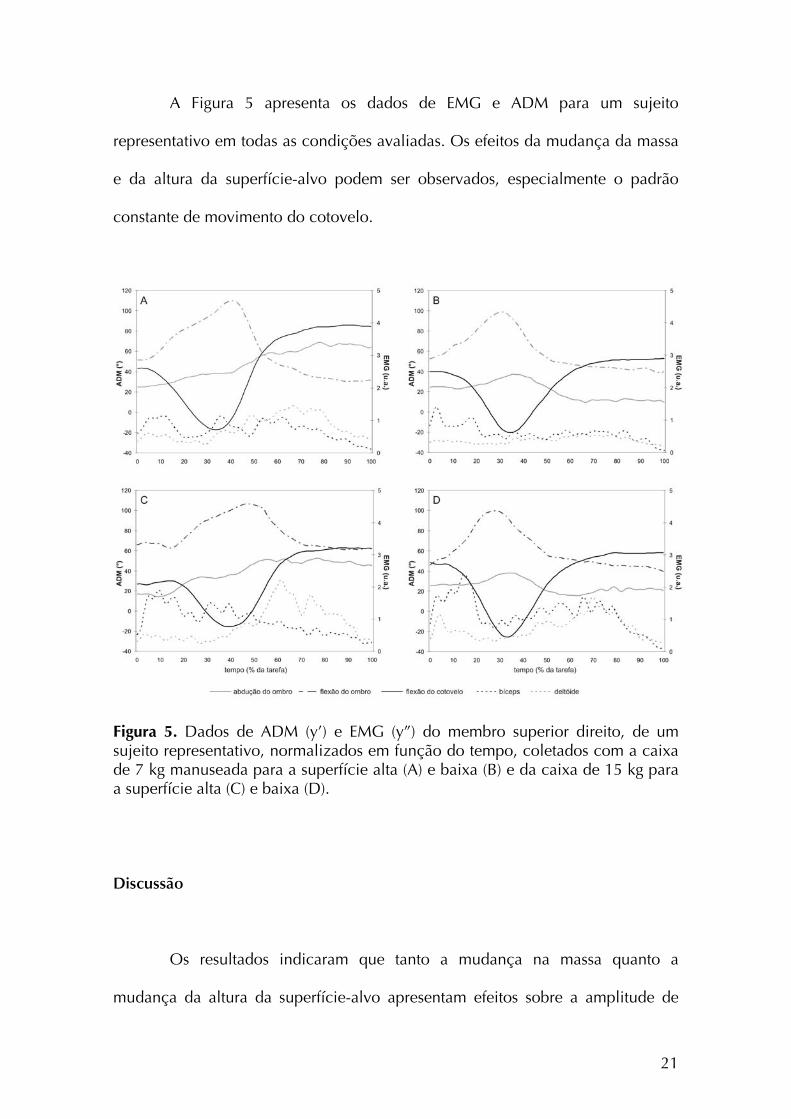
A Figura 5 apresenta os dados de EMG e ADM para um sujeito
representativo em todas as condições avaliadas. Os efeitos da mudança da massa
e da altura da superfície-alvo podem ser observados, especialmente o padrão
constante de movimento do cotovelo.
Figura 5. Dados de ADM (y’) e EMG (y”) do membro superior direito, de um sujeito representativo, normalizados em função do tempo, coletados com a caixa de 7 kg manuseada para a superfície alta (A) e baixa (B) e da caixa de 15 kg para a superfície alta (C) e baixa (D).
Discussão
Os resultados indicaram que tanto a mudança na massa quanto a
mudança da altura da superfície-alvo apresentam efeitos sobre a amplitude de
21
movimento e atividade eletromiográfica do segmento avaliado. A mudança na
massa da carga influenciou tanto o comportamento muscular quanto o postural,
mas o efeito mais pronunciado ocorreu sobre a atividade muscular. Maior
ativação EMG foi registrada para o bíceps e deltóide quando os sujeitos
manusearam a massa de 15 kg em comparação à massa de 7 kg. O maior esforço
necessário para transferir a caixa mais pesada pode explicar esta diferença. De
acordo com Kumar (1996) é possível estabelecer uma relação entre a carga
externa mantida nas mãos e a carga muscular. Está bem estabelecido na literatura
o fato de que o manuseio de cargas mais pesadas envolve altos níveis de esforço
na coluna lombar (DAVIS e MARRAS 2000). Um comportamento similar foi
observado nos músculos do membro superior. No estudo do manuseio manual de
objetos cilíndricos, Habes et al (1985) relataram a ocorrência de aumento na
amplitude EMG que apresentaram magnitude de 150 e 94% para o deltóide e
bíceps, respectivamente, quando a massa do cilindro aumentou de 40 para 80%
da contração voluntária máxima (CVM) dos sujeitos. Estes resultados corroboram
os dados apresentados no presente estudo, mesmo considerando as diferenças
nos parâmetros dos estudos relacionados à forma e tamanho do objeto
manuseado (cilindros versus caixas).
O aumento da massa da caixa também modificou a ADM, mas em menor
dimensão. Este resultado concorda com os achados de Authier et al (1995), que
relataram pequena modificação na técnica de manuseio diante da modificação da
massa manuseada. Eles atribuíram este resultado à pequena variação de massa
utilizada no experimento (incrementos de 10 kg), sendo insuficiente para causar
mudanças significativas. Uma vez que o incremento utilizado neste estudo foi
ainda menor (8 kg), a mesma tendência parece ter ocorrido nos sujeitos avaliados.
22
Modificações na altura da superfície-alvo do manuseio apresentaram um
claro efeito tanto na atividade muscular quanto nas posturas registradas, mas o
efeito mais expressivo foi registrado para a postura. Em geral, maior atividade
muscular foi registrada quando a caixa foi transferida para a superfície alta. Este
resultado é similar aos encontrados na literatura (HABES et al, 1985; NIELSEN et
al, 1998; ANDERSON et al, 2007). Habes et al (1985) também encontraram
aumento na carga dos músculos do ombro quando a altura da superfície de
destino da carga foi posicionada no nível dos olhos. Entretanto, os autores
relataram que os efeitos mais expressivos da mudança da altura ocorreram no
bíceps e não no deltóide, como identificado neste estudo. Diferenças na postura
promovidas pelo tamanho e forma do objeto manuseado podem explicar esta
divergência. A disposição e organização da tarefa também podem estar
associadas a este resultado. Nielsen et al (1998) avaliaram a carga muscular nos
ombros e coluna lombar a partir da aplicação da FPDA nos dados de atividade
muscular dos músculos trapézio e eretores da espinha, respectivamente. Os
autores relataram aumento na carga muscular do ombro quando os sujeitos
levantaram uma caixa de 10 kg de uma superfície alta (cerca de 120 cm),
comparado ao levantamento realizado a partir de superfícies mais baixas. Embora
os músculos utilizados no presente estudo para representar a carga muscular do
ombro sejam diferentes, os resultados apresentados neste estudo concordam com
aqueles apresentados por Nielsen et al (1998). Anderson et al (2007) relataram
aumento na atividade muscular do bíceps e deltóide quando a altura de uma
atividade de manuseio de halteres aumentou do nível dos dedos e cotovelo para
o nível dos ombros. Embora a atividade avaliada tenha sido diferente, os
resultados concordam com aqueles apresentados.
23
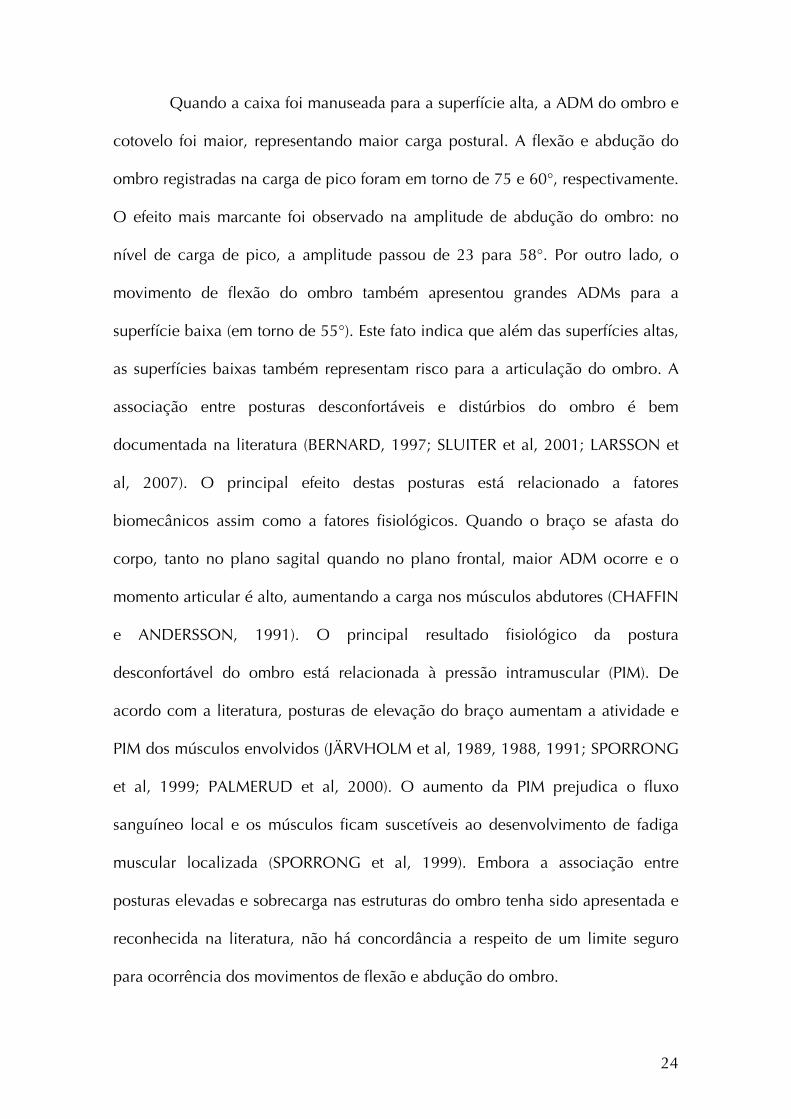
Quando a caixa foi manuseada para a superfície alta, a ADM do ombro e
cotovelo foi maior, representando maior carga postural. A flexão e abdução do
ombro registradas na carga de pico foram em torno de 75 e 60°, respectivamente.
O efeito mais marcante foi observado na amplitude de abdução do ombro: no
nível de carga de pico, a amplitude passou de 23 para 58°. Por outro lado, o
movimento de flexão do ombro também apresentou grandes ADMs para a
superfície baixa (em torno de 55°). Este fato indica que além das superfícies altas,
as superfícies baixas também representam risco para a articulação do ombro. A
associação entre posturas desconfortáveis e distúrbios do ombro é bem
documentada na literatura (BERNARD, 1997; SLUITER et al, 2001; LARSSON et
al, 2007). O principal efeito destas posturas está relacionado a fatores
biomecânicos assim como a fatores fisiológicos. Quando o braço se afasta do
corpo, tanto no plano sagital quando no plano frontal, maior ADM ocorre e o
momento articular é alto, aumentando a carga nos músculos abdutores (CHAFFIN
e ANDERSSON, 1991). O principal resultado fisiológico da postura
desconfortável do ombro está relacionada à pressão intramuscular (PIM). De
acordo com a literatura, posturas de elevação do braço aumentam a atividade e
PIM dos músculos envolvidos (JÄRVHOLM et al, 1989, 1988, 1991; SPORRONG
et al, 1999; PALMERUD et al, 2000). O aumento da PIM prejudica o fluxo
sanguíneo local e os músculos ficam suscetíveis ao desenvolvimento de fadiga
muscular localizada (SPORRONG et al, 1999). Embora a associação entre
posturas elevadas e sobrecarga nas estruturas do ombro tenha sido apresentada e
reconhecida na literatura, não há concordância a respeito de um limite seguro
para ocorrência dos movimentos de flexão e abdução do ombro.
24
Hoozemans et al (2008) relataram que o aumento da altura de
levantamento está associado à diminuição da carga lombar. Eles avaliaram alturas
entre 32 e 155 cm e recomendam que a otimização da altura vertical de
localização da carga seja priorizada em relação à diminuição da massa da carga.
Nossos resultados concordam com esta recomendação, mas apontam que alturas
próximas ao nível dos ombros (em torno de 140 cm) devem ser evitadas, para que
as posturas do ombro ocorram em amplitudes que não comprometam as
estruturas articulares. A localização vertical da carga deve ser fixada próxima ao
nível da cintura, evitando sobrecarga tanto para a coluna quanto para os
membros superiores.
A ADM do cotovelo não parece fornecer risco para o sistema
musculoesquelético de acordo com os resultados apresentados. Amplitudes de 80
a 120° (MURRAY et al 1995) e de 90 a 120° (KROEMER e GRANDJEAN, 2000)
têm sido propostas como faixas seguras para a flexão do cotovelo. De acordo
com estes autores, a habilidade em gerar torque é maior nesta faixa de
movimento. Em geral, as posturas de cotovelo registradas neste estudo estiveram
dentro destas faixas de segurança.
Enquanto a caixa foi transferida de uma superfície para outra, os sujeitos
não apresentaram diferenças nas posturas ou atividade muscular registradas para
os lados direito e esquerdo. Parece que os sujeitos manusearam a caixa de forma
simétrica, embora nenhuma instrução sobre como realizar a atividade tenha sido
fornecida no início do experimento. A maior vantagem mecânica oferecida pela
simetria pode explicar esta escolha espontânea.
A comparação entre sujeitos experientes e inexperientes não mostrou
nenhuma diferença estatisticamente significante em nenhuma condição estudada.
25
Os resultados apresentados por Authier et al (1996) mostraram que trabalhadores
experientes utilizam uma ampla variedade de preensões e estratégias para realizar
mesmo uma tarefa simples de manuseio. Estas estratégias afetam positivamente a
mecânica corporal e são biomecanicamente mais vantajosas (GAGNON, 2005).
Nenhuma diferença entre experientes e inexperientes foi identificada no presente
estudo. Este fato está provavelmente relacionado ao formato da caixa utilizada.
Esta caixa foi instrumentada com células de carga e para que os sensores
posicionados na superfície inferior da caixa fossem calibrados, três “pés” foram
incluídos em sua base. Estes suportes mantêm a caixa suspensa, isto é, a
superfície inferior da caixa não estava em contato com a prateleira sobre a qual
estava posicionada. Este fato possibilitou que os sujeitos pudessem apreender a
caixa utilizando todas as superfícies, sem que tivessem qualquer obstáculo. Desta
forma o uso da face inferior não implicava em mover a caixa e ajustar o
posicionamento das mãos. Esta possibilidade parece ter permitido que os sujeitos
utilizassem uma estratégia de preensão simples e mais econômica, usando a
superfície inferior da caixa.
Esta estratégia precisa ser melhor investigada em estudos futuros devido
ao seu potencial vantajoso do ponto de vista biomecânico. Adicionalmente, mais
estudos são necessários para contribuir com informações sobre a carga nos
ombros e uso de superfícies baixas em atividades de manuseio de carga.
Adicionalmente, um melhor entendimento da atividade muscular seria possível a
partir da inclusão de um modelo de força, considerando a relação
comprimento/tensão e força/velocidade em manuseios assimétricos.
Os músculos bíceps e deltóide foram avaliados uma vez que
desempenham um papel importante nos movimentos do ombro. Coury et al
26
(1998) relataram alta atividade do bíceps quando a força de adução foi testada
em várias combinações de posturas do ombro e cotovelo. Estas posturas
reproduziam aquelas utilizadas frequentemente em atividades industriais,
incluindo tarefas de manuseio. A principal conclusão foi que músculos
multifuncionais, como o bíceps, são sobrecarregados durante estes tipos de
atividades. Considerando este músculo como flexor do ombro e cotovelo, e o fato
de que o deltóide tem um papel importante na ação de abdução, esses dois
músculos parecem ser relevantes no estudo da carga muscular ocupacional.
Ainda, de acordo com Bjelle et al (1981), elevações repetitivas do braço durante
o trabalho, definidas como flexões e abduções acima de 60° representam um
fator significante nos distúrbios do ombro e pescoço entre trabalhadores
industriais.
De maneira geral, atividade muscular e movimentos do ombro foram
afetados tanto pela massa da carga quanto pela altura da superfície-alvo no
manuseio. Considerando que execução de força e posturas desconfortáveis
consistem em importantes fatores de risco para o desenvolvimento de distúrbios
osteomusculares na região do ombro, mais atenção deve ser dada à estes fatores
no planejamento ou redesenho de postos de trabalho. Sabe-se que superfícies
baixas podem promover altas cargas na coluna lombar durante atividades de
manuseio de carga, mas os resultados apresentados neste estudo mostram que
estas superfícies também oferecem riscos para os ombros, já que podem resultar
em amplitudes extremas de flexão da articulação. Esta é uma nova evidência, já
que as posturas do ombro durante atividades de manuseio não têm sido
avaliadas. Outro aspecto deste estudo é o seu desenho, que permitiu aos sujeitos
27

a realização da tarefa sem restrição do posicionamento dos pés, reproduzindo
condições ocupacionais reais.
28
DESDOBRAMENTOS A PARTIR DO ESTUDO INICIAL
O primeiro estudo apontou que houve certa homogeneidade no tipo de
preensão realizado. Indivíduos experientes e inexperientes adotaram a preensão
látero-inferior em todas as condições avaliadas. Esta preensão é caracterizada
pelo posicionamento das mãos nas faces laterais e inferiores da carga. Este
resultado diverge dos dados apresentados por Authier et al (1996), que
observaram até 40 combinações de pega e inclinação da carga entre o grupo de
sujeitos experientes avaliado. Os autores também relataram que sujeitos
inexperientes não apresentaram essa variação nos tipos de preensão ou mesmo na
inclinação da carga.
Uma possível explicação para o resultado observado é o formato da caixa
utilizada. Esta caixa foi desenvolvida especialmente para avaliação da atividade
de manuseio (PADULA e COURY, 2004) e apresenta células de carga acopladas
em suas faces para registro da força de preensão. Nesse sentido, ela possui três
apoios (“pés”) que a mantém suspensa com relação à superfície, condição
necessária para a calibração das células de carga das faces inferiores antes de
cada experimento. Este fato permitiu, então, que todas as superfícies da caixa
estivessem livres para o contato no momento do manuseio. Mediante essa
possibilidade, todos os sujeitos, sem exceção, mostraram preferência pela
preensão látero-inferior.
Para entender a ocorrência de homogeneidade no tipo de preensão
realizado e avaliar se a preensão látero-inferior, preferida pelos sujeitos nesta
condição, é biomecanicamente mais vantajosa, seja pela análise das posturas do
29
punho (flexo-extensão e desvios radial e ulnar), seja pela força de preensão
registrada, um segundo estudo (Estudo 2) foi desenvolvido. Além de descrever os
tipos de preensão realizados por sujeitos experientes e inexperientes, foi objetivo
do estudo descrever a força de preensão e movimentos do punho de acordo com
a pega realizada, considerando diferentes alturas de superfície-alvo, uma vez que
o layout da tarefa interfere na carga imposta ao membro superior. Ainda, as
amplitudes de movimento registradas para a articulação do punho foram
avaliadas de acordo com a amplitude de movimento segura proposta pela
literatura.
30
ESTUDO 2
COMO UMA CAIXA É MANUSEADA QUANDO TODAS AS FACES ESTÃO
LIVRES PARA O CONTATO?
OLIVEIRA AB, PÁLINKÁS ESL, SILVA LCCB, PADULA RS, COURY HJCG. How is
a box handled when all sides are free for contact? Manuscrito em fase final de
redação para submissão ao periódico APPLIED ERGONOMICS.
31
Introdução
Atividades ocupacionais envolvendo o manuseio de caixas têm sido
associadas ao desenvolvimento de distúrbios musculoesqueléticos. De acordo
com estudos epidemiológicos, trabalhadores que realizam atividades de
manuseio de cargas apresentam problemas principalmente na região lombar
(STRAKER, 1999). Recentemente mais atenção tem sido direcionada a outros
segmentos corporais quando o foco é a carga gerada durante o manuseio. A carga
imposta ao ombro tem sido também avaliada (NIELSEN et al, 1998; OLIVEIRA e
COURY, submetido), assim como aquela imposta ao punho, particularmente
considerando-se o efeito de tipos e posições de alças e manoplas na postura e
carga de trabalho (ANDO et al, 2000; DAVIS et al, 1998; DRURY et al, 1989a e
1989b; WANG et al, 2000). Neste contexto, a equação de levantamento NIOSH,
desenvolvida pelo Instituto Nacional de Segurança e Saúde Ocupacional
(National Institute for Occupational Safety and Health, NIOSH) em 1981, foi
revisada em 1991, quando os tipos de preensão passaram a ser considerados
como um novo multiplicador (WATERS et al, 1993).
De fato, a natureza do acoplamento mão-objeto é muito importante
porque pode determinar a postura do punho e mãos, assim como a carga imposta
a estes segmentos. Neste sentido, a principal abordagem de estudos envolvendo a
avaliação de punho e mãos durante tarefas de manuseio é o estudo de alças e
manoplas (CHUNG e WANG, 2001; COURY e DRURY 1982; DRURY, 1980;
WANG et al, 2000). Estes estudos têm fornecido informações a respeito de como
a angulação da alça/manopla pode afetar os desvios do punho e capacidade de
32
levantamento sob diferentes condições de trabalho (variação de massa da carga e
altura da tarefa).
O conhecimento gerado a partir destes estudos pode ser útil uma vez que
a associação entre desvios amplos do punho e realização de força têm sido
reconhecidos como perigosos (BERNARD et al, 1997; WANG et al, 2000). No
entanto, a presença de alças e manoplas em caixas e recipientes comerciais não é
comum. Drury et al (1982), depois de realizar um amplo levantamento a respeito
do manuseio realizado em contexto industrial, relatou que apenas 2,6% das
caixas utilizadas possuem alças. Também foi observado, mesmo quando
disponível, as alças não são necessariamente utilizadas pelos trabalhadores.
Questões práticas relacionadas ao desenho das alças podem estar envolvidas e
devem ser investigadas.
A posição das mãos, massa da carga, superfícies-alvo e experiência dos
trabalhadores parecem ser outras questões relevantes na avaliação da carga de
trabalho. Estes itens foram previamente explorados, mas, com relação à avaliação
do punho, existem algumas limitações. Uma característica importante dos estudos
que avaliaram posicionamento das mãos em atividades de manuseio é que a
caixa sempre era colocada sobre uma superfície plana, o que gerava restrições,
uma vez que os sujeitos tinham livre acesso apenas às faces laterais e superior da
caixa.
Considerando que caixas que permitem livre acesso também à face
inferior nunca foi investigada até então, seria útil testar como sujeitos experientes
e inexperientes em atividades de manuseio pegariam este tipo de caixa para
realização da tarefa. Para contribuir com esta informação, os objetivos do estudo
foram (1) descrever os tipos de preensão realizados por sujeitos experientes e
33
inexperientes no manuseio de uma caixa que possibilita livre acesso a todas as
faces; (2) descrever a força de preensão e movimentos do punho de acordo com a
preensão realizada, considerando diferentes alturas de superfície-alvo; (3) avaliar
as amplitudes de movimento do punho registradas de acordo com a amplitude de
movimento segura proposta pela literatura.
Métodos
Sujeitos
Vinte e oito homens destros, com idade média de 22,3 (± 4,3) anos,
altura média de 1,7 (± 0,04) m e peso médio de 69,1 (± 8,7) kg, foram recrutados
para participar do experimento. Dos vinte e oito sujeitos, 14 eram experientes em
tarefas de manuseio de carga (no mínimo 6 meses de trabalho em atividades que
incluíam o manuseio manual de cargas em estoques de supermercados e outras
lojas de varejo) e 14 inexperientes neste tipo de tarefa (estudantes, sem
experiência profissional em manuseio manual de caixas). Os critérios de
exclusão compreenderam a presença de sintomas ou distúrbios
musculoesqueléticos, doenças gerais, limitação na amplitude de movimentos,
desvios posturais aparentes ou problemas de equilíbrio. Todos os sujeitos
assinaram um Termo de Consentimento Formal, Livre e Esclarecido, previamente
aprovado pelo comitê de ética local (Processo 059/04).
34
Protocolo
Os sujeitos manusearam uma caixa (com massa de 11 kg) em uma
estante fixa, de uma prateleira (superfície intermediária – SI – 102,5 cm, próxima
ao nível da cintura) para outra, sendo alta (superfície alta – SA – 142,5 cm) e
baixa (superfície baixa – SB – 62,5 cm). Os sujeitos pegaram a caixa da SI e
transferiram-na para uma superfície de altura pré-determinada (SA ou SB). A
altura da superfície foi aleatorizada. Nenhuma instrução específica sobre posturas
para realizar a atividade ou sobre como pegar a caixa foram fornecidas aos
sujeitos. Antes do início do experimento os sujeitos foram informados sobre a
posição inicial e final da caixa e também sobre o momento de início da coleta de
dados.
Coleta de dados e equipamentos
Dados simultâneos foram registrados durante todo o experimento a partir
de células de carga acopladas à caixa, eletrogoniômetro e câmera de vídeo. Um
eletrogoniômetro biaxial (XM 65 Biometrics Ltd, Gwent, UK) foi utilizado para
registro dos movimentos de flexo-extensão e desvios do punho direito. O terminal
telescópico do eletrogoniômetro foi fixado no dorso da mão, sobre o terceiro
metacarpo e o terminal fixo, sobre a linha média do antebraço. A posição de
referência foi registrada com o sujeito em pé e os braços relaxados sobre uma
mesa, antebraços pronados e punho em posição neutra. Os dados foram
coletados a partir da Unidade de Aquisição DataLINK (Biometrics Ltd, Gwent,
UK) durante todo o experimento.
Uma caixa de metal construída especialmente para avaliar tarefas de
manuseio de cargas (PADULA e COURY, 2004) foi utilizada neste estudo. Esta
35
caixa mede 300 (mm em comprimento) x 300 (mm em profundidade) x 180 (mm
em altura) e foi instrumentada com duas células de carga nas laterais, e duas no
fundo da caixa, para permitir registro da força de preensão durante a realização
da atividade (ilustração detalhada no ANEXO III). Cada célula de carga foi
conectada à unidade de aquisição DataLink (Biometrics Ltd, Gwent, UK) e os
dados foram coletados a partir do programa DataLink (2.0, Biometrics Ltd), com
freqüência de amostragem de 100 Hz. A caixa apresentava três “pés” para suporte
em sua base, que permitiam o procedimento de calibração das células de carga.
Estes suportes também permitiam que os sujeitos apreendessem a caixa utilizando
qualquer um dos lados, incluindo a superfície inferior. Para descrever a posição
das mãos utilizada pelos sujeitos para o manuseio da caixa, imagens do plano
sagital (vista direita) foram coletadas durante o experimento a partir de uma
filmadora digital (GR-DV 1800, JVC).
Processamento e análise dos dados
Embora movimentos do punho e força de preensão tenham sido
coletados durante todo o experimento, apenas as fases de manuseio foram
analisadas. A fase de manuseio foi definida como o tempo durante o qual o
sujeito permaneceu com as mãos em contato com a caixa, aplicando forças
maiores que um limite pré-estabelecido. O início e final de cada manuseio foi
definido como o momento no qual a soma da força aplicada nas faces inferiores e
laterais da caixa era maior e menor que 3 N, respectivamente.
Todos os dados foram processados a partir do software MatLab® (versão
7.0.1, MathWorks Inc., Natick, USA). Os registros eletrogoniométricos foram
filtrados com filtro Butterworth de 2ª ordem, passa-baixa de 5 Hz e atraso de fase
36
zero. Depois de filtrados, os dados foram utilizados para identificação do início e
final de cada fase de manuseio. O valor médio da força aplicada em cada face da
caixa foi calculado para cada fase de manuseio. Os percentis de distribuição de
amplitude (FPDA) 10º, 50º e 90º foram utilizados para descrever e comparar
movimentos do punho entre as condições avaliadas. A análise a partir dos
percentis fornece as amplitudes realizadas durante os manuseios e permite a
comparação destes ângulos com aqueles propostos como seguros pela literatura.
Paschoarelli et al (2008), a partir de revisão da literatura disponível, propuseram a
amplitude de 15° como máxima para os movimentos de flexo-extensão e desvio
ulnar do punho e 10° como máximo desvio radial da articulação. Estas
amplitudes representam faixas seguras, dentro das quais, menor risco de lesão e
sobrecarga musculoesquelética é identificado.
Estatística
Os dados foram testados para normalidade e homogeneidade a partir da
aplicação dos testes de Shapiro Wilk e Levene, respectivamente. A ANOVA 2-
way foi aplicada nos dados cinemáticos para comparar grupos e alturas de
manuseio. A ANOVA 3-way foi utilizada para os dados de força de preensão para
comparar grupos, alturas e faces da caixa. O teste HSD de Tukey foi utilizado
como análise post-hoc. O nível alfa foi estabelecido a 5% para todas as análises,
realizadas no software Statistica (versão 7, StatSoft, Inc., Tulsa, USA).
37
Resultados
Posicionamento das mãos
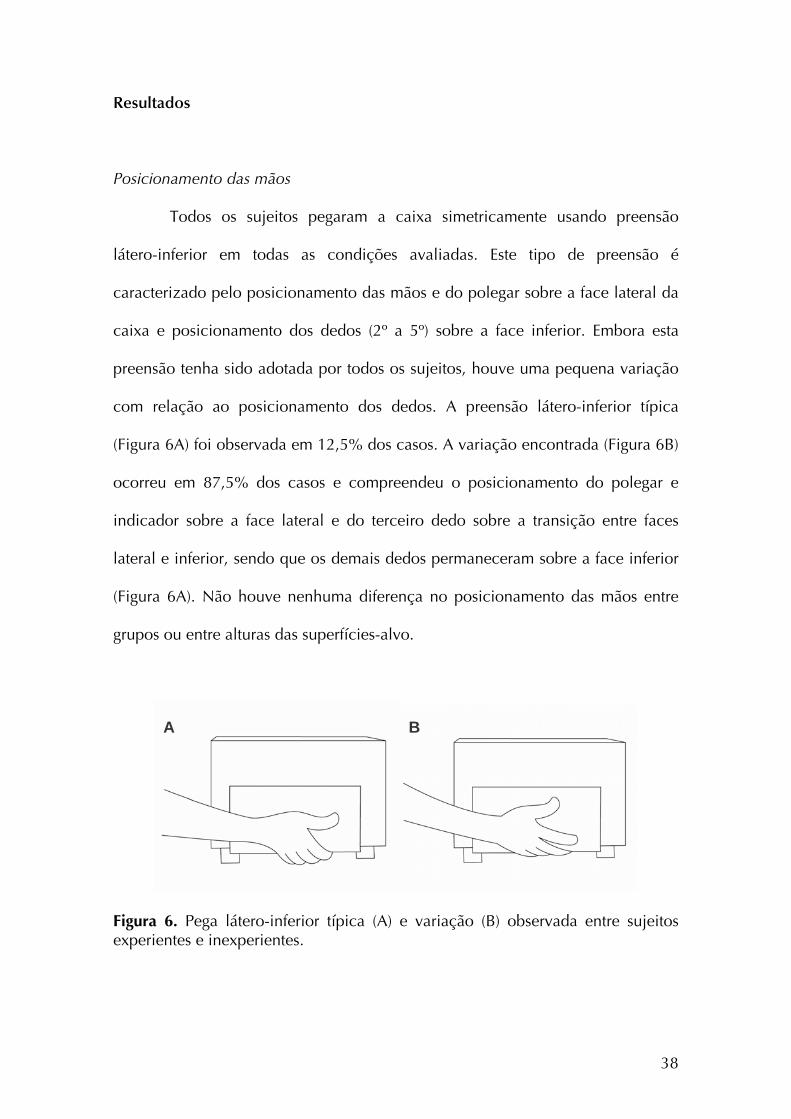
Todos os sujeitos pegaram a caixa simetricamente usando preensão
látero-inferior em todas as condições avaliadas. Este tipo de preensão é
caracterizado pelo posicionamento das mãos e do polegar sobre a face lateral da
caixa e posicionamento dos dedos (2º a 5º) sobre a face inferior. Embora esta
preensão tenha sido adotada por todos os sujeitos, houve uma pequena variação
com relação ao posicionamento dos dedos. A preensão látero-inferior típica
(Figura 6A) foi observada em 12,5% dos casos. A variação encontrada (Figura 6B)
ocorreu em 87,5% dos casos e compreendeu o posicionamento do polegar e
indicador sobre a face lateral e do terceiro dedo sobre a transição entre faces
lateral e inferior, sendo que os demais dedos permaneceram sobre a face inferior
(Figura 6A). Não houve nenhuma diferença no posicionamento das mãos entre
grupos ou entre alturas das superfícies-alvo.
A B
Figura 6. Pega látero-inferior típica (A) e variação (B) observada entre sujeitos experientes e inexperientes.
38
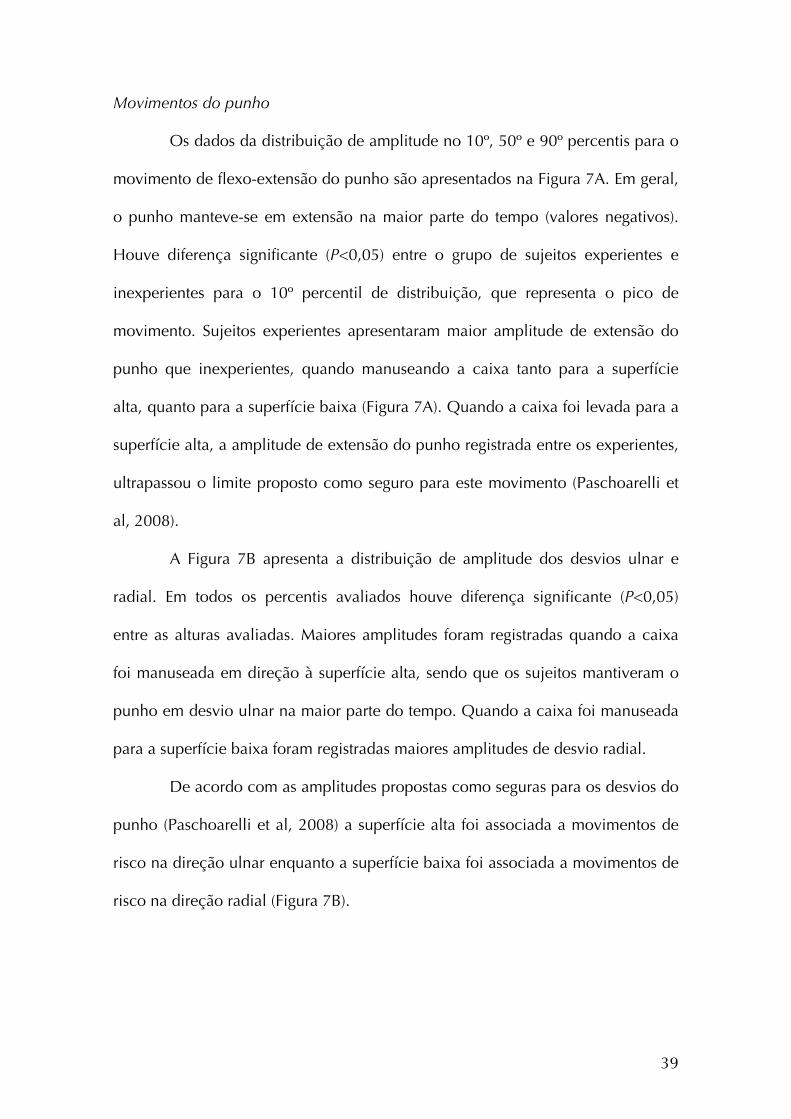
Movimentos do punho
Os dados da distribuição de amplitude no 10º, 50º e 90º percentis para o
movimento de flexo-extensão do punho são apresentados na Figura 7A. Em geral,
o punho manteve-se em extensão na maior parte do tempo (valores negativos).
Houve diferença significante (P<0,05) entre o grupo de sujeitos experientes e
inexperientes para o 10º percentil de distribuição, que representa o pico de
movimento. Sujeitos experientes apresentaram maior amplitude de extensão do
punho que inexperientes, quando manuseando a caixa tanto para a superfície
alta, quanto para a superfície baixa (Figura 7A). Quando a caixa foi levada para a
superfície alta, a amplitude de extensão do punho registrada entre os experientes,
ultrapassou o limite proposto como seguro para este movimento (Paschoarelli et
al, 2008).
A Figura 7B apresenta a distribuição de amplitude dos desvios ulnar e
radial. Em todos os percentis avaliados houve diferença significante (P<0,05)
entre as alturas avaliadas. Maiores amplitudes foram registradas quando a caixa
foi manuseada em direção à superfície alta, sendo que os sujeitos mantiveram o
punho em desvio ulnar na maior parte do tempo. Quando a caixa foi manuseada
para a superfície baixa foram registradas maiores amplitudes de desvio radial.
De acordo com as amplitudes propostas como seguras para os desvios do
punho (Paschoarelli et al, 2008) a superfície alta foi associada a movimentos de
risco na direção ulnar enquanto a superfície baixa foi associada a movimentos de
risco na direção radial (Figura 7B).
39
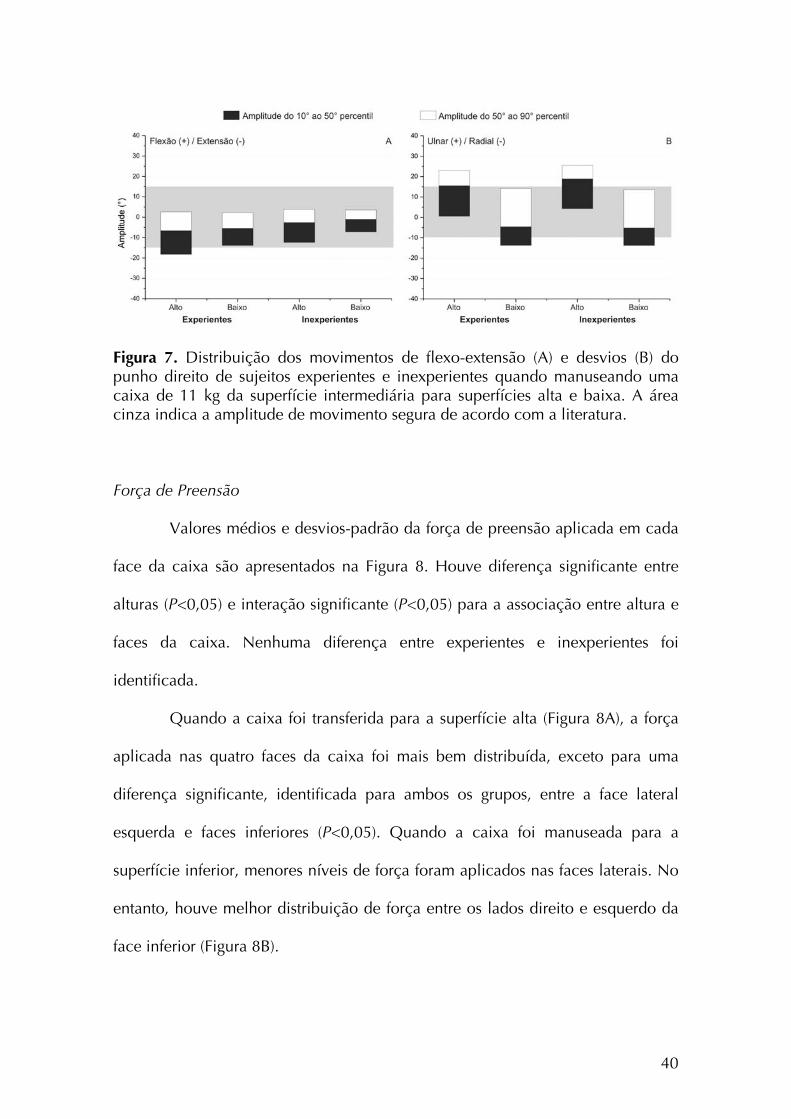
Figura 7. Distribuição dos movimentos de flexo-extensão (A) e desvios (B) do punho direito de sujeitos experientes e inexperientes quando manuseando uma caixa de 11 kg da superfície intermediária para superfícies alta e baixa. A área cinza indica a amplitude de movimento segura de acordo com a literatura. Força de Preensão
Valores médios e desvios-padrão da força de preensão aplicada em cada
face da caixa são apresentados na Figura 8. Houve diferença significante entre
alturas (P<0,05) e interação significante (P<0,05) para a associação entre altura e
faces da caixa. Nenhuma diferença entre experientes e inexperientes foi
identificada.
Quando a caixa foi transferida para a superfície alta (Figura 8A), a força
aplicada nas quatro faces da caixa foi mais bem distribuída, exceto para uma
diferença significante, identificada para ambos os grupos, entre a face lateral
esquerda e faces inferiores (P<0,05). Quando a caixa foi manuseada para a
superfície inferior, menores níveis de força foram aplicados nas faces laterais. No
entanto, houve melhor distribuição de força entre os lados direito e esquerdo da
face inferior (Figura 8B).
40
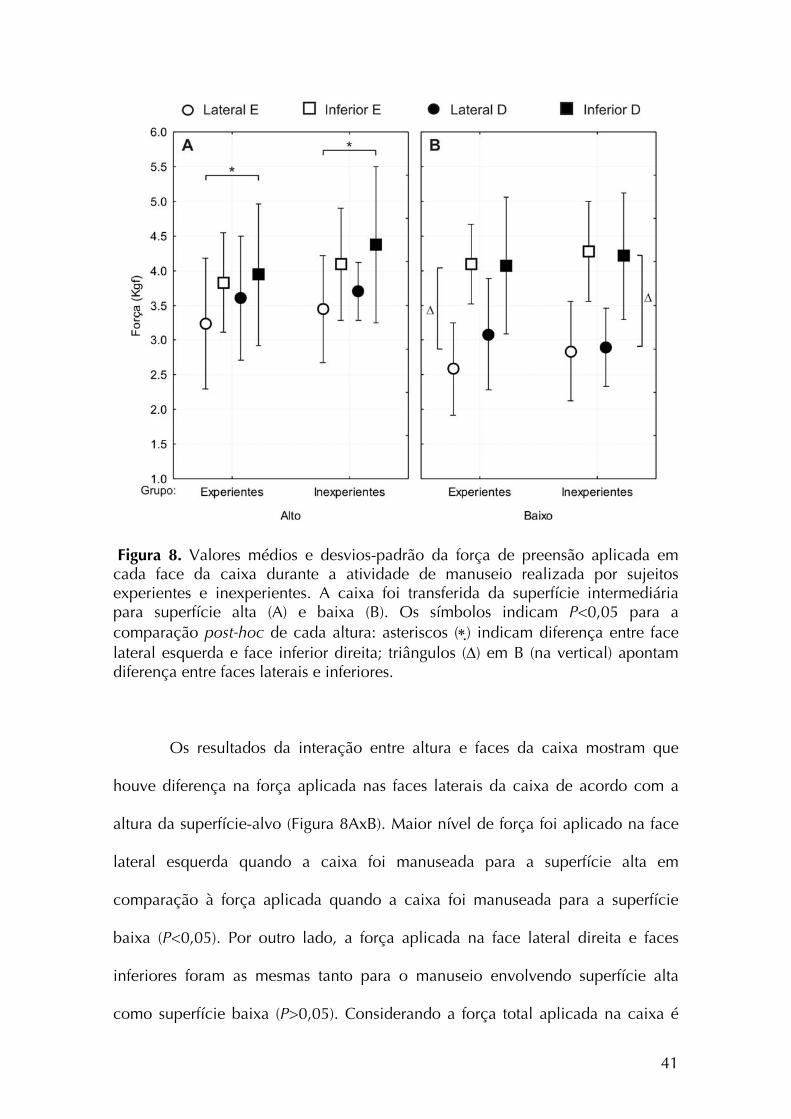
Figura 8. Valores médios e desvios-padrão da força de preensão aplicada em cada face da caixa durante a atividade de manuseio realizada por sujeitos experientes e inexperientes. A caixa foi transferida da superfície intermediária para superfície alta (A) e baixa (B). Os símbolos indicam P<0,05 para a comparação post-hoc de cada altura: asteriscos (∗) indicam diferença entre face lateral esquerda e face inferior direita; triângulos (Δ) em B (na vertical) apontam diferença entre faces laterais e inferiores.
Os resultados da interação entre altura e faces da caixa mostram que
houve diferença na força aplicada nas faces laterais da caixa de acordo com a
altura da superfície-alvo (Figura 8AxB). Maior nível de força foi aplicado na face
lateral esquerda quando a caixa foi manuseada para a superfície alta em
comparação à força aplicada quando a caixa foi manuseada para a superfície
baixa (P<0,05). Por outro lado, a força aplicada na face lateral direita e faces
inferiores foram as mesmas tanto para o manuseio envolvendo superfície alta
como superfície baixa (P>0,05). Considerando a força total aplicada na caixa é
41
possível concluir que maior nível de força foi necessário para mover a caixa para
a superfície alta.
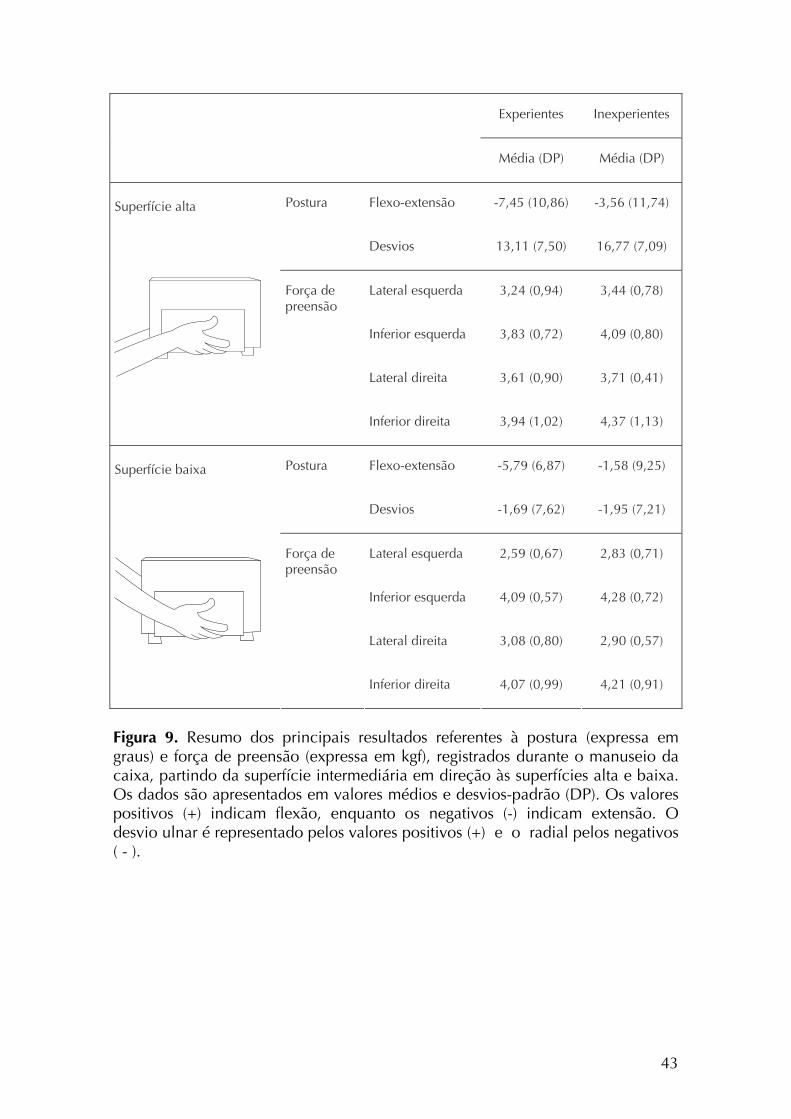
A Figura 9 apresenta um resumo dos dados de postura e força de
preensão. É possível verificar que maiores desvios do punho ocorreram quando a
caixa foi levada para a superfície alta. Nesta condição, maiores níveis de força
foram exercidos, considerando as faces laterais da caixa.
42
Experientes Inexperientes
Média (DP) Média (DP)
Postura Flexo-extensão -7,45 (10,86) -3,56 (11,74)
Desvios 13,11 (7,50) 16,77 (7,09)
Força de preensão
Lateral esquerda 3,24 (0,94) 3,44 (0,78)
Inferior esquerda 3,83 (0,72) 4,09 (0,80)
Lateral direita 3,61 (0,90) 3,71 (0,41)
Superfície alta
Inferior direita 3,94 (1,02) 4,37 (1,13)
Postura Flexo-extensão -5,79 (6,87) -1,58 (9,25)
Desvios -1,69 (7,62) -1,95 (7,21)
Força de preensão
Lateral esquerda 2,59 (0,67) 2,83 (0,71)
Inferior esquerda 4,09 (0,57) 4,28 (0,72)
Lateral direita 3,08 (0,80) 2,90 (0,57)
Superfície baixa
Inferior direita 4,07 (0,99) 4,21 (0,91)
Figura 9. Resumo dos principais resultados referentes à postura (expressa em graus) e força de preensão (expressa em kgf), registrados durante o manuseio da caixa, partindo da superfície intermediária em direção às superfícies alta e baixa. Os dados são apresentados em valores médios e desvios-padrão (DP). Os valores positivos (+) indicam flexão, enquanto os negativos (-) indicam extensão. O desvio ulnar é representado pelos valores positivos (+) e o radial pelos negativos ( - ).
43
Discussão
Sujeitos experientes e inexperientes manusearam a caixa para superfície
alta e baixa utilizando exclusivamente as faces laterais e inferior da caixa (pega
látero-inferior). Estudos a respeito do posicionamento das mãos têm mostrado que
sujeitos tendem a utilizar diferentes tipos de pega para manusear uma caixa
quando na ausência de alças e manoplas (AUTHIER et al, 1995; DRURY et al,
1982; PADULA et al, 2006). O fato interessante é que nenhum outro
posicionamento das mãos foi identificado no presente estudo e apenas uma
pequena variação foi registrada em relação ao posicionamento dos dedos sobre a
face lateral ou inferior da caixa. Então, quando houve livre acesso à face inferior
da caixa, os sujeitos preferiram utilizar esta face para realizar o manuseio.
A preferência pelo uso da face inferior parece ser justificada por
vantagens biomecânicas. Uma série de estudos realizados por Drury e
colaboradores (1982, 1985, 1989b) mostrou que quando as mãos estão
posicionadas sob a caixa, ou seja, na face inferior, a força exercida para
manusear a carga pode ser baixa se comparada à força gerada quando a mão está
posicionada em outros pontos da caixa. Manter as mãos sob a caixa pode permitir
maior geração de força muscular. Nesta condição, o bíceps, que é um músculo
forte e biarticular, é capaz de gerar grandes torques quando o cotovelo é mantido
entre 80 e 100° de flexão (MURRAY et al, 1995). Ainda, este posicionamento das
mãos pode facilitar o desenvolvimento de força adutora devido à posição neutra
do antebraço em relação ao movimento de prono-supinação, fornecendo um
bom ajuste entre mãos e caixa. Dados apresentados por Coury et al (1998)
mostraram que o bíceps estava altamente ativo durante tarefas de compressão em
44
adução, realizadas em um equipamento que reproduzia o movimento realizado
durante o manuseio de uma caixa. Considerando o fato de que o bíceps é ativado
tanto para suportar a caixa quanto para estabilizar segmentos durante a
compressão em adução é importante que sua ação possa ocorrer em vantagem
mecânica. O posicionamento das mãos sobre as faces laterais e inferior, adotado
pelos sujeitos avaliados neste estudo, parece fornecer esta vantagem. O uso das
faces lateral e inferior possibilita maior superfície de contato da mão na caixa,
gerando melhor acoplamento e distribuição da carga.
O posicionamento das mãos adotado pelos sujeitos experientes e
inexperientes durante a tarefa de manuseio ocorreu de forma simétrica. De
acordo com Deeb et al (1985), o posicionamento simétrico das mãos minimiza as
forças neste segmento. A escolha de posicionar as mãos de forma simétrica nas
faces lateral e inferior parece ter sido eficiente para os sujeitos avaliados no
presente estudo, uma vez que esta foi mantida durante as tarefas.
Extensão e desvio ulnar do punho foram predominantes durante a
atividade avaliada, exceto para o 50º e 90º percentis, quando o manuseio foi
realizado para a superfície baixa. Nesta condição, o desvio radial foi prevalente.
Os dados de flexo-extensão do punho consistem em uma informação
relativamente nova, uma vez que a maioria dos estudos que avaliam posturas do
punho durante o manuseio tem registrado apenas os desvios ulnar e radial da
articulação. A flexo-extensão não foi influenciada pela altura da superfície-alvo.
Na maior parte do tempo os movimentos ocorreram dentro da faixa tida como
segura. No entanto, sujeitos experientes apresentaram maior amplitude de
extensão do punho em relação aos inexperientes, particularmente quando a caixa
foi manuseada para a superfície alta. Nesta condição, a extensão do punho
45
realizada por sujeitos experientes ultrapassou os 15º propostos como ADM segura
(PASCHOARELLI et al, 2008).
Os movimentos de desvios do punho foram influenciados pela altura da
superfície-alvo. Todos os sujeitos tenderam manter o punho exclusivamente em
desvio ulnar quando manusearam a caixa para a superfície alta, sendo que o pico
de desvio ulnar alcançado foi de 25°. Desta forma, o punho esteve em ADM
segura por cerca de 50% do tempo. Quando a caixa foi levada em direção à
superfície baixa, desvios de até 15° foram registrados, tanto no sentido radial
quanto ulnar. No entanto, tendo em vista a postura média, é possível afirmar que
o desvio predominante foi o radial. Uma vez que o limite proposto como limite
seguro para o desvio radial do punho é 10°, posturas de risco para este
movimento também foram registradas. Drury et al (1989b) relataram amplitudes
de desvio ulnar muito pequenas quando trabalhadores realizaram um manuseio
simétrico. Para a condição sem alça, os sujeitos tiveram uma amplitude média de
5°. As diferenças entre estes dados e os resultados do presente estudo são
provavelmente relacionadas a diferenças metodológicas. Os dados foram
coletados por Drury et al (1989b) apenas no início e final de cada tarefa de
levantamento e abaixamento e não avaliaram superfícies tão altas como as
avaliadas neste estudo. Além disso, os resultados relatados em valores médios
podem subestimar as amplitudes de movimento. Por outro lado a análise dos
percentis permite avaliar a ADM realizada pelos sujeitos durante toda a tarefa,
como um processo contínuo. As amplitudes de movimento do punho
apresentadas neste estudo concordam com aquelas relatadas por Chung e Wang
(2001), e Padula et al (2006). Entretanto, o tempo gasto fora da amplitude segura
foi menor no nosso experimento do que no experimento de Padula,
46
principalmente para o movimento de flexo-extensão. Este fato pode,
provavelmente, ser explicado pelas diferenças no posicionamento das mãos.
Padula at al. (2006) relataram 3 tipos de preensão adotados pelos sujeitos para
realizar uma tarefa de manuseio, enquanto no presente estudo, uma vez que a
caixa permitia livre acesso a todas as faces, todos sujeitos escolheram utilizar
sempre as faces inferior e laterais para segurar a caixa.
Embora a experiência dos sujeitos não tenha influenciado o tipo de
preensão realizado pelos sujeitos, este fator foi associado à amplitude de extensão
do punho de forma significante. Os estudos que avaliaram a experiência dos
sujeitos (GAGNON, 2005) identificaram que trabalhadores experientes
desenvolvem estratégias mais seguras para realizar o manuseio manual de cargas.
Além de usar diferentes tipos de preensão, eles também inclinam a caixa. Este
achado pode explicar, ao menos em parte, a diferença na amplitude de extensão
do punho identificada entre experientes e inexperientes avaliados neste estudo.
Quando a caixa é levada para uma superfície localizada acima do nível da
cintura, trabalhadores experientes tendem a incliná-la de tal forma que a face
superior fique próxima ao corpo. Para isso, o punho é mantido em desvio radial e
sabe-se que este movimento é associado à extensão da articulação (Li et al,
2005).
A força de preensão variou apenas em função da altura da superfície-
alvo. Quando a caixa foi levada para a superfície alta houve melhor distribuição
de força entre face lateral e inferior. Entretanto, a força total utilizada foi maior
nesta condição. Este fato pode estar relacionado à força de adução necessária
para estabilizar e levantar a caixa. Quando o manuseio envolveu a superfície
baixa, uma quantidade de força similar foi aplicada na face inferior da caixa.
47
Entretanto, menor força foi registrada para as faces laterais, particularmente para o
lado esquerdo. As forças estavam então mais concentradas nas faces inferior e
lateral direita. Todos os sujeitos avaliados eram destros e esta estratégia foi
provavelmente adotada para possibilitar melhor controle da caixa a partir de
maior aplicação de força com o membro dominante.
Muitos estudos prévios descreveram medidas isométricas da força de
preensão. (CATOVIC et al, 1991; KATTEL et al, 1996; WARWICK et al, 1980;
GARG e BADGER, 1986). No entanto, a medida dinâmica de força tem sido
considerada como o melhor indicador para se avaliar o desempenho funcional
das mãos (ANDO et al, 2000; LI, 2002) e também avaliar e melhorar os postos de
trabalho (McGORRY, 2001). Morse et al (2006) estudaram a força de preensão
dinâmica e encontraram diferenças na relação entre força de preensão e posição
do punho quando compararam estes resultados com dados de testes isométricos.
No contexto industrial a maioria das melhorias, implementadas em
atividades de manuseio de carga, é concentrada no oferecimento de alças para
facilitar a realização da tarefa e reduzir a carga musculoesquelética. Muitos
estudos apresentam as vantagens do manuseio de caixas utilizando alças bem
planejadas (CHUNG e WANG, 2001; WANG et al, 2000; DAVIS et al, 1998;
DEEB et al, 1985; DRURY, 1980). Por outro lado, a avaliação de situações
ocupacionais reais mostra que os trabalhadores nem sempre utilizam as alças e
tendem a realizar o manuseio a partir do posicionamento assimétrico das mãos
(DRURY et al, 1982, AUTHIER et al, 1996). Os resultados apresentados
mostraram que os sujeitos preferem pegar a caixa a partir da face inferior quando
o posicionamento das mãos nesta face não apresenta obstáculos. Os dados da
avaliação biomecânica da preensão látero-inferior podem ser considerados
48
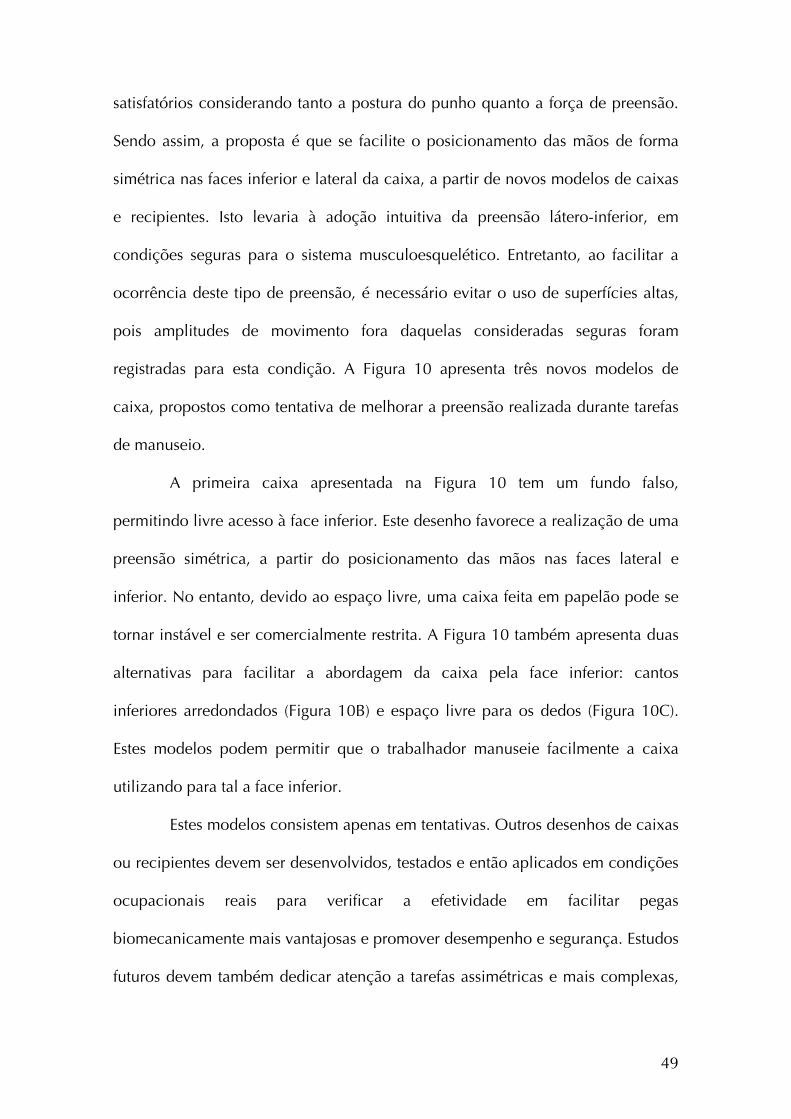
satisfatórios considerando tanto a postura do punho quanto a força de preensão.
Sendo assim, a proposta é que se facilite o posicionamento das mãos de forma
simétrica nas faces inferior e lateral da caixa, a partir de novos modelos de caixas
e recipientes. Isto levaria à adoção intuitiva da preensão látero-inferior, em
condições seguras para o sistema musculoesquelético. Entretanto, ao facilitar a
ocorrência deste tipo de preensão, é necessário evitar o uso de superfícies altas,
pois amplitudes de movimento fora daquelas consideradas seguras foram
registradas para esta condição. A Figura 10 apresenta três novos modelos de
caixa, propostos como tentativa de melhorar a preensão realizada durante tarefas
de manuseio.
A primeira caixa apresentada na Figura 10 tem um fundo falso,
permitindo livre acesso à face inferior. Este desenho favorece a realização de uma
preensão simétrica, a partir do posicionamento das mãos nas faces lateral e
inferior. No entanto, devido ao espaço livre, uma caixa feita em papelão pode se
tornar instável e ser comercialmente restrita. A Figura 10 também apresenta duas
alternativas para facilitar a abordagem da caixa pela face inferior: cantos
inferiores arredondados (Figura 10B) e espaço livre para os dedos (Figura 10C).
Estes modelos podem permitir que o trabalhador manuseie facilmente a caixa
utilizando para tal a face inferior.
Estes modelos consistem apenas em tentativas. Outros desenhos de caixas
ou recipientes devem ser desenvolvidos, testados e então aplicados em condições
ocupacionais reais para verificar a efetividade em facilitar pegas
biomecanicamente mais vantajosas e promover desempenho e segurança. Estudos
futuros devem também dedicar atenção a tarefas assimétricas e mais complexas,
49

50
para contribuir com informação para a prevenção de sobrecarga dos membros
superiores neste contexto ocupacional.
Figura 10. Novos modelos de caixa/recipiente propostos para possibilitar a pega da caixa a partir da superfície inferior. A: caixa com fundo falso e livre acesso aos dedos (área cinza); B: caixa com bordas inferiores arredondadas; C: caixa com espaço livre nas bordas inferiores. Os modelos B e C visam facilitar o posicionamento das mãos na face inferior.
51
C B A
Sujeitos experientes e inexperientes manusearam a caixa de forma
simétrica, usando as faces lateral e inferior. Este fato parece ser resultado do
desenho da caixa, que permitia livre acesso a todas as faces. Em geral, os sujeitos
mantiveram postura de extensão do punho associada ao desvio ulnar (superfície
alta) ou radial (superfície baixa). O movimento de flexo-extensão do punho foi a
única variável que diferenciou sujeitos experientes de inexperientes. A extensão
do punho foi prevalente e maior para sujeitos experientes. O pico de extensão do
punho (para sujeitos experientes) a ambos os desvios ulnar e radial, foram
maiores que os limites recomendados como seguros, particularmente no
manuseio envolvendo a superfície alta. Por outro lado, em comparação com
dados relatados anteriormente (CHUNG e WANG, 2001, PADULA et al, 2006), a
preensão adotada por todos os sujeitos deste estudo apresentou melhores
resultados em relação às posturas e faixas seguras de movimento. Desta forma,
uma preensão mais vantajosa foi realizada, indicando que algum espaço que
favoreça o posicionamento dos dedos na face inferior de caixas pode facilitar a
ocorrência desse tipo de preensão em condições reais de trabalho.
52
CONSIDERAÇÕES FINAIS
Considerações sobre os estudos
Embora o contexto mundial atual envolva automação de tarefas manuais,
o manuseio de cargas é bastante realizado em setores industriais e no mercado
varejista. A atividade de vendas on-line tem contribuído para a intensificação de
atividades desta natureza. Esse fato aliado aos dados epidemiológicos que
apontam associação entre a realização de tarefas de manuseio e o
desenvolvimento de lesões, justifica a importância do estudo destas atividades.
Os estudos apresentados foram então realizados para contribuir com o
entendimento da carga de trabalho imposta ao membro superior durante o
manuseio de carga.
Os resultados indicaram que tanto o layout da atividade, como a massa
do objeto manuseado, interferem no comportamento do membro superior, aqui
avaliados a partir dos movimentos articulares e atividade muscular. De maneira
geral, a experiência dos sujeitos avaliados não interferiu nas estratégias adotadas
e este fato foi atribuído ao modelo da caixa utilizada. A possibilidade de
posicionar os dedos na face inferior da caixa fez com que todos os indivíduos
adotassem a preensão látero-inferior. Considerando a postura do punho e força
aplicada na caixa, este tipo de pega poderia ser favorecido em ambientes
ocupacionais, uma vez que se apresentou mecanicamente mais vantajosa. Nossa
sugestão é que novos modelos de caixa sejam desenvolvidos e testados para a
53
exploração dessa hipótese e minimização da sobrecarga nos membros superiores
durante o manuseio de peso.
Considerando o layout da atividade, os resultados dos dois estudos
apontam para sobrecarga muscular e articular do membro superior quando o
manuseio é realizado tanto em superfícies altas como em superfícies baixas. Se
por um lado as superfícies baixas já são evitadas para controle dos distúrbios
lombares, as superfícies altas também devem/deveriam merecer atenção quando
do planejamento e avaliação de tarefas que envolvam manuseio manual de
cargas.
Para contribuir com informação a respeito da carga imposta ao membro
superior, estudos envolvendo outros layouts assim como manuseios assimétricos e
estudos em ambientes ocupacionais reais devem ser priorizados.
Atividades realizadas durante o período do doutorado direto
Durante o período de realização das atividades relacionadas ao
Doutorado Direto (2004-2008), outras atividades concomitantes foram
desenvolvidas. Estas atividades estão relacionadas à participação em outros
projetos de pesquisa junto com os demais alunos do Laboratório de Fisioterapia
Preventiva e Ergonomia (Lafipe) e em um treinamento em Segurança e Saúde
Ocupacional.
Inicialmente os dados referentes às atividades de Iniciação Científica
foram apresentados no artigo intitulado “Posturas do ombro durante exame ultra-
sonográfico utilizando diferentes transdutores”, publicado na Revista Brasileira de
54
Fisioterapia (IV). Este trabalho foi o precursor do estudo da articulação do ombro
no contexto ocupacional. A participação no projeto de pesquisa para o estudo
dos fatores de risco físico relacionados à atividade do médico ultra-sonografista
resultou ainda na co-autoria do artigo “Assessment of the ergonomic design of
diagnostic ultrasound transducers through wrist movements and subjective
evaluation”, publicado no periódico International Journal of Industrial Ergonomics
(Anexo V).
O início do estudo da atividade de manuseio de carga permitiu a co-
orientação das atividades de Iniciação Científica das alunas Luciana Cristina da
Cunha Bueno Silva e Ethel Sarolta Lilla Pálinkás. O trabalho desenvolvido com a
primeira aluna resultou no artigo “Avaliação da preensão durante manuseio com
variação de carga em diferentes alturas”, publicado na revista Fisioterapia em
Movimento (Anexo VI). A participação no desenvolvimento do artigo intitulado
“Are the anticipatory trunk movements occurring during load-carrying activities
protective or risky?”, publicado pelo periódico International Journal of Industrial
Ergonomics (Anexo VII), também foi resultado do envolvimento no estudo da
atividade de manuseio de cargas, realizado com outros membros do Lafipe. Parte
dos dados do estudo principal também foram apresentados no XVII Congress of
the International Society of Electromyography and Kinesiology sob o título
“Association between muscular activity and upper limb posture during lifting with
height and weight variation” (Anexo VIII).
A participação no projeto de pesquisa realizado no Lafipe para estudo
das fontes de erro nos registros eletrogoniométricos resultou na publicação do
artigo “Effects of sensor, trial and knee joint variables in electrogoniometric gait
55
recordings”, aceito para publicação na Revista Brasileira de Fisioterapia (Anexo
IX)
A participação no treinamento em Segurança e Saúde Ocupacional
(Occupational Safety and Health & Development) oferecido pelo então Instituto
Sueco para Vida no Trabalho, permitiu o desenvolvimento do projeto
“Intervenção para a Prevenção de Distúrbio Osteomuscular Relacionado ao
Trabalho (DORT) entre Funcionários da UFSCar”. Os resultados da avaliação dos
funcionários foram apresentados no 15° Congresso Brasileiro de Ergonomia no
artigo “Sintomas musculoesqueléticos e fatores de risco físicos e psicossociais
entre funcionários administrativos do setor público” (Anexo X).
A participação em todas as atividades desenvolvidas contribuiu de forma
significativa para a minha formação acadêmica e científica. Destaco a
fundamental importância do trabalho realizado em equipe, considerando todos os
membros do Lafipe e outros pesquisadores, para o desenvolvimento dos estudos
apresentados.
56
REFERÊNCIAS BIBLIOGRÁFICAS
AARAS A, WESTGAARD RH, STRANDEN E. Postural angles as an indicator of
postural load and muscular injury in occupational work situations. Ergonomics.
31(6), 915-933, 1988.
ANDERSON AM, MEADOR KA, MCCLURE LR, MAKROZAHOPOULOS D,
BROOKS DJ, MIRKA GA. A biomechanical analysis of anterior load carriage.
Ergonomics, 50(2), 2104-17, 2007.
ANDO S, ONO Y, SHIMAOKA M, HIRUTA S, HATTORI Y, HORI F, IMAEDA T,
TAKEUCHI Y. Strength and perceived exertion in isometric and dynamic lifting
with three different hand locations. Journal of Occupational Health, 42, 315-320,
2000.
AUTHIER M, GAGNON M, LORTIE M. Handling techniques: the influence of
weight and height for experts and novices. International Journal Occupational
Safety and Ergonomics, 1(3), 262-75, 1995.
AUTHIER M, LORTIE M, GAGNON M. Manual handling techniques: comparing
novices and experts. International Journal of Industrial Ergonomics, 17(5), 419-29,
1996.
57
AYOUB MM. Problems and solutions in manual materials handling: the state of
art. Ergonomics, 35(7-8), 713-28, 1992.
BARELA AMF, DUARTE M. Biomechanical characteristics of elderly individuals
walking on land and in water. Journal or Electromyography and Kinesiology,
18(3), 446-454, 2008.
BERNARD BP. Musculoskeletal Disorders and Workplace Factors. DHHS (NIOSH)
Publication No. 97-141. US Department of Health and Human Services, Public
Health Service, Centers for Disease Control and Prevention, National Institute for
Occupational Safety and Health, 1997.
BJELLE A, HAGBERG M, MICHAELSON G. Occupational and individual factors
in acute shoulder-neck disorders among industrial workers. British Journal of
Industrial Medicine, 38(4), 356-63, 1981.
CATOVIC E, CATOVIC A, KRALJEVIC K, MUFTIC O. The influence of arm
position on the pinch grip strength of female dentists in standing and sitting
positions. Applied Ergonomics, 22(3), 163-166, 1991.
CHAFFIN DB, ANDERSSON GBJ. Occupational Biomechanics. 2nd ed. USA:
John Wiley & Sons, Inc, 1991.
58
CHAFFIN DB, PARK KS. A longitudinal study of low-back pain as associated with
occupational weight lifting factors. American Industrial Hygiene Association
Journal, 34(12), 513-25, 1973.
CHUNG HC, WANG MJJ. The effects of container design and stair climbing on
maximal acceptable lift weight, wrist posture, psychophysical, and physiological
responses in wafer-handling tasks. Applied Ergonomics, 32, 593-598, 2001.
CIRIELLO VM, DEMPSEY PG, MAIKALA RV, O’BRIEN NV. Secular changes in
psychophysically determined maximum acceptable weights and forces over 20
years for male industrial workers. Ergonomics, 51(5), 593-601, 2008.
CIRIELLO VM, SNOOK SH, HASHEMI L, COTNAM J. Distributions of manual
materials handling task parameters. International Journal of Industrial Ergonomics,
24, 379-388, 1999.
CIRIELLO VM. The effects of box size, vertical distance, and height on lowering
tasks. International Journal of Industrial Ergonomics, 28, 61-67, 2001.
COURY HJCG, KUMAR S, NARAYAN Y. An electromyographic study of upper
limb adduction force with varying shoulder and elbow postures. Journal of
Electromyography and Kinesiology, 8(3), 157-68, 1998.
COURY BG, DRURY CG. Optimum handle positions in a box-holding task.
Ergonomics, 25(7), 645-662, 1982.
59
DAVIS KG, MARRAS WS. Assessment of the relationship between box weight and
trunk kinematics: does a reduction in box weight necessarily correspond to a
decrease in spinal loading? Human Factors, 42(2), 195-208, 2000.
DAVIS KG, MARRAS WS. Load spatial pathway and spine loading: how does lift
origin and destination influence low back response? Ergonomics, 48 (8), 1031-46,
2005.
DAVIS KD, MARRAS WS, WATERS TR. Reduction of spinal loading through the
use of handles. Ergonomics, 41(8), 1155-1168, 1998.
DEEB JM, DRURY CG, BEGBIE KL. Handle positions in a holding task as a
function of task height. Ergonomics, 28(5), 747-763, 1985.
DRURY CG, LAW CH, PAWENSKI CS. A survey of industrial box handling.
Human Factors. 24(5):553-565, 1982.
DRURY CG. Handles for manual materials handling. Applied Ergonomics, 11(1),
35-42, 1980.
DRURY CG, BEGBIE K, ULATE C, DEEB JM. Experiments on wrist deviation in
manual materials handling. Ergonomics, 28(3), 577-589, 1985.
60
DRURY CG, DEEB JM, HARTMAN B, WOOLLEY S, DRURY CE, GALLAGHER S.
Symmetric and asymmetric manual material handling, part 1: physiology and
psychophysics. Ergonomics, 32(5), 467-489, 1989a.
DRURY CG, DEEB JM, HARTMAN B, WOOLLEY S, DRURY CE, GALLAGHER S.
Symmetric and asymmetric manual material handling, part 2: biomechanics.
Ergonomics, 32(6), 565-583, 1989b.
DRURY CG, LAW CH, PAWENSKI CS. A survey of industrial box handling.
Human Factors, 24(5), 553-65, 1982.
FRERIKS B, HERMENS HJ. SENIAM 9: European recommendations for surface
electromyography. [CD-room]. Roessingh Research and Development, 1999.
GAGNON, M. Box tilt and knee motions in manual lifting: two differential factors
in expert and novice workers. Clinical Biomechanics. 12(7/8)419-428, 1997.
GAGNON, M. Ergonomic identification and biomechanical evaluation of
workers’ strategies and their validation in a training situation: Summary of
research. Clinical Biomechanics, 20(6), 569-80, 2005.
GAGNON M, DELISLE A, DESJARDINS P. Biomechanical differences between
best and worst performances in repeated free asymmetrical lifts. International
Journal of Industrial Ergonomics, 29:73-83, 2002.
61
GALLAGHER S. Physical limitations and musculoskeletal complaints associated
with work in unusual or restricted postures: A literature review. Journal of Safety
Research, 36:51-61, 2005.
GARG A, BADGER D. Maximum acceptable weights and maximum voluntary
isometric strengths for asymmetric lifting. Ergonomics, 29(7), 879-892, 1986.
GRIECO A, MOLTENI G, DE VITO G, SIAS N. Epidemiology of musculoskeletal
disorders due to biomechanical overload. Ergonomics, 40(9), 1253-1260, 1998.
HABES D, CARLSON W, BADGER D. Muscle fatigue associated with repetitive
arm lifts: effects of height weight and reach. Ergonomics, 28 (2), 471-88, 1985.
HÄGG GM, LUTTMANN A, JÄGER M. Methodologies for evaluating
electromyographic field data in ergonomics. Journal of Electromyography and
Kinesiology, 10(5), 301-12, 2000.
HASIANG SM, MCGORRY RW. Three different lifting strategies for controlling the
motion patterns of the external load. Ergonomics, 40 (9), 928-939, 1997.
HERBERTS P, KADEFORS R, BROMAN H. Arm positioning in manual tasks. An
electromyographic study of localized muscle fatigue. Ergonomics, 23(7)655-665,
1980.
62
HOOZEMANS MJM, KINGMA I, DE VRIES WHK, VAN DIEËN JH. Effect of lifting
height and load mass on low back loading. Ergonomics, 51(7), 1053-63, 2008.
HOSTENS I, RAMON H. Assessment of muscle fatigue in low level monotonous
task performance during car driving. Journal of Electromyography and
Kinesiology, 15, 266-274, 2005.
JÄGER M, LUTTMANN A. The load on the lumbar spine during asymmetrical bi-
manual materials handling. Ergonomics, 35(7/8), 783-805, 1992.
JÄRVHOLM, U., PALMERUD, G., HERBERTS, P., HÖGFORS, C., KADEFORS, R..
Intramuscular pressure and electromyography in the supraspinatus muscle at
shoulder abduction. Clinical Orthopaedic and Related Research, 245, 102-9,
1989.
JÄRVHOLM U, PALMERUD G, KARLSSON D, HERBERTS P, KADEFORS R.
Intramuscular Pressure and electromyography in four shoulder muscles. Journal of
Orthopaedic Research, 9(4), 609-19, 1991.
JÄRVHOLM U, PALMERUD G, STYF J, HERBERTS P, KADEFORS R. Intramuscular
pressure in the supraspinatus muscle. Journal of Orthopaedic Research, 6(2), 230-
38, 1988.
63

JONSSON B. Measurement and evaluation of local muscular strain in the
shoulder during constrained work. Journal of Human Ergology, 11(1), 73-88,
1982.
KATTEL BP, FREDERICKS TK, FERNANDEZ JE, LEE DC. The effect of upper-
extremity posture on maximum grip strength. International Journal of Industrial
Ergonomics, 18, 423-429, 1996.
KROEMER KHE, GRANDJEAN E. Fitting the task to the human: a textbook of
occupational ergonomics. 5th ed. London: Taylor & Francis, 2000.
KUMAR S. Biomechanical load on human lumbar spine in palletizing tasks with
restriction to access and varying headroom. International Journal of Industrial
Ergonomics, 23:349-358, 1999.
KUMAR S. Electromyography in ergonomics. In: KUMAR S, MITAL A, ed.
Electromyography in ergonomics. London: Taylor & Francis, 1-50, 1996.
LARSSON B, SØGAARD K, ROSENDAL L. Work-related neck-shoulder pain: a
review on magnitude, risk factors, biochemical characteristics, clinical picture
and preventive interventions. Best Practice & Research Clinical Rheumatology,
21(3), 447-63, 2007.
64
LI ZM. The influence of wrist position on individual finger forces during forceful
grip. The Journal of Hand Surgery, 27A(5), 886-896, 2002.
LI ZM, KUXHAUS L, FISK JA, CHRISTOPHEL TH. Coupling between wrist flexion-
extension and radial-ulnar deviation. Clinical Biomechanics, 20, 177-183, 2005.
LUSTED MJ, CARASCO CL, MANDRYK JA, HEATEY S. Self reported symptoms in
the neck ad upper limbs in nurses. Applied Ergonomics, 27(6), 381-387, 1996.
LUTTMANN A. Physiological basis and concepts of electromyography. Chapter 2:
51-96. In: KUMAR S, MITAL A, ed. Electromyography in Ergonomics. Taylor &
Francis, 1996.
MARRAS WS, LAVENDER SA, LEURGANS SE, FATHALLAH FA, FERGUSON SA,
ALLREAD WG, RAJULU SL. Biomechanical risk factors for occupationally related
low back disorders. Ergonomics, 38(2), 377-410, 1995.
MCGORRY RW. A system for the measurement of grip forces and applied
moments during hand tool use. Applied Ergonomics, 32, 271-279, 2001.
MENZEL NN, BROOKS SM, BERNARD TE, NELSON A. The physical workload of
nursing personnel: association with musculoskeletal discomfort. International
Journal of Nursing Studies, 41:859-867, 2004.
65
MING Z, NÄRHI M, SIIVOLA J. Neck and shoulder pain related to computer use.
Pathophysiology, 11:51-56, 2004.
MORSE JL, JUNG MC, BASHFORD GR, HALLBECK MS. Maximal dynamic grip
force and wrist torque: the effects of gender, exertion direction, angular velocity,
and wrist angle. Applied Ergonomics, 37, 737-742, 2006.
MURRAY WM, DELP SL, BUCHANAN TS. Variation of muscle moment arms with
elbow and forearm position. Journal of Biomechanics, 28 (5), 513-25, 1995.
NASTASIA I, LORTIE M, DELISLE A, GAGNON M. Perception and biomechanics
data in a manual handling task: a comparative study. Ergonomics, 50(12), 2059-
81, 2007.
NIELSEN PK, ANDERSEN L, JØRGENSEN K. The muscular load on the lower back
and shoulders due to lifting at different lifting heights and frequencies. Applied
Ergonomics, 29(6)445-450, 1998.
OKUNRIBIDO OO, HASLEGRAVE CM. Pouring liquid from a pot – kinematics of
an everyday task. Applied Ergonomics, 34 (4), 355-73, 2003.
OLIVEIRA AB, COURY HJCG. Upper limb muscular and postural behavior during
manual material handling tasks. Submitted, 2008.
66
PADULA RS, COURY HJCG. Device for analyzing grip forces during handling. In:
Premus 2004: Fifth International Scientific Conference on Prevention of Work-
related Musculoskeletal Disorders. Abstract Book II. Zurich, 599-600, 2004.
PADULA RS, SOUZA VC, COURY HJCG. Types of grip and wrist movements
during load handling activities. Brazilian Journal of Physical Therapy, 10(1), 29-
34, 2006. (in Portuguese).
PADULA RS, COURY HJCG. Sagittal trunk movements during load carrying
activities: a pilot study. International Journal of Industrial Ergonomics, 32, 181-
188, 2003a.
PADULA RS, COURY HJCG. An electrogoniometric study of trunk movements
during lifting activities. In: WAARD D, BROOKHUIS KA, VERWEY WB. Human
Factors in the age of virtual reality. Shaker Publishing, 279-282, 2003b.
PALMERUD G, FORSMAN M, SPORRONG H, HERBERTS P, KADEFORS R.
Intramuscular pressure of the infra- and supraspinatus muscles in relation to hand
load and arm posture. European Journal of Applied Physiology, 83(2-3), 223-30,
2000.
PASCHOARELLI LC, OLIVEIRA AB, COURY HJCG. Assessment of the ergonomics
design of diagnostic ultrasound transducers through wrist movements and
subjective evaluation. International Journal of Industrial Ergonomics, doi:
10.1016/j.ergon.2008.01.013, 2008.
67
POPE DP, SILMAN AJ, CHERRY NM, PRITCHARD C, MACFARLANE GJ.
Association of occupational physical demands and psychosocial working
environment with disabling shoulder pain. Annals of the Rheumatic Diseases,
60:852-858, 2001.
PUNNET L, FINE LJ, KEYSERLING WM, HERRIN GD, CHAFFIN DB. Shoulder
disorders and postural stress in automobile assembly work. Scandinavian Journal
of Work Environmental and Health, 26(4), 282-291, 2000.
SLUITER JK, REST KM, FRINGS-DRESEN MHW. Criteria document for evaluating
the work-relatedness of upper-extremity musculoskeletal disorders. Scandinavian
Journal of Environmental and Health, 27 (suppl 1), 1-102, 2001.
SMITH DR, WEI N, ZHAO L, WANG RS. Musculoskeletal complaints and
psychosocial risk factors among Chinese hospital nurses. Occupational Medicine,
54, 579-582, 2004.
SØGAARD K, LAURSEN B, JENSEN BR, SJØGAARD G. Dynamic loads on the
upper extremities during two different floor cleaning methods. Clinical
Biomechanics, 16(10), 866-79, 2001.
SPORRONG H, SANDSJO L, KADEFORS R, HERBERTS P. Assessment of
workload and arm position during different work sequences: a study with portable
devices on construction workers. Applied Ergonomics, 30, 495-503, 1999.
68
STRAKER LM. An overview of manual handling injury statistics in Western
Australia. International Journal of Industrial Ergonomics, 24 (4), 357-64, 1999.
WANG MJJ, CHUNG HC, CHEN HC. The effect of handle angle on MAWL, wrist
posture, RPE, and heart rate. Human Factors, 42(4), 553-565, 2000.
WARWICK D, NOVAK G, SCHULTZ A. Maximum voluntary strengths of male in
some lifting, pushing and puling activities. Ergonomics, 23(1), 49-54, 1980.
WATERS TR, PUTZ-ANDERSON V, GARG A, FINE LJ. Revised NIOSH equation
for the design and evaluation of manual lifting tasks. Ergonomics, 36(7), 749-776,
1993.
YEUNG SS, GENAIDY A, DEDDENS J, ALHEMOOD A, LEUNG PC. Prevalence of
musculoskeletal symptoms in single and multiple body regions and effects of
perceived risk of injury among manual handling workers. Spine, 27(19), 2166-71,
2002.
YEUNG SS, GENAIDY A, DEDDENS J. Worker’s assessments of manual lifting
tasks: cognitive strategies and validation with respect to objective indices and
musculoskeletal symptoms. International Archives of Occupational and
Environmental Health, 76, 505-516, 2003.
69
ANEXO I
OLIVEIRA AB, COURY HJCG. Upper limb muscular and postural behavior during
manual material handling tasks. Manuscrito submetido ao periódico
ERGONOMICS.
70
For Peer Review O
nly
Upper limb muscular and postural behavior during manual material
handling tasks
Journal: Ergonomics
Manuscript ID: TERG-2008-0186
Manuscript Type: Original Article
Date Submitted by the Author:
31-Jul-2008
Complete List of Authors: Oliveira, Ana; Universidade Federal de Sao Carlos, Physical Therapy (Fisioterapia) Coury, Helenice; Universidade Federal de Sao Carlos, Physical Therapy (Fisioterapia)
Keywords:
biomechanics < Physical Ergonomics, operator workload < System Performance, workstation design < Human-Machine Systems, manual handling < Health and Safety, upper limb disorders < Health and Safety
URL: http://mc.manuscriptcentral.com/terg E-mail: [email protected]
Ergonomics
For Peer Review O
nly
Title:
Upper limb muscular and postural behavior during manual material handling tasks.
Authors:
Ana Beatriz Oliveira1, Helenice Jane Cote Gil Coury1.
Affiliations:
1Federal University of Sao Carlos, Department of Physical Therapy, Brazil.
Addresses:
Helenice Jane Cote Gil Coury (corresponding author)
Universidade Federal de São Carlos, Departamento de Fisioterapia
Via Washington Luis, KM 235, CP 676
CEP 13565-905 São Carlos, SP, Brazil
E-mail: [email protected]; [email protected]
Phone: +55 16 33725535
Fax: +55 16 33612081
Ana Beatriz Oliveira
Universidade Federal de São Carlos, Programa de Pós-Graduação em Fisioterapia
Via Washington Luis, KM 235
CEP 13565-905 São Carlos, SP, Brazil
E-mail: [email protected]
Phone: +55 16 34127321
Fax: +55 16 33612081
Page 1 of 30
URL: http://mc.manuscriptcentral.com/terg E-mail: [email protected]
Ergonomics
123456789101112131415161718192021222324252627282930313233343536373839404142434445464748495051525354555657585960
For Peer Review O
nly
2
ABSTRACT
The aim of this study was to evaluate the effect of surface heights and weight on upper
limb EMG and movements during manual material handling performed by experienced
and inexperienced subjects. Sixteen experienced and sixteen inexperienced subjects
handled a box (7 and 15 kg) from an intermediate to either a high or low surface.
Electromyogram and video were recorded during the tasks. The10th, 50th and 90th
percentiles were calculated for the deltoid and biceps muscles, shoulder flexion,
shoulder abduction, and elbow flexion movements. Groups, right/left sides, weights and
heights were compared. There were no differences between either groups or sides.
Weight and height variations affected EMG and posture, although weight had more
impact on EMG. Shoulder amplitudes higher than 60° have occurred, particularly for
the high surface, while high shoulder flexion have occurred when the box was handled
to the both heights.
Relevance:
Knowledge on handling risks may be useful to the design of safer jobs. Shoulder
postures during handling involving low surfaces have not been evaluated so far. As well
as high surfaces, low height can be harmful to shoulder joints and deserves attention if
prevention of disorders is concerned.
Keywords:
biomechanics; workstation design; operator workload; manual handling; upper limb
disorders.
Page 2 of 30
URL: http://mc.manuscriptcentral.com/terg E-mail: [email protected]
Ergonomics
123456789101112131415161718192021222324252627282930313233343536373839404142434445464748495051525354555657585960
For Peer Review O
nly
1
1. INTRODUCTION
Manual material handling (MMH) activities are widely performed in
occupational settings. The relationship between those activities and work-related
musculoskeletal disorders (WRMSDs) has long been established in the literature 5
(Chaffin and Park 1973, Ayoub et al. 1992, Straker 1999, Yeung et al. 2002). In
general, 25 to 36% of reported WRMSDs are related to MMH activities (Drury et al.
1982, Straker 1999, Ciriello 2001). The part of the body most affected is the low back,
with a prevalence ranging from 50 to 70%. Epidemiological studies have also reported
high incidence of WRMSDs at other body sites. The second most affected region is the 10
shoulder, which presents a prevalence of MMH-related WRMSDs of 38 to 60%.
To reduce the occurrence and prevent the incidence of WRMSDs associated
with MMH activities, better understanding of musculoskeletal loads and the effects of
task parameters during this kind of activity is crucial. The design of MMH activities has
been studied through biomechanical and subjective approaches (Davis and Marras 2005, 15
Nastasia et al. 2007, Ciriello et al. 2008). While the spinal load during several kinds of
MMH activities has been well studied (Jäger and Luttmann 1992, Hasiang and McGorry
1997, Padula and Coury 2003, Hoozemans et al. 2008), the upper limb load has not.
The literature contains studies that measure physical load on the upper limbs during
MMH but, in general, they are restricted to specific work conditions and layouts. 20
Habes et al. (1985) studied the effect of destination height, load weight and
reach on shoulder and low back muscle fatigue during a repetitive lifting task. All
factors presented effects on the variables studied, but the authors did not investigate
heights below the waist level, and the subjects handled a cylindrical object. These
conditions may not allow generalization of the results to other common industrial 25
Page 3 of 30
URL: http://mc.manuscriptcentral.com/terg E-mail: [email protected]
Ergonomics
123456789101112131415161718192021222324252627282930313233343536373839404142434445464748495051525354555657585960

For Peer Review O
nly
2
conditions. Nielsen et al. (1998) assessed shoulder and lower back muscular loads and
evaluated the amplitude probability distribution function (APDF) of surface
electromyograms (EMGs), during lifting tasks using 10 kg boxes at different heights
and frequencies. They found differences in muscular load according to height changes
and frequency variation. Nevertheless, they did not explore the effect of weight changes30
on shoulder load. Davis and Marras (2005) evaluated the influence of lift origin and
destination on low back response. The three-dimensional spinal load was influenced by
the origin and destination height. The authors recognized the importance of studying
workplace spatial layout and biomechanical response during lifting but they focused
only on low back load. Hoozemans et al. (2008) have also studied the effect of lifting 35
height and mass in low back load and reported that both height and mass have an effect
on low back load, but they did not evaluate any variable related to upper limbs. The
literature available indicates that both handling height and load weight have an
important role in musculoskeletal loads during MMH activities. However, studies
involving these factors are either limited to few conditions or only relate to low back 40
behavior.
Another important factor that can influence the musculoskeletal load during
MMH is the subjects’ previous experience of load handling. According to interesting
studies on back load by Gagnon (2005), the strategy used by expert workers in
performing MMH activities has safety potential. In general, they present strategies 45
related to load maneuvers and footwork that differ from those of novice workers. Such
strategies can reduce back loadings, back asymmetries and mechanical work
requirements and, for these reasons, they can generate different profiles of
musculoskeletal loads.
Page 4 of 30
URL: http://mc.manuscriptcentral.com/terg E-mail: [email protected]
Ergonomics
123456789101112131415161718192021222324252627282930313233343536373839404142434445464748495051525354555657585960
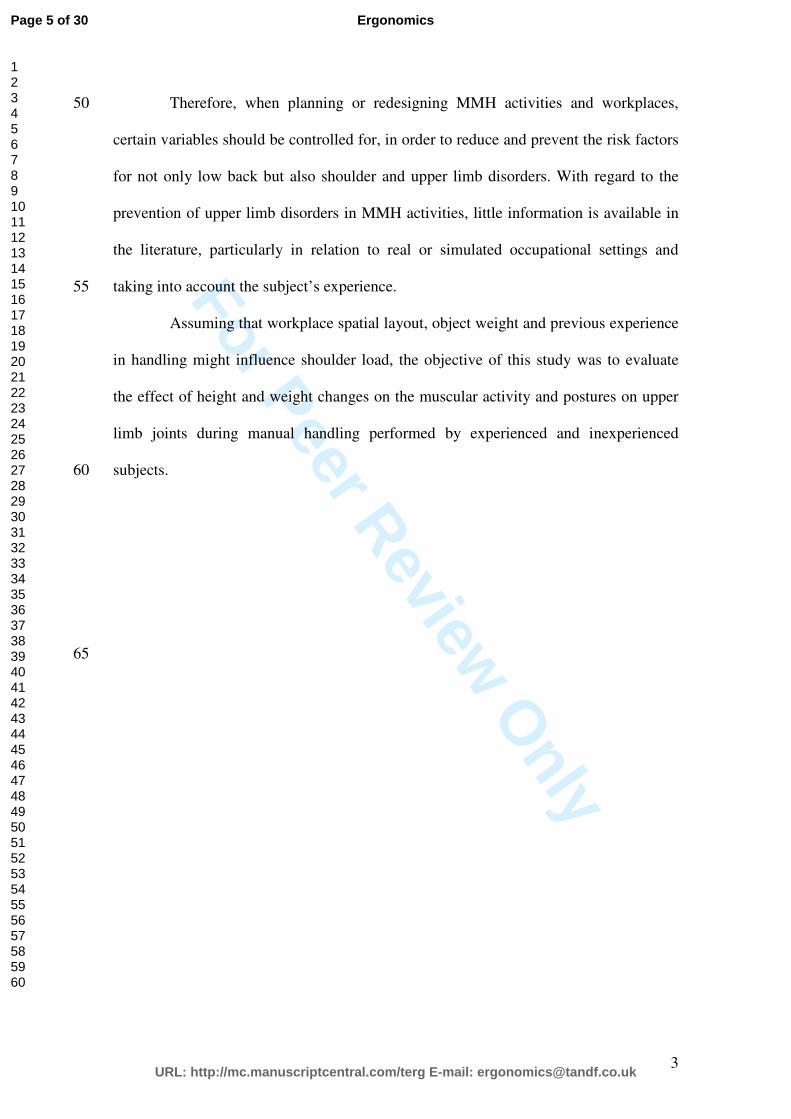
For Peer Review O
nly
3
Therefore, when planning or redesigning MMH activities and workplaces, 50
certain variables should be controlled for, in order to reduce and prevent the risk factors
for not only low back but also shoulder and upper limb disorders. With regard to the
prevention of upper limb disorders in MMH activities, little information is available in
the literature, particularly in relation to real or simulated occupational settings and
taking into account the subject’s experience.55
Assuming that workplace spatial layout, object weight and previous experience
in handling might influence shoulder load, the objective of this study was to evaluate
the effect of height and weight changes on the muscular activity and postures on upper
limb joints during manual handling performed by experienced and inexperienced
subjects.60
65
Page 5 of 30
URL: http://mc.manuscriptcentral.com/terg E-mail: [email protected]
Ergonomics
123456789101112131415161718192021222324252627282930313233343536373839404142434445464748495051525354555657585960

For Peer Review O
nly
4
2. METHODS
70
2.1. Subjects
Male subjects with and without occupational experience of load-handling
activities were recruited. The inclusion criteria were that the subjects should not present
musculoskeletal symptoms or disorders, general illnesses, limitations on movement
amplitudes, apparent postural deviations or balance problems. Thirty-two subjects, of 75
mean age 22.6 (± 4.3) years, mean height 1.69 (± 0.04) m and mean weight 68.3 (± 8.7)
kg, were recruited to participate in the study. Sixteen subjects were experienced (at least
6 months working in activities that included manual handling of boxes in storage sectors
of supermarkets and other retail stores) and 16 were inexperienced (students, without
professional experience of manual handling of boxes). They signed an informed consent 80
statement that had been approved by the local ethics committee (Process 059/04).
2.2. Protocol
Subjects handled a box (weighing either 7 or 15 kg) from one shelf
(intermediate shelf - IS - 102.5 cm, about waist level) to either a high surface (high shelf 85
- HS - 142.5 cm) or low surface (low shelf - LS - 62.5 cm). Data relating to all these
four conditions (two box weights and two surfaces) were recorded (see Figure 1). The
subjects always picked up the box from the IS and placed it on a predetermined shelf.
No specific instructions were provided, either on postures or how to grasp the box. The
height of the surface and weight of the box were randomized. Before lifting the box, the 90
subjects were provided with information about the initial and final positions of the box,
and when to perform the task. For each trial, simultaneous grip force, EMG and video
recordings were collected.
Page 6 of 30
URL: http://mc.manuscriptcentral.com/terg E-mail: [email protected]
Ergonomics
123456789101112131415161718192021222324252627282930313233343536373839404142434445464748495051525354555657585960
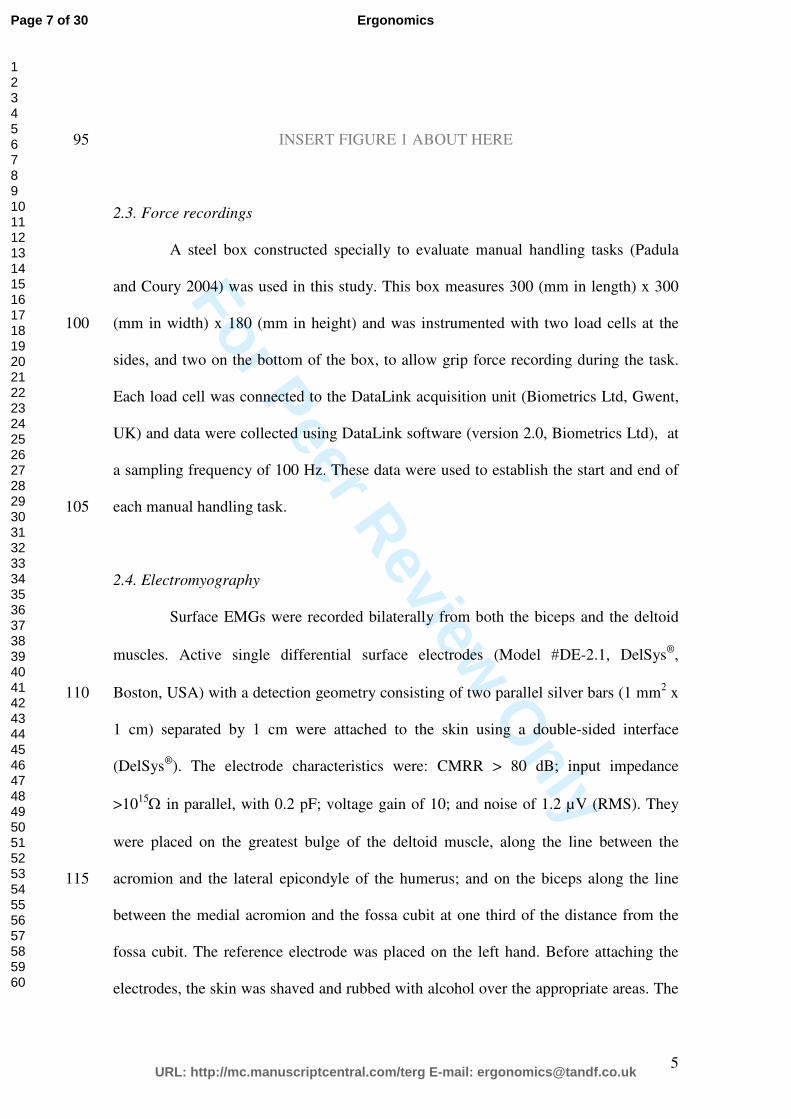
For Peer Review O
nly
5
INSERT FIGURE 1 ABOUT HERE95
2.3. Force recordings
A steel box constructed specially to evaluate manual handling tasks (Padula
and Coury 2004) was used in this study. This box measures 300 (mm in length) x 300
(mm in width) x 180 (mm in height) and was instrumented with two load cells at the 100
sides, and two on the bottom of the box, to allow grip force recording during the task.
Each load cell was connected to the DataLink acquisition unit (Biometrics Ltd, Gwent,
UK) and data were collected using DataLink software (version 2.0, Biometrics Ltd), at
a sampling frequency of 100 Hz. These data were used to establish the start and end of
each manual handling task. 105
2.4. Electromyography
Surface EMGs were recorded bilaterally from both the biceps and the deltoid
muscles. Active single differential surface electrodes (Model #DE-2.1, DelSys®,
Boston, USA) with a detection geometry consisting of two parallel silver bars (1 mm2 x 110
1 cm) separated by 1 cm were attached to the skin using a double-sided interface
(DelSys®). The electrode characteristics were: CMRR > 80 dB; input impedance
>1015Ω in parallel, with 0.2 pF; voltage gain of 10; and noise of 1.2 µV (RMS). They
were placed on the greatest bulge of the deltoid muscle, along the line between the
acromion and the lateral epicondyle of the humerus; and on the biceps along the line 115
between the medial acromion and the fossa cubit at one third of the distance from the
fossa cubit. The reference electrode was placed on the left hand. Before attaching the
electrodes, the skin was shaved and rubbed with alcohol over the appropriate areas. The
Page 7 of 30
URL: http://mc.manuscriptcentral.com/terg E-mail: [email protected]
Ergonomics
123456789101112131415161718192021222324252627282930313233343536373839404142434445464748495051525354555657585960
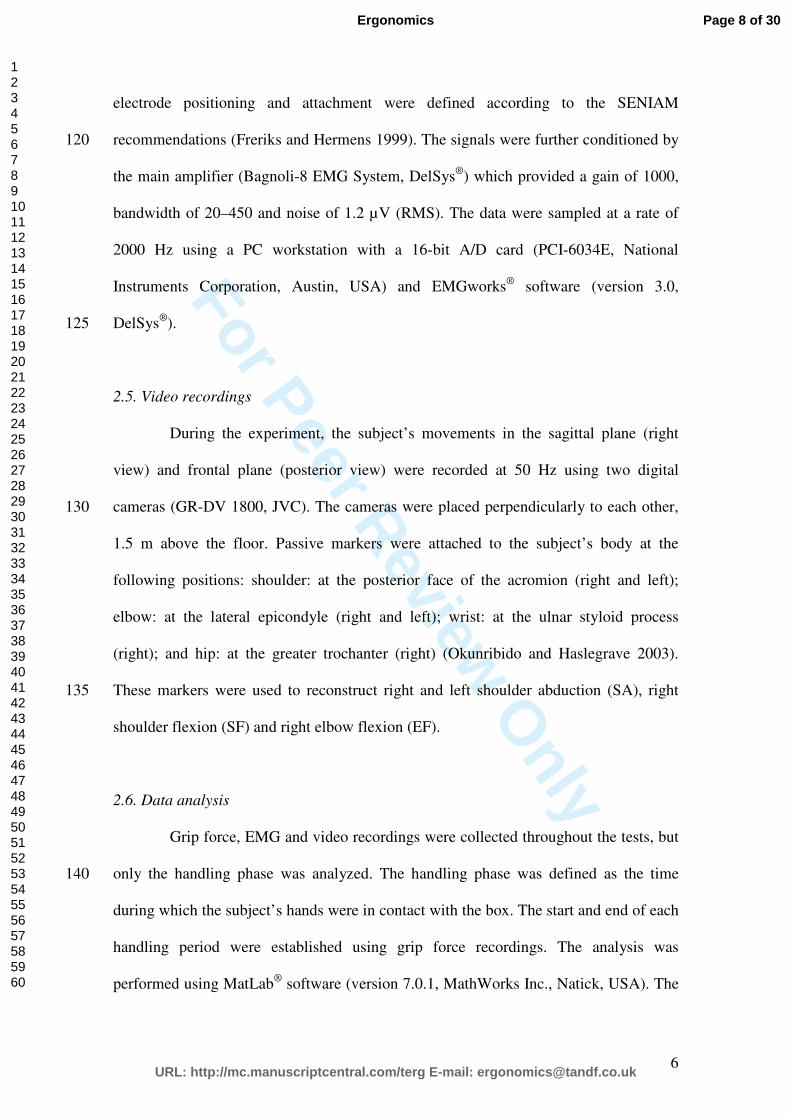
For Peer Review O
nly
6
electrode positioning and attachment were defined according to the SENIAM
recommendations (Freriks and Hermens 1999). The signals were further conditioned by 120
the main amplifier (Bagnoli-8 EMG System, DelSys®) which provided a gain of 1000,
bandwidth of 20–450 and noise of 1.2 µV (RMS). The data were sampled at a rate of
2000 Hz using a PC workstation with a 16-bit A/D card (PCI-6034E, National
Instruments Corporation, Austin, USA) and EMGworks® software (version 3.0,
DelSys®).125
2.5. Video recordings
During the experiment, the subject’s movements in the sagittal plane (right
view) and frontal plane (posterior view) were recorded at 50 Hz using two digital
cameras (GR-DV 1800, JVC). The cameras were placed perpendicularly to each other,130
1.5 m above the floor. Passive markers were attached to the subject’s body at the
following positions: shoulder: at the posterior face of the acromion (right and left);
elbow: at the lateral epicondyle (right and left); wrist: at the ulnar styloid process
(right); and hip: at the greater trochanter (right) (Okunribido and Haslegrave 2003).
These markers were used to reconstruct right and left shoulder abduction (SA), right 135
shoulder flexion (SF) and right elbow flexion (EF).
2.6. Data analysis
Grip force, EMG and video recordings were collected throughout the tests, but
only the handling phase was analyzed. The handling phase was defined as the time 140
during which the subject’s hands were in contact with the box. The start and end of each
handling period were established using grip force recordings. The analysis was
performed using MatLab® software (version 7.0.1, MathWorks Inc., Natick, USA). The
Page 8 of 30
URL: http://mc.manuscriptcentral.com/terg E-mail: [email protected]
Ergonomics
123456789101112131415161718192021222324252627282930313233343536373839404142434445464748495051525354555657585960
For Peer Review O
nly
7
start was defined as the moment when the sum of force applied on the bottom right and
left faces of the box reached 3 N. The end was established as the moment when this sum 145
decreased to below 3 N. These events were used to select the EMG and video records
for the handling phase.
The kinematic data were digitized, filtered and reconstructed using the Ariel
Performance Analysis System software (APAS®, Ariel Dynamics, Inc., Trabuco
Canyon, USA). Data were low-pass filtered at 5 Hz using a digital filter algorithm. The 150
reconstruction of real coordinates was performed using the direct linear transformation
(DLT) procedure. Shoulder abduction (SA) and flexion (SF) and elbow flexion (EF)
were calculated with the angles defined as shown in Figure 2, and stored as ASCII files.
INSERT FIGURE 2 ABOUT HERE155
The EMG data were processed using MatLab® software (version 7.0.1,
MathWorks Inc., Natick, USA). All signals were band-pass filtered using a fourth-order
zero-lag Butterworth filter at 20-400 Hz, and were subsequently full-wave rectified and
low-pass filtered at 5 Hz to obtain the linear envelope (Barela and Duarte 2008). The 160
signals were then selected using grip force data, as described above, and were
normalized to one specific handling – ‘reference handling’, which was performed with
the same box, but weighting 11kg. The box was transferred from the intermediate to the
high shelf.
An APDF was calculated for both the EMG and the kinematic data. According 165
to Jonsson (1982), probability levels of 10, 50 and 90% represent the static, median, and
peak muscular load, respectively. The APDF method is a widely applied procedure for
describing occupational load (Hägg et al. 2000, Søgaard et al. 2001) and, although the
Page 9 of 30
URL: http://mc.manuscriptcentral.com/terg E-mail: [email protected]
Ergonomics
123456789101112131415161718192021222324252627282930313233343536373839404142434445464748495051525354555657585960
For Peer Review O
nly
8
data was recorded during a short period of time, the analysis showed consistent results.
In order to perform qualitative analysis, and to identify differences between the 170
conditions and patterns among the subjects, the linear envelope of each raw EMG signal
was, for each condition, normalized in time from 0% to 100% in steps of 1%. The same
procedure was performed for shoulder flexion and abduction, and for elbow flexion
angles, and the range of motion (ROM) was described in accordance with the EMG, by
means of the 10th, 50th and 90th percentiles.175
2.7. Statistics
All data were tested for normality through Shapiro Wilk’s W test. According to
the results, nonparametric tests were applied. The Mann-Whitney test was used to test
for differences between the experienced and inexperienced subjects. The Wilcoxon180
matched-pairs test was applied to test for differences between the right and left sides
relating to EMG data, shoulder abduction movements, manual handling to high and low
surfaces, and box weights of 7 and 15 kg. An alpha level of 0.05 was used for all
statistical tests, which were performed using the Statistica® software (version 7,
StatSoft, Inc., Tulsa, USA).185
Page 10 of 30
URL: http://mc.manuscriptcentral.com/terg E-mail: [email protected]
Ergonomics
123456789101112131415161718192021222324252627282930313233343536373839404142434445464748495051525354555657585960
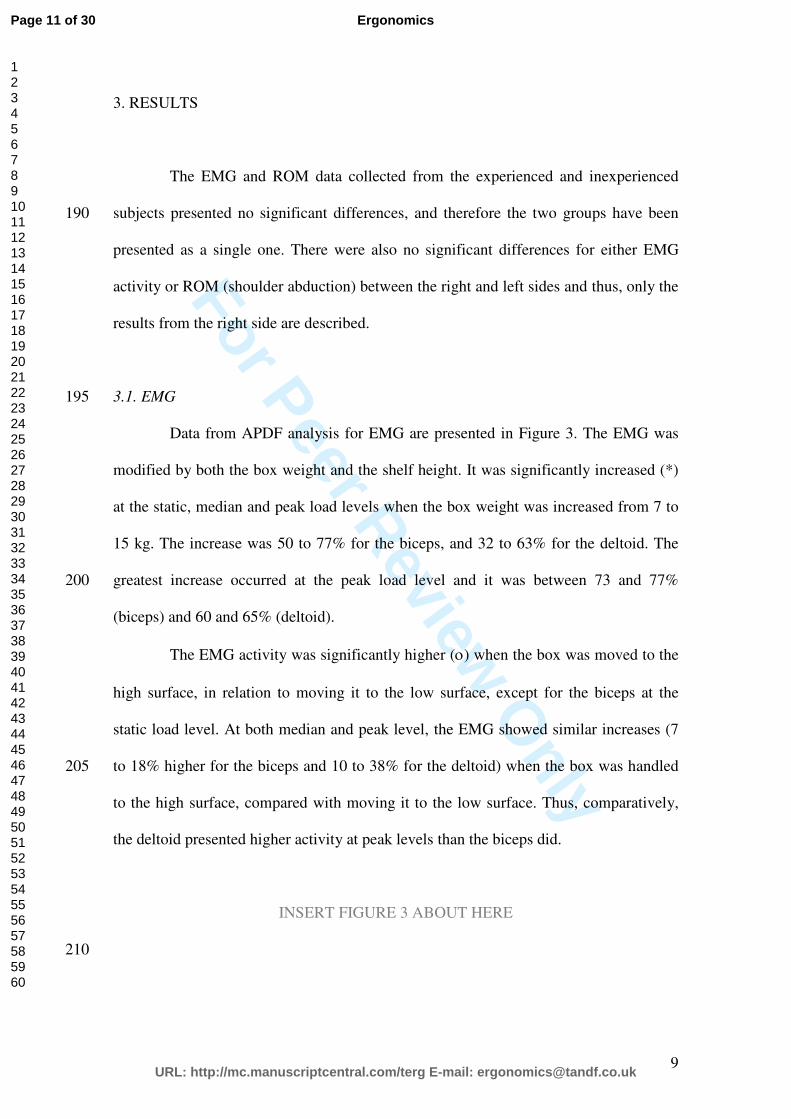
For Peer Review O
nly
9
3. RESULTS
The EMG and ROM data collected from the experienced and inexperienced
subjects presented no significant differences, and therefore the two groups have been190
presented as a single one. There were also no significant differences for either EMG
activity or ROM (shoulder abduction) between the right and left sides and thus, only the
results from the right side are described.
3.1. EMG195
Data from APDF analysis for EMG are presented in Figure 3. The EMG was
modified by both the box weight and the shelf height. It was significantly increased (*)
at the static, median and peak load levels when the box weight was increased from 7 to
15 kg. The increase was 50 to 77% for the biceps, and 32 to 63% for the deltoid. The
greatest increase occurred at the peak load level and it was between 73 and 77% 200
(biceps) and 60 and 65% (deltoid).
The EMG activity was significantly higher (ο) when the box was moved to the
high surface, in relation to moving it to the low surface, except for the biceps at the
static load level. At both median and peak level, the EMG showed similar increases (7
to 18% higher for the biceps and 10 to 38% for the deltoid) when the box was handled 205
to the high surface, compared with moving it to the low surface. Thus, comparatively,
the deltoid presented higher activity at peak levels than the biceps did.
INSERT FIGURE 3 ABOUT HERE
210
Page 11 of 30
URL: http://mc.manuscriptcentral.com/terg E-mail: [email protected]
Ergonomics
123456789101112131415161718192021222324252627282930313233343536373839404142434445464748495051525354555657585960
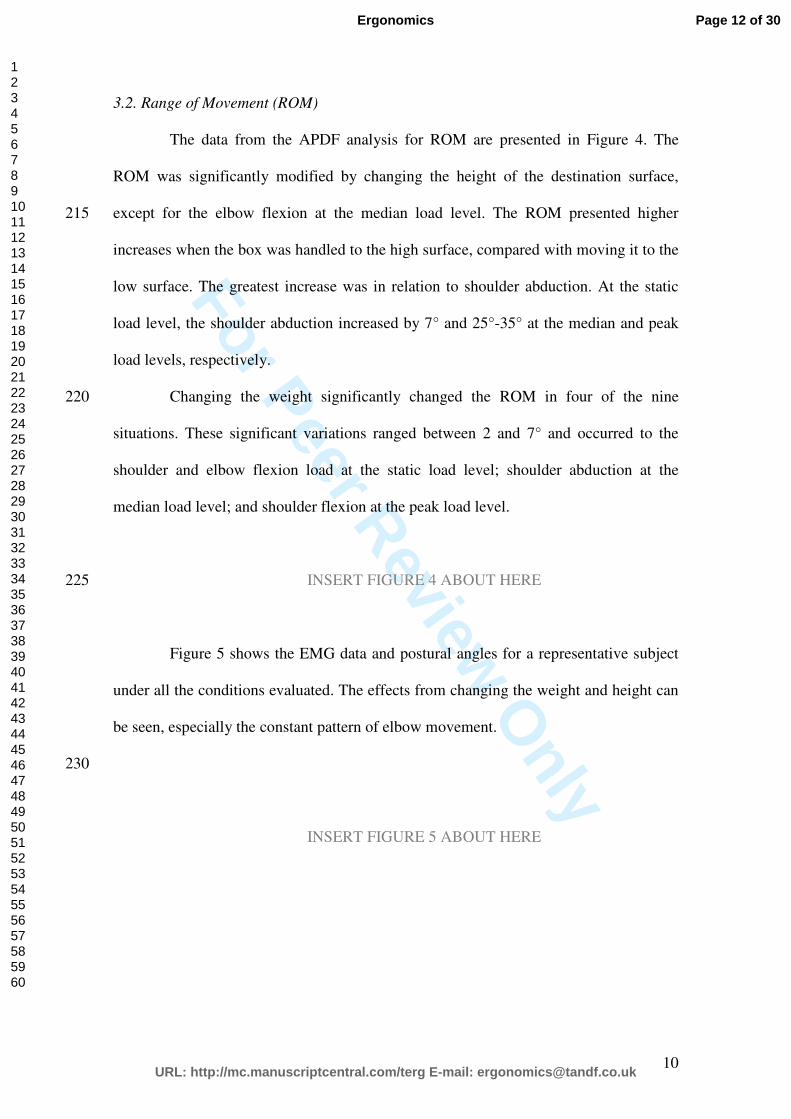
For Peer Review O
nly
10
3.2. Range of Movement (ROM)
The data from the APDF analysis for ROM are presented in Figure 4. The
ROM was significantly modified by changing the height of the destination surface,
except for the elbow flexion at the median load level. The ROM presented higher 215
increases when the box was handled to the high surface, compared with moving it to the
low surface. The greatest increase was in relation to shoulder abduction. At the static
load level, the shoulder abduction increased by 7° and 25°-35° at the median and peak
load levels, respectively.
Changing the weight significantly changed the ROM in four of the nine220
situations. These significant variations ranged between 2 and 7° and occurred to the
shoulder and elbow flexion load at the static load level; shoulder abduction at the
median load level; and shoulder flexion at the peak load level.
INSERT FIGURE 4 ABOUT HERE225
Figure 5 shows the EMG data and postural angles for a representative subject
under all the conditions evaluated. The effects from changing the weight and height can
be seen, especially the constant pattern of elbow movement.
230
INSERT FIGURE 5 ABOUT HERE
Page 12 of 30
URL: http://mc.manuscriptcentral.com/terg E-mail: [email protected]
Ergonomics
123456789101112131415161718192021222324252627282930313233343536373839404142434445464748495051525354555657585960
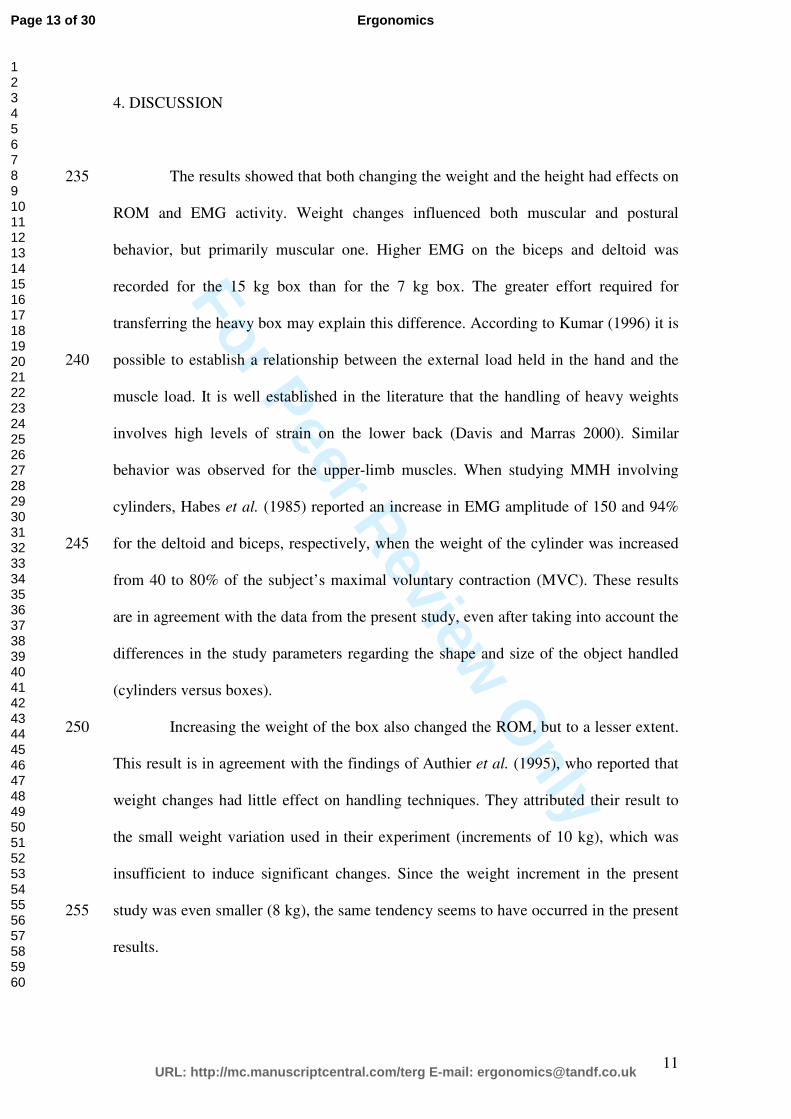
For Peer Review O
nly
11
4. DISCUSSION
The results showed that both changing the weight and the height had effects on 235
ROM and EMG activity. Weight changes influenced both muscular and postural
behavior, but primarily muscular one. Higher EMG on the biceps and deltoid was
recorded for the 15 kg box than for the 7 kg box. The greater effort required for
transferring the heavy box may explain this difference. According to Kumar (1996) it is
possible to establish a relationship between the external load held in the hand and the 240
muscle load. It is well established in the literature that the handling of heavy weights
involves high levels of strain on the lower back (Davis and Marras 2000). Similar
behavior was observed for the upper-limb muscles. When studying MMH involving
cylinders, Habes et al. (1985) reported an increase in EMG amplitude of 150 and 94%
for the deltoid and biceps, respectively, when the weight of the cylinder was increased 245
from 40 to 80% of the subject’s maximal voluntary contraction (MVC). These results
are in agreement with the data from the present study, even after taking into account the
differences in the study parameters regarding the shape and size of the object handled
(cylinders versus boxes).
Increasing the weight of the box also changed the ROM, but to a lesser extent. 250
This result is in agreement with the findings of Authier et al. (1995), who reported that
weight changes had little effect on handling techniques. They attributed their result to
the small weight variation used in their experiment (increments of 10 kg), which was
insufficient to induce significant changes. Since the weight increment in the present
study was even smaller (8 kg), the same tendency seems to have occurred in the present255
results.
Page 13 of 30
URL: http://mc.manuscriptcentral.com/terg E-mail: [email protected]
Ergonomics
123456789101112131415161718192021222324252627282930313233343536373839404142434445464748495051525354555657585960
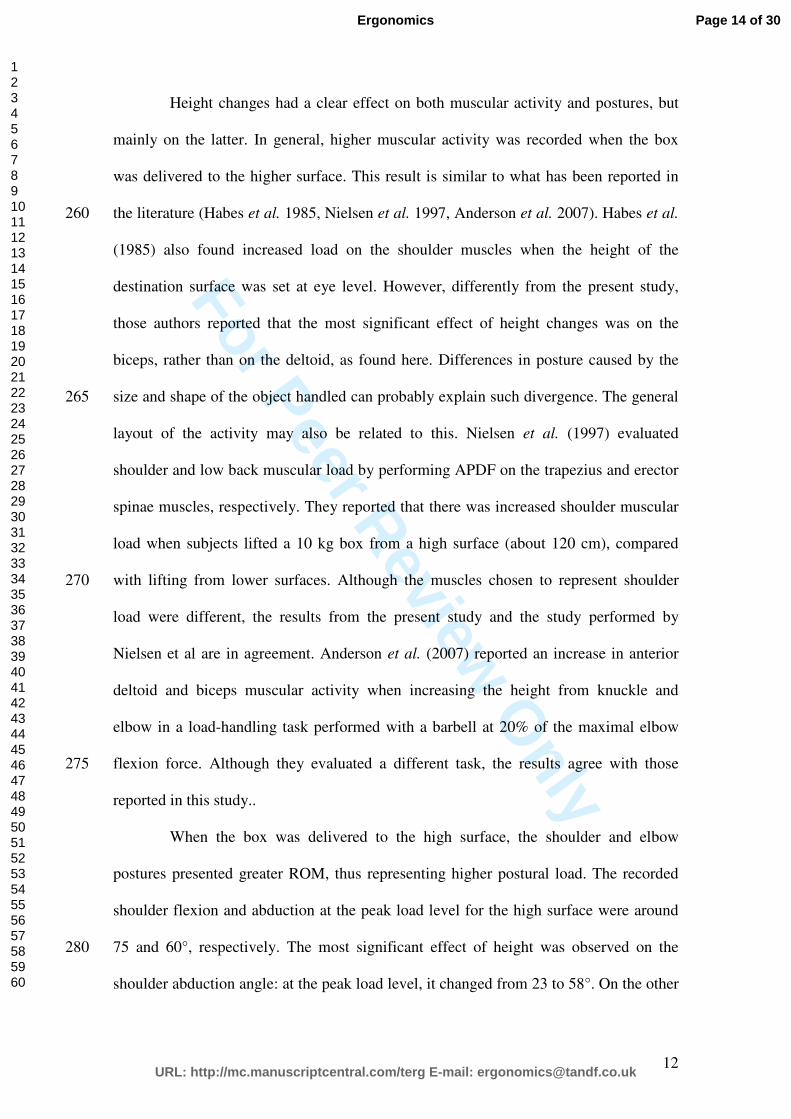
For Peer Review O
nly
12
Height changes had a clear effect on both muscular activity and postures, but
mainly on the latter. In general, higher muscular activity was recorded when the box
was delivered to the higher surface. This result is similar to what has been reported in
the literature (Habes et al. 1985, Nielsen et al. 1997, Anderson et al. 2007). Habes et al.260
(1985) also found increased load on the shoulder muscles when the height of the
destination surface was set at eye level. However, differently from the present study,
those authors reported that the most significant effect of height changes was on the
biceps, rather than on the deltoid, as found here. Differences in posture caused by the
size and shape of the object handled can probably explain such divergence. The general 265
layout of the activity may also be related to this. Nielsen et al. (1997) evaluated
shoulder and low back muscular load by performing APDF on the trapezius and erector
spinae muscles, respectively. They reported that there was increased shoulder muscular
load when subjects lifted a 10 kg box from a high surface (about 120 cm), compared
with lifting from lower surfaces. Although the muscles chosen to represent shoulder 270
load were different, the results from the present study and the study performed by
Nielsen et al are in agreement. Anderson et al. (2007) reported an increase in anterior
deltoid and biceps muscular activity when increasing the height from knuckle and
elbow in a load-handling task performed with a barbell at 20% of the maximal elbow
flexion force. Although they evaluated a different task, the results agree with those 275
reported in this study..
When the box was delivered to the high surface, the shoulder and elbow
postures presented greater ROM, thus representing higher postural load. The recorded
shoulder flexion and abduction at the peak load level for the high surface were around
75 and 60°, respectively. The most significant effect of height was observed on the 280
shoulder abduction angle: at the peak load level, it changed from 23 to 58°. On the other
Page 14 of 30
URL: http://mc.manuscriptcentral.com/terg E-mail: [email protected]
Ergonomics
123456789101112131415161718192021222324252627282930313233343536373839404142434445464748495051525354555657585960
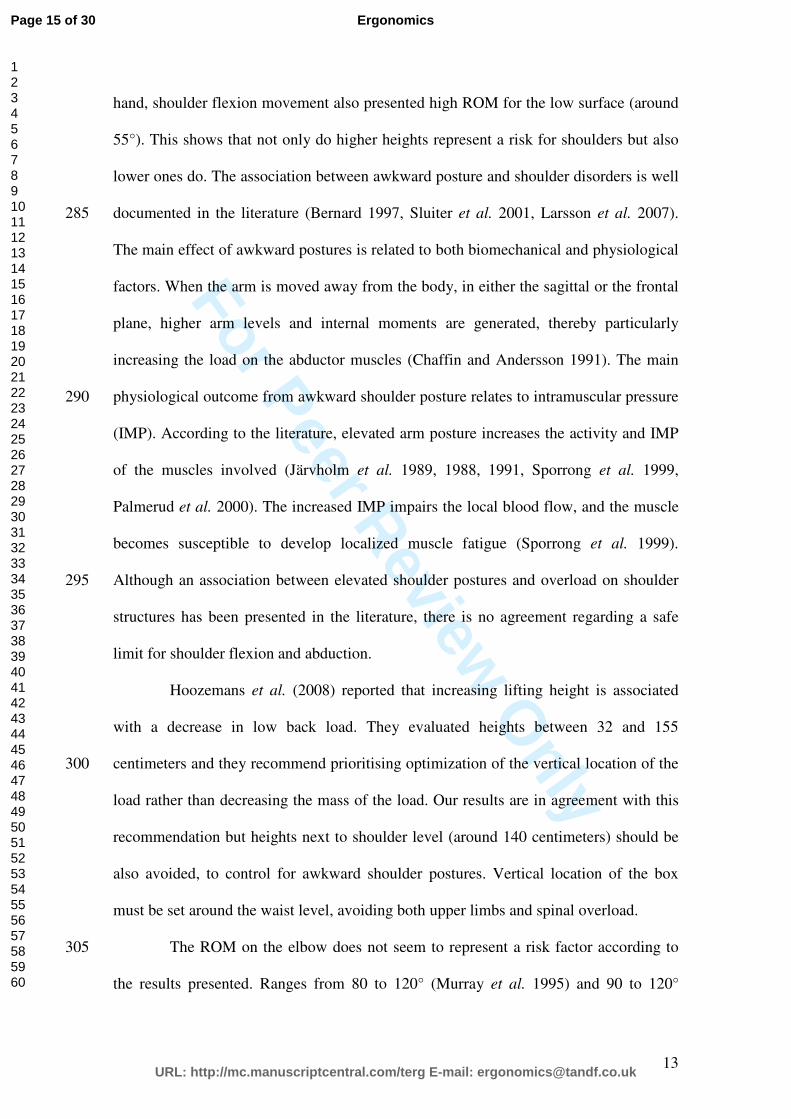
For Peer Review O
nly
13
hand, shoulder flexion movement also presented high ROM for the low surface (around
55°). This shows that not only do higher heights represent a risk for shoulders but also
lower ones do. The association between awkward posture and shoulder disorders is well
documented in the literature (Bernard 1997, Sluiter et al. 2001, Larsson et al. 2007). 285
The main effect of awkward postures is related to both biomechanical and physiological
factors. When the arm is moved away from the body, in either the sagittal or the frontal
plane, higher arm levels and internal moments are generated, thereby particularly
increasing the load on the abductor muscles (Chaffin and Andersson 1991). The main
physiological outcome from awkward shoulder posture relates to intramuscular pressure 290
(IMP). According to the literature, elevated arm posture increases the activity and IMP
of the muscles involved (Järvholm et al. 1989, 1988, 1991, Sporrong et al. 1999,
Palmerud et al. 2000). The increased IMP impairs the local blood flow, and the muscle
becomes susceptible to develop localized muscle fatigue (Sporrong et al. 1999).
Although an association between elevated shoulder postures and overload on shoulder 295
structures has been presented in the literature, there is no agreement regarding a safe
limit for shoulder flexion and abduction.
Hoozemans et al. (2008) reported that increasing lifting height is associated
with a decrease in low back load. They evaluated heights between 32 and 155
centimeters and they recommend prioritising optimization of the vertical location of the 300
load rather than decreasing the mass of the load. Our results are in agreement with this
recommendation but heights next to shoulder level (around 140 centimeters) should be
also avoided, to control for awkward shoulder postures. Vertical location of the box
must be set around the waist level, avoiding both upper limbs and spinal overload.
The ROM on the elbow does not seem to represent a risk factor according to 305
the results presented. Ranges from 80 to 120° (Murray et al. 1995) and 90 to 120°
Page 15 of 30
URL: http://mc.manuscriptcentral.com/terg E-mail: [email protected]
Ergonomics
123456789101112131415161718192021222324252627282930313233343536373839404142434445464748495051525354555657585960
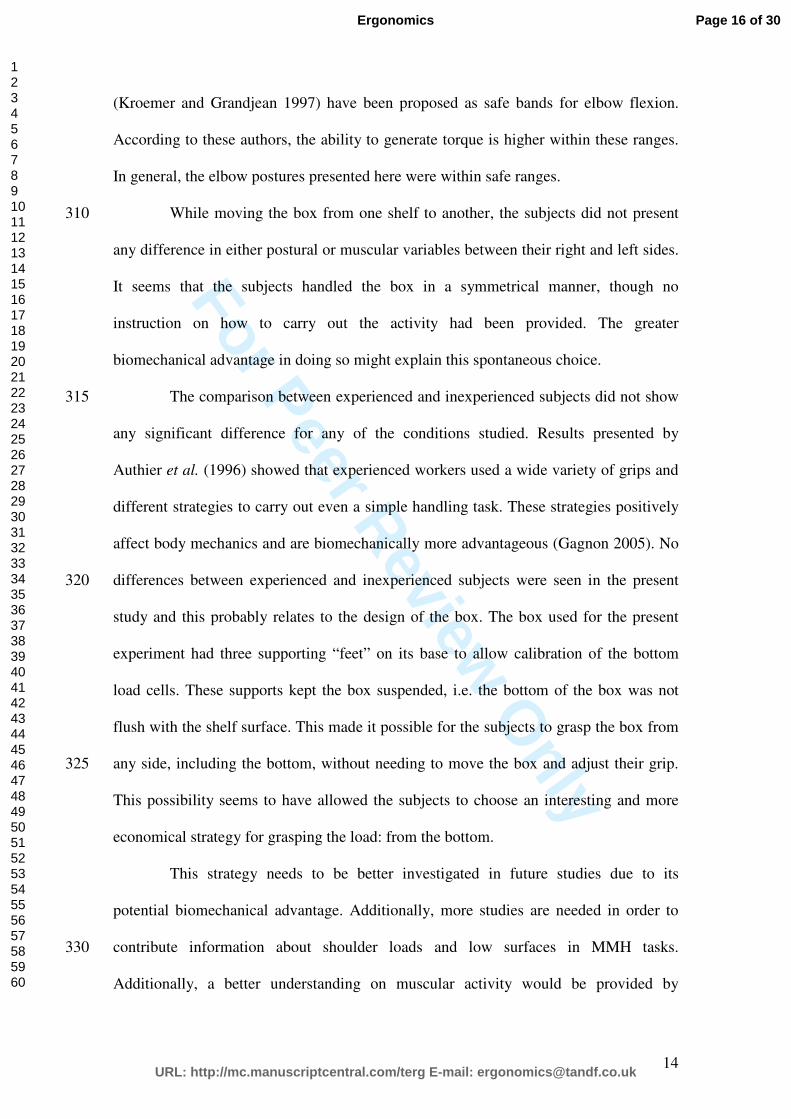
For Peer Review O
nly
14
(Kroemer and Grandjean 1997) have been proposed as safe bands for elbow flexion.
According to these authors, the ability to generate torque is higher within these ranges.
In general, the elbow postures presented here were within safe ranges.
While moving the box from one shelf to another, the subjects did not present 310
any difference in either postural or muscular variables between their right and left sides.
It seems that the subjects handled the box in a symmetrical manner, though no
instruction on how to carry out the activity had been provided. The greater
biomechanical advantage in doing so might explain this spontaneous choice.
The comparison between experienced and inexperienced subjects did not show 315
any significant difference for any of the conditions studied. Results presented by
Authier et al. (1996) showed that experienced workers used a wide variety of grips and
different strategies to carry out even a simple handling task. These strategies positively
affect body mechanics and are biomechanically more advantageous (Gagnon 2005). No
differences between experienced and inexperienced subjects were seen in the present320
study and this probably relates to the design of the box. The box used for the present
experiment had three supporting “feet” on its base to allow calibration of the bottom
load cells. These supports kept the box suspended, i.e. the bottom of the box was not
flush with the shelf surface. This made it possible for the subjects to grasp the box from
any side, including the bottom, without needing to move the box and adjust their grip.325
This possibility seems to have allowed the subjects to choose an interesting and more
economical strategy for grasping the load: from the bottom.
This strategy needs to be better investigated in future studies due to its
potential biomechanical advantage. Additionally, more studies are needed in order to
contribute information about shoulder loads and low surfaces in MMH tasks. 330
Additionally, a better understanding on muscular activity would be provided by
Page 16 of 30
URL: http://mc.manuscriptcentral.com/terg E-mail: [email protected]
Ergonomics
123456789101112131415161718192021222324252627282930313233343536373839404142434445464748495051525354555657585960
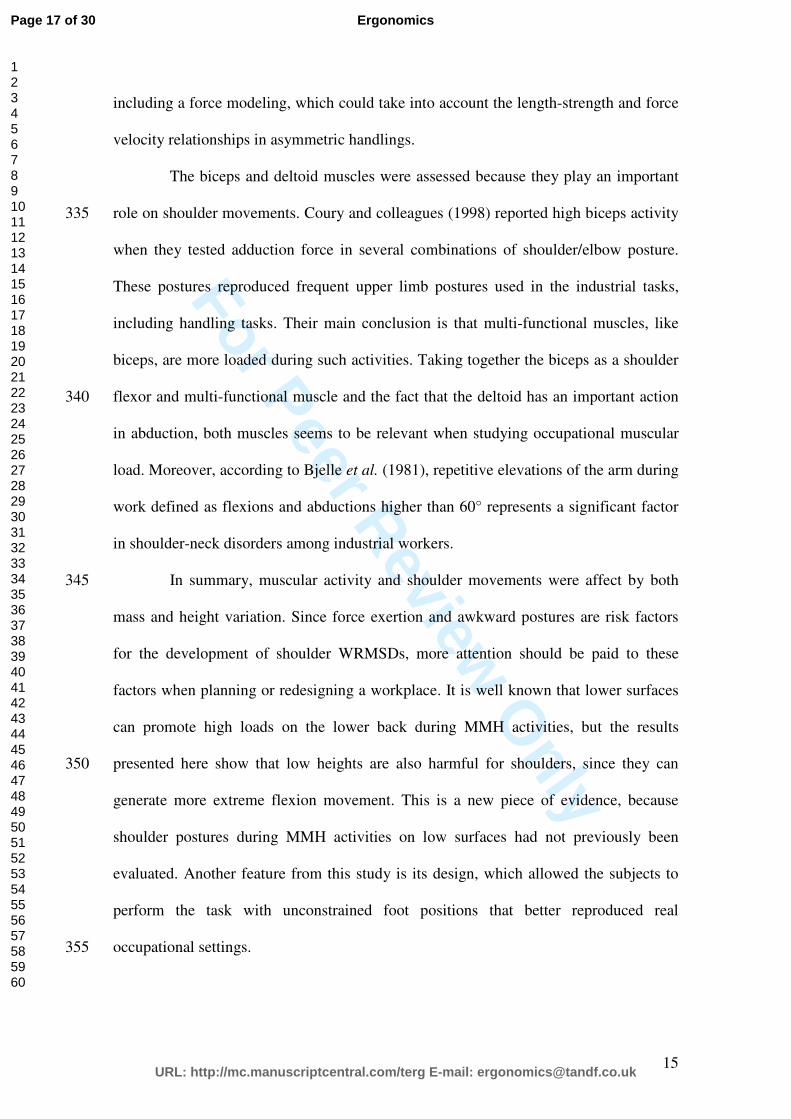
For Peer Review O
nly
15
including a force modeling, which could take into account the length-strength and force
velocity relationships in asymmetric handlings.
The biceps and deltoid muscles were assessed because they play an important
role on shoulder movements. Coury and colleagues (1998) reported high biceps activity 335
when they tested adduction force in several combinations of shoulder/elbow posture.
These postures reproduced frequent upper limb postures used in the industrial tasks,
including handling tasks. Their main conclusion is that multi-functional muscles, like
biceps, are more loaded during such activities. Taking together the biceps as a shoulder
flexor and multi-functional muscle and the fact that the deltoid has an important action 340
in abduction, both muscles seems to be relevant when studying occupational muscular
load. Moreover, according to Bjelle et al. (1981), repetitive elevations of the arm during
work defined as flexions and abductions higher than 60° represents a significant factor
in shoulder-neck disorders among industrial workers.
In summary, muscular activity and shoulder movements were affect by both 345
mass and height variation. Since force exertion and awkward postures are risk factors
for the development of shoulder WRMSDs, more attention should be paid to these
factors when planning or redesigning a workplace. It is well known that lower surfaces
can promote high loads on the lower back during MMH activities, but the results
presented here show that low heights are also harmful for shoulders, since they can 350
generate more extreme flexion movement. This is a new piece of evidence, because
shoulder postures during MMH activities on low surfaces had not previously been
evaluated. Another feature from this study is its design, which allowed the subjects to
perform the task with unconstrained foot positions that better reproduced real
occupational settings. 355
Page 17 of 30
URL: http://mc.manuscriptcentral.com/terg E-mail: [email protected]
Ergonomics
123456789101112131415161718192021222324252627282930313233343536373839404142434445464748495051525354555657585960
For Peer Review O
nly
16
5. ACKNOWLEDGEMENTS
The authors are grateful to Gert-Åke Hansson, of Lund University, Sweden, for
discussions regarding the processing and presentation of EMG and kinematic data. This 360
study was supported by grants from CNPq and Fapesp. A.B. Oliveira is grateful to
Fapesp for her PhD scholarship (05/53804-3).
365
Page 18 of 30
URL: http://mc.manuscriptcentral.com/terg E-mail: [email protected]
Ergonomics
123456789101112131415161718192021222324252627282930313233343536373839404142434445464748495051525354555657585960
For Peer Review O
nly
17
6. REFERENCES
Anderson, A.M., Meador K.A., McClure L.R., Makrozahopoulos D., Brooks D.J.,
Mirka G.A., 2007. A biomechanical analysis of anterior load carriage. Ergonomics, 50
(2), 2104-17.
Authier, M., Gagnon, M., Lortie, M., 1995. Handling techniques: the influence of
weight and height for experts and novices. International Journal Occupational Safety
and Ergonomics, 1 (3), 262-75.
Authier, M., Lortie, M., Gagnon, M., 1996. Manual handling techniques: comparing
novices and experts. International Journal of Industrial Ergonomics, 17 (5), 419-29.
Ayoub, M.M., 1992. Problems and solutions in manual materials handling: the state of
art. Ergonomics, 35 (7-8), 713-28.
Barela, A.M.F., Duarte, M., 2008. Biomechanical characteristics of elderly individuals
walking on land and in water. Journal or Electromyography and Kinesiology, 18 (3),
446-454.
Bernard, B.P., 1997. Musculoskeletal Disorders and Workplace Factors. DHHS
(NIOSH) Publication No. 97-141. US Department of Health and Human Services,
Public Health Service, Centers for Disease Control and Prevention, National Institute
for Occupational Safety and Health.
Bjelle, A., Hagberg, M., Michaelson, G., 1981. Occupational and individual factors in
acute shoulder-neck disorders among industrial workers. British Journal of Industrial
Medicine, 38 (4), 356-63.
Chaffin, D.B., Andersson, G.B.J., 1991. Occupational Biomechanics. 2nd ed. USA:
John Wiley & Sons, Inc.
Chaffin, D.B., Park, K.S., 1973. A longitudinal study of low-back pain as associated
with occupational weight lifting factors. American Industrial Hygiene Association
Journal, 34 (12), 513-25.
Page 19 of 30
URL: http://mc.manuscriptcentral.com/terg E-mail: [email protected]
Ergonomics
123456789101112131415161718192021222324252627282930313233343536373839404142434445464748495051525354555657585960
For Peer Review O
nly
18
Ciriello, V.M., 2001. The effects of box size, vertical distance, and height on lowering
tasks. International Journal of Industrial Ergonomics, 28 (2), 61-7.
Ciriello, V.M., Dempsey, P.G., Maikala, R.V., O’Brien, N.V., 2008. Secular changes in
psychophysically determined maximum acceptable weights and forces over 20 years for
male industrial workers. Ergonomics, 51(5), 593-601.
Coury, H.J.C.G., Kumar, S., Narayan, Y., 1998. An electromyographic study of upper
limb adduction force with varying shoulder and elbow postures. Journal of
Electromyography and Kinesiology, 8 (3), 157-68.
Davis, K., Marras, W.S., 2005. Load spatial pathway and spine loading: how does lift
origin and destination influence low back response? Ergonomics, 48 (8), 1031-46.
Davis, K.G., Marras, W.S., 2000. Assessment of the relationship between box weight
and trunk kinematics: does a reduction in box weight necessarily correspond to a
decrease in spinal loading? Human Factors, 42 (2), 195-208.
Drury, C.G., Law, C.H., Pawenski, C.S., 1982. A survey of industrial box handling.
Human Factors, 24 (5), 553-65.
Freriks, B., Hermens, H.J., 1999. SENIAM 9: European recommendations for surface
electromyography. [CD-room]. Roessingh Research and Development.
Gagnon, M., 2005. Ergonomic identification and biomechanical evaluation of workers’
strategies and their validation in a training situation: Summary of research. Clinical
Biomechanics, 20 (6), 569-80.
Habes, D., Carlson, W., Badger, D., 1985. Muscle fatigue associated with repetitive arm
lifts: effects of height weight and reach. Ergonomics, 28 (2), 471-88.
Page 20 of 30
URL: http://mc.manuscriptcentral.com/terg E-mail: [email protected]
Ergonomics
123456789101112131415161718192021222324252627282930313233343536373839404142434445464748495051525354555657585960
For Peer Review O
nly
19
Hägg, G.M., Luttmann, A., Jäger, M., 2000. Methodologies for evaluating
electromyographic field data in ergonomics. Journal of Electromyography and
Kinesiology, 10 (5), 301-12.
Hasiang, S.M., McGorry, R.W., 1997. Three different lifting strategies for controlling
the motion patterns of the external load. Ergonomics, 40 (9), 928-939.
Hoozemans, M.J.M., Kingma I., de Vries, W.H.K., van Dieën, J.H., 2008. Effect of
lifting height and load mass on low back loading. Ergonomics, 51 (7), 1053-63.
Jäger, M., Luttmann, A. 1992. The load on the lumbar spine during asymmetrical bi-
manual materials handling. Ergonomics, 35 (7/8), 783-805.
Järvholm, U., Palmerud, G., Herberts, P., Högfors, C., Kadefors, R., 1989.
Intramuscular pressure and electromyography in the supraspinatus muscle at shoulder
abduction. Clinical Orthopaedic and Related Research, 245, 102-9.
Järvholm, U., Palmerud, G., Karlsson, D., Herberts, P., Kadefors, R., 1991.
Intramuscular Pressure and electromyography in four shoulder muscles. Journal of
Orthopaedic Research, 9 (4), 609-19.
Järvholm, U., Palmerud, G., Styf, J., Herberts, P., Kadefors, R., 1988. Intramuscular
pressure in the supraspinatus muscle. Journal of Orthopaedic Research, 6 (2), 230-38.
Jonsson, B., 1982. Measurement and evaluation of local muscular strain in the shoulder
during constrained work. Journal of Human Ergology, 11 (1), 73-88.
Kroemer, K.H.E., Grandjean, E., 2000. Fitting the task to the human: a textbook of
occupational ergonomics. 5th ed. London: Taylor & Francis.
Kumar, S., 1996. Electromyography in ergonomics. In: Kumar, S., Mital, A., ed.
Electromyography in ergonomics. London: Taylor & Francis, 1-50.
Larsson, B., Søgaard, K., Rosendal, L., 2007. Work-related neck-shoulder pain: a
review on magnitude, risk factors, biochemical characteristics, clinical picture and
Page 21 of 30
URL: http://mc.manuscriptcentral.com/terg E-mail: [email protected]
Ergonomics
123456789101112131415161718192021222324252627282930313233343536373839404142434445464748495051525354555657585960
For Peer Review O
nly
20
preventive interventions. Best Practice & Research Clinical Rheumatology, 21 (3), 447-
63.
Murray, W.M., Delp, S.L., Buchanan, T.S., 1995. Variation of muscle moment arms
with elbow and forearm position. Journal of Biomechanics, 28 (5), 513-25.
Nastasia, I., Lortie, M., Delisle, A., Gagnon, M. Perception and biomechanics data in a
manual handling task: a comparative study. Ergonomics, 50(12), 2059-81.
Nielsen, P.K., Andersen, L., Jørgensen, K., 1998. The muscular load on the lower back
and shoulders due to lifting at different lifting heights and frequencies. Applied
Ergonomics, 29 (6), 445-50.
Okunribido, O.O., Haslegrave, C.M., 2003. Pouring liquid from a pot – kinematics of an
everyday task. Applied Ergonomics, 34 (4), 355-73.
Padula, R.S., Coury, H.J.C.G., 2003. Sagittal trunk movements during load carrying
activities: a pilot study. International Journal of Industrial Ergonomics, 32 (3), 181-
188.
Padula, R.S., Coury, H.J.C.G., 2004. Device for analyzing grip forces during handling.
In: Premus 2004: Fifth International Scientific Conference on Prevention of Work-
related Musculoskeletal Disorders. Abstract Book II. Zurich, 599-600.
Palmerud, G., Forsman, M., Sporrong, H., Herberts, P., Kadefors, R., 2000.
Intramuscular pressure of the infra- and supraspinatus muscles in relation to hand load
and arm posture. European Journal of Applied Physiology, 83 (2-3), 223-30.
Sluiter, J.K., Rest, K.M., Frings-Dresen, M.H.W., 2001. Criteria document for
evaluating the work-relatedness of upper-extremity musculoskeletal disorders.
Scandinavian Journal of Environmental and Health, 27 (suppl 1), 1-102.
Page 22 of 30
URL: http://mc.manuscriptcentral.com/terg E-mail: [email protected]
Ergonomics
123456789101112131415161718192021222324252627282930313233343536373839404142434445464748495051525354555657585960
For Peer Review O
nly
21
Søgaard, K., Laursen, B., Jensen, B.R., Sjøgaard, G., 2001. Dynamic loads on the upper
extremities during two different floor cleaning methods. Clinical Biomechanics, 16
(10), 866-79.
Sporrong, H., Sandsjö, L., Kadefors, R., Herberts, P., 1999. Assessment of workload
and arm position during different work sequences: a study with portable devices on
construction workers. Applied Ergonomics, 30 (6), 495-503.
Straker, L.M., 1999. An overview of manual handling injury statistics in Western
Australia. International Journal of Industrial Ergonomics, 24 (4), 357-64.
Yeung, S.S., Genaidy, A., Deddens, J., Alhemood, A., Leung, P.C., 2002. Prevalence of
musculoskeletal symptoms in single and multiple body regions and effects of perceived
risk of injury among manual handling workers. Spine, 27 (19), 2166-71.
Page 23 of 30
URL: http://mc.manuscriptcentral.com/terg E-mail: [email protected]
Ergonomics
123456789101112131415161718192021222324252627282930313233343536373839404142434445464748495051525354555657585960
For Peer Review O
nly
22
Figure 1. Layout of the manual handling tasks performed by the subjects. Full line
indicates the handling from the intermediate shelf to the high shelf (IS → HS) and
dotted line indicates the handling from the intermediate shelf to the low shelf (IS →
LS).
Figure 2. Illustration of the positions of the markers and coordinate system used for
joint angular position calculations.
Figure 3. Static, median and peak levels (mean ± one standard deviation) of the EMG
normalized to the reference condition, for the biceps and deltoid muscles of 32 subjects
during manual handling of 7 and 15 kg boxes from the intermediate to the high shelf
(HS) and from the intermediate to the low shelf (LS). Asterisk (*) indicates significant
difference (p <0.05) between 7 and 15 kg and circle (ο) indicates significant difference
(p <0.05) between HS and LS.
Figure 4. Static, median and peak levels (mean ± one standard deviation) of range of
motion (ROM) (in degrees) for right shoulder abduction and flexion and right elbow
flexion, of 32 subjects during manual handling of 7 and 15 kg boxes from the
intermediate to the high shelf (HS) and from the intermediate to the low shelf (LS).
Figure 5. Time-normalized ROM (y’) and EMG (y”) data from right upper limb of one
subject during MMH of 7 kg box to high (A) and low (B) shelf and of 15 kg box to high
(C) and low (D) shelf.
Page 24 of 30
URL: http://mc.manuscriptcentral.com/terg E-mail: [email protected]
Ergonomics
123456789101112131415161718192021222324252627282930313233343536373839404142434445464748495051525354555657585960
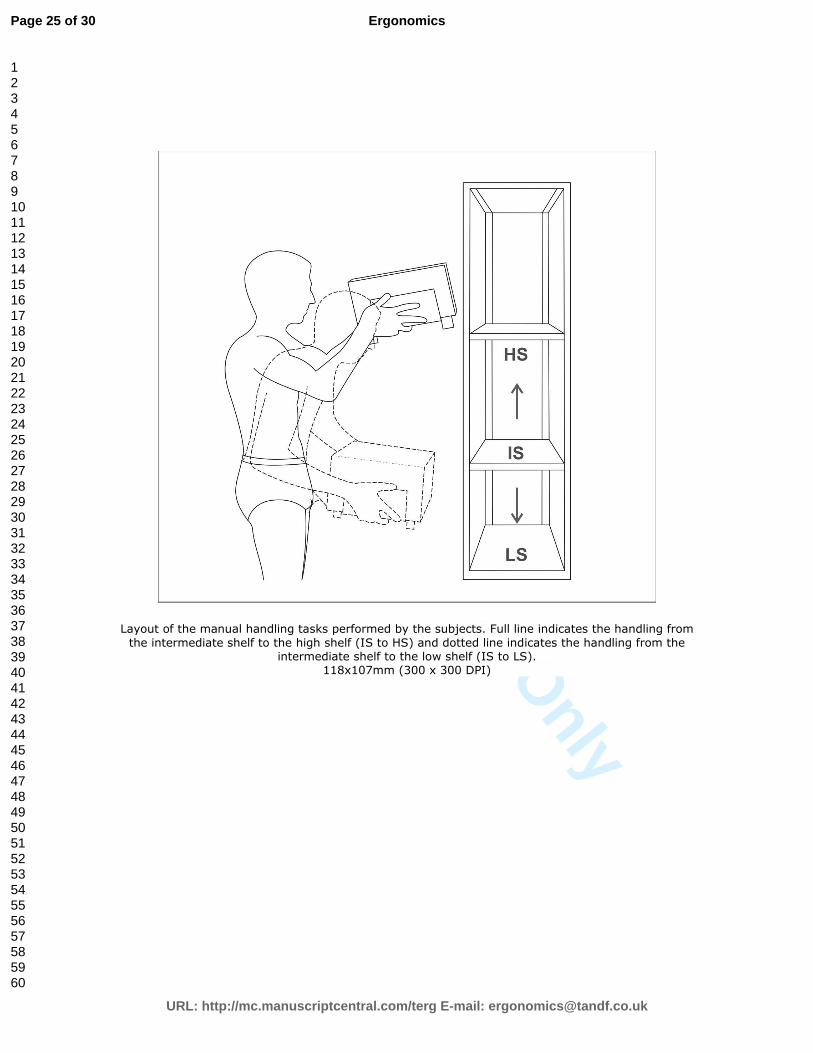
For Peer Review O
nly
Layout of the manual handling tasks performed by the subjects. Full line indicates the handling from
the intermediate shelf to the high shelf (IS to HS) and dotted line indicates the handling from the intermediate shelf to the low shelf (IS to LS).
118x107mm (300 x 300 DPI)
Page 25 of 30
URL: http://mc.manuscriptcentral.com/terg E-mail: [email protected]
Ergonomics
123456789101112131415161718192021222324252627282930313233343536373839404142434445464748495051525354555657585960
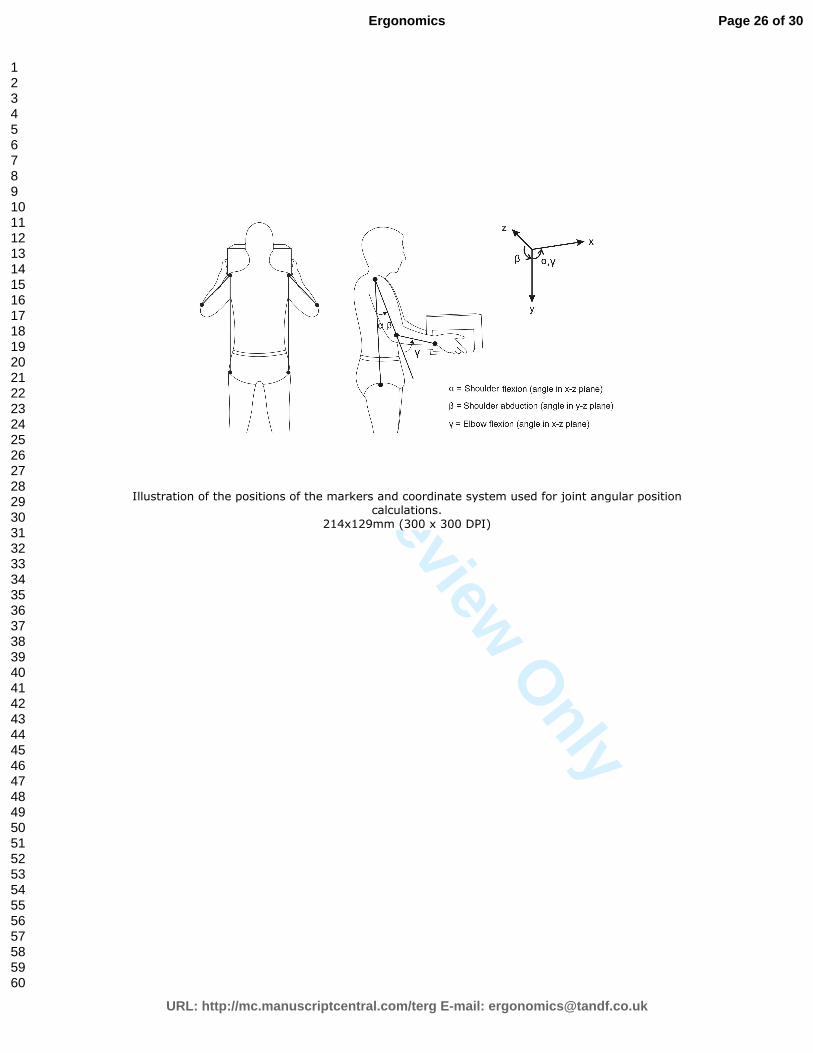
For Peer Review O
nly
Illustration of the positions of the markers and coordinate system used for joint angular position calculations.
214x129mm (300 x 300 DPI)
Page 26 of 30
URL: http://mc.manuscriptcentral.com/terg E-mail: [email protected]
Ergonomics
123456789101112131415161718192021222324252627282930313233343536373839404142434445464748495051525354555657585960
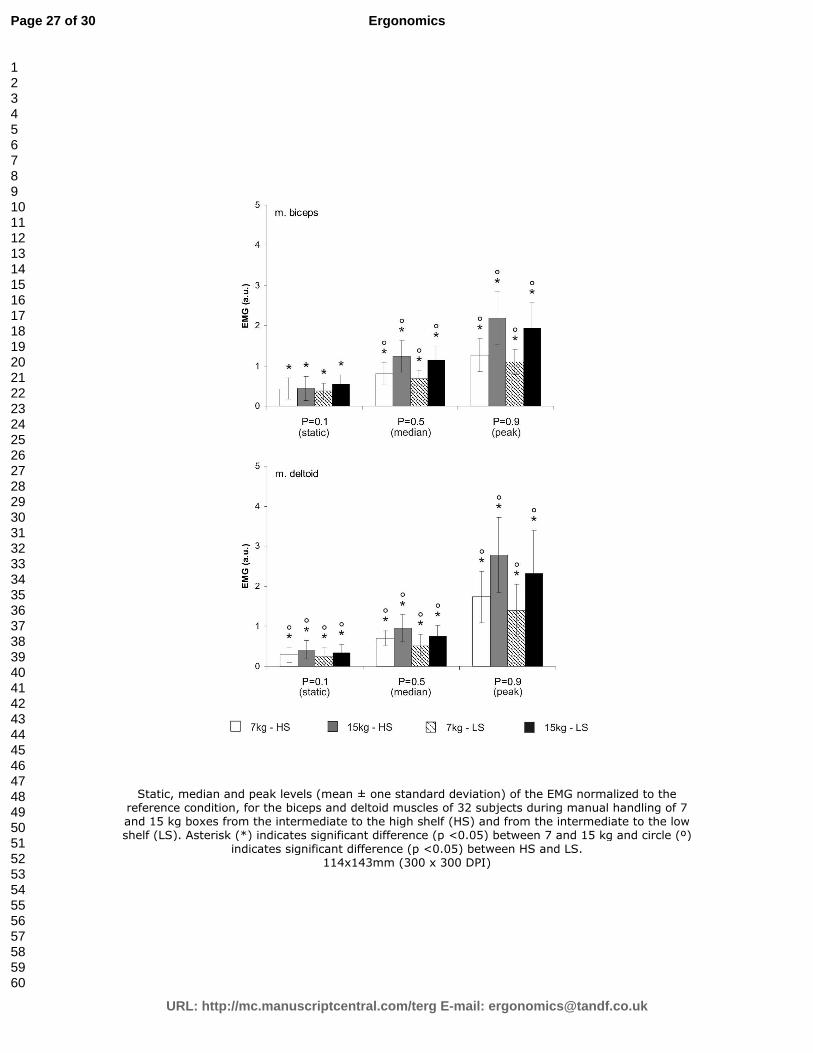
For Peer Review O
nly
Static, median and peak levels (mean ± one standard deviation) of the EMG normalized to the reference condition, for the biceps and deltoid muscles of 32 subjects during manual handling of 7 and 15 kg boxes from the intermediate to the high shelf (HS) and from the intermediate to the low shelf (LS). Asterisk (*) indicates significant difference (p <0.05) between 7 and 15 kg and circle (º)
indicates significant difference (p <0.05) between HS and LS. 114x143mm (300 x 300 DPI)
Page 27 of 30
URL: http://mc.manuscriptcentral.com/terg E-mail: [email protected]
Ergonomics
123456789101112131415161718192021222324252627282930313233343536373839404142434445464748495051525354555657585960
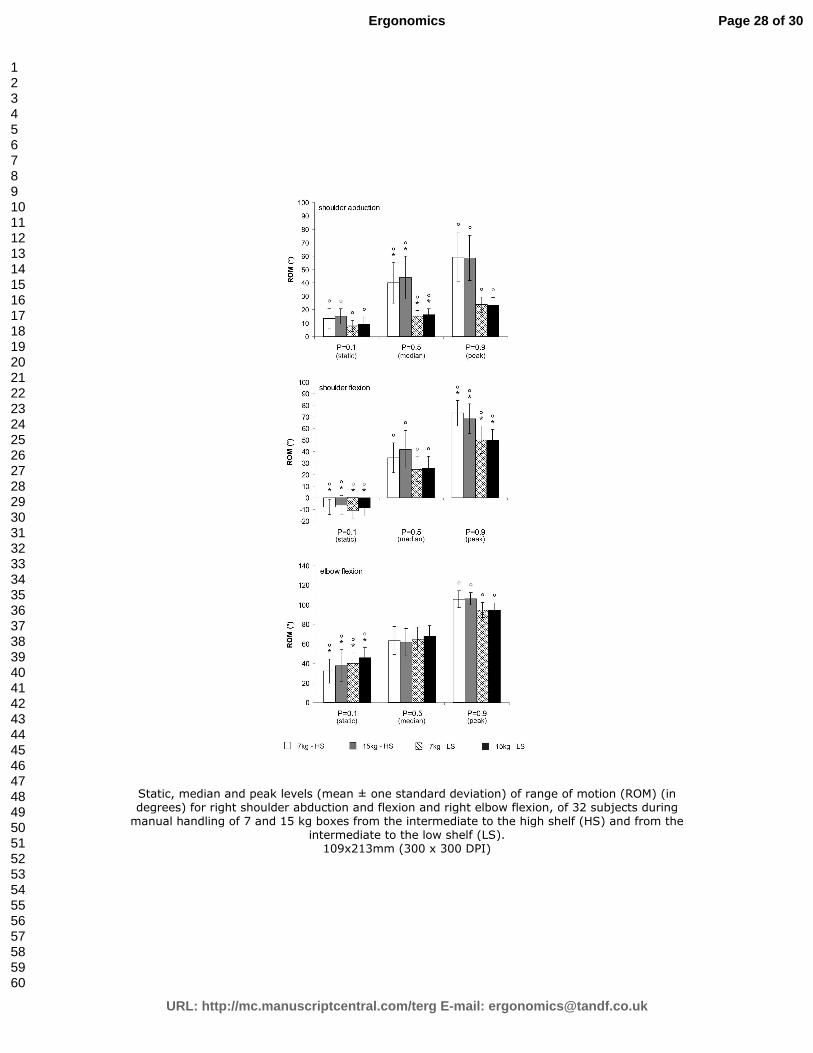
For Peer Review O
nly
Static, median and peak levels (mean ± one standard deviation) of range of motion (ROM) (in degrees) for right shoulder abduction and flexion and right elbow flexion, of 32 subjects during manual handling of 7 and 15 kg boxes from the intermediate to the high shelf (HS) and from the
intermediate to the low shelf (LS). 109x213mm (300 x 300 DPI)
Page 28 of 30
URL: http://mc.manuscriptcentral.com/terg E-mail: [email protected]
Ergonomics
123456789101112131415161718192021222324252627282930313233343536373839404142434445464748495051525354555657585960
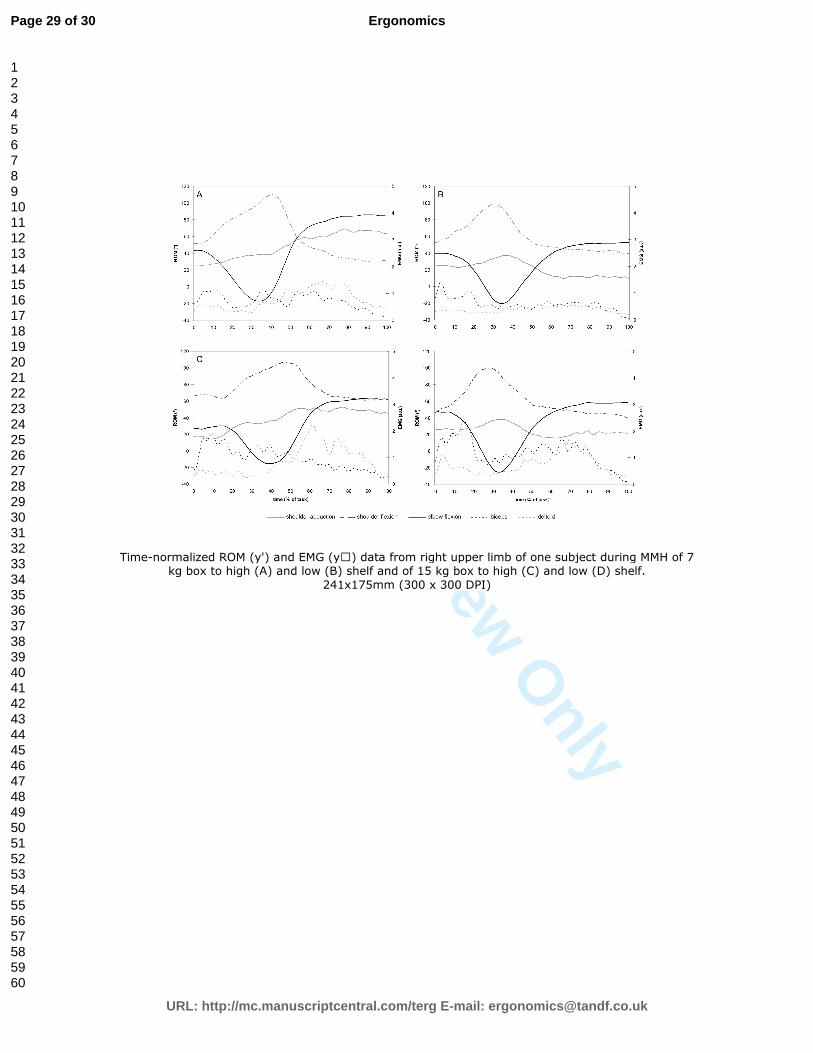
For Peer Review O
nly
Time-normalized ROM (y') and EMG (y<) data from right upper limb of one subject during MMH of 7 kg box to high (A) and low (B) shelf and of 15 kg box to high (C) and low (D) shelf.
241x175mm (300 x 300 DPI)
Page 29 of 30
URL: http://mc.manuscriptcentral.com/terg E-mail: [email protected]
Ergonomics
123456789101112131415161718192021222324252627282930313233343536373839404142434445464748495051525354555657585960
For Peer Review O
nly
Statement of Relevance Knowledge on handling risks may be useful to the design of safer jobs. Shoulder postures during handling involving low surfaces have not been evaluated so far. As well as high surfaces, low height can be harmful to shoulder joints and deserves attention if prevention of disorders is concerned.
Page 30 of 30
URL: http://mc.manuscriptcentral.com/terg E-mail: [email protected]
Ergonomics
123456789101112131415161718192021222324252627282930313233343536373839404142434445464748495051525354555657585960
ANEXO II
OLIVEIRA AB, PÁLINKÁS ESL, SILVA LCCB, PADULA RS, COURY HJCG. How is
a box handled when all sides are free for contact? Manuscrito em fase final de
redação para submissão ao periódico APPLIED ERGONOMICS.
102
103
Title:
How is a box handled when all sides are free for contact?
Authors:
Ana Beatriz de Oliveira1, Ethel Sarolta Lilla Pálinkás1, Luciana Cristina da Cunha
Bueno Silva1, Rosimeire Simprini Padula2, Helenice Jane Cote Gil Coury1.
Affiliations:
1Federal University of Sao Carlos, Department of Physical Therapy, Brazil.
2Sao Francisco University, Department of Physical Therapy, Brazil.
Corresponding author:
Helenice Jane Cote Gil Coury
Universidade Federal de São Carlos, Departamento de Fisioterapia
Via Washington Luis, KM 235, CP 676
CEP 13565-905 São Carlos, SP, Brazil
E-mail: [email protected]; [email protected]
Phone: +55 16 33725535
Fax: +55 16 33612081
104
ABSTRACT
The purpose of this study was to test how experienced and inexperienced subjects
would handle a box when all sides were free for contact. Fourteen experienced and 14
inexperienced subjects handled a 10 kg box from an intermediate surface to both high
and low surface. During the task subjects had their wrist movements and grip force
recorded. All subjects grasped the box symmetrically, positioning the hand on lateral
and bottom sides. Experienced subjects had a higher peak of wrist extension (P<0.05).
Height of the destination surface changed wrist deviation. When the box was moved to
high surface, ulnar deviation reached 25° and more force was used. In general, the grip
adopted by all subjects produced good results but in order to have safe ROM and less
hand forces, high surfaces must be avoided. New ideas to design boxes and containers
are presented to facilitate this hand position in real work conditions.
Keywords: manual material handling; grip force; wrist posture.
105
1. INTRODUCTION
Occupational activities involving manual handling of boxes has long been
associated with musculoskeletal disorders. According to epidemiological studies,
workers performing manual material handling (MMH) activities present problems
mainly in low-back region (Straker, 1999). Recently more attention has been addressed
to other body sites when the focus is the load generated during MMH. Shoulder load
has been assessed (Nielsen et al., 1998; Oliveira and Coury, submitted) and also wrist,
particularly concerning the effect of handles types and handle positions on wrist
postures and workload (Ando et al., 2000; Davis et al., 1998; Drury et al., 1989a and
1989b; Wang et al., 2000). In this context, the NIOSH lifting equation, developed by the
National Institute for Occupational Safety and Health (NIOSH) in 1981, was revised in
1991, when types of handling couple was considered as a multiplier (Waters et al.,
1993).
In fact, the nature of the hand-to-object coupling is very important because it
can determine wrist/hand posture as well as the load on these segments. In this sense,
the main approach in research involving wrist and hands during MMH tasks is the study
of handles (Chung and Wang, 2001; Coury and Drury 1982; Drury, 1980; Wang et al.,
2000). Those studies have provided information regarding how the handle angle can
affect wrist deviation and lifting capability under different work conditions (mass and
task height variation).
The knowledge generated from those studies can be useful provided that the
association between large wrist deviations and forceful exertions has been recognized as
hazardous (Bernard et al., 1997; Wang et al., 2000). However, the presence of handles
in commercial boxes and containers is not common. Drury et al. (1982), after
106
performing a large survey regarding industrial box handling, reported that only 2.6% of
boxes had handles. It was also observed that, even when available, the handles were not
necessarily used. Practical issues related to the handle design might be involved and
should be investigated.
Hand positions, weight of the load, target surfaces and workers’ experience
seem to be other relevant issues when evaluating wrist workload. Those topics have
been previously explored but concerning the wrist there are some limitations. One
important characteristic of all studies assessing hand position in MMH activities is that
the box was always standing on a plain surface, which has provided some restriction
since the subjects have had free access only to lateral and upper sides of the box.
Considering that boxes allowing free access to the low side have never been
investigated so far, it would be helpful to test how experienced and inexperienced
subjects grasp a box during manual handling when all sides are free to be approached.
To contribute with such information, the objective of this study was (1) to describe hand
grips performed by experienced and inexperienced subjects when handling a box which
allows free access to any side; (2) to describe grip force and wrist movements according
to each kind of hand grip, attempting to different heights of the destination surface; (3)
to check for safe range of motion (ROM) recorded for wrist movements in all
conditions.
107
2. METHODS
2.1. Subjects
Twenty-eight male subjects, of mean age 22.3 (± 4.3) years, mean height 1.7 (±
0.04) m and mean weight 69.1 (± 8.7) kg, were recruited to take part in the study.
Fourteen subjects were experienced in handling tasks (at least 6 months working with
activities that included manual handling of boxes in storage sectors of supermarkets and
other retail stores) and 14 were inexperienced in such tasks (students, without
professional experience of manual handling of boxes). Exclusion criteria were:
musculoskeletal symptoms or disorders, general illnesses, limitations on movement
amplitudes, apparent postural deviations and balance problems. All subjects signed an
informed consent statement that had been approved by the local ethics committee
(Process 059/04).
2.2. Protocol
Subjects handled an 11 kg box from an intermediate shelf (IS - 102.5 cm, about
waist level) to either a high shelf (HS - 142.5 cm) or low shelf (LS - 62.5 cm). The
subjects picked up the box from the IS and placed it on a predetermined shelf. The
height of destination shelf was randomized. No specific instructions were provided,
either on postures or how to grasp the box. Before performing the task, the subjects
were provided with information about the initial and final positions of the box, and
when to start the task.
2.3. Data collection and equipments
108
Simultaneous data on grip force, electrogoniometer and video were recorded
during all trials. Wrist positions and movements of right upper arm were recorded for
both the flexion/extension and the deviation angles, using electrogoniometer (XM 65
Biometrics Ltd, Gwent, UK) and an acquisition unit (DataLINK, Biometrics Ltd,
Gwent, UK). The reference position was recorded when the subject was standing with
the arms relaxed on a table in prone forearm position and wrist in a neutral position.
A steel box constructed specially to evaluate manual handling tasks (Padula
and Coury, 2004) was used in this study. This box measures 300 (mm in length) x 300
(mm in width) x 180 (mm in height) and was instrumented with two load cells at the
sides, and two on the bottom of the box, allowing the measure of grip force during
handlings. Each load cell was connected to the DataLink acquisition unit and data were
collected using DataLink software (version 2.0, Biometrics Ltd), at a sampling
frequency of 100 Hz. The box presented three supporting “feet” on its base which
allowed the calibration procedure of the bottom load cells. These supports also allowed
to the subjects to grasp the box from any side, including the bottom. In order to describe
the hand position applied by the subjects to grasp the box, images of the sagittal plane
(right view) were recorded during the experiment using a digital camera (GR-DV 1800,
JVC).
2.4. Data processing and analysis
Even though movements and grip force had been collected throughout the
whole tests, only the handling phases were analyzed. The handling phase was defined as
the time during which the subject’s hands were in contact with the box and exerting
forces above a pre-established limit. The start and end cut-points for each handling
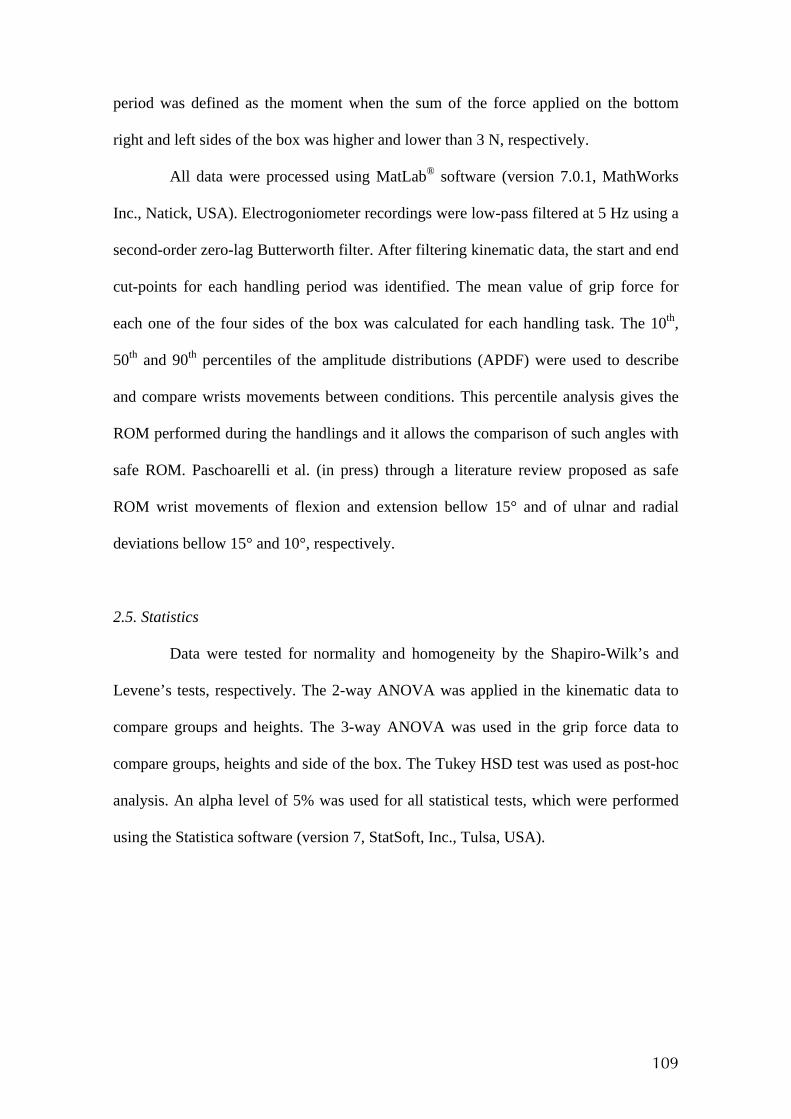
109
period was defined as the moment when the sum of the force applied on the bottom
right and left sides of the box was higher and lower than 3 N, respectively.
All data were processed using MatLab® software (version 7.0.1, MathWorks
Inc., Natick, USA). Electrogoniometer recordings were low-pass filtered at 5 Hz using a
second-order zero-lag Butterworth filter. After filtering kinematic data, the start and end
cut-points for each handling period was identified. The mean value of grip force for
each one of the four sides of the box was calculated for each handling task. The 10th,
50th and 90th percentiles of the amplitude distributions (APDF) were used to describe
and compare wrists movements between conditions. This percentile analysis gives the
ROM performed during the handlings and it allows the comparison of such angles with
safe ROM. Paschoarelli et al. (in press) through a literature review proposed as safe
ROM wrist movements of flexion and extension bellow 15° and of ulnar and radial
deviations bellow 15° and 10°, respectively.
2.5. Statistics
Data were tested for normality and homogeneity by the Shapiro-Wilk’s and
Levene’s tests, respectively. The 2-way ANOVA was applied in the kinematic data to
compare groups and heights. The 3-way ANOVA was used in the grip force data to
compare groups, heights and side of the box. The Tukey HSD test was used as post-hoc
analysis. An alpha level of 5% was used for all statistical tests, which were performed
using the Statistica software (version 7, StatSoft, Inc., Tulsa, USA).
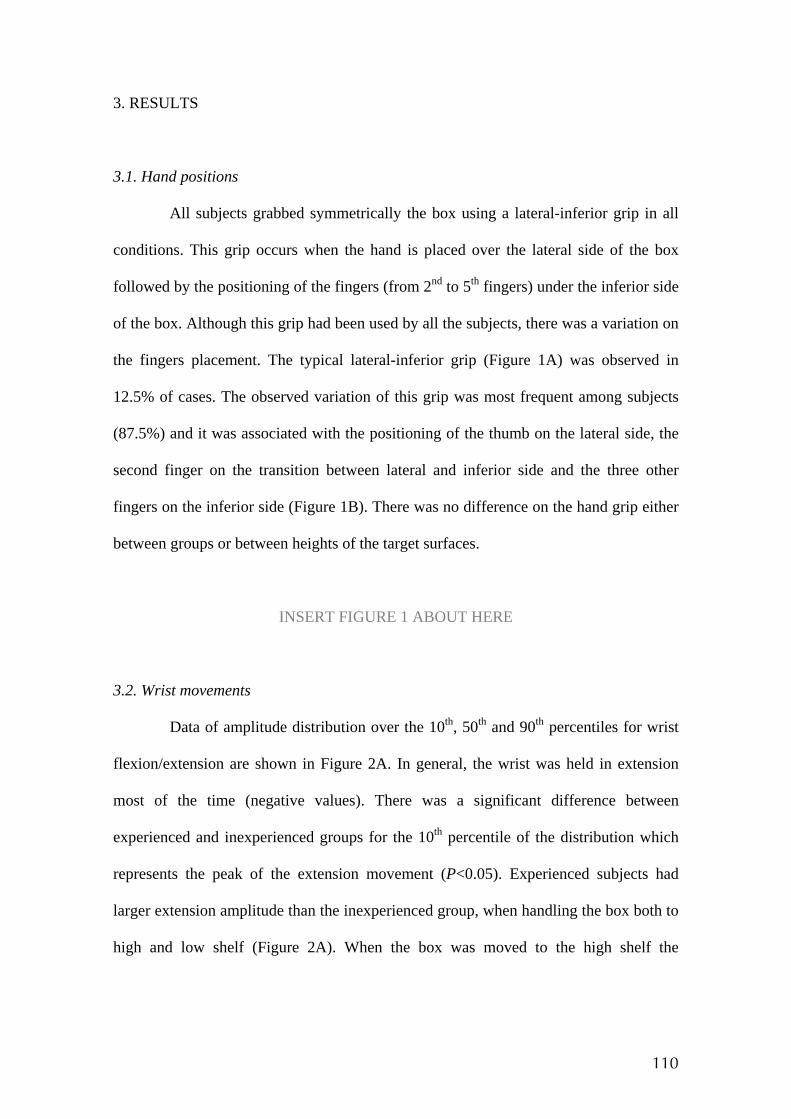
110
3. RESULTS
3.1. Hand positions
All subjects grabbed symmetrically the box using a lateral-inferior grip in all
conditions. This grip occurs when the hand is placed over the lateral side of the box
followed by the positioning of the fingers (from 2nd to 5th fingers) under the inferior side
of the box. Although this grip had been used by all the subjects, there was a variation on
the fingers placement. The typical lateral-inferior grip (Figure 1A) was observed in
12.5% of cases. The observed variation of this grip was most frequent among subjects
(87.5%) and it was associated with the positioning of the thumb on the lateral side, the
second finger on the transition between lateral and inferior side and the three other
fingers on the inferior side (Figure 1B). There was no difference on the hand grip either
between groups or between heights of the target surfaces.
INSERT FIGURE 1 ABOUT HERE
3.2. Wrist movements
Data of amplitude distribution over the 10th, 50th and 90th percentiles for wrist
flexion/extension are shown in Figure 2A. In general, the wrist was held in extension
most of the time (negative values). There was a significant difference between
experienced and inexperienced groups for the 10th percentile of the distribution which
represents the peak of the extension movement (P<0.05). Experienced subjects had
larger extension amplitude than the inexperienced group, when handling the box both to
high and low shelf (Figure 2A). When the box was moved to the high shelf the
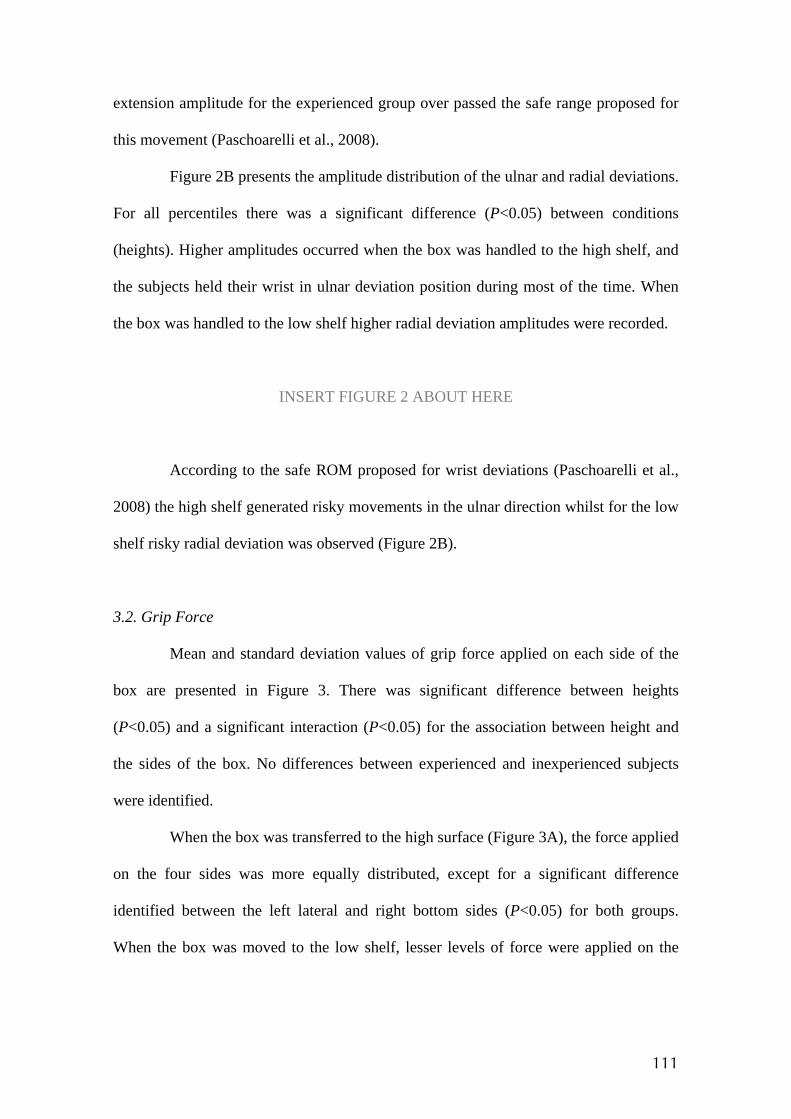
111
extension amplitude for the experienced group over passed the safe range proposed for
this movement (Paschoarelli et al., 2008).
Figure 2B presents the amplitude distribution of the ulnar and radial deviations.
For all percentiles there was a significant difference (P<0.05) between conditions
(heights). Higher amplitudes occurred when the box was handled to the high shelf, and
the subjects held their wrist in ulnar deviation position during most of the time. When
the box was handled to the low shelf higher radial deviation amplitudes were recorded.
INSERT FIGURE 2 ABOUT HERE
According to the safe ROM proposed for wrist deviations (Paschoarelli et al.,
2008) the high shelf generated risky movements in the ulnar direction whilst for the low
shelf risky radial deviation was observed (Figure 2B).
3.2. Grip Force
Mean and standard deviation values of grip force applied on each side of the
box are presented in Figure 3. There was significant difference between heights
(P<0.05) and a significant interaction (P<0.05) for the association between height and
the sides of the box. No differences between experienced and inexperienced subjects
were identified.
When the box was transferred to the high surface (Figure 3A), the force applied
on the four sides was more equally distributed, except for a significant difference
identified between the left lateral and right bottom sides (P<0.05) for both groups.
When the box was moved to the low shelf, lesser levels of force were applied on the
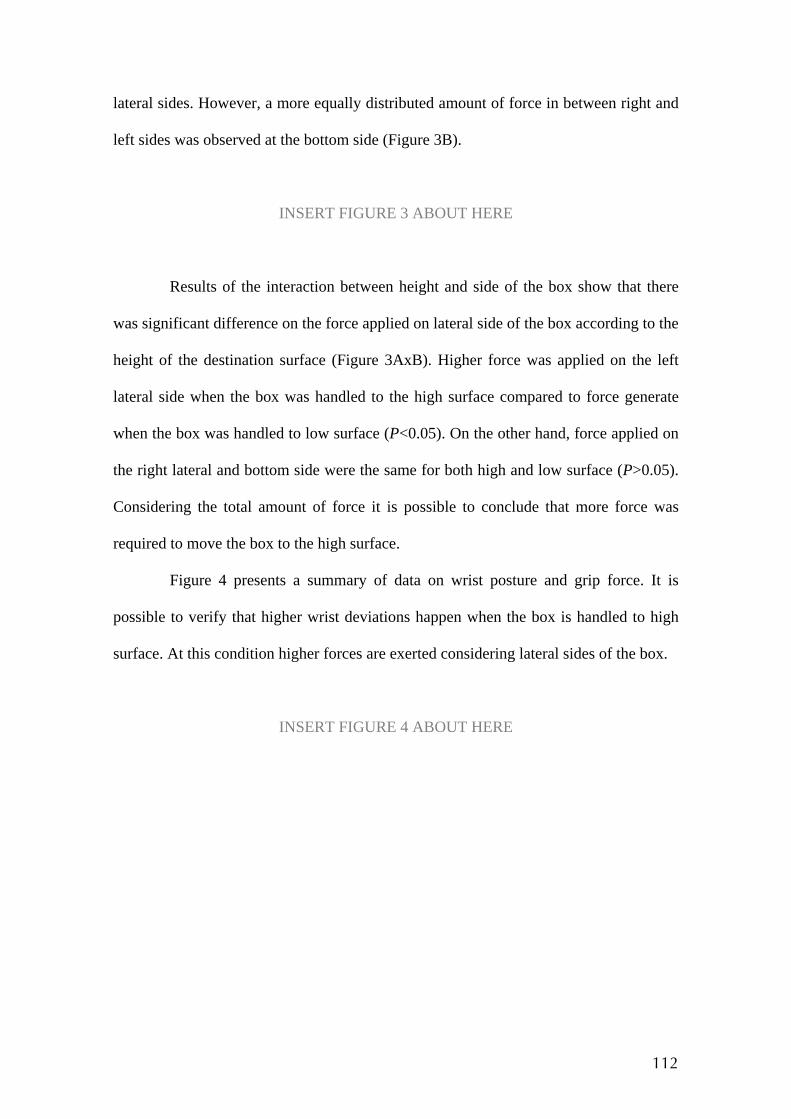
112
lateral sides. However, a more equally distributed amount of force in between right and
left sides was observed at the bottom side (Figure 3B).
INSERT FIGURE 3 ABOUT HERE
Results of the interaction between height and side of the box show that there
was significant difference on the force applied on lateral side of the box according to the
height of the destination surface (Figure 3AxB). Higher force was applied on the left
lateral side when the box was handled to the high surface compared to force generate
when the box was handled to low surface (P<0.05). On the other hand, force applied on
the right lateral and bottom side were the same for both high and low surface (P>0.05).
Considering the total amount of force it is possible to conclude that more force was
required to move the box to the high surface.
Figure 4 presents a summary of data on wrist posture and grip force. It is
possible to verify that higher wrist deviations happen when the box is handled to high
surface. At this condition higher forces are exerted considering lateral sides of the box.
INSERT FIGURE 4 ABOUT HERE
113
4. DISCUSSION
Experienced and inexperienced subjects handled the box to both high and low
surfaces using exclusively the bottom and lateral sides (lateral-inferior grip). Studies on
hand positions have shown that subjects use many different hand positions to grab a box
when a handle is not available (Authier et al., 1995; Drury et al., 1982; Padula et al,
2006). The interesting result here is that no other type of hand position was identified
and also only small variations were verified regarding the position of fingers on the
lateral or bottom side of the box. Thus, when the bottom side of the box was free for
contact subjects have preferred to approach box through this side.
The preference for this position seems to be justified by biomechanical
advantages. A series of studies performed by Drury et al. (1982, 1985, 1989b) showed
that when the hands are under the box, the force exerted to handle the load can be lower
comparatively to other hand positions. Keeping the hands under the box allows for
higher muscular strength. In this condition the biceps, which is a strong and biarticular
muscle, is, capable of generating high torques when the elbow is kept within 80 and
100° (Murray et al., 1995). Moreover this hand positioning may facilitate the
development of adduction force due to the neutral position of the forearm regarding
pronation and supination, providing a good coupling between hand and box. Data
presented by Coury et al. (1998) showed that the biceps was highly active during
adduction compression tasks performed on a device which reproduces a box.
Considering the fact that the biceps is active both to support the box and to stabilize
segments during the adduction compression it is important that its action can occur in
biomechanical advantage. The hand position on lateral and bottom sides adopted by the
subjects in this study seems to provide that characteristic. Using both lateral and bottom
114
sides allows for a better coupling as a larger hand surface is in contact with the box
providing a better load distribution.
The hand position adopted by experienced and inexperienced subjects during
the tasks occurred symmetrically. According to Deeb et al. (1985), symmetrical hand
position minimizes hand forces. The choice of positioning hands symmetrically on
lateral and bottom sides seems to have been efficient for the subjects in the present
study, since they did not change it during the tasks.
Extension and ulnar deviation were predominant during the activities analyzed
except when handling to low surface for the 50th and 90th percentiles. For these
situations the radial deviation was prevalent. Data on wrist flexion-extension are new
information since most studies in wrist postures during handling have recorded only
wrist deviations. Wrist flexion-extension was not influenced by heights of the surfaces
to which the loads were moved to. For most of the time movements have occurred
within safe range of motion, however, experienced subjects tended to present higher
extension amplitudes than the ones presented by inexperienced subjects, particularly
when moving the load to the high surface. For this condition wrist extension performed
by experienced subjects overreached the 15° proposed as safe ROM (Paschoarelli et al.,
2008).
Wrist deviation movements were influenced by the height of the destination
surface. All subjects tended to hold their wrist exclusively in ulnar deviation when
handling the box to the high surface, when the peak amplitude of ulnar deviation
reached 25°. Despite that, in about 50% of the time the wrist was held within the safe
limit. For the low surface wrist deviations up to 15° were recorded in both directions,
however but the mean amplitude tended to be kept radial position. Since the safe limit
proposed for radial deviation was 10°, risky postures were also recorded. Drury et al.
115
(1989b) reported quite small ulnar deviation angles when workers performed a
symmetric handling. For the condition without handle, subjects had a mean angle of 5°.
Differences between these results and the present study are probably related to
methodological aspects. Those authors collected data at the start and end of each lifting
and lowering tasks and did not study heights as high as we did. Resulted reported in
mean values can also underestimate amplitudes. Instead, percentile analysis shows the
ROM used by subjects during the whole task, as a continuous process. Wrist deviations
amplitudes presented in our results agree with those reported by Chung and Wang
(2001), and Padula et al. (2006). However, time spent out of the safe limits was smaller
in our experiment than in Padula’s, mainly for the flexion-extension movement. That
can probably be explained by differences in hand positioning. Padula at al. (2006)
reported 3 types of grip performed by the subjects to carry out the handling task, while
in the present study, as the box could be handled by any side, the subjects have chosen
the bottom and lateral sides to approach the box.
Although the subjects’ experience did not influence the type of grip performed
by the subjects, it was significantly associated with extension amplitude. Studies on
handler experience reported by Gagnon (2005) identified that experienced workers
develop safer strategies to perform handlings. Besides using different grips they also tilt
the box. This finding may explain, at least in part, the difference in the wrist extension
identified between groups in the present study. To tilt the box when moving it to the
high surface, experienced workers have to keep their wrists in radial deviation and it is
known that this movement is associated with wrist extension (Li et al., 2005).
The grip forces were only associated with the height of the destination surface.
When moving the box to the high surface a better distribution of force among lateral
and bottom sides was observed. However, the total amount of force was also higher for
116
this condition. This fact may be related to an adduction force needed to stabilize and lift
the box. When the box was moved to the low surface, a similar amount of force was
recorded on the bottom. However, lesser force was applied on the lateral sides,
particularly on the left one. Forces were then more concentrated on the bottom and on
the right lateral sides. As all subjects were right-handed and this strategy was probably
adopted to keep a better control of the box by using their right limb and generating more
force on this side.
Several previous studies have described grip forces, but through isometric
measures (Catovic et al., 1991; Kattel et al., 1996; Warwick et al., 1980; Garg and
Badger, 1986). However, the measurement of dynamic strength has been considered as
the best indicator to evaluate the functional performance of the hands (Ando et al, 2000;
Li, 2002) and also to evaluate and improve workplaces (McGorry, 2001). Morse et al.
(2006) studied dynamic grip force and they found differences in the relationship
between grip force and wrist position when comparing their results with isometric tests.
In the industrial context most of improvements given to handlers are
concentrated in offering handles to facilitate the task and decrease the musculoskeletal
load. Many studies in the literature presents the advantages of handling a box using well
designed handles (Chung and Wang, 2001; Wang et al., 2000; Davis et al., 1998; Deeb
et al, 1985; Drury, 1980). On the other hand, when assessing real work conditions it was
seen that subjects do not always use them and tend to perform handling tasks by
grasping the box with asymmetrical hand grip (Drury et al., 1982, Authier et al., 1996).
Results presented here showed that subjects would prefer to grasp the box from the
bottom side as they were free for choosing. The biomechanical results for the lateral-
inferior grip can be considered satisfactory considering both posture and hand grip
recordings. The purpose is to facilitate the positioning of the hand symmetrically on the
117
lateral and bottom sides of the box, by designing new boxes and containers. This would
generate intuitive adoption of lateral-inferior grip, with safe conditions for the
musculoskeletal system. However, when facilitating the adoption of this grip, attention
must be given to high surfaces, because higher ROM, outside the safe limits, was
recorded for this condition. Figure 5 presents three new designs of box as tries to
improve hand grip.
INSERT FIGURE 5 ABOUT HERE
The first box presented by Figure 6A has a fake bottom, allowing the free
access to the inferior side. This design promotes the use of symmetrical lateral-inferior
grip, however due to this free space the cardboard box may become instable and
commercially restricted. Figure 6 also presents two alternatives to facilitate the hand
approaching through the bottom of the box (Figure 6B) and rounded bottom edges
providing for the fingers which can allow the workers to handle the box easily.
These proposed boxes are only tries. Other box or containers design should be
developed, tested, and then applied in real work conditions to verify its effectiveness in
facilitating more biomechanically advantageous grip, and improving performance and
safety. Future studies should also address attention to asymmetrical handlings and more
complex tasks to contribute with information to prevent overload for upper limbs.
In summary, experienced and inexperienced subjects grasped the box in a
symmetrical way, using both lateral and inferior sides. This fact seems to result of the
design of the box which allowed free access to all sides of the box. In general subjects
held an extension posture associated to ulnar deviation (high surface) or radial deviation
(low surface). Wrist flexion-extension movement was the only variable differentiating

118
subjects. The wrist extension was prevalent and higher for experienced subjects. Peak of
extension (for experienced subjects) and both ulnar and radial deviations were higher
than safe limits, particularly when the box was moved to the highest level. On the other
hand, in comparison with data reported by other studies (Chung and Wang, 2001,
Padula et al., 2006), the grip adopted by all subjects in the present study showed better
results when wrist postures and safe ROM are concerned. Thus, more advantageous grip
was achieved here indicating that some free space for the fingers at the bottom side of
the box will facilitate the grips in real work conditions.
119
5. REFERENCES
Ando, S., Ono, Y., Shimaoka, M., Hiruta, S., Hattori, Y., Hori, F., Imaeda, T.,
Takeuchi, Y., 2000. Strength and perceived exertion in isometric and dynamic lifting
with three different hand locations. Journal of Occupational Health. 42, 315-320.
Authier, M., Gagnon, M., Lortie, M., 1995. Handling techniques: the influence of
weight and height for experts and novices. International Journal Occupational Safety
and Ergonomics. 1 (3), 262-75.
Authier, M., Lortie, M., Gagnon, M., 1996. Manual handling techniques: comparing
novices and experts. International Journal of Industrial Ergonomics. 17 (5), 419-29.
Bernard, B.P., 1997. Musculoskeletal Disorders and Workplace Factors. DHHS
(NIOSH) Publication No. 97-141. US Department of Health and Human Services,
Public Health Service, Centers for Disease Control and Prevention, National Institute
for Occupational Safety and Health.
Catovic, E., Catovic, A., Kraljevic, K., Muftic, O., 1991. The influence of arm position
on the pinch grip strength of female dentists in standing and sitting positions. Applied
Ergonomics. 22(3), 163-166.
Chung, H.C., Wang, M.J.J., 2001. The effects of container design and stair climbing on
maximal acceptable lift weight, wrist posture, psychophysical, and physiological
responses in wafer-handling tasks. Applied Ergonomics. 32, 593-598.
120
Coury, B.G., Drury, C.G., 1982. Optimum handle positions in a box-holding task.
Ergonomics. 25(7), 645-662.
Coury, H.J.C.G., Kumar, S., Narayan, Y., 1998. An electromyographic study of upper
limb adduction force with varying shoulder and elbow postures. Journal of
Electromyography and Kinesiology. 8 (3), 157-68.
Davis, K.D., Marras, W.S., Waters, T.R., 1998. Reduction of spinal loading through the
use of handles. Ergonomics. 41(8), 1155-1168.
Deeb, J.M., Drury, C.G., Begbie, K.L., 1985. Handle positions in a holding task as a
function of task height. Ergonomics. 28(5), 747-763.
Drury, C.G., 1980. Handles for manual materials handling. Applied Ergonomics. 11(1),
35-42.
Drury, C.G., Law, C.H., Pawenski, C.S., 1982. A survey of industrial box handling.
Human Factors, 24 (5), 553-65.
Drury, C.G., Begbie, K., Ulate, C., Deeb, J.M., 1985. Experiments on wrist deviation in
manual materials handling. Ergonomics. 28(3), 577-589.
121
Drury, C.G., Deeb, J.M., Hartman, B., Woolley, S., Drury, C.E., Gallagher, S., 1989a.
Symmetric and asymmetric manual material handling, part 1: physiology and
psychophysics. Ergonomics. 32(5), 467-489.
Drury, C.G., Deeb, J.M., Hartman, B., Woolley, S., Drury, C.E., Gallagher, S., 1989b.
Symmetric and asymmetric manual material handling, part 2: biomechanics.
Ergonomics. 32(6), 565-583.
Gagnon, M., 2005. Ergonomic identification and biomechanical evaluation of workers’
strategies and their validation in a training situation: Summary of research. Clinical
Biomechanics, 20 (6), 569-80.
Garg, A., Badger, D., 1986. Maximum acceptable weights and maximum voluntary
isometric strengths for asymmetric lifting. Ergonomics. 29(7), 879-892.
Kattel, B.P., Fredericks, T.K., Fernandez, J.E., Lee, D.C., 1996. The effect of upper-
extremity posture on maximum grip strength. International Journal of Industrial
Ergonomics. 18, 423-429.
Li, Z.M., 2002. The influence of wrist position on individual finger forces during
forceful grip. The Journal of Hand Surgery. 27A(5), 886-896.
Li, Z.M., Kuxhaus, L., Fisk, J.A., Christophel, T.H., 2005. Coupling between wrist
flexion-extension and radial-ulnar deviation. Clinical Biomechanics. 20, 177-183.
122
McGorry, R.W., 2001. A system for the measurement of grip forces and applied
moments during hand tool use. Applied Ergonomics. 32, 271-279.
Morse, J.L., Jung, M.C., Bashford, G.R., Hallbeck, M.S., 2006. Maximal dynamic grip
force and wrist torque: the effects of gender, exertion direction, angular velocity, and
wrist angle. Applied Ergonomics. 37, 737-742.
Murray, W.M., Delp, S.L., Buchanan, T.S., 1995. Variation of muscle moment arms
with elbow and forearm position. Journal of Biomechanics. 28(5), 513-525.
Nielsen, P.K., Andersen, L., Jørgensen, K., 1998. The muscular load on the lower back
and shoulders due to lifting at different lifting heights and frequencies. Applied
Ergonomics. 29 (6), 445-50.
Oliveira, A.B., Gil Coury, H.J.C., 2008. Upper limb muscular and postural behavior
during manual material handling tasks. Submitted.
Padula, R.S., Coury, H.J.C.G., 2004. Device for analyzing grip forces during handling.
In: Premus 2004: Fifth International Scientific Conference on Prevention of Work-
related Musculoskeletal Disorders. Abstract Book II. Zurich, 599-600.
Padula, R.S., Souza, V.C., Gil Coury, HJC., 2006. Types of grip and wrist movements
during load handling activities. Brazilian Journal of Physical Therapy. 10(1), 29-34. (in
Portuguese).
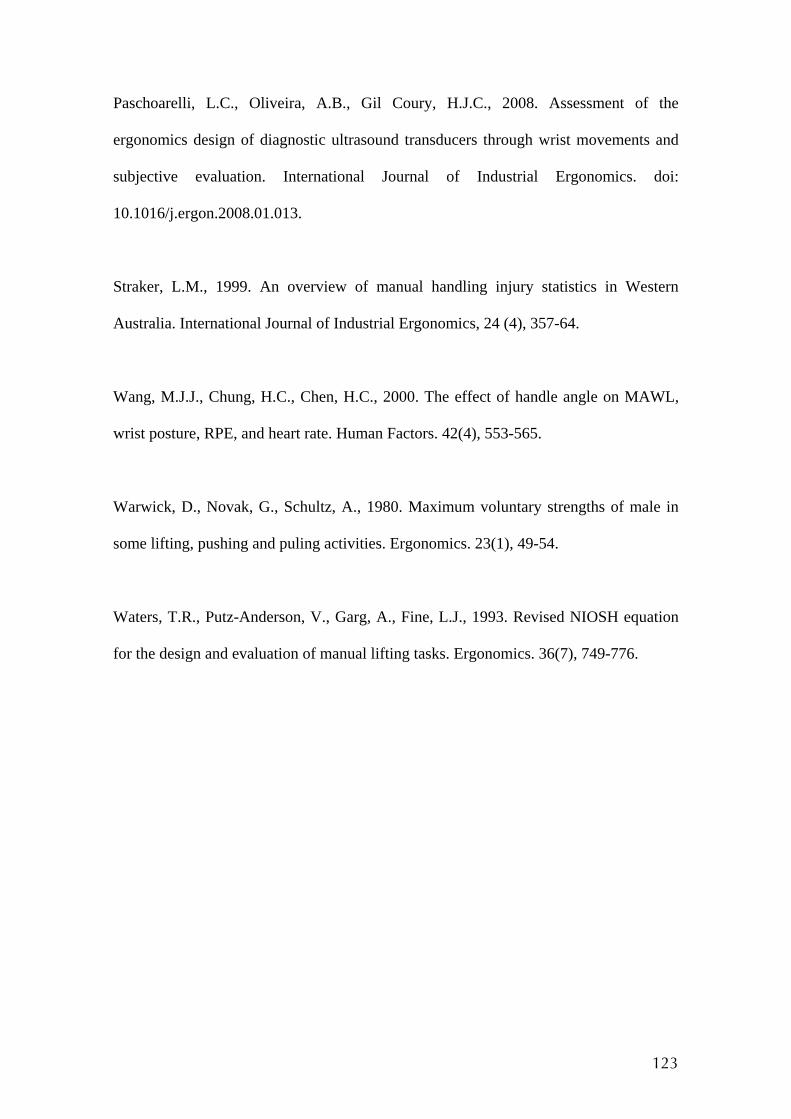
123
Paschoarelli, L.C., Oliveira, A.B., Gil Coury, H.J.C., 2008. Assessment of the
ergonomics design of diagnostic ultrasound transducers through wrist movements and
subjective evaluation. International Journal of Industrial Ergonomics. doi:
10.1016/j.ergon.2008.01.013.
Straker, L.M., 1999. An overview of manual handling injury statistics in Western
Australia. International Journal of Industrial Ergonomics, 24 (4), 357-64.
Wang, M.J.J., Chung, H.C., Chen, H.C., 2000. The effect of handle angle on MAWL,
wrist posture, RPE, and heart rate. Human Factors. 42(4), 553-565.
Warwick, D., Novak, G., Schultz, A., 1980. Maximum voluntary strengths of male in
some lifting, pushing and puling activities. Ergonomics. 23(1), 49-54.
Waters, T.R., Putz-Anderson, V., Garg, A., Fine, L.J., 1993. Revised NIOSH equation
for the design and evaluation of manual lifting tasks. Ergonomics. 36(7), 749-776.
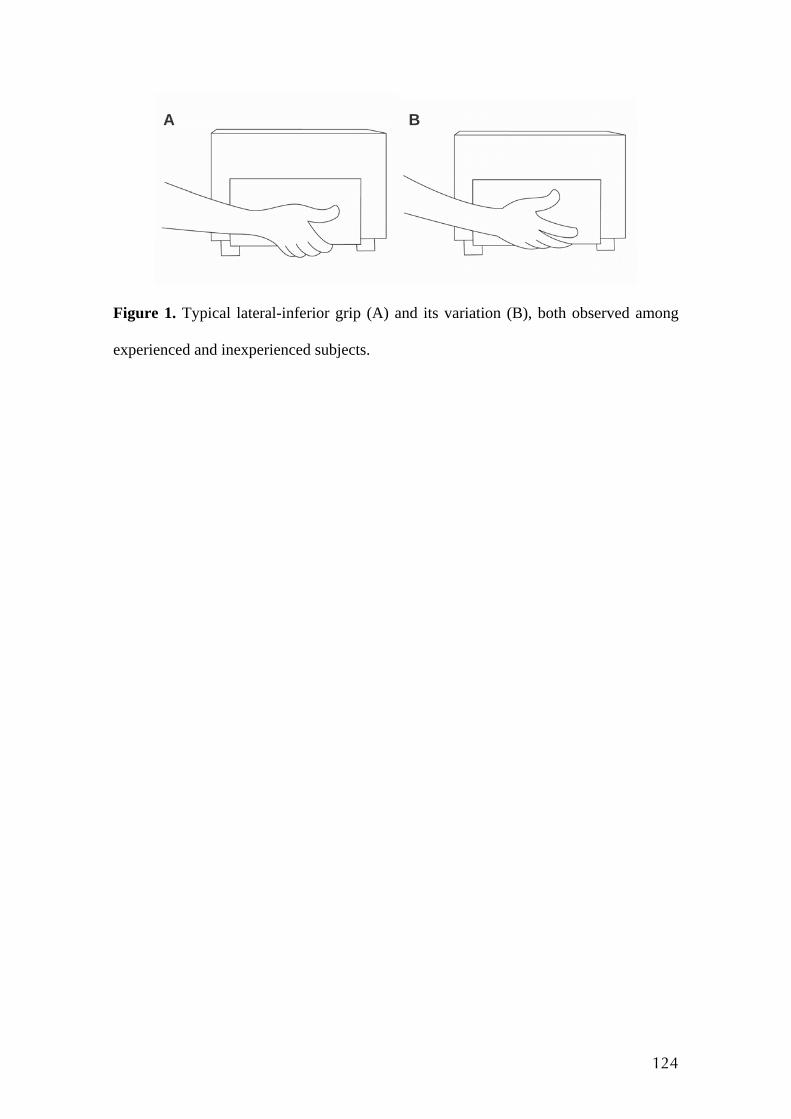
124
Figure 1. Typical lateral-inferior grip (A) and its variation (B), both observed among
experienced and inexperienced subjects.
A B
125
Figure 2. Distribution of right wrist flexion (A) and deviation (B) movements for
experienced and inexperienced subjects when handling an 11 Kg box from middle to
high and low surface. Grey area indicates the safe range of motion according to the
literature.
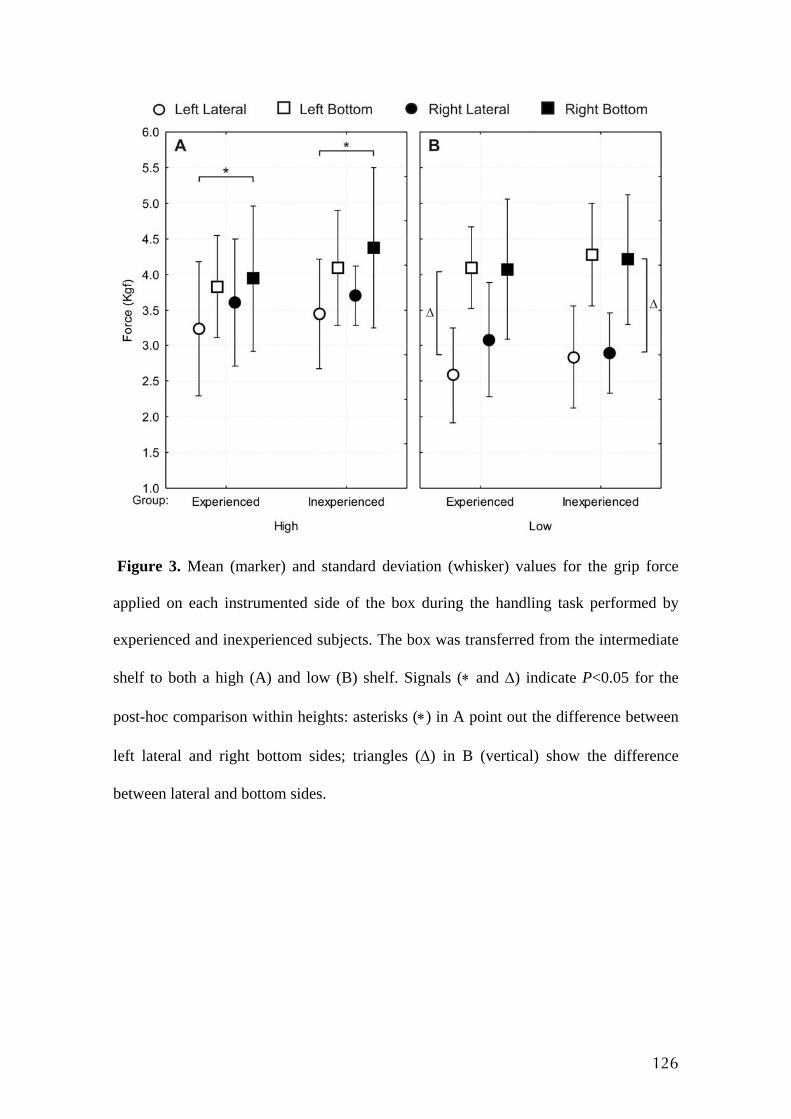
126
Figure 3. Mean (marker) and standard deviation (whisker) values for the grip force
applied on each instrumented side of the box during the handling task performed by
experienced and inexperienced subjects. The box was transferred from the intermediate
shelf to both a high (A) and low (B) shelf. Signals (∗ and Δ) indicate P<0.05 for the
post-hoc comparison within heights: asterisks (∗) in A point out the difference between
left lateral and right bottom sides; triangles (Δ) in B (vertical) show the difference
between lateral and bottom sides.
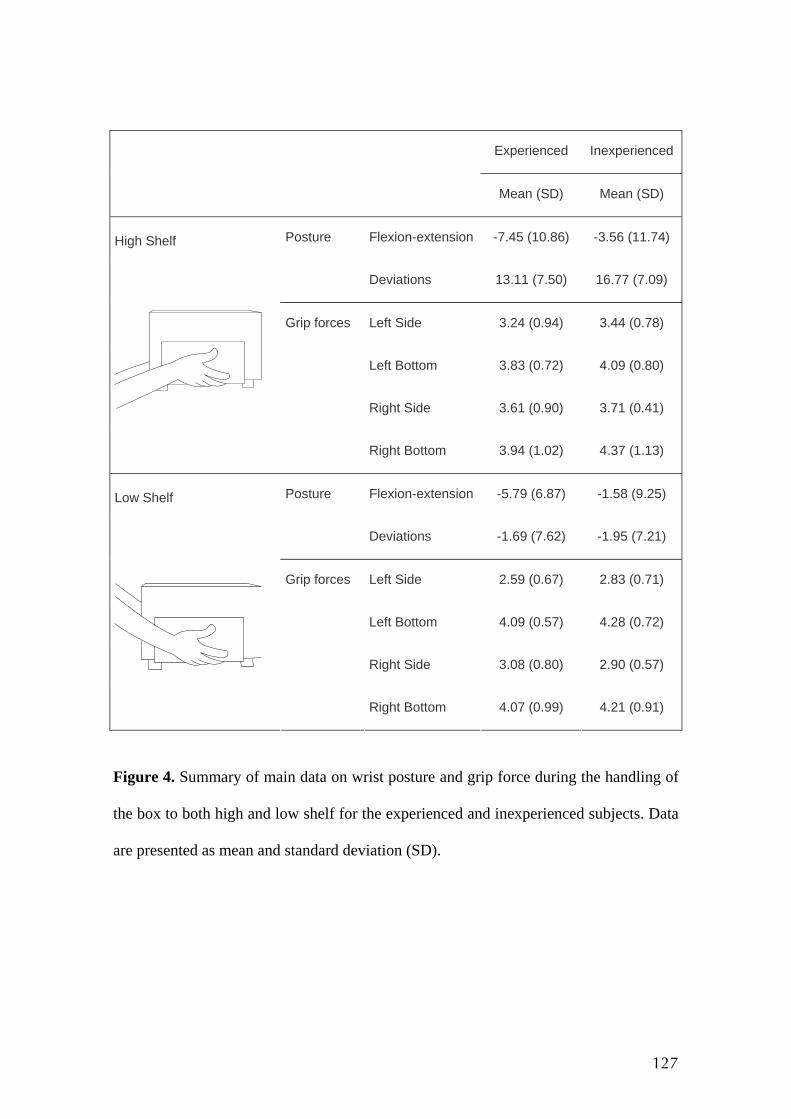
127
Experienced Inexperienced
Mean (SD) Mean (SD)
Posture Flexion-extension -7.45 (10.86) -3.56 (11.74)
Deviations 13.11 (7.50) 16.77 (7.09)
Grip forces Left Side 3.24 (0.94) 3.44 (0.78)
Left Bottom 3.83 (0.72) 4.09 (0.80)
Right Side 3.61 (0.90) 3.71 (0.41)
High Shelf
Right Bottom 3.94 (1.02) 4.37 (1.13)
Posture Flexion-extension -5.79 (6.87) -1.58 (9.25)
Deviations -1.69 (7.62) -1.95 (7.21)
Grip forces Left Side 2.59 (0.67) 2.83 (0.71)
Left Bottom 4.09 (0.57) 4.28 (0.72)
Right Side 3.08 (0.80) 2.90 (0.57)
Low Shelf
Right Bottom 4.07 (0.99) 4.21 (0.91)
Figure 4. Summary of main data on wrist posture and grip force during the handling of
the box to both high and low shelf for the experienced and inexperienced subjects. Data
are presented as mean and standard deviation (SD).
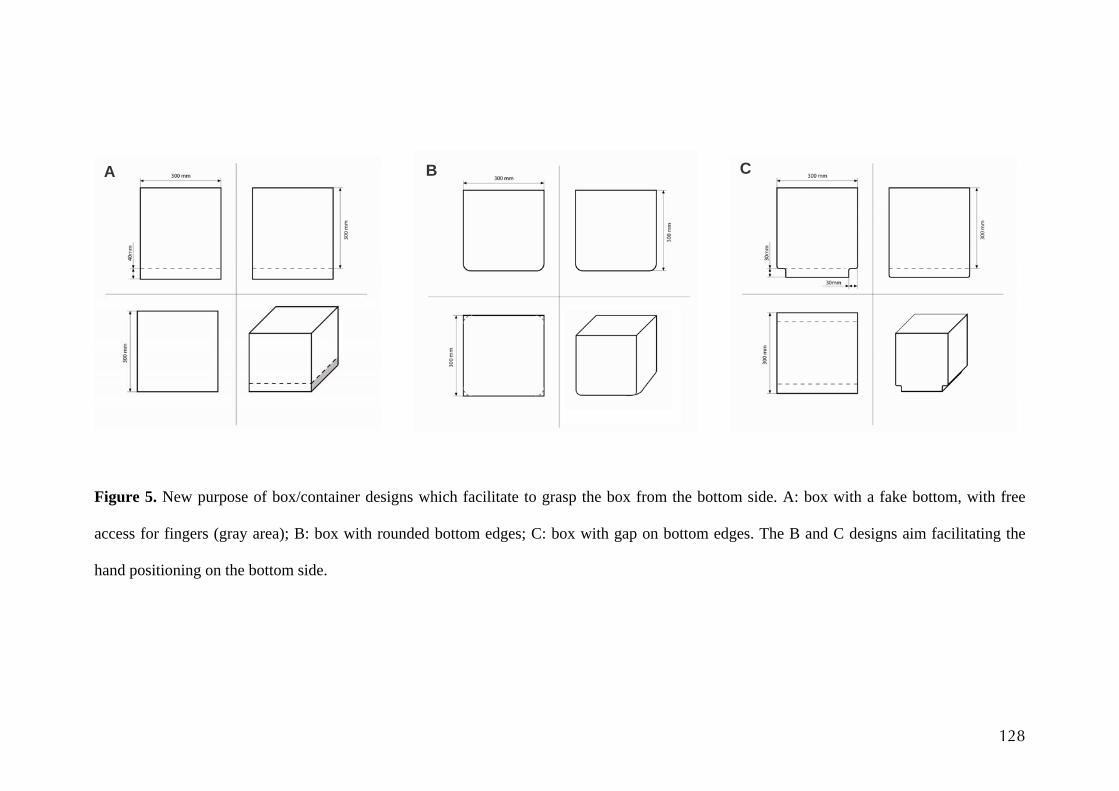
128
Figure 5. New purpose of box/container designs which facilitate to grasp the box from the bottom side. A: box with a fake bottom, with free
access for fingers (gray area); B: box with rounded bottom edges; C: box with gap on bottom edges. The B and C designs aim facilitating the
hand positioning on the bottom side.
A B C
ANEXO III
Ilustração da caixa instrumentada utilizada nos Estudos 1 e 2.
129
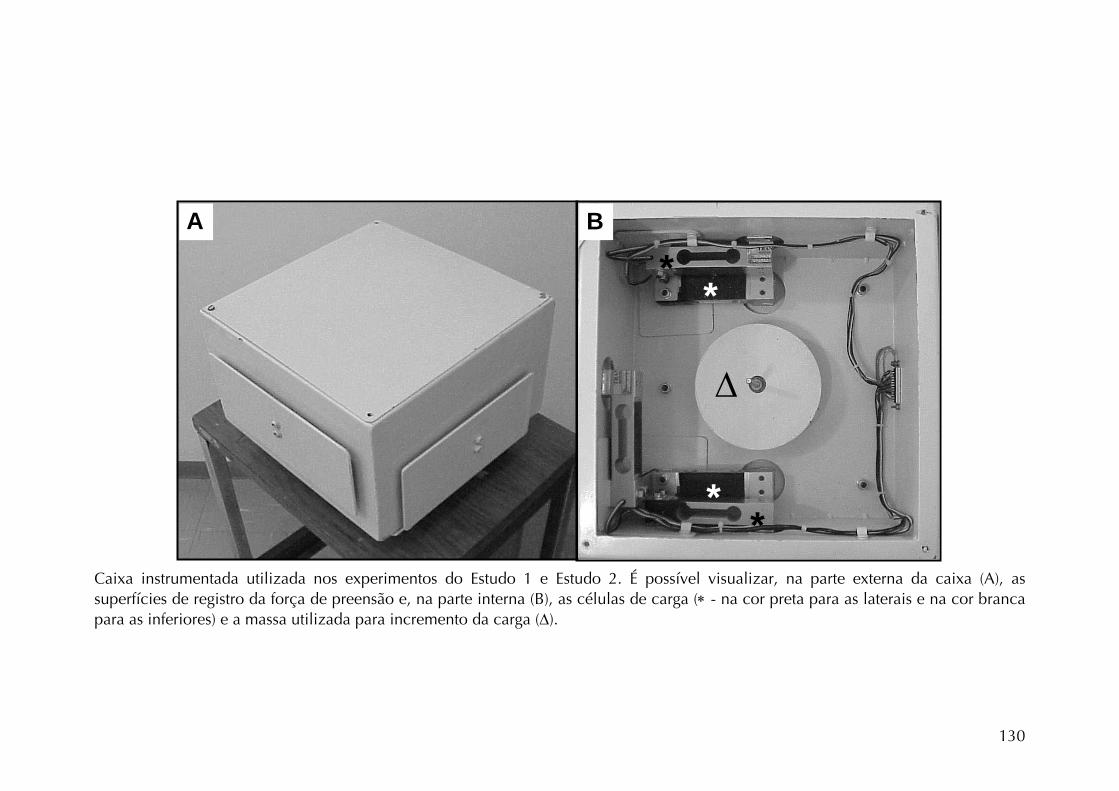
Δ
B
**
**
A Caixa instrumentada utilizada nos experimentos do Estudo 1 e Estudo 2. É possível visualizar, na parte externa da caixa (A), as superfícies de registro da força de preensão e, na parte interna (B), as células de carga (∗ - na cor preta para as laterais e na cor branca para as inferiores) e a massa utilizada para incremento da carga (Δ).
130
ANEXO IV
OLIVEIRA AB, SATO TO, PASCHOARELLI LC, COURY HJCG. Posturas do ombro
durante exame ultra-sonográfico utilizando diferentes transdutores. Artigo
publicado na REVISTA BRASILEIRA DE FISIOTERAPIA, 9(1), 63-69, 2005.
131
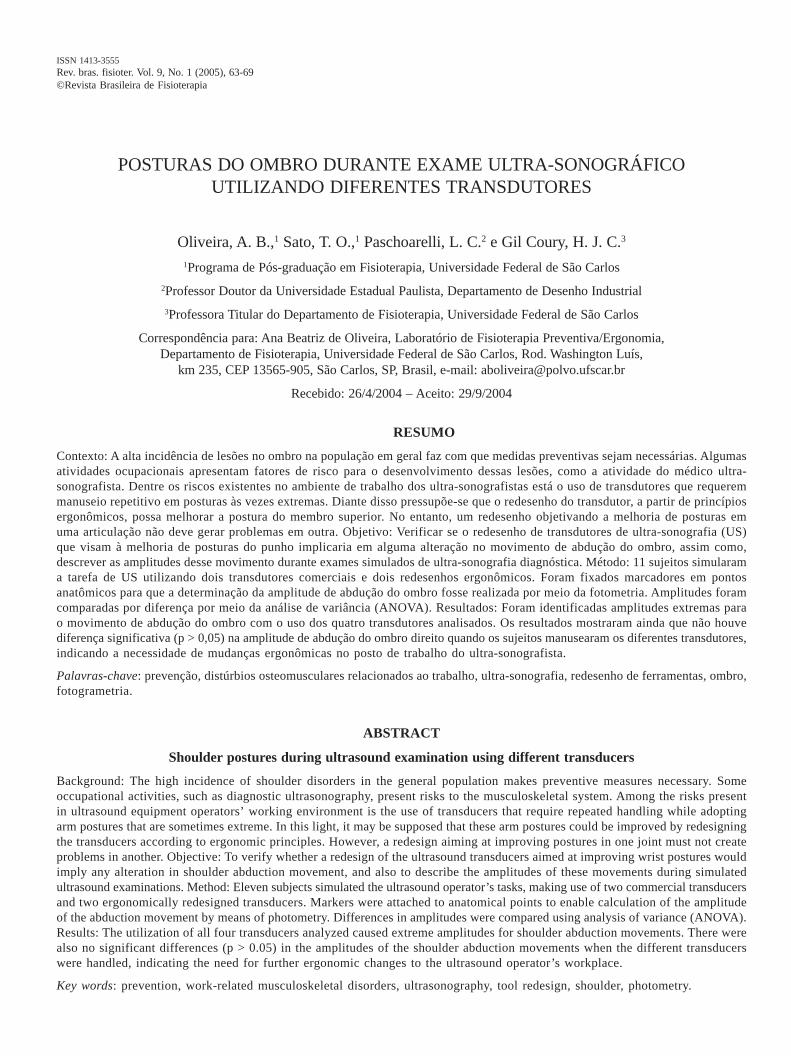
ISSN 1413-3555Rev. bras. fisioter. Vol. 9, No. 1 (2005), 63-69©Revista Brasileira de Fisioterapia
POSTURAS DO OMBRO DURANTE EXAME ULTRA-SONOGRÁFICOUTILIZANDO DIFERENTES TRANSDUTORES
Oliveira, A. B.,1 Sato, T. O.,1 Paschoarelli, L. C.2 e Gil Coury, H. J. C.3
1Programa de Pós-graduação em Fisioterapia, Universidade Federal de São Carlos
2Professor Doutor da Universidade Estadual Paulista, Departamento de Desenho Industrial
3Professora Titular do Departamento de Fisioterapia, Universidade Federal de São Carlos
Correspondência para: Ana Beatriz de Oliveira, Laboratório de Fisioterapia Preventiva/Ergonomia,Departamento de Fisioterapia, Universidade Federal de São Carlos, Rod. Washington Luís,
km 235, CEP 13565-905, São Carlos, SP, Brasil, e-mail: [email protected]
Recebido: 26/4/2004 – Aceito: 29/9/2004
RESUMO
Contexto: A alta incidência de lesões no ombro na população em geral faz com que medidas preventivas sejam necessárias. Algumasatividades ocupacionais apresentam fatores de risco para o desenvolvimento dessas lesões, como a atividade do médico ultra-sonografista. Dentre os riscos existentes no ambiente de trabalho dos ultra-sonografistas está o uso de transdutores que requeremmanuseio repetitivo em posturas às vezes extremas. Diante disso pressupõe-se que o redesenho do transdutor, a partir de princípiosergonômicos, possa melhorar a postura do membro superior. No entanto, um redesenho objetivando a melhoria de posturas emuma articulação não deve gerar problemas em outra. Objetivo: Verificar se o redesenho de transdutores de ultra-sonografia (US)que visam à melhoria de posturas do punho implicaria em alguma alteração no movimento de abdução do ombro, assim como,descrever as amplitudes desse movimento durante exames simulados de ultra-sonografia diagnóstica. Método: 11 sujeitos simularama tarefa de US utilizando dois transdutores comerciais e dois redesenhos ergonômicos. Foram fixados marcadores em pontosanatômicos para que a determinação da amplitude de abdução do ombro fosse realizada por meio da fotometria. Amplitudes foramcomparadas por diferença por meio da análise de variância (ANOVA). Resultados: Foram identificadas amplitudes extremas parao movimento de abdução do ombro com o uso dos quatro transdutores analisados. Os resultados mostraram ainda que não houvediferença significativa (p > 0,05) na amplitude de abdução do ombro direito quando os sujeitos manusearam os diferentes transdutores,indicando a necessidade de mudanças ergonômicas no posto de trabalho do ultra-sonografista.
Palavras-chave: prevenção, distúrbios osteomusculares relacionados ao trabalho, ultra-sonografia, redesenho de ferramentas, ombro,fotogrametria.
ABSTRACT
Shoulder postures during ultrasound examination using different transducers
Background: The high incidence of shoulder disorders in the general population makes preventive measures necessary. Someoccupational activities, such as diagnostic ultrasonography, present risks to the musculoskeletal system. Among the risks presentin ultrasound equipment operators’ working environment is the use of transducers that require repeated handling while adoptingarm postures that are sometimes extreme. In this light, it may be supposed that these arm postures could be improved by redesigningthe transducers according to ergonomic principles. However, a redesign aiming at improving postures in one joint must not createproblems in another. Objective: To verify whether a redesign of the ultrasound transducers aimed at improving wrist postures wouldimply any alteration in shoulder abduction movement, and also to describe the amplitudes of these movements during simulatedultrasound examinations. Method: Eleven subjects simulated the ultrasound operator’s tasks, making use of two commercial transducersand two ergonomically redesigned transducers. Markers were attached to anatomical points to enable calculation of the amplitudeof the abduction movement by means of photometry. Differences in amplitudes were compared using analysis of variance (ANOVA).Results: The utilization of all four transducers analyzed caused extreme amplitudes for shoulder abduction movements. There werealso no significant differences (p > 0.05) in the amplitudes of the shoulder abduction movements when the different transducerswere handled, indicating the need for further ergonomic changes to the ultrasound operator’s workplace.
Key words: prevention, work-related musculoskeletal disorders, ultrasonography, tool redesign, shoulder, photometry.
64 Oliveira, A. B. et al. Rev. bras. fisioter.
INTRODUÇÃO
A dor no ombro está entre as razões mais comuns devisitas médicas. A prevalência de dor no ombro acompanhadade incapacidade é de cerca de 20% na população em geral.1
Algumas atividades ocupacionais, como a do médico ultra-sonografista, apresentam fatores de risco para o desenvol-vimento de lesões musculoesqueléticas no complexo articulardo ombro. A incidência desses sintomas característicos dedistúrbios osteomusculares relacionados ao trabalho (DORTs)é alta nesses profissionais.2,3,4,5 Um dos fatores que pareceinterferir na origem desses sintomas é o alto número de examesde rotina que passou a ser realizado com o desenvolvimentoda ultra-sonografia (US) como técnica diagnóstica. Além disso,os fatores de risco presentes no ambiente de trabalho do ultra-sonografista contribuem para o surgimento dessas lesões. Váriosriscos foram observados, como: baixo índice de iluminação,choques elétricos, estresse e sobrecarga musculoesqueléticanos membros superiores e coluna.6,7,8,9 Sendo assim, torna-se importante estudá-los para que programas efetivos deprevenção possam ser propostos.
O resultado da associação dos fatores de risco ao altonúmero de exames realizados pode ser observado em levan-tamentos epidemiológicos que vêm sendo realizados. Emmédia, 80% dos profissionais que realizam US diagnósticaapresentam algum sintoma musculoesquelético, dos quais amaioria se localiza no membro superior, principalmente nosombros e punhos.2,3,4 Apesar de terem sido estudados emlevantamentos epidemiológicos, esses fatores não forammensurados diretamente na situação funcional.
A sobrecarga imposta ao membro superior pareceenvolver principalmente os movimentos de punho e ombro,em decorrência dos movimentos repetitivos do primeiro e dapostura estática do segundo.3 As sobrecargas estática e dinâmicada musculatura da cintura escapular e da extremidade superiorsão decorrentes da necessidade de manutenção do braço naposição adequada para fixar o transdutor perpendicular à peledo paciente ao longo de todo o exame.5
Wihlidal & Kumar3 chamam a atenção para a manutençãoda postura de abdução do ombro por períodos prolongados,o que, segundo Sj∅gaard & Jensen,10 pode promover fadigae dor muscular. Outro fator crítico dessa postura estárelacionado ao aumento da pressão intramuscular. Amanutenção de 30° de abdução implica aumento da espessurado músculo supra-espinhoso, importante abdutor. Isso porquea atividade muscular leva ao aumento do conteúdo hídrico,aumentando, assim, a pressão intramuscular, principalmentedos músculos situados em áreas delimitadas por estruturasósseas, como é o caso do supra-espinhoso.10
Chaffin11 considera que a abdução de amplitude maiorque 30° promove aumento na fadiga da porção média domúsculo deltóide e reduz sua eficiência fisiológica. Punnettet al.12 mostraram que a amplitude de abdução severa (maiorque 90°), mantida durante menos de 10% do ciclo de
trabalho, resulta em aumento do risco de desenvolvimentode distúrbios no ombro. Caso a manutenção dessa posturaseja efetuada durante uma porcentagem igual ou maior que10%, o risco de lesões aumenta ainda mais.
Paschoarelli13 redesenhou os transdutores para US demama visando à redução de posturas extremas no punho.A utilização do novo transdutor poderia influenciar, melho-rando ou piorando, as posturas da articulação do ombro.Sendo assim, justifica-se a necessidade de quantificar apostura, a partir de medidas das amplitudes de movimento,para avaliar uma intervenção. Algumas técnicas são capazesde medir parâmetros cinemáticos do movimento por meiodo cálculo da posição e do deslocamento ou ângulos docorpo.14 A fotometria é uma técnica que utiliza marcadoressobre a pele como referência para esses ângulos.15
Dessa forma, o objetivo do presente estudo foi descreveramplitudes de movimento durante exames simulados de USdiagnóstica e verificar, por meio de medidas angulares deamplitude obtidas pela fotometria, se o redesenho de trans-dutores de US de mama, que visam à melhoria da posturado punho, implica algum problema postural para a articulaçãogleno-umeral, considerando-se para tal a postura de abduçãodo ombro direito.
MATERIAIS E MÉTODOS
SujeitosParticiparam do experimento 11 indivíduos, sendo 5
do gênero feminino e 6 do gênero masculino, com idademédia de 24,09 anos (±1,97), peso médio de 65,79 kg (±8,78)e estatura média de 170,09 cm (±7,76). Todos os sujeitoseram destros e assinaram um termo de consentimento livree esclarecido. Este estudo foi aprovado pelo Comitê de Éticaem Pesquisa da Universidade Federal de São Carlos.
Equipamentos e MateriaisOs equipamentos utilizados foram: uma reprodução do
equipamento utilizado nos exames de US (mock-up), maca,manequim especial para exame de mama (S230.4, GaumardScientific – USA), TV, videocassete, câmera fotográfica digitalMavica MVC-FD91, um tripé VT-558 e quatro transdutores(Figura 1) para US de mama, sendo dois comerciais (Toshibae Hitachi) e dois protótipos desenvolvidos especialmente paraavaliação ergonômica da atividade. Informações detalhadassobre o redesenho dos transdutores podem ser encontradasem Paschoarelli.13
Os materiais utilizados foram: gel ultra-sonográfico,marcadores adesivos circulares e outros materiais de apoio.Para a análise dos dados utilizou-se um computador PentiumIII e os softwares AutoCad 2000 e Statistica 1984-2000.
ProcedimentosPara a coleta dos dados, uma US de mama foi simulada.
Primeiramente foram obtidos os dados de peso e estatura
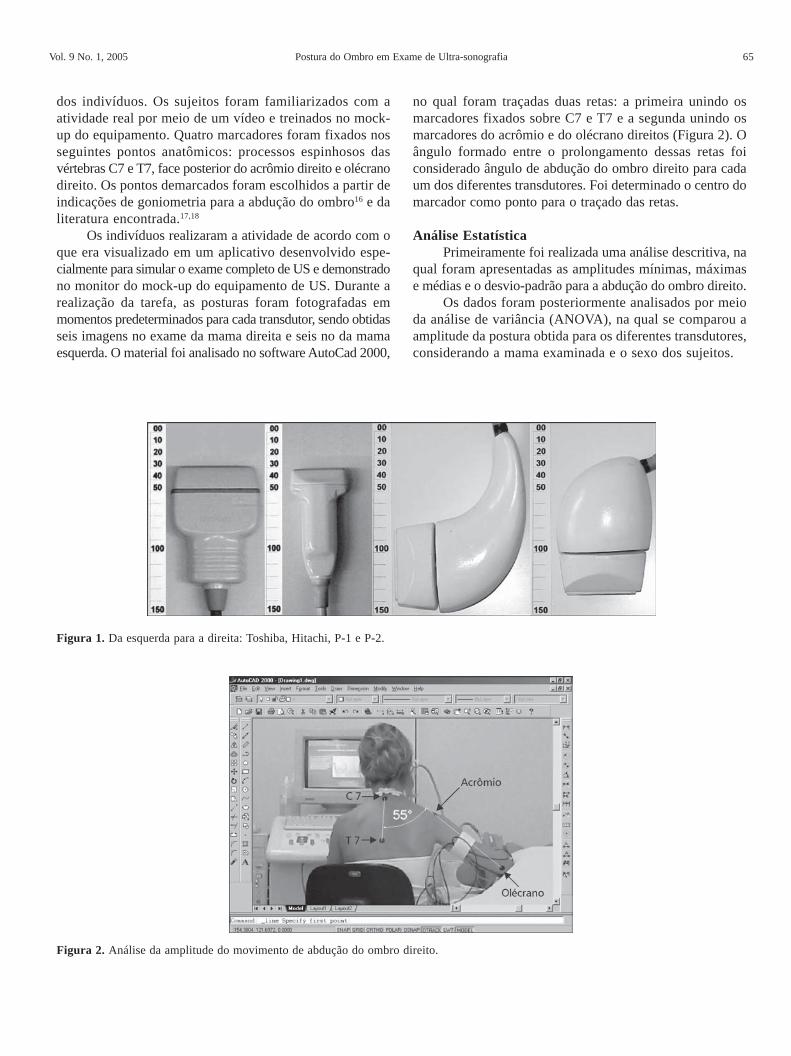
Vol. 9 No. 1, 2005 Postura do Ombro em Exame de Ultra-sonografia 65
dos indivíduos. Os sujeitos foram familiarizados com aatividade real por meio de um vídeo e treinados no mock-up do equipamento. Quatro marcadores foram fixados nosseguintes pontos anatômicos: processos espinhosos dasvértebras C7 e T7, face posterior do acrômio direito e olécranodireito. Os pontos demarcados foram escolhidos a partir deindicações de goniometria para a abdução do ombro16 e daliteratura encontrada.17,18
Os indivíduos realizaram a atividade de acordo com oque era visualizado em um aplicativo desenvolvido espe-cialmente para simular o exame completo de US e demonstradono monitor do mock-up do equipamento de US. Durante arealização da tarefa, as posturas foram fotografadas emmomentos predeterminados para cada transdutor, sendo obtidasseis imagens no exame da mama direita e seis no da mamaesquerda. O material foi analisado no software AutoCad 2000,
no qual foram traçadas duas retas: a primeira unindo osmarcadores fixados sobre C7 e T7 e a segunda unindo osmarcadores do acrômio e do olécrano direitos (Figura 2). Oângulo formado entre o prolongamento dessas retas foiconsiderado ângulo de abdução do ombro direito para cadaum dos diferentes transdutores. Foi determinado o centro domarcador como ponto para o traçado das retas.
Análise EstatísticaPrimeiramente foi realizada uma análise descritiva, na
qual foram apresentadas as amplitudes mínimas, máximase médias e o desvio-padrão para a abdução do ombro direito.
Os dados foram posteriormente analisados por meioda análise de variância (ANOVA), na qual se comparou aamplitude da postura obtida para os diferentes transdutores,considerando a mama examinada e o sexo dos sujeitos.
Figura 2. Análise da amplitude do movimento de abdução do ombro direito.
Figura 1. Da esquerda para a direita: Toshiba, Hitachi, P-1 e P-2.
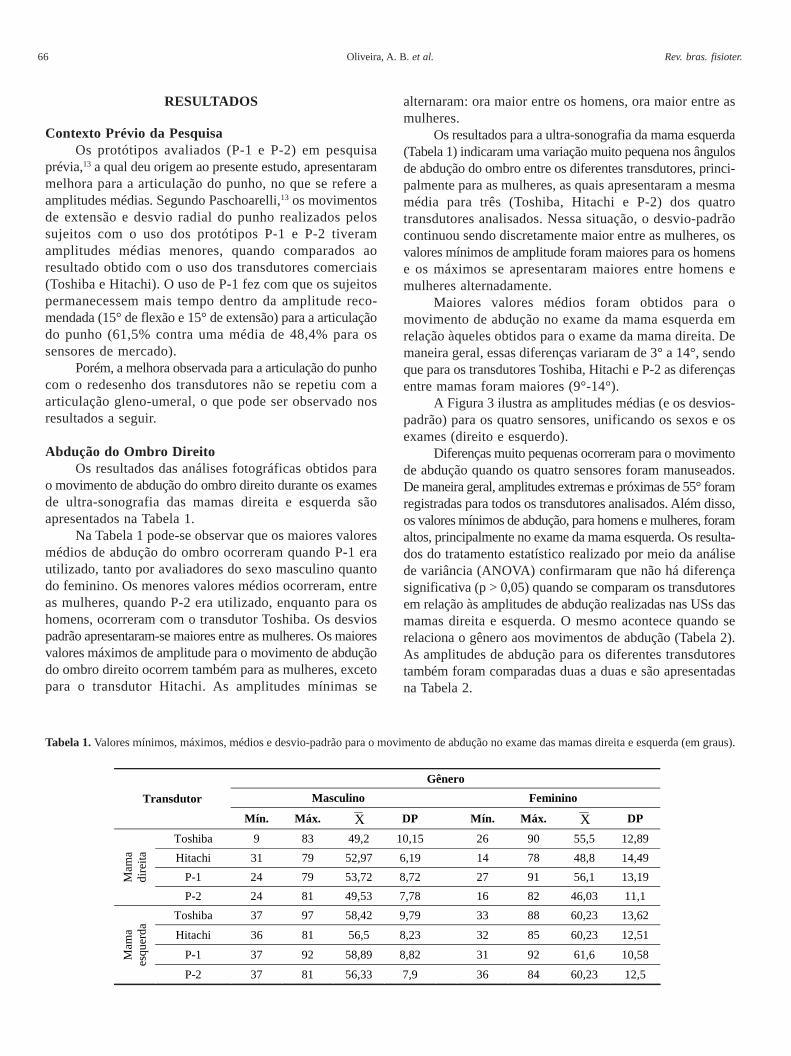
66 Oliveira, A. B. et al. Rev. bras. fisioter.
RESULTADOS
Contexto Prévio da PesquisaOs protótipos avaliados (P-1 e P-2) em pesquisa
prévia,13 a qual deu origem ao presente estudo, apresentarammelhora para a articulação do punho, no que se refere aamplitudes médias. Segundo Paschoarelli,13 os movimentosde extensão e desvio radial do punho realizados pelossujeitos com o uso dos protótipos P-1 e P-2 tiveramamplitudes médias menores, quando comparados aoresultado obtido com o uso dos transdutores comerciais(Toshiba e Hitachi). O uso de P-1 fez com que os sujeitospermanecessem mais tempo dentro da amplitude reco-mendada (15° de flexão e 15° de extensão) para a articulaçãodo punho (61,5% contra uma média de 48,4% para ossensores de mercado).
Porém, a melhora observada para a articulação do punhocom o redesenho dos transdutores não se repetiu com aarticulação gleno-umeral, o que pode ser observado nosresultados a seguir.
Abdução do Ombro DireitoOs resultados das análises fotográficas obtidos para
o movimento de abdução do ombro direito durante os examesde ultra-sonografia das mamas direita e esquerda sãoapresentados na Tabela 1.
Na Tabela 1 pode-se observar que os maiores valoresmédios de abdução do ombro ocorreram quando P-1 erautilizado, tanto por avaliadores do sexo masculino quantodo feminino. Os menores valores médios ocorreram, entreas mulheres, quando P-2 era utilizado, enquanto para oshomens, ocorreram com o transdutor Toshiba. Os desviospadrão apresentaram-se maiores entre as mulheres. Os maioresvalores máximos de amplitude para o movimento de abduçãodo ombro direito ocorrem também para as mulheres, excetopara o transdutor Hitachi. As amplitudes mínimas se
alternaram: ora maior entre os homens, ora maior entre asmulheres.
Os resultados para a ultra-sonografia da mama esquerda(Tabela 1) indicaram uma variação muito pequena nos ângulosde abdução do ombro entre os diferentes transdutores, princi-palmente para as mulheres, as quais apresentaram a mesmamédia para três (Toshiba, Hitachi e P-2) dos quatrotransdutores analisados. Nessa situação, o desvio-padrãocontinuou sendo discretamente maior entre as mulheres, osvalores mínimos de amplitude foram maiores para os homense os máximos se apresentaram maiores entre homens emulheres alternadamente.
Maiores valores médios foram obtidos para omovimento de abdução no exame da mama esquerda emrelação àqueles obtidos para o exame da mama direita. Demaneira geral, essas diferenças variaram de 3° a 14°, sendoque para os transdutores Toshiba, Hitachi e P-2 as diferençasentre mamas foram maiores (9°-14°).
A Figura 3 ilustra as amplitudes médias (e os desvios-padrão) para os quatro sensores, unificando os sexos e osexames (direito e esquerdo).
Diferenças muito pequenas ocorreram para o movimentode abdução quando os quatro sensores foram manuseados.De maneira geral, amplitudes extremas e próximas de 55° foramregistradas para todos os transdutores analisados. Além disso,os valores mínimos de abdução, para homens e mulheres, foramaltos, principalmente no exame da mama esquerda. Os resulta-dos do tratamento estatístico realizado por meio da análisede variância (ANOVA) confirmaram que não há diferençasignificativa (p > 0,05) quando se comparam os transdutoresem relação às amplitudes de abdução realizadas nas USs dasmamas direita e esquerda. O mesmo acontece quando serelaciona o gênero aos movimentos de abdução (Tabela 2).As amplitudes de abdução para os diferentes transdutorestambém foram comparadas duas a duas e são apresentadasna Tabela 2.
Tabela 1. Valores mínimos, máximos, médios e desvio-padrão para o movimento de abdução no exame das mamas direita e esquerda (em graus).
Gênero
Masculino Feminino Transdutor
Mín. Máx. X DP Mín. Máx. X DP
Toshiba 9 83 49,2 10,15 26 90 55,5 12,89
Hitachi 31 79 52,97 6,19 14 78 48,8 14,49
P-1 24 79 53,72 8,72 27 91 56,1 13,19 Mam
a di
reita
P-2 24 81 49,53 7,78 16 82 46,03 11,1
Toshiba 37 97 58,42 9,79 33 88 60,23 13,62
Hitachi 36 81 56,5 8,23 32 85 60,23 12,51
P-1 37 92 58,89 8,82 31 92 61,6 10,58 Mam
a es
quer
da
P-2 37 81 56,33 7,9 36 84 60,23 12,5
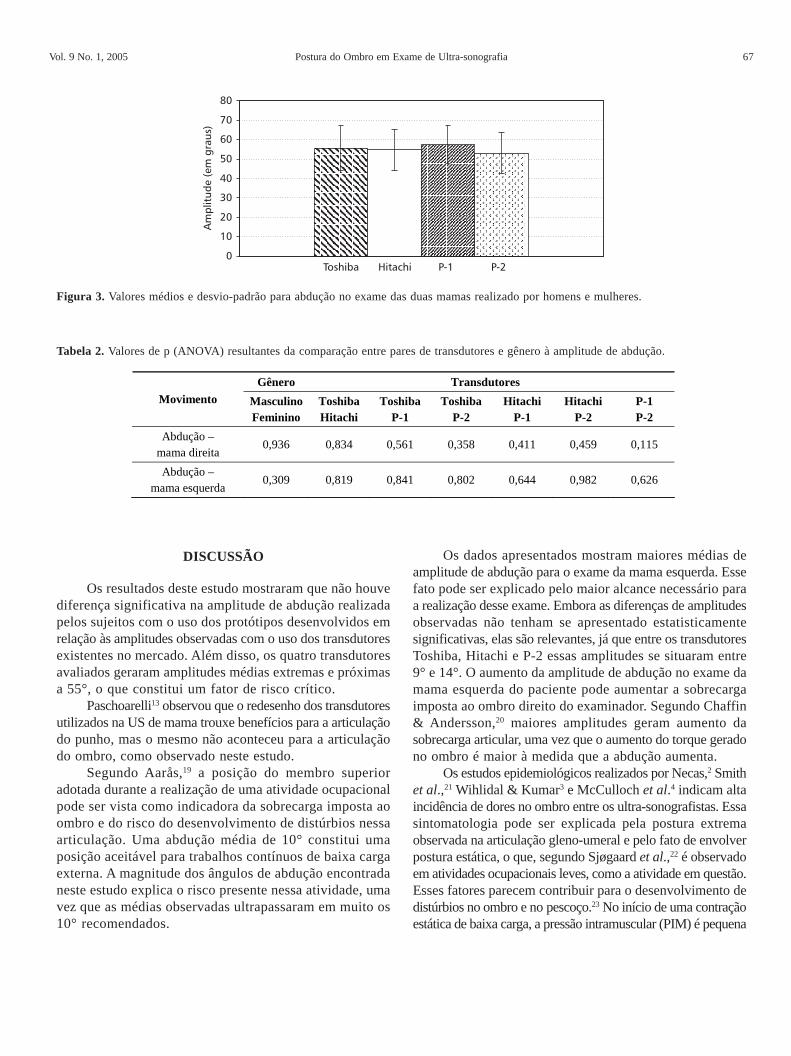
Vol. 9 No. 1, 2005 Postura do Ombro em Exame de Ultra-sonografia 67
DISCUSSÃO
Os resultados deste estudo mostraram que não houvediferença significativa na amplitude de abdução realizadapelos sujeitos com o uso dos protótipos desenvolvidos emrelação às amplitudes observadas com o uso dos transdutoresexistentes no mercado. Além disso, os quatro transdutoresavaliados geraram amplitudes médias extremas e próximasa 55°, o que constitui um fator de risco crítico.
Paschoarelli13 observou que o redesenho dos transdutoresutilizados na US de mama trouxe benefícios para a articulaçãodo punho, mas o mesmo não aconteceu para a articulaçãodo ombro, como observado neste estudo.
Segundo Aarås,19 a posição do membro superioradotada durante a realização de uma atividade ocupacionalpode ser vista como indicadora da sobrecarga imposta aoombro e do risco do desenvolvimento de distúrbios nessaarticulação. Uma abdução média de 10° constitui umaposição aceitável para trabalhos contínuos de baixa cargaexterna. A magnitude dos ângulos de abdução encontradaneste estudo explica o risco presente nessa atividade, umavez que as médias observadas ultrapassaram em muito os10° recomendados.
Os dados apresentados mostram maiores médias deamplitude de abdução para o exame da mama esquerda. Essefato pode ser explicado pelo maior alcance necessário paraa realização desse exame. Embora as diferenças de amplitudesobservadas não tenham se apresentado estatisticamentesignificativas, elas são relevantes, já que entre os transdutoresToshiba, Hitachi e P-2 essas amplitudes se situaram entre9° e 14°. O aumento da amplitude de abdução no exame damama esquerda do paciente pode aumentar a sobrecargaimposta ao ombro direito do examinador. Segundo Chaffin& Andersson,20 maiores amplitudes geram aumento dasobrecarga articular, uma vez que o aumento do torque geradono ombro é maior à medida que a abdução aumenta.
Os estudos epidemiológicos realizados por Necas,2 Smithet al.,21 Wihlidal & Kumar3 e McCulloch et al.4 indicam altaincidência de dores no ombro entre os ultra-sonografistas. Essasintomatologia pode ser explicada pela postura extremaobservada na articulação gleno-umeral e pelo fato de envolverpostura estática, o que, segundo Sjøgaard et al.,22 é observadoem atividades ocupacionais leves, como a atividade em questão.Esses fatores parecem contribuir para o desenvolvimento dedistúrbios no ombro e no pescoço.23 No início de uma contraçãoestática de baixa carga, a pressão intramuscular (PIM) é pequena
Figura 3. Valores médios e desvio-padrão para abdução no exame das duas mamas realizado por homens e mulheres.
Gênero Transdutores Movimento Masculino
Feminino Toshiba Hitachi
Toshiba P-1
Toshiba P-2
Hitachi P-1
Hitachi P-2
P-1 P-2
Abdução – mama direita
0,936 0,834 0,561 0,358 0,411 0,459 0,115
Abdução – mama esquerda
0,309 0,819 0,841 0,802 0,644 0,982 0,626
Tabela 2. Valores de p (ANOVA) resultantes da comparação entre pares de transdutores e gênero à amplitude de abdução.
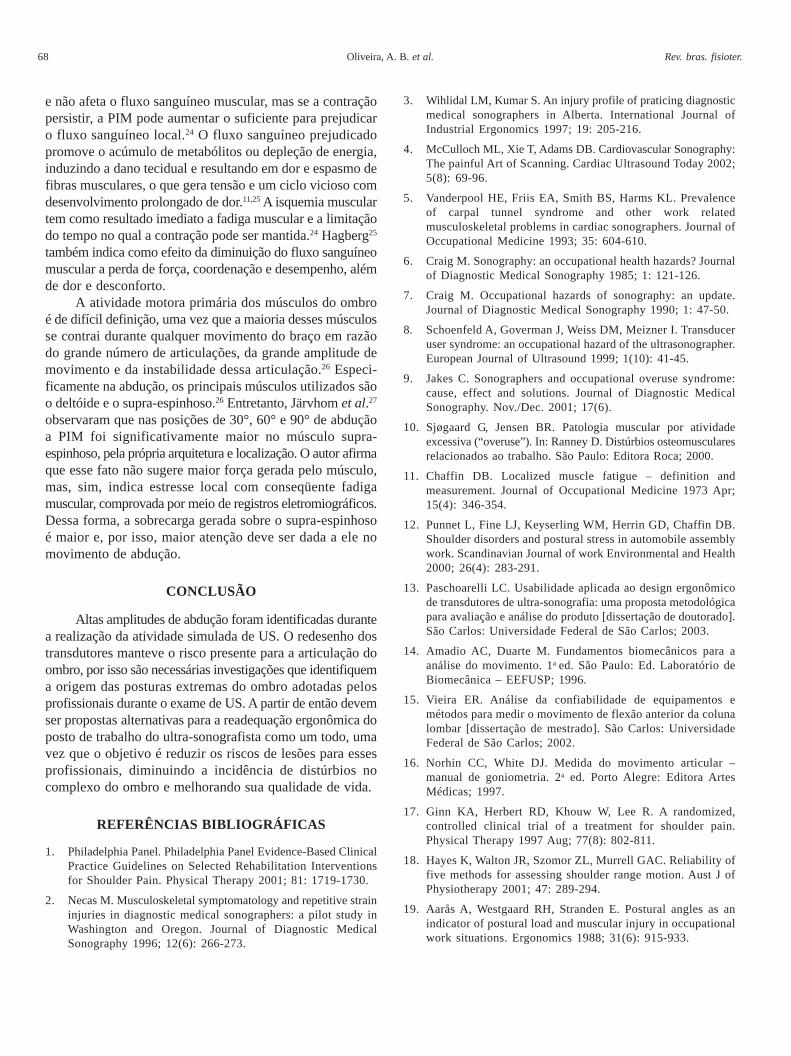
68 Oliveira, A. B. et al. Rev. bras. fisioter.
e não afeta o fluxo sanguíneo muscular, mas se a contraçãopersistir, a PIM pode aumentar o suficiente para prejudicaro fluxo sanguíneo local.24 O fluxo sanguíneo prejudicadopromove o acúmulo de metabólitos ou depleção de energia,induzindo a dano tecidual e resultando em dor e espasmo defibras musculares, o que gera tensão e um ciclo vicioso comdesenvolvimento prolongado de dor.11,25 A isquemia musculartem como resultado imediato a fadiga muscular e a limitaçãodo tempo no qual a contração pode ser mantida.24 Hagberg25
também indica como efeito da diminuição do fluxo sanguíneomuscular a perda de força, coordenação e desempenho, alémde dor e desconforto.
A atividade motora primária dos músculos do ombroé de difícil definição, uma vez que a maioria desses músculosse contrai durante qualquer movimento do braço em razãodo grande número de articulações, da grande amplitude demovimento e da instabilidade dessa articulação.26 Especi-ficamente na abdução, os principais músculos utilizados sãoo deltóide e o supra-espinhoso.26 Entretanto, Järvhom et al.27
observaram que nas posições de 30°, 60° e 90° de abduçãoa PIM foi significativamente maior no músculo supra-espinhoso, pela própria arquitetura e localização. O autor afirmaque esse fato não sugere maior força gerada pelo músculo,mas, sim, indica estresse local com conseqüente fadigamuscular, comprovada por meio de registros eletromiográficos.Dessa forma, a sobrecarga gerada sobre o supra-espinhosoé maior e, por isso, maior atenção deve ser dada a ele nomovimento de abdução.
CONCLUSÃO
Altas amplitudes de abdução foram identificadas durantea realização da atividade simulada de US. O redesenho dostransdutores manteve o risco presente para a articulação doombro, por isso são necessárias investigações que identifiquema origem das posturas extremas do ombro adotadas pelosprofissionais durante o exame de US. A partir de então devemser propostas alternativas para a readequação ergonômica doposto de trabalho do ultra-sonografista como um todo, umavez que o objetivo é reduzir os riscos de lesões para essesprofissionais, diminuindo a incidência de distúrbios nocomplexo do ombro e melhorando sua qualidade de vida.
REFERÊNCIAS BIBLIOGRÁFICAS
1. Philadelphia Panel. Philadelphia Panel Evidence-Based ClinicalPractice Guidelines on Selected Rehabilitation Interventionsfor Shoulder Pain. Physical Therapy 2001; 81: 1719-1730.
2. Necas M. Musculoskeletal symptomatology and repetitive straininjuries in diagnostic medical sonographers: a pilot study inWashington and Oregon. Journal of Diagnostic MedicalSonography 1996; 12(6): 266-273.
3. Wihlidal LM, Kumar S. An injury profile of praticing diagnosticmedical sonographers in Alberta. International Journal ofIndustrial Ergonomics 1997; 19: 205-216.
4. McCulloch ML, Xie T, Adams DB. Cardiovascular Sonography:The painful Art of Scanning. Cardiac Ultrasound Today 2002;5(8): 69-96.
5. Vanderpool HE, Friis EA, Smith BS, Harms KL. Prevalenceof carpal tunnel syndrome and other work relatedmusculoskeletal problems in cardiac sonographers. Journal ofOccupational Medicine 1993; 35: 604-610.
6. Craig M. Sonography: an occupational health hazards? Journalof Diagnostic Medical Sonography 1985; 1: 121-126.
7. Craig M. Occupational hazards of sonography: an update.Journal of Diagnostic Medical Sonography 1990; 1: 47-50.
8. Schoenfeld A, Goverman J, Weiss DM, Meizner I. Transduceruser syndrome: an occupational hazard of the ultrasonographer.European Journal of Ultrasound 1999; 1(10): 41-45.
9. Jakes C. Sonographers and occupational overuse syndrome:cause, effect and solutions. Journal of Diagnostic MedicalSonography. Nov./Dec. 2001; 17(6).
10. Sjøgaard G, Jensen BR. Patologia muscular por atividadeexcessiva (“overuse”). In: Ranney D. Distúrbios osteomuscularesrelacionados ao trabalho. São Paulo: Editora Roca; 2000.
11. Chaffin DB. Localized muscle fatigue – definition andmeasurement. Journal of Occupational Medicine 1973 Apr;15(4): 346-354.
12. Punnet L, Fine LJ, Keyserling WM, Herrin GD, Chaffin DB.Shoulder disorders and postural stress in automobile assemblywork. Scandinavian Journal of work Environmental and Health2000; 26(4): 283-291.
13. Paschoarelli LC. Usabilidade aplicada ao design ergonômicode transdutores de ultra-sonografia: uma proposta metodológicapara avaliação e análise do produto [dissertação de doutorado].São Carlos: Universidade Federal de São Carlos; 2003.
14. Amadio AC, Duarte M. Fundamentos biomecânicos para aanálise do movimento. 1a ed. São Paulo: Ed. Laboratório deBiomecânica – EEFUSP; 1996.
15. Vieira ER. Análise da confiabilidade de equipamentos emétodos para medir o movimento de flexão anterior da colunalombar [dissertação de mestrado]. São Carlos: UniversidadeFederal de São Carlos; 2002.
16. Norhin CC, White DJ. Medida do movimento articular –manual de goniometria. 2a ed. Porto Alegre: Editora ArtesMédicas; 1997.
17. Ginn KA, Herbert RD, Khouw W, Lee R. A randomized,controlled clinical trial of a treatment for shoulder pain.Physical Therapy 1997 Aug; 77(8): 802-811.
18. Hayes K, Walton JR, Szomor ZL, Murrell GAC. Reliability offive methods for assessing shoulder range motion. Aust J ofPhysiotherapy 2001; 47: 289-294.
19. Aarås A, Westgaard RH, Stranden E. Postural angles as anindicator of postural load and muscular injury in occupationalwork situations. Ergonomics 1988; 31(6): 915-933.

Vol. 9 No. 1, 2005 Postura do Ombro em Exame de Ultra-sonografia 69
20. Chaffin DB, Andersson GBJ. Occupational Biomechanics. 2nd
ed. Editora Wiley Interscience; 1991.
21. Smith AC, Wolf JG, Xie G, Smith MD. Musculoskeletal painin cardiac ultrasonographers: results of a random survey. Journalof the American Society of Echocardiography 1997a; 10(4):357-362.
22. Sjøgaard G, Savard G, Juei C. Muscle blood flow duringisometric activity and its relation to muscle fatigue. EuropeanJournal of Applied Physiology 1988; 57: 327-335.
23. Hagberg M. Work load and fatigue in repetitive arm elevations.Ergonomics 1981; 24(7): 543-555.
24. Sjøgaard G, Kiens B, Jørgensen K, Saltin B. Intramuscularpressure, EMG and blood flow during low-level prolonged staticcontraction in man. Acta Physiol Scand 1986; 128: 475-484.
25. Hagberg M. Local shoulder muscular strain – symptoms anddisorders. J Human Ergol 1982; 11: 99-108.
26. Smith LK, Weiss EL, Lehmkuhl LD. Cinesiologia clínica deBrunnstrom. 5a ed. São Paulo: Editora Manole; 1997b.
27. Järvholm U, Palmerud G, Styf J, Herberts P, Kadefors R.Intramuscular pressure in the supraspinatus muscle. J OrthopRes 1988; 6(2): 230-238.
ANEXO V
PASCHOARELLI LC, OLIVEIRA AB, COURY HJCG. Assessment of the ergonomic
design of diagnostic ultrasound transducers through wrist movements and
subjective evaluation. Artigo publicado no INTERNATIONAL JOURNAL OF
INDUSTRUAL ERGONOMICS, 2008, doi: 10.1016/j.ergon.2008.01.013.
139
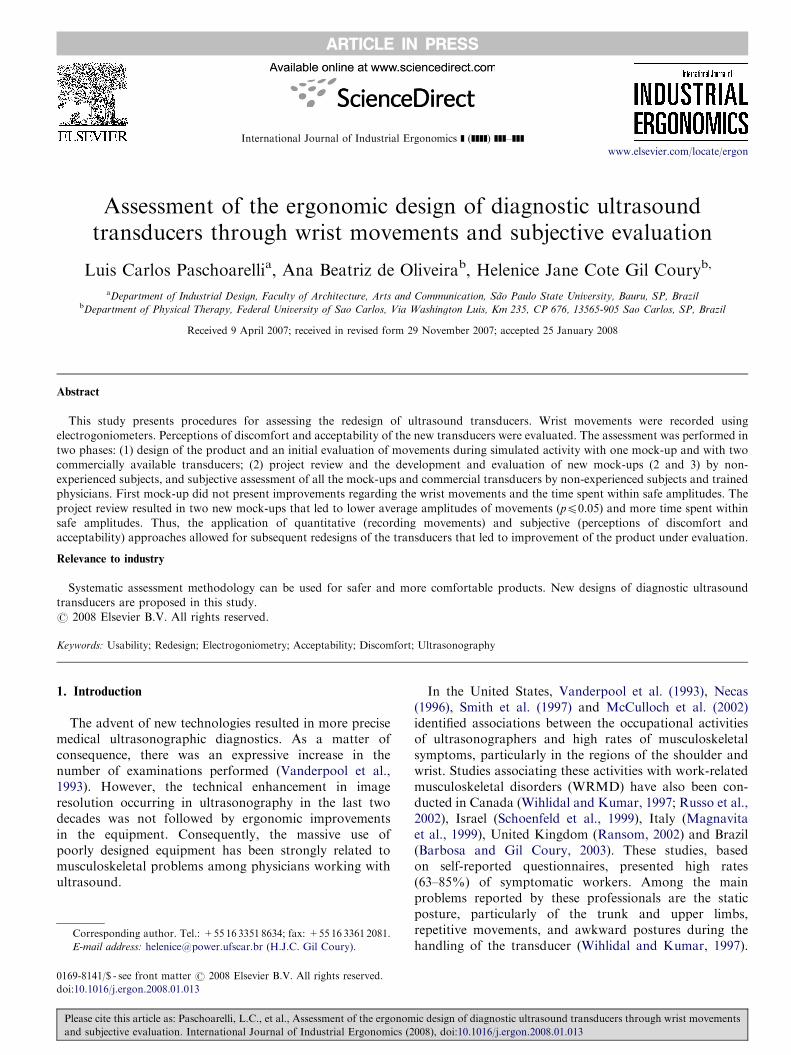
International Journal of Industrial Ergonomics ] (]]]]) ]]]–]]]
Assessment of the ergonomic design of diagnostic ultrasoundtransducers through wrist movements and subjective evaluation
Luis Carlos Paschoarellia, Ana Beatriz de Oliveirab, Helenice Jane Cote Gil Couryb,
aDepartment of Industrial Design, Faculty of Architecture, Arts and Communication, Sao Paulo State University, Bauru, SP, BrazilbDepartment of Physical Therapy, Federal University of Sao Carlos, Via Washington Luis, Km 235, CP 676, 13565-905 Sao Carlos, SP, Brazil
Received 9 April 2007; received in revised form 29 November 2007; accepted 25 January 2008
Abstract
This study presents procedures for assessing the redesign of ultrasound transducers. Wrist movements were recorded using
electrogoniometers. Perceptions of discomfort and acceptability of the new transducers were evaluated. The assessment was performed in
two phases: (1) design of the product and an initial evaluation of movements during simulated activity with one mock-up and with two
commercially available transducers; (2) project review and the development and evaluation of new mock-ups (2 and 3) by non-
experienced subjects, and subjective assessment of all the mock-ups and commercial transducers by non-experienced subjects and trained
physicians. First mock-up did not present improvements regarding the wrist movements and the time spent within safe amplitudes. The
project review resulted in two new mock-ups that led to lower average amplitudes of movements (pp0.05) and more time spent within
safe amplitudes. Thus, the application of quantitative (recording movements) and subjective (perceptions of discomfort and
acceptability) approaches allowed for subsequent redesigns of the transducers that led to improvement of the product under evaluation.
Relevance to industry
Systematic assessment methodology can be used for safer and more comfortable products. New designs of diagnostic ultrasound
transducers are proposed in this study.
r 2008 Elsevier B.V. All rights reserved.
Keywords: Usability; Redesign; Electrogoniometry; Acceptability; Discomfort; Ultrasonography
1. Introduction
The advent of new technologies resulted in more precisemedical ultrasonographic diagnostics. As a matter ofconsequence, there was an expressive increase in thenumber of examinations performed (Vanderpool et al.,1993). However, the technical enhancement in imageresolution occurring in ultrasonography in the last twodecades was not followed by ergonomic improvementsin the equipment. Consequently, the massive use ofpoorly designed equipment has been strongly related tomusculoskeletal problems among physicians working withultrasound.
In the United States, Vanderpool et al. (1993), Necas(1996), Smith et al. (1997) and McCulloch et al. (2002)identified associations between the occupational activitiesof ultrasonographers and high rates of musculoskeletalsymptoms, particularly in the regions of the shoulder andwrist. Studies associating these activities with work-relatedmusculoskeletal disorders (WRMD) have also been con-ducted in Canada (Wihlidal and Kumar, 1997; Russo et al.,2002), Israel (Schoenfeld et al., 1999), Italy (Magnavitaet al., 1999), United Kingdom (Ransom, 2002) and Brazil(Barbosa and Gil Coury, 2003). These studies, basedon self-reported questionnaires, presented high rates(63–85%) of symptomatic workers. Among the mainproblems reported by these professionals are the staticposture, particularly of the trunk and upper limbs,repetitive movements, and awkward postures during thehandling of the transducer (Wihlidal and Kumar, 1997).
ARTICLE IN PRESS
www.elsevier.com/locate/ergon
0169-8141/$ - see front matter r 2008 Elsevier B.V. All rights reserved.
doi:10.1016/j.ergon.2008.01.013
Corresponding author. Tel.: +55 16 3351 8634; fax: +55 16 3361 2081.
E-mail address: [email protected] (H.J.C. Gil Coury).
Please cite this article as: Paschoarelli, L.C., et al., Assessment of the ergonomic design of diagnostic ultrasound transducers through wrist movements
and subjective evaluation. International Journal of Industrial Ergonomics (2008), doi:10.1016/j.ergon.2008.01.013
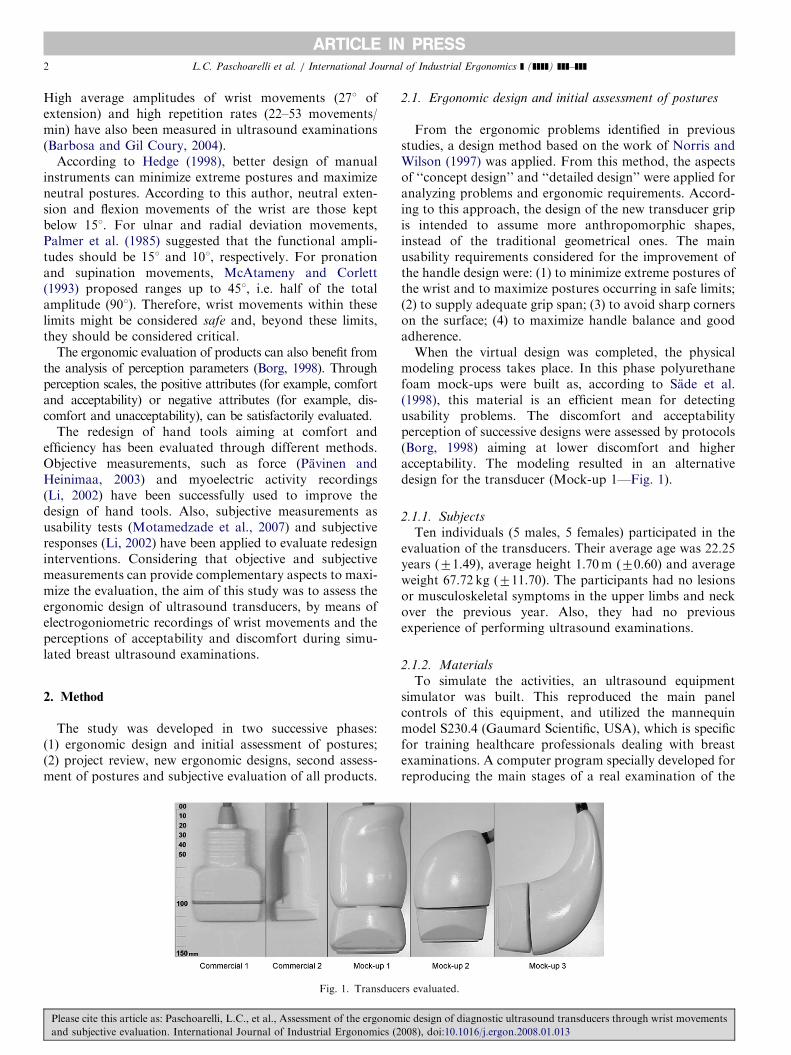
High average amplitudes of wrist movements (271 ofextension) and high repetition rates (22–53 movements/min) have also been measured in ultrasound examinations(Barbosa and Gil Coury, 2004).
According to Hedge (1998), better design of manualinstruments can minimize extreme postures and maximizeneutral postures. According to this author, neutral exten-sion and flexion movements of the wrist are those keptbelow 151. For ulnar and radial deviation movements,Palmer et al. (1985) suggested that the functional ampli-tudes should be 151 and 101, respectively. For pronationand supination movements, McAtameny and Corlett(1993) proposed ranges up to 451, i.e. half of the totalamplitude (901). Therefore, wrist movements within theselimits might be considered safe and, beyond these limits,they should be considered critical.
The ergonomic evaluation of products can also benefit fromthe analysis of perception parameters (Borg, 1998). Throughperception scales, the positive attributes (for example, comfortand acceptability) or negative attributes (for example, dis-comfort and unacceptability), can be satisfactorily evaluated.
The redesign of hand tools aiming at comfort andefficiency has been evaluated through different methods.Objective measurements, such as force (Pavinen andHeinimaa, 2003) and myoelectric activity recordings(Li, 2002) have been successfully used to improve thedesign of hand tools. Also, subjective measurements asusability tests (Motamedzade et al., 2007) and subjectiveresponses (Li, 2002) have been applied to evaluate redesigninterventions. Considering that objective and subjectivemeasurements can provide complementary aspects to maxi-mize the evaluation, the aim of this study was to assess theergonomic design of ultrasound transducers, by means ofelectrogoniometric recordings of wrist movements and theperceptions of acceptability and discomfort during simu-lated breast ultrasound examinations.
2. Method
The study was developed in two successive phases:(1) ergonomic design and initial assessment of postures;(2) project review, new ergonomic designs, second assess-ment of postures and subjective evaluation of all products.
2.1. Ergonomic design and initial assessment of postures
From the ergonomic problems identified in previousstudies, a design method based on the work of Norris andWilson (1997) was applied. From this method, the aspectsof ‘‘concept design’’ and ‘‘detailed design’’ were applied foranalyzing problems and ergonomic requirements. Accord-ing to this approach, the design of the new transducer gripis intended to assume more anthropomorphic shapes,instead of the traditional geometrical ones. The mainusability requirements considered for the improvement ofthe handle design were: (1) to minimize extreme postures ofthe wrist and to maximize postures occurring in safe limits;(2) to supply adequate grip span; (3) to avoid sharp cornerson the surface; (4) to maximize handle balance and goodadherence.When the virtual design was completed, the physical
modeling process takes place. In this phase polyurethanefoam mock-ups were built as, according to Sade et al.(1998), this material is an efficient mean for detectingusability problems. The discomfort and acceptabilityperception of successive designs were assessed by protocols(Borg, 1998) aiming at lower discomfort and higheracceptability. The modeling resulted in an alternativedesign for the transducer (Mock-up 1—Fig. 1).
2.1.1. Subjects
Ten individuals (5 males, 5 females) participated in theevaluation of the transducers. Their average age was 22.25years (71.49), average height 1.70m (70.60) and averageweight 67.72 kg (711.70). The participants had no lesionsor musculoskeletal symptoms in the upper limbs and neckover the previous year. Also, they had no previousexperience of performing ultrasound examinations.
2.1.2. Materials
To simulate the activities, an ultrasound equipmentsimulator was built. This reproduced the main panelcontrols of this equipment, and utilized the mannequinmodel S230.4 (Gaumard Scientific, USA), which is specificfor training healthcare professionals dealing with breastexaminations. A computer program specially developed forreproducing the main stages of a real examination of the
ARTICLE IN PRESS
Fig. 1. Transducers evaluated.
L.C. Paschoarelli et al. / International Journal of Industrial Ergonomics ] (]]]]) ]]]–]]]2
Please cite this article as: Paschoarelli, L.C., et al., Assessment of the ergonomic design of diagnostic ultrasound transducers through wrist movements
and subjective evaluation. International Journal of Industrial Ergonomics (2008), doi:10.1016/j.ergon.2008.01.013

right and left breasts (Fig. 2) was used. Two commercialtransducers that are frequently used for breast ultrasoundexaminations (named here Commercials 1 and 2) wereutilized, and also the first mock-up (Mock-up 1) developed(Fig. 1).
Recording and analysis of the wrist movements wereperformed using the DataLINK/DLK800 for data acquisi-tion, and DataLINK PC V. 2.00 software (Biometrics Ltd.,Gwent, UK), and a biaxial electrogoniometer and torsi-ometer (Biometricss).
The acceptability and discomfort were assessed by meansof a protocol with graph scales containing a horizontal lineof 100mm in length that indicated extreme attributes, ateach end: ‘‘no discomfort at all’’ and ‘‘maximum dis-comfort’’; and ‘‘no acceptability at all’’ and ‘‘maximumacceptability’’. The protocol contained detailed writteninstructions regarding how to fill it out. Standardizedverbal explanations were also provided (Borg, 1998).
2.1.3. Simulation of the task
The simulation consisted of performing sweeping move-ments across the entire breast area, bilaterally and in threedirections: longitudinal (from the upper to the lowerregion), transversal (from the sternum to the lateral sideof the thorax), and rotational (radial movements aroundthe nipple). The examination was performed on themannequin by following a graphical animation on thesimulator screen that reproduced the complete examina-tion. Each set of movements took around 4min and thewhole examination took around 12min to complete. Thesequences of activities in the simulated examination werebased upon various real examinations performed byexperienced physicians.
2.1.4. Procedures
Suitable participants watched at least five videos show-ing real examinations performed by experienced physiciansof right and leaf breast exams. After that, a 30min training
guided by the graphical animation was given to everysubject in an initial session. In the second session, the wristmovements were recorded while the subjects performed abreast ultrasound examination.
Movement recording: A biaxial electrogoniometer(Biometrics, XM65) was attached to the back of the righthand, on the medial line of the tendon of the third finger,and to the back of the forearm, on the medial line.A torsiometer (Biometrics, Z110) was attached to theventral face of the forearm, between the medial epicondyleand the styloid process. After calibration of the sensors, thesubjects performed the sequence of the examination threetimes, with each of the three transducers (two commercialtransducers and Mock-up 1). The sequences of theexaminations and transducers were randomized. Thesensors were calibrated according to the manufacturer’sinstructions (Biometrics, 1998) and care was taken whenfixing the sensors to prevent crosstalk problems.
2.1.5. Data analysis
In order to verify the effect of non-experiencedparticipants in the evaluation of wrist movements, record-ings from real examinations performed by experiencedphysicians in patients and recordings by non-experiencedsubjects in simulated situations were compared using thecommercial transducer 1 (the only available for bothgroups). Results showed that the variability inter-physi-cians were higher than the mean differences betweengroups. In some way, it was already expected, as thenon-experienced subjects were trained in a sequence ofmovement proposed to reproduce a real examination, andthey were able to replicate these movements consistently.Results from electrogoniometer recordings were ana-
lyzed for the extension, flexion, ulnar and radial deviation,pronation and supination movements of the wrist. Thepercentages of time spent in each of the pre-establishedamplitude ranges (safe and critical, as described in theIntroduction) were also calculated for each of the move-ments. As there was no differences for amplitudes betweengender (p ¼ 0.165) results from male and female wereanalyzed together. A mixed-design two-way ANOVA wasrun to determine whether there were differences inamplitudes, simultaneously, across the transducers(Mock-up 1, Commercials 1 and 2) and across the sixmovements evaluated (flexion, extension, ulnar and radialdeviation, pronation and supination). Although differencesbetween both commercial transducers were identified, nodifferences were found between the commercial transducersand the first mock-up designed (Mock-up 1).
2.2. Review of the ergonomic design, reevaluation of
movements and subjective assessment
From the unsatisfactory results of the initial evaluationof postures, a review of the ergonomic design was carriedout. At this phase the process started directly from thephysical modeling process using polyurethane foam for
ARTICLE IN PRESS
Fig. 2. Simulation of breast ultrasonography activity.
L.C. Paschoarelli et al. / International Journal of Industrial Ergonomics ] (]]]]) ]]]–]]] 3
Please cite this article as: Paschoarelli, L.C., et al., Assessment of the ergonomic design of diagnostic ultrasound transducers through wrist movements
and subjective evaluation. International Journal of Industrial Ergonomics (2008), doi:10.1016/j.ergon.2008.01.013
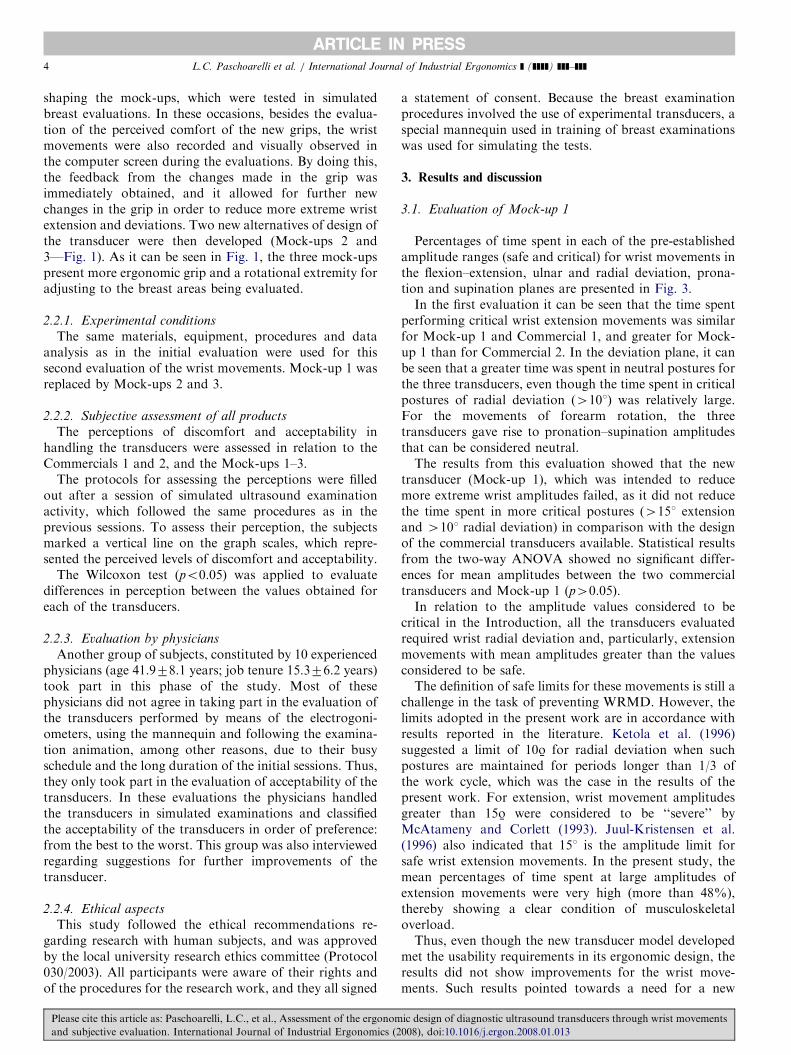
shaping the mock-ups, which were tested in simulatedbreast evaluations. In these occasions, besides the evalua-tion of the perceived comfort of the new grips, the wristmovements were also recorded and visually observed inthe computer screen during the evaluations. By doing this,the feedback from the changes made in the grip wasimmediately obtained, and it allowed for further newchanges in the grip in order to reduce more extreme wristextension and deviations. Two new alternatives of design ofthe transducer were then developed (Mock-ups 2 and3—Fig. 1). As it can be seen in Fig. 1, the three mock-upspresent more ergonomic grip and a rotational extremity foradjusting to the breast areas being evaluated.
2.2.1. Experimental conditions
The same materials, equipment, procedures and dataanalysis as in the initial evaluation were used for thissecond evaluation of the wrist movements. Mock-up 1 wasreplaced by Mock-ups 2 and 3.
2.2.2. Subjective assessment of all products
The perceptions of discomfort and acceptability inhandling the transducers were assessed in relation to theCommercials 1 and 2, and the Mock-ups 1–3.
The protocols for assessing the perceptions were filledout after a session of simulated ultrasound examinationactivity, which followed the same procedures as in theprevious sessions. To assess their perception, the subjectsmarked a vertical line on the graph scales, which repre-sented the perceived levels of discomfort and acceptability.
The Wilcoxon test (po0.05) was applied to evaluatedifferences in perception between the values obtained foreach of the transducers.
2.2.3. Evaluation by physicians
Another group of subjects, constituted by 10 experiencedphysicians (age 41.978.1 years; job tenure 15.376.2 years)took part in this phase of the study. Most of thesephysicians did not agree in taking part in the evaluation ofthe transducers performed by means of the electrogoni-ometers, using the mannequin and following the examina-tion animation, among other reasons, due to their busyschedule and the long duration of the initial sessions. Thus,they only took part in the evaluation of acceptability of thetransducers. In these evaluations the physicians handledthe transducers in simulated examinations and classifiedthe acceptability of the transducers in order of preference:from the best to the worst. This group was also interviewedregarding suggestions for further improvements of thetransducer.
2.2.4. Ethical aspects
This study followed the ethical recommendations re-garding research with human subjects, and was approvedby the local university research ethics committee (Protocol030/2003). All participants were aware of their rights andof the procedures for the research work, and they all signed
a statement of consent. Because the breast examinationprocedures involved the use of experimental transducers, aspecial mannequin used in training of breast examinationswas used for simulating the tests.
3. Results and discussion
3.1. Evaluation of Mock-up 1
Percentages of time spent in each of the pre-establishedamplitude ranges (safe and critical) for wrist movements inthe flexion–extension, ulnar and radial deviation, prona-tion and supination planes are presented in Fig. 3.In the first evaluation it can be seen that the time spent
performing critical wrist extension movements was similarfor Mock-up 1 and Commercial 1, and greater for Mock-up 1 than for Commercial 2. In the deviation plane, it canbe seen that a greater time was spent in neutral postures forthe three transducers, even though the time spent in criticalpostures of radial deviation (4101) was relatively large.For the movements of forearm rotation, the threetransducers gave rise to pronation–supination amplitudesthat can be considered neutral.The results from this evaluation showed that the new
transducer (Mock-up 1), which was intended to reducemore extreme wrist amplitudes failed, as it did not reducethe time spent in more critical postures (4151 extensionand 4101 radial deviation) in comparison with the designof the commercial transducers available. Statistical resultsfrom the two-way ANOVA showed no significant differ-ences for mean amplitudes between the two commercialtransducers and Mock-up 1 (p40.05).In relation to the amplitude values considered to be
critical in the Introduction, all the transducers evaluatedrequired wrist radial deviation and, particularly, extensionmovements with mean amplitudes greater than the valuesconsidered to be safe.The definition of safe limits for these movements is still a
challenge in the task of preventing WRMD. However, thelimits adopted in the present work are in accordance withresults reported in the literature. Ketola et al. (1996)suggested a limit of 10
%o for radial deviation when such
postures are maintained for periods longer than 1/3 ofthe work cycle, which was the case in the results of thepresent work. For extension, wrist movement amplitudesgreater than 15
%o were considered to be ‘‘severe’’ by
McAtameny and Corlett (1993). Juul-Kristensen et al.(1996) also indicated that 151 is the amplitude limit forsafe wrist extension movements. In the present study, themean percentages of time spent at large amplitudes ofextension movements were very high (more than 48%),thereby showing a clear condition of musculoskeletaloverload.Thus, even though the new transducer model developed
met the usability requirements in its ergonomic design, theresults did not show improvements for the wrist move-ments. Such results pointed towards a need for a new
ARTICLE IN PRESSL.C. Paschoarelli et al. / International Journal of Industrial Ergonomics ] (]]]]) ]]]–]]]4
Please cite this article as: Paschoarelli, L.C., et al., Assessment of the ergonomic design of diagnostic ultrasound transducers through wrist movements
and subjective evaluation. International Journal of Industrial Ergonomics (2008), doi:10.1016/j.ergon.2008.01.013
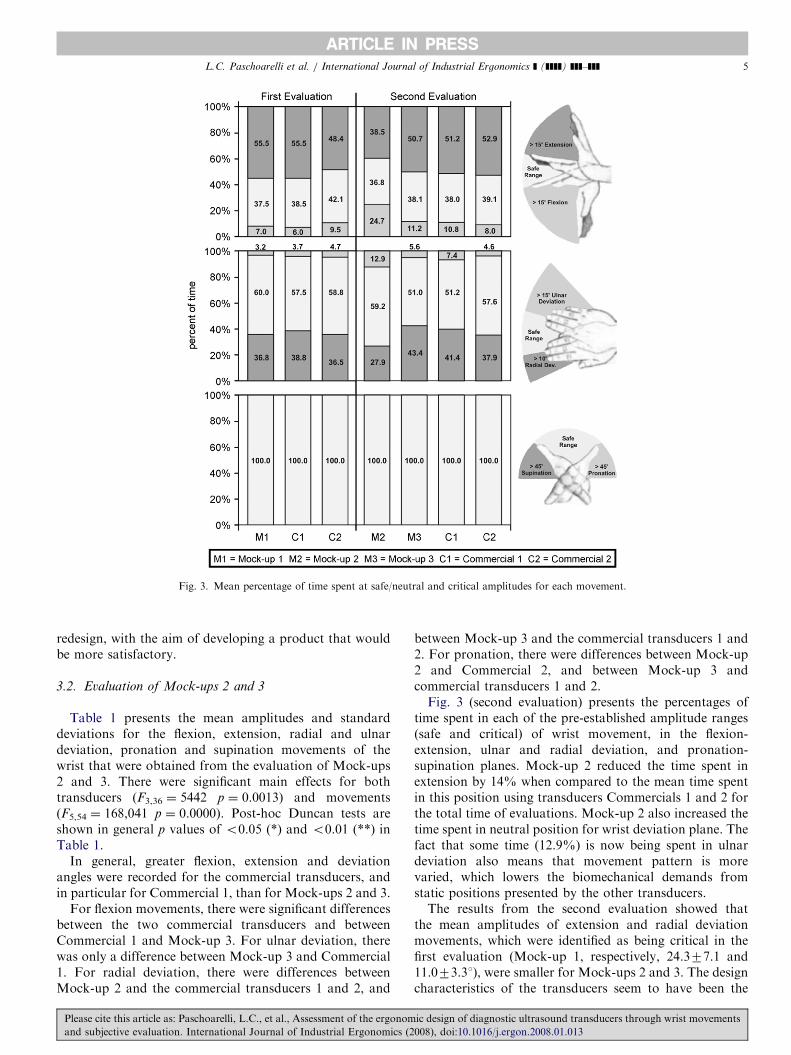
redesign, with the aim of developing a product that wouldbe more satisfactory.
3.2. Evaluation of Mock-ups 2 and 3
Table 1 presents the mean amplitudes and standarddeviations for the flexion, extension, radial and ulnardeviation, pronation and supination movements of thewrist that were obtained from the evaluation of Mock-ups2 and 3. There were significant main effects for bothtransducers (F3,36 ¼ 5442 p ¼ 0.0013) and movements(F5,54 ¼ 168,041 p ¼ 0.0000). Post-hoc Duncan tests areshown in general p values of o0.05 (*) and o0.01 (**) inTable 1.
In general, greater flexion, extension and deviationangles were recorded for the commercial transducers, andin particular for Commercial 1, than for Mock-ups 2 and 3.
For flexion movements, there were significant differencesbetween the two commercial transducers and betweenCommercial 1 and Mock-up 3. For ulnar deviation, therewas only a difference between Mock-up 3 and Commercial1. For radial deviation, there were differences betweenMock-up 2 and the commercial transducers 1 and 2, and
between Mock-up 3 and the commercial transducers 1 and2. For pronation, there were differences between Mock-up2 and Commercial 2, and between Mock-up 3 andcommercial transducers 1 and 2.Fig. 3 (second evaluation) presents the percentages of
time spent in each of the pre-established amplitude ranges(safe and critical) of wrist movement, in the flexion-extension, ulnar and radial deviation, and pronation-supination planes. Mock-up 2 reduced the time spent inextension by 14% when compared to the mean time spentin this position using transducers Commercials 1 and 2 forthe total time of evaluations. Mock-up 2 also increased thetime spent in neutral position for wrist deviation plane. Thefact that some time (12.9%) is now being spent in ulnardeviation also means that movement pattern is morevaried, which lowers the biomechanical demands fromstatic positions presented by the other transducers.The results from the second evaluation showed that
the mean amplitudes of extension and radial deviationmovements, which were identified as being critical in thefirst evaluation (Mock-up 1, respectively, 24.377.1 and11.073.31), were smaller for Mock-ups 2 and 3. The designcharacteristics of the transducers seem to have been the
ARTICLE IN PRESS
Fig. 3. Mean percentage of time spent at safe/neutral and critical amplitudes for each movement.
L.C. Paschoarelli et al. / International Journal of Industrial Ergonomics ] (]]]]) ]]]–]]] 5
Please cite this article as: Paschoarelli, L.C., et al., Assessment of the ergonomic design of diagnostic ultrasound transducers through wrist movements
and subjective evaluation. International Journal of Industrial Ergonomics (2008), doi:10.1016/j.ergon.2008.01.013
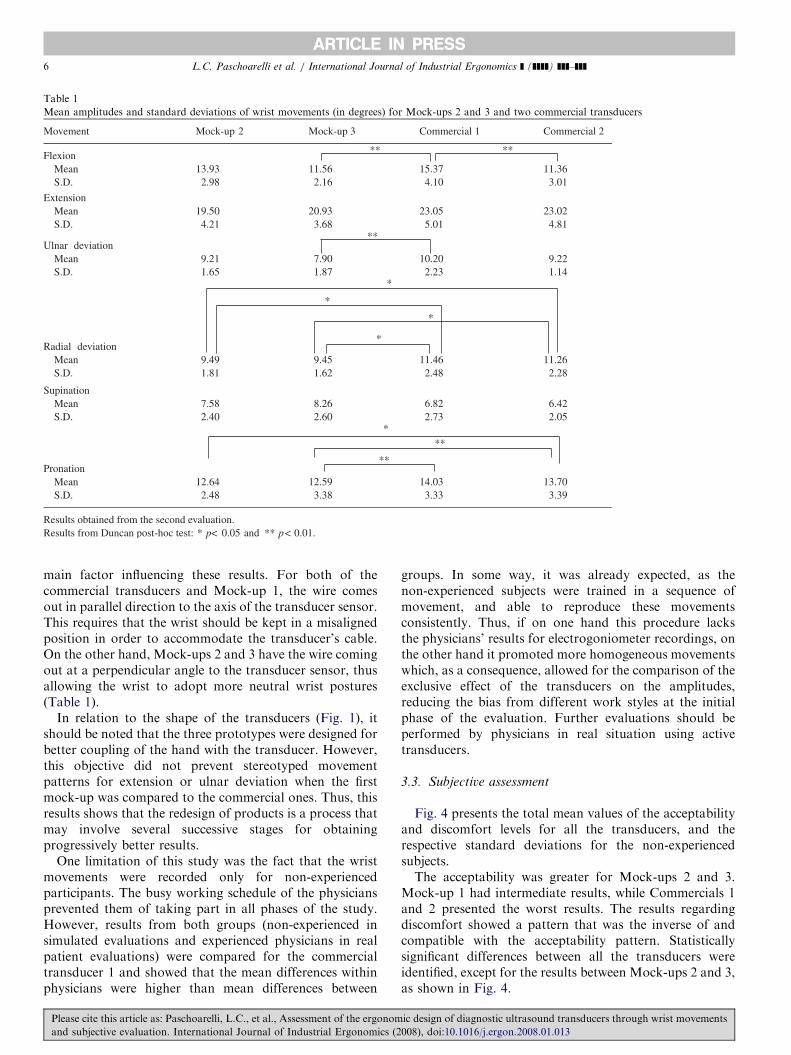
main factor influencing these results. For both of thecommercial transducers and Mock-up 1, the wire comesout in parallel direction to the axis of the transducer sensor.This requires that the wrist should be kept in a misalignedposition in order to accommodate the transducer’s cable.On the other hand, Mock-ups 2 and 3 have the wire comingout at a perpendicular angle to the transducer sensor, thusallowing the wrist to adopt more neutral wrist postures(Table 1).
In relation to the shape of the transducers (Fig. 1), itshould be noted that the three prototypes were designed forbetter coupling of the hand with the transducer. However,this objective did not prevent stereotyped movementpatterns for extension or ulnar deviation when the firstmock-up was compared to the commercial ones. Thus, thisresults shows that the redesign of products is a process thatmay involve several successive stages for obtainingprogressively better results.
One limitation of this study was the fact that the wristmovements were recorded only for non-experiencedparticipants. The busy working schedule of the physiciansprevented them of taking part in all phases of the study.However, results from both groups (non-experienced insimulated evaluations and experienced physicians in realpatient evaluations) were compared for the commercialtransducer 1 and showed that the mean differences withinphysicians were higher than mean differences between
groups. In some way, it was already expected, as thenon-experienced subjects were trained in a sequence ofmovement, and able to reproduce these movementsconsistently. Thus, if on one hand this procedure lacksthe physicians’ results for electrogoniometer recordings, onthe other hand it promoted more homogeneous movementswhich, as a consequence, allowed for the comparison of theexclusive effect of the transducers on the amplitudes,reducing the bias from different work styles at the initialphase of the evaluation. Further evaluations should beperformed by physicians in real situation using activetransducers.
3.3. Subjective assessment
Fig. 4 presents the total mean values of the acceptabilityand discomfort levels for all the transducers, and therespective standard deviations for the non-experiencedsubjects.The acceptability was greater for Mock-ups 2 and 3.
Mock-up 1 had intermediate results, while Commercials 1and 2 presented the worst results. The results regardingdiscomfort showed a pattern that was the inverse of andcompatible with the acceptability pattern. Statisticallysignificant differences between all the transducers wereidentified, except for the results between Mock-ups 2 and 3,as shown in Fig. 4.
ARTICLE IN PRESS
Table 1
Mean amplitudes and standard deviations of wrist movements (in degrees) for Mock-ups 2 and 3 and two commercial transducers
Movement Mock-up 2 Mock-up 3 Commercial 1 Commercial 2
FlexionMean 13.93 11.56 15.37 11.36S.D. 2.98 2.16 4.10 3.01
ExtensionMean 19.50 20.93 23.05 23.02S.D. 4.21 3.68 5.01 4.81
Ulnar deviationMean 9.21 7.90 10.20 9.22S.D. 1.65 1.87 2.23 1.14
Radial deviationMean 9.49 9.45 11.46 11.26S.D. 1.81 1.62 2.48 2.28
SupinationMean 7.58 8.26 6.82 6.42S.D. 2.40 2.60 2.73 2.05
PronationMean 12.64 12.59 14.03 13.70S.D. 2.48 3.38 3.33 3.39
Results obtained from the second evaluation.Results from Duncan post-hoc test: * p< <0.05 and **
**
**
*
*
*
*
***
**
**
p 0.01.
L.C. Paschoarelli et al. / International Journal of Industrial Ergonomics ] (]]]]) ]]]–]]]6
Please cite this article as: Paschoarelli, L.C., et al., Assessment of the ergonomic design of diagnostic ultrasound transducers through wrist movements
and subjective evaluation. International Journal of Industrial Ergonomics (2008), doi:10.1016/j.ergon.2008.01.013
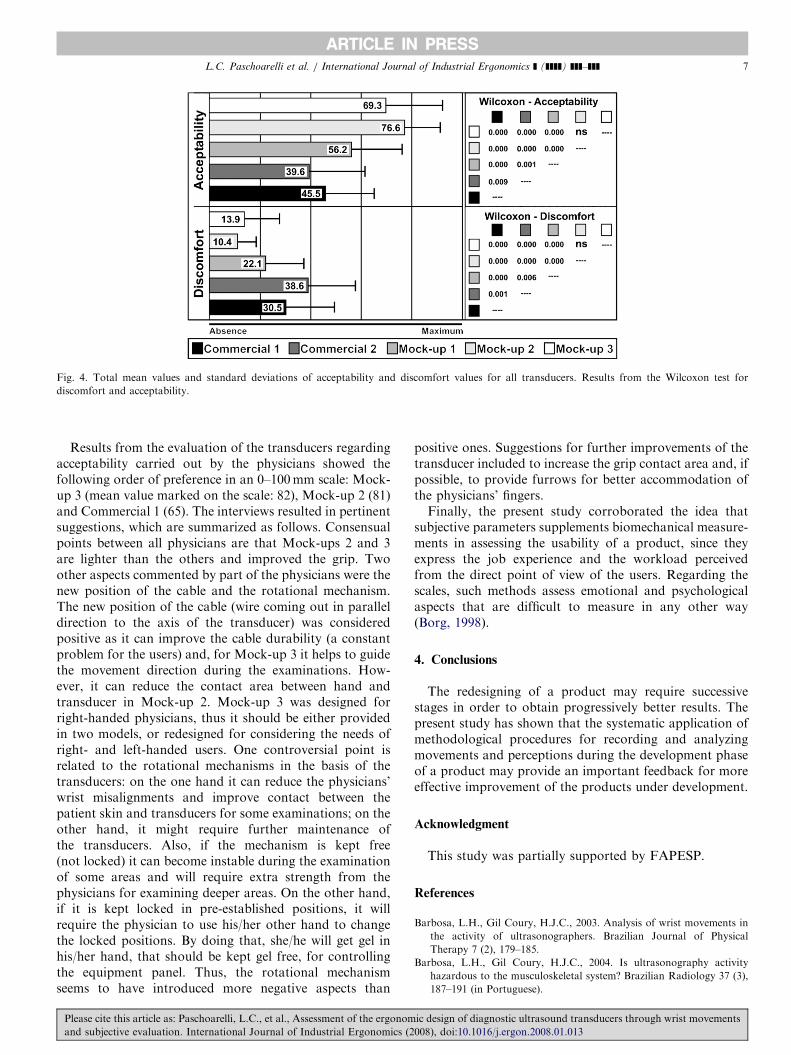
Results from the evaluation of the transducers regardingacceptability carried out by the physicians showed thefollowing order of preference in an 0–100mm scale: Mock-up 3 (mean value marked on the scale: 82), Mock-up 2 (81)and Commercial 1 (65). The interviews resulted in pertinentsuggestions, which are summarized as follows. Consensualpoints between all physicians are that Mock-ups 2 and 3are lighter than the others and improved the grip. Twoother aspects commented by part of the physicians were thenew position of the cable and the rotational mechanism.The new position of the cable (wire coming out in paralleldirection to the axis of the transducer) was consideredpositive as it can improve the cable durability (a constantproblem for the users) and, for Mock-up 3 it helps to guidethe movement direction during the examinations. How-ever, it can reduce the contact area between hand andtransducer in Mock-up 2. Mock-up 3 was designed forright-handed physicians, thus it should be either providedin two models, or redesigned for considering the needs ofright- and left-handed users. One controversial point isrelated to the rotational mechanisms in the basis of thetransducers: on the one hand it can reduce the physicians’wrist misalignments and improve contact between thepatient skin and transducers for some examinations; on theother hand, it might require further maintenance ofthe transducers. Also, if the mechanism is kept free(not locked) it can become instable during the examinationof some areas and will require extra strength from thephysicians for examining deeper areas. On the other hand,if it is kept locked in pre-established positions, it willrequire the physician to use his/her other hand to changethe locked positions. By doing that, she/he will get gel inhis/her hand, that should be kept gel free, for controllingthe equipment panel. Thus, the rotational mechanismseems to have introduced more negative aspects than
positive ones. Suggestions for further improvements of thetransducer included to increase the grip contact area and, ifpossible, to provide furrows for better accommodation ofthe physicians’ fingers.Finally, the present study corroborated the idea that
subjective parameters supplements biomechanical measure-ments in assessing the usability of a product, since theyexpress the job experience and the workload perceivedfrom the direct point of view of the users. Regarding thescales, such methods assess emotional and psychologicalaspects that are difficult to measure in any other way(Borg, 1998).
4. Conclusions
The redesigning of a product may require successivestages in order to obtain progressively better results. Thepresent study has shown that the systematic application ofmethodological procedures for recording and analyzingmovements and perceptions during the development phaseof a product may provide an important feedback for moreeffective improvement of the products under development.
Acknowledgment
This study was partially supported by FAPESP.
References
Barbosa, L.H., Gil Coury, H.J.C., 2003. Analysis of wrist movements in
the activity of ultrasonographers. Brazilian Journal of Physical
Therapy 7 (2), 179–185.
Barbosa, L.H., Gil Coury, H.J.C., 2004. Is ultrasonography activity
hazardous to the musculoskeletal system? Brazilian Radiology 37 (3),
187–191 (in Portuguese).
ARTICLE IN PRESS
Fig. 4. Total mean values and standard deviations of acceptability and discomfort values for all transducers. Results from the Wilcoxon test for
discomfort and acceptability.
L.C. Paschoarelli et al. / International Journal of Industrial Ergonomics ] (]]]]) ]]]–]]] 7
Please cite this article as: Paschoarelli, L.C., et al., Assessment of the ergonomic design of diagnostic ultrasound transducers through wrist movements
and subjective evaluation. International Journal of Industrial Ergonomics (2008), doi:10.1016/j.ergon.2008.01.013
Biometrics, 1998. Goniometers and Torsiometers Operating Manual.
Gwent, UK.
Borg, G., 1998. Borg’s Perceived Exertion and Pain Scales. Human
Kinetics, Champaign, 101pp.
Hedge, A., 1998. Design of hand-operated devices. In: Stanton, N. (Ed.),
Human Factors in Consumer Products. Taylor & Francis, London,
pp. 203–222.
Juul-Kristensen, B., Fallentin, N., Christensen, H., 1996. Data on
movement frequency and posture from observational techniques. In:
Advances in Occupational Ergonomics and Safety, vol. 2, pp. 454–457.
Ketola, R., Viikari-Juntura, E., Takala, E., 1996. Validation of a method
to assess physical load on the upper extremity. In: Advances in
Occupational Ergonomics and Safety, vol. 2, pp. 463–467.
Li, KW., 2002. Ergonomic design and evaluation of wire-tying hand tools.
International Journal of Industrial Ergonomics 30, 149–161.
Magnavita, N., Bevilacqua, L., Mirk, P., Fileni, A., Castellino, N., 1999.
Work-related musculoskeletal complaints in sonologists. Journal of
Occupational and Environmental Medicine 41 (11), 981–988.
McAtameny, L., Corlett, N., 1993. Rula: a survey method for the
investigation of work-related upper limb disorders. Applied Ergo-
nomics 24 (2), 91–99.
McCulloch, M.L., Xie, T., Adams, D.B., 2002. Cardiovascular sonogra-
phy: the painful art of scanning. Cardiac Ultrasound Today 5 (8),
69–96.
Motamedzade, M., Choobinehb, A., Mououdic, MA., Arghamid, S.,
2007. Ergonomic design of carpet weaving hand tools. International
Journal of Industrial Ergonomics 37, 581–587.
Necas, M., 1996. Musculoskeletal symptomatology and repetitive strain
injuries in diagnostic medical sonographers: a pilot study in
Washington and Oregon. Journal of Diagnostic Medical Sonography
12 (6), 266–273.
Norris, B., Wilson, J.R., 1997. Designing Safety Into Products—Making
Ergonomics Evaluation a Part of the Design Process. Institute for
Occupational Ergonomics/University of Nottingham, Nottingham,
30pp.
Palmer, A.K., Werner, F.H., Murphy, D., Glisson, R., 1985. Functional
wrist motion: a biomechanical study. The Journal of Hand Surgery
10A (1), 39–46.
Pavinen, M., Heinimaa, T., 2003. The effects of different hand tool blade
coatings on force demands when cutting wood. International Journal
of Industrial Ergonomics 32, 139–146.
Ransom, E., 2002. The Causes of Musculoskeletal Injury Amongst
Sonographers in the UK. Society of Radiographers, London, 31pp.
Russo, A., Murphy, C., Lessoway, V., Berkwitz, J., 2002. The prevalence
of musculoskeletal symptoms among British Columbia sonographers.
Applied Ergonomics 33 (5), 385–393.
Sade, S., Nieminen, M., Riihiaho, S., 1998. Testing usability with 3D
paper prototypes—case Halton system. Applied Ergonomics 29 (2),
67–73.
Schoenfeld, A., Goverman, J., Weiss, D.M., Meizner, I., 1999. Transducer
user syndrome: an occupational hazard of the ultrasonographer.
European Journal of Ultrasound 10 (1), 41–45.
Smith, A.C., Wolf, J.G., Xie, G.Y., Smith, M.D., 1997. Musculoskeletal
pain in cardiac ultrasonographers: results of a random survey. Journal
of American Society of Echocardiography 10 (4), 357–362.
Vanderpool, H.E., Friis, E.A., Smith, B.S., Harms, K.L., 1993. Prevalence
of carpal tunnel syndrome and other work-related musculoskeletal
problems in cardiac sonographers. Journal of Occupational Medicine
35 (6), 604–610.
Wihlidal, L.M., Kumar, S., 1997. An injury profile of practicing diagnostic
medical sonographers in Alberta. International Journal of Industrial
Ergonomics 19 (3), 205–216.
ARTICLE IN PRESSL.C. Paschoarelli et al. / International Journal of Industrial Ergonomics ] (]]]]) ]]]–]]]8
Please cite this article as: Paschoarelli, L.C., et al., Assessment of the ergonomic design of diagnostic ultrasound transducers through wrist movements
and subjective evaluation. International Journal of Industrial Ergonomics (2008), doi:10.1016/j.ergon.2008.01.013
ANEXO VI
SILVA LCCB, OLIVEIRA AB, COURY HJCG. Avaliação da preensão durante
manuseio com variação de carga em diferentes alturas. Artigo publicado na
revista FISIOTERAPIA EM MOVIMENTO, 19(3), 111-119, 2006.
148
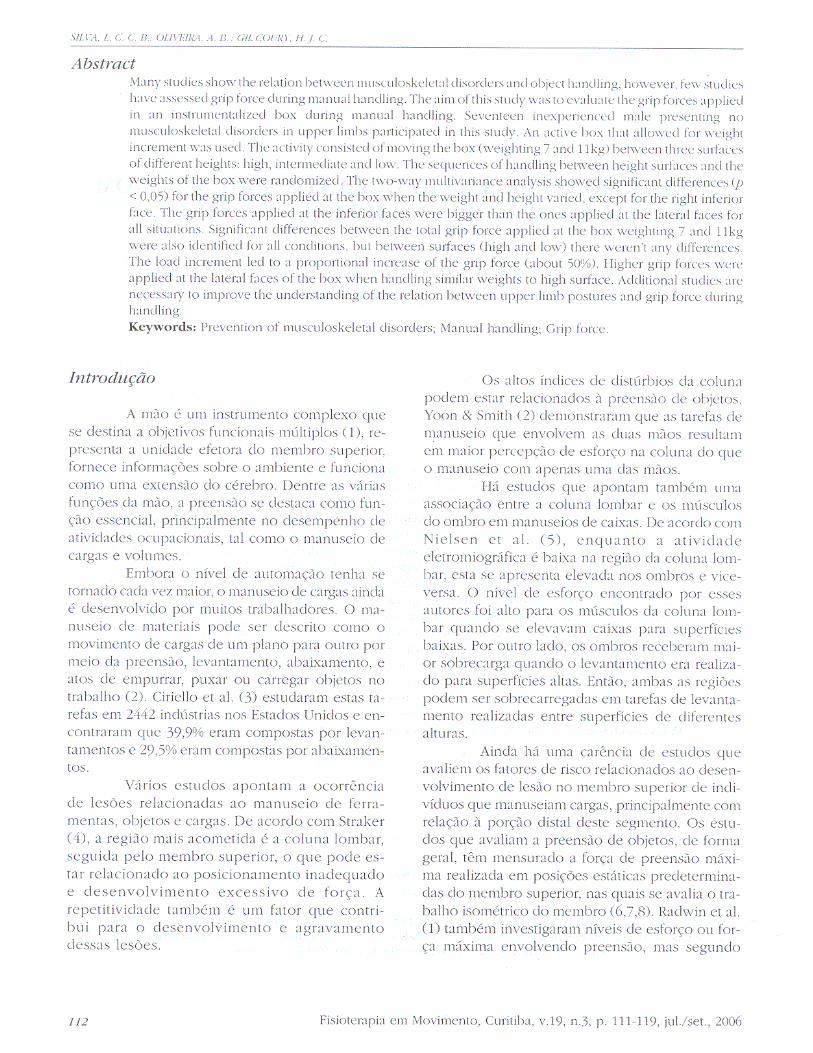
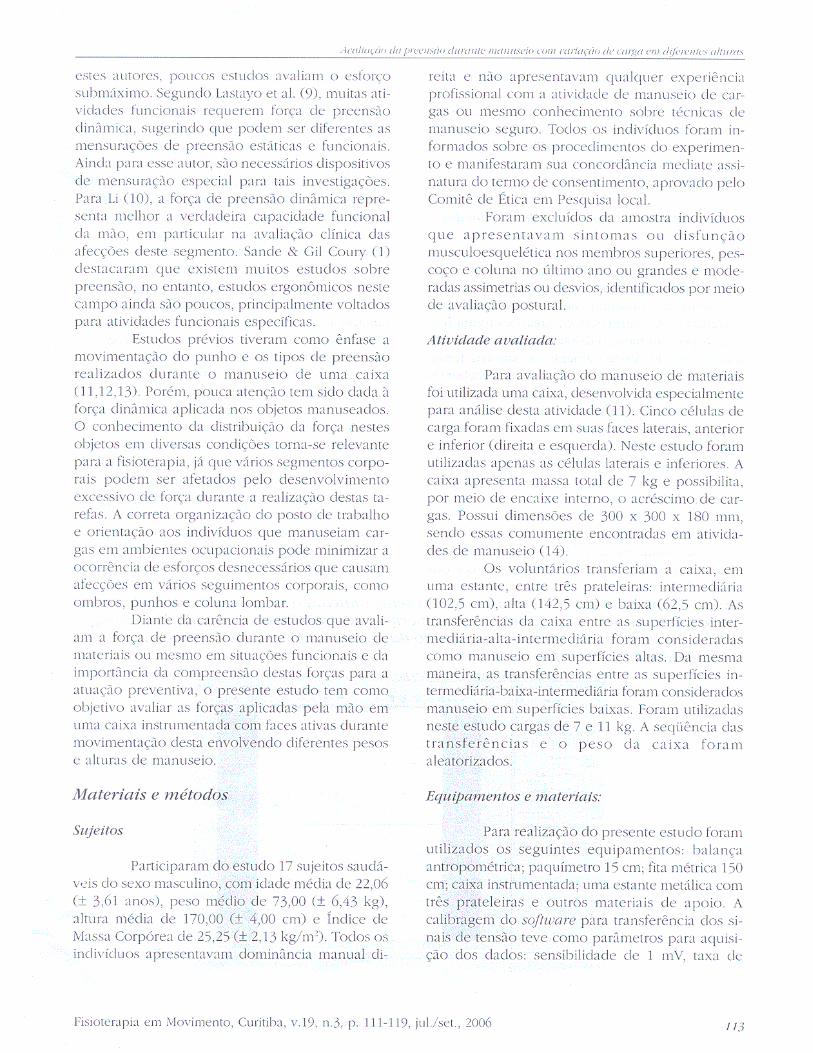
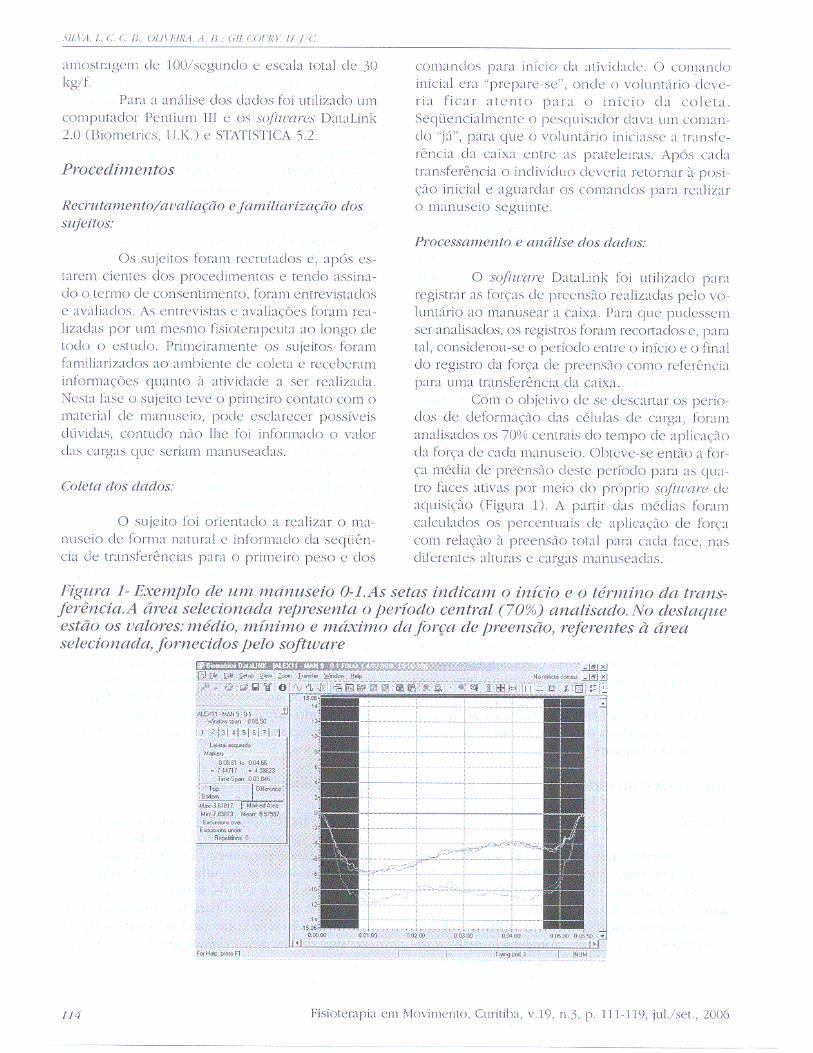
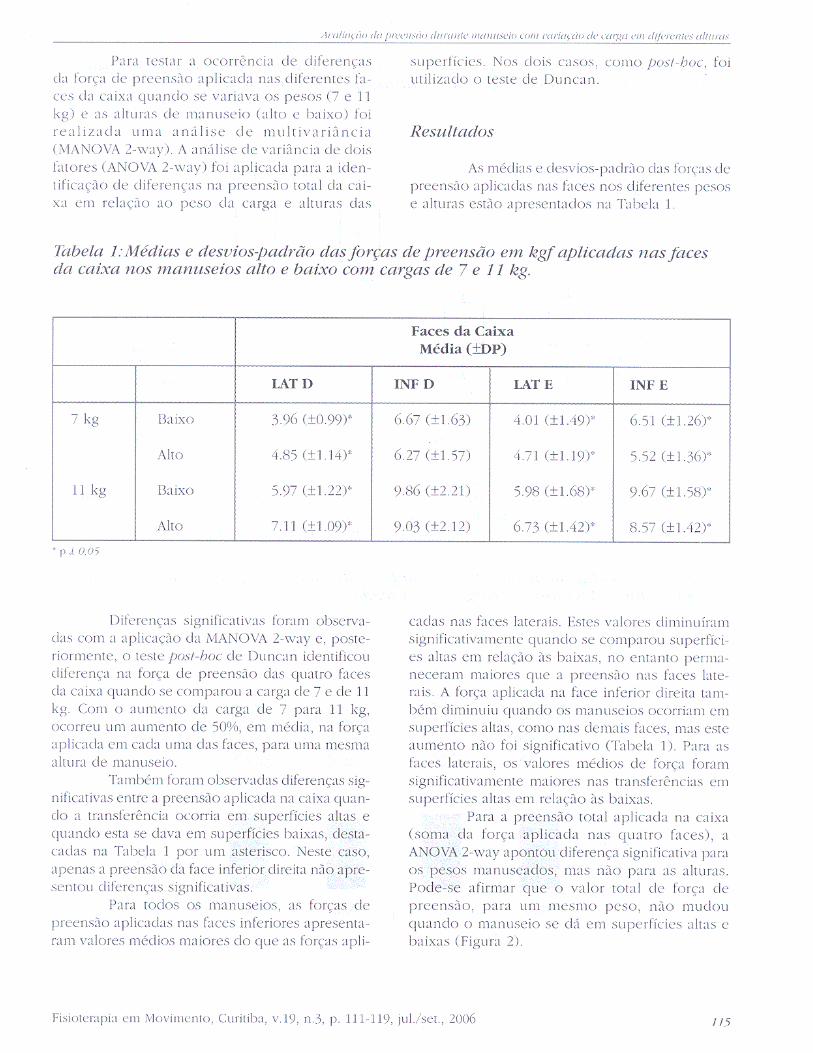
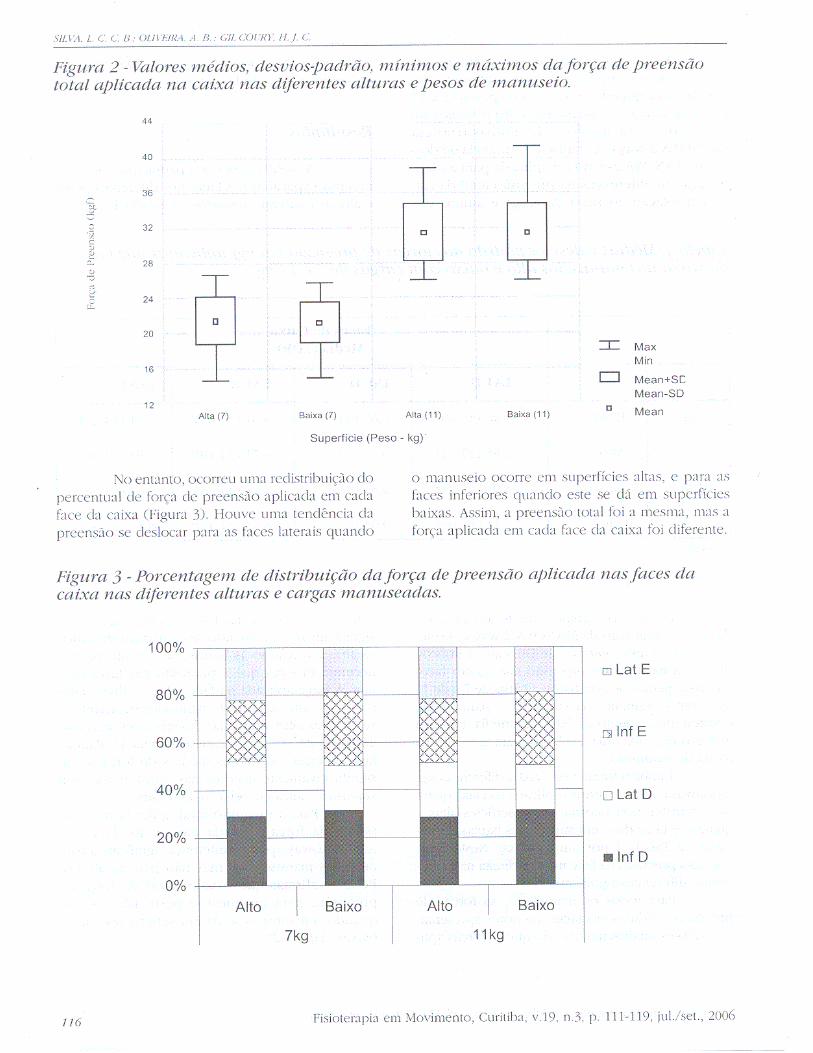
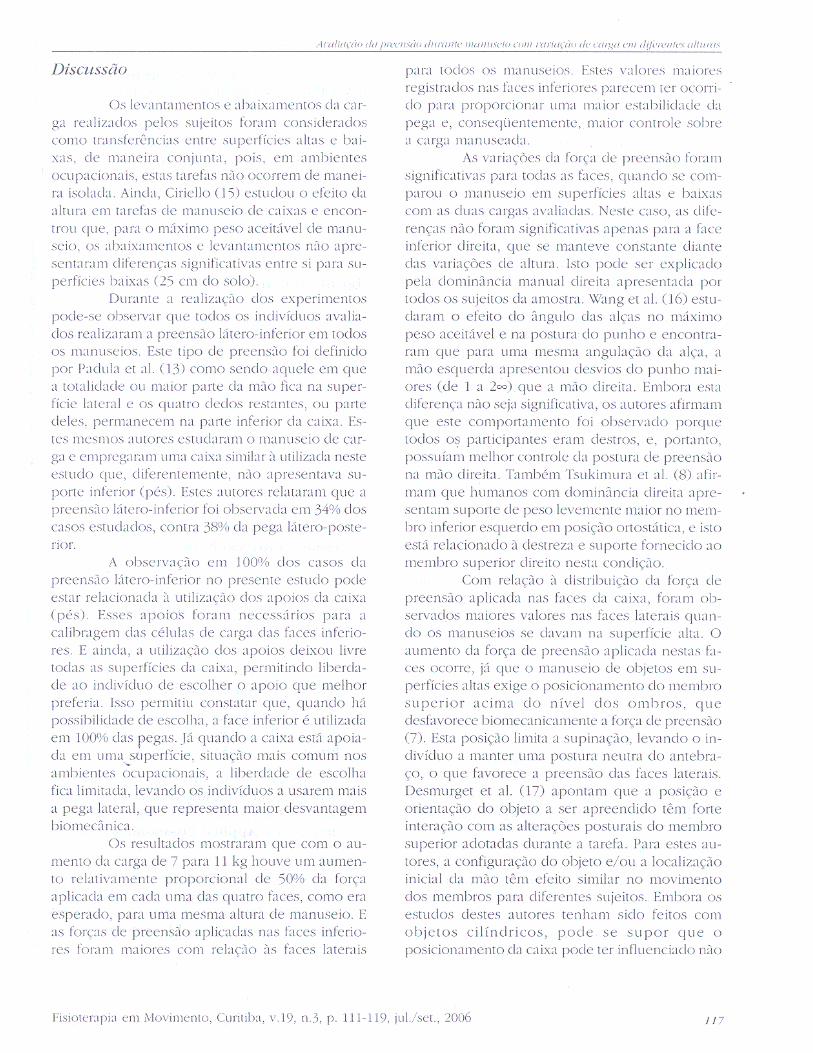
ANEXO VII
PADULA RS, OLIVEIRA AB, BARELA AM, BARELA JA, COURY HJCG. Are the
anticipatory trunk movements occurring during load-carrying activities protective
or risky? Artigo publicado no INTERNATIONAL JOURNAL OF INDUSTRUAL
ERGONOMICS, 38, 298-306, 2008, doi: 10.1016/j.ergon.2007.10.020.
158
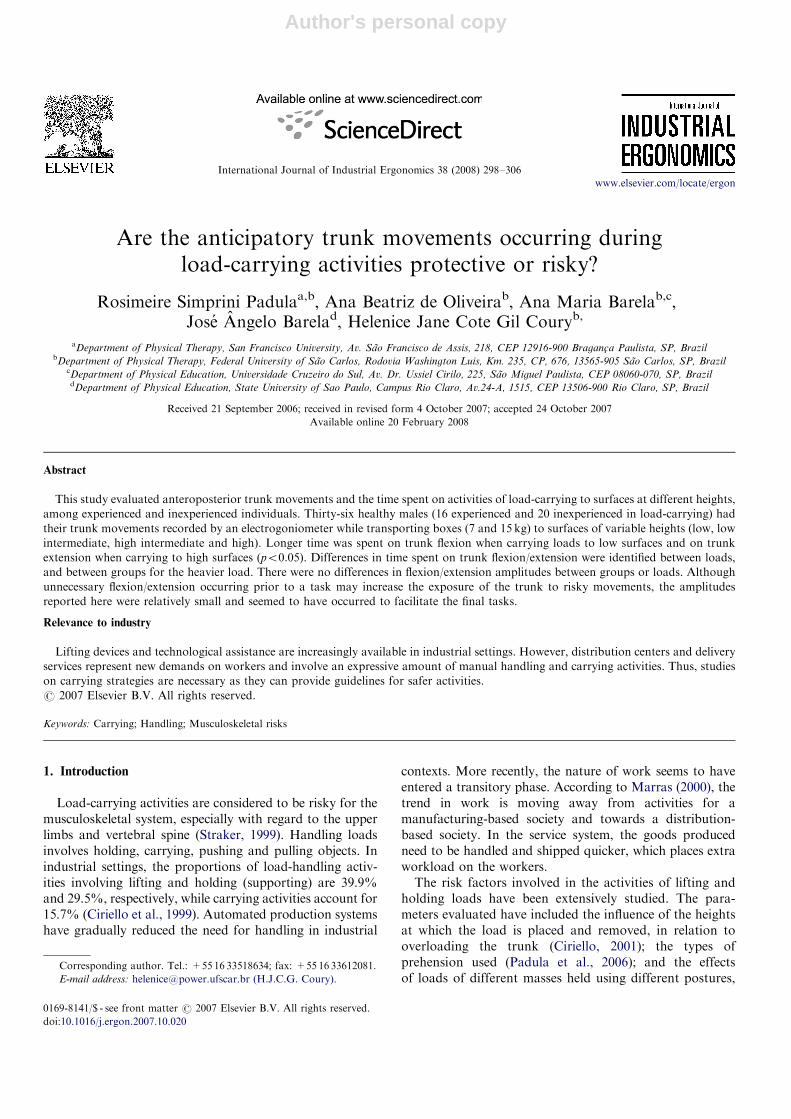
Author's personal copy
International Journal of Industrial Ergonomics 38 (2008) 298–306
Are the anticipatory trunk movements occurring duringload-carrying activities protective or risky?
Rosimeire Simprini Padulaa,b, Ana Beatriz de Oliveirab, Ana Maria Barelab,c,Jose Angelo Barelad, Helenice Jane Cote Gil Couryb,
aDepartment of Physical Therapy, San Francisco University, Av. Sao Francisco de Assis, 218, CEP 12916-900 Braganc-a Paulista, SP, BrazilbDepartment of Physical Therapy, Federal University of Sao Carlos, Rodovia Washington Luis, Km. 235, CP, 676, 13565-905 Sao Carlos, SP, Brazil
cDepartment of Physical Education, Universidade Cruzeiro do Sul, Av. Dr. Ussiel Cirilo, 225, Sao Miguel Paulista, CEP 08060-070, SP, BrazildDepartment of Physical Education, State University of Sao Paulo, Campus Rio Claro, Av.24-A, 1515, CEP 13506-900 Rio Claro, SP, Brazil
Received 21 September 2006; received in revised form 4 October 2007; accepted 24 October 2007
Available online 20 February 2008
Abstract
This study evaluated anteroposterior trunk movements and the time spent on activities of load-carrying to surfaces at different heights,
among experienced and inexperienced individuals. Thirty-six healthy males (16 experienced and 20 inexperienced in load-carrying) had
their trunk movements recorded by an electrogoniometer while transporting boxes (7 and 15 kg) to surfaces of variable heights (low, low
intermediate, high intermediate and high). Longer time was spent on trunk flexion when carrying loads to low surfaces and on trunk
extension when carrying to high surfaces (po0.05). Differences in time spent on trunk flexion/extension were identified between loads,
and between groups for the heavier load. There were no differences in flexion/extension amplitudes between groups or loads. Although
unnecessary flexion/extension occurring prior to a task may increase the exposure of the trunk to risky movements, the amplitudes
reported here were relatively small and seemed to have occurred to facilitate the final tasks.
Relevance to industry
Lifting devices and technological assistance are increasingly available in industrial settings. However, distribution centers and delivery
services represent new demands on workers and involve an expressive amount of manual handling and carrying activities. Thus, studies
on carrying strategies are necessary as they can provide guidelines for safer activities.
r 2007 Elsevier B.V. All rights reserved.
Keywords: Carrying; Handling; Musculoskeletal risks
1. Introduction
Load-carrying activities are considered to be risky for themusculoskeletal system, especially with regard to the upperlimbs and vertebral spine (Straker, 1999). Handling loadsinvolves holding, carrying, pushing and pulling objects. Inindustrial settings, the proportions of load-handling activ-ities involving lifting and holding (supporting) are 39.9%and 29.5%, respectively, while carrying activities account for15.7% (Ciriello et al., 1999). Automated production systemshave gradually reduced the need for handling in industrial
contexts. More recently, the nature of work seems to haveentered a transitory phase. According to Marras (2000), thetrend in work is moving away from activities for amanufacturing-based society and towards a distribution-based society. In the service system, the goods producedneed to be handled and shipped quicker, which places extraworkload on the workers.The risk factors involved in the activities of lifting and
holding loads have been extensively studied. The para-meters evaluated have included the influence of the heightsat which the load is placed and removed, in relation tooverloading the trunk (Ciriello, 2001); the types ofprehension used (Padula et al., 2006); and the effectsof loads of different masses held using different postures,
ARTICLE IN PRESS
www.elsevier.com/locate/ergon
0169-8141/$ - see front matter r 2007 Elsevier B.V. All rights reserved.
doi:10.1016/j.ergon.2007.10.020
Corresponding author. Tel.: +5516 33518634; fax: +55 16 33612081.
E-mail address: [email protected] (H.J.C.G. Coury).
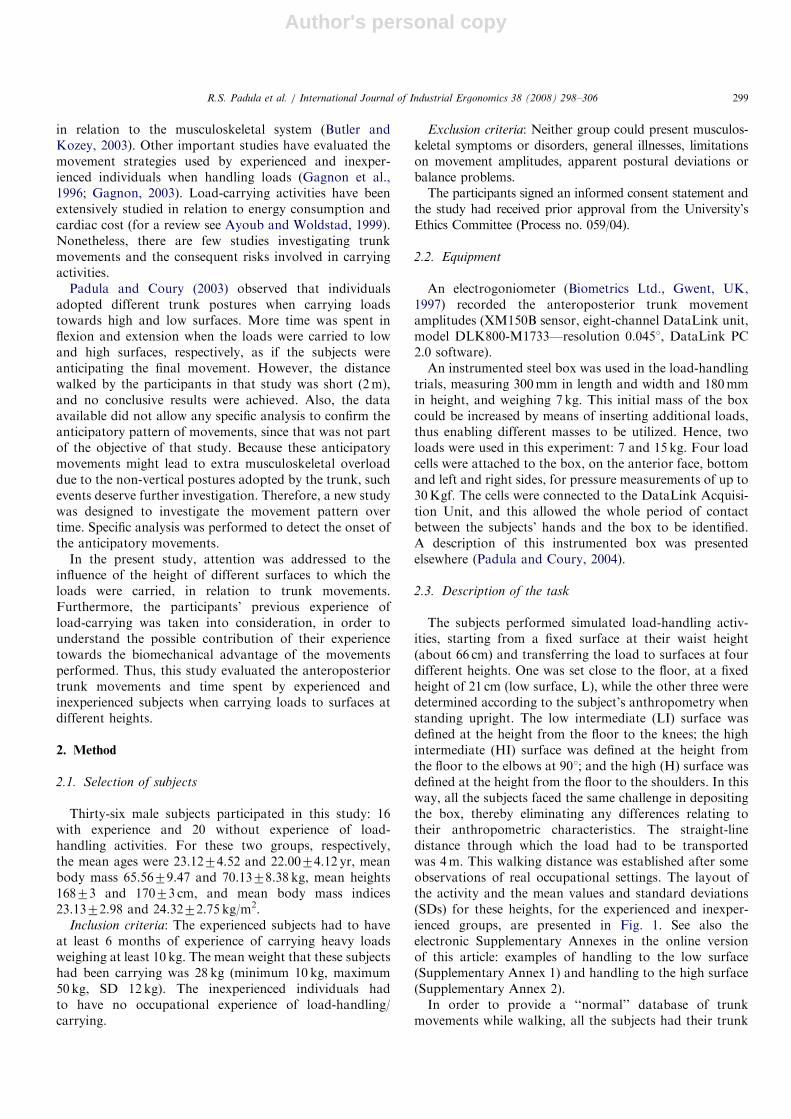
Author's personal copy
in relation to the musculoskeletal system (Butler andKozey, 2003). Other important studies have evaluated themovement strategies used by experienced and inexper-ienced individuals when handling loads (Gagnon et al.,1996; Gagnon, 2003). Load-carrying activities have beenextensively studied in relation to energy consumption andcardiac cost (for a review see Ayoub and Woldstad, 1999).Nonetheless, there are few studies investigating trunkmovements and the consequent risks involved in carryingactivities.
Padula and Coury (2003) observed that individualsadopted different trunk postures when carrying loadstowards high and low surfaces. More time was spent inflexion and extension when the loads were carried to lowand high surfaces, respectively, as if the subjects wereanticipating the final movement. However, the distancewalked by the participants in that study was short (2m),and no conclusive results were achieved. Also, the dataavailable did not allow any specific analysis to confirm theanticipatory pattern of movements, since that was not partof the objective of that study. Because these anticipatorymovements might lead to extra musculoskeletal overloaddue to the non-vertical postures adopted by the trunk, suchevents deserve further investigation. Therefore, a new studywas designed to investigate the movement pattern overtime. Specific analysis was performed to detect the onset ofthe anticipatory movements.
In the present study, attention was addressed to theinfluence of the height of different surfaces to which theloads were carried, in relation to trunk movements.Furthermore, the participants’ previous experience ofload-carrying was taken into consideration, in order tounderstand the possible contribution of their experiencetowards the biomechanical advantage of the movementsperformed. Thus, this study evaluated the anteroposteriortrunk movements and time spent by experienced andinexperienced subjects when carrying loads to surfaces atdifferent heights.
2. Method
2.1. Selection of subjects
Thirty-six male subjects participated in this study: 16with experience and 20 without experience of load-handling activities. For these two groups, respectively,the mean ages were 23.1274.52 and 22.0074.12 yr, meanbody mass 65.5679.47 and 70.1378.38 kg, mean heights16873 and 17073 cm, and mean body mass indices23.1372.98 and 24.3272.75 kg/m2.
Inclusion criteria: The experienced subjects had to haveat least 6 months of experience of carrying heavy loadsweighing at least 10 kg. The mean weight that these subjectshad been carrying was 28 kg (minimum 10 kg, maximum50 kg, SD 12 kg). The inexperienced individuals hadto have no occupational experience of load-handling/carrying.
Exclusion criteria: Neither group could present musculos-keletal symptoms or disorders, general illnesses, limitationson movement amplitudes, apparent postural deviations orbalance problems.The participants signed an informed consent statement and
the study had received prior approval from the University’sEthics Committee (Process no. 059/04).
2.2. Equipment
An electrogoniometer (Biometrics Ltd., Gwent, UK,1997) recorded the anteroposterior trunk movementamplitudes (XM150B sensor, eight-channel DataLink unit,model DLK800-M1733—resolution 0.0451, DataLink PC2.0 software).An instrumented steel box was used in the load-handling
trials, measuring 300mm in length and width and 180mmin height, and weighing 7 kg. This initial mass of the boxcould be increased by means of inserting additional loads,thus enabling different masses to be utilized. Hence, twoloads were used in this experiment: 7 and 15 kg. Four loadcells were attached to the box, on the anterior face, bottomand left and right sides, for pressure measurements of up to30Kgf. The cells were connected to the DataLink Acquisi-tion Unit, and this allowed the whole period of contactbetween the subjects’ hands and the box to be identified.A description of this instrumented box was presentedelsewhere (Padula and Coury, 2004).
2.3. Description of the task
The subjects performed simulated load-handling activ-ities, starting from a fixed surface at their waist height(about 66 cm) and transferring the load to surfaces at fourdifferent heights. One was set close to the floor, at a fixedheight of 21 cm (low surface, L), while the other three weredetermined according to the subject’s anthropometry whenstanding upright. The low intermediate (LI) surface wasdefined at the height from the floor to the knees; the highintermediate (HI) surface was defined at the height fromthe floor to the elbows at 901; and the high (H) surface wasdefined at the height from the floor to the shoulders. In thisway, all the subjects faced the same challenge in depositingthe box, thereby eliminating any differences relating totheir anthropometric characteristics. The straight-linedistance through which the load had to be transportedwas 4m. This walking distance was established after someobservations of real occupational settings. The layout ofthe activity and the mean values and standard deviations(SDs) for these heights, for the experienced and inexper-ienced groups, are presented in Fig. 1. See also theelectronic Supplementary Annexes in the online versionof this article: examples of handling to the low surface(Supplementary Annex 1) and handling to the high surface(Supplementary Annex 2).In order to provide a ‘‘normal’’ database of trunk
movements while walking, all the subjects had their trunk
ARTICLE IN PRESSR.S. Padula et al. / International Journal of Industrial Ergonomics 38 (2008) 298–306 299
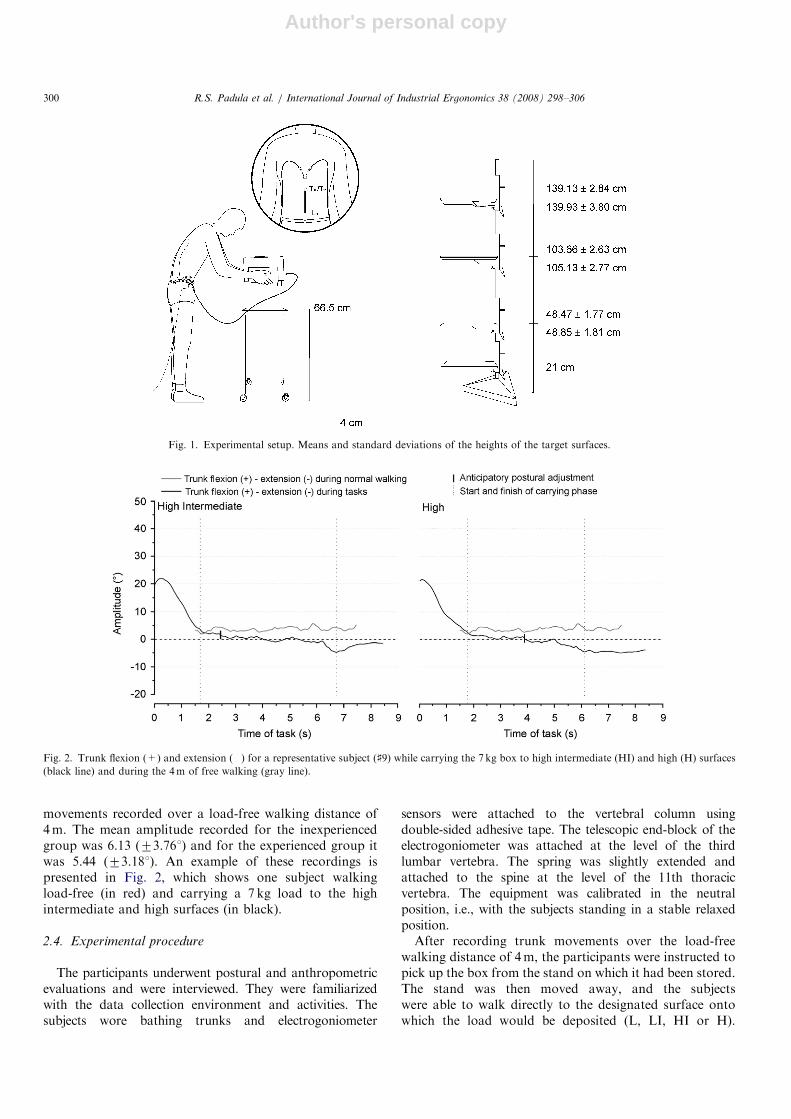
Author's personal copy
movements recorded over a load-free walking distance of4m. The mean amplitude recorded for the inexperiencedgroup was 6.13 (73.761) and for the experienced group itwas 5.44 (73.181). An example of these recordings ispresented in Fig. 2, which shows one subject walkingload-free (in red) and carrying a 7 kg load to the highintermediate and high surfaces (in black).
2.4. Experimental procedure
The participants underwent postural and anthropometricevaluations and were interviewed. They were familiarizedwith the data collection environment and activities. Thesubjects wore bathing trunks and electrogoniometer
sensors were attached to the vertebral column usingdouble-sided adhesive tape. The telescopic end-block of theelectrogoniometer was attached at the level of the thirdlumbar vertebra. The spring was slightly extended andattached to the spine at the level of the 11th thoracicvertebra. The equipment was calibrated in the neutralposition, i.e., with the subjects standing in a stable relaxedposition.After recording trunk movements over the load-free
walking distance of 4m, the participants were instructed topick up the box from the stand on which it had been stored.The stand was then moved away, and the subjectswere able to walk directly to the designated surface ontowhich the load would be deposited (L, LI, HI or H).
ARTICLE IN PRESS
Fig. 1. Experimental setup. Means and standard deviations of the heights of the target surfaces.
Fig. 2. Trunk flexion (+) and extension () for a representative subject (]9) while carrying the 7 kg box to high intermediate (HI) and high (H) surfaces
(black line) and during the 4m of free walking (gray line).
R.S. Padula et al. / International Journal of Industrial Ergonomics 38 (2008) 298–306300
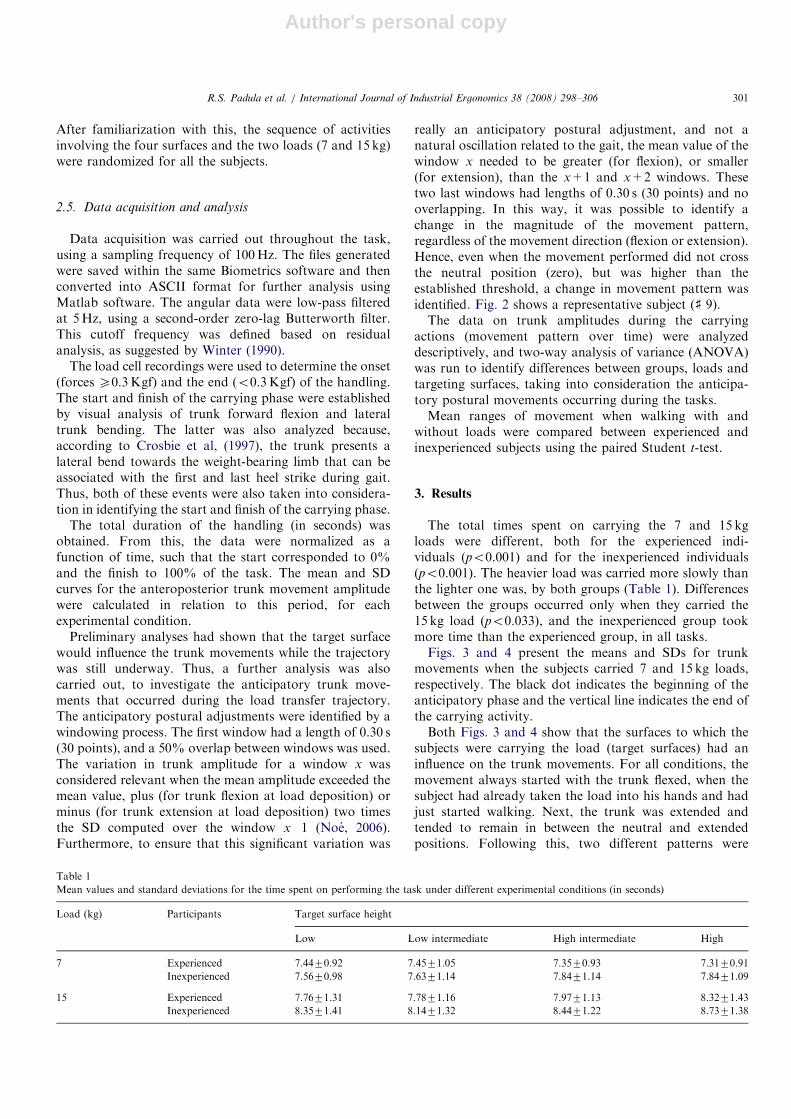
Author's personal copy
After familiarization with this, the sequence of activitiesinvolving the four surfaces and the two loads (7 and 15 kg)were randomized for all the subjects.
2.5. Data acquisition and analysis
Data acquisition was carried out throughout the task,using a sampling frequency of 100Hz. The files generatedwere saved within the same Biometrics software and thenconverted into ASCII format for further analysis usingMatlab software. The angular data were low-pass filteredat 5Hz, using a second-order zero-lag Butterworth filter.This cutoff frequency was defined based on residualanalysis, as suggested by Winter (1990).
The load cell recordings were used to determine the onset(forces X0.3Kgf) and the end (o0.3Kgf) of the handling.The start and finish of the carrying phase were establishedby visual analysis of trunk forward flexion and lateraltrunk bending. The latter was also analyzed because,according to Crosbie et al, (1997), the trunk presents alateral bend towards the weight-bearing limb that can beassociated with the first and last heel strike during gait.Thus, both of these events were also taken into considera-tion in identifying the start and finish of the carrying phase.
The total duration of the handling (in seconds) wasobtained. From this, the data were normalized as afunction of time, such that the start corresponded to 0%and the finish to 100% of the task. The mean and SDcurves for the anteroposterior trunk movement amplitudewere calculated in relation to this period, for eachexperimental condition.
Preliminary analyses had shown that the target surfacewould influence the trunk movements while the trajectorywas still underway. Thus, a further analysis was alsocarried out, to investigate the anticipatory trunk move-ments that occurred during the load transfer trajectory.The anticipatory postural adjustments were identified by awindowing process. The first window had a length of 0.30 s(30 points), and a 50% overlap between windows was used.The variation in trunk amplitude for a window x wasconsidered relevant when the mean amplitude exceeded themean value, plus (for trunk flexion at load deposition) orminus (for trunk extension at load deposition) two timesthe SD computed over the window x1 (Noe, 2006).Furthermore, to ensure that this significant variation was
really an anticipatory postural adjustment, and not anatural oscillation related to the gait, the mean value of thewindow x needed to be greater (for flexion), or smaller(for extension), than the x+1 and x+2 windows. Thesetwo last windows had lengths of 0.30 s (30 points) and nooverlapping. In this way, it was possible to identify achange in the magnitude of the movement pattern,regardless of the movement direction (flexion or extension).Hence, even when the movement performed did not crossthe neutral position (zero), but was higher than theestablished threshold, a change in movement pattern wasidentified. Fig. 2 shows a representative subject (] 9).The data on trunk amplitudes during the carrying
actions (movement pattern over time) were analyzeddescriptively, and two-way analysis of variance (ANOVA)was run to identify differences between groups, loads andtargeting surfaces, taking into consideration the anticipa-tory postural movements occurring during the tasks.Mean ranges of movement when walking with and
without loads were compared between experienced andinexperienced subjects using the paired Student t-test.
3. Results
The total times spent on carrying the 7 and 15 kgloads were different, both for the experienced indi-viduals (po0.001) and for the inexperienced individuals(po0.001). The heavier load was carried more slowly thanthe lighter one was, by both groups (Table 1). Differencesbetween the groups occurred only when they carried the15 kg load (po0.033), and the inexperienced group tookmore time than the experienced group, in all tasks.Figs. 3 and 4 present the means and SDs for trunk
movements when the subjects carried 7 and 15 kg loads,respectively. The black dot indicates the beginning of theanticipatory phase and the vertical line indicates the end ofthe carrying activity.Both Figs. 3 and 4 show that the surfaces to which the
subjects were carrying the load (target surfaces) had aninfluence on the trunk movements. For all conditions, themovement always started with the trunk flexed, when thesubject had already taken the load into his hands and hadjust started walking. Next, the trunk was extended andtended to remain in between the neutral and extendedpositions. Following this, two different patterns were
ARTICLE IN PRESS
Table 1
Mean values and standard deviations for the time spent on performing the task under different experimental conditions (in seconds)
Load (kg) Participants Target surface height
Low Low intermediate High intermediate High
7 Experienced 7.4470.92 7.4571.05 7.3570.93 7.3170.91
Inexperienced 7.5670.98 7.6371.14 7.8471.14 7.8471.09
15 Experienced 7.7671.31 7.7871.16 7.9771.13 8.3271.43
Inexperienced 8.3571.41 8.1471.32 8.4471.22 8.7371.38
R.S. Padula et al. / International Journal of Industrial Ergonomics 38 (2008) 298–306 301
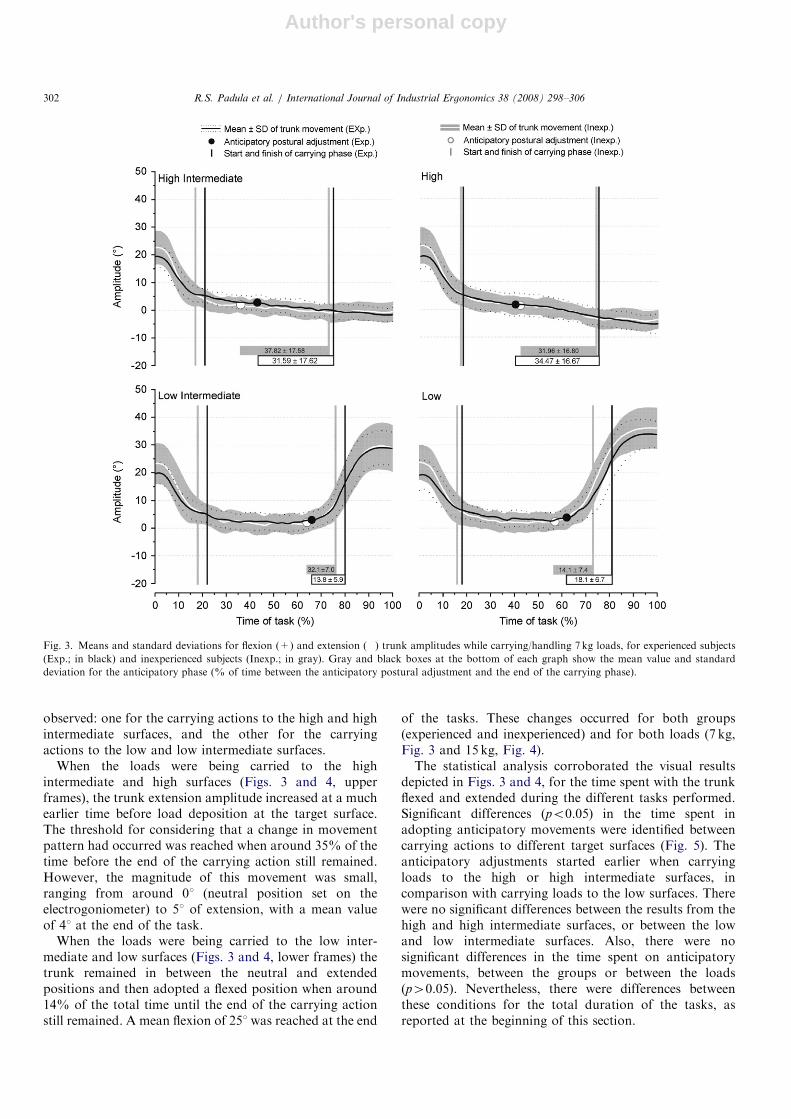
Author's personal copy
observed: one for the carrying actions to the high and highintermediate surfaces, and the other for the carryingactions to the low and low intermediate surfaces.
When the loads were being carried to the highintermediate and high surfaces (Figs. 3 and 4, upperframes), the trunk extension amplitude increased at a muchearlier time before load deposition at the target surface.The threshold for considering that a change in movementpattern had occurred was reached when around 35% of thetime before the end of the carrying action still remained.However, the magnitude of this movement was small,ranging from around 01 (neutral position set on theelectrogoniometer) to 51 of extension, with a mean valueof 41 at the end of the task.
When the loads were being carried to the low inter-mediate and low surfaces (Figs. 3 and 4, lower frames) thetrunk remained in between the neutral and extendedpositions and then adopted a flexed position when around14% of the total time until the end of the carrying actionstill remained. A mean flexion of 251 was reached at the end
of the tasks. These changes occurred for both groups(experienced and inexperienced) and for both loads (7 kg,Fig. 3 and 15 kg, Fig. 4).The statistical analysis corroborated the visual results
depicted in Figs. 3 and 4, for the time spent with the trunkflexed and extended during the different tasks performed.Significant differences (po0.05) in the time spent inadopting anticipatory movements were identified betweencarrying actions to different target surfaces (Fig. 5). Theanticipatory adjustments started earlier when carryingloads to the high or high intermediate surfaces, incomparison with carrying loads to the low surfaces. Therewere no significant differences between the results from thehigh and high intermediate surfaces, or between the lowand low intermediate surfaces. Also, there were nosignificant differences in the time spent on anticipatorymovements, between the groups or between the loads(p40.05). Nevertheless, there were differences betweenthese conditions for the total duration of the tasks, asreported at the beginning of this section.
ARTICLE IN PRESS
Fig. 3. Means and standard deviations for flexion (+) and extension () trunk amplitudes while carrying/handling 7 kg loads, for experienced subjects
(Exp.; in black) and inexperienced subjects (Inexp.; in gray). Gray and black boxes at the bottom of each graph show the mean value and standard
deviation for the anticipatory phase (% of time between the anticipatory postural adjustment and the end of the carrying phase).
R.S. Padula et al. / International Journal of Industrial Ergonomics 38 (2008) 298–306302
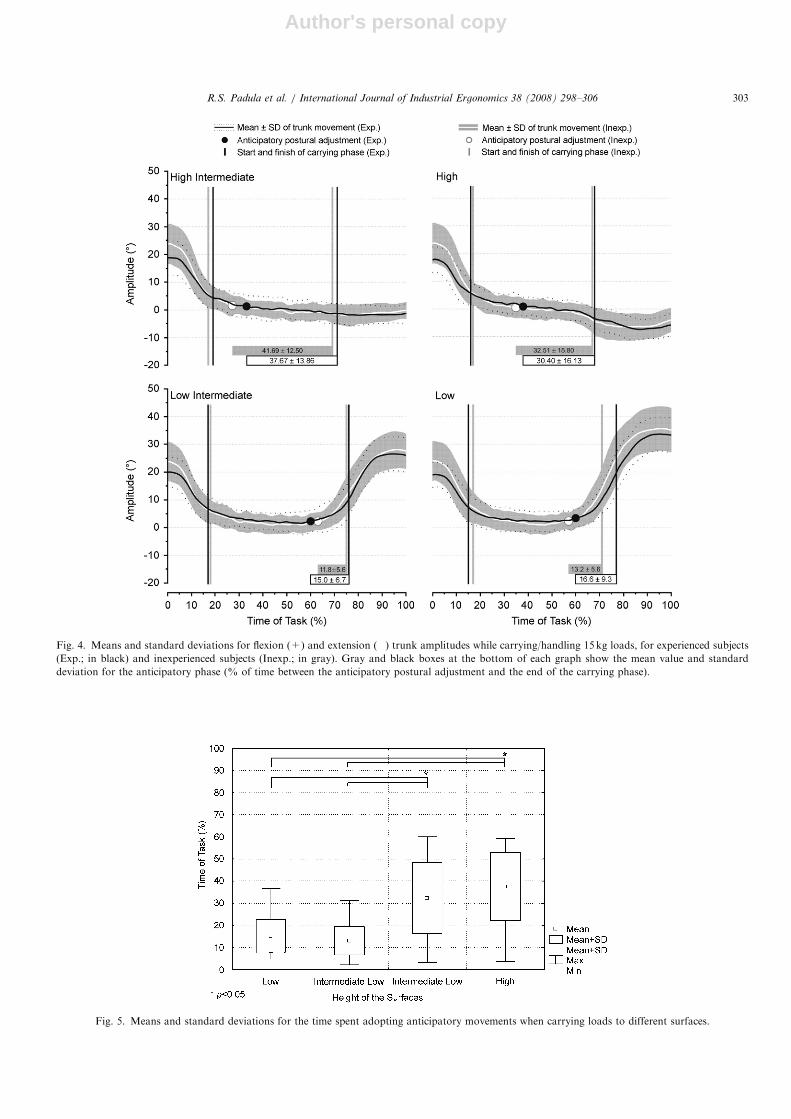
Author's personal copy
ARTICLE IN PRESS
Fig. 4. Means and standard deviations for flexion (+) and extension () trunk amplitudes while carrying/handling 15 kg loads, for experienced subjects
(Exp.; in black) and inexperienced subjects (Inexp.; in gray). Gray and black boxes at the bottom of each graph show the mean value and standard
deviation for the anticipatory phase (% of time between the anticipatory postural adjustment and the end of the carrying phase).
Fig. 5. Means and standard deviations for the time spent adopting anticipatory movements when carrying loads to different surfaces.
R.S. Padula et al. / International Journal of Industrial Ergonomics 38 (2008) 298–306 303
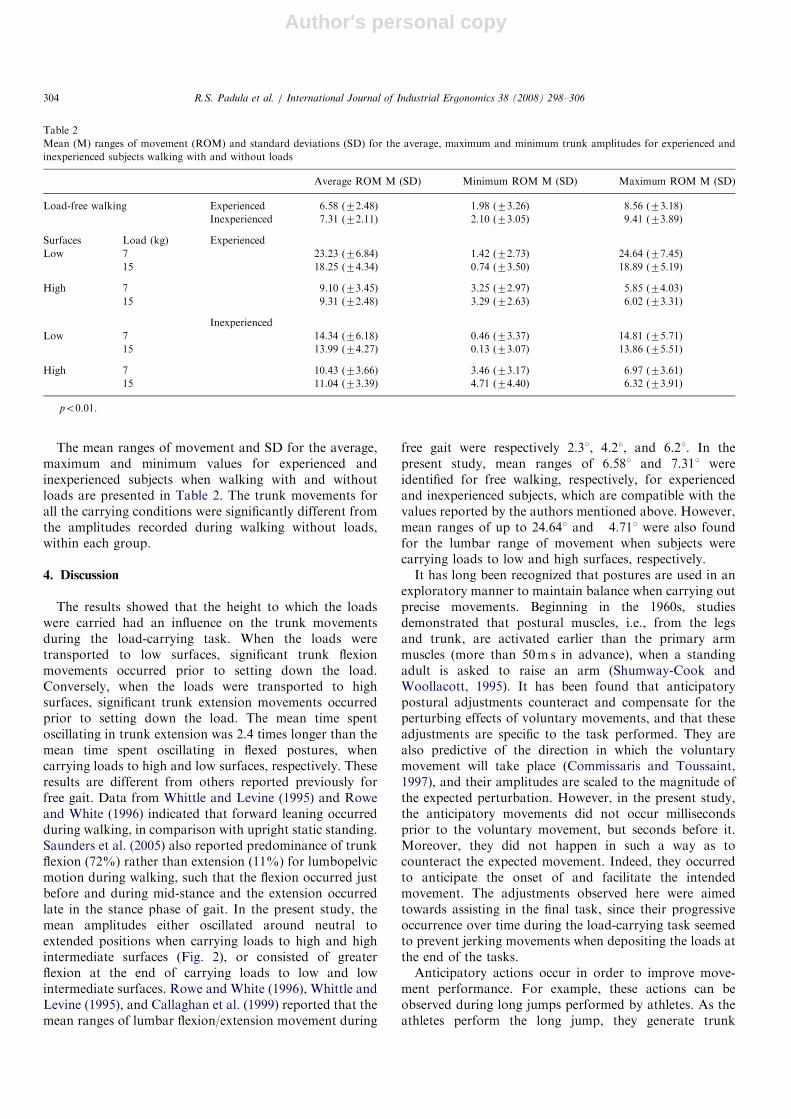
Author's personal copy
The mean ranges of movement and SD for the average,maximum and minimum values for experienced andinexperienced subjects when walking with and withoutloads are presented in Table 2. The trunk movements forall the carrying conditions were significantly different fromthe amplitudes recorded during walking without loads,within each group.
4. Discussion
The results showed that the height to which the loadswere carried had an influence on the trunk movementsduring the load-carrying task. When the loads weretransported to low surfaces, significant trunk flexionmovements occurred prior to setting down the load.Conversely, when the loads were transported to highsurfaces, significant trunk extension movements occurredprior to setting down the load. The mean time spentoscillating in trunk extension was 2.4 times longer than themean time spent oscillating in flexed postures, whencarrying loads to high and low surfaces, respectively. Theseresults are different from others reported previously forfree gait. Data from Whittle and Levine (1995) and Roweand White (1996) indicated that forward leaning occurredduring walking, in comparison with upright static standing.Saunders et al. (2005) also reported predominance of trunkflexion (72%) rather than extension (11%) for lumbopelvicmotion during walking, such that the flexion occurred justbefore and during mid-stance and the extension occurredlate in the stance phase of gait. In the present study, themean amplitudes either oscillated around neutral toextended positions when carrying loads to high and highintermediate surfaces (Fig. 2), or consisted of greaterflexion at the end of carrying loads to low and lowintermediate surfaces. Rowe and White (1996), Whittle andLevine (1995), and Callaghan et al. (1999) reported that themean ranges of lumbar flexion/extension movement during
free gait were respectively 2.31, 4.21, and 6.21. In thepresent study, mean ranges of 6.581 and 7.311 wereidentified for free walking, respectively, for experiencedand inexperienced subjects, which are compatible with thevalues reported by the authors mentioned above. However,mean ranges of up to 24.641 and 4.711 were also foundfor the lumbar range of movement when subjects werecarrying loads to low and high surfaces, respectively.It has long been recognized that postures are used in an
exploratory manner to maintain balance when carrying outprecise movements. Beginning in the 1960s, studiesdemonstrated that postural muscles, i.e., from the legsand trunk, are activated earlier than the primary armmuscles (more than 50m s in advance), when a standingadult is asked to raise an arm (Shumway-Cook andWoollacott, 1995). It has been found that anticipatorypostural adjustments counteract and compensate for theperturbing effects of voluntary movements, and that theseadjustments are specific to the task performed. They arealso predictive of the direction in which the voluntarymovement will take place (Commissaris and Toussaint,1997), and their amplitudes are scaled to the magnitude ofthe expected perturbation. However, in the present study,the anticipatory movements did not occur millisecondsprior to the voluntary movement, but seconds before it.Moreover, they did not happen in such a way as tocounteract the expected movement. Indeed, they occurredto anticipate the onset of and facilitate the intendedmovement. The adjustments observed here were aimedtowards assisting in the final task, since their progressiveoccurrence over time during the load-carrying task seemedto prevent jerking movements when depositing the loads atthe end of the tasks.Anticipatory actions occur in order to improve move-
ment performance. For example, these actions can beobserved during long jumps performed by athletes. As theathletes perform the long jump, they generate trunk
ARTICLE IN PRESS
Table 2
Mean (M) ranges of movement (ROM) and standard deviations (SD) for the average, maximum and minimum trunk amplitudes for experienced and
inexperienced subjects walking with and without loads
Average ROM M (SD) Minimum ROM M (SD) Maximum ROM M (SD)
Load-free walking Experienced 6.58 (72.48) 1.98 (73.26) 8.56 (73.18)
Inexperienced 7.31 (72.11) 2.10 (73.05) 9.41 (73.89)
Surfaces Load (kg) Experienced
Low 7 23.23 (76.84) 1.42 (72.73) 24.64 (77.45)
15 18.25 (74.34) 0.74 (73.50) 18.89 (75.19)
High 7 9.10 (73.45) 3.25 (72.97) 5.85 (74.03)
15 9.31 (72.48) 3.29 (72.63) 6.02 (73.31)
Inexperienced
Low 7 14.34 (76.18) 0.46 (73.37) 14.81 (75.71)
15 13.99 (74.27) 0.13 (73.07) 13.86 (75.51)
High 7 10.43 (73.66) 3.46 (73.17) 6.97 (73.61)
15 11.04 (73.39) 4.71 (74.40) 6.32 (73.91)
po0.01.
R.S. Padula et al. / International Journal of Industrial Ergonomics 38 (2008) 298–306304
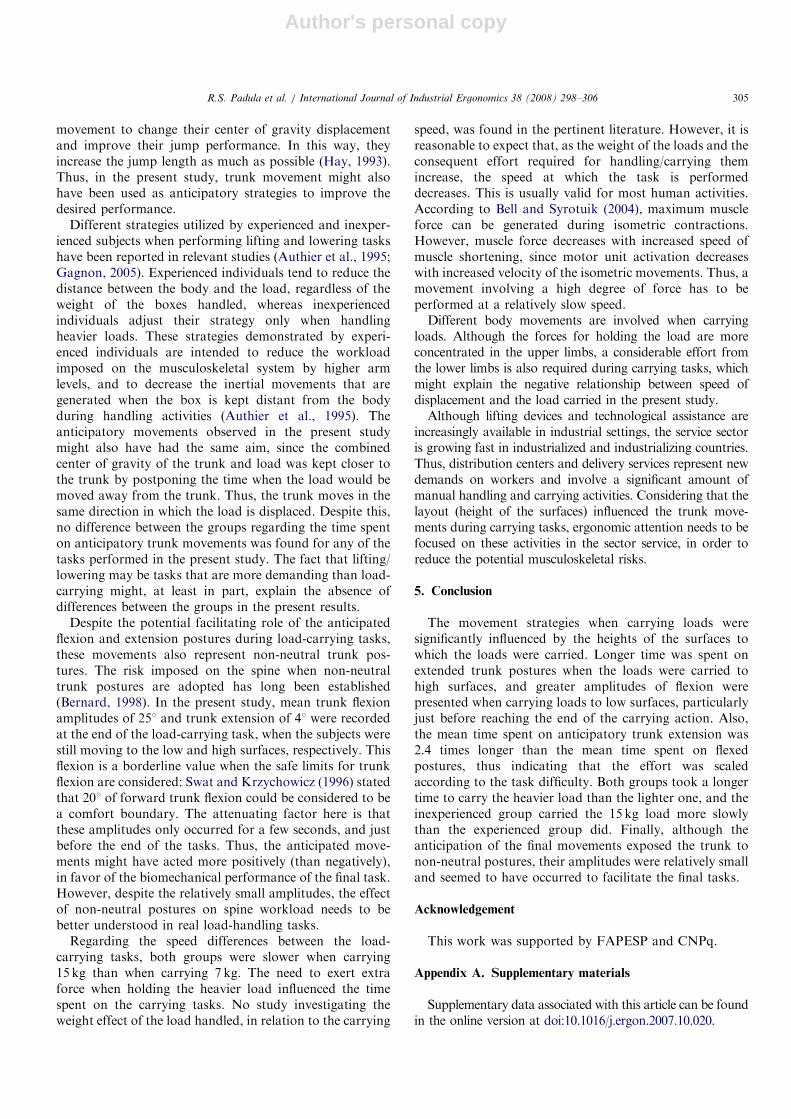
Author's personal copy
movement to change their center of gravity displacementand improve their jump performance. In this way, theyincrease the jump length as much as possible (Hay, 1993).Thus, in the present study, trunk movement might alsohave been used as anticipatory strategies to improve thedesired performance.
Different strategies utilized by experienced and inexper-ienced subjects when performing lifting and lowering taskshave been reported in relevant studies (Authier et al., 1995;Gagnon, 2005). Experienced individuals tend to reduce thedistance between the body and the load, regardless of theweight of the boxes handled, whereas inexperiencedindividuals adjust their strategy only when handlingheavier loads. These strategies demonstrated by experi-enced individuals are intended to reduce the workloadimposed on the musculoskeletal system by higher armlevels, and to decrease the inertial movements that aregenerated when the box is kept distant from the bodyduring handling activities (Authier et al., 1995). Theanticipatory movements observed in the present studymight also have had the same aim, since the combinedcenter of gravity of the trunk and load was kept closer tothe trunk by postponing the time when the load would bemoved away from the trunk. Thus, the trunk moves in thesame direction in which the load is displaced. Despite this,no difference between the groups regarding the time spenton anticipatory trunk movements was found for any of thetasks performed in the present study. The fact that lifting/lowering may be tasks that are more demanding than load-carrying might, at least in part, explain the absence ofdifferences between the groups in the present results.
Despite the potential facilitating role of the anticipatedflexion and extension postures during load-carrying tasks,these movements also represent non-neutral trunk pos-tures. The risk imposed on the spine when non-neutraltrunk postures are adopted has long been established(Bernard, 1998). In the present study, mean trunk flexionamplitudes of 251 and trunk extension of 41 were recordedat the end of the load-carrying task, when the subjects werestill moving to the low and high surfaces, respectively. Thisflexion is a borderline value when the safe limits for trunkflexion are considered: Swat and Krzychowicz (1996) statedthat 201 of forward trunk flexion could be considered to bea comfort boundary. The attenuating factor here is thatthese amplitudes only occurred for a few seconds, and justbefore the end of the tasks. Thus, the anticipated move-ments might have acted more positively (than negatively),in favor of the biomechanical performance of the final task.However, despite the relatively small amplitudes, the effectof non-neutral postures on spine workload needs to bebetter understood in real load-handling tasks.
Regarding the speed differences between the load-carrying tasks, both groups were slower when carrying15 kg than when carrying 7 kg. The need to exert extraforce when holding the heavier load influenced the timespent on the carrying tasks. No study investigating theweight effect of the load handled, in relation to the carrying
speed, was found in the pertinent literature. However, it isreasonable to expect that, as the weight of the loads and theconsequent effort required for handling/carrying themincrease, the speed at which the task is performeddecreases. This is usually valid for most human activities.According to Bell and Syrotuik (2004), maximum muscleforce can be generated during isometric contractions.However, muscle force decreases with increased speed ofmuscle shortening, since motor unit activation decreaseswith increased velocity of the isometric movements. Thus, amovement involving a high degree of force has to beperformed at a relatively slow speed.Different body movements are involved when carrying
loads. Although the forces for holding the load are moreconcentrated in the upper limbs, a considerable effort fromthe lower limbs is also required during carrying tasks, whichmight explain the negative relationship between speed ofdisplacement and the load carried in the present study.Although lifting devices and technological assistance are
increasingly available in industrial settings, the service sectoris growing fast in industrialized and industrializing countries.Thus, distribution centers and delivery services represent newdemands on workers and involve a significant amount ofmanual handling and carrying activities. Considering that thelayout (height of the surfaces) influenced the trunk move-ments during carrying tasks, ergonomic attention needs to befocused on these activities in the sector service, in order toreduce the potential musculoskeletal risks.
5. Conclusion
The movement strategies when carrying loads weresignificantly influenced by the heights of the surfaces towhich the loads were carried. Longer time was spent onextended trunk postures when the loads were carried tohigh surfaces, and greater amplitudes of flexion werepresented when carrying loads to low surfaces, particularlyjust before reaching the end of the carrying action. Also,the mean time spent on anticipatory trunk extension was2.4 times longer than the mean time spent on flexedpostures, thus indicating that the effort was scaledaccording to the task difficulty. Both groups took a longertime to carry the heavier load than the lighter one, and theinexperienced group carried the 15 kg load more slowlythan the experienced group did. Finally, although theanticipation of the final movements exposed the trunk tonon-neutral postures, their amplitudes were relatively smalland seemed to have occurred to facilitate the final tasks.
Acknowledgement
This work was supported by FAPESP and CNPq.
Appendix A. Supplementary materials
Supplementary data associated with this article can be foundin the online version at doi:10.1016/j.ergon.2007.10.020.
ARTICLE IN PRESSR.S. Padula et al. / International Journal of Industrial Ergonomics 38 (2008) 298–306 305
Author's personal copy
References
Authier, M., Gagnon, M., Lortie, M., 1995. Handling techniques:
the influence of weight and height for experts and novices. Inter-
national Journal of Occupational Safety and Ergonomics 1 (3),
262–275.
Ayoub, M.M., Woldstad, J.C., 1999. Chapter 15: models in
manual materials handling. In: Kumar, Shrawan (Ed.), Biomecha-
nics in Ergonomics. Taylor & Francis, Philadelphia, USA,
pp. 267–305.
Bell, G.J., Syrotuik, D.G., 2004. Physiology and biochemistry of strength
generation and factors limiting strength development in skeletal
muscle. In: Kumar, S. (Ed.), Muscle Strength. CRC Press, Boca
Raton, FL.
Bernard, B., 1998. Musculoskeletal Disorders and Workplace Factors—A
Critical Review of Epidemiologic Evidence for Work-Related Muscu-
loskeletal Disorders of the Neck, Upper Extremity, And Low Back.
National Institute for Occupational Safety and Health. Publication
No. 97-141.
Biometrics Ltda, 1997. Goniometer and torsiometer operating manual.
Gwent, UK.
Butler, L.H., Kozey, J.W., 2003. The effect of load and posture on load
simulations during a simulated lifting task in female workers.
International Journal of Industrial Ergonomics 31, 331–341.
Callaghan, J.P., Patla, A.E., McGill, S.M., 1999. Low back three-
dimensional joint forces, kinematics, and kinetics during walking.
Clinical Biomechanics 14, 203–216.
Ciriello, V.M., 2001. The effects of box size, vertical distance, and height
on lowering tasks. International Journal of Industrial Ergonomics 28,
61–67.
Ciriello, V.M., Snook, S.H., Hashemi, L., Cotnam, J., 1999. Distributions
of manual materials handling task parameters. International Journal
of Industrial Ergonomics 24, 379–388.
Commissaris, D.M., Toussaint, H.M., 1997. Anticipatory postural
adjustments in a bimanual, whole body lifting task with an object of
known weight. Human Movement Science 16, 407–431.
Crosbie, J., Vachalathiti, R., Smith, R., 1997. Patterns of spinal motion
during walking. Gait & Posture 2, 6–12.
Gagnon, M., 2003. The efficacy of training for three manual handling
strategies based on the observation of expert and novice workers.
Clinical Biomechanics 18 (7), 601–611.
Gagnon, M., 2005. Ergonomic identification and biomechanical evalua-
tion of worker strategies and their validation in a training situation:
summary of research. Clinical Biomechanics 20, 569–580.
Gagnon, M., Plamondon, A., Gravel, D., Lartie, M., 1996. Knee movement
strategies differentiate expert from novice workers in asymmetrical
manual materials handling. Journal of Biomechanics 29 (11), 1445–1453.
Hay, J.G., 1993. The Biomechanics of Sports Techniques. Prentice-Hall,
Englewood Cliffs, NJ.
Marras, W.S., 2000. Occupational low back disorder causation and
control. Ergonomics 43 (7), 880–902.
Noe, F., 2006. Modifications of anticipatory postural adjustments in a
rock climbing task: the effect of supporting wall inclination. Journal of
Electromyography and Kinesiology 16, 336–341.
Padula, R.S., Coury, H.J.C.G., 2003. Sagittal trunk movements during
load carrying activities: a pilot study. International Journal of
Industrial Ergonomics 32, 181–188.
Padula, R.S., Coury, H.J.C.G., 2004. Device for analyzing grip forces
during handling. In: Premus 2004: Fifth International Scientific
Conference on Prevention of Work-Related Musculoskeletal Dis-
orders. Abstract Book II: 599–600; Zurich.
Padula, R.S., Souza, V.C., Coury, H.J.C.G., 2006. Types of prehension
and wrist movements during load handling. Brazilian Journal of
Physical Therapy 10 (1), 29–34.
Rowe, P.J., White, M., 1996. Three dimensional, lumbar spinal kinematics
during gait, following mild musculoskeletal low back pain in nurses.
Gait & Posture 4, 242–251.
Saunders, S.W., Schache, A., Rath, D., Hodges, P.W., 2005. Changes in
three dimensional lumbo-pelvic kinematics and trunk muscle activity
with speed and mode of locomotion. Clinical Biomechanics 20, 784–793.
Shumway-Cook, A., Woollacott, M.H., 1995. Motor Control: Theory and
Practical Applications. Williams & Wilkins, Baltimore, MD.
Straker, L.M., 1999. An overview of manual handling injury statistics in
western Australia. International Journal of Industrial Ergonomics 23,
357–364.
Swat, K., Krzychowicz, G., 1996. ERGON: computer-aided working
posture analysis system for workplace designers. International Journal
of Industrial Ergonomics 18, 15–26.
Whittle, M.W., Levine, D.F., 1995. Sagittal plane motion of the lumbar
spine during normal gait. Gait & Posture 3, 82.
Winter, D.A., 1990. Biomechanics and Motor Control of Human
Movement, second ed. Wiley Interscience, New York.
ARTICLE IN PRESSR.S. Padula et al. / International Journal of Industrial Ergonomics 38 (2008) 298–306306
ANEXO VIII
OLIVEIRA AB, SATO TO, SERRÃO FV, COURY HJCG. Association between
muscular activity and upper limb posture during lifting with height and weight
variation. Resumo expandido apresentado no XVII Congress of the International
Society of Electromyography and Kinesiology, Ontario, Canada, 2008.
168
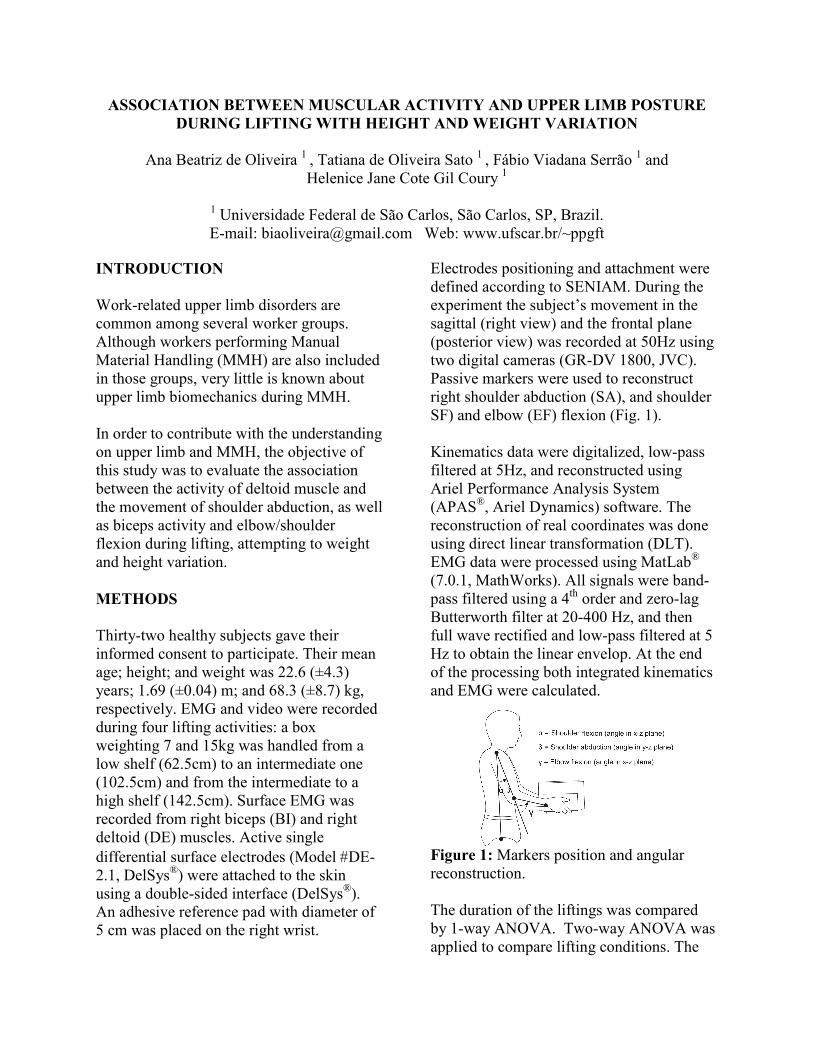
ASSOCIATION BETWEEN MUSCULAR ACTIVITY AND UPPER LIMB POSTURE
DURING LIFTING WITH HEIGHT AND WEIGHT VARIATION
Ana Beatriz de Oliveira 1 , Tatiana de Oliveira Sato
1 , Fábio Viadana Serrão
1 and
Helenice Jane Cote Gil Coury 1
1 Universidade Federal de São Carlos, São Carlos, SP, Brazil.
E-mail: [email protected] Web: www.ufscar.br/~ppgft
INTRODUCTION
Work-related upper limb disorders are
common among several worker groups.
Although workers performing Manual
Material Handling (MMH) are also included
in those groups, very little is known about
upper limb biomechanics during MMH.
In order to contribute with the understanding
on upper limb and MMH, the objective of
this study was to evaluate the association
between the activity of deltoid muscle and
the movement of shoulder abduction, as well
as biceps activity and elbow/shoulder
flexion during lifting, attempting to weight
and height variation.
METHODS
Thirty-two healthy subjects gave their
informed consent to participate. Their mean
age; height; and weight was 22.6 (±4.3)
years; 1.69 (±0.04) m; and 68.3 (±8.7) kg,
respectively. EMG and video were recorded
during four lifting activities: a box
weighting 7 and 15kg was handled from a
low shelf (62.5cm) to an intermediate one
(102.5cm) and from the intermediate to a
high shelf (142.5cm). Surface EMG was
recorded from right biceps (BI) and right
deltoid (DE) muscles. Active single
differential surface electrodes (Model #DE-
2.1, DelSys®) were attached to the skin
using a double-sided interface (DelSys®).
An adhesive reference pad with diameter of
5 cm was placed on the right wrist.
Electrodes positioning and attachment were
defined according to SENIAM. During the
experiment the subject’s movement in the
sagittal (right view) and the frontal plane
(posterior view) was recorded at 50Hz using
two digital cameras (GR-DV 1800, JVC).
Passive markers were used to reconstruct
right shoulder abduction (SA), and shoulder
SF) and elbow (EF) flexion (Fig. 1).
Kinematics data were digitalized, low-pass
filtered at 5Hz, and reconstructed using
Ariel Performance Analysis System
(APAS®, Ariel Dynamics) software. The
reconstruction of real coordinates was done
using direct linear transformation (DLT).
EMG data were processed using MatLab®
(7.0.1, MathWorks). All signals were band-
pass filtered using a 4th order and zero-lag
Butterworth filter at 20-400 Hz, and then
full wave rectified and low-pass filtered at 5
Hz to obtain the linear envelop. At the end
of the processing both integrated kinematics
and EMG were calculated.
Figure 1: Markers position and angular
reconstruction.
The duration of the liftings was compared
by 1-way ANOVA. Two-way ANOVA was
applied to compare lifting conditions. The
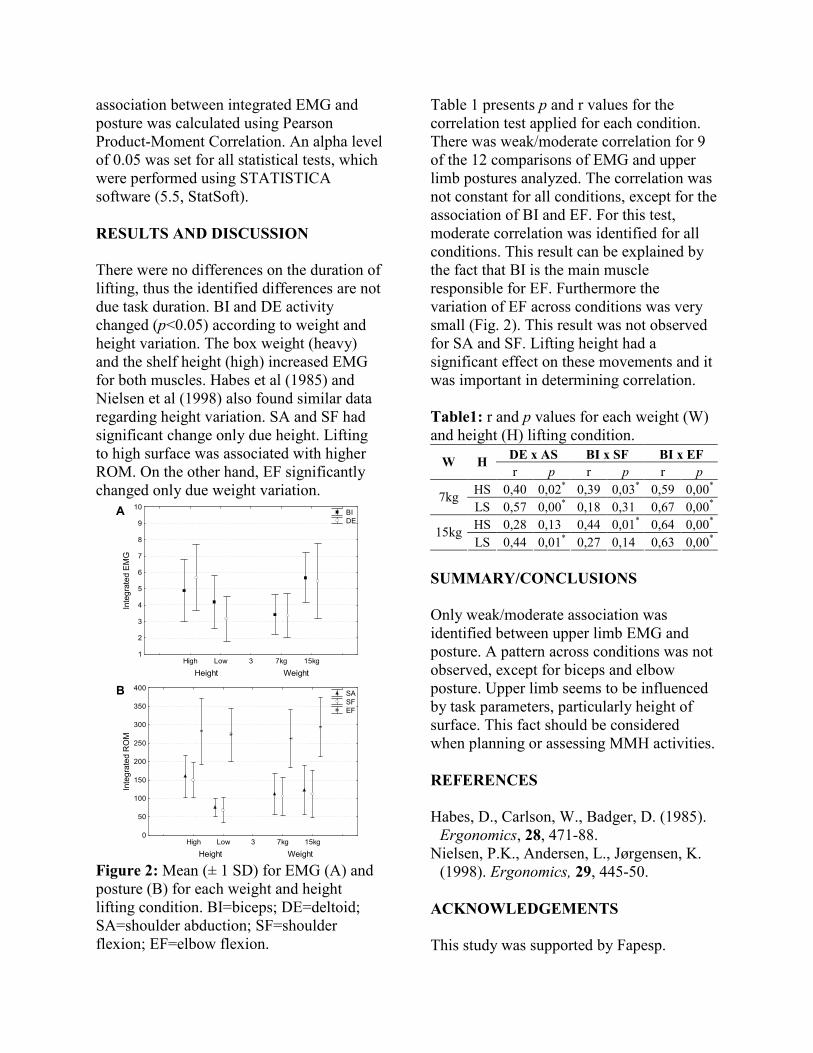
association between integrated EMG and
posture was calculated using Pearson
Product-Moment Correlation. An alpha level
of 0.05 was set for all statistical tests, which
were performed using STATISTICA
software (5.5, StatSoft).
RESULTS AND DISCUSSION
There were no differences on the duration of
lifting, thus the identified differences are not
due task duration. BI and DE activity
changed (p<0.05) according to weight and
height variation. The box weight (heavy)
and the shelf height (high) increased EMG
for both muscles. Habes et al (1985) and
Nielsen et al (1998) also found similar data
regarding height variation. SA and SF had
significant change only due height. Lifting
to high surface was associated with higher
ROM. On the other hand, EF significantly
changed only due weight variation.
High Low 3 7kg 15kg
Height Weight
1
2
3
4
5
6
7
8
9
10
Integrated EMG
BI
DE
High Low 3 7kg 15kg
Height Weight
0
50
100
150
200
250
300
350
400
Integrated ROM
SA
SF
EF
Figure 2: Mean (± 1 SD) for EMG (A) and
posture (B) for each weight and height
lifting condition. BI=biceps; DE=deltoid;
SA=shoulder abduction; SF=shoulder
flexion; EF=elbow flexion.
Table 1 presents p and r values for the
correlation test applied for each condition.
There was weak/moderate correlation for 9
of the 12 comparisons of EMG and upper
limb postures analyzed. The correlation was
not constant for all conditions, except for the
association of BI and EF. For this test,
moderate correlation was identified for all
conditions. This result can be explained by
the fact that BI is the main muscle
responsible for EF. Furthermore the
variation of EF across conditions was very
small (Fig. 2). This result was not observed
for SA and SF. Lifting height had a
significant effect on these movements and it
was important in determining correlation.
Table1: r and p values for each weight (W)
and height (H) lifting condition.
DE x AS BI x SF BI x EF W H
r p r p r p
HS 0,40 0,02* 0,39 0,03
* 0,59 0,00
*
7kg LS 0,57 0,00
* 0,18 0,31 0,67 0,00
*
HS 0,28 0,13 0,44 0,01* 0,64 0,00
*
15kg LS 0,44 0,01
* 0,27 0,14 0,63 0,00
*
SUMMARY/CONCLUSIONS
Only weak/moderate association was
identified between upper limb EMG and
posture. A pattern across conditions was not
observed, except for biceps and elbow
posture. Upper limb seems to be influenced
by task parameters, particularly height of
surface. This fact should be considered
when planning or assessing MMH activities.
REFERENCES
Habes, D., Carlson, W., Badger, D. (1985).
Ergonomics, 28, 471-88.
Nielsen, P.K., Andersen, L., Jørgensen, K.
(1998). Ergonomics, 29, 445-50.
ACKNOWLEDGEMENTS
This study was supported by Fapesp.
A
B
ANEXO IX
CARNAZ L, OLIVEIRA AB, SATO TO, COURY HJCG, HANSON, G-Å. Effects of
sensor, trial and knee joint variables in electrogoniometric gait recordings. Artigo
aceito para publicação na REVISTA BRASILEIRA DE FISIOTERAPIA, 12.6, 2008.
171
São Carlos, 18 de Setembro de 2008. Prezados(as) Senhores(as) Informamos V.Sas. que o manuscrito nº S-241 (224/2007), título “Effects of sensor, trial and knee joint variables in electrogoniometric gait recordings” de: Letícia Carnaz, Ana Beatriz de Oliveira, Tatiana de Oliveira Sato, Helenice Jane Cote Gil Coury e Gert-Ake Hanson, foi aceito para publicação na Revista Brasileira de Fisioterapia em 10/09/2008 para o volume 12.6.
Atenciosamente.
Tania de Fatima Salvini Revista Brasileira de Fisioterapia
Editora
171
EFFECTS OF SENSOR, TRIAL AND KNEE JOINT VARIABLES IN
ELECTROGONIOMETRIC GAIT RECORDINGS
EFEITOS DAS VARIÁVEIS SENSOR, COLETA E ARTICULAÇÃO DO JOELHO NOS
REGISTROS ELETROGONIOMÉTRICOS DA MARCHA
LETÍCIA CARNAZ1, ANA BEATRIZ DE OLIVEIRA1, TATIANA DE OLIVEIRA SATO1,
HELENICE JANE COTE GIL COURY1, GERT-AKE HANSON2
1 Departamento de Fisioterapia, Universidade Federal de São Carlos, São Carlos, SP - Brasil
2 Departamento de Medicina Ocupacional e Ambiental, Universidade –Hospital, Lund, Suécia
Título curto: Fontes de variação nos registros eletrogoniométricos da marcha.
Running title: Sources of variation in electrogoniometric gait recordings.
Palavras chave: movimento, erro de medida, marcha.
Key words: movement, measurement error, gait.
Correspondence to: Helenice Jane Cote Gil Coury
Departamento de Fisioterapia, UFSCar
Rodovia Washington Luis, Km 235, CP 676, CEP 13565-905, São Carlos-SP
e-mail: [email protected]
172
Abstract
Introduction: Different sources of variation, such as electrogoniometer characteristics and
procedures, can affect the accuracy and precision of movement measurements during gait.
Objective: To quantify the variations and compare the effects produced by different sources of
variation in electrogoniometric gait recordings: the sensors, procedures (consecutive trials)
and knee joint. Method: Knee flexion/extension and valgus/varus movements were recorded
during treadmill walking. The recordings were partitioned into strides and normalized in time
using a routine developed in MatLab. Mean curves for the knee during gait were derived from
50 strides, and seven conditions were evaluated: one comparing pairs of sensors; two
comparing pairs of different trials (including variations due to sensors); and four comparing
the right and left knees (including variations due to sensors and trials). Mean standard
deviations of the differences were calculated. To estimate the variations relating to the trial
and knee joint, the compound standard deviations were transformed into variances and split
into their components. Results: The variation introduced by pairs of sensors in the same
model applied in one trial was smaller than the variation introduced by the same sensor used
in two consecutive trials. Furthermore, the variation introduced by the difference between the
right and left knees was greater than the variation introduced by the difference between
sensors (A and B) and trials (1 and 2). Conclusions: It is therefore preferable to use different
sensors in the same data recording (simultaneous) than use the same sensor in two different
recordings (consecutive).
173
Resumo
Contextualização: Diferentes fontes de variação, tais como características do
eletrogoniômetro e procedimentos, podem afetar a acurácia e precisão das medidas do
movimento durante a marcha. Objetivo: Quantificar a variação e comparar o efeito das
diferentes fontes de variação nos registros eletrogoniométricos da marcha: os sensores, os
procedimentos (coletas consecutivas) e a articulação do joelho. Método: Movimentos de
flexo-extensão e valgo-varo do joelho foram registrados durante a caminhada na esteira. Os
registros foram divididos em passadas e normalizados no tempo usando uma rotina
desenvolvida em MatLab. As curvas médias do joelho durante a marcha foram derivadas de
50 passadas, e sete condições foram avaliadas: uma para comparar dois sensores; duas para
comparar duas diferentes coletas (incluindo a variação do sensor), e quatro para comparar os
joelhos direito e esquerdo (incluindo a variação dos sensores e coletas). Os desvios padrão
médios das diferenças foram calculados. Para estimar as variações devido as coletas e a
articulação do joelho, os desvios padrão compostos foram transformados em variâncias e seus
componentes isolados. Resultados: A variação introduzida por dois sensores do mesmo
modelo aplicados em uma coleta foi menor do que a variação introduzida pelo mesmo sensor
usado em duas coletas consecutivas. Ainda, a variação introduzida pela diferença entre os
joelhos direito e esquerdo foi maior do que a variação introduzida pela diferença entre os
sensores (A e B) e as coletas (1 e 2). Conclusões: Assim, é preferível usar diferentes sensores
na mesma coleta de dados (simultânea) do que usar o mesmo sensor em dois registros
diferentes (consecutivos).
174
Introduction
Physiotherapists require quantitative, reliable and precise methods for evaluating
impairments, disabilities and handicaps and also for determining rehabilitation outcomes.
Because of the feasibility of flexible electrogoniometers, they have been used for recording
functional movements1-6. However, different sources of variation can affect the accuracy and
precision of the measurements. Such as the different characteristics of particular goniometers,
misalignment of the endblocks relative to the planes of movement, limited reproducibility of
the application of the endblocks, vague definition that might lead to imprecise recordings of
the reference position7-9, and differences between bilateral joints, such as the knees during
normal gait10,11.
Several studies have analyzed the different sources of variation which can affect wrist
and forearm electrogoniometric recordings7,12. Nevertheless, few studies have applied the
flexible electrogoniometer for evaluating gait, and none of them has evaluated the sources of
variation in this application.
Thus, to estimate the variation coming from several sources on electrogoniometric gait
recordings, particularly sensors, procedures and knee joints, different ways for isolating each
effect should be considered. One possibility for determining the effect of the sensors would be
to record the same knee, using different sensors in the same trial (e.g. two goniometers of
similar model, attached to each other by double-sided adhesive tape), i.e. simultaneous
measurements. To evaluate the difference between right and left knee movements, data
collection could be simultaneous using different sensors, or consecutive using the same
sensor. Thus, it would be possible to decide whether it is preferable to use different sensors in
the same data recording (simultaneous) or the same sensor in two different recordings
(consecutive), in order to achieve the smallest variation.
175
Thus, the objective of this study was to quantify the variations and compare the effects
produced by different sources of variation in electrogoniometric gait recordings: the sensors,
procedures (trials) and knee joint.
Methods
Subjects - Eight healthy males (age 21.6 ± 3.5 years; height 170 ± 3 cm; weight 66.4
± 7.0 kg) participated in the study. They did not present any musculoskeletal injuries, balance
disorders or symptoms. Subjects presenting any lower-limb postural deviation were excluded
in order to ensure that only subjects presenting symmetrical lower limbs were included.
Furthermore, since electrogoniometer recordings are anthropometry-dependent, the subjects
were selected within the height range of 165-175 cm. Sixty healthy males were evaluated to
select the eight subjects who were finally included, since it was very difficult to find subjects
with our strict inclusion criteria. This study was developed with approval from the Federal
University of São Carlos Ethics Committee for Human Investigation (Protocol 035/04) and
the subjects signed a consent form.
Equipment - Knee flexion/extension (F/E) and valgus/varus (V/V) movements were
recorded using two biaxial flexible electrogoniometers (M110, Biometrics Ltd., Gwent, UK)
and an acquisition unit (Data Logger 1001, Biometrics Ltd.). The two sensors were named A
and B. The sampling frequency was 1000 Hz.
Procedures – For two of the three trials, bilateral recordings of F/E and V/V were
performed; one of the goniometers (A or B) was fixed to the shaved lateral face of each knee
with the subjects standing in anatomical position. The center of the inter-joint line was taken
to be the common reference for the leg and thigh. The center of the sensor spring was
coincident with this line, and the endblocks were aligned over the axis of the thigh and leg,
176
with the greater trochanter and lateral malleolus as the reference points (Figure 1). To avoid
kinematic crosstalk, the aim in the alignment was to take the “true” flexion axis13. A single
physiotherapist was responsible for attaching the sensors. The area to receive the sensors was
marked out using a dermographic pen, to allow precise reproduction of the attachments in the
subsequent trials. The knee angles when standing were taken to be the reference position and
the recordings of these angles were subtracted from the subsequent gait recordings. For the
third trial, the goniometers were fixed to one another using double-sided adhesive tape
(Figure 1) and were attached to the right knee.
Insert Figure 1 about here
Three gait trials were performed on each subject. The first trial was done with sensor
A on the left knee (recording AL1) and sensor B on the right knee (BR1); the second trial was
done with sensor A on the right knee (AR2) and sensor B on the left knee (BL2); and the third
trial was done with both sensors (A and B) on the right knee (AR3 and BR3, respectively).
The sequence of the trials was randomized between the subjects and there was a five-minute
break between trials. For each trial, after recording the reference position, the subjects were
gradually familiarized with a treadmill, walking at 5.0 km/h, and knee movements were
recorded for 90s.
A pilot test had previously been conduced to investigate the effects from varying the
positioning of the goniometer. The same trained physiotherapist performed palpation and
attached the goniometer to the subject’s knee twice. The maximum variation due to sensor
replacement was 1.1° for F/E and 3.6° for V/V movements. Schwartz et al.14 evaluated a
177
similar effect and, although these authors did not show these results explicitly, it can be
inferred from their graphs that they found errors ≤ 4° for F/E and ≤ 2° for V/V movements.
Data Analysis – Data processing was performed using a routine developed in MatLab
version 6.5 (MathWorks Inc., Natick, MA, USA). Through this routine, all the data were
filtered using a low-pass, second-order, zero-lag Butterworth filter at 10 Hz. The recording
was partitioned into strides, which were defined as the time between two consecutive heel
strikes. The heel strike was taken to be the first minimum after a maximum flexion15. The
central 50 strides (corresponding to about 60s of recording) for each knee were selected, and
were normalized in time for both F/E and V/V, represented by 101 data points (one for each
percent of the stride). Mean F/E and V/V curves were derived from these 50 strides, and were
used for the subsequent analysis.
From these data, seven differences were calculated: one comparing sensors A and B
(AR3-BR3); two measurements comparing trials 1 and 2 (including the variation due to the
sensor: BR1-AR2 and AL1-BL2); and four measurements comparing the right and left knees
(including the variation due to the sensor: BR1-AL1 and AR2-BL2; and the variation due to
the trial: AR2-AL1 and BR1-BL2).
For each comparison described above, the mean value of the difference between the
two curves for the 101 points was calculated. This value was taken to be the offset and was
subtracted from each of the 101 points on one curve. Hence, any systematic shift in F/E and
V/V, between the two recordings compared, was disregarded.
After offset subtraction, the mean standard deviation (SD) between the two knee
curves was calculated, to obtain a summary measurement of the difference, using the formula
below16.
178
21
1
2
⎟⎟⎟⎟
⎠
⎞
⎜⎜⎜⎜
⎝
⎛
=∑=
k
SDSD
k
ii
mean
The standard deviations obtained were used to estimate the size of the different
sources of variation. Since the variations due to sensor, trial and knee joint can be regarded as
independent, their contributions to the compound variations are cumulative, provided that the
variations are expressed as variances. Thus, a hierarchic analysis of variance was applied; the
SDs were squared, i.e. transformed into variances, and calculated for each subject and
movement (F/E and V/V), separately. The variance due to sensor was directly extracted from
condition AR3-BR3; the variance due to trial was derived by subtracting the variance due to
sensor, from the variance due to trial plus sensor (BR1-AR2 and AL1-BL2), and the mean
value of these two estimates was used; the variance due to knee joint was derived by
subtracting the variance due to sensor, from the variance due to knee joint plus sensor (BR1-
AL1 and AR2-BL2), and by subtracting the variance due to trial, from the variance due to
knee joint plus trial (AR2-AL1 and BR1-BL2), the mean value of these four estimates was
used. The SDs (i.e. the square root of the variances) were then calculated and presented in
tables and figures (cf. Figure 2 and 3). Since the data, depicted in Figure 4, did not present
normal distribution, the Kruskal-Wallis test was run to evaluate the differences in F/E and
V/V related to the sensor, trial and knee joint conditions. The post-hoc Dunn test was applied
when statistical differences were identified.
instant. i for the valuedeviation standard theis SD and curve, theup make that 101)(k instants all across values
deviation standardpoint -by-point individual theofmean theis SD where
i
mean
th=
179
Results
The eight subjects and the three trials presented on average a peak amplitude of 53.3°
(SD 1.5°) for F/E, with a peak flexion of 56.2° (1.6°) and peak extension of 2.9° (1.3°). The
V/V movements were smaller: a peak amplitude of 12.0° (1.7°), peak valgus of 9.5° (2.7°)
and peak varus of -2.5° (1.5°). The flexion and valgus peaks were reached during the swing
phase and the extension and varus peaks occurred during the stance phase.
Figures 2 and 3 show the difference curves, for each subject and comparison. For all
comparisons, the variation was generally higher for V/V than for F/E. For both F/E and V/V,
and for all comparisons, the differences were more pronounced during the swing phase, i.e.
60–100% of stride. Sensor comparisons (AR3-BR3) for both F/E and V/V movements
presented smaller deviations from zero values and the knee curves (plus sensor and plus trial)
showed larger deviations from zero, especially for V/V movements. Some subjects showed a
difference between the knee joints, which, for all combinations of knee joint plus trial and
knee joint plus sensor, was obvious in the graphs. For example, Fig. 3 shows that, at the
beginning of the swing phase (at about 70% of stride), the valgus angle for the right knee is
about 15° greater than for the left knee for subject 7. A difference of similar size, but in the
reverse direction and somewhat later in the swing phase, can be seen for subject 1.
Insert Figures 2 and 3 about here
All sources of variation, presented as SDs, are plotted in Figure 4. In general, the
sensors represented the smallest source of variation for both F/E and V/V. Variation due to
the trial showed values with greater fluctuation than did the variation due to the sensor. For
F/E, these variations were roughly at the same level, while for V/V, the variation due to the
trial was lower than the variation due to the sensor, for most of the subjects. As expected, the
180
variation due to the trial plus the sensor was higher than the variation due to either the sensor
or the trial alone, except for a few instances caused by random effects. The variations due to
knee joints presented higher values and were generally considerably higher for V/V than for
F/E. Of course, the combined variations (knee joint plus sensor and knee joint plus trial) were
greater than the knee joint variations alone. However, these differences were small, especially
for V/V, i.e. the relative influence of sensor and trial on the recording of the knee joint
variation was small.
Insert Figure 4 about here
Table 1 shows that, for F/E, the variation due to the sensor was smaller than the
variation due to the trial (statistically non-significant), while the variation due to the knee joint
was greater than the variation due to the trial, and significantly greater than the variation due
to the sensor (P<0.05). For V/V, the variation due to the trial showed the smallest value and
the variation due to the knee joint was significantly greater than the variation due to the sensor
(P<0.05) and the trial (P<0.05).
Insert Table 1 about here
Discussion
The knee joint variable had more influence in determining variation in the results than
did the sensor and trial variables, for most of the subjects. Furthermore, the variation was
much greater between the knee joints for V/V than for F/E movements. For all sources, the
variation was generally greater for the swing phase than for the stance phase.
Individual sensors of the same model can produce different outcomes in a jig, where
no other source of variation that would usually be present in functional situations can occur.
Shiratsu and Coury 9 reported up to 3° difference between individual sensors (Biometrics Ltd.;
XM150B) attached to a jig that reproduced full-range amplitudes for F/E movements and
181
deviations. In the present study, the variations (in SD) introduced by the sensors ranged from
0.48° to 0.76°. Considering the different measurements for characterizing the differences
between sensors, this is consistent with the above mentioned study, thus indicating that this
source has a small effect on knee joint measurements during walking. However, some
crosstalk effect from the sensors can be expected.
Crosstalk, i.e. erroneous recordings of V/V movements during F/E movements, and
vice versa, can occur for three reasons: (1) mechanical deviations in the geometrical
properties of the goniometer sensing elements; (2) misalignment of one of the endblocks,
resulting in axial rotation of the goniometer; or (3) mounting the goniometer outside of the
principal plane of the movement. The first type of crosstalk is an inherent property
(fingerprint) of the particular goniometer and is of significance only for high F/E angles. This
error presumably contributes towards the difference between the sensors observed in the V/V
movements during high flexion movements, i.e. during the swing phase. The second type of
crosstalk will occur if the endblock on the shank is not aligned with the sagittal plane. In this
case, pure F/E movements will cause an erroneous recording of V/V that is proportional to the
F/E amplitude7. Prior awareness of this potential source of error was the reason for the strict
and careful attachment of the endblocks ensured in the present study. However, for
comparisons between the knee joints, the effect of sensor positioning cannot be disregarded.
The third source of crosstalk will occur if both endblocks are misaligned in relation to the
sagittal plane. If the goniometer were to be placed in the frontal plane, i.e. at the front or back
of the knee (although in reality this position is not practically possible), the F/E angle would
appear in the channel that would record the V/V angle if the goniometer were to be placed in
the sagittal plane. Hence, placing the goniometers in any plane that is intermediate between
the sagittal and frontal planes will result in crosstalk. For example, to obtain an erroneous
182
recording of 12° of V/V with an F/E range of 56°, a misalignment of 26° of one of the
endblocks is required12.
Another source of variation is the occurrence of soft tissue artifacts due to the relative
displacement between the electrogoniometer attachments and the anatomical reference points
that are used to represent the joint angle in the static position8,17,18. Moreover, any angular
differences between the endblocks will be compensated by recording a reference position (and
subtracting the F/E and V/V angles from the subsequent recordings), as long as these angular
differences do not change. One possibility for reducing the influence of local changes is to
perform “spatial averaging” by applying a plate or ruler over the thigh and the shank8.
The repeatability of knee movements is clearly dependent on joint stability and
adaptability19. Moreover, as the V/V range of movement is small20-23, it can be strongly
influenced by individual anatomical and functional characteristics24,25. Individual
characteristics, which were analyzed here as knee joint variation, introduced the highest
source of variation. However, these results must be carefully interpreted, as this knee joint
variation is close to the variation due to the positioning of the goniometer (as presented in the
Methods section). Other different individual characteristics are considered to have an
influence on gait kinematics. Among these are age and gender26-30, which were controlled for
in the present study. Furthermore, lateral dominance has been considered to have some
influence on gait kinematics, although this issue still remains controversial27,29,30.
Finally, this manuscript has provided guidelines to identify the sources of variation in
electrogoniometric recordings of knee during gait, and suggested methodological alternatives
to isolate and correct these sources of variation.
183
Conclusions
The variation introduced by two separate sensors of the same model applied in one
trial was smaller than the variation introduced by recording movements in two consecutive
trials using the same sensor, with regard to recording knee movements during walking.
Nevertheless, the variation introduced by the difference between knee joints was greater than
the variations promoted by sensors and trials, and this difference was within the variation due
to sensor repositioning. Thus, it is preferable to use different sensors in the same data
recording (simultaneous) than use the same sensor in two different recordings (consecutive).
Acknowledgement
FAPESP process numbers: 05/59349-6; 05/53804-3; 04/15579-5; 04/07207-0.
References
1. Smutz P, Serina E, Rempel D. A system for evaluating the effect of keyboard design on
force, posture, comfort, and productivity. Ergonomics. 1994; 37: 1649-1660.
2. Åkesson I, Hansson G-Å, Balogh I, Moritz U, Skerfving S. Quantifying work load in neck,
shoulders and wrists in female dentists. Int Arch Occup Environ Health. 1997; 69: 461-474.
3. Rowe PJ, Myles CM, Walker C, Nutton R. Knee joint kinematics in gait and other
functional activities measured using flexible electrogoniometry: how much knee motion is
sufficient for normal daily life? Gait Posture. 2000; 12: 143-155.
4. Hansson G-Å, Balogh I, Byström JU, Ohlsson K, Nordander C, Asterland P, Sjölander S,
Rylander L, Winkel J, Skerfving S. Questionnaire versus direct technical measurements in
assessing postures and movements of the head, upper back, arms and hands. Scand J Work
Environ Health. 2001; 27: 30-40.
184
5. Juul-Kristensen B, Hansson G-Å, Fallentin N, Andersen JH, Ekdahl C. Assessment of work
postures and movements using a video-based observation method and direct technical
measurements. Appl Ergon. 2001; 32: 517-524.
6. Arvidsson I, Hansson G-Å, Mathiassen SE, Skerfving S. Neck postures in air traffic
controllers with and without neck/shoulder disorders. Appl Ergon. 2008; 39: 255-260.
7. Hansson G-Å, Balogh I, Ohlsson K, Rylander L, Skerfving S. Goniometer measurement
and computer analysis of wrist angles and movements applied to occupational repetitive work.
J Electromyogr Kinesiol. 1996; 6: 23-35.
8. Rowe PJ, Myles CM, Hillmann SJ, Hazlewood ME. Validation of flexible
electrogoniometry as a measure of joint kinematics. Physiotherapy. 2001; 87: 479-88.
9. Shiratsu A, Coury HJCG. Reliability and accuracy of different sensors of a flexible
electrogoniometer. Clin Biomech. 2003; 18: 682-684.
10. Hannah RE, Morrison JB, Chapman AE. Kinematic symmetry of the lower limbs. Arch
Phys Med Rehabil. 1984; 65: 155-158.
11. Maupas E, Paysant J, Datie AM, Martinet N, André JM. Functional asymmetries of the
lower limbs. A comparison between clinical assessment of laterality, isokinetic evaluation and
electrogoniometric monitoring of knees during walking. Gait Posture. 2002; 16: 304-312.
12. Hansson G-Å, Balogh I, Ohlsson K, Skerfving S. Measurements of wrist and forearm
positions and movements: effect of, and compensation for, goniometer crosstalk. J
Electromyogr Kinesiol. 2004; 14: 355-67.
185
13. Coury HJCG, Brasileiro JS, Salvini TF, Poletto PR, Carnaz L, Hansson G- Å. Change in
knee kinematics during gait after eccentric isokinetic training for quadriceps in subjects
submitted to anterior cruciate ligament reconstruction. Gait Posture. 2006; 24: 370-374.
14. Schwartz H, Trost JP, Wervey RA. Measurement and management of errors in
quantitative gait data. Gait Posture. 2004; 20: 196-203.
15. Winter DA. Kinematic and kinetic pattern in human gait: variability and compensating
effects. Hum Mov Sci. 1984; 3: 51-76.
16. James CR. Considerations of movement variability in biomechanics research. In: Stergiou
N. Innovative analysis of human movement. 1ª ed. Champaign: Human Kinetics; 2004. p. 29-
62.
17. Isacson J, Gransberg L, Knutsson E. Three-dimensional electrogoniometric gait recording.
J Biomech. 1986; 8:627-635.
18. Ishii Y, Terajima K, Terashima S, Koga Y. Three-dimensional kinematics of the human
knee with intracortical pin fixation. Clin Orthop. 1997; 343: 144-150.
19. Heiderscheit BC. Movement variability as a clinical measure for locomotion. J Appl
Biomech. 2000; 16: 419-27.
20. Chao EY, Laughman RK, Schneider E, Stauffer RN. Normative data of knee joint motion
and ground reaction forces in adult level walking. J Biomech. 1983; 16: 219-233.
21. Xue LM, Bo L, Bo Deng, Shi MZ. Normal six-degree-of-freedom motions of knee joint
during level walking. J Biomech Eng. 1996; 118: 258-261.
22. Reinschmidt C, van den Bogert AJ, Lundberg A, Nigg BM, Murphy N, Stacoff A, Stano
A. Tibiofemoral and tibiocalcaneal motion during walking: external vs. skeletal markers. Gait
Posture. 1997; 6: 98-109.
186
23. Benoit D, Ramse, DK, Lamontagne M, Xu L, Wretenberg P, Renstrom P. In vivo knee
kinematics during gait reveals new rotation profiles and smaller translations. Clin Orthop
Relat Res. 2007; 454: 81-88.
24. Ramsey DK, Wretenberg PF. Biomechanics of the knee: methodological considerations in
the vivo kinematic analysis of the tibiofemoral and patellofemoral joint. Clin Biomech. 1999;
14: 595-611.
25. Claiborne TL, Armstrong CW, Gandhi V, Pincivero DM. Relationship between hip and
knee strength and knee valgus during a single leg squat. J Appl Biomech. 2006; 22: 41-50.
26. Kettelkamp DB, Johnson RJ, Smidt GL, Chao EYS, Walker M. An electrogoniometric
study of knee motion in normal gait. J Bone Joint Surg. 1970; 52: 775-790.
27. Gundersen LA, Valle DR, Barr AE, Danoff JV, Stanhope SJ, Snyder-Mackler L. Bilateral
analysis of the knee and ankle during gait: an examination of relationship between lateral
dominance and symmetry. Phys Ther. 1989; 69: 640-50.
28. Benedetti MG, Catani F, Leardini A, Pignotti E, Giannini S. Data management in gait
analysis for clinical applications. Clin Biomech. 1998; 13: 204-215.
29. Maupas E, Paysant J, Martinet N, André JM. Asymmetry leg activity in healthy subjects
during walking, detected by electrogoniometry. Clin Biomech. 1999; 14: 403-411.
30. Sadegui H, Allard P, Prince F, Labelle H. Symmetry and limb dominance in able-bodied
gait: a review. Gait Posture. 2000; 12: 34-45.
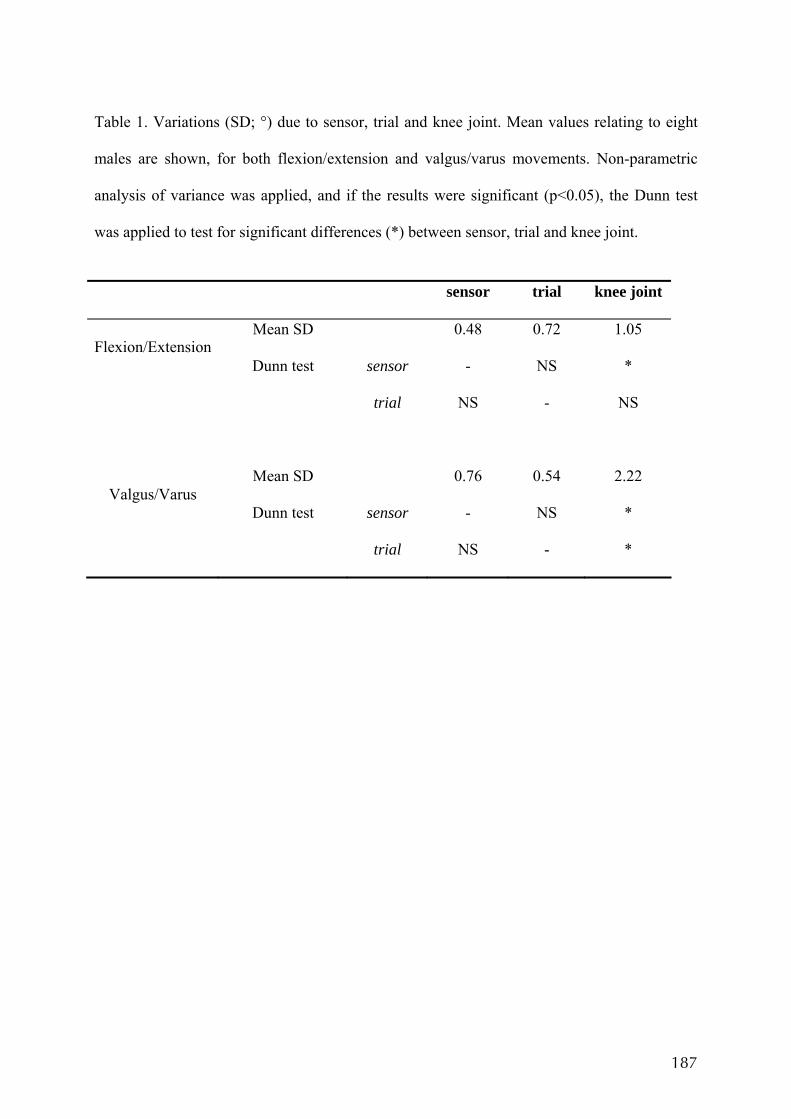
187
Table 1. Variations (SD; °) due to sensor, trial and knee joint. Mean values relating to eight
males are shown, for both flexion/extension and valgus/varus movements. Non-parametric
analysis of variance was applied, and if the results were significant (p<0.05), the Dunn test
was applied to test for significant differences (*) between sensor, trial and knee joint.
sensor trial knee joint
Mean SD 0.48 0.72 1.05 Flexion/Extension
Dunn test sensor - NS *
trial NS - NS
Mean SD 0.76 0.54 2.22 Valgus/Varus
Dunn test sensor - NS *
trial NS - *
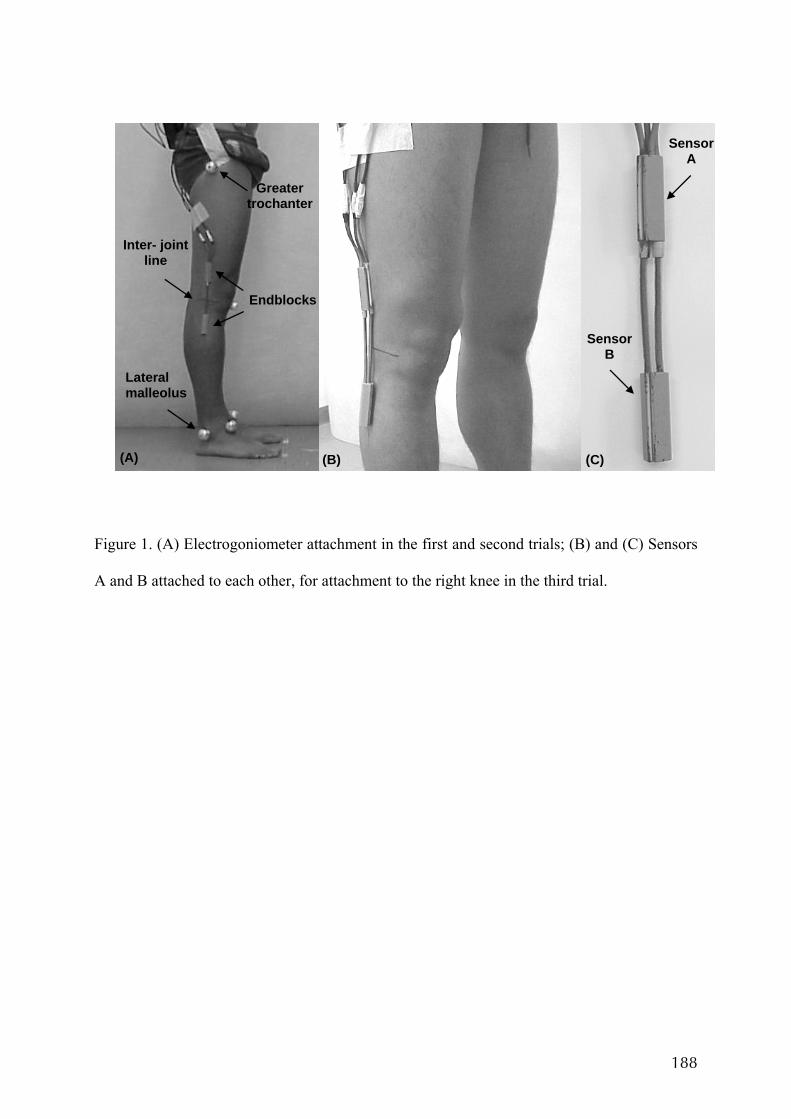
188
Figure 1. (A) Electrogoniometer attachment in the first and second trials; (B) and (C) Sensors
A and B attached to each other, for attachment to the right knee in the third trial.
Lateral malleolus
Greater trochanter
Endblocks
Inter- joint line
(A) (B) (C)
Sensor A
Sensor B
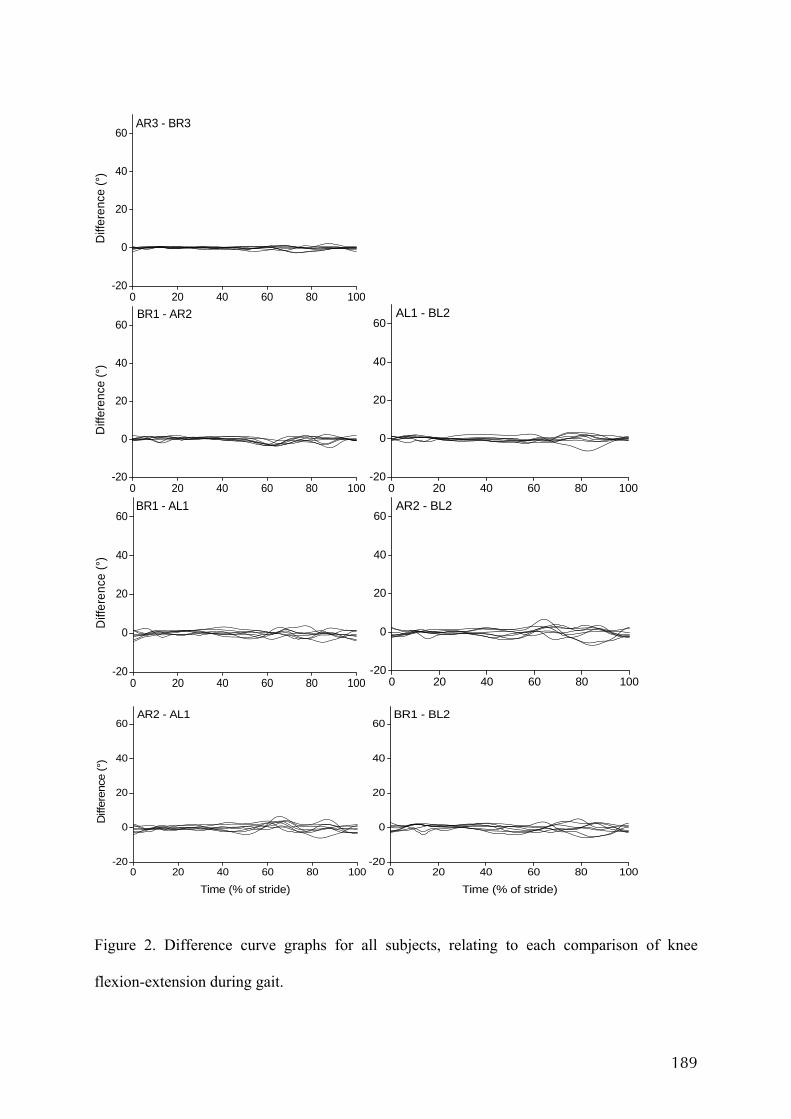
189
0 20 40 60 80 100-20
0
20
40
60AR3 - BR3
Diff
eren
ce (°
)
0 20 40 60 80 100-20
0
20
40
60BR1 - AR2
Diff
eren
ce (°
)
0 20 40 60 80 100-20
0
20
40
60AL1 - BL2
0 20 40 60 80 100-20
0
20
40
60BR1 - AL1
Diff
eren
ce (°
)
0 20 40 60 80 100-20
0
20
40
60AR2 - BL2
0 20 40 60 80 100-20
0
20
40
60AR2 - AL1
Diff
eren
ce (°
)
Time (% of stride)0 20 40 60 80 100
-20
0
20
40
60BR1 - BL2
Time (% of stride)
Figure 2. Difference curve graphs for all subjects, relating to each comparison of knee
flexion-extension during gait.
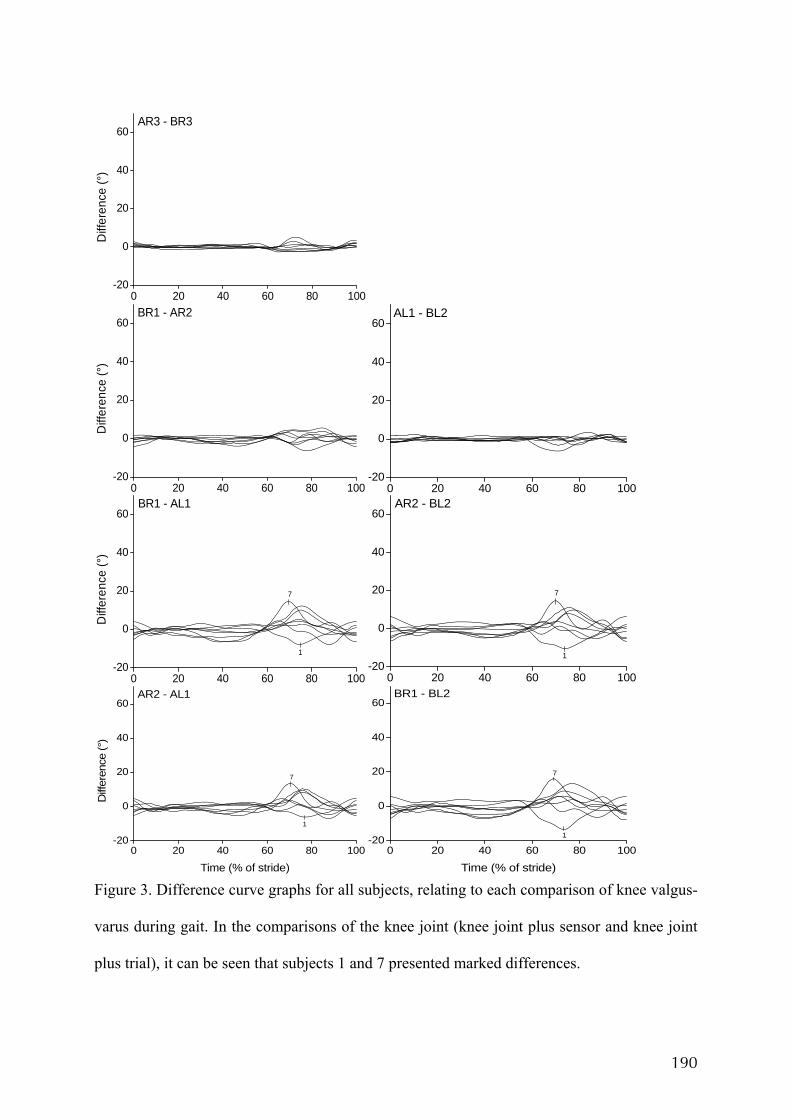
190
0 20 40 60 80 100-20
0
20
40
60AR3 - BR3
Diff
eren
ce (°
)
0 20 40 60 80 100-20
0
20
40
60BR1 - AR2
Diff
eren
ce (°
)
0 20 40 60 80 100-20
0
20
40
60AL1 - BL2
0 20 40 60 80 100-20
0
20
40
60
1
7
BR1 - AL1
Diff
eren
ce (°
)
0 20 40 60 80 100-20
0
20
40
60
1
7
AR2 - BL2
0 20 40 60 80 100-20
0
20
40
60
1
7
AR2 - AL1
Diff
eren
ce (°
)
Time (% of stride)0 20 40 60 80 100
-20
0
20
40
60
1
7
BR1 - BL2
Time (% of stride) Figure 3. Difference curve graphs for all subjects, relating to each comparison of knee valgus-
varus during gait. In the comparisons of the knee joint (knee joint plus sensor and knee joint
plus trial), it can be seen that subjects 1 and 7 presented marked differences.
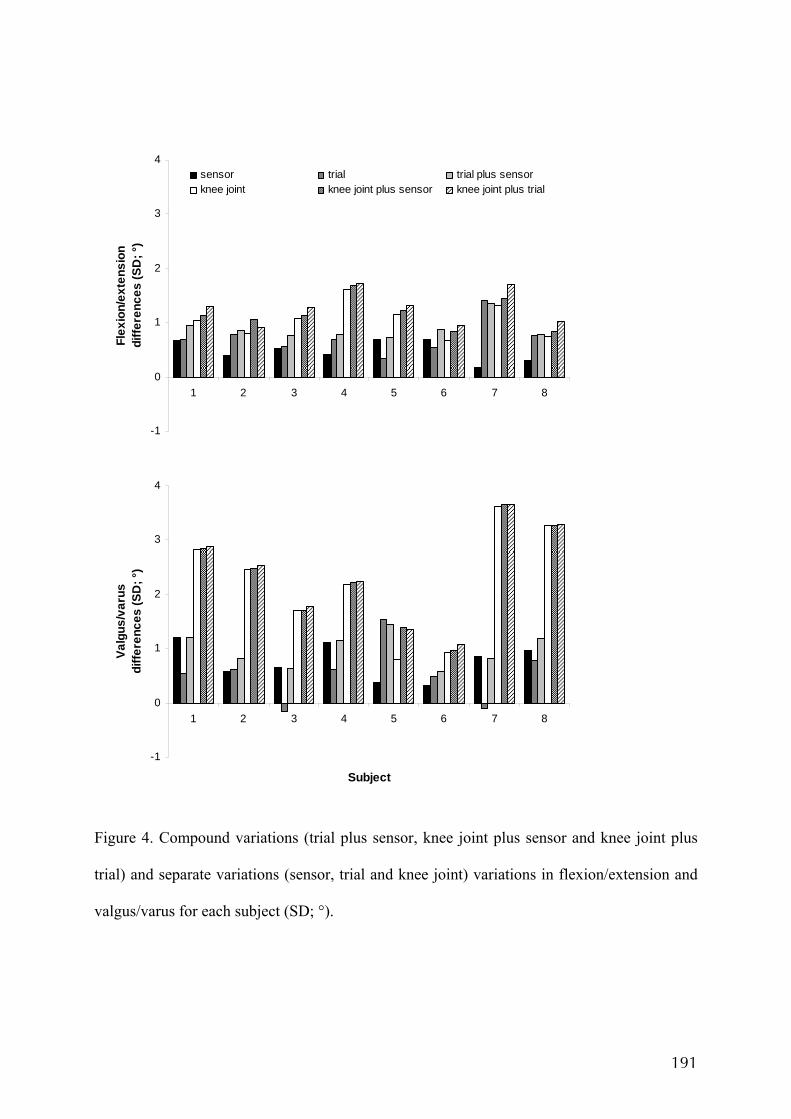
191
Figure 4. Compound variations (trial plus sensor, knee joint plus sensor and knee joint plus
trial) and separate variations (sensor, trial and knee joint) variations in flexion/extension and
valgus/varus for each subject (SD; °).
-1
0
1
2
3
4
1 2 3 4 5 6 7 8
Flex
ion/
exte
nsio
n di
ffere
nces
(SD
; °)
sensor trial trial plus sensorknee joint knee joint plus sensor knee joint plus trial
-1
0
1
2
3
4
1 2 3 4 5 6 7 8
Subject
Valg
us/v
arus
di
ffere
nces
(SD
; °)
ANEXO X
OLIVEIRA AB, VINGÅRD E, COURY HJCG. Sintomas musculoesqueléticos e
fatores de risco físicos e psicossociais entre funcionários administrativos do setor
público. Artigo apresentado no XV CONGRESSO BRASILEIRO DE ERGONOMIA,
Porto Seguro, Bahia, 2008.
194
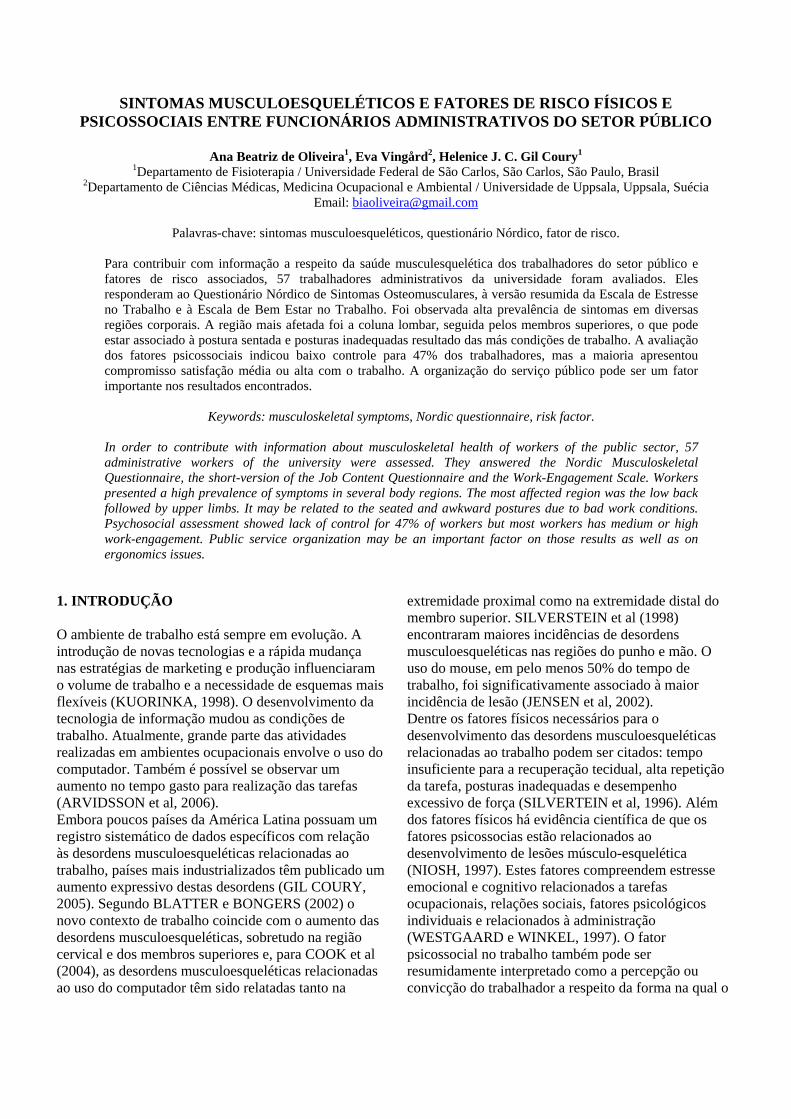
SINTOMAS MUSCULOESQUELÉTICOS E FATORES DE RISCO FÍSICOS E PSICOSSOCIAIS ENTRE FUNCIONÁRIOS ADMINISTRATIVOS DO SETOR PÚBLICO
Ana Beatriz de Oliveira1, Eva Vingård2, Helenice J. C. Gil Coury1
1Departamento de Fisioterapia / Universidade Federal de São Carlos, São Carlos, São Paulo, Brasil 2Departamento de Ciências Médicas, Medicina Ocupacional e Ambiental / Universidade de Uppsala, Uppsala, Suécia
Email: [email protected]
Palavras-chave: sintomas musculoesqueléticos, questionário Nórdico, fator de risco.
Para contribuir com informação a respeito da saúde musculesquelética dos trabalhadores do setor público e fatores de risco associados, 57 trabalhadores administrativos da universidade foram avaliados. Eles responderam ao Questionário Nórdico de Sintomas Osteomusculares, à versão resumida da Escala de Estresse no Trabalho e à Escala de Bem Estar no Trabalho. Foi observada alta prevalência de sintomas em diversas regiões corporais. A região mais afetada foi a coluna lombar, seguida pelos membros superiores, o que pode estar associado à postura sentada e posturas inadequadas resultado das más condições de trabalho. A avaliação dos fatores psicossociais indicou baixo controle para 47% dos trabalhadores, mas a maioria apresentou compromisso satisfação média ou alta com o trabalho. A organização do serviço público pode ser um fator importante nos resultados encontrados.
Keywords: musculoskeletal symptoms, Nordic questionnaire, risk factor.
In order to contribute with information about musculoskeletal health of workers of the public sector, 57 administrative workers of the university were assessed. They answered the Nordic Musculoskeletal Questionnaire, the short-version of the Job Content Questionnaire and the Work-Engagement Scale. Workers presented a high prevalence of symptoms in several body regions. The most affected region was the low back followed by upper limbs. It may be related to the seated and awkward postures due to bad work conditions. Psychosocial assessment showed lack of control for 47% of workers but most workers has medium or high work-engagement. Public service organization may be an important factor on those results as well as on ergonomics issues.
1. INTRODUÇÃO O ambiente de trabalho está sempre em evolução. A introdução de novas tecnologias e a rápida mudança nas estratégias de marketing e produção influenciaram o volume de trabalho e a necessidade de esquemas mais flexíveis (KUORINKA, 1998). O desenvolvimento da tecnologia de informação mudou as condições de trabalho. Atualmente, grande parte das atividades realizadas em ambientes ocupacionais envolve o uso do computador. Também é possível se observar um aumento no tempo gasto para realização das tarefas (ARVIDSSON et al, 2006). Embora poucos países da América Latina possuam um registro sistemático de dados específicos com relação às desordens musculoesqueléticas relacionadas ao trabalho, países mais industrializados têm publicado um aumento expressivo destas desordens (GIL COURY, 2005). Segundo BLATTER e BONGERS (2002) o novo contexto de trabalho coincide com o aumento das desordens musculoesqueléticas, sobretudo na região cervical e dos membros superiores e, para COOK et al (2004), as desordens musculoesqueléticas relacionadas ao uso do computador têm sido relatadas tanto na
extremidade proximal como na extremidade distal do membro superior. SILVERSTEIN et al (1998) encontraram maiores incidências de desordens musculoesqueléticas nas regiões do punho e mão. O uso do mouse, em pelo menos 50% do tempo de trabalho, foi significativamente associado à maior incidência de lesão (JENSEN et al, 2002). Dentre os fatores físicos necessários para o desenvolvimento das desordens musculoesqueléticas relacionadas ao trabalho podem ser citados: tempo insuficiente para a recuperação tecidual, alta repetição da tarefa, posturas inadequadas e desempenho excessivo de força (SILVERTEIN et al, 1996). Além dos fatores físicos há evidência científica de que os fatores psicossocias estão relacionados ao desenvolvimento de lesões músculo-esquelética (NIOSH, 1997). Estes fatores compreendem estresse emocional e cognitivo relacionados a tarefas ocupacionais, relações sociais, fatores psicológicos individuais e relacionados à administração (WESTGAARD e WINKEL, 1997). O fator psicossocial no trabalho também pode ser resumidamente interpretado como a percepção ou convicção do trabalhador a respeito da forma na qual o
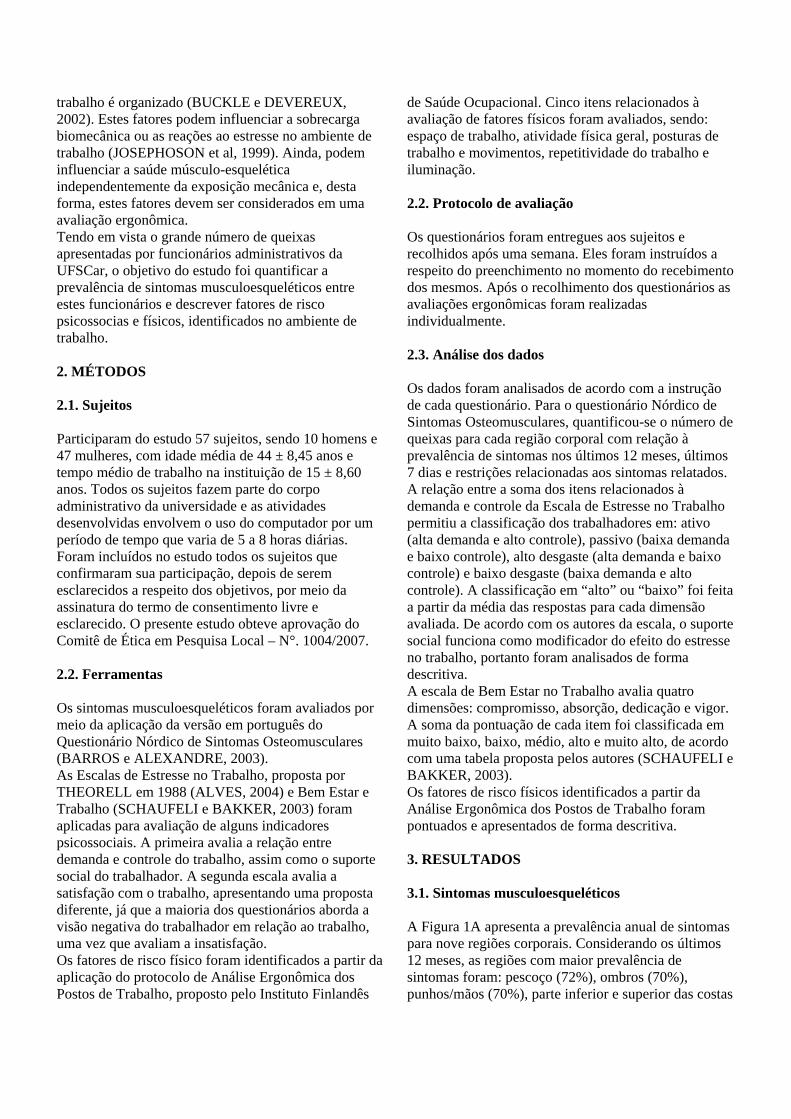
trabalho é organizado (BUCKLE e DEVEREUX, 2002). Estes fatores podem influenciar a sobrecarga biomecânica ou as reações ao estresse no ambiente de trabalho (JOSEPHOSON et al, 1999). Ainda, podem influenciar a saúde músculo-esquelética independentemente da exposição mecânica e, desta forma, estes fatores devem ser considerados em uma avaliação ergonômica. Tendo em vista o grande número de queixas apresentadas por funcionários administrativos da UFSCar, o objetivo do estudo foi quantificar a prevalência de sintomas musculoesqueléticos entre estes funcionários e descrever fatores de risco psicossocias e físicos, identificados no ambiente de trabalho. 2. MÉTODOS 2.1. Sujeitos Participaram do estudo 57 sujeitos, sendo 10 homens e 47 mulheres, com idade média de 44 ± 8,45 anos e tempo médio de trabalho na instituição de 15 ± 8,60 anos. Todos os sujeitos fazem parte do corpo administrativo da universidade e as atividades desenvolvidas envolvem o uso do computador por um período de tempo que varia de 5 a 8 horas diárias. Foram incluídos no estudo todos os sujeitos que confirmaram sua participação, depois de serem esclarecidos a respeito dos objetivos, por meio da assinatura do termo de consentimento livre e esclarecido. O presente estudo obteve aprovação do Comitê de Ética em Pesquisa Local – N°. 1004/2007. 2.2. Ferramentas Os sintomas musculoesqueléticos foram avaliados por meio da aplicação da versão em português do Questionário Nórdico de Sintomas Osteomusculares (BARROS e ALEXANDRE, 2003). As Escalas de Estresse no Trabalho, proposta por THEORELL em 1988 (ALVES, 2004) e Bem Estar e Trabalho (SCHAUFELI e BAKKER, 2003) foram aplicadas para avaliação de alguns indicadores psicossociais. A primeira avalia a relação entre demanda e controle do trabalho, assim como o suporte social do trabalhador. A segunda escala avalia a satisfação com o trabalho, apresentando uma proposta diferente, já que a maioria dos questionários aborda a visão negativa do trabalhador em relação ao trabalho, uma vez que avaliam a insatisfação. Os fatores de risco físico foram identificados a partir da aplicação do protocolo de Análise Ergonômica dos Postos de Trabalho, proposto pelo Instituto Finlandês
de Saúde Ocupacional. Cinco itens relacionados à avaliação de fatores físicos foram avaliados, sendo: espaço de trabalho, atividade física geral, posturas de trabalho e movimentos, repetitividade do trabalho e iluminação. 2.2. Protocolo de avaliação Os questionários foram entregues aos sujeitos e recolhidos após uma semana. Eles foram instruídos a respeito do preenchimento no momento do recebimento dos mesmos. Após o recolhimento dos questionários as avaliações ergonômicas foram realizadas individualmente. 2.3. Análise dos dados Os dados foram analisados de acordo com a instrução de cada questionário. Para o questionário Nórdico de Sintomas Osteomusculares, quantificou-se o número de queixas para cada região corporal com relação à prevalência de sintomas nos últimos 12 meses, últimos 7 dias e restrições relacionadas aos sintomas relatados. A relação entre a soma dos itens relacionados à demanda e controle da Escala de Estresse no Trabalho permitiu a classificação dos trabalhadores em: ativo (alta demanda e alto controle), passivo (baixa demanda e baixo controle), alto desgaste (alta demanda e baixo controle) e baixo desgaste (baixa demanda e alto controle). A classificação em “alto” ou “baixo” foi feita a partir da média das respostas para cada dimensão avaliada. De acordo com os autores da escala, o suporte social funciona como modificador do efeito do estresse no trabalho, portanto foram analisados de forma descritiva. A escala de Bem Estar no Trabalho avalia quatro dimensões: compromisso, absorção, dedicação e vigor. A soma da pontuação de cada item foi classificada em muito baixo, baixo, médio, alto e muito alto, de acordo com uma tabela proposta pelos autores (SCHAUFELI e BAKKER, 2003). Os fatores de risco físicos identificados a partir da Análise Ergonômica dos Postos de Trabalho foram pontuados e apresentados de forma descritiva. 3. RESULTADOS 3.1. Sintomas musculoesqueléticos A Figura 1A apresenta a prevalência anual de sintomas para nove regiões corporais. Considerando os últimos 12 meses, as regiões com maior prevalência de sintomas foram: pescoço (72%), ombros (70%), punhos/mãos (70%), parte inferior e superior das costas
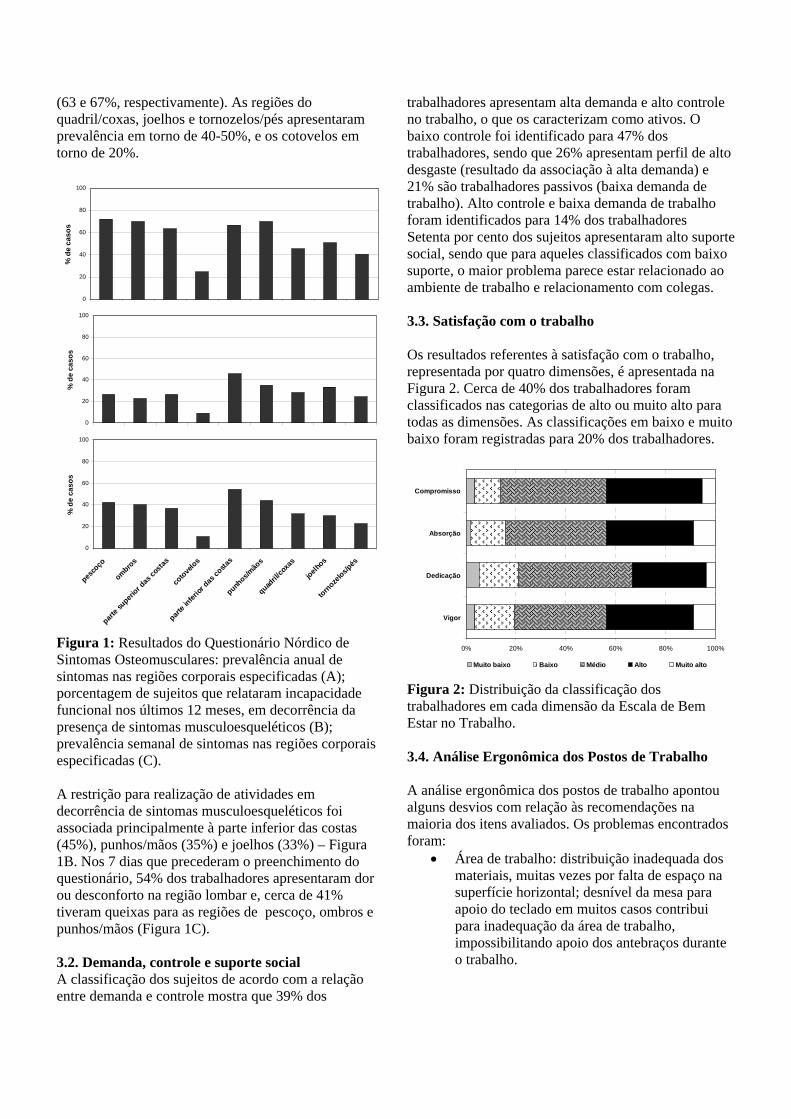
(63 e 67%, respectivamente). As regiões do quadril/coxas, joelhos e tornozelos/pés apresentaram prevalência em torno de 40-50%, e os cotovelos em torno de 20%.
0
20
40
60
80
100
% d
e ca
sos
0
20
40
60
80
100
% d
e ca
sos
0
20
40
60
80
100
pesco
ço
ombros
parte s
uperior d
as co
stas
cotove
los
parte i
nferior
das co
stas
punhos/m
ãos
quadril/
coxa
s
joelhos
tornoze
los/pés
% d
e ca
sos
Figura 1: Resultados do Questionário Nórdico de Sintomas Osteomusculares: prevalência anual de sintomas nas regiões corporais especificadas (A); porcentagem de sujeitos que relataram incapacidade funcional nos últimos 12 meses, em decorrência da presença de sintomas musculoesqueléticos (B); prevalência semanal de sintomas nas regiões corporais especificadas (C). A restrição para realização de atividades em decorrência de sintomas musculoesqueléticos foi associada principalmente à parte inferior das costas (45%), punhos/mãos (35%) e joelhos (33%) – Figura 1B. Nos 7 dias que precederam o preenchimento do questionário, 54% dos trabalhadores apresentaram dor ou desconforto na região lombar e, cerca de 41% tiveram queixas para as regiões de pescoço, ombros e punhos/mãos (Figura 1C). 3.2. Demanda, controle e suporte social A classificação dos sujeitos de acordo com a relação entre demanda e controle mostra que 39% dos
trabalhadores apresentam alta demanda e alto controle no trabalho, o que os caracterizam como ativos. O baixo controle foi identificado para 47% dos trabalhadores, sendo que 26% apresentam perfil de alto desgaste (resultado da associação à alta demanda) e 21% são trabalhadores passivos (baixa demanda de trabalho). Alto controle e baixa demanda de trabalho foram identificados para 14% dos trabalhadores Setenta por cento dos sujeitos apresentaram alto suporte social, sendo que para aqueles classificados com baixo suporte, o maior problema parece estar relacionado ao ambiente de trabalho e relacionamento com colegas. 3.3. Satisfação com o trabalho Os resultados referentes à satisfação com o trabalho, representada por quatro dimensões, é apresentada na Figura 2. Cerca de 40% dos trabalhadores foram classificados nas categorias de alto ou muito alto para todas as dimensões. As classificações em baixo e muito baixo foram registradas para 20% dos trabalhadores.
0% 20% 40% 60% 80% 100%
Vigor
Dedicação
Absorção
Compromisso
Muito baixo Baixo Médio Alto Muito alto
Figura 2: Distribuição da classificação dos trabalhadores em cada dimensão da Escala de Bem Estar no Trabalho. 3.4. Análise Ergonômica dos Postos de Trabalho A análise ergonômica dos postos de trabalho apontou alguns desvios com relação às recomendações na maioria dos itens avaliados. Os problemas encontrados foram:
• Área de trabalho: distribuição inadequada dos materiais, muitas vezes por falta de espaço na superfície horizontal; desnível da mesa para apoio do teclado em muitos casos contribui para inadequação da área de trabalho, impossibilitando apoio dos antebraços durante o trabalho.
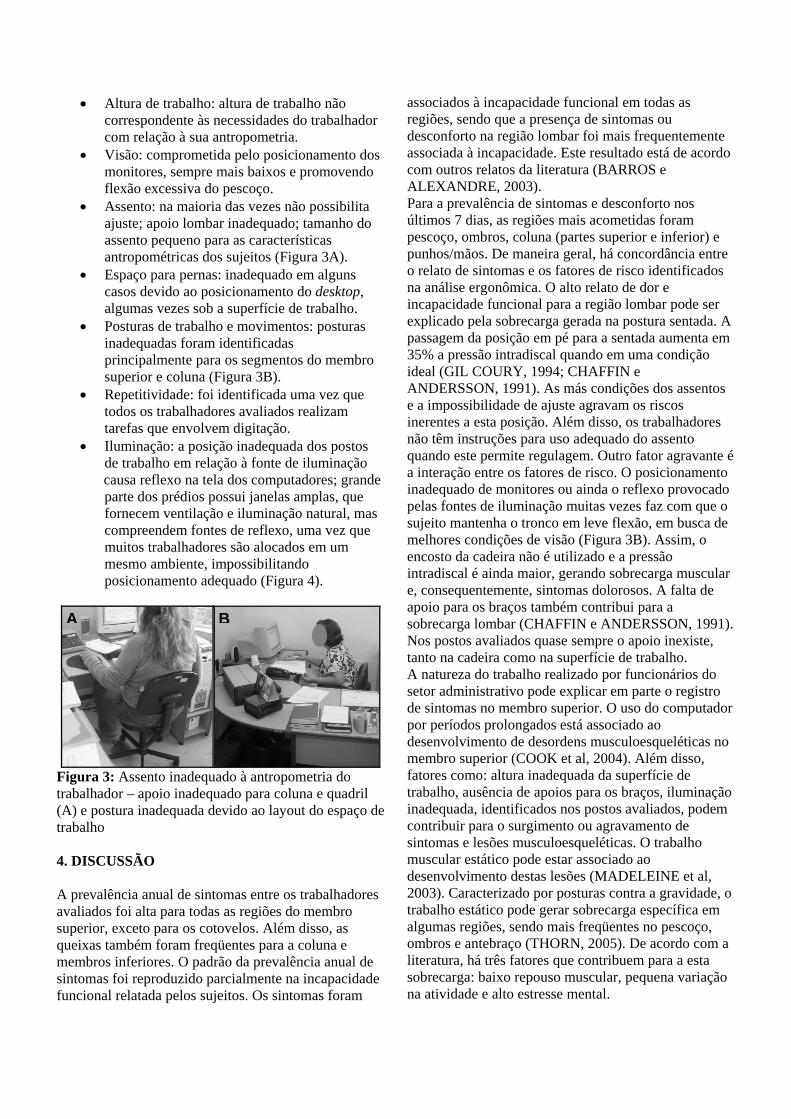
• Altura de trabalho: altura de trabalho não correspondente às necessidades do trabalhador com relação à sua antropometria.
• Visão: comprometida pelo posicionamento dos monitores, sempre mais baixos e promovendo flexão excessiva do pescoço.
• Assento: na maioria das vezes não possibilita ajuste; apoio lombar inadequado; tamanho do assento pequeno para as características antropométricas dos sujeitos (Figura 3A).
• Espaço para pernas: inadequado em alguns casos devido ao posicionamento do desktop, algumas vezes sob a superfície de trabalho.
• Posturas de trabalho e movimentos: posturas inadequadas foram identificadas principalmente para os segmentos do membro superior e coluna (Figura 3B).
• Repetitividade: foi identificada uma vez que todos os trabalhadores avaliados realizam tarefas que envolvem digitação.
• Iluminação: a posição inadequada dos postos de trabalho em relação à fonte de iluminação causa reflexo na tela dos computadores; grande parte dos prédios possui janelas amplas, que fornecem ventilação e iluminação natural, mas compreendem fontes de reflexo, uma vez que muitos trabalhadores são alocados em um mesmo ambiente, impossibilitando posicionamento adequado (Figura 4).
Figura 3: Assento inadequado à antropometria do trabalhador – apoio inadequado para coluna e quadril (A) e postura inadequada devido ao layout do espaço de trabalho 4. DISCUSSÃO A prevalência anual de sintomas entre os trabalhadores avaliados foi alta para todas as regiões do membro superior, exceto para os cotovelos. Além disso, as queixas também foram freqüentes para a coluna e membros inferiores. O padrão da prevalência anual de sintomas foi reproduzido parcialmente na incapacidade funcional relatada pelos sujeitos. Os sintomas foram
associados à incapacidade funcional em todas as regiões, sendo que a presença de sintomas ou desconforto na região lombar foi mais frequentemente associada à incapacidade. Este resultado está de acordo com outros relatos da literatura (BARROS e ALEXANDRE, 2003). Para a prevalência de sintomas e desconforto nos últimos 7 dias, as regiões mais acometidas foram pescoço, ombros, coluna (partes superior e inferior) e punhos/mãos. De maneira geral, há concordância entre o relato de sintomas e os fatores de risco identificados na análise ergonômica. O alto relato de dor e incapacidade funcional para a região lombar pode ser explicado pela sobrecarga gerada na postura sentada. A passagem da posição em pé para a sentada aumenta em 35% a pressão intradiscal quando em uma condição ideal (GIL COURY, 1994; CHAFFIN e ANDERSSON, 1991). As más condições dos assentos e a impossibilidade de ajuste agravam os riscos inerentes a esta posição. Além disso, os trabalhadores não têm instruções para uso adequado do assento quando este permite regulagem. Outro fator agravante é a interação entre os fatores de risco. O posicionamento inadequado de monitores ou ainda o reflexo provocado pelas fontes de iluminação muitas vezes faz com que o sujeito mantenha o tronco em leve flexão, em busca de melhores condições de visão (Figura 3B). Assim, o encosto da cadeira não é utilizado e a pressão intradiscal é ainda maior, gerando sobrecarga muscular e, consequentemente, sintomas dolorosos. A falta de apoio para os braços também contribui para a sobrecarga lombar (CHAFFIN e ANDERSSON, 1991). Nos postos avaliados quase sempre o apoio inexiste, tanto na cadeira como na superfície de trabalho.
A B
A natureza do trabalho realizado por funcionários do setor administrativo pode explicar em parte o registro de sintomas no membro superior. O uso do computador por períodos prolongados está associado ao desenvolvimento de desordens musculoesqueléticas no membro superior (COOK et al, 2004). Além disso, fatores como: altura inadequada da superfície de trabalho, ausência de apoios para os braços, iluminação inadequada, identificados nos postos avaliados, podem contribuir para o surgimento ou agravamento de sintomas e lesões musculoesqueléticas. O trabalho muscular estático pode estar associado ao desenvolvimento destas lesões (MADELEINE et al, 2003). Caracterizado por posturas contra a gravidade, o trabalho estático pode gerar sobrecarga específica em algumas regiões, sendo mais freqüentes no pescoço, ombros e antebraço (THORN, 2005). De acordo com a literatura, há três fatores que contribuem para a esta sobrecarga: baixo repouso muscular, pequena variação na atividade e alto estresse mental.
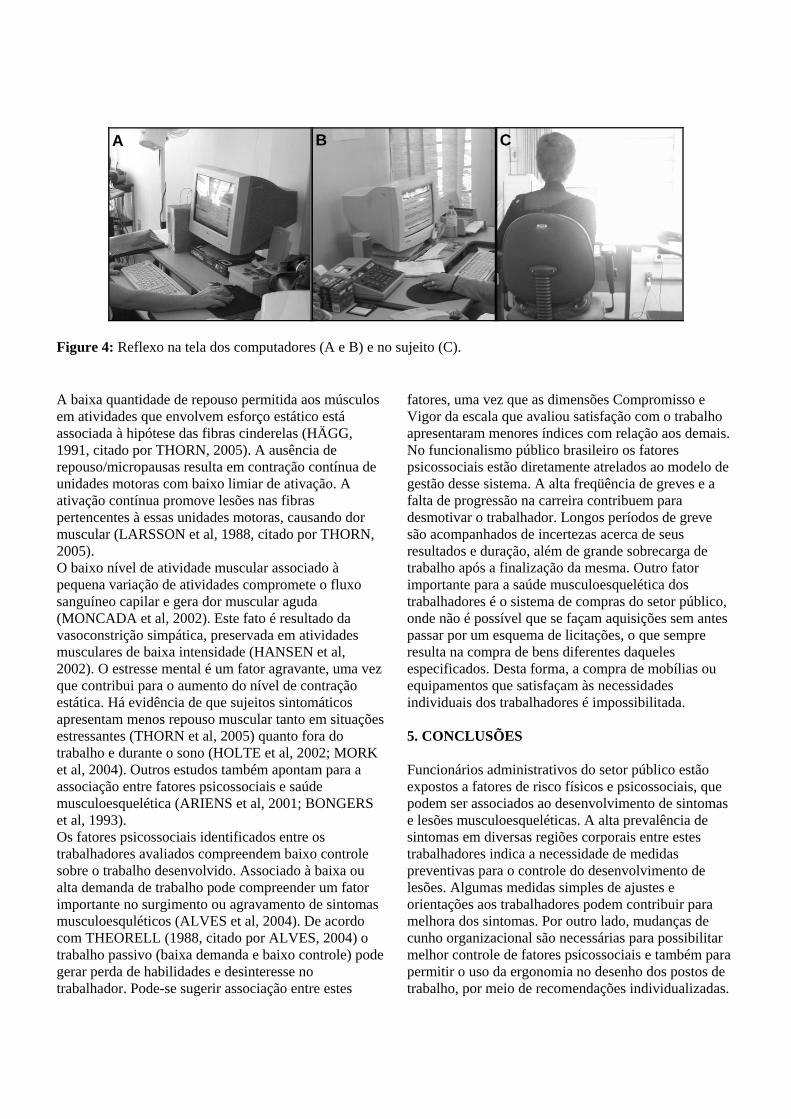
B C A
Figure 4: Reflexo na tela dos computadores (A e B) e no sujeito (C). A baixa quantidade de repouso permitida aos músculos em atividades que envolvem esforço estático está associada à hipótese das fibras cinderelas (HÄGG, 1991, citado por THORN, 2005). A ausência de repouso/micropausas resulta em contração contínua de unidades motoras com baixo limiar de ativação. A ativação contínua promove lesões nas fibras pertencentes à essas unidades motoras, causando dor muscular (LARSSON et al, 1988, citado por THORN, 2005). O baixo nível de atividade muscular associado à pequena variação de atividades compromete o fluxo sanguíneo capilar e gera dor muscular aguda (MONCADA et al, 2002). Este fato é resultado da vasoconstrição simpática, preservada em atividades musculares de baixa intensidade (HANSEN et al, 2002). O estresse mental é um fator agravante, uma vez que contribui para o aumento do nível de contração estática. Há evidência de que sujeitos sintomáticos apresentam menos repouso muscular tanto em situações estressantes (THORN et al, 2005) quanto fora do trabalho e durante o sono (HOLTE et al, 2002; MORK et al, 2004). Outros estudos também apontam para a associação entre fatores psicossociais e saúde musculoesquelética (ARIENS et al, 2001; BONGERS et al, 1993). Os fatores psicossociais identificados entre os trabalhadores avaliados compreendem baixo controle sobre o trabalho desenvolvido. Associado à baixa ou alta demanda de trabalho pode compreender um fator importante no surgimento ou agravamento de sintomas musculoesquléticos (ALVES et al, 2004). De acordo com THEORELL (1988, citado por ALVES, 2004) o trabalho passivo (baixa demanda e baixo controle) pode gerar perda de habilidades e desinteresse no trabalhador. Pode-se sugerir associação entre estes
fatores, uma vez que as dimensões Compromisso e Vigor da escala que avaliou satisfação com o trabalho apresentaram menores índices com relação aos demais. No funcionalismo público brasileiro os fatores psicossociais estão diretamente atrelados ao modelo de gestão desse sistema. A alta freqüência de greves e a falta de progressão na carreira contribuem para desmotivar o trabalhador. Longos períodos de greve são acompanhados de incertezas acerca de seus resultados e duração, além de grande sobrecarga de trabalho após a finalização da mesma. Outro fator importante para a saúde musculoesquelética dos trabalhadores é o sistema de compras do setor público, onde não é possível que se façam aquisições sem antes passar por um esquema de licitações, o que sempre resulta na compra de bens diferentes daqueles especificados. Desta forma, a compra de mobílias ou equipamentos que satisfaçam às necessidades individuais dos trabalhadores é impossibilitada. 5. CONCLUSÕES Funcionários administrativos do setor público estão expostos a fatores de risco físicos e psicossociais, que podem ser associados ao desenvolvimento de sintomas e lesões musculoesqueléticas. A alta prevalência de sintomas em diversas regiões corporais entre estes trabalhadores indica a necessidade de medidas preventivas para o controle do desenvolvimento de lesões. Algumas medidas simples de ajustes e orientações aos trabalhadores podem contribuir para melhora dos sintomas. Por outro lado, mudanças de cunho organizacional são necessárias para possibilitar melhor controle de fatores psicossociais e também para permitir o uso da ergonomia no desenho dos postos de trabalho, por meio de recomendações individualizadas.
6. REFERÊNCIAS ALVES MGM, CHOR D, FAERSTEIN E, LOPES CS, WERNECK GL. Versão resumida da “job stress scale”: adaptação para o português. Revista de Saúde Pública. 38(2):164-171. 2004. ARIËNS GA, van MECHELEN W, BONGERS PM, BOUTER LM, van DER WAL G. Psychosocial risk factors for neck pain: a systematic review. American Journal of Industrial Medicine. 39(2):180–193. 2001. ARVIDSON I, HANSON G-Å, MATHIASSEN SE, SKERFVIG S. Changes in physical workload with implementation of mouse-based information technology in air traffic control. International Journal of Industrial Ergonomics. 36:613-622. 2006. BARROS ENC, ALEXANDRE NMC. Cross-cultural adaptation of the Nordic musculoskeletal questionnaire. International Nursing Review. 50:101-108. BLATTER BM, BONGERS PM. Duration of computer use and mouse use in relation to musculoskeletal disorders of neck or upper limb. International Journal of Industrial Ergonomics. 30:295-306. 2002. BONGERS PM, DE WINTER CR, KOMPIER MAJ, HIELDEBRANDT VH. Psychosocial factors at work and musculoskeletal diseases. Scandinavian Journal of Work, Environment and Health. 19:297-312. 1993. BUCKLE PW, DEVEREUX JJ. The nature of work-related neck and upper limb musculoskeletal disorders. Applied Ergonomics. 33:207-217. 2002. CHAFFIN, DB; ANDERSSON, GBJ. Occupational Biomechanics. Second Edition. John Wiley & Sons, Inc. 1991. COOK C, URGESS-LIMERICK R, PAPALIA S. The effect of wrist rests and forearm support during keyboard and mouse use. International Journal of Industrial Ergonomics. 33:463-472. 2004. GIL COURY HJC. Time trends in ergonomic intervention research for improved musculoskeletal health and comfort in Latin America. Applied Ergonomics. 36:249-252. 2005. GIL COURY HJC. Trabalhando sentado – manual de posturas confortáveis. Editora da UFSCar. Primeira Edição, São Carlos, 1994.
HANSEN J. Sympathetic neural control of skeletal muscle blood flow and oxygenation. Danish Medical Bulletin. 49:109-129. 2002. HOLTE KA, WESTGAARD RH. Daytime trapezius muscle activity and shoulder neck-pain of service workers with work stress and low biomechanical exposure. American Journal of Industrial Medicine. 41:393-405. 2002. JENSEN C, FINSEN L, SØGAARD K, CHRISTENSEN H. Musculoskeletal symptoms and duration of computer and mouse use. International Journal of Industrial Ergonomics. 30:265-275. 2002. JOSEPHSON M, PERNOLD G, HULTÉN GA, HÄRENSTAM A, THEORELL T, VINGARD E, WALDENSTRÖM M, HJELM EW. Differences in the association between psychosocial work conditions and physical work load in female- and male-dominated occupations, MUSIC-Norrtälje Study Group. American Industrial Hygiene Association Journal. 60:673-678. 1999. KUORINKA I. The influence of industrial trends on work-related musculoskeletal disorders (WMSD’s). International Journal of Industrial Ergonomics. 21:5-9. 1998. MADELEINE P, LUNDAGER B, VOIGT M, ARENDT-NIELSEN L. The effects of neck-shoulder pain development on sensory-motor interactions among female workers in the poultry and fish industries. A prospective study. International Archives of Occupational Environmental Health. 76(1):39-49. 2003. MONCADA S, ERUSALIMSKY JD. Does nitric oxide modulate mitochondrial energy generation and apoptosis? Nature Reviews Molecular Cell Biology. 3:214-220. 2002. Mork P, Westgaard R. The association between nocturnal trapezius muscle activity and shoulder and neck pain. European Journal of Applied Physiology. 92(1-2):18-25. 2004. National Institute for Occupational Safety and Health (NIOSH), 1997. In: BERNARD BP. Musculoskeletal Disorders and Workplace Factors. DHHS (NIOSH) Publication Nº. 97-141. US Department of Health and Human Services, NIOSH, Cincinnati, OH.
SCHAUFELI W, BAKKER A. UWES: Utrecht Work Engagement Scale. User’s Manual. Occupational Health Psychology Unit, Utrecht University, 2003. SILVERSTEIN B, WELP E, NELSON N, KALAT J. Claims incidence of work-related disorders of the upper extremities: Washington State, 1997 through 1995. American Journal of Public Health. 88(12):1827-1833. 1998. SILVERSTEIN MA, SILVERSTEIN B, FRANKLIN GM. Evidence for work-related musculoskeletal disorders: A scientific counterargument. Journal of Occupational and Environmental Medicine. 38(5):477-848. 1996.
THORN S. Muscular activity in light manual work – with reference to the development of muscle pain among computer users. Doctoral Thesis. Chalmers University of Technology, Göteborg, Sweden, 2005. WESTGAARD RH, WINKEL J. Ergonomic intervention research for improvement musculoskeletal health: A critical review. International Journal of Industrial Ergonomics. 20:463-500. 1997.

Livros Grátis( http://www.livrosgratis.com.br )
Milhares de Livros para Download: Baixar livros de AdministraçãoBaixar livros de AgronomiaBaixar livros de ArquiteturaBaixar livros de ArtesBaixar livros de AstronomiaBaixar livros de Biologia GeralBaixar livros de Ciência da ComputaçãoBaixar livros de Ciência da InformaçãoBaixar livros de Ciência PolíticaBaixar livros de Ciências da SaúdeBaixar livros de ComunicaçãoBaixar livros do Conselho Nacional de Educação - CNEBaixar livros de Defesa civilBaixar livros de DireitoBaixar livros de Direitos humanosBaixar livros de EconomiaBaixar livros de Economia DomésticaBaixar livros de EducaçãoBaixar livros de Educação - TrânsitoBaixar livros de Educação FísicaBaixar livros de Engenharia AeroespacialBaixar livros de FarmáciaBaixar livros de FilosofiaBaixar livros de FísicaBaixar livros de GeociênciasBaixar livros de GeografiaBaixar livros de HistóriaBaixar livros de Línguas

Baixar livros de LiteraturaBaixar livros de Literatura de CordelBaixar livros de Literatura InfantilBaixar livros de MatemáticaBaixar livros de MedicinaBaixar livros de Medicina VeterináriaBaixar livros de Meio AmbienteBaixar livros de MeteorologiaBaixar Monografias e TCCBaixar livros MultidisciplinarBaixar livros de MúsicaBaixar livros de PsicologiaBaixar livros de QuímicaBaixar livros de Saúde ColetivaBaixar livros de Serviço SocialBaixar livros de SociologiaBaixar livros de TeologiaBaixar livros de TrabalhoBaixar livros de Turismo