anuário do instituto de geociências - ufrj ... · 214 anuário do instituto de geociências -...
TRANSCRIPT

212
Anuário do Instituto de Geociências - UFRJ www.anuario.igeo.ufrj.br
Microtremor Response of a Mass Movement in Federal District of Brazil Resposta em Microtremor de um Movemento de Massa no Distrito Federal, Brasil
Yawar Hussain1; Hernan Martinez-Carvajal1,2; Martin Cárdenas-Soto3; Rogério Uagoda4; Salvatore Martino5 & Muhammad B. Hussain6
1University of Brasilia, Department of Civil and Environmental Engineering, SG-12, Asa Norte, 70.910-900, Brasilia, DF, Brazil.2National University of Colombia at Medellı́n, Faculty of Mines, Cl. 59a, No. 63-20, Medellı́n, Colombia.
3National Autonomous University of Mexico, Engineering Faculty, Av. Universidad No. 3000, C. U., Coyoacán, C.P. 04510, Mexico City, Mexico.
4University of Brasilia, Post-Graduation Program in Geography, ICC Norte, 70.910-900, Brasilia, DF, Brazil.5University of Rome “Sapienza”, Department of Earth Sciences and Research Center for Geological Risks (CERI),
P.le A. Moro 5, 00185 Roma, Italy.6 The University of Lahore, Gujrat Campus, Department of Physics, Main GT Road, Adjacent Chenab Bridge, Gujrat, Pakistan
E-mails: [email protected]; [email protected]; [email protected]; [email protected]; [email protected]; [email protected]
Recebido em: 26/09/2017 Aprovado em: 31/10/2017DOI: http://dx.doi.org/10.11137/2017_3_212_221
Abstract
The present study provides a brief description of the ambient noise recorded at a slow moving mass movement in Ribeirão Contagem Basin. The area is an interesting natural laboratory as river detachment processes in a number of different stages can be identified and are easily accessible. We investigate the site dynamic characteristics of the study area by recording ambient noise time-series at nine points, using portable nine three-component short period seismometers. The time-series are processed to give both horizontal to vertical spectral ratio (HVSR) curves as well as time-frequency plots of noise power spectral density (SPD). The HVSR curves illustrate and quantify aspects of site resonance effects due to the local geological setting. Probability density function (PDF) shows that noise level lies well between new high noise model (NHNM) and new lower noise model (NLNM) and their probabilities are higher above 2 Hz. HVSR curves present a uniform lithologically controlled peak at 2 Hz. Directional properties of the wavefield are determined by beamforming method. The f-k analysis results in the E-W component show that at 5 Hz phase velocities are close to 1700 m/s while at 10 Hz dropped to 250 m/s. We observed that between 5 and 16 Hz the incoming wavefield arrive from 260 degrees. Further studies will apply a detailed noise analysis for relating the dynamics of the landslide (which can be retriggered by river erosion as well as rainfalls and seismic shaking) to possible changes in detectable physical properties.Keywords: Seismic noise; Power Spectral Density; Probability Density Function; HVSR; f-k analysis
Resumo
O estudo apresentado fornece uma ampla descrição do ruído ambiental registrado de um deslizamento de encosta lento localizado na bacia do Ribeirão Contagem no Distrito Federal. A área de estudo é um laboratório natural na medida que os processos erosivos do rio podem ser analisados em diferentes estágios de evolução dentro de um setor de fácil acesso. A pesquisa abrange o estudo das características dinâmicas da área por meio do registro das séries temporais do ruído ambiental em nove pontos mediante o uso de sismómetros de período curto e três componentes. As series temporais são processadas para obter as curvas de relação espectral horizontal-vertical (HVSR) e também os gráficos tempo:frequência dos espectros de potência (SPD). As curvas HVSR ilustram e quantificam aspectos dos efeitos de ressonância local devidos ao ambiente geológico. A função de desnsidade de probabilidade (PDF) mostra que os níveis de ruído registrados estão enquadrados entre os limites conhecidos como NHNM (new high noise model) e NLNM (new lower noise model) e que suas probabilidades são maiores acima de 2 Hz. As curvas HVSR apresentam um pico de resposta uniforme litológicamente controlado a 2 Hz. As propriedades direcionais do campo de ondas são determinadas pelo método da viga (beamforming method). A análise dos resultados na componente EW indica que na fase de 5 Hz a velocidade está próxima de 1700 m/s enquanto que para 10 Hz desce a 250 m/s. Foi observado que entre 5 e 16 Hz o ângulo de chegada da frente de ondas é 260 graus. Estudos adicionais aplicarão uma análise detalhada do ruído para relacionar a dinâmica do deslizamento de terra (que pode ser desencadeado pela erosão do rio, assim como chuvas e agitação sísmica) a possíveis mudanças nas propriedades físicas detectáveis.Palavras-chave: Ruído sísmico; Espectro de densidade de potência; Função densidade de probabilidade; HVSR; Análise f-k
A n u á r i o d o I n s t i t u t o d e G e o c i ê n c i a s - U F R JISSN 0101-9759 e-ISSN 1982-3908 - Vol. 40 - 3 / 2017 p. 212-221
213A n u á r i o d o I n s t i t u t o d e G e o c i ê n c i a s - U F R JISSN 0101-9759 e-ISSN 1982-3908 - Vol. 40 - 3 / 2017 p. 212-221
Microtremor Response of a Mass Movement in Federal District of Brazil Yawar Hussain; Hernan Martinez-Carvajal; Martin Cárdenas-Soto; Rogério Uagoda; Salvatore Martino & Muhammad B. Hussain
1 Introduction
Shallow and rainfall triggered mass move-ments have a greater share in the global terrestrial hazards (Fernandes & Amaral, 1997). The tragedies of 1967 and more recently of 2011 in Rio de Janeiro are the tragic reminder of the atrocities caused by such type of mass movements in Brazil (Entralgo, 2013; Gomes et al., 2013). The area of District Fed-eral (DF) is characterized by the thick and collaps-ible soil which is less supportive for the civil engi-neering structures (Araki, 1997). Because of these problematic soil conditions, the shallow slopes of the region are unstable. The growth of population in surrounding regions of DF has greatly affected the ecosystem of the area by distrusting the natural drainages that are not being compensated by appro-priate managerial landuse planning. Water quality deterioration and soil erosion are two major environ-mental responses to these unplanned urban growths on the problematic soil in surrounding areas of DF (Mendonça et al., 1994).
A generic term used to defined the ambient vibrations of ground caused by sources such as tide, turbulent wind, effects of wind on trees or build-ings, industrial machinery, cars and trains, or human footsteps is called noise. Based on the frequency contents, there are two sources of noise as natural and cultural commonly referred to as microseisms (below 1 Hz) and microtremors (above 1 Hz), re-spectively (Bonnefoy-Claudet et al., 2006). Seismic noise is a part of the record and brings with it in-formation from both the source that generates it and of the medium through which it is traveled. Along with geophysical and geotechnical studies that pro-vide information about the subsurface structures as well as their mechanical and elastic properties, and slip surfaces of landslide, there are many noise based techniques are popular amongst the earth scientists and engineers. The ambient noise based analysis like HVSR and f-k analysis have also been gaining popu-larity in landslide hazard assessment and vulnerabil-ity to different triggering factors like earthquakes and rainfalls. These passive seismic techniques offer a logistically efficient and cost effective method to map landslide and and its dynamics. HVSR provides information about the resonance behaviors of litho-morphologies and geomorphological features (Galea et al., 2014). More recent applications of noise based techniques are microzonation studies based on seis-
mic site response (Parolai et al., 2004), in the study of dynamical behaviour of buildings (Gallipoli et al., 2010; Nakata et al., 2013), crustal tomography through noise correlation techniques (Curtis et al., 2006), shallow crustal velocity profiling (Panzera & Lombardo 2013), monitoring of earth dams and levees by noise interferometry (Planès et al., 2015, 2017), underground mining (Olivier et al., 2015 ) as well as active volcanoes (Ballmer et al., 2013; Can-nata et al., 2017). Noise data can also potentially provide high resolution spatio-temporal information about the landscape dynamics and evolution (Méric et al., 2007). The sources of noise are usually dy-namic in nature because of this dynamism the levels of noise in a region are not constant over time. This variability of recorded noise can be quantified by the noise analysis.
The present study applied a preliminary noise analysis to the recorded ambient vibrations by a network of ten short-period seismometers at a mass movement in Ribeirão Contagem Basin. Noise analysis was done by calculating HVSR curves, time-frequency plots of noise energy as well as f-k analysis. These noise analyses are the prerequisite of any further noise based studies for hazards assessment and soil dynamic properties estimation under the influence of triggering factors. Finally, we discuss the implications of the main findings.
2 Material and Methods2.1 Study Area
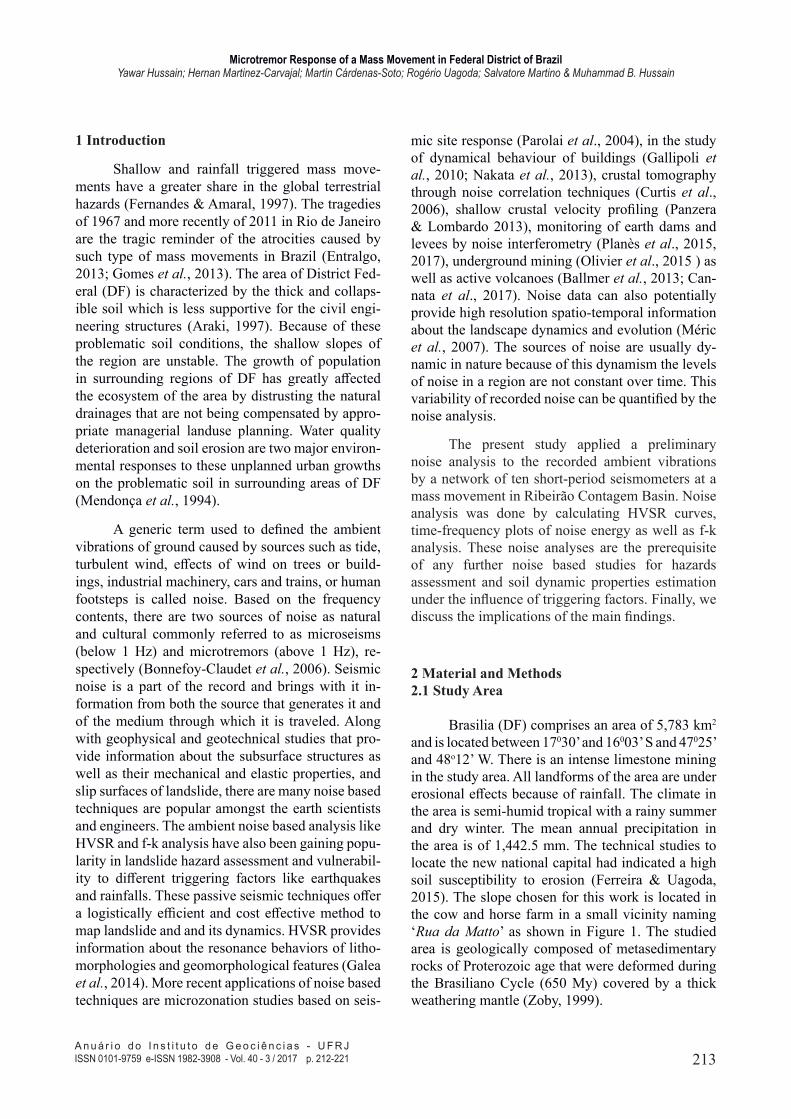
Brasilia (DF) comprises an area of 5,783 km2 and is located between 17030’ and 16003’ S and 47025’ and 48o12’ W. There is an intense limestone mining in the study area. All landforms of the area are under erosional effects because of rainfall. The climate in the area is semi-humid tropical with a rainy summer and dry winter. The mean annual precipitation in the area is of 1,442.5 mm. The technical studies to locate the new national capital had indicated a high soil susceptibility to erosion (Ferreira & Uagoda, 2015). The slope chosen for this work is located in the cow and horse farm in a small vicinity naming ‘Rua da Matto’ as shown in Figure 1. The studied area is geologically composed of metasedimentary rocks of Proterozoic age that were deformed during the Brasiliano Cycle (650 My) covered by a thick weathering mantle (Zoby, 1999).
214A n u á r i o d o I n s t i t u t o d e G e o c i ê n c i a s - U F R JISSN 0101-9759 e-ISSN 1982-3908 - Vol. 40 - 3 / 2017 p. 212-221
Microtremor Response of a Mass Movement in Federal District of Brazil Yawar Hussain; Hernan Martinez-Carvajal; Martin Cárdenas-Soto; Rogério Uagoda; Salvatore Martino & Muhammad B. Hussain
2.2 SPD and PDF
The rural environment with farming and mining activities as well as the nearby village roads necessarily lead to anthropogenic disturbances on the recorded noise seismograms. The highest ambient noise levels cover a wide dominant frequency band between 2 and 48 Hz, and the extraction of potential PSD variations due to hydrodynamic effects, therefore, necessitates postprocessing these data.
The sources of noise are not stationary over space and time, in this situation time-frequency
2.1.1 Data Acquisition
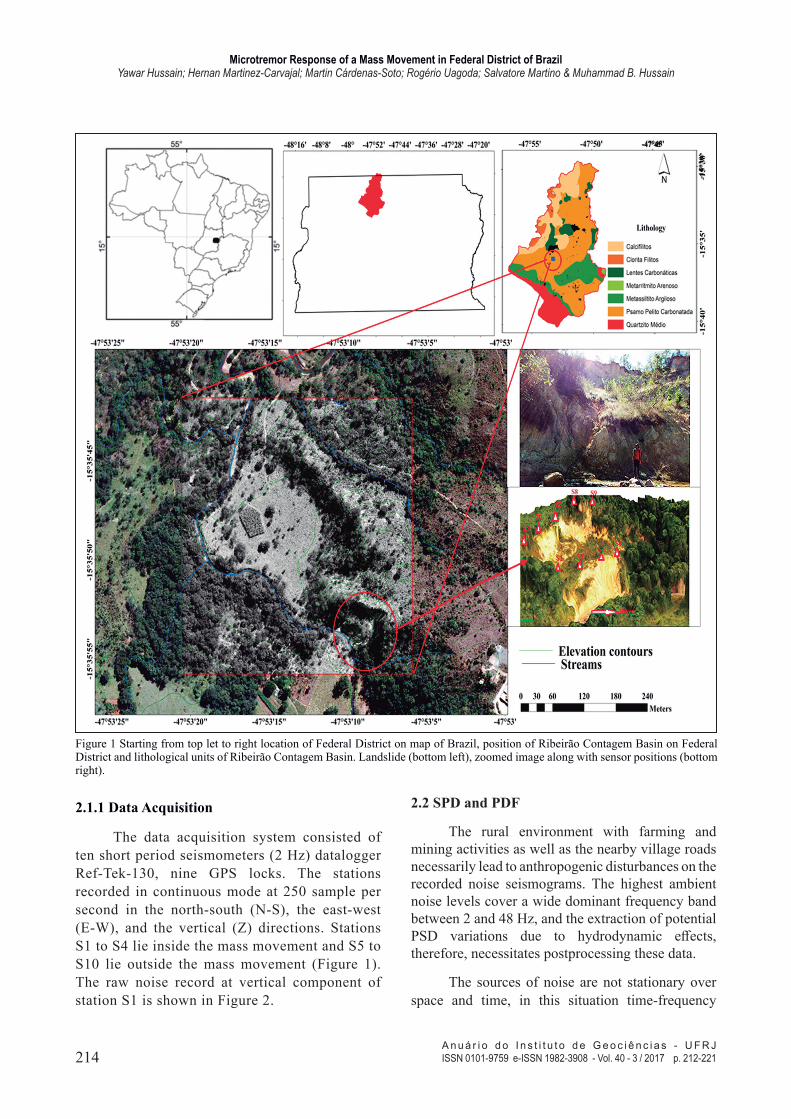
The data acquisition system consisted of ten short period seismometers (2 Hz) datalogger Ref-Tek-130, nine GPS locks. The stations recorded in continuous mode at 250 sample per second in the north-south (N-S), the east-west (E-W), and the vertical (Z) directions. Stations S1 to S4 lie inside the mass movement and S5 to S10 lie outside the mass movement (Figure 1). The raw noise record at vertical component of station S1 is shown in Figure 2.
Figure 1 Starting from top let to right location of Federal District on map of Brazil, position of Ribeirão Contagem Basin on Federal District and lithological units of Ribeirão Contagem Basin. Landslide (bottom left), zoomed image along with sensor positions (bottom right).
215A n u á r i o d o I n s t i t u t o d e G e o c i ê n c i a s - U F R JISSN 0101-9759 e-ISSN 1982-3908 - Vol. 40 - 3 / 2017 p. 212-221
Microtremor Response of a Mass Movement in Federal District of Brazil Yawar Hussain; Hernan Martinez-Carvajal; Martin Cárdenas-Soto; Rogério Uagoda; Salvatore Martino & Muhammad B. Hussain
analysis of noise help in understanding the spatiotemporal variations of noise sources (Burtin et al., 2008). Different noise energies were emitted at different frequencies which can be calculated from spectrograms (time series). Power Spectral Density (PSD) approach is used for the calculation of noise spectrograms (Burtin et al., 2008; Yan et al., 2017). The PSDs are calculated using Welch’s averaging method (Welch, 1967). The processing steps consist of detrending the signal, mean subtraction, and the removal of instrumental self response. In signal processing, a technique where power spectrum estimate of a stationary ergodic finite-variance random process, give a finite contiguous realization of the data and it can overcome the limitation of Fourier analysis is called multitaper method (Thomson, 1982). Here it is applied to a 1-hour time window and power spectrum was estimated. In this way, a high frequency resolution is achieved for short record, which decreases the number of computed frequencies in the spectrum.
PSD curves were used to define a Probability Density Function (PDF) at each period of the
noise record (McNamara & Buland, 2004). For the computation of the PDF, the single PSD curves were smoothed using a centered averaging moving window with a width of 1=8 of an octave. The PSD values at each period were gathered into bins of 1-dB width to define the histogram of the PSD recurrence for each period. Finally, the PDF was built by normalization of the histograms, period by period (Barrière et al., 2015). The distribution of power is plotted as a function of frequency. The PDF at a particular central frequency is equal to the ratio of the number of spectral estimates that fall into a 1 dB bin at that central frequency, to the total number of spectral estimates of all powers with the same central frequency (i.e. the total number of hours in the dataset). The Peterson, (1993) model is mainly used as a reference model for the study of the noise quality of a site.
2.3 HVSR
The survey was carried out in accordance with the instructions provided by Koller et al. (2004).
Figure 2 Ambient noise recordings (unfiltered) at vertical component of station S1.

216A n u á r i o d o I n s t i t u t o d e G e o c i ê n c i a s - U F R JISSN 0101-9759 e-ISSN 1982-3908 - Vol. 40 - 3 / 2017 p. 212-221
Microtremor Response of a Mass Movement in Federal District of Brazil Yawar Hussain; Hernan Martinez-Carvajal; Martin Cárdenas-Soto; Rogério Uagoda; Salvatore Martino & Muhammad B. Hussain
This technique is based on an idea that frequency-dependent ellipticity of surface wave motion can be explained by the shape of HVSR curve (Benjumea et al., 2016) and for determining the resonance of soil deposit over basement was given by Nogoshi & Igarashi (1970, 1971). This technique has been revised after the work of Nakamura, (2008) and now it is considered as a suitable technique for earthquake hazards assessments through microzoation (Di Giulio et al., 2014), to bedrock depth estimation (García-Jerez et al., 2007; Gosar & Lenart, 2010; Ullah et al., 2016) as well as its utilization in archeology is also well established (Kalil et al., 2016) and landslide studies, slip surface and volume estimations are other accepts of its applications (Del Gaudio et al., 2008; Pazzi et al., 2016; Imposa et al., 2017).
2.4 Frequency-Wavenumber (f-k)
Analysis of surface wave has gained greater importance in the subsurface characterization. In this method, the energetic part of seismic wave is utilized. The surface wave energy can be extracted by two ways one is the array method and other is single station method. In the first method, the surface waves are obtained from dispersion curve (frequency-dependent phase velocity) for this dispersion curve extraction the noise must be recorded at more than one seismometers simultaneous.
The concept of seismic array was applied in the 1960s, since then it has been used by the seismologists for the analysis of properties of propagating waves. The origin of signals is detected by vector velocity which can be explained by horizontal slowness (inversion of apparent horizontal velocity) and backazimuth provided by array processing (Rost & Thomas, 2002). Here a standard array processing technique, frequency-wavenumber (f-k analysis) is used for the calculation of vector velocity of incoming waves (Aki & Richards, 1980). Most array methods use time delays of the signals recorded at different array stations and summation of the coherent data stream from each station to improve the signal-to-noise ratio (SNR) for a specific phase. The time delays required to bring the signals into phase provide a direct estimate of the backazimuth and the slowness of the signal.
One day of noise recording (Julian day 307) was subjected to beamforming/fk-analysis. With
this analysis on 2-D array, the phase velocity (km/s) as well as backazimuth (measured from north in degrees) is determined. There are different methods that can be used for phase velocity estimation but most widely used is the f-k analysis. We processed time window of 5 min duration using all stations and the three ground motion components.
3 Results and Discussion3.1 SPD and PDF
An example of 1-d-long records from station S1 (Figure 3) reveals large temporal variations of the seismic noise. The time-frequency series can be divided into three main phases (A, B, C) based on noise energy: phase A corresponds to low frequency (less than 2 Hz), phase B to the intermediate frequency range 2-10 Hz, and phase C to a high frequency (greater than 10 Hz) noise. Second band (B) is observed at frequency range 2-10 Hz where the energy of noise fluctuates greatly. Noise characteristics of band B show clear variations with the day-night periodicity and can be linked with the cultural activities near the site. The main observed cultural activities are workers at the farm, working of electrical motor, activities of cows in the form, mining activities (workers, rockfall, trucks) and villages (Rua da Matto) near the experimental site. These estimations are poor at frequencies less that 2 Hz due to sensor’s natural response. At frequencies, larger than 10 Hz results are noisy.
The above spectrograms also show one important feature. A change in the level of energy in the same band of microseism takes place at hourly basis. The spectrogram of S1, shows a significant energy fall in the band from ~ 3 to 9 Hz between 2 to 3 pm.
The PDFs are calculated from PSDs and then Peterson’s New High Noise Model (NHNM) and New Low Noise Model (NLNM) have been plotted for comparison (Figure 4). Results showed that PSDs of vertical components are different from zeros as well as they lie well between Peterson curves. We observe that the noise below 12 Hz is continuously being generated. According to Peterson, (1993) the noise level should be at least 20 dB less that NHNM at a frequency range of 1 to 20 Hz. There are very little variations on the noise recorded at E-W and N-S

217A n u á r i o d o I n s t i t u t o d e G e o c i ê n c i a s - U F R JISSN 0101-9759 e-ISSN 1982-3908 - Vol. 40 - 3 / 2017 p. 212-221
Microtremor Response of a Mass Movement in Federal District of Brazil Yawar Hussain; Hernan Martinez-Carvajal; Martin Cárdenas-Soto; Rogério Uagoda; Salvatore Martino & Muhammad B. Hussain
components which are because of tilting of sensors and are related to installation problem as well as some metrological factors like wind and rainfall etc. (Hussain et al. 2017). The first peak of micrometer is related to sensor’s natural frequency response. The second peak is observed above 2 Hz on the statistical model of environmental noise where energy levels with high probabilities are observed that never reach the NHNM. The noise at S8 has high energy than S1 while probability decreases at high frequencies. The noise probabilities of both stations never reach NHNM (Figure 4). The human activity generates noise that never surpasses the model of maximum seismic noise of Peterson (NHNM) during recording periods.
Figure 3 Time-frequency plot of PSD variations for S1. Color bar presents energy levels in decibels [dB] relative to the velocity (10 log 10 [(m/s) 2 /Hz]). Dashed white squares indicate different phases of of noise energy.
Figure 4 PDF of vertical component of S1 (inside) and S8 (outside).
3.2 HVSR
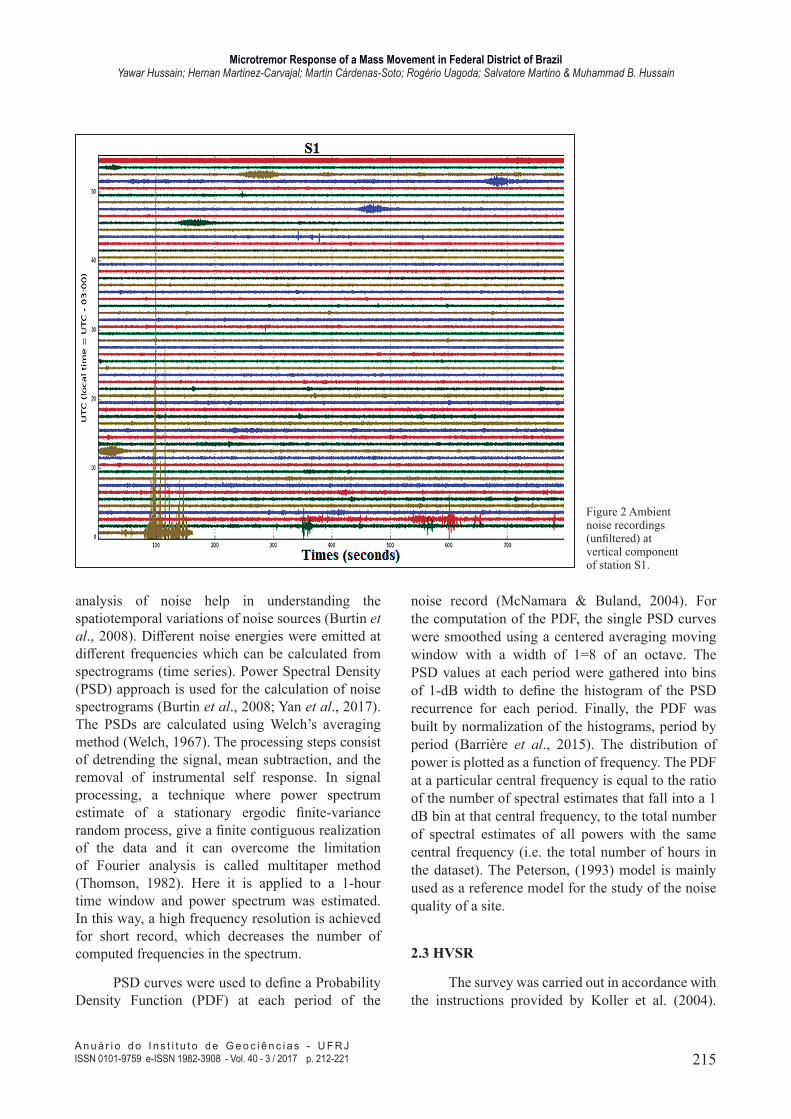
HVSR curves show a clear peak at a frequency of 2 Hz at all measuring points, inside as well as outside the mass movement (Figure 5). This peak shows that bedrock lies at relatively deeper depths. The attempts to localize the frequency of mass movement as well as the seasonal impacts not been successful which needs further detailed studies. Figure 5 shows that peak remains same both inside and outside the landslide mass. As we move from left to right inside the mass movement the secondary peak became more prominent at higher frequencies, especially at sensors S3 and S4. This peak is again observed at the stations S8 and S10 that lie directly
218A n u á r i o d o I n s t i t u t o d e G e o c i ê n c i a s - U F R JISSN 0101-9759 e-ISSN 1982-3908 - Vol. 40 - 3 / 2017 p. 212-221
Microtremor Response of a Mass Movement in Federal District of Brazil Yawar Hussain; Hernan Martinez-Carvajal; Martin Cárdenas-Soto; Rogério Uagoda; Salvatore Martino & Muhammad B. Hussain
upward the sensors S3 and S4. These secondary peaks may be related to mechanical vibration modes of the landslide mass. Future work will be focused on the determination of landslide mass frequency that differs from surround stable material. This frequency will help to mark the boundary of the landslide mass.
3.3 Frequency-Wavenumber (f-k)
In order to explore the incoming field wave, we applied f-k analysis to the seismic array in 5 seconds time windows along one hour of seismic noise. Figure 6 shows results for the Z component. In Figure 6a we observe that between 2.5 and 3.5 Hz velocities are close to 1700 m/s, however, around
4 Hz is not possible to define a velocity continuity. Between 4 and 16 Hz velocity values vary between 500 and 1500 m/s, but these values do not decrease as a function of the frequency, indicating the absence of surface waves. These waves are attenuated while passing through a highly deformed material (tropical clay) of mass movement. We observe that between 5 and 16 Hz the incoming wavefield arrive from 260 degrees. At 260 degree the prominent sources of noise are farm and village Rua de Matto. We observe that east-west (E-W) components show a more stable behavior for phase velocity value; higher values at low frequencies and lower values at high frequencies. Backazimuth values are interesting between 4 and 8 Hz, which arrives from 260 degrees of azimuth.
Figure 5 HVSR curves inside (S1-S4) and outside (S5-S10) the landslide mass.

219A n u á r i o d o I n s t i t u t o d e G e o c i ê n c i a s - U F R JISSN 0101-9759 e-ISSN 1982-3908 - Vol. 40 - 3 / 2017 p. 212-221
Microtremor Response of a Mass Movement in Federal District of Brazil Yawar Hussain; Hernan Martinez-Carvajal; Martin Cárdenas-Soto; Rogério Uagoda; Salvatore Martino & Muhammad B. Hussain
In Figure 7 average velocity values along 1 hr time windows for each frequency are given. A large dispersion is observed before 5 Hz. Between 5 and 16 Hz the incoming wave field comes from 260 degrees, but is not possible to obtain a dispersion curve. So the dispersion characteristics (phase velocity vs frequency) of surface become invisible after 6 Hz. Below 2 Hz there is no data of frequency response of the seismometers. The result indicates that incoming noise wave could compose of body waves at frequencies greater than 7 Hz.
4 Conclusions
This study aimed at the analysis of microtremor (>1 Hz) recorded at a mass movement in Brasilia, Brazil. Here obtained results output that the contribution to the noise recorded at stations inside and outside the analysed landslide mass is likely due to several factors including man-induced disturbance and instrument self-noise. Following conclusions are drawn from the analysis.
1. On PSD plot three frequency bands are observed where energy of recorded noise is a function of
Figure 6 The f-k analysis of E-W component: results as a function of the velocity (top); results as a function of the backazimuth (bottom).
Figure 7 Dispersion of recorded noise wavefield of Julian day 307. After 7 Hz there are little variations in phase velocity of wave with frequency.

220A n u á r i o d o I n s t i t u t o d e G e o c i ê n c i a s - U F R JISSN 0101-9759 e-ISSN 1982-3908 - Vol. 40 - 3 / 2017 p. 212-221
Microtremor Response of a Mass Movement in Federal District of Brazil Yawar Hussain; Hernan Martinez-Carvajal; Martin Cárdenas-Soto; Rogério Uagoda; Salvatore Martino & Muhammad B. Hussain
natural frequency response of sensors and an-thropic activities;
2. The recorded noise level was found lie in the NLNM and NHNM model of Peterson, (1993) for all stations and never reaches the NHNM;
3. Results of HVSR curves reveal a consistent and ubiquitous peak which is observed at all stations that is related to the thickness of Saprolite layer, i.e. to the local geological setting
4. From f-k analysis it is concluded that waves come at 260 degree azimuth are devoid of sur-face waves at higher frequency range (greater than 7 Hz).
5 Acknowledgments
The first author would like to thank CNPq and FAPDF for the financial support and Pool of Brazilian Equipments (PegBr), Rio de Janeiro, for providing seismometers used in this study.
6 References
Araki, M.S. 1997. Aspectos relativos às propriedades dos solos porosos colapsíveis do Distrito Federal. Programa de Pós-graduação em Geotecnia, Departamento de Engenharia Civil, Universidade de Brasília, Dissertação de Mestrado, 121p.
Ballmer, S.; Wolfe, C.J.; Okubo, P.G.; Haney, M.M. & Thurber, C.H. 2013. Ambient seismic noise interferometry in Hawai’i reveals long-range observability of volcanic tremor. Geophysical Journal International, 194(1): 512-523.
Barrière, J.; Oth, A.; Hostache, R. & Krein, A. 2015. Bed load transport monitoring using seismic observations in a low‐gradient rural gravel bed stream. Geophysical Research Letters, 42(7): 2294-2301.
Benjumea, B.; Macau, A.; Gabàs, A. & Figueras, S. 2016. Characterization of a complex near-surface structure using well logging and passive seismic measurements. Solid Earth, 7(2): 685-701.
Bonnefoy-Claudet, S.; Cotton, F. & Bard, P.Y. 2006. The nature of noise wavefield and its applications for site effects studies: A literature review. Earth-Science Reviews, 79(3): 205-227.
Burtin, A.; Bollinger, L.; Vergne, J.; Cattin, R. & Nábělek, J.L. 2008. Spectral analysis of seismic noise induced by rivers: A new tool to monitor spatiotemporal changes in stream hydrodynamics. Journal of Geophysical Research, 113(B05301):1-14.
Cannata, A.; Cannavò, F.; Montalto, P.; Ercoli, M.; Mancinelli, P.; Pauselli, C. & Leto, G. 2017. Monitoring crustal changes at volcanoes by seismic noise interferometry: Mt. Etna case of study. Journal of Volcanology and
Geothermal Research, 337: 165-174.Curtis, A.; Gerstoft, P.; Sato, H.; Snieder, R. & Wapenaar, K.
2006. Seismic interferometry-turning noise into signal. Leading Edge, 25(9): 1082-1092.
Del Gaudio, V.; Coccia, S.; Wasowski, J.; Gallipoli, M.R. & Mucciarelli, M. 2008. Detection of directivity in seismic site response from microtremor spectral analysis. Natural Hazards and Earth System Sciences, 8(4): 751-762.
Di Giulio, G.; Amoroso, S.; Di Naccio, D.; Falcucci, E.; Gori, S.; Hailemikael, S.; Vassallo, M.; Ciampaglia, A.; De Luca, G.; Del Grosso, A. & Di Marcantonio, P. 2014. The seismic microzonation of San Gregorio through a multidisciplinary approach. Seismic amplification in a stiff site. In: GIORGIO LOLLINO, ANDREA MANCONI, FAUSTO GUZZETTI, MARTIN CULSHAW, PETER BOBROWSKY, FABIO LUINO (Eds.), Engineering Geology for Society and Territory. Cham, Springer International Publishing, p. 1137-1141.
Entralgo, J.F.T. 2013. Análise espacial e estatística dos movimentos de massa deflagrados pelas chuvas dos dias 11 e 12 de Janeiro de 2011 na região serrana do Estado do Rio de Janeiro, Brasil. Programa de Pós-graduação em Geotecnia, Universidade de Brasília, Dissertação de Mestrado, 99p.
Fernandes, N.F. & Amaral, C. 1997. Movimentos de Massa: uma abordagem geológico-geomorfológica. In: GUERRA, A.P.T. & CUNHA, B. (Orgs.), Geomorfologia e Meio Ambiente. Rio de Janeiro, Editora Bertran Brasil, p. 123-194.
Ferreira, R.S. & Uagoda, R. 2015. Morphometric study of controls to Erosional Features and identification of areas susceptible to Mass Movement Hazards in the Contagem Watershed, Distrito Federal. Espaço & Geografia, 18(1): 187-216
Galea, P.; D’Amico, S. & Farrugia, D. 2014. Dynamic characteristics of an active coastal spreading area using ambient noise measurements-Anchor Bay, Malta. Geophysical Journal International, 199(2): 1166-1175.
Gallipoli, M.R.; Mucciarelli, M.; Šket-Motnikar, B.; Zupanćić, P.; Gosar, A.; Prevolnik, S. & Olumćeva, T. 2010. Empirical estimates of dynamic parameters on a large set of European buildings. Bulletin of Earthquake Engineering, 8(3): 593-607.
García-Jerez, A.; Navarro, M.; Alcalá, F.J.; Luzón, F.; Pérez-Ruiz, J.A.; Enomoto, T.; Vidal, F. & Ocaña. E. 2007. Shallow velocity structure using joint inversion of array and h/v spectral ratio of ambient noise: the case of Mula town (SE of Spain). Soil Dynamics and Earthquake Engineering, 27(10): 907-919.
Gomes, R.A.T.; Guimarães, R.F.; Carvalho, J.; Abílio, O.; Fernandes, N.F. & Amaral Júnior, E.V. 2013. Combining spatial models for shallow landslides and debris-flows prediction. Remote Sensing, 5(5): 2219-2237.
Gosar, A. & Lenart, A. 2010. Mapping the thickness of sediments in the Ljubljana Moor basin (Slovenia) using microtremors. Bulletin of Earthquake Engineering, 8(3): 501-518.
Hussain, Y.; Cárdenas-Soto, M.; Martinez-Carajal, H.; Uagoda, R.; Soares, J. & Martino, S. 2017. Spectral Analysis of the Recorded Ambient Vibration at a Mass Movement in Brasilia. In: SYMPOSIUM ON THE APPLICATION OF GEOPHYSICS TO ENGINEERING AND ENVIRONMENTAL PROBLEMS, 1, 2017, Denver, Abstracts, EEGS, p. 214-218.
Imposa, S.; Grassi, S.; Fazio, F.; Rannisi, G. & Cino, P. 2017.

221A n u á r i o d o I n s t i t u t o d e G e o c i ê n c i a s - U F R JISSN 0101-9759 e-ISSN 1982-3908 - Vol. 40 - 3 / 2017 p. 212-221
Microtremor Response of a Mass Movement in Federal District of Brazil Yawar Hussain; Hernan Martinez-Carvajal; Martin Cárdenas-Soto; Rogério Uagoda; Salvatore Martino & Muhammad B. Hussain
Geophysical surveys to study a landslide body (north-eastern Sicily). Natural Hazards, 86(2): 327-343.
Kalil, A.E.; Hazeif, H.E.A. & Mossa, H. 2016. The efficiency of horizontal to vertical spectral ratio technique for buried monuments delineation (case study, Saqqara (Zoser) pyramid, Egypt). Arabian Journal of Geosciences, 9(1): 1-9.
Koller, M.; Chatelain, J.L.; Guillier, B.; Duval, A.M.; Atakan, K.; Bard, P.Y. & SESAME Team. 2004. Practical user guidelines and software for the implementation of the H/V ratio technique: measuring conditions, processing method and results interpretation. In: PROCEEDINGS OF THE WORLD CONFERENCE IN EARTHQUAKE ENGINEERING, 13, 2004, Vancouver, paper # 3132.
McNamara, D.E. & Buland, R.P. 2004. Ambient noise levels in the continental United States. Bulletin of the Seismological Society of America, 94(4): 1517-1527.
Mendonça, A.F.; Pires, A.C.B. & Barros, J.G.C. 1994. Pseudosinkhole occurrences in Brasilia, Brazil. Environmental Geology, 23(1):36-40.
Méric, O.; Garambois, S.; Malet, J.P.; Cadet, H.; Gueguen, P. & Jongmans, D. 2007 Seismic noise-based methods for soft-rock landslide characterization. Bulletin de la Société Géologique de France, 178(2): 137-148.
Nakamura, Y. 2008. On the H/V spectrum. In: THE 14TH WORLD CONFERENCE ON EARTHQUAKE ENGINEERING, BEIJING, China.
Nakata, N.; Snieder, R.; Kuroda, S.; Ito, S.; Aizawa, T. & Kunimi, T. 2013. Monitoring a building using deconvolution interferometry. I: Earthquake‐data analysis. Bulletin of the Seismological Society of America, 103(3): 1662-1678.
Nogoshi, M. & Igarashi, T. 1971. On the amplitude characteristics of microtremor (Part 2). Journal of the Seismological Society of Japan, 24(1): 26-40.
Olivier, G.; Brenguier, F.; Campillo, M.; Roux, P.; Shapiro, N.M. & Lynch, R. 2015. Investigation of coseismic and postseismic processes using in situ measurements of seismic velocity variations in an underground mine. Geophysical Research Letters, 42(21): 9261-9269.
Panzera, F. & Lombardo, G. 2013. Seismic property characterization of lithotypes cropping out in the Siracusa urban area Italian. Engineering Geology, 153: 12-24.
Parolai, S.; Richwalski, S.M.; Milkereit, C. & Bormann, P. 2004. Assessment of the stability of H/V spectral
ratios from ambient noise and comparison with earthquake data in the Cologne area (Germany). Tectonophysics, 390(1): 57-73.
Pazzi, V.; Tanteri, L.; Bicocchi, G.; D’Ambrosio, M.; Caselli, A. & Fanti, R. 2016. H/V measurements as an effective tool for the reliable detection of landslide slip surfaces: Case studies of Castagnola (La Spezia, Italy) and Roccalbegna (Grosseto, Italy). Physics and Chemistry of the Earth, Parts A/B/C, 98: 136-153.
Peterson, J. 1993. Observation and modeling of seismic background noise. USA, Geological Survey Open File report 93-322, 95p.
Planès, T.; Mooney, M.A.; Rittgers, J.B.R.; Parekh, M.L.; Behm, M. & Snieder, R. 2015. Time-lapse monitoring of internal erosion in earthen dams and levees using ambient seismic noise. Geotechnique, 66(4): 301-312.
Planès, T.; Rittgers, J.B.; Mooney, M.A.; Kanning, W. & Draganov, D. 2017. Monitoring the tidal response of a sea levee with ambient seismic noise. Journal of Applied Geophysics, 138: 255-263.
Rost, S. & Thomas, C. 2002. Array seismology: Methods and applications. Reviews of Geophysics, 40(3): 2-27.
Thomson, D.J. 1982. Spectrum estimation and harmonic analysis. Proceedings of the IEEE, 70(9): 1055-1096.
Ullah, I.; Prado, R.L & Hussain, Y. 2016. Thickness and shear wave velocity measurement of sediment package at meteorite impact crater site of Colonia, Sao Paulo City, Brazil. In: SIMPÓSIO BRASILEIRO DE GEOFÍSICA, 7, 2016, Ouro Preto, Anais, UFOP, p. 06.
Welch, P. 1967. The use of fast Fourier transform for the estimation of power spectra: a method based on time averaging over short, modified periodograms. IEEE Transactions on Audio and Electroacoustics, 15(2): 70-73.
Yan, Y.A.N.; Cui, P.; Chen, S.C.; Chen, X.Q.; Chen, H.Y. & Chien, Y.L. 2017. Characteristics and interpretation of the seismic signal of a field-scale landslide dam failure experiment. Journal of Mountain Science, 14(2): 219-236.
Zoby, J.L.G. 1999. Hidrogeologia de Brasilia–DF, Bacia do Ribeirão Sobradinho. Programa de Pós-graduação em Geociências, Universidade de Sao Paulo. Dissertação de Mestrado, 178p.