a study of sorghum production potential in the semi...
TRANSCRIPT

EMPRESA BRASILEIRA DE PESQUISA AGROPECUÁRIA
DEPARTAMENTO DE MÉTODOS QUANTITATIVOS
A STUDY OF SORGHUM PRODUCTION POTENTIAL IN THE
SEMI-ARID TROPIC OF BRAZIL
Fernando Luis GaragorryEveraldo Rocha PortoAntonio Williams MoitaAderaldo de Souza SilvaHomero Chaib Filho
DMQ/A/62 Novembro,1982

A STUDY OF SORGHUM PRODUCT10N POTENT1AL 1N THE SEM1-AR1DTROPIC OF BRAZIL
Fernando Luis Garagorry, Everaldo Rocha Porto,Antonio Williams Moita, Aderaldo de Souza Silva
and Homero Chaib Filho
Brazilian Agricultural Research Corporation
SUMMARY
The paper presents the appiication of a computerizedagroclimatic system to the study of sorghum production potential inthe semi-arid tropic of Brazil. After a brief description of the sy~tem, the resuits obtained for a sampie of counties are discussed.Ln particular, the paper .í.Ll.ust rat.es the use of clustering techniquesin connection to agroclimatic zoning. The use of the system in relation to complementary irrigation studies is also stressed.
1NTRODUCT10N
The work on agroc 1ima tic mo de I, ing performed at E1'1BRAPAhas evolved over a period of six years. During ali this time, theeffort has been centered on the study of the semi-arid tropic ofBrazil. 'I'be main interest is at the farm levei; but, in order to setmeaningful priorities for farming systems research, it was found thatsome work at the county Cmunicipaiity) levei would be required.

2
The main objectives, at the county leveI, have bceenthe following:(1) to assess mean productivity and best planting period for sevaal
crops (mainly beans, corn, sorghum, cotton and cowpeal i
(2) to estimate the amount of excess water that, eventually, couJdbe available to the crops by means of non-traditional irrig~liontechniques.
A substantial part of the county leveI studies isperformed with a computerized agioclimatic system. In the next section, an outline of the computer system, in its present form, willbe given. It evolved from a large program to a system of programs.This gives flexibility to the user, since the system can opperatewith different formulas to estimate potential evapotranspiration,and the user can choose a variety of printouts or can perform hisown analysis of output values.
Then, some of the results obtained through the system will be presented. They refer to sorghum production potential in32'counties of 8 states of the semi-arid tropic of Brazil.
Finally, some indications on future work related tostudies of sorghum production potential will be presented.
D1BRAPA'S COMPUTERIZED AGROCLlMATIC SYSTEM
General description
The main components of EMBRAPA's computerizedclimatic system, in its present form, are presented in Fig. 1.
the following, a brief description of these components is given.Temporary disk files, used to pass information from one programanother, are not shown in Fig. 1.
agr~In
to

ClIM ATIC
DATA
GETDATA 1
REPORT
Fig. 1. Ef~BRAPA'S computerized a qroc l ima t ic system.
3
SELEC='STATIO~
MOD~~- ( O_T_H_E_R ~_.---fL DATA
SIMULATlON
RESULTS
GETDATA 2
RESANAL
REPORT
SELECTED
VARIABLES
4
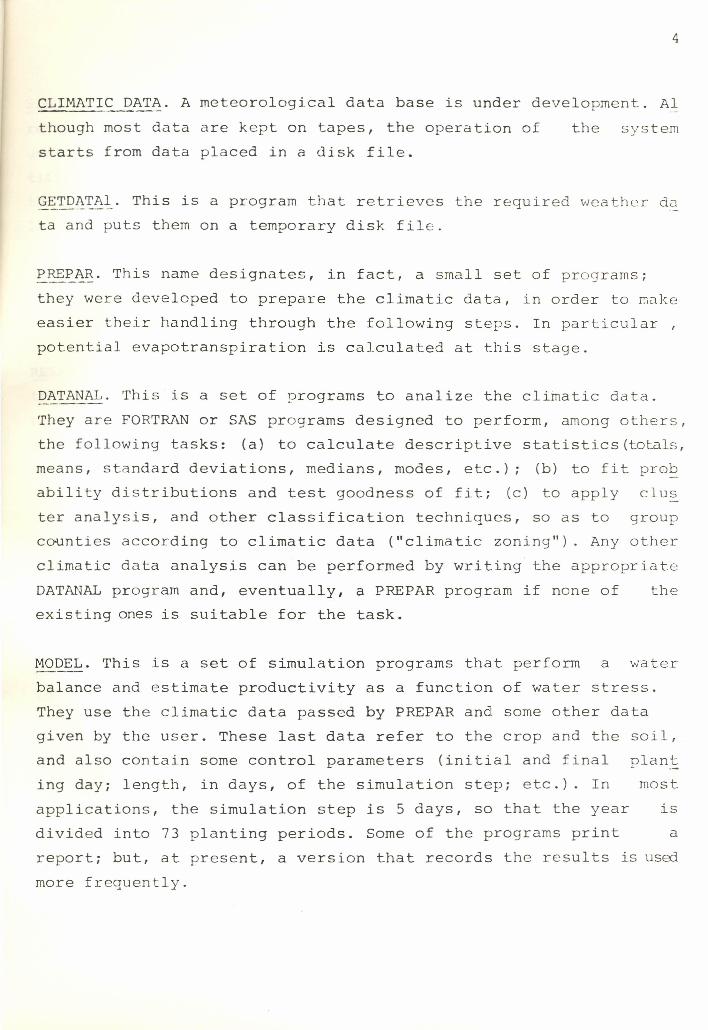
CLIMATIC DATA. A meteorological data base is under development. A!though most data are kept on tapes, the operation of the systemstarts from data placed in a disk file.
º-~TDATA~. This is a program that retrieves the required weather data and puts them on a temporary disk file.
~.~E~~~. This name designates, in fact, a small set of programs;they were developed to prepare the climatic data, in order to makeeasier their handling through the following steps. ln particular,potential evapotranspiration is calculated at this stage.
p~TA~AL. This is a set of programs to analize the climatic data.They are FORTRAN or SAS programs designed to perform, among others,the following tasks: (a) to calcula te descr ipti ve sta tistics (totaIs,means, standard deviations, medians, modes, etc.); (b) to fit pro~ability distributions and test goodness of fit; (c) to apply cluster analysis, and other classification techniques, 50 as to groupcounties according to climatic data ("climatic zoning"). Any otherclimatic data analysis can be performed by writing the appropriateDATANAL program and, eventually, a PREPAR program if none of theexisting ones is suitable for the task.
~~~EL. This is a set of simulation programs that perform a waterbalance and estimate productivity as a function of water stress.They use the climatic data passed by PREPAR and some other datagiven by the user. These last data refer to the crop and the soil,and also contain some control parameters (initial and final plan~ing daYi length, in days, of the simulation stepi etc.). ln mostapplications, the simulation step is 5 days, 50 that the year isdivided into 73 planting periods. Some of the programs print areporti but, at present, a version that records the results is usedmore frequently.

5
SIMULATION RESULTS. This is a permanent disk file that stores theresults obtained from MODEL. In fact, along with the results, theuser provided data ("OTHER DATA" in Fig. 1) and some station identification informations are also recorded by the mod eL, In this way,the user will be able to perform any analysis of the results at alater time .
.~~~~~'!:~~ This is a program that retrieves the required sí.rnuLa t i ori
results from the previous file and puts them on a te~porary diskfile .
.~E~AN~. This is a set of programs designed to perform, arrongothers,the following tasks: (a) to print simulation resul ts; .(b) to applycluster analysis, and other classification techniques, 50 as togroup counties according to their estimated productivity or waterperformance with respect to the given crop ("agroclimatic zoning").
CommentsThe system is in continuous development along the
following lines: (1) more climatic data are being recorded on tapes;(2) more programs are being added to the basic steps shown in Fig.1.
Over the last years, it evolved from one program thatprepared the data, run the water balance and printed the results ,to the present situation. It can be said that the main concern hasbeen on modularization, both at system and program levels. Eachprogram of the system must be directed to a specific task; eachroutine of a program must be small (maximum of one printout page)and perform a simple function.
The model runs a water balance for each plantingperiod of each year for which rainfall data are available. The results are collected into simple statistics (frequencies and means),which are recorded on the SIMULATION RESULTS file (Fig. 1). Norainfall probability distribution is used, since the model workswith the original values. The only preparation required is a sum

6
of the cIimatic data (rainfall and evapotranspiration) corresponqing to each period.
One of the more useful aspects of the system is thatit records the simuIation results. In this way, the user can applyalI sorts of numeric or graphic techniques to analyse thf' rcsults,and this can be done at any time. This is !)Cl.rticularly use f u l vzi t.h
regard to the zoning work, where the simula tion resul ts for i;t_"·Xü
counties must be jointly analysed.
SORGHUM PRODUCTION POTENTIAL IN THE SEMI-ARIDTROPIC OF BRAZIL
The computerized system has been applied to the studyof sorghum production potential in the semi-arid tropic of Brazil.To illustrate the results, a set of 32 counties has been used. Theyf orm an intentional sample, chosen so as to represent the differentstates and geographic conditions of the region.
The model caIculates a productivity index for eachpIanting period in each year. This is a number between O and 1 ,representing the quotient YA/YP (actual yieId divided by potentialyieId). At the end, the program caLc uLat.es the mean index vaIue foreach pIanting period over the simulation years. Working with asimuIation step of 5 days, the model produces, for each county, avector with 73 components (the productivity indexes) whichcharacterize the county (Fig. 2). SimiIarIy, the model estimatestwo other vectors of 73 components; one of them gives the meanexcess (run-off) water and the other the mean deficit (potentialminus actual evapotranspiration), in millimeters, for each planting

7
1.0,- - - - - - - - - - - - - - - - - - - - - - - - - - - - - - - - - - - - - - - - - - - - - - - - - - - - - - - - - - - - - - - - --,
PROOUC
.. .. .TIVI 0.5TY
COUNTY: JAICÓS
STATE: PIAUI
BEST EPOCH :JANUARY
....
INOEX
I,II
I,,,I •I • • • ••
I •• • •••t •••• 0o o I ••• _ •••••••• -.
~ • - - - •• - ••• - --. -1- - - • - • - - - - - _. - - - - - - ••• - - - • _. - - - - - - - • - - • - - •••• - •••• -- --73
......
PROOUCTIVITy
,.o:-·~------_ .._----------------------_ ..__ .._-_ .._----------- ..---------I, ...
COUNTY: ÁGUA BRANCA
STATE: ALAGOAS
BEST EPOCH: MAY..
I
0·5 I
.......NOEX
.........,
0.0 ~•.. __ .. _.... ; .... - ..... _. - .... _. - - - - - . - - . - . - - - - - . ;3- - - - - - - - - - - - --
PLANTING PERIOD
Fig. 2. Mean productivity indexes and best planting epoch for two counties ,showing totally different patterns.

8
·400:III
COUN TV o JAICÓS
STATE : PIAUI
I
300.tilILLIMETERS
I
I
I200 I
o''0
.. ....-.
100 III
I
I
.- ..:.... o
o
o ••00
IO.--.-_ ..... -_ .•. - ..•... ---
I .COUNTV: AGUA BRANCA
STATE : ALAGOAS·300.
M .I
..LL .I
..M 200 :·ETER I
S I
100 :
•..
'._.. . .....o •.... ..... ......... ....
Q.----------.-.----i.-----------.---_.".--------_..-----------;3- - - - . - - -
PLANTlNG PERIOD EXCESS
DEFICIT
Fig. 3. Excess and deficit for two counties, showing totally different patterns.

9
period (rig, 3).
and be the
vectors af praductivity indexes for two given counties Cl and C2.Let the ~uclidean distance between Cl and C2 be defined as
73í 1L (D.
- l
i=l
Having defined a distance on the set of countjes ,different clustering techniques can be used in order to find meaningful groups (clusters) of counties (see, for instance, HARTIGAN1975, JARDINE and SIBSON 1971, SNEATH and SOKAL 1973). In thiswork, an algorithm developed by GARAGORRY and PALMA (1980), thatworks under the SAS package, has been used. The algorithm p~ucesa set af clusters which minimizes the maximum diameter of theclusters (as usual, the diameter of a cluster is the maximum distance between any two members of the cluster). The idea, of course,is'that the counties in each cluster will have similar productivitypatterns. Working on the computer output of the clusteringalgorithm, it is possib1e to identify clearly defined groups ofcounties. Table 1 gives a summary of the results obtained throughthe application of cluster analysis.
Table 1. Results obtained by c1uster ana1ysis
SORGHUM BEST PLANTING NUMBER OFCLUSTER Pü'l'BN'l'IAL EPOCH COUNTIES
1 HIGH JAN 32 HIGH MID-APR/MID-JUN 93 FAIR MID-JAN/MID-MAR 74 FAIR MID-APR/MID-JUN 65 FAIR MID-OCT/MID-FEB 16 POOR 6
Clusters 2 and 4 constitute a sort of surprise ,since t.here was no informa tion about sorghum planted around 1'1ay

10
This will certainly be the object of further research since,according to the model, in a large proportion of counties, some ofthem with very high estimated potencial, planting should be donefrom ~pril to June.
Different distances between two counties weredefjned using the excess water or the deficit vectors, instead ofthe productivity .indcx vectors. In a11 cases, the resu1ts oetai.nedthrough c1uster analysis were consistent with the above prcse~tation.
~~~nty _l:evel-~eco~enªa tio~~Zoning means classification or grouping. In this
sense, computerizeo data analysis techniques can be he1pful toobtain an initial c1assification. The final zoning can be obtainedby the combination of that classification with other agroclimaticarguments.
On the other hand, independently of the work onagroclimatic zoning, it is convenient to know specific results foreach county. In particular, the best planting season, maximumestimated productivity and maximum estimated run-off can be printedfor each county. This information is useful to farmers, extensionagents and researchers. Table 2 gives a sample of the sort ofcountylevel results that can be obtained from the system. Productivityindexes are presented in 10% interva1s; the highest interva1 reachedis used, in Tab1e 2, to define the best planting season for eachcounty. Estimated maximum run-off and the period when it occurs area1so shown in Table 2.

11
Table 2. 1nformation on individual counties, ordered by states. (a)
COUNTYMAXIi1UM PRODUCTIV1TY 1NDEX
PLANTINGH~XDv1U!'1EXCESS i'll'I.TER
SEASON %INTERVAL PERIOC mrn
._--------
~~~~~Água Branca APR16-JUN09 80- 90 APR21-APR25 303Delmiro Gouveia APR16-HAI20 50- 60 FEB2S-!V-\ROl 63111ata Grande HIH06-MAI25 90-100 APR2 6-1\T'R3 O 420Palmeira dos índios APR21-JUN14 90-100 APR21-APR2S 399pão de Açúcar APRII-MAI2S 60- 70 1\PR21-APR25 107Penedo (b) APROI-JUN19 90-100 APR16-APR20 568Piranhas APR26-MAIIO 60- 70 APRll-J.,.PRl5 59Poço das Trincheiras MAIII-MA120 80- 90 APR26-APR30 lor./::>Santana do 1panema APR21-JUN09 80- 90 APR21-APR25 275Bahia--- OCT08-FEB04Barreiras 60- 70 NOV07-NOVll 301Irecê OCT18-NOV21 40- 50 NOV12-NOV16 133Senhor do Bonfim APRII-MAI25 60- 70 JAN21-JAN2S 117
(a) States names are underlined.(b) 'I'h i s county does not belong to the SAT of Braz.il; it was included
for comparison.
1n general, a very good agreement was found betweenthe estimates of the maximum productivity index and the maxirnurnexcess water. But, in rnost cases, the period with maxirnurnrun-offpreceeds the rnid-point of the best planting intervalo This indicatesthat it may not be appropriate to equate best planting period withperiod of rnaxirnurnrun-off, and that the use of a productivity indexshould be encouraged, although much more research is required inthis area.
Excess water studiesA major line of research at CPATSA (ElI1BRAPAI S
research center for the semi-arid tropic) is the use of excess waterthrough non-traditional techniques, in order to provide oomplernentLryirrigation at critical stages of the crop growth. The modelestillBtes

12
the mean excess water (run-offl for each planting period. Excesswater, or run-off, is defined, in the IDodel, as the amount of waterthat cannot be held in the reservoir; therefore, it refers both tosurface run-off and deep infiltration. For that reason, an apprDpriatetechnology to retain and use most of the excess water estimatccby the model may not be available. Nevertheless, those va1ues givean idea about the potentia1 to introduce, into a given COUTlty, thecomp1ementary irrigation techno1ogy a1ready tested at CPATSA withvery encouraging resu1ts.
CONCLUSIONS
As stated before, EMBRAPA's computerized agroclillBticsystem is under continuous improvement. At the same time, severalfi~ld experiments are being conducted, in order to estimate cropresponse to water and to study root development.
Severa1 computer experiments are required so as toknow, in more detai1, the model sensitivity with regard to thefo1lowing aspects: (1) changes in the crop coefficients (length ofthe pheno1ogical phases, productivity function coefficients, etc.);(2) changes in the crop-soi1 coefficients (root development). A1so,different clustering technigues should be tested in re1ation tozoning studies.
More importantly, the work with the agroc1imaticmodel should be combined with the use of a more detai1ed sorghumproduction modelo This will be useful to obtain more insight withregard to sorghum production potential in those counties that alreadyshow good prospects with the present modelo

13
REFERENCES
1. GAR.z\GORRY,F.L. & PALMA, O. r. (1980). "Aplicaç::ío de pr o q r ar 'cãointeira ~ construç5o de conglomerados", Tech. Rep. DMQ/A/47,
E1'1BRAPA, Brasília.
2. HARTIGAN, J. A. (1975). ~lust~rinLA1gorithms, Wi1ey.
3 .. JARDINE. N. & SIBSON. R. (1971). Mathematical Taxon0!!l.-Y, Wi1ej.
4. SNEI\.TH, P.H.A. & SOKAL, R.R .. (1973). Numerical_~axon?_~:::.~~
PriI::!'::-!:ples and Practice of Numeric::.§..l C1.::issification), W. H.
Freeman and Co., San Francisco.