urban and territorial ecology · urban and territorial ecology ecologia territorial e urbana ......
TRANSCRIPT
03-03-2016
1
Urban and Territorial Ecology Ecologia Territorial e Urbana
Joana Mourão (Arch. PhD)
Doutoramento em Urbanismo
Módulo 0 – Introduction/Introdução
Conceitos e Enquadramento
Módulo 1 – Ecological Buildings and Territories/ Edificação e Territórios Ecológicos
Edifícios, Bairros e Territórios
Módulo 2 – Low Carbon Urban Planning/ Planeamento Urbano Baixo Carbono
Freguesias, Cidades e Municípios
Módulo 3 – Urban Environmental Asessment/ Avaliação de Impactes da Urbanização
Bairros e grandes urbanizações
Módulo 4 – Urban Metabolism Evolution/ Evolução do Metabolismo Urbano
Regiões e Áreas metropolitanas
2
Territorial and Urban Ecology – All Contents:

03-03-2016
2
Módulo 2 – Low Carbon Urban Planning/ Planeamento Urbano Baixo Carbono
- Ecological Cities and Territories
- Urban Metabolism
- Low Carbon Environmental comittments
- Low Carbon Urban Metabolism
- Analysis of Urban Sectors
- Urban Planning Scenarios
- Conclusions
3
Territorial and Urban Ecology – M2 Contents:
M2. Low Carbon Urban Planning
Research Questions:
1. What are Ecological Cities? Are they depending on Ecological
Territories?
2. How is the Metabolism of Ecological Cities, Ecological
Territories and Ecological Economies?
3. Can the urban and territorial metabolism to become a low
carbon metabolism?
4. How do we plan a low carbon urban and territorial
metabolism?
5. Which are the main challenges for low carbon urban and
territorial planning?
4
03-03-2016
3
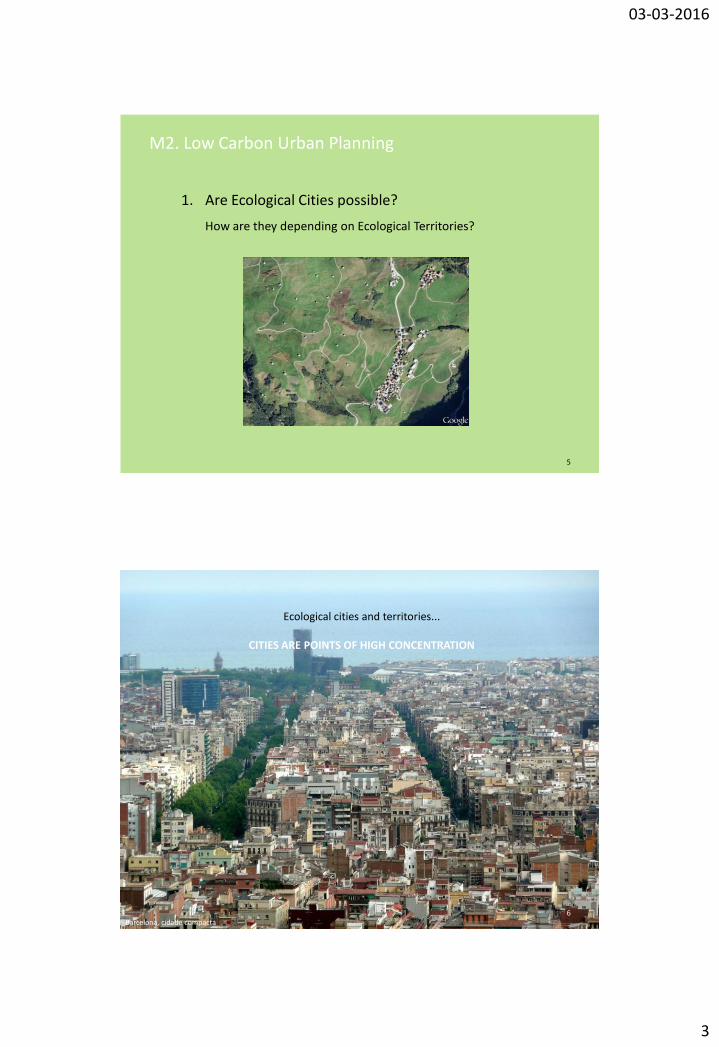
M2. Low Carbon Urban Planning
1. Are Ecological Cities possible?
How are they depending on Ecological Territories?
5
Barcelona, cidade compacta 6
Ecological cities and territories...
CITIES ARE POINTS OF HIGH CONCENTRATION
03-03-2016
4
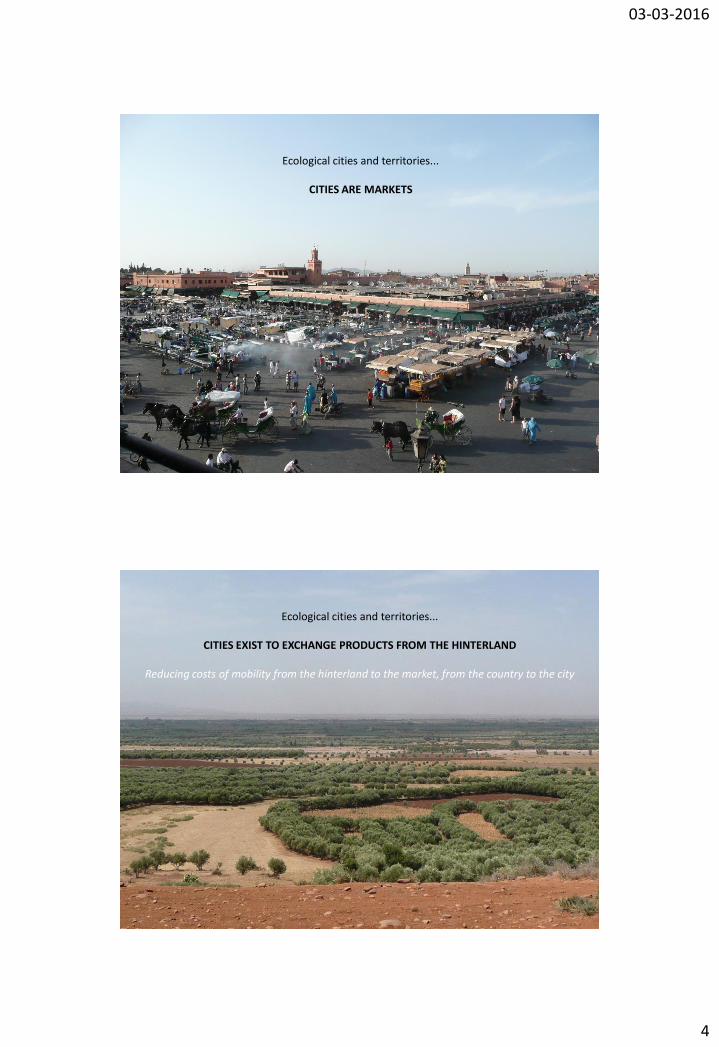
Ecological cities and territories...
CITIES ARE MARKETS
Ecological cities and territories...
CITIES EXIST TO EXCHANGE PRODUCTS FROM THE HINTERLAND
Reducing costs of mobility from the hinterland to the market, from the country to the city
03-03-2016
5
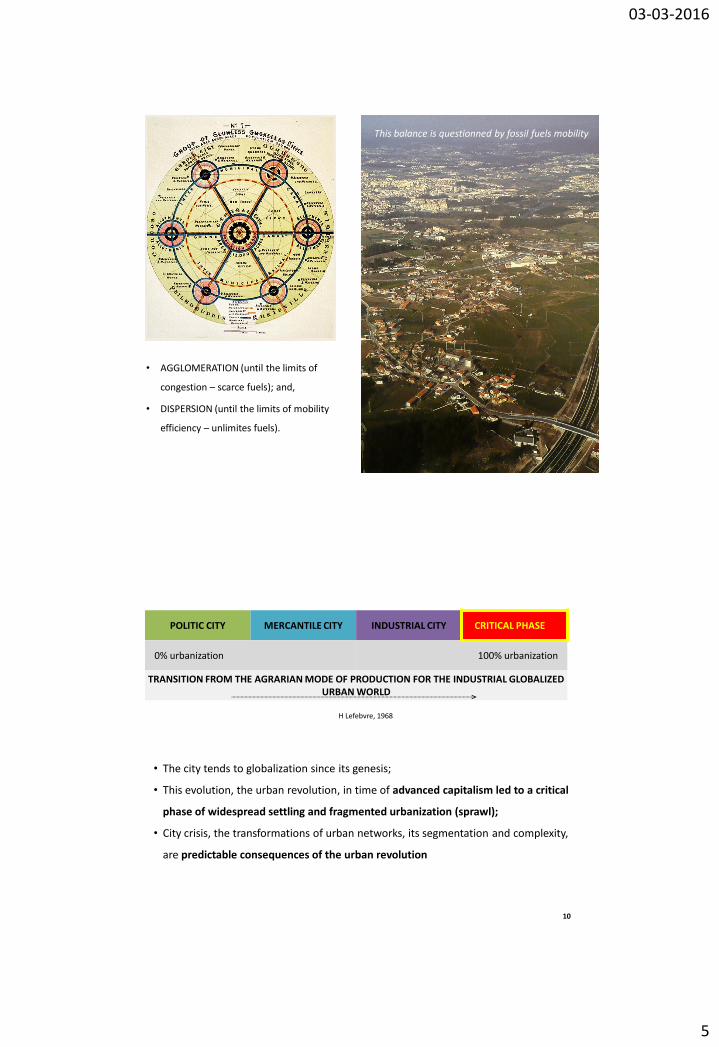
• AGGLOMERATION (until the limits of
congestion – scarce fuels); and,
• DISPERSION (until the limits of mobility
efficiency – unlimites fuels).
This balance is questionned by fossil fuels mobility
POLITIC CITY MERCANTILE CITY INDUSTRIAL CITY CRITICAL PHASE
0% urbanization 100% urbanization
TRANSITION FROM THE AGRARIAN MODE OF PRODUCTION FOR THE INDUSTRIAL GLOBALIZED URBAN WORLD
H Lefebvre, 1968
• The city tends to globalization since its genesis;
• This evolution, the urban revolution, in time of advanced capitalism led to a critical
phase of widespread settling and fragmented urbanization (sprawl);
• City crisis, the transformations of urban networks, its segmentation and complexity,
are predictable consequences of the urban revolution
10
03-03-2016
6
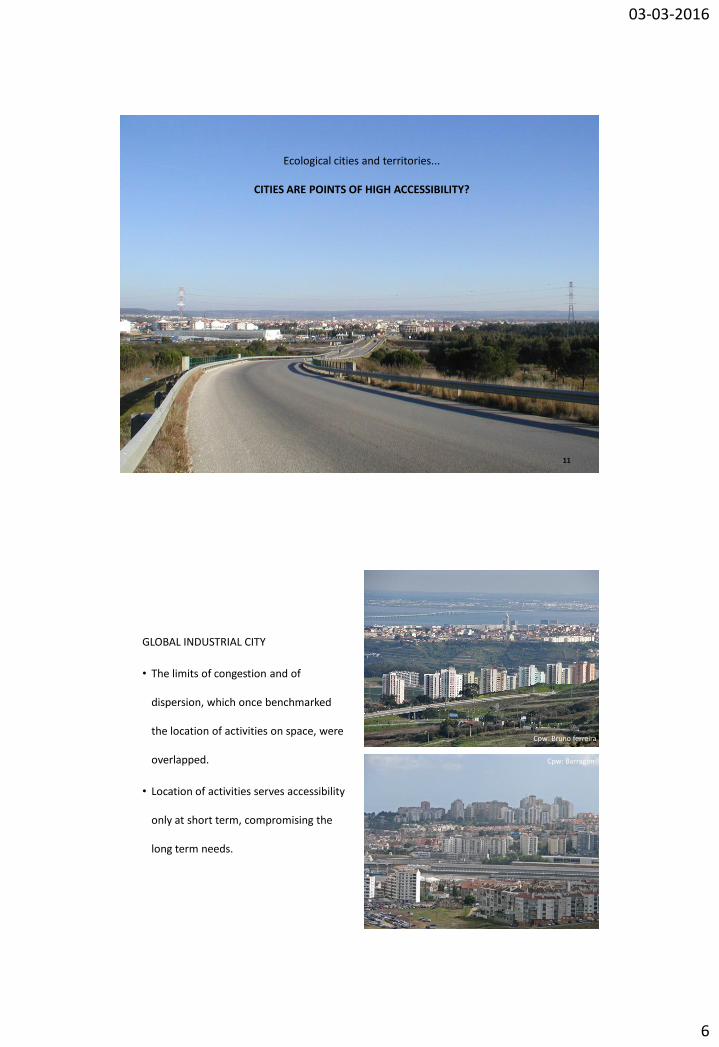
Ecological cities and territories...
CITIES ARE POINTS OF HIGH ACCESSIBILITY?
11
GLOBAL INDUSTRIAL CITY
• The limits of congestion and of
dispersion, which once benchmarked
the location of activities on space, were
overlapped.
• Location of activities serves accessibility
only at short term, compromising the
long term needs.
Cpw: Bruno ferreira
Cpw: Barragon

03-03-2016
7
RISKS:
• Urbanization growing without limits,
resulted on traffic congestion, urban
sprawl, emptying of urban centres,
environmental contamination and high
carbon emissions.
• Generalized accessibility, while it lasts,
supports high carbon urban territories
and policies contradicting the ecological
change of paradigm.
M2. Low Carbon Urban Planning
2. How is the Metabolism of Cities and Territories in
industrial globalized times?
Can it be more sustainable?
14
03-03-2016
8
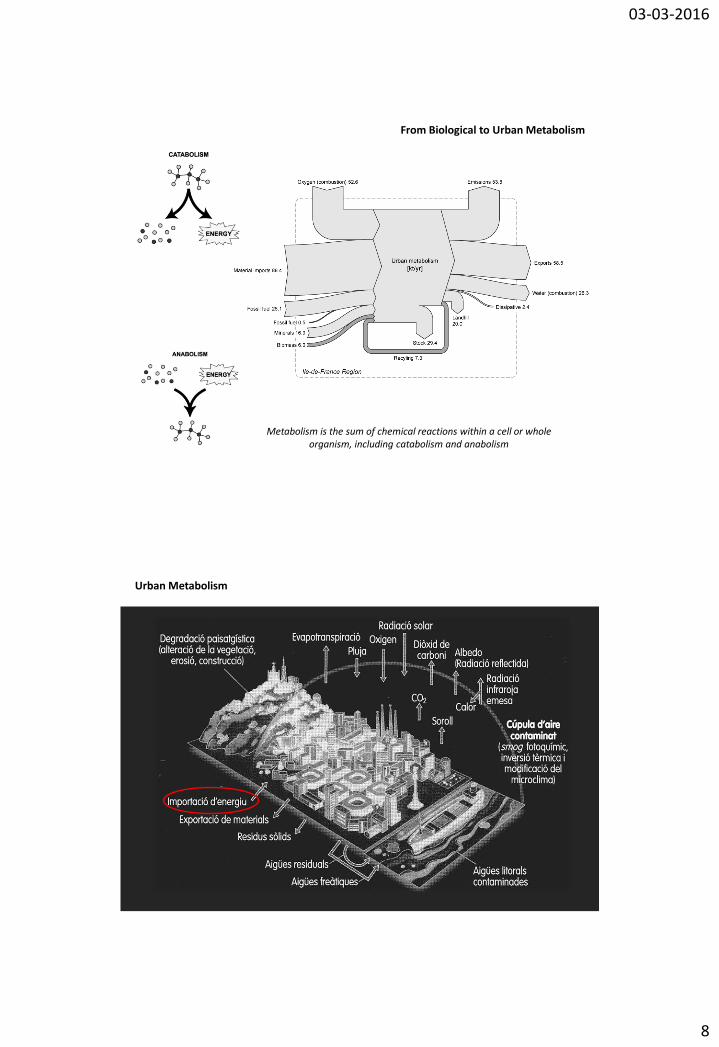
From Biological to Urban Metabolism
Metabolism is the sum of chemical reactions within a cell or whole organism, including catabolism and anabolism
Urban Metabolism

03-03-2016
9
LAND EFFICIENCY
WATER EFFICIENCY CONFORT AND ADAPTATION
ENERGY EFFICIENCY
CONSTRUCTION ECO EFFICIENCY
MATERIAL ECO EFFICIENCY
ECOLOGICAL URBAN SPACES
17
LAND MATERIALS
ORG WASTE
EMISSIONS
WASTE
EFLUENTS
AÇO, CIMENTO, TIJOLO
URBAN
METABOLISM
BIOMASS
ALIMENTAÇÃO
DEMOLIÇÃO
ALT CLIMATICAS
COMPOSTAGEM
P, N, K, C
REUTILIZAÇÃO
VIDRO, PAPEL, PLSTC.
METAIS
PESADOS
M. ORGÂNICA
P, N, K, C
RECICLAGEM
ENERGY
ELECTRICIDADE
COMBUSTÍVEIS
ENERGIAS REN.
WATER
AG. PLUVIAIS
AG. POTÁVEL
18
Urban Metabolism
Measuring contamination will allow a better control of the impacts of the social metabolism
RESOURCES
CONTAMINATION
03-03-2016
10
LAND MATERIALS
ORG WASTE
EMISSIONS
WASTE
EFLUENTS
AÇO, CIMENTO, TIJOLO
URBAN
METABOLISM
BIOMASS
ALIMENTAÇÃO
DEMOLIÇÃO
ALT CLIMATICAS
COMPOSTAGEM
P, N, K, C
REUTILIZAÇÃO
VIDRO, PAPEL, PLSTC.
METAIS
PESADOS
M. ORGÂNICA
P, N, K, C
RECICLAGEM
ENERGY
ELECTRICIDADE
COMBUSTÍVEIS
ENERGIAS REN.
WATER
AG. PLUVIAIS
AG. POTÁVEL
19
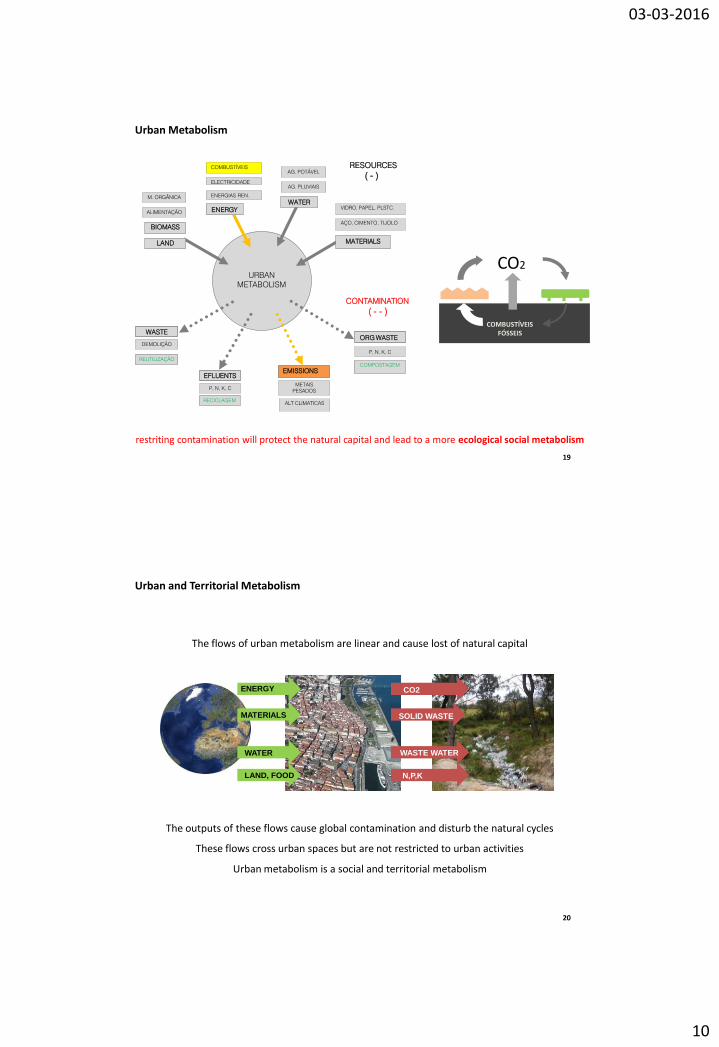
Urban Metabolism
restriting contamination will protect the natural capital and lead to a more ecological social metabolism
COMBUSTÍVEIS FÓSSEIS
CO2
CONTAMINATION
( - - )
RESOURCES
( - )
ENERGY CO2
WATER
LAND, FOOD N,P,K
MATERIALS
WASTE WATER
SOLID WASTE
The flows of urban metabolism are linear and cause lost of natural capital
20
Urban and Territorial Metabolism
The outputs of these flows cause global contamination and disturb the natural cycles
These flows cross urban spaces but are not restricted to urban activities
Urban metabolism is a social and territorial metabolism

03-03-2016
11
• Where do the flows of urban metabolism occur? In urban infrastructures (Buildings,
networks, roads...)
• Urban infrastructures have been responsible for managing a large part of the flows and
processes of Urban and Territorial Metabolism without control of the impacts of these flows
• How do the flows of urban metabolism can be regulated? Through new objectives for
urban governance and through ecological urban proposals
• Ecological urban planning is seeking for an efficient role on the planning of the material and
energetic flows of an urban system to assure a greater sustainability and lower carbon
emissions of these systems
21
Planning Urban and Territorial Metabolism
High Carbon Urban and Territorial Metabolism!
Carbon Emissions came out mostly from burning fossil fuels in
the mobility and in the use of energy in urban systems
Carbon sequestration by the ecosystems is not sufficient to
regulate the carbon cycle
To restrict the inputs of non renewable energy flows and to
increase energy efficiency reduces the outputs of carbon
emissions
Fon
te:
Cid
ade
e D
emo
crac
ia
Low Carbon Urban and Territorial Metabolism
22

03-03-2016
12
Ecological Urban Planning must restrict the inputs of non renewable
energy flows and increase energy efficiency
Such purposes will require transformations on the urban systems
Carbon reductions and Energy savings :
have an important feedback in terms of finantial autonomy
can set a conflict with other purposes of development
Fon
te:
Cid
ade
e D
emo
crac
ia
Planning Low Carbon Urban and Territorial Metabolism
23
Questions?
24
03-03-2016
13
M2. Low Carbon Urban Planning
3. Why urban and territorial metabolism should become
low carbon?
Which framework supports this challenge?
25
26
Climate change
03-03-2016
14
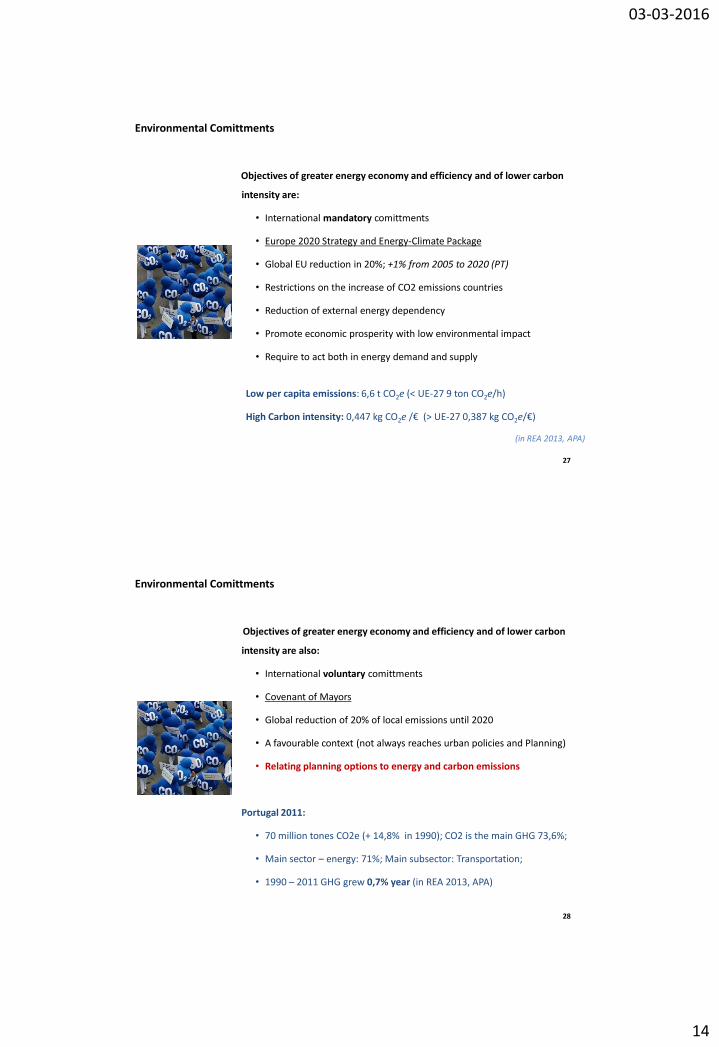
Objectives of greater energy economy and efficiency and of lower carbon
intensity are:
• International mandatory comittments
• Europe 2020 Strategy and Energy-Climate Package
• Global EU reduction in 20%; +1% from 2005 to 2020 (PT)
• Restrictions on the increase of CO2 emissions countries
• Reduction of external energy dependency
• Promote economic prosperity with low environmental impact
• Require to act both in energy demand and supply
Low per capita emissions: 6,6 t CO2e (< UE-27 9 ton CO2e/h)
High Carbon intensity: 0,447 kg CO2e /€ (> UE-27 0,387 kg CO2e/€)
(in REA 2013, APA)
Environmental Comittments
27
Objectives of greater energy economy and efficiency and of lower carbon
intensity are also:
• International voluntary comittments
• Covenant of Mayors
• Global reduction of 20% of local emissions until 2020
• A favourable context (not always reaches urban policies and Planning)
• Relating planning options to energy and carbon emissions
Portugal 2011:
• 70 million tones CO2e (+ 14,8% in 1990); CO2 is the main GHG 73,6%;
• Main sector – energy: 71%; Main subsector: Transportation;
• 1990 – 2011 GHG grew 0,7% year (in REA 2013, APA)
Environmental Comittments
28

03-03-2016
15
Low Carbon Urban and Territorial
Metabolism in globalized industrial times?
Lower Fossil Fuels consumption
Lower Electricity consumption from non
renewable sources
Greater Energy Efficiency
Restriction of CO2 equivalent emissions
Energy Supply + Energy Demand
Low Carbon Urban and Territorial Metabolism
29
CO2, CH4 e N2O Emissions Portugal 2008, APA
Environmental Data - CO2 Eq
CO2= 1; CH4=25; N2O=298 (IPCC – Global Warming Potential)
30
Burning fuels Waste Industry Agriculture
03-03-2016
16
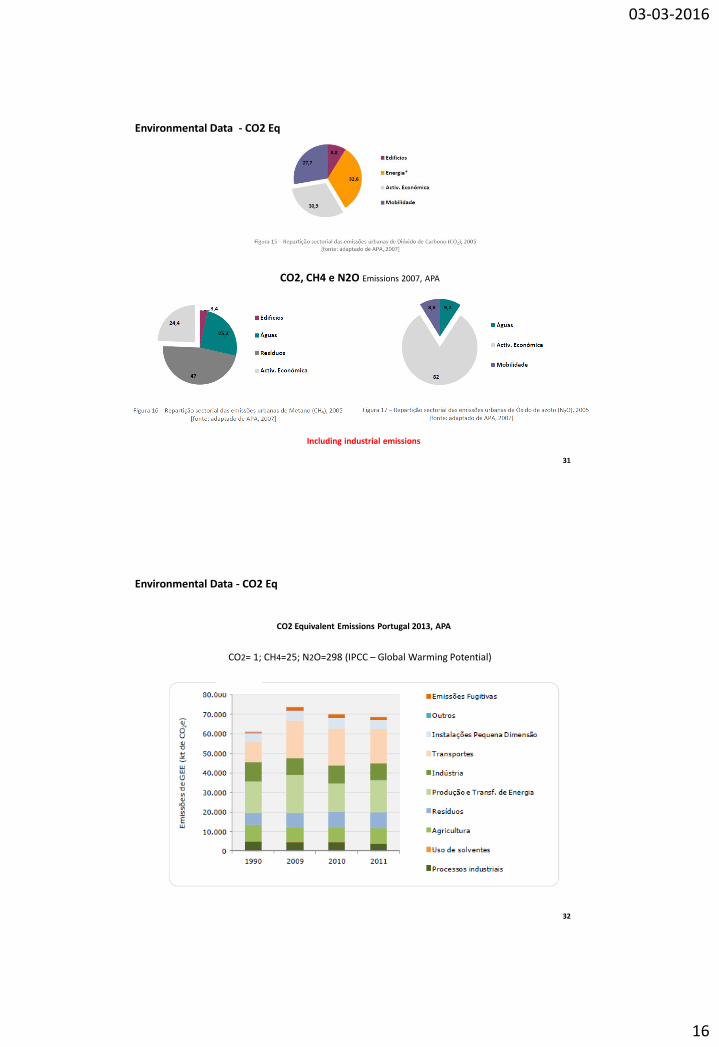
CO2, CH4 e N2O Emissions 2007, APA
Environmental Data - CO2 Eq
Including industrial emissions
31
Environmental Data - CO2 Eq
CO2 Equivalent Emissions Portugal 2013, APA
32
CO2= 1; CH4=25; N2O=298 (IPCC – Global Warming Potential)

03-03-2016
17
33
Mix eléctrico Portugal 2011 (GALP)
Planning Low Carbon Urban and Territorial Metabolism
34

03-03-2016
18
Biomass Geothermal Hidric Wind Sun
Planning Low Carbon Urban and Territorial Metabolism
Renewables in Portugal 2006-2015 (DGEG)
35
Edifícios
Municípios
Portugal
União
Europeia
Which instruments can we use (SEA/AAE)?
Multi - level and inter sectorial assessemnt
• Strategic Environmental Assessment (SEA/AAE) (DL
232/2007 15.06) mandatory for all plans and
programs, including Spatial Planning
• Not specific tool for urban planning
Research Approaches
Strategic Environmental
Asessment
Planning Low Carbon Urban and Territorial Metabolism
36

03-03-2016
19
Edifícios
Municípios
Portugal
União
Europeia
Which instruments can we use?
Multi - level action, not always sequential
Sustainable Energy Action Plans Covenant of Mayors (SEAP)
• Not specific for urban areas
• Required information not always available
• Required methodologies not always available
• Concern to municipal infra-structures and buildings
• Still not connected to transition actions
Research Approaches
Covenant of Mayors (SEAP)
Planning Low Carbon Urban and Territorial Metabolism
37
Questions?
38
Break!
03-03-2016
20
M2. Low Carbon Urban Planning
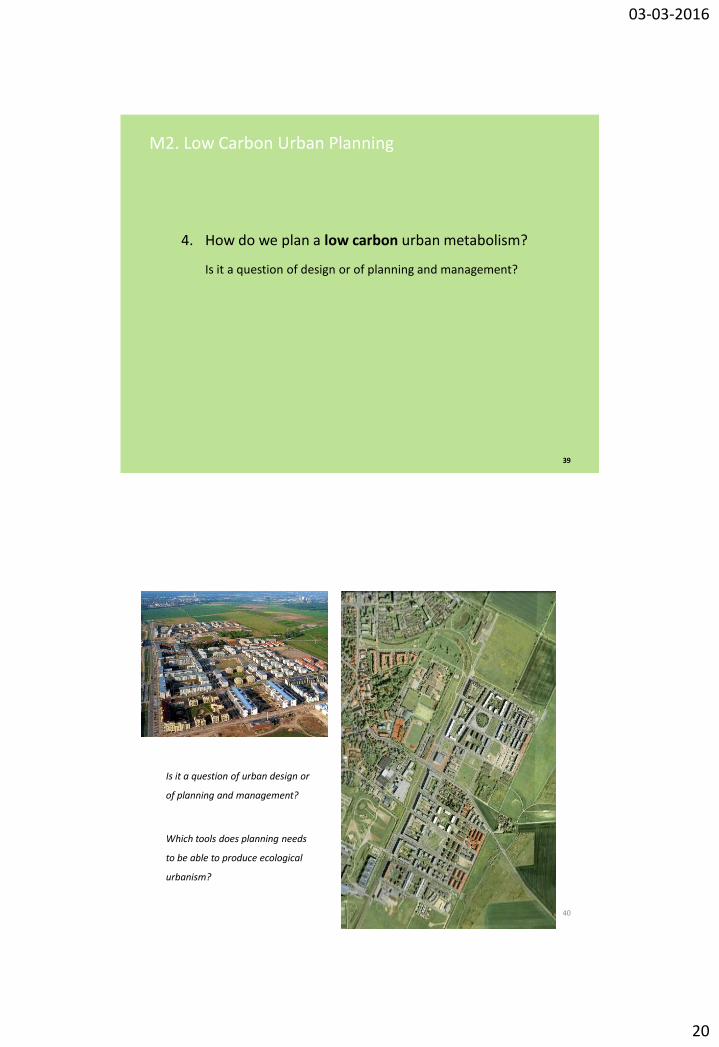
4. How do we plan a low carbon urban metabolism?
Is it a question of design or of planning and management?
39
40
Is it a question of urban design or
of planning and management?
Which tools does planning needs
to be able to produce ecological
urbanism?
03-03-2016
21
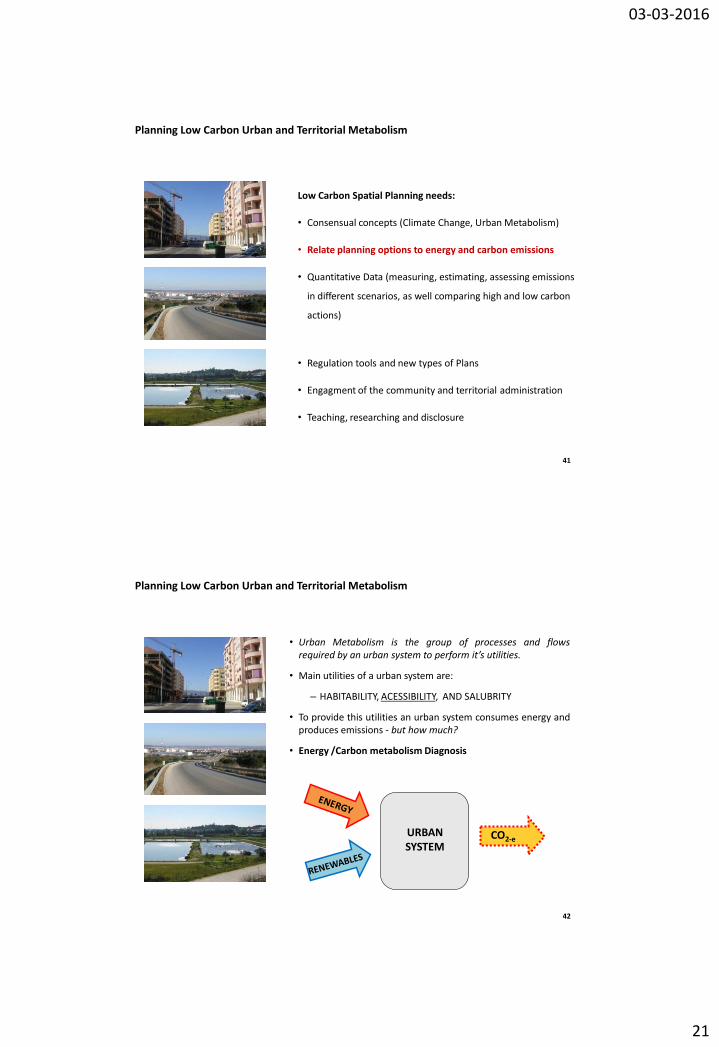
Low Carbon Spatial Planning needs:
• Consensual concepts (Climate Change, Urban Metabolism)
• Relate planning options to energy and carbon emissions
• Quantitative Data (measuring, estimating, assessing emissions
in different scenarios, as well comparing high and low carbon
actions)
• Regulation tools and new types of Plans
• Engagment of the community and territorial administration
• Teaching, researching and disclosure
Planning Low Carbon Urban and Territorial Metabolism
41
• Urban Metabolism is the group of processes and flows required by an urban system to perform it’s utilities.
• Main utilities of a urban system are:
– HABITABILITY, ACESSIBILITY, AND SALUBRITY
• To provide this utilities an urban system consumes energy and produces emissions - but how much?
• Energy /Carbon metabolism Diagnosis
CO2-e
Planning Low Carbon Urban and Territorial Metabolism
42
URBAN SYSTEM
03-03-2016
22
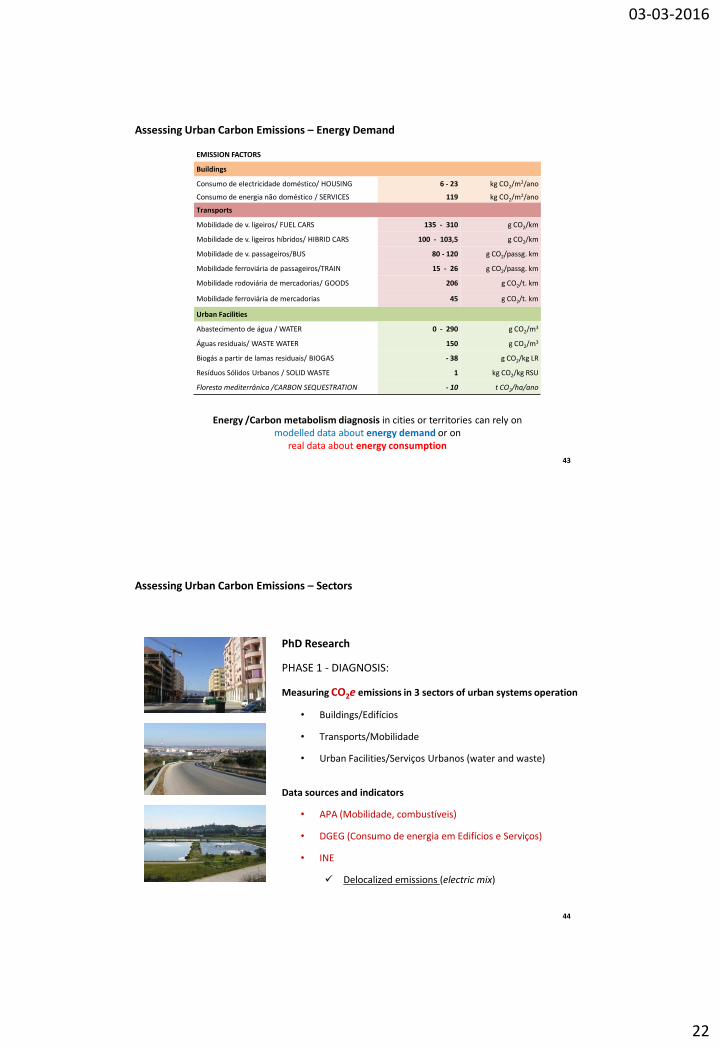
EMISSION FACTORS
Buildings
Consumo de electricidade doméstico/ HOUSING 6 - 23 kg CO2/m2/ano
Consumo de energia não doméstico / SERVICES 119 kg CO2/m2/ano
Transports
Mobilidade de v. ligeiros/ FUEL CARS 135 - 310 g CO2/km
Mobilidade de v. ligeiros híbridos/ HIBRID CARS 100 - 103,5 g CO2/km
Mobilidade de v. passageiros/BUS 80 - 120 g CO2/passg. km
Mobilidade ferroviária de passageiros/TRAIN 15 - 26 g CO2/passg. km
Mobilidade rodoviária de mercadorias/ GOODS 206 g CO2/t. km
Mobilidade ferroviária de mercadorias 45 g CO2/t. km
Urban Facilities
Abastecimento de água / WATER 0 - 290 g CO2/m3
Águas residuais/ WASTE WATER 150 g CO2/m3
Biogás a partir de lamas residuais/ BIOGAS - 38 g CO2/kg LR
Resíduos Sólidos Urbanos / SOLID WASTE 1 kg CO2/kg RSU
Floresta mediterrânica /CARBON SEQUESTRATION - 10 t CO2/ha/ano
Assessing Urban Carbon Emissions – Energy Demand
43
Energy /Carbon metabolism diagnosis in cities or territories can rely on modelled data about energy demand or on
real data about energy consumption
PhD Research
PHASE 1 - DIAGNOSIS:
Measuring CO2e emissions in 3 sectors of urban systems operation
• Buildings/Edifícios
• Transports/Mobilidade
• Urban Facilities/Serviços Urbanos (water and waste)
Data sources and indicators
• APA (Mobilidade, combustíveis)
• DGEG (Consumo de energia em Edifícios e Serviços)
• INE
Delocalized emissions (electric mix)
44
Assessing Urban Carbon Emissions – Sectors
03-03-2016
23
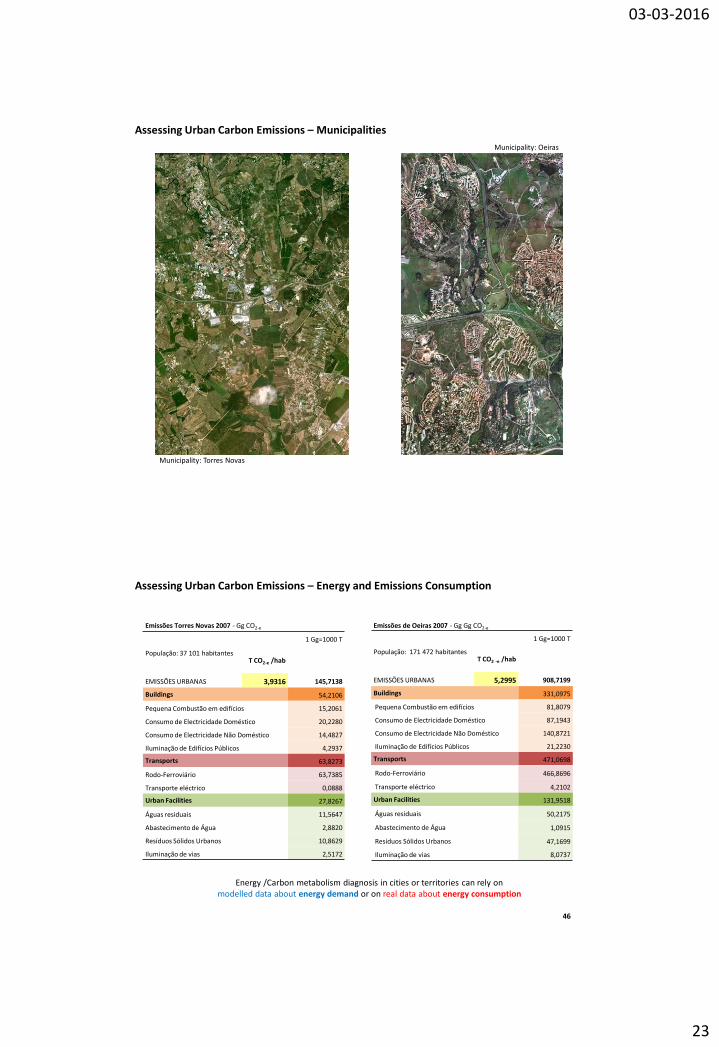
Municipality: Torres Novas
Municipality: Oeiras
Assessing Urban Carbon Emissions – Municipalities
Emissões Torres Novas 2007 - Gg CO2-e
1 Gg=1000 T
População: 37 101 habitantes
T CO2-e /hab
EMISSÕES URBANAS 3,9316 145,7138
Buildings 54,2106
Pequena Combustão em edifícios 15,2061
Consumo de Electricidade Doméstico 20,2280
Consumo de Electricidade Não Doméstico 14,4827
Iluminação de Edifícios Públicos 4,2937
Transports 63,8273
Rodo-Ferroviário 63,7385
Transporte eléctrico 0,0888
Urban Facilities 27,8267
Águas residuais 11,5647
Abastecimento de Água 2,8820
Resíduos Sólidos Urbanos 10,8629
Iluminação de vias 2,5172
Emissões de Oeiras 2007 - Gg Gg CO2-e
1 Gg=1000 T
População: 171 472 habitantes
T CO2 -e /hab
EMISSÕES URBANAS 5,2995 908,7199
Buildings 331,0975
Pequena Combustão em edifícios 81,8079
Consumo de Electricidade Doméstico 87,1943
Consumo de Electricidade Não Doméstico 140,8721
Iluminação de Edifícios Públicos 21,2230
Transports 471,0698
Rodo-Ferroviário 466,8696
Transporte eléctrico 4,2102
Urban Facilities 131,9518
Águas residuais 50,2175
Abastecimento de Água 1,0915
Resíduos Sólidos Urbanos 47,1699
Iluminação de vias 8,0737
Assessing Urban Carbon Emissions – Energy and Emissions Consumption
46
Energy /Carbon metabolism diagnosis in cities or territories can rely on modelled data about energy demand or on real data about energy consumption

03-03-2016
24
A1. Gas in buildings
A2. Electricity in residential …
A3. Electricity in non …
A4. Public buildings lightning
B1. Motorway and diesel …
B2. Electric transportation
C1. Waste water
C2. Water Supply
C3. Urban Solid Waste
C4. Roads lightning
0 10 20 30 40 50 60 70
0 50 100 150 200 250 300 350 400 450 500
A1. Gas in buildings
A2. Electricity in residential buldings
A3. Electricity in non residential buldings
A4. Public buildings lightning
B1. Motorway and diesel Railway
B2. Electric transportation
C1. Waste water
C2. Water Supply
C3. Urban Solid Waste
C4. Roads lightning
Assessing Urban Carbon Emissions
47
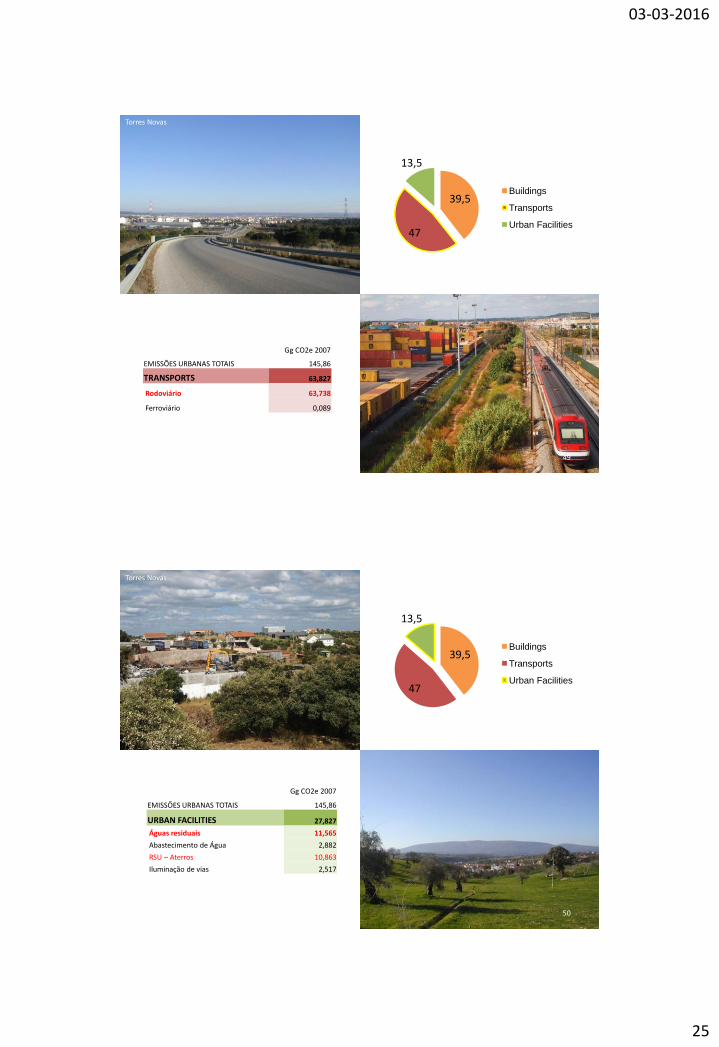
Municipality: Torres Novas
Municipality: Oeiras
Gg CO2e 2007
EMISSÕES URBANAS TOTAIS 145,86
BUILDINGS 54,211
Pequena Combustão em edifícios 15,206
Cons. Electricidade Doméstico 20,228
Cons. Electricidade Não doméstico 14,48
Iluminação de Edifícios Públicos 4,29
Torres Novas
48
39,5
47
13,5
Buildings
Transports
Urban Facilities
03-03-2016
25
Gg CO2e 2007
EMISSÕES URBANAS TOTAIS 145,86
TRANSPORTS 63,827
Rodoviário 63,738
Ferroviário 0,089
39,5
47
13,5
Buildings
Transports
Urban Facilities
49
Torres Novas
Gg CO2e 2007
EMISSÕES URBANAS TOTAIS 145,86
URBAN FACILITIES 27,827
Águas residuais 11,565
Abastecimento de Água 2,882
RSU – Aterros 10,863
Iluminação de vias 2,517
39,5
47
13,5
Buildings
Transports
Urban Facilities
50
Torres Novas

03-03-2016
26
PhD Research
PHASE 2 - PROSPECTIVES:
- Estimation of the selected indicators (2007 a 2020) in two different
scenaries (BaU and Ecological); Combination of:
National data - Cenários para a Economia Pós-Quioto do
Departamento de Prospectiva e Planeamento
Local data - Spatial Planning options (Plano Diretor Municipal)
- Comparing scenarios:
Conventional Spatial Planning (BaU) = + 15%
Ecological Spatial Planning = - 0,6%
Estimating Urban Carbon Emissions
51
MUNICIPALITY IN 2020
BasU REGULATION SCENARIO COMMON OBJECTIVES ECOLOGICAL SCENARIO
Master Plan 2010
• Adapt city limits (perímetros urbanos)
• Reoccupation of urban centers
• Network for economic activities
• Improve the infrastructure network
• Protect natural resources and values
• Promote forest management and
agriculture
Alternative Master Plan
Economic competitiveness Low carbon development
Tendential Post-Kyoto Scenario
- Economy based on leisure,
tourism and logistics, with a
centralization of the operators
of transport and energy
Change Post-Kyoto Scenario
- Economy directed to a
concentration of activities in
space and for environmental
protection and energy security
Estimating Urban Carbon Emissions
52

03-03-2016
27
BasU REGULATION SCENARIO ECOLOGICAL SCENARIO
• Adapt city limits
• Reoccupation of urban centers
• Network for economic activities
• Improve the infrastructure network
• Protect natural resources and values
• Promote forest management and
agriculture
Estimating Urban Carbon Emissions
BAU REGULATION SCENARIO
Selected Planning Measures
Restriction to 15% of urban land increase
Buildings
Definition of areas for rehabilitating urbanized space
Conditioning of building in rural areas (minimum sprawl control)
Residential and Golf Tourism
Increase of 36% of industrial and logístics land use
Road extensions Mobility
Revision of public transport networks
Sewage network requalification and new ETARs
Urban Facilities Municipal Ecological Structure (MES)
Characterization and agroforestry zoning
Estimating Urban Carbon Emissions
54
03-03-2016
28
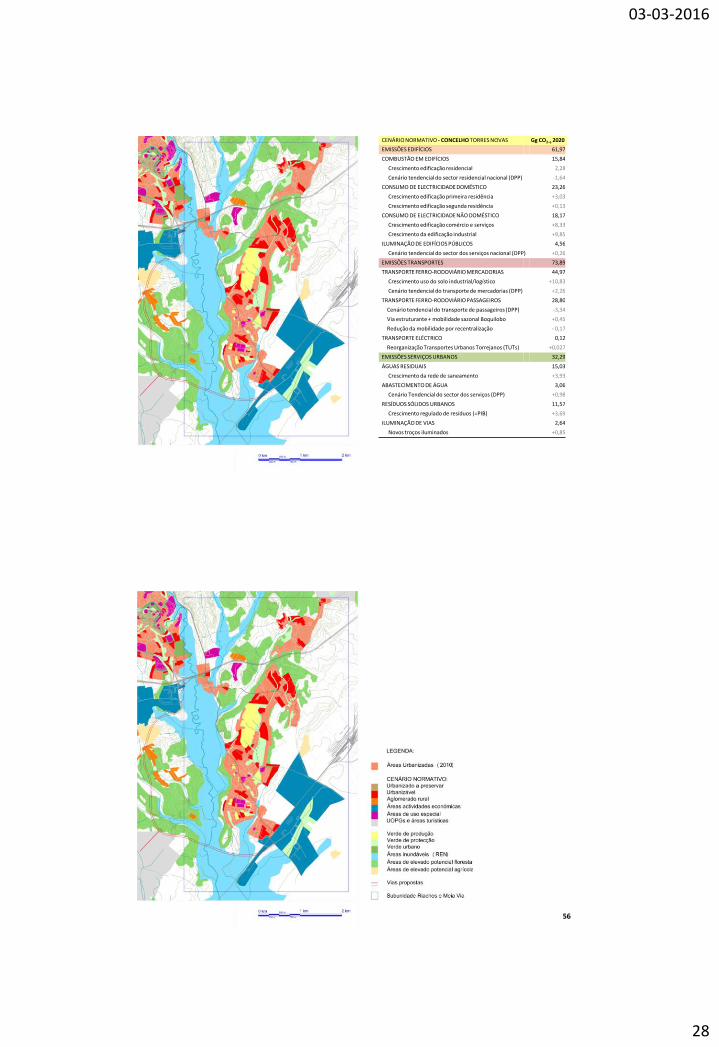
CENÁRIO NORMATIVO - CONCELHO TORRES NOVAS Gg CO2-e 2020
EMISSÕES EDIFÍCIOS 61,97
COMBUSTÃO EM EDIFÍCIOS 15,84
Crescimento edificação residencial 2,28
Cenário tendencial do sector residencial nacional (DPP) -1,64
CONSUMO DE ELECTRICIDADE DOMÉSTICO 23,26
Crescimento edificação primeira residência +3,03
Crescimento edificação segunda residência +0,13
CONSUMO DE ELECTRICIDADE NÃO DOMÉSTICO 18,17
Crescimento edificação comércio e serviços +8,33
Crescimento da edificação industrial +9,85
ILUMINAÇÃO DE EDIFÍCIOS PÚBLICOS 4,56
Cenário tendencial do sector dos serviços nacional (DPP) +0,26
EMISSÕES TRANSPORTES 73,89
TRANSPORTE FERRO-RODOVIÁRIO MERCADORIAS 44,97
Crescimento uso do solo industrial/logístico +10,83
Cenário tendencial do transporte de mercadorias (DPP) +2,26
TRANSPORTE FERRO-RODOVIÁRIO PASSAGEIROS 28,80
Cenário tendencial do transporte de passageiros (DPP) -3,34
Via estruturante + mobilidade sazonal Boquilobo +0,45
Redução da mobilidade por recentralização - 0,17
TRANSPORTE ELÉCTRICO 0,12
Reorganização Transportes Urbanos Torrejanos (TUTs) +0,027
EMISSÕES SERVIÇOS URBANOS 32,29
ÁGUAS RESIDUAIS 15,03
Crescimento da rede de saneamento +3,93
ABASTECIMENTO DE ÁGUA 3,06
Cenário Tendencial do sector dos serviços (DPP) +0,98
RESÍDUOS SÓLIDOS URBANOS 11,57
Crescimento regulado de resíduos (=PIB) +3,69
ILUMINAÇÃO DE VIAS 2,64
Novos troços iluminados +0,85
56
03-03-2016
29
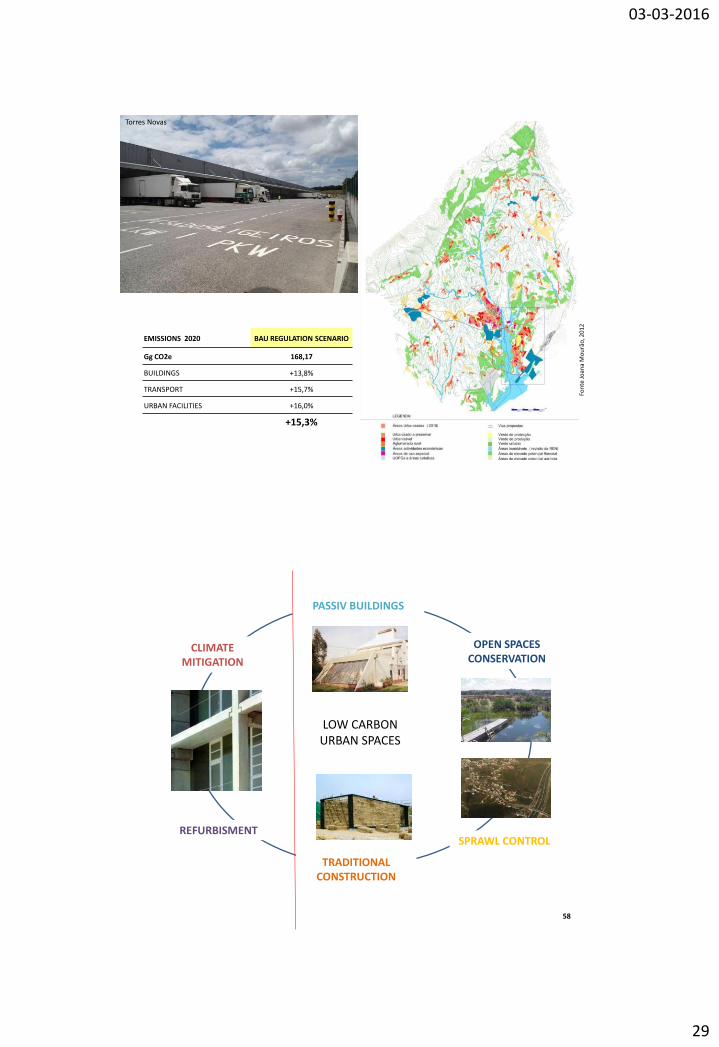
EMISSIONS 2020 BAU REGULATION SCENARIO
Gg CO2e 168,17
BUILDINGS +13,8%
TRANSPORT +15,7%
URBAN FACILITIES +16,0%
+15,3%
Torres Novas
Fon
te J
oan
a M
ou
rão
, 20
12
SPRAWL CONTROL
OPEN SPACES CONSERVATION
CLIMATE MITIGATION
PASSIV BUILDINGS
REFURBISMENT
TRADITIONAL CONSTRUCTION
LOW CARBON URBAN SPACES
58
03-03-2016
30
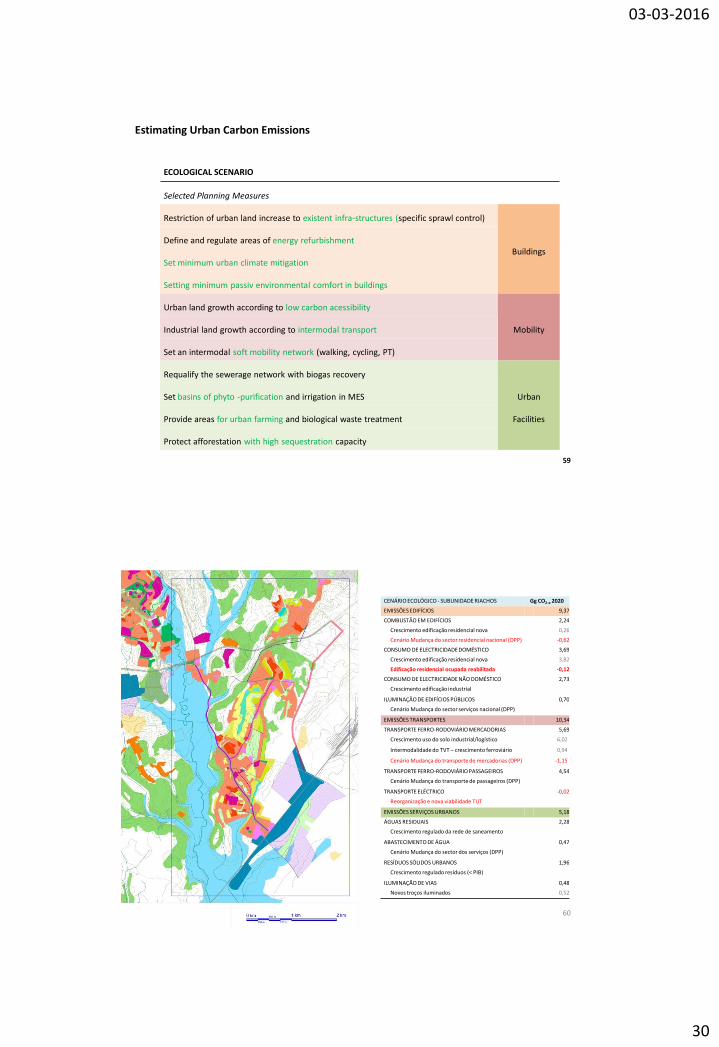
ECOLOGICAL SCENARIO
Selected Planning Measures
Restriction of urban land increase to existent infra-structures (specific sprawl control)
Buildings Define and regulate areas of energy refurbishment
Set minimum urban climate mitigation
Setting minimum passiv environmental comfort in buildings
Urban land growth according to low carbon acessibility
Mobility Industrial land growth according to intermodal transport
Set an intermodal soft mobility network (walking, cycling, PT)
Requalify the sewerage network with biogas recovery
Urban
Facilities
Set basins of phyto -purification and irrigation in MES
Provide areas for urban farming and biological waste treatment
Protect afforestation with high sequestration capacity
Estimating Urban Carbon Emissions
59
CENÁRIO ECOLÓGICO - SUBUNIDADE RIACHOS Gg CO2-e 2020
EMISSÕES EDIFÍCIOS 9,37
COMBUSTÃO EM EDIFÍCIOS 2,24
Crescimento edificação residencial nova 0,26
Cenário Mudança do sector residencial nacional (DPP) -0,62
CONSUMO DE ELECTRICIDADE DOMÉSTICO 3,69
Crescimento edificação residencial nova 3,82
Edificação residencial ocupada reabilitada -0,12
CONSUMO DE ELECTRICIDADE NÃO DOMÉSTICO 2,73
Crescimento edificação industrial
ILUMINAÇÃO DE EDIFÍCIOS PÚBLICOS 0,70
Cenário Mudança do sector serviços nacional (DPP)
EMISSÕES TRANSPORTES 10,34
TRANSPORTE FERRO-RODOVIÁRIO MERCADORIAS 5,69
Crescimento uso do solo industrial/logístico 6,02
Intermodalidade do TVT – crescimento ferroviário 0,94
Cenário Mudança do transporte de mercadorias (DPP) -1,15
TRANSPORTE FERRO-RODOVIÁRIO PASSAGEIROS 4,54
Cenário Mudança do transporte de passageiros (DPP)
TRANSPORTE ELÉCTRICO -0,02
Reorganização e nova viabilidade TUT
EMISSÕES SERVIÇOS URBANOS 5,18
ÁGUAS RESIDUAIS 2,28
Crescimento regulado da rede de saneamento
ABASTECIMENTO DE ÁGUA 0,47
Cenário Mudança do sector dos serviços (DPP)
RESÍDUOS SÓLIDOS URBANOS 1,96
Crescimento regulado resíduos (< PIB)
ILUMINAÇÃO DE VIAS 0,48
Novos troços iluminados 0,52
60

03-03-2016
31
61
Fon
te J
oan
a M
ou
rão
, 20
12
Gg CO2e 2007 Gg CO2e 2020 Evolução 2007-2020
Buildings 54,21 54,61 + 0,74 %
Energy refurbishment Passiv environmental comfort in buildings Amenização do clima urbano nos espaços abertos (serviços urbanos) Edificação e Reabilitação em zonas acessíveis seleccionadas (mobilidade)
Estimating Urban Carbon Emissions – Intersectorial effects
62
03-03-2016
32
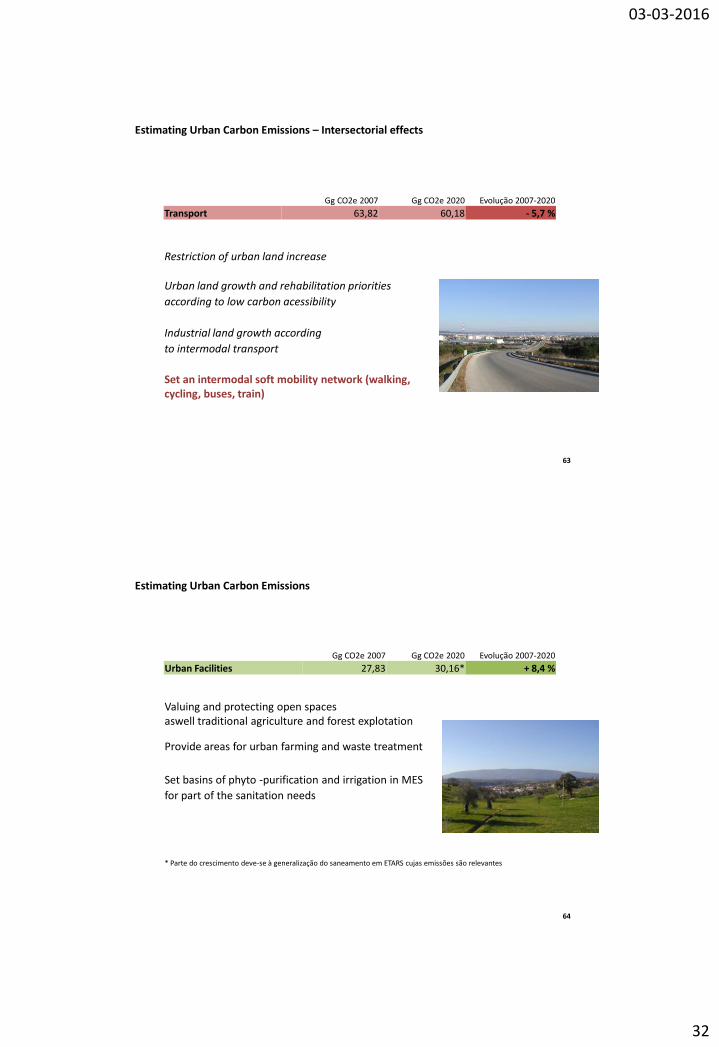
Gg CO2e 2007 Gg CO2e 2020 Evolução 2007-2020
Transport 63,82 60,18 - 5,7 %
Restriction of urban land increase
Urban land growth and rehabilitation priorities
according to low carbon acessibility
Industrial land growth according
to intermodal transport
Set an intermodal soft mobility network (walking, cycling, buses, train)
Estimating Urban Carbon Emissions – Intersectorial effects
63
Gg CO2e 2007 Gg CO2e 2020 Evolução 2007-2020
Urban Facilities 27,83 30,16* + 8,4 %
Valuing and protecting open spaces aswell traditional agriculture and forest explotation
Provide areas for urban farming and waste treatment
Set basins of phyto -purification and irrigation in MES
for part of the sanitation needs
* Parte do crescimento deve-se à generalização do saneamento em ETARS cujas emissões são relevantes
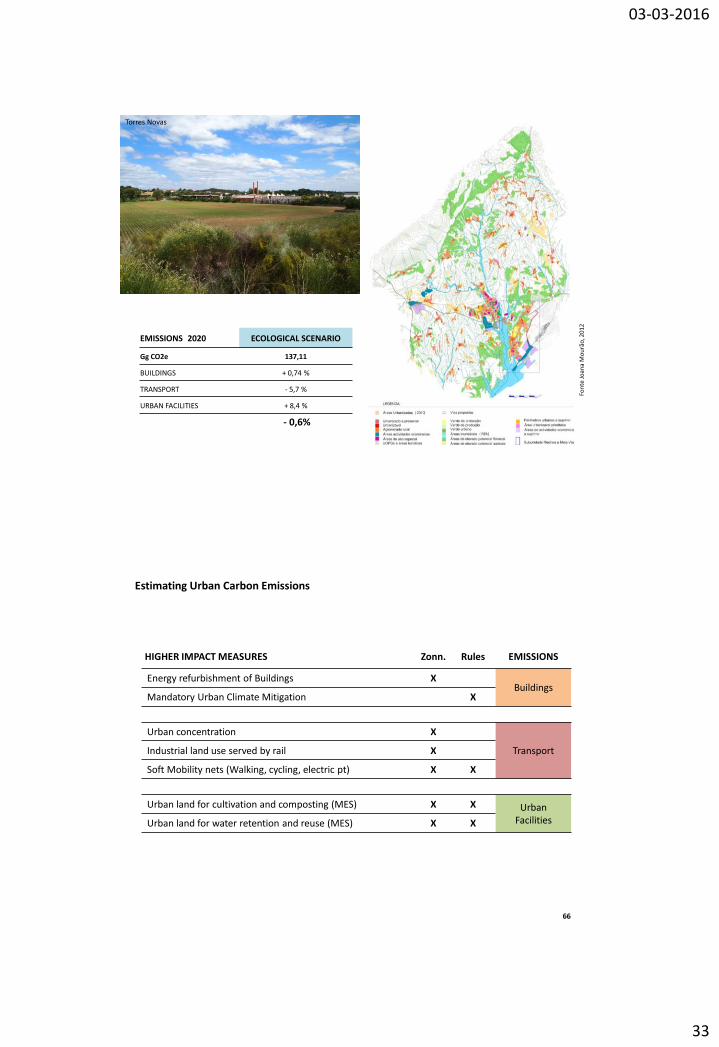
Estimating Urban Carbon Emissions
64
03-03-2016
33
EMISSIONS 2020 ECOLOGICAL SCENARIO
Gg CO2e 137,11
BUILDINGS + 0,74 %
TRANSPORT - 5,7 %
URBAN FACILITIES + 8,4 %
- 0,6%
Torres Novas
Fon
te J
oan
a M
ou
rão
, 20
12
HIGHER IMPACT MEASURES Zonn. Rules EMISSIONS
Energy refurbishment of Buildings X Buildings
Mandatory Urban Climate Mitigation X
Urban concentration X
Transport Industrial land use served by rail X
Soft Mobility nets (Walking, cycling, electric pt) X X
Urban land for cultivation and composting (MES) X X Urban Facilities Urban land for water retention and reuse (MES) X X
Estimating Urban Carbon Emissions
66

03-03-2016
34
M2. Low Carbon Urban Planning
5. Which are the main opportunities and challenges of
low carbon urban and territorial planning?
67
• CO2e q emissions are an useful indicator for assessing environmental impacts
of different urban and regional development options.
• Urban and Territorial carbon balance improves he planning process if:
• starts from a diagnosis of energy demand and carbon emissions
• adopts targets for quantitative limitation of carbon emissions
• evaluates alternatives estimating carbon emissions in different scenarios
• reverts to other assessment instruments
• Territorial carbon balance methods complex and are not stabilized
• Importance of the consistency of characterization and estimation indicators
• The methodologies influence the results!
68
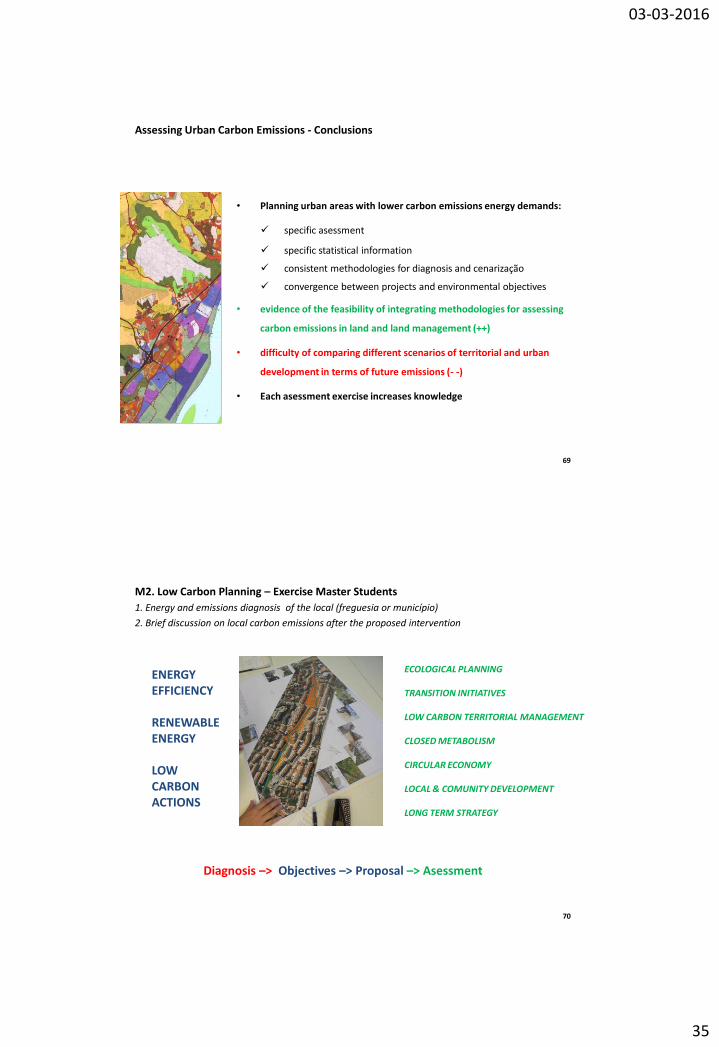
Assessing Urban Carbon Emissions - Conclusions
03-03-2016
35
• Planning urban areas with lower carbon emissions energy demands:
specific asessment
specific statistical information
consistent methodologies for diagnosis and cenarização
convergence between projects and environmental objectives
• evidence of the feasibility of integrating methodologies for assessing
carbon emissions in land and land management (++)
• difficulty of comparing different scenarios of territorial and urban
development in terms of future emissions (- -)
• Each asessment exercise increases knowledge
69
Assessing Urban Carbon Emissions - Conclusions
ENERGY EFFICIENCY RENEWABLE ENERGY LOW CARBON ACTIONS
ECOLOGICAL PLANNING
TRANSITION INITIATIVES
LOW CARBON TERRITORIAL MANAGEMENT
CLOSED METABOLISM
CIRCULAR ECONOMY
LOCAL & COMUNITY DEVELOPMENT
LONG TERM STRATEGY
70
M2. Low Carbon Planning – Exercise Master Students
1. Energy and emissions diagnosis of the local (freguesia or município)
2. Brief discussion on local carbon emissions after the proposed intervention
Diagnosis –> Objectives –> Proposal –> Asessment
03-03-2016
36
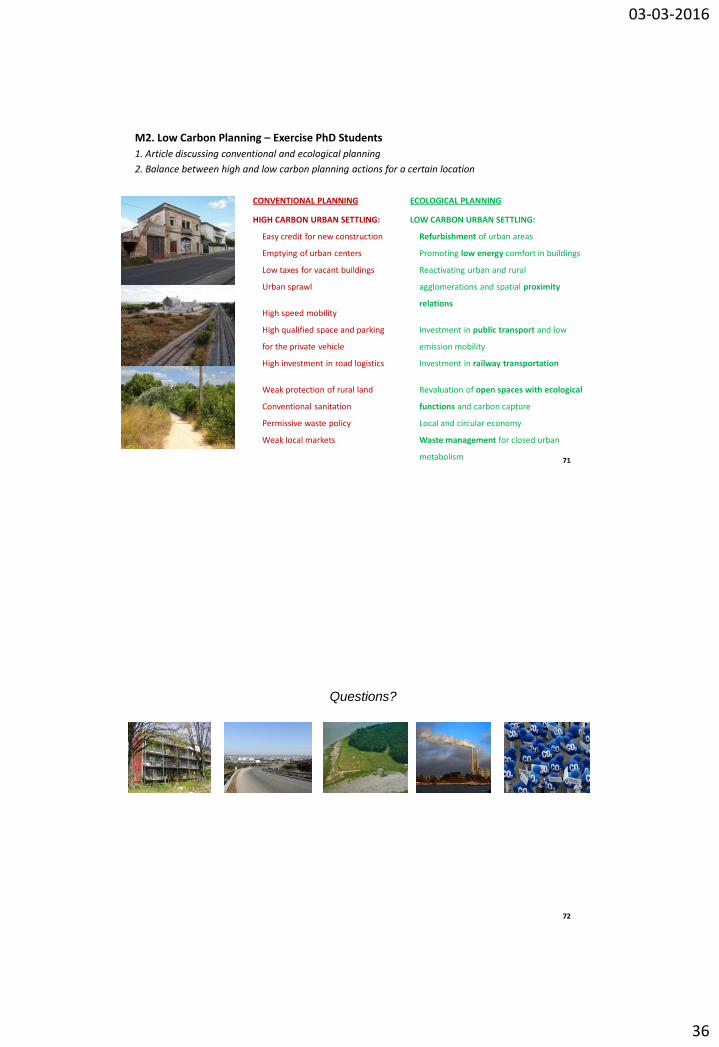
ECOLOGICAL PLANNING
LOW CARBON URBAN SETTLING:
Refurbishment of urban areas
Promoting low energy comfort in buildings
Reactivating urban and rural
agglomerations and spatial proximity
relations
Investment in public transport and low
emission mobility
Investment in railway transportation
Revaluation of open spaces with ecological
functions and carbon capture
Local and circular economy
Waste management for closed urban
metabolism
71
CONVENTIONAL PLANNING
HIGH CARBON URBAN SETTLING:
Easy credit for new construction
Emptying of urban centers
Low taxes for vacant buildings
Urban sprawl
High speed mobility
High qualified space and parking
for the private vehicle
High investment in road logistics
Weak protection of rural land
Conventional sanitation
Permissive waste policy
Weak local markets
M2. Low Carbon Planning – Exercise PhD Students
1. Article discussing conventional and ecological planning
2. Balance between high and low carbon planning actions for a certain location
Questions?
72