universidade de sÃo paulo · matemática computacional) – instituto de ciências matemáticas e...
TRANSCRIPT
UN
IVER
SID
AD
E D
E SÃ
O P
AULO
Inst
ituto
de
Ciên
cias
Mat
emát
icas
e d
e Co
mpu
taçã
o
TRIVIR: A Visualization System to Support DocumentRetrieval with High Recall
Amanda Gonçalves DiasDissertação de Mestrado do Programa de Pós-Graduação em Ciênciasde Computação e Matemática Computacional (PPG-CCMC)

SERVIÇO DE PÓS-GRADUAÇÃO DO ICMC-USP
Data de Depósito:
Assinatura: ______________________
Amanda Gonçalves Dias
TRIVIR: A Visualization System to Support DocumentRetrieval with High Recall
Master dissertation submitted to the Institute ofMathematics and Computer Sciences – ICMC-USP,in partial fulfillment of the requirements for thedegree of the Master Program in Computer Scienceand Computational Mathematics. EXAMINATIONBOARD PRESENTATION COPY
Concentration Area: Computer Science andComputational Mathematics
Advisor: Profa. Dra. Maria Cristina Ferreira de Oliveira
USP – São CarlosSeptember 2019

Ficha catalográfica elaborada pela Biblioteca Prof. Achille Bassi e Seção Técnica de Informática, ICMC/USP,
com os dados inseridos pelo(a) autor(a)
Bibliotecários responsáveis pela estrutura de catalogação da publicação de acordo com a AACR2: Gláucia Maria Saia Cristianini - CRB - 8/4938 Juliana de Souza Moraes - CRB - 8/6176
G643tGonçalves Dias, Amanda TRIVIR: A Visualization System to SupportDocument Retrieval with High Recall / AmandaGonçalves Dias; orientadora Maria Cristina Ferreirade Oliveira; coorientador Evangelos Milios. -- SãoCarlos, 2019. 96 p.
Dissertação (Mestrado - Programa de Pós-Graduaçãoem Ciências de Computação e MatemáticaComputacional) -- Instituto de Ciências Matemáticase de Computação, Universidade de São Paulo, 2019.
1. Document retrieval. 2. Informationvisualization. 3. High recall. 4. Vocabularymismatch. I. Ferreira de Oliveira, Maria Cristina,orient. II. Milios, Evangelos, coorient. III.Título.
Amanda Gonçalves Dias
TRIVIR: Um sistema de visualização para apoio àrecuperação de documentos com alta cobertura.
Dissertação apresentada ao Instituto de CiênciasMatemáticas e de Computação – ICMC-USP,como parte dos requisitos para obtenção do títulode Mestra em Ciências – Ciências de Computaçãoe Matemática Computacional. EXEMPLAR DEDEFESA
Área de Concentração: Ciências de Computação eMatemática Computacional
Orientadora: Profa. Dra. Maria Cristina Ferreirade Oliveira
USP – São CarlosSetembro de 2019


ACKNOWLEDGEMENTS
I would like to thank my advisor Maria Cristina Ferreira de Oliveira that guided methroughout the entire project with insightful discussions, a lot of patience and friendship. Addi-tionally, I would like to thank Evangelos Milios from the Dalhousie University that participatedin this Master’s project since day one with many ideas and solutions. You both made me a betterresearcher and a better person. I am beyond grateful for the time I spent around you.
I am also thankful for all my friends and colleagues that helped me get through thisprocess. Your friendship and support, was crucial for me to conclude this chapter of my life.Special thanks to the USP volleyball team that was always able to pull me out of the difficultdays.
I thank my family which made all of this possible. Thank you for always believing inme and for allowing me to take the opportunities life so kindly provided me so far. You are myfoundation, and that is something I will never forget.
Last but not least, I thank Gustavo, who stuck with me in the good and bad days, alwaysgiving me his unconditional love and support. I love you and I will be forever grateful.
I am grateful to our collaborators Osvaldo Novais de Oliveira Jr. (IFSC, University ofSão Paulo), Gustavo Martini Dalpian (Federal University of the ABC) and Gustavo MartinsNunes Avellar (ICMC, University of São Paulo), who participated in the validation sessions ofTRIVIR.
This work has received financial support from the Coordenação de Aperfeiçoamento dePessoal de Nível Superior - Brasil (CAPES) - Finance Code 001.


“We can judge our progress by the courage of our questions and the depth of our answers, our
willingness to embrace what is true rather than what feels good.”
(Carl Edward Sagan)

ABSTRACTGONÇALVES DIAS, A. TRIVIR: A Visualization System to Support Document Retrievalwith High Recall. 2019. 96 p. Dissertação (Mestrado em Ciências – Ciências de Computação eMatemática Computacional) – Instituto de Ciências Matemáticas e de Computação, Universidadede São Paulo, São Carlos – SP, 2019.
A high recall problem in document retrieval is described by scenarios in which one wants toensure that, given one (or multiple) query document(s), (nearly) all relevant related documents areretrieved, with minimum human effort. The problem may be expressed as a document similaritysearch: a user picks an example document (or multiple ones), and an automatic system recoverssimilar ones from a collection. This problem is often handled with a so-called Continuous Active
Learning strategy: given the initial query, which is a document described by a set of relevantterms, a learning method returns the most-likely relevant documents (e.g., the most similar)to the reviewer in batches, the reviewer labels each document as relevant/not relevant and thisinformation is fed back into the learning algorithm, which uses it to refine its predictions. Thisiterative process goes on until some quality condition is satisfied, which might demand highhuman effort, since documents are displayed as ranked lists and need to be labeled individually,and impact negatively the convergence of the learning algorithm. Besides, the vocabularymismatch issue, i.e., when distinct terminologies are employed to describe semantically relatedor equivalent concepts, can impair recall capability.
We propose TRIVIR, a novel interactive visualization tool powered by an information retrieval(IR) engine that implements an active learning protocol to support IR with high recall. Thesystem integrates multiple graphical views in order to assist the user identifying the relevantdocuments in a collection. Given representative documents as queries, users can interact withthe views to label documents as relevant/not relevant, and this information is used to train amachine learning (ML) algorithm which suggests other potentially relevant documents. TRIVIRoffers two major advantages over existing visualization systems for IR. First, it merges the MLalgorithm output into the visualization, while supporting several user interactions in order toenhance and speed up its convergence. Second, it tackles the vocabulary mismatch problem, byproviding term’s synonyms and a view that conveys how the terms are used within the collection.Besides, TRIVIR has been developed as a flexible front-end interface that can be associated withdistinct text representations and multidimensional projection techniques. We describe two usecases conducted with collaborators who are potential users of TRIVIR. Results show that thesystem simplified the search for relevant documents in large collections, based on the context inwhich the terms occur.
Keywords: visualization, information retrieval, total recall, vocabulary mismatch, machinelearning.

RESUMO
GONÇALVES DIAS, A. TRIVIR: Um sistema de visualização para apoio à recuperação dedocumentos com alta cobertura.. 2019. 96 p. Dissertação (Mestrado em Ciências – Ciênciasde Computação e Matemática Computacional) – Instituto de Ciências Matemáticas e de Computa-ção, Universidade de São Paulo, São Carlos – SP, 2019.
No âmbito de recuperação de documentos, há situações em que é preciso assegurar que todos osdocumentos relevantes para uma dada consulta serão recuperados, de preferência com um esforçohumano mínimo. Uma das maneiras de formular este problema de recuperação com alta coberturaé com uma consulta por similaridade: um usuário seleciona um (ou vários) documento(s), e umsistema automático é utilizado para recuperar, de uma coleção, os documentos ’semelhantes’aos apresentados. Uma maneira usual de abordar o problema adota uma estratégia denominadaContinuous Active Learning, em que dado o(s) documento(s) de consulta, descrito por seustermos relevantes, um método de aprendizado de máquina retorna e apresenta ao analista, emlotes, os documentos mais provavelmente relevantes, ou mais similares a esse(s). O analistaclassifica cada documento quanto à relevância, realimentando o algoritmo de aprendizado, o qualpode então refinar suas previsões. Esse processo interativo continua até que alguma condição dequalidade seja satisfeita, o que pode exigir grande esforço do usuário, já que os documentos sãooferecidos no formato de listas ranqueadas e devem ser marcados individualmente, e impactarnegativamente a convergência do algoritmo de aprendizado. Ademais, uma das dificuldades é aincompatibilidade de vocabulário, quando terminologias distintas são empregadas para descreverconceitos semanticamente relacionados, o que pode prejudicar a identificação dos documentosrelevantes.
Neste trabalho propomos TRIVIR, uma visualização interativa alimentada por um motor derecuperação de informação (RI) que implementa o protocolo Continuous Active Learning com ofim de auxiliar RI de alta cobertura. O sistema integra várias representações gráficas para auxiliaro usuário a identificar documentos relevantes em uma coleção. Dados documentos representativoscomo entrada, usuários podem interagir com as visualizações e marcar documentos comorelevantes/não relevantes. Esta informação é utilizada para treinar um algoritmo de aprendizadode máquina que, por sua vez, sugere documentos potencialmente relevantes. TRIVIR ofereceduas principais vantagens em relação a outros sistemas de visualização para RI. Primeiro, integraa visualização a um algoritmo de aprendizado de máquina com o qual usários podem interagirpara melhorar e acelerar a convergência do algoritmo. Segundo, o sistema trata o problema deincompatibilidade de vocabulário, provendo sinônimos dos termos e o contexto no qual termossão utilizados na coleção. TRIVIR foi desenvolvido como uma interface web flexível podendo serassociado com diferentes técnicas de representação de documentos e projeção multidimensional.Descrevemos dois casos de uso conduzidos com potenciais usuários do TRIVIR. Resultados

mostraram que o sistema facilitou a pesquisa por documentos relevantes em grandes coleções,por meio da utilização da informação do contexto no qual os termos ocorrem.
Palavras-chave: visualização, recuperação de informação, cobertura total, incompatibilidade devocabulário, aprendizado de máquina.

LIST OF FIGURES
Figure 1 – TF-IDF terms’ distribution in a particular document from a collection of 675 docu-
ments in computer science . . . . . . . . . . . . . . . . . . . . . . . . . . . . 33
Figure 2 – While CBOW finds a target word (w(t)) based on its context words, Skip-gram finds
the context words surround a target word (w(t)). . . . . . . . . . . . . . . . . . 34
Figure 3 – The paragraph node serves as a memory that helps to find the missing information.
Along with the three context words, the system’s goal, in this case, is to predict the
fourth word. . . . . . . . . . . . . . . . . . . . . . . . . . . . . . . . . . . . 35
Figure 4 – Similar to the skip-gram model, the paragraph is trained to predict the words in
different windows. . . . . . . . . . . . . . . . . . . . . . . . . . . . . . . . . 36
Figure 5 – Projections using different dimensionality reduction techniques of 6000 digits from
the MNIST dataset . . . . . . . . . . . . . . . . . . . . . . . . . . . . . . . 40
Figure 6 – Projection of LSP and HiPP of 30000 data points from a news articles dataset . . . 41
Figure 7 – The VIBE system. Documents represented as rectangles are placed according to the
keywords or POIs they contain. . . . . . . . . . . . . . . . . . . . . . . . . . 44
Figure 8 – The Visual re-ranking visualization. Red rectangles represent the keywords of
interest, gray rectangles are deactivated keywords, the blue icon is the exploration
cursor that will define the location to which the algorithm should use as reference
to re-rank the list in (2). The circles in red in (1) represent the documents that are
currently being displayed in the ranked list in (2). The circle sizes encode the overall
relevance of the document to all the queries phrases. . . . . . . . . . . . . . . . 45
Figure 9 – The TileBars system. The user can type in multiple queries and a list of documents
that contain the queries’ terms is presented. Each item of the list contains a visu-
alization that shows the portions of the text that are relevant to the queries where
higher the saturation, more relevant that part of the text is to the search. . . . . . . 46
Figure 10 – The WebSearchViz system. In (a) the user can see three subjects of interest (data
visualization, software visualization and website visualization). The query is located
at the center of the circle and the resulted web pages are the pink squares around
it. In (b) the user sees how the results are related to a subject when s/he moves the
"website visualization" subject around. It is clear that the documents in (1) are more
related to "web visualization" than the documents in (2) since they barely moved. . 47
Figure 11 – The Scatter/Gather visualization. The user is presented with an overall view of the
important terms in the collection where s/he can choose some terms in order to filter
the visualization to show new terms related to the selected ones. . . . . . . . . . . 48

Figure 12 – The WebRat visualization. On the left is presented the results for the query "Knowl-
edge Management". On the top right, the result after the user zoomed in into the
keyword "certification" is shown and on the bottom right the user is refining the
query with the word "information". . . . . . . . . . . . . . . . . . . . . . . . . 49
Figure 13 – The STORIES system. The main view shows a story graph of news regarding Britney
Spears in 2007. The main window on the center-left represents the first story graphs
resulted from the search and, as a user narrows the time window (center-right), it is
possible to gain new insights about the documents since new nodes are added. If the
user selects edges between the nodes, a list of pertinent documents to those nodes is
presented in the center-bottom where the text can be inspected in the left. . . . . . 50
Figure 14 – The cit2vec system. A search for depth-based random forests techniques shows
techniques and data used by documents in this domain. . . . . . . . . . . . . . . 51
Figure 15 – The VisIRR system. The user can type a query in A, see the results in both the
scatterplot and in the tabular view in B, see the list of recommended documents in C,
zoom-in to get more details (D) and visualize the topic cluster summary in E. . . . 52
Figure 16 – The Galaxy of News visualization. Documents are shown as stars in the sky. Sym-
bols such as keywords, locations, time event(s) occurred, subjects, and actions are
extracted from news articles and fed into the ARN. . . . . . . . . . . . . . . . . 53
Figure 17 – The Typograph system. The user entered the query "sun" and some phrases such as
"microsoft windows" and "single released" show different contexts that the query
was utilized. The user can interact further in order to visualize snippets showing the
use of the query within the text. . . . . . . . . . . . . . . . . . . . . . . . . . 54
Figure 18 – The BEAD visualization. Documents are represented by their IDs and the distance
from the query is mapped as the color intensity of nodes. . . . . . . . . . . . . . 55
Figure 19 – The CiteSpace II system. A network of 541 co-cited authors. The thickness of each
ring represent the amount of citations given a time slice and the color saturation the
time of the corresponding citations. The prominent cluster (i.e. on the right) is the
most recent one. . . . . . . . . . . . . . . . . . . . . . . . . . . . . . . . . 56
Figure 20 – The extended Revis visualization. A system to help users with the task of Systematic
Literature Review. The red circles represent articles not included in the SLR whereas
blue ones are included and gray ones are cited references. . . . . . . . . . . . . . 57
Figure 21 – The Face Atlas visualization. After the search for the keyword "diabetes", the system
generated two clusters representing type-1 and type-2 diabetes. Red links represent
similar complications whereas green links represent common symptoms. . . . . . 58
Figure 22 – The DocuCompass system. The lens puts documents in focus and groups them by
color. The bar charts represent the terms’ frequencies in each group. . . . . . . . 59
Figure 23 – The visualization with two anchors selected: the keyword "www" and the document
"Finding and Visualizing Inter-Site Clan Graphs". . . . . . . . . . . . . . . . . 60

Figure 24 – The Pex-Web visualization. The document are placed based on a similarity map and
colors are assigned based on the frequency of the query on each document. . . . . 61
Figure 25 – (top) The basic version of the “visualization pipeline”. Interaction can be performed
directly on the Algorithm (blue arrow) or the data (red arrow). (bottom) Modified
version of the pipeline for semantic interaction, where the user interacts within the
spatial metaphor (purple arrow). . . . . . . . . . . . . . . . . . . . . . . . . . 62
Figure 26 – StarSPIRE spatial workspace showing clusters of open documents and numerous
iconified documents selected and arranged through semantic interaction. . . . . . 62
Figure 27 – Barchart showing the amount of Yes or No incidents for the following features: Does
the solution use metadata information?, Does the solution deal with the issue of
vocabulary mismatch? and Does the solution implement text classification algorithms
in order to enhance the IR system? . . . . . . . . . . . . . . . . . . . . . . . . 65
Figure 28 – TRIVIR interface. The Scatterplot View in area (2) shows a similarity mapdepicting a collection of 675 papers in Computer Science. The circle colorsindicate the current query document (green), and then: the relevant (blue), notrelevant (red), suggested as relevant (yellow), and yet unlabeled documents(gray). The menu on top allows filtering the scatterplot in three differentways (2a, 2b and 2c). The Terms View (1) shows the important terms fromthe query document, where the user can remove (1a) or add (1b) terms. Area(4) shows the Signature List view, which shows the relevant 3-grams in thecorpus. It can be switched with the Focus List or the Suggestion List viewsby clicking on the corresponding buttons. The user can visualize important3-grams from the collection, select 3-grams with specific terms (4a), or selectall 3-grams that include terms from the terms view (4b). . . . . . . . . . . . 68
Figure 29 – Both the Focus List view (1) and the Suggestion List view (2) share the samearea in the interface, and the user switches between them (and the SignatureList view) by selecting the corresponding buttons on the top (refer to Figure28). The Focus List view shows all documents currently labeled as relevant;the Suggestion List view shows the documents suggested as relevant by theML classifier. The user can press the "Train" button to retrain the classifier (2a). 69

Figure 30 – Information flow in TRIVIR. The user first selects a corpus and a querydocument, and possibly modifies the default settings. The system initiallyrenders the Document view and the associated Terms, Signature List andFocus List views, which are computed considering the document represen-tation, the creation of a model containing the word representation of thecollection using the skipgram model, the ranked 3-gram list, and the distancefunction. The ML algorithm is trained; the documents it predicts as relevantdefine the Suggestion List view. Finally the 2D Scatterplot view is createdand rendered, with the circles colored according to the documents’ labels.Interacting with the multiple views the user has the necessary support toinvestigate the collection and decide about document relevance. The CALprotocol allows her to retrain the ML classifier and finish the process at anytime, when the final Focus List view gives all the documents identified asrelevant. . . . . . . . . . . . . . . . . . . . . . . . . . . . . . . . . . . . . 71
Figure 31 – List of synonyms for the term "case". The list merges dictionary synonymsand terms that are used in the same context as the selected one in the collection. 72
Figure 32 – Using the Signature List view to filter the scatterplot to display the documentsthat include the 3-gram "case base reason". One observes four categoriesof documents in the Scatterplot view (all of them include this 3-gram): thequery document (green), relevant documents (blue), suggested documents(yellow) and not yet labeled documents (gray). The user can set all notlabeled documents as not relevant (a) or relevant (b) at once. . . . . . . . . 73
Figure 33 – The menu on the Scatterplot view has different options depending on the label of the
document. For not labeled (gray) and suggested documents (yellow) the user has the
option of setting a document as relevant or not relevant (a). For relevant documents
(blue) the user can set it as not relevant or query (b) and for not relevant documents
(red) the user can add them to the Focus list (set as relevant) or set other documents
similar to it as not relevant (c) . . . . . . . . . . . . . . . . . . . . . . . . . . 74
Figure 34 – Demonstration of how to expand the set of relevant (by creating additional query
documents) and not relevant documents. The example illustrates the before and after
setting a document as query (a and b) and the before and after expanding the set of
not relevant documents (c and d) . . . . . . . . . . . . . . . . . . . . . . . . 75
Figure 35 – Suggestion View menu. The user has the options to set a document as notrelevant or relevant. . . . . . . . . . . . . . . . . . . . . . . . . . . . . . . 75
Figure 36 – Focus List menu. The user has the option to remove the document from the list. 76

Figure 37 – Scatterplot projections of a corpus with 1,363 papers, both created with the t-SNE
projection technique and different document vector representations, namely word
embeddings in (a); the VSM and a TF-IDF weighting scheme in (b). Blue circles cor-
respond to documents currently labeled as relevant, yellow to documents suggested
as relevant, not relevant documents are in red and the query documents in green. . . 80Figure 38 – After searching for the word "cell" in the signature view, the user realized it
is used in different contexts in the collection. Thus, he scanned the list andset all documents containing interesting 3-grams as relevant. . . . . . . . . 80
Figure 39 – Distribution of labeled documents at the end of the SMS session. . . . . . . 83


LIST OF TABLES
Table 1 – Some of the solutions presented in the related work section regarding the A -Category (1: Understanding the search; 2: Understanding the corpus; and 3:Understanding the search and the corpus), B - if the proposed visualizationrequires metadata, C - if the solution counted on text classification in order toenhance the IR system and D - If the solution handled the vocabulary-mismatchissue. . . . . . . . . . . . . . . . . . . . . . . . . . . . . . . . . . . . . . . 64


CONTENTS
1 INTRODUCTION . . . . . . . . . . . . . . . . . . . . . . . . . . . . 231.1 Contributions . . . . . . . . . . . . . . . . . . . . . . . . . . . . . . . . . 261.2 Structure of the document . . . . . . . . . . . . . . . . . . . . . . . . 26
2 DOCUMENT RETRIEVAL . . . . . . . . . . . . . . . . . . . . . . . 272.1 Initial Considerations . . . . . . . . . . . . . . . . . . . . . . . . . . . . 272.2 Document Retrieval . . . . . . . . . . . . . . . . . . . . . . . . . . . . . 272.2.1 Retrieval Models . . . . . . . . . . . . . . . . . . . . . . . . . . . . . . . 282.2.2 Active learning in information retrieval . . . . . . . . . . . . . . . . . 282.2.3 Challenges in Document Retrieval . . . . . . . . . . . . . . . . . . . . 292.3 Document Representation . . . . . . . . . . . . . . . . . . . . . . . . . 302.3.1 TF-IDF . . . . . . . . . . . . . . . . . . . . . . . . . . . . . . . . . . . . 312.3.2 Word Embeddings . . . . . . . . . . . . . . . . . . . . . . . . . . . . . . 332.4 Text Classification . . . . . . . . . . . . . . . . . . . . . . . . . . . . . . 362.5 Techniques for Text Visualization . . . . . . . . . . . . . . . . . . . . . 38
3 INFORMATION VISUALIZATION FOR INTERACTIVE TEXT RE-TRIEVAL . . . . . . . . . . . . . . . . . . . . . . . . . . . . . . . . . 43
3.1 Understanding the search . . . . . . . . . . . . . . . . . . . . . . . . . 433.2 Understanding the corpus . . . . . . . . . . . . . . . . . . . . . . . . . 523.3 Understanding the search and the corpus . . . . . . . . . . . . . . . . 583.4 Discussion and final considerations . . . . . . . . . . . . . . . . . . . . 63
4 TRIVIR: A VISUALIZATION SYSTEM TO SUPPORT DOCUMENTRETRIEVAL WITH HIGH RECALL . . . . . . . . . . . . . . . . . . 67
4.1 Initial Considerations . . . . . . . . . . . . . . . . . . . . . . . . . . . . 674.2 The TRIVIR System . . . . . . . . . . . . . . . . . . . . . . . . . . . . 674.2.1 Tasks supported . . . . . . . . . . . . . . . . . . . . . . . . . . . . . . . 694.2.2 The views detailed . . . . . . . . . . . . . . . . . . . . . . . . . . . . . 704.2.3 Underlying techniques . . . . . . . . . . . . . . . . . . . . . . . . . . . 744.3 Validation . . . . . . . . . . . . . . . . . . . . . . . . . . . . . . . . . . . 774.3.1 Preliminary Validation . . . . . . . . . . . . . . . . . . . . . . . . . . . 774.3.1.1 Data and system setup . . . . . . . . . . . . . . . . . . . . . . . . . . . . 774.3.1.2 Results . . . . . . . . . . . . . . . . . . . . . . . . . . . . . . . . . . . . . 78

4.3.2 A literature review problem . . . . . . . . . . . . . . . . . . . . . . . . 794.3.2.1 Data and system setup . . . . . . . . . . . . . . . . . . . . . . . . . . . . 794.3.2.2 Results . . . . . . . . . . . . . . . . . . . . . . . . . . . . . . . . . . . . . 794.3.3 A Systematic Mapping Study (SMS) scenario . . . . . . . . . . . . . 814.3.3.1 Data and system setup . . . . . . . . . . . . . . . . . . . . . . . . . . . . 814.3.3.2 Results . . . . . . . . . . . . . . . . . . . . . . . . . . . . . . . . . . . . . 824.4 Final considerations . . . . . . . . . . . . . . . . . . . . . . . . . . . . . 84
5 CONCLUSIONS . . . . . . . . . . . . . . . . . . . . . . . . . . . . . 85
BIBLIOGRAPHY . . . . . . . . . . . . . . . . . . . . . . . . . . . . . . . . . . . 89
23
CHAPTER
1INTRODUCTION
The wide availability of resources for the bulk digitalization of documents and othermedia produces vast collections of digital material of interest to professionals and researchersin the human and social sciences. This scenario increases the demand for the development ofcomputing technologies to support investigations on such collections in general, and collectionsof textual documents in particular. There are potential applications in many areas, e.g., medical,social and legal, encompassing a variety of problems, tasks and goals that require analyzing largedocument corpora.
Research on Visual Analytics is central to addressing the current challenges associ-ated with data analysis and data-centered discovery. Visual Analytics (VA) (OLIVEIRA; LEV-KOWITZ, 2003; WONG; THOMAS, 2004; KEIM et al., 2008) refers to the integration ofMachine Learning and Data Visualization techniques to assist humans in tasks that require theinterpretation of complex data. VA advocates a strong coupling of techniques from both areasto advance data analysis capability, by giving human and computer complementary roles inhandling the many issues introduced by the volume and complexity of current data sets. VA isparticularly relevant in handling complex multidimensional data, including collections of textualdocuments.
Given a set of documents, users may be interested in finding within this corpus documentsrelated with certain topics (BLAIR; MARON, 1985). The documents of interest are called"relevant", i.e., they satisfy the user’s information need, whereas the others are named "notrelevant". If the user is searching for a specific piece of information, the information need canbe expressed clearly and unambiguously as a query. In this scenario, the classic ranked list ofhits returned by search engines usually suffices. However, a different situation arises when auser can not concisely and objectively express a query, but it is still crucial that s/he finds therelevant documents to her information need. A typical example is when users are surveyingthe literature on a certain topic. An initial keyword-based search may return many documents,but not all of them will be actually relevant to the survey. User effort is necessary to identify

24 Chapter 1. Introduction
the relevant ones. Recall and Precision are often employed as measures of the success of anInformation Retrieval (IR) task. Recall is the proportion of relevant documents in the corpusthat were actually retrieved, whereas precision is the proportion of retrieved documents that areactually relevant.
Our contribution focuses on information retrieval tasks that demand high recall. Suchtasks occur frequently in diverse situations and application domains. Possible scenarios include,for example, lawyers searching for previous cases that may be in some way related to a currentone; researchers engaged in a literature survey who do not want to miss relevant studies to theirtopic; medical doctors searching for patient records that may include medical conditions relevantto a case under study; or people performing patent search where missing a single relevant patentcan result in invalidation of an otherwise sound patent. Pursuing high recall, however, oftenresults in loss of precision, meaning the user will end up retrieving many not relevant documents.This is a crucial issue, as we shall observe in the results section (Section 4.3), where we discussour solution applied on a real-word scenario.
An illustrative example of the potential of text analytics in practical applications inhumanities comes from the legal domain. In countries that follow the Common Law legal system,e.g., Canada and the United States, once a lawsuit gets underway, the parties or their lawyersstart an investigative process named “discovery”. This is a formal and strongly regulated process,in which the goal is to gather information related to the lawsuit, finding out facts and documentspreviously unknown (to one or both parties) that may be relevant to the dispute. Currently,Electronic Discovery (or E-Discovery, for short) refers to the discovery process conducted onElectronically Stored Information (ESI), which may include emails, documents, presentations,databases, voice mail, audio and video files, social media, and web sites. Typically, parties needto review documents in order to identify responsiveness (relevance to a specific informationneed), or privileges, i.e., documents that should be withheld due to privacy regulations.
Analytic software to support E-discovery often rely on Technology Assisted Review,referred to as TAR Cormack and Grossman (2013). Using TAR for E-discovery can reduce thenumber of documents required for review by attorneys, with an impact on labor effort and costs.It has been shown (GROSSMAN; CORMACK, 2011) that a supervised machine learning TARmethod is more effective than human review, as measured by recall and precision. Nonetheless, amajor concern in this scenario is minimizing the risk of overlooking important documents. Thisexample illustrates a typical scenario of total recall in information retrieval, i.e., given a particularinformation need (expressed as a query, or as one or multiple representative documents), a systemshould be able to ensure that nearly all relevant documents to the query will be retrieved.
The legal domain is just one example. A similar scenario has been investigated by Makkiet al. (2017) in another domain: their goal is to retrieve Twitter posts related to a predefinedset of topics, and label them accordingly. The topics, in this case, describe relevant politicaldebates held at the Canadian Parliament. The retrieval system is potentially useful, e.g., to
25
investigative journalists or social researchers, and similarly to the previous case a major concernis that relevant posts are not missed – otherwise analysts might be misled or biased in theirstudies. Again, there is a growing demand for tools to support analytics of social media posts.Nonetheless, ensuring that relevant posts are not missed is not a trivial task, due to the sheervolume of posts, the specificity of the debates, and the noisy and inconsistent vocabulary adoptedin Twitter.
Both examples illustrate situations that lead to the formulation of a high recall problem inthe context of textual document retrieval, and several other scenarios could be listed: documentretrieval with high recall is a problem that has received considerable attention from the collabo-rators at the MALNIS research group from University of Dalhousie, Canada. The problem canbe expressed in different manners, but our interest lies in scenarios in which it is expressed as adocument similarity search: user picks an example document (or multiple ones), and wants anautomatic system to recover similar ones in the collection, based on the informative keywords,or terms, identified in the query document.
A strategy often employed in scenarios similar to the ones just described is referred to asContinuous Active Learning (CORMACK; GROSSMAN, 2014): once presented to an initialquery, a learning method returns the most-likely relevant documents (e.g., the most similar) tothe reviewer in batches, the reviewer labels each document (as relevant/not relevant) and thelabels are fed back to the learning algorithm which uses this information to refine its predictions.This iterative process goes on until some condition is satisfied – e.g., no more improvementsobserved in a target quality measure.
The interactive process is a great tool in scenarios where high recall is required becauseusers are often more willing to provide feedback and interact with the information retrievalsystem, as opposed to users that are interested in very high precision and usually count on websearch engines.
In a general setting, one of the difficulties faced stems from the vocabulary mismatchissue, i.e., the use of different terminologies to describe semantically related or equivalentconcepts. The challenge is to identify the semantically related terms when providing relevancefeedback to a learning algorithm, so that the corresponding related documents are also identified.
This scenario provides the motivation for this research proposal, in which the aim is toinvestigate the following research problem: “Can an user interacting with appropriate visual
representations of a document collection improve total recall in a (general) document similarity
search?”

26 Chapter 1. Introduction
1.1 ContributionsWithin the presented context, our studies resulted in TRIVIR, an interactive visualization
tool for information retrieval with high recall, i.e., we want to ensure that very few relevantdocuments will be missed by the retrieval task. As described in Chapter 4, it integrates a front-endvisualization interface to a back-end information retrieval engine associated with a machinelearning (ML) algorithm, which learns how to identify relevant documents based on user input.The ML algorithm suggests potentially relevant documents that are shown as a ranked list andalso mapped in a Scatterplot view where one can see how suggested documents are related withother documents in the collection. The user can interact with multiple graphical views to explorethe collection in order to identify and label documents that meet her information needs. TRIVIRoffers two major advantages over existing visualization systems for information retrieval. First,it merges the ML algorithm into the visualization while allowing several user interactions inorder to enhance and speed up its convergence. Second, it tackles the problem of vocabularymismatch by providing synonyms of terms and a view that shows the context where a term occur.Besides, TRIVIR is a flexible interface over different text representations and multidimensionalprojection techniques.
1.2 Structure of the documentThis document is organized as follows. Chapter 2 describes a short background on
document retrieval. A brief survey on related work on text visualization is presented in Chapter3. The TRIVIR system as well as our validation exercises are described in Chapter 4. Finally wepresent our conclusions in Chapter 5.

27
CHAPTER
2DOCUMENT RETRIEVAL
2.1 Initial ConsiderationsIn this work, we deal with concepts commonly used in the information retrieval field.
The following sections provide an overview of the techniques and nomenclature used throughoutthis dissertation. More specifically, this chapter covers studies in the document retrieval area,including usage scenarios and challenges. Additionally, it covers aspects such as documentrepresentation, dimensional reduction and text classification techniques.
2.2 Document RetrievalThe historical need of human beings to gather information became even more pressing
after the introduction of computers. According to Blair and Maron (1985), given a set ofdocuments by different authors and collected at different moments, users might want to finddocuments related with certain topics of interest within this set. The documents of interest arecalled "relevant", whereas the others are named "not relevant". Document retrieval was for manyyears a manual process. However, the availability of huge amounts of digital document setsmade it unfeasible to search for relevant documents without computer assistance. Computerizedfull-text document retrieval emerged in this context, introducing new approaches, challenges, andmany novel applications going from simple web search to governmental and institutional systems.New methods and techniques have been created in order to enhance the search experience movingfrom simple lists of ranked documents to more complex visualizations and algorithms.
A document can be considered relevant to a query based on two major aspects, namely(1) topical and user constraints and (2) whether binary or multivalued relevance is considered.The topical relevance could be measured based on the match between a document and thequery’s terms. On the other hand, relevance also takes into consideration the user judgment,which could include aspects such as the document’s date or language, for example. The second

28 Chapter 2. Document Retrieval
aspect concerns binary relevance, meaning that a document is either relevant or not relevant.However, if multivalued relevance is considered, a document may have more than two levels ofrelevance. Retrieval models arose to provide a framework for defining new tasks and explainingassumptions. Classic retrieval models are the Boolean model and the Vector Space model(CROFT; METZLER; STROHMAN, 2009).
2.2.1 Retrieval Models
The Boolean Retrieval model uses Boolean expressions to formulate a query. Whensearching for documents, the Boolean model will consider a document relevant only if it matchesthe query entirely. Documents are not ranked by relevance, since all relevant documents aretreated as equals. This model is easy to interpret, which brings transparency to the retrieved set,and it is more efficient than ranked retrieval models. However, it requires a certain level of userexpertise, since the lack of a ranking algorithm makes simple queries less effective (CROFT;METZLER; STROHMAN, 2009).
The Vector Space model applies term weighting, ranking and possibly relevance feedbackin order to enhance search effectiveness. It represents queries and documents as t-dimensionalvectors defined in a multidimensional space, where t is the number of index terms. A commonmethod to determine whether a document is relevant to a query and its degree of relevance, isto compute the cosine correlation on the query and documents normalized vectors. This modelis not as transparent as the Boolean model, as it may be difficult to understand why documentshave been considered relevant and how the rankings have been applied (CROFT; METZLER;STROHMAN, 2009).
The facet query can be seen as a combination of both previous models. This techniqueallows users to perform multiple Boolean queries simultaneously and documents are rankedbased on the number of matched queries (SINGHAL, 2001). By providing multiple searches atonce, users can analyze different perspectives of a search.
2.2.2 Active learning in information retrieval
Active Learning (AL) appears in contexts where a ML algorithm is allowed to chooseinteresting documents to be labeled, e.g., to create a training set for classification when labeleddata is scarce. AL aims at achieving high accuracy while minimizing the cost of obtaining labeleddata (SETTLES, 2009). It is particularly relevant in certain IR scenarios in which there are manyunlabeled items and a user interested in a small portion of the collection. The user, in this contextcalled an ‘oracle’, is presented unlabeled items (also known as training points, or queries) tolabel. Beyond recommending items likely of interest, as in Recommender Systems, the rationaleis to let the user understand her preferences while feeding an algorithm that considers thisinformation in providing subsequent recommendations, thus personalizing the recommendation

2.2. Document Retrieval 29
process (RUBENS; KAPLAN; SUGIYAMA, 2011).
The legal field makes intensive usage of document retrieval, having introduced the term“electronic discovery" or “e-discovery", defined as the process of identifying, preserving, collect-ing, processing, searching, reviewing, and producing Electronically Stored Information that maybe relevant to people from different scenarios and backgrounds. (CORMACK; GROSSMAN,2013). In this context, technology-assisted review ("TAR") has been introduced to support e-discovery. According to Cormack and Grossman (2014), its purpose is to find as much relevantdocuments in a collection as possible, with reasonable effort. The most frequent approach forTAR is to use a training set to select certain terms or phrases that characterize a document asrelevant/not relevant. Then, the classifier algorithm predicts whether documents outside thetraining set should or not be useful (CORMACK; GROSSMAN, 2016b). Algorithms consideredeffective include Support Vector Machines, Logistic regression, Nearest Neighbor and NaiveBayes. These can be associated with multiple TAR protocols (GROSSMAN; CORMACK, 2016),such as the Continuous Active Learning (CAL) protocol adopted in TRIVIR. The CAL protocolcomprises four steps, namely:
1. Create an initial set of possible relevant documents.
2. Train a ML algorithm with the labeled documents. This step should return a ranked listwith documents that might be relevant to the user. It is common for the ML algorithm touse binary relevance.
3. The user can provide relevance feedback to the system by labeling documents as "relevant"or "not relevant".
4. Repeat steps (2) and (3) and, if necessary, also step (1), until no more (or very few) relevantdocuments are suggested by the classifier (GROSSMAN; CORMACK, 2016).
Unlike other protocols such as Simple Active Learning (SAL) and Simple PassiveLearning (SPL), CAL does not face the problem of determining when to stop training and howmany documents should be included in the review set. However, the question of when to stop thesearch still holds (CORMACK; GROSSMAN, 2016a).
2.2.3 Challenges in Document Retrieval
When evaluating the outcome of a search, the most usual measures are recall andprecision. Recall is defined as “the fraction of relevant documents that are identified as relevant
by a search or review effort”; Precision is “the fraction of documents identified as relevant
by a search or review effort, that are in fact relevant.” (CORMACK; GROSSMAN, 2013). Itis expected that the best search results would maximize recall and precision, however, whatusually happens is that high recall results in low precision and vice-versa. According to Manning,

30 Chapter 2. Document Retrieval
Raghavan and Schütze (2008), a Boolean search tends to yield low precision and high recallwhere OR operators are used, and low recall and high precision where AND operators are used.This situation makes finding a satisfactory middle ground very difficult or impossible.
An influential study by Blair and Maron (1985) has shown that the system STAIRS, astate-of-art software in full text retrieval at the time, was capable of retrieving only 20 percentof the relevant documents, while its users (lawyers) believed it had achieved over 75 percent.A reason for the low recall is that words or phrases could be written in different ways but stillown the same meaning. As an example, the word “accident" might be reported in a legal ornews document using the keywords "event", "incident", or "situation". Besides, misspelling alsoproved to be an obstacle when retrieving similar documents. That study proved that many earlytechniques for document retrieval were unsuitable for large document sets. The concern forproviding scalable techniques motivated the creation of the Text Retrieval Conference (TREC) in1992, that expanded the studies on information retrieval (IR) for large text collections (SINGHAL,2001).
Several challenging issues remain in document retrieval. One of them is determiningrelevance, since it is not straightforward to assess document relevance based solely on theuser’s query. Several document retrieval models have been created in order to address this issuewhich are a formal representation of the process of matching a query and a document (CROFT;METZLER; STROHMAN, 2009). Retrieval evaluation is an additional challenge. Whilst recalland precision are popular measures, they are difficult to measure on a web search environmentand are normally evaluated on small text collections. Moreover, as stated by Baeza-Yates andRibeiro-Neto (1999) even though recall and precision are widely employed to compare the resultset of non-interactive systems, they are less appropriate for assessing interactive systems. Novelmetrics are necessary, such as the time required to learn the model, the time required to achievegoals on benchmark tasks, error rates, and retention of the interface usage over time.
Finally, another core issue is how to best determine a user’s information needs, whichis not always well defined. For this, several techniques, including query suggestion, queryexpansion and relevance feedback have been introduced in order to help users express theirneeds properly and improve the document retrieval process (CROFT; METZLER; STROHMAN,2009).
2.3 Document Representation
Since computers cannot make sense of actual text, some processing is needed. A commonapproach is to transform a text document into a vector representation. This vector might simplybe the count of the terms within a document (commonly referred to as bag-of-words or theVector Space Model), or some additional processing can be applied in the vector in order to givemore importance to representative terms. Representing documents in a vector space, is known

2.3. Document Representation 31
as the vector space model, and it is really useful in other information processing tasks, such asdocument classification, document clustering and document ranking (MANNING; RAGHAVAN;SCHüTZE, 2008). Documents are represented as points in the vector space and the distancesamong points (i.e. documents) depict their semantic similarity (TURNEY; PANTEL, 2010).Additionally, some pre-processing is usually necessary to avoid including in the vector commonwords such as "of" and "the". This process is called stop-word removal and consists of removingcertain words devoid of meaning from the document before representing it as a vector. A stop-word list might contain general common words or domain specific terms such as "conference"or "abstract" if one is handling scientific documents, for instance. Also common is to removespecial characters and numbers when appropriate.
Additionally, some normalization such as transforming all the words into lower casecharacters and uniformly handling different forms of a word can be applied in the pre processingstep. For example, the words "analyse", "analyses" and "analysed" should be interpreted as havingthe same meaning and appear as a single term in the vector representation. In order to achieve thisgoal, stemming or lemmatization can be applied, where the former is a simpler solution wherecommon suffixes are removed. In this case, all the three mentioned words would become theword "analys". However, dealing with the words "see", "sees" and "saw", the simplest stemmingalgorithm would reduce all forms to "s". More advanced stemming algorithms would have aminimum number of letters to keep, which would properly change "sees" to "see", however,they would not modify the word "saw". Lemmatization is a more elaborate process where thewords are transformed into their root or dictionary form. Thus, the first group of words would betransformed into the single word "analyse" and the second group would be represented by theword "see".
Other techniques can be used in order to retrieve the most important aspects of a docu-ment, such as tokenization, which consists of retrieving the most important terms (called tokens)of a document, where each token might consist of multiple words. For example, the words AirCanada usually appear together, because they represent the name of a company, thus they repre-sent a single token. Additionally, metadata from specific domains that do not bring representativevalue can be removed, for example author’s names, university names, and dates in a corpus ofscientific papers.
The following sections describe some techniques used to represent documents. Morespecifically, how the vector representation can be enhanced in order to better represent thesingularities of each text in a document corpora.
2.3.1 TF-IDF
A problem with the bag-of-words approach is that the raw frequency of terms does notrepresent the real importance of a term to a document when assessing its relevancy to a query. Forexample, the word "computer" would have a high frequency in a computer science collection and
32 Chapter 2. Document Retrieval
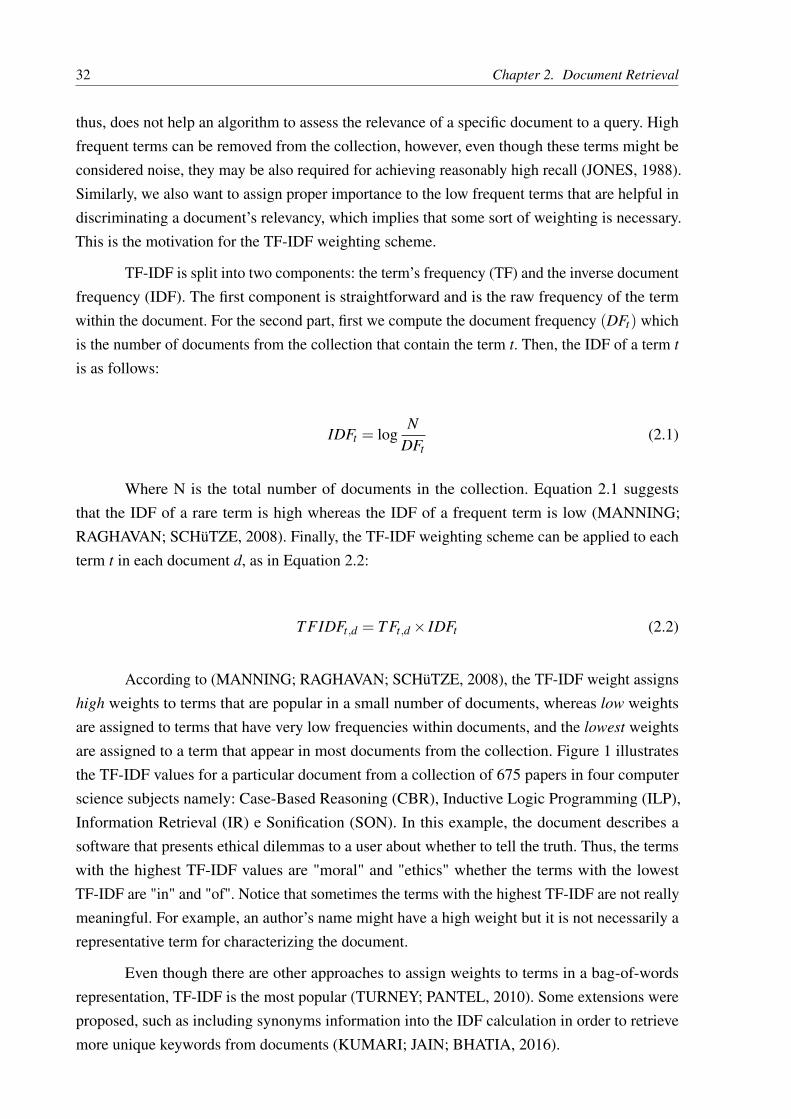
thus, does not help an algorithm to assess the relevance of a specific document to a query. Highfrequent terms can be removed from the collection, however, even though these terms might beconsidered noise, they may be also required for achieving reasonably high recall (JONES, 1988).Similarly, we also want to assign proper importance to the low frequent terms that are helpful indiscriminating a document’s relevancy, which implies that some sort of weighting is necessary.This is the motivation for the TF-IDF weighting scheme.
TF-IDF is split into two components: the term’s frequency (TF) and the inverse documentfrequency (IDF). The first component is straightforward and is the raw frequency of the termwithin the document. For the second part, first we compute the document frequency (DFt) whichis the number of documents from the collection that contain the term t. Then, the IDF of a term t
is as follows:
IDFt = logN
DFt(2.1)
Where N is the total number of documents in the collection. Equation 2.1 suggeststhat the IDF of a rare term is high whereas the IDF of a frequent term is low (MANNING;RAGHAVAN; SCHüTZE, 2008). Finally, the TF-IDF weighting scheme can be applied to eachterm t in each document d, as in Equation 2.2:
T FIDFt,d = T Ft,d × IDFt (2.2)
According to (MANNING; RAGHAVAN; SCHüTZE, 2008), the TF-IDF weight assignshigh weights to terms that are popular in a small number of documents, whereas low weightsare assigned to terms that have very low frequencies within documents, and the lowest weightsare assigned to a term that appear in most documents from the collection. Figure 1 illustratesthe TF-IDF values for a particular document from a collection of 675 papers in four computerscience subjects namely: Case-Based Reasoning (CBR), Inductive Logic Programming (ILP),Information Retrieval (IR) e Sonification (SON). In this example, the document describes asoftware that presents ethical dilemmas to a user about whether to tell the truth. Thus, the termswith the highest TF-IDF values are "moral" and "ethics" whether the terms with the lowestTF-IDF are "in" and "of". Notice that sometimes the terms with the highest TF-IDF are not reallymeaningful. For example, an author’s name might have a high weight but it is not necessarily arepresentative term for characterizing the document.
Even though there are other approaches to assign weights to terms in a bag-of-wordsrepresentation, TF-IDF is the most popular (TURNEY; PANTEL, 2010). Some extensions wereproposed, such as including synonyms information into the IDF calculation in order to retrievemore unique keywords from documents (KUMARI; JAIN; BHATIA, 2016).

2.3. Document Representation 33
Figure 1 – TF-IDF terms’ distribution in a particular document from a collection of 675 documents incomputer science
Source: Developed by author
2.3.2 Word Embeddings
Even though the bag-of-words representation and its variations are highly popular, theyare not suitable in some information retrieval scenarios, since it does not consider the inherentrelationships among terms in the text. Besides, the bag-of-words representation ignores wordorder, which means that completely different phrases formed by the same words would be equallyrepresented, with a possible negative effect.
In order to mitigate the above problems, methods that use neural networks to createvector representation of words have been introduced. The study by Mikolov et al. (2013)presented the Skip-gram model, which became the base model for many following techniquesincluding word2vec (MIKOLOV et al., 2013), a now highly popular technique to create wordrepresentations.
Advances in data availability and computing power made possible to train machinelearning algorithms on much larger data sets which typically outperform simple models suchas the bag-of-words. Mikolov et al. (2013) presented two new architectures to build vectorrepresentations of words illustrated in Figure 2. The first one is the Continuous Bag-of-WordsModel (CBOW), which given the words surrounding a target, predicts the target word. Thesecond model is the continuous Skip-gram model, which is also a neural network where givenan input word, the model predicts the most likely surrounding words. The models are consideredsimple because, unlike common neural network models, the hidden layer has a linear function.This feature might not represent the data too precisely, but it allows for efficient training on muchlarger data sets.

34 Chapter 2. Document Retrieval
Figure 2 – While CBOW finds a target word (w(t)) based on its context words, Skip-gram finds the contextwords surround a target word (w(t)).
Source: Mikolov et al. (2013)
This kind of representation allows executing simple algebraic operations in the vectorsand thus, finding inherent relationship among words. For example, it was found that w("Paris") -w("France") + w("Italy") is very close to the vector w("Rome") where w(word) means the vectorrepresentation of a specific word. Additionally, beyond obtaining the model, one also has a wordrepresentation that can be employed in different tasks (MIKOLOV; YIH; ZWEIG, 2013).
In order to enhance the skip-gram model, Mikolov et al. (2013) introduced severalextensions that resulted in word2vec, an open source project1 that incorporates both the CBOWand the Skip-gram models. The original softmax function in the hidden layer was replaced bytwo new functions: the hierarchical softmax and the negative sampling. The main advantage ofthe hierarchical softmax is that instead of evaluating all words in the vocabulary in the outputnodes, it evaluates around log2(W ) nodes, where W is the total number of words in the collection.On the other hand, the underlying rationale of negative sampling is that given an input word andgiven the positive output words returned by the model, the algorithm chooses some negativesamples according to a certain probability and updates the weights of the negative samplesand the positive words, instead of the entire vocabulary. Negative sampling has proved to beaccurate in learning representations, specially for frequent words. Moreover, in order to counterthe imbalance between rare and frequent words, a sub sampling approach was used where eachword in the training set is discarded with a certain probability. Using the skipgram model asbase model, Bojanowski et al. (2017) proposed a model that represents each word as a bag ofcharacter n-grams. The underlying rationale is that word representations can be improved ifwords are represented by the sum of their character n-gram vector representations, specially formorphologically rich languages. For example, taking n = 3 and the word "where", the algorithm
1 code.google.com/p/word2vec

2.3. Document Representation 35
would set as input: <wh, whe, her, ere, re> and the full word "where". The model performedbetter on languages such as Arabic, German and Russian than English, French or Spanish.However, it also proved effective when dealing with the English Rare Words dataset. This modelis available in the "fastText" website2, which also provides a model for text classification.
After the development of word embeddings, some studies were conducted in order tocreate similar representations of sentences, paragraphs and even full documents. One of the mostpopular solutions is the doc2vec method, introduced by Le and Mikolov (2014) under the nameof Paragraph Vectors. The method embeds two models that can represent texts varying fromsentences to full documents. The first one is called the Distributed Memory Model of ParagraphVectors (PV-DM) and consists in concatenating a paragraph with word vectors and predictingthe following word in the given context. In this method, the paragraphs are mapped to a uniquevector and are represented as a column in a matrix D, whereas words are mapped in a column inmatrix W (see Figure 3). Then, paragraph and word vectors are averaged or concatenated in orderto predict the next word in a context. It has been found that concatenating the vectors resultsin better predictions. The paragraph can be seen as a word that acts as a memory to rememberwhich words are missing from the current context or topic.
Figure 3 – The paragraph node serves as a memory that helps to find the missing information. Along withthe three context words, the system’s goal, in this case, is to predict the fourth word.
Source: Le and Mikolov (2014)
The second model is called Distributed Bag of Words version of Paragraph Vector (PV-DBOW) and its goal is to predict words from the paragraph (Figure 4). The idea is to randomlyselect a word from a text window in the paragraph and use the algorithm to predict its surroundingwords given the paragraph context (the selected window). This model requires less memory thanthe previous one and is similar to the skip-gram model.
The paper reports experiments conducted using a combination of the two models, how-ever, it has been found that using only the PV-DM model generates satisfying results for most
2 https://fasttext.cc/

36 Chapter 2. Document Retrieval
Figure 4 – Similar to the skip-gram model, the paragraph is trained to predict the words in differentwindows.
Source: Le and Mikolov (2014)
tasks. Experiments in text classification using the proposed method were conducted in twodata sets, namely the Stanford Sentiment Treebank dataset that contains 11,855 sentences frommovie reviews, and the IMDB dataset, which consists of 100,000 movie reviews includingseveral sentences. The method has also been tested on an information retrieval task. The resultsconfirmed that PV-DM achieved lower error rates than existing ones.
The goal of the information retrieval experiment consisted in finding two out of threesnippets retrieved from a web engine that were related to a given query. The rationale is thatgiven the distance among the paragraphs, the two that were actually related to a query would becloser, whereas the unrelated one would be far apart. Results have shown that the new methodachieved the lowest error rate compared to others, including the bag-of-words model using theTF-IDF weighting scheme (3.82% and 8.10%, respectively).
Even though word embeddings learn the context of a given word, problems remaindue to polysemy, that implies that one word may have different meanings depending on thecontext, since the model learns a single representation for each word. Further studies (ZAMANI;CROFT, 2017) and (KIELA; HILL; CLARK, 2015) try to remedy this issue by adding semanticinformation to the model according to the user needs.
2.4 Text Classification
In Section 2.2 we briefly described the CAL protocol and its importance to informationretrieval tasks, specially when the goal is to achieve high recall. The rationale is to present tothe user the top K most similar documents to a query document so s/he can label the results as"relevant" or "not relevant". Then, these labeled documents are used to update a classifier modelthat will come up with new documents for the user to review. The process can stop accordingto several rules, such as when the user considers appropriate, when no new documents are
2.4. Text Classification 37
considered relevant by the algorithm, or when all the documents have been labeled. This lateroption will achieve the highest recall, at the cost of greater human effort.
Text classification algorithms use a vector representation of text as input, and return aclass or category of the text. The output can be binary, such as "relevant" or "not relevant", 1 or 0,or handle multiple categories such as "not relevant", "neutral", "relevant" or lie between a range,e.g., 1-5 stars in a movie review. In order for the algorithm to know the class of a text, it needs tobe trained with labeled data. This is the motivation for employing supervised machine learningalgorithms and neural networks for automatic text classifications tasks (KADHIM, 2019).
Even though neural and deep networks usually provide better results than standardmachine learning algorithms (KAMATH; BUKHARI; DENGEL, 2018), they are computationallyexpensive and usually require a large training set to produce good results. For these reasonsstandard text classification algorithms remain very popular since they require less resources andusually yield satisfying results. Popular algorithms include Support Vector Machine (SVM),Logistic Regression and Naive Bayes classifiers.
A problem with classification algorithms is that they do not share parameters amongfeatures and classes, which limits their generalization power when dealing with a large outputspace and few training samples (JOULIN et al., 2017). In order to tackle this problem, Joulin et
al. (2017) presented a text classifier, embedded in the "fastText" library, which can train on abillion words in ten minutes and achieves performance comparable with state-of-the-art solutions.The underlying rationale of the "fastText" classifier is to find vector representations for text andlabels so that labels associated with certain texts appear close together in the vector space. This isdone using a similar architecture to CBOW. The hierarchical softmax function is used to computethe probability of a correct label, given an input text. The score returned by the softmax functionis normalized with the scores returned for the same function using other labels. Additionally,instead of using the bag of words representation that ignores word order, the algorithm uses bagof n-grams to capture partial information regarding word order.
Experiments were conducted in two different tasks. The first one considered the problemof sentiment analysis to compare fastText with existing text classifiers, and the second oneused a tag prediction dataset in order to evaluate its capacity to scale to large amounts of data.The results have shown that fastText achieved results on par with recent deep learning inspiredmethods, with the advantage of being much faster.
The goal of this study is not to find the best text classifier algorithm, but rather checkits usefulness when applied in an interactive visualization and classification tool that supportsinformation retrieval aiming for total recall. Previous studies have already shown that allowinguser’s interference in classification processes can improve the efficiency of the classifier’sconvergence (PAIVA et al., 2015).
Similarly, Koch, Heimerl and Ertl (2013) presented a solution that lets a user visually
38 Chapter 2. Document Retrieval
and interactively build binary classifiers in order to improve a document retrieval task usingmultiple views. The classification algorithm used was the linear SVM, where the goal is to showusers the most uncertain documents that the classifier found relevant and not relevant for labelingfirst. Documents are shown in a 2D scatterplot that displays the current state of the classifier.By labeling the documents, the user can see a preview of how the other documents would beclassified.
In conclusion, the rationale is to have a default text classification algorithm and, ideally,the user would be able to choose among other algorithms since the classifier accuracy is highlyrelated to the data and domain under analysis (KAMATH; BUKHARI; DENGEL, 2018).
2.5 Techniques for Text Visualization
In information retrieval tasks it can be very useful to have an overview of the data, a.k.a,how the corpus is organized. At this point, we know that the documents can be represented asvectors where similar documents should have representations that are close to each other in thevector space. However, these vectors are high-dimensional, which makes impossible for us tovisualize them. Dimensional reduction techniques can be helpful in this context, to obtain 2D or3D vectors that can be represented in a 2D visualization, while preserving as much as possible therelationships defined in the original space. Besides visualization tasks, dimensionality reductionalso facilitates classification and compression of high-dimensional data.
Since it is beyond our scope to detail such techniques, we rather focus on a few techniquesfound most relevant to our studies. The first technique is the Principal Component Analysis(PCA) which is a convex and full spectral technique. A convex technique means that the objectivefunction does not contain any local optima and by full spectral it implies that PCA performsan eigendecomposition of a full matrix which, at the end, provides the similarities among theinput vectors. Similar to PCA, multidimensional scaling (MDS) is also convex and full spectral(MAATEN; POSTMA; HERIK, 2009).
PCA dates back to 1901 (PEARSON, 1901). It consists in preserving the inner productof data points by applying an orthogonal transformation in order to achieve the best fit whenplacing the data on a line (or plane). This is done by retrieving the dimensions that maximizethe variability in the data, which are called the "Principal Components". Thus, the first principalcomponent will be the one with the largest possible variance and the others principal componentswill have the next highest variance, while being orthogonal to the other components. In orderto find the dimensions that offer maximum variability, a common approach is to compute thecovariance matrix which shows the linear tendency between each pair of data points. Theprincipal components will be given by the eigenvectors associated with the largest eigenvaluesof the covariance matrix.
The MDS technique (TORGERSON, 1952) consists in three steps: (1) Find the com-

2.5. Techniques for Text Visualization 39
parative pairwise distances among data points (distance - a unknown constant), (2) find anapproximation for the unknown constant and (3) place the data in the space according to the abso-lute distances found in the previous step. This unknown constant is estimated as the value whichadded up to the distance will allow the data to be fitted by a real Euclidean space with the smallestdimensionality possible. The classical multidimensional scalling is one way of implementingMDS. A popular MDS approach is the Force-Directed Placement (FDP) (FRUCHTERMAN;REINGOLD, 1991) which creates forces for every pair of data points and the system reaches theequilibrium by pushing and pulling them out. This technique is considered equivalent to MDSwhen the spring forces are proportional to the dissimilarity of points in both the real and theprojected space.
As stated by Maaten, Postma and Herik (2009), PCA and MDS face two major draw-backs. First, PCA does not scale to very high-dimensional data, since the covariance matrixis proportional to the dimensionality of the data points. However, this issue might be solvedby MDS if the number of data points is lower than the their dimensionality since classicalscaling scales with the number of data points. Another drawback is that both techniques focuson maximizing the global pairwise distance among the data points and do not prioritize thesimilarity of neighboring points, which may be more important.
The results from Maaten, Postma and Herik (2009) suggested at the time that mostnonlinear techniques do not outperform PCA on natural datasets, even though they are capableof learning the structure of complex, nonlinear data. Besides, when the number of data pointsis greater than the number of dimensions, nonlinear techniques have a higher computationalcost than PCA. Even though convex techniques such as PCA are popular, the author suggeststhat finding a sub optimal objective function is more viable than optimizing a convex objectivefunction due to its complexity to optimization. This is supported by the results obtained fromthe t-SNE technique which is a non-convex MDS variant that was not yet available when thecomparative study was performed.
The (t-Distributed Stochastic Neighbor Embedding) t-SNE technique was proposed byMaaten and Hinton (2008) for data visualization. This means that the goal is to give each dataelement a position in a 2D or 3D space. As opposed to linear techniques such as PCA andMDS, that focus on keeping dissimilar data points far apart, non-linear methods such as t-SNEusually focus on keeping similar data points close together, which is typically impossible whenusing linear techniques. As the name suggests, t-SNE was derived from the Stochastic NeighborEmbedding (HINTON; ROWEIS, 2002), a technique to embed high-dimensional data into alow-dimensional space in a way that reduces the agglomeration of points in the center of themap, thus improving the quality of visualizations.
Maaten and Hinton (2008) modified the SNE’s cost function, which is difficult to optimizeand generates the agglomeration problem. Thus, t-SNE applies a symetrized version of the SNEcost function and uses the Student-t distribution, rather than a Gaussian, for computing similarity
40 Chapter 2. Document Retrieval
between two points in the low-dimensional space, which speeds up calculations. Also, t-SNEapplies a heavy-tailed distribution of the points in order to alleviate the two problems mentionedabove.
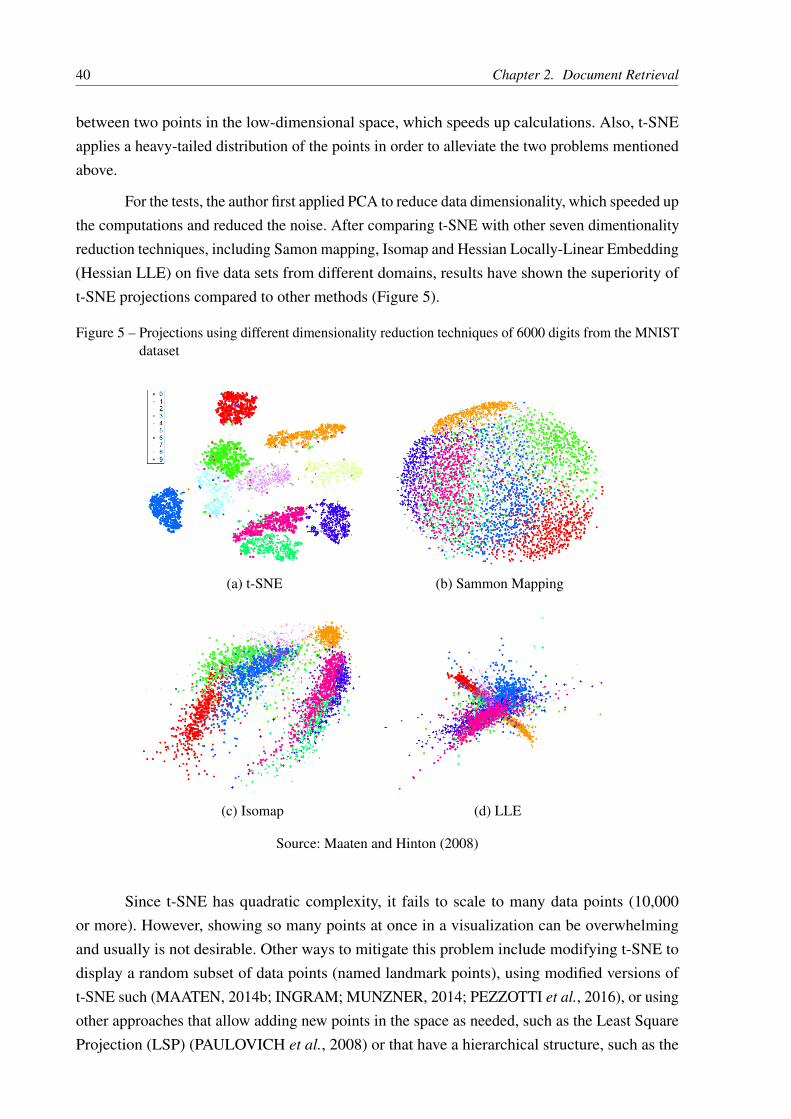
For the tests, the author first applied PCA to reduce data dimensionality, which speeded upthe computations and reduced the noise. After comparing t-SNE with other seven dimentionalityreduction techniques, including Samon mapping, Isomap and Hessian Locally-Linear Embedding(Hessian LLE) on five data sets from different domains, results have shown the superiority oft-SNE projections compared to other methods (Figure 5).
Figure 5 – Projections using different dimensionality reduction techniques of 6000 digits from the MNISTdataset
(a) t-SNE (b) Sammon Mapping
(c) Isomap (d) LLE
Source: Maaten and Hinton (2008)
Since t-SNE has quadratic complexity, it fails to scale to many data points (10,000or more). However, showing so many points at once in a visualization can be overwhelmingand usually is not desirable. Other ways to mitigate this problem include modifying t-SNE todisplay a random subset of data points (named landmark points), using modified versions oft-SNE such (MAATEN, 2014b; INGRAM; MUNZNER, 2014; PEZZOTTI et al., 2016), or usingother approaches that allow adding new points in the space as needed, such as the Least SquareProjection (LSP) (PAULOVICH et al., 2008) or that have a hierarchical structure, such as the

2.5. Techniques for Text Visualization 41
Hierarchical Point Placement Projection (HiPP) (PAULOVICH; MINGHIM, 2008).
The LSP technique relies on selecting control points representative of the data distribution.These points are mapped in the 2D space using MDS. Then, the algorithm creates a linear systemin order to map the other points using their similarity information and the Cartesian coordinatesof the control points. That way, the system makes it possible the simple addition of new points,since it only interpolates the new points while aiming at preserving neighborhood relations.LSP yields high precision and fast computation specially in nonlinear sparse spaces such ashigh-dimensional document representations. The projection can be generated from the distancerelationship matrix or from attribute relationships of a vector representation.
HiPP is a variation that focuses on allowing exploration through different levels ofdetail. The projection first shows clusters of the data and details are provided on demand byexpanding the clusters. Thus, instead of dealing with approximations, it splits the data intoclusters and places them in the display according to the cluster’s similarity, which is way fasterthan calculating the similarities among all the datapoints. By optimizing the use of space, thetechnique solves the problem of point overlapping typical of t-SNE and LSP. After constructingthe tree, where the leaves represent individual data instances, the projection is done in two mainsteps: first, the LSP (or other point placement strategy) is used to project the nodes. Second, thedistance among points is improved in order to resolve overlaps. Views of data mapped by bothHiPP and LSP are shown in Figure 6.
Figure 6 – Projection of LSP and HiPP of 30000 data points from a news articles dataset
(a) Least-Square Projection (LSP) (b) Hierarchical Point-Placement (HiPP)
Source: Paulovich and Minghim (2008)
A drawback of non-linear techniques is that their behavior depends on the chosenparameters, which may depend on the data. For example changing the perplexity and stepparameters in t-SNE can yield different results3. Similarly, the choice of the control points inLSP interferes in the final result. Nevertheless, according to Sedlmair, Munzner and Tory (2013),
3 https://distill.pub/2016/misread-tsne/

42 Chapter 2. Document Retrieval
a good approach is to vary the dimensionality reduction technique to investigate the best option,since there is not a single technique that is best than the others in all scenarios.
43
CHAPTER
3INFORMATION VISUALIZATION FOR
INTERACTIVE TEXT RETRIEVAL
This chapter presents a literature review on text visualizations proposed for use inconnection with document retrieval tasks. The studies were organized into three groups: (1)Those that help a user to understand the search result and, thus formulate an ideal query, (2)Those that help a user to understand the corpus and, (3) Those that merge both previous goals.The later is more related to this work, however, both groups 1 and 2 present solutions for theirrespective goals that were considered relevant to our research.
3.1 Understanding the search
Systems that relate text documents to queries, usually represented as keywords of interest,are very relevant to the task of information retrieval specially because they render the searchprocess more transparent than classic search engines, where the user inputs some keywordsand the result is a ranked list of documents. When the user understands why a document wasranked high or low, s/he can improve the initial query and thus, increase recall. This is speciallyimportant when the user is conducting exploratory search or the ideal query is very complex toformulate.
The VIBE system by Olsen et al. (1993) is one of the first to support document retrievalby displaying the relationship between the documents and the query (Figure 7). It is a prototypesystem for visualizing a document collection that relies on facet queries. The authors introducedthe term "point of interest" (POI), where each point (i.e. document) is located at a unique positionin the display as an icon and each POI represents a set of user-defined keywords serving as aquery. Therefore, the system allows a user to perform multiple queries simultaneously, each onerepresented by a POI which enables analyzing a document from different perspectives.
The investigation is possible because documents are placed on the display according

44 Chapter 3. Information Visualization for Interactive Text Retrieval
Figure 7 – The VIBE system. Documents represented as rectangles are placed according to the keywordsor POIs they contain.
Source: Olsen et al. (1993)
to their similarity to each POI. For example, a document that refers to a single POI will beplaced at the same location as the POI’s icon. On the other hand, if a document refers to multiplePOIs it will be placed between them (the exact position will depend on the similarity among thePOIs). The scoring algorithm which determines the relationship between a document and a POIis defined by the user and could be the count of terms from each POI.
The user can click on a document to view its content and, if multiple documents areplaced at the same position on the display, the visualization shows lines under the documenticon, where each line represents another document that can be accessed by multiple clicks on theicon. Moreover, users can reposition the POIs, change their definition by modifying weights ofPOIs keywords and ignore a certain POI. The visualization does not allow many interactions andit does not scale to many points of interest since it would be difficult to identify the topics fromdocuments in the center. However, the idea of points of interest is used in many following works.
Similar to the VIBE system, the Visual re-ranking system (KLOUCHE et al., 2017)allows a user to input keywords and a 2D visualization with both the keywords and their relateddocuments are spatially placed according to their similarity (Figure 8). The user can activateor deactivate a keyword in order to see how the documents are rearranged. A major differencerelative to the VIBE system, however, is that it also shows a ranked list of documents and theuser can re-rank this list by selecting a position in the visualization. For example, if the userselects a position close to a specific keyword, the ranked list will be updated to show documentsmore related to the selected keyword.
Another solution to understand the result of a search while prioritizing retrieval of long

3.1. Understanding the search 45
Figure 8 – The Visual re-ranking visualization. Red rectangles represent the keywords of interest, grayrectangles are deactivated keywords, the blue icon is the exploration cursor that will define thelocation to which the algorithm should use as reference to re-rank the list in (2). The circles inred in (1) represent the documents that are currently being displayed in the ranked list in (2).The circle sizes encode the overall relevance of the document to all the queries phrases.
Source: Klouche et al. (2017)
texts is the Tile Bars system (Figure 9) (HEARST, 1995). It shows not only document relevancebut also why a specific document received a high ranking. To achieve this goal, the systempresents additional information such as term frequency, term distribution in the text and termoverlapping within the document.
TileBars relies on facet queries as the VIBE system, in which users can input topicsor queries. It is possible to explore parts of interest in a document by means of a visualizationthat shows a list of large rectangles representing a document. Within each rectangle there aresmall squares (or tiles) color coded from white to black, where the darker the tile, the morefrequent is the corresponding term in a specific part of the document. The difference betweenVIBE and TileBars is that the former does not address the issues of term distribution, frequencyand overlap. Moreover, TileBars would be helpful to determine whether a search was useful andwhich additional information could yield better results. An user can perform multiple queriesand explore the results in order to improve the original query.
A problem noticed on the TileBars system is that once a user opens a document on thelist, s/he loses the terms’ locations. The study by Byrd (1999) uses the scrollbar feature to codeterm information in each document. This is accomplished by positioning small colored iconsoverlapping the scrollbar, where each color represents a term and its variants. The system helpsusers to quickly find parts of interest in a document and decide on its relevance. A limitation isthat it does not scale well with the number of terms, since distinguishing more than roughly fivecolors is difficult.
Similarly, the SmartSkim (HARPER; COULTHARD; YIXING, 2002) system presents ahistogram visualization representing a target document where each bar corresponds to a fixedlength section of the text. The height of each bar represents the importance of that section to the
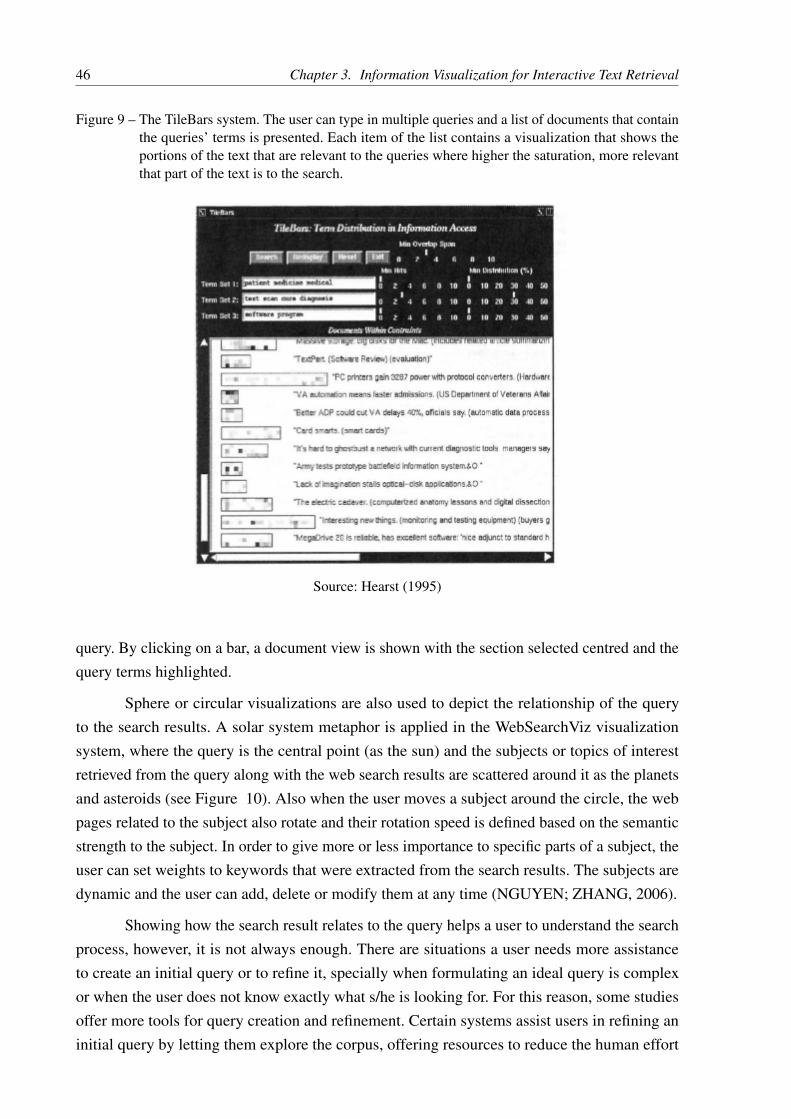
46 Chapter 3. Information Visualization for Interactive Text Retrieval
Figure 9 – The TileBars system. The user can type in multiple queries and a list of documents that containthe queries’ terms is presented. Each item of the list contains a visualization that shows theportions of the text that are relevant to the queries where higher the saturation, more relevantthat part of the text is to the search.
Source: Hearst (1995)
query. By clicking on a bar, a document view is shown with the section selected centred and thequery terms highlighted.
Sphere or circular visualizations are also used to depict the relationship of the queryto the search results. A solar system metaphor is applied in the WebSearchViz visualizationsystem, where the query is the central point (as the sun) and the subjects or topics of interestretrieved from the query along with the web search results are scattered around it as the planetsand asteroids (see Figure 10). Also when the user moves a subject around the circle, the webpages related to the subject also rotate and their rotation speed is defined based on the semanticstrength to the subject. In order to give more or less importance to specific parts of a subject, theuser can set weights to keywords that were extracted from the search results. The subjects aredynamic and the user can add, delete or modify them at any time (NGUYEN; ZHANG, 2006).
Showing how the search result relates to the query helps a user to understand the searchprocess, however, it is not always enough. There are situations a user needs more assistanceto create an initial query or to refine it, specially when formulating an ideal query is complexor when the user does not know exactly what s/he is looking for. For this reason, some studiesoffer more tools for query creation and refinement. Certain systems assist users in refining aninitial query by letting them explore the corpus, offering resources to reduce the human effort

3.1. Understanding the search 47
Figure 10 – The WebSearchViz system. In (a) the user can see three subjects of interest (data visualization,software visualization and website visualization). The query is located at the center of thecircle and the resulted web pages are the pink squares around it. In (b) the user sees how theresults are related to a subject when s/he moves the "website visualization" subject around. Itis clear that the documents in (1) are more related to "web visualization" than the documentsin (2) since they barely moved.
(a) (b)
Source: Nguyen and Zhang (2006)
and expertise required. They typically resort to the metadata associated with specific documentcategories, such as news articles or scientific papers. The documents and/or the terms are usuallyorganized into groups to facilitate user navigation. Clustering algorithms can be employed toorganize the documents according to topics they have in common.
One of the early attempts to allow users to refine a query is the Scatter Gather visualization(CUTTING et al., 1992), illustrated in Figure 11. The authors use clusters to help users defininga query, rather than exploring the corpus. In this way, it is not necessary to provide initial termsor query. By selecting the initial cluster, the algorithm creates new clusters on the fly. Thevisualization does not provide many interactions besides clicking on each cluster to reveal newclusters underneath.
The WebRat visualization (GRANITZER et al., 2003) is another solution that allowsa user to refine an initial query by clustering the results. The user first enters the initial querythen the system returns the results from different search engines grouped into clusters labeledby the important topics of each cluster. The user can refine the query by adding a topic to thesearch (Figure 12). Results have shown that the system can be very useful to users with limitedknowledge on the search domain.
Similarly, VisElabor (KORHONEN; LITOLA; TARHIO, 2007) consists of a visualizationwith four main views in order to let the user refine an initial query applied to a search engine.The views include a list view returned from the search engine, a category view which is theresult of a cluster algorithm to categorize the results, a graph view showing the relationshipamong documents and a full text view that presents the documents to the user. By manipulatingthese views, a user can submit new queries through the system and it increments the currentvisualization with the new results, thus improving the initial query.
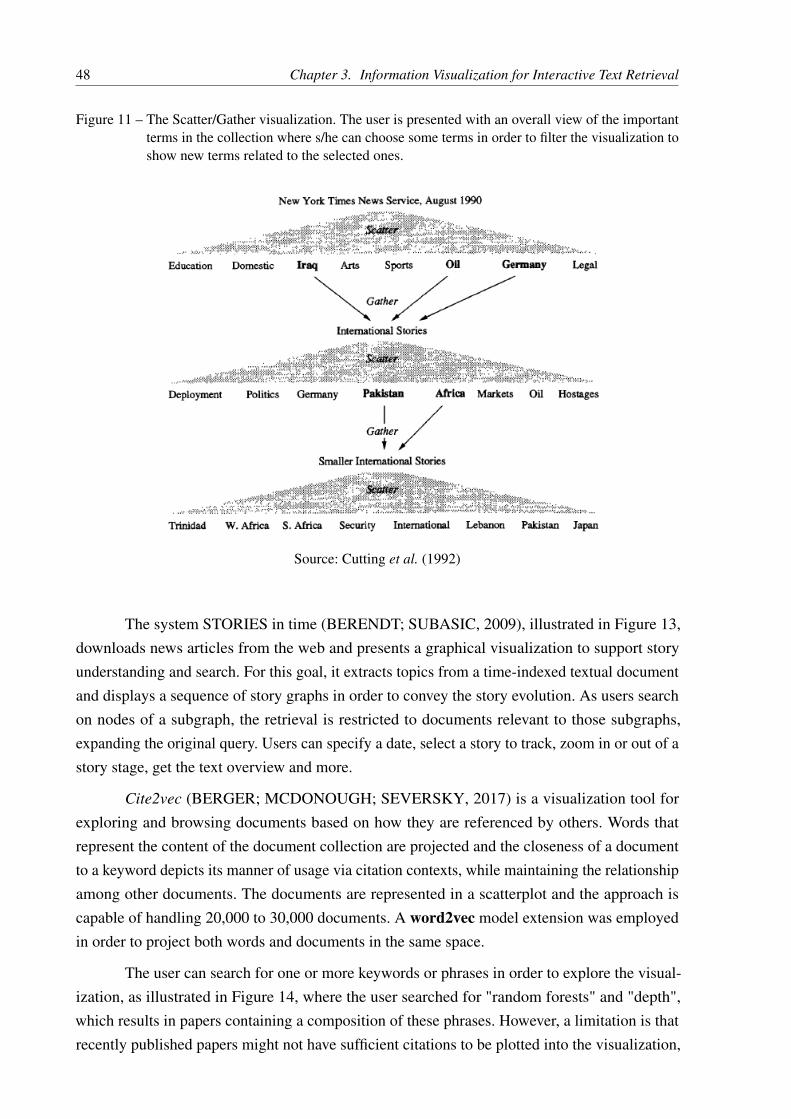
48 Chapter 3. Information Visualization for Interactive Text Retrieval
Figure 11 – The Scatter/Gather visualization. The user is presented with an overall view of the importantterms in the collection where s/he can choose some terms in order to filter the visualization toshow new terms related to the selected ones.
Source: Cutting et al. (1992)
The system STORIES in time (BERENDT; SUBASIC, 2009), illustrated in Figure 13,downloads news articles from the web and presents a graphical visualization to support storyunderstanding and search. For this goal, it extracts topics from a time-indexed textual documentand displays a sequence of story graphs in order to convey the story evolution. As users searchon nodes of a subgraph, the retrieval is restricted to documents relevant to those subgraphs,expanding the original query. Users can specify a date, select a story to track, zoom in or out of astory stage, get the text overview and more.
Cite2vec (BERGER; MCDONOUGH; SEVERSKY, 2017) is a visualization tool forexploring and browsing documents based on how they are referenced by others. Words thatrepresent the content of the document collection are projected and the closeness of a documentto a keyword depicts its manner of usage via citation contexts, while maintaining the relationshipamong other documents. The documents are represented in a scatterplot and the approach iscapable of handling 20,000 to 30,000 documents. A word2vec model extension was employedin order to project both words and documents in the same space.
The user can search for one or more keywords or phrases in order to explore the visual-ization, as illustrated in Figure 14, where the user searched for "random forests" and "depth",which results in papers containing a composition of these phrases. However, a limitation is thatrecently published papers might not have sufficient citations to be plotted into the visualization,

3.1. Understanding the search 49
Figure 12 – The WebRat visualization. On the left is presented the results for the query "Knowledge Man-agement". On the top right, the result after the user zoomed in into the keyword "certification"is shown and on the bottom right the user is refining the query with the word "information".
Source: Granitzer et al. (2003)
even though they could be relevant to the user. Since the visualization focuses on how an articleis being used, if a user wants to search for an author, only the papers that explicitly cited thatauthor are shown.
As discussed in Chapter 2, vocabulary mismatch is an additional issue in documentretrieval, when different terms refer to the same concept, or occurrences of a single term indi-cate different meanings. It can be handled, e.g., by assigning a similar distributional vector towords that appear in the same context in a corpus, i.e., surrounded by the same words. Zimmeret al. (ZIMMER; SAHLGREN; KERREN, 2017) introduce a system that tackles vocabularymismatch in the context of scientific papers, reinforcing that articles may address related topicseven if they use different terms to describe similar concepts (ZIMMER; SAHLGREN; KERREN,2017). Authors use a corpus of scientific papers to create a word similarity matrix. The visualiza-tion uses a collection of 2,752 documents as example and consists of three graph views. Onenetwork represents the papers as nodes connected considering their citations, the second networkmaps the author and co-author relationships and the third network consists of all the author’saffiliations and edges are added if authors from different affiliations publish a paper together.
The authors also used both bag-of-words and TF-IDF techniques in order to find papersthat include a certain keyword and its importance in the text. To find synonymous terms, a wordsimilarity matrix was created. The rationale is that words that were used in the same context

50 Chapter 3. Information Visualization for Interactive Text Retrieval
Figure 13 – The STORIES system. The main view shows a story graph of news regarding Britney Spearsin 2007. The main window on the center-left represents the first story graphs resulted fromthe search and, as a user narrows the time window (center-right), it is possible to gain newinsights about the documents since new nodes are added. If the user selects edges between thenodes, a list of pertinent documents to those nodes is presented in the center-bottom wherethe text can be inspected in the left.
Source: Berendt and Subasic (2009)
(surrounded by the same words) receive a similar distributional vector which is calculated usingthe random indexing (RI) that is based on an incremental random projection of a count-basedmodel. The cosine similarity metric was used to generate the word similarity matrix.
The initial visualization does not show any graphs but the bag-of-words and TF-IDFfrequency of the entire collection. Thus the user can assess how to start a search and add orremove nodes on demand. The user can search on a network and the visualization creates linkswith the two other graphs on mouse hover. By right-clicking a node, it is possible to see thebag-of-words and TF-IDF frequencies of that document. By using three different graphs in thesame view, one might need some training to deal with the amount of information. The systemscales for up to 10.000 nodes and edges since it uses WebGL instead of SVG-based node linkvisualization approaches.
The aforementioned systems rely mostly on the user knowledge, whereas classic IRsystems usually suggest new documents that might be relevant. There are visualization sys-tems aimed at assisting users to perform IR tasks with high recall, while offering personal-ized recommendations, such as the Visual Information Retrieval and Recommendation system(VisIRR) (CHOO et al., 2018). VisIRR has been created to support large-scale document discov-

3.1. Understanding the search 51
Figure 14 – The cit2vec system. A search for depth-based random forests techniques shows techniquesand data used by documents in this domain.
Source: Berger, McDonough and Seversky (2017)
ery and utilizes a publication database with nearly 430,000 academic research articles. It relieson document metadata to offer recommendations based on the documents’ ratings or numberof citations. The system uses topic modeling in order to retrieve the most important topicsfrom a document corpus and then groups similar topics together. Afterwards, the documents areprojected into a 2D scatterplot. The starting point of the system (see Figure 15) is an overviewvisualization of part of documents retrieved by the user query.
By hovering a circle in the scatterplot the user can explore the document’s details. Besides,there is a list on the bottom of all the documents sorted by the number of citations. By zoomingin, the user enlarges a particular topic clusters revealing more specific topics to that area. The usercan also apply additional queries and compare between the new and the previous visualizationresults. In order to help the system to recommend relevant papers, the user can assign ratings todocuments. Another way is to change the recommendation type to citation-based which showsthe highly cited documents that are similar to the rated document. The system shows a lot ofpossibilities and efficiently helps the user to find new documents and improve the initial query.However, it currently relies heavily on citation and co-authorship information.
In order to help the user to refine a query, some systems rely on visualizations that showhow the documents in the search result set are related, where similar documents are spatiallyplaced close to each other. The reason is that in order to give the user the ability to improve orcreate a query, a system needs to guide users with insights and possibly recommendations. Based

52 Chapter 3. Information Visualization for Interactive Text Retrieval
Figure 15 – The VisIRR system. The user can type a query in A, see the results in both the scatterplot andin the tabular view in B, see the list of recommended documents in C, zoom-in to get moredetails (D) and visualize the topic cluster summary in E.
Source: Choo et al. (2018)
on the studied solutions, a technique that is usually adopted is to cluster documents by similarity,usually based on relevant keywords, where the k-means clustering is very popular for this task.
3.2 Understanding the corpus
One of the goals of this project is to show how the documents retrieved from a queryare related. The following solutions also address this problem, however, their main focus ison the exploratory search of a document corpus in order to give users new insights, and notspecifically on improving an initial query nor retrieving a set of relevant documents. Besides,most contributions consider specific types of documents, such as news articles and scientificpapers with specific metadata associated that can enhance the visualizations. This is not thecase of the visualization solution described in this dissertation, since it should handle differentdomains.
A classic set of visualizations derived from the IN-SPIRE project includes contributionssuch as the Galaxy of News visualization (RENNISON, 1994) where the main view is shown inFigure 16, in which the goal is to give users a broad understanding of a news database introducingthe visualization of themes. The software relies on an Associative Relation Network (ARN) toestablish relationships among news articles, where the affinity between symbols contained in anARN defines weighted relationships between documents. The process consists of extracting key

3.2. Understanding the corpus 53
information, such as keywords, from a news corpus and insert the key symbols into the ARN.Then, the system searches the network to extract hierarchical relationships between the articlesand render the nodes as words in the display, in agreement with their similarity. Since timecomplexity is a concern when dealing with relational graph representations, the relationshipsamong articles are computed offline and outside the front-end application. Users can zoom ininto a specific area and the articles will be reorganized according to the new point of interest. Itis also possible to read an entire document.
Figure 16 – The Galaxy of News visualization. Documents are shown as stars in the sky. Symbols such askeywords, locations, time event(s) occurred, subjects, and actions are extracted from newsarticles and fed into the ARN.
Source: Rennison (1994)
Retrieving the corpus in a different process speeds up the calculations thus providing asmoother user experience within the visualization. Nevertheless, there is the concern of keepingthe corpus up to date. The Galaxy of News system served as inspiration to other projects such asthe ThemeScape visualization developed by Wise et al. (1995) which complements the Galaxysystem by showing landscapes rather than points in the space. This gives users a better ideaof the semantics behind a group of documents. Also, the Typograph (ENDERT et al., 2013)visualization shows terms, phrases, snippets and full documents according to their similarityallowing a user to identify clusters and investigate the space by zooming into specific regions.Additionally, an interesting feature of this visualization is that a user can see different contexts inwhich the query is relevant (see Figure 17).
While the previous solutions handle corpora of news articles, the following solutions areconcerned with showing relationships among scientific papers. This category usually deals withtypical metadata of this type of document, such as references, citation, author or venues. In the
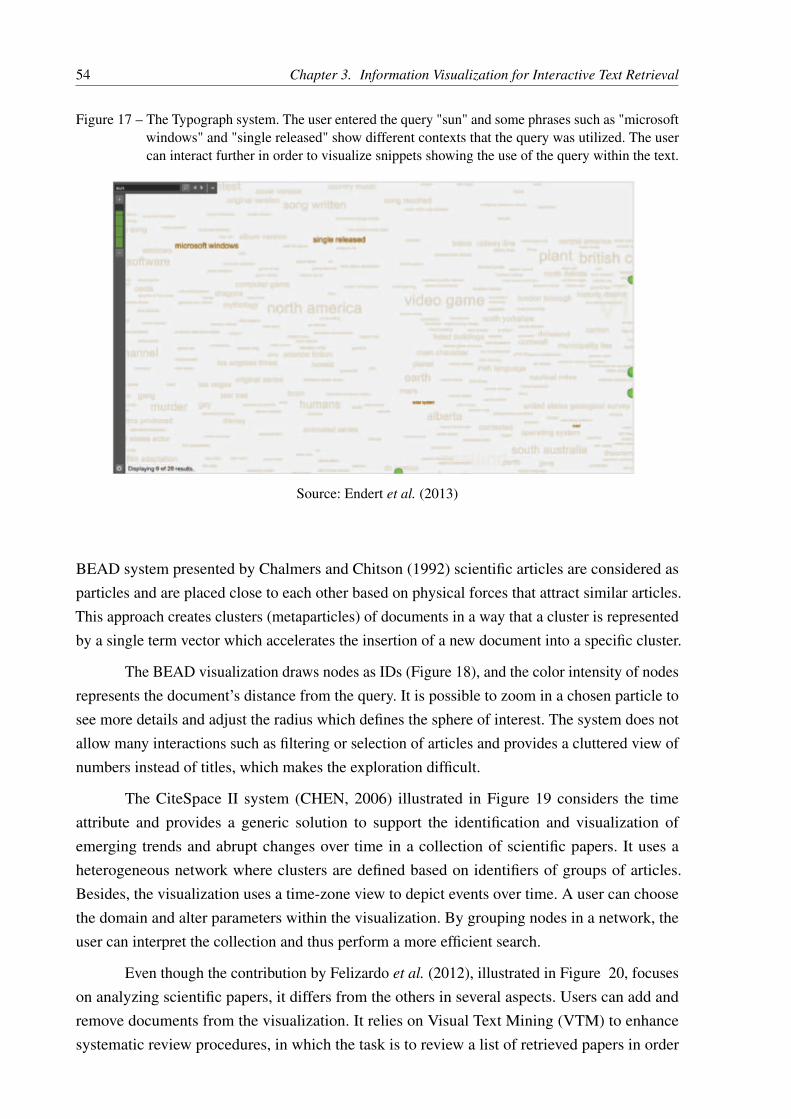
54 Chapter 3. Information Visualization for Interactive Text Retrieval
Figure 17 – The Typograph system. The user entered the query "sun" and some phrases such as "microsoftwindows" and "single released" show different contexts that the query was utilized. The usercan interact further in order to visualize snippets showing the use of the query within the text.
Source: Endert et al. (2013)
BEAD system presented by Chalmers and Chitson (1992) scientific articles are considered asparticles and are placed close to each other based on physical forces that attract similar articles.This approach creates clusters (metaparticles) of documents in a way that a cluster is representedby a single term vector which accelerates the insertion of a new document into a specific cluster.
The BEAD visualization draws nodes as IDs (Figure 18), and the color intensity of nodesrepresents the document’s distance from the query. It is possible to zoom in a chosen particle tosee more details and adjust the radius which defines the sphere of interest. The system does notallow many interactions such as filtering or selection of articles and provides a cluttered view ofnumbers instead of titles, which makes the exploration difficult.
The CiteSpace II system (CHEN, 2006) illustrated in Figure 19 considers the timeattribute and provides a generic solution to support the identification and visualization ofemerging trends and abrupt changes over time in a collection of scientific papers. It uses aheterogeneous network where clusters are defined based on identifiers of groups of articles.Besides, the visualization uses a time-zone view to depict events over time. A user can choosethe domain and alter parameters within the visualization. By grouping nodes in a network, theuser can interpret the collection and thus perform a more efficient search.
Even though the contribution by Felizardo et al. (2012), illustrated in Figure 20, focuseson analyzing scientific papers, it differs from the others in several aspects. Users can add andremove documents from the visualization. It relies on Visual Text Mining (VTM) to enhancesystematic review procedures, in which the task is to review a list of retrieved papers in order

3.2. Understanding the corpus 55
Figure 18 – The BEAD visualization. Documents are represented by their IDs and the distance from thequery is mapped as the color intensity of nodes.
Source:Chalmers and Chitson (1992)
to prevent the exclusion of relevant studies from a survey. Their visualization is split into twoviews, namely a content map and a citation map. The first shows document content similaritiesand dissimilarities and the second shows how documents are related based on direct citations orcross-citations.
Both views rely on a graph visualization where nodes that represent documents areplaced with a force-based strategy. Nodes can have three different categories (added, removed orreferenced) and the user can explore the network in order to improve his/her literature review.Results indicate that the tool yields a higher performance than manual selection, with similaraccuracy of a traditional selection review task. Similarly, the solution from Chou and Yang (2011)called PaperVis, also focuses on scientific papers in order to facilitate the literature review tasks.
The Action Science Explorer (ASE) (DUNNE et al., 2012) is a prototype system aimedat allowing users to select key papers, explore citation patterns and identify clusters. The mainvisualization is a node-link diagram that uses a force-directed layout and shows papers as nodesconnected by their citations. An interesting aspect of this visualization is that it shows the contextin which a paper was cited by another when the user selects a node. The text containing all thecitation context in the selected node is shown in another view.
Unlike the previous contributions, the following systems are not restricted to a particulardocument type, nor consider specific attributes. In this aspect they are similar to the systemdeveloped in this dissertation project, which does not rely on specific attributes. The FaceAtlas(CAO et al., 2010) visualization aims at showing the relationship among documents according todifferent facets of information. It consists of a graph visualization that shows the local relationsand a density map to portray a global context.

56 Chapter 3. Information Visualization for Interactive Text Retrieval
Figure 19 – The CiteSpace II system. A network of 541 co-cited authors. The thickness of each ringrepresent the amount of citations given a time slice and the color saturation the time of thecorresponding citations. The prominent cluster (i.e. on the right) is the most recent one.
Source: Chen (2006)
Besides the common interactions such as zooming, filtering and highlighting, FaceAtlasalso allows dynamic context switching for the user to change the primary visualization accordingto different facets. Showing relationships according to different facets is very interesting, sincedocuments might be connected in different ways. To illustrate this idea, in Figure 21 it ispossible to see the results for the query "diabetes". The color of the links and nodes representthe different facets where red represents symptoms, yellow diseases and green treatments. Asthe Figure shows, type-1 Diabetes and type-2 Diabetes (nodes in yellow) also share a lot ofcommon symptoms (red link) but few common treatments (green link). It is possible to noticethat diseases in the type-2 Diabetes’s cluster share a lot of common treatments.
Another relevant system is Jigsaw (STASKO et al., 2007), which was developed in thecontext of investigative analysis and aims at helping analysts to explore reports collections inorder to search, review and understand them better. The system connects entities such as people,places, dates and organizations from different reports, in order to help analysts to decide whichreports they should read. The system offers four views: a tabular connections view to show theconnection between the entities, a semantic graph view that shows the relation between theentities and the reports, a scatter plot view showing the relationship of any two entity categoriesand the text view that displays the original reports.
Even though Jigsaw was designed to help investigative analysts, it has been used in

3.2. Understanding the corpus 57
Figure 20 – The extended Revis visualization. A system to help users with the task of Systematic LiteratureReview. The red circles represent articles not included in the SLR whereas blue ones areincluded and gray ones are cited references.
(a) Content map. (b) Citation Map.
Source: Felizardo et al. (2012)
different domains because of its great generality on handling diverse types of documents. Im-provements have been done in the system, as in (GöRG et al., 2013) which enhances it byincluding several automated algorithms such as analysis of similarities among document, docu-ment clusters, document sentiment and document summarization
DocuCompass (HEIMERL et al., 2016) presents a focus+context visualization by usinga lens metaphor and the scatterplot visualization, where each circle represents a document. Thisstudy focuses on the exploration of a general text corpora and, by using lenses, the visualizationhelps users to analyze documents without loosing the overall context. An interesting feature inthis visualization is the labeled bar charts (Figure 22). The circles in the scatterplot are clusteredand mapped by color and each bar in a bar chart represents the frequency of a specific label ineach group. For example, a user interested in the word ’texture’ should explore the group coloredin red. This can give users hints on where to search.
Users can define parameters such as the choices of dimensionality reduction techniqueand term selection method. A limitation is that it is not possible to open a document of interest.Another problem is that lenses allow users to focus in one area at a time, which makes it harderto compare groups of documents placed in different regions. Since the bar charts are positionedin a small space along with the term on the side, they are small to analyze and eventual clutteringhappens with the text.
For simple queries that require one or few documents as result, the classic ranked listsprovided by most search engines are usually sufficient. However, if a complex query is requiredor if the user doesn’t have a clear idea on what s/he is looking for, new methods of exploration

58 Chapter 3. Information Visualization for Interactive Text Retrieval
Figure 21 – The Face Atlas visualization. After the search for the keyword "diabetes", the system generatedtwo clusters representing type-1 and type-2 diabetes. Red links represent similar complicationswhereas green links represent common symptoms.
Source: Cao et al. (2010)
are necessary. Solutions that show relationship among documents by similarity are interesting inthe sense that users are able to explore a document collection from different perspectives, whichis important to acquire new insights and a clearer idea on how to formulate a good query. Studiescomparing the CiteSpace system (CS) (CHEN, 2006) with the Web of Science (WoS) searchengine, thus comparing an information visualization system to a textual based IR system haveshowed that users found the CS system more usable, easier to start searching and easier to searchthan the WoS. Moreover, the subjects of the experiment were more satisfied with the resultswhen using the CS system than those using the WoS system.
3.3 Understanding the search and the corpus
Finally, the final category of contributions is considered more similar to the solutionproposed in this dissertation, in that they provide three functionalities of interest to us, namely:to convey the relationship between the retrieved documents and the query and to convey the rela-tionships among the documents, while focusing on improving document retrieval and supportingquery refinement. Besides, we are also interested in handling the problem of vocabulary-mismatchby showing the different contexts a keyword of interest appears.
The solution by Tatemura (2000) (Figure 23) uses the concept of points of interestand allows a user to provide relevance feedback in order to refine an initial query. The LatentSemantic Indexing (LSI) technique is used to perform automatic indexing of documents, whichuses multiple keywords to describe a document by implementing the VSM technique. This is
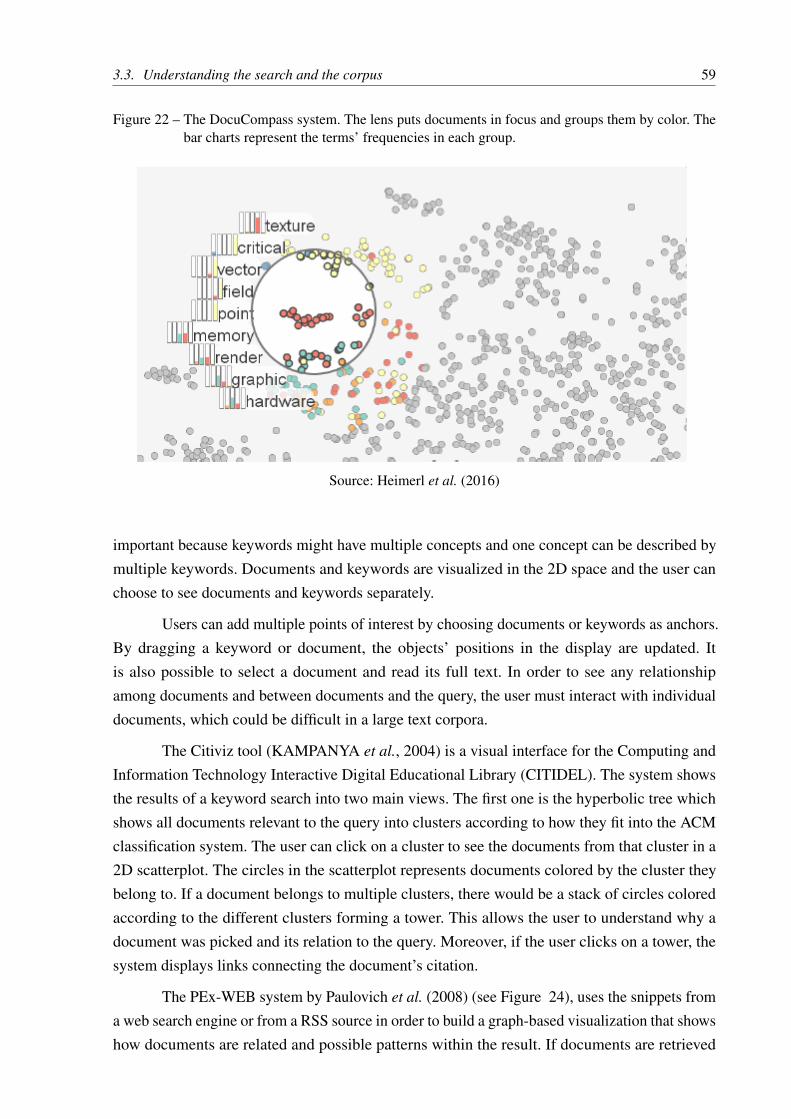
3.3. Understanding the search and the corpus 59
Figure 22 – The DocuCompass system. The lens puts documents in focus and groups them by color. Thebar charts represent the terms’ frequencies in each group.
Source: Heimerl et al. (2016)
important because keywords might have multiple concepts and one concept can be described bymultiple keywords. Documents and keywords are visualized in the 2D space and the user canchoose to see documents and keywords separately.
Users can add multiple points of interest by choosing documents or keywords as anchors.By dragging a keyword or document, the objects’ positions in the display are updated. Itis also possible to select a document and read its full text. In order to see any relationshipamong documents and between documents and the query, the user must interact with individualdocuments, which could be difficult in a large text corpora.
The Citiviz tool (KAMPANYA et al., 2004) is a visual interface for the Computing andInformation Technology Interactive Digital Educational Library (CITIDEL). The system showsthe results of a keyword search into two main views. The first one is the hyperbolic tree whichshows all documents relevant to the query into clusters according to how they fit into the ACMclassification system. The user can click on a cluster to see the documents from that cluster in a2D scatterplot. The circles in the scatterplot represents documents colored by the cluster theybelong to. If a document belongs to multiple clusters, there would be a stack of circles coloredaccording to the different clusters forming a tower. This allows the user to understand why adocument was picked and its relation to the query. Moreover, if the user clicks on a tower, thesystem displays links connecting the document’s citation.
The PEx-WEB system by Paulovich et al. (2008) (see Figure 24), uses the snippets froma web search engine or from a RSS source in order to build a graph-based visualization that showshow documents are related and possible patterns within the result. If documents are retrieved

60 Chapter 3. Information Visualization for Interactive Text Retrieval
Figure 23 – The visualization with two anchors selected: the keyword "www" and the document "Findingand Visualizing Inter-Site Clan Graphs".
Source: Tatemura (2000)
with the Yahoo API, the visualization also shows the relationship between documents and thequery by coloring or resizing nodes based on their ranking. The process is done in three mainsteps: obtain the VSM representation of the retrieved documents; calculate the distance amongdocuments using the cosine-based distance and use the distance as input to the Least SquareProjection (LSP) technique in order to retrieve the X and Y coordinates that the documents willbe placed in the visualization.
Users can explore the results by clicking on a node to see a list of its nearest neighbors,selecting an area on the map in order to open the documents within that area and even train aclassifier that uses the Support Vector Machine (SVM) model in order to color the circles in thevisualization according to specific labels. Studies have shown that naive users could successfullyuse the system and it was possible to infer topics for a given region.
Similarly, the solution by Gomez-Nieto et al. (2014) aims to preserve the snippet structureprovided by general search engines while showing relationship among the retrieved documentsand the query. It uses the Least Square Projection (LSP) as the dimensionality reduction technique,since it preserves the neighborhood structure of documents and has low computational cost. Only
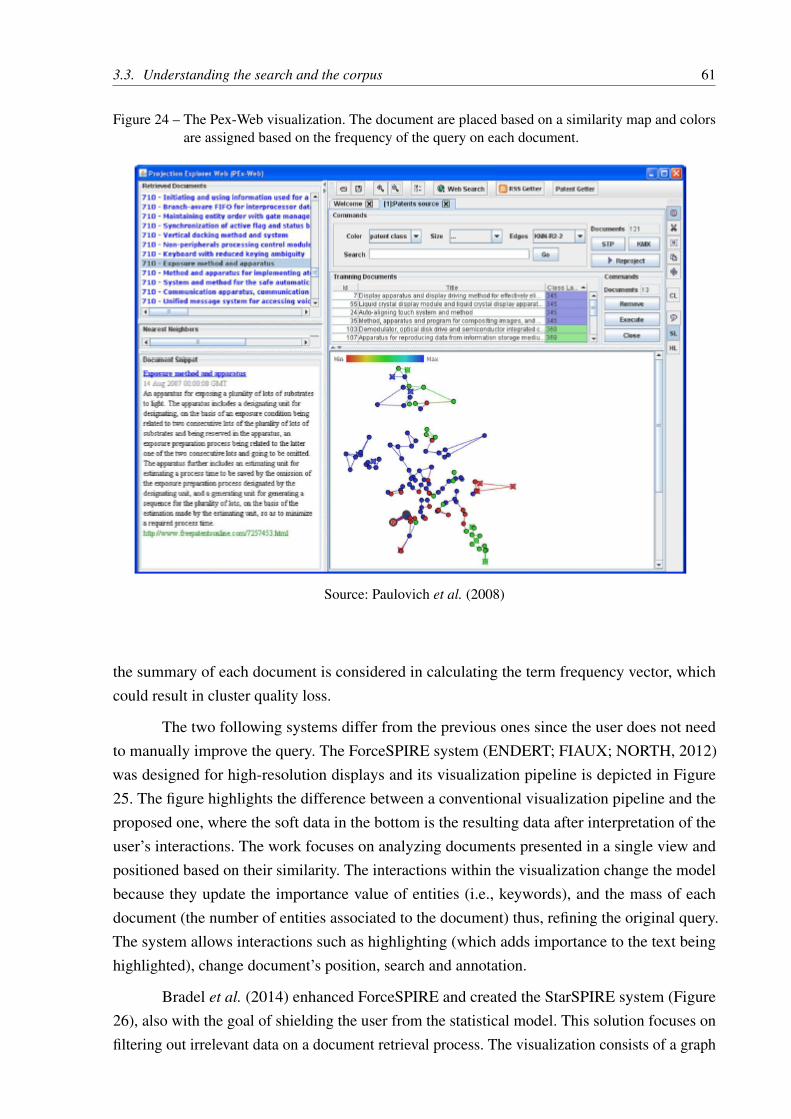
3.3. Understanding the search and the corpus 61
Figure 24 – The Pex-Web visualization. The document are placed based on a similarity map and colorsare assigned based on the frequency of the query on each document.
Source: Paulovich et al. (2008)
the summary of each document is considered in calculating the term frequency vector, whichcould result in cluster quality loss.
The two following systems differ from the previous ones since the user does not needto manually improve the query. The ForceSPIRE system (ENDERT; FIAUX; NORTH, 2012)was designed for high-resolution displays and its visualization pipeline is depicted in Figure25. The figure highlights the difference between a conventional visualization pipeline and theproposed one, where the soft data in the bottom is the resulting data after interpretation of theuser’s interactions. The work focuses on analyzing documents presented in a single view andpositioned based on their similarity. The interactions within the visualization change the modelbecause they update the importance value of entities (i.e., keywords), and the mass of eachdocument (the number of entities associated to the document) thus, refining the original query.The system allows interactions such as highlighting (which adds importance to the text beinghighlighted), change document’s position, search and annotation.
Bradel et al. (2014) enhanced ForceSPIRE and created the StarSPIRE system (Figure26), also with the goal of shielding the user from the statistical model. This solution focuses onfiltering out irrelevant data on a document retrieval process. The visualization consists of a graph

62 Chapter 3. Information Visualization for Interactive Text Retrieval
Figure 25 – (top) The basic version of the “visualization pipeline”. Interaction can be performed directlyon the Algorithm (blue arrow) or the data (red arrow). (bottom) Modified version of thepipeline for semantic interaction, where the user interacts within the spatial metaphor (purplearrow).
Source: Endert, Fiaux and North (2012)
using a modified force-directed layout where nodes are small boxes containing a summary of thedocument and their size and saturation represents its relevance to the query.
Figure 26 – StarSPIRE spatial workspace showing clusters of open documents and numerous iconifieddocuments selected and arranged through semantic interaction.
Source: Bradel et al. (2014)
The user can perform interactions such as searching, moving nodes, resizing a document,minimizing a document, annotations, searching, highlighting and overlapping documents. Be-sides, user can perform implicit or explicit queries where the former are resulted from the userinteraction with the visualization and the latest the action of typing new keywords. By queryingnew documents, the system allows new information to be added to the display. Computational

3.4. Discussion and final considerations 63
efficiency was improved, as compared to ForceSPIRE, because the system does not store mostof the data and only displays a small set of documents. However, it is not recommended for anextremely large data set. Besides, user needs to interact with individual documents in order toadd or remove relevance to it which can be overwhelming when dealing with a huge documentcorpus.
The contributions under this category tackle some of the problems we want to solve, butthey do not consider the vocabulary-mismatch issue. It is also possible to note that graphs andscatterplot visualizations are the preferred techniques for solutions to show relationship amongdocuments. The relationship to the query is usually conveyed by mapping the projection, such asincreasing the size attribute of the nodes or circles according to the relevance of the document tothe query.
3.4 Discussion and final considerations
The study by Liu et al. (2018) surveys interactive visualizations and text mining tech-niques aimed at supporting exploration and analysis of large-scale textual data. A visualizationthat links visualizations, tasks and mining techniques is available1.
The research showed that “typographic visualizations”, “chart visualizations” , and“graph visualizations” are the most popular visualization techniques where the first includestext highlighting, word cloud and hybrid visualizations. The second consists of scatterplots,line charts, tables, and other charts such as bar charts. Finally, representatives of the third(graph visualizations) are node-link, tree and matrix visualizations. An interesting result wasthat even thought the largest number of papers retrieved was on “information retrieval”, thesurvey identified 33 visualization papers and 1851 mining papers. Similarly, “classification” wasaddressed in few text visualization papers, even though it has been extensively studied in the textmining field. On the other hand, “exploratory analysis” and “natural language processing” werethe largest and second largest clusters in terms of number of visualization papers.
By comparing the analysis tasks, some opportunities were identified in the study con-sidering the gaps in text visualization and mining fields, such as creating solutions that solve“information retrieval” tasks with support from visualizations. For example, “query ambiguity”,“federated search”, and “distributed information retrieval” are challenges yet to be studied inthe visualization field. Another opportunity is to include human knowledge to support textmining tasks. For example, “binary classification” and “recommendation” are well studied intext mining. However, the authors suggest that interactive visualizations could allow expertsto provide informative supervision to the classifier and thus, improve the performance of textclassification. Finally, another opportunity identified by Liu et al. (2018), related to our work,
1 http://visgroup.thss.tsinghua.edu.cn/textvis/
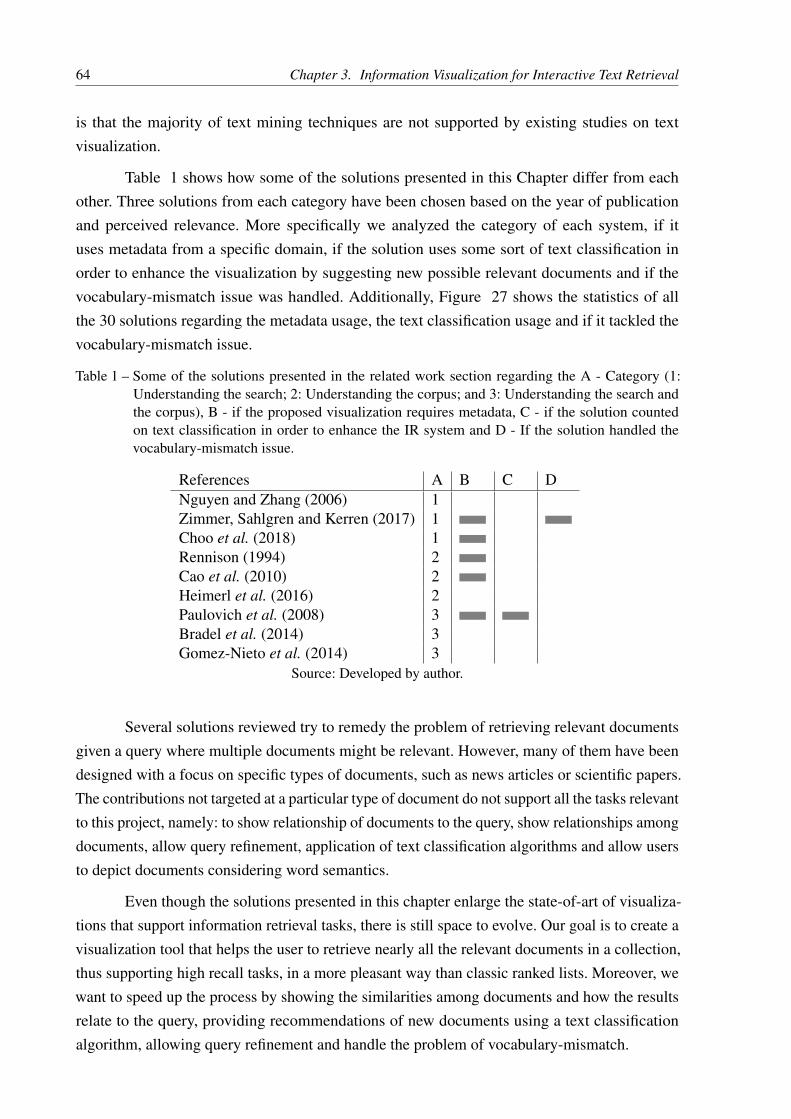
64 Chapter 3. Information Visualization for Interactive Text Retrieval
is that the majority of text mining techniques are not supported by existing studies on textvisualization.
Table 1 shows how some of the solutions presented in this Chapter differ from eachother. Three solutions from each category have been chosen based on the year of publicationand perceived relevance. More specifically we analyzed the category of each system, if ituses metadata from a specific domain, if the solution uses some sort of text classification inorder to enhance the visualization by suggesting new possible relevant documents and if thevocabulary-mismatch issue was handled. Additionally, Figure 27 shows the statistics of allthe 30 solutions regarding the metadata usage, the text classification usage and if it tackled thevocabulary-mismatch issue.
Table 1 – Some of the solutions presented in the related work section regarding the A - Category (1:Understanding the search; 2: Understanding the corpus; and 3: Understanding the search andthe corpus), B - if the proposed visualization requires metadata, C - if the solution countedon text classification in order to enhance the IR system and D - If the solution handled thevocabulary-mismatch issue.
References A B C DNguyen and Zhang (2006) 1Zimmer, Sahlgren and Kerren (2017) 1Choo et al. (2018) 1Rennison (1994) 2Cao et al. (2010) 2Heimerl et al. (2016) 2Paulovich et al. (2008) 3Bradel et al. (2014) 3Gomez-Nieto et al. (2014) 3
Source: Developed by author.
Several solutions reviewed try to remedy the problem of retrieving relevant documentsgiven a query where multiple documents might be relevant. However, many of them have beendesigned with a focus on specific types of documents, such as news articles or scientific papers.The contributions not targeted at a particular type of document do not support all the tasks relevantto this project, namely: to show relationship of documents to the query, show relationships amongdocuments, allow query refinement, application of text classification algorithms and allow usersto depict documents considering word semantics.
Even though the solutions presented in this chapter enlarge the state-of-art of visualiza-tions that support information retrieval tasks, there is still space to evolve. Our goal is to create avisualization tool that helps the user to retrieve nearly all the relevant documents in a collection,thus supporting high recall tasks, in a more pleasant way than classic ranked lists. Moreover, wewant to speed up the process by showing the similarities among documents and how the resultsrelate to the query, providing recommendations of new documents using a text classificationalgorithm, allowing query refinement and handle the problem of vocabulary-mismatch.
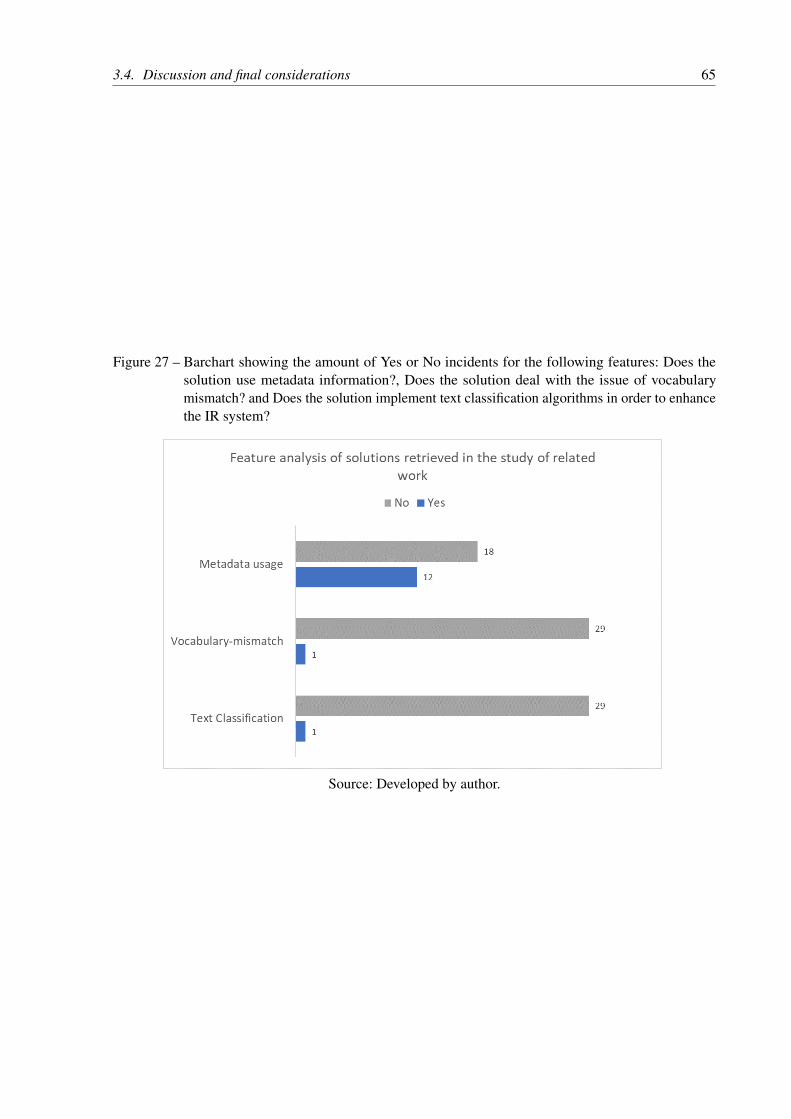
3.4. Discussion and final considerations 65
Figure 27 – Barchart showing the amount of Yes or No incidents for the following features: Does thesolution use metadata information?, Does the solution deal with the issue of vocabularymismatch? and Does the solution implement text classification algorithms in order to enhancethe IR system?
Source: Developed by author.


67
CHAPTER
4TRIVIR: A VISUALIZATION SYSTEM TO
SUPPORT DOCUMENT RETRIEVAL WITHHIGH RECALL
4.1 Initial Considerations
In this Chapter we present TRIVIR, a visualization system to support document retrievalwith high recall. We developed TRIVIR considering that current visualizations that support IRdoes not handle the vocabulary mismatch issue while integrating machine learning algorithmsto suggest new documents. Besides, it provides ways for the user explore the collection byanalysing how documents are related to each other and how the query is related among the resultset. Additionally, we aim at connecting text mining techniques into a visualization system inscenarios where high recall is required.
This chapter is organized as follows: In section 4.2 we present an overview of the system,tasks supported, details on each TRIVIR’s views, and underlying techniques used to developthe system. In section 4.3 we present our validation exercises using three different scenarios(a prelimiary validation, a literature review problem, and a systematic mapping study (SMS)scenario). Finally, section 4.4 concludes this Chapter with our final considerations.
4.2 The TRIVIR System
TRIVIR has been conceived as an interface to a general document retrieval systemthat implements a Continuous Active Learning (CAL) protocol. As such, it integrates machinelearning and interactive text visualization for user-assisted document retrieval, in order to supporthigh recall. Different alternatives could be considered as the underlying techniques, e.g., textrepresentation, machine learning algorithm and multidimensional projection. Ideally, multiple

68 Chapter 4. TRIVIR: A Visualization System to Support Document Retrieval with High Recall
choices could be offered for users to experiment and find out the best configuration for theirparticular retrieval task and document collection.
Users may choose the dimensionality reduction technique and the document representa-tion since there is no technique that is better than all the others. Specially for the dimensionalityreduction techniques, it is recommended that for each collection we would have a differentapproach that best represent its content (SEDLMAIR; MUNZNER; TORY, 2013).
The system interface is illustrated in Figure 28. It presents six views, namely: theTerms view (1), the Scatterplot view (2), the Document view (3), the Signature List view (4)which shares the same area as the Focus List and Suggestion List views. These three list views(Signature, Focus, and Suggestion) can be switched by clicking on the top buttons identified in(4) as "Signature", "Focus", and "Suggestion". The Signature List view is the default at systemstart-up, and the two other views are illustrated side by side in Figure 29.
Figure 28 – TRIVIR interface. The Scatterplot View in area (2) shows a similarity map depicting acollection of 675 papers in Computer Science. The circle colors indicate the current querydocument (green), and then: the relevant (blue), not relevant (red), suggested as relevant(yellow), and yet unlabeled documents (gray). The menu on top allows filtering the scatterplotin three different ways (2a, 2b and 2c). The Terms View (1) shows the important terms fromthe query document, where the user can remove (1a) or add (1b) terms. Area (4) shows theSignature List view, which shows the relevant 3-grams in the corpus. It can be switched withthe Focus List or the Suggestion List views by clicking on the corresponding buttons. Theuser can visualize important 3-grams from the collection, select 3-grams with specific terms(4a), or select all 3-grams that include terms from the terms view (4b).
Source:Developed by author
In this example, we use a collection of 675 papers from four different Computer Scienceareas (Case-Based Reasoning (CBR), Inductive Logic Programming (ILP), Information Retrieval
(IR) and Sonification (SON)) containing title, authors, affiliation, abstract and references. Thecircle colors in the Scatterplot view indicate the current query document (green), relevant

4.2. The TRIVIR System 69
documents (blue), not relevant documents (red), suggested documents (yellow), and not yetlabeled documents (gray). A user can select documents including a particular term (2a); filterthe K documents most similar to the initial query (2b); and reduce point clutter by displayingonly the relevant and suggested documents (2c). Clicking on a circle displays its content in theDocument View (3) (query document shown). The terms view (1) shows the important termsfrom the query document, where the user can remove (1a) or add (1b) terms as needed. TheSignature List view shows the relevant 3-grams in the corpus. The user can select 3-grams withspecific terms (4a), or select all 3-grams including terms from the terms view (4b). The focus listwould display the titles of all documents currently labeled as relevant, the suggestion list woulddisplay the title of the documents labeled as relevant by the ML algorithm as well as a button toretrain the classifier.
Figure 29 – Both the Focus List view (1) and the Suggestion List view (2) share the same area in theinterface, and the user switches between them (and the Signature List view) by selectingthe corresponding buttons on the top (refer to Figure 28). The Focus List view shows alldocuments currently labeled as relevant; the Suggestion List view shows the documentssuggested as relevant by the ML classifier. The user can press the "Train" button to retrain theclassifier (2a).
Developed by author
The system allows the user to explore a document collection and label documents asrelevant or not relevant through exploration of the similarity map among the result set and thequery, through classic ranked lists and through exploration of how key terms are used in the text.
4.2.1 Tasks supported
A user should be able to explore the collection, read individual documents (Documentview) and label documents as relevant or not relevant, assisted by the information displayed inthe different views. It is possible to label one document at a time through classic ranked lists(Focus List and Suggestion List views) or through the Scatterplot view. The user might also

70 Chapter 4. TRIVIR: A Visualization System to Support Document Retrieval with High Recall
want to label multiple documents simultaneously based on how key terms are used within thedocuments (Signature List view) and by letting the system automatically label all documentssimilar to a selected one as relevant or not relevant (Scatterplot view). Additionally, the usercan retrieve synonyms and terms used in the same context as a selected one, thus expanding theset of important terms (Terms view). As users find out actual word synonyms and alternativewords that occur in the same context as the selected, they may be able to identify additionalrelevant documents, e.g., that use different words to describe the same concept, thus handlingthe vocabulary mismatch issue.
An overview of the system’s flow is presented in Figure 30. The user first selects a corpusand a query document. At this point, s/he has the option of changing the document representation,dissimilarity function and/or the multidimensional projection technique. As default, TRIVIRuses as document representation a Vector Space Model (bag-of-words) with a TF-IDF weightingscheme, the cosine similarity and the t-SNE projection technique to create the 2D similarityscatterplot of the entire collection. The system first computes and stores both the word embeddingand the VSM document representations as well as the model for the collection using the fastTextlibrary for R (JOULIN et al., 2017) which consists in using the skipgram model to create wordrepresentations of the collection (further explained in Sub-section 4.2.3). The model is usedto generate the synonyms based on the context of the terms and applied to the Terms view.Then, the 3-gram list is created and ranked by decreased frequency. Finally, given the selecteddocument representation, it computes the pairwise cosine similarities from the query documentto all the others. The system can then load the Terms View, Signature List view, Focus List viewand Document view. The ML algorithm (currently, the system uses the classifier of the fastTextlibrary (BOJANOWSKI et al., 2017)) is trained considering the 10 most similar documents tothe query document as relevant, and the 10 less similar as not relevant. The algorithm returns20 possibly relevant documents, which are included in the Suggestion List view. Finally, theScatterplot view is loaded based on the documents’ labels.
The user can interact with the Scatterplot, Suggestion List, Focus List and Signature Listviews to label new documents. Along with the other views, the Terms view and the Documentview support the exploration of the collection. The user can retrain the ML algorithm as much ass/he wants and stop the process at any time. At the end, the Focus List view with the relevantdocuments is saved. More details on each view is given next.
4.2.2 The views detailed
The Terms view shows the five most important terms from the query document accordingto the TF-IDF weighting scheme. For each term a list of synonyms is retrieved using two differentR libraries. The first one is qdap1, which has a functionality to retrieve the synonyms from an
1 https://CRAN.R-project.org/package=qdap

4.2. The TRIVIR System 71
Figure 30 – Information flow in TRIVIR. The user first selects a corpus and a query document, andpossibly modifies the default settings. The system initially renders the Document view and theassociated Terms, Signature List and Focus List views, which are computed considering thedocument representation, the creation of a model containing the word representation of thecollection using the skipgram model, the ranked 3-gram list, and the distance function. TheML algorithm is trained; the documents it predicts as relevant define the Suggestion List view.Finally the 2D Scatterplot view is created and rendered, with the circles colored according tothe documents’ labels. Interacting with the multiple views the user has the necessary supportto investigate the collection and decide about document relevance. The CAL protocol allowsher to retrain the ML classifier and finish the process at any time, when the final Focus Listview gives all the documents identified as relevant.
Developed by author
online dictionary (RINKER, 2019), and the second one (fastrtext2) has a method to retrieve thewords used in the same context as a specific term (BOJANOWSKI et al., 2017). The resultsare merged and presented as a list when the user clicks on a term. Figure 31 presents a list ofsynonyms for the term "case" and, since one of the groups is of papers in the area of Case Base
Reasoning, the terms "reason" and "base" usually appear in the same context as the word "case"and thus, appear in the list. The user can also add (Figure 28 (1b)) and remove (Figure 28 (1a))terms as needed. However, adding or deleting new terms does not affect the model used bythe classifier nor the visualizations. In fact, the manipulation of the term’s view only occurs inconnection with the Signature List view.
The Signature view was inspired by the solution by Jankowska, Keselj and Milios (2012),who used character n-grams for text classification based on the Common N-Gram (CNG) analysismethod. They presented the Relative N-Gram Signatures visualization that allows the user toexplore the interesting n-grams for a document or group of documents and to get insight into theinner workings of the CNG classifier. Our Signature List view is simpler than theirs, however, ithelps the user to gain insight on common or interesting n-grams in the corpus. It consists of then-grams (so far we adopt n = 3) of the entire collection ordered by decreasing frequency. The
2 https://CRAN.R-project.org/package=fastrtext

72 Chapter 4. TRIVIR: A Visualization System to Support Document Retrieval with High Recall
Figure 31 – List of synonyms for the term "case". The list merges dictionary synonyms and terms that areused in the same context as the selected one in the collection.
Developed by author
3-grams with frequency equal to 1 were removed, since keeping them significantly increasedthe list size. The blue bars on the left represent the frequency of the 3-gram where the highestis the saturation, the highest is the frequency. The goal in providing the Signature List view isto allow users to identify a term’s context of usage and filter the Scatterplot view to to displayonly the documents with a specific 3-gram (the other documents are hidden until the user resetsthe Scatterplot view). The user can either type in terms in the Signature List view (Figure 28(4a)) or filter the 3-grams that contain the terms in the Terms view (Figure 28 (4b)). In the lastcase, the terms in the synonyms lists are not considered since they are only suggestions to theuser. Further, s/he can label as relevant all documents that contain a particular 3-gram (Figure 32(a)) or likewise as not relevant (Figure 32 (b)). However, documents already labeled as relevant,not relevant or the query document are not affected. This functionality allows users to manuallyselect the context of a term s/he is or is not interested. Both the Terms view and the Signature Listview tackle the problem of vocabulary mismatch where the former deals with different wordsdescribing the same concept and the latest deals with the same word being used with differentmeanings, or in distinct contexts.
The Scatterplot view represents the entire collection, where each document is depicted asa circle, at the spatial location computed by a multidimensional projection technique. Our interestis on projection techniques, as described in Chapter 2, aimed at preserving the neighbourhoodrelationships between the data elements, in this case, the individual documents. Thus, it isexpected that similar documents are placed close in the projection. In the Scatterplot view,

4.2. The TRIVIR System 73
Figure 32 – Using the Signature List view to filter the scatterplot to display the documents that include the3-gram "case base reason". One observes four categories of documents in the Scatterplot view(all of them include this 3-gram): the query document (green), relevant documents (blue),suggested documents (yellow) and not yet labeled documents (gray). The user can set all notlabeled documents as not relevant (a) or relevant (b) at once.
distinct colors indicate, respectively, the query document(s) (in green), the documents labeled asrelevant (in blue), the documents labeled as not relevant (in red), the suggested documents (inyellow), and documents not yet labeled (in gray). Clicking on a circle displays its full text inthe Document view and pops a menu right above it, which can be used to label the document asrelevant/not relevant. The menu that is shown is different depending on the label of the selecteddocument (Figure 33). For the suggested and not labeled documents, the user can use the menuto set a selected document as relevant or not relevant. However, for the relevant documents, theuser can set a specific document as an additional query document, in which case the circle willbe colored green, and its 10 most similar documents are also set as relevant (Figure 34 (a,b)).Similarly, if the same option is chosen for a not relevant document, its 10 most similar documentsare set as not relevant (Figure 34 (c,d)). The classifier will not be retrained at this point, unlessthe user clicks on the "Train" button in the Suggestion List view. The Scatterplot view alsooffers some searching functionalities, such as finding documents with a particular term or phrase(Figure 28 (2a)), or filtering the map to display only the k most similar documents to the initialquery document (Figure 28 (2b)), or to show only the relevant and suggested documents (Figure28 (2c)). This is particularly helpful when working with large collections, as the similarity mapcan become highly cluttered.
As mentioned, TRIVIR relies on a ML algorithm to recommend new documents. Thelist of recommended documents is shown in the Suggestion List view (Figure 29 (2)). The user

74 Chapter 4. TRIVIR: A Visualization System to Support Document Retrieval with High Recall
Figure 33 – The menu on the Scatterplot view has different options depending on the label of the document.For not labeled (gray) and suggested documents (yellow) the user has the option of setting adocument as relevant or not relevant (a). For relevant documents (blue) the user can set it asnot relevant or query (b) and for not relevant documents (red) the user can add them to theFocus list (set as relevant) or set other documents similar to it as not relevant (c)
(a) labeled and suggested (b) relevant (c) not relevant
Developed by author.
can click on a document from the list, and a menu is displayed that allows labeling the document(Figure 35). S/he can also read the selected document in the Document view and locate it in theScatterplot view (the circle that represents the selected document is shown with a thicker border).A document set as relevant will be transferred to the Focus List view (Figure 29 (1)) and its circleon the Scatterplot view will be colored blue. If the user sets a document as not relevant its circleis colored red in the Scatterplot view. The user can choose to retrain the ML algorithm at anytime by clicking on the "Train" button (Figure 29 (2a)) – upon which any remaining documentsin the list are considered not relevant, i.e., the user is not required to label every document inthe Suggestion List view. The classifier uses all documents in the Focus List and the documentslabeled as not relevant to train the algorithm and suggest new documents.
Finally, the Focus List view (Figure 29 (1)) includes all documents currently deemed asrelevant. It is possible to click on an item in the list to load its content in the Document view, andremove a specific document from it (Figure 36). In the end, it is expected that the Focus Listview will include all the relevant documents for a given query.
4.2.3 Underlying techniques
Currently, two alternative approaches are supported for representing text documents:Word Embeddings using fastText (BOJANOWSKI et al., 2017), or the VSM using the TF-IDF term weighting (JONES, 1988). The corpus is pre processed to remove stop-words andnon letter characters. Moreover, all characters are lower cased and lemmatization is applied,which consists in transforming a word into its root or dictionary form. The system supportstwo multidimensional projection techniques to create the 2D similarity scatterplot: (1) TheBarnes-Hut implementation of the t-SNE algorithm (MAATEN, 2014a), and (2) the Least-Square Projection (LSP) (PAULOVICH et al., 2008). In case the LSP projection is chosen, thepairwise cosine similarity measure is applied on the documents’ vector representation of theentire collection, query included.
The CAL protocol has been adopted based on previous evidence that it yields superior

4.2. The TRIVIR System 75
Figure 34 – Demonstration of how to expand the set of relevant (by creating additional query documents)and not relevant documents. The example illustrates the before and after setting a documentas query (a and b) and the before and after expanding the set of not relevant documents (c andd)
(a) Before setting a document as query. (b) After setting a document as query.
(c) Before increasing the set of not relevant. (d) After increasing the set of not relevant.
Developed by author.
Figure 35 – Suggestion View menu. The user has the options to set a document as not relevant or relevant.
Developed by author
results while demanding less review effort (GROSSMAN; CORMACK, 2016). The choiceof TAR protocol determines the choice of the underlying classification algorithm. Currently,the system uses the classifier from the fastText library (JOULIN et al., 2017), using multiplerelevance rather than binary relevance. We found this necessary after including a functionalitythat allows the user to indicate additional query documents. By automatically setting as relevant

76 Chapter 4. TRIVIR: A Visualization System to Support Document Retrieval with High Recall
Figure 36 – Focus List menu. The user has the option to remove the document from the list.
Developed by author
the 10 most similar documents to the new query, we observed a decrease in precision, as notrelevant documents were added to the Focus List view, with negative impact on the classifierperformance. Thus, we established four possible classes for each document: all documentsconsidered not relevant are in the same class (1) Not Relevant, whether the ones consideredrelevant are split into classes (2) Relevant Query, (3) Relevant, (4) Relevant Automatic, andassigned different weights (2, 1 and 0.5, respectively). Since the Suggestion List view only ranks20 documents at a time, the documents are ordered based on their weights, which results inshowing first the documents in the same class as the query documents, followed by the oneslabeled as relevant and finally, the ones set automatically as relevant.
TRIVIR performs the following steps using fastText functions of the fastrtext package:
1. load_model: We loaded a model with pre-trained word vectors. The model was obtainedfrom Wikipedia 2017, UMBC webbase corpus and statmt.org news dataset (MIKOLOV et
al., 2017), which contains 1 million word vectors trained with sub-word information3.
2. get_sentence_representation: Then, we learned the vector representation of each documentin our collection using the loaded model with pre-trained word vectors.
3. execute and predict: We created a trained model of the corpus for the classifier, where thefollowing parameters were used: supervised, input = file with labeled documents, dim =100, lr = 1, wordNgrams = 2, epoch = 20, and output = the trained model. From the model,it is possible to predict unlabeled documents.
4. execute and get_nn We also created an unsupervised model for our collection, with thefollowing parameter settings: skipgram, input = union of documents from the collection,and output = the unsupervised trained model. We applied the unsupervised model in orderto retrieve n words which vector representation is close to a selected one.
The system has been developed using d3.js4, a JavaScript library that supports thedevelopment of dynamic visualizations (BOSTOCK; OGIEVETSKY; HEER, 2011), and web3 https://fasttext.cc4 https://d3js.org/

4.3. Validation 77
technologies such as CSS, HTML and JavaScript. Developed to work on web browsers, thesystem is easily accessible and can be executed on personal data collections. The code isavailable5.
4.3 ValidationIn order to validate the system and ensure it meets the actual needs of potential users,
we had the collaboration of two professors in Physics, plus a Masters student in ComputerScience who faced complex information retrieval problems as part of their research work.Informed about the goals and functionalities of TRIVIR, they showed interest in experimentingwith the system. The two Physics professors are collaborating to conduct a broad literaturesurvey on topics related to materials science research, for which formulating precise queriesis particularly difficult. Indeed, the terms materials science and design cover a range of topics,with contributions expected from different fields. Thus the choice of search keywords is by nomeans straightforward. This was a strong motivation for them to engage on the validation effortof TRIVIR. The Masters student had conducted a systematic literature review, and welcomed anopportunity to verify his findings with an alternative approach. In particular, he was concernedabout missing relevant publications.
An early validation effort was conducted with one of the Professors, which raised severalissues and contributed to fine-tuning the visual interface. The later sessions, with the secondProfessor and the Masters student, were conducted using the current version of the system.The author of this dissertation participated in all sessions. During the sessions, the users wereencouraged to report their insights about the system as well as suggestions for improvement.
4.3.1 Preliminary Validation
We conducted two early sessions with a potential user while the system was still underdevelopment. Our purpose was to verify usability issues and gather insights on how it could beimproved to function properly in a realistic setting. Our collaborator had a collection of papersretrieved from the Web of Science (WoS) website using multiple search terms. Even thoughhe was able to formulate an initial query, the search ended up retrieving a lot of documentsnot related to his topics of interest. This was mainly because contributions are expected fromdifferent fields, and the choice of keywords to search is by no means straightforward.
4.3.1.1 Data and system setup
The corpus used for the sessions was retrieved from the WoS website using the keywords(materials and design and discover, materials and design and discovery and (comput_ or high-
throughput or machine learning) and materials and design and discovery and (comput_ or5 https://github.com/amandagdias/TRIVIR

78 Chapter 4. TRIVIR: A Visualization System to Support Document Retrieval with High Recall
high-throughput)). The results were merged into a collection of 2,095 papers, for which theabstract, title and the year of publication have been preserved. Regarding the system, we used theword embeddings representation of documents and the t-SNE projection technique to generatethe scatterplot view.
4.3.1.2 Results
The Professor was really pleased with how easy the system was to learn. He exploredmostly the Suggestion List, the Scatterplot and the Document views to filter out results. Duringthe sessions, it became clear the need to filter the scatterplot in order to remove point clutter.Also, the Suggestion List view proved useful, as the returned documents were mostly consideredrelevant, even though the training set was small. However, the user wished to expand the sets ofrelevant/not relevant documents faster, labeling multiple documents at once. Besides, a singlequery document was not enough to represent his information needs. Indeed, in exploring thedocument similarity map he found important documents in different regions of the Scatterplotview. These usually corresponded to documents addressing distinct topics. Motivated by theseissues we introduced three new functionalities into the system: (1) The ability to set multiplequery documents. This will retrieve the 10 most similar documents to the new query and setthem as relevant. (2) The ability to label as not relevant the 10 documents most similar to a notrelevant document. (3) Setting as relevant/not relevant all documents containing a certain n-gram(in the Signature List view).
Even though functionalities (1) and (2) speed up the labeling process, they introducedan undesired aside effect, as irrelevant documents ended up included in the Focus List view,since new documents were added based solely on the cosine similarity distance to the selecteddocument. In order to assign less importance to the documents added automatically, the relevantdocuments were assigned to three different classes, and the classifier results ranked based on thedocument’s assigned class.
As mentioned, this collection was known to include many documents unrelated to thesearch, even though they employ the target keywords. The Professor considered these documentsas "false positives". After the sessions were finished, we decided to investigate whether theSignature List view could help in reducing or eliminating what our collaborator called "the curseof false positives". First, we verified whether the information in the Signature List view couldbe used to filter out the false positives. We selected some frequent terms in the false positivedocuments labeled by the Professor and used them to filter the Signature List view to show onlythe 3-grams with those terms. We selected some 3-grams which we believed were common inthe false positive documents, and filtered the corresponding documents. Then, we send a listcontaining those documents to the Professor and asked him to assess manually whether thesewere indeed false positives.
The Professor found that out of 101 documents identified, 82 were correctly labeled as not

4.3. Validation 79
relevant. The relatively high number of documents mistakenly considered as not relevant mightbe explained by our lack of familiarity with the contents of the collection, which contributed to apoor selection of the representative 3-grams. From this experience, we realized that setting agroup of documents as not relevant might result in the user missing important information if s/heis not really certain that the 3-gram only appears in not relevant documents. Moreover, we foundsome bugs during the session that were fixed later and also introduced a few minor modificationsin the interface to enhance usability.
4.3.2 A literature review problem
Following up the preliminary validation session, system development was finished fixingthe issues identified and incorporating the suggestions. With the updates in place we moved on toperform further validation sessions on two real-case scenarios. The first is similar to the previousone, now involving the second Physics Professor, working on a different, though related, corpus.
4.3.2.1 Data and system setup
The second collection consisted of authors, abstract, year of publication and title in-formation relative to 1,363 papers. Again, the corpus had been retrieved from WoS, but withslightly different search keywords: ((material* and (discovery or design) and ("machine learn-
ing" or "high-throughput" or "big data"))), applying a filter to restrict categories related to theirresearch area. This time, rather than word embeddings, we decided to adopt the VSM documentrepresentation. We also modified the classifier learning rate from 1.0 (previous) to 0.1.
4.3.2.2 Results
We observed that the scatterplot projection obtained using the VSM representationyielded better separation of the documents in the Scatterplot view than the word embeddings(Figure 37). It is possible to notice small groups of documents related with the same topic.However, exploring the map we identified some occurrences of the vocabulary mismatch issuewhere, in a group of mostly not relevant documents, the user found a few documents that wereactually relevant. We realized that even though the papers share a target term, the context ofusage is different. For example, the term "cell" appears in contexts of biology (e.g. cancer cells)and physics (e.g. solar cells).
The Professor searched the Signature List view for the term "cell" and retrieved thecontexts on which it was used. By inspecting the documents in which the selected 3-gramsoccurred, he could set all of them as relevant or not relevant at once (Figure 38). Similar actionswere performed on different terms, such as "machine learn model", "computational materialdesign", "rational material design", and "lithium ion battery".

80 Chapter 4. TRIVIR: A Visualization System to Support Document Retrieval with High Recall
Figure 37 – Scatterplot projections of a corpus with 1,363 papers, both created with the t-SNE projectiontechnique and different document vector representations, namely word embeddings in (a); theVSM and a TF-IDF weighting scheme in (b). Blue circles correspond to documents currentlylabeled as relevant, yellow to documents suggested as relevant, not relevant documents are inred and the query documents in green.
(a) Word Embedding (b) VSM + TF-IDF
Developed by author.
Figure 38 – After searching for the word "cell" in the signature view, the user realized it is used indifferent contexts in the collection. Thus, he scanned the list and set all documents containinginteresting 3-grams as relevant.
Developed by author.

4.3. Validation 81
The menu on the Scatterplot view proved useful, since the Professor was able to visualizethe relationships of documents containing certain author names and keywords. Also, by filteringthe K documents most similar to the first query document, he realized the relevant documentswere concentrated in the middle of the projection map, and did not belong to a well definedvisual cluster.
We noticed a problem, however, which did not occur in the previous validation sessions,regarding the accuracy of the classifier output. Out of 20 documents included in the Suggestionlist the Professor considered only 6 as actually relevant. Moreover, the 14 not relevant documentswere clearly not related to the target themes. We conjectured this might be due to the changein the classifier learning rate. In a post-processing task conducted after the session we verifiedthis assumption, setting the learning rate again to the previous value (lr = 1) and re-executingthe process, asking the Professor to assess the results again. With this new configuration, heconsidered 9 out of the 20 suggested documents as relevant. This result opens up the possibilityof incorporating and testing different ML algorithms and configurations, in order to investigatehow results can be improved.
Overall, the professor was pleased with the visualization and was able to retrieve over200 relevant documents in a session that lasted under two hours. Most of the selection effort wasconducted in the final 30 minutes, after he decided to use the functionalities of the Signature Listview.
4.3.3 A Systematic Mapping Study (SMS) scenario
Our third collaborator is a Master’s student who had conducted a Systematic MappingStudy to identify all relevant studies related to his research. His is interested in papers describingsystems to teach Computer Science concepts through Virtual Reality (VR), Augmented Reality(AR) or Mixed Reality (MR), specially those developed for mobile devices. After manuallyreviewing a large collection of papers he identified 15 as relevant to his research. He wantedto use TRIVIR to check whether he might have missed important papers and thus improve theresults of his SMS. We were particularly interested in comparing the sets of papers obtained withthe manual approach and using TRIVIR.
4.3.3.1 Data and system setup
The student used the parsif.al6 tool in order to support his SMS and retrieved 1,259 papersfrom the ACM, Engineering Village, IEEE and Scopus data bases. The provided search stringwas ("learning" OR "teaching") AND ("programming") AND ( "augmented reality" OR "virtual
reality" OR "mixed reality"). We were able to download a .csv file from parsif.al containing allthe papers and upload to our system the information of title, authors, year, abstract and keywords.
6 https://parsif.al/

82 Chapter 4. TRIVIR: A Visualization System to Support Document Retrieval with High Recall
We set the t-SNE as the projection technique and the VSM using the TF-IDF weighting schemeas document representation.
4.3.3.2 Results
The student started interacting with the Suggestion List view and considered relevantonly 1 out of the 20 documents. It is important to point out, however, that he already had ain-depth knowledge of the corpus. In fact, some papers now directly labeled as not relevant hadbeen considered for inspection in the SMS effort, and discarded only after reading.
He observed that several papers included relevant keywords, such as "augmented reality"and "virtual reality", but their reported contribution did not actually focus on these concepts.Similarly, the keywords of some relevant studies were not actually representative of their content,and thus misleading.
The student removed 5 documents from the initial Focus List view, which brought somenot relevant papers. He found these papers, even though they had some similarities with thequery document, did not meet his needs as they were not specific enough. The selected querydocument appeared in the Scatterplot view within a small cluster containing relevant documents.He investigated this group and marked 3 additional documents as relevant.
As he continued exploring the Scatterplot view, he encountered some papers on games,a topic he considered not related to his interest, even though it is slightly related to his search.Then, intending to remove documents that included this term, he searched in the Signature Listview and found the 3-gram "game base learn". Surprisingly, there were relevant papers that usedthis 3-gram and, instead of removing any documents with this particular 3-gram he actuallyidentified 4 additional relevant papers.
This motivated him to search for additional 3-grams, where he found additional relevantpapers containing the 3-grams "virtual reality vr", "augmented reality ar", "augmented realitylearn" and, "virtual reality virtual", including papers not identified as relevant in his manualreview. After he finished exploring the Signature List and the Scatterplot views, he retrained theML algorithm, however, none of the suggested results were relevant. He decided to retrain thealgorithm again and found one more relevant document. After a final training iteration where noadditional relevant document was suggested the student decided to stop the session to verify theresults. The entire session took slightly under 2 hours.
The final Focus List view included 26 documents and their distribution is illustrated inFigure 39, which we compared against the previous set of relevant papers obtained in the SMS.With TRIVIR the student retrieved 11 of the 15 papers previously found, and 15 new potentiallyrelevant papers. We then tried to understand the reasons for missing 4 papers from the originalSMS set. A common issue to all papers was that their keywords were not specific, so as to helpfiltering them. Moreover, two of the papers were marginally relevant, did not share the same
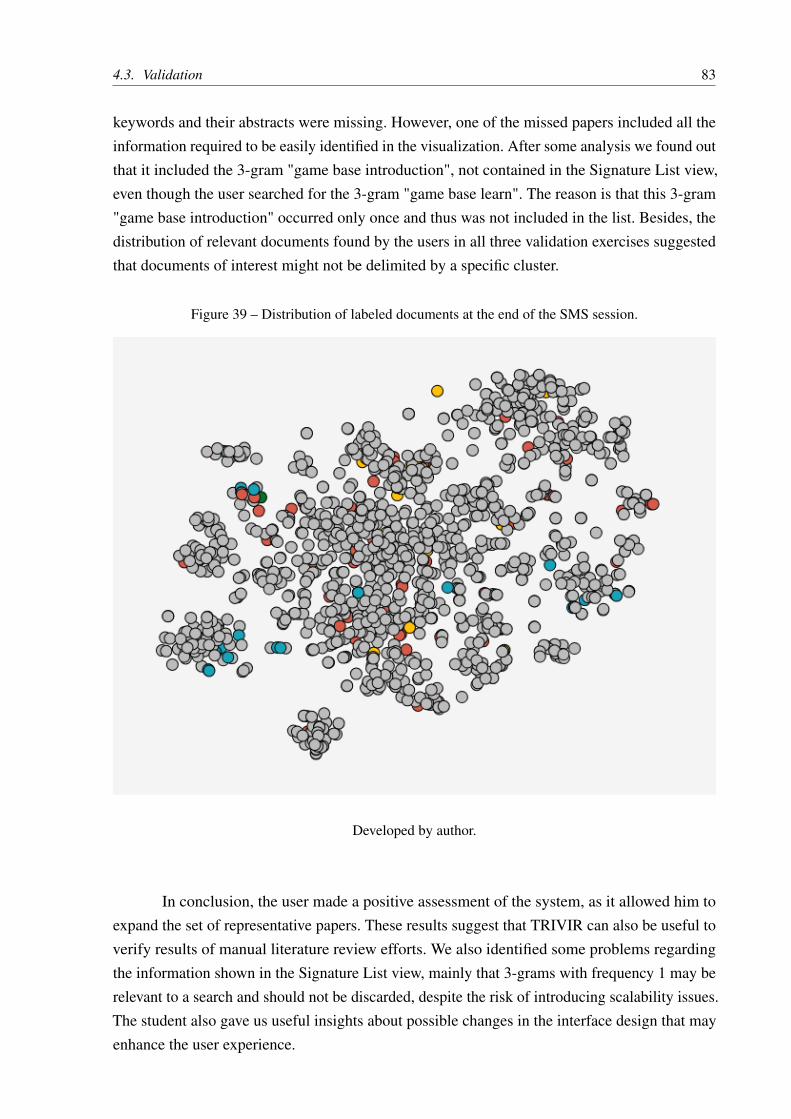
4.3. Validation 83
keywords and their abstracts were missing. However, one of the missed papers included all theinformation required to be easily identified in the visualization. After some analysis we found outthat it included the 3-gram "game base introduction", not contained in the Signature List view,even though the user searched for the 3-gram "game base learn". The reason is that this 3-gram"game base introduction" occurred only once and thus was not included in the list. Besides, thedistribution of relevant documents found by the users in all three validation exercises suggestedthat documents of interest might not be delimited by a specific cluster.
Figure 39 – Distribution of labeled documents at the end of the SMS session.
Developed by author.
In conclusion, the user made a positive assessment of the system, as it allowed him toexpand the set of representative papers. These results suggest that TRIVIR can also be useful toverify results of manual literature review efforts. We also identified some problems regardingthe information shown in the Signature List view, mainly that 3-grams with frequency 1 may berelevant to a search and should not be discarded, despite the risk of introducing scalability issues.The student also gave us useful insights about possible changes in the interface design that mayenhance the user experience.

84 Chapter 4. TRIVIR: A Visualization System to Support Document Retrieval with High Recall
4.4 Final considerationsIn this Chapter we introduced TRIVIR, a novel visualization system to support docu-
ment retrieval with high recall. More specifically, the presented system offers the followingpossibilities:
∙ Explore a document collection projected as a content similarity map to show documents’relationships, query included.
∙ Label documents as relevant, not relevant or query.
∙ Easily expand the set of relevant and not relevant documents considering the most similardocuments to a selected one.
∙ Identify the context on which terms appear in documents, with the option to set alldocuments containing a specific 3-gram as relevant or not relevant.
∙ Identify the synonyms of keywords and discover new terms that are used in similarcontexts.
∙ Explore a list of suggested documents created by a machine learning algorithm.
The validation exercises suggested the system supported users in performing the de-scribed tasks and was well accepted by them. As next steps, we consider modify the currentenvironment to become more user friendly and make the system easily accessible through anopen website. We also observed that each view of the system could be enhanced in differentways to further improve the user experience. For example, the Scatterplot view could groupdocuments using a clustering algorithm, the Document view could highlight important termsand sections of the text, and the Signature view could present the frequency and distribution of3-grams on selected documents. Regarding the underlining techniques, the system is flexible todeal with different methods which allows studies comparing different document representationsand classification algorithms for document retrieval along with text visualization.

85
CHAPTER
5CONCLUSIONS
In this work we developed TRIVIR, a system that combines IR with interactive visual-ization techniques in order to enhance document retrieval. Users can interact with the ML modelto retrieve relevant documents from a collection. The system applies the CAL protocol, whichtrains a classification algorithm based on user’s relevance feedback. Whilst a standard approachshows to users a ranked list where each document must be inspected individually, in TRIVIRusers sees the suggested documents in relation to others, can explore other documents than thosesuggested by the classifier, can inspect the context in which terms occur in the documents andcan label several documents at once, speeding up the process. A user starts selecting a querydocument representative of her information needs. S/he can add query documents in the processand select the document representation and the projection technique to be used.
Source code is available online1 and it was developed to be flexible in terms of documentrepresentation, multidimensional projection and classification techniques, which implies thatthe original code can be easily enhanced with additional approaches. Moreover, TRIVIR wasbuilt considering that it will run in a public server where users can access it through a publicweb page. A paper with results from this project was submitted to the 19th ACM Symposium onDocument Engineering2.
We validated TRIVIR with the collaboration of two Physics professors and a Master’sstudent, who used the system in real case scenarios and expressed positive impressions ofTRIVIR. The system was considered user-friendly, and the users learnt how to navigate andexplore its functions within minutes after a brief explanation. The Signature List view was theonly one that demanded some additional effort from users. Still, it proved a key feature to labelgroups of documents and speed up the process.
The usefulness of TRIVIR is not so easy to demonstrate. In order to benefit from TRIVIR
1 https://github.com/amandagdias/TRIVIR2 https://doceng.org/doceng2019/

86 Chapter 5. Conclusions
users must be prepared to explore different strategies, which may not be easy for those withlimited experience with semi-automated surveys or computational tools to assist in surveys. Alikely future development of TRIVIR could be in creating a tutorial functionality to assist usersin understanding different strategies and how they can be combined to achieve their goal.
In the validation effort we identified that users may end up finding relevant documentswithin the documents labeled as "not relevant". This usually happened after employing thefunctionality to label the 10 most similar document to a selected one as "not relevant". Thisproblem is similar to the one we faced when selecting additional query documents. However,labeling relevant documents as "not relevant" negatively impacts our purpose of achieving highrecall. Thus, even though it quickly enlarges the set of not relevant documents, this functionalitymust be employed with caution. Moreover, removing low frequent 3-grams may also negativelyaffect the search for important documents in certain scenarios.
Another limitation is scalability. In general, our experiments used a collection of around2,500 documents and the system took about 10 minutes to load all the required resourcesand approximately 800 megabytes of data was generated. Even though users could load moredocuments, they would have to consider the time and memory necessary. In order to handle theincrease in the size of the data, a modification in TRIVIR’s Scatterplot View might be necessarysince the clutter would prevent the user from properly inspecting the results. A solution might beto apply a cluster technique on the data where similar data points are grouped together and moredetails can be given on demand.
Nevertheless, TRIVIR enables information retrieval tasks considering not only suggesteddocuments from a ML algorithm but it also incorporates visualizations that guides users inretrieving important documents from a collection. Additionally, the vocabulary-mismatch issuewas handled by providing words context through the Signature View and synonyms through theTerms View.
Possible applications for TRIVIR include:
∙ Support information retrieval tasks with high recall. Examples include bibliographicresearch, but the system is not restricted to a particular application.
∙ Validate results obtained in previous retrieval tasks, such as a Systematic Mapping Study.
∙ Compare different document representation, multidimensional projection, classificationand similarity computation techniques.
∙ Perform exploratory tasks in document collections in general.
Even though our validation exercises provided valuable feedback and suggested thatTRIVIR was useful for the proposed tasks, we believe that a formal evaluation with users in

87
distinct domains applications may provide more solid evidence of the system’s effectiveness andpotential.
Possible future lines of research include:
∙ Expand techniques options for document representation, multidimensional projection,similarity computation and text classification.
∙ Apply concepts from Human Computer Interaction in order to assess and improve thesystem’s usability and make it easier to end users.
∙ Incorporate new functionalities into some of TRIVIR’s main views, such as: (1) clusterdata points in the Scatterplot view; (2) update the machine learning model considering theTerms’ view interactions, and (3) create signatures for each document.


89
BIBLIOGRAPHY
BAEZA-YATES, R. A.; RIBEIRO-NETO, B. Modern Information Retrieval. Boston, MA,USA: Addison-Wesley Longman Publishing Co., Inc., 1999. ISBN 020139829X. Citation onpage 30.
BERENDT, B.; SUBASIC, I. Stories in time: A graph-based interface for news tracking anddiscovery. In: Proceedings of the 2009 IEEE/WIC/ACM International Joint Conference onWeb Intelligence and Intelligent Agent Technology - Volume 03. IEEE Computer Society,2009. (WI-IAT ’09), p. 531–534. ISBN 978-0-7695-3801-3. Available: <http://dx.doi.org/10.1109/WI-IAT.2009.342>. Citations on pages 48 and 50.
BERGER, M.; MCDONOUGH, K.; SEVERSKY, L. M. cite2vec: Citation-driven document ex-ploration via word embeddings. IEEE Transactions on Visualization and Computer Graph-ics, v. 23, n. 1, p. 691–700, Jan 2017. ISSN 1077-2626. Citations on pages 48 and 51.
BLAIR, D. C.; MARON, M. E. An evaluation of retrieval effectiveness for a full-text document-retrieval system. Communications of the ACM, ACM, v. 28, n. 3, p. 289–299, Mar. 1985. ISSN0001-0782. Available: <http://doi.acm.org/10.1145/3166.3197>. Citations on pages 23, 27,and 30.
BOJANOWSKI, P.; GRAVE, E.; JOULIN, A.; MIKOLOV, T. Enriching word vectors withsubword information. Transactions of the Association for Computational Linguistics, v. 5,p. 135–146, 2017. Citations on pages 34, 70, 71, and 74.
BOSTOCK, M.; OGIEVETSKY, V.; HEER, J. D3 data-driven documents. IEEE Transactionson Visualization and Computer Graphics, IEEE Educational Activities Department, v. 17,n. 12, p. 2301–2309, Dec. 2011. ISSN 1077-2626. Available: <http://dx.doi.org/10.1109/TVCG.2011.185>. Citation on page 76.
BRADEL, L.; NORTH, C.; HOUSE, L.; LEMAN, S. Multi-model semantic interaction for textanalytics. In: 2014 IEEE Conference on Visual Analytics Science and Technology (VAST).Paris, France: IEEE, 2014. p. 163–172. Citations on pages 61, 62, and 64.
BYRD, D. A scrollbar-based visualization for document navigation. In: Proceedings of theFourth ACM Conference on Digital Libraries. ACM, 1999. (DL ’99), p. 122–129. ISBN1-58113-145-3. Available: <http://doi.acm.org/10.1145/313238.313283>. Citation on page 45.
CAO, N.; SUN, J.; LIN, Y.; GOTZ, D.; LIU, S.; QU, H. Facetatlas: Multifaceted visualization forrich text corpora. IEEE Transactions on Visualization and Computer Graphics, v. 16, n. 6,p. 1172–1181, Nov 2010. ISSN 1077-2626. Citations on pages 55, 58, and 64.
CHALMERS, M.; CHITSON, P. Bead: Explorations in information visualization. In: Proceed-ings of the 15th Annual International ACM SIGIR Conference on Research and Develop-ment in Information Retrieval. ACM, 1992. (SIGIR ’92), p. 330–337. ISBN 0-89791-523-2.Available: <http://doi.acm.org/10.1145/133160.133215>. Citations on pages 54 and 55.

90 Bibliography
CHEN, C. Citespace ii: Detecting and visualizing emerging trends and transient patterns inscientific literature. J. Am. Soc. Inf. Sci. Technol., John Wiley & Sons, Inc., v. 57, n. 3, p. 359–377, Feb. 2006. ISSN 1532-2882. Available: <http://dx.doi.org/10.1002/asi.v57:3>. Citationson pages 54, 56, and 58.
CHOO, J.; KIM, H.; CLARKSON, E.; LIU, Z.; LEE, C.; LI, F.; LEE, H.; KANNAN, R.;STOLPER, C. D.; STASKO, J.; PARK, H. Visirr: A visual analytics system for informationretrieval and recommendation for large-scale document data. ACM Transactions on KnowledgeDiscovery from Data, ACM, v. 12, n. 1, p. 8:1–8:20, Jan. 2018. ISSN 1556-4681. Available:<http://doi.acm.org/10.1145/3070616>. Citations on pages 50, 52, and 64.
CHOU, J.-K.; YANG, C.-K. Papervis: Literature review made easy. In: Proceedings of the 13thEurographics / IEEE - VGTC Conference on Visualization. Chichester, UK: The EurographsAssociation; John Wiley; Sons, Ltd., 2011. (EuroVis’11), p. 721–730. Available: <http://dx.doi.org/10.1111/j.1467-8659.2011.01921.x>. Citation on page 55.
CORMACK, G. V.; GROSSMAN, M. R. The Grossman-Cormack Glossary of TechnologyAssisted Review. 2013. Available: <http://www.fclr.org/fclr/articles/html/2010/grossman.pdf>.Accessed: 27/07/2017. Citations on pages 24 and 29.
. Evaluation of machine-learning protocols for technology-assisted review in electronicdiscovery. In: Proceedings of the 37th International ACM SIGIR Conference on Research;Development in Information Retrieval. ACM, 2014. (SIGIR ’14), p. 153–162. ISBN 978-1-4503-2257-7. Available: <http://doi.acm.org/10.1145/2600428.2609601>. Citations on pages25 and 29.
. Engineering quality and reliability in technology-assisted review. In: Proceedings of the39th International ACM SIGIR Conference on Research and Development in InformationRetrieval. ACM, 2016. (SIGIR ’16), p. 75–84. ISBN 978-1-4503-4069-4. Available: <http://doi.acm.org/10.1145/2911451.2911510>. Citation on page 29.
. A tour of technology-assisted review. In: FAGERBERG, J.; MOWERY, D. C.; NELSON,R. R. (Ed.). Perspectives on Predictive Coding and Other Advanced Search Methods forthe Legal Practitioner. [S.l.]: American Bar Association, 2016. chap. 3. ISBN 978-1-63425-657-5. Citation on page 29.
CROFT, B.; METZLER, D.; STROHMAN, T. Search Engines: Information Retrieval inPractice. 1st. ed. USA: Addison-Wesley Publishing Company, 2009. ISBN 0136072240,9780136072249. Citations on pages 28 and 30.
CUTTING, D. R.; KARGER, D. R.; PEDERSEN, J. O.; TUKEY, J. W. Scatter/gather: Acluster-based approach to browsing large document collections. In: Proceedings of the 15thAnnual International ACM SIGIR Conference on Research and Development in Infor-mation Retrieval. ACM, 1992. (SIGIR ’92), p. 318–329. ISBN 0-89791-523-2. Available:<http://doi.acm.org/10.1145/133160.133214>. Citations on pages 47 and 48.
DUNNE, C.; SHNEIDERMAN, B.; GOVE, R.; KLAVANS, J.; DORR, B. Rapid understandingof scientific paper collections: Integrating statistics, text analytics, and visualization. Journal ofthe American Society for Information Science and Technology, v. 63, n. 12, p. 2351–2369,2012. Available: <https://onlinelibrary.wiley.com/doi/abs/10.1002/asi.22652>. Citation on page55.

Bibliography 91
ENDERT, A.; BURTNER, R.; CRAMER, N.; PERKO, R.; HAMPTON, S.; COOK, K. Typo-graph: Multiscale spatial exploration of text documents. In: 2013 IEEE International Confer-ence on Big Data. Silicon Valley, CA, USA: IEEE, 2013. p. 17–24. Citations on pages 53and 54.
ENDERT, A.; FIAUX, P.; NORTH, C. Semantic interaction for visual text analytics. In: Pro-ceedings of the SIGCHI Conference on Human Factors in Computing Systems. ACM,2012. (CHI ’12), p. 473–482. ISBN 978-1-4503-1015-4. Available: <http://doi.acm.org/10.1145/2207676.2207741>. Citations on pages 61 and 62.
FELIZARDO, K. R.; ANDERY, G. F.; PAULOVICH, F. V.; MINGHIM, R.; MALDONADO,J. C. A visual analysis approach to validate the selection review of primary studies in systematicreviews. Information and Software Technology, v. 54, n. 10, p. 1079 – 1091, 2012. ISSN0950-5849. Available: <http://www.sciencedirect.com/science/article/pii/S0950584912000742>.Citations on pages 54 and 57.
FRUCHTERMAN, T. M. J.; REINGOLD, E. M. Graph drawing by force-directed placement.Software: Practice and Experience, John Wiley & Sons, Inc., v. 21, n. 11, p. 1129–1164, Nov.1991. ISSN 0038-0644. Available: <http://dx.doi.org/10.1002/spe.4380211102>. Citation onpage 39.
GOMEZ-NIETO, E.; ROMAN, F. S.; PAGLIOSA, P.; CASACA, W.; HELOU, E. S.; OLIVEIRA,M. C. F.; NONATO, L. G. Similarity preserving snippet-based visualization of web searchresults. IEEE Transactions on Visualization and Computer Graphics, IEEE EducationalActivities Department, v. 20, n. 3, p. 457–470, Mar. 2014. ISSN 1077-2626. Available: <http://dx.doi.org/10.1109/TVCG.2013.242>. Citations on pages 60 and 64.
GRANITZER, M.; KIENREICH, W.; SABOL, V.; DöSINGER, G. Webrat: Supporting ag-ile knowledge retrieval through dynamic, incremental clustering and automatic labelling ofweb search result sets. In: Proceedings of the Twelfth International Workshop on En-abling Technologies: Infrastructure for Collaborative Enterprises. Washington, DC, USA:IEEE Computer Society, 2003. (WETICE ’03), p. 296–. ISBN 0-7695-1963-6. Available:<http://dl.acm.org/citation.cfm?id=938984.939786>. Citations on pages 47 and 49.
GROSSMAN, M.; CORMACK, G. Continuous active learning for tar. Practical Law TheJournal: Litigation, p. 32–37, Apr-May 2016. Citations on pages 29 and 75.
GROSSMAN, M. R.; CORMACK, G. V. Technology-Assisted Review in E-Discovery CanBe More Effective and More Efficient Than Exhaustive Manual Review. Richmond Journalof Law and Technology, XVII, n. 3, p. 1–33, 2011. ISSN 02729490. Available: <http://www.discovia.com/wp-content/uploads/2012/07/grossman-cormack-20110326.pdf>. Citation onpage 24.
GöRG, C.; LIU, Z.; KIHM, J.; CHOO, J.; PARK, H.; STASKO, J. Combining computationalanalyses and interactive visualization for document exploration and sensemaking in jigsaw.IEEE Transactions on Visualization and Computer Graphics, v. 19, n. 10, p. 1646–1663,Oct 2013. ISSN 1077-2626. Citation on page 57.
HARPER, D. J.; COULTHARD, S.; YIXING, S. A language modelling approach to relevanceprofiling for document browsing. In: Proceedings of the 2Nd ACM/IEEE-CS Joint Confer-ence on Digital Libraries. ACM, 2002. (JCDL ’02), p. 76–83. ISBN 1-58113-513-0. Available:<http://doi.acm.org/10.1145/544220.544234>. Citation on page 45.

92 Bibliography
HEARST, M. A. Tilebars: Visualization of term distribution information in full text informa-tion access. In: Proceedings of the SIGCHI Conference on Human Factors in ComputingSystems. ACM Press/Addison-Wesley Publishing Co., 1995. (CHI ’95), p. 59–66. ISBN 0-201-84705-1. Available: <http://dx.doi.org/10.1145/223904.223912>. Citations on pages 45and 46.
HEIMERL, F.; JOHN, M.; HAN, Q.; KOCH, S.; ERTL, T. Docucompass: Effective explo-ration of document landscapes. In: 2016 IEEE Conference on Visual Analytics Science andTechnology (VAST). Baltimore, MD, USA: IEEE, 2016. p. 11–20. Citations on pages 57, 59,and 64.
HINTON, G.; ROWEIS, S. Stochastic neighbor embedding. In: Proceedings of the 15thInternational Conference on Neural Information Processing Systems. MIT Press, 2002.(NIPS’02), p. 857–864. Available: <http://dl.acm.org/citation.cfm?id=2968618.2968725>. Cita-tion on page 39.
INGRAM, S.; MUNZNER, T. Dimensionality reduction for documents with nearest neighborqueries. Neurocomputing, v. 150, 11 2014. Citation on page 40.
JANKOWSKA, M.; KESELJ, V.; MILIOS, E. Relative n-gram signatures: Document vi-sualization at the level of character n-grams. In: Proceedings of the 2012 IEEE Confer-ence on Visual Analytics Science and Technology (VAST). Washington, DC, USA: IEEEComputer Society, 2012. (VAST ’12), p. 103–112. ISBN 978-1-4673-4752-5. Available:<http://dx.doi.org/10.1109/VAST.2012.6400484>. Citation on page 71.
JONES, K. S. Document retrieval systems. In: WILLETT, P. (Ed.). London, UK, UK: TaylorGraham Publishing, 1988. chap. A Statistical Interpretation of Term Specificity and Its Applica-tion in Retrieval, p. 132–142. ISBN 0-947568-21-2. Available: <http://dl.acm.org/citation.cfm?id=106765.106782>. Citations on pages 32 and 74.
JOULIN, A.; GRAVE, E.; BOJANOWSKI, P.; MIKOLOV, T. Bag of tricks for efficient textclassification. In: Proceedings of the 15th Conference of the European Chapter of the As-sociation for Computational Linguistics. Association for Computational Linguistics, 2017.p. 427–431. Available: <http://aclweb.org/anthology/E17-2068>. Citations on pages 37, 70,and 75.
KADHIM, A. Survey on supervised machine learning techniques for automatic text classification.Artificial Intelligence Review, 01 2019. Citation on page 37.
KAMATH, C. N.; BUKHARI, S. S.; DENGEL, A. Comparative study between traditionalmachine learning and deep learning approaches for text classification. In: Proceedings ofthe ACM Symposium on Document Engineering 2018. ACM, 2018. (DocEng ’18), p. 14:1–14:11. ISBN 978-1-4503-5769-2. Available: <http://doi.acm.org/10.1145/3209280.3209526>.Citations on pages 37 and 38.
KAMPANYA, N.; SHEN, R.; KIM, S.; NORTH, C.; FOX, E. Citiviz: A visual user inter-face to the CITIDEL system. In: Heery R., Lyon L. (eds) Research and Advanced Tech-nology for Digital Libraries. ECDL, 2004. p. 122–133. Available: <https://doi.org/10.1007/978-3-540-30230-8_12>. Citation on page 59.
KEIM, D.; ANDRIENKO, G.; FEKETE, J.-D.; GÖRG, C.; KOHLHAMMER, J.; MELANÇON,G. Visual analytics: Definition, process, and challenges. Information visualization, Springer, p.154–175, 2008. Citation on page 23.

Bibliography 93
KIELA, D.; HILL, F.; CLARK, S. Specializing word embeddings for similarity or relat-edness. In: Proceedings of the 2015 Conference on Empirical Methods in Natural Lan-guage Processing. Association for Computational Linguistics, 2015. p. 2044–2048. Available:<http://aclweb.org/anthology/D15-1242>. Citation on page 36.
KLOUCHE, K.; RUOTSALO, T.; MICALLEF, L.; ANDOLINA, S.; JACUCCI, G. Visualre-ranking for multi-aspect information retrieval. In: Proceedings of the 2017 Conference onConference Human Information Interaction and Retrieval. ACM, 2017. (CHIIR ’17), p.57–66. ISBN 978-1-4503-4677-1. Available: <http://doi.acm.org/10.1145/3020165.3020174>.Citations on pages 44 and 45.
KOCH, S.; HEIMERL, F.; ERTL, T. Visual document retrieval: Supporting text search andanalysis with visual analytics. Computing in Science Engineering, v. 15, n. 4, p. 66–74, July-Aug. 2013. ISSN 1521-9615. Available: <doi.ieeecomputersociety.org/10.1109/MCSE.2013.93>.Citation on page 37.
KORHONEN, A.; LITOLA, J.; TARHIO, J. Platform for elaboration of search results. We-bist 2007 - 3rd International Conference on Web Information Systems and Technologies,Proceedings, p. 263–269, 01 2007. Citation on page 47.
KUMARI, M.; JAIN, A.; BHATIA, A. Synonyms based term weighting scheme: An extensionto tf.idf. Procedia Computer Science, v. 89, p. 555 – 561", 2016. ISSN 1877-0509. Available:<http://www.sciencedirect.com/science/article/pii/S1877050916311589>. Citation on page 32.
LE, Q.; MIKOLOV, T. Distributed representations of sentences and documents. In: Proceedingsof the 31st International Conference on International Conference on Machine Learning -Volume 32. JMLR.org, 2014. (ICML’14), p. II–1188–II–1196. Available: <http://dl.acm.org/citation.cfm?id=3044805.3045025>. Citations on pages 35 and 36.
LIU, S.; WANG, X.; COLLINS, C.; DOU, W.; OUYANG, F.; M, E. A.; JIANG, L.; KEIM, D.Bridging text visualization and mining: A task-driven survey. IEEE Transactions on Visualiza-tion and Computer Graphics, p. 1–1, 2018. ISSN 1077-2626. Citation on page 63.
MAATEN, L. Accelerating t-sne using tree-based algorithms. Journal of Machine LearningResearch, v. 15, p. 3221–3245, 2014. Available: <http://jmlr.org/papers/v15/vandermaaten14a.html>. Citation on page 74.
MAATEN, L. V. D. Accelerating t-sne using tree-based algorithms. J. Mach. Learn. Res.,JMLR.org, v. 15, n. 1, p. 3221–3245, Jan. 2014. ISSN 1532-4435. Available: <http://dl.acm.org/citation.cfm?id=2627435.2697068>. Citation on page 40.
MAATEN, L. V. D.; POSTMA, E.; HERIK, J. Van den. Dimensionality reduction: a comparativereview. J Mach Learn Res, v. 10, p. 66–71, 2009. Citations on pages 38 and 39.
MAATEN, L. van der; HINTON, G. Visualizing data using t-SNE. Journal of MachineLearning Research, v. 9, p. 2579–2605, 2008. Available: <http://www.jmlr.org/papers/v9/vandermaaten08a.html>. Citations on pages 39 and 40.
MAKKI, R.; CARVALHO, E.; SOTO, A. J.; BROOKS, S.; OLIVEIRA, M. C. F. de; MILIOS,E.; MINGHIM, R. Atr-vis: Visual and interactive information retrieval for parliamentary discus-sions in twitter. To appear in ACM Transactions on Knowledge Discovery from Data, 2017.Citation on page 24.

94 Bibliography
MANNING, C. D.; RAGHAVAN, P.; SCHüTZE, H. Introduction to Information Retrieval.[S.l.]: Cambridge University Press, 2008. ISBN 0521865719, 9780521865715. Citations onpages 30, 31, and 32.
MIKOLOV, T.; CORRADO, G.; CHEN, K.; DEAN, J. Efficient estimation of word represen-tations in vector space. In: . [S.l.]: Computing Research Repository (CoRR), 2013. p. 1–12.Citations on pages 33 and 34.
MIKOLOV, T.; GRAVE, E.; BOJANOWSKI, P.; PUHRSCH, C.; JOULIN, A. Advancesin pre-training distributed word representations. Computing Research Repository (CoRR),abs/1712.09405, 2017. Available: <http://arxiv.org/abs/1712.09405>. Citation on page 76.
MIKOLOV, T.; SUTSKEVER, I.; CHEN, K.; CORRADO, G.; DEAN, J. Distributed representa-tions of words and phrases and their compositionality. In: Proceedings of the 26th InternationalConference on Neural Information Processing Systems. USA: Curran Associates Inc., 2013.(NIPS’13), p. 3111–3119. Available: <http://dl.acm.org/citation.cfm?id=2999792.2999959>.Citations on pages 33 and 34.
MIKOLOV, T.; YIH, S. W.-t.; ZWEIG, G. Linguistic regularities in continuousspace word representations. In: Proceedings of the 2013 Conference of the NorthAmerican Chapter of the Association for Computational Linguistics: HumanLanguage Technologies (NAACL-HLT-2013). Association for Computational Lin-guistics, 2013. Available: <https://www.microsoft.com/en-us/research/publication/linguistic-regularities-in-continuous-space-word-representations/>. Citation on page34.
NGUYEN, T. N.; ZHANG, J. A novel visualization model for web search results. IEEE trans-actions on visualization and computer graphics, v. 12, p. 981–8, 09 2006. Citations on pages46, 47, and 64.
OLIVEIRA, M. C. F.; LEVKOWITZ, H. From visual data exploration to visual data mining: asurvey. IEEE Transactions on Visualization and Computer Graphics, v. 9, n. 3, p. 378–394,2003. Citation on page 23.
OLSEN, K. A.; KORFHAGE, R. R.; SOCHATS, K. M.; SPRING, M. B.; WILLIAMS, J. G.Visualization of a document collection: The vibe system. Information Processing & Manage-ment, v. 29, n. 1, p. 69 – 81, 1993. ISSN 0306-4573. Available: <http://www.sciencedirect.com/science/article/pii/0306457393900248>. Citations on pages 43 and 44.
PAIVA, J. G. S.; SCHWARTZ, W. R.; PEDRINI, H.; MINGHIM, R. An approach to supportingincremental visual data classification. IEEE Transactions on Visualization and ComputerGraphics, v. 21, p. 4–17, 2015. Citation on page 37.
PAULOVICH, F.; NONATO, L.; MINGHIM, R.; LEVKOWITZ, H. Least square projection:A fast high-precision multidimensional projection technique and its application to documentmapping. IEEE Transactions on Visualization and Computer Graphics, v. 14, n. 3, p. 564–575, May-June 2008. ISSN 1077-2626. Citations on pages 40 and 74.
PAULOVICH, F. V.; MINGHIM, R. HiPP: A novel hierarchical point placement strategy and itsapplication to the exploration of document collections. IEEE Transactions on Visualizationand Computer Graphics, IEEE Educational Activities Department, Piscataway, NJ, EUA, v. 14,n. 6, p. 1229–1236, Nov. 2008. ISSN 1077-2626. Citation on page 41.

Bibliography 95
PAULOVICH, F. V.; PINHO, R.; BOTHA, C. P.; HEIJS, A.; MINGHIM, R. Pex-web: Content-based visualization of web search results. 2008 International Conference Information Visu-alisation, p. 208–214, July 2008. ISSN 1550-6037. Citations on pages 59, 61, and 64.
PEARSON, K. On lines and planes of closest fit to systems of points in space. PhilosophicalMagazine, v. 2, p. 559–572, 1901. Citation on page 38.
PEZZOTTI, N.; LELIEVELDT, B.; MAATEN, L. van der; HöLLT, T.; EISEMANN, E.; VI-LANOVA, A. Approximated and user steerable tsne for progressive visual analytics. IEEETransactions on Visualization and Computer Graphics, v. 23, 07 2016. Citation on page 40.
RENNISON, E. Galaxy of news: An approach to visualizing and understanding expansivenews landscapes. In: Proceedings of the 7th Annual ACM Symposium on User InterfaceSoftware and Technology. ACM, 1994. (UIST ’94), p. 3–12. ISBN 0-89791-657-3. Available:<http://doi.acm.org/10.1145/192426.192429>. Citations on pages 52, 53, and 64.
RINKER, T. W. qdap: Quantitative Discourse Analysis Package. Buffalo, New York, 2019.2.3.2. Available: <http://github.com/trinker/qdap>. Citation on page 71.
RUBENS, N.; KAPLAN, D.; SUGIYAMA, M. Active learning in recommender systems. Rec-ommender Systems Handbook, Springer, p. 735–767, 2011. Citation on page 29.
SEDLMAIR, M.; MUNZNER, T.; TORY, M. Empirical guidance on scatterplot and dimensionreduction technique choices. IEEE Transactions on Visualization and Computer Graphics,IEEE Educational Activities Department, Piscataway, NJ, USA, v. 19, n. 12, p. 2634–2643, Dec.2013. ISSN 1077-2626. Available: <http://dx.doi.org/10.1109/TVCG.2013.153>. Citations onpages 41 and 68.
SETTLES, B. Active learning literature survey. Computer Sciences Technical Report, n. 1648,2009. Citation on page 28.
SINGHAL, A. Modern information retrieval: A brief overview. IEEE Data Engineering Bul-letin, v. 24, n. 4, p. 35–43, 01 2001. Citations on pages 28 and 30.
STASKO, J.; GORG, C.; LIU, Z.; SINGHAL, K. Jigsaw: Supporting investigative analysisthrough interactive visualization. 2007 IEEE Symposium on Visual Analytics Science andTechnology, p. 131–138, Oct 2007. Citation on page 56.
TATEMURA, J. Graphical relevance feedback: visual exploration in the document space. Pro-ceedings of 2000 IEEE International Symposium on Visual Languages, p. 39–46, 2000.ISSN 1049-2615. Citations on pages 58 and 60.
TORGERSON, W. S. Multidimensional scaling: I. theory and method. Psychometrika, v. 17,n. 4, p. 401–419, Dec 1952. ISSN 1860-0980. Available: <https://doi.org/10.1007/BF02288916>.Citation on page 38.
TURNEY, P.; PANTEL, P. From frequency to meaning: Vector space models of semantics.Journal of Artificial Intelligence Research, v. 37, 03 2010. Citations on pages 31 and 32.
WISE, J. A.; THOMAS, J. J.; PENNOCK, K.; LANTRIP, D.; POTTIER, M.; SCHUR, A.;CROW, V. Visualizing the non-visual: spatial analysis and interaction with information from textdocuments. Proceedings of Visualization 1995 Conference, p. 51–58, 1995. Citation on page53.

96 Bibliography
WONG, P.; THOMAS, J. Visual Analytics. IEEE Computer Graphics and Applications, v. 24,n. 5, p. 20–21, 2004. Citation on page 23.
ZAMANI, H.; CROFT, W. B. Relevance-based word embedding. In: Proceedings of the40th International ACM SIGIR Conference on Research and Development in Informa-tion Retrieval. ACM, 2017. (SIGIR ’17), p. 505–514. ISBN 978-1-4503-5022-8. Available:<http://doi.acm.org/10.1145/3077136.3080831>. Citation on page 36.
ZIMMER, B.; SAHLGREN, M.; KERREN, A. Visual analysis of relationships between het-erogeneous networks and texts: An application on the ieee vis publication dataset. Informatics,v. 4, p. 11, 05 2017. Citations on pages 49 and 64.

UN
IVER
SID
AD
E D
E SÃ
O P
AULO
Inst
ituto
de
Ciên
cias
Mat
emát
icas
e d
e Co
mpu
taçã
o