study on crime and corruption in cape verde · corruption in cape verde capa est. sob crime e...
TRANSCRIPT
MINISTÉRIO DA JUSTIÇAComissão de Coordenaçãode Combate à Droga
NAÇÕES UNIDASEscritório contra Drogas e Crime
MINISTRY OF JUSTICEComissão de Coordenaçãode Combate à Droga
UNITED NATIONSOffice on Drugs and Crime
ESTUDO SOBRE CRIME E CORRUPÇÃO EM CABO VERDE
STUDY ON CRIME AND CORRUPTION IN CAPE VERDE
Capa Est. Sob Crime e Corrupção 1 130-10-2007 15:51:58
2
Edited by: Anna Alvazzi del Frate Translation: José Luís Ramos e Sara Ramos This publication is also on the Internet: www.unodc.org © UNODC, 2007 This publication may be freely reprinted provided the source is acknowledged and a copy of the publication or reprint is forwarded to UNODC. The opinions expressed in this publication are those of the authors and contributors and do not necessarily reflect the views of UNODC. printed by Grafica da Praia
3
Introduction For several decades, surveys of general population have been used to collect information on the crime situation. These surveys (victim or victimization surveys) place emphasis on the experience of respondents rather than on officially recorded crime, in the belief that much crime is not reported by citizens to the authorities. As a result, the analysis of survey findings may assist in improving law enforcement capabilities, by identifying strengths and weaknesses in the relationship between the police and the public. Parallel to the survey of general population, it is important to complement the information by considering the experiences, perceptions and expectations of police officers. Finally, surveys of the private sector and public employees from sectors other than the police may provide information on the experiences and perceptions of these groups about the integrity of the country by looking at the way its administration works: transparency of bureaucracy, rule of law application and their opposite, i.e. corruption. In total, four different surveys with the aim of providing a full coverage of the situation of (and responses to) crime and corruption in the country. The Cape Verde surveys were carried out according to the international standard methodologies identified by and included in the UNODC “Data for Africa” initiative. The Crime Victim Survey (CVS) for general population, the Crime and Corruption Business Survey (CCBS) for the private sector, and model surveys for police officers and public employees were adjusted to the local context and implemented at the inception of the projects Anti-organized crime and counter-narcotics enforcement in Cape Verde (CAVE ANTRAF) and Strengthening of the rule of law in Cape Verde (CAVE JIMLOC) in 2006. The results of the four baseline surveys will be used as a benchmark to monitor the results of other technical assistance initiatives implemented by the two projects. This will be done by repeating the four surveys at the conclusion of project activities. The surveys have already been conducted in several countries in the world. The general population survey was done with the same methodology in seven countries in the Southern African Development Community (SADC) region in 2000-04. It was possible to transfer to Cape Verde the experience gained through similar surveys carried out in Mozambique in 2002, thus having the advantage of the availability of instruments and training already translated into Portuguese. The overall objectives of the surveys may be summarized as follows:
1. Assessment of the extent of crime and corruption experienced by citizens;
2. Assessment of the perceptions of citizens about police performance, access to justice, safety and security, causes of crime;
3. Assessment of experiences and perceptions of police officers about crime and corruption, working environment and conditions;
4. Assessment of experiences and perceptions of other public employees about corruption, working environment and conditions;
5. Assessment of the extent of crime and corruption experienced by the private sector;
6. Assessment of the perceptions of businesses about corruption, safety and security.
The follow-up/monitoring surveys will be conducted with the same methodology as the baseline surveys upon conclusion of the two projects. It is expected that they will achieve the result of measuring progress along the six objectives mentioned above. This report contains a synthetic presentation of the key findings from the four baseline surveys, where possible placing them within a broader international context and identifying issues for closer monitoring and follow-up.
4
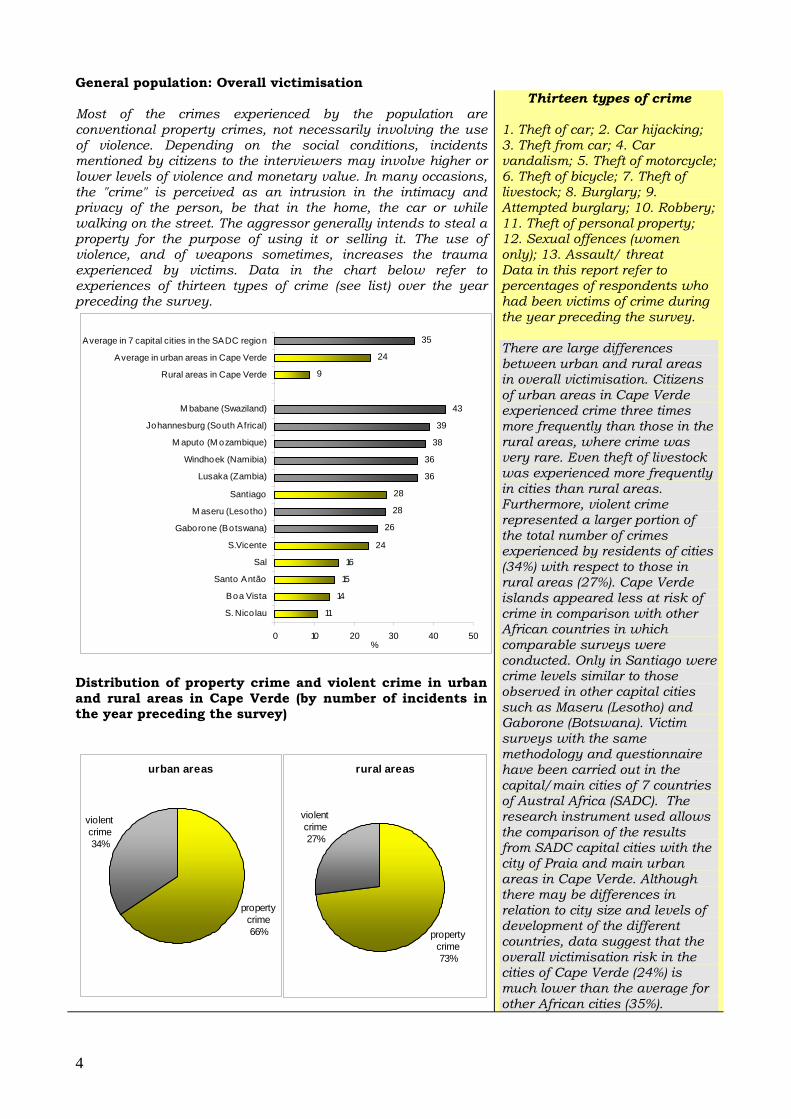
General population: Overall victimisation Most of the crimes experienced by the population are conventional property crimes, not necessarily involving the use of violence. Depending on the social conditions, incidents mentioned by citizens to the interviewers may involve higher or lower levels of violence and monetary value. In many occasions, the "crime" is perceived as an intrusion in the intimacy and privacy of the person, be that in the home, the car or while walking on the street. The aggressor generally intends to steal a property for the purpose of using it or selling it. The use of violence, and of weapons sometimes, increases the trauma experienced by victims. Data in the chart below refer to experiences of thirteen types of crime (see list) over the year preceding the survey.
11
14
15
16
24
26
28
28
36
36
38
39
43
9
24
35
0 10 20 30 40 50
S. Nico lau
Boa Vista
Santo Antão
Sal
S.Vicente
Gaborone (Botswana)
M aseru (Lesotho)
Santiago
Lusaka (Zambia)
Windhoek (Namibia)
M aputo (M ozambique)
Johannesburg (South Africal)
M babane (Swaziland)
Rural areas in Cape Verde
Average in urban areas in Cape Verde
Average in 7 capital cities in the SADC region
%
Distribution of property crime and violent crime in urban and rural areas in Cape Verde (by number of incidents in the year preceding the survey)
Thirteen types of crime
1. Theft of car; 2. Car hijacking; 3. Theft from car; 4. Car vandalism; 5. Theft of motorcycle; 6. Theft of bicycle; 7. Theft of livestock; 8. Burglary; 9. Attempted burglary; 10. Robbery; 11. Theft of personal property; 12. Sexual offences (women only); 13. Assault/ threat Data in this report refer to percentages of respondents who had been victims of crime during the year preceding the survey. There are large differences between urban and rural areas in overall victimisation. Citizens of urban areas in Cape Verde experienced crime three times more frequently than those in the rural areas, where crime was very rare. Even theft of livestock was experienced more frequently in cities than rural areas. Furthermore, violent crime represented a larger portion of the total number of crimes experienced by residents of cities (34%) with respect to those in rural areas (27%). Cape Verde islands appeared less at risk of crime in comparison with other African countries in which comparable surveys were conducted. Only in Santiago were crime levels similar to those observed in other capital cities such as Maseru (Lesotho) and Gaborone (Botswana). Victim surveys with the same methodology and questionnaire have been carried out in the capital/main cities of 7 countries of Austral Africa (SADC). The research instrument used allows the comparison of the results from SADC capital cities with the city of Praia and main urban areas in Cape Verde. Although there may be differences in relation to city size and levels of development of the different countries, data suggest that the overall victimisation risk in the cities of Cape Verde (24%) is much lower than the average for other African cities (35%).
rural areas
property crime73%
violent crime27%
urban areas
property crime66%
violent crime34%
5
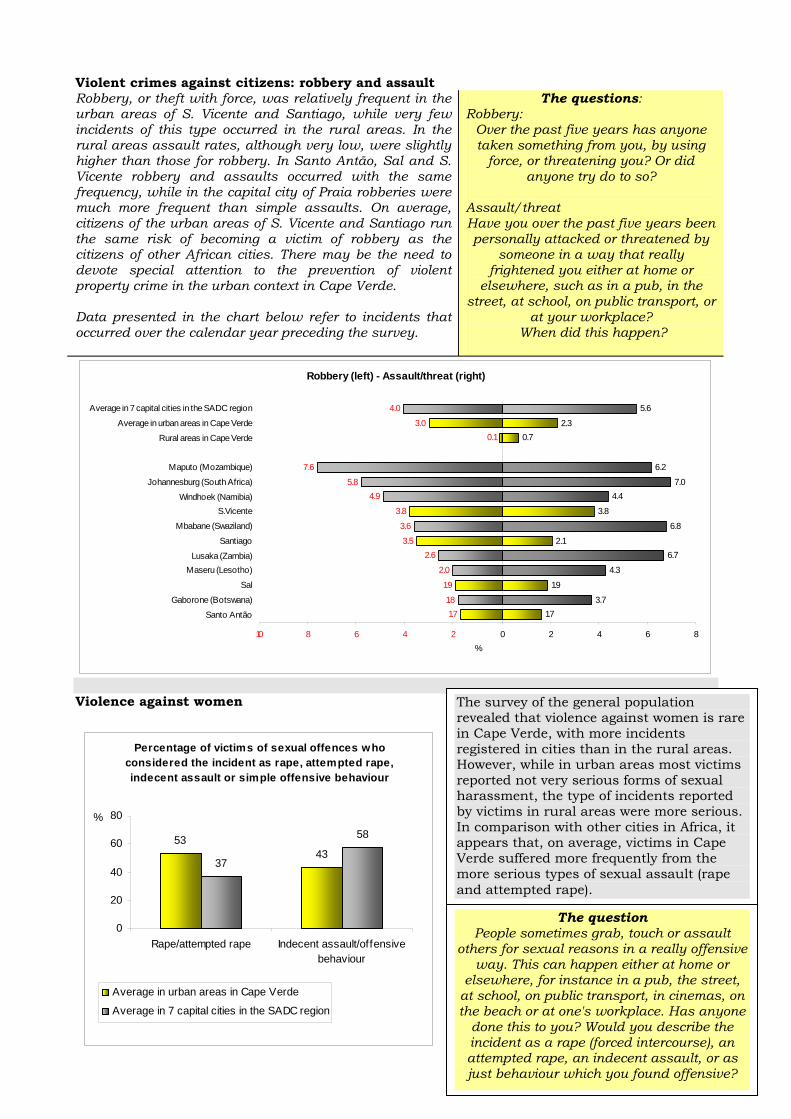
Violent crimes against citizens: robbery and assault Robbery, or theft with force, was relatively frequent in the urban areas of S. Vicente and Santiago, while very few incidents of this type occurred in the rural areas. In the rural areas assault rates, although very low, were slightly higher than those for robbery. In Santo Antão, Sal and S. Vicente robbery and assaults occurred with the same frequency, while in the capital city of Praia robberies were much more frequent than simple assaults. On average, citizens of the urban areas of S. Vicente and Santiago run the same risk of becoming a victim of robbery as the citizens of other African cities. There may be the need to devote special attention to the prevention of violent property crime in the urban context in Cape Verde. Data presented in the chart below refer to incidents that occurred over the calendar year preceding the survey.
The questions: Robbery:
Over the past five years has anyone taken something from you, by using
force, or threatening you? Or did anyone try do to so?
Assault/threat Have you over the past five years been personally attacked or threatened by
someone in a way that really frightened you either at home or
elsewhere, such as in a pub, in the street, at school, on public transport, or
at your workplace? When did this happen?
Robbery (left) - Assault/threat (right)
1.73.7
1.9
4.3
6.72.1
6.8
3.8
4.47.0
6.2
0.72.3
5.6
1.71.8
1.9
2.0
2.63.5
3.6
3.8
4.95.8
7.6
0.13.0
4.0
10 8 6 4 2 0 2 4 6 8
Santo Antão
Gaborone (Botswana)
Sal
Maseru (Lesotho)Lusaka (Zambia)
Santiago
Mbabane (Swaziland)
S.VicenteWindhoek (Namibia)
Johannesburg (South Africa)
Maputo (Mozambique)
Rural areas in Cape Verde
Average in urban areas in Cape Verde
Average in 7 capital cities in the SADC region
%
Violence against women
Percentage of victims of sexual offences who considered the incident as rape, attempted rape, indecent assault or simple offensive behaviour
5343
37
58
0
20
40
60
80
Rape/attempted rape Indecent assault/offensivebehaviour
%
Average in urban areas in Cape Verde
Average in 7 capital cities in the SADC region
The question People sometimes grab, touch or assault
others for sexual reasons in a really offensive way. This can happen either at home or
elsewhere, for instance in a pub, the street, at school, on public transport, in cinemas, on the beach or at one's workplace. Has anyone
done this to you? Would you describe the incident as a rape (forced intercourse), an attempted rape, an indecent assault, or as just behaviour which you found offensive?
The survey of the general population revealed that violence against women is rare in Cape Verde, with more incidents registered in cities than in the rural areas. However, while in urban areas most victims reported not very serious forms of sexual harassment, the type of incidents reported by victims in rural areas were more serious. In comparison with other cities in Africa, it appears that, on average, victims in Cape Verde suffered more frequently from the more serious types of sexual assault (rape and attempted rape).
6
Ownership of cars among survey respondents
23
24
25
27
28
34
45
45
56
0 20 40 60
Praia (Cape Verde)
Lusaka (Zambia)
Maputo (Mozambique)
Maseru (Lesotho)
Kampala (Uganda)
Gaborone (Botswana)
Mbabane (Swaziland)
Johannesburg (South Africa)
Windhoek (Namibia)
%
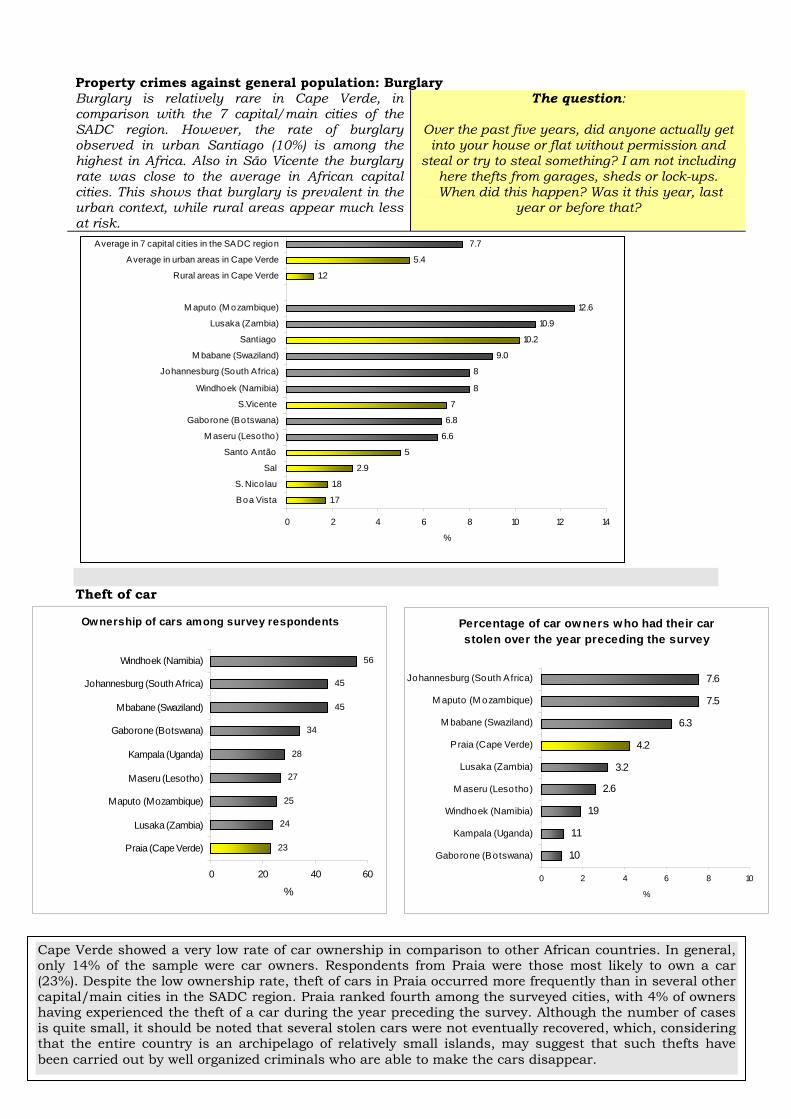
Property crimes against general population: Burglary Burglary is relatively rare in Cape Verde, in comparison with the 7 capital/main cities of the SADC region. However, the rate of burglary observed in urban Santiago (10%) is among the highest in Africa. Also in São Vicente the burglary rate was close to the average in African capital cities. This shows that burglary is prevalent in the urban context, while rural areas appear much less at risk.
The question:
Over the past five years, did anyone actually get into your house or flat without permission and
steal or try to steal something? I am not including here thefts from garages, sheds or lock-ups.
When did this happen? Was it this year, last year or before that?
1.7
1.8
2.9
5
6.6
6.8
7
8
8
9.0
10.2
10.9
12.6
1.2
5.4
7.7
0 2 4 6 8 10 12 14
Boa Vista
S. Nico lau
Sal
Santo Antão
M aseru (Lesotho)
Gaborone (Botswana)
S.Vicente
Windhoek (Namibia)
Johannesburg (South Africa)
M babane (Swaziland)
Santiago
Lusaka (Zambia)
M aputo (M ozambique)
Rural areas in Cape Verde
Average in urban areas in Cape Verde
Average in 7 capital cities in the SADC region
%
Theft of car
Percentage of car owners who had their car stolen over the year preceding the survey
1.0
1.1
1.9
2.6
3.2
4.2
6.3
7.5
7.6
0 2 4 6 8 10
Gaborone (Botswana)
Kampala (Uganda)
Windhoek (Namibia)
M aseru (Lesotho)
Lusaka (Zambia)
Praia (Cape Verde)
M babane (Swaziland)
M aputo (M ozambique)
Johannesburg (South Africa)
%
Cape Verde showed a very low rate of car ownership in comparison to other African countries. In general, only 14% of the sample were car owners. Respondents from Praia were those most likely to own a car (23%). Despite the low ownership rate, theft of cars in Praia occurred more frequently than in several other capital/main cities in the SADC region. Praia ranked fourth among the surveyed cities, with 4% of owners having experienced the theft of a car during the year preceding the survey. Although the number of cases is quite small, it should be noted that several stolen cars were not eventually recovered, which, considering that the entire country is an archipelago of relatively small islands, may suggest that such thefts have been carried out by well organized criminals who are able to make the cars disappear.
7
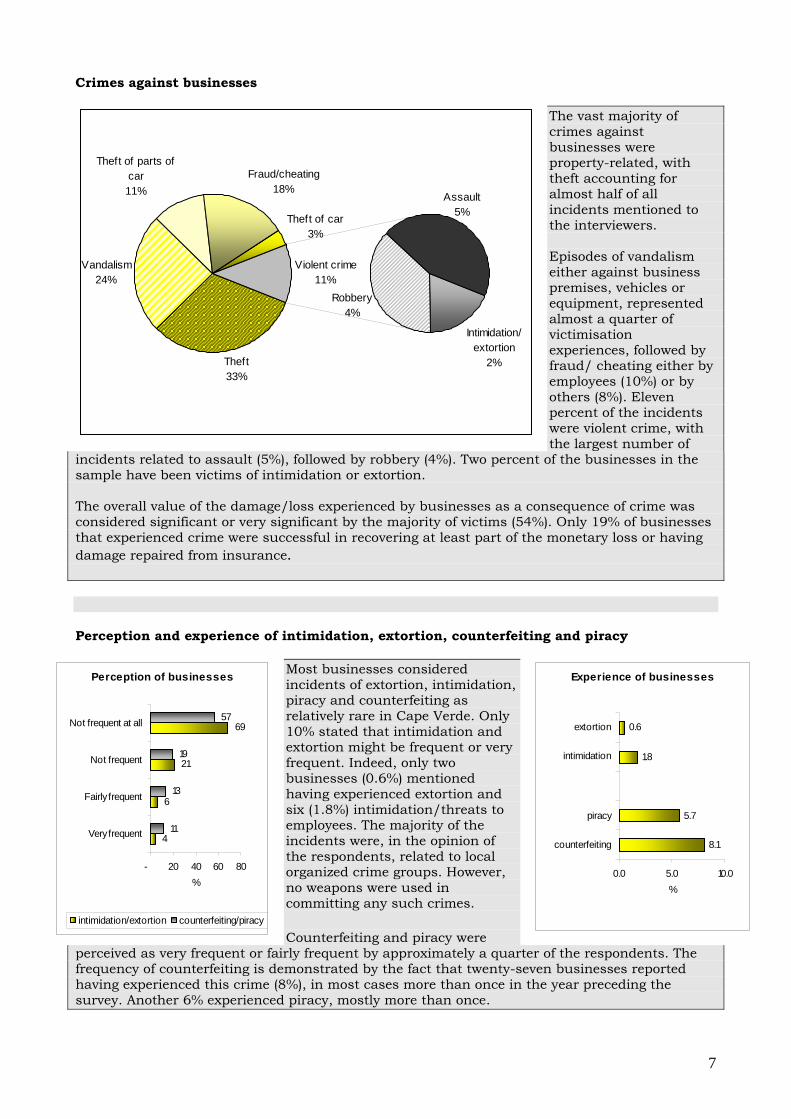
Crimes against businesses The vast majority of crimes against businesses were property-related, with theft accounting for almost half of all incidents mentioned to the interviewers. Episodes of vandalism either against business premises, vehicles or equipment, represented almost a quarter of victimisation experiences, followed by fraud/ cheating either by employees (10%) or by others (8%). Eleven percent of the incidents were violent crime, with the largest number of
incidents related to assault (5%), followed by robbery (4%). Two percent of the businesses in the sample have been victims of intimidation or extortion. The overall value of the damage/loss experienced by businesses as a consequence of crime was considered significant or very significant by the majority of victims (54%). Only 19% of businesses that experienced crime were successful in recovering at least part of the monetary loss or having damage repaired from insurance. Perception and experience of intimidation, extortion, counterfeiting and piracy
Most businesses considered incidents of extortion, intimidation, piracy and counterfeiting as relatively rare in Cape Verde. Only 10% stated that intimidation and extortion might be frequent or very frequent. Indeed, only two businesses (0.6%) mentioned having experienced extortion and six (1.8%) intimidation/threats to employees. The majority of the incidents were, in the opinion of the respondents, related to local organized crime groups. However, no weapons were used in committing any such crimes. Counterfeiting and piracy were
perceived as very frequent or fairly frequent by approximately a quarter of the respondents. The frequency of counterfeiting is demonstrated by the fact that twenty-seven businesses reported having experienced this crime (8%), in most cases more than once in the year preceding the survey. Another 6% experienced piracy, mostly more than once.
Theft33%
Vandalism24%
Theft of parts of car11%
Fraud/cheating18%
Theft of car3%
Intimidation/ extortion
2%
Robbery4%
Assault5%
Violent crime11%
Perception of businesses
4
6
21
69
11
13
19
57
- 20 40 60 80
Very frequent
Fairly frequent
Not frequent
Not frequent at all
%
intimidation/extortion counterfeiting/piracy
Experience of businesses
8.1
5.7
1.8
0.6
0.0 5.0 10.0
counterfeiting
piracy
intimidation
extortion
%
8
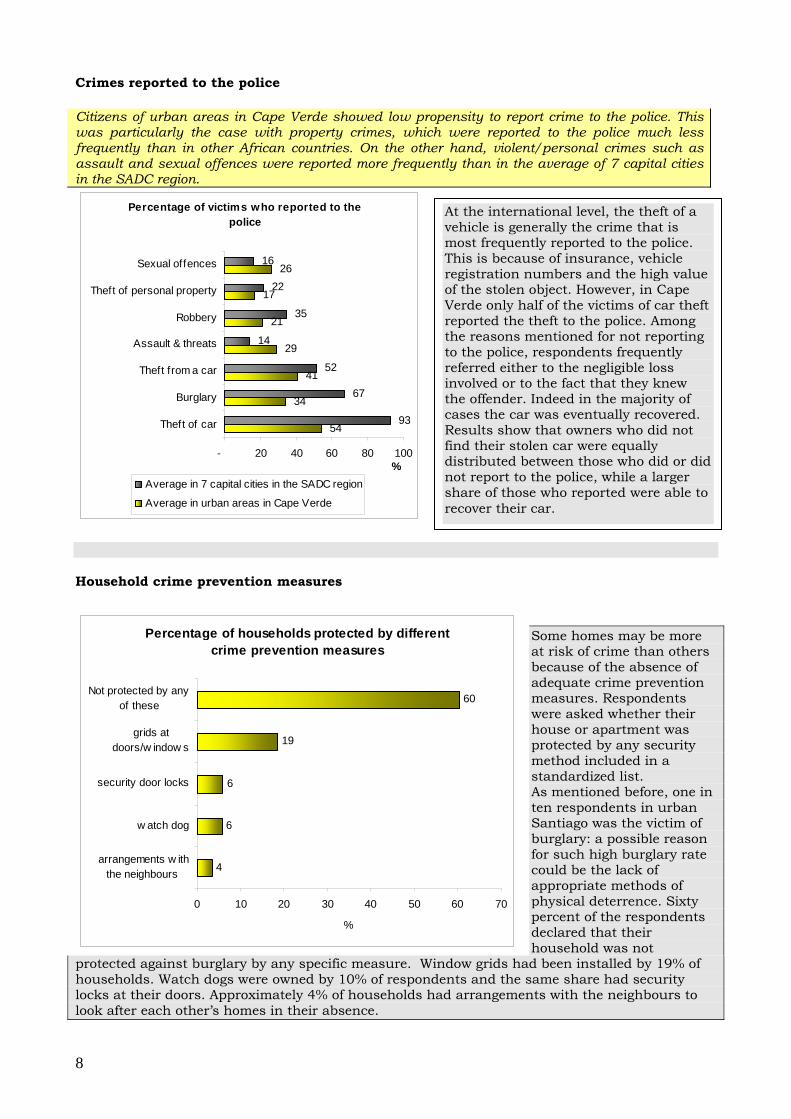
Crimes reported to the police Citizens of urban areas in Cape Verde showed low propensity to report crime to the police. This was particularly the case with property crimes, which were reported to the police much less frequently than in other African countries. On the other hand, violent/personal crimes such as assault and sexual offences were reported more frequently than in the average of 7 capital cities in the SADC region.
Percentage of victims who reported to the police
54
34
41
29
21
17
26
93
67
52
14
35
22
16
- 20 40 60 80 100
Theft of car
Burglary
Theft from a car
Assault & threats
Robbery
Theft of personal property
Sexual offences
%Average in 7 capital cities in the SADC region
Average in urban areas in Cape Verde
Household crime prevention measures
Some homes may be more at risk of crime than others because of the absence of adequate crime prevention measures. Respondents were asked whether their house or apartment was protected by any security method included in a standardized list. As mentioned before, one in ten respondents in urban Santiago was the victim of burglary: a possible reason for such high burglary rate could be the lack of appropriate methods of physical deterrence. Sixty percent of the respondents declared that their household was not
protected against burglary by any specific measure. Window grids had been installed by 19% of households. Watch dogs were owned by 10% of respondents and the same share had security locks at their doors. Approximately 4% of households had arrangements with the neighbours to look after each other’s homes in their absence.
At the international level, the theft of a vehicle is generally the crime that is most frequently reported to the police. This is because of insurance, vehicle registration numbers and the high value of the stolen object. However, in Cape Verde only half of the victims of car theft reported the theft to the police. Among the reasons mentioned for not reporting to the police, respondents frequently referred either to the negligible loss involved or to the fact that they knew the offender. Indeed in the majority of cases the car was eventually recovered. Results show that owners who did not find their stolen car were equally distributed between those who did or did not report to the police, while a larger share of those who reported were able to recover their car.
Percentage of households protected by different crime prevention measures
4
6
6
19
60
0 10 20 30 40 50 60 70
arrangements w iththe neighbours
w atch dog
security door locks
grids atdoors/w indow s
Not protected by anyof these
%
9
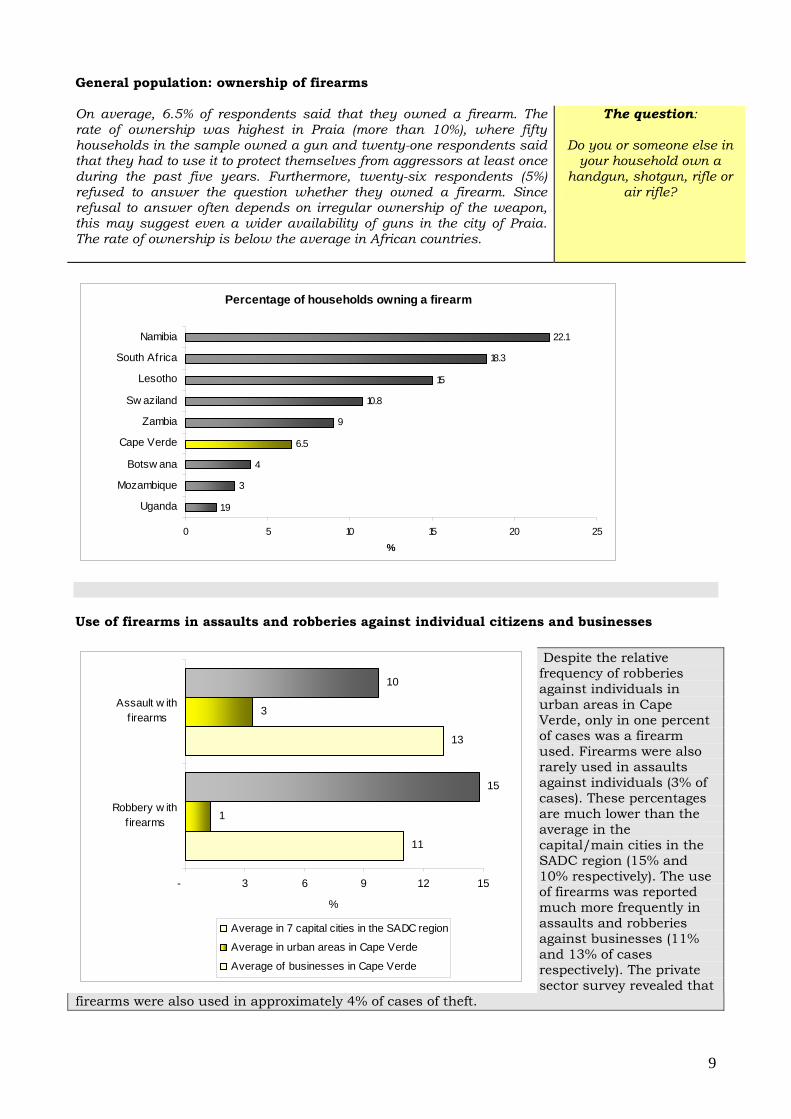
General population: ownership of firearms On average, 6.5% of respondents said that they owned a firearm. The rate of ownership was highest in Praia (more than 10%), where fifty households in the sample owned a gun and twenty-one respondents said that they had to use it to protect themselves from aggressors at least once during the past five years. Furthermore, twenty-six respondents (5%) refused to answer the question whether they owned a firearm. Since refusal to answer often depends on irregular ownership of the weapon, this may suggest even a wider availability of guns in the city of Praia. The rate of ownership is below the average in African countries.
The question:
Do you or someone else in your household own a
handgun, shotgun, rifle or air rifle?
Percentage of households owning a firearm
1.9
3
4
6.5
9
10.8
15
18.3
22.1
0 5 10 15 20 25
Uganda
Mozambique
Botsw ana
Cape Verde
Zambia
Sw aziland
Lesotho
South Africa
Namibia
%
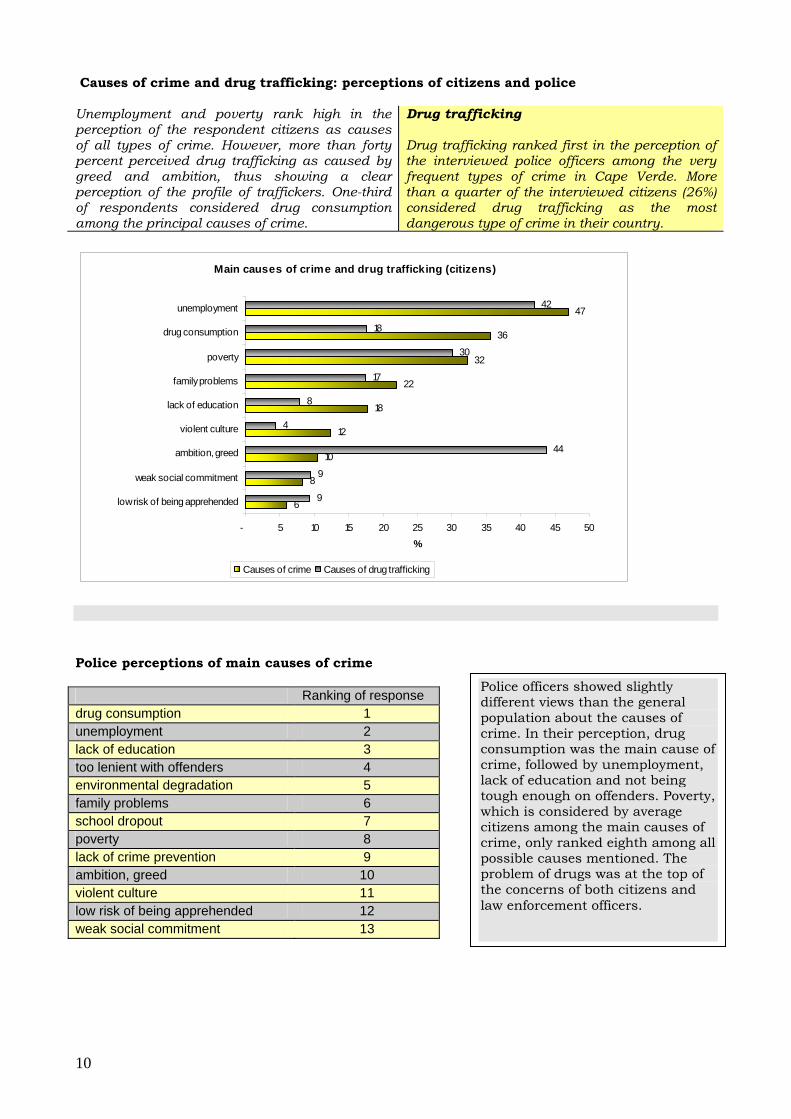
Use of firearms in assaults and robberies against individual citizens and businesses
Despite the relative frequency of robberies against individuals in urban areas in Cape Verde, only in one percent of cases was a firearm used. Firearms were also rarely used in assaults against individuals (3% of cases). These percentages are much lower than the average in the capital/main cities in the SADC region (15% and 10% respectively). The use of firearms was reported much more frequently in assaults and robberies against businesses (11% and 13% of cases respectively). The private sector survey revealed that
firearms were also used in approximately 4% of cases of theft.
11
13
1
3
15
10
- 3 6 9 12 15
Robbery w ithfirearms
Assault w ithfirearms
%
Average in 7 capital cities in the SADC region
Average in urban areas in Cape Verde
Average of businesses in Cape Verde
10
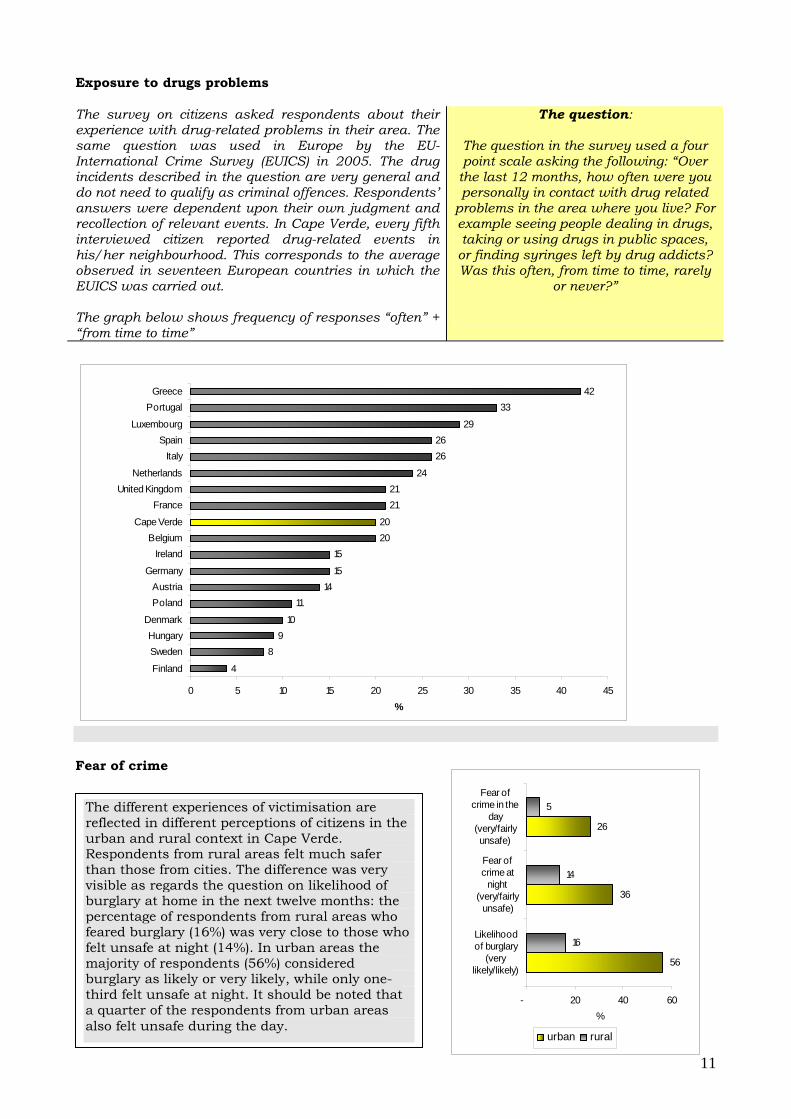
Causes of crime and drug trafficking: perceptions of citizens and police Unemployment and poverty rank high in the perception of the respondent citizens as causes of all types of crime. However, more than forty percent perceived drug trafficking as caused by greed and ambition, thus showing a clear perception of the profile of traffickers. One-third of respondents considered drug consumption among the principal causes of crime.
Drug trafficking Drug trafficking ranked first in the perception of the interviewed police officers among the very frequent types of crime in Cape Verde. More than a quarter of the interviewed citizens (26%) considered drug trafficking as the most dangerous type of crime in their country.
Main causes of crime and drug trafficking (citizens)
6
8
10
12
18
22
32
36
47
9
9
44
4
8
17
30
18
42
- 5 10 15 20 25 30 35 40 45 50
low risk of being apprehended
weak social commitment
ambition, greed
violent culture
lack of education
family problems
poverty
drug consumption
unemployment
%
Causes of crime Causes of drug trafficking
Police perceptions of main causes of crime Ranking of response drug consumption 1 unemployment 2 lack of education 3 too lenient with offenders 4 environmental degradation 5 family problems 6 school dropout 7 poverty 8 lack of crime prevention 9 ambition, greed 10 violent culture 11 low risk of being apprehended 12 weak social commitment 13
Police officers showed slightly different views than the general population about the causes of crime. In their perception, drug consumption was the main cause of crime, followed by unemployment, lack of education and not being tough enough on offenders. Poverty, which is considered by average citizens among the main causes of crime, only ranked eighth among all possible causes mentioned. The problem of drugs was at the top of the concerns of both citizens and law enforcement officers.
11
Exposure to drugs problems The survey on citizens asked respondents about their experience with drug-related problems in their area. The same question was used in Europe by the EU-International Crime Survey (EUICS) in 2005. The drug incidents described in the question are very general and do not need to qualify as criminal offences. Respondents’ answers were dependent upon their own judgment and recollection of relevant events. In Cape Verde, every fifth interviewed citizen reported drug-related events in his/her neighbourhood. This corresponds to the average observed in seventeen European countries in which the EUICS was carried out. The graph below shows frequency of responses “often” + “from time to time”
The question:
The question in the survey used a four point scale asking the following: “Over
the last 12 months, how often were you personally in contact with drug related
problems in the area where you live? For example seeing people dealing in drugs, taking or using drugs in public spaces,
or finding syringes left by drug addicts? Was this often, from time to time, rarely
or never?”
4
89
10
1114
15
152020
2121
24
2626
29
3342
0 5 10 15 20 25 30 35 40 45
Finland
SwedenHungary
Denmark
PolandAustria
Germany
IrelandBelgium
Cape Verde
FranceUnited Kingdom
Netherlands
ItalySpain
Luxembourg
PortugalGreece
%
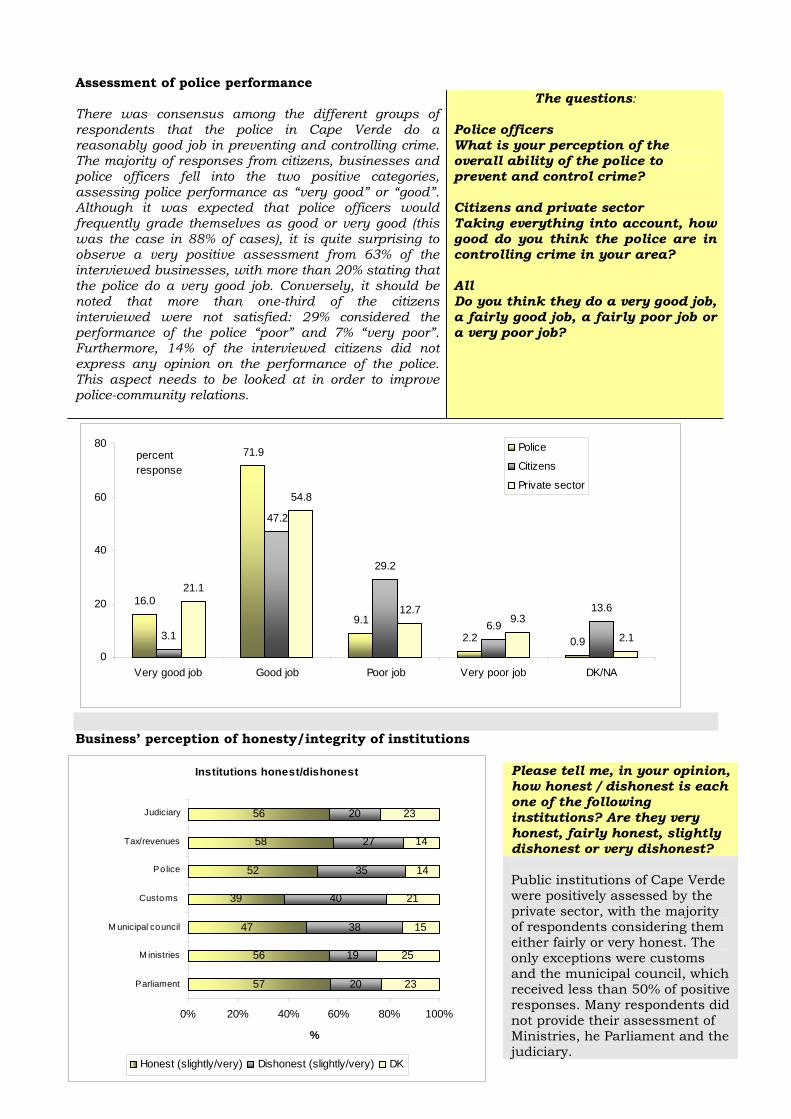
Fear of crime
56
36
26
16
14
5
- 20 40 60
Likelihoodof burglary
(verylikely/likely)
Fear ofcrime at
night(very/fairly
unsafe)
Fear ofcrime in the
day(very/fairlyunsafe)
%
urban rural
The different experiences of victimisation are reflected in different perceptions of citizens in the urban and rural context in Cape Verde. Respondents from rural areas felt much safer than those from cities. The difference was very visible as regards the question on likelihood of burglary at home in the next twelve months: the percentage of respondents from rural areas who feared burglary (16%) was very close to those who felt unsafe at night (14%). In urban areas the majority of respondents (56%) considered burglary as likely or very likely, while only one-third felt unsafe at night. It should be noted that a quarter of the respondents from urban areas also felt unsafe during the day.
12
Institutions honest/dishonest
57
56
47
39
52
58
56
20
19
38
40
35
27
20
23
25
15
21
14
14
23
0% 20% 40% 60% 80% 100%
Parliament
M inistries
M unicipal council
Customs
Police
Tax/revenues
Judiciary
%
Honest (slightly/very) Dishonest (slightly/very) DK
Assessment of police performance There was consensus among the different groups of respondents that the police in Cape Verde do a reasonably good job in preventing and controlling crime. The majority of responses from citizens, businesses and police officers fell into the two positive categories, assessing police performance as “very good” or “good”. Although it was expected that police officers would frequently grade themselves as good or very good (this was the case in 88% of cases), it is quite surprising to observe a very positive assessment from 63% of the interviewed businesses, with more than 20% stating that the police do a very good job. Conversely, it should be noted that more than one-third of the citizens interviewed were not satisfied: 29% considered the performance of the police “poor” and 7% “very poor”. Furthermore, 14% of the interviewed citizens did not express any opinion on the performance of the police. This aspect needs to be looked at in order to improve police-community relations.
The questions:
Police officers What is your perception of the overall ability of the police to prevent and control crime? Citizens and private sector Taking everything into account, how good do you think the police are in controlling crime in your area? All Do you think they do a very good job, a fairly good job, a fairly poor job or a very poor job?
16.0
71.9
9.12.2 0.93.1
47.2
29.2
6.913.6
21.1
54.8
12.79.3
2.1
0
20
40
60
80
Very good job Good job Poor job Very poor job DK/NA
Police
Citizens
Private sector
percentresponse
Business’ perception of honesty/integrity of institutions
Please tell me, in your opinion, how honest / dishonest is each one of the following institutions? Are they very honest, fairly honest, slightly dishonest or very dishonest? Public institutions of Cape Verde were positively assessed by the private sector, with the majority of respondents considering them either fairly or very honest. The only exceptions were customs and the municipal council, which received less than 50% of positive responses. Many respondents did not provide their assessment of Ministries, he Parliament and the judiciary.
13
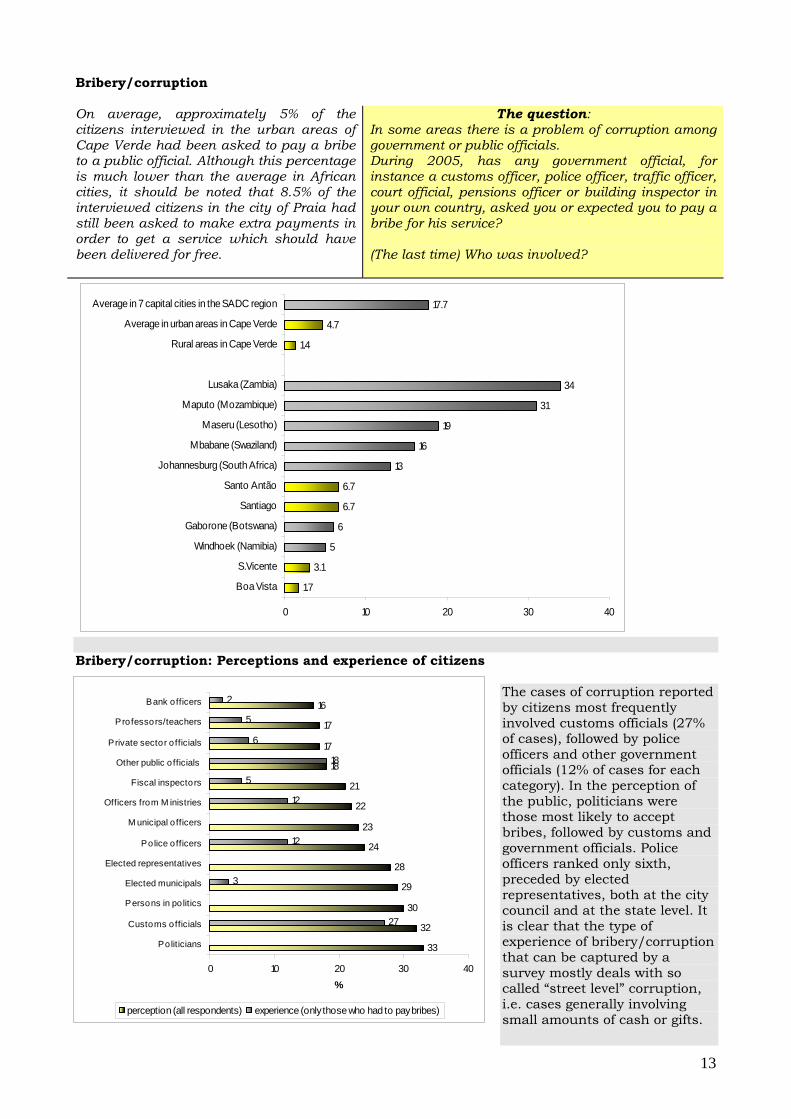
Bribery/corruption On average, approximately 5% of the citizens interviewed in the urban areas of Cape Verde had been asked to pay a bribe to a public official. Although this percentage is much lower than the average in African cities, it should be noted that 8.5% of the interviewed citizens in the city of Praia had still been asked to make extra payments in order to get a service which should have been delivered for free.
The question: In some areas there is a problem of corruption among government or public officials. During 2005, has any government official, for instance a customs officer, police officer, traffic officer, court official, pensions officer or building inspector in your own country, asked you or expected you to pay a bribe for his service? (The last time) Who was involved?
1.7
3.1
5
6
6.7
6.7
13
16
19
31
34
1.4
4.7
17.7
0 10 20 30 40
Boa Vista
S.Vicente
Windhoek (Namibia)
Gaborone (Botswana)
Santiago
Santo Antão
Johannesburg (South Africa)
Mbabane (Swaziland)
Maseru (Lesotho)
Maputo (Mozambique)
Lusaka (Zambia)
Rural areas in Cape Verde
Average in urban areas in Cape Verde
Average in 7 capital cities in the SADC region
Bribery/corruption: Perceptions and experience of citizens
The cases of corruption reported by citizens most frequently involved customs officials (27% of cases), followed by police officers and other government officials (12% of cases for each category). In the perception of the public, politicians were those most likely to accept bribes, followed by customs and government officials. Police officers ranked only sixth, preceded by elected representatives, both at the city council and at the state level. It is clear that the type of experience of bribery/corruption that can be captured by a survey mostly deals with so called “street level” corruption, i.e. cases generally involving small amounts of cash or gifts.
33
32
30
29
28
24
23
22
21
18
17
17
16
27
3
12
12
5
18
6
5
2
0 10 20 30 40
Politicians
Customs officials
Persons in po litics
Elected municipals
Elected representatives
Police officers
M unicipal o fficers
Officers from M inistries
Fiscal inspectors
Other public o fficials
Private sector o fficials
Professors/teachers
Bank officers
%
perception (all respondents) experience (only those who had to pay bribes)
14
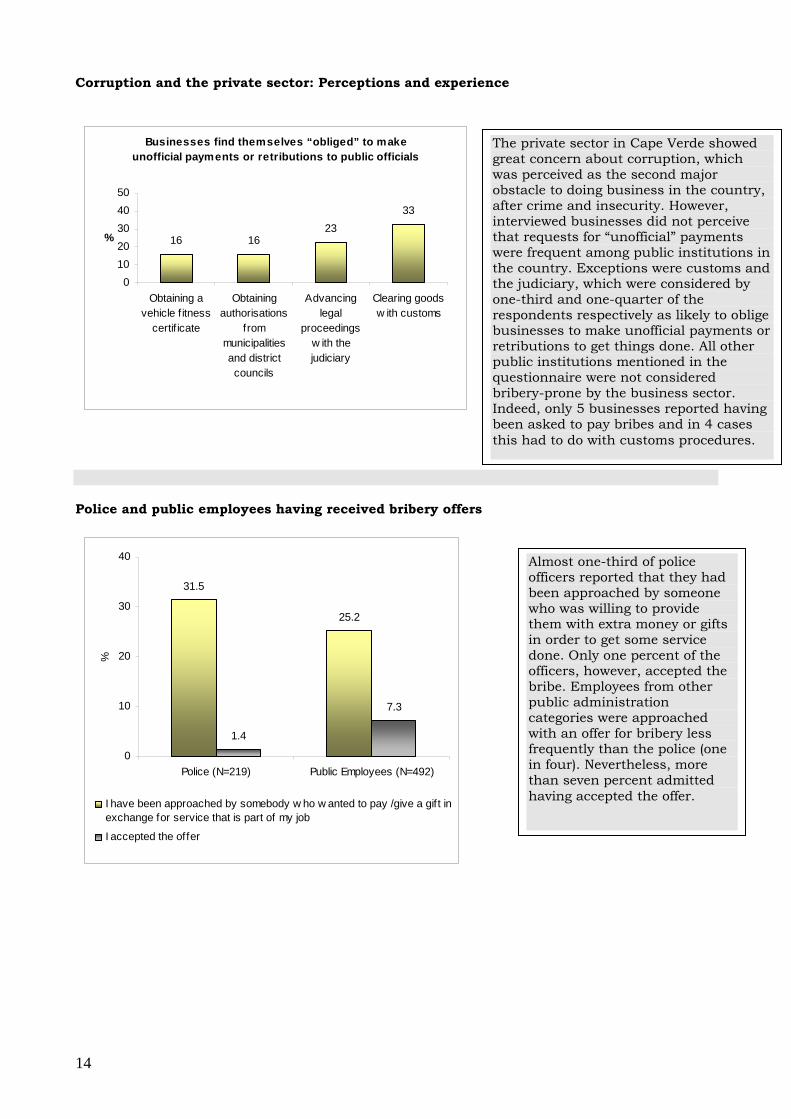
Corruption and the private sector: Perceptions and experience
Businesses find themselves “obliged” to make unofficial payments or retributions to public officials
16 1623
33
01020304050
Obtaining avehicle f itness
certif icate
Obtainingauthorisations
frommunicipalitiesand districtcouncils
Advancinglegal
proceedingsw ith thejudiciary
Clearing goodsw ith customs
%
Police and public employees having received bribery offers
31.5
25.2
1.4
7.3
0
10
20
30
40
Police (N=219) Public Employees (N=492)
%
I have been approached by somebody w ho w anted to pay /give a gift inexchange for service that is part of my job
I accepted the offer
Almost one-third of police officers reported that they had been approached by someone who was willing to provide them with extra money or gifts in order to get some service done. Only one percent of the officers, however, accepted the bribe. Employees from other public administration categories were approached with an offer for bribery less frequently than the police (one in four). Nevertheless, more than seven percent admitted having accepted the offer.
The private sector in Cape Verde showed great concern about corruption, which was perceived as the second major obstacle to doing business in the country, after crime and insecurity. However, interviewed businesses did not perceive that requests for “unofficial” payments were frequent among public institutions in the country. Exceptions were customs and the judiciary, which were considered by one-third and one-quarter of the respondents respectively as likely to oblige businesses to make unofficial payments or retributions to get things done. All other public institutions mentioned in the questionnaire were not considered bribery-prone by the business sector. Indeed, only 5 businesses reported having been asked to pay bribes and in 4 cases this had to do with customs procedures.
15
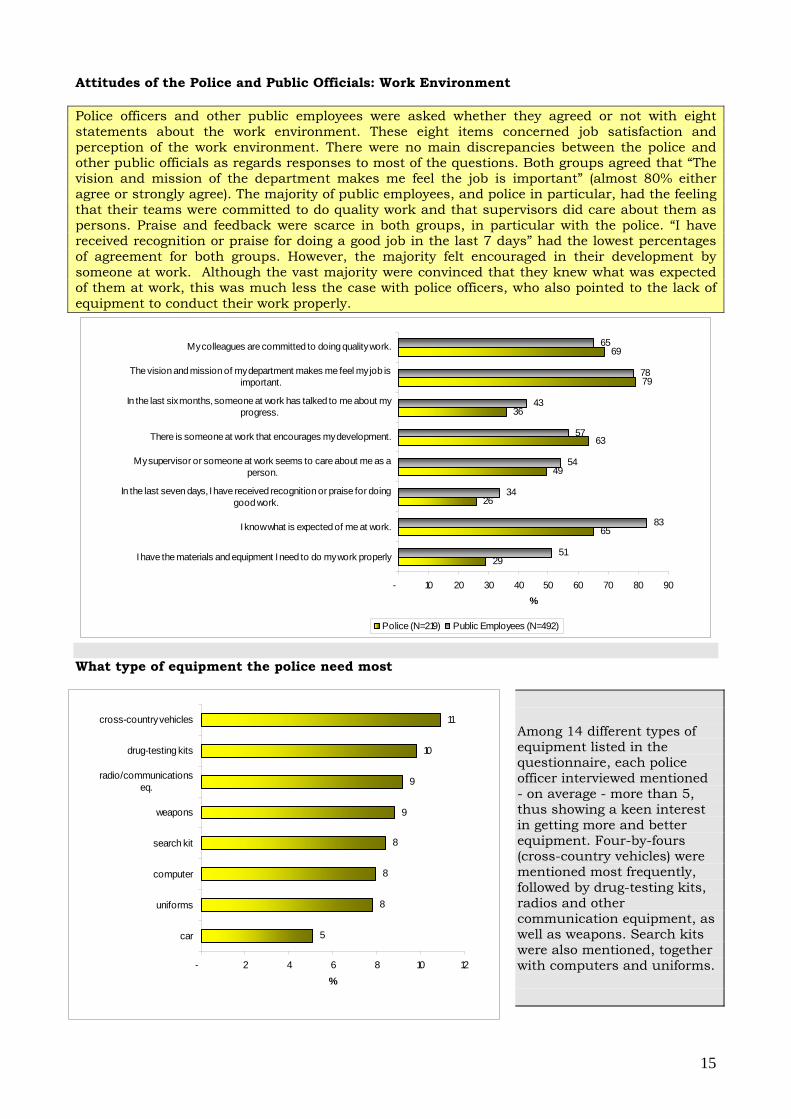
Attitudes of the Police and Public Officials: Work Environment Police officers and other public employees were asked whether they agreed or not with eight statements about the work environment. These eight items concerned job satisfaction and perception of the work environment. There were no main discrepancies between the police and other public officials as regards responses to most of the questions. Both groups agreed that “The vision and mission of the department makes me feel the job is important” (almost 80% either agree or strongly agree). The majority of public employees, and police in particular, had the feeling that their teams were committed to do quality work and that supervisors did care about them as persons. Praise and feedback were scarce in both groups, in particular with the police. “I have received recognition or praise for doing a good job in the last 7 days” had the lowest percentages of agreement for both groups. However, the majority felt encouraged in their development by someone at work. Although the vast majority were convinced that they knew what was expected of them at work, this was much less the case with police officers, who also pointed to the lack of equipment to conduct their work properly.
29
65
26
49
63
36
79
69
51
83
34
54
57
43
78
65
- 10 20 30 40 50 60 70 80 90
I have the materials and equipment I need to do my work properly
I know what is expected of me at work.
In the last seven days, I have received recognition or praise for doinggood work.
My supervisor or someone at work seems to care about me as aperson.
There is someone at work that encourages my development.
In the last six months, someone at work has talked to me about myprogress.
The vision and mission of my department makes me feel my job isimportant.
My colleagues are committed to doing quality work.
%
Police (N=219) Public Employees (N=492)
What type of equipment the police need most
Among 14 different types of equipment listed in the questionnaire, each police officer interviewed mentioned - on average - more than 5, thus showing a keen interest in getting more and better equipment. Four-by-fours (cross-country vehicles) were mentioned most frequently, followed by drug-testing kits, radios and other communication equipment, as well as weapons. Search kits were also mentioned, together with computers and uniforms.
5
8
8
8
9
9
10
11
- 2 4 6 8 10 12
car
uniforms
computer
search kit
weapons
radio/communicationseq.
drug-testing kits
cross-country vehicles
%
16
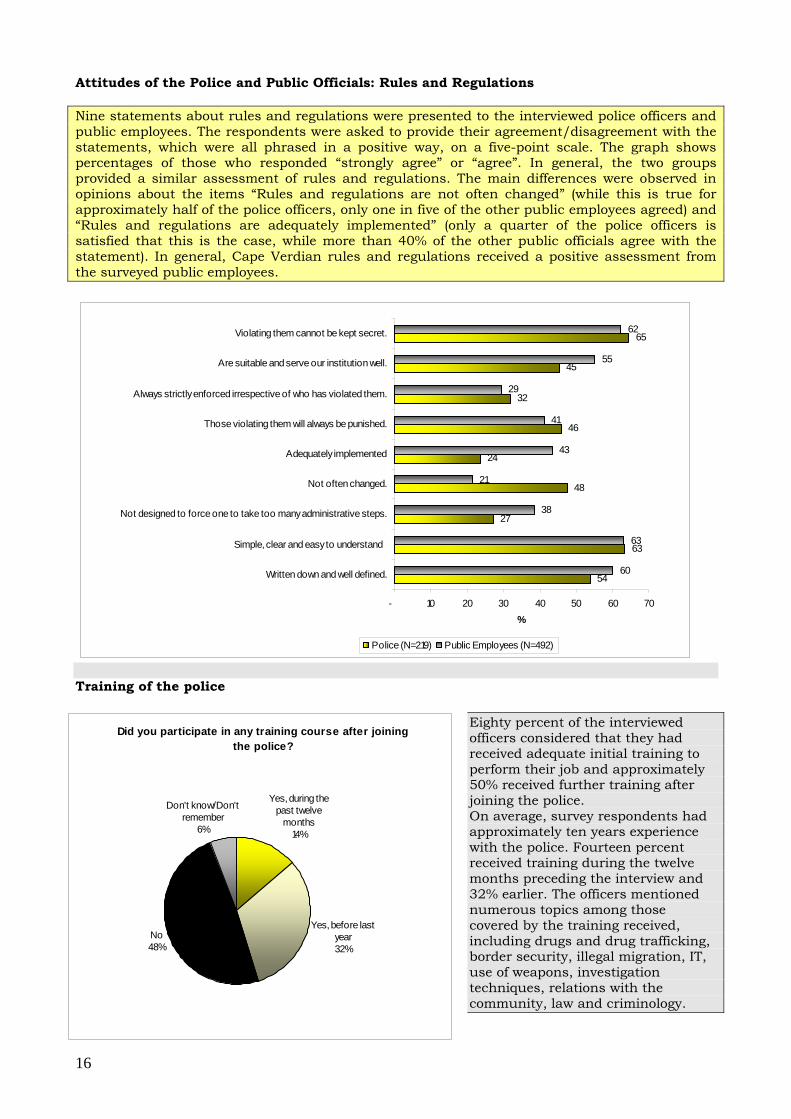
Attitudes of the Police and Public Officials: Rules and Regulations Nine statements about rules and regulations were presented to the interviewed police officers and public employees. The respondents were asked to provide their agreement/disagreement with the statements, which were all phrased in a positive way, on a five-point scale. The graph shows percentages of those who responded “strongly agree” or “agree”. In general, the two groups provided a similar assessment of rules and regulations. The main differences were observed in opinions about the items “Rules and regulations are not often changed” (while this is true for approximately half of the police officers, only one in five of the other public employees agreed) and “Rules and regulations are adequately implemented” (only a quarter of the police officers is satisfied that this is the case, while more than 40% of the other public officials agree with the statement). In general, Cape Verdian rules and regulations received a positive assessment from the surveyed public employees.
54
63
27
48
24
46
32
45
65
60
63
38
21
43
41
29
55
62
- 10 20 30 40 50 60 70
Written down and well defined.
Simple, clear and easy to understand
Not designed to force one to take too many administrative steps.
Not often changed.
Adequately implemented
Those violating them will always be punished.
Always strictly enforced irrespective of who has violated them.
Are suitable and serve our institution well.
Violating them cannot be kept secret.
%
Police (N=219) Public Employees (N=492)
Training of the police
Eighty percent of the interviewed officers considered that they had received adequate initial training to perform their job and approximately 50% received further training after joining the police. On average, survey respondents had approximately ten years experience with the police. Fourteen percent received training during the twelve months preceding the interview and 32% earlier. The officers mentioned numerous topics among those covered by the training received, including drugs and drug trafficking, border security, illegal migration, IT, use of weapons, investigation techniques, relations with the community, law and criminology.
Did you participate in any training course after joining the police?
Yes, during the past twelve
months14%
Yes, before last year32%
No48%
Don't know/Don't remember
6%
17
Conclusions • Four surveys carried out in Cape Verde reveal that crime and victimization are relatively rare in comparison to other African countries. Only in Praia are crime levels higher than those observed in the capital cities of Botswana (Gaborone) and Lesotho (Maseru).
• There is significant difference between rural and urban areas, with most crime occurring in urban areas. Furthermore, the nature of urban crime appears more violent than that occurring in the rural parts of the country. Special attention should be paid to the prevention of violent property crime in urban areas.
• Women are not exposed to very high risks. However, some of the incidents reported to the survey appeared very serious and had not been reported to the police.
• Reporting rates, with the exception of sexual offences, are much lower than in other African countries and among the lowest in the world.
• Cape Verdian businesses perceive crime and insecurity as obstacles. Citizens of urban areas fear crime as an issue that pervades their life, day and night. The large majority expect to be victim of burglary in the next twelve months. Physical measures for prevention and deterrence are scarce.
• One citizen in five has been exposed to drugs problems over the past year. A quarter of the respondents consider drug trafficking as the most dangerous type of crime in their country. Forty percent think that drug trafficking is caused by greed and ambition, while drug consumption is perceived by one-third of citizens as a main cause of crime in general.
• Theft is the most frequent type of crime experienced by citizens and businesses. Burglary rates in urban Santiago were among the highest in Africa. Businesses very frequently experience episodes of vandalism and fraud.
• Despite the low availability of cars in the country, theft of cars in Praia occurs more frequently than in some African capitals.
• The majority of businesses having experienced a crime consider the consequent damage/loss as major. However, not many businesses were insured.
• The level of corruption is lower than in other African countries.
• The police are given an overall positive assessment by citizens and businesses. However, there is still much to do in order to improve police-community relations.
• Police officers may need more training opportunities and better equipment in order to improve their job satisfaction, which is likely to reflect into better performance.
• Rules and regulations are perceived to be well written by police officers and public employees.
• The public institution perceived as most corrupt is customs.
• In the perception of general public and police officers, the main causes of crime are unemployment and drug consumption.
• Public employees show some dissatisfaction with their job and have a reasonable level of awareness of the existence of nepotism and corruption in the public administration. Lack of transparency and possible partiality in promotions and recognitions are perceived as particular problems.
18
Technical details
Corruption survey: Private Sector and Public Employees Activities within the project JIMLOC (anti-corruption) Surveys on Crime Victims and Police Officers Activities within the project ANTRAF (fight against illicit trafficking and organized crime) INSTITUTIONAL ARRANGEMENTS Coordination/supervision
Comissão de Coordenação de Combate à Droga (CCCD) – ENLCDCC Steering Committee
Partnership
United Nations Office on Drugs and Crime (UNODC) – Project CAVE-INTECRIN UNODC International Consultant – Dr. Gregório Firminino UNODC - Dr. Anna Alvazzi Del Frate (DPA/PARB)
Technical team/Fieldwork
ANTRAF Maria de Lurdes Fernandes Lopes, Demographer, Study Co-ordinator Elisio Semedo, Sociologist Elsa Fontes, Sociologist Paulo Veríssimo, Sociologist, Study Administrator José Gil Monteiro, Engeneer, IT
JIMLOC Afrosondagem: Deolinda Reis, Crisanto Barros, Francisco Rodrigues, José Semedo
METHODOLOGY Geographical coverage/domains, Target population, sample size and interviewing methods
Citizens of Cape Verde (aged 16 and above) from the islands of Santiago (urban area of Praia and rest of Santiago), Sal, Boavista, S. Vicente, Santo Antão and S. Nicolau – 1,845 respondents
o Face-to-face interview with one selected respondent in the household
Officers of Polícia Nacional, Polícia Judiciária and Polícia Marítima from the police domains of Calheta, Santa Catarina, Santa Cruz, Tarrafal, S. Domingos, S. Nicolau, Sal, S. Vicente, Praia, Boavista, Santo Antão – 300 respondents
o Face-to-face interview o Self-administered questionnaire
Public employees from the islands of Santo Antão, São Vicente, São Nicolau, Sal, Maio and Santiago – 492 respondents
o Mix face-to-face interview and self-administered questionnaire
Private sector from the urban area of Praia, rest of Santiago, São Vicente, Sal and Maio - 332 respondents
o Face-to-face interview
Dates of fieldwork June/October 2006