sintering kinetics of crystallizing glass particles. a … · sintering kinetics of crystallizing...
TRANSCRIPT

SINTERING KINETICS OF CRYSTALLIZING GLASS PARTICLES. A REVIEW
Miguel Oscar Prado Centro Atómico Bariloche Comisión Nacional de Energía Atómica Av. Bustillo, km 9.5 S.C. de Bariloche 8400 - Argentina
Eduardo Bellini Ferreira and Edgar Dutra Zanotto Laboratório de Materiais Vítreos Universidade Federal de São Carlos Av. Washington Luis, km 235 São Carlos, SP 13565-905 - Brazil www.lamav.ufscar.br
ABSTRACT
We critically review and discuss the main glass sintering models: Frenkel’s, Mackenzie-Shuttleworth’s, Scherer’s and the recently developed Clusters model, and focus on the problem of sintering with concurrent crystallization. The Clusters model is tested for compacts of spherical soda-lime-silica (SLS) glass particles, having a narrow size distribution, which easily crystallize. Simulations for isothermal and non-isothermal sintering with simultaneous crystallization are compared with experimental data. Physical and processing parameters such as viscosity, surface tension, crystal growth rate, number of nucleation sites, particle size distribution and particle packing are considered in the model. The evolution of the relative density during sintering and the pore size distribution in the final stages of sintering are reasonably predicted by the model. All the results are discussed taking into account the assumptions made and other complicating factors, such as compositional shifts due to crystallization, temperature gradients and degassing. Finally, we discuss the physical and processing parameters that determine whether sintering is favorable over crystallization or not. We demonstrate that the Clusters model provides a powerful simulation tool to design processing conditions for efficient densification of devitrifying glass compacts with any particle size distribution.
INTRODUCTION
The physical processes that control the densification kinetics of porous glass bodies by reducing their surface area are well-known. The decrease of the surface energy is the driving force, while viscous flow is the kinetic path through which the surface area is minimized. In some cases, however, a competing process of crystallization of the glass particles occurs concomitantly. The crystallized portions of the particle surfaces do not flow, slowing down the sintering kinetics. The interplay between the kinetics of crystallization and sintering can result in a variety of microstructures with different porosities and crystallized fractions. Crystallization is a desirable effect only if the purpose is to produce sintered glass-ceramics, in which case controlled crystallization is necessary; otherwise, it is a source of difficulty.
Different models have been developed to account for the kinetics of sintering. The Frenkel (F) model of sintering [1], which describes the early stages of sintering of spherical and monodispersed vitreous particles, allows one to calculate the shrinkage rate of two equal particles whose centers approximate each other. The energy released by the decrease of surface area is equalized to that for viscous flow, which is responsible for the mass transport that produces densification. Frenkel model is valid roughly within the first 10% of linear shrinkage. For compacts beginning with a relative “green” density of 0.6, 10% of linear shrinkage leads to a relative density of 0.8. (The relative density is defined as the density of the body divided by the

density of the pore free, solid material - glass or crystal. Unless specified, throughout this text we use the term density referring to the relative density.)
Mackenzie and Shuttleworth (MS) [2] developed a model to explain the final sintering steps of a matrix with spherical monodispersed pores. This model applies to relative densities higher than 0.9. Thus there is a gap between the densities 0.8 and 0.9 to which none of the above models reach. This gap is much larger when the initial density of the compact is about 0.15, as in gel-derived materials. This problem was analyzed by Scherer [3], who considered a geometric array of sintering particles that mimicked the structure of dry gels. Scherer’s assumptions were similar to those of Frenkel: the energy for viscous flow was supposed to be equal to the energy change resulting from the reduction in surface area. He succeeded in describing the sintering of compacts from a very low relative density, 0.15, up to 0.94. As this model also applies to the densification of bodies having high green densities (even for particle arrangements that are unlike those of dry-gels), its results are virtually insensitive to geometric features. For instance, the results of Scherer and Frenkel models almost coincide for the first 10% of linear shrinkage. The Scherer model was successfully applied to the sintering of pure SiO2 preforms produced by flame hydrolysis of SiCl4 having a pore size distribution. In this case, the pore size distribution data was required for the calculations [4,5].
The Clusters model [6], which allows the F and MS regimes to occur simultaneously (for clusters of different particle sizes), was later developed to describe sintering of compacts having any particle size distribution. This model considers the sample shrinkage as the sum of the partial shrinkage of several clusters, each consisting of equally sized particles and each showing an independent F or MS behavior. The overall set of clusters mimics the real particle size distribution of the specimen.
As a result of these ideas, three sintering stages occur in a compact: a pure “Frenkel” first stage (when all clusters are in the F regime), followed by a mixed "Frenkel/Mackenzie-Shuttleworth" stage, and a third pure "Mackenzie-Shuttleworth" step (when all clusters are in the MS regime). The concept of “neck forming ability - ξr”, is introduced to account for the formation of necks among particles with different sizes, thus relaxing the assumption of clustering.
In general, the data necessary to calculate the sintering kinetics of non-devitrifying glasses are: viscosity vs. temperature, glass-vapor surface energy, particle or pore size and thermal history. The Clusters model allows for a particle size distribution. If the particles are not spherical, an (empirical) shape factor is also needed. The Clusters model also allows one to introduce the number of necks that each particle forms with its neighbors. If there is simultaneous crystallization or pre-existing solid impurities (or crystals) on the glass particles surface, not all particle-particle contacts are available for viscous flow [7-9]. In this case one can also take into consideration the number of crystallization sites and the crystal growth rates as a function of temperature. Finally, when all particle size clusters are in the MS regime, the Clusters model has the additional advantage of yielding the pore size distribution.
It is common practice in modeling glass sintering to fit measured to theoretical density using viscosity as a free parameter, and then compare the viscosity thus obtained with measured data. When this procedure is used, it must be kept in mind that the fitted viscosity may confound with additional effects on the sintering kinetics, such as a slowing down of the densification rate due to surface crystallization or an increase in this densification rate caused by sharp edges or particles having shape factor greater than 1 (e.g., for jagged powders). To avoid such problems, in this work we use the experimental viscosity curve as an input parameter.
If crystallization occurs during sintering, viscous flow is significantly hindered and the sintering rate decreases. When all particle surfaces crystallize, sintering (by viscous flow) ceases and a fully or partially crystallized porous body is obtained [7,10]. However, concurrent sintering and crystallization have a significant technological importance, since various glass-ceramic products are made by viscous sintering followed by controlled crystallization [11].
The kinetics of homogeneous or heterogeneous crystallization is well described by the Johnson-Mehl-Avrami-Kolmogorov (JMAK) equation of phase transformations [12]. To calculate the surface fraction transformed on a given thermal path, one needs to know the density of nucleation sites, Ns (for surface crystallization), the crystal growth rate, U(T), and the crystal shape for each crystalline phase.
A few papers have focused on the complex issues of concurrent sintering and crystallization, e.g., Uhlmann et al. [13], Zarzycky et al. [14] and Boccaccini et al. [15]. However, all these papers dealt with the conditions to avoid crystallization before sintering. Scherer [16] studied the effect of solid inclusions on the compact shrinkage and briefly discussed the effects of crystallization. Müller et al. [17], Gutzow et al. [18] and the present work deal with sintering with simultaneous crystallization. The additional effect of finite particle size on the crystallization kinetics was studied by Weinberg [19].
Using the proposal of Müller et al. [17], the Clusters model is extended to describe the concurrence of sintering and surface crystallization in isothermal and non-isothermal experiments [8,9]. The model as such considers the effect of the surface crystallization on the sintering rate, an approach that differs from that of Uhlmann et al. [13], who considered volume crystallization, and treated sintering and crystallization as independent processes. The Clusters model also predicts the sintering kinetics and pore size distribution of compacts of glass particles having a partially crystallized surface at the beginning of sintering [7]. In real systems, a pre-existing crystallized surface fraction or solid impurities on the particles surface strongly affect the sintering kinetics.
Next, we will summarize the governing models, describe relevant experiments and discuss several results involving the Clusters model. THE MODELS The Frenkel model [1]
The Frenkel model offers a description of the onset of isotropic sintering of monodispersed spherical particles. After a sintering time t, the linear shrinkage (∆L) relative to the sample original length, L0, is given by Eq. (1a).
tr)T(8
3L
L0 η
γ=
∆
(1a)
where η(T) is the temperature-dependent shear viscosity, γ is the glass-vapor surface energy (whose temperature dependence is very weak), and r is the initial particle radius.
To describe the density change during sintering Eq. (1b) is commonly used. In that equation, ρ0 is the initial green density of the compact and ρg is the actual density of the glass.
Deviations from Eq. (1a) are found when the particles are jagged [20]. To account for the effect of particle shape on the sintering kinetics, an empirical constant, denominated shape factor,

3
g
0r)T(8
t31)t(−
ηγ
−ρρ
=ρ (1b)
kS, is normally used to fit the measurements. The ks values used in the literature vary from 1.8 to 3. Nevertheless, when one compares the sintering kinetics of spherical particles with that of irregular particles (such as crushed particles) having the same size distribution, not only shapes are being taken into account, but also the particle packing, that is different for different shapes. Thus, the real effect of the particles shape on the sintering kinetics deserves further attention.
Frenkel equation, Eq. (1a), is actually derived for a linear arrangement of particles. In passing to volume shrinkage, one can use Eq. (1b). This passage assumes isotropic sintering behavior in three spatial coordinates, which is equivalent to consider a simple cubic array of particles. Thus, each particle should have six neighbors and, therefore, develop six sintering necks in the process. However, experimental data for an array of spherical glass particles having a narrow size distribution shows that a distribution of necks per particle (between 3 and 8) arises and that the average is 5 [7]. This distribution varies for different systems and should, therefore, be tested case-by-case.
The Mackenzie-Shuttleworth model [2]
For higher relative densities (ρ > 0.9), when the pores are spherical and isolated in the glass, the Mackenzie-Shuttleworth model [2] gives the following densification rate:
)1()T(a2
3dtd
oρ−
ηγ
=ρ (2a)
where a0 is the initial radius of the spherical pores. Equation (2a) is presented here in a simplified form that allows for a simple mathematical treatment [21]. Actually, we approximated the pore radius, a(t), by the constant a0, while the pore number remains fixed. This approximation slightly underestimates the actual sintering kinetics in the latest stages.
The original MS kinetics, without approximations, is expressed as [22]:
)t()t(adt)t(ad
ργ
= (2b)
Although the initial particle boundaries have vanished by the time the MS stage is reached,
the pore size distribution is inherited from the initial particle size distribution. On a laboratory time scale, sintering is accomplished somewhat above the glass transition
temperature, Tg. In this range of temperatures, the viscosity η(T) is normally described by the Vogel-Fulcher-Tamman (VFT) equation [23]:
)TT(RE
o
v
e)T( −∞η=η (3)

where R is the gas constant, To is an empirical constant, Ev an apparent activation energy associated to molecular transport by viscous flow, and η∞ the viscosity at an “infinite” temperature. In this work, we use measured values of viscosity as an input parameter in the simulations.
The surface energy can be estimated from the glass composition. The other relevant parameters were measured.
The Scherer model
Scherer’s model [3] uses a basic cell pictured as a cubic array of intersecting cylinders, which describes low-density microstructures such as those of dry gels and flame hydrolysis preforms. The cylinders stand for strings of particles. Because the particles, in this case, are aligned along the borders of a cubic structural unit, each particle has a small number of neighbors and, hence, a small number of contacts (6 for particles in the string crossovers and 2 otherwise).
This model is an excellent (and perhaps the only) way to deal with the sintering kinetics of these types of structures. The geometry of the unit cell is very dissimilar to the geometry of packed particles, but since the calculations are insensitive to the geometry assumed in different models, this cylinder geometry has been applied to high-density systems with good results [24]. It also solves the problem of describing the medium range densities, especially when one starts from low-density compacts. Scherer’s model was developed to include the measured pore size distribution obtained through mercury porosimetry. However, one must consider that if a pore size distribution is present, porosimetry can be misleading because the Hg or any other liquid may penetrate the large pores through the small ones. In addition, mercury porosimetry depends on the rate at which the pressure increases during measurement. Thus, the information from mercury intrusion porosimetry does not always reflect actual pore sizes and may be a source of problems. The Clusters model Densification of glass particles having a size distribution: Giess et al. [22] reported that a pure MS analysis does not accurately describe the final stages of sintering of pressed compacts of polydispersed, irregular-shaped cordierite glass particles. He suggested that this drawback may be the result of fractions having small-size particles sintering most rapidly at the outset and large particles delaying sintering towards the end of the process. Figure 1 illustrates this fact in a cross section of a compact of an alumino-borosilicate glass the particles having a wide size distribution, after a linear shrinkage of 8%.
Figure 1: SEM micrograph of a polydispersed compact of an alumino-borosilicate glass after a linear shrinkage of 8% starting from relative green density ≈ 0.6. Width of the micrograph = 20 microns.

Figure 1 gives experimental evidence of the fact that the F and MS processes may occur simultaneously in a sample having a particle size distribution. The Clusters model [6] is based on this experimental fact: small particles preferentially cluster in the open spaces left by larger particles and sinter faster. Thus, for a polydispersed compact with volume fraction vr of particles of radius r, the Eq. (4) holds true for the densification kinetics at a given temperature.
[ ]
[ ]∑∑
ν−θ+−θξ
ν−θρ+−θξρ=ρ
rr8.08.0r
rr
8.0MS8.0rF
)tt()tt(
)tt()t()tt()t,r()t( (4)
Equation (4) sums up the relative density ρ(r,t) for each cluster having particle size r, as a
function of time, t. During the Frenkel stage of sintering, the condition ρ(r,t) = ρF(r,t) < 0.8 is met and ρF(r,t) is calculated using the Frenkel model - Eq. (1b). Later, ρ(r,t) = ρMS(r,t) > 0.8, ρMS(r,t) is calculated by the Mackenzie-Shuttleworth model - Eq. (2a). For each cluster, the passage from the F to the MS regime is performed using the step function θ(X), which is unity for positive X and null for negative X, thus alternating between 1 and 0 at t = t0.8, when ρF(r,t0.8) = 0.8 is reached. ξr is the neck-forming ability of each particle having size r, which can be calculated from the particle size distribution. The empirical expression ξr=1/rc, where c depends on the particle size distribution, is proposed in Ref. [6].
The pore radius a0 in Eq. (2a) is adjusted for each cluster to ensure a continuous ρ(r,t) function at t = t0.8. The adjustment is achieved by first computing t0.8 with Eq. (1b), then calculating a0 with the integrated version of Eq. (2a) at t = t0.8.
Eq. (4) can be explicitly written as Eq. (5) for ξr = 1 (which corresponds to narrow size distributions):
( )
( )
( ) ( ) ( ) ( ) rr
8.00
g
08.03
g
0 vttTra2t3
e11tt
rT8t31
t ∑
−θ
ηγ−
ρρ
−−+−θ
ηγ
−ρ
ρ=ρ
(5)
Other aspects of the microstructure that should be considered in order to describe the sintering
of actual glasses are: a) The number of necks that each particle develops with its neighbors: we have experimentally found [7] that the actual number of necks per particle in green compacts of monodispersed spheres is distributed from 3 to 8 neck/particle, with an average value of about 5 neck/particle. Note that, in the Scherer scheme of particle arrangement, each particle must have either 2 or 6 contacts with its neighboring particles (i.e., particles at an edge or at a corner of the cell, respectively).
Figure 2 shows that some necks can lack in a real compact. There are two possible reasons: a gap arises between two neighboring particles (frustrated contact) or a neighbor lacks creating a “hole” in the random packed structure. Both types of defects necks slow down densification.

Figure 2: Detail of an array of glass spheres slightly sintered to form necks. The white arrows show the absence of neighbors or frustrated necks (although the two particles are close, they do not touch). Black arrows show necks. The width of the micrograph is 1.425 mm.
For size distributions D1 and D3 in Figure 3, we found that the average number of necks is 5,
i.e., one neck less than the 6 necks needed for a local cubic array of particles, as is implicitly assumed in Eq. (1b).
0 300 600 900 1200 1500
0,00
0,05
0,10
Size Distributions: D1 D2 D3
Freq
uenc
y
Diameter (µm)
Figure 3: Size distribution of the SLS glass beads used in this work.
b) Particles surface with pre-existing solid inclusions: when the glass particles to be sintered show pre-existing surface crystals or dust, only the glass-glass contacts contribute to sintering. For example, particles having only 90% of glassy surface have an effective surface fraction 0.9 * 0.9 = 0.81 that is free for making contacts and developing necks during sintering.
The Clusters model was developed to describe systems that undergo simultaneous F and MS kinetics, as the one shown in Figure 1. The model allows one to include the afore-mentioned packing and pre-crystallization details a) and b). The calculations are carried out via summations of the density of each particle size fraction, because it is not always possible to describe the particle size distribution as simple analytical functions. Working with summations rather than integrals allows one to use the particle size distribution, which is easily measured.

To the best of our knowledge, there is no single model able to describe sintering processes from green to full density. Even the Scherer model only describes sintering up to ρ ~ 0.94. In the present case, for compacts having a green density of about 0.6 or more, we use the Frenkel model for the first 10% of linear shrinkage – i.e. relative density range between 0.6 and 0.8 – and the MS model for the high-density range from 0.8 to 1. The choice of an appropriate pore size, a0, for each particle size considered, allows one to obtain a continuous passage from the F to the MS curves at the desired value of relative density = 0.8. Our model, however, does not apply to low-density green compacts.
The MS mechanism is strictly valid only in the density range of 0.9 to 1, but in our model we suppose its validity already from 0.8. We justify this simplification showing a posteriori that the sintering kinetics of various systems (including materials having a wide particle size distribution and showing concurrent crystallization) can be described by the model. There is a good reason for choosing 0.8 as the initial density of the MS model. We have experimentally observed that, at this density, a qualitative shift in porosity occurs from interconnected to isolated pores. Hence, the porosity is no longer interconnected.
The Clusters model uses the approximation suggested in Ref. [21] for the MS process. This approximation gives a slightly slower kinetics for sintering than the exact solution. But the difference is negligible compared to all the other simplifications. Moreover, it drastically simplifies the calculations, allowing one to include other effects such as concurrent crystallization in isothermal and non-isothermal sintering.
The particle size distribution (which is easy to measure) is used as an input and allows one to calculate the pore size distribution. This model feature allows one to predict the evolution of pore size over time and to compare this calculated distribution with pore size measurements from plane sections through the sample (careful stereological corrections must be made in this case). In a recent report [7] we demonstrated that calculations with the Clusters model provide a good prediction of the measured pore size distribution of sintered spherical particles.
Sintering with concurrent crystallization: Figure 4 shows a spherical particle of soda-lime-silica glass that developed necks with its neighbors during sintering and whose surface is full of cristobalite and devitrite crystals. The crystals grow from the surface towards the particle interior. In this case, crystallization arrested viscous flow sintering in an early stage.
Figure 4: Crystals growing from the surface towards the volume in a spherical soda-lime-silica glass particle (radius ≈ 200 microns) in a sintering-crystallization experiment. Necks between particles are clearly shown.
Isothermal sintering with concurrent crystallization: most glass powders tend to crystallize starting from the external surfaces when heated [25], and any fraction of the surface that
crystallizes slows down the sintering kinetics by preventing viscous flow. It is, therefore, important to understand the effect of surface crystallization on the sintering kinetics.
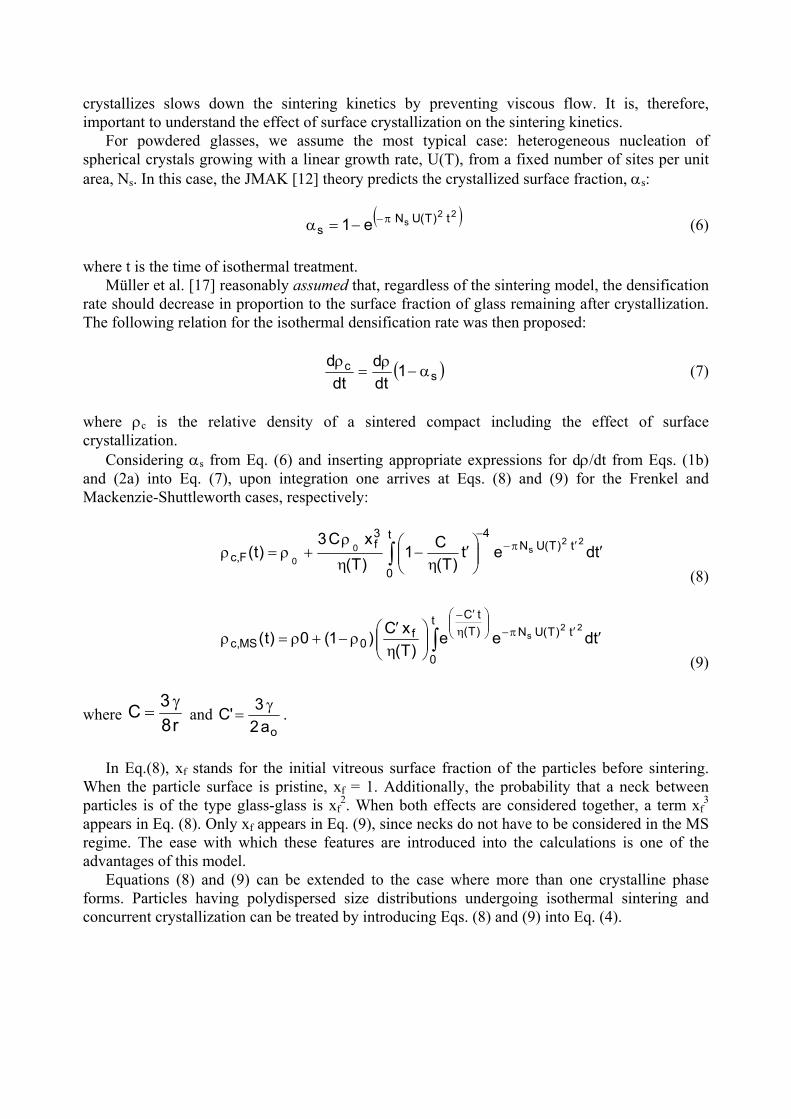
For powdered glasses, we assume the most typical case: heterogeneous nucleation of spherical crystals growing with a linear growth rate, U(T), from a fixed number of sites per unit area, Ns. In this case, the JMAK [12] theory predicts the crystallized surface fraction, αs:
( )22
s t)T(UNs e1 π−−=α (6)
where t is the time of isothermal treatment.
Müller et al. [17] reasonably assumed that, regardless of the sintering model, the densification rate should decrease in proportion to the surface fraction of glass remaining after crystallization. The following relation for the isothermal densification rate was then proposed:
( )sc 1
dtd
dtd
α−ρ
=ρ (7)
where ρc is the relative density of a sintered compact including the effect of surface crystallization.
Considering αs from Eq. (6) and inserting appropriate expressions for dρ/dt from Eqs. (1b) and (2a) into Eq. (7), upon integration one arrives at Eqs. (8) and (9) for the Frenkel and Mackenzie-Shuttleworth cases, respectively:
tdet)T(
C1)T(xC3
)t(22
s00
t)T(UNt
0
43f
F,c ′
′η
−η
ρ+ρ=ρ ′π−
−
∫ (8)
tdee)T(
xC)1(0)t(t
0
t)T(UN)T(tC
f0MS,c
22s ′
η′
ρ−+ρ=ρ ∫ ′π−
η
′−
(9)
where r83C γ
= and oa2
3'C γ= .
In Eq.(8), xf stands for the initial vitreous surface fraction of the particles before sintering.
When the particle surface is pristine, xf = 1. Additionally, the probability that a neck between particles is of the type glass-glass is xf
2. When both effects are considered together, a term xf3
appears in Eq. (8). Only xf appears in Eq. (9), since necks do not have to be considered in the MS regime. The ease with which these features are introduced into the calculations is one of the advantages of this model.
Equations (8) and (9) can be extended to the case where more than one crystalline phase forms. Particles having polydispersed size distributions undergoing isothermal sintering and concurrent crystallization can be treated by introducing Eqs. (8) and (9) into Eq. (4).

Non-isothermal densification with concurrent crystallization: in some situations, however, depending on how fast the sintering and crystallization rates are, a substantial part of these processes may already occur on the heating path. Thus, it is fundamental to be able to simulate the sintering and crystallization degrees achieved in the compact during heating up at a given rate before reaching the designed annealing temperature. Here, we follow the procedure presented in Ref. [9].
The time, t, can be treated as a temperature dependent variable, such as dt = dT/q, where q is a constant heating rate. Making the appropriate change of variables and taking into account the heating rate, the temperature dependent surface crystallized fraction can be written as follows:
2
T
Tg2s 'dT)'T(U
qN
s e1)T(
π− ∫
−=α (10)
where Tg is the glass transition temperature and T is the sintering temperature reached at the end of a continuous heating experiment.
The densification rates for both F and MS stages may be similarly written. From Eqs. (1a), (7) and (10) one arrives at Eqs. (11a) and (11b), which give the Frenkel sintering kinetics with concurrent surface crystallization for an isotropic non-isothermal process.
Td)T(
)T(1qC)T(
LL T
T
s
0g
′′η′α−
=∆
∫ (11a)
3T
Tg
s
0F,c
'dT)'T(
)'T(1qC1
)T(
ηα−
−
ρ=ρ
∫
(11b)
The corresponding MS expression obtained from Eqs. (2a), (7) and (10) is:
Td)T(
))T(1(eqC)1()T(
T
T
S)T(
dTqC
00MS,cg
T
gT
′′η
′α−∫
′ρ−+ρ=ρ ∫
η′−
(12) For simplicity, in the Eqs. (11) and (12), the particles surfaces were considered free of solid
inclusions (pristine or totally glassy), which could affect viscous flow, hence the parameter xf = 1.
Polydispersed distributions undergoing non-isothermal sintering and concurrent crystallization can be treated by introducing Eqs. (11) and (12) into Eq. (4).
With these equations and the appropriate physical and processing parameters of the glass (surface tension, viscosity vs. temperature, crystal growth rate vs. temperature, number of active

surface sites, particle size distribution and green density), the densification kinetics (ρ or ρc vs. time) can be predicted at any chosen temperature. Another application is the possibility of predicting the pore size distribution any time at the MS stage of densification. With the exception of U(T) – which must be measured – the other quantities can be estimated from the glass composition (η, γ) or can be used as simulation parameters (Ns, vr, ρ0). Crystallization towards the glass particle volume: most analyses of the competition between sintering and crystallization only take into account internal crystallization [10,13,14] or surface crystallization [7,8,17]. Such kinetics was studied by Gutzow et al. [18].
Interior crystallization is typically neglected because, in practice, the effect of volume crystallization (crystals nucleating in the volume and emerging to the particle surface) is generally much smaller than surface crystallization. However, if the growing crystals have densities that significantly differ from that of the glass, the density variation must be considered in calculating the evolution of the body relative density as in [18]. RESULTS
In this section we summarize our calculations and experimental data for soda-lime-silica (SLS) glass spheres having (wt.%) 72.5 SiO2, 13.7 Na2O, 9.8 CaO, 3.3 MgO, 0.4 Al2O3 and 0.2 FeO-Fe2O3, which crystallize into up to four different phases. Crystal growth rate (U) and numbers of crystals per unit surface (Ns): using optical microscopy, we measured the crystal growth rates of 4 phases: spherulites, needles, sticks and bipyramidal crystals appearing on the surface of glass samples after proper thermal treatments. Those were the predominant morphologies on the heat-treated samples in the range of 680 - 840oC (Figures 5a, 5b and 5c). Table I summarizes the data for the four different crystalline phases.
Figure 5. SEM micrographs of the surface of glass spheres heat-treated at (a) 700°C/5h; (b) 840°C/90min; and (c) a detail of (b). Sample (a) shows mainly spherulitic crystals; samples (b) and (c) show needle-like, stick and bipyramidal crystals. The widths of the micrographs are: (a) 150 microns; (b) 20 microns; and (c) 7 microns.
We refer to phases 1, 2, 3 and 4 for simplicity, since the morphologies were not all associated
to known crystalline phases. However, it is known from the literature that spherulitic (or dendritic) (1) and needle-like (2) crystals growing on a commercial soda-lime-silica glass are cristobalite and devitrite, respectively. Most of the crystalline phases nucleated and grew from
(a) (b) (c)

Table I. Relevant data for the main crystalline phases found on the glass surface. Crystal growth rates – U(T) – refer to crystal radii or largest edge, R. Ns is the density of nucleation sites on the particles surface. Phase Morphology Phase NS (m-2) U(T) – dR/dt
(m/s) T range of validity (K)
1 Spherulites Cristobalite 3.0 x 10⁹ e(-27594/T+5.20) 953 – 1123 2 Needles Devitrite 1.1 x 10⁹ e(-27657/T+6.93) 953 – 1123 3 Sticks not identified 1.8 x 10⁸ e(-43910/T+20.01) 1063 – 1123 4 Bipyramidal not identified 1.8 x 10⁸ e(-26222/T+2.17) 1063 – 1123 the particles surface. However, a few crystals nucleated on bubbles or heterogeneities in the bulk. It is also interesting to observe that the predominant crystalline phase changes with the annealing temperature. Isothermal sintering and crystallization: the spherical particles of soda-lime-silica glass having the distributions D2 and D3 shown in Fig. 3 were used in experiments to determine the number of neighbors around each particle. The average number of neighbors was found to be 5 for both distributions [7]. In the same reference, particles distributed as D1 in Fig. 3 were used for the sintering experiments shown in Figure 6 (the black dots refer to experimental data and the solid line is the calculated densification kinetics based on the Clusters model).
0 2500 5000 7500 10000
0.7
0.8
0.9
1.0
Den
sity
(gr/c
m3 )
Time (s)
Figure 6: Sintering kinetics of soda-lime-silica glass spheres having size distribution D1, at 710oC. Solid circles: measured; solid line: calculated with the Clusters model.
The compacts did not reach full density (ρ = 1), because pre-existent crystalline particles on
the sphere’s surface reduced the area available for sintering and (probably) due to gases (entrapped or from degassing) that cannot diffuse out from the sample, an effect that is not accounted for in the model. Surface crystallization during sintering was negligible, i.e., only about 2% when the sample density saturated, causing no harm in this case.
The measured and calculated porosity was compared for a sample with relative density = 0.88. This sample was chosen because at this density all clusters, having particle sizes given by D1 in Fig. 3, should be in the Mackenzie-Shuttleworth regime.
The calculated pore size distribution is plotted in Fig. 7. To carry this out, the a0(r, t = 0) (initial pore radius at t = 0 present in clusters of particles of radius r) is calculated at first. Eq. (5) is then used to estimate the time at which the compact density reaches 0.88. After that, using Eq. (2b), each pore radius is computed at that time. It is worth stressing that, although the overall

density of the compact is 0.88, the local density depended on the particle sizes existing in each region of the sample. The measured pore size distribution is shown in the same figure for comparison. The sizes of about 800 pores were measured by microscopy on plane sections through the sample, and the section size distribution thus found was converted to the volume by standard stereological calculations. The calculated values are systematically smaller (about 10 microns) than the measured ones.
0 20 40 60 80 100-0.02
0.00
0.02
0.04
0.06
0.08
0.10
0.12
0.14 Calculated Measured
Volu
me
Frac
tion
Pore radius (microns)
Figure 7: Pore size distribution: calculated with the Clusters model (hollow squares). Measured are solid squares.
Isothermal sintering experiments with particles having size distributions D1 and D3 in Fig. 3 were also conducted at higher temperatures where crystallization hinders sintering, and the results are shown in Figs. 8 and 9. These figures show reasonable agreement between experiments and calculations.
0 10 20 30 400.6
0.8
1.0
Fig. 8
677C 710C 751C Calculated.
Den
sity
Time (ks)
0 50 100 150 200 2500.60
0.65
0.70
0.75
0.80
0.85
0.90
0.95
1.00Fig.9
D2, 751 C
D2, 655 C
Den
sity
Time (ks)
Figure 8: Densification kinetics of D1 glass spheres at different temperatures. Lines: calculated with the Clusters model. Solid symbols: measured.
Figure 9: Densification kinetics of D2 glass spheres at 751°C and 655°C. Lines: calculated with the Clusters model. Solid symbols: measured.

Non-isothermal sintering and crystallization: Figure 10(a) shows the calculated densification curves (for particles having size distribution D1 of Fig. 3) for four different heating rates: 0.2, 1, 5 and 15 K/min. Measured data for each heating rate are also shown. Figure 10(b) equally shows calculated and measured densification values but for particles having the size distribution D2 of Fig. 3.
For all heating rates and size-distributions, an increase in the heating rates shifts densification to higher temperatures. The maximum calculated sample density is always about 2% lower than the experimental final density.
900 950 1000 1050 1100 11500.6
0.7
0.8
0.9
1.0
(a)
Den
sity
Temperature (K)
900 950 1000 1050 1100 11500.6
0.7
0.8
0.9
1.0
(b)
Den
sity
Temperature (K)
Figure 10: Density of sintered compacts of (a) spherical particles of size distribution D1, calculated densities (full lines) at heating rates from left to right: 0.2 K/min, 1 K/min, 5 K/min, 15 K/min. Measured values: symbols; (b) spherical particles of size distribution D2, calculated densities (full lines) at heating rates from left to right: 1 K/min, 5 K/min. Measured values: symbols. (a) and (b) dotted line: glass density. DISCUSSION
In the previous section, the Clusters model was tested for isothermal and non-isothermal sintering of spherical glass particles having different size distributions, embedded solid particles or pre-existing surface crystals and simultaneous crystallization. These provide examples of different situations that may arise when sintering diverse glasses. The ability of a given model to include the particular characteristics of the system of interest determines its applicability. For compacts with relative green densities of about 0.6 or higher, such as those of the systems discussed herein, for one make quantitative predictions of sintering and crystallization kinetics, the Clusters model can take account of different aspects of diverse systems (number of neighbors/particle, particle size distribution, crystallizing phases, etc.). Another interesting feature of the Clusters model is that it serves as a tool to predict the resulting porosity distribution in a sintered compact. Considering all the assumptions, Fig. 7 shows that the calculated pore size distribution at ρ = 0.88 reasonably agrees with the measured distribution of partially sintered soda-lime-silica spheres.
The surface viscosity of glass particles with pristine surfaces (free of embedded solid particles or pre-existing surface crystals) is expected to be somewhat lower than the volume viscosity [26]. In our case, because the used soda-lime-silica glass spheres were produced by an industrial process, their surfaces were full of defects and embedded particles, which were difficult to characterize properly due to their small sizes. That is why, in this case, if we had used the

viscosity as a fitting parameter (thus considering clean particle surfaces), the viscosity obtained would be about 70% higher than the directly measured. It is remarkable that this same high viscosity is found for both the isothermal and non-isothermal sintering kinetics of these glass spheres. In reality, this so high viscosity values is affected by the embedded solid particles or pre-existing surface crystals on the particles surface.
However, the extended Clusters model, which takes simultaneous crystallization into account, allows one to consider not only the information that contacts between particles of the crystal-crystal or glass-crystal type will not develop necks by viscous flow (only glass-glass contacts develop necks), but also that the rate of sintering is proportional to the remaining glassy area. With these features included in the model, the experimental viscosity reasonably explains all isothermal and non-isothermal measurements.
Due to the crystallization of non-stoichiometric phases, the chemical composition of the glass matrix around crystals continuously changes with time, which also leads to change in viscosity. An estimate of such change, considering the two main crystalline phases (devitrite and cristobalite), the glass chemical composition and using the SciGlass database [27], indicates only a slight decrease in the surface viscosity.
An exact computation of the crystallized surface fraction is very difficult when the geometry of the crystals is as complex as that of devitrite. This phase can appear as needles or as laths, with no obvious symmetry. Devitrite is by far the most common crystalline phase in the sintering range. We thus approximated its surface morphology as a circle. The same geometry was used to compute the areas of other crystalline phases. This approximation overestimated the crystallization kinetics.
The effects of particle size distribution and the contacts between particles having different sizes are introduced in the Clusters model through the parameter ξr, which is significant only for large size distributions. This parameter “weights” the volume fraction of each particle size with the relative number of necks that these particles develop in surrounding all the other particles in the distribution. As smaller particles develop more necks to surround other particles, their “weight” is augmented in detriment to larger particles. But large size distributions are common for crushed irregular particles. In this case, the effect of size distribution is mixed with that of “particle shape” and “packing”, since particles having different geometry pack in a different way. When these three effects are simultaneously present, it may be too difficult to uncouple them.
The number of neighbors each particle has or, equivalently, the number of necks each particle develops also depends on the particle size distribution, particle shape and packing. This information, if available, can be readily introduced into the Clusters model.
Another important point is the temperature equilibrium during non-isothermal sintering. In this case, thermal gradients that develop within the compact on the heating path are not included in the model (although they could be). Temperature gradients may arise when the heating rate or the sample dimensions are relatively large, for example in glassy blocks having sides of about 50 cm for nuclear waste immobilization and in tiles.
In non-isothermal sintering, temperature gradients may arise between the sample surface (due to the small heat transfer coefficient) and the compact interior (due to the small thermal diffusivity of porous glass). An estimation of these thermal gradients was done in Ref. [9].
Residual porosity is frequently found in many viscous sintering experiments. This saturation may be due to at least these factors: pre-existing surface crystals, partial or total surface crystallization during sintering, insoluble gases entrapped in the initial pores and bubbles formed by the release of dissolved gas (which can be catalyzed by crystallization). While surface

crystallization is taken into account in the model equations, the processes involving gases are not. Therefore, entrapped gases or degassing cause remnant porosity in SLS glass.
SUMMARY
We tested the Clusters model for isothermal and non-isothermal sintering of soda-lime-silica glass, which readily crystallizes during sintering, having narrow distributions of spherical particles. The model provided a good description of the experimental results. The effect of pre-existing crystals or embedded solid particles on the surface was taken into account and proved to exert a strong effect on the Frenkel stage of sintering. In a green compact, each glass particle can have a different number of neighbors, which, in the present case, vary from three to eight. The number of neighbors depends on the size distribution and particle shape. This new variable (average number of neighbors) was also introduced into the model equations. The Clusters model (and other sintering models) assumes a homogeneous temperature within the sample. However, in the case of large samples or high heating rates, temperature gradients must be considered. Finally, when all the clusters having different particle sizes are in the Mackenzie-Shuttleworth regime, the model can also predict the pore size distribution.
In summary, we have shown that different aspects of the sample microstructure and crystallization parameters can be included in the formulation of the Clusters model, providing a formidable tool to simulate the densification kinetics of crystallizing powdered glasses in a variety of processing situations.
ACKNOWLEDGEMENTS
The authors gratefully acknowledge CNPq, Cyted, PRONEX and FAPESP (Brazil) for funding this research. REFERENCES
1 J.J. Frenkel, “Viscous flow of crystalline bodies under the action of surface tension,” Journal of Physics (USSR), IX [5] 385 (1945).
2 J.K. Mackenzie and R. Shuttleworth, “A phenomenological theory of sintering, ”Proceedings of the Physical Society (London), Sec. B, 62 833 (1949).
3 G.W. Scherer, “Sintering of low-density glasses: I, theory,” Journal of the American Ceramic Society, 60 [5-6] 236 (1977).
4 G.W. Scherer and D.L. Bachman, “Sintering of low-density glasses: II, Experimental study,” Journal of the American Ceramic Society, 60 [5-6] 239 (1977).
5 G.W. Scherer, “Sintering of low-density glasses: III, Effect of a distribution of pore sizes,” Journal of the American Ceramic Society, 60 [5-6] 243 (1977).
6 M.O. Prado, E.D. Zanotto and R. Müller, “Model for sintering polydispersed glass particles,” Journal of Non-Crystalline Solids, 279 [2-3]169-78 (2001).
7 M.O. Prado, E.D. Zanotto and C. Fredericci, “Sintering polydispersed spherical glass particles,” Journal of Materials Research, 18 [6] 1347 (2003).
8 M.O. Prado, C. Fredericci and E.D. Zanotto, “Isothermal sintering and concurrent crystallization of soda-lime-silica glass beads,” Journal of Non-Crystalline Solids, 331 [1-3] 145-56 (2003).
9 M.O. Prado, C. Fredericci and E.D. Zanotto, “Non-isothermal sintering with concurrent crystallization of polydispersed soda-lime-silica glass beads,” Journal of Non-Crystalline Solids, 331 [1-3] 157-67 (2003).
10 G.W. Scherer, “Sintering of sol-gel films,” Journal of Sol-Gel Science & Technology, 8 353 (1997).
11 E.M. Rabinovich, “Preparation of glass by sintering,” Journal of Materials Science, 20 4259 (1985).
12 M. Avrami, “Kinetics of phase change. I. General theory," Journal of Chemistry and Physics, 7 1103 (1939).
13 D.R. Uhlmann, L. Klein, P.I.K. Onorato and R.W. Hopper, Proc. Lunar Sci. Conf. 6th, 693 (1975).
14 J. Zarzycki, pp. 204 in Advances in Ceramics, Vol. 4, American Ceramic Society, Columbus, OH, 1982.
15 A.R. Boccaccini, W. Stumpfe, D.M. Rtaplin and C.M. Ponton, “Densification and crystallization of glass powder compacts during constant heating rate sintering,” Materials Science & Engineering A219 26 (1996).
16 G.W. Scherer, pp. 503-514 in Better Ceramics Through Chemistry IV, eds. B.J.J. Zelinski, C.J. Brinker, D.E. Clark and D.R. Ulrich, Mat. Res. Soc., Pittsburgh, PA, 1990.
17 R. Müller, M. Kirsch and H. Lorenz, “Surface crystallization a limiting effect of sintering glass powders,” Proc. XV Congress on Glass, Leningrad, 3 334 (1989).
18 I. Gutzow, R. Pascova, A. Karamanov and J. Schmelzer, “The kinetics of surface induced sinter crystallization and formulation of glass-ceramic materials,” Journal of Materials Science, 33 [21] 5265 (1998).
19 M. Weinberg, “Surface nucleated transformation kinetics in 2- and 3-dimensional finite systems,” Journal of Non-Crystalline Solids, 134 116-22 (1991).
20 I.B. Cutler, “Sintering of glass powders during constant rates of heating,” Journal of the American Ceramic Society, 52 [1] 14 (1969).
21 Yet-Ming Chiang, D.P. Birnie III and W.D. Kingery, “Single phase sintering”; pp. 392 in Physical Ceramics Principles for Ceramic Science and Engineering, Wiley, NY, 1997.
22 E.A. Giess, J.P. Fletcher and L. Wynn Herron, “Isothermal sintering of cordierite-type glass powders,” Journal of the American Ceramic Society, 67 [8] 549 (1984).
23 I. Gutzow and J. Schmelzer, “The Viscosity of Glass-Forming Melts”; pp. 32 in The Vitreous State. Thermodynamics, Structure, Rheology and Crystallization, Ed. Springer, Berlin, 1995.
24 G.W. Scherer, “Sintering of gels”; pp. 221 in Proceedings of the Winter School on Glasses and Ceramics from Gels, São Carlos (SP), Brazil, 14-19 August 1989. Editors: M.A. Aegerter, M. Jafellicci, D.P.F. de Souza and E.D. Zanotto - World Scientific Publishing Co. Pte. Ltd., London, 1989.
25 R. Müller, E.D. Zanotto and V.M. Fokin, “Surface crystallization of silicate glasses: nucleation sites and kinetics,” Journal of Non-Crystalline Solids, 274 [1-3] 208-31 (2000).
26 A. Agarwal and M. Tomozawa,“Surface and bulk structural relaxation kinetics of silica glass,” Journal of Non-Crystalline Solids, 209 264 (1997).
27 O.V. Mazurin, M.V. Streltsina, T.P. Shvaiko-Shvaikovskaya, V.K. Leko and A.I. Priven, SciGlass™ 3.0 - Universal Information System on Glass Properties (www.scivision.com).