rio de janeiro -25-28 august 2014 ultimate energy ......aug 28, 2014 · wasteeng 2014 rio de...
TRANSCRIPT

WastEEng 2014Rio de Janeiro - 25-28 August 2014
Ultimate energy performances ofgrate combustor WtE plants
S. Consonni, F. Viganò, E. BogaleDepartment of Energy, Politecnico di Milano

2The paths of energy recovery from waste
RDF
Com
bust
ion
Piro
lysi
s
MSW
Com
bust
ion
Com
bust
ion
RDF
mec
hani
cal
trea
tmen
t
Synthetic fuels:H2, liquid fuels
Gas
ifica
tion
bio-
dige
stio
n in
land
fill
Gas
ifica
tion
Focus of this presentation:
S. Consonni - WastEEng 2014, 28 Aug 2014
Syngas - Biogas
+ Heat
Electricity
Com
bust
ion
gas
turb
ine,
int.
com
bust
ion
engi
ne
stea
mcy
cle
Com
bust
ion
Com
bust
ion
Com
bu-
stio
n
pressurized steam
presentation:
gratecombustors with production of electricity only

33Basic issues of Energy from Waste: a reminder
• Unfavourable physical properties (solid chunks) --> grate, long residence times, large combustion chamber
• Unfavourable composition:
− high moisture content --> low boiler efficiency
− high ash content --> high aux power consumption, erosion, large boiler
S. Consonni - WastEEng 2014, 28 Aug 2014
− corrosive species --> limit steam conditions
− pollutants --> heavy flue gas treatment
• Heating value much lower than for fossil fuels --> for given power, large flow rates --> high aux power consumption, high costs
• Small scale --> low efficiency, high costs

4The price to pay for low quality waste fuel
Eur
o/kW
el
0
2,000
4,000
6,000
8,000
10,000
1 2 3
WTE plant WTE plant
Capital cost
As a consequence of extremely high capital costs and low efficiency, energy production
S. Consonni - WastEEng 2014, 28 Aug 2014
10.0
15.0
20.0
25.0
30.0
35.0
40.0
45.0
1 2 3
Net
effi
cien
cy, %
WTE plant100.000 tons/yr
7.5 MWel,net
WTE plant1.000.000 tons/yr
100 MWel,net
Coal-fired plant1.000 MWel,net
Net electric efficiency
efficiency, energy production from waste is economically acceptable only for negative fuel prices (gate fee)

55
Although the competition with fossil fuel-fired power plants is extremely challenging (and somewhat unfair), viewing WTE plants as power stationspower stations rather than a disposal technology is the only way WTE can be accepted by legislators and the public opinion
Relevance of energy recovery
S. Consonni - WastEEng 2014, 28 Aug 2014
accepted by legislators and the public opinion
Waste = Resource

6Directions for improvement
1) Decrease costs– simpler configuration– use less material– ease/decrease maintenance– etc.
2) Increase efficiency– improve thermodynamic cycle
S. Consonni - WastEEng 2014, 28 Aug 2014
– improve thermodynamic cycle– adopt different combustion technology (fluidized bed ?)– adopt technologies other than combustion (gasification ?)
3) Generate additional ouputs– cogeneration of heat & power– recover materials from bottom ashes– etc.
7
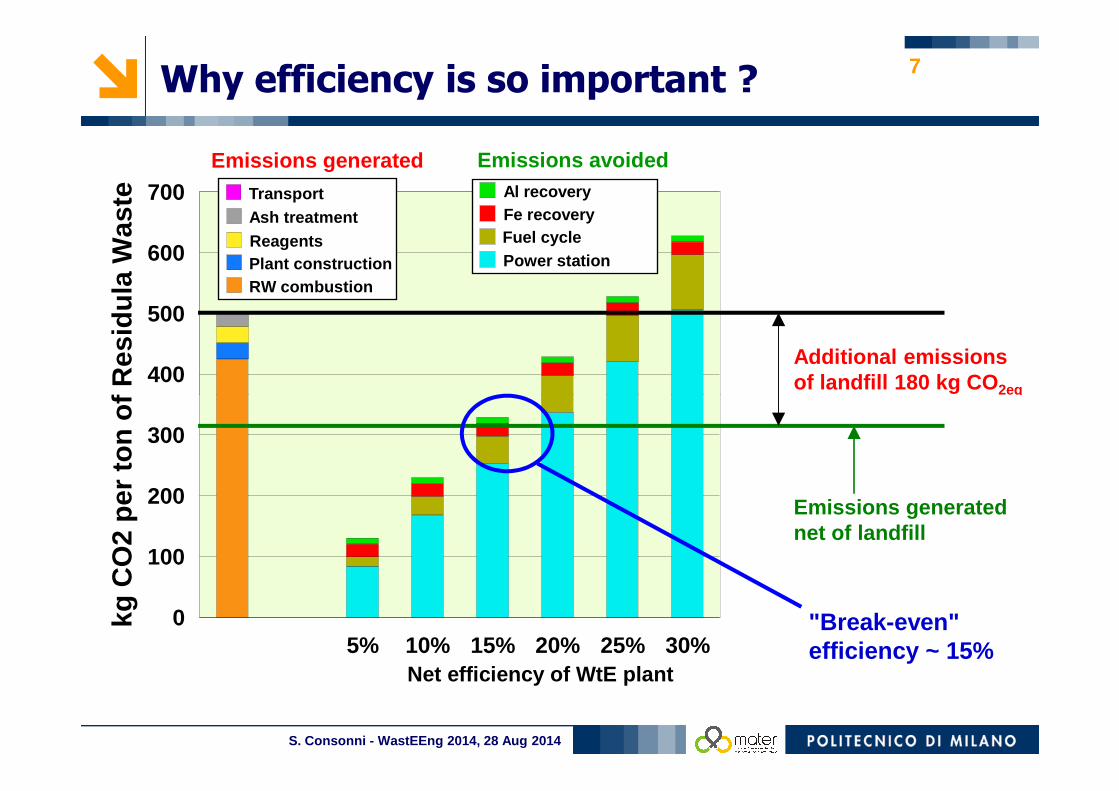
400
500
600
700
kg C
O2
per
ton
of R
esid
ula
Was
te
Al recoveryFe recovery
Power stationFuel cycle
Emissions avoided
TransportAsh treatmentReagentsPlant constructionRW combustion
Emissions generated
Why efficiency is so important ?
Additional emissions of landfill 180 kg CO 2eq
S. Consonni - WastEEng 2014, 28 Aug 2014
5% 10% 15% 20% 25% 30%0
100
200
300
kg C
O2
per
ton
of R
esid
ula
Was
te
Net efficiency of WtE plant
Emissions generated net of landfill
"Break-even" efficiency ~ 15%

88
Performances achievable by state-of-the-art
Technologies
S. Consonni - WastEEng 2014, 28 Aug 2014
by state-of-the-artgrate combustors

99Modern, advanced combustion plant
STACK
EVA
ECO
FGR
WASTE
STEAM DRUM
SH
CONDENSATE PREHEATEREPS SCR
FABRIC FILTER
ASH ASH
EVA
FGR FAN
ASH
S. Consonni - WastEEng 2014, 28 Aug 2014
DEAERATOR FWH
PRIMARYAIR AIR PREHEATERS
GRATE FURNACE
BOTTOMASH VAPOR FROM
ASH QUENCHING
SECONDARY AIR
ASH
ASH

10Methodology of performance predictions
out
in
in
in
in 2
in1
out
out
fuel
out
out 2
in leakage
gas turbine coolingflows
IntercooledCompressor
Splitter
Mixer
Pump
Heat exchanger
in ex 2
out
outin1
in 2
Cooling air
in2
in1out 1
out 2
in1
in2
out 2
Saturator
W outW in
out 1
out 1
in
leakage
gas turbine coolingflows
Compressor
in (coolingfluid)
2
• GS modular code developed at PoliMI / Princeton
• Thermoflex / SteamPro
• Aspen Plus
S. Consonni - WastEEng 2014, 28 Aug 2014
fuel
Turbine Combustor
HRSG
Chemical converter
Oxygen separation plant
Shaft and generator
Exhaust gasAir
OxygenNitrogen
Qout
W in
inout
fue l airExhaust
ga s
SOFC
turbine inlet
toreheat
fromreheat
in out
outin out
feedwaterto boiler
Steam cycle
• estimation of operating parameters (P, T, mass flows) and performances of each component
• evaluation of mass / energy balances
• overall performances
• costs

11Typical operating parameters
small(conservative
design)
large(advanced
design)evaporation pressure 45 70extraction for air pre-heating 3.0 1.0/6.5 deaerator pressurecondensation pressure 0.10 0.06gas temperature at SH inlet
plant size
design parameter unit
bar2-3
max 650
S. Consonni - WastEEng 2014, 28 Aug 2014
gas temperature at SH inletsteam temperature at SH outlet 400 450gas temperature at end of heat recovery 160 135temperature of primary air 120 150temperature of secondary air 120 150
1 21 2
MP feedwater heatersflue gas recirculated % massoxygen at boiler outlet % vol 6.0 5.0loss due to unburnt carbon % LHV
°C
max 650
steam bleeds for air heaters
none15.0
0.8
LP feedwater heaters ahead of deaerator

1212Effect of steam parameters and scale
26
28
30
320 39 77 116 154 193 231 270 309
722
778
833
889
combustion power, MWt
advanceddesign
net e
lect
ric e
ffici
ency
, %
net e
lect
ric k
Wh
per
ton
of w
asteadvanced design
Pev 70 barTSH 450°C, etc.
S. Consonni - WastEEng 2014, 28 Aug 2014
0 100 200 300 400 500 600 700 80016
18
20
22
24
MSW treatment capacity, 1000 t/y
500
556
611
667
net electric kWh per ton of M
SW
conservativedesign MSW LHV
10 MJ/kg
net e
lect
ric e
ffici
ency
, %
LHV10 MJ/kg ne
t ele
ctric
kW
h pe
r to
n of
was
te
conservative designPev 45 barTSH 400°C, etc.

13
79
81
83
85
87
Ren
dim
ento
iso
entr
opic
o T
V [
%]
Isentropic efficiency of steam turbines
7800 RPM
4300 RPM
10400 RPM
Isen
trop
ic e
ffici
ency
of S
T [%
]
S. Consonni - WastEEng 2014, 28 Aug 2014
69
71
73
75
77
79
0 20 40 60 80 100 120
Potenza elettrica lorda [MW]
Ren
dim
ento
iso
entr
opic
o T
V [
%]
13
4300 RPM
6000 RPM
9000 RPM
11300 RPM
pIN = 65 barTIN = 450°Cpcond = 0.09 bar
3000 RPM12000 RPM
Isen
trop
ic e
ffici
ency
of S
T [%
]
Gross electric power [MW]
1414Industrial practice vs scale
26
28
30
32
rend
imen
to e
lettr
ico,
%
0 39 77 116 154 193 231 270 309
722
778
833
889
potenza di combustione, MWt
elet
tric
ità n
etta
, kW
h pe
r to
nn d
i RU
R
parametri avanzati
realtà industriale
Combustion power, MW LHV
Net
ele
ctric
effi
cien
cy, %
LHV
Net
ele
ctric
ity p
rodu
ctio
n, k
Wh/
tU
RW
Advanced parameters
Industrial practice
How can we shiftthis line upward ?
S. Consonni - WastEEng 2014, 28 Aug 2014
0 100 200 300 400 500 600 700 80016
18
20
22
24
capacità di trattamento RUR, 1000 t/y
rend
imen
to e
lettr
ico,
%
500
556
611
667
elet
tric
ità n
etta
, kW
h pe
r to
nn d
i RU
R
parametri conservativi PCI
10 MJ/kg
realtà industriale
Net
ele
ctric
effi
cien
cy, %
URW treatment capacity, 1000 t/y
Net
ele
ctric
ity p
rodu
ctio
n, k
Wh/
t
Conservativeparameters LHV
10 MJ/kg
Industrial practice

1515Possible routes to increase efficiency
1) Increase scale --> larger plants
2) Use auxiliary, high-quality fuels in complex, integrated configurations --> see presentation by dr. S. Guerreiro + related refs
3) Improve steam cycle:
− better cycle parameters --> higher Pev, TSH, lower Pcond
− more sophisticated configuration --> reheat
S. Consonni - WastEEng 2014, 28 Aug 2014
− more sophisticated configuration --> reheat
and given that:
• Pcond is determined by ambient conditions and water availability
• Higher Pev necessarily requires either higher TSH or reheat to limit liquid fraction at steam turbine outlet
• must go to either higher TSH and/or reheat

1616
Increase TSH ?
Routes to increase efficiency
S. Consonni - WastEEng 2014, 28 Aug 2014
Increase TSH ?

1717The challenge of higher TSH
S. Consonni - WastEEng 2014, 28 Aug 2014
Superheater tubes of plant in Acerra (Italy)
TSH = 500°C

1818
STACK
EVA
ECO
FGR
WASTE
STEAM DRUM
SH1
CONDENSATE PREHEATEREPS SCR
FABRIC FILTER
ASH ASH
EVA
FGR FAN
ASH
"Bypass" concept (Hans, 2010)
S. Consonni - WastEEng 2014, 28 Aug 2014
DEAERATOR FWH
PRIMARYAIR AIR PREHEATERS
GRATE FURNACE
SECONDARY AIR
SH2
COMBUSTOR
AIR
FUEL GAS
> 1λ λ
> 1λ
<1 GASCLEANING

1919
STACK
EVA
ECO
FGR
WASTE
STEAM DRUM
SH1
CONDENSATE PREHEATEREPS SCR
FABRIC FILTER
ASH ASH
EVA
FGR FAN
ASH
"Steam Boost" concept (Madsen, 2007)
S. Consonni - WastEEng 2014, 28 Aug 2014
DEAERATOR FWH
PRIMARYAIR AIR PREHEATERS
SECONDARY AIR
COO2
Cl
Na Zn
Pb
H O2 CO,CO
2
CH4,CXHY
CO,H2
STEAMBOOST SUPERHEATER
NON CORROSIVE GASES
WATERCOOLED MEMEBRANE WALL
GRATECOMBUSTOR
VAPOR FROMBOTTOM ASH QUENCH

2020External superheating with Biogas
STACK
EVA
ECO
FGR
WASTE
STEAM DRUM
SH1
CONDENSATE PREHEATEREPS SCR
FABRIC FILTER
ASH ASH
EVA
FGR FAN
ASH
S. Consonni - WastEEng 2014, 28 Aug 2014
DEAERATOR FWH
PRIMARYAIR AIR PREHEATERS
GRATE FURNACE
BOTTOMASH
SECONDARY AIR
ASH
COMBUSTOR
SH2
TO STACK
APH
BIOGASANAEROBIC DIGESTOR
AIR

2121
Given the challenge of high TSH, improving efficiency by adopting more sophisticated configurations - rather than by increasing TSH -seems attractive
Routes to increase efficiency
S. Consonni - WastEEng 2014, 28 Aug 2014
steam Reheat (RH)

2222Reheat via high-pressure liquid (Amsterdam)
S. Consonni - WastEEng 2014, 28 Aug 2014

2323Fisia-Babcock plant in Ruedersdorf (Berlin)
S. Consonni - WastEEng 2014, 28 Aug 2014

2424"Full" steam reheat
STACK
EVA
ECO
FGR
WASTE
EVA
ASH
STEAMDRUM
SH
RH
CONDENSATE PREHEATER
SCR
FABRIC FILTER
ASH ASH
SECONDARYAIR
EPS
EVA
FGR FAN
S. Consonni - WastEEng 2014, 28 Aug 2014
DEAERATOR FWH
PRIMARYAIR
AIR PREHEATERS
ASH
GRATEFURNACE
BOTTOMASH VAPOR FROM
ASHQUENCHING
ASH

2525Assumptions
CONV RH130 RH150 RH170LHV of waste fuel MJ/kgcombustion power MWevaporation pressure 70 130 150 170reheat pressure - 25 25 25extraction for air pre-heatingdeaerator pressurecondensation pressuregas temperature at SH inletsteam temperature at SH outletsteam temperature at RH outlet - 450 450 450
450
3.00.07
max 650
design parameter unit
bar
plant configuration
10,34200
0.88/6.30
S. Consonni - WastEEng 2014, 28 Aug 2014
steam temperature at RH outlet - 450 450 450gas temperature at eco outletgas temperature at end of heat recoverytemperature of prim/sec air
blowdownwater ∆P/P in economizersteam ∆P/P in SH / RHflue gas recirculated (*) % mass 15.0 26.9 31.2 35.8oxygen at boiler outlet % voloxygen at stack % volunburnt carbon in bottom ash % massthermal losses in boiler / heat exchangers %
(*) as fraction of flue gas flow at economizer outlet
1.0
6.07.0
190135150
15.08.0
1.0
2.0
%
LP feedwater heaters ahead of deaerator22
°C
steam bleeds for air heaters
2626Thermodynamic cycle
70 bar
130 bar
170 bar150 bar
Reheating 170 bar
Reheating 150 bar
Reheating 130 bar
Tem
pera
ture
(°
C)
S. Consonni - WastEEng 2014, 28 Aug 2014
0.07 bar
25 bar
Conventional
70 bar
Tem
pera
ture
(
Entropy (kJ/kgK)

2727Implications for boiler design
Conventional plant, Pev=70 bar, TSH=450°C, FGR=15%
Tgrate=1141°C T at inlet of convective section 650°C
flue gaseswater/steam
S. Consonni - WastEEng 2014, 28 Aug 2014

2828Implications for boiler design
Plant with RH, Pev=170 bar, TSH=TRH=450°C, FGR=15%
T at inlet of convective section 694°C
Tgrate=1141°C
flue gaseswater/steam
S. Consonni - WastEEng 2014, 28 Aug 2014
2929Higher FGR as means to mitigate Tgas
T at inlet of convective section 650°CTgrate=1060°C
Plant with RH, Pev=170 bar, TSH=TRH=450°C, FGR=22.9%
flue gaseswater/steam
S. Consonni - WastEEng 2014, 28 Aug 2014

3030"Flue Gas Quench" (FGQ)
STACK
EVA
ECO
FGR
WASTE
EVA
ASH
STEAMDRUM
SH
RH
CONDENSATE PREHEATER
SCR
FABRIC FILTER
ASH ASH
SECONDARYAIR
EPS
EVA
FGR FAN
gas quench
S. Consonni - WastEEng 2014, 28 Aug 2014
DEAERATOR FWH
PRIMARYAIR
AIR PREHEATERS
ASH
GRATEFURNACE
BOTTOMASH VAPOR FROM
ASHQUENCHING
ASH

3131"Flue Gas Quench" (FGQ)
Plant with RH, Pev=170 bar, TSH=TRH=450°C
FGR = 15%(*) in comb. chamber+FGR = 7.9%(*) at outlet of radiative section
gas quench
flue gaseswater/steam
S. Consonni - WastEEng 2014, 28 Aug 2014
section
(*) referred to flow at outlet of economizer

3232
CONV RH130 RH150 RH170combustion power MW
evaporation pressure 70 130 150 170reheat pressure - 25 25 25condensation pressure
steam temperature at SH outletsteam temperature at RH outlet - 450 450 450
gas temperature at exit of radiative section 650 673 688 694
gas temperature at inlet of convective section 650 650 650 650
Flue gas generated on the grate 124.4 124.4 124.4 124.4
plant configuration
200
0.07450
°CAss
umpt
ions
design parameter
°C
unit
bar
Main results: conventional vs RH with FGQ
S. Consonni - WastEEng 2014, 28 Aug 2014
Flue gas generated on the grate 124.4 124.4 124.4 124.4
FGR to combustion chamber 21.9 21.9 21.9 21.9
FGR to quench at exit of radiative section 0.0 7.6 12.7 15.0
Flue gas in convective section 146.3 153.9 159.0 161.3
FGR, kg per kg at boiler outlet 15.0 19.2 21.8 22.9
FGR, kg per kg generated on the grate 17.6 23.8 27.8 29.7
Steam at HP turbine inlet kg/s 66.04 60.45 60.55 60.65
Gross power HP turbine - 16.71 18.09 19.43Gross power LP turbine - 54.09 56.44 57.67
Total gross power 63.51 70.80 73.60 77.10
Net Power 56.38 63.53 66.26 69.70
Net extra power generated with RH, FGQ - 7.15 9.88 13.32
Gross Electric Efficiency 31.75 35.40 36.80 38.55Net Electric Efficiency 28.19 31.76 33.13 34.85
MWel
kg/s
Res
ults %
%

3333Efficiency vs Pev
30
32
34
36
Net
effi
cien
cy, %
reheat,
S. Consonni - WastEEng 2014, 28 Aug 2014
40 60 80 100 120 140 160 180
Evaporation pressure
24
26
28
30
Net
effi
cien
cy, %
conventional
reheat,flue gas quench

3434Capital costs (Euro 2014)
• Base estimate carried out with SteamPro / PEACE
• RH cases corrected for extended Inconel cladding + refractory coverage:
– 100% of radiative section covered with refractory (1100 Euro/m2) or Inconel (3400 Euro/m2)
– evaporator + high-temperature SH and RH (for a total of about 25% of total surface of convective section) completely
S. Consonni - WastEEng 2014, 28 Aug 2014
about 25% of total surface of convective section) completely covered with Inconel (2500 Euro/m2)
• Additional corrections to SteamPro/PEACE predictions for Electric systems, solid handling, buildings and civil works based on experience of major WTE built in Italy in the last decade
NOTICE: cost of convective sectionconvective section of boiler increases very substantially, but cost of radiative sectionradiative section tends to decrease (lower thermal power, smaller tubes)

3535Capital costs (Flue Gas Quench, Euro 2014)
Evaporation pressure, bar 70 130 150 170
Gross power output, MWel 63.51 70.80 73.60 77.10
RH No Yes Yes Yes
Grate Combustor + Boiler 106,023,271 142,650,594 147,874,391 147,993,662
Flue gas treatment system 25,659,239 27,817,262 28,818,427 32,359,935
Steam Turbine 11,049,716 14,916,068 15,624,692 16,177,916
Heat rejection system 2,726,335 2,667,227 2,720,810 2,788,220
Other components of steam cycle 1,213,331 1,272,090 1,190,703 1,386,017
Electric system + transforms + DCS 7,659,061 8,309,219 8,554,490 8,857,999
S. Consonni - WastEEng 2014, 28 Aug 2014
Waste handling 3,177,930 3,177,930 3,177,930 3,177,930
Handling of solid residues 2,398,599 2,398,599 2,398,599 2,398,599
HVAC+Buildings 11,938,833 11,938,833 11,938,833 11,938,833
Balance of plant 1,337,969 1,342,847 1,353,852 1,375,690
Civil works, roads and construction 25,854,501 25,254,224 25,205,628 25,076,495
Mechanical works 76,418,032 65,640,222 62,291,223 58,480,012
Engineering and Plant startUp 9,780,023 11,144,403 11,197,343 11,224,896
Total plant and Civil costs 285,236,840 318,529,520 322,346,922 323,236,204
Contingencies 10% 28,523,684 31,852,952 32,234,692 32,323,620
Design, safety, testing, insurance, etc 7,5% 21,392,763 23,889,714 24,176,019 24,242,715
Grand Total 335,153,287 374,272,186 378,757,634 379,802,540

3636Back-of-the-envelope cost assessment
• Extra-power generation = 13.32 MW
• Extra electricity generated in 1 yr (7800 hrs) = 104 GWh
• Extra capital cost = 44.6 M€
Plant with RH, Pev=170 bar, TSH=TRH=450°C, Flue Gas Quench
PRELIMINARY, CONSERVATIVE ESTIMATE
S. Consonni - WastEEng 2014, 28 Aug 2014
• Extra capital cost = 44.6 M€
• Assume Capital Carrying Charge 15%
• Add 4% per year of investment for O&M
• Thus, extra costs = 44.6 M€ · 0.19 = 8.5 M€/yr
• Break-even value of electricity =
[8.5 M€/yr] / [104 GWh/yr] = 81.7 €/MWh

3737Conclusions
• Given the very unfavorable characteristics of the waste fuel, improving the performance of WTE plants poses extreme challenges
• For grate combustors plants fed only with waste, steam reheat seems an interesting option
• The introduction of RH calls for a comprehensive redesign a comprehensive redesign of the whole integrated boilerof the whole integrated boiler. Flue Gas Quench allows
S. Consonni - WastEEng 2014, 28 Aug 2014
of the whole integrated boilerof the whole integrated boiler. Flue Gas Quench allows limiting the size and the cost of the radiative section while keeping safe temperatures in the convective section
•• Preliminary, conservativePreliminary, conservative estimates show that with PEV=170 bar and Tmax of steam 450°C it is possible to increase net efficiency of over 6 percentage points6 percentage points
• For a 200 MWLHV plant, the extra electricity generated with RH comes at a cost in the neighborhood of 80 80 €€/MWh/MWh

3838
Thank you for your attention !
Conclusions
S. Consonni - WastEEng 2014, 28 Aug 2014
www.mater.polimi.it