production of gordonia alkanivorans strain 1b biomass in...
TRANSCRIPT
2015
UNIVERSIDADE DE LISBOA
FACULDADE DE CIÊNCIAS
DEPARTAMENTO DE BIOLOGIA VEGETAL
Production of Gordonia alkanivorans strain 1B biomass in
bioreactor and further application towards fossil fuels
desulfurization
Mestrado em Microbiologia Aplicada
Marta Sofia Lopes Pacheco
Dissertação orientada por:
Doutor Luís Alves
Professora Doutora Ana Reis

Production of Gordonia alkanivorans strain 1B biomass in bioreactor and
further application towards fossil fuels desulfurization
Marta Sofia Lopes Pacheco
2015
This thesis was fully performed at the Department of Bioenergy of Laboratório Nacional
de Energia e Geologia (LNEG) under the direct supervision of Dr. Luís Alves in the scope
of the Master in Applied Microbiology of the Faculty of Sciences of the University of
Lisbon.
Prof. Dr. Ana Reis was the internal designated supervisor in the scope of the Master in
Applied Microbiology of the Faculty of Sciences of the University of Lisbon

Agradecimentos
Quero deixar um agradecimento a todos aqueles que ajudaram (direta ou indiretamente) à
elaboração desta dissertação e sem os quais este trabalho não teria sido possível.
Ao Doutor Luís Alves e à Doutora Susana Paixão Alves por terem aceitado ser meus orientadores e
por me terem acolhido como estagiária numa altura em que muitos outros não o fariam. O vosso
apoio, compreensão e paciência foram fundamentais para levar este trabalho a bom porto. Por tudo
isto um grande obrigado.
À Professora Doutora Ana Reis, pelos conselhos e disponibilidade para me coorientar (mesmo após
uma mudança radical de tema de dissertação). Muito obrigada por todo o apoio.
À Professora Doutora Lélia Chambel, por toda a disponibilidade demonstrada para resolver os
problemas que foram surgindo no decurso deste trabalho e por me ter aceitado neste mestrado.
Ao grupo de colegas, funcionários e investigadores do Laboratório Nacional de Energia e Geologia
(LNEG). Ao Engenheiro Carlos Barata por toda a ajuda e ensinamentos no que toca ao
funcionamento do laboratório e na solução de vários problemas. A todos os meus colegas, Doutor
Tiago Lopes, Engenheira Margarida Gonçalves, Dra. Patrícia Branco, Dra. Catarina Figueiredo e
Doutora Maria José, muito obrigada pela amizade, companhia e apoio nas mais diversas situações.
Ao Engenheiro Diogo Sebastião por todas as tertúlias que nos proporciona e por me obrigar a ir
almoçar e lanchar a horas decentes. Um obrigado muito especial à Dra. Ana Sofia Fernandes, que
comigo e com o Dr. Tiago Silva formou uma equipa de trabalho excecional. Muito obrigada pela
companhia em todos aqueles fins-de-semana de trabalho e noitadas a filtrar tupinambo e acima de
tudo pela tua amizade, apoio e compreensão quando as coisas se tornaram mais difíceis (e muito
obrigada pelos maravilhosos jantares!).
Ao meu querido grupo de amigos que já não se encontram no LNEG, Engenheiro Francisco Mendes,
por fazer sobremesas deliciosas com farinha, ao Dr. Bruno Arez, por todas as “suecadas” e noitadas,
à Dra. Diana Francisco, Dr. João Caldeira, Engenheiro Vasco Martins muito obrigada pela vossa
amizade e apoio.
Um grande obrigado há minha querida e favorita Engenheira Joana Ortigueira (à qual nem sei muito
bem como agradecer). Muito obrigada por seres uma companhia constante, por me ligares todos os
dias, por me desviares para jogar contigo, por ouvires os meus desabafos, por me ajudares com as
revisões da tese e por me mimares com cheesecake de Nutella e After Eights quando estava mais
em baixo. No fundo muito obrigada por existires e seres minha amiga.
Muito obrigada aos meus “afilhados” da FCUL, Dr. Flávio Ferreira, Dr. João Messias, Dra. Teresa
Santos, Dr. Pedro Henrique, Dr. Gonçalo Rodrigues, peço desculpa não ter estado tão presente como
devia, mas muito obrigada pela vossa amizade e pelas festas de fim-de-ano. Um obrigado especial
há minha afilhada Dra. Vera Salgado, por me ter acompanhado durante os meus tempos no LNEG,
por manter a “boa disposição geral” no laboratório e por todos os jogos de “matrecos”.
Muito obrigada ao Rui Capela, pela amizade persistente e por me obrigar a mim e ao Tiago a sair do
trabalho e ir jantar. Ao Dr. Bruno Espirito Santo por ter sido a minha companhia quando estava no
ICAT. Muito obrigada pela tua amizade e por ouvires os meus desabafos (desculpa se sou chata às
vezes).
Queria agradecer há minha família, aos meus tios e primas por todo o apoio nesta fase tão difícil da
minha vida académica. À Manuela Quental, a minha “madrinha emprestada”, por todo o apoio, força,
disponibilidade e por ajudar a minha mãe a não ficar tão preocupada com o meu trabalho, muito,
muito obrigada.
Há minha irmã, Patrícia Rodrigues, ao meu cunhado Luís Rodrigues e aos meus sobrinhos Filipa,
Tomás e Sara Rodrigues, muito obrigada por serem a minha família, por todo o apoio que me deram
e principalmente por quando nos vêm visitar terem a maior paciência e a melhor disposição do
mundo!
Ao meu amor, Dr. Tiago Silva, sem o qual, muito provavelmente, nunca teria acabado este mestrado.
Muito obrigada por me aturares, já lá vão quase 8 anos, por aturares todas as minhas más
disposições, todo o trabalho de laboratório, todas as diretas a trabalhar, por estares presente quando
mais preciso, por todos os conselhos e decisões que me ajudaste a tomar. Muito obrigado por seres
meu e estares comigo para sempre. Muito obrigada aos meus futuros sogros, João e Flora Silva por
todo o apoio e disponibilidade para me ajudar.
Por fim queria agradecer aos meus pais, José e Susete Pacheco, por compreenderem o fato de eu
querer ser cientista e nunca terem duvidado das minhas capacidades. Muito obrigada há minha mãe
por toda a preocupação, por defender sempre as minhas escolhas e por me apoiar em todas as
decisões. Muito obrigada por cuidares de mim. Muito obrigada ao meu pai, que mesmo já não
estando entre nós, continua vivo nos nossos corações. Muito obrigada por acreditares que um dia
viria a ser “doutora” e por me apoiares durante todo o meu percurso académico e por me dares a
oportunidade de ter a profissão com a qual sonhei.

Este trabalho foi financiado por fundos da FEDER, através da POFC-COMPETE e por fundos
nacionais através da FCT (Fundação para a Ciência e Tecnologia) no âmbito do projeto
Carbon4Desulf – FCOMP-01-0124-FEDER-013932 (Ex-PTDC/AAC-AMB/112841/2009). Deixo um
agradecimento especial à Doutora Susana Paixão Alves por ter coorientado o trabalho na Unidade
de Bioenergia do LNEG. Agradeço também a colaboração da Dra. Margarida Monteiro na
manutenção do microrganismo utilizado.
Resumo
A população mundial tem vindo a crescer exponencialmente nos últimos 100 anos, maioritariamente
nos países em desenvolvimento como a China ou a India. Estas populações continuam a usar o
petróleo como fonte primária de combustível, esperando-se por isso um aumento da procura de
11,25% até 2035 (OPEC 2013). A descoberta da tecnologia necessária para a extração de crude de
zonas de difícil perfuração revolucionou o mercado da energia, diminuindo o preço do barril de
petróleo até valores históricos (U.S Energy Informaton Administration 2014). Contudo, crudes
extraídos destes novos poços possuem na sua composição grandes quantidades de compostos de
enxofre e outros contaminantes cuja remoção é extremamente complicada, sendo designados
“crudes pesados”. A combustão dos petróleos e derivados leva à libertação destes compostos, para
a atmosfera, podendo causar diversos problemas ambientais e de saúde. Desta forma, é imperativa
a sua remoção, sendo que diversos países, tais como os Estados Unidos da América, a China e os
países pertencentes à União Europeia, começaram a legislar de modo a restringirem a quantidade
de enxofre presente nos produtos petrolíferos, exigindo a criação do chamado “ultra-low sulfur oil”
(OPEC 2014).
Hoje em dia, o processo utilizado nas refinarias para a remoção de enxofre dos crudes é a
hidrodessulfurização (HDS). Este processo consiste na utilização de altas temperaturas e pressões
e catalisadores de última geração para remover os compostos de enxofre. Contudo, compostos como
o dibenzotiofeno (DBT), que são os grandes contribuidores para o enxofre presente nos crudes, são
altamente recalcitrantes a este processo, uma vez que a molécula de enxofre se encontra rodeada
por dois anéis benzénicos. Para a remoção destes compostos, a indústria desenvolveu a HDS
profunda. Esta utiliza temperaturas e pressões mais elevadas que a HDS e catalisadores mais
eficientes sendo também menos ecológica e mais dispendiosa (Klein 1999).
Existe no entanto uma alternativa biológica à HDS profunda, a biodessulfurização (BDS). Esta é um
processo biotecnológico equivalente à HDS, uma vez que remove o enxofre de compostos
complexos. Nas últimas décadas, a BDS tem vindo a atrair atenções, visto que tem a capacidade de
processar os combustíveis fósseis de uma forma amiga do ambiente. Esta dá-se a temperaturas e
pressões iguais às ambientais e é efetuada por microrganismos que têm a capacidade de metabolizar
compostos de enxofre (Soleimani et al. 2007; Alves & Paixão 2011).
Neste estudo foi utilizada a bactéria Gordonia alkanivorans estirpe 1B. As espécies do género
Gordonia são bastante atrativas para usos biotecnológicos, uma vez que, têm a capacidade de
degradar inúmeros poluentes ambientais, tais como hidrocarbonetos policíclicos aromáticos,
alquilpiridinas, xenobióticos ou polímeros naturais. Têm também a capacidade de transformar ou
sintetizar compostos orgânicos (transformação de esteroides e produção de carotenoides) (Linos et
al. 1999; Harner et al. 2011; Grace Liu et al. 2011). A estirpe 1B já tinha sido descrita como tendo a
capacidade de converter DBT em 2-HBP (2-hidroxibifenil) por Alves et al. (2005). Foi igualmente
demonstrado, por Alves (2007), que a bactéria em questão possui, à semelhança de Rodococcus
erythropolis (uma espécie até então muito utilizada em ensaios de dessulfurização), um operão dsz,
composto pelos genes dszA, dszB e dszC que codificam as proteínas necessárias para que a célula
consiga dessulfurizar. Alves & Paixão (2014b) identificaram também outra característica metabólica
interessante na estirpe 1B, nomeadamente o fato de esta crescer preferencialmente utilizando
frutose como fonte de carbono.
Este comportamento é raro em bactérias, contudo abriu uma nova linha de investigação em que se
deu prioridade à pesquisa de fontes de carbono alternativas, ricas em frutose (nomeadamente
resíduos agroindustriais), tais como melaço de cana, medronho, alfarroba ou tubérculos de
tupinambo (Silva 2012; Silva et al. 2012; Alves & Paixão 2014a; Silva et al. 2015). Todas estas fontes
de carbono alternativas produziram melhores resultados de dessulfurização quando comparadas
com fontes ricas em glucose, contudo, o sumo de tupinambo (JAJ) foi o melhor, de entre as fontes
alternativas ricas em frutose testadas (Silva 2012). Os tubérculos de tupinambo são ricos em inulina,
um frutano linear composto por um número variável de moléculas de frutose unidas por ligações
β (2 →1) com uma molécula de glucose no final, ligada à cadeia de frutoses por uma ligação
α (1 → 2). A inulina é solúvel em água e pode ser facilmente hidrolisada (através de hidrólise ácida
ou enzimática), libertando frutose (até 95%) e glucose (Silva 2012; Paixão et al. 2013). Por estas
razões, o JAJ foi escolhido como a fonte de carbono alternativa a ser utilizada neste trabalho.
Sendo que a BDS é mais eficiente e menos dispendiosa que a HDS profunda, pode ser utilizada nas
refinarias como um complemento à HDS de maneira a produzir combustíveis com muito baixo teor
de enxofre (Alves et al. 2015). Quando implementada, esta técnica vai diminuir os problemas
ambientais levantados pela HDS, reduzindo a emissão de CO2, a produção de resíduos e o consumo
de energia. Tudo isto se traduz em menos capital investido (dois terços do capital necessário para a
HDS) e menos custos operacionais (Vazquez-Duhalt et al. 2002; Alves et al. 2015). O processo de
BDS pode ainda beneficiar da produção simultânea de produtos de alto valor acrescentado, que
podem ser valorizados através de outros processos industriais (De Miguel et al. 2000; De Miguel et
al. 2001; Veiga-Crespo et al. 2012; Bandyopadhyay & Chowdhury 2014).
Este trabalho, teve como objetivo principal a minimização do meio de cultura utilizado para o
crescimento da bactéria Gordonia alkanivorans estirpe 1B (meio mínimo sem sulfatos/meio SFM).
Para isso, avaliou-se quais os componentes do meio mais importantes para o crescimento e
desenvolvimento celular, tendo sido selecionados para minimização a fonte de azoto (NH4Cl), a fonte
de magnésio (MgCl2.6H20) e a solução de micronutrientes (TES), primeiro em frasco agitado e de
seguida em cultura em contínuo.
O azoto (N) é um grande interveniente no crescimento celular e um dos nutrientes necessários à vida
como a conhecemos. Faz parte da composição de aminoácidos, ácidos nucleicos e
enzimas/coenzimas e no meio mínimo utilizado para crescer a bactéria G. alkanivorans é o nutriente
utilizado em maior concentração (1,22 g.l-1), sem contar com a fonte de carbono (Singh 1971; Alves
et al. 2015). Portanto, para minimizar a quantidade de fonte de azoto foram testadas diversas
formulações do SFM com concentrações decrescentes de NH4Cl (F#1 – 100%, F#2 – 75%, F#3 –
50% e F#4 – 25%). Os resultados obtidos mostraram que o crescimento foi grandemente afetado
tanto com F#4 como com F#3. Nestes dois casos não houve consumo total dos açúcares fornecidos,
provando que a quantidade de azoto era insuficiente. Contudo, com F#2, a curva de crescimento foi
semelhante à produzida pelo controlo F#1, ocorrendo o consumo total dos açúcares.
No que toca à dessulfurização, quando crescida com a F#1, a cultura conseguiu obter uma taxa
máxima específica de produção de 2-HBP (q2-HBP) de 2,5 µmol.g-1(peso seco).h-1, com consumo total
do DBT fornecido. Mas, com a diminuição da concentração de azoto, a q2-HBP foi também
decrescendo, atingindo um valor de 2,4 µmol.g-1(peso seco).h-1 no crescimento com F#2;
2,3 µmol.g-1(peso seco).h-1 no crescimento com F#3; e 1,4 µmol.g-1(peso seco).h-1 no crescimento
com F#4. Nestas três condições testadas não ocorreu o consumo total do DBT fornecido, indicando
que a concentração de azoto utilizada não foi suficiente. Contudo, o facto de o crescimento ter
ocorrido normalmente com a F#2 indica que esta está muito próxima da concentração mínima
necessária à célula, portanto 75% <fonte de N mínima <100%.
Quanto ao magnésio (Mg), este foi escolhido como um dos elementos do meio a minimizar pois é
essencial à divisão celular e é um interveniente especialmente importante para bactérias gram-
positivas, uma vez que faz parte da estrutura do peptidoglicano (Webb 1939). Ao testar-se
concentrações decrescentes de MgCl2.6H20 (F#1 – 100%; F#5 – 75%; F#6 – 50%; F#7 – 25%), foi
possível observar que não houve alterações significativas nem no perfil de crescimento (sendo a
absorvância a 600 nm (OD600nm) semelhante para todas as formulações testadas), nem no consumo
de açúcares. Contudo, em termos de dessulfurização, verificou-se um comportamento interessante.
A diminuição da concentração de magnésio levou a um aumento significativo da q2-HBP de
2,5 µmol.g-1(peso seco).h-1 (F#1) para 2,8 µmol.g-1(peso seco).h-1 (F#5); 3,0 µmol.g-1(peso seco).h-1
(F#6); e 3,4 µmol.g-1(peso seco).h-1 (F#7). Este resultado indica que o magnésio pode inibir, de certa
forma, a dessulfurização, de tal modo que a diminuição da concentração utilizada faz com que esta
aumente significativamente.
O último componente do meio testado foi a solução de micronutrientes (TES). Esta solução é
composta por minerais como ferro, zinco, molibdénio, manganésio ou cobalto (Alves & Paixão
2014b). Estes micronutrientes fazem parte da estrutura das proteínas celulares e funcionam muitas
vezes como cofatores (Majzlik et al. 2011; Kirsch & Eitinger 2014). Neste caso, as concentrações
testadas anteriormente (F#8 – 75%, F#9 – 50% e F#10 – 25%) não foram suficientes para se observar
diferenças quer no crescimento, quer no consumo de açúcares, quer em termos de dessulfurização.
Testaram-se então concentrações mais baixas, nomeadamente, 5% (F#11), 2,5% (F#12) e 0%
(F#13). Com estas concentrações já foi possível observar alterações nos parâmetros avaliados. Com
F#11, as células foram capazes de consumir toda a fonte de carbono fornecida, contudo, só o fizeram
após 118 horas de crescimento. Relativamente às restantes concentrações, verificou-se que não
houve conclusão do crescimento visto não ter ocorrido o consumo total da fonte de carbono. Quanto
à dessulfurização, o consumo total do DBT foi atingido em todos os frascos, exceto na ausência de
TES. Para F#8, F#9 e F#10, a q2-HBP foi mais elevada que o controlo, sendo que nas restantes
concentrações testadas foi quase duas vezes mais baixa.
A informação obtida nos diferentes ensaios em frasco agitado permitiu a minimização das
concentrações dos três componentes essenciais presentes na formulação original do meio, sem
afetar negativamente o crescimento celular e ainda melhorando a dessulfurização. Estes resultados
permitiram desenvolver o meio SFM minimizado, ao qual se denominou “meio SFMM”, consistindo
em 85% N (estipulado através de uma extrapolação baseada nos resultados do consumo de
açúcares e desulfurização), 25% Mg e 25% TES. De seguida, o meio SFMM e o meio SFM foram
testados com duas fontes de carbono distintas: frutose + glucose e JAJ precipitado (JAJp). Em geral,
estes ensaios demostraram que, independentemente da fonte de carbono utilizada, a utilização do
meio minimizado (meio SFMM) aumentou a dessulfurização pela estirpe 1B, em comparação com o
respetivo controlo (meio SFM).
Este facto foi de encontro ao esperado, uma vez que a minimização do Mg e do TES fez com que a
q2-HBP fosse mais elevada. A estirpe 1B foi capaz de crescer normalmente no meio minimizado e não
foram observados efeitos de sinergia negativos entre os compostos do meio. Comparando os
resultados por fonte de carbono é possível observar, no entanto, que para ambos os meios (SFM e
SFMM), as taxas máximas de crescimento (µmax) e a dessulfurização (q2-HBP) foram mais baixas
quando o JAJp foi utilizado como fonte de carbono. Isto pode ser o resultado de um efeito inibitório
causado pelo cloreto de bário utilizado durante a precipitação dos sulfatos.
Para a BDS ser integrada nas refinarias, a produção de biomassa deverá ocorrer num quimiostato
trabalhando em modo contínuo (Pacheco 1999). Este sistema tem a vantagem de permitir o controlo
total sobre diversos parâmetros da cultura, tais como a temperatura, a agitação, o pH, o arejamento
e a velocidade a que o meio de cultura entra no quimiostato. Tendo isto em conta, o passo seguinte
consistiu na adaptação do SFMM (anteriormente otimizado em frasco agitado) para uso em
quimiostato. Sendo que este trabalho tem como base a minimização de custos do processo, foi
igualmente desenvolvido um quimiostato de baixo custo. Neste, foi efetuado um “screening” à
concentração de azoto, uma vez que tinha ficado estipulado no ensaio de frasco que a concentração
ótima seria um valor entre 75-100%.
Tal como foi observado no ensaio em frasco agitado, os parâmetros analisados foram melhores com
o aumento da concentração de azoto. Ensaios de citometria de fluxo foram efetuados de modo a
perceber o estado fisiológico das células crescidas com as diferentes concentrações de azoto. Foi
possível observar que com menos de 100% de azoto, a percentagem de células com a membrana
comprometida aumenta, sendo que as percentagens de células metabolicamente inativas ou mortas
mantêm-se constantes. Um dos parâmetros que pode ser utilizado para calcular a concentração
ótima de NH4Cl é a taxa de produção de biomassa (BPR). Fazendo uma regressão polinomial da
BPR = f (concentração de N) foi possível interpolar que 90% seria a concentração mais acertada,
uma vez que o valor da BPR foi muito semelhante ao obtido com o 100%.
Desenhado o meio SFMM para quimiostato (meio SFMMR), consistindo em 90% N, 25% Mg e 25%
TES, este foi testado com duas fontes de carbono: frutose + glucose versus JAJ para a produção de
biocatalizadores. A taxa de diluição foi de 0,065 h-1 para crescimentos com fontes comerciais e 0,045
h-1 para crescimentos com JAJ (fonte alternativa de carbono), com base nos resultados previamente
obtidos em frasco agitado. Comparando os dados metabólicos das duas culturas em estado
estacionário SS#5 e SS#6 (SS#5 – SFMMR + (Frutose + Glucose); SS#6 – SFMMR + JAJ
concentrado/JAJc), é possível observar que a cultura SS#5 apresenta uma produção de biomassa
(3,97 g.l-1) superior à da cultura SS#6 (3,10 g.l-1), sendo estes resultados consistentes com os
restantes parâmetros metabólicos associados ao crescimento (OD600nm, biomassa, taxa de produção
de biomassa, taxas de consumo de açúcares, qFru, qGlu). Contudo, esta diferença de 1,7 vezes pode
estar associada às diferenças na taxa de diluição, sendo que, no SS#5 foi 0,065 h-1 e no SS#6 foi de
0,045 h-1 o que pode levar à produção de células metabolicamente mais ativas. Quanto aos
resultados obtidos para a recuperação de carbono (CR), a eficiência da conversão de carbono (CCE)
e o rendimento celular (Yx/s), verificou-se que são muito semelhantes para ambas as culturas,
demonstrando um comportamento similar das células crescidas no meio minimizado, apesar da
utilização de uma fonte de carbono diferente. O meio SFMMR também permitiu o consumo total da
fonte de carbono (e por consequência de todos os nutrientes do meio) em ambas as culturas SS,
permitindo obter um q2-HBP de 2,90 µmol.g-1(peso seco).h-1 para o SS#5 e um q2-HBP de
12,23 µmol.g-1(peso seco).h-1 para o SS#6, sendo este último 4 vezes superior ao obtido com o meio
SFMMR com a fonte de carbono comercial (Frutose + Glucose).
Os resultados obtidos recorrendo à citometria de fluxo demonstraram que em ambos os SS, as
células se encontram maioritariamente saudáveis, sendo a percentagem de células viáveis
aproximadamente 93% tanto para a cultura SS#5, como para a cultura SS#6. Desta forma, os
resultados metabólicos e fisiológicos apontam para as células da cultura SS#6 (SFMMR + JAJc) como
sendo os biocatalizadores otimizados e mais eficientes em termos de custos e em termos de
produtividade (biodessulfurização). A taxa de dessulfurização obtida com este meio foi igualmente
2,4 vezes superior à obtida por Silva (2012) utilizando células da estirpe 1B crescidas em JAJp
(q2-HBP = 5,06 µmol.g-1(peso seco).h-1).
Para melhor compreender as diferenças observadas em termos de dessulfurização, utilizou-se a
técnica de PCR em tempo real para analisar a expressão dos genes dszA, dszB e dszC. Analisando
os resultados observou-se uma grande diminuição na expressão dos genes dszB e dszA no caso da
cultura SS#5 (SFMMR + Frutose + Glucose), em comparação com a cultura SS#6 (SFMMR + JAJc).
Estes resultados podem explicar a diferença entre taxas de dessulfurização, uma vez que a
expressão dos genes necessários à via não está a ocorrer na mesma proporção.
Numa refinaria, as células de G. alkanivorans estirpe 1B vão ter que dessulfurizar petróleo, que é
rico em diferentes espécies de tiofenos (onde está incluído o DBT). À escala laboratorial, o crude
pode ser mimetizado utilizando uma mistura de tiofenos dissolvidos num solvente orgânico
(combustível modelo). Desta forma testou-se o desempenho de células provenientes do quimiostato,
crescidas com SFMMR + JAJc (cultura SS#6), a dessulfurizar um combustível modelo. Os resultados
obtidos indicam que as células foram capazes de dessulfurizar 500 µM de uma mistura de DBT e
derivados de DBT em apenas 72 h, sendo que ao final deste tempo já só são observáveis os produtos
da dessulfurização.
De modo a viabilizar economicamente todo este processo é necessário aproveitar produtos
secundários que a célula possa produzir. No caso da bactéria utlizada neste estudo, durante o
crescimento, são produzidos pigmentos (entre outros produtos secundários) que podem ser
aproveitados após a dessulfurização. Neste contexto, os pigmentos produzidos pela estirpe 1B foram
extraídos de células de ambos os crescimentos em quimiostato (culturas SS#5 e SS#6), antes e após
a dessulfurização. Após a sua identificação em HPLC, observou-se que os pigmentos obtidos são
principalmente da família dos carotenoides, sendo que dos vários picos observados, houve
correspondência para a astaxantina, luteína e cantaxantina. Os resultados obtidos demonstram que
as células exaustas (SS#5-postBDS; SS#6-postBDS) produziram maiores quantidades dos
carotenoides identificados (luteína, astaxantina e cantaxantina) do que as células frescas
(SS#5-preBDS; SS#6-postBDS). A luteína foi o carotenoide mais abundante, tanto para as células
pré-dessulfurização como para as células pós-dessulfurização de ambos os estados estacionários.
Estes resultados também demonstraram um perfil de carotenoides diferente para as células
produzidas no SS#5 e no SS#6. As células produzidas no SS#5-postBDS atingiram uma produção
total de pigmentos de 265 µg.g-1(peso seco), enquanto que as células produzidas no SS#6 obtiveram
uma produção total de pigmentos de 334 µg.g-1(peso seco). Como a dessulfurização do DBT
melhorou a produção generalizada de todos os pigmentos, a exploração destes produtos de alto
valor acrescentado a partir das células exaustas pode estar associada ao processo de
biodessulfurização, como um fator determinante ao seu equilíbrio económico (Paixão et al. 2016).
A biodessulfurização é um passo importante para tornar o processo de tratamento de crudes um
pouco mais ecológico e amigo do ambiente. Este trabalho permitiu a redução dos componentes do
meio de cultura necessário para o crescimento da estirpe 1B e levando ao aumento da capacidade
de dessulfurização dos biocatalizadores utilizados na biodessulfurização de combustíveis fósseis e
à redução do custo associado à sua produção.
Palavras-chave: Biodessulfurização; enxofre; petróleo; Gordonia alkanivorans estirpe 1B;
minimização de meios de cultura; bio-reator.
Abstract
Biodesulfurization is an eco-friendly process for the production of ultra-low sulfur fuels. Optimization
studies towards the integration of this technology in a petroleum refinery are an important focus of
research. The main goal of this study consisted on the minimization of the sulfur free mineral (SFM)
medium for the maximum production of efficient desulfurizing biocatalysts (Gordonia alkanivorans
active cells) taking into account the lowest operational costs. In this context, a series of assays, first
in shake-flask and then in chemostat, were carried out to develop and optimize a culture medium
containing minimal amounts of Nitrogen and Magnesium sources and TES (trace elements solution).
The shake-flask minimization assays allowed the design of a SFMM (SFM minimum) medium
containing 75-100% Nitrogen source, 25% Magnesium source and 25% TES, which permitted
enhanced desulfurization in comparison with control medium (SFM). This combined reduction was
then applied to the SFM reactor medium and the culture conditions were optimized in chemostat
assays. After screening for the minimal amount of Nitrogen source using a low-cost bioreactor, the
established SFMMR (SFMM reactor) medium was 90% NH4Cl, 25% MgCl2 and 25% TES. This
SFMMR medium was tested in two additional continuous cultures and adjusted in order to obtain the
maximum yield of biocatalysts (strain 1B resting cells). The use of Jerusalem artichoke juice
concentrate as the single carbon source caused a 4-fold increase in desulfurization capability of the
biocatalysts (maximum specific 2-hidroxybiphenyl production rate = 12.2 µmol.g-1(dry cell weight).h-
1). These results were consistent with the Real Time-PCR analysis, which showed a higher expression
of the overall desulfurization genes (dszA, dszB, dszC) in these biocatalysts. Furthermore, these
biocatalysts were also capable of total desulfurization of a model oil, with the exhausted biomass
producing 334 μg.g-1(dry cell weight) of high added-value carotenoids, highlighting their potential
towards a cost-effective industrial scale-up.
Key-words: Biodesulfurization; sulfur; crude oil; Gordonia alkanivorans strain 1B; culture media
minimization; bioreactor.
Abbreviation list
2-HBP – 2-Hydroxybiphenyl
atm – Atmosphere
BDS – Biodesulfurization
CCE – Carbon Conversion Efficiency
C-content – Carbon Content
cDNA – Complementary Deoxyribonucleic Acid
CFDA – 5,6-carboxyfluorescein diacetate
CR – Carbon Recovery (percentage of supplied carbon that is used in the cell constitution)
DBT – Dibenzothiophene
DBTO – Dibenzothiophene 5-oxide
DBTO2 – Dibenzothiophene 5,5-oxide
DCW – Dry Cell Weight
DMF – Dimethylformamide
DMSO – Dimethyl Sulfoxide
DPM – Diesel Particulate Matter
EU – European Union
F# – Formulation Number
Fru – Fructose
Fru+Glu – Fructose + Glucose
g.g-1 – gram per gram
GC – Gas Chromatography
GHG – Greenhouse Gas
Glu – Glucose
HDS – Hydrodesulfurization
HPBS – 2-(2’-hydroxyphenyl) benzene sulfinate
HPLC – High Precision Liquid Chromatography
JAJ – Jerusalem artichoke Juice
JAJC –Jerusalem artichoke Juice Concentrate
JAJp – Sulfate precipitated Jerusalem artichoke juice
LwL – Lower Left Quadrant
LwR – Lower Right Quadrant
mb.d-1 – Million Barrels per Day
MEOR – Microbial Enhanced Oil Recovery
Mg-content – Magnesium Content
N-content – Nitrogen Content
OD600nm – Absorbance at 600 nm
ODS – Oxidative Desulfurization
OEDS – Oxidative Desulfurization Combined with Extraction
PCR – Polymerase Chain Reaction
PI – Propidium Iodide
q2-HBP – Specific Desulfurization Rate
qCO2 – Specific Rate of Carbon Dioxide Production
qFru – Specific Rate of Fructose Consumption
qSO4 – Specific Rate of Sulfate Consumption
RC – Resting cells
RNA – Ribonucleic Acid
rpm – Rotations per Minute
RT-PCR – Real Time Polymerase Chain Reaction
S-content – Sulfur Content
SFM – Sulfur Free Mineral
SFMM – Sulfur Free Mineral Minimum
SFMMR – Sulfur Free Mineral Minimum (Medium Adapted for Bioreactor)
SFMR – Sulfur Free Mineral (Medium Adapted for Bioreactor)
SS# – Steady-state Culture Number
TES – Trace Element Solution
UpL – Upper Left Quadrant
UpR – Upper Right Quadrant
USA – United States of America
v.v-1 – Volume per Volume
vvm – Volume per volume per minute
w.v-1 – Weight per Volume
Yx/s – Cell Yield (cell mass produced per mole of substrate consumed)
Index 1. Introduction ................................................................................................................................... 1
1.1. World energy demand ............................................................................................................ 1
1.2. The importance of oil .............................................................................................................. 1
1.3. The impact of sulfur in oil quality and environment ................................................................. 3
1.4. Hydrodesulfurization ............................................................................................................... 5
1.5. Biodesulfurization ................................................................................................................... 6
1.5.1. Dibenzothiophene and biodesulfurization pathways ......................................................... 7
1.6. Gordonia alkanivorans strain 1B ........................................................................................... 10
1.6.1. Desulfurization ability ..................................................................................................... 10
1.6.2. Fructophilic behavior and its influence on desulfurization ability ..................................... 11
1.7. Jerusalem artichoke as a sustainable carbon source for BDS .............................................. 11
1.8. Challenges towards biodesulfurization industrial scale-up .................................................... 14
1.9. Scope of the thesis ............................................................................................................... 16
2. Materials and methods ................................................................................................................ 16
2.1. Chemicals and reagents ....................................................................................................... 16
2.2. Jerusalem artichoke juice ..................................................................................................... 17
2.3. Microorganism and culture media ......................................................................................... 17
2.4. Culture medium minimization: shake-flask assays ................................................................ 18
2.5. Minimum culture medium: optimization in chemostat ............................................................ 19
2.5.1. BDS assays using resting cells ...................................................................................... 20
2.5.2. Pigments extraction ....................................................................................................... 21
2.6. Analytical methods ............................................................................................................... 21
2.6.1. Optical density and dry cell weight ................................................................................. 21
2.6.2. Sulfate analysis .............................................................................................................. 21
2.6.3. Desulfurization assessment ........................................................................................... 22
2.6.4. Sugar measurement ...................................................................................................... 22
2.6.5. Cell health assessment .................................................................................................. 22
2.6.6. Real Time-PCR assays: Desulfurization gene expression assessment .......................... 23
2.6.7. Pigments quantification and analysis ............................................................................. 24
3. Results and discussion ............................................................................................................... 24
3.1. Culture medium minimization in shaken flask assays ........................................................... 24
3.1.1. Nitrogen source (NH4Cl) ................................................................................................ 25
3.1.2. Magnesium source (MgCl2.6H2O) .................................................................................. 27
3.1.3. Trace Element Solution (TES)........................................................................................ 29
3.1.4. Minimized medium: commercial versus alternative C-source ......................................... 32
3.2. Minimum culture medium: optimization in chemostat ............................................................ 35
3.2.1. Optimization of the N-source minimization in a low-cost chemostat ............................... 36
3.2.2. Minimized medium: commercial versus alternative C-source ......................................... 40
3.3. Evaluation of the expression of the dsz operon by Real Time-PCR ...................................... 42
3.4. Desulfurization of a model oil................................................................................................ 43
3.5. Pigments analysis of pre and post-desulfurizing resting cells ............................................... 44
4. Conclusion .................................................................................................................................. 46
5. Future Works .............................................................................................................................. 47
6. Bibliography ................................................................................................................................ 47
1
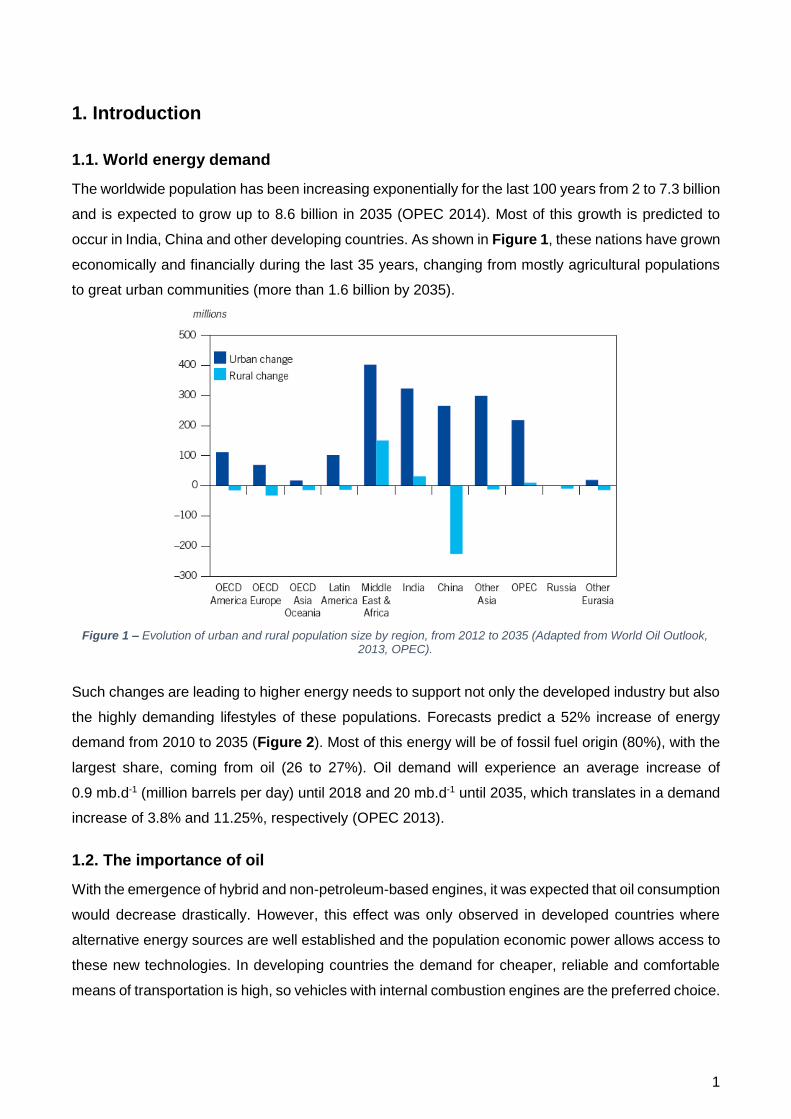
Figure 1 – Evolution of urban and rural population size by region, from 2012 to 2035 (Adapted from World Oil Outlook, 2013, OPEC).
1. Introduction
1.1. World energy demand
The worldwide population has been increasing exponentially for the last 100 years from 2 to 7.3 billion
and is expected to grow up to 8.6 billion in 2035 (OPEC 2014). Most of this growth is predicted to
occur in India, China and other developing countries. As shown in Figure 1, these nations have grown
economically and financially during the last 35 years, changing from mostly agricultural populations
to great urban communities (more than 1.6 billion by 2035).
Such changes are leading to higher energy needs to support not only the developed industry but also
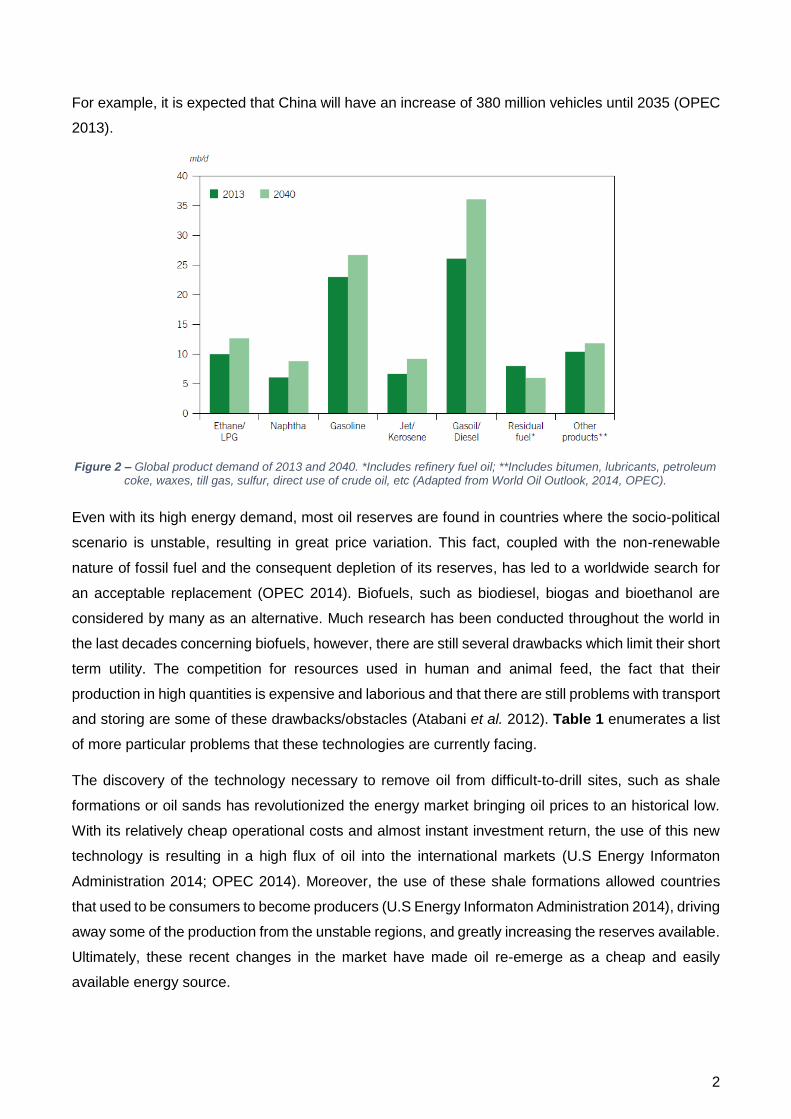
the highly demanding lifestyles of these populations. Forecasts predict a 52% increase of energy
demand from 2010 to 2035 (Figure 2). Most of this energy will be of fossil fuel origin (80%), with the
largest share, coming from oil (26 to 27%). Oil demand will experience an average increase of
0.9 mb.d-1 (million barrels per day) until 2018 and 20 mb.d-1 until 2035, which translates in a demand
increase of 3.8% and 11.25%, respectively (OPEC 2013).
1.2. The importance of oil
With the emergence of hybrid and non-petroleum-based engines, it was expected that oil consumption
would decrease drastically. However, this effect was only observed in developed countries where
alternative energy sources are well established and the population economic power allows access to
these new technologies. In developing countries the demand for cheaper, reliable and comfortable
means of transportation is high, so vehicles with internal combustion engines are the preferred choice.
2
Figure 2 – Global product demand of 2013 and 2040. *Includes refinery fuel oil; **Includes bitumen, lubricants, petroleum coke, waxes, till gas, sulfur, direct use of crude oil, etc (Adapted from World Oil Outlook, 2014, OPEC).
For example, it is expected that China will have an increase of 380 million vehicles until 2035 (OPEC
2013).
Even with its high energy demand, most oil reserves are found in countries where the socio-political
scenario is unstable, resulting in great price variation. This fact, coupled with the non-renewable
nature of fossil fuel and the consequent depletion of its reserves, has led to a worldwide search for
an acceptable replacement (OPEC 2014). Biofuels, such as biodiesel, biogas and bioethanol are
considered by many as an alternative. Much research has been conducted throughout the world in
the last decades concerning biofuels, however, there are still several drawbacks which limit their short
term utility. The competition for resources used in human and animal feed, the fact that their
production in high quantities is expensive and laborious and that there are still problems with transport
and storing are some of these drawbacks/obstacles (Atabani et al. 2012). Table 1 enumerates a list
of more particular problems that these technologies are currently facing.
The discovery of the technology necessary to remove oil from difficult-to-drill sites, such as shale
formations or oil sands has revolutionized the energy market bringing oil prices to an historical low.
With its relatively cheap operational costs and almost instant investment return, the use of this new
technology is resulting in a high flux of oil into the international markets (U.S Energy Informaton
Administration 2014; OPEC 2014). Moreover, the use of these shale formations allowed countries
that used to be consumers to become producers (U.S Energy Informaton Administration 2014), driving
away some of the production from the unstable regions, and greatly increasing the reserves available.
Ultimately, these recent changes in the market have made oil re-emerge as a cheap and easily
available energy source.
3
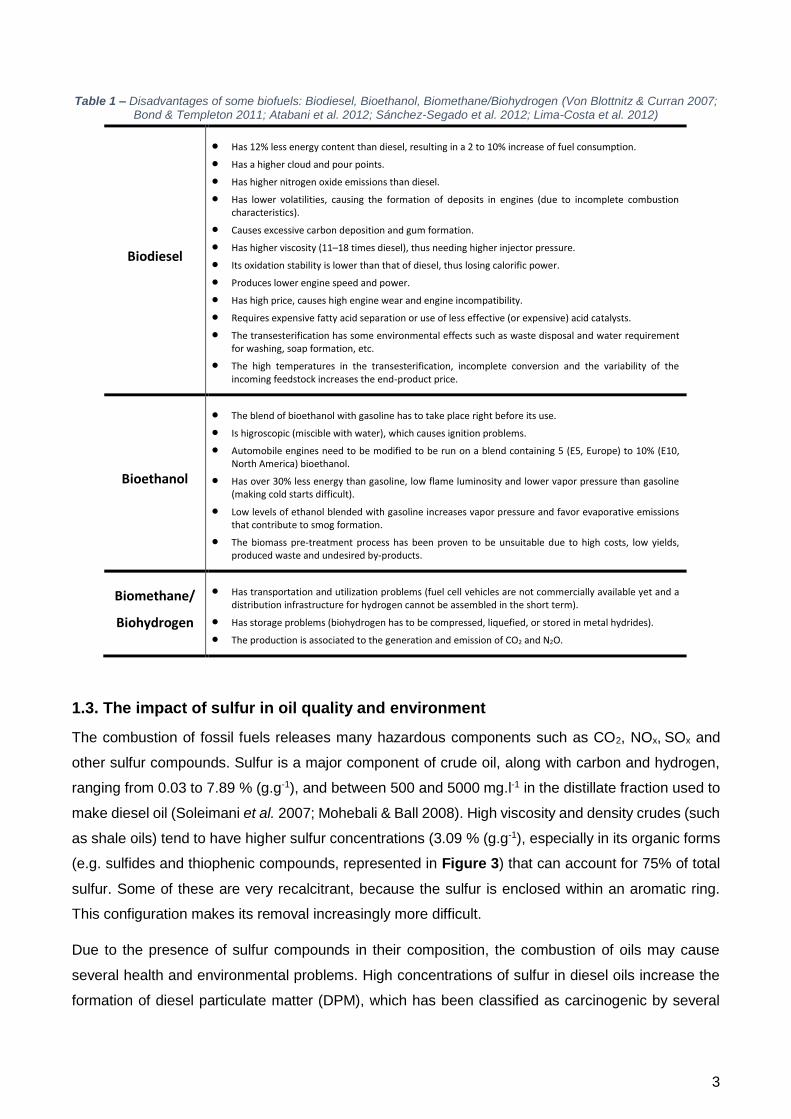
Table 1 – Disadvantages of some biofuels: Biodiesel, Bioethanol, Biomethane/Biohydrogen (Von Blottnitz & Curran 2007; Bond & Templeton 2011; Atabani et al. 2012; Sánchez-Segado et al. 2012; Lima-Costa et al. 2012)
1.3. The impact of sulfur in oil quality and environment
The combustion of fossil fuels releases many hazardous components such as CO2, NOx, SOx and
other sulfur compounds. Sulfur is a major component of crude oil, along with carbon and hydrogen,
ranging from 0.03 to 7.89 % (g.g-1), and between 500 and 5000 mg.l-1 in the distillate fraction used to
make diesel oil (Soleimani et al. 2007; Mohebali & Ball 2008). High viscosity and density crudes (such
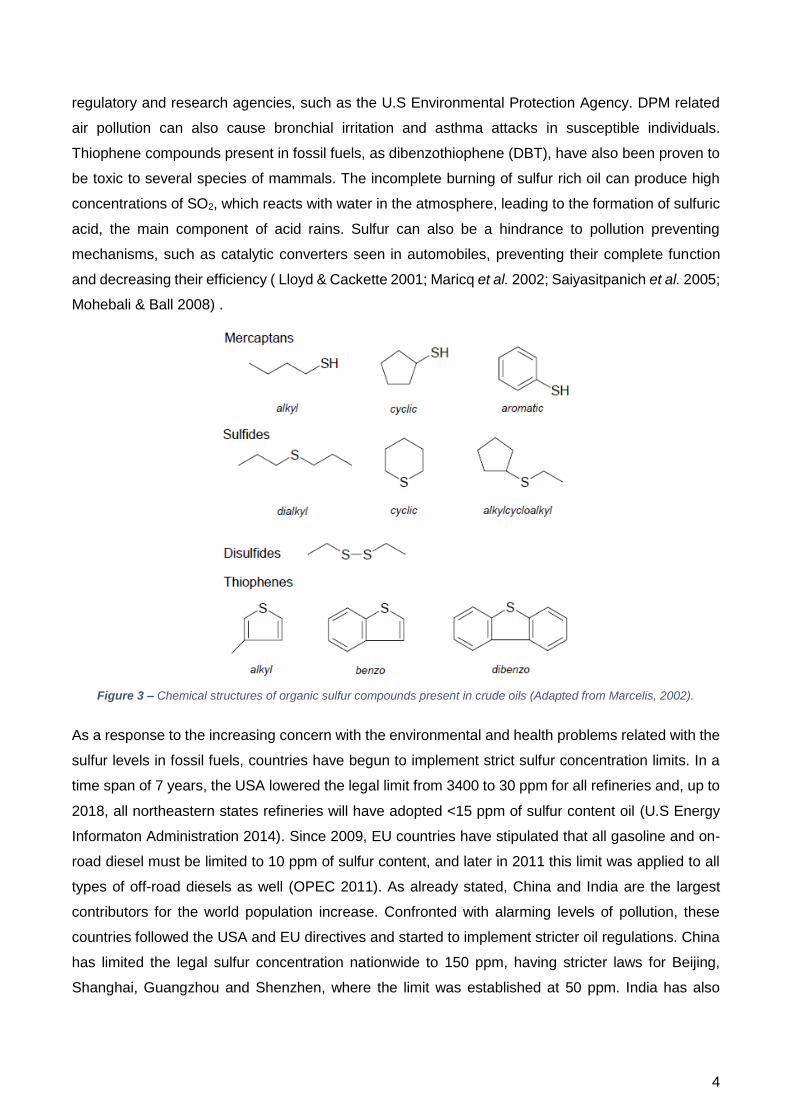
as shale oils) tend to have higher sulfur concentrations (3.09 % (g.g-1), especially in its organic forms
(e.g. sulfides and thiophenic compounds, represented in Figure 3) that can account for 75% of total
sulfur. Some of these are very recalcitrant, because the sulfur is enclosed within an aromatic ring.
This configuration makes its removal increasingly more difficult.
Due to the presence of sulfur compounds in their composition, the combustion of oils may cause
several health and environmental problems. High concentrations of sulfur in diesel oils increase the
formation of diesel particulate matter (DPM), which has been classified as carcinogenic by several
Biodiesel
Has 12% less energy content than diesel, resulting in a 2 to 10% increase of fuel consumption. Has a higher cloud and pour points. Has higher nitrogen oxide emissions than diesel. Has lower volatilities, causing the formation of deposits in engines (due to incomplete combustion
characteristics). Causes excessive carbon deposition and gum formation. Has higher viscosity (11–18 times diesel), thus needing higher injector pressure. Its oxidation stability is lower than that of diesel, thus losing calorific power. Produces lower engine speed and power. Has high price, causes high engine wear and engine incompatibility. Requires expensive fatty acid separation or use of less effective (or expensive) acid catalysts. The transesterification has some environmental effects such as waste disposal and water requirement
for washing, soap formation, etc. The high temperatures in the transesterification, incomplete conversion and the variability of the
incoming feedstock increases the end-product price.
Bioethanol
The blend of bioethanol with gasoline has to take place right before its use. Is higroscopic (miscible with water), which causes ignition problems. Automobile engines need to be modified to be run on a blend containing 5 (E5, Europe) to 10% (E10,
North America) bioethanol. Has over 30% less energy than gasoline, low flame luminosity and lower vapor pressure than gasoline
(making cold starts difficult). Low levels of ethanol blended with gasoline increases vapor pressure and favor evaporative emissions
that contribute to smog formation. The biomass pre-treatment process has been proven to be unsuitable due to high costs, low yields,
produced waste and undesired by-products.
Biomethane/
Biohydrogen
Has transportation and utilization problems (fuel cell vehicles are not commercially available yet and a distribution infrastructure for hydrogen cannot be assembled in the short term).
Has storage problems (biohydrogen has to be compressed, liquefied, or stored in metal hydrides). The production is associated to the generation and emission of CO2 and N2O.
4
Figure 3 – Chemical structures of organic sulfur compounds present in crude oils (Adapted from Marcelis, 2002).
regulatory and research agencies, such as the U.S Environmental Protection Agency. DPM related
air pollution can also cause bronchial irritation and asthma attacks in susceptible individuals.
Thiophene compounds present in fossil fuels, as dibenzothiophene (DBT), have also been proven to
be toxic to several species of mammals. The incomplete burning of sulfur rich oil can produce high
concentrations of SO2, which reacts with water in the atmosphere, leading to the formation of sulfuric
acid, the main component of acid rains. Sulfur can also be a hindrance to pollution preventing
mechanisms, such as catalytic converters seen in automobiles, preventing their complete function
and decreasing their efficiency ( Lloyd & Cackette 2001; Maricq et al. 2002; Saiyasitpanich et al. 2005;
Mohebali & Ball 2008) .
As a response to the increasing concern with the environmental and health problems related with the
sulfur levels in fossil fuels, countries have begun to implement strict sulfur concentration limits. In a
time span of 7 years, the USA lowered the legal limit from 3400 to 30 ppm for all refineries and, up to
2018, all northeastern states refineries will have adopted <15 ppm of sulfur content oil (U.S Energy
Informaton Administration 2014). Since 2009, EU countries have stipulated that all gasoline and on-
road diesel must be limited to 10 ppm of sulfur content, and later in 2011 this limit was applied to all
types of off-road diesels as well (OPEC 2011). As already stated, China and India are the largest
contributors for the world population increase. Confronted with alarming levels of pollution, these
countries followed the USA and EU directives and started to implement stricter oil regulations. China
has limited the legal sulfur concentration nationwide to 150 ppm, having stricter laws for Beijing,
Shanghai, Guangzhou and Shenzhen, where the limit was established at 50 ppm. India has also

5
Figure 4 – Proposed reaction mechanisms for DBT hydrodesulfurization (Cat = catalyst). (Adapted from Marcelis, 2002).
lowered its legal limit to 150 ppm sulfur gasoline nationwide and restricted to 50 ppm in 13 selected
cities with large vehicle populations and high pollution levels (OPEC 2014).
Furthermore, it has to be expected that the sulfur level in on-road and off-road gasoline and diesel
requirements will become stricter in the foreseeable future towards ultra-low sulfur fuels, approaching
zero sulfur emissions from burned fuels. Therefore, the efficiency of the desulfurization technologies
becomes a key point (Alves et al. 2015).
1.4. Hydrodesulfurization
Hydrodesulfurization (HDS) is the most commonly used industrial process for the removal of sulfur
compounds from crude oil and refined petroleum products. As shown in Figure 4, this process
consists in the use of hydrogen to convert organic sulfur into hydrogen sulfide (H2S), which is easily
removed. It combines high pressure and temperature (150 – 3000 psi; 250 – 455°C) in contact with
crude oil, and uses CoMo/Al2O3 or NiMo/Al2O3 as metal catalysts (Whitehurst et al. 1998; Shafi &
Hutchings 2000; Javadli & Klerk 2012).
Although HDS is the most widespread physico-chemical method for sulfur removal from crude oil,
sometimes it is still not enough to reach the increasingly stringent legal limits established. The
presence of polycyclic aromatic compounds, such as DBT and its derivatives (abundant in heavy
crude oils), leads to a lower efficiency of sulfur removal. The complex structural characteristics of
these molecules protects the sulfur atom from the hydrogen attacks, maintaining its structure intact.

6
Thus, to achieve lower sulfur concentrations, it is necessary to increase the intensity of the physico-
chemical treatment implementing deep HDS.
Deep HDS is a process that uses higher temperatures and pressures and longer residence times with
more sophisticated catalysts (Klein 1999), so it has several drawbacks, which are direct
consequences of the extreme conditions applied towards desulfurization. Deep HDS makes the
process of removing the organic sulfur highly expensive and substantially increases its carbon
footprint (Singh et al. 2012). It reduces the quality of the final product, as the higher temperatures and
pressures used allow the conversion of other chemical components present in the fuel, therefore
decreasing the octane number (Folsom et al. 1999; Reichmuth et al. 2000; Javadli & Klerk 2012). The
lifespan of the used catalysts is also shortened by the poisoning effect of the generated H2S (the
heavier the feedstock, the faster the catalyst deactivates) and the deactivated catalysts constitute a
hazardous type of waste which poses several disposal problems (Vogelaar 2003; Bhatia & Sharma
2012). Deep HDS is largely affected by the low-reactivity components in the reaction mixture, such
as organic hetero-compounds and polyaromatic hydrocarbons (Monticello 1996; Folsom et al. 1999;
Konishi et al. 2000; Egorova 2003).
Since the production of ultra-low sulfur automotive fuels has gained enormous interest in the scientific
community worldwide, other desulfurization technologies, much more efficient and less expensive in
removing HDS recalcitrant organic sulfur compounds, are being used in test scale and commercial
scale projects. These include oxidative desulfurization (ODS), extractive desulfurization, adsorptive
desulfurization and biodesulfurization (Babich & Moulijn 2003; Adegunlola et al. 2012; Muzic & Sertic-
Bionda 2013). Among them, ODS combined with extraction (OEDS) or adsorption is considered to be
one of the most promising processes to remove refractory sulfur compounds from diesel fuel
(Sampanthar et al. 2006; Jiang et al. 2011). However, for heavy oil desulfurization, few of these
processes are viable and/or as effective as HDS. The approach with the best chance of leading to a
breakthrough in desulfurization of heavy oil is autoxidation followed by thermal decomposition of the
oxidized heavy oil. There is also possibility for synergistically employing autoxidation in combination
with biodesulfurization and hydrodesulfurization (Javadli & Klerk 2012). Therefore, the study for a
more efficient and profitable way to remove sulfur from crude oils is still mandatory.
1.5. Biodesulfurization
Nowadays, biotechnology has replaced several chemical processes, since biocatalysts can function
at mild conditions and more efficiently. This brings many advantages such as the reduction of energy
costs, lower emissions and minimal generation of undesirable by-products (Borgne & Quintero 2003;
Singh et al. 2012). It is known that oil refining processes are mainly physico-chemical, so
biotechnological approaches to the problems presented tend to be very well received. Several
microorganisms and their enzymes have already been studied on both bench and pilot scale for
7
application on several parts of the refining process, such as biodenitrogenation, biodemetallation,
biodemulsification and microbial enhanced oil recovery (MEOR), biological control of reservoir souring
and transformation of heavy crude to light crude and biodesulfurization (Singh et al. 2012).
Biodesulfurization (BDS) is a biotechnological process corresponding to HDS, since it removes sulfur
from complex compounds. In the last decade, BDS has drawn wide attention because of its green
processing of fossil fuels. It takes place at low temperature and pressure, through the use of
microorganisms capable of metabolizing sulfur compounds, and, in the last 20 years, has been
extensively studied as an alternative to HDS (Soleimani et al. 2007; Alves & Paixão 2011). BDS is
able to remove the most recalcitrant sulfur compounds (for example, DBT), without the use of
hydrogen and without the formation of H2S. In fact, the removed sulfur is used by the microorganism
in its own metabolic pathways and it is eventually converted into biomass, turning the process much
more eco-friendly (Caro et al. 2007; Mohebali & Ball 2008). The maintenance of a desulfurizing
microorganism is also cheaper than the purchase or development of new chemical catalysts. When
compared to HDS, this process requires approximately two times less capital and 15% less operating
costs (Kaufman et al. 1998; Mohebali & Ball 2008).
There are very few reports on BDS process designs and cost analysis (Gupta et al. 2005). Recently,
Alves et al. (2015) reported a study where two BDS process designs were analyzed in terms of energy
consumption, greenhouse gas emissions (GHG) and costs. This study pointed out for the application
of the BDS downstream HDS as the best cost-effective conceptual design to apply into an oil refinery.
Since it is able of desulfurize HDS recalcitrant compounds selectively, BDS integration may lead to
the accomplishment of the stringent European limit of <10 ppm for S-content on fuels, which otherwise
may imply the necessity of more severe conditions within HDS units. Deep HDS is a very costly option
and is not environmentaly friendly because implies higher GHG emissions and substantially increases
the carbon footprint.
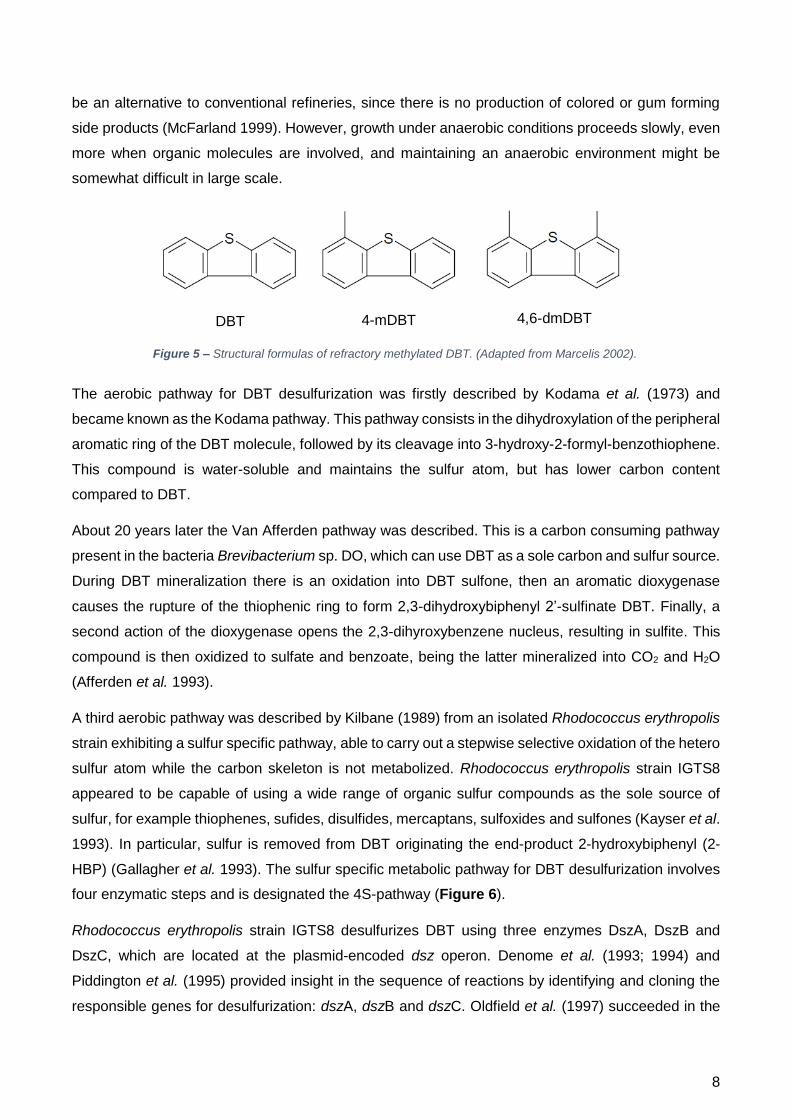
1.5.1. Dibenzothiophene and biodesulfurization pathways
The model compound most used in BDS studies is the dibenzothiophene (DBT) (Figure 5). It consists
of two benzene rings fused to a central thiophene ring which encases the sulfur molecule. DBT is an
abundant and very recalcitrant thiophene derivative that resists even the action of deep HDS and it is
easily manipulated, since it is not mutagenic or hazardous to human health, hence its choice for most
studies (Alves 2007).
DBT desulfurization can be performed both by anaerobic and aerobic microorganisms. Through the
anaerobic pathway microorganisms convert DBT into biphenyl with release of H2S as a side-product.
The anaerobic pathway was firstly described by Kim et al. (1995), who reported a significant
conversion of model compounds by a concentrated cell suspension of Desulfovibrio desulfuricans
M6, a sulfate reducing bacterium with high hydrogenase activity. Anaerobic biodesulfurization might
8
Figure 5 – Structural formulas of refractory methylated DBT. (Adapted from Marcelis 2002).
be an alternative to conventional refineries, since there is no production of colored or gum forming
side products (McFarland 1999). However, growth under anaerobic conditions proceeds slowly, even
more when organic molecules are involved, and maintaining an anaerobic environment might be
somewhat difficult in large scale.
The aerobic pathway for DBT desulfurization was firstly described by Kodama et al. (1973) and
became known as the Kodama pathway. This pathway consists in the dihydroxylation of the peripheral
aromatic ring of the DBT molecule, followed by its cleavage into 3-hydroxy-2-formyl-benzothiophene.
This compound is water-soluble and maintains the sulfur atom, but has lower carbon content
compared to DBT.
About 20 years later the Van Afferden pathway was described. This is a carbon consuming pathway
present in the bacteria Brevibacterium sp. DO, which can use DBT as a sole carbon and sulfur source.
During DBT mineralization there is an oxidation into DBT sulfone, then an aromatic dioxygenase
causes the rupture of the thiophenic ring to form 2,3-dihydroxybiphenyl 2’-sulfinate DBT. Finally, a
second action of the dioxygenase opens the 2,3-dihyroxybenzene nucleus, resulting in sulfite. This
compound is then oxidized to sulfate and benzoate, being the latter mineralized into CO2 and H2O
(Afferden et al. 1993).
A third aerobic pathway was described by Kilbane (1989) from an isolated Rhodococcus erythropolis
strain exhibiting a sulfur specific pathway, able to carry out a stepwise selective oxidation of the hetero
sulfur atom while the carbon skeleton is not metabolized. Rhodococcus erythropolis strain IGTS8
appeared to be capable of using a wide range of organic sulfur compounds as the sole source of
sulfur, for example thiophenes, sufides, disulfides, mercaptans, sulfoxides and sulfones (Kayser et al.
1993). In particular, sulfur is removed from DBT originating the end-product 2-hydroxybiphenyl (2-
HBP) (Gallagher et al. 1993). The sulfur specific metabolic pathway for DBT desulfurization involves
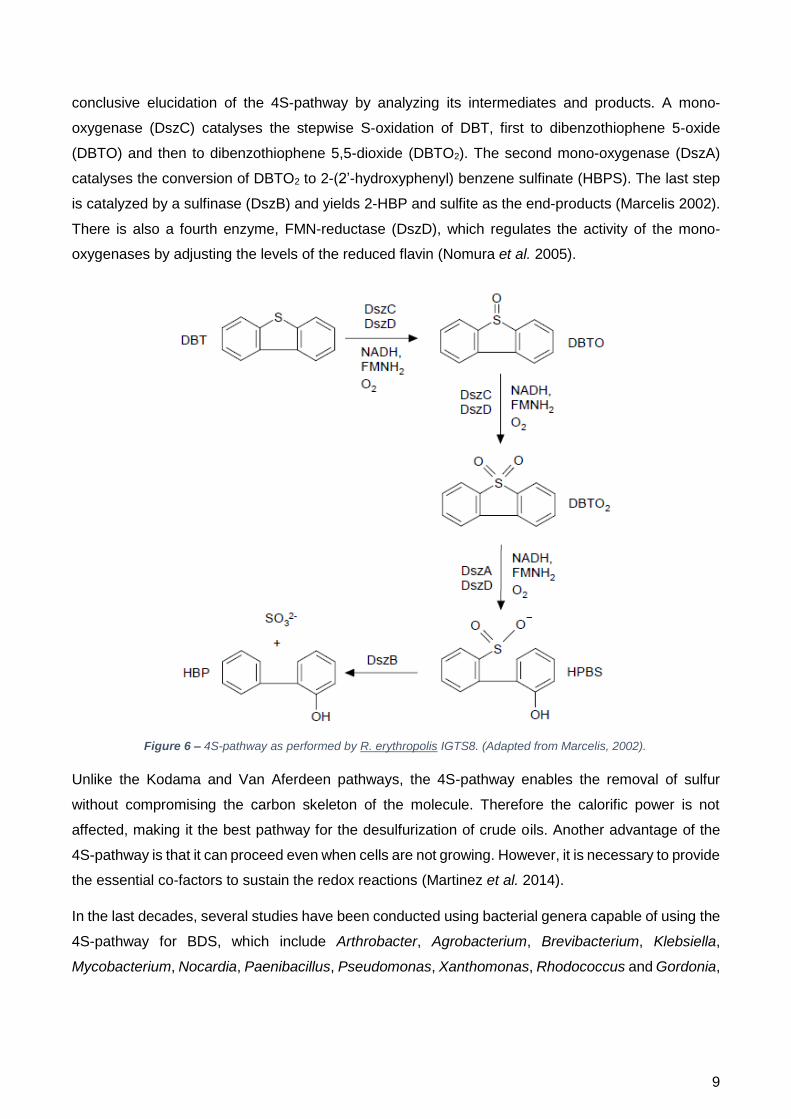
four enzymatic steps and is designated the 4S-pathway (Figure 6).
Rhodococcus erythropolis strain IGTS8 desulfurizes DBT using three enzymes DszA, DszB and
DszC, which are located at the plasmid-encoded dsz operon. Denome et al. (1993; 1994) and
Piddington et al. (1995) provided insight in the sequence of reactions by identifying and cloning the
responsible genes for desulfurization: dszA, dszB and dszC. Oldfield et al. (1997) succeeded in the
DBT 4-mDBT 4,6-dmDBT
9
Figure 6 – 4S-pathway as performed by R. erythropolis IGTS8. (Adapted from Marcelis, 2002).
conclusive elucidation of the 4S-pathway by analyzing its intermediates and products. A mono-
oxygenase (DszC) catalyses the stepwise S-oxidation of DBT, first to dibenzothiophene 5-oxide
(DBTO) and then to dibenzothiophene 5,5-dioxide (DBTO2). The second mono-oxygenase (DszA)
catalyses the conversion of DBTO2 to 2-(2’-hydroxyphenyl) benzene sulfinate (HBPS). The last step
is catalyzed by a sulfinase (DszB) and yields 2-HBP and sulfite as the end-products (Marcelis 2002).
There is also a fourth enzyme, FMN-reductase (DszD), which regulates the activity of the mono-
oxygenases by adjusting the levels of the reduced flavin (Nomura et al. 2005).
Unlike the Kodama and Van Aferdeen pathways, the 4S-pathway enables the removal of sulfur
without compromising the carbon skeleton of the molecule. Therefore the calorific power is not
affected, making it the best pathway for the desulfurization of crude oils. Another advantage of the
4S-pathway is that it can proceed even when cells are not growing. However, it is necessary to provide
the essential co-factors to sustain the redox reactions (Martinez et al. 2014).
In the last decades, several studies have been conducted using bacterial genera capable of using the
4S-pathway for BDS, which include Arthrobacter, Agrobacterium, Brevibacterium, Klebsiella,
Mycobacterium, Nocardia, Paenibacillus, Pseudomonas, Xanthomonas, Rhodococcus and Gordonia,
10
being these last two the most promising (Clark & Kirk 1994; Tanaka et al. 2002; Alves et al. 2008;
Alves & Paixão 2011; Silva 2012; Alves & Paixão 2014).
1.6. Gordonia alkanivorans strain 1B
The genus Gordonia is very diverse, and was firstly proposed as the genus Gordona by Tsukamura
(1971), being then renamed as Gordonia by Stackerbrandt et al. (1988). This genus comprises gram
positive, aerobic, non-sporulating bacteria and is part of the family Gordoniaceae, order
Actinomycetales, sub-order Corynebacterineae. In fact, Gordonia is closely related to genus as
Mycobacterium, Nocardia and Rhodococcus, all part of the same sub-order (Goodfellow & Maldonado
2006). Research about this genus has been increasing since 1998, and 36 different species have
already been described (NCBI 2015). Some of them, such as G. aichiensis, G. araii, G. bronchialis,
G. effuse and G. sputi have been isolated from imuno-compromised clinical patients. However they
are not considered harmful for healthy individuals (Drzyzga 2012). The majority can be found in
several aquatic and terrestrial habitats, meaning that members of the genus Gordonia are widely
distributed in the environment as is generally assumed for other mycolic acid-containing
actinomycetes such as Rhodococcus and Mycobacterium (Drzyzga et al. 2011).
Many species from the genus Gordonia are attractive for biotechnological uses due to their ability to
degrade several environmental pollutants as polycyclic aromatic hydrocarbons, alkylpyridines,
phthalates, xenobiotics or slowly biodegradable natural polymers. They are also attractive due to their
ability to transform or synthetize organic compounds, such as steroid transformation and carotenoid
production (Harner et al. 2011; Grace Liu et al. 2011).
The bacteria G. alkanivorans strain 1B, the microorganism used in the present study, was isolated by
Alves et al. (2005) from oil contaminated ground samples from Parque das Nações (Lisbon, Portugal).
It is an aerobic, gram-positive, catalase-positive, oxidase-negative and pink/orange-pigmented
bacterium. Cells were shown to be short branched hyphae, which disintegrated to rods and coccus-
like elements when visualized by phase contrast microscopy. They are non-motile cells generally
occurring in groups (Alves et al. 2005).
1.6.1. Desulfurization ability
The strain 1B was first described as a desulfurizing bacteria in 2005, being able to convert DBT to
2-HBP at a rate of 2.58 µM.h-1, corresponding to a maximum specific desulfurization rate (q2-HBP) of
1.03 μmol(2-HBP).g-1(Dry Cell Weight or DCW).h-1, using glucose as the single carbon source (Alves
et al. 2005). Similar results were reported for another strain of the same species, Gordonia
alkanivorans strain RIPI90A, which obtained a specific desulfurization rate of 1.40 μmol.g-1(DCW).h-1
(Mohebali & Ball 2008).
11
Alves et al. (2007), studying the G. alkanivorans strain 1B desulfurization genes, proved the existence
of the dsz operon in the genome of this strain. These genes were compared with other sequences of
relevant desulfurizing microorganisms and showed high similarity with those from R. erythropolis
IGTS8 (88% for dszA, 88% for dszB and 90% for dszC). The dszAB genes were later cloned and
expressed in E. coli, which became able of using dibenzothiophene sulfone (DBTS) as a sulfur source
and desulfurize it 4.5 times faster, without the substrate inhibition seen in G.alkanivorans strain 1B
(Alves et al. 2006).
1.6.2. Fructophilic behavior and its influence on desulfurization ability
Usually fructophilic pathways are associated to yeasts, and the only known prokaryotes presenting
this behavior were lactic-acid bacteria (Leandro et al. 2011; Neveling et al. 2012). However, Alves &
Paixão (2014b), were able to describe a fructophilic behavior in G. alkanivorans strain 1B. When
cultivated with fructose as carbon source it was able to achieve an optical density 5-fold higher than
with glucose after only 5 days, increasing its growth rate from 0.025 h-1 to 0.091 h-1. The greater
number of functional cells produced in fructose conducted to a more effective BDS process by strain
1B, as it was attained a q2-HBP about 74% higher than in glucose grown cultures
(2.10 μmol.g-1(DCW).h-1 in fructose versus 1.20 μmol.g-1(DCW).h-1 in glucose). Moreover, this
significant BDS enhancement can be better observed in terms of the overall 2-HBP production rate,
which increased over 5-fold, from 1.8 µM.h-1 (in glucose) to 9.29 µM.h-1 (in fructose).
This discovery opened a new line of research, where new alternative carbon sources could be
harnessed to make the biodesulfurization process industrially viable and profitable. In this ambit, the
potential of several sustainable fructose-rich materials (agro-industrial materials), such as sugar beet
molasses, carob pulp, strawberry tree fruit and Jerusalem artichoke tubers, were evaluated as
alternative carbon sources towards cost-effective DBT desulfurization by strain 1B (Silva 2012; Silva
et al. 2012; Silva et al. 2015; Alves & Paixão 2014a). All these tested alternative carbon sources
yielded better desulfurization results when compared with glucose rich carbon sources, however the
greater results obtained using Jerusalem artichoke (2-HBP production rate = 28.2 µM.h-1 and
q2-HBP = 5.06 μmol.g-1(DCW).h-1) highlighted its potential as the best alternative carbon source towards
the upscale of BDS by strain 1B (Silva 2012). Therefore, in this work Jerusalem artichoke juice was
chosen as the preferred cost-effective alternative carbon source to be added towards culture medium
optimization.
1.7. Jerusalem artichoke as a sustainable carbon source for BDS
Heliantus tuberosus (Figure 7) or Jerusalem artichoke (common designation) is a species of
sunflower originated from eastern North America, from Maine west to Dakota and southwards to
northern Florida and Texas. It is now widely cultivated worldwide, including countries such as France,
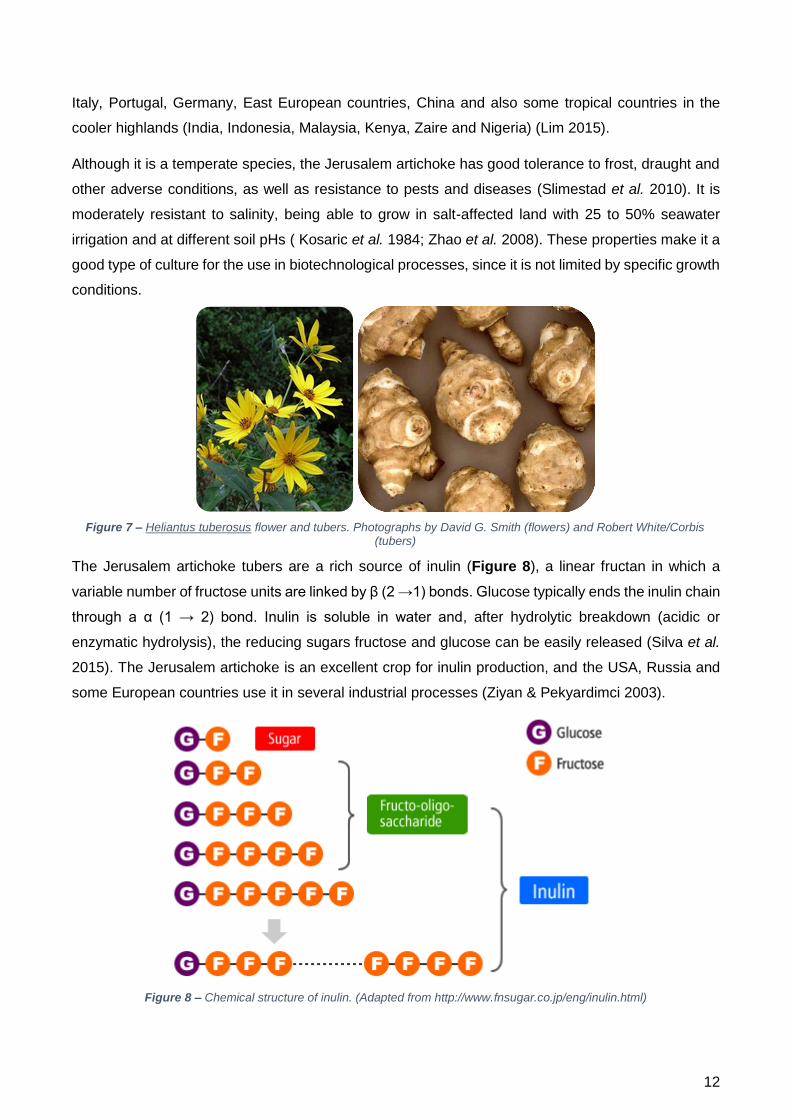
12
Figure 7 – Heliantus tuberosus flower and tubers. Photographs by David G. Smith (flowers) and Robert White/Corbis (tubers)
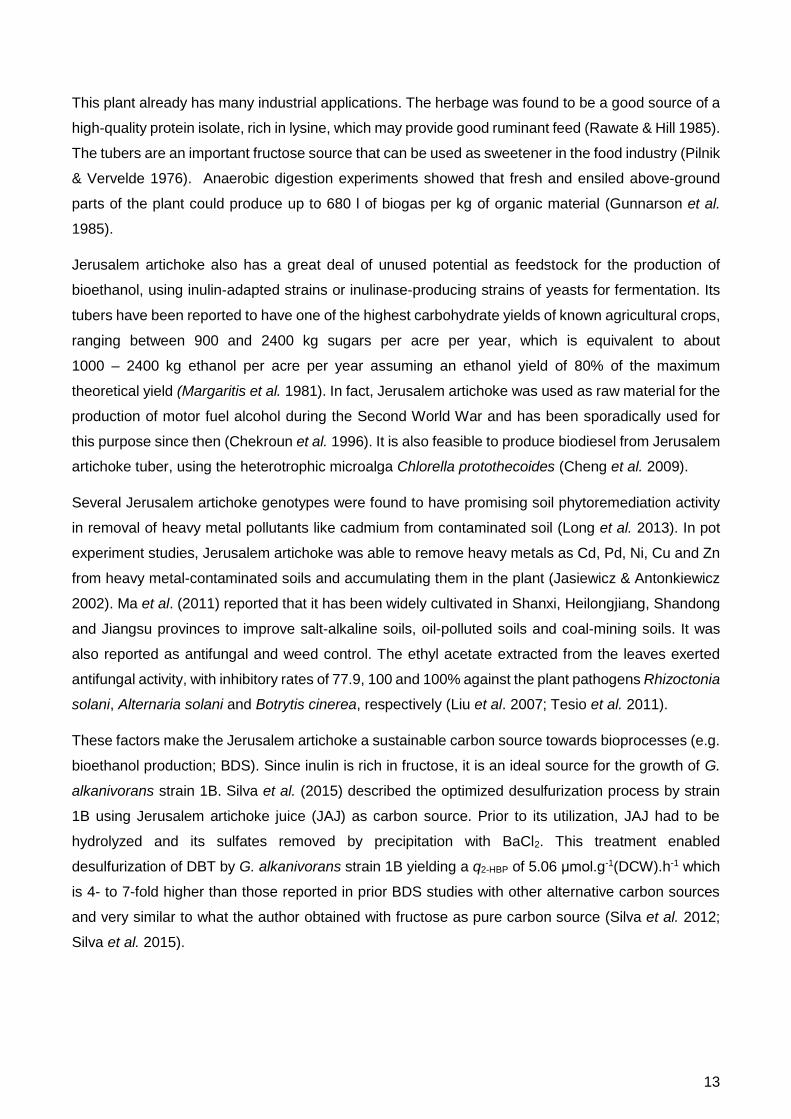
Figure 8 – Chemical structure of inulin. (Adapted from http://www.fnsugar.co.jp/eng/inulin.html)
Italy, Portugal, Germany, East European countries, China and also some tropical countries in the
cooler highlands (India, Indonesia, Malaysia, Kenya, Zaire and Nigeria) (Lim 2015).
Although it is a temperate species, the Jerusalem artichoke has good tolerance to frost, draught and
other adverse conditions, as well as resistance to pests and diseases (Slimestad et al. 2010). It is
moderately resistant to salinity, being able to grow in salt-affected land with 25 to 50% seawater
irrigation and at different soil pHs ( Kosaric et al. 1984; Zhao et al. 2008). These properties make it a
good type of culture for the use in biotechnological processes, since it is not limited by specific growth
conditions.
The Jerusalem artichoke tubers are a rich source of inulin (Figure 8), a linear fructan in which a
variable number of fructose units are linked by β (2 →1) bonds. Glucose typically ends the inulin chain
through a α (1 → 2) bond. Inulin is soluble in water and, after hydrolytic breakdown (acidic or
enzymatic hydrolysis), the reducing sugars fructose and glucose can be easily released (Silva et al.
2015). The Jerusalem artichoke is an excellent crop for inulin production, and the USA, Russia and
some European countries use it in several industrial processes (Ziyan & Pekyardimci 2003).
13
This plant already has many industrial applications. The herbage was found to be a good source of a
high-quality protein isolate, rich in lysine, which may provide good ruminant feed (Rawate & Hill 1985).
The tubers are an important fructose source that can be used as sweetener in the food industry (Pilnik
& Vervelde 1976). Anaerobic digestion experiments showed that fresh and ensiled above-ground
parts of the plant could produce up to 680 l of biogas per kg of organic material (Gunnarson et al.
1985).
Jerusalem artichoke also has a great deal of unused potential as feedstock for the production of
bioethanol, using inulin-adapted strains or inulinase-producing strains of yeasts for fermentation. Its
tubers have been reported to have one of the highest carbohydrate yields of known agricultural crops,
ranging between 900 and 2400 kg sugars per acre per year, which is equivalent to about
1000 – 2400 kg ethanol per acre per year assuming an ethanol yield of 80% of the maximum
theoretical yield (Margaritis et al. 1981). In fact, Jerusalem artichoke was used as raw material for the
production of motor fuel alcohol during the Second World War and has been sporadically used for
this purpose since then (Chekroun et al. 1996). It is also feasible to produce biodiesel from Jerusalem
artichoke tuber, using the heterotrophic microalga Chlorella protothecoides (Cheng et al. 2009).
Several Jerusalem artichoke genotypes were found to have promising soil phytoremediation activity
in removal of heavy metal pollutants like cadmium from contaminated soil (Long et al. 2013). In pot
experiment studies, Jerusalem artichoke was able to remove heavy metals as Cd, Pd, Ni, Cu and Zn
from heavy metal-contaminated soils and accumulating them in the plant (Jasiewicz & Antonkiewicz
2002). Ma et al. (2011) reported that it has been widely cultivated in Shanxi, Heilongjiang, Shandong
and Jiangsu provinces to improve salt-alkaline soils, oil-polluted soils and coal-mining soils. It was
also reported as antifungal and weed control. The ethyl acetate extracted from the leaves exerted
antifungal activity, with inhibitory rates of 77.9, 100 and 100% against the plant pathogens Rhizoctonia
solani, Alternaria solani and Botrytis cinerea, respectively (Liu et al. 2007; Tesio et al. 2011).
These factors make the Jerusalem artichoke a sustainable carbon source towards bioprocesses (e.g.
bioethanol production; BDS). Since inulin is rich in fructose, it is an ideal source for the growth of G.
alkanivorans strain 1B. Silva et al. (2015) described the optimized desulfurization process by strain
1B using Jerusalem artichoke juice (JAJ) as carbon source. Prior to its utilization, JAJ had to be
hydrolyzed and its sulfates removed by precipitation with BaCl2. This treatment enabled
desulfurization of DBT by G. alkanivorans strain 1B yielding a q2-HBP of 5.06 μmol.g-1(DCW).h-1 which
is 4- to 7-fold higher than those reported in prior BDS studies with other alternative carbon sources
and very similar to what the author obtained with fructose as pure carbon source (Silva et al. 2012;
Silva et al. 2015).
14
1.8. Challenges towards biodesulfurization industrial scale-up
Since BDS is more efficient and less expensive than HDS in removing sulfur from refractory
heterocyclic compounds present in crude oil, it could be used in oil refinery as a complement to
achieve ultra-low sulfur diesel (Alves et al. 2015). BDS can be an alternative/complement to
desulfurize heavy oils, like shale oils, which have high thiophene concentration. However, to apply
BDS into an industrial scale it is mandatory to overcome several limitations and problems.
BDS shows a low conversion rate, which may be caused by feedback inhibition of the enzyme
activities by the accumulation of the end product of the 4S-pathway (2-HBP), which is extremely toxic
to most microorganisms (Alves & Paixão 2011). The 4S-pathway is also inhibited in the presence of
other sulfur compounds in the culture medium, and even small concentrations of sulfate or other easy
access sulfur sources can inhibit BDS (Mohebali & Ball 2008; Silva et al. 2012). To add up, bacteria
have very low sulfur requirements. In Rhodococcus sp., the cells were found to require 0.1 mM of
sulfur for normal growth (Reichmuth et al. 2000). Only 1% of bacterial dry weight is sulfur, which
implies a very low need in relation to this element (Stoner et al. 1990). Therefore, it is important to
use feedstocks containing low residual concentration or even null content of sulfur (Silva 2012).
Moreover, there is a limitation associated with the costs of the culture medium. This is a problem
shared with many other biotechnological processes, representing 30 to 40% of the total value, namely
the carbon source, which makes the process more expensive (Alves et al. 2015). At present, there is
no economically suitable method for large-scale preparation of biocatalysts (Tao et al. 2006). Since it
is necessary to reduce production costs, it is important to search for cheap and widely available raw
materials. The utilization of alternative carbon sources derived from agro-industrial by-products,
wastes or plants that can be grown on marginal land may represent a sustainable strategy for
biotechnological processes (Alves et al. 2008; Alves & Paixão 2014a; Silva et al. 2013; Silva et al.
2015). Many carbon sources were already tested in the search for a suitable alternative for the
production of biocatalysts able to perform BDS. The first reported utilization of raw materials as carbon
sources for this process was by Alves et al. (2008), using recycled paper sludge which is a very
abundant type of waste resultant of the pulp and paper industry. Recycled paper sludge is very rich
in cellulose, xylan and lignin which can be hydrolyzed into glucose, xylose and cellobiose, making it
very interesting as a carbon source. After this work, other alternative carbon sources have been
tested, with different degrees of success, such as glycerol (Abo-State et al. 2014; Tang & Hong 2014),
carob pulp liquor (Silva et al. 2012), Jerusalem artichoke juice (Paixão et al. 2013; Silva et al. 2015)
and sugar beet molasses (Alves & Paixão 2014a).
Until recently, BDS studies have been focused mainly on model compounds, and this fact also limits
the ability to demonstrate the commercial potential of this biotechnology (Grossman et al. 2001; Alves
2007). Oils are complex substrates, therefore, it is necessary to take into account their associated
15
problems such as the toxicity of their constituent compounds and the existence of steric hindrance
associated with the molecular structure of these compounds that might inhibit the activity of microbial
enzymatic systems (Alves 2007). However, recent studies with petroleum show sulfur removal up to
90%, using different microorganisms and on different distillates, being achieved an ultra-low sulfur
diesel with 14 ppm of S-content (sulfur content) (Bhatia & Sharma 2012; Kilbane 2006; Nuhu 2013).
For the industrial production of the biocatalyst, the use of a continuous flow stirred tank reactor
(CFSTR), instead of a fed batch system, can bring many advantages (Pacheco 1999). In this system
cells are always at their maximum growth rate and therefore, all the metabolic pathways are at their
highest function rate. This system also has the advantage of not accumulating end products which
can inhibit several pathways, including desulfurization, being an asset for metabolic related
bioprocesses (Schilling et al. 2002).
However, the best approach to efficiently perform BDS is still not consensual. Some authors affirm
that the best approach is to grow the biocatalysts in the same reactor as the BDS is to be performed
(Schilling et al. 2002). Others state that to efficiently perform BDS it is needed a biphasic system
where the biocatalyst and the crude oil are only in contact in a thin layer, where BDS occurs. This
system is proposed by (Yang et al. 2007), and is based in the use of a biphasic continuous stirred
tank reactor, since the partition of organic and inorganic phases brings many advantages in the down-
stream processing. Another interesting alternative is the immobilization of the biocatalysts, which
allows an easier recovery and re-use of cells, increased stability to different reaction conditions and
components and lower biocatalyst contamination of final product (Zhang et al. 2010).
In overall, there are several problems related to large scale operation, such as the difficulty in the
control of various parameters that regulate biocatalyst activity and stability, the oil/water volume ratio,
the logistics of sanitary handling, shipment, storage and use of effective microorganisms within the
production field or refinery environment (Javadli & Klerk 2012). There are also some problems
associated with the biphasic system used for BDS. The cells, when mixed with water and oil, produce
a sort of surfactant, which emulsifies the oil and makes the separation from water and cell recovery
highly difficult (Alves 2007; Naito et al. 2001).
When successfully implemented, BDS technology could result in less environmental issues, with a
CO2 emission reduction of 70 to 80%, smaller residue production and reduced energy consumption,
which, in turn, is translated in reduced capital (two thirds of HDS) and operational costs
(Vazquez-Duhalt et al. 2002; Alves et al. 2015). In addition, the BDS process may benefit from the
simultaneous production of high-added value microbial by-products (such as biosurfactants and
pigments), which can be further valorized through other industrial processes (De Miguel et al. 2000;
De Miguel et al. 2001; Veiga-Crespo et al. 2012; Bandyopadhyay & Chowdhury 2014). The final
product of the 4S-pathway (2-HBP) is a hydrotrope that can act as a surfactant which could be
16
recovered from BDS effluents (Mohebali et al. 2007). On the other hand, Alves et al. (2005) described
Gordonia alkanivorans strain 1B as a pink/orange pigmented bacteria. Orange color is normally
associated with carotenoids as β-carotene, so this aspect can be exploited taking into account a
further industrial scale-up of the BDS process using this bacterium (Veiga-Crespo et al. 2012).
1.9. Scope of the thesis
Due to the strict European regulations regarding the legal limits on sulfur concentration on fossil fuels
and their derivatives it is imperative the development of cost-effective technologies to remove sulfur.
Therefore, the optimization studies of BDS as an eco-friendly technology complementary to HDS
towards an integrated industrial production of ultra-low sulfur fuels (gasoline/diesel) in a petroleum
refinery is an important focus of research.
In this context, the main goal of this study consisted on the component minimization of the culture
medium for the maximum production of efficient desulfurizing biocatalysts (G. alkanivorans active
cells) taking into account the lowest operation costs. In fact, the utilization of desulfurizing
microorganisms that can grow in low nutrient culture media without vitamins and/or other growth
promoters (e.g. yeast extract, peptone, triptone, etc) is an advantage for BDS upscale since it may
reduce the biocatalyst production costs significantly. Hence, several objectives were developed:
Minimization of the sulfur free mineral (SFM) media, usually used to grow Gordonia
alkanivorans strain 1B, in shake-flask assays;
Optimization of SFM medium minimization in chemostat assays;
Optimization of biocatalysts production (resting cells of G. alkanivorans strain 1B) in chemostat
using the minimized medium with the best culture conditions and JAJ as sustainable carbon
source;
Evaluation of the desulfurization ability of a model oil by G. alkanivorans strain 1B grown in the
chemostat optimized conditions.
2. Materials and methods
2.1. Chemicals and reagents
Dibenzothiophene (DBT 99%) was obtained from Acros Organics (Geel, Belgium), 2-hydroxybiphenyl
(2-HBP) was from Sigma (Missouri, USA), dimethylformamide (DMF) was from Riedelde Haën
(Hannover, Germany), 4-methyl-DBT (96%) was from Aldrich Chem. Co. (Missouri, USA), BaCl2.2H2O
(>99%) and sodium sulfate anhydrous (>99%) were obtained from Merck (New Jersey, USA). For all
BDS assays, a stock solution of 150 mM DBT, dissolved in DMF, was prepared. The 5,6-
17
carboxyfluorescein diacetate (CFDA) and propidium iodide (PI) were acquired from Invitrogen
(Massachusetts, USA). All other reagents were of the highest grade commercially available.
2.2. Jerusalem artichoke juice
Jerusalem artichoke tubers were cultivated in a depleted soil in Oleiros, Portugal and processed as
described in Silva et al. (2015) towards the production of Jerusalem artichoke juice (JAJ). The JAJ
was hydrolyzed at pH 2 and 55°C for 48 hours to convert inulin into fructose and glucose and then
filtered (0.20 µm membranes). For total sulfate precipitation, sterile BaCl2 at 0.5% (w.v-1) was added
to the filter sterilized juice adjusted to pH 8.73 (Silva et al. 2015). This JAJ was shaken vigorously,
incubated at 30°C for 36 hours and finally filtered to remove all BaCl2 (0.45 µm membranes) and again
filter sterilized (0.20 µm membranes) for storage effects. This JAJ precipitated with BaCl2 for sulfate
removal (JAJp) was used in minimized medium in shake-flask assays.
A second process of JAJ preparation was tested, based in inulin precipitation. Untreated juice was
frozen at -20°C and then defrosted at 4°C, in order to precipitate the inulin. When two phases were
formed the upper layer was removed. The bottom layer containing pulp and precipitated inulin was
then hydrolyzed in the same conditions described above to obtain a JAJ with the correspondent
monosaccharides. In this process, no sulfate precipitation was performed. This JAJ concentrate (JAJc)
was used in minimized medium in chemostat/bioreactor assay, as an alternative carbon source.
2.3. Microorganism and culture media
The microorganism used in this study was the bacterium Gordonia alkanivorans strain 1B, isolated in
our laboratory (Alves et al. 2005). The basal salts medium used for cultivation and maintenance of
this microorganism was a sulfur-free mineral (SFM) culture medium containing 1.22 g.l-1 NH4Cl,
2.55 g.l-1 KH2PO4, 2.55 g.l-1 Na2HPO4.2H2O and 0.17 g.l-1 MgCl2.6H2O. This medium was
supplemented with 0.50 ml.l-1 of a sulfur-free trace elements solution (TES) (Alves & Paixão 2014b)
and its final pH was adjusted to 7.5, before being autoclaved at 121°C, 1 atm for 15 minutes. Pure
carbon sources such as glucose and fructose were dissolved in Millipore water in 50% (w.v-1)
concentrated solutions. Pure carbon sources and Jerusalem artichoke juice (JAJ) were filter sterilized
with a 0.20 µm pore sterile filter before being added to the medium in aseptic conditions, to an initial
concentration of 10 g.l-1 total reducing sugars.
Usually, prior to each assay, a bacterial inoculum was prepared by growing the strain 1B with fructose
(10 g.l-1) as the single carbon source and 250 µM DBT as single sulfur source. This fermentation was
performed in a volume of 150 ml, in a 500 ml shake-flask, at 30°C and 150 rotations per minute (rpm)
in a horizontal incubator (Unitron CH-4103, Infors AG, Bottingen, Switzerland) for 72 hours.
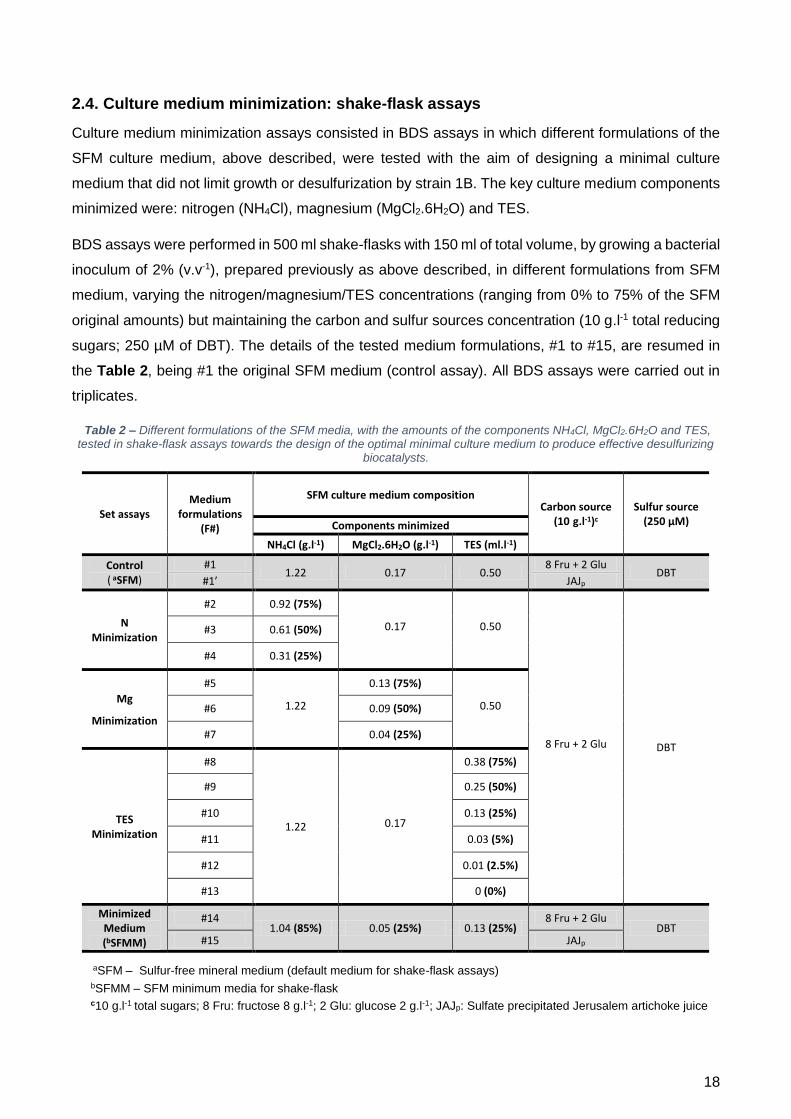
18
2.4. Culture medium minimization: shake-flask assays
Culture medium minimization assays consisted in BDS assays in which different formulations of the
SFM culture medium, above described, were tested with the aim of designing a minimal culture
medium that did not limit growth or desulfurization by strain 1B. The key culture medium components
minimized were: nitrogen (NH4Cl), magnesium (MgCl2.6H2O) and TES.
BDS assays were performed in 500 ml shake-flasks with 150 ml of total volume, by growing a bacterial
inoculum of 2% (v.v-1), prepared previously as above described, in different formulations from SFM
medium, varying the nitrogen/magnesium/TES concentrations (ranging from 0% to 75% of the SFM
original amounts) but maintaining the carbon and sulfur sources concentration (10 g.l-1 total reducing
sugars; 250 µM of DBT). The details of the tested medium formulations, #1 to #15, are resumed in
the Table 2, being #1 the original SFM medium (control assay). All BDS assays were carried out in
triplicates.
Table 2 – Different formulations of the SFM media, with the amounts of the components NH4Cl, MgCl2.6H2O and TES, tested in shake-flask assays towards the design of the optimal minimal culture medium to produce effective desulfurizing
biocatalysts.
aSFM – Sulfur-free mineral medium (default medium for shake-flask assays) bSFMM – SFM minimum media for shake-flask c10 g.l-1 total sugars; 8 Fru: fructose 8 g.l-1; 2 Glu: glucose 2 g.l-1; JAJp: Sulfate precipitated Jerusalem artichoke juice
Set assays Medium
formulations (F#)
SFM culture medium composition Carbon source
(10 g.l-1)c Sulfur source
(250 µM) Components minimized
NH4Cl (g.l-1) MgCl2.6H2O (g.l-1) TES (ml.l-1)
Control ( aSFM)
#1 1.22 0.17 0.50
8 Fru + 2 Glu DBT
#1’ JAJp
N Minimization
#2 0.92 (75%)
0.17 0.50
8 Fru + 2 Glu DBT
#3 0.61 (50%)
#4 0.31 (25%)
Mg
Minimization
#5
1.22
0.13 (75%)
0.50 #6 0.09 (50%)
#7 0.04 (25%)
TES Minimization
#8
1.22 0.17
0.38 (75%)
#9 0.25 (50%)
#10 0.13 (25%)
#11 0.03 (5%)
#12 0.01 (2.5%)
#13 0 (0%)
Minimized Medium (bSFMM)
#14 1.04 (85%) 0.05 (25%) 0.13 (25%)
8 Fru + 2 Glu DBT
#15 JAJp
19
2.5. Minimum culture medium: optimization in chemostat
The continuous culture assays were performed on a bench-top bioreactor BioFlo IIc (1 l vase) with
390 ml working volume (New Brunswick Scientific, Edison, New Jersey, USA). NH4Cl screening
assays, were performed in a tailor-made bioreactor system coupling a GLS 80 stirred reactor
(500 ml Duran GLS80 bottle + screw cap connection system + stirrer shaft from Duran Group GmbH,
Germany) with 260 ml working volume. The working volume was maintained constant by a surface
dipped leveling tube linked to a peristaltic pump with adjustable speed while the influx of culture
medium was kept constant by a second peristaltic pump. In the continuous culture assays,
independently of the reactor used, the temperature was kept at 30°C, the pH was controlled by the
addition of 1 M NaOH solution on demand to maintain pH at 7.5, and agitation was kept at 300 rpm.
The aeration rate was 2 vvm.
The starting culture medium used for this set of reactor minimization assays was an adaptation of the
SFM medium (designated as SFMR medium), which was previously optimized in our lab for minimal
phosphate source. This SFMR medium contained 1.22 g.l-1 NH4Cl, 0.50 g.l-1 KH2PO4, 0.50 g.l-1
Na2HPO4.2H2O, 0.17 g.l-1 MgCl2.6H2O and 0.50 ml.l-1 of TES with a final pH of 7.5 (personal
communication). Polypropylene glycol was added to the culture medium in all assays in a
concentration of 0.15 ml.l-1, as a way to control foam formation. The carbon source was added to
obtain a concentration of 10 g.l-1 total sugars, unless otherwise stated, and 0.03 g.l-1 Na2SO4 were
added as a S-source. An inoculum of 10% (v.v-1) was used to start the culture and the continuous
feed was initiated within a 24 hour time period after inoculation.
Two types of carbon sources were tested to produce the desulfurizing biocatalysts through continuous
culture: simple carbon source versus sustainable complex carbon source (JAJ). In the majority of the
assays, the used carbon source was a mixture of fructose and glucose (8 g.l-1 fructose + 2 g.l-1
glucose) to mimic the sugar proportion of JAJ, except for the NH4Cl screening assay where 10 g.l-1 of
fructose were used. For the preparation of the mixture of simple sugars, both sugars were diluted in
Millipore water up to 10% of the total media volume and autoclaved (121°C, 1 atm, 30 min) before
being added to the final culture medium. JAJ was filter sterilized using a 0.22 µm pore sterile filter and
mixed with the final medium in a laminar flow chamber. The results obtained in the prior shake-flasks
minimization assays were used as a basis for the formulations tested in the continuous culture
optimization assays. The formulations (#1 to #6) tested in the bioreactors are described in Table 3.
All the steady-state cultures of G. alkanivorans strain 1B were further characterized through
evaluation of their potential for desulfurization of 250 µM of DBT. Several parameters were monitored
within the reactor during the steady-state: residual reducing sugars (g.l-1); biomass concentration,
expressed as dry cell weight (g.l-1); optical density (OD600nm). The metabolic rates (substrate
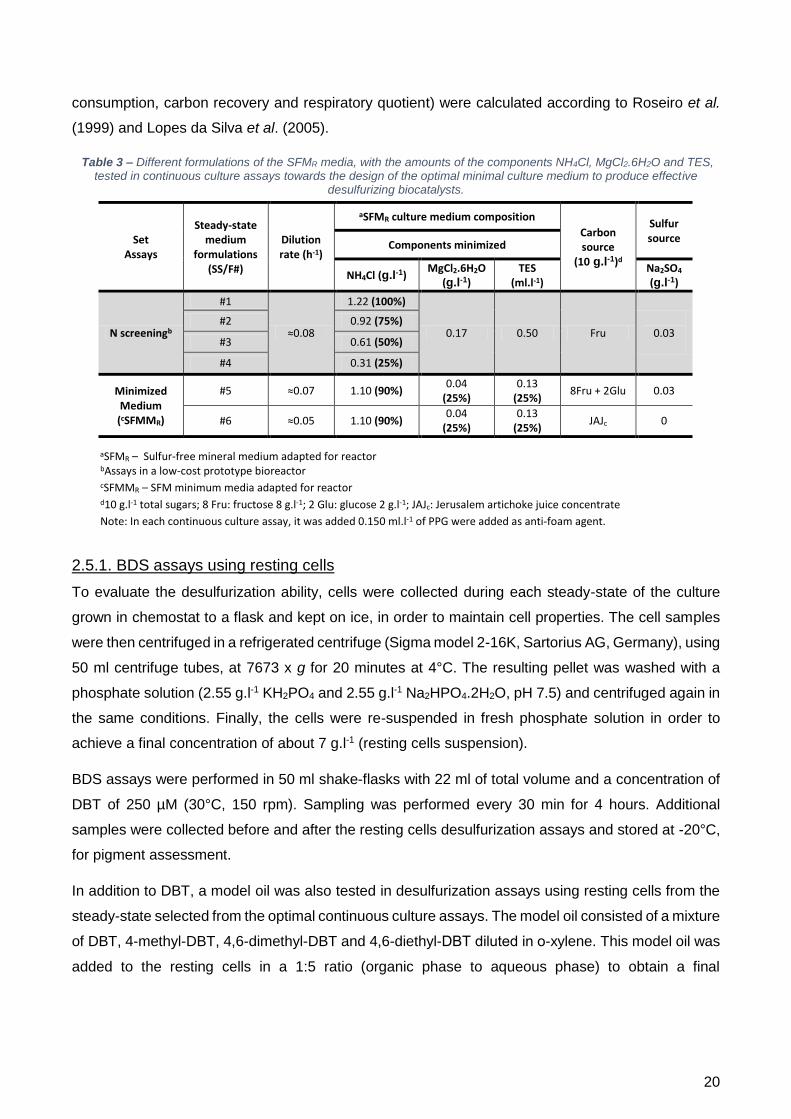
20
consumption, carbon recovery and respiratory quotient) were calculated according to Roseiro et al.
(1999) and Lopes da Silva et al. (2005).
Table 3 – Different formulations of the SFMR media, with the amounts of the components NH4Cl, MgCl2.6H2O and TES, tested in continuous culture assays towards the design of the optimal minimal culture medium to produce effective
desulfurizing biocatalysts.
aSFMR – Sulfur-free mineral medium adapted for reactor bAssays in a low-cost prototype bioreactor
cSFMMR – SFM minimum media adapted for reactor d10 g.l-1 total sugars; 8 Fru: fructose 8 g.l-1; 2 Glu: glucose 2 g.l-1; JAJc: Jerusalem artichoke juice concentrate
Note: In each continuous culture assay, it was added 0.150 ml.l-1 of PPG were added as anti-foam agent.
2.5.1. BDS assays using resting cells
To evaluate the desulfurization ability, cells were collected during each steady-state of the culture
grown in chemostat to a flask and kept on ice, in order to maintain cell properties. The cell samples
were then centrifuged in a refrigerated centrifuge (Sigma model 2-16K, Sartorius AG, Germany), using
50 ml centrifuge tubes, at 7673 x g for 20 minutes at 4°C. The resulting pellet was washed with a
phosphate solution (2.55 g.l-1 KH2PO4 and 2.55 g.l-1 Na2HPO4.2H2O, pH 7.5) and centrifuged again in
the same conditions. Finally, the cells were re-suspended in fresh phosphate solution in order to
achieve a final concentration of about 7 g.l-1 (resting cells suspension).
BDS assays were performed in 50 ml shake-flasks with 22 ml of total volume and a concentration of
DBT of 250 µM (30°C, 150 rpm). Sampling was performed every 30 min for 4 hours. Additional
samples were collected before and after the resting cells desulfurization assays and stored at -20°C,
for pigment assessment.
In addition to DBT, a model oil was also tested in desulfurization assays using resting cells from the
steady-state selected from the optimal continuous culture assays. The model oil consisted of a mixture
of DBT, 4-methyl-DBT, 4,6-dimethyl-DBT and 4,6-diethyl-DBT diluted in ο-xylene. This model oil was
added to the resting cells in a 1:5 ratio (organic phase to aqueous phase) to obtain a final
Set Assays
Steady-state medium
formulations (SS/F#)
Dilution rate (h-1)
aSFMR culture medium composition
Carbon source
(10 g.l-1)d
Sulfur source
Components minimized
NH4Cl (g.l-1) MgCl2.6H2O
(g.l-1) TES
(ml.l-1) Na2SO4
(g.l-1)
N screeningb
#1
≈0.08
1.22 (100%)
0.17 0.50 Fru
0.03
#2 0.92 (75%)
#3 0.61 (50%)
#4 0.31 (25%)
Minimized Medium
(cSFMMR)
#5 ≈0.07 1.10 (90%) 0.04
(25%) 0.13
(25%) 8Fru + 2Glu 0.03
#6 ≈0.05 1.10 (90%) 0.04
(25%) 0.13
(25%) JAJc 0
21
concentration of 500 µM of the different DBT, and incubated in closed 100 ml Duran flasks at 30°C
and 150 rpm for 24 hours. All BDS assays were performed in triplicates.
2.5.2. Pigments extraction
The biomass samples were centrifuged in a Sigma 2-16K refrigerated centrifuge (7673 x g,
20 minutes, 4°C). Each supernatant was discarded and the pellet was uniformly spread in petri dishes
and then dried at 50°C until ~60% water content was obtained. 25 mg of the dried biomass was
weighted to 1.5 ml micro centrifuge tubes for extraction, and another 25 mg for dry weight
assessment.
Pigments extraction was performed with 1 ml of Dimethyl Sulfoxide (DMSO) (50°C, 1 hour, 150 rpm)
in an incubator shaker (Optic ivymen system, Comecta S.A, Spain) and finally the tubes were
centrifuged at 15000 x g for 5 minutes (Biofuge 15 centrifuge, Heraeus Sepatech, Germany). The
supernatants, containing the pigments, were transferred to tubes protected from the light and another
500 µl of DMSO were added to the respective pellets. After being re-suspended, the samples were
incubated for 30 minutes in the conditions described above, and then centrifuged in the same way.
This process was repeated until the DMSO was clear.
The resulting DMSO samples were mixed with acetone, NaCl (20% v.v-1) and ethyl acetate in a ratio
of 4:1:1:6 respectively and softly inverted and kept at -20°C overnight, so that phase separation would
occur. The top colored layer was removed and filtered through 0.22 µm syringe filters for the remaining
analysis. Samples were protected from direct light at all times and stored at -20°C in order to avoid
pigment degradation prior to analysis.
2.6. Analytical methods
2.6.1. Optical density and dry cell weight
The culture growth was monitored by analysis of the optical density at 600 nm (OD600nm) (Thermo
Fisher Scientific spectrophotometer, model Genesys 20, USA) and dry cell weight (DCW) values.
DCW was determined by centrifuging the samples 10 minutes at 15000 x g at room temperature in a
Biofuge 15 (Heraeus Sepatech, Germany) and drying them overnight at 100°C.
2.6.2. Sulfate analysis
Sulfate concentration was determined by high-performance liquid chromatography using a Dionex
chromatograph ICS-1000 (Dionex Corporation, Sunnyvale, CA), equipped with an ASRS - Ultra II
suppressor, an AG14A (4 x 50 mm) pre-column and an IONPAC AS14A (4 x 250 mm) column. Sodium
carbonate 8 mM was used as mobile phase at a flow rate of 1 ml.min-1.
22
Another sulfate assessment technique was used, based in the precipitation with BaCl2. SulfaVer4
powder pillows (HACH Company, Loveland, Colorado, USA) were used accordingly to the HACH
DR/2000 spectrophotometer handbook. (HACH Company, Loveland, Colorado, USA).
2.6.3. Desulfurization assessment
DBT and its derivatives desulfurization was evaluated by measuring each respective 2-HBP
production, which is the final product of the DBT desulfurization through the 4S-pathway. The samples
(0.750 ml) were acidified with 0.025 ml of HCl (4 M) and then a liquid-liquid extraction with ethyl
acetate was performed on a vortex (5 minutes), in order to extract 2-HBP and DBT. After phase
separation, the organic phase was analyzed by gas-chromatography (GC) (model CP9001,
Chrompack, Middelburg, The Netherlands) equipped with a flame ionization detector. A 10% CP-5
CB on 100/120 MESH Chromosorb W-HP column was used with nitrogen as the carrier gas. The
chromatograph oven start temperature was 130°C for 3 minutes and the end temperature 230°C
maintained for 3 minutes (heating rate of 6°C.min-1). The injector and detector temperatures were set
for 280 and 290°C, respectively. In all GC measurements (except for model oil) 4-methyl-DBT was
used as internal standard to minimize variations.
2.6.4. Sugar measurement
Glucose and fructose concentrations were measured by high-performance liquid chromatography
(HPLC) instrumentation (LaChrom Merck/Hitachi, Germany) equipped with a differential refractive
index detector. A Waters SugarPak 1 column (6.5 x 300 mm, Bio-Rad Laboratories, CA, USA) was
used operating at 75°C with Ca-EDTA at 50 g.l-1 as mobile phase at a flow rate of 0.5 ml.min-1. Data
was analyzed using Chromeleon software ver. 6.40 SP6 build 783 (1994-2003, Dionex).
2.6.5. Cell health assessment
Flow cytometric analysis was performed in a FACSCalibur Flow Cytometer (BD Biosciences, San
Jose, CA, USA) equipped with an argon laser emitting at 488 nm and data was analyzed using FCS
Express 5 Flow Research Edition software (De Novo Software, 2015). G. alkanivorans cells were
stained with both 5,6-carboxyfluorescein diacetate (CFDA) (green fluorescence, FL1) and Propidium
iodide (PI) (red fluorescence, FL3). Stock solutions of 10 mM CFDA in acetone and 1.5 mM PI in
distilled water were previously prepared and stored at -20°C and 4°C, respectively. Cells were
centrifuged at 8500 x g for 10 minutes (Biofuge 15, Heraeus Sepatech, Germany), resuspended in
Tris-HCl buffer (50 mM, pH 7.4) and sonicated for 10 seconds. Concentration of the cell suspension
was adjusted to approximately 3000 events per second by flow cytometric analysis and the sample
total volume set to 0.995 ml. The cells were then incubated with 5 µl of CFDA solution for 30 minutes
at 37°C protected from light. After incubation, cells were washed and re-suspended in Tris-HCl buffer
and maintained in ice. For the double-staining, cells were adjusted to 1000 events per second and
1 µl of PI solution was added and the flow cytometric analysis performed immediately. Each sample
23
was collected in duplicate and readings were performed six times for each duplicate. Instrument
settings were selected for the forward and side scatter signals in order to discriminate the cells from
background noise and debris. Samples containing Tris-HCl buffer without cells were analyzed to
confirm the presence of a constant background noise which was not due to unstained cells. For the
control assays, healthy (metabolic active) cells were harvested during the exponential phase using
fructose as the single carbon source (5 g.l-1) and 200 µM of DBT, and after several days of nutrient
starvation (stressed cells). Dead cells were obtained by incubating healthy cells in ethanol at 70%
(v.v-1) for 1 min (Silva 2012).
2.6.6. Real Time-PCR assays: Desulfurization gene expression assessment
The evaluation of the desulfurization gene expression was performed using the StepOne Plus Real
Time-PCR system (Applied Biosystems). A two-step approach was used: the first step consisted in
performing RNA extraction and cDNA formation, followed by amplification and quantification. For RNA
extraction, cells of each steady-state were immediately frozen to inhibit cell modification. These
samples were then thawed in ice (in order to minimize the temperature shock), normalized to 2 mg of
cells and centrifuged at 8000 x g for 5 minutes in a Microfuge 18 centrifuge (Beckman Coulter inc.,
CA, USA) to remove the growth media. 250 µl of lysozyme (6 mg.ml-1 in Tris-EDTA buffer, pH 8) was
then added and left to incubate for 1 minute at room temperature. After a new centrifugation at
8000 x g for 2 minutes, the pellet was again suspended in 250 µl of lysozyme and left to incubate at
37°C for 40 minutes. For the next extraction steps, the RNA extraction kit RNeasy MiniKit (Qiagen,
Austin, TX, USA) was used, and the supplied protocol was followed. The amount and purity of
resulting RNA was accessed using NanoDrop 2000c (Thermo Scientific, USA).
For the production of cDNA from the extracted RNA, the High-Capacity cDNA Reverse Transcription
kit (Applied Biosystems) was used and PCR was performed in a C100 Thermal Cycler (Bio-Rad) with
the following conditions: 10 minutes at 25°C; 120 minutes at 37°C; 5 minutes at 85°C; 4°C infinitely.
The obtained cDNA was then used in the RT-PCR reaction with SYBR-Green PCR master mix
(Applied Biosystems). SYBR-Green is a DNA binding fluorophore that has high affinity for double
stranded DNA, enabling the quantification of specific genes. In this case, the primers used are referred
to the desulfurization genes dszA, dszB, dszC, being the reference gene one copy of 16S DNA
(whose expression is highly conserved). The gene sequence and melting points are represented in
Table 4.
PCR conditions were as follows: 10 minutes at 95°C; 40 cycles of 15 seconds at 95°C and 1 minute
at 62°C.
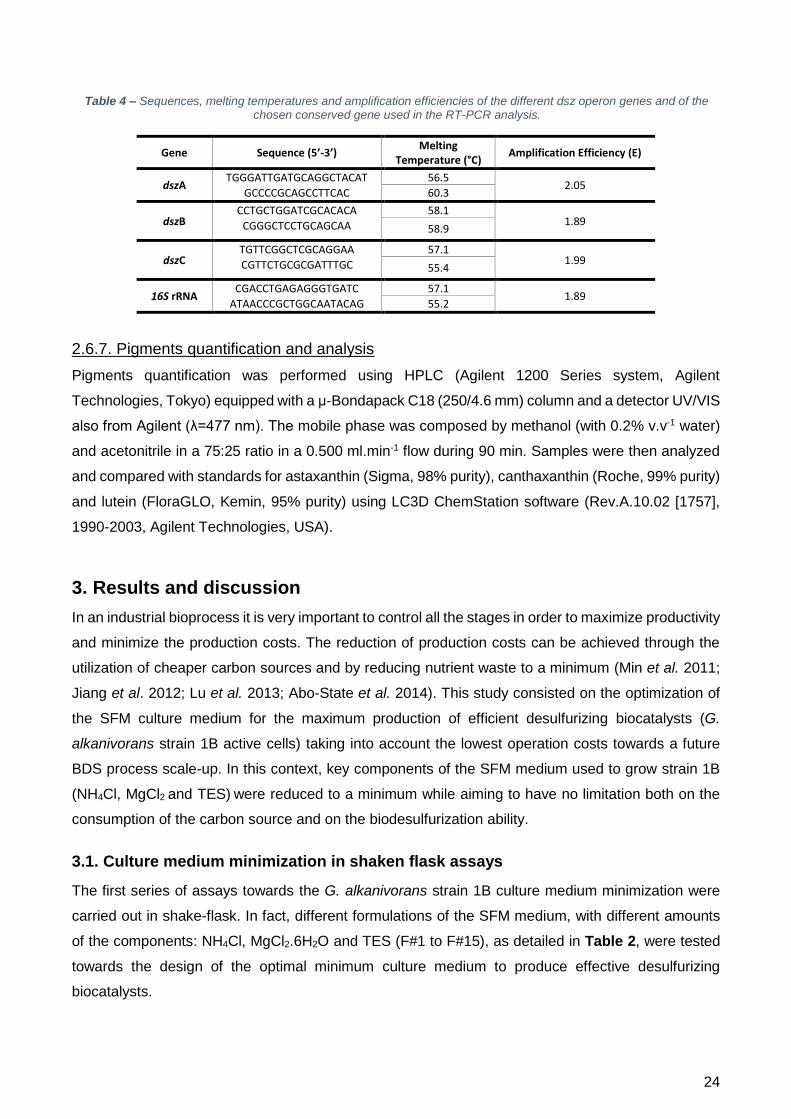
24
Table 4 – Sequences, melting temperatures and amplification efficiencies of the different dsz operon genes and of the chosen conserved gene used in the RT-PCR analysis.
Gene Sequence (5’-3’) Melting
Temperature (°C) Amplification Efficiency (E)
dszA TGGGATTGATGCAGGCTACAT 56.5
2.05 GCCCCGCAGCCTTCAC 60.3
dszB CCTGCTGGATCGCACACA 58.1
1.89 CGGGCTCCTGCAGCAA 58.9
dszC TGTTCGGCTCGCAGGAA 57.1
1.99 CGTTCTGCGCGATTTGC 55.4
16S rRNA CGACCTGAGAGGGTGATC 57.1
1.89 ATAACCCGCTGGCAATACAG 55.2
2.6.7. Pigments quantification and analysis
Pigments quantification was performed using HPLC (Agilent 1200 Series system, Agilent
Technologies, Tokyo) equipped with a μ-Bondapack C18 (250/4.6 mm) column and a detector UV/VIS
also from Agilent (λ=477 nm). The mobile phase was composed by methanol (with 0.2% v.v-1 water)
and acetonitrile in a 75:25 ratio in a 0.500 ml.min-1 flow during 90 min. Samples were then analyzed
and compared with standards for astaxanthin (Sigma, 98% purity), canthaxanthin (Roche, 99% purity)
and lutein (FloraGLO, Kemin, 95% purity) using LC3D ChemStation software (Rev.A.10.02 [1757],
1990-2003, Agilent Technologies, USA).
3. Results and discussion
In an industrial bioprocess it is very important to control all the stages in order to maximize productivity
and minimize the production costs. The reduction of production costs can be achieved through the
utilization of cheaper carbon sources and by reducing nutrient waste to a minimum (Min et al. 2011;
Jiang et al. 2012; Lu et al. 2013; Abo-State et al. 2014). This study consisted on the optimization of
the SFM culture medium for the maximum production of efficient desulfurizing biocatalysts (G.
alkanivorans strain 1B active cells) taking into account the lowest operation costs towards a future
BDS process scale-up. In this context, key components of the SFM medium used to grow strain 1B
(NH4Cl, MgCl2 and TES) were reduced to a minimum while aiming to have no limitation both on the
consumption of the carbon source and on the biodesulfurization ability.
3.1. Culture medium minimization in shaken flask assays
The first series of assays towards the G. alkanivorans strain 1B culture medium minimization were
carried out in shake-flask. In fact, different formulations of the SFM medium, with different amounts
of the components: NH4Cl, MgCl2.6H2O and TES (F#1 to F#15), as detailed in Table 2, were tested
towards the design of the optimal minimum culture medium to produce effective desulfurizing
biocatalysts.
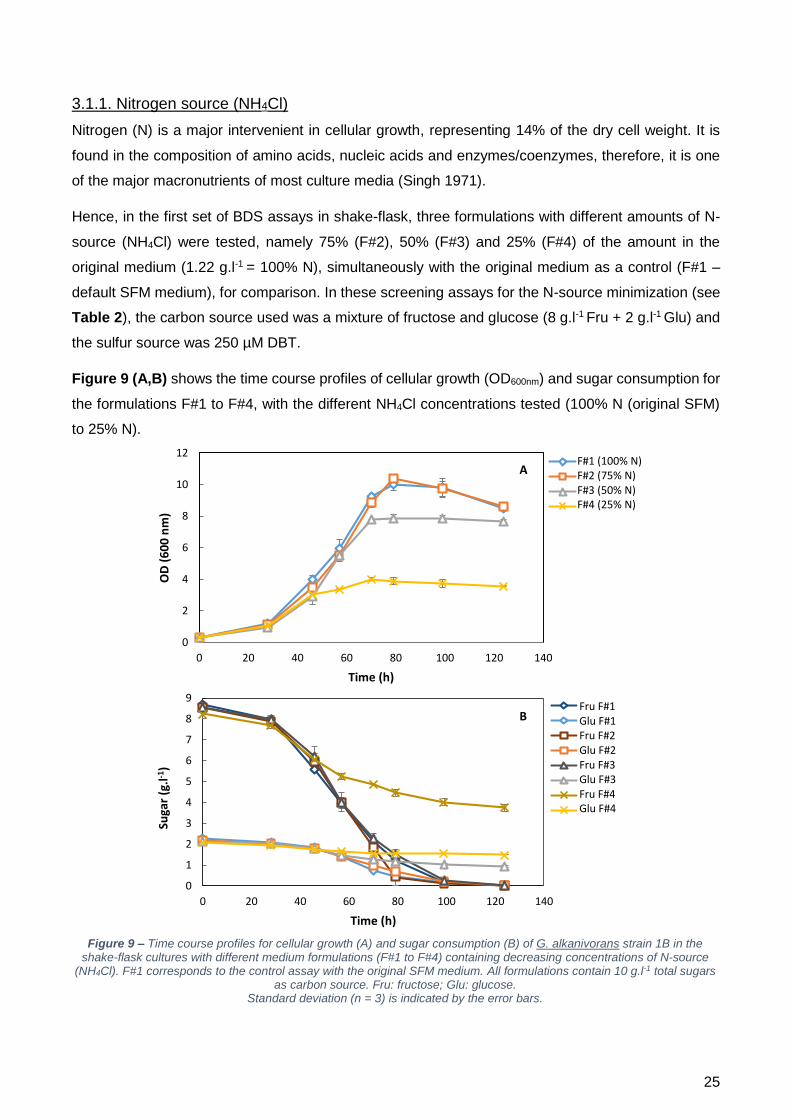
25
3.1.1. Nitrogen source (NH4Cl)
Nitrogen (N) is a major intervenient in cellular growth, representing 14% of the dry cell weight. It is
found in the composition of amino acids, nucleic acids and enzymes/coenzymes, therefore, it is one
of the major macronutrients of most culture media (Singh 1971).
Hence, in the first set of BDS assays in shake-flask, three formulations with different amounts of N-
source (NH4Cl) were tested, namely 75% (F#2), 50% (F#3) and 25% (F#4) of the amount in the
original medium (1.22 g.l-1 = 100% N), simultaneously with the original medium as a control (F#1 –
default SFM medium), for comparison. In these screening assays for the N-source minimization (see
Table 2), the carbon source used was a mixture of fructose and glucose (8 g.l-1 Fru + 2 g.l-1 Glu) and
the sulfur source was 250 µM DBT.
Figure 9 (A,B) shows the time course profiles of cellular growth (OD600nm) and sugar consumption for
the formulations F#1 to F#4, with the different NH4Cl concentrations tested (100% N (original SFM)
to 25% N).
0
2
4
6
8
10
12
0 20 40 60 80 100 120 140
OD
(6
00
nm
)
Time (h)
DM75% NH4Cl50% NH4Cl25% NH4Cl
0
1
2
3
4
5
6
7
8
9
0 20 40 60 80 100 120 140
Suga
r (g
.l-1
)
Time (h)
Fructose DM
Glucose DM
Fructose 75% NH4Cl
Glucose 75% NH4Cl
Fructose 50% NH4Cl
Glucose 50% NH4Cl
Fructose 25% NH4ClGlucose 25% NH4Cl
F#1 (100% N) F#2 (75% N) F#3 (50% N) F#4 (25% N)
Fru F#1 Glu F#1 Fru F#2 Glu F#2 Fru F#3 Glu F#3 Fru F#4 Glu F#4
A
B
Figure 9 – Time course profiles for cellular growth (A) and sugar consumption (B) of G. alkanivorans strain 1B in the shake-flask cultures with different medium formulations (F#1 to F#4) containing decreasing concentrations of N-source
(NH4Cl). F#1 corresponds to the control assay with the original SFM medium. All formulations contain 10 g.l-1 total sugars as carbon source. Fru: fructose; Glu: glucose.
Standard deviation (n = 3) is indicated by the error bars.
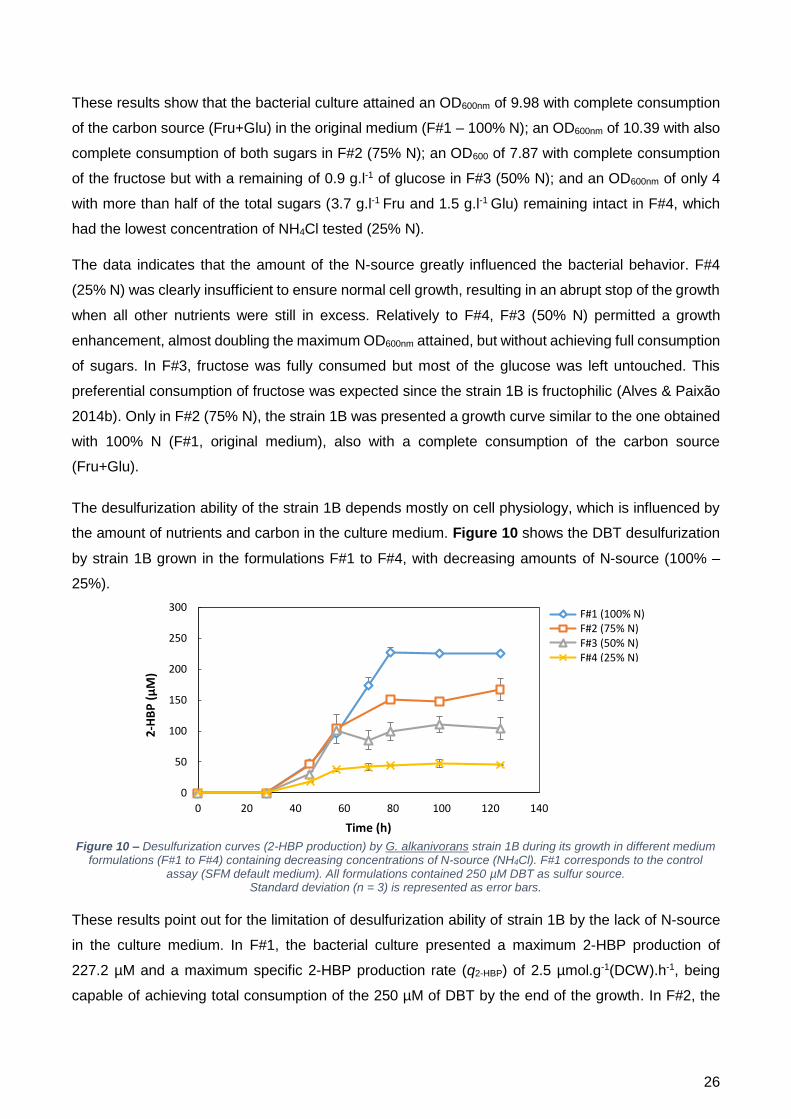
26
These results show that the bacterial culture attained an OD600nm of 9.98 with complete consumption
of the carbon source (Fru+Glu) in the original medium (F#1 – 100% N); an OD600nm of 10.39 with also
complete consumption of both sugars in F#2 (75% N); an OD600 of 7.87 with complete consumption
of the fructose but with a remaining of 0.9 g.l-1 of glucose in F#3 (50% N); and an OD600nm of only 4
with more than half of the total sugars (3.7 g.l-1 Fru and 1.5 g.l-1 Glu) remaining intact in F#4, which
had the lowest concentration of NH4Cl tested (25% N).
The data indicates that the amount of the N-source greatly influenced the bacterial behavior. F#4
(25% N) was clearly insufficient to ensure normal cell growth, resulting in an abrupt stop of the growth
when all other nutrients were still in excess. Relatively to F#4, F#3 (50% N) permitted a growth
enhancement, almost doubling the maximum OD600nm attained, but without achieving full consumption
of sugars. In F#3, fructose was fully consumed but most of the glucose was left untouched. This
preferential consumption of fructose was expected since the strain 1B is fructophilic (Alves & Paixão
2014b). Only in F#2 (75% N), the strain 1B was presented a growth curve similar to the one obtained
with 100% N (F#1, original medium), also with a complete consumption of the carbon source
(Fru+Glu).
The desulfurization ability of the strain 1B depends mostly on cell physiology, which is influenced by
the amount of nutrients and carbon in the culture medium. Figure 10 shows the DBT desulfurization
by strain 1B grown in the formulations F#1 to F#4, with decreasing amounts of N-source (100% –
25%).
These results point out for the limitation of desulfurization ability of strain 1B by the lack of N-source
in the culture medium. In F#1, the bacterial culture presented a maximum 2-HBP production of
227.2 µM and a maximum specific 2-HBP production rate (q2-HBP) of 2.5 µmol.g-1(DCW).h-1, being
capable of achieving total consumption of the 250 µM of DBT by the end of the growth. In F#2, the
0
50
100
150
200
250
300
0 20 40 60 80 100 120 140
2-H
BP
(µ
M)
Time (h)
DM75% NH4Cl50% NH4Cl25% NH4Cl
F#1 (100% N) F#2 (75% N) F#3 (50% N) F#4 (25% N)
Figure 10 – Desulfurization curves (2-HBP production) by G. alkanivorans strain 1B during its growth in different medium formulations (F#1 to F#4) containing decreasing concentrations of N-source (NH4Cl). F#1 corresponds to the control
assay (SFM default medium). All formulations contained 250 µM DBT as sulfur source. Standard deviation (n = 3) is represented as error bars.
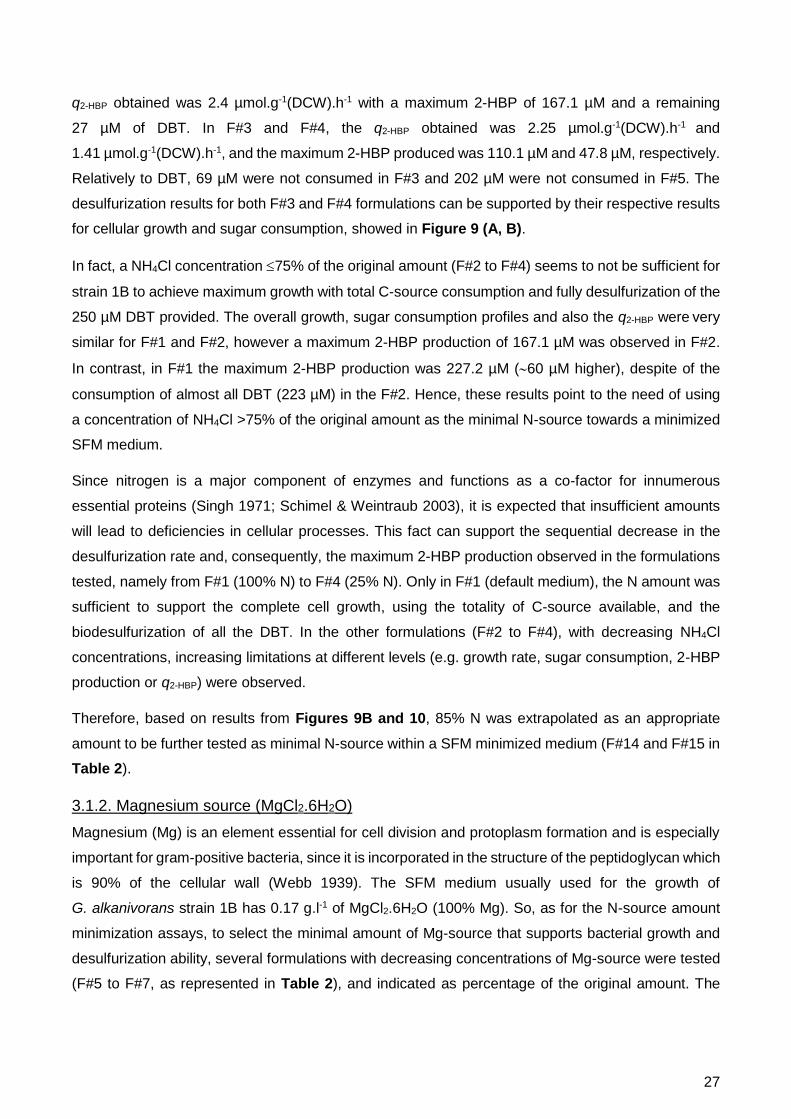
27
q2-HBP obtained was 2.4 µmol.g-1(DCW).h-1 with a maximum 2-HBP of 167.1 µM and a remaining
27 µM of DBT. In F#3 and F#4, the q2-HBP obtained was 2.25 µmol.g-1(DCW).h-1 and
1.41 µmol.g-1(DCW).h-1, and the maximum 2-HBP produced was 110.1 µM and 47.8 µM, respectively.
Relatively to DBT, 69 µM were not consumed in F#3 and 202 µM were not consumed in F#5. The
desulfurization results for both F#3 and F#4 formulations can be supported by their respective results
for cellular growth and sugar consumption, showed in Figure 9 (A, B).
In fact, a NH4Cl concentration 75% of the original amount (F#2 to F#4) seems to not be sufficient for
strain 1B to achieve maximum growth with total C-source consumption and fully desulfurization of the
250 µM DBT provided. The overall growth, sugar consumption profiles and also the q2-HBP were very
similar for F#1 and F#2, however a maximum 2-HBP production of 167.1 µM was observed in F#2.
In contrast, in F#1 the maximum 2-HBP production was 227.2 µM (60 µM higher), despite of the
consumption of almost all DBT (223 µM) in the F#2. Hence, these results point to the need of using
a concentration of NH4Cl >75% of the original amount as the minimal N-source towards a minimized
SFM medium.
Since nitrogen is a major component of enzymes and functions as a co-factor for innumerous
essential proteins (Singh 1971; Schimel & Weintraub 2003), it is expected that insufficient amounts
will lead to deficiencies in cellular processes. This fact can support the sequential decrease in the
desulfurization rate and, consequently, the maximum 2-HBP production observed in the formulations
tested, namely from F#1 (100% N) to F#4 (25% N). Only in F#1 (default medium), the N amount was
sufficient to support the complete cell growth, using the totality of C-source available, and the
biodesulfurization of all the DBT. In the other formulations (F#2 to F#4), with decreasing NH4Cl
concentrations, increasing limitations at different levels (e.g. growth rate, sugar consumption, 2-HBP
production or q2-HBP) were observed.
Therefore, based on results from Figures 9B and 10, 85% N was extrapolated as an appropriate
amount to be further tested as minimal N-source within a SFM minimized medium (F#14 and F#15 in
Table 2).
3.1.2. Magnesium source (MgCl2.6H2O)
Magnesium (Mg) is an element essential for cell division and protoplasm formation and is especially
important for gram-positive bacteria, since it is incorporated in the structure of the peptidoglycan which
is 90% of the cellular wall (Webb 1939). The SFM medium usually used for the growth of
G. alkanivorans strain 1B has 0.17 g.l-1 of MgCl2.6H2O (100% Mg). So, as for the N-source amount
minimization assays, to select the minimal amount of Mg-source that supports bacterial growth and
desulfurization ability, several formulations with decreasing concentrations of Mg-source were tested
(F#5 to F#7, as represented in Table 2), and indicated as percentage of the original amount. The
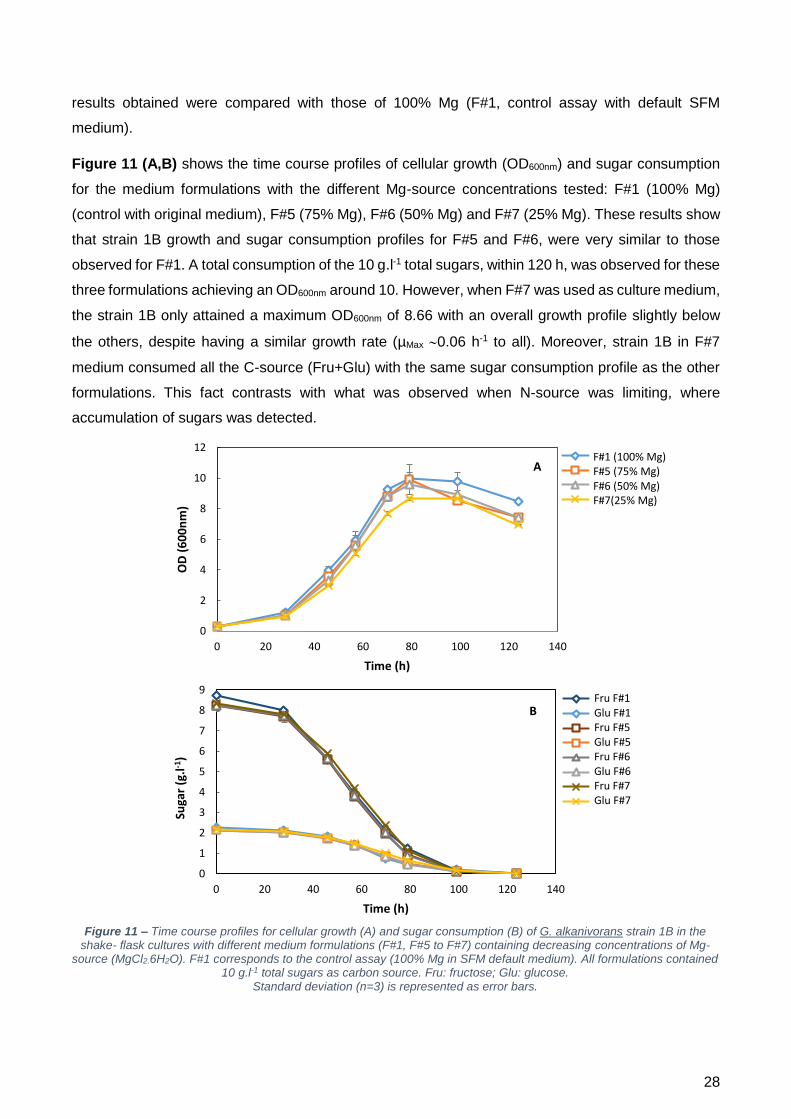
28
results obtained were compared with those of 100% Mg (F#1, control assay with default SFM
medium).
Figure 11 (A,B) shows the time course profiles of cellular growth (OD600nm) and sugar consumption
for the medium formulations with the different Mg-source concentrations tested: F#1 (100% Mg)
(control with original medium), F#5 (75% Mg), F#6 (50% Mg) and F#7 (25% Mg). These results show
that strain 1B growth and sugar consumption profiles for F#5 and F#6, were very similar to those
observed for F#1. A total consumption of the 10 g.l-1 total sugars, within 120 h, was observed for these
three formulations achieving an OD600nm around 10. However, when F#7 was used as culture medium,
the strain 1B only attained a maximum OD600nm of 8.66 with an overall growth profile slightly below
the others, despite having a similar growth rate (µMax 0.06 h-1 to all). Moreover, strain 1B in F#7
medium consumed all the C-source (Fru+Glu) with the same sugar consumption profile as the other
formulations. This fact contrasts with what was observed when N-source was limiting, where
accumulation of sugars was detected.
0
1
2
3
4
5
6
7
8
9
0 20 40 60 80 100 120 140
Suga
r (g
.l-1
)
Time (h)
Fructose DMGlucose DMFructose 75% MgCl2Glucose 75% MgCl2Fructose 50% MgCl2Glucose 50% MgCl2Fructose 25% MgCl2Glucose 25% MgCl2
0
2
4
6
8
10
12
0 20 40 60 80 100 120 140
OD
(6
00
nm
)
Time (h)
DM75% MgCl250% MgCl225% MgCl2
F#1 (100% Mg) F#5 (75% Mg) F#6 (50% Mg) F#7(25% Mg)
A
B Fru F#1 Glu F#1 Fru F#5 Glu F#5 Fru F#6 Glu F#6 Fru F#7 Glu F#7
Figure 11 – Time course profiles for cellular growth (A) and sugar consumption (B) of G. alkanivorans strain 1B in the shake- flask cultures with different medium formulations (F#1, F#5 to F#7) containing decreasing concentrations of Mg-
source (MgCl2.6H2O). F#1 corresponds to the control assay (100% Mg in SFM default medium). All formulations contained 10 g.l-1 total sugars as carbon source. Fru: fructose; Glu: glucose.
Standard deviation (n=3) is represented as error bars.
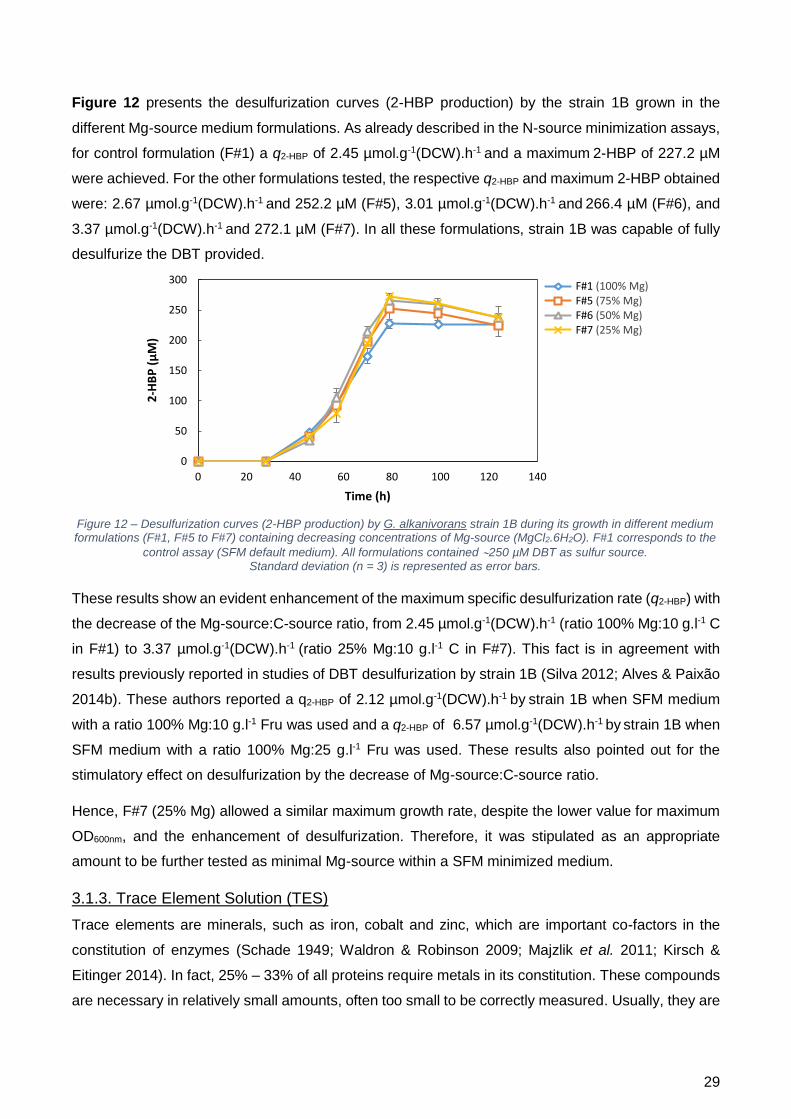
29
Figure 12 presents the desulfurization curves (2-HBP production) by the strain 1B grown in the
different Mg-source medium formulations. As already described in the N-source minimization assays,
for control formulation (F#1) a q2-HBP of 2.45 µmol.g-1(DCW).h-1 and a maximum 2-HBP of 227.2 µM
were achieved. For the other formulations tested, the respective q2-HBP and maximum 2-HBP obtained
were: 2.67 µmol.g-1(DCW).h-1 and 252.2 µM (F#5), 3.01 µmol.g-1(DCW).h-1 and 266.4 µM (F#6), and
3.37 µmol.g-1(DCW).h-1 and 272.1 µM (F#7). In all these formulations, strain 1B was capable of fully
desulfurize the DBT provided.
These results show an evident enhancement of the maximum specific desulfurization rate (q2-HBP) with
the decrease of the Mg-source:C-source ratio, from 2.45 µmol.g-1(DCW).h-1 (ratio 100% Mg:10 g.l-1 C
in F#1) to 3.37 µmol.g-1(DCW).h-1 (ratio 25% Mg:10 g.l-1 C in F#7). This fact is in agreement with
results previously reported in studies of DBT desulfurization by strain 1B (Silva 2012; Alves & Paixão
2014b). These authors reported a q2-HBP of 2.12 µmol.g-1(DCW).h-1 by strain 1B when SFM medium
with a ratio 100% Mg:10 g.l-1 Fru was used and a q2-HBP of 6.57 µmol.g-1(DCW).h-1 by strain 1B when
SFM medium with a ratio 100% Mg:25 g.l-1 Fru was used. These results also pointed out for the
stimulatory effect on desulfurization by the decrease of Mg-source:C-source ratio.
Hence, F#7 (25% Mg) allowed a similar maximum growth rate, despite the lower value for maximum
OD600nm, and the enhancement of desulfurization. Therefore, it was stipulated as an appropriate
amount to be further tested as minimal Mg-source within a SFM minimized medium.
3.1.3. Trace Element Solution (TES)
Trace elements are minerals, such as iron, cobalt and zinc, which are important co-factors in the
constitution of enzymes (Schade 1949; Waldron & Robinson 2009; Majzlik et al. 2011; Kirsch &
Eitinger 2014). In fact, 25% – 33% of all proteins require metals in its constitution. These compounds
are necessary in relatively small amounts, often too small to be correctly measured. Usually, they are
0
50
100
150
200
250
300
0 20 40 60 80 100 120 140
2-H
BP
(µ
M)
Time (h)
DM75% MgCl250% MgCl225% MgCl2
F#1 (100% Mg) F#5 (75% Mg) F#6 (50% Mg) F#7 (25% Mg)
Figure 12 – Desulfurization curves (2-HBP production) by G. alkanivorans strain 1B during its growth in different medium formulations (F#1, F#5 to F#7) containing decreasing concentrations of Mg-source (MgCl2.6H2O). F#1 corresponds to the
control assay (SFM default medium). All formulations contained 250 µM DBT as sulfur source. Standard deviation (n = 3) is represented as error bars.
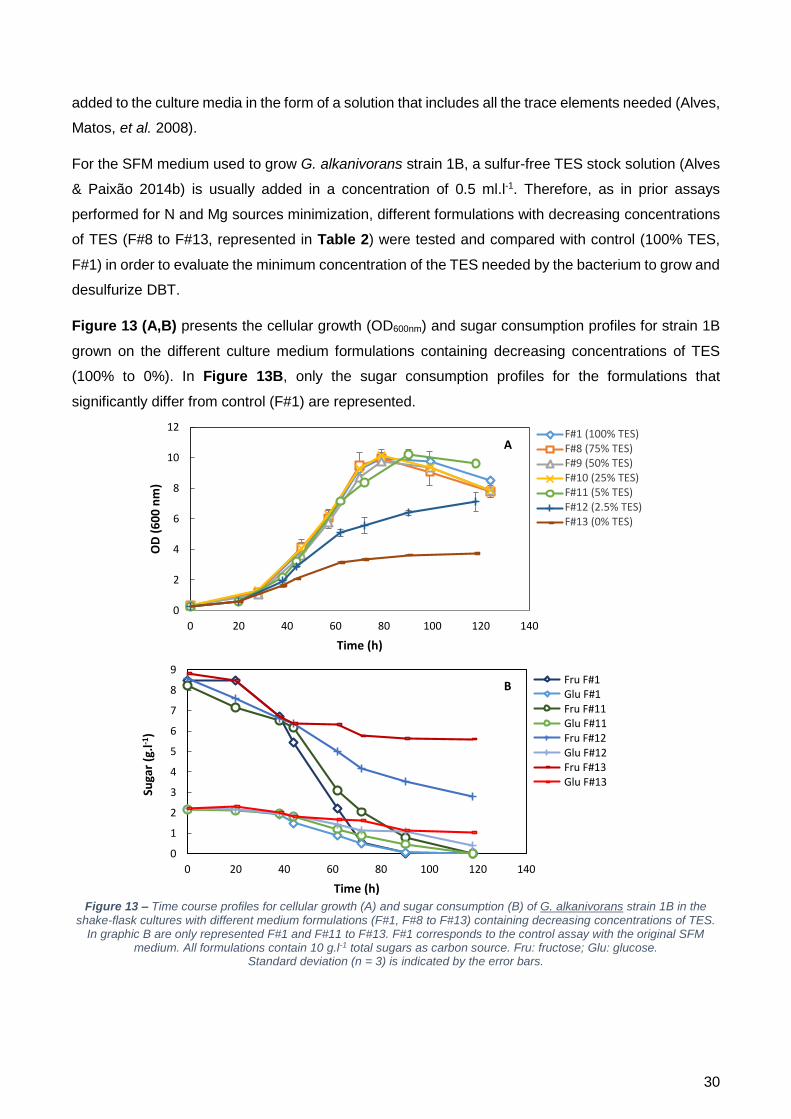
30
added to the culture media in the form of a solution that includes all the trace elements needed (Alves,
Matos, et al. 2008).
For the SFM medium used to grow G. alkanivorans strain 1B, a sulfur-free TES stock solution (Alves
& Paixão 2014b) is usually added in a concentration of 0.5 ml.l-1. Therefore, as in prior assays
performed for N and Mg sources minimization, different formulations with decreasing concentrations
of TES (F#8 to F#13, represented in Table 2) were tested and compared with control (100% TES,
F#1) in order to evaluate the minimum concentration of the TES needed by the bacterium to grow and
desulfurize DBT.
Figure 13 (A,B) presents the cellular growth (OD600nm) and sugar consumption profiles for strain 1B
grown on the different culture medium formulations containing decreasing concentrations of TES
(100% to 0%). In Figure 13B, only the sugar consumption profiles for the formulations that
significantly differ from control (F#1) are represented.
0
2
4
6
8
10
12
0 20 40 60 80 100 120 140
OD
(6
00
nm
)
Time (h)
DM75% TES50% TES25% TES5% TES2.5% TES0% TES
0
1
2
3
4
5
6
7
8
9
0 20 40 60 80 100 120 140
Suga
r (g
.l-1
)
Time (h)
Fructose DM
Glucose DM
Fructose 5% TES
Glucose 5% TES
Fructose 2.5% TES
Glucose 2.5% TES
Fructose 0% TES
Glucose 0% TES
F#1 (100% TES) F#8 (75% TES) F#9 (50% TES) F#10 (25% TES) F#11 (5% TES) F#12 (2.5% TES) F#13 (0% TES)
Fru F#1 Glu F#1 Fru F#11 Glu F#11 Fru F#12 Glu F#12 Fru F#13 Glu F#13
A
B
Figure 13 – Time course profiles for cellular growth (A) and sugar consumption (B) of G. alkanivorans strain 1B in the shake-flask cultures with different medium formulations (F#1, F#8 to F#13) containing decreasing concentrations of TES.
In graphic B are only represented F#1 and F#11 to F#13. F#1 corresponds to the control assay with the original SFM medium. All formulations contain 10 g.l-1 total sugars as carbon source. Fru: fructose; Glu: glucose.
Standard deviation (n = 3) is indicated by the error bars.
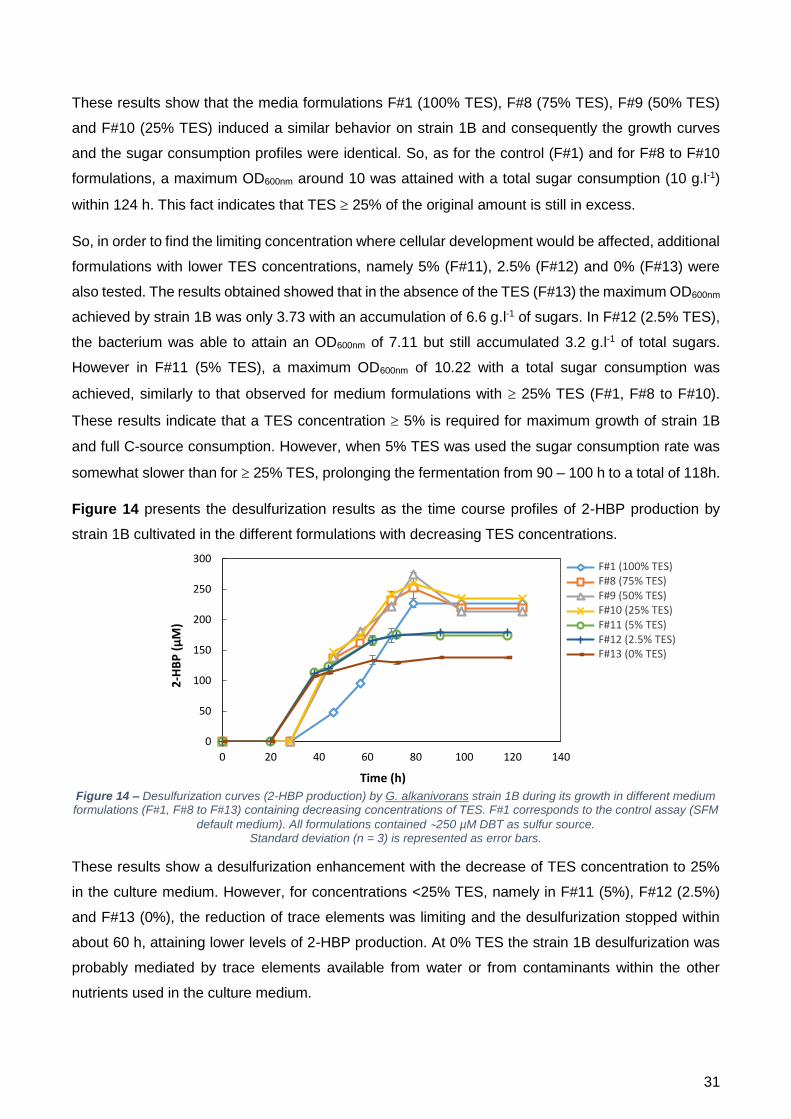
31
0
50
100
150
200
250
300
0 20 40 60 80 100 120 140
2-H
BP
(µ
M)
Time (h)
DM75% TES50% TES25% TES5% TES2.5% TES0% TES
Figure 14 – Desulfurization curves (2-HBP production) by G. alkanivorans strain 1B during its growth in different medium formulations (F#1, F#8 to F#13) containing decreasing concentrations of TES. F#1 corresponds to the control assay (SFM
default medium). All formulations contained 250 µM DBT as sulfur source. Standard deviation (n = 3) is represented as error bars.
These results show that the media formulations F#1 (100% TES), F#8 (75% TES), F#9 (50% TES)
and F#10 (25% TES) induced a similar behavior on strain 1B and consequently the growth curves
and the sugar consumption profiles were identical. So, as for the control (F#1) and for F#8 to F#10
formulations, a maximum OD600nm around 10 was attained with a total sugar consumption (10 g.l-1)
within 124 h. This fact indicates that TES 25% of the original amount is still in excess.
So, in order to find the limiting concentration where cellular development would be affected, additional
formulations with lower TES concentrations, namely 5% (F#11), 2.5% (F#12) and 0% (F#13) were
also tested. The results obtained showed that in the absence of the TES (F#13) the maximum OD600nm
achieved by strain 1B was only 3.73 with an accumulation of 6.6 g.l-1 of sugars. In F#12 (2.5% TES),
the bacterium was able to attain an OD600nm of 7.11 but still accumulated 3.2 g.l-1 of total sugars.
However in F#11 (5% TES), a maximum OD600nm of 10.22 with a total sugar consumption was
achieved, similarly to that observed for medium formulations with 25% TES (F#1, F#8 to F#10).
These results indicate that a TES concentration 5% is required for maximum growth of strain 1B
and full C-source consumption. However, when 5% TES was used the sugar consumption rate was
somewhat slower than for 25% TES, prolonging the fermentation from 90 – 100 h to a total of 118h.
Figure 14 presents the desulfurization results as the time course profiles of 2-HBP production by
strain 1B cultivated in the different formulations with decreasing TES concentrations.
These results show a desulfurization enhancement with the decrease of TES concentration to 25%
in the culture medium. However, for concentrations <25% TES, namely in F#11 (5%), F#12 (2.5%)
and F#13 (0%), the reduction of trace elements was limiting and the desulfurization stopped within
about 60 h, attaining lower levels of 2-HBP production. At 0% TES the strain 1B desulfurization was
probably mediated by trace elements available from water or from contaminants within the other
nutrients used in the culture medium.
F#1 (100% TES) F#8 (75% TES) F#9 (50% TES) F#10 (25% TES) F#11 (5% TES) F#12 (2.5% TES) F#13 (0% TES)
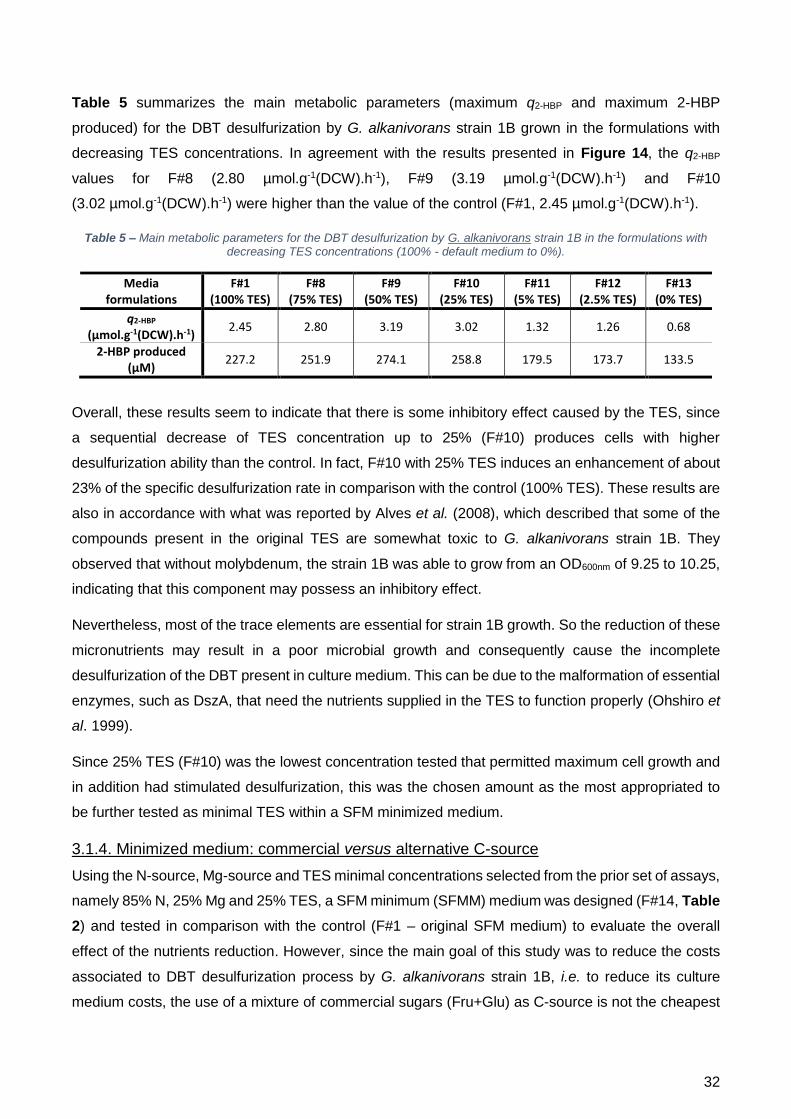
32
Table 5 summarizes the main metabolic parameters (maximum q2-HBP and maximum 2-HBP
produced) for the DBT desulfurization by G. alkanivorans strain 1B grown in the formulations with
decreasing TES concentrations. In agreement with the results presented in Figure 14, the q2-HBP
values for F#8 (2.80 µmol.g-1(DCW).h-1), F#9 (3.19 µmol.g-1(DCW).h-1) and F#10
(3.02 µmol.g-1(DCW).h-1) were higher than the value of the control (F#1, 2.45 µmol.g-1(DCW).h-1).
Table 5 – Main metabolic parameters for the DBT desulfurization by G. alkanivorans strain 1B in the formulations with decreasing TES concentrations (100% - default medium to 0%).
Media formulations
F#1 (100% TES)
F#8 (75% TES)
F#9 (50% TES)
F#10 (25% TES)
F#11 (5% TES)
F#12 (2.5% TES)
F#13 (0% TES)
q2-HBP (µmol.g-1(DCW).h-1)
2.45 2.80 3.19 3.02 1.32 1.26 0.68
2-HBP produced (µM)
227.2 251.9 274.1 258.8 179.5 173.7 133.5
Overall, these results seem to indicate that there is some inhibitory effect caused by the TES, since
a sequential decrease of TES concentration up to 25% (F#10) produces cells with higher
desulfurization ability than the control. In fact, F#10 with 25% TES induces an enhancement of about
23% of the specific desulfurization rate in comparison with the control (100% TES). These results are
also in accordance with what was reported by Alves et al. (2008), which described that some of the
compounds present in the original TES are somewhat toxic to G. alkanivorans strain 1B. They
observed that without molybdenum, the strain 1B was able to grow from an OD600nm of 9.25 to 10.25,
indicating that this component may possess an inhibitory effect.
Nevertheless, most of the trace elements are essential for strain 1B growth. So the reduction of these
micronutrients may result in a poor microbial growth and consequently cause the incomplete
desulfurization of the DBT present in culture medium. This can be due to the malformation of essential
enzymes, such as DszA, that need the nutrients supplied in the TES to function properly (Ohshiro et
al. 1999).
Since 25% TES (F#10) was the lowest concentration tested that permitted maximum cell growth and
in addition had stimulated desulfurization, this was the chosen amount as the most appropriated to
be further tested as minimal TES within a SFM minimized medium.
3.1.4. Minimized medium: commercial versus alternative C-source
Using the N-source, Mg-source and TES minimal concentrations selected from the prior set of assays,
namely 85% N, 25% Mg and 25% TES, a SFM minimum (SFMM) medium was designed (F#14, Table
2) and tested in comparison with the control (F#1 – original SFM medium) to evaluate the overall
effect of the nutrients reduction. However, since the main goal of this study was to reduce the costs
associated to DBT desulfurization process by G. alkanivorans strain 1B, i.e. to reduce its culture
medium costs, the use of a mixture of commercial sugars (Fru+Glu) as C-source is not the cheapest
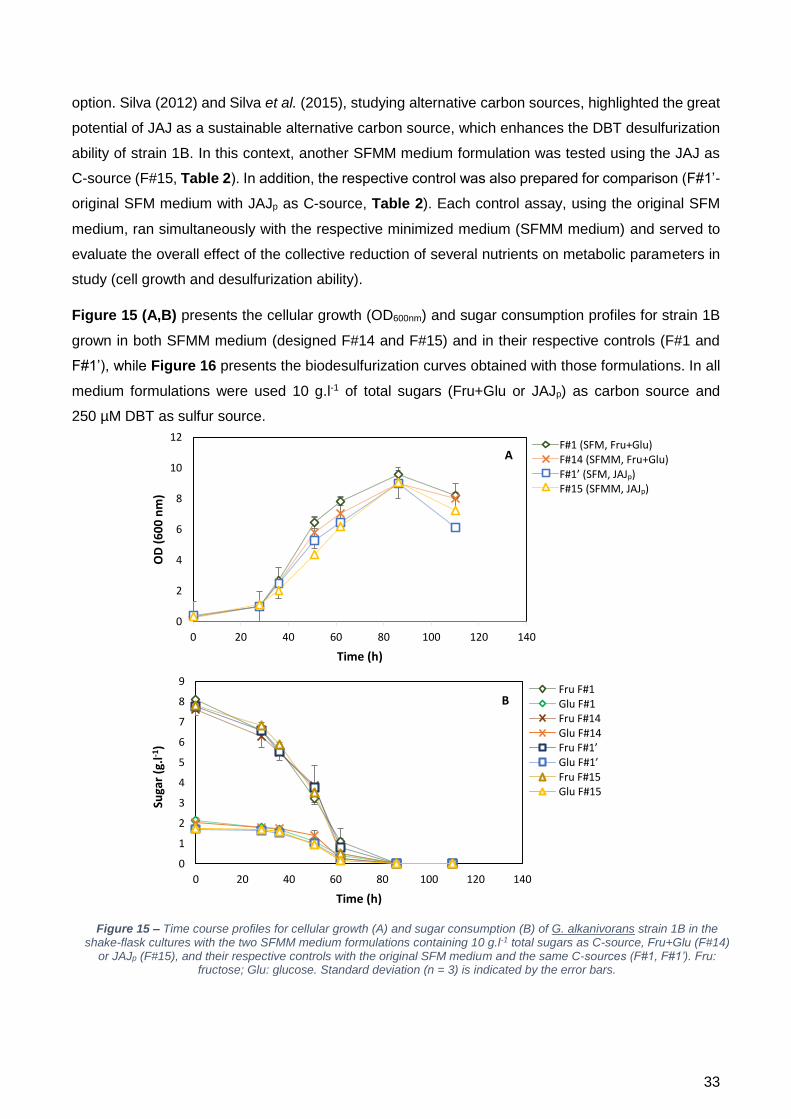
33
option. Silva (2012) and Silva et al. (2015), studying alternative carbon sources, highlighted the great
potential of JAJ as a sustainable alternative carbon source, which enhances the DBT desulfurization
ability of strain 1B. In this context, another SFMM medium formulation was tested using the JAJ as
C-source (F#15, Table 2). In addition, the respective control was also prepared for comparison (F#1’-
original SFM medium with JAJp as C-source, Table 2). Each control assay, using the original SFM
medium, ran simultaneously with the respective minimized medium (SFMM medium) and served to
evaluate the overall effect of the collective reduction of several nutrients on metabolic parameters in
study (cell growth and desulfurization ability).
Figure 15 (A,B) presents the cellular growth (OD600nm) and sugar consumption profiles for strain 1B
grown in both SFMM medium (designed F#14 and F#15) and in their respective controls (F#1 and
F#1’), while Figure 16 presents the biodesulfurization curves obtained with those formulations. In all
medium formulations were used 10 g.l-1 of total sugars (Fru+Glu or JAJp) as carbon source and
250 µM DBT as sulfur source.
0
2
4
6
8
10
12
0 20 40 60 80 100 120 140
OD
(6
00
nm
)
Time (h)
DM Fru+GluSMM Fru+GluDM JAJSMM JAJ
0
1
2
3
4
5
6
7
8
9
0 20 40 60 80 100 120 140
Suga
r (g
.l-1
)
Time (h)
Fructose DM Fru+GluGlucose DM Fru+GluFructose SMM Fru+GluGlucose SMM Fru+GluFructose DM JAJGlucose DM JAJFrutose SMM JAJGlucose SMM JAJ
F#1 (SFM, Fru+Glu) F#14 (SFMM, Fru+Glu) F#1’ (SFM, JAJp) F#15 (SFMM, JAJp)
Fru F#1 Glu F#1 Fru F#14 Glu F#14 Fru F#1’ Glu F#1’ Fru F#15 Glu F#15
A
B
Figure 15 – Time course profiles for cellular growth (A) and sugar consumption (B) of G. alkanivorans strain 1B in the shake-flask cultures with the two SFMM medium formulations containing 10 g.l-1 total sugars as C-source, Fru+Glu (F#14)
or JAJp (F#15), and their respective controls with the original SFM medium and the same C-sources (F#1, F#1’). Fru: fructose; Glu: glucose. Standard deviation (n = 3) is indicated by the error bars.
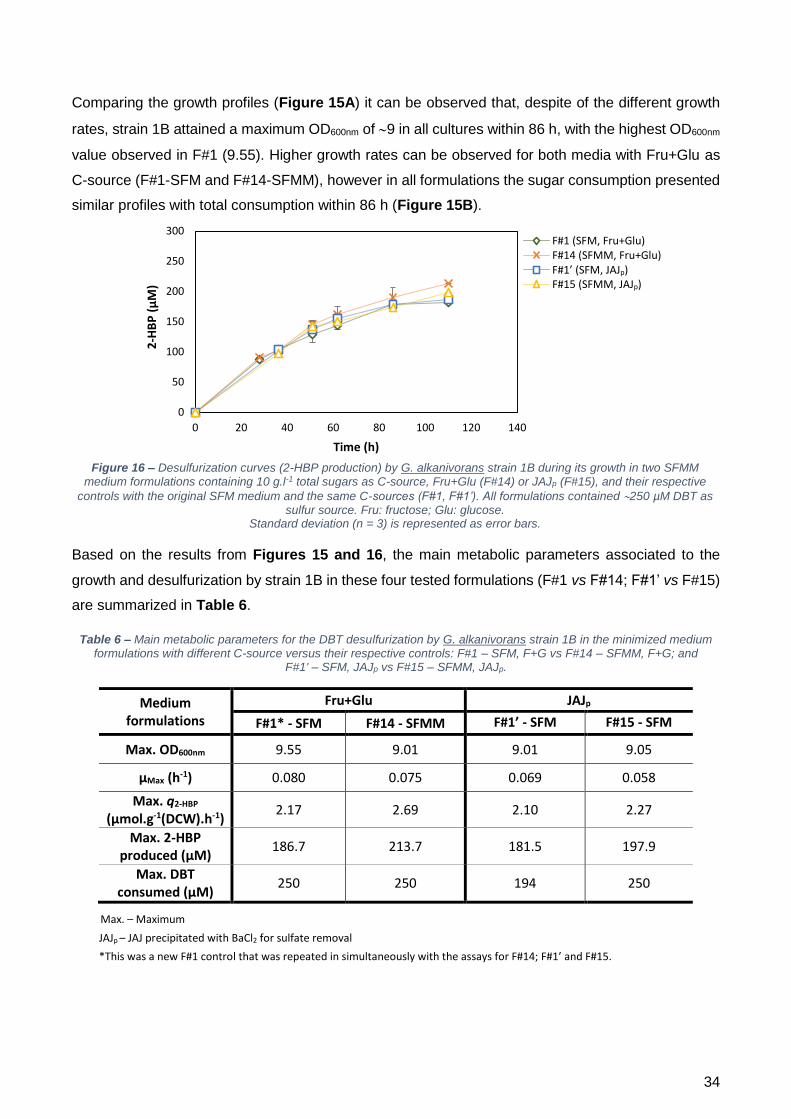
34
Figure 16 – Desulfurization curves (2-HBP production) by G. alkanivorans strain 1B during its growth in two SFMM medium formulations containing 10 g.l-1 total sugars as C-source, Fru+Glu (F#14) or JAJp (F#15), and their respective
controls with the original SFM medium and the same C-sources (F#1, F#1’). All formulations contained 250 µM DBT as sulfur source. Fru: fructose; Glu: glucose.
Standard deviation (n = 3) is represented as error bars.
Comparing the growth profiles (Figure 15A) it can be observed that, despite of the different growth
rates, strain 1B attained a maximum OD600nm of 9 in all cultures within 86 h, with the highest OD600nm
value observed in F#1 (9.55). Higher growth rates can be observed for both media with Fru+Glu as
C-source (F#1-SFM and F#14-SFMM), however in all formulations the sugar consumption presented
similar profiles with total consumption within 86 h (Figure 15B).
Based on the results from Figures 15 and 16, the main metabolic parameters associated to the
growth and desulfurization by strain 1B in these four tested formulations (F#1 vs F#14; F#1’ vs F#15)
are summarized in Table 6.
Table 6 – Main metabolic parameters for the DBT desulfurization by G. alkanivorans strain 1B in the minimized medium formulations with different C-source versus their respective controls: F#1 – SFM, F+G vs F#14 – SFMM, F+G; and
F#1' – SFM, JAJp vs F#15 – SFMM, JAJp.
Medium formulations
Fru+Glu JAJp
F#1* - SFM F#14 - SFMM F#1’ - SFM F#15 - SFM
Max. OD600nm 9.55 9.01 9.01 9.05
µMax (h-1) 0.080 0.075 0.069 0.058
Max. q2-HBP (µmol.g-1(DCW).h-1)
2.17 2.69 2.10 2.27
Max. 2-HBP produced (µM)
186.7 213.7 181.5 197.9
Max. DBT consumed (µM)
250 250 194 250
Max. – Maximum
JAJp – JAJ precipitated with BaCl2 for sulfate removal
*This was a new F#1 control that was repeated in simultaneously with the assays for F#14; F#1’ and F#15.
0
50
100
150
200
250
300
0 20 40 60 80 100 120 140
2-H
BP
(µ
M)
Time (h)
DM Fru+GluSMM Fru+GluDM JAJSMM JAJ
F#1 (SFM, Fru+Glu) F#14 (SFMM, Fru+Glu) F#1’ (SFM, JAJp) F#15 (SFMM, JAJp)
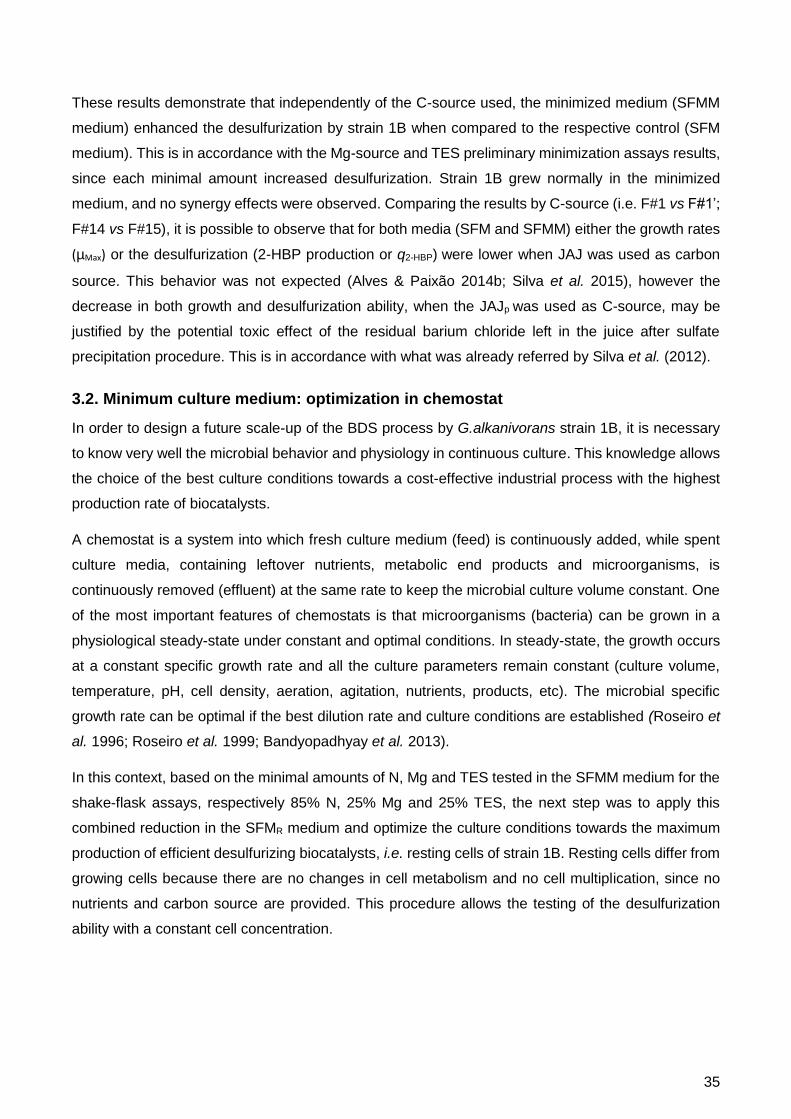
35
These results demonstrate that independently of the C-source used, the minimized medium (SFMM
medium) enhanced the desulfurization by strain 1B when compared to the respective control (SFM
medium). This is in accordance with the Mg-source and TES preliminary minimization assays results,
since each minimal amount increased desulfurization. Strain 1B grew normally in the minimized
medium, and no synergy effects were observed. Comparing the results by C-source (i.e. F#1 vs F#1’;
F#14 vs F#15), it is possible to observe that for both media (SFM and SFMM) either the growth rates
(µMax) or the desulfurization (2-HBP production or q2-HBP) were lower when JAJ was used as carbon
source. This behavior was not expected (Alves & Paixão 2014b; Silva et al. 2015), however the
decrease in both growth and desulfurization ability, when the JAJp was used as C-source, may be
justified by the potential toxic effect of the residual barium chloride left in the juice after sulfate
precipitation procedure. This is in accordance with what was already referred by Silva et al. (2012).
3.2. Minimum culture medium: optimization in chemostat
In order to design a future scale-up of the BDS process by G.alkanivorans strain 1B, it is necessary
to know very well the microbial behavior and physiology in continuous culture. This knowledge allows
the choice of the best culture conditions towards a cost-effective industrial process with the highest
production rate of biocatalysts.
A chemostat is a system into which fresh culture medium (feed) is continuously added, while spent
culture media, containing leftover nutrients, metabolic end products and microorganisms, is
continuously removed (effluent) at the same rate to keep the microbial culture volume constant. One
of the most important features of chemostats is that microorganisms (bacteria) can be grown in a
physiological steady-state under constant and optimal conditions. In steady-state, the growth occurs
at a constant specific growth rate and all the culture parameters remain constant (culture volume,
temperature, pH, cell density, aeration, agitation, nutrients, products, etc). The microbial specific
growth rate can be optimal if the best dilution rate and culture conditions are established (Roseiro et
al. 1996; Roseiro et al. 1999; Bandyopadhyay et al. 2013).
In this context, based on the minimal amounts of N, Mg and TES tested in the SFMM medium for the
shake-flask assays, respectively 85% N, 25% Mg and 25% TES, the next step was to apply this
combined reduction in the SFMR medium and optimize the culture conditions towards the maximum
production of efficient desulfurizing biocatalysts, i.e. resting cells of strain 1B. Resting cells differ from
growing cells because there are no changes in cell metabolism and no cell multiplication, since no
nutrients and carbon source are provided. This procedure allows the testing of the desulfurization
ability with a constant cell concentration.
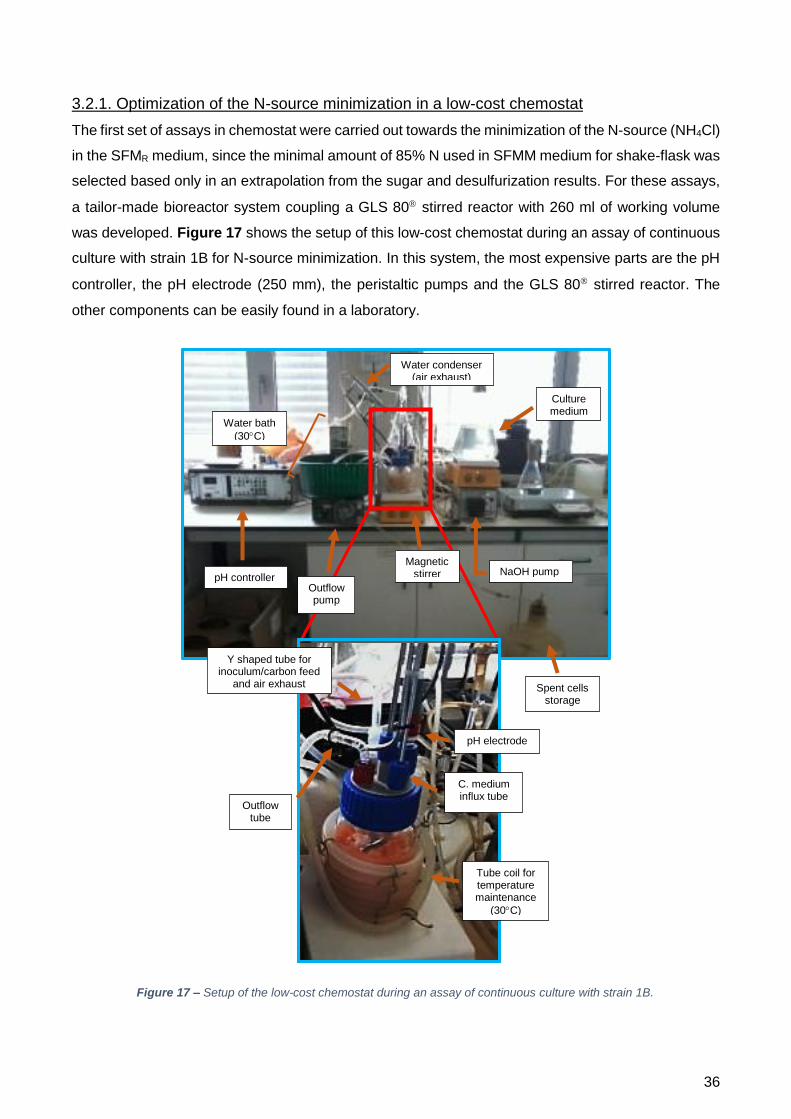
36
3.2.1. Optimization of the N-source minimization in a low-cost chemostat
The first set of assays in chemostat were carried out towards the minimization of the N-source (NH4Cl)
in the SFMR medium, since the minimal amount of 85% N used in SFMM medium for shake-flask was
selected based only in an extrapolation from the sugar and desulfurization results. For these assays,
a tailor-made bioreactor system coupling a GLS 80 stirred reactor with 260 ml of working volume
was developed. Figure 17 shows the setup of this low-cost chemostat during an assay of continuous
culture with strain 1B for N-source minimization. In this system, the most expensive parts are the pH
controller, the pH electrode (250 mm), the peristaltic pumps and the GLS 80 stirred reactor. The
other components can be easily found in a laboratory.
pH controller NaOH pump
Water condenser (air exhaust)
Water bath
(30C)
Culture medium
Magnetic stirrer
Outflow pump
Y shaped tube for inoculum/carbon feed
and air exhaust
Outflow tube
pH electrode
C. medium influx tube
Spent cells storage
Tube coil for temperature maintenance
(30C)
Figure 17 – Setup of the low-cost chemostat during an assay of continuous culture with strain 1B.
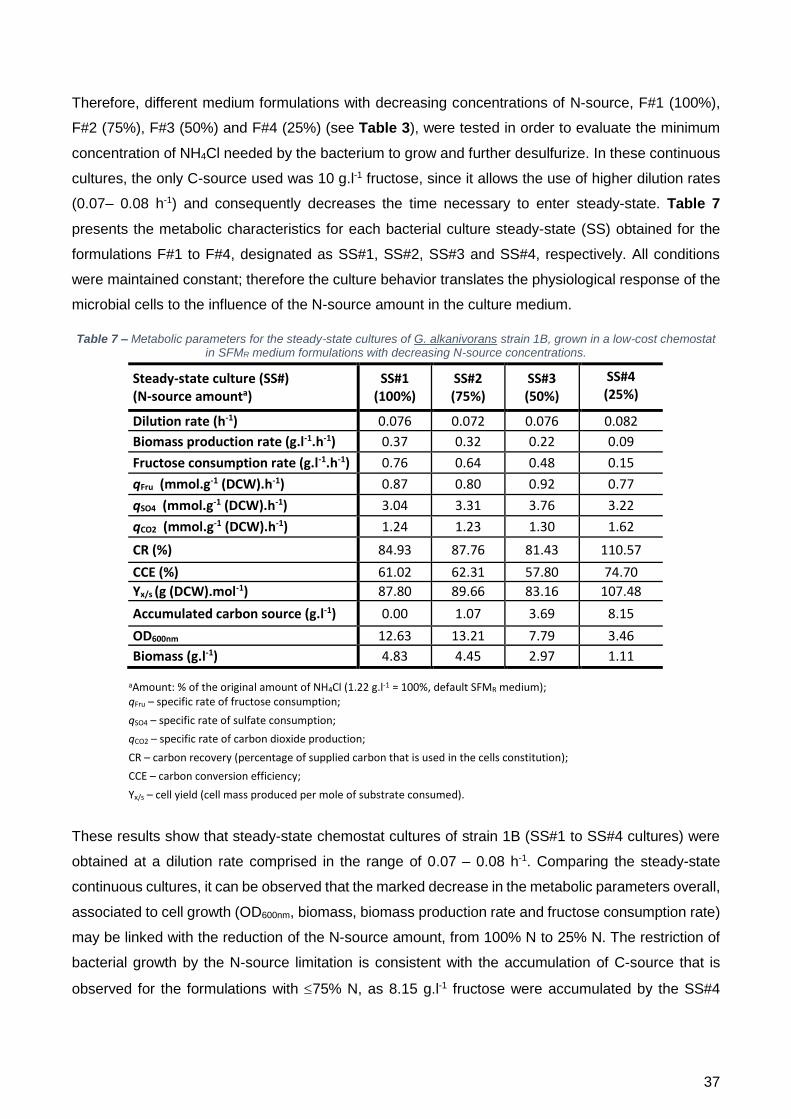
37
Therefore, different medium formulations with decreasing concentrations of N-source, F#1 (100%),
F#2 (75%), F#3 (50%) and F#4 (25%) (see Table 3), were tested in order to evaluate the minimum
concentration of NH4Cl needed by the bacterium to grow and further desulfurize. In these continuous
cultures, the only C-source used was 10 g.l-1 fructose, since it allows the use of higher dilution rates
(0.07– 0.08 h-1) and consequently decreases the time necessary to enter steady-state. Table 7
presents the metabolic characteristics for each bacterial culture steady-state (SS) obtained for the
formulations F#1 to F#4, designated as SS#1, SS#2, SS#3 and SS#4, respectively. All conditions
were maintained constant; therefore the culture behavior translates the physiological response of the
microbial cells to the influence of the N-source amount in the culture medium.
Table 7 – Metabolic parameters for the steady-state cultures of G. alkanivorans strain 1B, grown in a low-cost chemostat in SFMR medium formulations with decreasing N-source concentrations.
aAmount: % of the original amount of NH4Cl (1.22 g.l-1 = 100%, default SFMR medium); qFru – specific rate of fructose consumption;
qSO4 – specific rate of sulfate consumption;
qCO2 – specific rate of carbon dioxide production;
CR – carbon recovery (percentage of supplied carbon that is used in the cells constitution);
CCE – carbon conversion efficiency;
Yx/s – cell yield (cell mass produced per mole of substrate consumed).
These results show that steady-state chemostat cultures of strain 1B (SS#1 to SS#4 cultures) were
obtained at a dilution rate comprised in the range of 0.07 – 0.08 h-1. Comparing the steady-state
continuous cultures, it can be observed that the marked decrease in the metabolic parameters overall,
associated to cell growth (OD600nm, biomass, biomass production rate and fructose consumption rate)
may be linked with the reduction of the N-source amount, from 100% N to 25% N. The restriction of
bacterial growth by the N-source limitation is consistent with the accumulation of C-source that is
observed for the formulations with 75% N, as 8.15 g.l-1 fructose were accumulated by the SS#4
Steady-state culture (SS#) (N-source amounta)
SS#1 (100%)
SS#2 (75%)
SS#3 (50%)
SS#4 (25%)
Dilution rate (h-1) 0.076 0.072 0.076 0.082
Biomass production rate (g.l-1.h-1) 0.37 0.32 0.22 0.09
Fructose consumption rate (g.l-1.h-1) 0.76 0.64 0.48 0.15
qFru (mmol.g-1 (DCW).h-1) 0.87 0.80 0.92 0.77
qSO4 (mmol.g-1 (DCW).h-1) 3.04 3.31 3.76 3.22
qCO2 (mmol.g-1 (DCW).h-1) 1.24 1.23 1.30 1.62
CR (%) 84.93 87.76 81.43 110.57
CCE (%) 61.02 62.31 57.80 74.70
Yx/s (g (DCW).mol-1) 87.80 89.66 83.16 107.48
Accumulated carbon source (g.l-1) 0.00 1.07 3.69 8.15
OD600nm 12.63 13.21 7.79 3.46
Biomass (g.l-1) 4.83 4.45 2.97 1.11
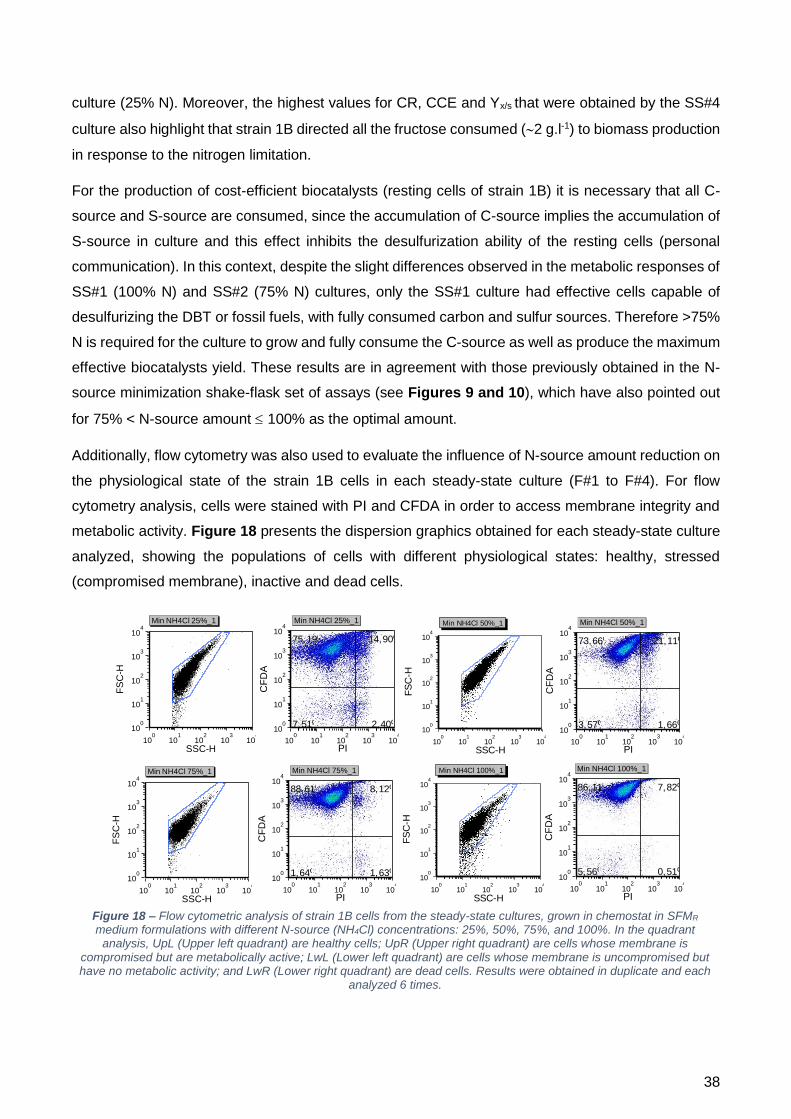
38
culture (25% N). Moreover, the highest values for CR, CCE and Yx/s that were obtained by the SS#4
culture also highlight that strain 1B directed all the fructose consumed (2 g.l-1) to biomass production
in response to the nitrogen limitation.
For the production of cost-efficient biocatalysts (resting cells of strain 1B) it is necessary that all C-
source and S-source are consumed, since the accumulation of C-source implies the accumulation of
S-source in culture and this effect inhibits the desulfurization ability of the resting cells (personal
communication). In this context, despite the slight differences observed in the metabolic responses of
SS#1 (100% N) and SS#2 (75% N) cultures, only the SS#1 culture had effective cells capable of
desulfurizing the DBT or fossil fuels, with fully consumed carbon and sulfur sources. Therefore >75%
N is required for the culture to grow and fully consume the C-source as well as produce the maximum
effective biocatalysts yield. These results are in agreement with those previously obtained in the N-
source minimization shake-flask set of assays (see Figures 9 and 10), which have also pointed out
for 75% < N-source amount 100% as the optimal amount.
Additionally, flow cytometry was also used to evaluate the influence of N-source amount reduction on
the physiological state of the strain 1B cells in each steady-state culture (F#1 to F#4). For flow
cytometry analysis, cells were stained with PI and CFDA in order to access membrane integrity and
metabolic activity. Figure 18 presents the dispersion graphics obtained for each steady-state culture
analyzed, showing the populations of cells with different physiological states: healthy, stressed
(compromised membrane), inactive and dead cells.
Min NH4Cl 50%_1
PI
CF
DA
100
101
102
103
104
100
101
102
103
104
1,66%3,57%
21,11%73,66%
Min NH4Cl 75%_1
PI
CF
DA
100
101
102
103
104
100
101
102
103
104
1,63%1,64%
8,12%88,61%
Min NH4Cl 75%_1
SSC-H
FS
C-H
100
101
102
103
104
100
101
102
103
104
Min NH4Cl 100%_1
PI
CF
DA
100
101
102
103
104
100
101
102
103
104
86,11% 7,82%
5,56% 0,51%
Min NH4Cl 100%_1
SSC-H
FS
C-H
100
101
102
103
104
100
101
102
103
104
Min NH4Cl 25%_1
PI
CF
DA
100
101
102
103
104
100
101
102
103
104
75,19% 14,90%
7,51% 2,40%
Min NH4Cl 25%_1
SSC-H
FS
C-H
100
101
102
103
104
100
101
102
103
104
Min NH4Cl 50%_1
SSC-H
FS
C-H
100
101
102
103
104
100
101
102
103
104
Figure 18 – Flow cytometric analysis of strain 1B cells from the steady-state cultures, grown in chemostat in SFMR medium formulations with different N-source (NH4Cl) concentrations: 25%, 50%, 75%, and 100%. In the quadrant
analysis, UpL (Upper left quadrant) are healthy cells; UpR (Upper right quadrant) are cells whose membrane is compromised but are metabolically active; LwL (Lower left quadrant) are cells whose membrane is uncompromised but have no metabolic activity; and LwR (Lower right quadrant) are dead cells. Results were obtained in duplicate and each
analyzed 6 times.
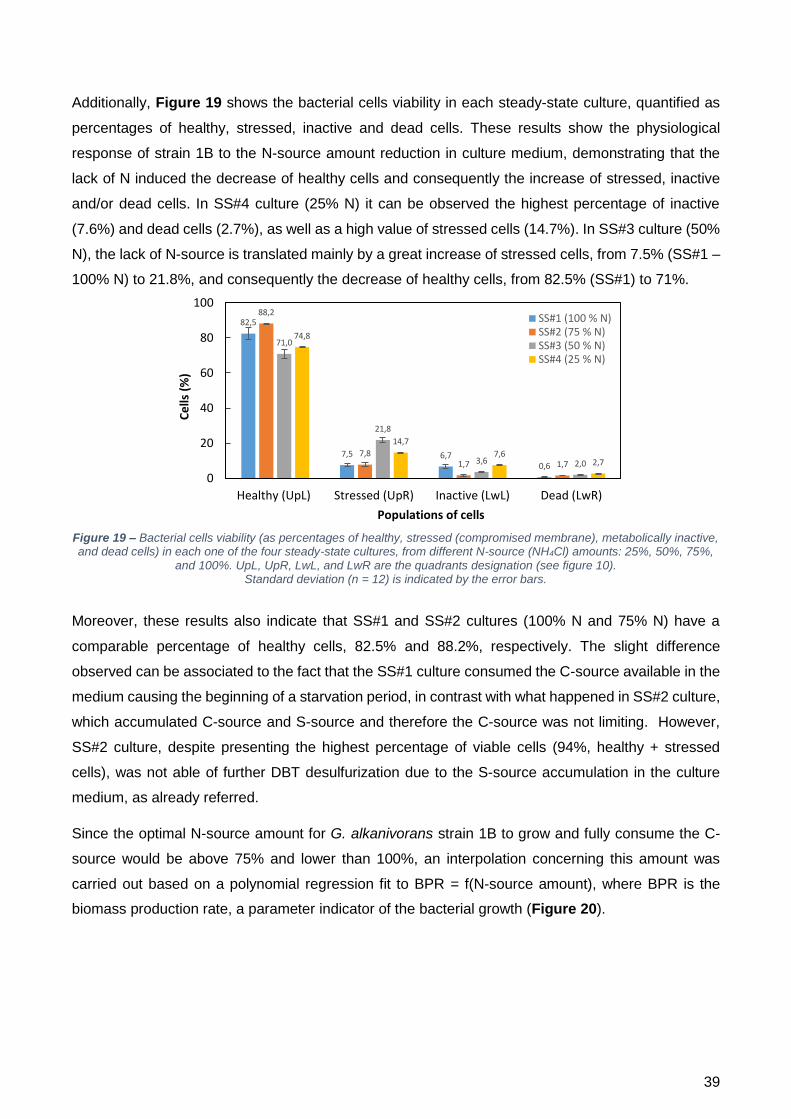
39
82,5
7,5 6,70,6
88,2
7,81,7 1,7
71,0
21,8
3,6 2,0
74,8
14,7
7,62,7
0
20
40
60
80
100
Healthy (UpL) Stressed (UpR) Inactive (LwL) Dead (LwR)
Ce
lls (
%)
Populations of cells
SS#1 (100 % N)SS#2 (75 % N)SS#3 (50 % N)SS#4 (25 % N)
Figure 19 – Bacterial cells viability (as percentages of healthy, stressed (compromised membrane), metabolically inactive, and dead cells) in each one of the four steady-state cultures, from different N-source (NH4Cl) amounts: 25%, 50%, 75%,
and 100%. UpL, UpR, LwL, and LwR are the quadrants designation (see figure 10). Standard deviation (n = 12) is indicated by the error bars.
Additionally, Figure 19 shows the bacterial cells viability in each steady-state culture, quantified as
percentages of healthy, stressed, inactive and dead cells. These results show the physiological
response of strain 1B to the N-source amount reduction in culture medium, demonstrating that the
lack of N induced the decrease of healthy cells and consequently the increase of stressed, inactive
and/or dead cells. In SS#4 culture (25% N) it can be observed the highest percentage of inactive
(7.6%) and dead cells (2.7%), as well as a high value of stressed cells (14.7%). In SS#3 culture (50%
N), the lack of N-source is translated mainly by a great increase of stressed cells, from 7.5% (SS#1 –
100% N) to 21.8%, and consequently the decrease of healthy cells, from 82.5% (SS#1) to 71%.
Moreover, these results also indicate that SS#1 and SS#2 cultures (100% N and 75% N) have a
comparable percentage of healthy cells, 82.5% and 88.2%, respectively. The slight difference
observed can be associated to the fact that the SS#1 culture consumed the C-source available in the
medium causing the beginning of a starvation period, in contrast with what happened in SS#2 culture,
which accumulated C-source and S-source and therefore the C-source was not limiting. However,
SS#2 culture, despite presenting the highest percentage of viable cells (94%, healthy + stressed
cells), was not able of further DBT desulfurization due to the S-source accumulation in the culture
medium, as already referred.
Since the optimal N-source amount for G. alkanivorans strain 1B to grow and fully consume the C-
source would be above 75% and lower than 100%, an interpolation concerning this amount was
carried out based on a polynomial regression fit to BPR = f(N-source amount), where BPR is the
biomass production rate, a parameter indicator of the bacterial growth (Figure 20).
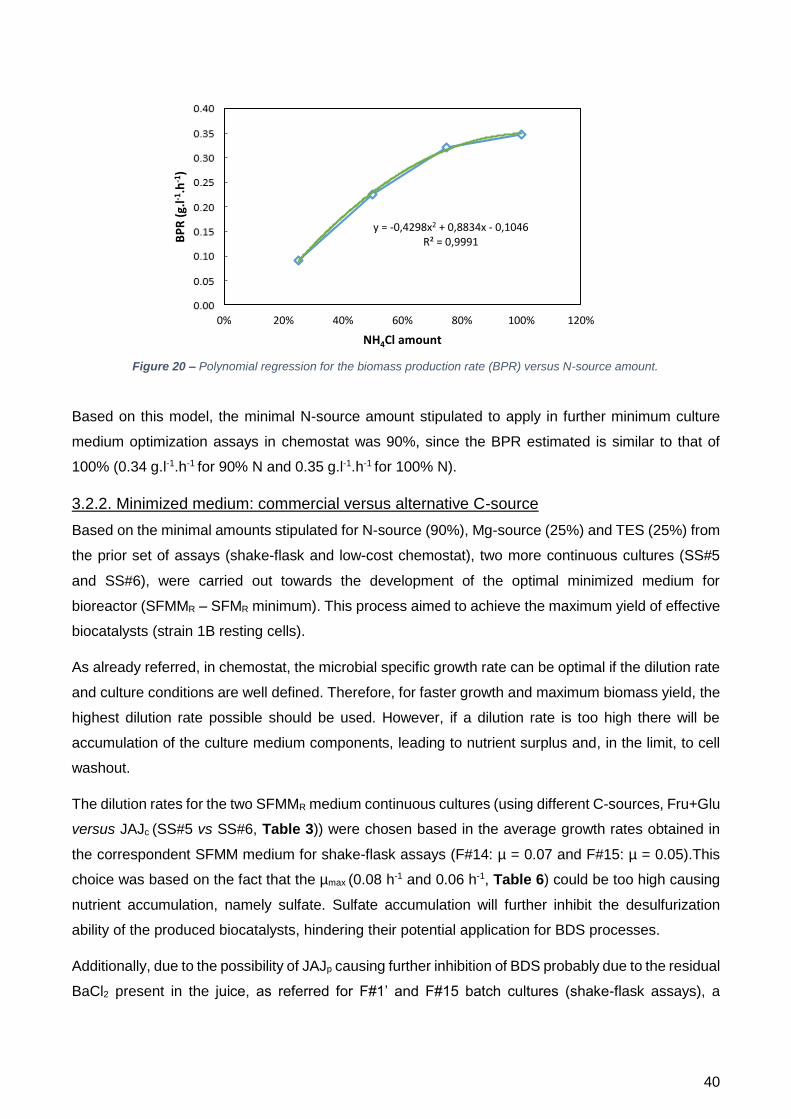
40
y = -0,4298x2 + 0,8834x - 0,1046R² = 0,9991
0,00
0,05
0,10
0,15
0,20
0,25
0,30
0,35
0,40
0% 20% 40% 60% 80% 100% 120%
BP
R (
g.l-1
.h-1
)
NH4Cl amount
Figure 20 – Polynomial regression for the biomass production rate (BPR) versus N-source amount.
Based on this model, the minimal N-source amount stipulated to apply in further minimum culture
medium optimization assays in chemostat was 90%, since the BPR estimated is similar to that of
100% (0.34 g.l-1.h-1 for 90% N and 0.35 g.l-1.h-1 for 100% N).
3.2.2. Minimized medium: commercial versus alternative C-source
Based on the minimal amounts stipulated for N-source (90%), Mg-source (25%) and TES (25%) from
the prior set of assays (shake-flask and low-cost chemostat), two more continuous cultures (SS#5
and SS#6), were carried out towards the development of the optimal minimized medium for
bioreactor (SFMMR – SFMR minimum). This process aimed to achieve the maximum yield of effective
biocatalysts (strain 1B resting cells).
As already referred, in chemostat, the microbial specific growth rate can be optimal if the dilution rate
and culture conditions are well defined. Therefore, for faster growth and maximum biomass yield, the
highest dilution rate possible should be used. However, if a dilution rate is too high there will be
accumulation of the culture medium components, leading to nutrient surplus and, in the limit, to cell
washout.
The dilution rates for the two SFMMR medium continuous cultures (using different C-sources, Fru+Glu
versus JAJc (SS#5 vs SS#6, Table 3)) were chosen based in the average growth rates obtained in
the correspondent SFMM medium for shake-flask assays (F#14: µ = 0.07 and F#15: µ = 0.05).This
choice was based on the fact that the µmax (0.08 h-1 and 0.06 h-1, Table 6) could be too high causing
nutrient accumulation, namely sulfate. Sulfate accumulation will further inhibit the desulfurization
ability of the produced biocatalysts, hindering their potential application for BDS processes.
Additionally, due to the possibility of JAJp causing further inhibition of BDS probably due to the residual
BaCl2 present in the juice, as referred for F#1’ and F#15 batch cultures (shake-flask assays), a
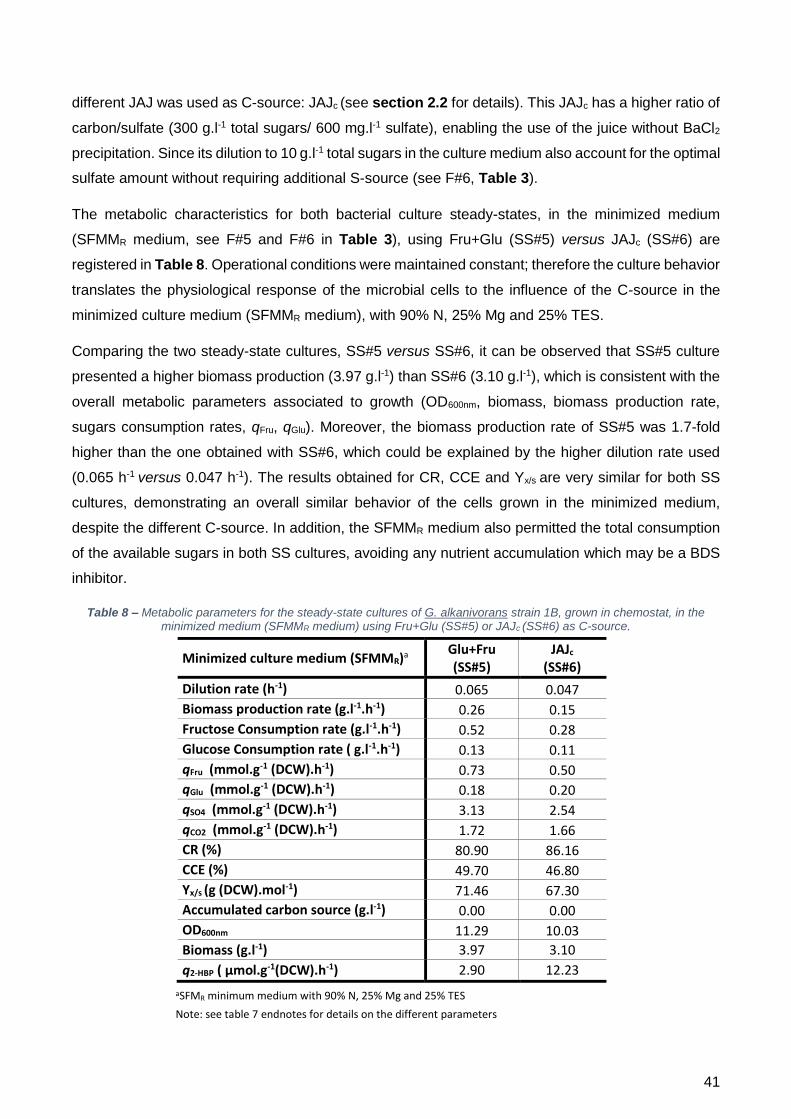
41
different JAJ was used as C-source: JAJc (see section 2.2 for details). This JAJc has a higher ratio of
carbon/sulfate (300 g.l-1 total sugars/ 600 mg.l-1 sulfate), enabling the use of the juice without BaCl2
precipitation. Since its dilution to 10 g.l-1 total sugars in the culture medium also account for the optimal
sulfate amount without requiring additional S-source (see F#6, Table 3).
The metabolic characteristics for both bacterial culture steady-states, in the minimized medium
(SFMMR medium, see F#5 and F#6 in Table 3), using Fru+Glu (SS#5) versus JAJc (SS#6) are
registered in Table 8. Operational conditions were maintained constant; therefore the culture behavior
translates the physiological response of the microbial cells to the influence of the C-source in the
minimized culture medium (SFMMR medium), with 90% N, 25% Mg and 25% TES.
Comparing the two steady-state cultures, SS#5 versus SS#6, it can be observed that SS#5 culture
presented a higher biomass production (3.97 g.l-1) than SS#6 (3.10 g.l-1), which is consistent with the
overall metabolic parameters associated to growth (OD600nm, biomass, biomass production rate,
sugars consumption rates, qFru, qGlu). Moreover, the biomass production rate of SS#5 was 1.7-fold
higher than the one obtained with SS#6, which could be explained by the higher dilution rate used
(0.065 h-1 versus 0.047 h-1). The results obtained for CR, CCE and Yx/s are very similar for both SS
cultures, demonstrating an overall similar behavior of the cells grown in the minimized medium,
despite the different C-source. In addition, the SFMMR medium also permitted the total consumption
of the available sugars in both SS cultures, avoiding any nutrient accumulation which may be a BDS
inhibitor.
Table 8 – Metabolic parameters for the steady-state cultures of G. alkanivorans strain 1B, grown in chemostat, in the minimized medium (SFMMR medium) using Fru+Glu (SS#5) or JAJc (SS#6) as C-source.
aSFMR minimum medium with 90% N, 25% Mg and 25% TES
Note: see table 7 endnotes for details on the different parameters
Minimized culture medium (SFMMR)a Glu+Fru (SS#5)
JAJc (SS#6)
Dilution rate (h-1) 0.065 0.047
Biomass production rate (g.l-1.h-1) 0.26 0.15
Fructose Consumption rate (g.l-1.h-1) 0.52 0.28
Glucose Consumption rate ( g.l-1.h-1) 0.13 0.11
qFru (mmol.g-1 (DCW).h-1) 0.73 0.50
qGlu (mmol.g-1 (DCW).h-1) 0.18 0.20
qSO4 (mmol.g-1 (DCW).h-1) 3.13 2.54
qCO2 (mmol.g-1 (DCW).h-1) 1.72 1.66
CR (%) 80.90 86.16
CCE (%) 49.70 46.80
Yx/s (g (DCW).mol-1) 71.46 67.30
Accumulated carbon source (g.l-1) 0.00 0.00
OD600nm 11.29 10.03
Biomass (g.l-1) 3.97 3.10
q2-HBP ( µmol.g-1(DCW).h-1) 2.90 12.23

42
Further desulfurization results obtained with resting cells from SS#5 (q2-HBP = 2.90 µmol.g-1(DCW).h-1)
and SS#6 (q2-HBP = 12.23 µmol.g-1(DCW).h-1) showed a 4-fold higher desulfurization ability from the
biocatalysts produced in the SFMMR medium using the alternative C-source (JAJc).
Additionally to the metabolic study, flow cytometry analysis (Figure 21) was also performed to
evaluate the physiological state of the cells from each SS culture (SS#5 and SS#6). Flow cytometry
results show a percentage of viable cells >93% for both cultures (SS#5: 95% = 62% healthy + 33%
stressed; SS#6: 93% = 73% healthy + 20% stressed) and consequently <7% of inactive and dead
cells (SS#5: 3.6% inactive + 1.1% dead; SS#6: 3.7% inactive + 2.8% dead), demonstrating the overall
good physiological state of each culture.
Therefore, the overall metabolic and physiological results pointed out for SS#6 culture resting cells
as the optimized cost-effective biocatalysts for BDS processes with G. alkanivorans strain 1B. In fact,
these efficient biocatalysts are capable of enhanced DBT desulfurization
(q2-HBP = 12.23 µmol.g-1(DCW).h-1) and may be produced in a chemostat using a low-cost culture
medium: SFMMR + JAJc culture medium. DBT desulfurization using strain 1B SS#6 resting cells (JAJc)
was 2.4-fold higher than that obtained by Silva (2012) using strain 1B growing cells and JAJp as
C-source (q2-HBP = 5.06 µmol.g-1(DCW).h-1).
3.3. Evaluation of the expression of the dsz operon by Real Time-PCR
In complement to the BDS assays using resting cells of SS#5 and SS#6 cultures, the evaluation of
the desulfurization gene expression (regulated by dsz operon) in both chemostat cultures was
performed through a Real Time-PCR system (RT-PCR). A two-step RT-PCR approach was
performed as described in section 2.6.6. For each SS culture, the RNA was first extracted from cells
61,63
32,88
3,55 1,05
72,96
20,01
3,65 2,84
0
20
40
60
80
100
Healthy (UpL) Stressed (UpR) Inactive (LwL) Dead (LwR)
Ce
lls (
%)
Populations of cells
SFMM Fru+Glu
SFMM JAJ
Figure 21 – Bacterial cells viability (as percentages of healthy, stressed (compromised membrane), metabolically inactive, and dead cells) in both steady-state cultures, grown in SFMMR medium with Glu+Fru (SS#5) and JAJc (SS#6). UpL, UpR,
LwL, and LwR are the quadrants designation (see figure 18). Standard deviation (n = 12) is indicated by the error bars.
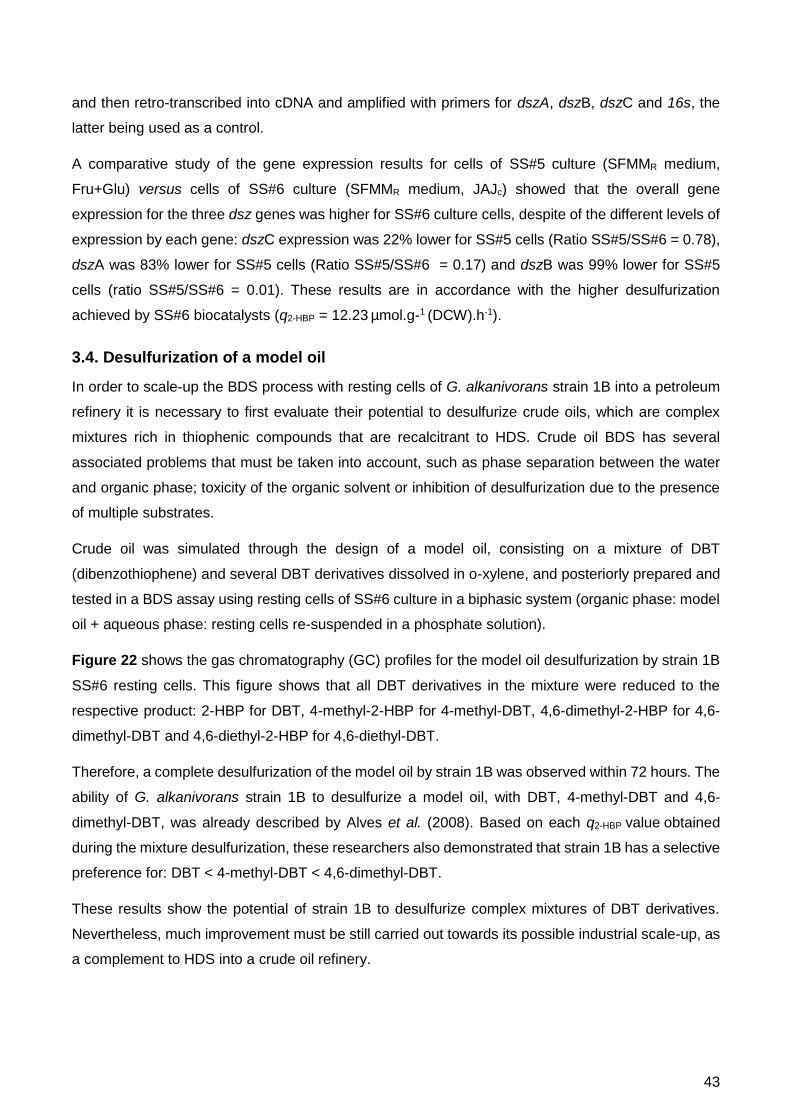
43
and then retro-transcribed into cDNA and amplified with primers for dszA, dszB, dszC and 16s, the
latter being used as a control.
A comparative study of the gene expression results for cells of SS#5 culture (SFMMR medium,
Fru+Glu) versus cells of SS#6 culture (SFMMR medium, JAJc) showed that the overall gene
expression for the three dsz genes was higher for SS#6 culture cells, despite of the different levels of
expression by each gene: dszC expression was 22% lower for SS#5 cells (Ratio SS#5/SS#6 = 0.78),
dszA was 83% lower for SS#5 cells (Ratio SS#5/SS#6 = 0.17) and dszB was 99% lower for SS#5
cells (ratio SS#5/SS#6 = 0.01). These results are in accordance with the higher desulfurization
achieved by SS#6 biocatalysts (q2-HBP = 12.23 µmol.g-1 (DCW).h-1).
3.4. Desulfurization of a model oil
In order to scale-up the BDS process with resting cells of G. alkanivorans strain 1B into a petroleum
refinery it is necessary to first evaluate their potential to desulfurize crude oils, which are complex
mixtures rich in thiophenic compounds that are recalcitrant to HDS. Crude oil BDS has several
associated problems that must be taken into account, such as phase separation between the water
and organic phase; toxicity of the organic solvent or inhibition of desulfurization due to the presence
of multiple substrates.
Crude oil was simulated through the design of a model oil, consisting on a mixture of DBT
(dibenzothiophene) and several DBT derivatives dissolved in o-xylene, and posteriorly prepared and
tested in a BDS assay using resting cells of SS#6 culture in a biphasic system (organic phase: model
oil + aqueous phase: resting cells re-suspended in a phosphate solution).
Figure 22 shows the gas chromatography (GC) profiles for the model oil desulfurization by strain 1B
SS#6 resting cells. This figure shows that all DBT derivatives in the mixture were reduced to the
respective product: 2-HBP for DBT, 4-methyl-2-HBP for 4-methyl-DBT, 4,6-dimethyl-2-HBP for 4,6-
dimethyl-DBT and 4,6-diethyl-2-HBP for 4,6-diethyl-DBT.
Therefore, a complete desulfurization of the model oil by strain 1B was observed within 72 hours. The
ability of G. alkanivorans strain 1B to desulfurize a model oil, with DBT, 4-methyl-DBT and 4,6-
dimethyl-DBT, was already described by Alves et al. (2008). Based on each q2-HBP value obtained
during the mixture desulfurization, these researchers also demonstrated that strain 1B has a selective
preference for: DBT < 4-methyl-DBT < 4,6-dimethyl-DBT.
These results show the potential of strain 1B to desulfurize complex mixtures of DBT derivatives.
Nevertheless, much improvement must be still carried out towards its possible industrial scale-up, as
a complement to HDS into a crude oil refinery.
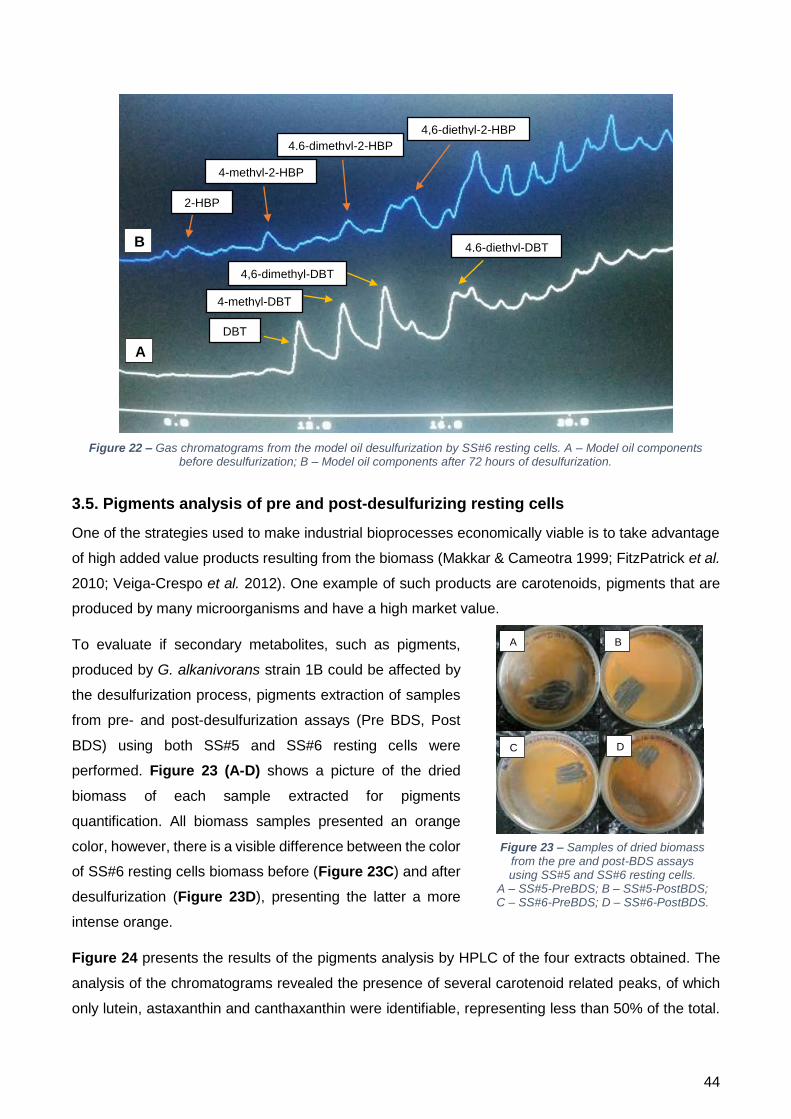
44
3.5. Pigments analysis of pre and post-desulfurizing resting cells
One of the strategies used to make industrial bioprocesses economically viable is to take advantage
of high added value products resulting from the biomass (Makkar & Cameotra 1999; FitzPatrick et al.
2010; Veiga-Crespo et al. 2012). One example of such products are carotenoids, pigments that are
produced by many microorganisms and have a high market value.
To evaluate if secondary metabolites, such as pigments,
produced by G. alkanivorans strain 1B could be affected by
the desulfurization process, pigments extraction of samples
from pre- and post-desulfurization assays (Pre BDS, Post
BDS) using both SS#5 and SS#6 resting cells were
performed. Figure 23 (A-D) shows a picture of the dried
biomass of each sample extracted for pigments
quantification. All biomass samples presented an orange
color, however, there is a visible difference between the color
of SS#6 resting cells biomass before (Figure 23C) and after
desulfurization (Figure 23D), presenting the latter a more
intense orange.
Figure 24 presents the results of the pigments analysis by HPLC of the four extracts obtained. The
analysis of the chromatograms revealed the presence of several carotenoid related peaks, of which
only lutein, astaxanthin and canthaxanthin were identifiable, representing less than 50% of the total.
B
A
DBT
4-methyl-DBT
4,6-dimethyl-DBT
4,6-diethyl-DBT
2-HBP
4-methyl-2-HBP
4,6-dimethyl-2-HBP
4,6-diethyl-2-HBP
Figure 22 – Gas chromatograms from the model oil desulfurization by SS#6 resting cells. A – Model oil components before desulfurization; B – Model oil components after 72 hours of desulfurization.
A B
C D
Figure 23 – Samples of dried biomass from the pre and post-BDS assays using SS#5 and SS#6 resting cells.
A – SS#5-PreBDS; B – SS#5-PostBDS; C – SS#6-PreBDS; D – SS#6-PostBDS.
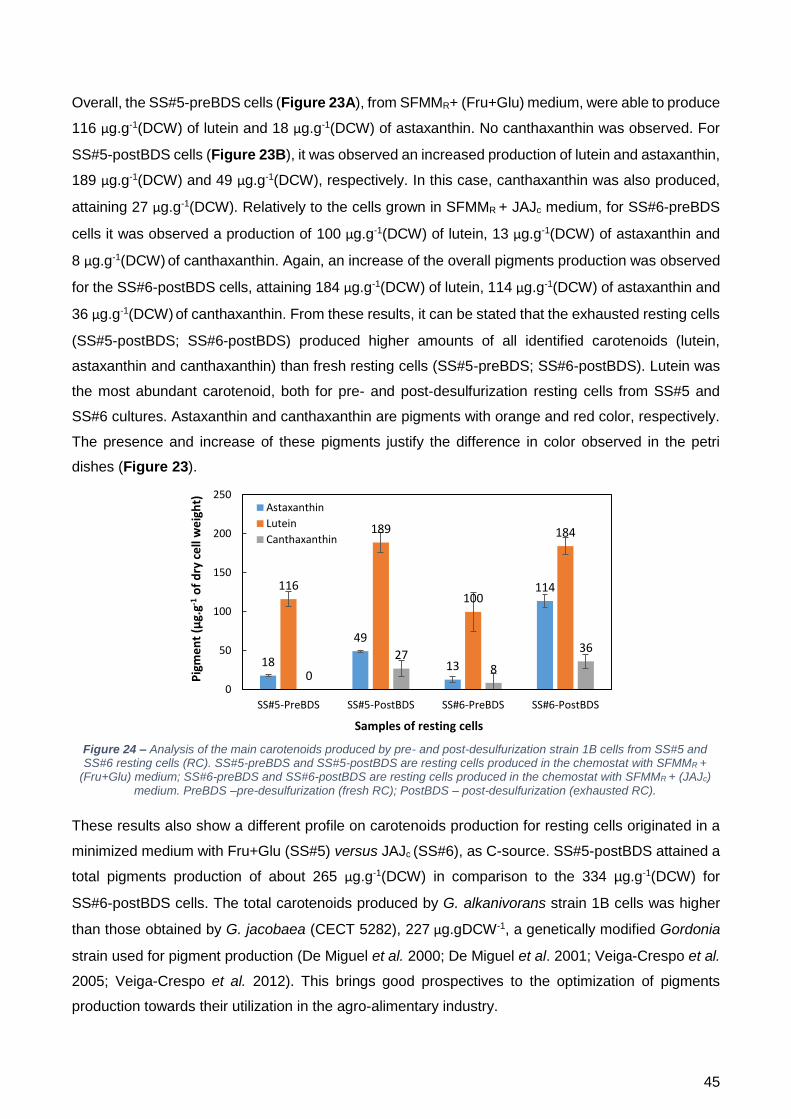
45
18
49
13
114116
189
100
184
0
278
36
0
50
100
150
200
250
SS#5-PreBDS SS#5-PostBDS SS#6-PreBDS SS#6-PostBDS
Pig
me
nt
(µg.
g-1o
f d
ry c
ell
we
igh
t)
Samples of resting cells
Astaxanthin
Lutein
Canthaxanthin
Figure 24 – Analysis of the main carotenoids produced by pre- and post-desulfurization strain 1B cells from SS#5 and SS#6 resting cells (RC). SS#5-preBDS and SS#5-postBDS are resting cells produced in the chemostat with SFMMR +
(Fru+Glu) medium; SS#6-preBDS and SS#6-postBDS are resting cells produced in the chemostat with SFMMR + (JAJc) medium. PreBDS –pre-desulfurization (fresh RC); PostBDS – post-desulfurization (exhausted RC).
Overall, the SS#5-preBDS cells (Figure 23A), from SFMMR+ (Fru+Glu) medium, were able to produce
116 µg.g-1(DCW) of lutein and 18 µg.g-1(DCW) of astaxanthin. No canthaxanthin was observed. For
SS#5-postBDS cells (Figure 23B), it was observed an increased production of lutein and astaxanthin,
189 µg.g-1(DCW) and 49 µg.g-1(DCW), respectively. In this case, canthaxanthin was also produced,
attaining 27 µg.g-1(DCW). Relatively to the cells grown in SFMMR + JAJc medium, for SS#6-preBDS
cells it was observed a production of 100 µg.g-1(DCW) of lutein, 13 µg.g-1(DCW) of astaxanthin and
8 µg.g-1(DCW) of canthaxanthin. Again, an increase of the overall pigments production was observed
for the SS#6-postBDS cells, attaining 184 µg.g-1(DCW) of lutein, 114 µg.g-1(DCW) of astaxanthin and
36 µg.g-1(DCW) of canthaxanthin. From these results, it can be stated that the exhausted resting cells
(SS#5-postBDS; SS#6-postBDS) produced higher amounts of all identified carotenoids (lutein,
astaxanthin and canthaxanthin) than fresh resting cells (SS#5-preBDS; SS#6-postBDS). Lutein was
the most abundant carotenoid, both for pre- and post-desulfurization resting cells from SS#5 and
SS#6 cultures. Astaxanthin and canthaxanthin are pigments with orange and red color, respectively.
The presence and increase of these pigments justify the difference in color observed in the petri
dishes (Figure 23).
These results also show a different profile on carotenoids production for resting cells originated in a
minimized medium with Fru+Glu (SS#5) versus JAJc (SS#6), as C-source. SS#5-postBDS attained a
total pigments production of about 265 µg.g-1(DCW) in comparison to the 334 µg.g-1(DCW) for
SS#6-postBDS cells. The total carotenoids produced by G. alkanivorans strain 1B cells was higher
than those obtained by G. jacobaea (CECT 5282), 227µg.gDCW-1, a genetically modified Gordonia
strain used for pigment production (De Miguel et al. 2000; De Miguel et al. 2001; Veiga-Crespo et al.
2005; Veiga-Crespo et al. 2012). This brings good prospectives to the optimization of pigments
production towards their utilization in the agro-alimentary industry.
46
Since DBT desulfurization enhanced the overall pigments production in the resting cells used as
biocatalysts, the further exploitation of these high added value products from the exhausted microbial
biomass can be coupled to BDS process as a decisive factor to bring economical balance to its
possible scale-up (Paixão et al. 2016).
4. Conclusion
The shake-flask minimization assays allowed the design of a minimized culture medium (SFMM
medium) containing 75-100% of N-source, 25% of Mg-source and 25% of TES (% of the original
amounts used in the default SFM medium). Using 85% N, the SFMM medium was tested with two
C-sources (Fru+Glu) versus JAJp and the results obtained demonstrate that independently of the
C-source used, the SFMM medium enhances the desulfurization by strain 1B in comparison with the
respective control (SFM medium).
Based on these minimal amounts established for SFMM medium, the next step was to apply this
combined reduction in the SFMR medium and optimize the culture conditions in chemostat assays,
where bacteria can be grown in a physiological steady-state under constant and optimal conditions.
In this context, after a first screening on the minimal amount for N-source using a low-cost bioreactor,
the established SFMMR medium (90% N, 25% Mg and 25% TES) was tested in two more continuous
cultures (SS#5 and SS#6) for the development of the optimal minimized medium for reactor taking
into account the maximum yield of effective biocatalysts (G. alkanivorans strain 1B resting cells). The
results highlighted the SFMMR medium with JAJc as C-source as the optimal minimized medium in
which cost-effective biocatalysts can be produced (SS#6 resting cells), attaining a desulfurization
(q2-HBP) of 12.2 µmol.g-1(DCW).h-1, about 4-fold higher than the one observed with the biocatalysts
from the SFMMR medium with Fru+Glu as C-source (q2-HBP = 2.9 µmol.g-1(DCW).h-1 for SS#5 resting
cells). RT-PCR results confirmed the higher expression of the overall desulfurization genes (dszA,
dszB, dszC genes) in the SS#6 resting cells.
Moreover, a BDS assay for a model oil (500 µM, DBT + 4-methyl-DBT + 4,6-dimethyl-DBT, and 4,6-
diethyl-DBT), using SS#6 resting cells culture in a biphasic system, was performed showing the ability
of complete desulfurization within 72 h by these biocatalysts. Additionally, it was also demonstrated
that the exhausted biocatalysts were able to produce high amounts of carotenoids (334 μg.g-1(DCW)).
The further exploitation of these high added value products from the exhausted microbial biomass
can also be coupled to the BDS process as a decisive factor to bring economical balance to its
industrial scale-up in addition to the low-cost culture medium (SFMMR medium) developed for the
effective biocatalysts production in bioreactor. This reflects great perspectives for the future of BDS
as an integrated part of the petroleum treatment industry.

47
5. Future Works
As a future work, it is important to further test the influence of magnesium in desulfurization by strain
1B. It is also important to test desulfurizing cells with crude oil or diesel/gasoline, in order to better
understand how G. alkanivorans strain 1B cells react in “real” fossil fuels. Finally, more tests must be
conducted to optimize conditions to maximize both desulfurization and pigment production during
desulfurization.
6. Bibliography
Abo-State, M.A. et al., 2014. Modification of basal salts medium for enhancing dibenzothiophene biodesulfurization by Brevibacillus invocatus C19 and Rhodococcus erythropolis IGTS8. World Applied Sciences Journal, 30(2), pp.133–140.
Adegunlola, G.A. et al., 2012. Microbial desulphurization of crude oil using Aspergillus flavus. European Journal of Experimental Biology, 2(2), pp.400–403.
Afferden, M. va. et al., 1993. Biochemical mechanisms for the desulfurization of coal-relevant organic sulfur compounds. Fuel, 72(12), pp.1635–1643.
Alves, L. et al., 2015. Biodesulphurization of fossil fuels: energy, emissions and cost analysis. RSC Advances, 5(43), pp.34047–34057.
Alves, L. et al., 2005. Desulfurization of dibenzothiophene, benzothiophene, and other thiophene analogs by a newly isolated bacterium, Gordonia alkanivorans strain 1B. Applied biochemistry and biotechnology, 120, pp.199–208.
Alves, L., 2007. Dibenzothiophene desulfurization by Gordonia alkanivorans strain 1B. Universidade de Lisboa. Alves, L., Marques, S., et al., 2008. Dibenzothiophene desulfurization by Gordonia alkanivorans strain 1B using recycled paper
sludge hydrolyzate. Chemosphere, 70(6), pp.967–73. Alves, L., Matos, J., et al., 2008. Evidence for the role of zinc on the performance of dibenzothiophene desulfurization by Gordonia
alkanivorans strain 1B. Journal of Industrial Microbiology and Biotechnology, 35(1), pp.69–73. Alves, L. et al., 2006. Sequencing, cloning and expression of the dsz genes required for dibenzothiophene sulfone desulfurization
from Gordonia alkanivorans strain 1B. Enzyme and Microbial Technology, 40(6), pp.1598–1603. Alves, L. & Paixão, S.M., 2011. Effect of the carbon source on fossil fuels desulfurization ability by Gordonia alkanivorans strain
1B. In IV Congresso da Ordem dos Biólogos. p. 1. Alves, L. & Paixão, S.M., 2014a. Enhancement of dibenzothiophene desulfurization by Gordonia alkanivorans strain 1B using sugar
beet molasses as alternative carbon source. Applied biochemistry and biotechnology, 172(6), pp.3297–305. Alves, L. & Paixão, S.M., 2014b. Fructophilic behaviour of Gordonia alkanivorans strain 1B during dibenzothiophene desulfurization
process. New biotechnology, 31(1), pp.73–9. Alves, L. & Paixão, S.M., 2011. Toxicity evaluation of 2-hydroxybiphenyl and other compounds involved in studies of fossil fuels
biodesulphurisation. Bioresource technology, 102(19), pp.9162–6. Atabani, a. E. et al., 2012. A comprehensive review on biodiesel as an alternative energy resource and its characteristics.
Renewable and Sustainable Energy Reviews, 16(4), pp.2070–2093. Babich, I. V & Moulijn, J.A., 2003. Science and technology of novel processes for deep desulfurization of oil refinery streams : a
review. Fuel, 82, pp.607–631. Bandyopadhyay, S. & Chowdhury, R., 2014. Parameter optimization of surface active properties and quantification of biosurfactant
produced in continuous stirred tank bioreactor during biodesulfurization of diesel. International Journal of Innovative Research in Advanced Engineering, 1(9), pp.217–224.
Bandyopadhyay, S., Chowdhury, R. & Bhattacharjee, C., 2013. Steady state performance of a bioreactor for production of near zero sulfur diesel (NZSD) and bio-surfactant. Journal of Clean Energy Technologies, 1(3), pp.189–193.
Bhatia, S. & Sharma, D.K., 2012. Thermophilic desulfurization of dibenzothiophene and different petroleum oils by Klebsiella sp. 13T. Environmental science and pollution research international, 19(8), pp.3491–7.
Von Blottnitz, H. & Curran, M.A., 2007. A review of assessments conducted on bio-ethanol as a transportation fuel from a net energy, greenhouse gas, and environmental life cycle perspective. Journal of Cleaner Production, 15(7), pp.607–619.
Bond, T. & Templeton, M.R., 2011. History and future of domestic biogas plants in the developing world. Energy for Sustainable Development, 15(4), pp.347–354.
Borgne, S. Le & Quintero, R., 2003. Biotechnological processes for the refining of petroleum. Fuel Processing Technology, 81(2), pp.155–169.
Caro, A. et al., 2007. Dibenzothiophene biodesulfurization in resting cell conditions by aerobic bacteria. Biochemical Engineering Journal, 35(2), pp.191–197.
Chekroun, M. Ben et al., 1996. Comparison of fructose production by 37 cultivars of Jerusalem artichoke (Helianthus tuberosus L.). New Zealand Journal of Crop and Horticultural Science, 24(1), pp.115–120.
Cheng, Y. et al., 2009. Biodiesel production from Jerusalem artichoke (Helianthus Tuberosus L.) tuber by heterotrophic microalgae Chlorella protothecoides. Journal of Chemical Technology & Biotechnology, 84(5), pp.777–781.
Clark, P.D. & Kirk, M.J., 1994. Studies on the upgrading of bituminous oils with water and transition metal catalysts. Energy & Fuels, 8(2), pp.380–387.
Denome, S.A. et al., 1994. Characterization of the desulfurization genes from Rhodococcus sp. strain IGTS8. Journal of bacteriology, 176(21), pp.6707–16.
Denome, S.A., Olson, E.S. & Young, K.D., 1993. Identification and cloning of genes involved in specific desulfurization of dibenzothiophene by Rhodococcus sp. strain IGTS8. Applied and environmental microbiology, 59(9), pp.2837–43.
48
Drzyzga, O. et al., 2011. Cholesterol degradation by Gordonia cholesterolivorans. Applied and Environmental Microbiology, 77(14), pp.4802–4810.
Drzyzga, O., 2012. The strenghts and weaknesses of Gordonia: A review of an emerging genus with increasing biotechnological potential. Critical Reviews in Microbiology, 38(4), pp.300–316.
Egorova, M., 2003. Study of aspects of deep hydrodesulfurization by means of model reactions. Swiss Federal Institute of Technology Zurich.
FitzPatrick, M. et al., 2010. A biorefinery processing perspective: Treatment of lignocellulosic materials for the production of value-added products. Bioresource Technology, 101(23), pp.8915–8922.
Folsom, B.R. et al., 1999. Microbial desulfurization of alkylated dibenzothiophenes from a hydrodesulfurized middle disti llate by Rhodococcus erythropolis I-19. Applied and Environmental Microbiology, 65(11), pp.4967–4972.
Gallagher, J.R., Olson, E.S. & Stanley, D.C., 1993. Microbial desulfurization of dibenzothiophene: a sulfur-specific pathway. FEMS microbiology letters, 107(1), pp.31–5.
Goodfellow, M. & Maldonado, L.A., 2006. The families Dietziaceae, Gordoniaceae, Nocardiaceae and Tsukamurellaceae. In M. Dworkin et al., eds. Procaryotes. Springer New York, pp. 843–888.
Grace Liu, P.-W. et al., 2011. Bioremediation of petroleum hydrocarbon contaminated soil: Effects of strategies and microbial community shift. International Biodeterioration & Biodegradation, (65), pp.1119–1127.
Grossman, M.J. et al., 2001. Deep desulfurization of extensively hydrodesulfurized middle distillate oil by Rhodococcus sp. strain ECRD-1. Applied and environmental microbiology, 67(4), pp.1949–52.
Gunnarson, S. et al., 1985. Jerusalem artichoke (Helianthus tuberosus L.) for biogas production. Biomass, 7(2), pp.85–97. Gupta, N., Roychoudhury, P.K. & Deb, J.K., 2005. Biotechnology of desulfurization of diesel: prospects and challenges. Applied
microbiology and biotechnology, 66(4), pp.356–66. Harner, N.K. et al., 2011. Microbial processes in the Athabasca oil sands and their potential applications in microbial enhanced oil
recovery. Journal of industrial microbiology & biotechnology, 38(11), pp.1761–75. Jasiewicz, C. & Antonkiewicz, J., 2002. Heavy metal extraction by Jerusalem artichoke (Helianthus tuberosus L.) from soils
contaminated with heavy metals. Chemia i Inżynieria Ekologiczna, 9(4), pp.379–386. Javadli, R. & Klerk, A., 2012. Desulfurization of heavy oil. Applied Petrochemical Research, 1, pp.3–19. Jiang, Z. et al., 2012. Fed-batch cell culture process optimization. Bioprocess International. Jiang, Z. et al., 2011. Oxidative desulfurization of fuel oils. Chinese Journal of Catalysis, 32(5), pp.707–715. Kaufman, E.N., Harkins, J.B. & Borole, A.P., 1998. Comparison of batchstirred and electrospray reactors for biodesulfurization of
dibenzothiophene in crude oil and hydrocarbon feedstocks. Applied Biochemistry and Biotechnology, 73(2-3), pp.127–144. Kayser, K.J. et al., 1993. Utilization of organosulfur compounds by axenic and mixed cultures of Rhodococcus erythropolis IGTS8.
Journal of Genereal Microbiology, 139, pp.2123–2129. Kilbane, J.J., 1989. Desulfurization of coal: the microbial solution. Trends in Biotechnology, 7(4), pp.97–101. Kilbane, J.J., 2006. Microbial biocatalyst developments to upgrade fossil fuels. Current opinion in biotechnology, 17(3), pp.305–14. Kim, B.H. et al., 1995. Selectivity of desulfurization activity of Desulfovibrio desulfuricans M6 on different petroleum products. Fuel
Processing Technology, 43(1), pp.87–94. Kirsch, F. & Eitinger, T., 2014. Transport of nickel and cobalt ions into bacterial cells by S components of ECF transporters.
BioMetals, 27(4), pp.653–660. Klein, J., 1999. Biological processing of fossil fuels. Applied Microbiology and Biotechnology, 52(1), pp.2–15. Kodama, K. et al., 1973. Identification of microbial products from dibenzothiophene and its proposed oxidation pathway. Agricultural
and Biological Chemistry, 37(1), pp.45–50. Konishi, J. et al., 2000. Demonstration of the carbon-sulfur bond targeted desulfurization of benzothiophene by thermophilic
Paenibacillus sp. strain A11-2 capable of desulfurizing dibenzothiophene. FEMS microbiology letters, 187(2), pp.151–4. Kosaric, N. et al., 1984. The Jerusalem artichoke as an agricultural crop. Biomass, 5(1), pp.1–36. Leandro, M.J. et al., 2011. The osmotolerant fructophilic yeast Zygosaccharomyces rouxii employs two plasma-membrane fructose
uptake systems belonging to a new family of yeast sugar transporters. Microbiology, 157(2), pp.601–608. Lim, T.K., 2015. Edible Medicinal And Non Medicinal Plants - volume 9: Modified stems, roots, bulbs, Springer. Lima-Costa, M.E. et al., 2012. Kinetics of sugars consumption and ethanol inhibition in carob pulp fermentation by Saccharomyces
cerevisiae in batch and fed-batch cultures. Journal of industrial microbiology & biotechnology, 39(5), pp.789–97. Linos, A. et al., 1999. Gordonia polyisoprenivorans sp. nov., a rubber-degrading actinomycete isolated from an automobile tyre.
International Journal of Systematic Bacteriology, 49(4), pp.1785–1791. Liu, H. et al., 2007. Studies on the antifungal activities and chemical components of extracts from Helianthus tuberosus leaves.
Natural Product Research & Development, 19(3), p.405. Lloyd, A.C. & Cackette, T. a., 2001. Diesel engines: environmental impact and control. Journal of the Air & Waste Management
Association, 51(6), pp.809–847. Long, X. et al., 2013. Phytoremediation of cadmium-contaminated soil by two Jerusalem artichoke (Helianthus tuberosus L.)
genotypes. CLEAN - Soil, Air, Water, 41(2), pp.202–209. Lopes da Silva, T. et al., 2005. The use of multi-parameter flow cytometry to study the impact of limiting substrate, agitation intensity,
and dilution rate on cell aggregation during Bacillus licheniformis CCMI 1034 aerobic continuous culture fermentations. Biotechnology and bioengineering, 92(5), pp.568–78.
Lu, F. et al., 2013. Automated dynamic fed-batch process and media optimization for high productivity cell culture process development. Biotechnology and Bioengineering, 110(1), pp.191–205.
Ma, X.Y. et al., 2011. Jerusalem artichoke (Helianthus tuberosus), a medicinal salt-resistant plant has high adaptability and multiple-use values. Journal of Medicinal Plants Research, 5(8), pp.1272–1279.
Majzlik, P. et al., 2011. Influence of zinc(II) and copper(II) ions on Streptomyces bacteria revealed by electrochemistry. International Journal of Electrochemical Science, 6(6), pp.2171–2191.
Makkar, R.S. & Cameotra, S.S., 1999. Biosurfactant production by microorganisms on unconventional carbon sources. Journal of Surfactants and Detergents, 2(2), pp.237–241.
Marcelis, C., 2002. Anaerobic biodesulfurization of thiophenes. Wageningen University. Margaritis, A., Bajpai, P. & Cannell, E., 1981. Optimization studies for the bioconversion of Jerusalem artichoke tubers to ethanol
and microbial biomass. Biotechnology Letters, 3(10), pp.595–599.

49
Maricq, M.M. et al., 2002. The effects of the catalytic converter and fuel sulfur level on motor vehicle particulate matter emissions: Light duty diesel vehicles. Environmental Science and Technology, 36(2), pp.283–289.
Martinez, I. et al., 2014. Biodesulfurization of dibenzothiophene by resting cells of Pseudomonas putida CECT5279 : influence of the oxygen transfer rate in the scale-up from shaken flask to stirrer tank reactor. Journal of Chemical Technology & Biotechnology.
McFarland, B.L., 1999. Biodesulfurization. Current opinion in microbiology, 2(3), pp.257–64. De Miguel, T. et al., 2001. Analysis of canthaxanthin and related pigments from Gordonia jacobaea mutants. Journal of Agricultural
and Food Chemistry, 49(3), pp.1200–1202. De Miguel, T. et al., 2000. Isolation and taxonomic study of a new canthaxanthin-containing bacterium, Gordonia jacobaea MV-1
sp. nov. International Microbiology, 3(2), pp.107–111. Min, Z. et al., 2011. Rapid development and optimization of cell culture media. Biopharm International, 21(1), pp.1–8. Mohebali, G. et al., 2007. Stabilization of water/gas oil emulsions by desulfurizing cells of Gordonia alkanivorans RIPI90A.
Microbiology, 153(Pt 5), pp.1573–81. Mohebali, G. & Ball, A.S., 2008. Biocatalytic desulfurization (BDS) of petrodiesel fuels. Microbiology, 154(Pt 8), pp.2169–83. Monticello, D.J., 1996. Multistage process for deep desulfurizaton of a fossil fuel. , p.15. Muzic, M. & Sertic-Bionda, K., 2013. Alternative processes for removing organic sulfur compounds from petroleum fractions.
Chemical and Biochemical Engineering Quarterly, 11(1), pp.101–108. Naito, M. et al., 2001. Long-term repeated biodesulfurization by immobilized Rhodococcus erythropolis KA2-5-1 cells. Applied
microbiology and biotechnology, 55(3), pp.374–8. Neveling, D.P., Endo, A. & Dicks, L.M.T., 2012. Fructophilic Lactobacillus kunkeei and Lactobacillus brevis isolated from fresh
flowers, bees and bee-hives. Current microbiology. Nomura, N. et al., 2005. Identification and functional analysis of genes required for desulfurization of alkyl dibenzothiophenes of
Mycobacterium sp. G3. Journal of bioscience and bioengineering, 100(4), pp.398–402. Nuhu, A.A., 2013. Bio-catalytic desulfurization of fossil fuels-an update types of isolates and BDS Activities, Ohshiro, T. et al., 1999. Purification and characterization of dibenzothiophene (DBT) sulfone monooxygenase, an enzyme involved
in DBT desulfurization, from Rhodococcus erythropolis D-1. Journal of bioscience and bioengineering, 88(6), pp.610–6. Oldfield, C. et al., 1997. Elucidation of the metabolic pathway for dibenzothiophene desulphurization by Rhodococcus sp. strain
IGTS8 (ATCC 53968). Microbiology, 143, pp.2961–73. OPEC, 2011. World Oil Outlook 2011, Vienna, Austria: OPEC Secretariat. OPEC, 2013. World Oil Outlook 2013, Vienna, Austria: OPEC Secretariat. OPEC, 2014. World Oil Outlook 2014, Vienna, Austria: OPEC Secretariat. Pacheco, M. A. (1999).Recent advances in biodesulfurization (BDS) of diesel fuel. Paper presented at the NPRA Annual Meeting,
San Antonio, TX, 21–23 March 1999. Paixão, S.M. et al., 2016. Advances in the reduction of the costs inherent to fossil fuels’ biodesulfurization towards its potential
industrial application. In T. Saleh, ed. Applying Nanotechnology to the Desulfurization Process in Petroleum Engineering. IGI Global, pp. 390–425.
Paixão, S.M. et al., 2013. Screening of novel yeast inulinases and further application to bioprocesses. New Biotechnology, 30(6), pp.598–606.
Piddington, C.S., Kovacevich, B.R. & Rambosek, J., 1995. Sequence and molecular characterization of a DNA region encoding the dibenzothiophene desulfurization operon of Rhodococcus sp. strain IGTS8. Applied and environmental microbiology, 61(2), pp.468–75.
Pilnik, W. & Vervelde, G.J., 1976. Jerusalem artichoke (Helianthus tuberosus L.) as a source of fructose, a natural alternative sweetener. Zeitschrift fur Acker und Pflazenbau, 142(2).
Rawate, P.D. & Hill, R.M., 1985. Extraction of a high-protein isolate from Jerusalem artichoke (Helianthus tuberosus) tops and evaluation of its nutrition potential. Journal of Agricultural and Food Chemistry, 33(1), pp.29–31.
Reichmuth, D.S. et al., 2000. Biodesulfurization of dibenzothiophene in Escherichia coli is enhanced by expression of a Vibrio harveyi oxidoreductase gene. Biotechnology and bioengineering, 67(1), pp.72–9.
Roseiro, J.C. et al., 1999. Physiology and kinetics of trimethylamine conversion by two methylotrophic strains in continuous cultivation systems. Applied microbiology and biotechnology, 52, pp.546–552.
Roseiro, J.C. et al., 1996. Technological and kinetic aspects of sublethal acid toxicity in microbial gum production. Journal of Chemical Technology & Biotechnology, 65, pp.258–264.
Saiyasitpanich, P. et al., 2005. The effect of diesel fuel sulfur content on particulate matter emissions for a nonroad diesel generator. Journal of the Air & Waste Management Association (1995), 55(7), pp.993–998.
Sampanthar, J.T. et al., 2006. A novel oxidative desulfurization process to remove refractory sulfur compounds from diesel fuel. Applied Catalysis B: Environmental, 63(1-2), pp.85–93.
Sánchez-Segado, S. et al., 2012. Process design and economic analysis of a hypothetical bioethanol production plant using carob pod as feedstock. Bioresource technology, 104, pp.324–8.
Schade, a. L., 1949. Cobalt and bacterial growth, with special reference to Proteus vulgaris. Journal of bacteriology, 58(6), pp.811–822.
Schilling, B.M. et al., 2002. Continuous desulfurization of dibenzothiophene with Rhodococcus rhodochrous IGTS8 (ATCC 53968). Biotechnology Progress, 18(6), pp.1207–1213.
Schimel, J.P. & Weintraub, M.N., 2003. The implications of exoenzyme activity on microbial carbon and nitrogen limitation in soil : a theoretical model. , 35, pp.549–563.
Shafi, R. & Hutchings, G.J., 2000. Hydrodesulfurization of hindered dibenzothiophenes: an overview. Catalysis Today, 59(3-4), pp.423–442.
Silva, T.P. et al., 2015. Jerusalem artichoke as low-cost fructose-rich feedstock for fossil fuels desulphurization by a fructophilic bacterium. Journal of Applied Microbiology, 118(3), pp.609–618.
Silva, T.P. et al., 2012. Optimization of low sulfur carob pulp liquor as carbon source for fossil fuels biodesulfurization. Journal of Chemical Technology and Biotechnology, 88(5), pp.919–923.
Silva, T.P., 2012. Utilization of agroindustrial materials as alternative carbon sources for the biodesulfurization of fossil fuels by Gordonia alkanvorans strain 1B. Faculty of Sciences of the Unversity of Lisbon.
50
Singh, A., Singh, B. & Ward, O., 2012. Potential applications of bioprocess technology in petroleum industry. Biodegradation, 23(6), pp.865–80.
Singh, R.M., 1971. Role of carbon and nitrogen sources in bacterial growth and sporulation. Applied microbiology, 22(1), pp.131–132.
Slimestad, R. et al., 2010. Norwegian-grown Jerusalem artichoke (Helianthus tuberosus L.): morphology and content of sugars and fructo-oligosaccharides in stems and tubers. Journal of the science of food and agriculture, 90(6), pp.956–64.
Soleimani, M., Bassi, A. & Margaritis, A., 2007. Biodesulfurization of refractory organic sulfur compounds in fossil fuels. Biotechnology advances, 25(6), pp.570–96.
Stackerbrandt, E., Smida, J. & Collins, M.D., 1988. Evidence of phylogenetic heterogeneity within the genus Rhodococcus: Revival of the genus Gordona (Tsukamura). The Journal of General and Applied Microbiology, 34(4), pp.341–348.
Stoner, D.L. et al., 1990. Modification of water-soluble coal-derived products by dibenzothiophene-degrading microorganisms. Applied and environmental microbiology, 56(9), pp.2667–76.
Tanaka, Y. et al., 2002. Biodesulfurization of benzothiophene and dibenzothiophene by a newly isolated Rhodococcus strain. Applied microbiology and biotechnology, 59(2-3), pp.325–8.
Tang, K. & Hong, X., 2014. A characterization of bacterium for FCC diesel oil desulfurization. Petroleum Science and Technology, 32(13), pp.1545–1552.
Tao, F. et al., 2006. Biodesulfurization in biphasic systems containing organic solvents. Applied and Environmental Microbiology, 72(7), pp.4604–4609.
Tesio, F., Weston, L.A. & Ferrero, A., 2011. Allelochemicals identified from Jerusalem artichoke (Helianthus tuberosus L.) residues and their potential inhibitory activity in the field and laboratory. Scientia Horticulturae, 129(3), pp.361–368.
Tsukamura, M., 1971. Proposal of a new genus, Gordona, for slightly acid-fast organisms occurring in sputa of patients with pulmonary disease and in soil. Journal of general microbiology, 68(1), pp.15–26.
U.S Energy Informaton Administration, 2014. Annual Energy Outlook 2013 (Early Release Overview). Annual Energy Outlook, pp.1–18.
Vazquez-Duhalt, R. et al., 2002. Will biochemical catalysis impact the petroleum refining industry? Energy & Fuels, 16(5), pp.1239–1250.
Veiga-Crespo, P. et al., 2012. Analysis of canthaxanthin production by Gordonia jacobaea. Methods in Molecular Biology, 892, p.355.
Veiga-Crespo, P. et al., 2005. Influence of culture conditions of Gordonia jacobaea MV-26 on canthaxanthin production. International Microbiology, 8(1), pp.55–58.
Vogelaar, B., 2003. Deactivation of Mo/Al2O3 and NiMo/Al2O3 catalysts during hydrodesulfurization of thiophene. Applied Catalysis A: General, 251(1), pp.85–92..
Waldron, K.J. & Robinson, N.J., 2009. How do bacterial cells ensure that metalloproteins get the correct metal? Nature reviews. Microbiology, 7(1), pp.25–35.
Webb, M., 1939. The Influence of Magnesium on Cell Division. In Mg and bacterial grwoth in simple media. pp. 418–424. Whitehurst, D.D., Isoda, T. & Mochida, I., 1998. Present state of the art and future challenges in the hydrodesulfurization of
polyaromatic sulfur compounds. Advances in Catalysis, 42, pp.345–471 Yang, J. et al., 2007. Two-layer continuous-process design for the biodesulfurization of diesel oils under bacterial growth conditions.
Biochemical Engineering Journal, 37(2), pp.212–218. Zhang, Y.-W., Prabhu, P. & Lee, J.-K., 2010. Alginate immobilization of recombinant Escherichia coli whole cells harboring L-
arabinose isomerase for L-ribulose production. Bioprocess and biosystems engineering, 33(6), pp.741–8. Zhao, G.-M. et al., 2008. Soil properties and yield of Jerusalem artichoke (Helianthus tuberosus L.) with seawater irrigation in north
China plain. Pedosphere, 18(2), pp.195–202. Ziyan, E. & Pekyardimci, S., 2003. Characterization of polyphenol oxidase from Jerusalem artichole (Helianthus tuberosus). Turk
Journal Chemistry, 27, pp.217–225.