processing of short fiber reinforced porous cmc and mmc tubes by
TRANSCRIPT
UNIVERSIDADE FEDERAL DE SANTA CATARINA
PROGRAMA DE PÓS-GRADUAÇÃO EM CIÊNCIA E
ENGENHARIA DE MATERIAIS
Cyro Rovath de Faria
PROCESSING OF SHORT FIBER REINFORCED POROUS
CMC AND MMC TUBES BY POWDER THERMOPLASTIC
EXTRUSION
Dissertação submetida ao Programa de
Pós-Graduação em Ciência e Engenharia de Materiais da
Universidade Federal de Santa
Catarina para a obtenção do Grau de Mestre em Ciência e Engenharia de
Materiais.
Orientador: Prof. Dr. Aloisio Nelmo Klein
Co-orientador: Dr. rer. Nat. Frank Jörg Clemens
Florianópolis
2011

Catalogação na fonte elaborada pela biblioteca da
Universidade Federal de Santa Catarina
A ficha catalográfica é confeccionada pela Biblioteca
Central. Tamanho: 7cm x 12 cm
Fonte: Times New Roman 9,5
Maiores informações em:
http://www.bu.ufsc.br/design/Catalogacao.html
Cyro Rovath de Faria
PROCESSING OF SHORT FIBER REINFORCED POROUS
CMC AND MMC TUBES BY POWDER THERMOPLASTIC
EXTRUSION
Esta Dissertação foi julgada adequada para obtenção do Título de Mestre em Ciência e Engenharia de Materiais, e aprovada em sua forma
final pelo Programa de Pós-Graduação em Ciência e Engenharia de Materiais.
Florianópolis, 25 de Fevereiro de 2011
___________________________________ Prof. Carlos Augusto Silva de Oliveira, Dr. Ing.
Coordenador do Programa
Banca Examinadora:
_________________________
Prof. Antônio Pedro Novaes de Oliveira, Dr. Ing.
Universidade Federal de Santa Catarina
_________________________
Prof. Antonio Eduardo Martinelli, PhD Universidade Federal do Rio Grande do Norte
_________________________
Prof. José Roberto Martinelli, PhD
Universidade de São Paulo


Aos meus pais e à minha esposa

AGRADECIMENTOS
À Universidade Federal de Santa Catarina. Ao Prof. Dr. Aloisio Nelmo Klein pela orientação e pela
confiança em mim depositada.
Ao EMPA (Swiss Federal Laboratories for Materials Science and Technology), em especial ao Dr. Thomas Graule, chefe do Laboratório
de Cerâmicas de Alta Performance, pela oportunidade de realizar meu trabalho experimental em seu laboratório.
Ao Dr. Frank Jörg Clemens, pela co-orientação e pelo convite a
fazer parte de seu grupo no EMPA. Aos colegas dos cursos de graduação e pós-graduação pela forte
amizade.
Aos colegas de trabalho no EMPA, em especial aos que já lá estavam quando cheguei, por terem sido muito receptivos.
Aos meus pais, Sebastião Sérgio de Faria e Clélia Rovath de Faria, por tudo o que fizeram e me proporcionaram até hoje e por todo o amor dado.
Ao meu irmão e amigo, Rafael Rovath de Faria, pelo exemplo e principalmente pelo incentivo que me fez seguir adiante na vida acadêmica.
À Natalie Rovath de Faria pelo carinho e amor dados durante a segunda metade do meu período de estadia na Suíça, e por se deixar levar pelo meu também dado amor, tornando-se enfim, e antes da defesa
deste trabalho, minha eterna companheira e esposa. Ao destino que fez meu caminho cruzar o de Natalie, então
Natalie Gigaud.


“Any sufficiently advanced technology is
indistinguishable from magic.”
Arthur C. Clarke

RESUMO
Materiais com poros interconectados são comumente usados em diversas aplicações de filtragem, como, por exemplo, purificação de
água, filtração de metais fundidos e filtração de gases quentes. Se por um lado, os filtros devem conter uma estrutura de elevada porosidade aberta; em contrapartida, esses materiais devem apresentar resistência
mecânica suficiente para suportar a queda de pressão durante o processo de filtração. O objetivo deste trabalho foi estudar a viabilidade de produção de tubos porosos, em compósitos de matriz cerâmica e
metálica reforçados por fibras, via extrusão termoplástica de pós, para aplicação em processos de filtração. A extrusão termoplástica é um
processo contínuo, capaz de promover um alto nível de alinhamento de fibras na direção de extrusão, sem que haja excessiva fratura de fibras durante o processamento. Pós de alumina e superliga de níquel foram
selecionados para formar a matriz dos compósitos de matriz cerâmica e metálica, respectivamente. Fibras curtas de alumina foram utilizadas como reforço. Como componentes do sistema ligante foram utilizados
polietileno de baixa densidade (LDPE), parafina (PW) e ácido esteárico (SA). Diferentes proporções entre LDPE-PW-SA foram estudadas a fim
de desenvolver um sistema ligante apropriado ao processo. A evolução da viscosidade da mistura em função do teor de sólidos foi estudada e comparada a diversos modelos de viscosidade. Após o desenvolvimento
do feedstock de extrusão, 30 % em volume de fibras foram adicionadas a mistura. Tubos com 4,5 a 10,0 mm de diâmetro, com 0,6 e 1,0 mm de espessura foram então extrudados com sucesso, após sucessivas etapas
de ajuste dos parâmetros de extrusão. Análises microscópicas confirmaram o alinhamento satisfatório das fibras. Finalmente, após a sinterização dos tubos a 1300 ºC durante 60 minutos, meso e
macroporosidades foram identificadas através de análises porosimétricas por intrusão de mercúrio, totalizando um volume de poros de,
aproximadamente, 41 e 36 % nos tubos de matriz cerâmica e metálica, respectivamente. O nível de porosidade, bem como o tamanho médio de poros, foi considerado adequado à aplicação em certos processos de
filtração, em especial a filtração de gases quentes. Palavras-chave: Extrusão. Materiais porosos. Compósitos reforçados
por fibras. Compósitos de matriz metálica. Compósitos de matriz cerâmica. Sistemas ligantes.

ABSTRACT
Materials with interconnected pore network are commonly used in several filtering applications, e.g. water purification, molten metal
filtration, and hot-gas filtration. On one hand filters must contain a highly open porous structure; on the other hand these materials must have sufficient mechanical strength to withstand the pressure drop
during the filtration process. The objective of this work was to study the feasibility to produce short fiber reinforced porous ceramic and metal matrix composites tubes, processed by powder thermoplastic extrusion,
for application in filtering processes. The powder thermoplastic extrusion is a continuous process, able to promote high alignment of
fibers in the extrusion direction, without excessive fiber breakage. Alumina and nickel superalloy powders have been selected to form the matrix of the ceramic and metallic matrix composites, respectively.
Short alumina fibers have been used as reinforcement. Low density polyethylene (LDPE), paraffin wax (PW) and stearic acid (SA) formed the binder system. Different proportions of LDPE-PW-SA have been
studied in order to develop a binder system suitable for the extrusion process. The evolution of the feedstock viscosity as a function of the
solids content was studied and compared to various viscosity models. After the development of the extrusion feedstock, 30 vol.% of fibers were incorporated to the mixture. Tubes with 4.5 and 10.0 mm of
diameter, with 0.6 and 1.0 mm of thickness, were then successfully extruded, after the complete extrusion parameters adjustment. Microscopy analysis confirmed the satisfactory fiber alignment. Finally,
after sintering the tubes at 1300 °C for 60 minutes, meso and macroporosity were identified by mercury intrusion porosimetry analysis, with a total pore volume of, approximately, 41 and 36 % in the
ceramic and metal matrix composites, respectively. The porosity level, as well as the average pore size, have been considered adequate for the
application in certain filtration processes, particularly in hot-gas filtration.
Keywords: Extrusion. Porous materials. Fiber reinforced composites. Metal matrix composites. Ceramic matrix composites. Binder systems.

LIST OF FIGURES
Figure 1 – Classification of composites according to the reinforcement form. ........................................................................................................ 39 Figure 2 – Schematic diagram showing fiber alignment due to contracting and expanding flow during injection or feedstock extrusion process. .................................................................................................... 41 Figure 3 – Quantitative analysis of the degree of orientation of SiC particles in an extruded 2080 aluminum alloy matrix composite with 20 vol.% of reinforcement fraction. The degree of orientation is defined by
the angle of a given article to loading axis. ............................................ 42 Figure 4 – Hexagonal close-packed structure of -alumina................... 44 Figure 5 – Ni-Al-O isothermal phase diagram at 1600 K. Two reaction paths are possible when nickel is bonded to Al2O3. (I) low oxygen activity, no reaction product form. (II) high oxygen activity, spinel
forms. ....................................................................................................... 48 Figure 6 – Schematic cross-section of a porous solid showing different types of pores. ......................................................................................... 55 Figure 7 – Scanning electron microscope image of an alumina fiber filter membrane. ...................................................................................... 58 Figure 8 – Microstructure of the composite obtained by WHIPOX
process. .................................................................................................... 60 Figure 9 – Collection of possible particle shapes. ................................. 63 Figure 10 – Surfactant sketch showing its hydrophilic and hydrophobic groups, and the behavior of a surfactant in different means. .................. 65 Figure 11 – Simple shear flow of a fluid between two plates, in which
one has higher velocity than the other. ................................................... 67 Figure 12 – Newtonian and non-Newtonian models of fluid behavior. . 69 Figure 13 – Arrhenius plot of a natural logarithm of the viscosity for a
polyethylene and stearic acid mixture. .................................................... 70 Figure 14 – Relative viscosity versus volume fraction of monosized
glass spheres. ........................................................................................... 71 Figure 15 – Sketches showing the immobile liquid when the solid
volume fraction reaches the maximum value m, and the mobile liquid
when <m............................................................................................... 73 Figure 16 – Powder volume fraction versus powder weight fraction. A small error in the weight is amplified in the volume loading near the
maximum loading. ................................................................................... 76 Figure 17 – Relative viscosity versus powder volume loading. Small error in volume loading represents large changes in viscosity near
maximum loading. Relative viscosity can become infinite for errors that
achieves higher loading than the maximum. .......................................... 77 Figure 18 – Effect of the percentage of small particles on relative
viscosity for a bimodal mixture of spheres at a solid content of 55 vol.% and a size ratio of 21............................................................................... 78 Figure 19 – The effect of particle shape on the relative viscosity for a
suspension of glass particles in water. The ratio length-diameter is also indicated to show its direct influence. .................................................... 79 Figure 20 – Schematic diagram of a constant plunger speed with circular
orifice capillary rheometer. .................................................................... 80 Figure 21 – Schematic diagram of the chamber of a torque rheometer. 81 Figure 22 – Mixing torque as a function of mixing time. Steady-state torque is associated with mixture homogeneity. .................................... 82 Figure 23 – Sketch of a plunger extruder used in thermoplastic powder
extrusion. ................................................................................................ 84 Figure 24 – Sketch of an extrudate suffering swelling in the die exit region. Note that the velocity profile changes from parabolic to straight.86 Figure 25 – Various forms of melt fracture: (a) regular ripple, (b) bamboo, (c) spiral and (d) random fracture. .......................................... 87 Figure 26 – Cumulative binder weight loss versus temperature for plain polyethylene in Air and N2 atmosphere; and polyethylene mixed with iron powder in N2 atmosphere. ............................................................... 90 Figure 27 – Scanning electron image of neck formed on nickel particles
sintered at 1200 °C for 60 min in vacuum. ............................................ 92 Figure 28 – Conceptual evolution of spherical particles through the three stages of sintering. .................................................................................. 94 Figure 29 – Schematic diagram of the procedure used in the feedstock development. (a) Mixing, (b) granulation, (c) warm-pressing and (d)
debinding. ............................................................................................. 101 Figure 30 – Schematic graphic of feedstock composition. Question marks denote the amount to be defined during feedstock development.104 Figure 31 – Sketch of the three different geometries of the extruded tubes. ..................................................................................................... 104 Figure 32 – Rotors used for mixing in the kneader. Rotors type: Roller-
Rotors R600. ......................................................................................... 107 Figure 33 – Picture of the die, upper punch (bigger) and lower punch
(smaller) used for warm-pressing the disc-shaped samples................. 107 Figure 34 – Warm-pressing setup, showing the press and its piston, the heating band around the die, the force meter, chronometer, and
temperature control unit. ...................................................................... 108
Figure 35 – Capillary rheometer used to granulate the feedstock and to
extrude the tubes.................................................................................... 109 Figure 36 – Sketch of the die used for feedstock granulation. ............. 110 Figure 37 – Sketch of the dies used for tube extrusion, showing the die diameter, the extrudate thickness and the die entrance angle. .............. 110 Figure 38 – Solvent debinding setup. ................................................... 111 Figure 39 – SEM images of IN718 powder in four different magnifications, 10000, 5000, 2000 and 1000x. .................................... 113 Figure 40 – SEM images of alumina powder in four different
magnifications, 10000, 5000, 2000 and 1000x. .................................... 114 Figure 41 – PSD analysis of the IN718 powder from 2
nd batch. .......... 115
Figure 42 – PSD analysis of the alumina powder. ................................ 115 Figure 43 – SEM images of Nextel™ 610 alumina fibers. Magnification: 110 and 1000 x. ............................................................ 116 Figure 44 – Thermogravimetric analysis of LDPE70 in forming gas. . 116 Figure 45 – Thermogravimetric analysis of LDPE02 in forming gas. . 117 Figure 46 – Thermogravimetric analysis of PW in forming gas. ......... 117 Figure 47 – Thermogravimetric analysis of SA in forming gas. .......... 118 Figure 48 – Plot of pre-mixing torque and temperature versus mixing
time of 54 vol.% of alumina powder with a plain LDPE70 binder system. ................................................................................................... 119 Figure 49 – Plot of mixing torque and temperature versus mixing time
of 54 vol.% of alumina powder with a plain LDPE70 binder system. . 119 Figure 50 – Plot of pre-mixing torque and temperature versus mixing time of 54 vol.% of IN718 powder with a plain LDPE70 binder system.120 Figure 51 – Plot of mixing torque and temperature versus mixing time of 54 vol.% of IN718 powder with a plain LDPE70 binder system. .... 120 Figure 52 – Plot of mixing torque versus time of alumina and IN718
feedstocks with 54 vol.% of solids and a plain LDPE70 binder system. The mixing temperature at stable torque stage was 152 °C. ................ 121 Figure 53 – Cylinder pressure during granulation of IN718 and alumina feedstocks with 54 vol.% of solids and a plain LDPE70 binder system. The temperature during granulation was 140 °C. ................................. 122 Figure 54 – Piston force during granulation of IN718 and alumina feedstocks with 54 vol.% of solids and a plain LDPE70 binder system. The temperature during granulation was 140 °C. ................................. 123 Figure 55 – Cylinder pressure as a function of shear rate during feedstock granulation. ........................................................................... 124 Figure 56 – Thermogravimetric analysis of plain LDPE70, alumina and IN718 based feedstocks. TGA was performed in forming gas. Total
mass has been normalized to binder mass to make it easy to compare the
three different analyses. ........................................................................ 124 Figure 57 – Thermogravimetric analysis of alumina-LDPE70 based
feedstocks performed in forming gas and in air. Total mass has been normalized to binder mass.................................................................... 125 Figure 58 – IN718 and alumina warm-pressed samples. ..................... 126 Figure 59 – SEM image of a green warm-pressed alumina disc, with 54 vol.% of solids and plain LDPE70. Magnification: 10000 x. .............. 127 Figure 60 – SEM image of a green warm-pressed IN718 disc, with 54
vol.% of solids and plain LDPE70. Magnification: 10000 x. .............. 127 Figure 61 – Picture of disc-shaped samples after thermal debinding. (a)
Alumina in oxidizing atmosphere, (b) alumina in reducing atmosphere and (c) IN718 in reducing atmosphere. ................................................ 128 Figure 62 – Plot of pre-mixing torque and temperature versus mixing
time of 54 vol.% of alumina powder with a plain LDPE02 binder system. .................................................................................................. 132 Figure 63 – Plot of final mixing torque and temperature versus mixing
time of 54 vol.% of alumina powder with a plain LDPE02 binder system. .................................................................................................. 132 Figure 64 – Plot of final mixing torque versus time of alumina feedstocks with LDPE70 and LDPE02 as binders, with 54 vol.% of solids. The mixing temperature at stable torque stage was 152 °C. .... 133 Figure 65 – Cylinder pressure during granulation of alumina feedstocks with 54 vol.% of solids, with two different binders: LDPE70 and LDPE02. The temperature during granulation was 140 °C. ................ 134 Figure 66 – Piston force during granulation of alumina feedstocks with 54 vol.% of solids, with two different binders: LDPE70 and LDPE02. The temperature during granulation was 140 °C. ................................ 134 Figure 67 – Cylinder pressure as a function of shear rate during feedstock granulation of alumina based feedstocks with LDPE02 and
LDPE70 as binders. .............................................................................. 135 Figure 68 – Alumina discs with 54 vol.% of solids. (a) plain LDPE70 and (b) plain LDPE02 as binders after debinding program. ................ 137 Figure 69 – Plot of mixing torque versus time during pre-mixing of alumina feedstocks with 54, 56, 58, 60 and 62 vol.% of solids at 180 °C.138 Figure 70 – Plot of mixing torque versus time during final mixing of
alumina feedstocks with 54, 56, 58, 60 and 62 vol.% of solids at 152 °C.139 Figure 71 – Average torque during final mixing versus filling level for
alumina feedstock with plain LDPE70. ............................................... 140 Figure 72 – Regression curve and equation of LDPE/Al2O3 ratio versus inverse of torque. .................................................................................. 141
Figure 73 – Plot of filling level versus mixing torque of alumina
feedstocks compared with various viscosity models. ........................... 143 Figure 74 – Detail of the plot of filling level versus mixing torque of
alumina feedstocks compared with various viscosity models, in the region of the measured data. ................................................................. 143 Figure 75 – Alumina discs with filling levels of (a) 54, (b) 56, (c) 58, (d)
60 and (e) 62 vol.% after debinding program. ...................................... 145 Figure 76 – Binder composition of alumina and IN718 feedstocks during tests to define PW content. All feedstock had a filling level of 62
vol.%. ..................................................................................................... 146 Figure 77 – Plot of mixing torque versus time during final mixing of
alumina feedstocks with different binder systems and 62 vol.% of solids at 152 °C. All binders systems have 5 vol.% of PW and the balance of LDPE70. ................................................................................................ 147 Figure 78 – Plot of mixing torque versus time during final mixing of IN718 feedstocks with different binder systems and 62 vol.% of solids at 152 °C. All binders systems have 5 vol.% of PW and the balance of
LDPE70. ................................................................................................ 147 Figure 79 – Evolution of mixing torque with increase of PW volume
content and corresponding decrease of LDPE70 content. The amount of SA was fixed in all binders at 5 vol.%. ................................................. 148 Figure 80 – SEM images of green warm-pressed alumina discs. (a) 54
vol.% of solids and plain LDPE as binder. (b) 62 vol.% of solids and binder system composed of 5 vol.% of SA, 30 vol.% of PW and 75 vol.% of LDPE. Magnification: 10000 x. ............................................. 150 Figure 81 – SEM images of green warm-pressed IN718 discs. (a) 54 vol.% of solids and plain LDPE as binder. (b) 62 vol.% of solids and binder system composed of 5 vol.% of SA, 30 vol.% of PW and 75
vol.% of LDPE. Magnification: 10000 x. ............................................. 150 Figure 82 – Alumina discs after debinding process in forming gas
atmosphere. Feedstocks have the following PW content: (a) 47.5, (b) 39, (c) 30, (d) 25, (e) 20 and (f) 0 (zero) vol.%. ......................................... 152 Figure 83 – IN718 discs after debinding process in forming gas
atmosphere. Feedstocks have the following PW content: (a) 47.5, (b) 39, (c) 30, (d) 25, (e) 20 and (f) 0 (zero) vol.%. ......................................... 153 Figure 84 – Schematic graphic representing the ultimate extrusion
feedstock composition. .......................................................................... 153 Figure 85 – Plot of pre-mixing torque and pre-mixing temperature
versus time of the ultimate alumina feedstock with Nextel™ fibers. .. 155 Figure 86 – Plot of pre-mixing torque and pre-mixing temperature versus time of the ultimate IN718 feedstock with Nextel™ fibers. ..... 155
Figure 87 – Plot of final mixing torque versus time of the ultimate
alumina feedstock with Nextel™ fibers in comparison with the correspondent alumina feedstock without fibers. ................................ 156 Figure 88 – Plot of final mixing torque versus time of the ultimate IN718 feedstock with Nextel™ fibers in comparison with the correspondent IN718 feedstock without fibers. ................................... 156 Figure 89 – Thermogravimetric analysis of the ultimate alumina feedstock with Nextel™ fibers. Atmosphere: forming gas. Total mass has been normalized to binder mass to facilitate the interpretation of the
curve. The guide line at 65,46 wt.% represents the LDPE amount that remains after the removal of SA and PW. ........................................... 157 Figure 90 – Thermogravimetric analysis of the ultimate IN718 feedstock with Nextel™ fibers. Atmosphere: forming gas. Total mass has been normalized to binder mass to facilitate the interpretation of the curve.
The guide line at 65,46 wt.% represents the LDPE amount that remains after the removal of SA and PW. ......................................................... 158 Figure 91 – Discs after debinding process in forming gas atmosphere.
(a) Alumina and (b) IN718 ultimate feedstocks with fibers. ............... 159 Figure 92 – Plot of extrusion pressure versus cylinder temperature of
alumina tubes with 10.0 mm of diameter and 0.6 mm of wall thickness. Piston speed: 1.00 mm/min. ................................................................. 161 Figure 93 – Arrhenius plot of the natural logarithm of extrusion pressure
P versus the inverse of extrusion temperature T. The measured data are from the extrusion of alumina tubes with 10.0 mm of diameter and 0.6 mm of wall thickness with a piston speed of 1.00 mm/min. ............... 162 Figure 94 – Picture of extruded tubes with surface defect associated with extrusion above the melting point of the backbone polymer. (a) Alumina tube extruded at 120 °C and (b) IN718 tube extruded at 120 °C showing
both rough surface and banana shape. The tubes were extruded with a piston speed of 1.00 mm/min, with no die temperature control. ......... 163 Figure 95 – Picture of extruded tubes with surface defect associated with extrusion below or close to the melting point of the backbone polymer. (a) Alumina tube extruded at 100 °C showing stains on the surface, (b)
alumina tube extruded at 110 °C showing fish scale and (c) IN718 tube extruded at 110 °C showing also fish scale. The tubes were extruded with a piston speed of 1.00 mm/min, with no die temperature control.163 Figure 96 – Pictures of die cooling setup showing: (a) the refrigerant fluid (ethanol) inside the beaker in contact with the extrusion die to
reduce its temperature; and (b) detail of the die submerged in the ethanol bath and the alumina extrudate exiting the die. ................................... 164

Figure 97 – Pictures of tubes produced without and with the setup for
cooling the die. (a) Alumina tube extruded at 120 °C without die cooling setup. (b) Alumina tube extruded at 120 °C with die cooling setup, using
ethanol as refrigerant. (c) IN718 tube extruded at 120 °C without die cooling setup. (d) IN718 tube extruded at 120 °C with die cooling setup, using ethanol as refrigerant. All tubes were extruded with a piston speed
of 1.00 mm/min. All tubes have 10.0 mm of diameter and 1.0 mm of thickness. ............................................................................................... 166 Figure 98 – Plot of extrusion pressure versus piston speed of IN718
tubes with 10.0 mm of diameter and 0.6 mm of wall thickness extruded at 120 °C using the die cooling setup with ethanol. ............................. 167 Figure 99 – Picture of tubes extruded with piston speed of 1.00 mm/min. (a) IN718 tube with 4.5 mm of diameter and 1.0 mm of thickness showing fish scale and banana shape. (b) IN718 tube with 10.0 mm of
diameter and 0.6 mm of thickness showing fish scale and banana shape. (c) Defect-free IN718 tube with 10.0 mm of diameter and 1.0 mm of thickness. (d) Alumina tube with 4.5 mm of diameter and 1.0 mm of
thickness showing fish scale and banana shape. All tubes were produced with the use of the die cooling setup with ethanol as refrigerant. ........ 169 Figure 100 – Pictures of defect-free tubes extruded with extrusion speed vE of 15.7 mm/min. (a) Alumina and (b) IN718 tubes with 10.0 mm of diameter and 1.0 mm of thickness. (c) Alumina and (d) IN718 tubes
with 4.5 mm of diameter and 1.0 mm of thickness. (e) Alumina and (f) IN718 tubes with 10.0 mm of diameter and 1.0 mm of thickness. All tubes extruded at 120 °C using the die cooling setup with ethanol. ..... 171 Figure 101 – Pictures of defect-free tubes extruded under the ultimate extrusion conditions. (a) IN718 [gray] and alumina [white] tubes with 10.0 mm of diameter and 1.0 mm of thickness. (b) IN718 [gray] and
alumina [white] tubes with 10.0 mm of diameter and 0.6 mm of thickness. (c) IN718 [gray] and alumina [white] tubes with 4.5 mm of
diameter and 1.0 mm of thickness. ....................................................... 173 Figure 102 – SEM image of extruded alumina green tube. The images are from a tube with 10.0 mm of diameter and 1.0 mm of thickness.
Magnification: (a) 150x and (b) 1000x. ................................................ 174 Figure 103 – SEM image of extruded IN718 green tube. The images are from a tube with 10.0 mm of diameter and 1.0 mm of thickness.
Magnification: (a) 150x and (b) 1000x. ................................................ 175 Figure 104 – Picture of alumina tubes after thermal debinding and
sintering in forming gas. (a) Two samples of 10.0 mm of diameter and 1.0 mm of thickness; (b) Two samples of 10.0 mm of diameter and 0.6
mm of thickness and (c) One sample of 4.5 mm of diameter and 1.0 mm
of thickness. .......................................................................................... 176 Figure 105 – Pictures of IN718 tubes after thermal debinding and
sintering in forming gas. Tubes geometry: (a) 10.0 mm of diameter and 1.0 mm of thickness and (b) 4.5 mm of diameter and 1.0 mm of thickness. .............................................................................................. 176 Figure 106 - Picture of alumina tubes after thermal debinding and sintering in air. (a) 10.0 mm of diameter and 1.0 mm of thickness; (b) 10.0 mm of diameter and 0.6 mm of thickness and (c) 4.5 mm of
diameter and 1.0 mm of thickness. The dark edges of tubes (a) and (b) are contamination originated from the cutting disc. The curvature of the
tube (c) is not related with the debinding and sintering, but was already present on the green tube. ..................................................................... 177 Figure 107 – SEM images of extruded alumina tubes (a) before solvent
debinding and (b) after solvent debinding. Magnification: 5000x. ..... 178 Figure 108 – SEM images of extruded IN718 tubes (a) before solvent debinding and (b) after solvent debinding. Magnification: 5000x. ..... 178 Figure 109 – Picture of alumina tubes after solvent debinding, thermal debinding and sintering in forming gas. (a) 10.0 mm of diameter and 1.0
mm of thickness; (b) 10.0 mm of diameter and 0.6 mm of thickness and (c) 4.5 mm of diameter and 1.0 mm of thickness. ............................... 180 Figure 110 – Picture of IN718 tubes after solvent debinding, thermal
debinding and sintering in forming gas. (a) 10.0 mm of diameter and 1.0 mm of thickness; (b) 10.0 mm of diameter and 0.6 mm of thickness and (c) 4.5 mm of diameter and 1.0 mm of thickness. ............................... 180 Figure 111 – Picture of alumina tubes after solvent debinding, thermal debinding and sintering in air. (a) 10.0 mm of diameter and 1.0 mm of thickness; (b) 10.0 mm of diameter and 0.6 mm of thickness and (c) 4.5
mm of diameter and 1.0 mm of thickness. The dark edges of the tubes are contamination originated from the cutting disc. ............................ 181 Figure 112 – SEM images of an alumina tube sintered in forming gas at 1300 °C for 60 min. Magnifications: (a) 150x and (b) 5000x. ............ 183 Figure 113 – SEM images of an IN718 tube sintered in forming gas at
1300 °C for 60 min. Magnifications: (a) 150x and (b) 5000x. ............ 184 Figure 114 – XRD analyses of green and sintering alumina tubes. Sintering atmospheres: forming gas and air. ........................................ 185 Figure 115 – XRD analysis of green and sintered IN718 tubes. Sintering atmosphere: forming gas. ..................................................................... 186 Figure 116 – XRD analysis of sintered IN718 samples with and without Nextel™ fibers. Sintering atmosphere: forming gas ........................... 187
Figure 117 – XRD analysis of IN718 samples before and after sintering.
Sintering atmosphere: forming gas. Black lines were added in the graphic to guide the eyes and evidence the peak shift. ......................... 188 Figure 118 – Pore size distribution measured by mercury porosimetry of alumina sintered tubes. .......................................................................... 189 Figure 119 – Pore size distribution measured by mercury porosimetry of
IN718 sintered tubes.............................................................................. 189

LIST OF TABLES
Table 1 – Data of some commercial alumina fibers. Some may be no longer available. ...................................................................................... 45 Table 2 – Coefficients of thermal expansion of nickel and alumina. ..... 47 Table 3 – Stability of alumina whiskers in nickel-based matrices. ........ 49 Table 4 – Chemical composition of IN718 and IN625 nickel
superalloys. .............................................................................................. 51 Table 5 – Potential industrial applications for fibers reinforced ceramic composites. .............................................................................................. 53 Table 6 – Basic information provided by the suppliers of the used powders. .................................................................................................. 97 Table 7 – Chemical composition of the nickel based superalloy IN718, after the supplier. Elements with percentage above 1.0% are marked in bold. ......................................................................................................... 98 Table 8 – Properties and supplier’s information of binders and surfactant used. ......................................................................................................... 99 Table 9 – Granulation parameters. ........................................................ 100 Table 10 – Dies and pins basic geometries used for tube production and the respective produced tube geometries. ............................................. 109 Table 11 – Results of helium pycnometry and BET analysis for the two different powders................................................................................... 115 Table 12 – Average pressure and piston force at plateau during
granulation of IN718 and alumina feedstocks at the three different shear rates and granulation speeds.................................................................. 123 Table 13 – Density and thickness of warm pressed samples with a plain
LDPE70 binder system and 54 vol.% of solids. ................................... 126 Table 14 – Various debinding programs imposed to the IN718 disc-shaped samples in the attempt to reduce defects formation during
thermal debinding. The parameters that differ from the basic program are highlighted. As a reference, the basic program is also shown as
program #0. ........................................................................................... 130 Table 15 – Average pressure and piston force at plateau during granulation of alumina feedstocks with LDPE02 and LDPE70 at the
three different shear rates and granulation speeds. ............................... 135 Table 16 - Density and thickness of warm pressed alumina samples with plain LDPE70 and plain LDPE02 binder systems, with a solids load of
54 vol.%................................................................................................. 136 Table 17 – Solid load and torque data according to measured values and
calculated values according to regression equation from Figure 72. ... 141
Table 18 – Density and thickness of warm-pressed alumina samples
with plain LDPE70 with different filling levels. ................................. 144 Table 19 – Binder composition of alumina and IN718 feedstocks during
tests to define PW content. All feedstock had a filling level of 62 vol.%.146 Table 20 – Warm-pressing temperature, density and thickness of warm-pressed alumina and IN718 samples with different binder systems. All
binder system contains 5 vol.% of SA and LDPE as balance.............. 149 Table 21 – Percentage of binder removed from alumina and IN718 discs with different binder systems. .............................................................. 151 Table 22 – Density, thickness and pressing temperature of warm-pressed alumina and IN718 discs with the ultimate feedstocks containing fibers.159 Table 23 – Calculated section areas of the piston and dies. ................ 168 Table 24 – Calculated extrusion speeds vE for the three different dies geometries for a piston speed vP of 1.00 mm/min. .............................. 170 Table 25 – Calculated piston speed vP for the three different dies geometries to achieve an extrusion speed vE of 15.7 mm/min. ........... 170 Table 26 – Different thermal debinding programs used on the attempt to
diminish the deformation of IN718 tubes with 10.0 mm of diameter and 1.0 of thickness. All samples have been previously submitted to solvent
debinding. ............................................................................................. 182
LIST OF ABBREVIATIONS
CIP – Cold isostatic pressing CMC – Ceramic matrix composite
HDPE – High density polyethylene HIP – Hot isostatic pressing IGCC – Integrated gasification combined cycle
LDPE – Low density polyethylene MFI – Melt flow index MMC – Metal matrix composite
PE – Polyethylene PFBC – Pressurized fluidized-bed combustion
PIM – Powder injection molding PIP – Polymer infiltration and pyrolysis PMC – Polymer matrix composite
PMP – Particulate materials processing PP – Polypropylene PS – Polystyrene
PSD – Particle size distribution PW – Paraffin wax
SA – Stearic acid SEC – Size exclusion chromatography SEM – Scanning electron microscopy
SHS – Self-propagation high temperature synthesis TGA – Thermogravimetric analysis WHIPOX – Wound highly porous oxide CMC
XRD – X-ray diffraction

LIST OF SYMBOLS
lc – Fiber critical length df – Fiber diameter
f* – Fiber strength
i* – interface shear strength Tc – Critical temperature
tc – Time of exposure in the critical temperature M – Metal
SL – Solid-liquid surface tension
G – Gibbs free energy Tg – Glass transition temperature Tm – Melting temperature
A – Area x – Distance v – Velocity
f – Force
– Velocity gradient or shear rate
– Shear stress
– Viscosity T – Temperature
0 – Viscosity at a reference temperature T0 – Reference temperature k – Boltzmann’s constant
E – Activation energy Ea – Apparent activation energy
r – Relative viscosity
– Volume fraction
r – Relative solids volume fraction
m – Maximum solids volume fraction
b – Binder viscosity ∞ – Infinite
A, B, k and n – Unknown constants
– Crowding factor r – Particle radius
– Intrinsic viscosity D – Diffusion coefficient L – Particle length
D – Particle diameter
GT – Total Gibbs free energy
GV – Gibbs free energy associated with volume
GB – Gibbs free energy associated with boundaries
GS – Gibbs free energy associated with surface area
AS – Surface area VP – Volume of feedstock displaced by the piston
vP – Piston speed AP – Piston section area t – time
VE – Extruded volume vE – Extrusion speed AD – Die section area
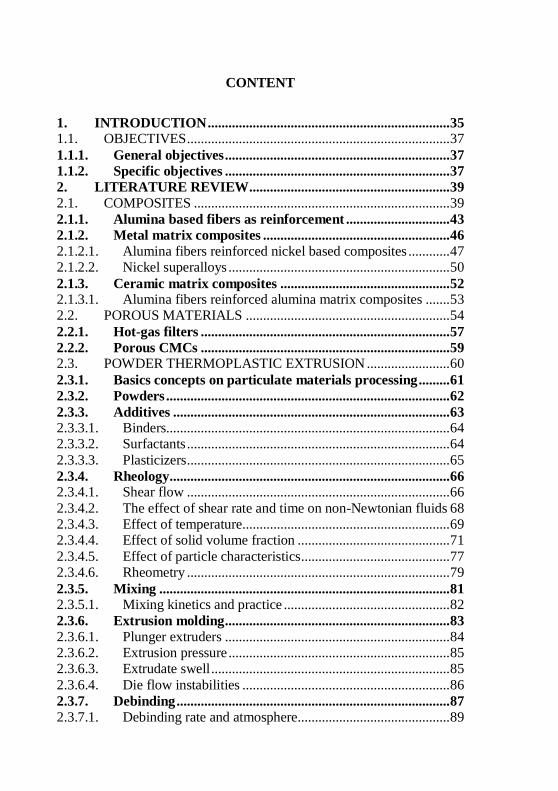
CONTENT
1. INTRODUCTION ...................................................................... 35 1.1. OBJECTIVES ............................................................................ 37 1.1.1. General objectives ................................................................. 37 1.1.2. Specific objectives ................................................................. 37 2. LITERATURE REVIEW .......................................................... 39 2.1. COMPOSITES .......................................................................... 39 2.1.1. Alumina based fibers as reinforcement .............................. 43 2.1.2. Metal matrix composites ...................................................... 46 2.1.2.1. Alumina fibers reinforced nickel based composites ............ 47 2.1.2.2. Nickel superalloys ................................................................ 50 2.1.3. Ceramic matrix composites ................................................. 52 2.1.3.1. Alumina fibers reinforced alumina matrix composites ....... 53 2.2. POROUS MATERIALS ........................................................... 54 2.2.1. Hot-gas filters ........................................................................ 57 2.2.2. Porous CMCs ........................................................................ 59 2.3. POWDER THERMOPLASTIC EXTRUSION ........................ 60 2.3.1. Basics concepts on particulate materials processing ......... 61 2.3.2. Powders .................................................................................. 62 2.3.3. Additives ................................................................................ 63 2.3.3.1. Binders.................................................................................. 64 2.3.3.2. Surfactants ............................................................................ 64 2.3.3.3. Plasticizers ............................................................................ 65 2.3.4. Rheology ................................................................................. 66 2.3.4.1. Shear flow ............................................................................ 66 2.3.4.2. The effect of shear rate and time on non-Newtonian fluids 68 2.3.4.3. Effect of temperature............................................................ 69 2.3.4.4. Effect of solid volume fraction ............................................ 71 2.3.4.5. Effect of particle characteristics ........................................... 77 2.3.4.6. Rheometry ............................................................................ 79 2.3.5. Mixing .................................................................................... 81 2.3.5.1. Mixing kinetics and practice ................................................ 82 2.3.6. Extrusion molding................................................................. 83 2.3.6.1. Plunger extruders ................................................................. 84 2.3.6.2. Extrusion pressure ................................................................ 85 2.3.6.3. Extrudate swell ..................................................................... 85 2.3.6.4. Die flow instabilities ............................................................ 86 2.3.7. Debinding ............................................................................... 87 2.3.7.1. Debinding rate and atmosphere............................................ 89
2.3.7.2. Debinding defects ................................................................ 91 2.3.8. Sintering ................................................................................ 91 2.3.8.1. Solid-state sintering stages .................................................. 93 2.3.8.2. Sintering parameters ............................................................ 94 3. EXPERIMENTAL .................................................................... 97 3.1. MATERIALS ............................................................................ 97 3.1.1. Powders ................................................................................. 97 3.1.2. Fibers ..................................................................................... 98 3.1.3. Binders and solvent .............................................................. 99 3.2. METHODS ............................................................................... 99 3.2.1. Feedstock development ........................................................ 99 3.2.1.1. Filling level definition and maximum filling level determination ........................................................................................ 102 3.2.1.2. Binder system definition ................................................... 103 3.2.2. Tube extrusion .................................................................... 103 3.2.3. Tubes debinding ................................................................. 105 3.2.3.1. Solvent debinding .............................................................. 105 3.2.4. Tubes sintering ................................................................... 106 3.3. INSTRUMENTS .................................................................... 106 3.3.1. Processing instruments ...................................................... 106 3.3.2. Characterization instruments ........................................... 111 4. RESULTS AND DISCUSSIONS ........................................... 113 4.1. MATERIALS CHARACTERIZATION ................................ 113 4.2. PRELIMINARY TESTS ........................................................ 118 4.2.1. Alumina and IN718 feedstocks with plain LDPE70 ....... 118 4.2.1.1. Mixing ............................................................................... 118 4.2.1.2. Granulation ........................................................................ 122 4.2.1.3. Warm-pressing .................................................................. 125 4.2.1.4. Thermal debinding ............................................................ 128 4.2.2. Alumina feedstock with plain LDPE02............................ 131 4.2.2.1. Mixing ............................................................................... 131 4.2.2.2. Granulation ........................................................................ 133 4.2.2.3. Warm-pressing .................................................................. 136 4.2.2.4. Debinding .......................................................................... 136 4.3. FEEDSTOCK DEVELOPMENT........................................... 137 4.3.1. Filling level definition ........................................................ 137 4.3.1.1. Mixing ............................................................................... 138 4.3.1.1.1. Maximum filling level calculation .................................. 140 4.3.1.1.2. Viscosity models comparison ......................................... 141 4.3.1.2. Granulation ........................................................................ 144 4.3.1.3. Warm-pressing .................................................................. 144
4.3.1.4. Debinding ........................................................................... 144 4.3.2. Paraffin wax content definition ......................................... 145 4.3.2.1. Mixing ................................................................................ 146 4.3.2.2. Granulation ......................................................................... 148 4.3.2.3. Warm-pressing ................................................................... 149 4.3.2.4. Thermal debinding ............................................................. 151 4.3.3. Ultimate extrusion feedstock ............................................. 153 4.3.3.1. Mixing ................................................................................ 153 4.3.3.2. Granulation ......................................................................... 158 4.3.3.3. Warm-pressing ................................................................... 158 4.3.3.4. Debinding ........................................................................... 159 4.4. TUBES EXTRUSION ............................................................. 160 4.4.1. Cylinder temperature control ............................................ 160 4.4.2. Die temperature control ..................................................... 164 4.4.3. Piston speed control ............................................................ 166 4.4.4. Ultimate extrusion conditions ............................................ 172 4.5. TUBES DEBINDING AND SINTERING ............................. 175 4.5.1. Thermal debinding and sintering without previous solvent
debinding .............................................................................................. 175 4.5.2. Solvent debinding followed by thermal debinding and
sintering ............................................................................................... 177
4.5.3. Sintered tubes characterization ......................................... 183 4.5.3.1. SEM analysis ...................................................................... 183 4.5.3.2. XRD analysis...................................................................... 184 4.5.3.3. Porosimetry analysis .......................................................... 188 5. CONCLUSIONS ....................................................................... 191 SUGGESTIONS FOR FUTURE WORK ......................................... 195 REFERENCES .................................................................................... 197 ANEXO A – Resumo estendido em português ................................. 205
35
1. INTRODUCTION
Porous materials, more specifically interconnected porous materials, are used in several applications, in particular filtering.
Examples of filtering process are the water purification, oil filtration, aerosols filtration, hot-gas filtration and molten metal filtration (FERNANDO, et al., 2002; FERNANDO, et al., 2005; STUDART, et
al., 2006). Filtration is a very important process for several fields, in particular for the petrochemical, mining and chemical industries (FERNANDO, et al., 2005).
For its application to be successfully attended, a porous material used for filtering must fulfill the following requirements (DUO, et al.,
1999):
i. Presence of an interconnected porous network; ii. Pore size distribution according to the size of the filtered
particulate; iii. Permeability to the filtered fluid; iv. Sufficient mechanical strength to withstand the fluid
pressure drop; v. Thermal resistance to withstand high temperatures, up to
1000 °C, in the case of hot-gas filtration;
vi. Corrosion and oxidation resistance.
On one hand these materials must contain high open porosity, according to the application, on the other hand, high mechanical
strength is also required for the component to withstand the pressure drop imposed by the filtering process.
The introduction of short fibers is an intelligent solution to
improve the mechanical strength, without jeopardizing the permeability of the component. In the search of appropriate materials for the
production of porous components, short fibers were found to be good precursors for membranes used in hot-gas and aerosols filtration (FERNANDO, et al., 2005).
One way to optimize the utilization of fibers is to align them in the direction of the highest tensile strain imposed to the component. It is well known that powder injection molding (PIM) and powder extrusion
have the ability to align short fibers in the direction of the viscous flux of the material (CHAWLA, et al., 2006; YE, et al., 2008). The
36
alignment is parallel in contracting flow and perpendicular in expanding
flow (YE, et al., 2008). The same benefit can be obtained by the powder thermoplastic extrusion.
The fiber alignment achieved by extrusion processes is one of the reasons why this route was chosen to produce short fibers reinforced porous tubes. Furthermore this process shows other important
advantages such as:
i. Fiber length maintenance (fiber breaking occurs only during the mixing step);
ii. Possibility to produce thin wall tubes without shape collapse;
iii. It is a continuous process, which is a very important issue for industry in terms of time and process variability;
iv. Possibility to produce components with a high length/thickness ratio.
In the present work alumina short fibers were added to alumina
powder and a nickel based alloy powder, to produce ceramic matrix composite (CMC) and metal matrix composite (MMC) porous tubes,
respectively. The idea was to validate a process that could suit several different applications in which ceramic or metallic filters are required.
Nextel™
610 alumina fibers were chosen due to purity and
availability at the EMPA laboratory where this project was carried out. Alumina powder was chosen for its well known thermal and chemical stability, adequate for filtering applications (FERNANDO, et al., 2002).
The IN718 nickel superalloy was chosen for its high thermal and corrosion resistance.
37
1.1. OBJECTIVES
1.1.1. General objectives
The aim of this work is to study the feasibility to produce short
fiber reinforced porous CMCs and MMCs tubes, processed via powder thermoplastic extrusion.
1.1.2. Specific objectives
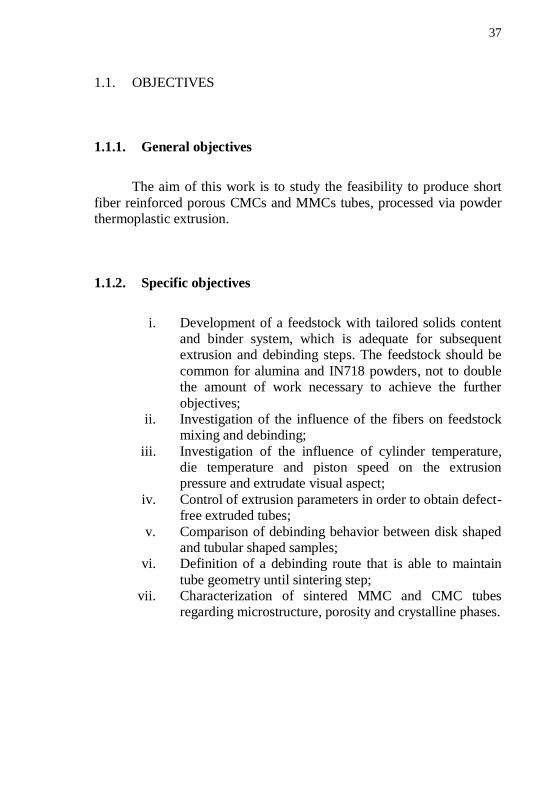
i. Development of a feedstock with tailored solids content and binder system, which is adequate for subsequent extrusion and debinding steps. The feedstock should be
common for alumina and IN718 powders, not to double the amount of work necessary to achieve the further
objectives; ii. Investigation of the influence of the fibers on feedstock
mixing and debinding;
iii. Investigation of the influence of cylinder temperature, die temperature and piston speed on the extrusion pressure and extrudate visual aspect;
iv. Control of extrusion parameters in order to obtain defect-free extruded tubes;
v. Comparison of debinding behavior between disk shaped and tubular shaped samples;
vi. Definition of a debinding route that is able to maintain
tube geometry until sintering step; vii. Characterization of sintered MMC and CMC tubes
regarding microstructure, porosity and crystalline phases.

38
39
2. LITERATURE REVIEW
2.1. COMPOSITES
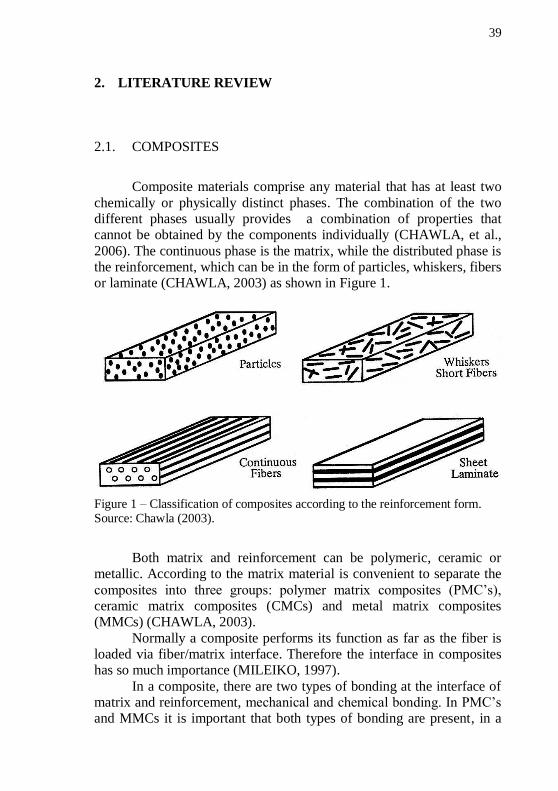
Composite materials comprise any material that has at least two
chemically or physically distinct phases. The combination of the two different phases usually provides a combination of properties that cannot be obtained by the components individually (CHAWLA, et al.,
2006). The continuous phase is the matrix, while the distributed phase is the reinforcement, which can be in the form of particles, whiskers, fibers or laminate (CHAWLA, 2003) as shown in Figure 1.
Figure 1 – Classification of composites according to the reinforcement form. Source: Chawla (2003).
Both matrix and reinforcement can be polymeric, ceramic or metallic. According to the matrix material is convenient to separate the
composites into three groups: polymer matrix composites (PMC’s), ceramic matrix composites (CMCs) and metal matrix composites (MMCs) (CHAWLA, 2003).
Normally a composite performs its function as far as the fiber is loaded via fiber/matrix interface. Therefore the interface in composites has so much importance (MILEIKO, 1997).
In a composite, there are two types of bonding at the interface of matrix and reinforcement, mechanical and chemical bonding. In PMC’s and MMCs it is important that both types of bonding are present, in a
40
way that the load can be transmitted from the weaker matrix to the
typically stiffer reinforcement. Whereas for CMCs mechanical bonding is more desirable than chemical bonding so that a series of fracture
mechanisms such as crack-bridgind, crack deflection, fiber fracture and fiber pull-out can take place. The energy consumed in these fracture mechanisms leads to an enhanced fracture toughness and a non-
catastrophic failure mode (CHAWLA, 2003; CHAWLA, et al., 2006). The main advantage of CMCs and MMCs have in common, in
comparison with PMC’s, are the higher temperature ranges that these
materials can be submitted (CHAWLA, et al., 2006). A metal matrix composite has usually a ductile matrix. The most
efficient fibers are graphite, boron, carbides, and oxides, which are brittle. In the case of ceramic matrix composites, usually both matrix and fibers are brittle (MILEIKO, 1997).
This work relates with short alumina fibers reinforced CMCs and MMCs. The characteristic of such materials will be described in the following sections.
A big variety of processing routes are available to produce CMCs and MMCs such as (CHAWLA, 2003; CHAWLA, et al., 2006;
GERMAN, 1990; SURESH, et al., 1993; CHOU, et al., 1985):
i. Cold pressing and sintering; ii. Hot pressing;
iii. Injection molding; iv. Conventional extrusion; v. Forging;
vi. Rolling; vii. Reaction and diffusion bonding;
viii. Casting or liquid infiltration;
ix. Squeeze casting or pressure infiltration; x. Spray co-deposition
xi. Direct oxidation – Lanxide™ process; xii. In-situ chemical reaction techniques;
xiii. Sol-gel;
xiv. Polymer infiltration and pyrolysis – PIP; xv. Self-propagation high temperature synthesis – SHS;
xvi. Electrophoretic deposition;
xvii. Explosive shock consolidation;
41
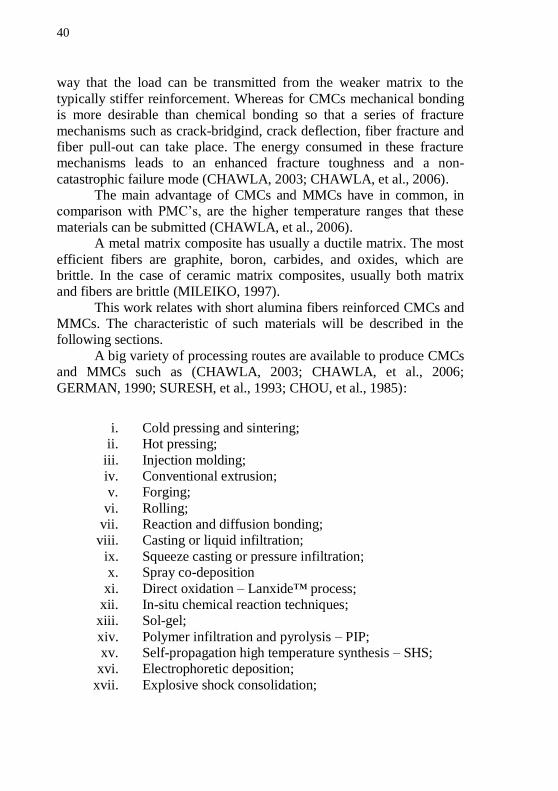
Compared with these processes, thermoplastic powder extrusion
features two main advantages regarding the processing of fibrous composites. First it is a process, like others related feedstock processing
routes, which induces fiber alignment (GERMAN, 1990; SHENOY, 1999; CALOW, et al., 1972). The fiber alignment can be good to tailor properties such as strength and creep resistance in a preferential
direction (CALOW, et al., 1971). Figure 2 shows schematically the concept of fiber alignment obtained with PIM processing.
Figure 2 – Schematic diagram showing fiber alignment due to contracting and
expanding flow during injection or feedstock extrusion process.
Source: German (1990).
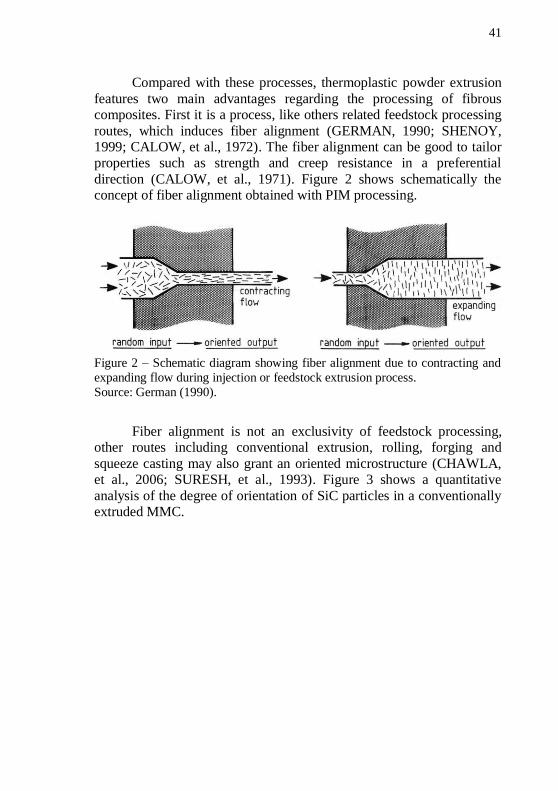
Fiber alignment is not an exclusivity of feedstock processing, other routes including conventional extrusion, rolling, forging and
squeeze casting may also grant an oriented microstructure (CHAWLA, et al., 2006; SURESH, et al., 1993). Figure 3 shows a quantitative
analysis of the degree of orientation of SiC particles in a conventionally extruded MMC.
42
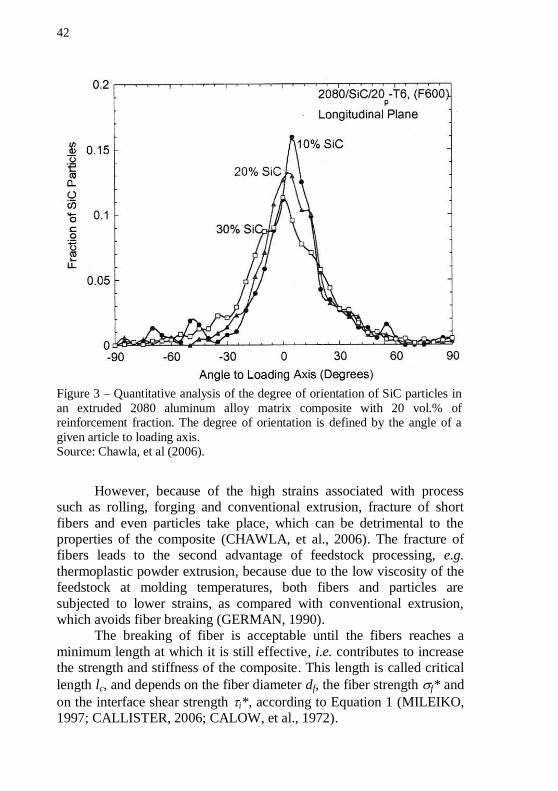
Figure 3 – Quantitative analysis of the degree of orientation of SiC particles in
an extruded 2080 aluminum alloy matrix composite with 20 vol.% of reinforcement fraction. The degree of orientation is defined by the angle of a
given article to loading axis. Source: Chawla, et al (2006).
However, because of the high strains associated with process such as rolling, forging and conventional extrusion, fracture of short
fibers and even particles take place, which can be detrimental to the properties of the composite (CHAWLA, et al., 2006). The fracture of fibers leads to the second advantage of feedstock processing, e.g.
thermoplastic powder extrusion, because due to the low viscosity of the feedstock at molding temperatures, both fibers and particles are
subjected to lower strains, as compared with conventional extrusion, which avoids fiber breaking (GERMAN, 1990).
The breaking of fiber is acceptable until the fibers reaches a
minimum length at which it is still effective, i.e. contributes to increase the strength and stiffness of the composite. This length is called critical
length lc, and depends on the fiber diameter df, the fiber strength f* and
on the interface shear strength i*, according to Equation 1 (MILEIKO, 1997; CALLISTER, 2006; CALOW, et al., 1972).
43
Equation 1
2.1.1. Alumina based fibers as reinforcement
Ceramic fibers are very attractive for reinforcement of both
CMCs and MMCs. They combine high strength, high modulus, chemical resistance, high temperature capabilities, being ideal candidates for high temperature applications (CHAWLA, 2003).
Due to the small cross section and large aspect ratio, ceramic fibers have two very important features: their high degree of flexibility and higher strength than the bulk material of the same composition
(CHAWLA, 2003; CHAWLA, et al., 2006). A big problem of high temperature applications is the oxidation
when the material is exposed to oxidizing atmosphere (LEV, et al., 1995). Carbon fibers oxidizes easily at temperatures above 400 °C. Silicon carbide (SiC) fibers are also prone to oxidation at temperatures
higher than 1200 °C (CHAWLA, 2003). A solution to the oxidation problem demands the use of oxide fibers (LEV, et al., 1995). Oxide fibers are available since 1970s and have been thoroughly investigated
(CHAWLA, 2003). Among the oxides, alumina is one of the most stable in a variety
of environments, although its melting point, 2050 °C, is not one of the
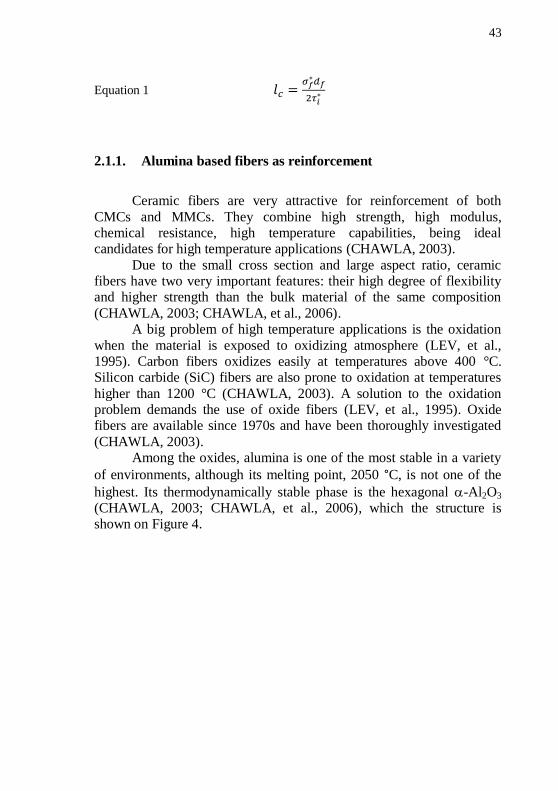
highest. Its thermodynamically stable phase is the hexagonal -Al2O3 (CHAWLA, 2003; CHAWLA, et al., 2006), which the structure is shown on Figure 4.
44
Figure 4 – Hexagonal close-packed
structure of -alumina. Source: Chawla (2003).
Since decades many companies produce in high scale
polycrystalline alumina fibers, being the fibers produced by Du Pont,
Sumitomo Chemical Co., and 3M Co. (formerly known as Minnesota Mining and Manufacturing Co.) among the most commercialized (CHAWLA, 2003).
The highest performance fibers that are now available in adequate quantities and at reasonable cost are fine-grained high-purity alumina
(Nextel™ 610) and alumina/mullite (Nextel™ 720) fibers produced by the 3M Co. The Nextel™ 610 has the highest strength (~3.3 GPa) and higher corrosion resistance, while the Nextel™ 720 shows better creep
resistance, being stable at higher temperatures, 1200 °C for Nextel™ 720 against 1100 °C for The Nextel™ 610 (MARSHALL, et al., 2001).
Table 1 shows the data of some of the commercially available
alumina fibers.
45
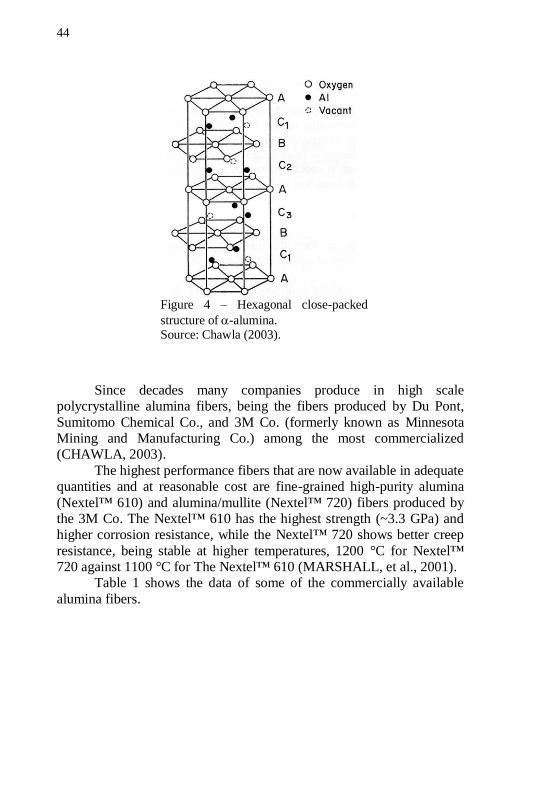
Table 1 – Data of some commercial alumina fibers. Some may be no longer available.
Comercial
Name
Composition
(wt.%)
Diameter
(m)
Density
(g/cm3)
Tensile
Strength
(GPa)
Young’s
Modulus
(GPa)
FP >99 Al2O3 20 3.9 1.4 380
PRD-166 80 Al2O3
20 ZrO2 18 4.2 1.9 344
Nextel 312
62.5 Al2O3 24.5 SiO2
13 B2O3
10 – 12 2.7 1.7 150
Nextel 440
70 Al2O3 28 SiO2
2 B2O3
10 – 12 3.05 2.0 190
Nextel
480*
70 Al2O3 28 SiO2
2 B2O3
10 – 12 3.05 2.3 224
Nextel 550 73 Al2O3
27 SiO2 10 – 12 3.03 2.0 193
Nextel 610 >99 Al2O3 10 – 12 3.9 3.1 370
Nextel
650*
89 Al2O3
10 ZrO2
1 Y2O3
10 – 12 4.10 2.55 358
Nextel 720 85 Al2O3
15 SiO2 10 - 12 3.40 2.1 260
Saffil 96 Al2O3
4 SiO2 3 2.3 1.0 100
Saphikon
Single Crystal 100
Al2O3
70 – 250 3.8 3.1 380
Sumitomo 85 Al2O3
15 SiO2 9 3.2 2.6 250
Almax >99.5 Al2O3 10 3.6 1.8 320
* No longer available
Source: Chawla (2003); Mileiko (1997); Bansal (2005); Dhingra (1980).
Nextel fibers are polycrystalline which gives them isotropic properties, e.g. isotropic thermal expansion, what can make easier to

46
avoid thermal expansion mismatch between matrix and fibers
(CHAWLA, 2003). Sintering of alumina fibers should not exceed 1300 °C. Above
this temperature the properties of the fibers reduces due to degradation (LEE, et al., 2003).
2.1.2. Metal matrix composites
Metal matrix composites development has been impelled by some advantages with respect to unreinforced metals. Comparing with the analog unreinforced metal, MMCs may enhance the following
properties (CHAWLA, et al., 2006; SURESH, et al., 1993):
i. Specific strength;
ii. Specific modulus; iii. Dimensional stability; iv. Reduced coefficient of thermal expansion;
v. Creep resistance; vi. Fatigue resistance;
vii. Wear resistance;
viii. Isotropy.
When compared with CMCs, metal matrix composites have as
advantage higher thermal, electrical conductivity and fracture toughness (SURESH, et al., 1993; CHAWLA, 2003).
Examples of metals commonly used as the matrix on composites
are: aluminum and aluminum alloys, titanium alloys, magnesium and magnesium alloys, cobalt, iron and iron alloys, copper, silver, nickel and nickel alloys, including nickel superalloys, niobium, and intermetallics
1
(CHAWLA, et al., 2006; SURESH, et al., 1993). For high temperature applications the matrix systems are mainly
nickel-, niobium-, and cobalt-based alloys, as well as intermetallics. The
MMCs with these matrix systems are developed for applications at temperatures over 800 °C (SURESH, et al., 1993).
1 The chemical bond in intermetallics is actually not metallic, but ionic or covalent in nature.
Intermetallics are formed when two dissimilar metals are combined following chemical
valence rules, i.e. ionic or covalent rules (CHAWLA, et al., 2006).
47
The two main routes to produce MMCs are via liquid state
processing and solid state processing. The advantages of the solid state processing, which is mostly based on powder metallurgy techniques, is
the control of reinforcement distribution, uniformity of matrix microstructure, and lower degree of interfacial reaction between matrix and reinforcement which can be detrimental to the reinforcement
(CHAWLA, et al., 2006). Increasingly MMCs are used in several areas including
aerospace, automotive and railway industries; electronics; thermal
management; filamentary superconducting magnets; power transmission; sporting goods; and wear-resistant materials (CHAWLA,
et al., 2006; SURESH, et al., 1993).
2.1.2.1. Alumina fibers reinforced nickel based composites
The study and development of alumina reinforced nickel based
composites was driven the high temperature and oxidation resistance of nickel alloys and the availability of alumina whiskers. A promising application for such composites was high temperature turbine blades.
However problems with thermal expansion compatibility (see Table 2), whiskers degradation and weak interface bond made retarded the
development of these composites (CALOW, et al., 1972; CALOW, et al., 1971; MILEIKO, 1997; MILEIKO, et al., 2004).
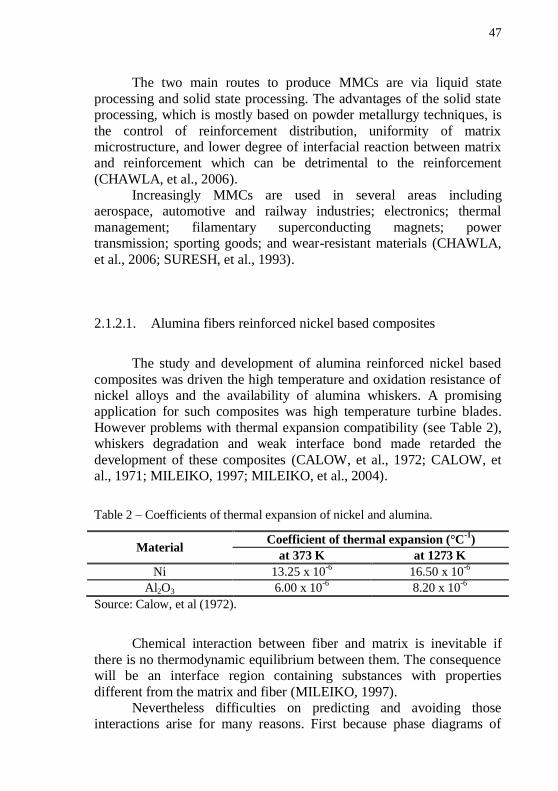
Table 2 – Coefficients of thermal expansion of nickel and alumina.
Material Coefficient of thermal expansion (°C
-1)
at 373 K at 1273 K
Ni 13.25 x 10⁻⁶ 16.50 x 10
-6
Al2O3 6.00 x 10⁻⁶
8.20 x 10⁻⁶
Source: Calow, et al (1972).
Chemical interaction between fiber and matrix is inevitable if
there is no thermodynamic equilibrium between them. The consequence will be an interface region containing substances with properties
different from the matrix and fiber (MILEIKO, 1997). Nevertheless difficulties on predicting and avoiding those
interactions arise for many reasons. First because phase diagrams of
48
complex systems elements used in MMCs are unknown. Secondly the
kinetics cannot be described without experiments. Thirdly the influence of the interface on the properties of the composite can be varied and
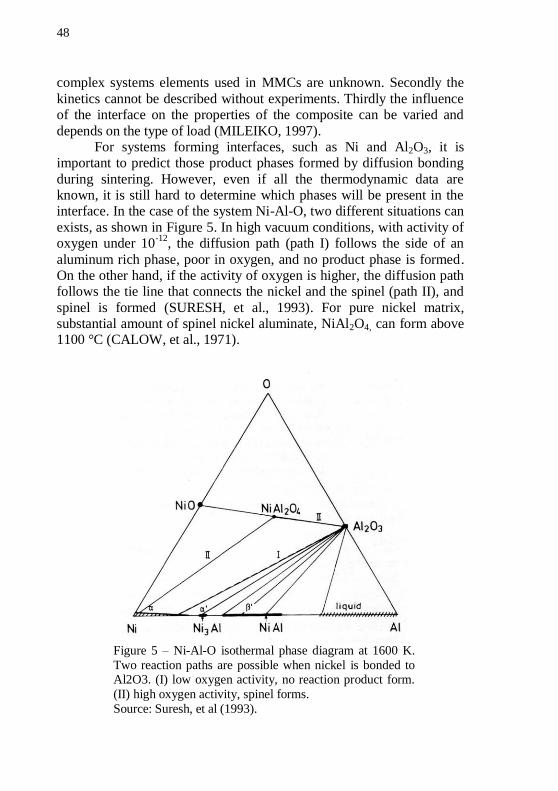
depends on the type of load (MILEIKO, 1997). For systems forming interfaces, such as Ni and Al2O3, it is
important to predict those product phases formed by diffusion bonding
during sintering. However, even if all the thermodynamic data are known, it is still hard to determine which phases will be present in the interface. In the case of the system Ni-Al-O, two different situations can
exists, as shown in Figure 5. In high vacuum conditions, with activity of oxygen under 10
-12, the diffusion path (path I) follows the side of an
aluminum rich phase, poor in oxygen, and no product phase is formed. On the other hand, if the activity of oxygen is higher, the diffusion path follows the tie line that connects the nickel and the spinel (path II), and
spinel is formed (SURESH, et al., 1993). For pure nickel matrix, substantial amount of spinel nickel aluminate, NiAl2O4, can form above 1100 °C (CALOW, et al., 1971).
Figure 5 – Ni-Al-O isothermal phase diagram at 1600 K.
Two reaction paths are possible when nickel is bonded to Al2O3. (I) low oxygen activity, no reaction product form.
(II) high oxygen activity, spinel forms.
Source: Suresh, et al (1993).
49
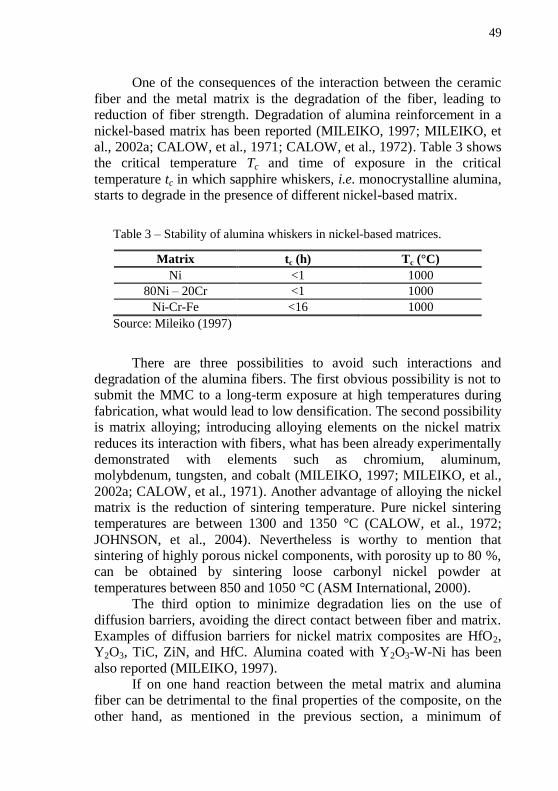
One of the consequences of the interaction between the ceramic
fiber and the metal matrix is the degradation of the fiber, leading to reduction of fiber strength. Degradation of alumina reinforcement in a
nickel-based matrix has been reported (MILEIKO, 1997; MILEIKO, et al., 2002a; CALOW, et al., 1971; CALOW, et al., 1972). Table 3 shows the critical temperature Tc and time of exposure in the critical
temperature tc in which sapphire whiskers, i.e. monocrystalline alumina, starts to degrade in the presence of different nickel-based matrix.
Table 3 – Stability of alumina whiskers in nickel-based matrices.
Matrix tc (h) Tc (°C)
Ni <1 1000
80Ni – 20Cr <1 1000
Ni-Cr-Fe <16 1000
Source: Mileiko (1997)
There are three possibilities to avoid such interactions and degradation of the alumina fibers. The first obvious possibility is not to submit the MMC to a long-term exposure at high temperatures during
fabrication, what would lead to low densification. The second possibility is matrix alloying; introducing alloying elements on the nickel matrix
reduces its interaction with fibers, what has been already experimentally demonstrated with elements such as chromium, aluminum, molybdenum, tungsten, and cobalt (MILEIKO, 1997; MILEIKO, et al.,
2002a; CALOW, et al., 1971). Another advantage of alloying the nickel matrix is the reduction of sintering temperature. Pure nickel sintering temperatures are between 1300 and 1350 °C (CALOW, et al., 1972;
JOHNSON, et al., 2004). Nevertheless is worthy to mention that sintering of highly porous nickel components, with porosity up to 80 %, can be obtained by sintering loose carbonyl nickel powder at
temperatures between 850 and 1050 °C (ASM International, 2000). The third option to minimize degradation lies on the use of
diffusion barriers, avoiding the direct contact between fiber and matrix. Examples of diffusion barriers for nickel matrix composites are HfO2, Y2O3, TiC, ZiN, and HfC. Alumina coated with Y2O3-W-Ni has been
also reported (MILEIKO, 1997). If on one hand reaction between the metal matrix and alumina
fiber can be detrimental to the final properties of the composite, on the
other hand, as mentioned in the previous section, a minimum of
50
chemical interaction is required for MMCs to guarantee a proper load
transfer from matrix to the fibers. Following this approach the formation of a complex oxide AlxMyOz at the interface, where M is an alloying
element of the nickel matrix, might be also desirable (MILEIKO, et al., 2002a). Some alloying elements, e.g. chromium, improve the bond strength without though causing chemical reaction (CALOW, et al.,
1971). Tests has shown that nickel alloys reinforced with different
alumina based fibers have higher creep resistance than any available
non-reinforced nickel superalloys (MILEIKO, et al., 2002b; MILEIKO, et al., 2004). The potential for such composites is the use at
temperatures up to 1200 °C (MILEIKO, 2002).
2.1.2.2. Nickel superalloys
As mentioned in the previous section, alloying the nickel matrix
is one of the possible approaches to minimize fiber-matrix detrimental interactions (MILEIKO, 1997). Nickel based superalloys are well known for its high temperature strength and resistance. However, nickel
based superalloys limiting temperature is below 1100 °C. The only way to enhance the use temperature of such alloys is reinforcing them with
creep-resistant ceramic fibers (MILEIKO, et al., 2002a; MILEIKO, et al., 2002b).
Superalloys are the class of heat-resisting alloys based on nickel,
nickel-iron, or cobalt. These alloys exhibit a combination of strength and corrosion resistance at elevated and cryogenic temperatures, what make them useful for many applications in the aerospace, automotive,
medical, chemical and petrochemical industries (JOHNSON, et al., 2004).
Their high strength and toughness make them difficult to shape
via machining and forging. For this reason powder metallurgy techniques, including powder injection molding, are alternative routes
that have been used to process these materials (JOHNSON, et al., 2004). Among the superalloys that have been processed via powder
injection molding, IN718 nickel superalloy has been the most
extensively studied. This alloy is usually sintered at temperatures between 1250 and 1275 °C to densities close to 100% (ASM International, 2000; JOHNSON, et al., 2004; VALENCIA, et al., 1997;
51
BOSE, et al., 1997; VALENCIA, et al., 1994; HAJMRLE, et al., 1980).
The alloy IN625 is another alloy that can be processed by powder injection molding; however this alloy requires higher sintering
temperatures, above 1290 °C to achieve full density (JOHNSON, et al., 2004).
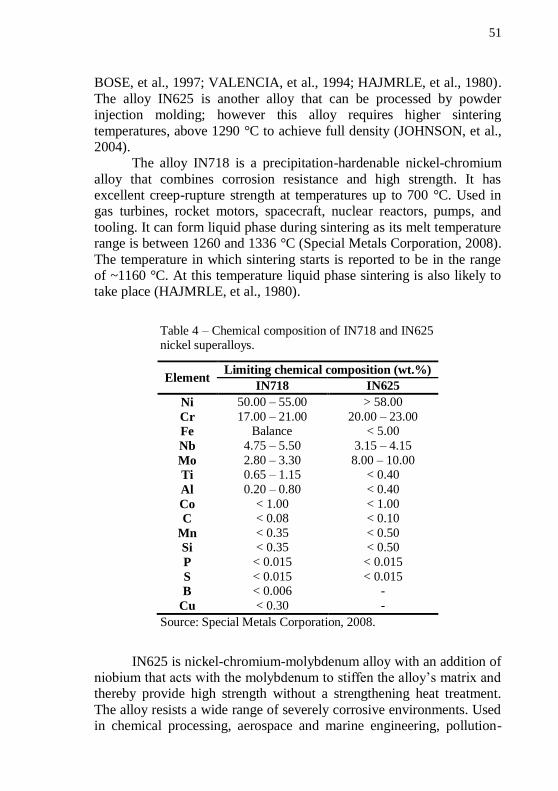
The alloy IN718 is a precipitation-hardenable nickel-chromium
alloy that combines corrosion resistance and high strength. It has excellent creep-rupture strength at temperatures up to 700 °C. Used in gas turbines, rocket motors, spacecraft, nuclear reactors, pumps, and
tooling. It can form liquid phase during sintering as its melt temperature range is between 1260 and 1336 °C (Special Metals Corporation, 2008).
The temperature in which sintering starts is reported to be in the range of ~1160 °C. At this temperature liquid phase sintering is also likely to take place (HAJMRLE, et al., 1980).
Table 4 – Chemical composition of IN718 and IN625 nickel superalloys.
Element Limiting chemical composition (wt.%)
IN718 IN625
Ni 50.00 – 55.00 > 58.00
Cr 17.00 – 21.00 20.00 – 23.00
Fe Balance < 5.00
Nb 4.75 – 5.50 3.15 – 4.15
Mo 2.80 – 3.30 8.00 – 10.00
Ti 0.65 – 1.15 < 0.40
Al 0.20 – 0.80 < 0.40
Co < 1.00 < 1.00
C < 0.08 < 0.10
Mn < 0.35 < 0.50
Si < 0.35 < 0.50
P < 0.015 < 0.015
S < 0.015 < 0.015
B < 0.006 -
Cu < 0.30 -
Source: Special Metals Corporation, 2008.
IN625 is nickel-chromium-molybdenum alloy with an addition of niobium that acts with the molybdenum to stiffen the alloy’s matrix and thereby provide high strength without a strengthening heat treatment.
The alloy resists a wide range of severely corrosive environments. Used in chemical processing, aerospace and marine engineering, pollution-
52
control equipment, and nuclear reactors. Its melting point range is 1290
to 1350 °C (Special Metals Corporation, 2008). The composition of IN718 and IN625 superalloys are given on
Table 4.
2.1.3. Ceramic matrix composites
Although high performance ceramics have high strength, high
hardness, excellent high temperature capabilities, chemical inertness, high wear resistance and all allied to low density; these materials have an inherent brittleness, i.e. low fracture toughness, being prone to
catastrophic failure under mechanical or thermal stresses in the presence of crack-like defects (CHAWLA, 2003). Increase thermal shock
resistance and toughness of these materials, making them damage tolerant by introducing reinforcement fibers is the main purpose of the productions of CMCs (CHAWLA, 2003; CINIBULK, et al., 2004;
HACKEMANN, et al., 2010). The fiber reinforced CMCs may also show higher tensile strength, stiffness and creep than the monolithic ceramics (CINIBULK, et al., 2004; HACKEMANN, et al., 2010).
For the selection of the matrix and fibers for a specific application, the following properties should be considered (CHAWLA,
2003):
i. Melting temperature; ii. Volatility;
iii. Density; iv. Elastic modulus; v. Thermal expansion coefficient;
vi. Creep characteristics; vii. Strength
viii. Fracture toughness;
ix. Chemical and thermal compatibility between fiber and matrix.
Some of the items above are discussed in the following section, justifying the selection of the alumina-alumina CMCs used in the present work.
53
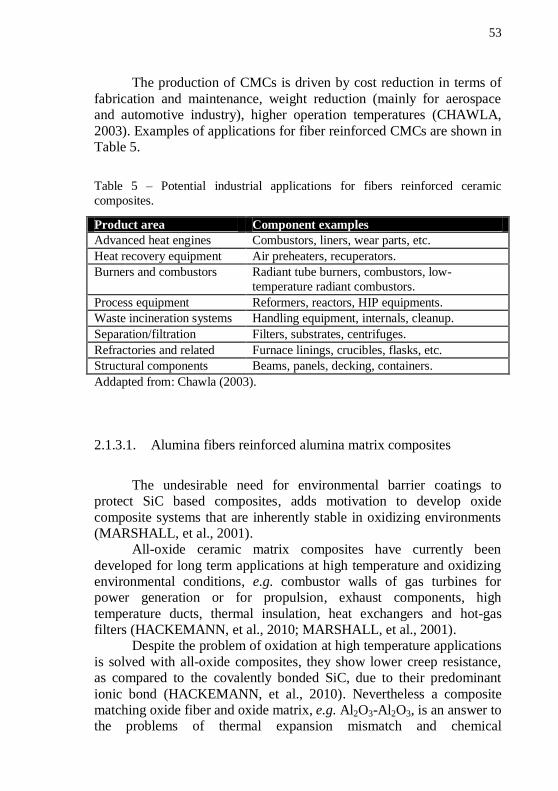
The production of CMCs is driven by cost reduction in terms of
fabrication and maintenance, weight reduction (mainly for aerospace and automotive industry), higher operation temperatures (CHAWLA,
2003). Examples of applications for fiber reinforced CMCs are shown in Table 5.
Table 5 – Potential industrial applications for fibers reinforced ceramic
composites.
Product area Component examples
Advanced heat engines Combustors, liners, wear parts, etc.
Heat recovery equipment Air preheaters, recuperators.
Burners and combustors Radiant tube burners, combustors, low-
temperature radiant combustors.
Process equipment Reformers, reactors, HIP equipments.
Waste incineration systems Handling equipment, internals, cleanup.
Separation/filtration Filters, substrates, centrifuges.
Refractories and related Furnace linings, crucibles, flasks, etc.
Structural components Beams, panels, decking, containers.
Addapted from: Chawla (2003).
2.1.3.1. Alumina fibers reinforced alumina matrix composites
The undesirable need for environmental barrier coatings to protect SiC based composites, adds motivation to develop oxide
composite systems that are inherently stable in oxidizing environments (MARSHALL, et al., 2001).
All-oxide ceramic matrix composites have currently been
developed for long term applications at high temperature and oxidizing environmental conditions, e.g. combustor walls of gas turbines for power generation or for propulsion, exhaust components, high
temperature ducts, thermal insulation, heat exchangers and hot-gas filters (HACKEMANN, et al., 2010; MARSHALL, et al., 2001).
Despite the problem of oxidation at high temperature applications
is solved with all-oxide composites, they show lower creep resistance, as compared to the covalently bonded SiC, due to their predominant
ionic bond (HACKEMANN, et al., 2010). Nevertheless a composite matching oxide fiber and oxide matrix, e.g. Al2O3-Al2O3, is an answer to the problems of thermal expansion mismatch and chemical
54
compatibility between the elements of the composite (LEV, et al.,
1995). Alumina fiber reinforced alumina matrix composites should be
sintered at temperatures below 1300 °C. Composites sintered above this temperature tend to fracture in a completely brittle mode due to fiber degradation. For non coated fiber, like Nextel™ 610, the optimum
sintering temperature is 1200 °C, however pressure should be simultaneously applied to achieve high densities (LEE, et al., 2003).
2.2. POROUS MATERIALS
Porous materials are any solid material which contains cavities,
channels or interstices. Most of the materials are porous to some extend and it is actually difficult to find or either prepare a real non-porous material, i.e. with null porosity. The degree of porosity influences
directly on physical properties of the materials and its control is of great industrial importance. Porosity also affects the chemical reactivity of solids and the physical interaction of solids with gases and liquids
(ROUQUEROL, et al., 1994). Pores can be classified according to size, shape and availability to
an external fluid. According to IUPAC, the classification of pore size is made as follows (STUDART, et al., 2006; ROUQUEROL, et al., 1994):
i. Microporosity – pores width smaller than 2 nm;
ii. Mesoporosity – pores width between 2 and 50 nm; iii. Macroporosity – pores width larger than 50 nm.
According to the availability to an external fluid, pores can be
categorized into two main groups: closed and open pores. Closed pores are totally isolated from their neighbors. This type of pores is represented by the pore (a) in Figure 6. Open pores are those which have
a continuous channel of communication with the external surface of the body, like pores (b), (c), (d), (e) and (f) in Figure 6. Yet, open pores can
be sub-classified into through pores, like (c), (d) and (e), which are those open at two or more ends; or sub-classified as blind pores, like (b) and (f), open in only one extremity (ROUQUEROL, et al., 1994).
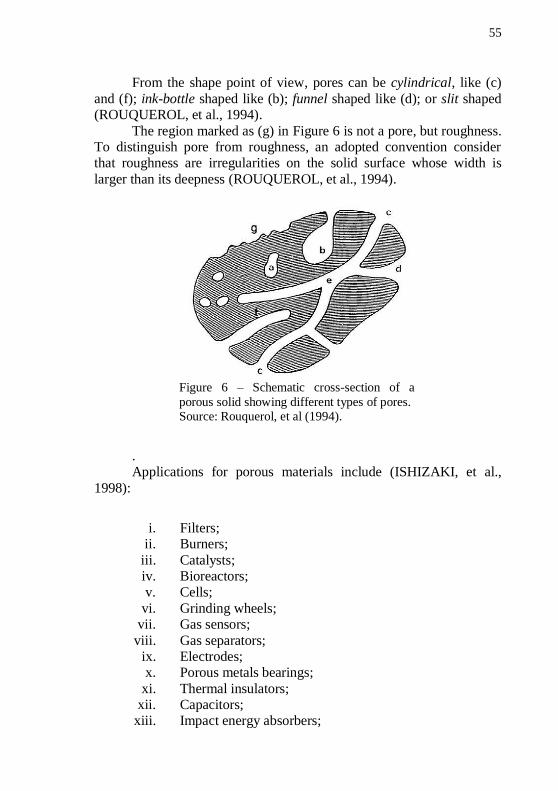
55
From the shape point of view, pores can be cylindrical, like (c)
and (f); ink-bottle shaped like (b); funnel shaped like (d); or slit shaped (ROUQUEROL, et al., 1994).
The region marked as (g) in Figure 6 is not a pore, but roughness. To distinguish pore from roughness, an adopted convention consider that roughness are irregularities on the solid surface whose width is
larger than its deepness (ROUQUEROL, et al., 1994).
Figure 6 – Schematic cross-section of a
porous solid showing different types of pores. Source: Rouquerol, et al (1994).
. Applications for porous materials include (ISHIZAKI, et al.,
1998):
i. Filters; ii. Burners;
iii. Catalysts; iv. Bioreactors; v. Cells;
vi. Grinding wheels; vii. Gas sensors;
viii. Gas separators; ix. Electrodes; x. Porous metals bearings;
xi. Thermal insulators; xii. Capacitors;
xiii. Impact energy absorbers;
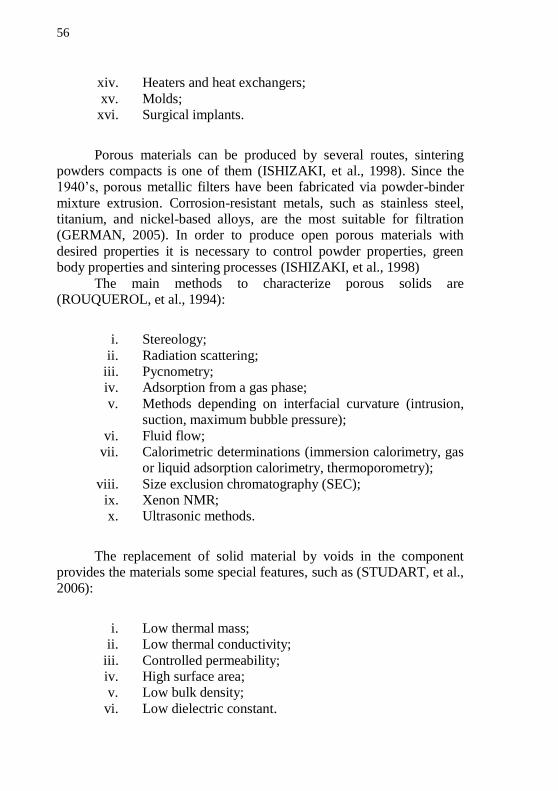
56
xiv. Heaters and heat exchangers;
xv. Molds; xvi. Surgical implants.
Porous materials can be produced by several routes, sintering powders compacts is one of them (ISHIZAKI, et al., 1998). Since the 1940’s, porous metallic filters have been fabricated via powder-binder
mixture extrusion. Corrosion-resistant metals, such as stainless steel, titanium, and nickel-based alloys, are the most suitable for filtration (GERMAN, 2005). In order to produce open porous materials with
desired properties it is necessary to control powder properties, green body properties and sintering processes (ISHIZAKI, et al., 1998)
The main methods to characterize porous solids are (ROUQUEROL, et al., 1994):
i. Stereology;
ii. Radiation scattering; iii. Pycnometry; iv. Adsorption from a gas phase;
v. Methods depending on interfacial curvature (intrusion, suction, maximum bubble pressure);
vi. Fluid flow; vii. Calorimetric determinations (immersion calorimetry, gas
or liquid adsorption calorimetry, thermoporometry);
viii. Size exclusion chromatography (SEC); ix. Xenon NMR; x. Ultrasonic methods.
The replacement of solid material by voids in the component provides the materials some special features, such as (STUDART, et al., 2006):
i. Low thermal mass; ii. Low thermal conductivity;
iii. Controlled permeability; iv. High surface area; v. Low bulk density;
vi. Low dielectric constant.
57
These properties can be tailored by changing type of porosity, i.e.
open or close, pore mean size, pore size distribution, and pore morphology. All this microstructural aspects are highly influenced by
the processing route used to produce a porous material (STUDART, et al., 2006).
Macroporous materials with open porosity can be made from
particles or discontinuous fibers by partially sintering previous porous compacts, or by sintering powder mixtures that undergo reactions that lead to pore formation (FERNANDO, et al., 2005; INNOCENTINI, et
al., 2009; STUDART, et al., 2006). These macroporous materials generally have porosity between 20 and 97% with pore size ranging
from 400 nm to 4 mm (STUDART, et al., 2006). Applications for macroporous ceramic materials are: hot-gas
filtration, molten metal filtration, diffusion, dispersion rolls, ink pads for
fingerprinting, high temperature thermal insulators, burners and numerous others (FERNANDO, et al., 2005; PRABHAKARAN, et al., 2005; STUDART, et al., 2006). Some of these components are made of
ceramic materials or high temperature metal alloys (WOOD, et al., 2008), e.g. refractory metals and superalloys.
2.2.1. Hot-gas filters
Hot-gas filters are porous, closed-end tubes used to remove fine particles in a variety of operations (CHAWLA, 2003). Advanced power
systems, such as the integrated gasification combined cycle (IGCC) and pressurized fluidized-bed combustion (PFBC), requiring gas turbines, are technologies to produce electricity and steam from coal and other
hydrocarbon fuels with high efficiency and reduced emissions of sulfur dioxide and other pollutants. Removal of particulate and other emissions is required for these processes to protect the gas turbines against erosion
and corrosion. To maintain a high thermal efficiency, the gas cleaning should be done without a previous cooling of the gases. Filtration then
should be carried at over 350 °C for IGCC and 750 °C for PFBC. Moreover the filters must withstands backpressure pulses used on filter cleaning, i.e. removal of filter cake from the filters (DUO, et al., 1999;
CHAWLA, 2003; INNOCENTINI, et al., 2009). Other applications for hot-gas filters are coal gasification,
incineration, catalytic recovery, catalytic processing, chemical and
58
petrochemical processing (FERNANDO, et al., 2002; CHAWLA,
2003). After rapid development over the past decade, ceramic barrier
filters have emerged as the most promising choice for hot-gas cleaning because of their high corrosion resistance and their ability to withstand high temperatures up to 1000 °C (DUO, et al., 1999).
Membranes with pore size ranging from 0.1 to 50 m and porosity above about 40% are adequate for use in hot-gas filtration (FERNANDO, et al., 2005). Other requirements for hot-gas filters are:
(DUO, et al., 1999; CHAWLA, 2003; FERNANDO, et al., 2002; INNOCENTINI, et al., 2009)
i. Long-term durability; ii. High temperature capabilities;
iii. Alkali corrosion resistance;
iv. Cleanability; v. Thermal shock resistance;
vi. Impermeability to particulates to be filtered;
vii. Optimized permeability to the gas; viii. Lightweight;
ix. High toughness.
Figure 7 – Scanning electron microscope image of an
alumina fiber filter membrane.
Source: Fernando, et al (2002)
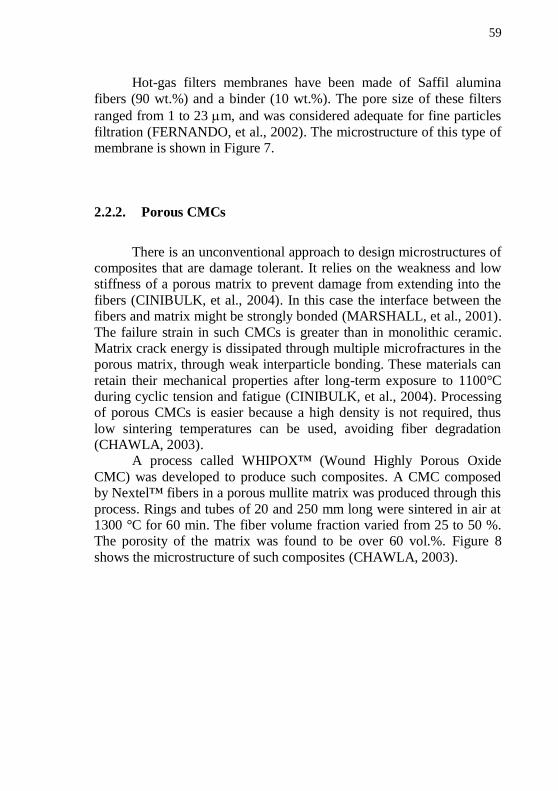
59
Hot-gas filters membranes have been made of Saffil alumina
fibers (90 wt.%) and a binder (10 wt.%). The pore size of these filters
ranged from 1 to 23 m, and was considered adequate for fine particles
filtration (FERNANDO, et al., 2002). The microstructure of this type of membrane is shown in Figure 7.
2.2.2. Porous CMCs
There is an unconventional approach to design microstructures of composites that are damage tolerant. It relies on the weakness and low stiffness of a porous matrix to prevent damage from extending into the
fibers (CINIBULK, et al., 2004). In this case the interface between the fibers and matrix might be strongly bonded (MARSHALL, et al., 2001).
The failure strain in such CMCs is greater than in monolithic ceramic. Matrix crack energy is dissipated through multiple microfractures in the porous matrix, through weak interparticle bonding. These materials can
retain their mechanical properties after long-term exposure to 1100°C during cyclic tension and fatigue (CINIBULK, et al., 2004). Processing of porous CMCs is easier because a high density is not required, thus
low sintering temperatures can be used, avoiding fiber degradation (CHAWLA, 2003).
A process called WHIPOX™ (Wound Highly Porous Oxide
CMC) was developed to produce such composites. A CMC composed by Nextel™ fibers in a porous mullite matrix was produced through this
process. Rings and tubes of 20 and 250 mm long were sintered in air at 1300 °C for 60 min. The fiber volume fraction varied from 25 to 50 %. The porosity of the matrix was found to be over 60 vol.%. Figure 8
shows the microstructure of such composites (CHAWLA, 2003).
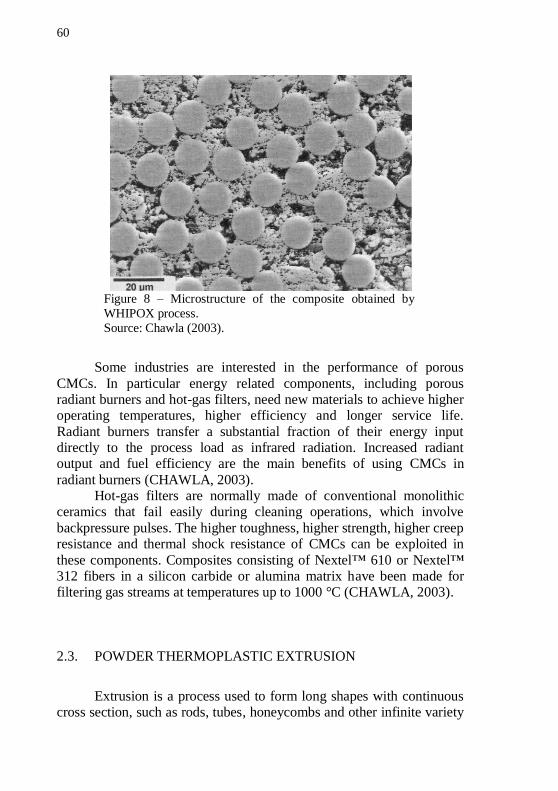
60
Figure 8 – Microstructure of the composite obtained by
WHIPOX process.
Source: Chawla (2003).
Some industries are interested in the performance of porous
CMCs. In particular energy related components, including porous radiant burners and hot-gas filters, need new materials to achieve higher operating temperatures, higher efficiency and longer service life.
Radiant burners transfer a substantial fraction of their energy input directly to the process load as infrared radiation. Increased radiant output and fuel efficiency are the main benefits of using CMCs in
radiant burners (CHAWLA, 2003). Hot-gas filters are normally made of conventional monolithic
ceramics that fail easily during cleaning operations, which involve
backpressure pulses. The higher toughness, higher strength, higher creep resistance and thermal shock resistance of CMCs can be exploited in
these components. Composites consisting of Nextel™ 610 or Nextel™ 312 fibers in a silicon carbide or alumina matrix have been made for filtering gas streams at temperatures up to 1000 °C (CHAWLA, 2003).
2.3. POWDER THERMOPLASTIC EXTRUSION
Extrusion is a process used to form long shapes with continuous cross section, such as rods, tubes, honeycombs and other infinite variety
61
of profiles. In the industry, extrusion is a common process used in the
fields of metallurgy, ceramics, polymers and foodstuffs (RAUWENDAAL, 1986).
Powder thermoplastic extrusion is the molding process of particulate materials, in which a feedstock, i.e. powder-binder mixture, is forced through a die, where the compact extruded acquires the shape
of the die channel (GERMAN, 2005). After molding a debinding step is necessary to remove the
binders and finally the component is sintered (GERMAN, 2005).
2.3.1. Basics concepts on particulate materials processing
The processing of materials through powder, commonly known
as particulate materials processing (PMP), is an attractive technology due to its replication capabilities and the viability to tailor the product application through the selective placement of phases or pores.
Moreover PMP is in many cases the most competitive available technology that allows the production of materials such as composites, high-temperature ceramics, certain polymers, copper steels, refractory
metals, intermetallics and cermets (GERMAN, 2005). These materials couldn’t be processed in an economically viable way through
conventional routes such as casting, and in many cases no other route is available.
The porosity control makes PMP an useful technology to produce
components for filtration, lubrication and energy dissipation (GERMAN, 2005).
Particulate material processing consist basically on conforming or
molding a chosen powder into a desired shape, and through a heat treatment called sintering, bond the particles together, making the initial individual particles become a solid body (GERMAN, 2005).
Two are the major routes to form a green body, compaction or shaping. The green body is the name given to the compact before
sintering, it consist of powder and usually additives, that are added to improve conformability and/or help the compact retain its shape and improve mechanical strength during manufacturing steps that take place
before sintering (GERMAN, 2005). Compaction is applied for granulates and powders with low
amount of additives, whereas shaping is applied for plastic consistence
62
feeds and slurries containing high amount of additives (GERMAN,
2005). Compaction technologies can be divided into die compaction,
cold isostatic compaction2, hot pressing and rolling pressing. Examples
of shaping technologies are injection molding, plastic extrusion, thermoplastic extrusion, rolling, thermosetting and thermoplastic
pressing, porcelain pressing and slurry techniques3 (REED, 1995;
GERMAN, 2005).
2.3.2. Powders
Powder processing technologies deal generally with particles in the range from some dozen nanometers to hundreds of microns. The
main aspects of the powders to be characterized are (GERMAN, 2005):
i. Particle size and particle size distribution (PSD); ii. Particle shape;
iii. Particle agglomeration; iv. Surface area; v. Interparticle friction;
vi. Flow and packing; vii. Internal structure;
viii. Composition, homogeneity and contamination.
These characteristics are imposed by the material and especially by the powder synthesis and fabrication technique.
The shape of the particles is a very important factor on the processing and affects directly the packing, flow and compressibility (GERMAN, 2005). Figure 9 gives a collection of possible particles
shapes. The most appropriate way to characterize the particle shape is through scanning electron microscopy (SEM). Light scattering particle
2 Also known as cold isostatic pressing, CIP. A variant of CIP is hot isostatic pressing, HIP, in
which a previously sintered body is subjected to a pressurized hot-gas (REED, 1995). HIP is
considered an enhanced sintering process rather than an compaction process. 3 Slurry techniques comprise: Slip casting, tape casting, pressure casting, slurry pressing,
vacuum casting, centrifugal casting, gel casting, casting concrete and others.
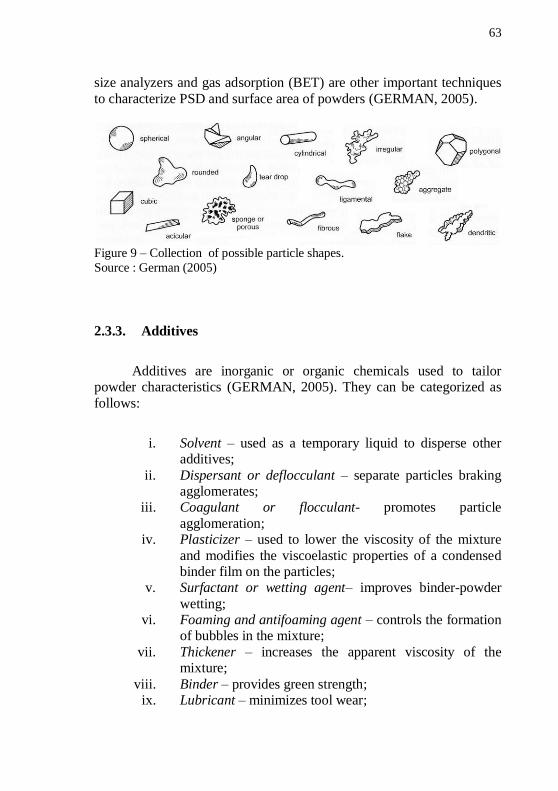
63
size analyzers and gas adsorption (BET) are other important techniques
to characterize PSD and surface area of powders (GERMAN, 2005).
Figure 9 – Collection of possible particle shapes.
Source : German (2005)
2.3.3. Additives
Additives are inorganic or organic chemicals used to tailor powder characteristics (GERMAN, 2005). They can be categorized as
follows:
i. Solvent – used as a temporary liquid to disperse other additives;
ii. Dispersant or deflocculant – separate particles braking agglomerates;
iii. Coagulant or flocculant- promotes particle
agglomeration; iv. Plasticizer – used to lower the viscosity of the mixture
and modifies the viscoelastic properties of a condensed binder film on the particles;
v. Surfactant or wetting agent– improves binder-powder
wetting; vi. Foaming and antifoaming agent – controls the formation
of bubbles in the mixture;
vii. Thickener – increases the apparent viscosity of the mixture;
viii. Binder – provides green strength; ix. Lubricant – minimizes tool wear;
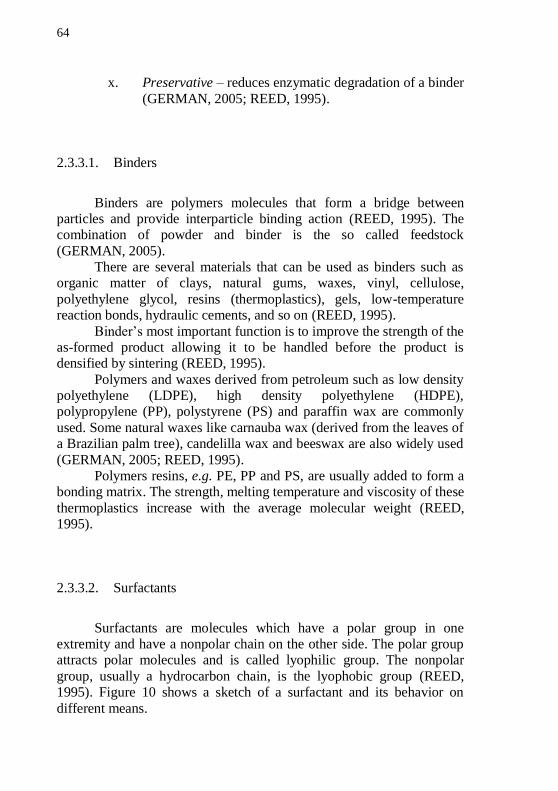
64
x. Preservative – reduces enzymatic degradation of a binder
(GERMAN, 2005; REED, 1995).
2.3.3.1. Binders
Binders are polymers molecules that form a bridge between particles and provide interparticle binding action (REED, 1995). The combination of powder and binder is the so called feedstock
(GERMAN, 2005). There are several materials that can be used as binders such as
organic matter of clays, natural gums, waxes, vinyl, cellulose,
polyethylene glycol, resins (thermoplastics), gels, low-temperature reaction bonds, hydraulic cements, and so on (REED, 1995).
Binder’s most important function is to improve the strength of the as-formed product allowing it to be handled before the product is densified by sintering (REED, 1995).
Polymers and waxes derived from petroleum such as low density polyethylene (LDPE), high density polyethylene (HDPE), polypropylene (PP), polystyrene (PS) and paraffin wax are commonly
used. Some natural waxes like carnauba wax (derived from the leaves of a Brazilian palm tree), candelilla wax and beeswax are also widely used
(GERMAN, 2005; REED, 1995). Polymers resins, e.g. PE, PP and PS, are usually added to form a
bonding matrix. The strength, melting temperature and viscosity of these
thermoplastics increase with the average molecular weight (REED, 1995).
2.3.3.2. Surfactants
Surfactants are molecules which have a polar group in one extremity and have a nonpolar chain on the other side. The polar group attracts polar molecules and is called lyophilic group. The nonpolar
group, usually a hydrocarbon chain, is the lyophobic group (REED, 1995). Figure 10 shows a sketch of a surfactant and its behavior on
different means.
65
Surfactants improve the compatibility of the solid with the liquid
medium, when adsorbed at the interface solid-liquid, reducing the
surface tension SL. The driving force for the adsorption of these
molecules at a surface or interface is the reduction of Gibbs free energy
G (REED, 1995).
Figure 10 – Surfactant sketch showing its hydrophilic and hydrophobic groups,
and the behavior of a surfactant in different means. Source: Reed (1995).
Examples of surfactants are: stearic acid, ethoxylated nonylphenol, ethoxylated tridecyl alcohol, sodium stearate, sodium
disopropylnaphtalene sulfonate, dodecyltrimethylammonium chloride and sodium dodecyl sulfate (REED, 1995; GERMAN, 1990).
2.3.3.3. Plasticizers
Ceramic systems containing a binder are molded above the glass transition temperature Tg of the binder. Plasticizers usually have a
smaller molecule than the binder. This molecules are distributed among the chains of the binder reduces the Van der Waals forces that binds the polymer molecules together. This makes the binder to soften and
increase its flexibility, but also reduces its strength. Essentially the plasticizer reduces the Tg of the polymer (REED, 1995). In general the plasticizer have a low melting point (Tm).
Oils and waxes are used as plasticizers in the case of thermoplastic binders such as PE and PS. Stearic acid and oleic acid
behave as plasticizers for waxes (REED, 1995).
66
2.3.4. Rheology
Rheology is the science of deformation and flow (REED, 1995). The study of the rheological behavior of a fluid material is of high
importance for the design and selection of the equipments for processing a feedstock (GERMAN, 1990).
The most important rheological property of a feedstock is the
viscosity. The second important property is the elasticity. Elastic materials exhibit a shape memory effect, which implies that part of the submitted deformation is recovered after the stress is ceased. Feedstocks
exhibit both viscous and elastics characteristics and are therefore termed viscoelastic fluids (GERMAN, 1990).
One of the effects of the viscoelasticity of polymers is the phenomenon known as extrudate swell
4, in which the diameter of the
extrudate out of the die is considerably higher than the diameter of the
die orifice. This occurs because the viscoelastic fluid recovers part of its deformation – the elastic portion – underwent when it was forced into the die (SHENOY, 1999)
2.3.4.1. Shear flow
The steady simple shear flow can be described by the scheme of
Figure 11. The situation describes a fluid being sheared by two plates of area A separated by a distance dx2. The lower plate moves with a velocity v1 and the upper plate with a velocity v1+dv1. The differential
velocity dv1 is imposed by the force f.
The velocity gradient [s-1] is also called shear rate and can be
defined as shows Equation 2, where the term dx1/dx2 describes the shear
strain . The shear stress [Pa], necessary to shear the fluid and maintain a laminar flow, can be defined as it is shown on Equation 3.
Finally Equation 4 defines the viscosity [Pa∙s], referred to as steady
state viscosity, which correlates shear rate and shear stress.
4 Also known as die swell, jet swell, Barus effect or Merrington effect (SHENOY, 1999).
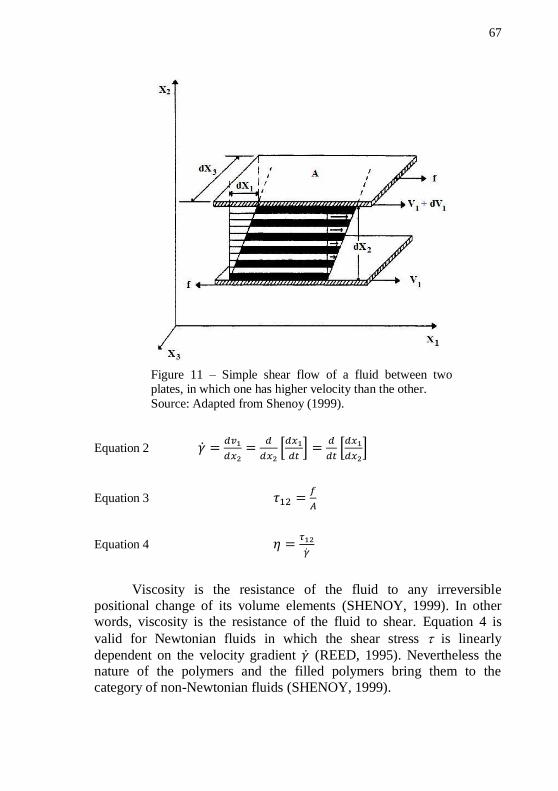
67
Figure 11 – Simple shear flow of a fluid between two plates, in which one has higher velocity than the other.
Source: Adapted from Shenoy (1999).
Equation 2
Equation 3
Equation 4
Viscosity is the resistance of the fluid to any irreversible
positional change of its volume elements (SHENOY, 1999). In other words, viscosity is the resistance of the fluid to shear. Equation 4 is
valid for Newtonian fluids in which the shear stress is linearly
dependent on the velocity gradient (REED, 1995). Nevertheless the nature of the polymers and the filled polymers bring them to the
category of non-Newtonian fluids (SHENOY, 1999).
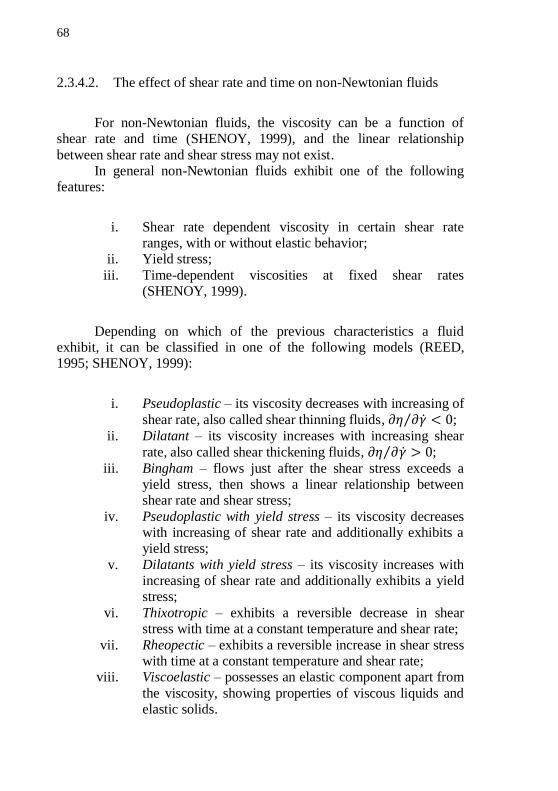
68
2.3.4.2. The effect of shear rate and time on non-Newtonian fluids
For non-Newtonian fluids, the viscosity can be a function of shear rate and time (SHENOY, 1999), and the linear relationship
between shear rate and shear stress may not exist. In general non-Newtonian fluids exhibit one of the following
features:
i. Shear rate dependent viscosity in certain shear rate ranges, with or without elastic behavior;
ii. Yield stress;
iii. Time-dependent viscosities at fixed shear rates (SHENOY, 1999).
Depending on which of the previous characteristics a fluid exhibit, it can be classified in one of the following models (REED, 1995; SHENOY, 1999):
i. Pseudoplastic – its viscosity decreases with increasing of
shear rate, also called shear thinning fluids, ;
ii. Dilatant – its viscosity increases with increasing shear
rate, also called shear thickening fluids, ;
iii. Bingham – flows just after the shear stress exceeds a yield stress, then shows a linear relationship between shear rate and shear stress;
iv. Pseudoplastic with yield stress – its viscosity decreases with increasing of shear rate and additionally exhibits a yield stress;
v. Dilatants with yield stress – its viscosity increases with increasing of shear rate and additionally exhibits a yield stress;
vi. Thixotropic – exhibits a reversible decrease in shear stress with time at a constant temperature and shear rate;
vii. Rheopectic – exhibits a reversible increase in shear stress with time at a constant temperature and shear rate;
viii. Viscoelastic – possesses an elastic component apart from
the viscosity, showing properties of viscous liquids and elastic solids.
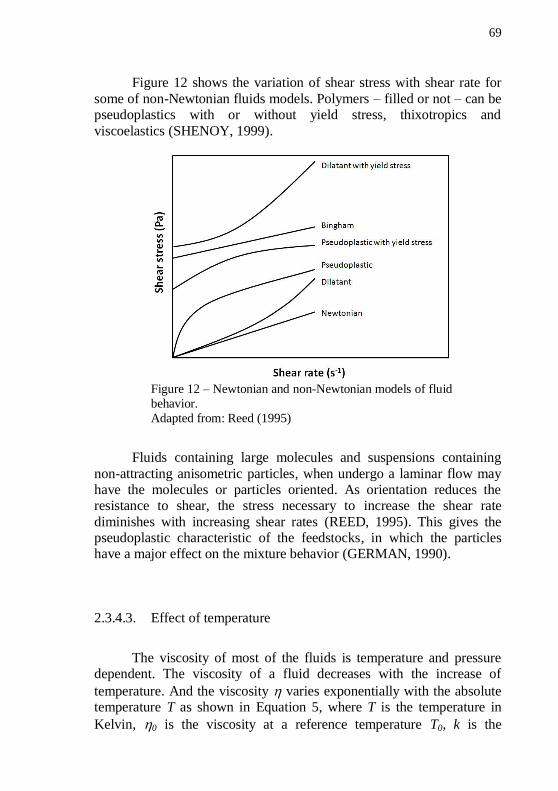
69
Figure 12 shows the variation of shear stress with shear rate for
some of non-Newtonian fluids models. Polymers – filled or not – can be pseudoplastics with or without yield stress, thixotropics and
viscoelastics (SHENOY, 1999).
Figure 12 – Newtonian and non-Newtonian models of fluid
behavior.
Adapted from: Reed (1995)
Fluids containing large molecules and suspensions containing
non-attracting anisometric particles, when undergo a laminar flow may have the molecules or particles oriented. As orientation reduces the resistance to shear, the stress necessary to increase the shear rate
diminishes with increasing shear rates (REED, 1995). This gives the pseudoplastic characteristic of the feedstocks, in which the particles have a major effect on the mixture behavior (GERMAN, 1990).
2.3.4.3. Effect of temperature
The viscosity of most of the fluids is temperature and pressure dependent. The viscosity of a fluid decreases with the increase of
temperature. And the viscosity varies exponentially with the absolute temperature T as shown in Equation 5, where T is the temperature in
Kelvin, 0 is the viscosity at a reference temperature T0, k is the
70
Boltzmann’s constant, and E is a material specific constant which
represents the activation energy for viscous flow. High values of E indicate a high sensibility to temperature change (GERMAN, 1990).
Equation 5
Figure 13 illustrates the application of Equation 5 for a binder system composed by polyethylene and stearic acid, with activation
energy of 32 kJ/mol (GERMAN, 1990). The plot of the natural logarithm of the viscosity, versus the inverse of the temperature is the so called Arrhenius plot.
Figure 13 – Arrhenius plot of a natural logarithm of the viscosity for a polyethylene and stearic acid mixture.
Source: German (1990).
Polymers loaded with particles, in spite they exhibit higher viscosity, are more temperature sensitive than pure polymers. This happens because of the difference in thermal expansion coefficients of
the polymers and the particles. The polymer expands more than the particles and the solid volume fraction decreases with the increase of temperature. This means that the apparent activation energy Ea is larger
for loaded systems (GERMAN, 1990).
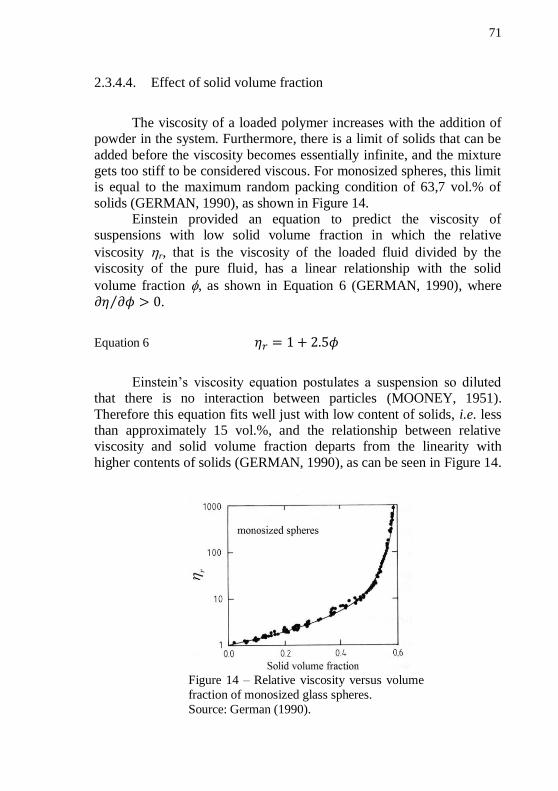
71
2.3.4.4. Effect of solid volume fraction
The viscosity of a loaded polymer increases with the addition of powder in the system. Furthermore, there is a limit of solids that can be
added before the viscosity becomes essentially infinite, and the mixture gets too stiff to be considered viscous. For monosized spheres, this limit is equal to the maximum random packing condition of 63,7 vol.% of
solids (GERMAN, 1990), as shown in Figure 14. Einstein provided an equation to predict the viscosity of
suspensions with low solid volume fraction in which the relative
viscosity r, that is the viscosity of the loaded fluid divided by the viscosity of the pure fluid, has a linear relationship with the solid
volume fraction , as shown in Equation 6 (GERMAN, 1990), where
.
Equation 6
Einstein’s viscosity equation postulates a suspension so diluted that there is no interaction between particles (MOONEY, 1951).
Therefore this equation fits well just with low content of solids, i.e. less than approximately 15 vol.%, and the relationship between relative viscosity and solid volume fraction departs from the linearity with
higher contents of solids (GERMAN, 1990), as can be seen in Figure 14.
Figure 14 – Relative viscosity versus volume
fraction of monosized glass spheres.
Source: German (1990).
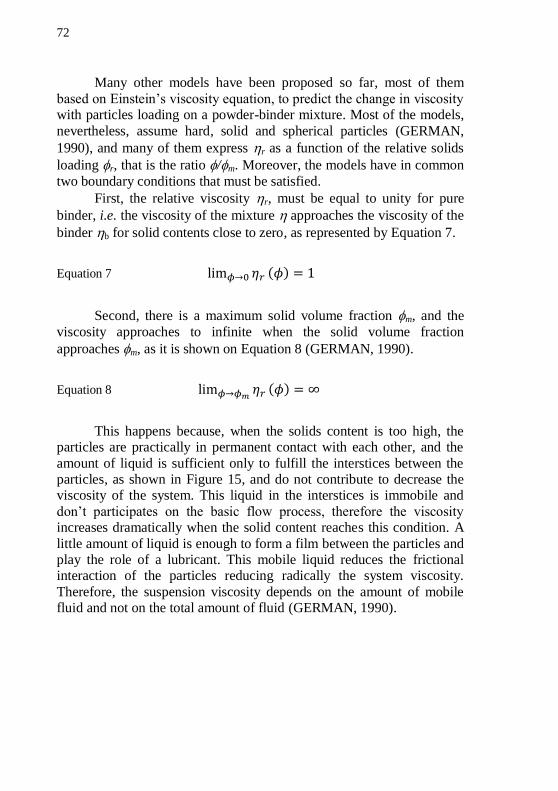
72
Many other models have been proposed so far, most of them
based on Einstein’s viscosity equation, to predict the change in viscosity with particles loading on a powder-binder mixture. Most of the models,
nevertheless, assume hard, solid and spherical particles (GERMAN,
1990), and many of them express r as a function of the relative solids
loading r, that is the ratio /m. Moreover, the models have in common
two boundary conditions that must be satisfied.
First, the relative viscosity r, must be equal to unity for pure
binder, i.e. the viscosity of the mixture approaches the viscosity of the
binder b for solid contents close to zero, as represented by Equation 7.
Equation 7
Second, there is a maximum solid volume fraction m, and the
viscosity approaches to infinite when the solid volume fraction
approaches m, as it is shown on Equation 8 (GERMAN, 1990).
Equation 8
This happens because, when the solids content is too high, the particles are practically in permanent contact with each other, and the
amount of liquid is sufficient only to fulfill the interstices between the particles, as shown in Figure 15, and do not contribute to decrease the viscosity of the system. This liquid in the interstices is immobile and
don’t participates on the basic flow process, therefore the viscosity increases dramatically when the solid content reaches this condition. A
little amount of liquid is enough to form a film between the particles and play the role of a lubricant. This mobile liquid reduces the frictional interaction of the particles reducing radically the system viscosity.
Therefore, the suspension viscosity depends on the amount of mobile fluid and not on the total amount of fluid (GERMAN, 1990).
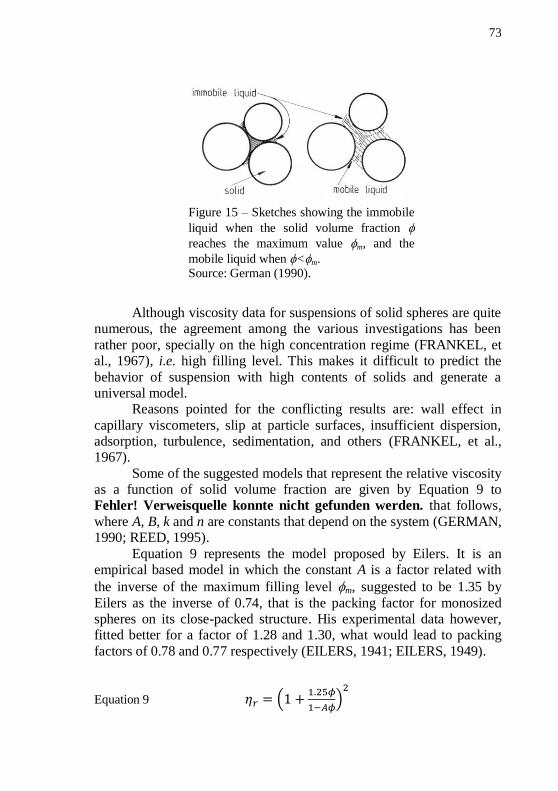
73
Figure 15 – Sketches showing the immobile
liquid when the solid volume fraction
reaches the maximum value m, and the
mobile liquid when <m. Source: German (1990).
Although viscosity data for suspensions of solid spheres are quite numerous, the agreement among the various investigations has been
rather poor, specially on the high concentration regime (FRANKEL, et al., 1967), i.e. high filling level. This makes it difficult to predict the
behavior of suspension with high contents of solids and generate a universal model.
Reasons pointed for the conflicting results are: wall effect in
capillary viscometers, slip at particle surfaces, insufficient dispersion, adsorption, turbulence, sedimentation, and others (FRANKEL, et al., 1967).
Some of the suggested models that represent the relative viscosity as a function of solid volume fraction are given by Equation 9 to Fehler! Verweisquelle konnte nicht gefunden werden. that follows,
where A, B, k and n are constants that depend on the system (GERMAN, 1990; REED, 1995).
Equation 9 represents the model proposed by Eilers. It is an empirical based model in which the constant A is a factor related with
the inverse of the maximum filling level m, suggested to be 1.35 by
Eilers as the inverse of 0.74, that is the packing factor for monosized spheres on its close-packed structure. His experimental data however, fitted better for a factor of 1.28 and 1.30, what would lead to packing
factors of 0.78 and 0.77 respectively (EILERS, 1941; EILERS, 1949).
Equation 9
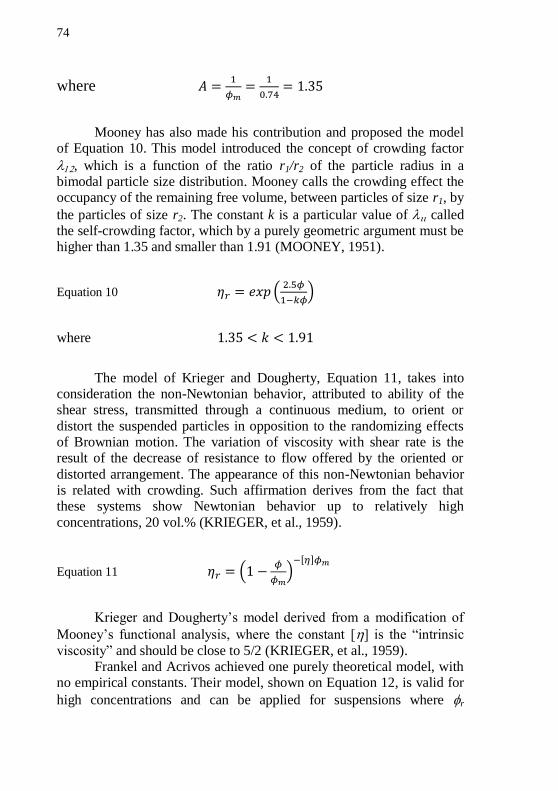
74
where
Mooney has also made his contribution and proposed the model of Equation 10. This model introduced the concept of crowding factor
, which is a function of the ratio r1/r2 of the particle radius in a bimodal particle size distribution. Mooney calls the crowding effect the occupancy of the remaining free volume, between particles of size r1, by
the particles of size r2. The constant k is a particular value of called the self-crowding factor, which by a purely geometric argument must be higher than 1.35 and smaller than 1.91 (MOONEY, 1951).
Equation 10
where
The model of Krieger and Dougherty, Equation 11, takes into consideration the non-Newtonian behavior, attributed to ability of the shear stress, transmitted through a continuous medium, to orient or
distort the suspended particles in opposition to the randomizing effects of Brownian motion. The variation of viscosity with shear rate is the result of the decrease of resistance to flow offered by the oriented or
distorted arrangement. The appearance of this non-Newtonian behavior is related with crowding. Such affirmation derives from the fact that these systems show Newtonian behavior up to relatively high
concentrations, 20 vol.% (KRIEGER, et al., 1959).
Equation 11
Krieger and Dougherty’s model derived from a modification of
Mooney’s functional analysis, where the constant [] is the “intrinsic
viscosity” and should be close to 5/2 (KRIEGER, et al., 1959). Frankel and Acrivos achieved one purely theoretical model, with
no empirical constants. Their model, shown on Equation 12, is valid for
high concentrations and can be applied for suspensions where r
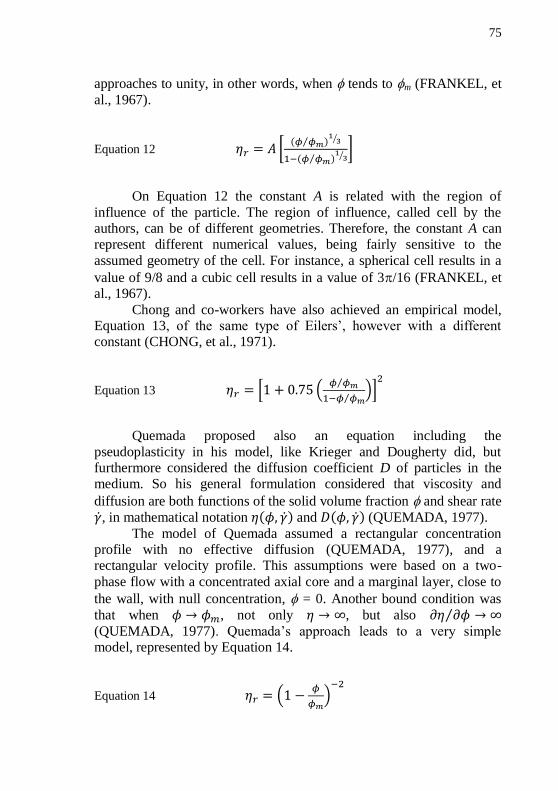
75
approaches to unity, in other words, when tends to m (FRANKEL, et
al., 1967).
Equation 12
On Equation 12 the constant A is related with the region of
influence of the particle. The region of influence, called cell by the authors, can be of different geometries. Therefore, the constant A can represent different numerical values, being fairly sensitive to the
assumed geometry of the cell. For instance, a spherical cell results in a
value of 9/8 and a cubic cell results in a value of 3/16 (FRANKEL, et al., 1967).
Chong and co-workers have also achieved an empirical model, Equation 13, of the same type of Eilers’, however with a different constant (CHONG, et al., 1971).
Equation 13
Quemada proposed also an equation including the
pseudoplasticity in his model, like Krieger and Dougherty did, but furthermore considered the diffusion coefficient D of particles in the medium. So his general formulation considered that viscosity and
diffusion are both functions of the solid volume fraction and shear rate
, in mathematical notation and (QUEMADA, 1977).
The model of Quemada assumed a rectangular concentration profile with no effective diffusion (QUEMADA, 1977), and a rectangular velocity profile. This assumptions were based on a two-
phase flow with a concentrated axial core and a marginal layer, close to
the wall, with null concentration, = 0. Another bound condition was
that when , not only , but also
(QUEMADA, 1977). Quemada’s approach leads to a very simple model, represented by Equation 14.
Equation 14
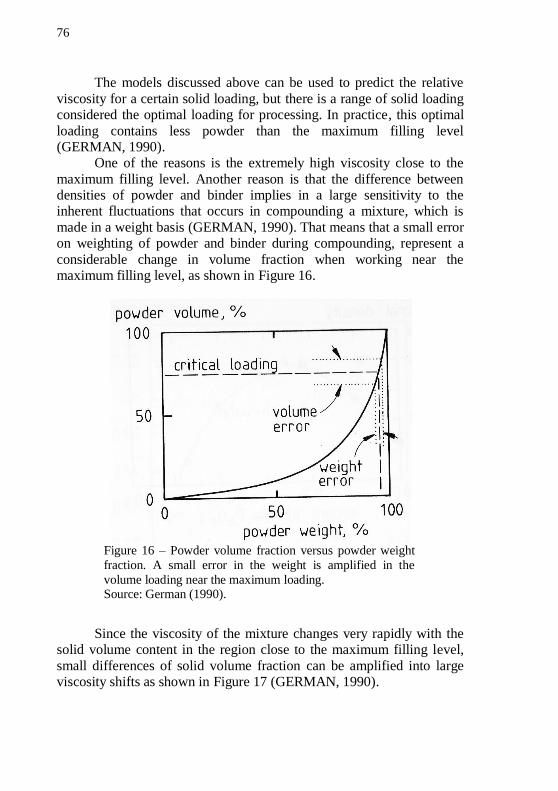
76
The models discussed above can be used to predict the relative
viscosity for a certain solid loading, but there is a range of solid loading considered the optimal loading for processing. In practice, this optimal
loading contains less powder than the maximum filling level (GERMAN, 1990).
One of the reasons is the extremely high viscosity close to the
maximum filling level. Another reason is that the difference between densities of powder and binder implies in a large sensitivity to the inherent fluctuations that occurs in compounding a mixture, which is
made in a weight basis (GERMAN, 1990). That means that a small error on weighting of powder and binder during compounding, represent a
considerable change in volume fraction when working near the maximum filling level, as shown in Figure 16.
Figure 16 – Powder volume fraction versus powder weight
fraction. A small error in the weight is amplified in the
volume loading near the maximum loading. Source: German (1990).
Since the viscosity of the mixture changes very rapidly with the solid volume content in the region close to the maximum filling level,
small differences of solid volume fraction can be amplified into large viscosity shifts as shown in Figure 17 (GERMAN, 1990).
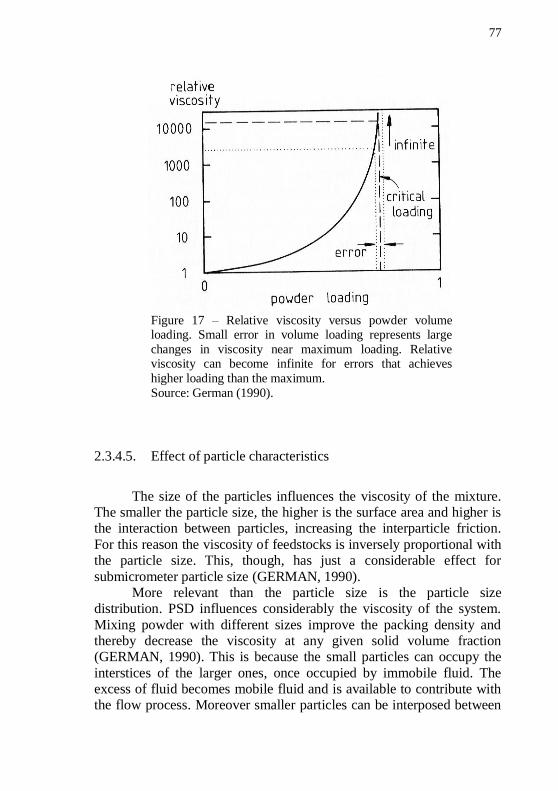
77
Figure 17 – Relative viscosity versus powder volume loading. Small error in volume loading represents large
changes in viscosity near maximum loading. Relative viscosity can become infinite for errors that achieves
higher loading than the maximum.
Source: German (1990).
2.3.4.5. Effect of particle characteristics
The size of the particles influences the viscosity of the mixture. The smaller the particle size, the higher is the surface area and higher is the interaction between particles, increasing the interparticle friction.
For this reason the viscosity of feedstocks is inversely proportional with the particle size. This, though, has just a considerable effect for
submicrometer particle size (GERMAN, 1990). More relevant than the particle size is the particle size
distribution. PSD influences considerably the viscosity of the system.
Mixing powder with different sizes improve the packing density and thereby decrease the viscosity at any given solid volume fraction (GERMAN, 1990). This is because the small particles can occupy the
interstices of the larger ones, once occupied by immobile fluid. The excess of fluid becomes mobile fluid and is available to contribute with the flow process. Moreover smaller particles can be interposed between
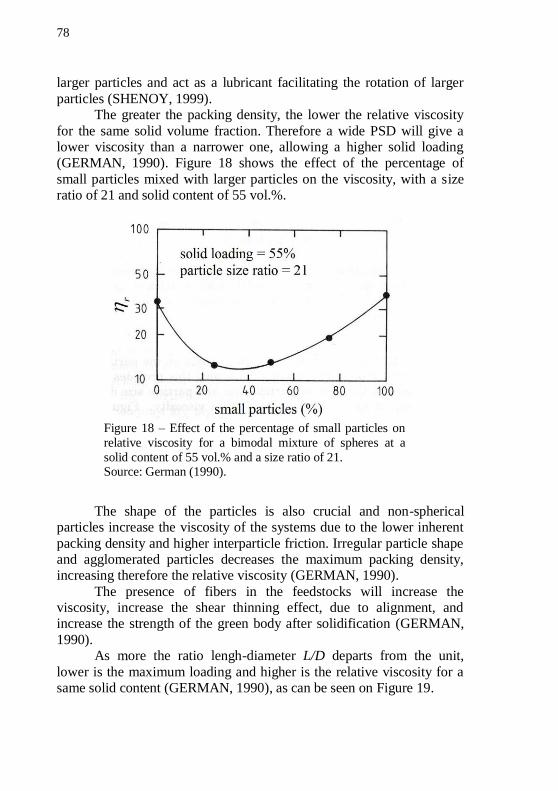
78
larger particles and act as a lubricant facilitating the rotation of larger
particles (SHENOY, 1999). The greater the packing density, the lower the relative viscosity
for the same solid volume fraction. Therefore a wide PSD will give a lower viscosity than a narrower one, allowing a higher solid loading (GERMAN, 1990). Figure 18 shows the effect of the percentage of
small particles mixed with larger particles on the viscosity, with a size ratio of 21 and solid content of 55 vol.%.
Figure 18 – Effect of the percentage of small particles on
relative viscosity for a bimodal mixture of spheres at a
solid content of 55 vol.% and a size ratio of 21. Source: German (1990).
The shape of the particles is also crucial and non-spherical particles increase the viscosity of the systems due to the lower inherent
packing density and higher interparticle friction. Irregular particle shape and agglomerated particles decreases the maximum packing density, increasing therefore the relative viscosity (GERMAN, 1990).
The presence of fibers in the feedstocks will increase the viscosity, increase the shear thinning effect, due to alignment, and increase the strength of the green body after solidification (GERMAN,
1990). As more the ratio lengh-diameter L/D departs from the unit,
lower is the maximum loading and higher is the relative viscosity for a same solid content (GERMAN, 1990), as can be seen on Figure 19.
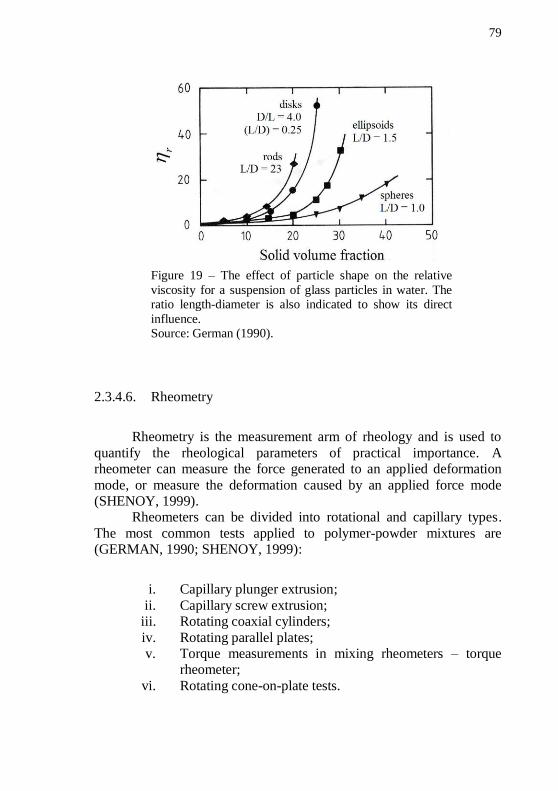
79
Figure 19 – The effect of particle shape on the relative
viscosity for a suspension of glass particles in water. The ratio length-diameter is also indicated to show its direct
influence. Source: German (1990).
2.3.4.6. Rheometry
Rheometry is the measurement arm of rheology and is used to
quantify the rheological parameters of practical importance. A rheometer can measure the force generated to an applied deformation
mode, or measure the deformation caused by an applied force mode (SHENOY, 1999).
Rheometers can be divided into rotational and capillary types.
The most common tests applied to polymer-powder mixtures are (GERMAN, 1990; SHENOY, 1999):
i. Capillary plunger extrusion;
ii. Capillary screw extrusion; iii. Rotating coaxial cylinders;
iv. Rotating parallel plates; v. Torque measurements in mixing rheometers – torque
rheometer;
vi. Rotating cone-on-plate tests.
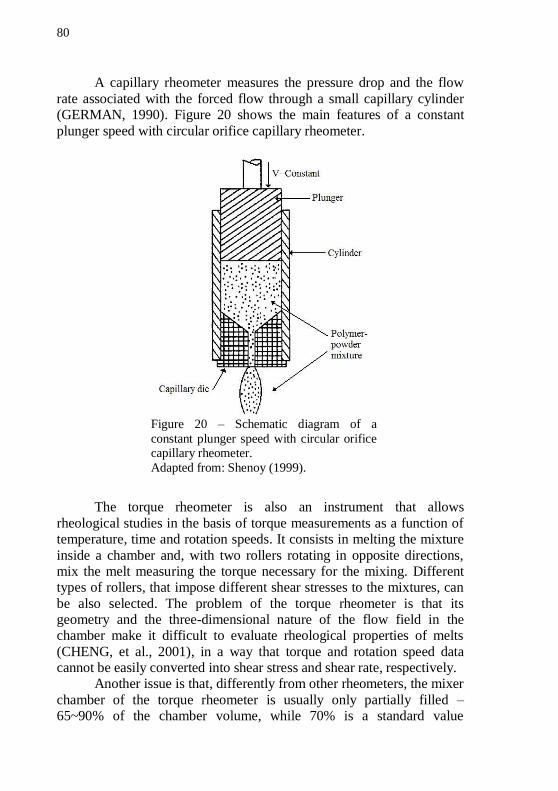
80
A capillary rheometer measures the pressure drop and the flow
rate associated with the forced flow through a small capillary cylinder (GERMAN, 1990). Figure 20 shows the main features of a constant
plunger speed with circular orifice capillary rheometer.
Figure 20 – Schematic diagram of a
constant plunger speed with circular orifice capillary rheometer.
Adapted from: Shenoy (1999).
The torque rheometer is also an instrument that allows
rheological studies in the basis of torque measurements as a function of temperature, time and rotation speeds. It consists in melting the mixture
inside a chamber and, with two rollers rotating in opposite directions, mix the melt measuring the torque necessary for the mixing. Different types of rollers, that impose different shear stresses to the mixtures, can
be also selected. The problem of the torque rheometer is that its geometry and the three-dimensional nature of the flow field in the chamber make it difficult to evaluate rheological properties of melts
(CHENG, et al., 2001), in a way that torque and rotation speed data cannot be easily converted into shear stress and shear rate, respectively.
Another issue is that, differently from other rheometers, the mixer
chamber of the torque rheometer is usually only partially filled – 65~90% of the chamber volume, while 70% is a standard value
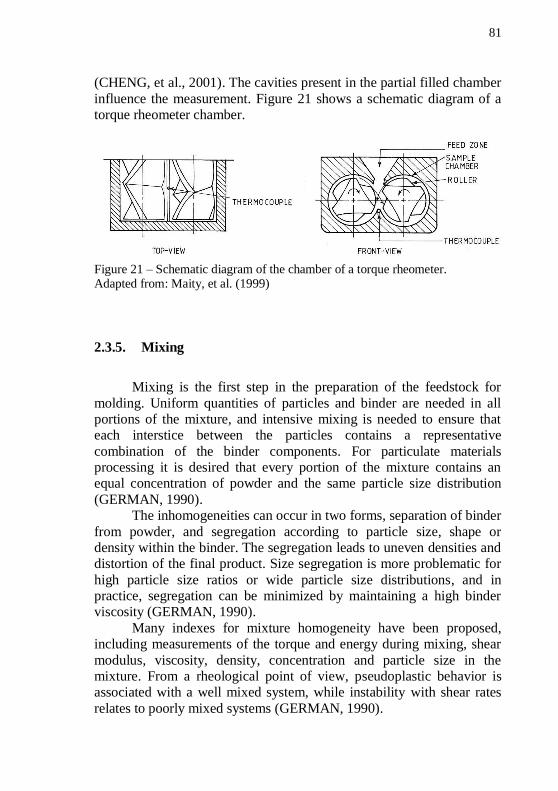
81
(CHENG, et al., 2001). The cavities present in the partial filled chamber
influence the measurement. Figure 21 shows a schematic diagram of a torque rheometer chamber.
Figure 21 – Schematic diagram of the chamber of a torque rheometer. Adapted from: Maity, et al. (1999)
2.3.5. Mixing
Mixing is the first step in the preparation of the feedstock for
molding. Uniform quantities of particles and binder are needed in all portions of the mixture, and intensive mixing is needed to ensure that each interstice between the particles contains a representative
combination of the binder components. For particulate materials processing it is desired that every portion of the mixture contains an equal concentration of powder and the same particle size distribution
(GERMAN, 1990). The inhomogeneities can occur in two forms, separation of binder
from powder, and segregation according to particle size, shape or density within the binder. The segregation leads to uneven densities and distortion of the final product. Size segregation is more problematic for
high particle size ratios or wide particle size distributions, and in practice, segregation can be minimized by maintaining a high binder viscosity (GERMAN, 1990).
Many indexes for mixture homogeneity have been proposed, including measurements of the torque and energy during mixing, shear
modulus, viscosity, density, concentration and particle size in the mixture. From a rheological point of view, pseudoplastic behavior is associated with a well mixed system, while instability with shear rates
relates to poorly mixed systems (GERMAN, 1990).
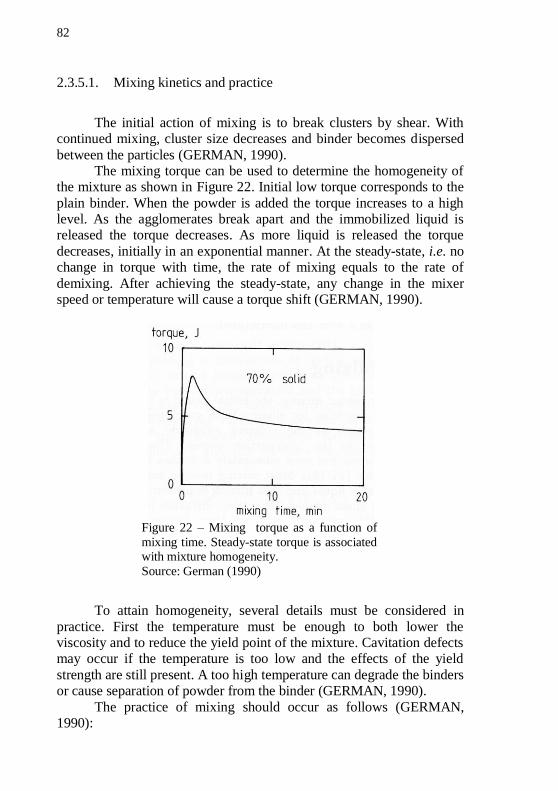
82
2.3.5.1. Mixing kinetics and practice
The initial action of mixing is to break clusters by shear. With continued mixing, cluster size decreases and binder becomes dispersed
between the particles (GERMAN, 1990). The mixing torque can be used to determine the homogeneity of
the mixture as shown in Figure 22. Initial low torque corresponds to the
plain binder. When the powder is added the torque increases to a high level. As the agglomerates break apart and the immobilized liquid is released the torque decreases. As more liquid is released the torque
decreases, initially in an exponential manner. At the steady-state, i.e. no change in torque with time, the rate of mixing equals to the rate of
demixing. After achieving the steady-state, any change in the mixer speed or temperature will cause a torque shift (GERMAN, 1990).
Figure 22 – Mixing torque as a function of
mixing time. Steady-state torque is associated with mixture homogeneity.
Source: German (1990)
To attain homogeneity, several details must be considered in
practice. First the temperature must be enough to both lower the viscosity and to reduce the yield point of the mixture. Cavitation defects may occur if the temperature is too low and the effects of the yield
strength are still present. A too high temperature can degrade the binders or cause separation of powder from the binder (GERMAN, 1990).
The practice of mixing should occur as follows (GERMAN, 1990):

83
i. The binder of highest melting point is added to the
preheated chamber; ii. Selectively lower temperature binders are added with
appropriate temperature reductions when necessary, to avoid evaporation or degradation;
iii. As the chamber becomes fuller, mechanical work
increases and considerable heating may occur. Temperature control is important in this case;
iv. The powder is then added.
v. At this point the temperature may reduce drastically if the powder has a high heat capacity (metallic powders
mainly); vi. The mixing torque, after the powder has been added,
becomes relatively higher, because of inhomogeneities,
interparticle friction, and decrease in temperature; vii. As temperature and homogeneity increases, the torque
reduces fast;
viii. Finally, when temperature is stable and a good level of homogeneity is achieved, the torque reaches a steady-
state value;
2.3.6. Extrusion molding
The extrusion process consists basically in pushing or forcing a
material through an opening. Extruder die refers to the part of the machine containing the opening through which the material is forced. As the material is squeezed through the die, it acquired the shape of the
die opening. The extruded product is referred to as the extrudate (RAUWENDAAL, 1986).
Extruders are the most important piece of machinery in the
polymer processing industry, but also many different materials can be formed through extrusion process, e.g. metals, clays, ceramics,
foodstuffs, etc. Materials can be extruded in the molten or in the solid state. Polymers are generally extruded in the molten state; nevertheless, the solid state extrusion can be used for some specific applications
(RAUWENDAAL, 1986).
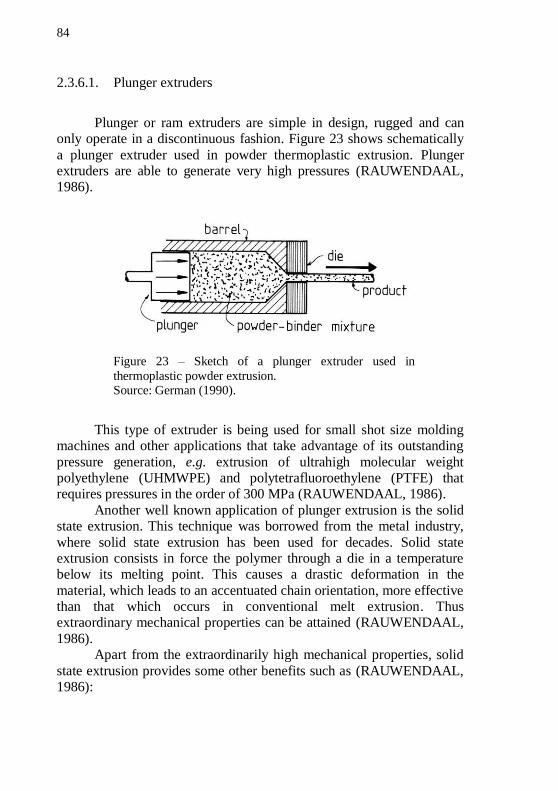
84
2.3.6.1. Plunger extruders
Plunger or ram extruders are simple in design, rugged and can only operate in a discontinuous fashion. Figure 23 shows schematically
a plunger extruder used in powder thermoplastic extrusion. Plunger extruders are able to generate very high pressures (RAUWENDAAL, 1986).
Figure 23 – Sketch of a plunger extruder used in
thermoplastic powder extrusion. Source: German (1990).
This type of extruder is being used for small shot size molding machines and other applications that take advantage of its outstanding
pressure generation, e.g. extrusion of ultrahigh molecular weight polyethylene (UHMWPE) and polytetrafluoroethylene (PTFE) that requires pressures in the order of 300 MPa (RAUWENDAAL, 1986).
Another well known application of plunger extrusion is the solid state extrusion. This technique was borrowed from the metal industry,
where solid state extrusion has been used for decades. Solid state extrusion consists in force the polymer through a die in a temperature below its melting point. This causes a drastic deformation in the
material, which leads to an accentuated chain orientation, more effective than that which occurs in conventional melt extrusion. Thus extraordinary mechanical properties can be attained (RAUWENDAAL,
1986). Apart from the extraordinarily high mechanical properties, solid
state extrusion provides some other benefits such as (RAUWENDAAL, 1986):
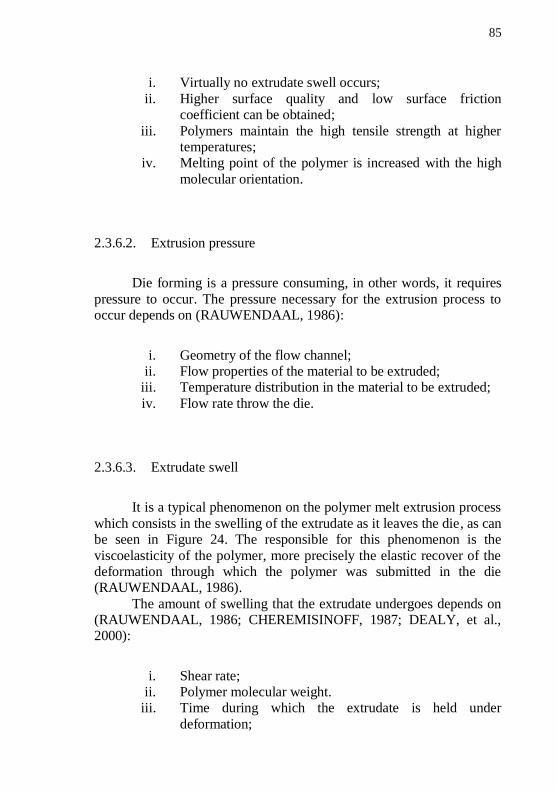
85
i. Virtually no extrudate swell occurs;
ii. Higher surface quality and low surface friction coefficient can be obtained;
iii. Polymers maintain the high tensile strength at higher temperatures;
iv. Melting point of the polymer is increased with the high
molecular orientation.
2.3.6.2. Extrusion pressure
Die forming is a pressure consuming, in other words, it requires
pressure to occur. The pressure necessary for the extrusion process to occur depends on (RAUWENDAAL, 1986):
i. Geometry of the flow channel; ii. Flow properties of the material to be extruded;
iii. Temperature distribution in the material to be extruded;
iv. Flow rate throw the die.
2.3.6.3. Extrudate swell
It is a typical phenomenon on the polymer melt extrusion process
which consists in the swelling of the extrudate as it leaves the die, as can be seen in Figure 24. The responsible for this phenomenon is the
viscoelasticity of the polymer, more precisely the elastic recover of the deformation through which the polymer was submitted in the die (RAUWENDAAL, 1986).
The amount of swelling that the extrudate undergoes depends on (RAUWENDAAL, 1986; CHEREMISINOFF, 1987; DEALY, et al., 2000):
i. Shear rate; ii. Polymer molecular weight.
iii. Time during which the extrudate is held under
deformation;
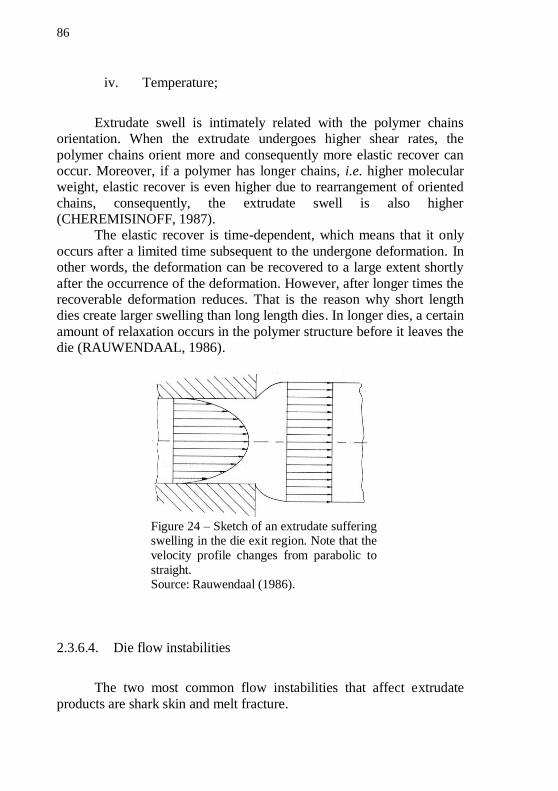
86
iv. Temperature;
Extrudate swell is intimately related with the polymer chains orientation. When the extrudate undergoes higher shear rates, the
polymer chains orient more and consequently more elastic recover can occur. Moreover, if a polymer has longer chains, i.e. higher molecular weight, elastic recover is even higher due to rearrangement of oriented
chains, consequently, the extrudate swell is also higher (CHEREMISINOFF, 1987).
The elastic recover is time-dependent, which means that it only
occurs after a limited time subsequent to the undergone deformation. In other words, the deformation can be recovered to a large extent shortly
after the occurrence of the deformation. However, after longer times the recoverable deformation reduces. That is the reason why short length dies create larger swelling than long length dies. In longer dies, a certain
amount of relaxation occurs in the polymer structure before it leaves the die (RAUWENDAAL, 1986).
Figure 24 – Sketch of an extrudate suffering swelling in the die exit region. Note that the
velocity profile changes from parabolic to
straight. Source: Rauwendaal (1986).
2.3.6.4. Die flow instabilities
The two most common flow instabilities that affect extrudate
products are shark skin and melt fracture.
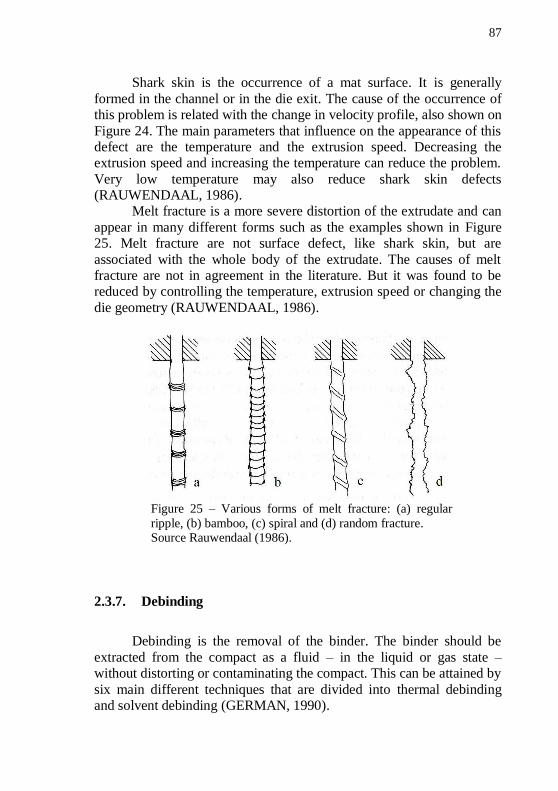
87
Shark skin is the occurrence of a mat surface. It is generally
formed in the channel or in the die exit. The cause of the occurrence of this problem is related with the change in velocity profile, also shown on
Figure 24. The main parameters that influence on the appearance of this defect are the temperature and the extrusion speed. Decreasing the extrusion speed and increasing the temperature can reduce the problem.
Very low temperature may also reduce shark skin defects (RAUWENDAAL, 1986).
Melt fracture is a more severe distortion of the extrudate and can
appear in many different forms such as the examples shown in Figure 25. Melt fracture are not surface defect, like shark skin, but are
associated with the whole body of the extrudate. The causes of melt fracture are not in agreement in the literature. But it was found to be reduced by controlling the temperature, extrusion speed or changing the
die geometry (RAUWENDAAL, 1986).
Figure 25 – Various forms of melt fracture: (a) regular
ripple, (b) bamboo, (c) spiral and (d) random fracture. Source Rauwendaal (1986).
2.3.7. Debinding
Debinding is the removal of the binder. The binder should be
extracted from the compact as a fluid – in the liquid or gas state – without distorting or contaminating the compact. This can be attained by
six main different techniques that are divided into thermal debinding and solvent debinding (GERMAN, 1990).
88
Thermal debinding techniques are diffusion, permeation and
wicking. Diffusion and permeating consist in heat the compact to a temperature high enough to cause the evaporation or degradation of the
binder. Degradation can occur as decomposition, chain scission or depolymerization. If the compact has low porosity, diffusion is favorable, otherwise permeation occurs. Wicking is a technique in
which the molten binder is extracted from the compact to the pores of a wicking substrate via capillary forces. In the wicking process the temperature should be enough to decrease sufficiently the viscosity of
the binder (GERMAN, 1990). Solvent debinding techniques are divided into extraction, high
pressure and thermally assisted. These techniques consist in immersing the compact in a fluid that is able to dissolve some of the binders. The solvent induce binder flow out of the compact based on the chemical
concentration gradient. The role of the solvent debinding is to create a pore structure, promoting channels through which vapor of the remaining binder can flow in the subsequent debinding by evaporation.
Extraction is the simple immersion in a solvent. The high pressure technique utilizes a supercritical in which vapor and liquid are
indistinguishable. The thermally assisted solvent debinding uses heat to increase the kinetics of the process, the solvent in this case may be in the vapor state. Solvents commonly used include ethanol, ethylene chloride,
trichloroethylene, pentane, methylene chloride, Freon, acetone, hexane and heptane (GERMAN, 1990).
In practice two or more techniques mentioned above are
combined to accelerate the debinding cycle. One key factor on debinding is to use multiple component binder system, allowing debinding to occur progressively in more than one step, so that after the
removal of the first binder, another is still in a sufficient amount to hold the particles cohesively. Reactive atmospheres can reduce the binder
removal time, but may also alter the particles composition (GERMAN, 1990).
Another relevant aspect is, when the binder is removed from the
interstices of the particles, the compact becomes very fragile until it is sintered, though it must have sufficient strength to retain its shape (GERMAN, 1990). The compact after binder removal is often called
brown part, in allusion with the green part after molding. Usually wax and oils are removed by solvent debinding. On the
other hand, the polymers with higher molecular weights are usually thermally removed. Oils and waxes should be over 30 vol.% of the binder, to form a sufficient interconnectivity to the surface and, later, to
89
provide an interconnected porous network that allows the polymers to
evaporate in a subsequent thermal debinding step (GERMAN, 1990). The last polymers to be removed form the so called backbone, and are
the binder components that will retain the shape of the compact until the earlier steps of sintering.
The debinding process is highly influenced by the permeability of
the particles in the compact. The permeability in its turn is dependent on the packing density of the powder. Large particle size distributions lead to higher densities and decrease the permeability of the compact
(GERMAN, 1990). The low permeability caused by dense packing powders difficult the debinding process.
During debinding, capillary forces act pulling particles together. If the compact is less dense than the critical loading, the liquid – molten binder or solvent – lubricates the surface of the particles that will
rearrange migrating and sometimes agglomerating. As the binder is removed, the particles approach each other until contact each other, this, summed with possible residual binder, gives the compact strength. The
removal of the residual binder can only occur by evaporation, i.e. thermal debinding, and must occur at the onset of sintering, since the
compact cannot be handled once the binder is totally removed (GERMAN, 1990).
High debinding rates can be achieved with thin compact sections,
large particles, high porosity, large pressure gradients and high temperatures (GERMAN, 1990).
2.3.7.1. Debinding rate and atmosphere
High solid contents make debinding process slower due to reduced permeability of the binder through the denser particles packing. It is proved that shorter debinding times as well as better dimensional
control is achieved using a solvent debinding step. Nevertheless all debinding routes end up with thermal evaporation step prior to sintering
(GERMAN, 1990). Basically thermal evaporating rates depend on three factors:
binder molecular weight, atmosphere, and temperature. Evaporating
rates decreases with increasing molecular weight of the binder. Atmosphere is also a very important factor that influences debinding rates and the selection between oxidizing, inert or reducing atmosphere
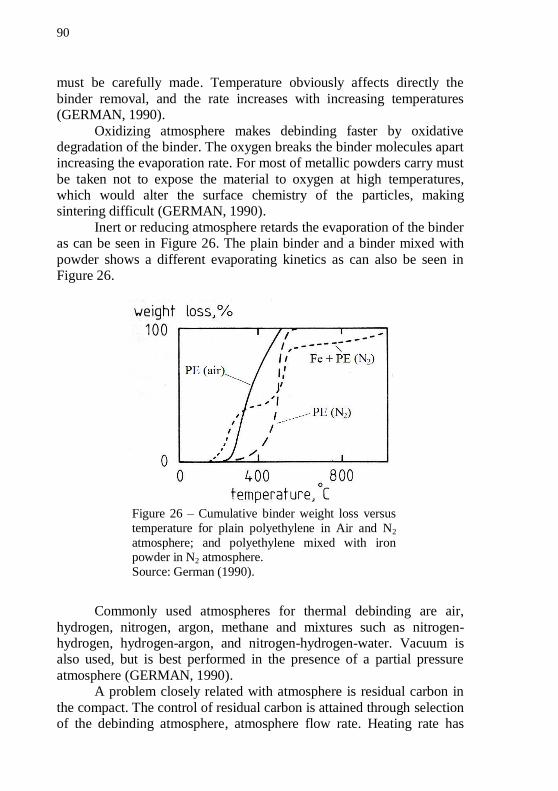
90
must be carefully made. Temperature obviously affects directly the
binder removal, and the rate increases with increasing temperatures (GERMAN, 1990).
Oxidizing atmosphere makes debinding faster by oxidative degradation of the binder. The oxygen breaks the binder molecules apart increasing the evaporation rate. For most of metallic powders carry must
be taken not to expose the material to oxygen at high temperatures, which would alter the surface chemistry of the particles, making sintering difficult (GERMAN, 1990).
Inert or reducing atmosphere retards the evaporation of the binder as can be seen in Figure 26. The plain binder and a binder mixed with
powder shows a different evaporating kinetics as can also be seen in Figure 26.
Figure 26 – Cumulative binder weight loss versus
temperature for plain polyethylene in Air and N2
atmosphere; and polyethylene mixed with iron powder in N2 atmosphere.
Source: German (1990).
Commonly used atmospheres for thermal debinding are air,
hydrogen, nitrogen, argon, methane and mixtures such as nitrogen-hydrogen, hydrogen-argon, and nitrogen-hydrogen-water. Vacuum is also used, but is best performed in the presence of a partial pressure
atmosphere (GERMAN, 1990). A problem closely related with atmosphere is residual carbon in
the compact. The control of residual carbon is attained through selection of the debinding atmosphere, atmosphere flow rate. Heating rate has
91
also influence on the formation of residual carbon, however its role is
not so clear and residual carbon can form either at low or high heating rates. There are evidences that show that, if the binder is not fully
removed until debinding temperature reaches 450 °C, residual carbon
may occur. As carbon control is not so simple, usually residual carbon is removed on the sintering step at higher temperatures (GERMAN, 1990).
2.3.7.2. Debinding defects
The most common defect is the compact deformation by viscous flow, caused by gravity and compact weight. Powder can flow under
relative low stresses, leading to distortion during debinding as the binder, which previously retained the compact shape by bonding between the particles, is removed from the compact. Deformation is
more likely to happen for larger particle sizes, low solid contents, and higher particle sphericity (GERMAN, 1990).
Blisters, craters and vapor blowholes are other common
problems. Vapor bubbles can nucleate during thermal debinding, if permeation or diffusion of vapor from the bubble to the surface does not
occur, the pressure increases and displacement of particles may happen, leading to formation of such defects. Vapor diffusivity can decrease for higher packing density, which is influenced by particle size distribution,
thicker sections, and larger particles. Blister, craters and blowholes are also particularly common when binder constituents are too volatile or if the heating rate is too fast. Entrapped air can also be a cause
(GERMAN, 1990). Single component binder systems offer higher probability for the
appearance of debinding defects, due to difficult extraction (GERMAN,
1990).
2.3.8. Sintering
Sintering is a heating process that causes particles to bond together and develops the desired microstructure and properties (GERMAN, 2005; GERMAN, 1990; REED, 1995). The term sintering
is often erroneously associated with shrinkage and densification.
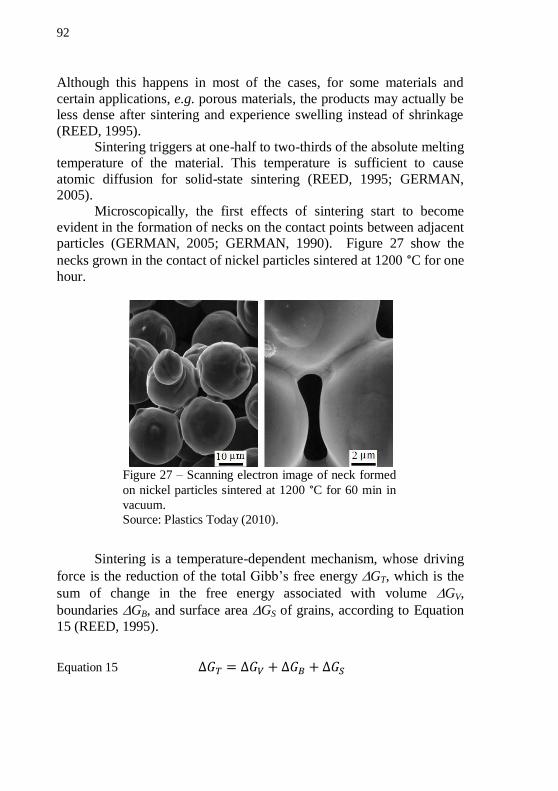
92
Although this happens in most of the cases, for some materials and
certain applications, e.g. porous materials, the products may actually be less dense after sintering and experience swelling instead of shrinkage
(REED, 1995). Sintering triggers at one-half to two-thirds of the absolute melting
temperature of the material. This temperature is sufficient to cause
atomic diffusion for solid-state sintering (REED, 1995; GERMAN, 2005).
Microscopically, the first effects of sintering start to become
evident in the formation of necks on the contact points between adjacent particles (GERMAN, 2005; GERMAN, 1990). Figure 27 show the
necks grown in the contact of nickel particles sintered at 1200 °C for one
hour.
Figure 27 – Scanning electron image of neck formed
on nickel particles sintered at 1200 °C for 60 min in
vacuum.
Source: Plastics Today (2010).
Sintering is a temperature-dependent mechanism, whose driving
force is the reduction of the total Gibb’s free energy GT, which is the
sum of change in the free energy associated with volume GV,
boundaries GB, and surface area GS of grains, according to Equation
15 (REED, 1995).
Equation 15
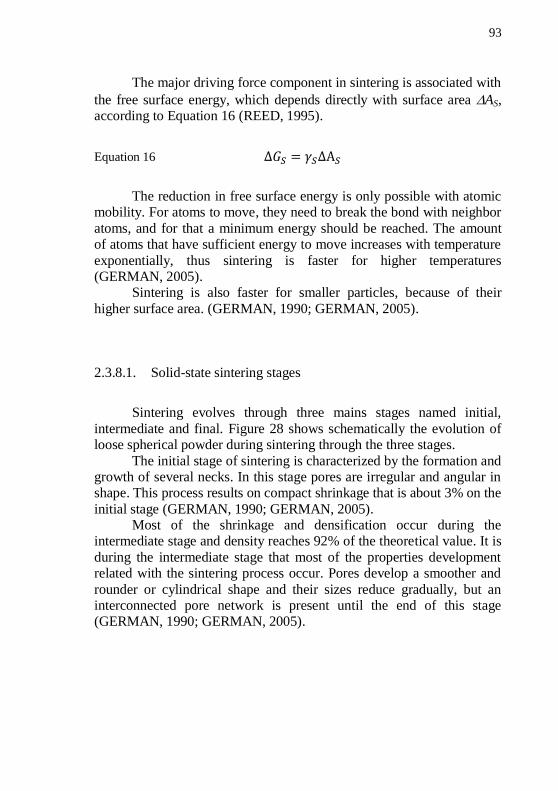
93
The major driving force component in sintering is associated with
the free surface energy, which depends directly with surface area AS, according to Equation 16 (REED, 1995).
Equation 16
The reduction in free surface energy is only possible with atomic mobility. For atoms to move, they need to break the bond with neighbor
atoms, and for that a minimum energy should be reached. The amount of atoms that have sufficient energy to move increases with temperature
exponentially, thus sintering is faster for higher temperatures (GERMAN, 2005).
Sintering is also faster for smaller particles, because of their
higher surface area. (GERMAN, 1990; GERMAN, 2005).
2.3.8.1. Solid-state sintering stages
Sintering evolves through three mains stages named initial,
intermediate and final. Figure 28 shows schematically the evolution of loose spherical powder during sintering through the three stages.
The initial stage of sintering is characterized by the formation and growth of several necks. In this stage pores are irregular and angular in shape. This process results on compact shrinkage that is about 3% on the
initial stage (GERMAN, 1990; GERMAN, 2005). Most of the shrinkage and densification occur during the
intermediate stage and density reaches 92% of the theoretical value. It is
during the intermediate stage that most of the properties development related with the sintering process occur. Pores develop a smoother and
rounder or cylindrical shape and their sizes reduce gradually, but an interconnected pore network is present until the end of this stage (GERMAN, 1990; GERMAN, 2005).
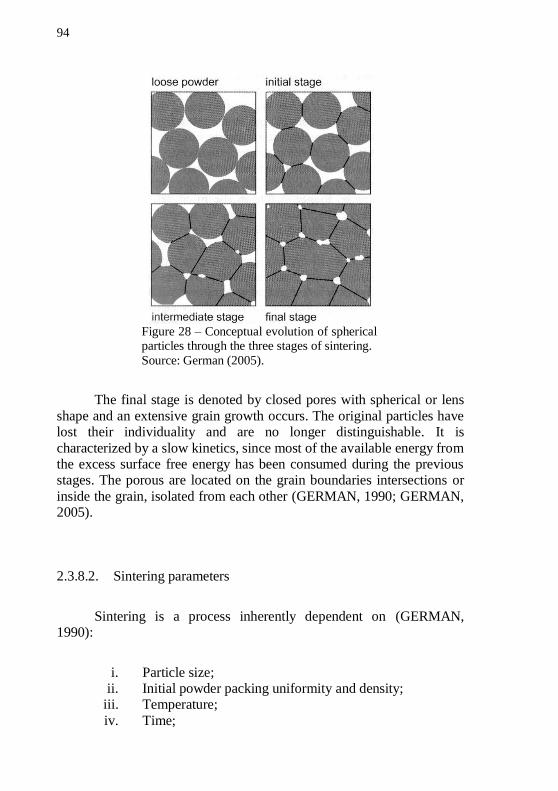
94
Figure 28 – Conceptual evolution of spherical particles through the three stages of sintering.
Source: German (2005).
The final stage is denoted by closed pores with spherical or lens
shape and an extensive grain growth occurs. The original particles have lost their individuality and are no longer distinguishable. It is
characterized by a slow kinetics, since most of the available energy from the excess surface free energy has been consumed during the previous stages. The porous are located on the grain boundaries intersections or
inside the grain, isolated from each other (GERMAN, 1990; GERMAN, 2005).
2.3.8.2. Sintering parameters
Sintering is a process inherently dependent on (GERMAN, 1990):
i. Particle size; ii. Initial powder packing uniformity and density;
iii. Temperature;
iv. Time;
95
v. Heating rate;
vi. Atmosphere.
The two first parameters are related with the material and
previous process steps, while the other four are the parameters related with the sintering process itself. As mentioned in the previous section, sintering is faster for small particle sizes, as the reduction of the surface
free energy is the driving force of the process (GERMAN, 1990). Powder packing uniformity and a high green density can improve
sintering, because of the higher particle contact coordination and lower
initial porosity. This leads to a faster sintering and lower shrinkage (GERMAN, 1990).
High heating rates may cause distortion or cracks due to allotropic transformations or non-uniform heating in the case of thick sections. A fast heating may also cause retention of residual carbon
(GERMAN, 2005). On the other hand, a too slow heating rate may cause grain growth due to long exposures time at high temperatures (COOVATTANACHAI, et al., 2010).
Increased sintering time results in higher densities but bigger grain sizes (GERMAN, 1990), whereas high temperatures results in
greater shrinkage and higher density, but also grain growth and pore coarsening (GERMAN, 1990).
Atmosphere plays an important role during sintering. Common
sintering atmospheres are: hydrogen, dissociated ammonia, water vapor, argon, helium, nitrogen, methane, propane, and mixtures of these gases. Vacuum is also often used, with or without partial pressure control.
There are three mains aspects to be concerned with the atmosphere during sintering (REED, 1995; GERMAN, 1990; GERMAN, 2005):
i. Non-soluble gas proceeding from the atmosphere can be
trapped into closed pores refraining pore shrinkage and density improvement;
ii. The partial pressure of the gases contained in the atmosphere may control the vaporization of elements or the stoichiometry of compounds in the particles;
iii. Reactive gases from the atmosphere may reduce or oxidize the particles elements or compounds;
96
According to the reactivity of the atmosphere, they can be
classified as (GERMAN, 2005):
i. Oxidizing – carbon dioxide, water or oxygen;
ii. Neutral – argon, helium or vacuum; iii. Reducing – hydrogen or carbon monoxide; iv. Hydriding – hydrogen, ammonia;
v. Dehydriding – vacuum or argon; vi. Nitriding – nitrogen or ammonia;
vii. Carburizing – methane or propane;
viii. Decarburizing – carbon dioxide, or oxygen.
Oxide ceramics are usually sintered in air, but most of the high-
performance materials require protective atmospheres, including even oxides. Metallic powders usually require a protective atmosphere – inert or reducing – to avoid oxidation (GERMAN, 1990).
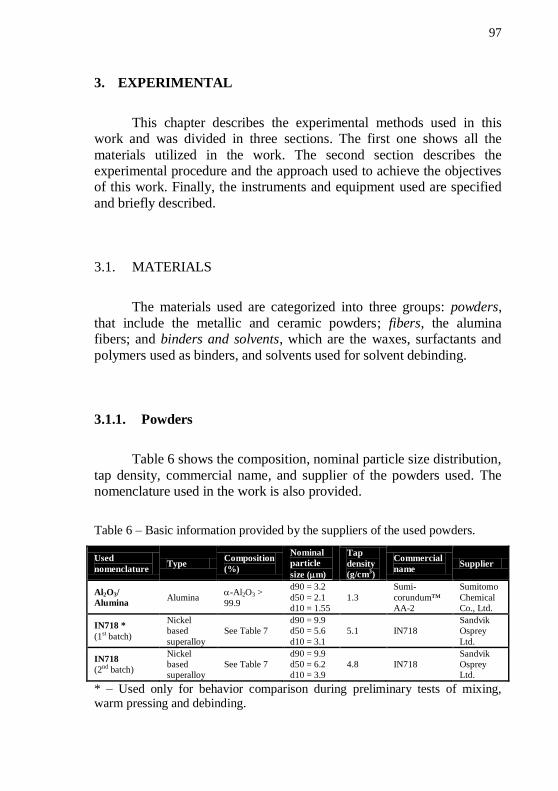
97
3. EXPERIMENTAL
This chapter describes the experimental methods used in this work and was divided in three sections. The first one shows all the
materials utilized in the work. The second section describes the experimental procedure and the approach used to achieve the objectives of this work. Finally, the instruments and equipment used are specified
and briefly described.
3.1. MATERIALS
The materials used are categorized into three groups: powders,
that include the metallic and ceramic powders; fibers, the alumina fibers; and binders and solvents, which are the waxes, surfactants and
polymers used as binders, and solvents used for solvent debinding.
3.1.1. Powders
Table 6 shows the composition, nominal particle size distribution,
tap density, commercial name, and supplier of the powders used. The nomenclature used in the work is also provided.
Table 6 – Basic information provided by the suppliers of the used powders.
Used
nomenclature Type
Composition
(%)
Nominal
particle
size (m)
Tap
density
(g/cm3)
Commercial
name Supplier
Al2O3/
Alumina Alumina
-Al2O3 >
99.9
d90 = 3.2
d50 = 2.1
d10 = 1.55
1.3
Sumi-
corundum™
AA-2
Sumitomo
Chemical
Co., Ltd.
IN718 *
(1st batch)
Nickel
based
superalloy
See Table 7
d90 = 9.9
d50 = 5.6
d10 = 3.1
5.1 IN718
Sandvik
Osprey
Ltd.
IN718
(2nd batch)
Nickel
based
superalloy
See Table 7
d90 = 9.9
d50 = 6.2
d10 = 3.9
4.8 IN718
Sandvik
Osprey
Ltd.
* – Used only for behavior comparison during preliminary tests of mixing, warm pressing and debinding.
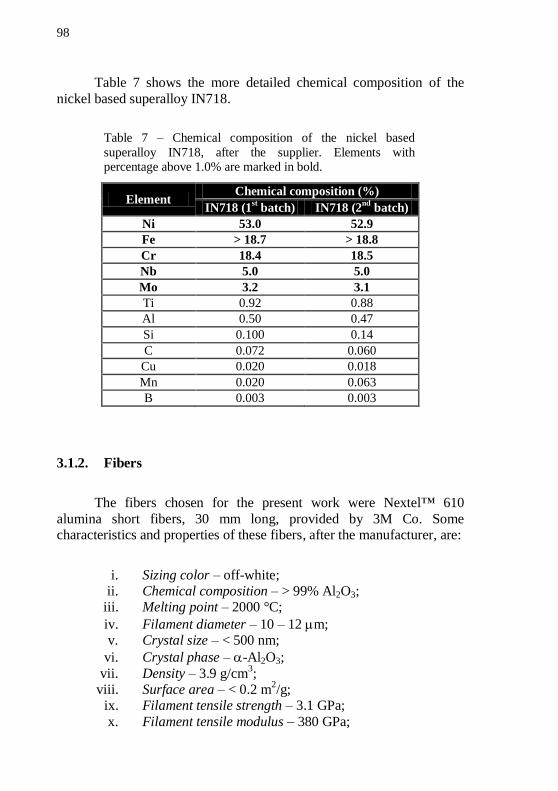
98
Table 7 shows the more detailed chemical composition of the
nickel based superalloy IN718.
Table 7 – Chemical composition of the nickel based
superalloy IN718, after the supplier. Elements with percentage above 1.0% are marked in bold.
Element Chemical composition (%)
IN718 (1st batch) IN718 (2
nd batch)
Ni 53.0 52.9
Fe > 18.7 > 18.8
Cr 18.4 18.5
Nb 5.0 5.0
Mo 3.2 3.1
Ti 0.92 0.88
Al 0.50 0.47
Si 0.100 0.14
C 0.072 0.060
Cu 0.020 0.018
Mn 0.020 0.063
B 0.003 0.003
3.1.2. Fibers
The fibers chosen for the present work were Nextel™ 610
alumina short fibers, 30 mm long, provided by 3M Co. Some characteristics and properties of these fibers, after the manufacturer, are:
i. Sizing color – off-white; ii. Chemical composition – > 99% Al2O3;
iii. Melting point – 2000 °C;
iv. Filament diameter – 10 – 12 m; v. Crystal size – < 500 nm;
vi. Crystal phase – -Al2O3;
vii. Density – 3.9 g/cm3;
viii. Surface area – < 0.2 m2/g;
ix. Filament tensile strength – 3.1 GPa;
x. Filament tensile modulus – 380 GPa;
99
xi. Coefficient of thermal expansion (100-1100 °C) – 8.0 x
10-6
°C-1
;
3.1.3. Binders and solvent
The properties and supplier’s information of the binders and surfactant are shown in Table 8.
Table 8 – Properties and supplier’s information of binders and surfactant used.
Used
nomenclature
Common
name
Additive
Type*
MFI
(g/10min)
Density
(g/cm3)
Tm
(°C)
Commercial
name Supplier
LDPE70 Low density
polyethylene Binder 70 0.919 108
Lacqtene®
1700MN18C
Elf Atochem S.A.
LDPE02 Low density polyethylene
Binder 02 0.930 115 Lacqtene
®
1020FE30
Elf Atochem
S.A.
PW Paraffin wax Binder / Plasticizer
N/A N/A 58 - 60
Paraffin wax 76231 Fluka
Sigma-Aldrich
Co.
SA Stearic acid Surfactant / Dispersant /
Plasticizer
N/A 0.845 67-69
Stearic acid 93661 Fluka
Sigma-Aldrich
Co.
* The additives were classified according to the definitions of their functions
(REED, 1995), this information was not provided by the suppliers.
The solvent used for solvent debinding was commercial ethanol
95%.
3.2. METHODS
3.2.1. Feedstock development
Before the extrusion of the tubes, attention was given to the feedstock behavior during mixing, shaping and, especially, debinding.
To develop the feedstock, no fibers were added in the mixture, so that
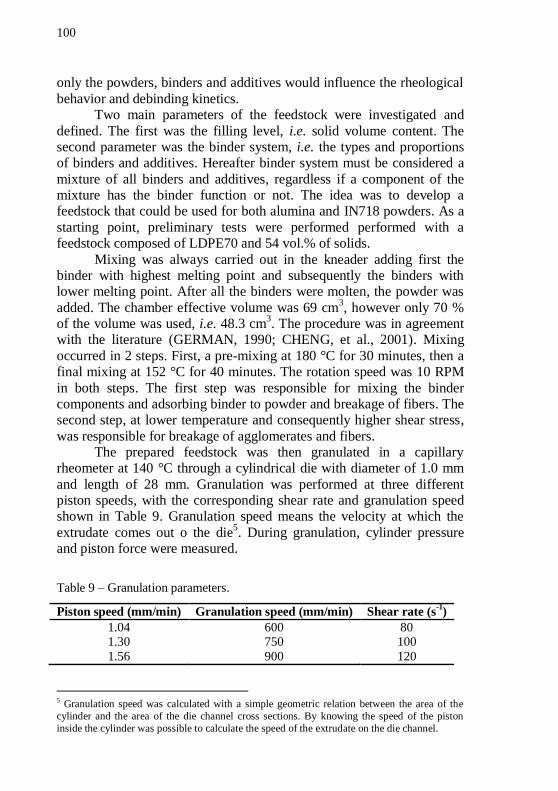
100
only the powders, binders and additives would influence the rheological
behavior and debinding kinetics. Two main parameters of the feedstock were investigated and
defined. The first was the filling level, i.e. solid volume content. The second parameter was the binder system, i.e. the types and proportions of binders and additives. Hereafter binder system must be considered a
mixture of all binders and additives, regardless if a component of the mixture has the binder function or not. The idea was to develop a feedstock that could be used for both alumina and IN718 powders. As a
starting point, preliminary tests were performed performed with a feedstock composed of LDPE70 and 54 vol.% of solids.
Mixing was always carried out in the kneader adding first the binder with highest melting point and subsequently the binders with lower melting point. After all the binders were molten, the powder was
added. The chamber effective volume was 69 cm3, however only 70 %
of the volume was used, i.e. 48.3 cm3. The procedure was in agreement
with the literature (GERMAN, 1990; CHENG, et al., 2001). Mixing
occurred in 2 steps. First, a pre-mixing at 180 °C for 30 minutes, then a final mixing at 152 °C for 40 minutes. The rotation speed was 10 RPM
in both steps. The first step was responsible for mixing the binder components and adsorbing binder to powder and breakage of fibers. The second step, at lower temperature and consequently higher shear stress,
was responsible for breakage of agglomerates and fibers. The prepared feedstock was then granulated in a capillary
rheometer at 140 °C through a cylindrical die with diameter of 1.0 mm
and length of 28 mm. Granulation was performed at three different piston speeds, with the corresponding shear rate and granulation speed shown in Table 9. Granulation speed means the velocity at which the
extrudate comes out o the die5. During granulation, cylinder pressure
and piston force were measured.
Table 9 – Granulation parameters.
Piston speed (mm/min) Granulation speed (mm/min) Shear rate (s-1
)
1.04 600 80 1.30 750 100
1.56 900 120
5 Granulation speed was calculated with a simple geometric relation between the area of the
cylinder and the area of the die channel cross sections. By knowing the speed of the piston
inside the cylinder was possible to calculate the speed of the extrudate on the die channel.
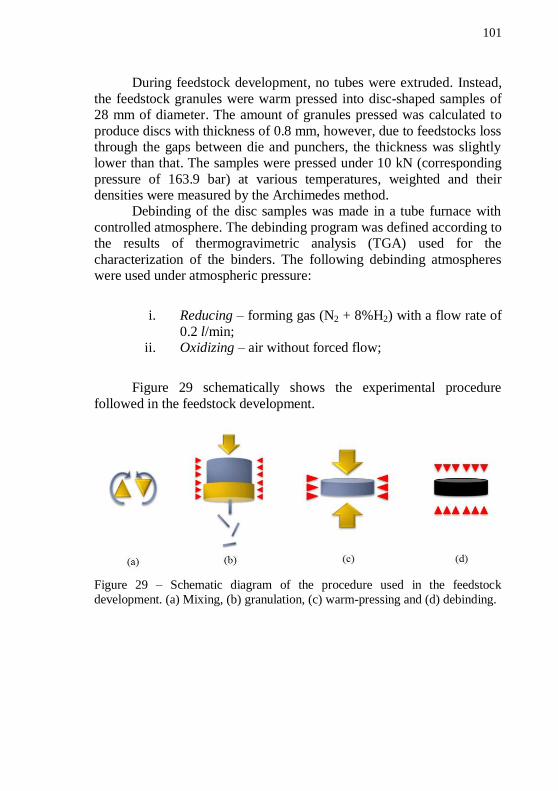
101
During feedstock development, no tubes were extruded. Instead,
the feedstock granules were warm pressed into disc-shaped samples of 28 mm of diameter. The amount of granules pressed was calculated to
produce discs with thickness of 0.8 mm, however, due to feedstocks loss through the gaps between die and punchers, the thickness was slightly lower than that. The samples were pressed under 10 kN (corresponding
pressure of 163.9 bar) at various temperatures, weighted and their densities were measured by the Archimedes method.
Debinding of the disc samples was made in a tube furnace with
controlled atmosphere. The debinding program was defined according to the results of thermogravimetric analysis (TGA) used for the
characterization of the binders. The following debinding atmospheres were used under atmospheric pressure:
i. Reducing – forming gas (N2 + 8%H2) with a flow rate of
0.2 l/min; ii. Oxidizing – air without forced flow;
Figure 29 schematically shows the experimental procedure
followed in the feedstock development.
Figure 29 – Schematic diagram of the procedure used in the feedstock
development. (a) Mixing, (b) granulation, (c) warm-pressing and (d) debinding.
102
3.2.1.1. Filling level definition and maximum filling level
determination
To define the solid volume content and determine the maximum
filling level several feedstocks, with a simple binder system, composed of plain LDPE, were prepared. The solids content varied between 54 and 62 vol.%, that is roughly the same range usually used in PIM
(GERMAN, 1990). Mixing was carried out in the kneader at 152 °C. To define the maximum filling level, in which viscosity
approaches infinite, and so as the mixing torque, a relationship between
the solids-binder ratio and the inverse of mixing torque was used. This method was developed in the group of Clemens and is going to be
shown in a later section. For this method, the torque data of unfilled LDPE, i.e. no powder addition, was also included. To validate the results and the method, data was compared with different viscosity
models. The following characteristics were considered during the
definition of the filling level:
i. Mixing torque; ii. Maximum filling level;
iii. Debinding behavior.
Mixing torque should not be too high, close to the limit of the kneader, because although the addition of paraffin wax in the binder
system during binder system definition would reduce the torque, the fiber addition for tube extrusion would, on the contrary, increase it. What effect would be predominant was difficult to estimate, so that a
safety margin should be given. The defined filling level should also be, obviously, below the maximum filling level (GERMAN, 1990).
All samples were warm pressed at 140 °C under 10 kN
(corresponding pressure of 163.9 bar). The debinding behavior was analyzed considering the presence of
defects in the samples after the debinding cycle, such as deformation, edge rounding and blisters.
103
3.2.1.2. Binder system definition
After defining the filling level, the binder system had to be developed. A three component binder system composed by low density
polyethylene (LDPE), paraffin wax (PW) and stearic acid (SA) was used. A multi-component binder system would, according to the literature, permit faster debinding less prone to the formation of
debinding defects. As surfactant, SA was used in a small amount, fixed in 5.0 vol.%
of the total amount of binder, as used in many others similar PIM binder
systems (GERMAN, 1990). So what had to be investigated was the volume fractions of LDPE and PW.
Several amounts of PW content were investigated varying from zero to 95 vol.%. SA was used in a fix value of 5 vol.%. The balance was LDPE.
The warm pressing temperature was empirically determined in a way that perfect discs were produced. With too low temperatures, the feedstock could not fill the mold properly, while with too high
temperatures an excess of flash was produced and material was lost through the gap of the mould. The temperature varied from 95 to 140
°C. Pressing was performed under 10 kN (corresponding pressure of 163.9 bar).
The amount of PW was defined based on the debinding behavior,
i.e. absence of deformation, edge rounding and blisters.
3.2.2. Tube extrusion
After feedstock development, 30 vol.% of Nextel™ 610 fibers
were incorporated into the solids content of feedstock, being the other 70 vol.% alumina or IN718 powder. This amount was also fixed according to previous studies for other CMCs and MMCs (CHAWLA,
2003; CHAWLA, et al., 2006; SURESH, et al., 1993; MILEIKO, 1997). Figure 30 shows schematically the composition of the feedstock after
binder system definition and the introduction of fibers.
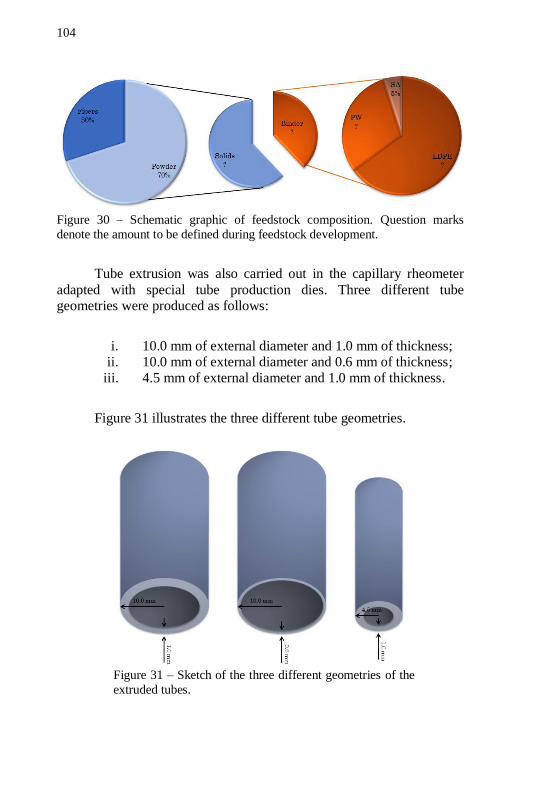
104
Figure 30 – Schematic graphic of feedstock composition. Question marks
denote the amount to be defined during feedstock development.
Tube extrusion was also carried out in the capillary rheometer
adapted with special tube production dies. Three different tube geometries were produced as follows:
i. 10.0 mm of external diameter and 1.0 mm of thickness; ii. 10.0 mm of external diameter and 0.6 mm of thickness;
iii. 4.5 mm of external diameter and 1.0 mm of thickness.
Figure 31 illustrates the three different tube geometries.
Figure 31 – Sketch of the three different geometries of the
extruded tubes.
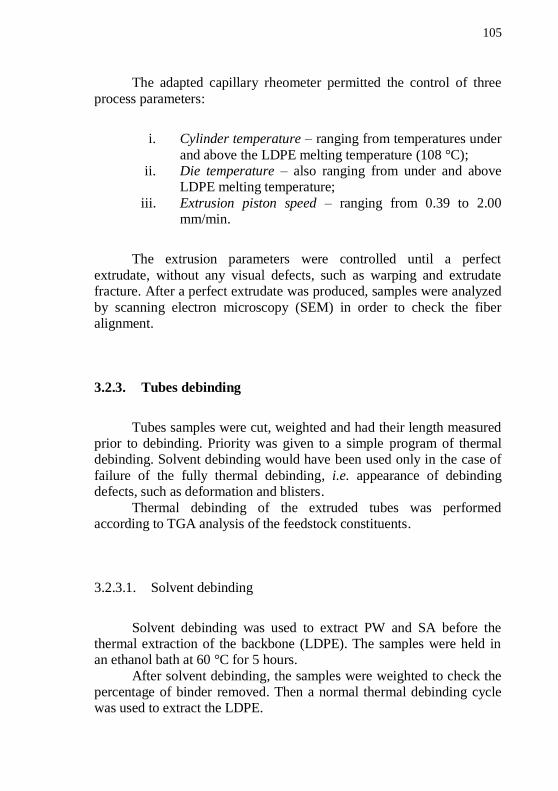
105
The adapted capillary rheometer permitted the control of three
process parameters:
i. Cylinder temperature – ranging from temperatures under
and above the LDPE melting temperature (108 °C); ii. Die temperature – also ranging from under and above
LDPE melting temperature;
iii. Extrusion piston speed – ranging from 0.39 to 2.00 mm/min.
The extrusion parameters were controlled until a perfect
extrudate, without any visual defects, such as warping and extrudate fracture. After a perfect extrudate was produced, samples were analyzed
by scanning electron microscopy (SEM) in order to check the fiber alignment.
3.2.3. Tubes debinding
Tubes samples were cut, weighted and had their length measured prior to debinding. Priority was given to a simple program of thermal debinding. Solvent debinding would have been used only in the case of
failure of the fully thermal debinding, i.e. appearance of debinding defects, such as deformation and blisters.
Thermal debinding of the extruded tubes was performed according to TGA analysis of the feedstock constituents.
3.2.3.1. Solvent debinding
Solvent debinding was used to extract PW and SA before the thermal extraction of the backbone (LDPE). The samples were held in an ethanol bath at 60 °C for 5 hours.
After solvent debinding, the samples were weighted to check the percentage of binder removed. Then a normal thermal debinding cycle was used to extract the LDPE.
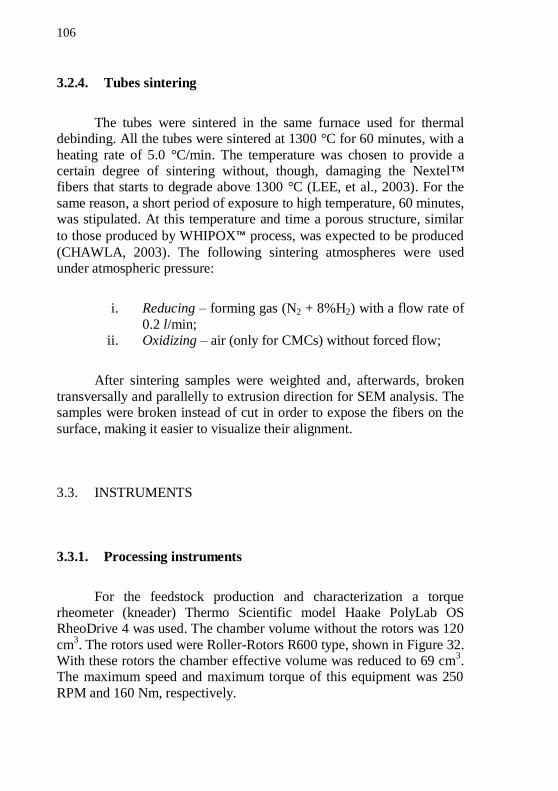
106
3.2.4. Tubes sintering
The tubes were sintered in the same furnace used for thermal debinding. All the tubes were sintered at 1300 °C for 60 minutes, with a
heating rate of 5.0 °C/min. The temperature was chosen to provide a certain degree of sintering without, though, damaging the Nextel™ fibers that starts to degrade above 1300 °C (LEE, et al., 2003). For the
same reason, a short period of exposure to high temperature, 60 minutes, was stipulated. At this temperature and time a porous structure, similar
to those produced by WHIPOX™ process, was expected to be produced
(CHAWLA, 2003). The following sintering atmospheres were used under atmospheric pressure:
i. Reducing – forming gas (N2 + 8%H2) with a flow rate of
0.2 l/min; ii. Oxidizing – air (only for CMCs) without forced flow;
After sintering samples were weighted and, afterwards, broken
transversally and parallelly to extrusion direction for SEM analysis. The samples were broken instead of cut in order to expose the fibers on the
surface, making it easier to visualize their alignment.
3.3. INSTRUMENTS
3.3.1. Processing instruments
For the feedstock production and characterization a torque rheometer (kneader) Thermo Scientific model Haake PolyLab OS RheoDrive 4 was used. The chamber volume without the rotors was 120
cm3. The rotors used were Roller-Rotors R600 type, shown in Figure 32.
With these rotors the chamber effective volume was reduced to 69 cm3.
The maximum speed and maximum torque of this equipment was 250
RPM and 160 Nm, respectively.
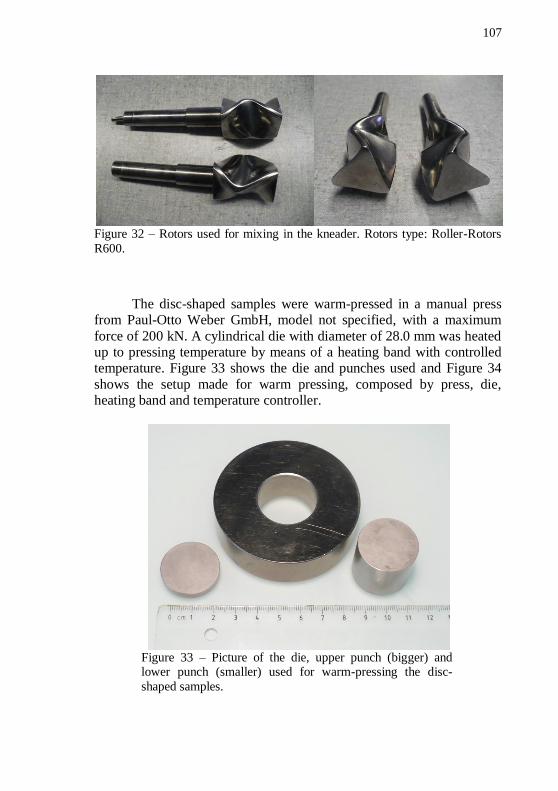
107
Figure 32 – Rotors used for mixing in the kneader. Rotors type: Roller-Rotors
R600.
The disc-shaped samples were warm-pressed in a manual press
from Paul-Otto Weber GmbH, model not specified, with a maximum
force of 200 kN. A cylindrical die with diameter of 28.0 mm was heated up to pressing temperature by means of a heating band with controlled temperature. Figure 33 shows the die and punches used and Figure 34
shows the setup made for warm pressing, composed by press, die, heating band and temperature controller.
Figure 33 – Picture of the die, upper punch (bigger) and lower punch (smaller) used for warm-pressing the disc-
shaped samples.
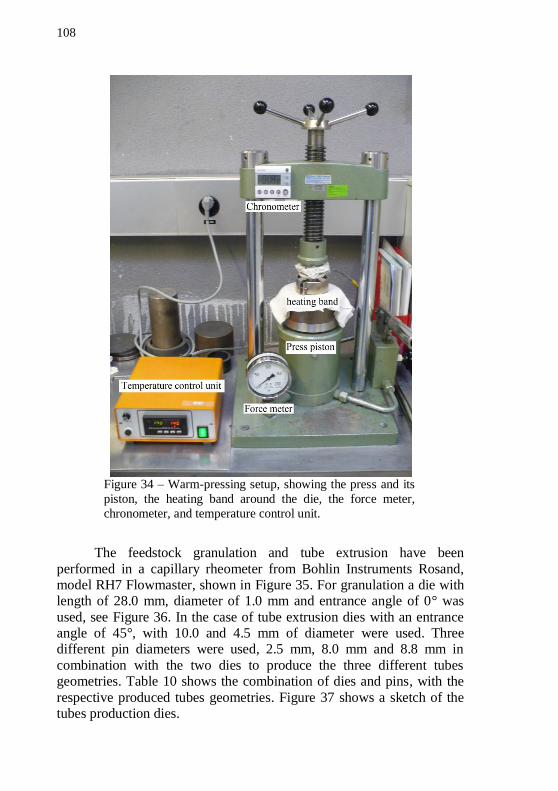
108
Figure 34 – Warm-pressing setup, showing the press and its
piston, the heating band around the die, the force meter,
chronometer, and temperature control unit.
The feedstock granulation and tube extrusion have been
performed in a capillary rheometer from Bohlin Instruments Rosand, model RH7 Flowmaster, shown in Figure 35. For granulation a die with length of 28.0 mm, diameter of 1.0 mm and entrance angle of 0° was
used, see Figure 36. In the case of tube extrusion dies with an entrance angle of 45°, with 10.0 and 4.5 mm of diameter were used. Three different pin diameters were used, 2.5 mm, 8.0 mm and 8.8 mm in
combination with the two dies to produce the three different tubes geometries. Table 10 shows the combination of dies and pins, with the
respective produced tubes geometries. Figure 37 shows a sketch of the tubes production dies.
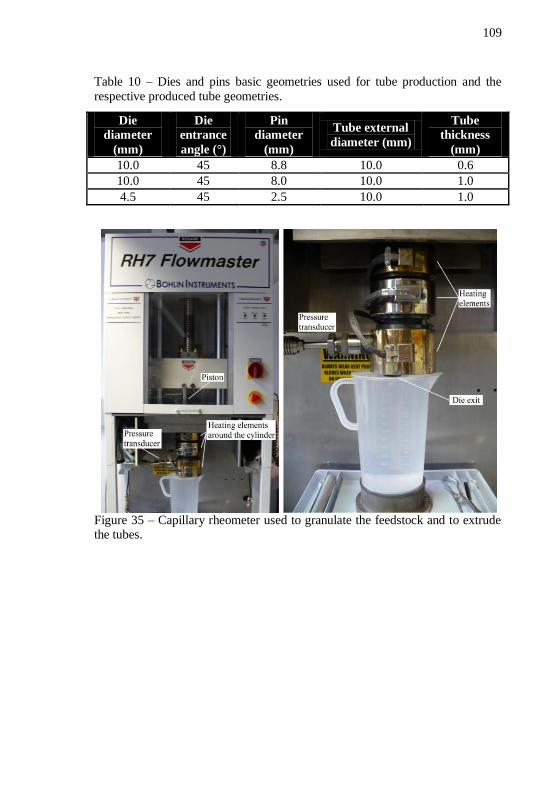
109
Table 10 – Dies and pins basic geometries used for tube production and the
respective produced tube geometries.
Die
diameter
(mm)
Die
entrance
angle (°)
Pin
diameter
(mm)
Tube external
diameter (mm)
Tube
thickness
(mm)
10.0 45 8.8 10.0 0.6
10.0 45 8.0 10.0 1.0
4.5 45 2.5 10.0 1.0
Figure 35 – Capillary rheometer used to granulate the feedstock and to extrude the tubes.
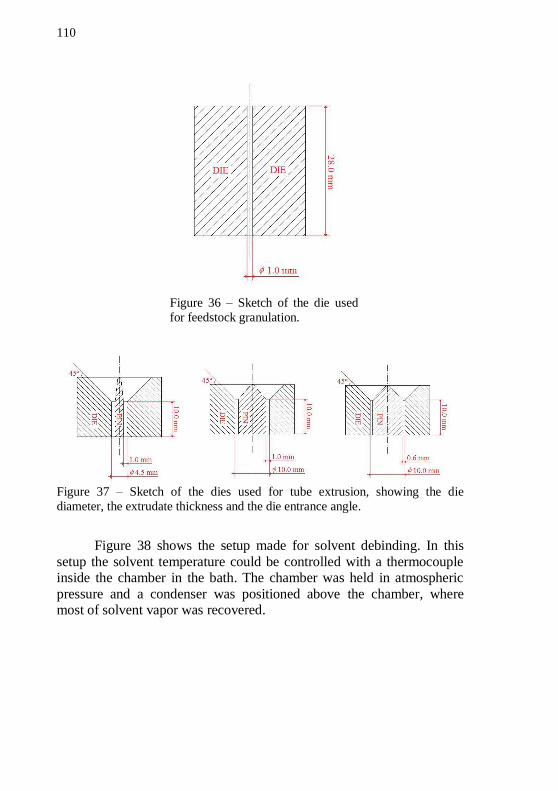
110
Figure 36 – Sketch of the die used
for feedstock granulation.
Figure 37 – Sketch of the dies used for tube extrusion, showing the die
diameter, the extrudate thickness and the die entrance angle.
Figure 38 shows the setup made for solvent debinding. In this
setup the solvent temperature could be controlled with a thermocouple inside the chamber in the bath. The chamber was held in atmospheric
pressure and a condenser was positioned above the chamber, where most of solvent vapor was recovered.
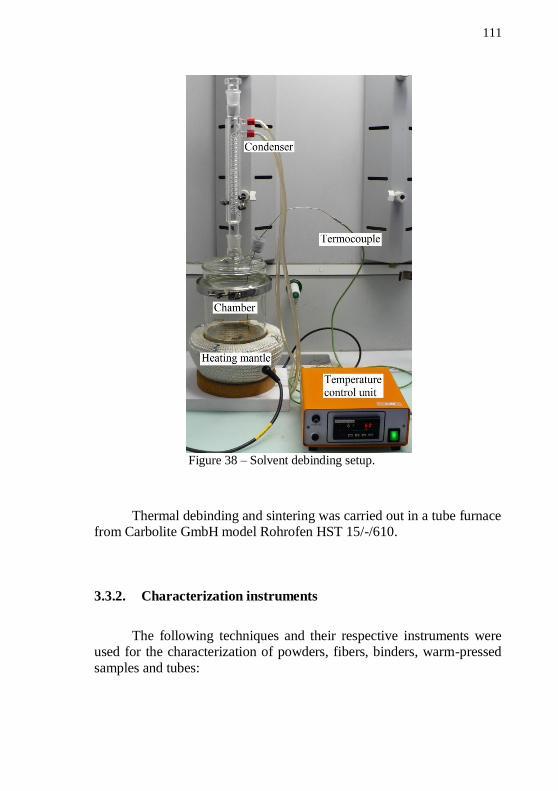
111
Figure 38 – Solvent debinding setup.
Thermal debinding and sintering was carried out in a tube furnace
from Carbolite GmbH model Rohrofen HST 15/-/610.
3.3.2. Characterization instruments
The following techniques and their respective instruments were used for the characterization of powders, fibers, binders, warm-pressed
samples and tubes:
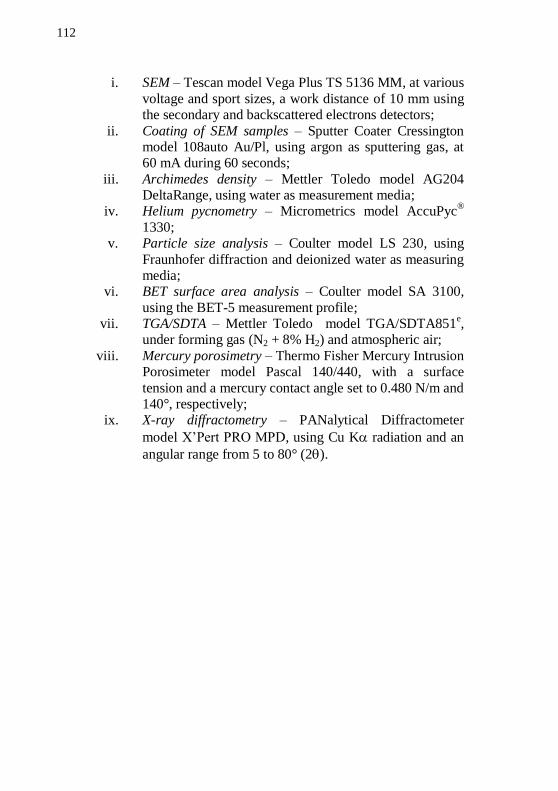
112
i. SEM – Tescan model Vega Plus TS 5136 MM, at various
voltage and sport sizes, a work distance of 10 mm using the secondary and backscattered electrons detectors;
ii. Coating of SEM samples – Sputter Coater Cressington model 108auto Au/Pl, using argon as sputtering gas, at 60 mA during 60 seconds;
iii. Archimedes density – Mettler Toledo model AG204 DeltaRange, using water as measurement media;
iv. Helium pycnometry – Micrometrics model AccuPyc®
1330; v. Particle size analysis – Coulter model LS 230, using
Fraunhofer diffraction and deionized water as measuring media;
vi. BET surface area analysis – Coulter model SA 3100,
using the BET-5 measurement profile; vii. TGA/SDTA – Mettler Toledo model TGA/SDTA851
e,
under forming gas (N2 + 8% H2) and atmospheric air;
viii. Mercury porosimetry – Thermo Fisher Mercury Intrusion Porosimeter model Pascal 140/440, with a surface
tension and a mercury contact angle set to 0.480 N/m and 140°, respectively;
ix. X-ray diffractometry – PANalytical Diffractometer
model X’Pert PRO MPD, using Cu K radiation and an
angular range from 5 to 80° (2).
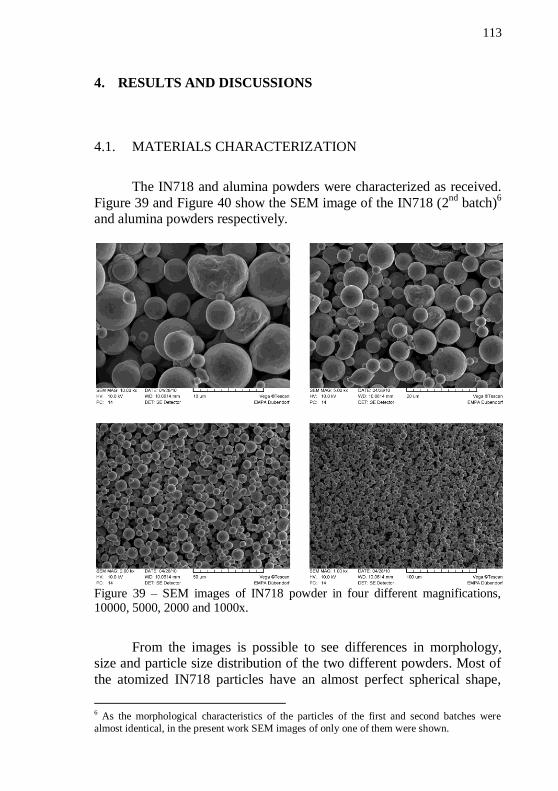
113
4. RESULTS AND DISCUSSIONS
4.1. MATERIALS CHARACTERIZATION
The IN718 and alumina powders were characterized as received.
Figure 39 and Figure 40 show the SEM image of the IN718 (2nd
batch)6
and alumina powders respectively.
Figure 39 – SEM images of IN718 powder in four different magnifications, 10000, 5000, 2000 and 1000x.
From the images is possible to see differences in morphology, size and particle size distribution of the two different powders. Most of
the atomized IN718 particles have an almost perfect spherical shape,
6 As the morphological characteristics of the particles of the first and second batches were
almost identical, in the present work SEM images of only one of them were shown.
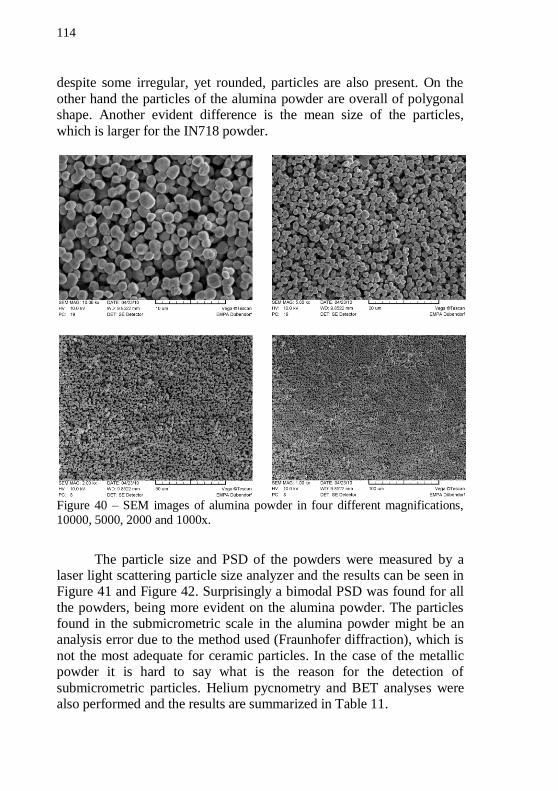
114
despite some irregular, yet rounded, particles are also present. On the
other hand the particles of the alumina powder are overall of polygonal shape. Another evident difference is the mean size of the particles,
which is larger for the IN718 powder.
Figure 40 – SEM images of alumina powder in four different magnifications,
10000, 5000, 2000 and 1000x.
The particle size and PSD of the powders were measured by a laser light scattering particle size analyzer and the results can be seen in Figure 41 and Figure 42. Surprisingly a bimodal PSD was found for all
the powders, being more evident on the alumina powder. The particles found in the submicrometric scale in the alumina powder might be an analysis error due to the method used (Fraunhofer diffraction), which is
not the most adequate for ceramic particles. In the case of the metallic powder it is hard to say what is the reason for the detection of
submicrometric particles. Helium pycnometry and BET analyses were also performed and the results are summarized in Table 11.
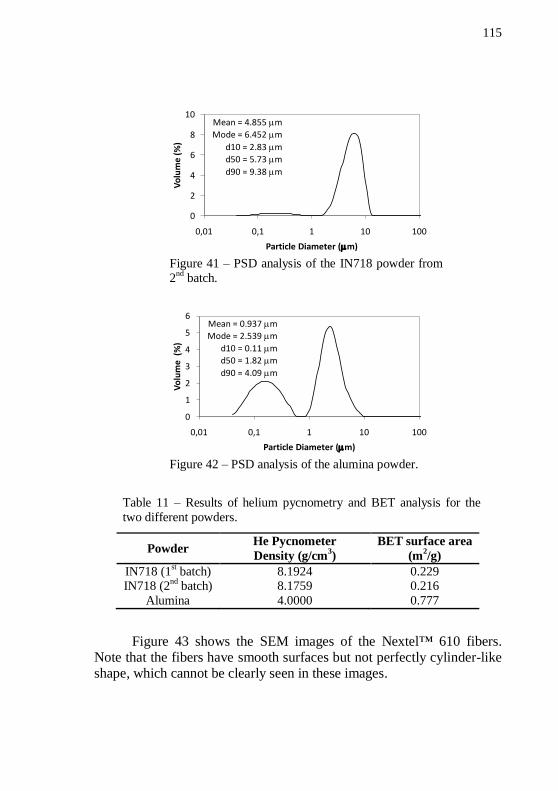
115
Figure 41 – PSD analysis of the IN718 powder from
2nd
batch.
Figure 42 – PSD analysis of the alumina powder.
Table 11 – Results of helium pycnometry and BET analysis for the
two different powders.
Powder He Pycnometer
Density (g/cm3)
BET surface area
(m2/g)
IN718 (1st batch) 8.1924 0.229
IN718 (2nd
batch) 8.1759 0.216
Alumina 4.0000 0.777
Figure 43 shows the SEM images of the Nextel™ 610 fibers. Note that the fibers have smooth surfaces but not perfectly cylinder-like shape, which cannot be clearly seen in these images.
0
2
4
6
8
10
0,01 0,1 1 10 100
Vo
lum
e (
%)
Particle Diameter (m)
IN718 (2nd lot)
Mean = 4.855 m
Mode = 6.452 m
d10 = 2.83 m
d50 = 5.73 m
d90 = 9.38 m
0
1
2
3
4
5
6
0,01 0,1 1 10 100
Vo
lum
e (
%)
Particle Diameter (m)
Alumina
Mean = 0.937 m
Mode = 2.539 m
d10 = 0.11 m
d50 = 1.82 m
d90 = 4.09 m
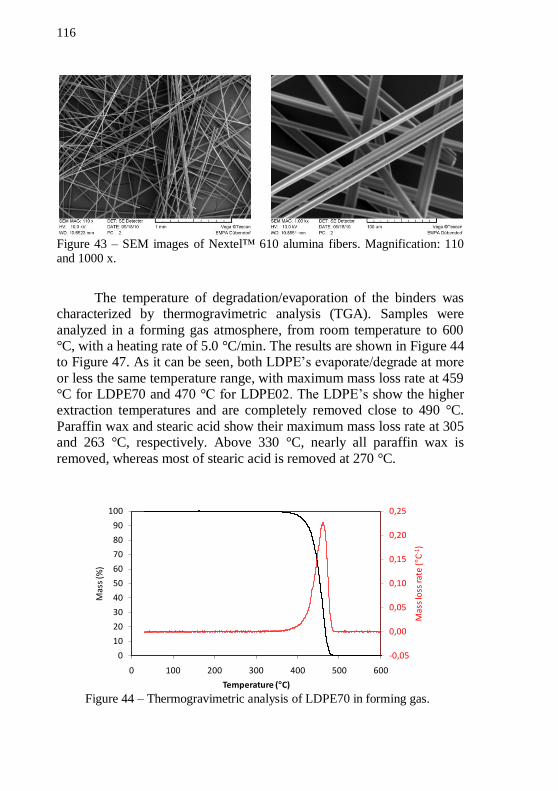
116
Figure 43 – SEM images of Nextel™ 610 alumina fibers. Magnification: 110 and 1000 x.
The temperature of degradation/evaporation of the binders was characterized by thermogravimetric analysis (TGA). Samples were
analyzed in a forming gas atmosphere, from room temperature to 600 °C, with a heating rate of 5.0 °C/min. The results are shown in Figure 44 to Figure 47. As it can be seen, both LDPE’s evaporate/degrade at more
or less the same temperature range, with maximum mass loss rate at 459 °C for LDPE70 and 470 °C for LDPE02. The LDPE’s show the higher extraction temperatures and are completely removed close to 490 °C.
Paraffin wax and stearic acid show their maximum mass loss rate at 305 and 263 °C, respectively. Above 330 °C, nearly all paraffin wax is
removed, whereas most of stearic acid is removed at 270 °C.
Figure 44 – Thermogravimetric analysis of LDPE70 in forming gas.
-0,05
0,00
0,05
0,10
0,15
0,20
0,25
0
10
20
30
40
50
60
70
80
90
100
0 100 200 300 400 500 600
Mas
s lo
ss ra
te (°C
-1)
Mas
s (%
)
Temperature (°C)
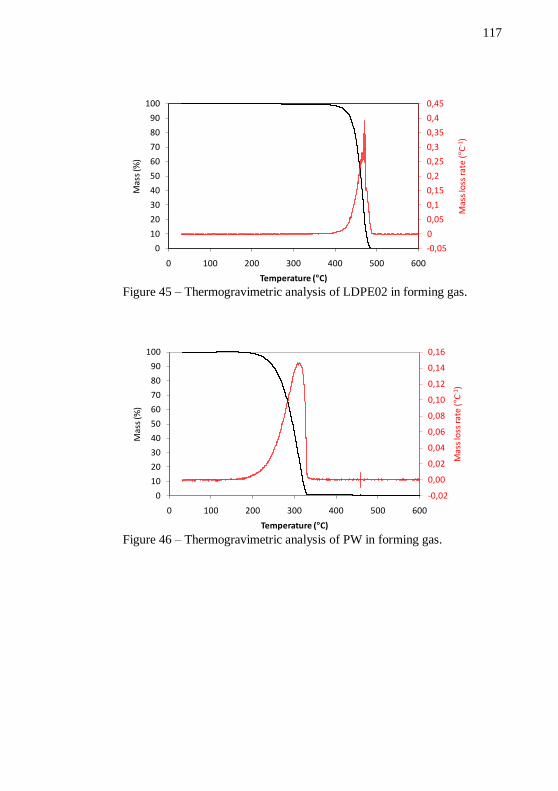
117
Figure 45 – Thermogravimetric analysis of LDPE02 in forming gas.
Figure 46 – Thermogravimetric analysis of PW in forming gas.
-0,05
0
0,05
0,1
0,15
0,2
0,25
0,3
0,35
0,4
0,45
0
10
20
30
40
50
60
70
80
90
100
0 100 200 300 400 500 600
Mas
s lo
ss ra
te (°C
-1)
Mas
s (%
)
Temperature (°C)
-0,02
0,00
0,02
0,04
0,06
0,08
0,10
0,12
0,14
0,16
0
10
20
30
40
50
60
70
80
90
100
0 100 200 300 400 500 600
Mas
s lo
ss ra
te (°C
-1)
Mas
s (%
)
Temperature (°C)
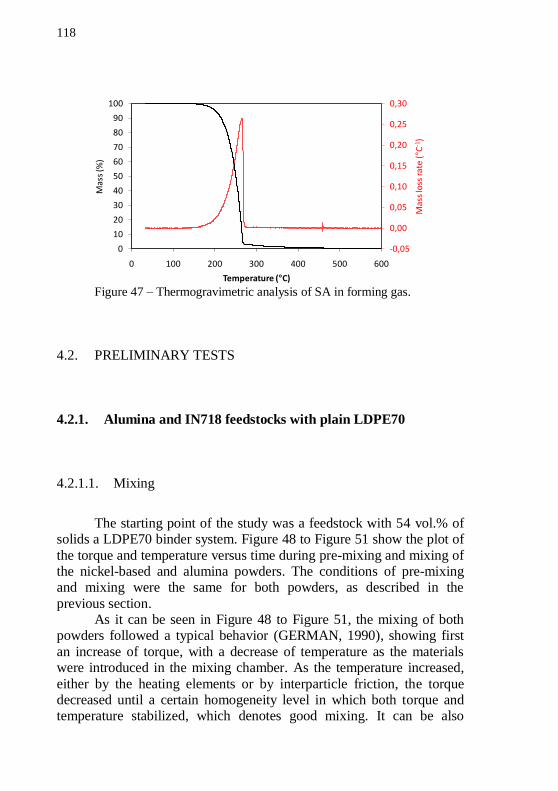
118
Figure 47 – Thermogravimetric analysis of SA in forming gas.
4.2. PRELIMINARY TESTS
4.2.1. Alumina and IN718 feedstocks with plain LDPE70
4.2.1.1. Mixing
The starting point of the study was a feedstock with 54 vol.% of solids a LDPE70 binder system. Figure 48 to Figure 51 show the plot of
the torque and temperature versus time during pre-mixing and mixing of the nickel-based and alumina powders. The conditions of pre-mixing and mixing were the same for both powders, as described in the
previous section. As it can be seen in Figure 48 to Figure 51, the mixing of both
powders followed a typical behavior (GERMAN, 1990), showing first
an increase of torque, with a decrease of temperature as the materials were introduced in the mixing chamber. As the temperature increased,
either by the heating elements or by interparticle friction, the torque decreased until a certain homogeneity level in which both torque and temperature stabilized, which denotes good mixing. It can be also
-0,05
0,00
0,05
0,10
0,15
0,20
0,25
0,30
0
10
20
30
40
50
60
70
80
90
100
0 100 200 300 400 500 600
Mas
s lo
ss ra
te (°C
-1)
Mas
s (%
)
Temperature (°C)
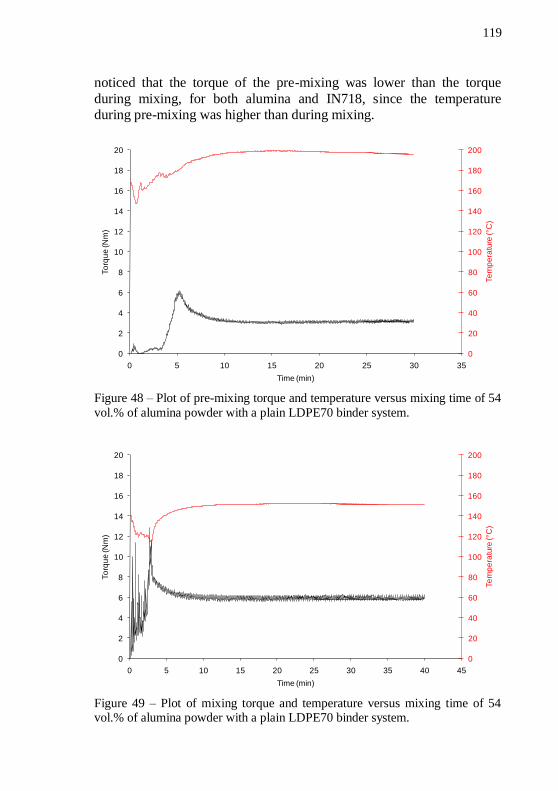
119
noticed that the torque of the pre-mixing was lower than the torque
during mixing, for both alumina and IN718, since the temperature during pre-mixing was higher than during mixing.
Figure 48 – Plot of pre-mixing torque and temperature versus mixing time of 54
vol.% of alumina powder with a plain LDPE70 binder system.
Figure 49 – Plot of mixing torque and temperature versus mixing time of 54 vol.% of alumina powder with a plain LDPE70 binder system.
0
20
40
60
80
100
120
140
160
180
200
0
2
4
6
8
10
12
14
16
18
20
0 5 10 15 20 25 30 35
Te
mp
era
ture
(°C
)
To
rqu
e (N
m)
Time (min)
0
20
40
60
80
100
120
140
160
180
200
0
2
4
6
8
10
12
14
16
18
20
0 5 10 15 20 25 30 35 40 45
Te
mp
era
ture
(°C
)
To
rqu
e (N
m)
Time (min)
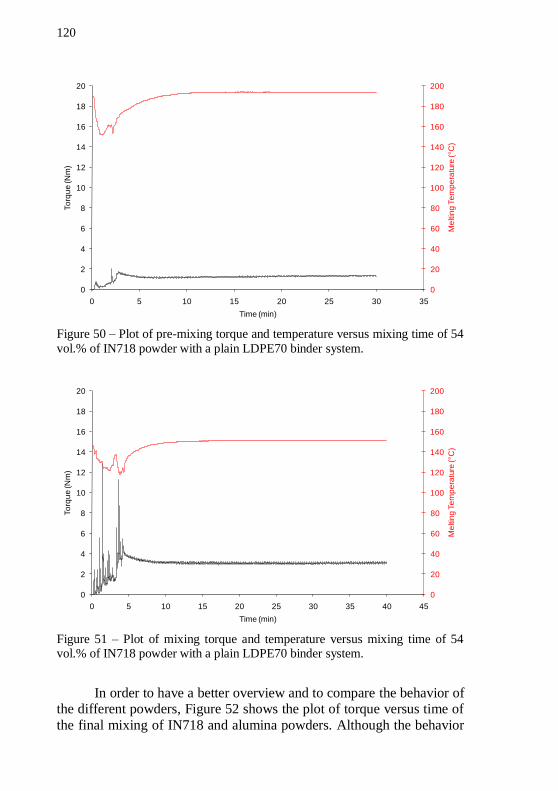
120
Figure 50 – Plot of pre-mixing torque and temperature versus mixing time of 54
vol.% of IN718 powder with a plain LDPE70 binder system.
Figure 51 – Plot of mixing torque and temperature versus mixing time of 54 vol.% of IN718 powder with a plain LDPE70 binder system.
In order to have a better overview and to compare the behavior of the different powders, Figure 52 shows the plot of torque versus time of
the final mixing of IN718 and alumina powders. Although the behavior
0
20
40
60
80
100
120
140
160
180
200
0
2
4
6
8
10
12
14
16
18
20
0 5 10 15 20 25 30 35
Me
ltin
g T
em
pe
ratu
re (°C
)
To
rqu
e (N
m)
Time (min)
0
20
40
60
80
100
120
140
160
180
200
0
2
4
6
8
10
12
14
16
18
20
0 5 10 15 20 25 30 35 40 45
Me
ltin
g T
em
pe
ratu
re (°C
)
To
rqu
e (N
m)
Time (min)
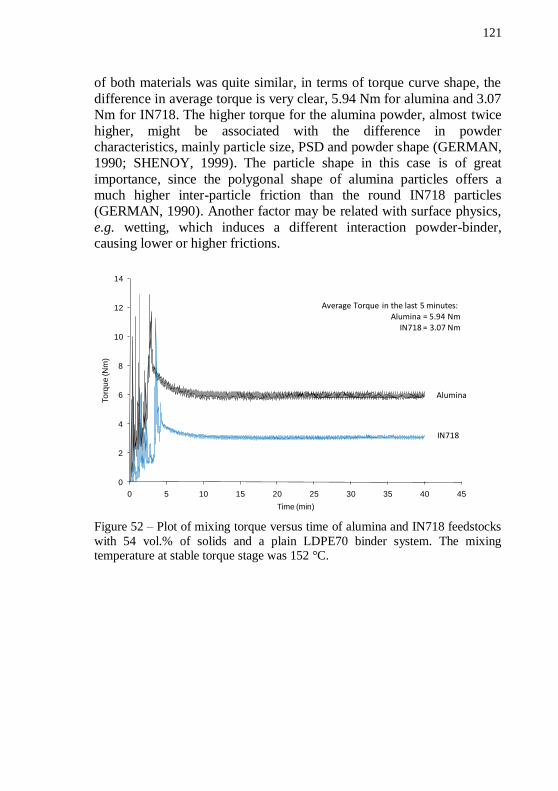
121
of both materials was quite similar, in terms of torque curve shape, the
difference in average torque is very clear, 5.94 Nm for alumina and 3.07 Nm for IN718. The higher torque for the alumina powder, almost twice
higher, might be associated with the difference in powder characteristics, mainly particle size, PSD and powder shape (GERMAN, 1990; SHENOY, 1999). The particle shape in this case is of great
importance, since the polygonal shape of alumina particles offers a much higher inter-particle friction than the round IN718 particles (GERMAN, 1990). Another factor may be related with surface physics,
e.g. wetting, which induces a different interaction powder-binder, causing lower or higher frictions.
Figure 52 – Plot of mixing torque versus time of alumina and IN718 feedstocks
with 54 vol.% of solids and a plain LDPE70 binder system. The mixing temperature at stable torque stage was 152 °C.
0
2
4
6
8
10
12
14
0 5 10 15 20 25 30 35 40 45
To
rqu
e (N
m)
Time (min)
Alumina
IN718
Average Torque in the last 5 minutes:Alumina = 5.94 Nm
IN718 = 3.07 Nm
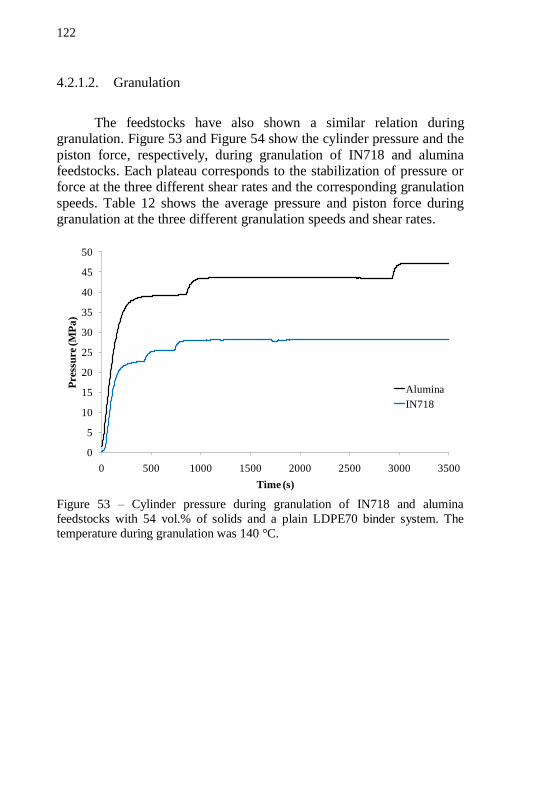
122
4.2.1.2. Granulation
The feedstocks have also shown a similar relation during granulation. Figure 53 and Figure 54 show the cylinder pressure and the
piston force, respectively, during granulation of IN718 and alumina feedstocks. Each plateau corresponds to the stabilization of pressure or force at the three different shear rates and the corresponding granulation
speeds. Table 12 shows the average pressure and piston force during granulation at the three different granulation speeds and shear rates.
Figure 53 – Cylinder pressure during granulation of IN718 and alumina
feedstocks with 54 vol.% of solids and a plain LDPE70 binder system. The
temperature during granulation was 140 °C.
0
5
10
15
20
25
30
35
40
45
50
0 500 1000 1500 2000 2500 3000 3500
Pre
ssu
re (M
Pa
)
Time (s)
Alumina
IN718

123
Figure 54 – Piston force during granulation of IN718 and alumina feedstocks
with 54 vol.% of solids and a plain LDPE70 binder system. The temperature during granulation was 140 °C.
Table 12 – Average pressure and piston force at plateau during granulation of
IN718 and alumina feedstocks at the three different shear rates and granulation speeds.
Feedstock
Shear
rate
(s-1
)
Granulation
speed (mm/min)
Average
pressure
(MPa)
Average
piston force
(kN)
Alumina
80 600 39.28 17.19
100 750 43.49 19.66
120 900 47.15 21.49
IN718
80 600 22.52 9.57
100 750 25.47 10.99
120 900 28.13 12.50
Figure 55 shows the plot of the average pressure versus the shear rate imposed to the feedstocks. Note that both feedstocks show roughly
the same sensitivity to the shear rate, showing nearly the same increment on pressure with the increase of shear rate, which means that the difference on morphology and PSD of the powders have virtually no
influence on the pseudoplasticity of the feedstocks for this shear rates range.
0
5
10
15
20
25
0 500 1000 1500 2000 2500 3000 3500
Pis
ton
Fo
rce
(kN
)
Time (s)
Alumina
IN718
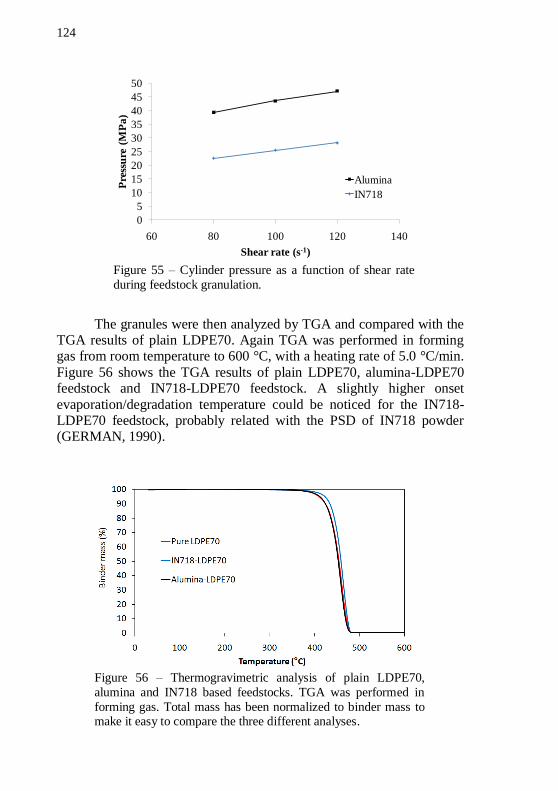
124
Figure 55 – Cylinder pressure as a function of shear rate
during feedstock granulation.
The granules were then analyzed by TGA and compared with the TGA results of plain LDPE70. Again TGA was performed in forming gas from room temperature to 600 °C, with a heating rate of 5.0 °C/min.
Figure 56 shows the TGA results of plain LDPE70, alumina-LDPE70 feedstock and IN718-LDPE70 feedstock. A slightly higher onset
evaporation/degradation temperature could be noticed for the IN718-LDPE70 feedstock, probably related with the PSD of IN718 powder (GERMAN, 1990).
Figure 56 – Thermogravimetric analysis of plain LDPE70,
alumina and IN718 based feedstocks. TGA was performed in
forming gas. Total mass has been normalized to binder mass to make it easy to compare the three different analyses.
0
5
10
15
20
25
30
35
40
45
50
60 80 100 120 140
Pre
ssu
re (
MP
a)
Shear rate (s-1)
Alumina
IN718
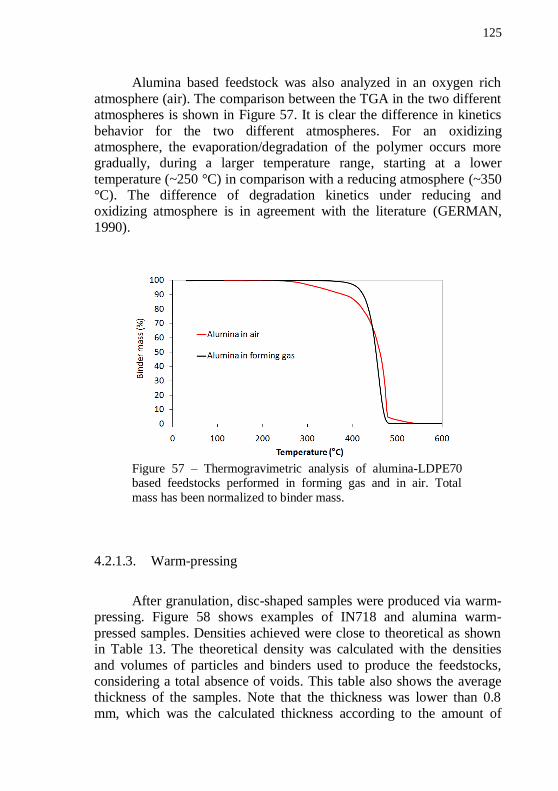
125
Alumina based feedstock was also analyzed in an oxygen rich
atmosphere (air). The comparison between the TGA in the two different atmospheres is shown in Figure 57. It is clear the difference in kinetics
behavior for the two different atmospheres. For an oxidizing atmosphere, the evaporation/degradation of the polymer occurs more gradually, during a larger temperature range, starting at a lower
temperature (~250 °C) in comparison with a reducing atmosphere (~350 °C). The difference of degradation kinetics under reducing and oxidizing atmosphere is in agreement with the literature (GERMAN,
1990).
Figure 57 – Thermogravimetric analysis of alumina-LDPE70 based feedstocks performed in forming gas and in air. Total
mass has been normalized to binder mass.
4.2.1.3. Warm-pressing
After granulation, disc-shaped samples were produced via warm-pressing. Figure 58 shows examples of IN718 and alumina warm-
pressed samples. Densities achieved were close to theoretical as shown in Table 13. The theoretical density was calculated with the densities
and volumes of particles and binders used to produce the feedstocks, considering a total absence of voids. This table also shows the average thickness of the samples. Note that the thickness was lower than 0.8
mm, which was the calculated thickness according to the amount of
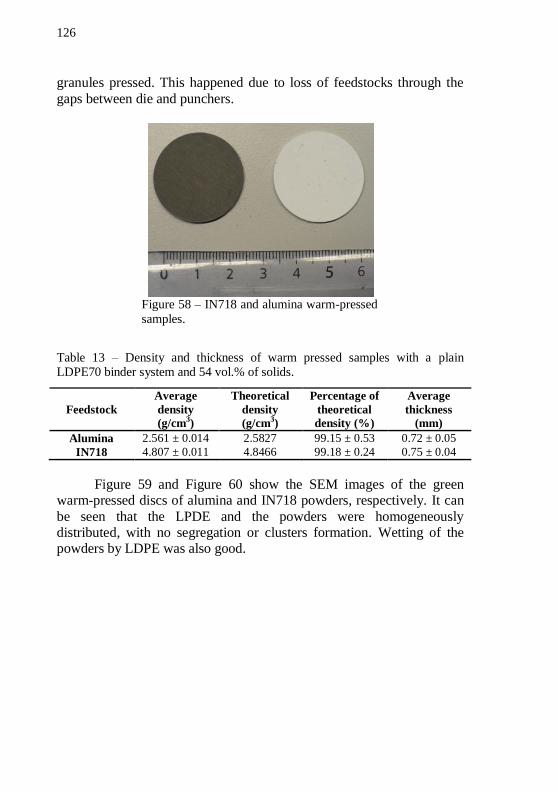
126
granules pressed. This happened due to loss of feedstocks through the
gaps between die and punchers.
Figure 58 – IN718 and alumina warm-pressed
samples.
Table 13 – Density and thickness of warm pressed samples with a plain LDPE70 binder system and 54 vol.% of solids.
Feedstock
Average
density
(g/cm3)
Theoretical
density
(g/cm3)
Percentage of
theoretical
density (%)
Average
thickness
(mm)
Alumina 2.561 ± 0.014 2.5827 99.15 ± 0.53 0.72 ± 0.05
IN718 4.807 ± 0.011 4.8466 99.18 ± 0.24 0.75 ± 0.04
Figure 59 and Figure 60 show the SEM images of the green
warm-pressed discs of alumina and IN718 powders, respectively. It can
be seen that the LPDE and the powders were homogeneously distributed, with no segregation or clusters formation. Wetting of the powders by LDPE was also good.
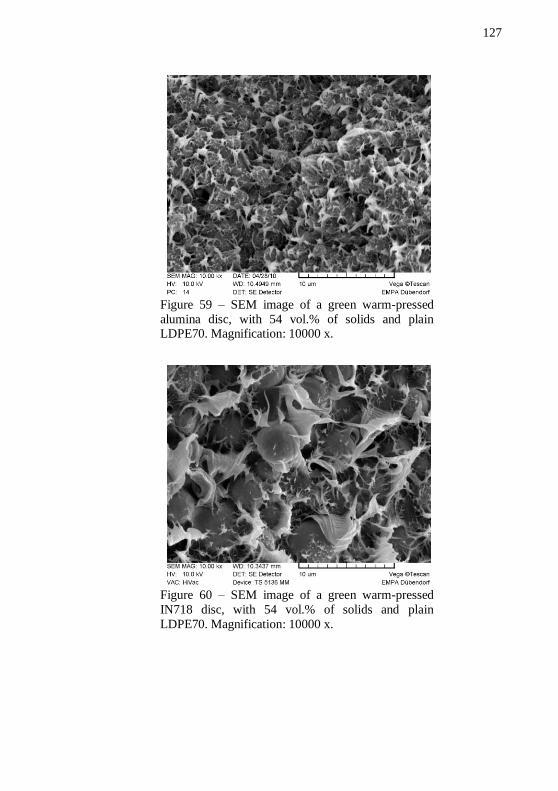
127
Figure 59 – SEM image of a green warm-pressed
alumina disc, with 54 vol.% of solids and plain LDPE70. Magnification: 10000 x.
Figure 60 – SEM image of a green warm-pressed
IN718 disc, with 54 vol.% of solids and plain
LDPE70. Magnification: 10000 x.
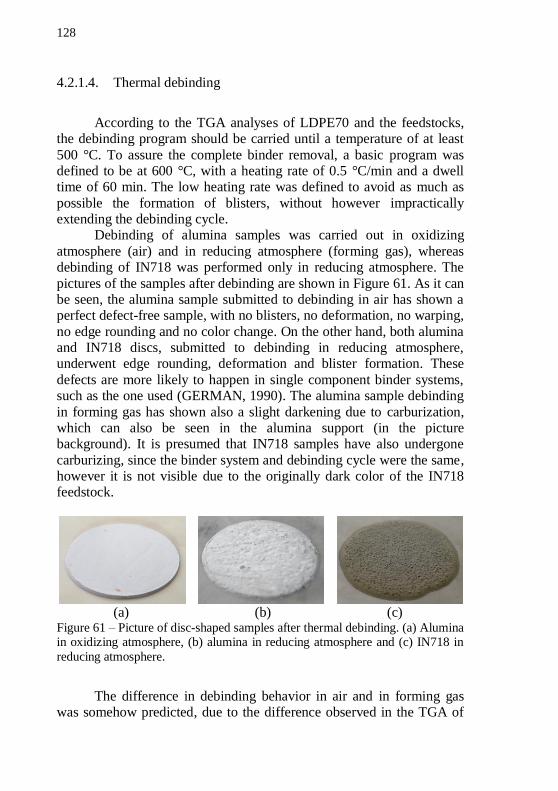
128
4.2.1.4. Thermal debinding
According to the TGA analyses of LDPE70 and the feedstocks, the debinding program should be carried until a temperature of at least
500 °C. To assure the complete binder removal, a basic program was defined to be at 600 °C, with a heating rate of 0.5 °C/min and a dwell time of 60 min. The low heating rate was defined to avoid as much as
possible the formation of blisters, without however impractically extending the debinding cycle.
Debinding of alumina samples was carried out in oxidizing
atmosphere (air) and in reducing atmosphere (forming gas), whereas debinding of IN718 was performed only in reducing atmosphere. The
pictures of the samples after debinding are shown in Figure 61. As it can be seen, the alumina sample submitted to debinding in air has shown a perfect defect-free sample, with no blisters, no deformation, no warping,
no edge rounding and no color change. On the other hand, both alumina and IN718 discs, submitted to debinding in reducing atmosphere, underwent edge rounding, deformation and blister formation. These
defects are more likely to happen in single component binder systems, such as the one used (GERMAN, 1990). The alumina sample debinding
in forming gas has shown also a slight darkening due to carburization, which can also be seen in the alumina support (in the picture background). It is presumed that IN718 samples have also undergone
carburizing, since the binder system and debinding cycle were the same, however it is not visible due to the originally dark color of the IN718 feedstock.
(a) (b) (c) Figure 61 – Picture of disc-shaped samples after thermal debinding. (a) Alumina in oxidizing atmosphere, (b) alumina in reducing atmosphere and (c) IN718 in
reducing atmosphere.
The difference in debinding behavior in air and in forming gas was somehow predicted, due to the difference observed in the TGA of
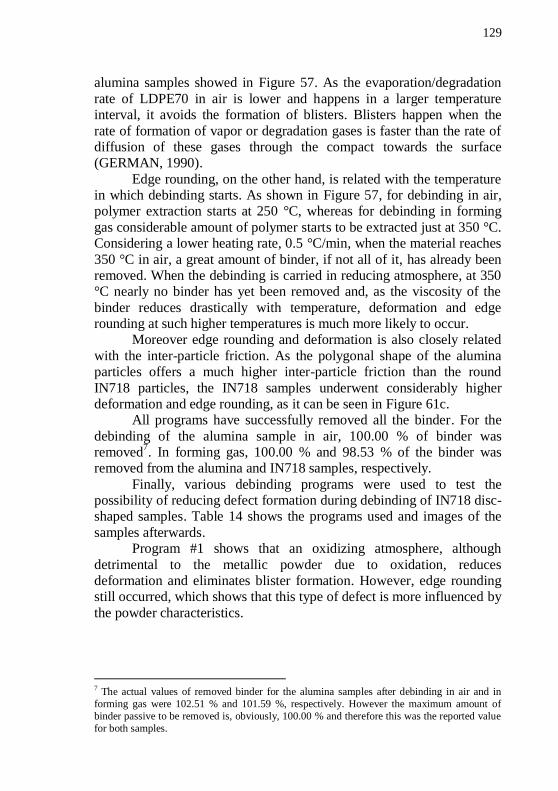
129
alumina samples showed in Figure 57. As the evaporation/degradation
rate of LDPE70 in air is lower and happens in a larger temperature interval, it avoids the formation of blisters. Blisters happen when the
rate of formation of vapor or degradation gases is faster than the rate of diffusion of these gases through the compact towards the surface (GERMAN, 1990).
Edge rounding, on the other hand, is related with the temperature in which debinding starts. As shown in Figure 57, for debinding in air, polymer extraction starts at 250 °C, whereas for debinding in forming
gas considerable amount of polymer starts to be extracted just at 350 °C. Considering a lower heating rate, 0.5 °C/min, when the material reaches
350 °C in air, a great amount of binder, if not all of it, has already been removed. When the debinding is carried in reducing atmosphere, at 350 °C nearly no binder has yet been removed and, as the viscosity of the
binder reduces drastically with temperature, deformation and edge rounding at such higher temperatures is much more likely to occur.
Moreover edge rounding and deformation is also closely related
with the inter-particle friction. As the polygonal shape of the alumina particles offers a much higher inter-particle friction than the round
IN718 particles, the IN718 samples underwent considerably higher deformation and edge rounding, as it can be seen in Figure 61c.
All programs have successfully removed all the binder. For the
debinding of the alumina sample in air, 100.00 % of binder was removed
7. In forming gas, 100.00 % and 98.53 % of the binder was
removed from the alumina and IN718 samples, respectively.
Finally, various debinding programs were used to test the possibility of reducing defect formation during debinding of IN718 disc-shaped samples. Table 14 shows the programs used and images of the
samples afterwards. Program #1 shows that an oxidizing atmosphere, although
detrimental to the metallic powder due to oxidation, reduces deformation and eliminates blister formation. However, edge rounding still occurred, which shows that this type of defect is more influenced by
the powder characteristics.
7 The actual values of removed binder for the alumina samples after debinding in air and in
forming gas were 102.51 % and 101.59 %, respectively. However the maximum amount of
binder passive to be removed is, obviously, 100.00 % and therefore this was the reported value
for both samples.
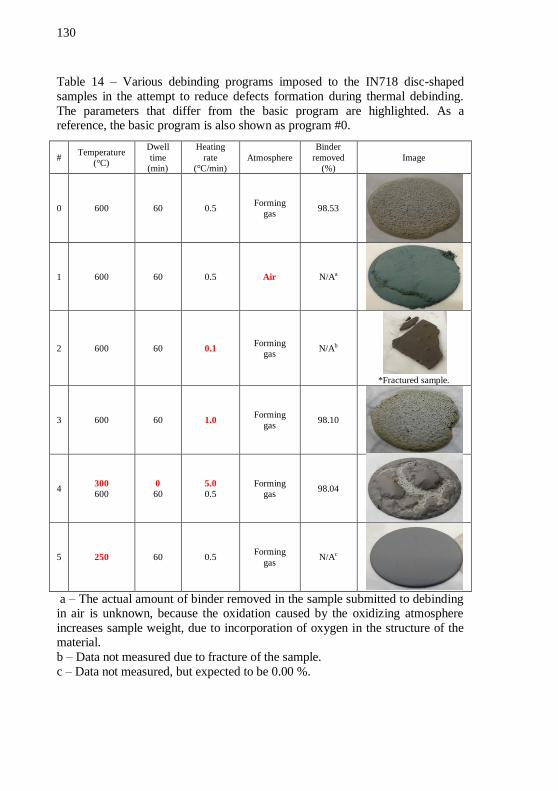
130
Table 14 – Various debinding programs imposed to the IN718 disc-shaped
samples in the attempt to reduce defects formation during thermal debinding.
The parameters that differ from the basic program are highlighted. As a reference, the basic program is also shown as program #0.
# Temperature
(°C)
Dwell
time
(min)
Heating
rate
(°C/min)
Atmosphere
Binder
removed
(%)
Image
0 600 60 0.5 Forming
gas 98.53
1 600 60 0.5 Air N/Aa
2 600 60 0.1 Forming
gas N/Ab
*Fractured sample.
3 600 60 1.0 Forming
gas 98.10
4 300
600
0
60
5.0
0.5
Forming
gas 98.04
5 250 60 0.5 Forming
gas N/Ac
a – The actual amount of binder removed in the sample submitted to debinding in air is unknown, because the oxidation caused by the oxidizing atmosphere
increases sample weight, due to incorporation of oxygen in the structure of the material.
b – Data not measured due to fracture of the sample.
c – Data not measured, but expected to be 0.00 %.
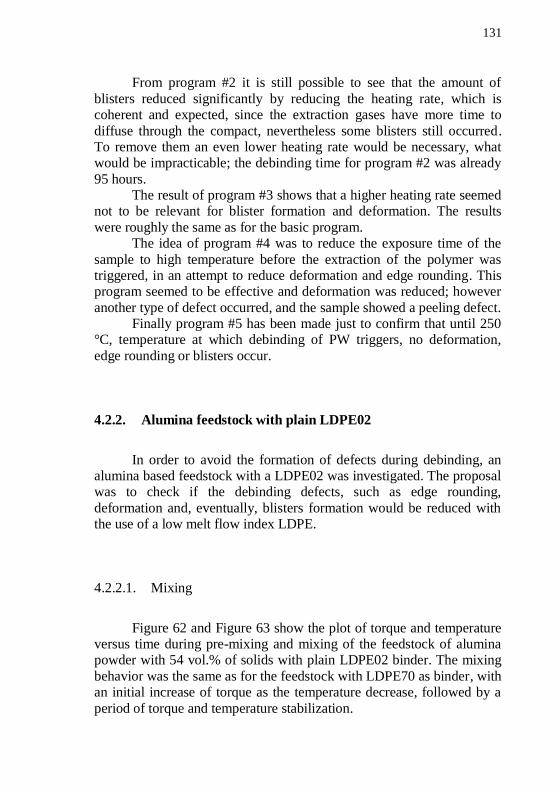
131
From program #2 it is still possible to see that the amount of
blisters reduced significantly by reducing the heating rate, which is coherent and expected, since the extraction gases have more time to
diffuse through the compact, nevertheless some blisters still occurred. To remove them an even lower heating rate would be necessary, what would be impracticable; the debinding time for program #2 was already
95 hours. The result of program #3 shows that a higher heating rate seemed
not to be relevant for blister formation and deformation. The results
were roughly the same as for the basic program. The idea of program #4 was to reduce the exposure time of the
sample to high temperature before the extraction of the polymer was triggered, in an attempt to reduce deformation and edge rounding. This program seemed to be effective and deformation was reduced; however
another type of defect occurred, and the sample showed a peeling defect. Finally program #5 has been made just to confirm that until 250
°C, temperature at which debinding of PW triggers, no deformation,
edge rounding or blisters occur.
4.2.2. Alumina feedstock with plain LDPE02
In order to avoid the formation of defects during debinding, an alumina based feedstock with a LDPE02 was investigated. The proposal was to check if the debinding defects, such as edge rounding,
deformation and, eventually, blisters formation would be reduced with the use of a low melt flow index LDPE.
4.2.2.1. Mixing
Figure 62 and Figure 63 show the plot of torque and temperature versus time during pre-mixing and mixing of the feedstock of alumina powder with 54 vol.% of solids with plain LDPE02 binder. The mixing
behavior was the same as for the feedstock with LDPE70 as binder, with an initial increase of torque as the temperature decrease, followed by a
period of torque and temperature stabilization.
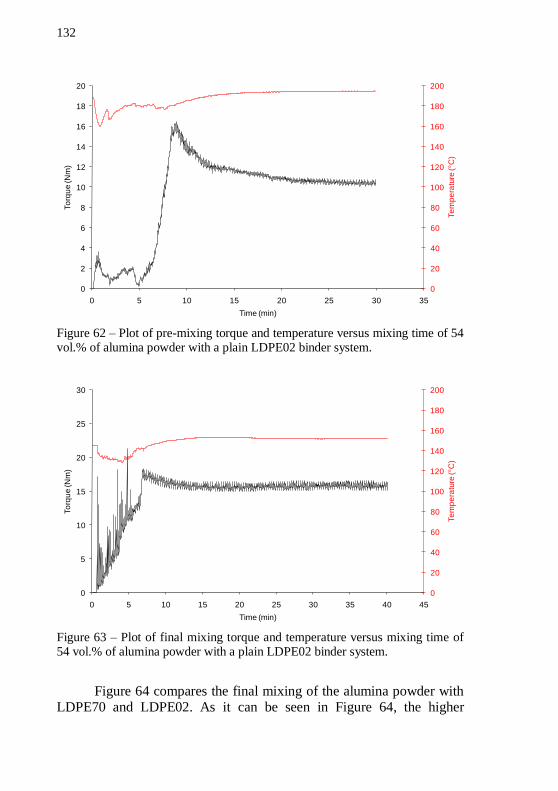
132
Figure 62 – Plot of pre-mixing torque and temperature versus mixing time of 54 vol.% of alumina powder with a plain LDPE02 binder system.
Figure 63 – Plot of final mixing torque and temperature versus mixing time of 54 vol.% of alumina powder with a plain LDPE02 binder system.
Figure 64 compares the final mixing of the alumina powder with LDPE70 and LDPE02. As it can be seen in Figure 64, the higher
0
20
40
60
80
100
120
140
160
180
200
0
2
4
6
8
10
12
14
16
18
20
0 5 10 15 20 25 30 35
Te
mp
era
ture
(°C
)
To
rqu
e (N
m)
Time (min)
0
20
40
60
80
100
120
140
160
180
200
0
5
10
15
20
25
30
0 5 10 15 20 25 30 35 40 45
Te
mp
era
ture
(°C
)
To
rqu
e (N
m)
Time (min)
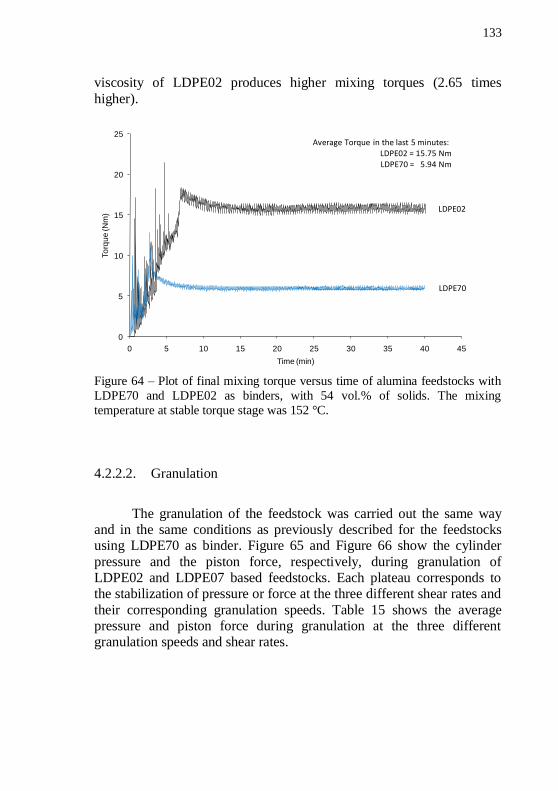
133
viscosity of LDPE02 produces higher mixing torques (2.65 times
higher).
Figure 64 – Plot of final mixing torque versus time of alumina feedstocks with
LDPE70 and LDPE02 as binders, with 54 vol.% of solids. The mixing
temperature at stable torque stage was 152 °C.
4.2.2.2. Granulation
The granulation of the feedstock was carried out the same way and in the same conditions as previously described for the feedstocks using LDPE70 as binder. Figure 65 and Figure 66 show the cylinder
pressure and the piston force, respectively, during granulation of LDPE02 and LDPE07 based feedstocks. Each plateau corresponds to the stabilization of pressure or force at the three different shear rates and
their corresponding granulation speeds. Table 15 shows the average pressure and piston force during granulation at the three different granulation speeds and shear rates.
0
5
10
15
20
25
0 5 10 15 20 25 30 35 40 45
To
rqu
e (N
m)
Time (min)
LDPE02
LDPE70
Average Torque in the last 5 minutes:LDPE02 = 15.75 NmLDPE70 = 5.94 Nm
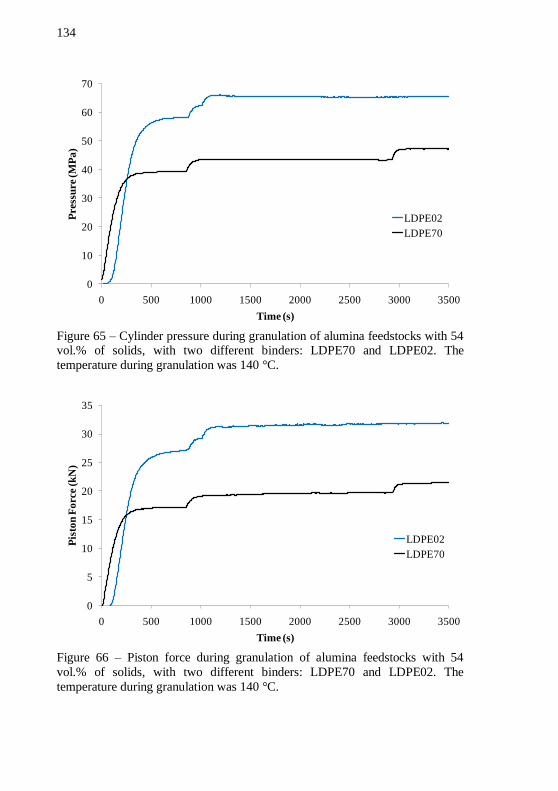
134
Figure 65 – Cylinder pressure during granulation of alumina feedstocks with 54 vol.% of solids, with two different binders: LDPE70 and LDPE02. The
temperature during granulation was 140 °C.
Figure 66 – Piston force during granulation of alumina feedstocks with 54
vol.% of solids, with two different binders: LDPE70 and LDPE02. The
temperature during granulation was 140 °C.
0
10
20
30
40
50
60
70
0 500 1000 1500 2000 2500 3000 3500
Pre
ssu
re (M
Pa
)
Time (s)
LDPE02
LDPE70
0
5
10
15
20
25
30
35
0 500 1000 1500 2000 2500 3000 3500
Pis
ton
Fo
rce
(kN
)
Time (s)
LDPE02
LDPE70
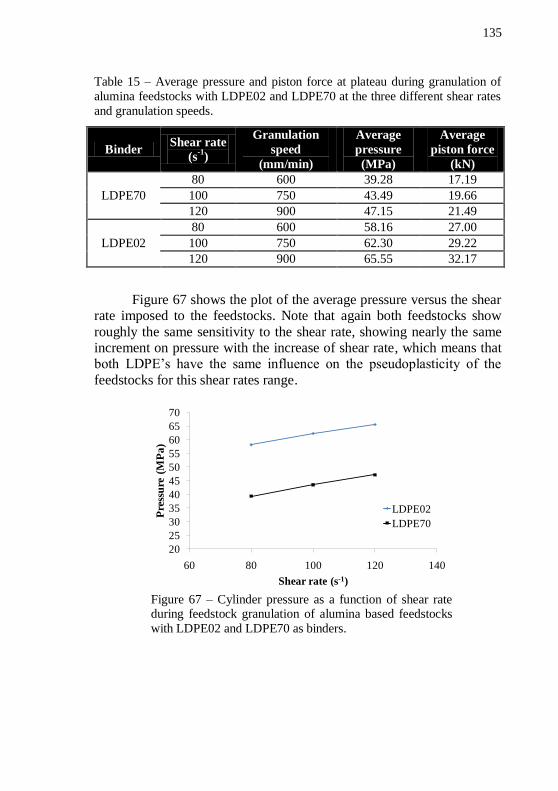
135
Table 15 – Average pressure and piston force at plateau during granulation of
alumina feedstocks with LDPE02 and LDPE70 at the three different shear rates
and granulation speeds.
Binder Shear rate
(s-1
)
Granulation
speed
(mm/min)
Average
pressure
(MPa)
Average
piston force
(kN)
LDPE70
80 600 39.28 17.19
100 750 43.49 19.66
120 900 47.15 21.49
LDPE02
80 600 58.16 27.00
100 750 62.30 29.22
120 900 65.55 32.17
Figure 67 shows the plot of the average pressure versus the shear rate imposed to the feedstocks. Note that again both feedstocks show
roughly the same sensitivity to the shear rate, showing nearly the same increment on pressure with the increase of shear rate, which means that both LDPE’s have the same influence on the pseudoplasticity of the
feedstocks for this shear rates range.
Figure 67 – Cylinder pressure as a function of shear rate during feedstock granulation of alumina based feedstocks
with LDPE02 and LDPE70 as binders.
20
25
30
35
40
45
50
55
60
65
70
60 80 100 120 140
Pre
ssu
re (
MP
a)
Shear rate (s-1)
LDPE02
LDPE70
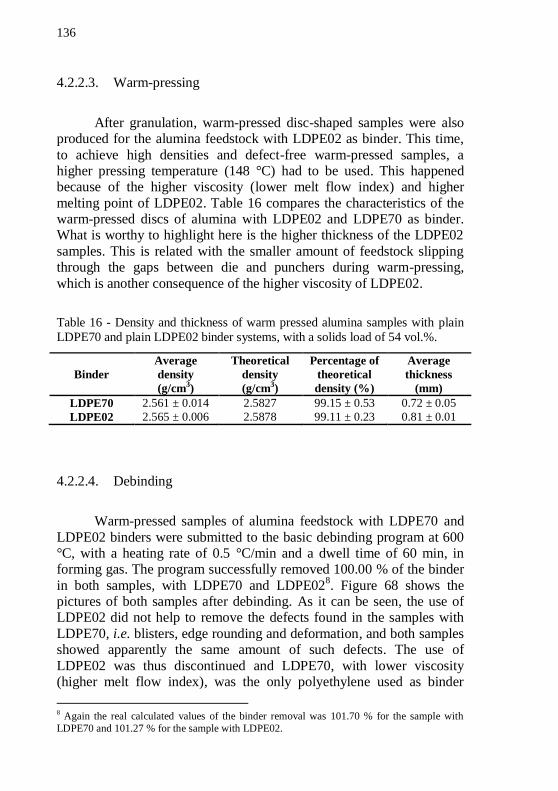
136
4.2.2.3. Warm-pressing
After granulation, warm-pressed disc-shaped samples were also produced for the alumina feedstock with LDPE02 as binder. This time,
to achieve high densities and defect-free warm-pressed samples, a higher pressing temperature (148 °C) had to be used. This happened because of the higher viscosity (lower melt flow index) and higher
melting point of LDPE02. Table 16 compares the characteristics of the warm-pressed discs of alumina with LDPE02 and LDPE70 as binder. What is worthy to highlight here is the higher thickness of the LDPE02
samples. This is related with the smaller amount of feedstock slipping through the gaps between die and punchers during warm-pressing,
which is another consequence of the higher viscosity of LDPE02.
Table 16 - Density and thickness of warm pressed alumina samples with plain
LDPE70 and plain LDPE02 binder systems, with a solids load of 54 vol.%.
Binder
Average
density
(g/cm3)
Theoretical
density
(g/cm3)
Percentage of
theoretical
density (%)
Average
thickness
(mm)
LDPE70 2.561 ± 0.014 2.5827 99.15 ± 0.53 0.72 ± 0.05
LDPE02 2.565 ± 0.006 2.5878 99.11 ± 0.23 0.81 ± 0.01
4.2.2.4. Debinding
Warm-pressed samples of alumina feedstock with LDPE70 and
LDPE02 binders were submitted to the basic debinding program at 600 °C, with a heating rate of 0.5 °C/min and a dwell time of 60 min, in forming gas. The program successfully removed 100.00 % of the binder
in both samples, with LDPE70 and LDPE028. Figure 68 shows the
pictures of both samples after debinding. As it can be seen, the use of LDPE02 did not help to remove the defects found in the samples with
LDPE70, i.e. blisters, edge rounding and deformation, and both samples showed apparently the same amount of such defects. The use of
LDPE02 was thus discontinued and LDPE70, with lower viscosity (higher melt flow index), was the only polyethylene used as binder
8 Again the real calculated values of the binder removal was 101.70 % for the sample with
LDPE70 and 101.27 % for the sample with LDPE02.
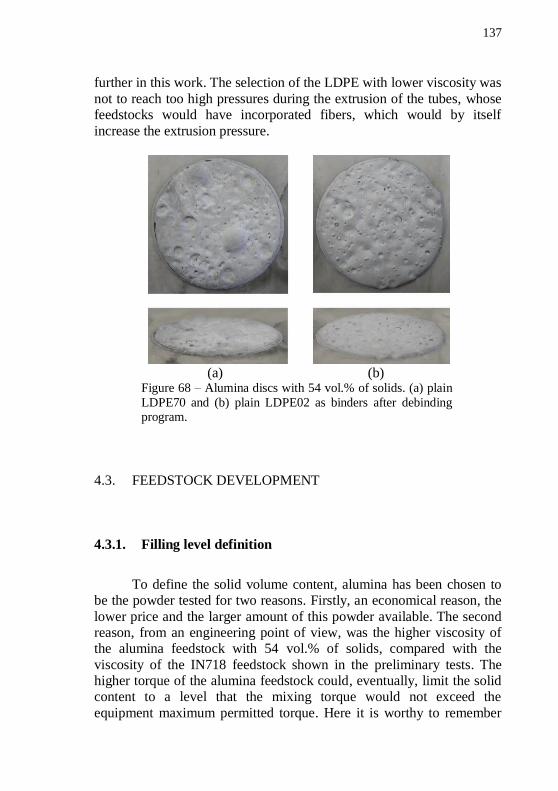
137
further in this work. The selection of the LDPE with lower viscosity was
not to reach too high pressures during the extrusion of the tubes, whose feedstocks would have incorporated fibers, which would by itself
increase the extrusion pressure.
(a) (b)
Figure 68 – Alumina discs with 54 vol.% of solids. (a) plain
LDPE70 and (b) plain LDPE02 as binders after debinding program.
4.3. FEEDSTOCK DEVELOPMENT
4.3.1. Filling level definition
To define the solid volume content, alumina has been chosen to be the powder tested for two reasons. Firstly, an economical reason, the
lower price and the larger amount of this powder available. The second reason, from an engineering point of view, was the higher viscosity of the alumina feedstock with 54 vol.% of solids, compared with the
viscosity of the IN718 feedstock shown in the preliminary tests. The higher torque of the alumina feedstock could, eventually, limit the solid content to a level that the mixing torque would not exceed the
equipment maximum permitted torque. Here it is worthy to remember
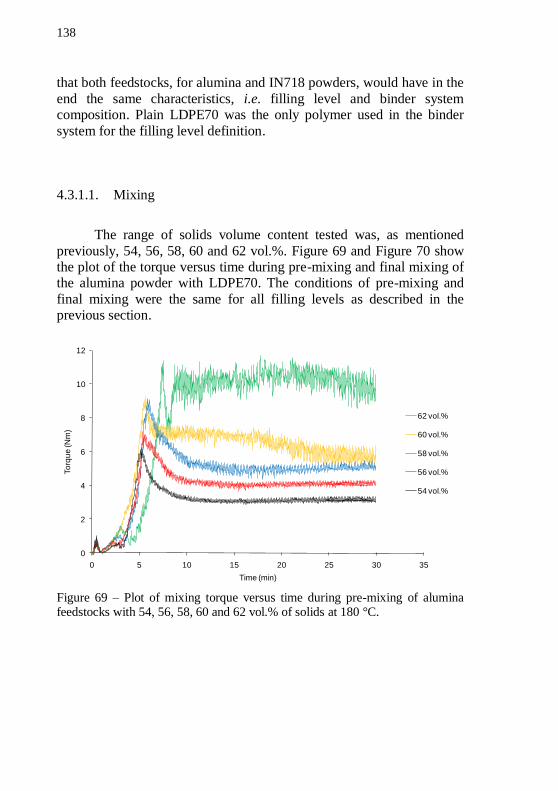
138
that both feedstocks, for alumina and IN718 powders, would have in the
end the same characteristics, i.e. filling level and binder system composition. Plain LDPE70 was the only polymer used in the binder
system for the filling level definition.
4.3.1.1. Mixing
The range of solids volume content tested was, as mentioned
previously, 54, 56, 58, 60 and 62 vol.%. Figure 69 and Figure 70 show the plot of the torque versus time during pre-mixing and final mixing of the alumina powder with LDPE70. The conditions of pre-mixing and
final mixing were the same for all filling levels as described in the previous section.
Figure 69 – Plot of mixing torque versus time during pre-mixing of alumina feedstocks with 54, 56, 58, 60 and 62 vol.% of solids at 180 °C.
0
2
4
6
8
10
12
0 5 10 15 20 25 30 35
To
rqu
e (N
m)
Time (min)
62 vol.%
60 vol.%
58 vol.%
56 vol.%
54 vol.%
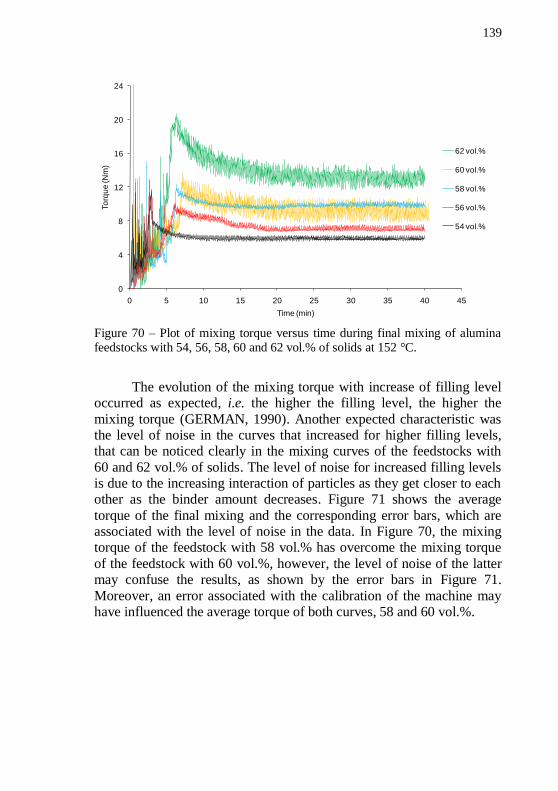
139
Figure 70 – Plot of mixing torque versus time during final mixing of alumina feedstocks with 54, 56, 58, 60 and 62 vol.% of solids at 152 °C.
The evolution of the mixing torque with increase of filling level occurred as expected, i.e. the higher the filling level, the higher the
mixing torque (GERMAN, 1990). Another expected characteristic was the level of noise in the curves that increased for higher filling levels, that can be noticed clearly in the mixing curves of the feedstocks with
60 and 62 vol.% of solids. The level of noise for increased filling levels is due to the increasing interaction of particles as they get closer to each other as the binder amount decreases. Figure 71 shows the average
torque of the final mixing and the corresponding error bars, which are associated with the level of noise in the data. In Figure 70, the mixing torque of the feedstock with 58 vol.% has overcome the mixing torque
of the feedstock with 60 vol.%, however, the level of noise of the latter may confuse the results, as shown by the error bars in Figure 71.
Moreover, an error associated with the calibration of the machine may have influenced the average torque of both curves, 58 and 60 vol.%.
0
4
8
12
16
20
24
0 5 10 15 20 25 30 35 40 45
To
rqu
e (N
m)
Time (min)
62 vol.%
60 vol.%
58 vol.%
56 vol.%
54 vol.%
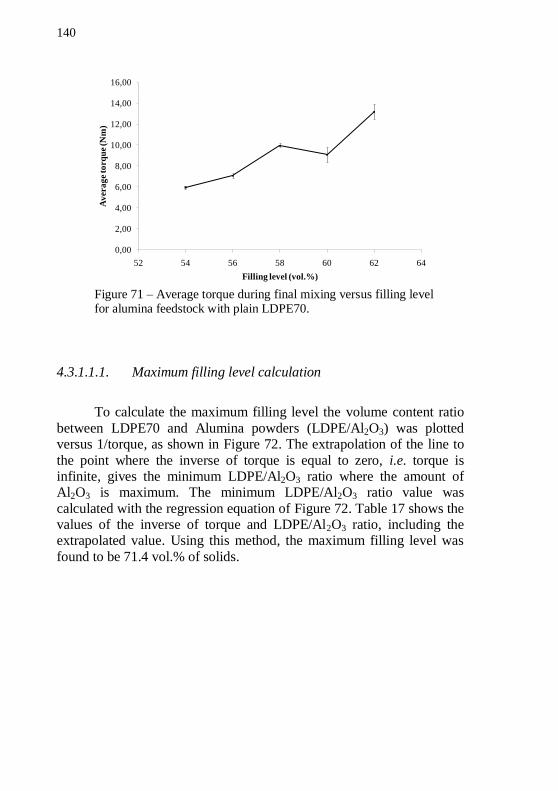
140
Figure 71 – Average torque during final mixing versus filling level for alumina feedstock with plain LDPE70.
4.3.1.1.1. Maximum filling level calculation
To calculate the maximum filling level the volume content ratio
between LDPE70 and Alumina powders (LDPE/Al2O3) was plotted versus 1/torque, as shown in Figure 72. The extrapolation of the line to
the point where the inverse of torque is equal to zero, i.e. torque is infinite, gives the minimum LDPE/Al2O3 ratio where the amount of Al2O3 is maximum. The minimum LDPE/Al2O3 ratio value was
calculated with the regression equation of Figure 72. Table 17 shows the values of the inverse of torque and LDPE/Al2O3 ratio, including the extrapolated value. Using this method, the maximum filling level was
found to be 71.4 vol.% of solids.
0,00
2,00
4,00
6,00
8,00
10,00
12,00
14,00
16,00
52 54 56 58 60 62 64
Av
era
ge
torq
ue
(Nm
)
Filling level (vol.%)
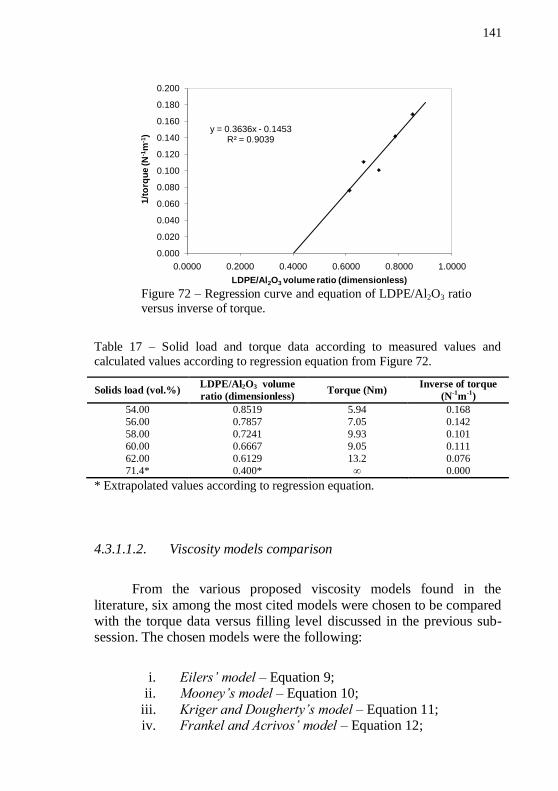
141
Figure 72 – Regression curve and equation of LDPE/Al2O3 ratio
versus inverse of torque.
Table 17 – Solid load and torque data according to measured values and
calculated values according to regression equation from Figure 72.
Solids load (vol.%) LDPE/Al2O3 volume
ratio (dimensionless) Torque (Nm)
Inverse of torque
(N-1
m-1
)
54.00 0.8519 5.94 0.168
56.00 0.7857 7.05 0.142
58.00 0.7241 9.93 0.101
60.00 0.6667 9.05 0.111
62.00 0.6129 13.2 0.076
71.4* 0.400* ∞ 0.000
* Extrapolated values according to regression equation.
4.3.1.1.2. Viscosity models comparison
From the various proposed viscosity models found in the
literature, six among the most cited models were chosen to be compared with the torque data versus filling level discussed in the previous sub-session. The chosen models were the following:
i. Eilers’ model – Equation 9; ii. Mooney’s model – Equation 10;
iii. Kriger and Dougherty’s model – Equation 11; iv. Frankel and Acrivos’ model – Equation 12;
y = 0.3636x - 0.1453R² = 0.9039
0.000
0.020
0.040
0.060
0.080
0.100
0.120
0.140
0.160
0.180
0.200
0.0000 0.2000 0.4000 0.6000 0.8000 1.0000
1/t
orq
ue
(N
-1m
-1)
LDPE/Al2O3 volume ratio (dimensionless)
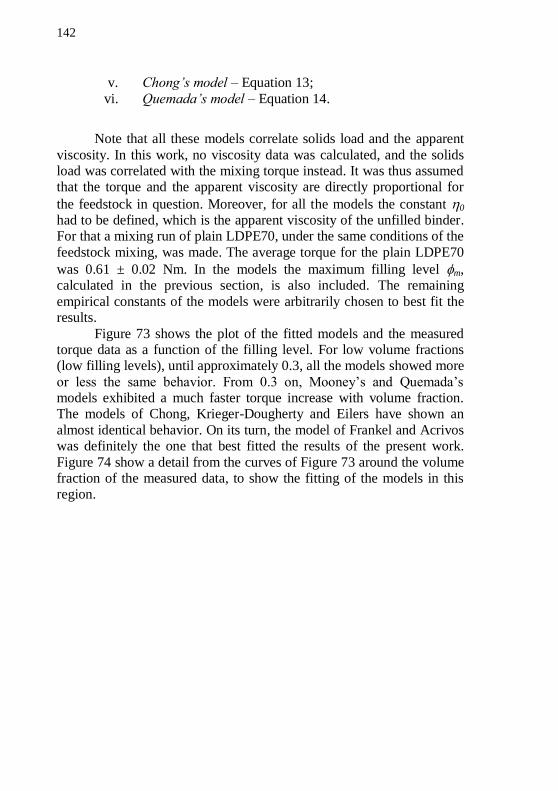
142
v. Chong’s model – Equation 13;
vi. Quemada’s model – Equation 14.
Note that all these models correlate solids load and the apparent
viscosity. In this work, no viscosity data was calculated, and the solids load was correlated with the mixing torque instead. It was thus assumed that the torque and the apparent viscosity are directly proportional for
the feedstock in question. Moreover, for all the models the constant 0 had to be defined, which is the apparent viscosity of the unfilled binder. For that a mixing run of plain LDPE70, under the same conditions of the
feedstock mixing, was made. The average torque for the plain LDPE70
was 0.61 ± 0.02 Nm. In the models the maximum filling level m, calculated in the previous section, is also included. The remaining
empirical constants of the models were arbitrarily chosen to best fit the results.
Figure 73 shows the plot of the fitted models and the measured torque data as a function of the filling level. For low volume fractions (low filling levels), until approximately 0.3, all the models showed more
or less the same behavior. From 0.3 on, Mooney’s and Quemada’s models exhibited a much faster torque increase with volume fraction. The models of Chong, Krieger-Dougherty and Eilers have shown an
almost identical behavior. On its turn, the model of Frankel and Acrivos was definitely the one that best fitted the results of the present work.
Figure 74 show a detail from the curves of Figure 73 around the volume fraction of the measured data, to show the fitting of the models in this region.
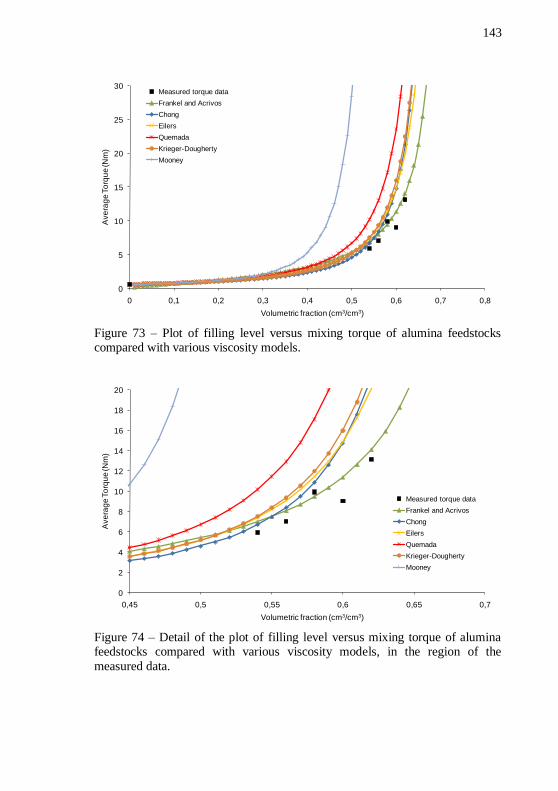
143
Figure 73 – Plot of filling level versus mixing torque of alumina feedstocks compared with various viscosity models.
Figure 74 – Detail of the plot of filling level versus mixing torque of alumina feedstocks compared with various viscosity models, in the region of the
measured data.
0
5
10
15
20
25
30
0 0,1 0,2 0,3 0,4 0,5 0,6 0,7 0,8
Ave
rag
e T
orq
ue (N
m)
Volumetric fraction (cm3/cm3)
Measured torque data
Frankel and Acrivos
Chong
Eilers
Quemada
Krieger-Dougherty
Mooney
0
2
4
6
8
10
12
14
16
18
20
0,45 0,5 0,55 0,6 0,65 0,7
Ave
rag
e T
orq
ue (N
m)
Volumetric fraction (cm3/cm3)
Measured torque data
Frankel and Acrivos
Chong
Eilers
Quemada
Krieger-Dougherty
Mooney
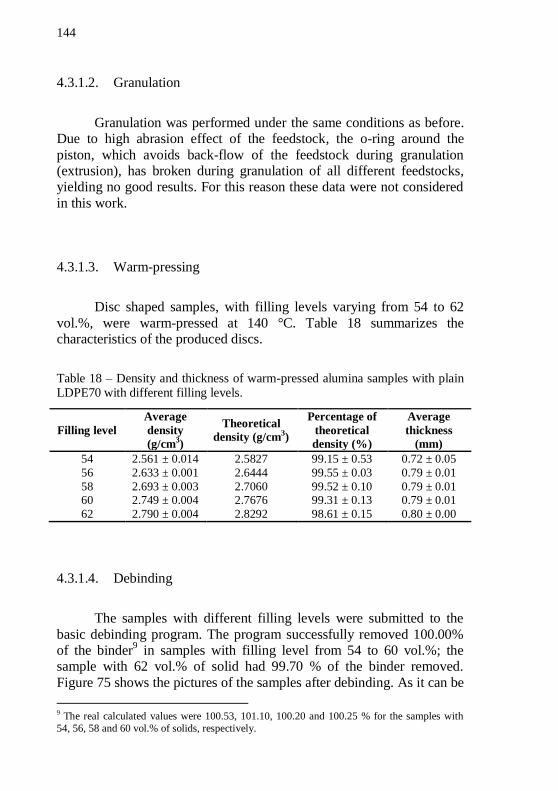
144
4.3.1.2. Granulation
Granulation was performed under the same conditions as before. Due to high abrasion effect of the feedstock, the o-ring around the
piston, which avoids back-flow of the feedstock during granulation (extrusion), has broken during granulation of all different feedstocks, yielding no good results. For this reason these data were not considered
in this work.
4.3.1.3. Warm-pressing
Disc shaped samples, with filling levels varying from 54 to 62
vol.%, were warm-pressed at 140 °C. Table 18 summarizes the characteristics of the produced discs.
Table 18 – Density and thickness of warm-pressed alumina samples with plain LDPE70 with different filling levels.
Filling level
Average
density
(g/cm3)
Theoretical
density (g/cm3)
Percentage of
theoretical
density (%)
Average
thickness
(mm)
54 2.561 ± 0.014 2.5827 99.15 ± 0.53 0.72 ± 0.05
56 2.633 ± 0.001 2.6444 99.55 ± 0.03 0.79 ± 0.01
58 2.693 ± 0.003 2.7060 99.52 ± 0.10 0.79 ± 0.01 60 2.749 ± 0.004 2.7676 99.31 ± 0.13 0.79 ± 0.01
62 2.790 ± 0.004 2.8292 98.61 ± 0.15 0.80 ± 0.00
4.3.1.4. Debinding
The samples with different filling levels were submitted to the
basic debinding program. The program successfully removed 100.00% of the binder
9 in samples with filling level from 54 to 60 vol.%; the
sample with 62 vol.% of solid had 99.70 % of the binder removed.
Figure 75 shows the pictures of the samples after debinding. As it can be
9 The real calculated values were 100.53, 101.10, 100.20 and 100.25 % for the samples with
54, 56, 58 and 60 vol.% of solids, respectively.
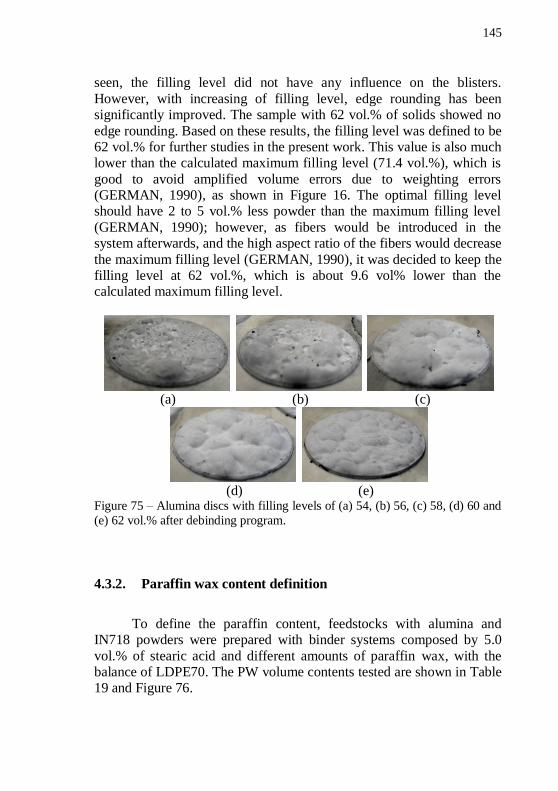
145
seen, the filling level did not have any influence on the blisters.
However, with increasing of filling level, edge rounding has been significantly improved. The sample with 62 vol.% of solids showed no
edge rounding. Based on these results, the filling level was defined to be 62 vol.% for further studies in the present work. This value is also much lower than the calculated maximum filling level (71.4 vol.%), which is
good to avoid amplified volume errors due to weighting errors (GERMAN, 1990), as shown in Figure 16. The optimal filling level should have 2 to 5 vol.% less powder than the maximum filling level
(GERMAN, 1990); however, as fibers would be introduced in the system afterwards, and the high aspect ratio of the fibers would decrease
the maximum filling level (GERMAN, 1990), it was decided to keep the filling level at 62 vol.%, which is about 9.6 vol% lower than the calculated maximum filling level.
(a) (b) (c)
(d) (e) Figure 75 – Alumina discs with filling levels of (a) 54, (b) 56, (c) 58, (d) 60 and
(e) 62 vol.% after debinding program.
4.3.2. Paraffin wax content definition
To define the paraffin content, feedstocks with alumina and IN718 powders were prepared with binder systems composed by 5.0
vol.% of stearic acid and different amounts of paraffin wax, with the balance of LDPE70. The PW volume contents tested are shown in Table 19 and Figure 76.
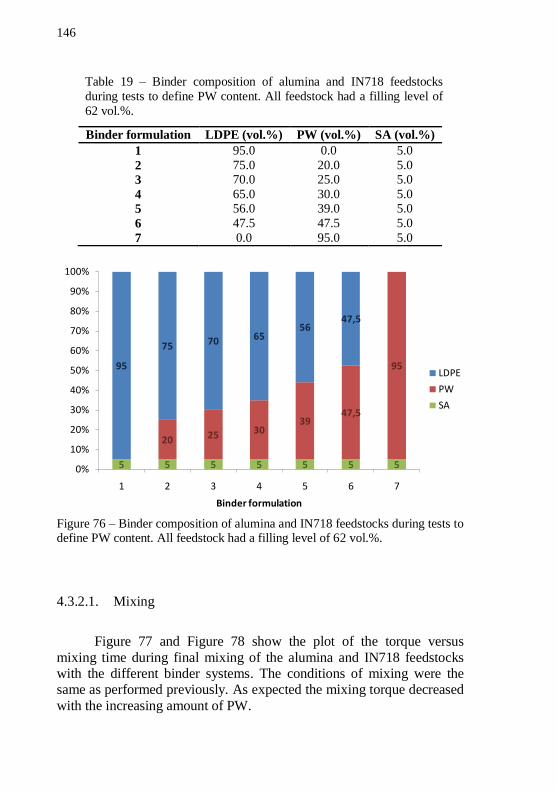
146
Table 19 – Binder composition of alumina and IN718 feedstocks
during tests to define PW content. All feedstock had a filling level of
62 vol.%.
Binder formulation LDPE (vol.%) PW (vol.%) SA (vol.%)
1 95.0 0.0 5.0
2 75.0 20.0 5.0
3 70.0 25.0 5.0
4 65.0 30.0 5.0
5 56.0 39.0 5.0
6 47.5 47.5 5.0
7 0.0 95.0 5.0
Figure 76 – Binder composition of alumina and IN718 feedstocks during tests to define PW content. All feedstock had a filling level of 62 vol.%.
4.3.2.1. Mixing
Figure 77 and Figure 78 show the plot of the torque versus
mixing time during final mixing of the alumina and IN718 feedstocks with the different binder systems. The conditions of mixing were the same as performed previously. As expected the mixing torque decreased
with the increasing amount of PW.
5 5 5 5 5 5 5
20 25 3039
47,5
9595
75 70 6556
47,5
0%
10%
20%
30%
40%
50%
60%
70%
80%
90%
100%
1 2 3 4 5 6 7
Binder formulation
LDPE
PW
SA
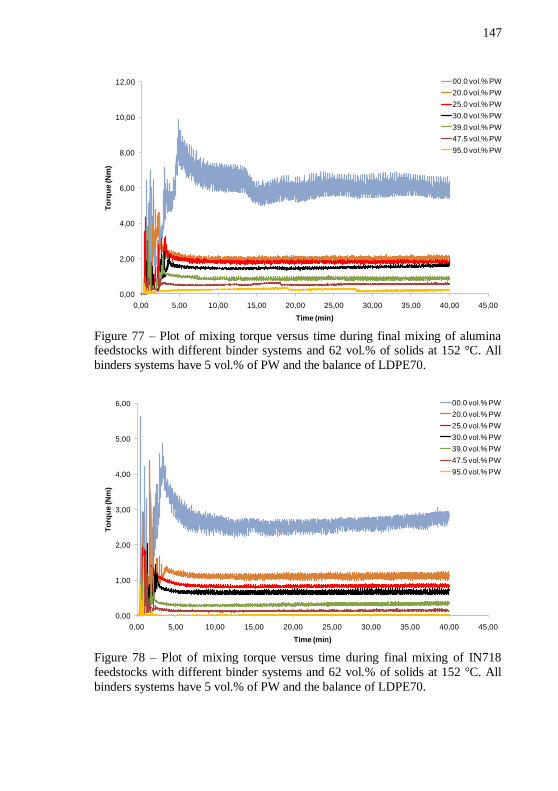
147
Figure 77 – Plot of mixing torque versus time during final mixing of alumina feedstocks with different binder systems and 62 vol.% of solids at 152 °C. All
binders systems have 5 vol.% of PW and the balance of LDPE70.
Figure 78 – Plot of mixing torque versus time during final mixing of IN718
feedstocks with different binder systems and 62 vol.% of solids at 152 °C. All
binders systems have 5 vol.% of PW and the balance of LDPE70.
0,00
2,00
4,00
6,00
8,00
10,00
12,00
0,00 5,00 10,00 15,00 20,00 25,00 30,00 35,00 40,00 45,00
To
rqu
e (N
m)
Time (min)
00.0 vol.% PW
20.0 vol.% PW
25.0 vol.% PW
30.0 vol.% PW
39.0 vol.% PW
47.5 vol.% PW
95.0 vol.% PW
0,00
1,00
2,00
3,00
4,00
5,00
6,00
0,00 5,00 10,00 15,00 20,00 25,00 30,00 35,00 40,00 45,00
To
rqu
e (N
m)
Time (min)
00.0 vol.% PW
20.0 vol.% PW
25.0 vol.% PW
30.0 vol.% PW
39.0 vol.% PW
47.5 vol.% PW
95.0 vol.% PW
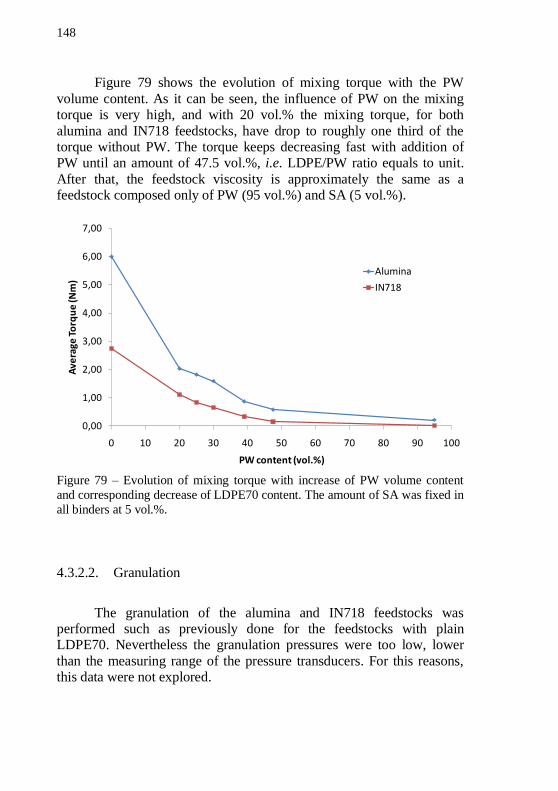
148
Figure 79 shows the evolution of mixing torque with the PW
volume content. As it can be seen, the influence of PW on the mixing torque is very high, and with 20 vol.% the mixing torque, for both
alumina and IN718 feedstocks, have drop to roughly one third of the torque without PW. The torque keeps decreasing fast with addition of PW until an amount of 47.5 vol.%, i.e. LDPE/PW ratio equals to unit.
After that, the feedstock viscosity is approximately the same as a feedstock composed only of PW (95 vol.%) and SA (5 vol.%).
Figure 79 – Evolution of mixing torque with increase of PW volume content
and corresponding decrease of LDPE70 content. The amount of SA was fixed in
all binders at 5 vol.%.
4.3.2.2. Granulation
The granulation of the alumina and IN718 feedstocks was performed such as previously done for the feedstocks with plain LDPE70. Nevertheless the granulation pressures were too low, lower
than the measuring range of the pressure transducers. For this reasons, this data were not explored.
0,00
1,00
2,00
3,00
4,00
5,00
6,00
7,00
0 10 20 30 40 50 60 70 80 90 100
Ave
rage
To
rqu
e (N
m)
PW content (vol.%)
Alumina
IN718
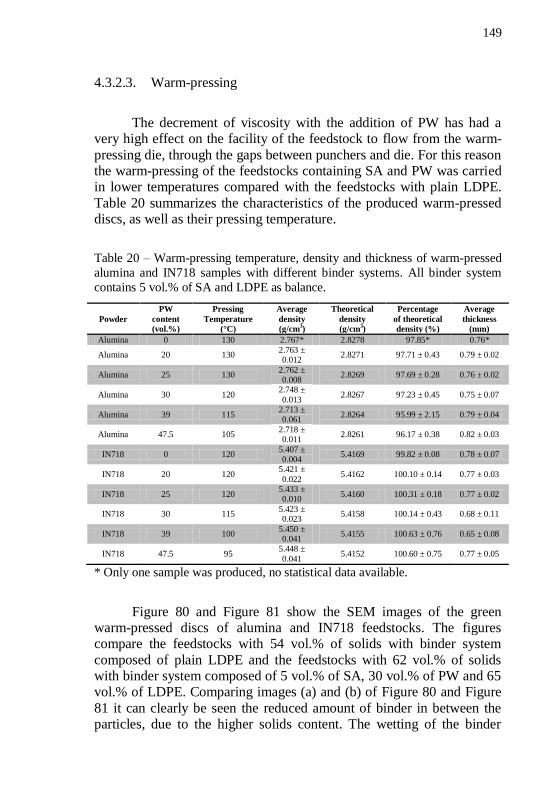
149
4.3.2.3. Warm-pressing
The decrement of viscosity with the addition of PW has had a very high effect on the facility of the feedstock to flow from the warm-
pressing die, through the gaps between punchers and die. For this reason the warm-pressing of the feedstocks containing SA and PW was carried in lower temperatures compared with the feedstocks with plain LDPE.
Table 20 summarizes the characteristics of the produced warm-pressed discs, as well as their pressing temperature.
Table 20 – Warm-pressing temperature, density and thickness of warm-pressed
alumina and IN718 samples with different binder systems. All binder system
contains 5 vol.% of SA and LDPE as balance.
Powder
PW
content
(vol.%)
Pressing
Temperature
(°C)
Average
density
(g/cm3)
Theoretical
density
(g/cm3)
Percentage
of theoretical
density (%)
Average
thickness
(mm)
Alumina 0 130 2.767* 2.8278 97.85* 0.76*
Alumina 20 130 2.763 ± 0.012
2.8271 97.71 ± 0.43 0.79 ± 0.02
Alumina 25 130 2.762 ± 0.008
2.8269 97.69 ± 0.28 0.76 ± 0.02
Alumina 30 120 2.748 ±
0.013 2.8267 97.23 ± 0.45 0.75 ± 0.07
Alumina 39 115 2.713 ± 0.061
2.8264 95.99 ± 2.15 0.79 ± 0.04
Alumina 47.5 105 2.718 ± 0.011
2.8261 96.17 ± 0.38 0.82 ± 0.03
IN718 0 120 5.407 ± 0.004
5.4169 99.82 ± 0.08 0.78 ± 0.07
IN718 20 120 5.421 ±
0.022 5.4162 100.10 ± 0.14 0.77 ± 0.03
IN718 25 120 5.433 ± 0.010
5.4160 100.31 ± 0.18 0.77 ± 0.02
IN718 30 115 5.423 ± 0.023
5.4158 100.14 ± 0.43 0.68 ± 0.11
IN718 39 100 5.450 ± 0.041
5.4155 100.63 ± 0.76 0.65 ± 0.08
IN718 47.5 95 5.448 ±
0.041 5.4152 100.60 ± 0.75 0.77 ± 0.05
* Only one sample was produced, no statistical data available.
Figure 80 and Figure 81 show the SEM images of the green warm-pressed discs of alumina and IN718 feedstocks. The figures compare the feedstocks with 54 vol.% of solids with binder system
composed of plain LDPE and the feedstocks with 62 vol.% of solids with binder system composed of 5 vol.% of SA, 30 vol.% of PW and 65 vol.% of LDPE. Comparing images (a) and (b) of Figure 80 and Figure
81 it can clearly be seen the reduced amount of binder in between the particles, due to the higher solids content. The wetting of the binder
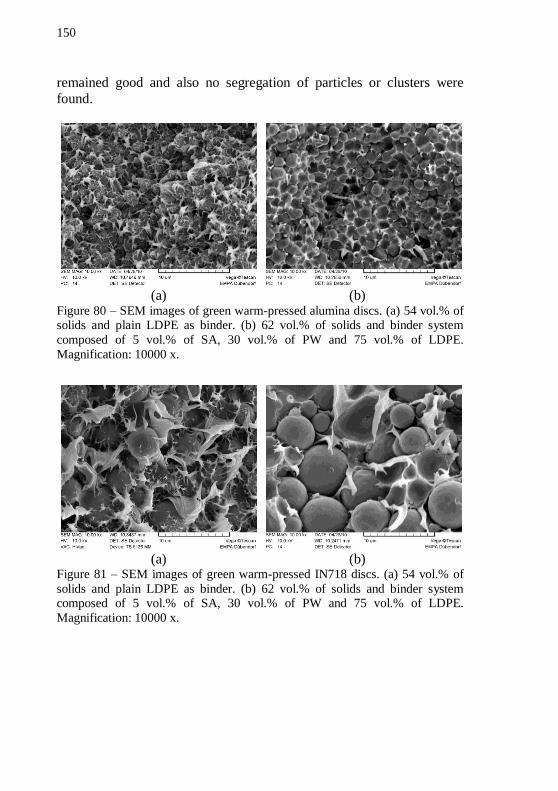
150
remained good and also no segregation of particles or clusters were
found.
(a) (b) Figure 80 – SEM images of green warm-pressed alumina discs. (a) 54 vol.% of solids and plain LDPE as binder. (b) 62 vol.% of solids and binder system
composed of 5 vol.% of SA, 30 vol.% of PW and 75 vol.% of LDPE.
Magnification: 10000 x.
(a) (b) Figure 81 – SEM images of green warm-pressed IN718 discs. (a) 54 vol.% of
solids and plain LDPE as binder. (b) 62 vol.% of solids and binder system composed of 5 vol.% of SA, 30 vol.% of PW and 75 vol.% of LDPE.
Magnification: 10000 x.
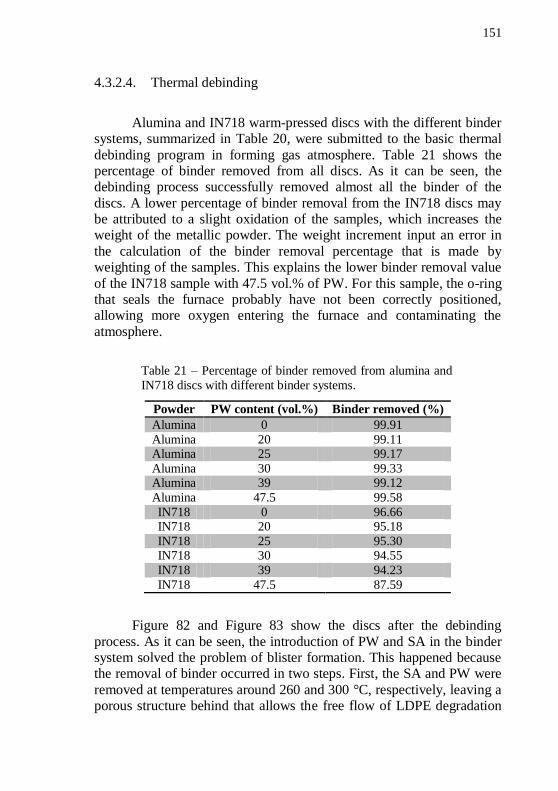
151
4.3.2.4. Thermal debinding
Alumina and IN718 warm-pressed discs with the different binder systems, summarized in Table 20, were submitted to the basic thermal
debinding program in forming gas atmosphere. Table 21 shows the percentage of binder removed from all discs. As it can be seen, the debinding process successfully removed almost all the binder of the
discs. A lower percentage of binder removal from the IN718 discs may be attributed to a slight oxidation of the samples, which increases the weight of the metallic powder. The weight increment input an error in
the calculation of the binder removal percentage that is made by weighting of the samples. This explains the lower binder removal value
of the IN718 sample with 47.5 vol.% of PW. For this sample, the o-ring that seals the furnace probably have not been correctly positioned, allowing more oxygen entering the furnace and contaminating the
atmosphere.
Table 21 – Percentage of binder removed from alumina and
IN718 discs with different binder systems.
Powder PW content (vol.%) Binder removed (%)
Alumina 0 99.91
Alumina 20 99.11 Alumina 25 99.17
Alumina 30 99.33 Alumina 39 99.12
Alumina 47.5 99.58
IN718 0 96.66 IN718 20 95.18
IN718 25 95.30 IN718 30 94.55
IN718 39 94.23
IN718 47.5 87.59
Figure 82 and Figure 83 show the discs after the debinding
process. As it can be seen, the introduction of PW and SA in the binder system solved the problem of blister formation. This happened because the removal of binder occurred in two steps. First, the SA and PW were
removed at temperatures around 260 and 300 °C, respectively, leaving a porous structure behind that allows the free flow of LDPE degradation
152
gases, which are produced in the second step of the thermal debinding,
at temperatures around 460 °C. It can also be seen that the minimum amount of PW for alumina
and IN718 feedstocks is different, 25 vol.% for the alumina feedstock and 30 vol.% for IN718 feedstocks. Below these values blisters starts to disrupt on the surface of the samples. The different limits of PW content
are correlated with the difference in powder morphology and PSD which leads to a different powder packing factor (GERMAN, 1990), probably denser for the IN718 powder. Denser packing makes
debinding slower for the IN718 powder, which makes the samples of this powder more prone to blister formation. With this results the PW
volume content has being defined to 30 vol.% of the binder system, so that both alumina and IN718 show no blister formation during debinding. This result is in agreement with what is found in the
literature, which states that a minimum of 30 vol.% of low molecular binder should be used to form a sufficient interconnected network, alloying efficient solvent debinding, which could later provide an
interconnected porous network for the subsequent thermal debinding (GERMAN, 1990).
(a) (b) (c)
(d) (e) (f) Figure 82 – Alumina discs after debinding process in forming gas atmosphere.
Feedstocks have the following PW content: (a) 47.5, (b) 39, (c) 30, (d) 25, (e)
20 and (f) 0 (zero) vol.%.
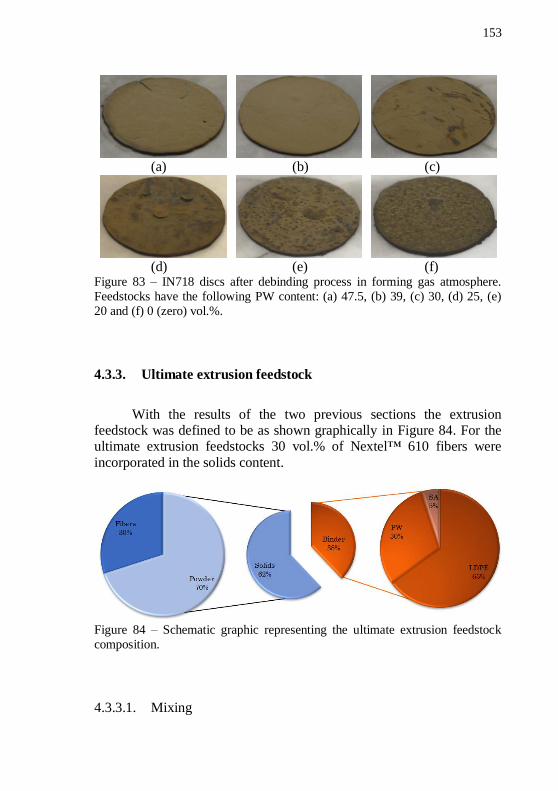
153
(a) (b) (c)
(d) (e) (f) Figure 83 – IN718 discs after debinding process in forming gas atmosphere.
Feedstocks have the following PW content: (a) 47.5, (b) 39, (c) 30, (d) 25, (e)
20 and (f) 0 (zero) vol.%.
4.3.3. Ultimate extrusion feedstock
With the results of the two previous sections the extrusion feedstock was defined to be as shown graphically in Figure 84. For the ultimate extrusion feedstocks 30 vol.% of Nextel™ 610 fibers were
incorporated in the solids content.
Figure 84 – Schematic graphic representing the ultimate extrusion feedstock
composition.
4.3.3.1. Mixing
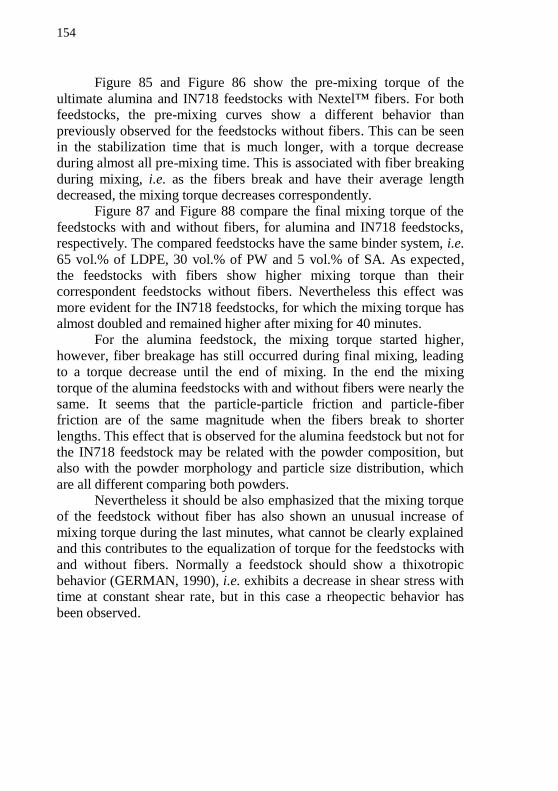
154
Figure 85 and Figure 86 show the pre-mixing torque of the
ultimate alumina and IN718 feedstocks with Nextel™ fibers. For both feedstocks, the pre-mixing curves show a different behavior than
previously observed for the feedstocks without fibers. This can be seen in the stabilization time that is much longer, with a torque decrease during almost all pre-mixing time. This is associated with fiber breaking
during mixing, i.e. as the fibers break and have their average length decreased, the mixing torque decreases correspondently.
Figure 87 and Figure 88 compare the final mixing torque of the
feedstocks with and without fibers, for alumina and IN718 feedstocks, respectively. The compared feedstocks have the same binder system, i.e.
65 vol.% of LDPE, 30 vol.% of PW and 5 vol.% of SA. As expected, the feedstocks with fibers show higher mixing torque than their correspondent feedstocks without fibers. Nevertheless this effect was
more evident for the IN718 feedstocks, for which the mixing torque has almost doubled and remained higher after mixing for 40 minutes.
For the alumina feedstock, the mixing torque started higher,
however, fiber breakage has still occurred during final mixing, leading to a torque decrease until the end of mixing. In the end the mixing
torque of the alumina feedstocks with and without fibers were nearly the same. It seems that the particle-particle friction and particle-fiber friction are of the same magnitude when the fibers break to shorter
lengths. This effect that is observed for the alumina feedstock but not for the IN718 feedstock may be related with the powder composition, but also with the powder morphology and particle size distribution, which
are all different comparing both powders. Nevertheless it should be also emphasized that the mixing torque
of the feedstock without fiber has also shown an unusual increase of
mixing torque during the last minutes, what cannot be clearly explained and this contributes to the equalization of torque for the feedstocks with
and without fibers. Normally a feedstock should show a thixotropic behavior (GERMAN, 1990), i.e. exhibits a decrease in shear stress with time at constant shear rate, but in this case a rheopectic behavior has
been observed.
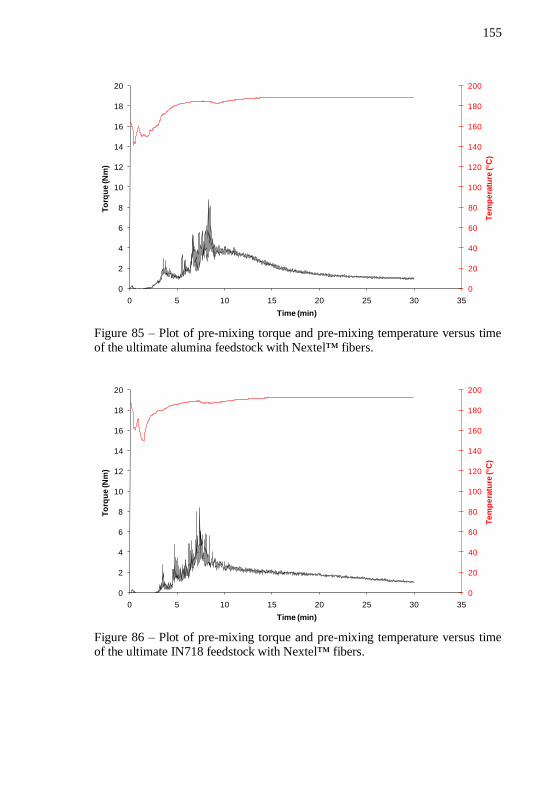
155
Figure 85 – Plot of pre-mixing torque and pre-mixing temperature versus time of the ultimate alumina feedstock with Nextel™ fibers.
Figure 86 – Plot of pre-mixing torque and pre-mixing temperature versus time of the ultimate IN718 feedstock with Nextel™ fibers.
0
20
40
60
80
100
120
140
160
180
200
0
2
4
6
8
10
12
14
16
18
20
0 5 10 15 20 25 30 35
Te
mp
era
ture
(°C
)
To
rqu
e (N
m)
Time (min)
0
20
40
60
80
100
120
140
160
180
200
0
2
4
6
8
10
12
14
16
18
20
0 5 10 15 20 25 30 35
Te
mp
era
ture
(°C
)
To
rqu
e (N
m)
Time (min)
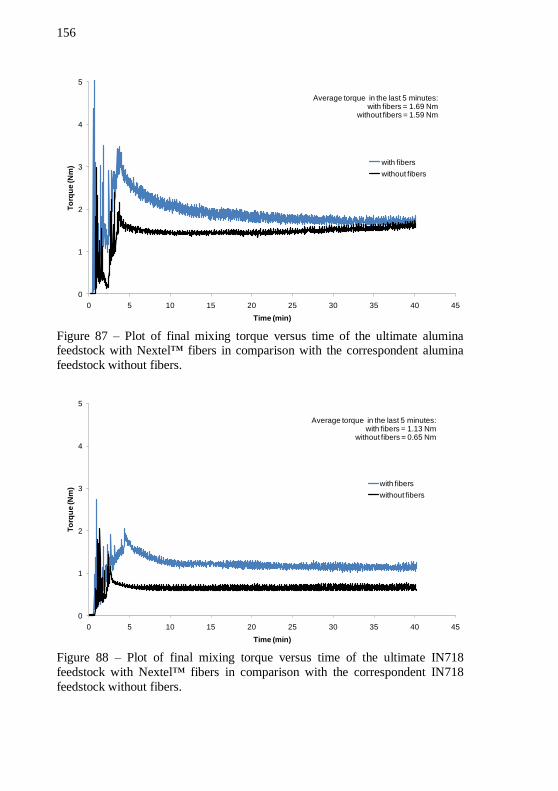
156
Figure 87 – Plot of final mixing torque versus time of the ultimate alumina feedstock with Nextel™ fibers in comparison with the correspondent alumina
feedstock without fibers.
Figure 88 – Plot of final mixing torque versus time of the ultimate IN718
feedstock with Nextel™ fibers in comparison with the correspondent IN718
feedstock without fibers.
0
1
2
3
4
5
0 5 10 15 20 25 30 35 40 45
To
rqu
e (N
m)
Time (min)
with fibers
without fibers
Average torque in the last 5 minutes:with fibers = 1.69 Nm
without fibers = 1.59 Nm
0
1
2
3
4
5
0 5 10 15 20 25 30 35 40 45
To
rqu
e (N
m)
Time (min)
with fibers
without fibers
Average torque in the last 5 minutes:with fibers = 1.13 Nm
without fibers = 0.65 Nm
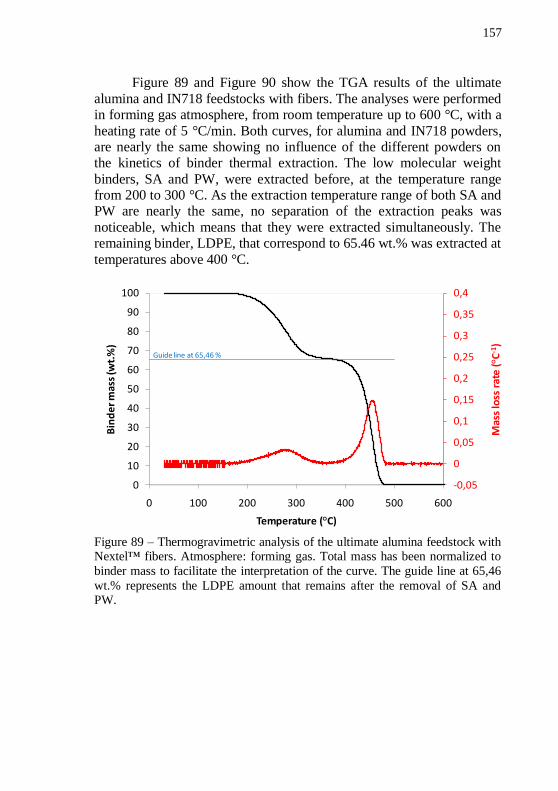
157
Figure 89 and Figure 90 show the TGA results of the ultimate
alumina and IN718 feedstocks with fibers. The analyses were performed in forming gas atmosphere, from room temperature up to 600 °C, with a
heating rate of 5 °C/min. Both curves, for alumina and IN718 powders, are nearly the same showing no influence of the different powders on the kinetics of binder thermal extraction. The low molecular weight
binders, SA and PW, were extracted before, at the temperature range from 200 to 300 °C. As the extraction temperature range of both SA and PW are nearly the same, no separation of the extraction peaks was
noticeable, which means that they were extracted simultaneously. The remaining binder, LDPE, that correspond to 65.46 wt.% was extracted at
temperatures above 400 °C.
Figure 89 – Thermogravimetric analysis of the ultimate alumina feedstock with Nextel™ fibers. Atmosphere: forming gas. Total mass has been normalized to
binder mass to facilitate the interpretation of the curve. The guide line at 65,46
wt.% represents the LDPE amount that remains after the removal of SA and PW.
-0,05
0
0,05
0,1
0,15
0,2
0,25
0,3
0,35
0,4
0
10
20
30
40
50
60
70
80
90
100
0 100 200 300 400 500 600M
ass
loss
rat
e (
C-1
)
Bin
de
r m
ass
(wt.
%)
Temperature ( C)
Guide line at 65,46 %
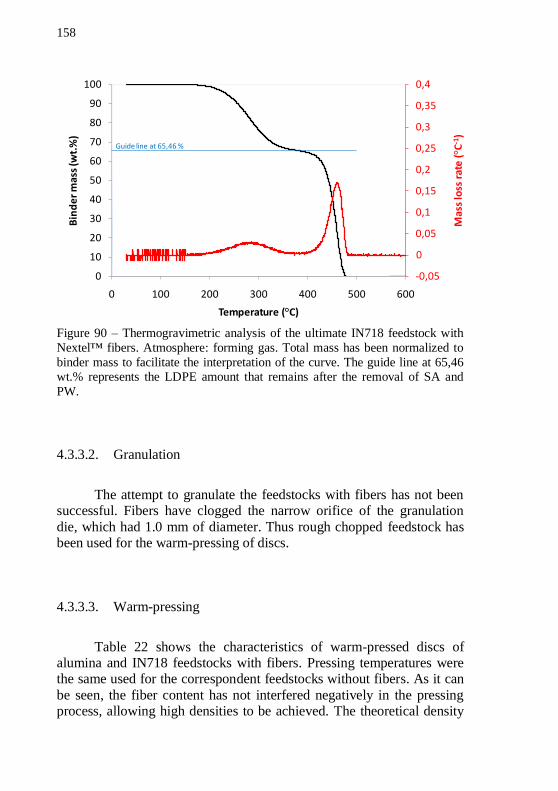
158
Figure 90 – Thermogravimetric analysis of the ultimate IN718 feedstock with
Nextel™ fibers. Atmosphere: forming gas. Total mass has been normalized to
binder mass to facilitate the interpretation of the curve. The guide line at 65,46 wt.% represents the LDPE amount that remains after the removal of SA and
PW.
4.3.3.2. Granulation
The attempt to granulate the feedstocks with fibers has not been successful. Fibers have clogged the narrow orifice of the granulation
die, which had 1.0 mm of diameter. Thus rough chopped feedstock has been used for the warm-pressing of discs.
4.3.3.3. Warm-pressing
Table 22 shows the characteristics of warm-pressed discs of alumina and IN718 feedstocks with fibers. Pressing temperatures were the same used for the correspondent feedstocks without fibers. As it can
be seen, the fiber content has not interfered negatively in the pressing process, allowing high densities to be achieved. The theoretical density
-0,05
0
0,05
0,1
0,15
0,2
0,25
0,3
0,35
0,4
0
10
20
30
40
50
60
70
80
90
100
0 100 200 300 400 500 600
Mas
s lo
ss r
ate
( C
-1)
Bin
de
r m
ass
(wt.
%)
Temperature ( C)
Guide line at 65,46 %
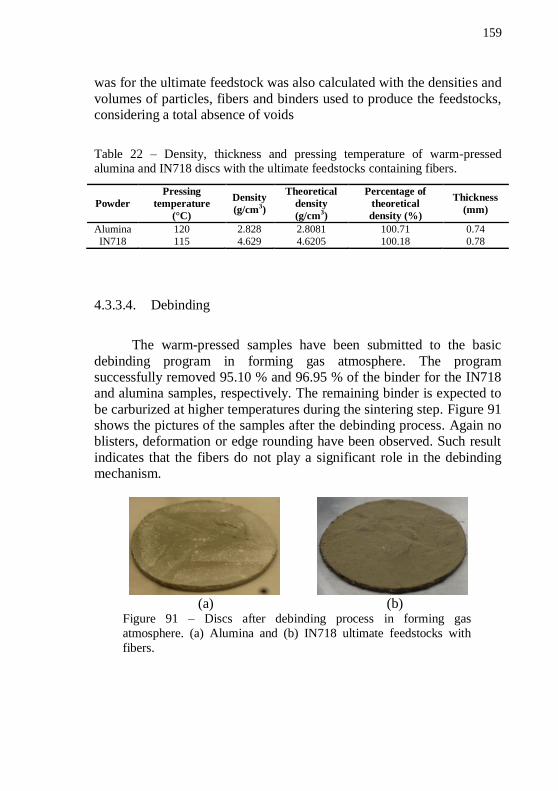
159
was for the ultimate feedstock was also calculated with the densities and
volumes of particles, fibers and binders used to produce the feedstocks, considering a total absence of voids
Table 22 – Density, thickness and pressing temperature of warm-pressed alumina and IN718 discs with the ultimate feedstocks containing fibers.
Powder
Pressing
temperature
(°C)
Density
(g/cm3)
Theoretical
density
(g/cm3)
Percentage of
theoretical
density (%)
Thickness
(mm)
Alumina 120 2.828 2.8081 100.71 0.74
IN718 115 4.629 4.6205 100.18 0.78
4.3.3.4. Debinding
The warm-pressed samples have been submitted to the basic
debinding program in forming gas atmosphere. The program successfully removed 95.10 % and 96.95 % of the binder for the IN718 and alumina samples, respectively. The remaining binder is expected to
be carburized at higher temperatures during the sintering step. Figure 91 shows the pictures of the samples after the debinding process. Again no blisters, deformation or edge rounding have been observed. Such result
indicates that the fibers do not play a significant role in the debinding mechanism.
(a) (b)
Figure 91 – Discs after debinding process in forming gas
atmosphere. (a) Alumina and (b) IN718 ultimate feedstocks with
fibers.
160
4.4. TUBES EXTRUSION
The extrusion of tubes has been performed with the ultimate alumina and IN718 feedstocks developed and showed in the previous
sections. The following sections describe the approach to achieve uniform and visually defect-free tubes produced via extrusion. As mentioned before, extrusion was carried out in a capillary rheometer
adapted with tube extruding dies in three different configurations, allowing the production of three different tube geometries.
As the extrusion equipment was relatively simply built, only two
parameters could be controlled, namely cylinder temperature and piston speed. A third parameter, die temperature, has also been investigated,
however, no electronic automated control was originally built in the machine, and a cooling setup with the use of a refrigerant fluid, has been adapted, which has given the die temperature two states, cooled and not
cooled. The control of these three parameters, which is going to be discussed in the following sections, was the most important aspect on the extrusion optimization, and has been done mainly in an empirical
way.
4.4.1. Cylinder temperature control
The cylinder temperature has been set in six different temperatures: 90, 95, 100, 110, 120 and 140 °C. Considering the melting point of the high molecular polymer, LDPE70, that is 108 °C, the
temperature varied from below to above the melting point of this polymer, which is the backbone of the system. Thus the tubes were extruded in the solid and molten states. The solid state extrusion is of
industrial practice and is only possible with plunger type extruders (RAUWENDAAL, 1986), with a configuration similar to the adapted capillary rheometer used in the present work.
With this temperature variation, differences were expected on the surface finishing of the tubes, as well as some deformation and, of
course, differences on extruding pressures. During the control of cylinder temperature, no die cooling has been applied and the piston speed was fixed at 1.0 mm/min.
The first aspect noticed was that there was no possibility to extrude the tubes at 140 °C. The viscosity of the feedstock in the exit of
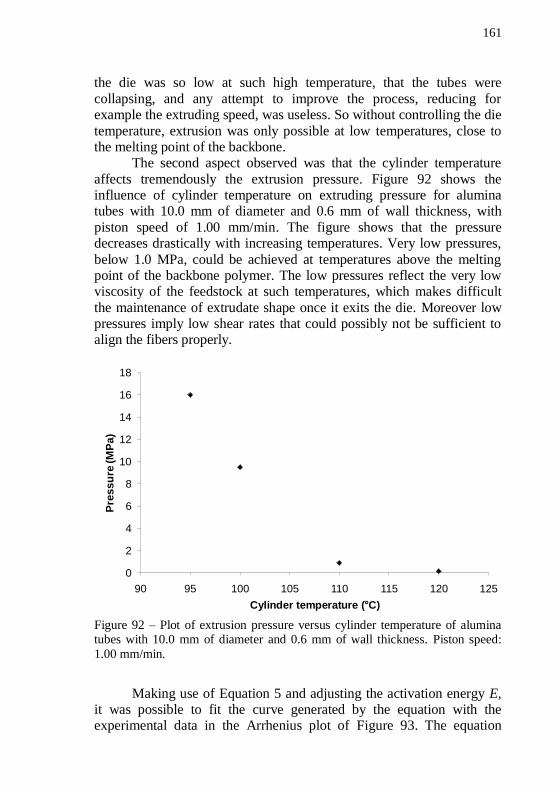
161
the die was so low at such high temperature, that the tubes were
collapsing, and any attempt to improve the process, reducing for example the extruding speed, was useless. So without controlling the die
temperature, extrusion was only possible at low temperatures, close to the melting point of the backbone.
The second aspect observed was that the cylinder temperature
affects tremendously the extrusion pressure. Figure 92 shows the influence of cylinder temperature on extruding pressure for alumina tubes with 10.0 mm of diameter and 0.6 mm of wall thickness, with
piston speed of 1.00 mm/min. The figure shows that the pressure decreases drastically with increasing temperatures. Very low pressures,
below 1.0 MPa, could be achieved at temperatures above the melting point of the backbone polymer. The low pressures reflect the very low viscosity of the feedstock at such temperatures, which makes difficult
the maintenance of extrudate shape once it exits the die. Moreover low pressures imply low shear rates that could possibly not be sufficient to align the fibers properly.
Figure 92 – Plot of extrusion pressure versus cylinder temperature of alumina tubes with 10.0 mm of diameter and 0.6 mm of wall thickness. Piston speed:
1.00 mm/min.
Making use of Equation 5 and adjusting the activation energy E, it was possible to fit the curve generated by the equation with the experimental data in the Arrhenius plot of Figure 93. The equation
0
2
4
6
8
10
12
14
16
18
90 95 100 105 110 115 120 125
Pre
ssu
re (M
Pa)
Cylinder temperature ( C)
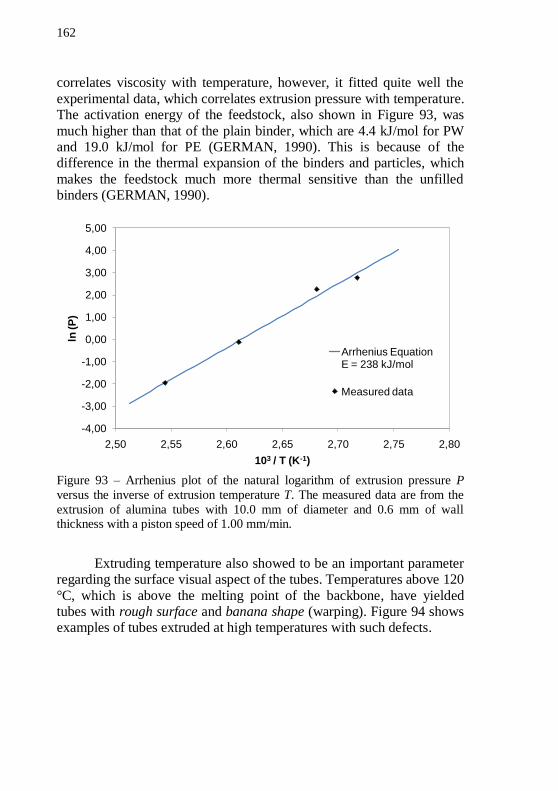
162
correlates viscosity with temperature, however, it fitted quite well the
experimental data, which correlates extrusion pressure with temperature. The activation energy of the feedstock, also shown in Figure 93, was
much higher than that of the plain binder, which are 4.4 kJ/mol for PW and 19.0 kJ/mol for PE (GERMAN, 1990). This is because of the difference in the thermal expansion of the binders and particles, which
makes the feedstock much more thermal sensitive than the unfilled binders (GERMAN, 1990).
Figure 93 – Arrhenius plot of the natural logarithm of extrusion pressure P
versus the inverse of extrusion temperature T. The measured data are from the
extrusion of alumina tubes with 10.0 mm of diameter and 0.6 mm of wall thickness with a piston speed of 1.00 mm/min.
Extruding temperature also showed to be an important parameter regarding the surface visual aspect of the tubes. Temperatures above 120
°C, which is above the melting point of the backbone, have yielded tubes with rough surface and banana shape (warping). Figure 94 shows examples of tubes extruded at high temperatures with such defects.
-4,00
-3,00
-2,00
-1,00
0,00
1,00
2,00
3,00
4,00
5,00
2,50 2,55 2,60 2,65 2,70 2,75 2,80
ln (P
)
103 / T (K-1)
Arrhenius Equation E = 238 kJ/mol
Measured data
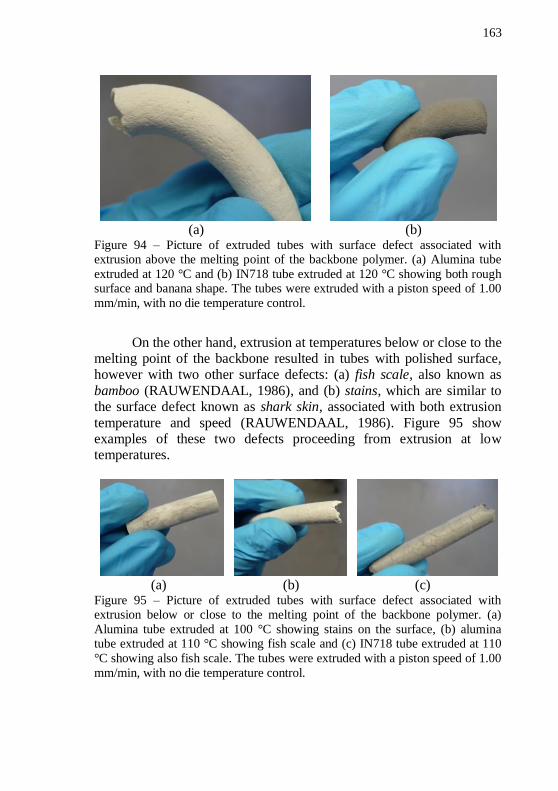
163
(a) (b) Figure 94 – Picture of extruded tubes with surface defect associated with extrusion above the melting point of the backbone polymer. (a) Alumina tube
extruded at 120 °C and (b) IN718 tube extruded at 120 °C showing both rough surface and banana shape. The tubes were extruded with a piston speed of 1.00
mm/min, with no die temperature control.
On the other hand, extrusion at temperatures below or close to the melting point of the backbone resulted in tubes with polished surface, however with two other surface defects: (a) fish scale, also known as
bamboo (RAUWENDAAL, 1986), and (b) stains, which are similar to the surface defect known as shark skin, associated with both extrusion
temperature and speed (RAUWENDAAL, 1986). Figure 95 show examples of these two defects proceeding from extrusion at low temperatures.
(a) (b) (c) Figure 95 – Picture of extruded tubes with surface defect associated with extrusion below or close to the melting point of the backbone polymer. (a)
Alumina tube extruded at 100 °C showing stains on the surface, (b) alumina tube extruded at 110 °C showing fish scale and (c) IN718 tube extruded at 110
°C showing also fish scale. The tubes were extruded with a piston speed of 1.00
mm/min, with no die temperature control.
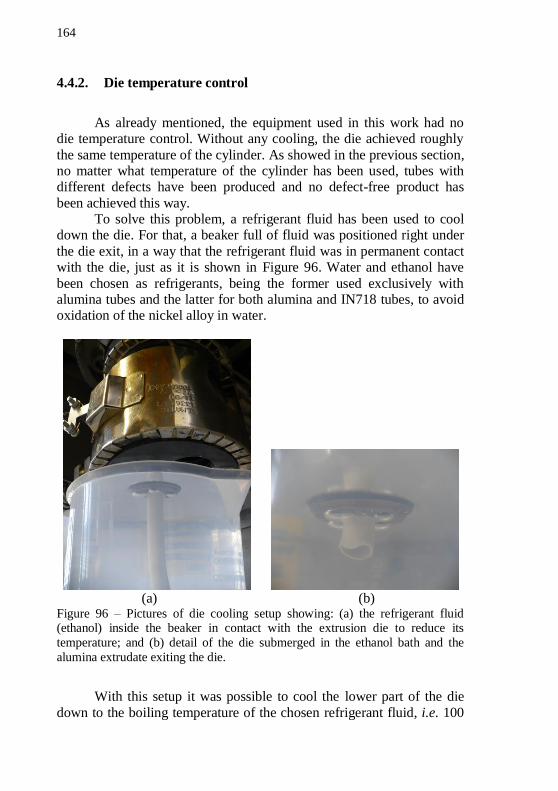
164
4.4.2. Die temperature control
As already mentioned, the equipment used in this work had no die temperature control. Without any cooling, the die achieved roughly
the same temperature of the cylinder. As showed in the previous section, no matter what temperature of the cylinder has been used, tubes with different defects have been produced and no defect-free product has
been achieved this way. To solve this problem, a refrigerant fluid has been used to cool
down the die. For that, a beaker full of fluid was positioned right under
the die exit, in a way that the refrigerant fluid was in permanent contact with the die, just as it is shown in Figure 96. Water and ethanol have
been chosen as refrigerants, being the former used exclusively with alumina tubes and the latter for both alumina and IN718 tubes, to avoid oxidation of the nickel alloy in water.
(a) (b) Figure 96 – Pictures of die cooling setup showing: (a) the refrigerant fluid (ethanol) inside the beaker in contact with the extrusion die to reduce its
temperature; and (b) detail of the die submerged in the ethanol bath and the
alumina extrudate exiting the die.
With this setup it was possible to cool the lower part of the die
down to the boiling temperature of the chosen refrigerant fluid, i.e. 100
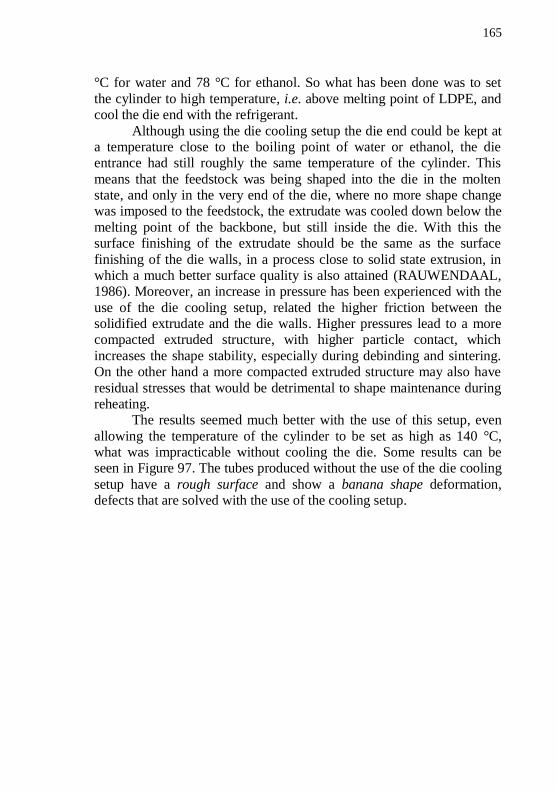
165
°C for water and 78 °C for ethanol. So what has been done was to set
the cylinder to high temperature, i.e. above melting point of LDPE, and cool the die end with the refrigerant.
Although using the die cooling setup the die end could be kept at a temperature close to the boiling point of water or ethanol, the die entrance had still roughly the same temperature of the cylinder. This
means that the feedstock was being shaped into the die in the molten state, and only in the very end of the die, where no more shape change was imposed to the feedstock, the extrudate was cooled down below the
melting point of the backbone, but still inside the die. With this the surface finishing of the extrudate should be the same as the surface
finishing of the die walls, in a process close to solid state extrusion, in which a much better surface quality is also attained (RAUWENDAAL, 1986). Moreover, an increase in pressure has been experienced with the
use of the die cooling setup, related the higher friction between the solidified extrudate and the die walls. Higher pressures lead to a more compacted extruded structure, with higher particle contact, which
increases the shape stability, especially during debinding and sintering. On the other hand a more compacted extruded structure may also have
residual stresses that would be detrimental to shape maintenance during reheating.
The results seemed much better with the use of this setup, even
allowing the temperature of the cylinder to be set as high as 140 °C, what was impracticable without cooling the die. Some results can be seen in Figure 97. The tubes produced without the use of the die cooling
setup have a rough surface and show a banana shape deformation, defects that are solved with the use of the cooling setup.
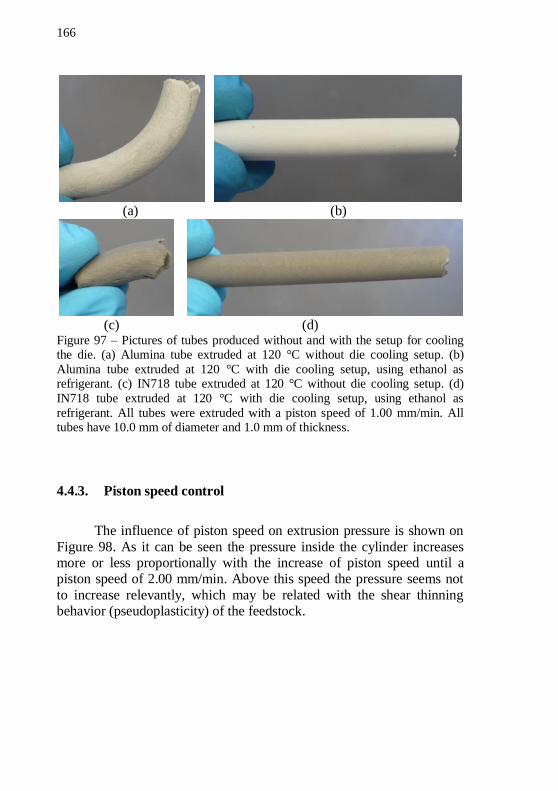
166
(a) (b)
(c) (d) Figure 97 – Pictures of tubes produced without and with the setup for cooling the die. (a) Alumina tube extruded at 120 °C without die cooling setup. (b)
Alumina tube extruded at 120 °C with die cooling setup, using ethanol as refrigerant. (c) IN718 tube extruded at 120 °C without die cooling setup. (d)
IN718 tube extruded at 120 °C with die cooling setup, using ethanol as
refrigerant. All tubes were extruded with a piston speed of 1.00 mm/min. All tubes have 10.0 mm of diameter and 1.0 mm of thickness.
4.4.3. Piston speed control
The influence of piston speed on extrusion pressure is shown on
Figure 98. As it can be seen the pressure inside the cylinder increases more or less proportionally with the increase of piston speed until a piston speed of 2.00 mm/min. Above this speed the pressure seems not
to increase relevantly, which may be related with the shear thinning behavior (pseudoplasticity) of the feedstock.
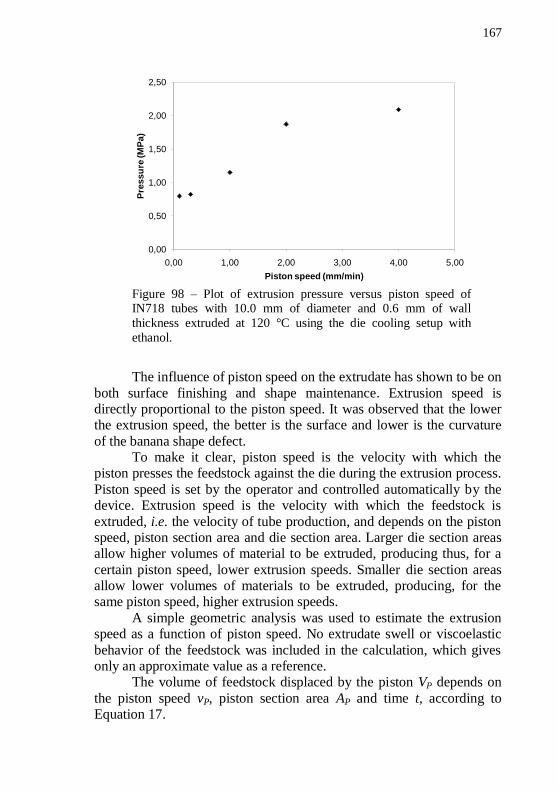
167
Figure 98 – Plot of extrusion pressure versus piston speed of IN718 tubes with 10.0 mm of diameter and 0.6 mm of wall
thickness extruded at 120 °C using the die cooling setup with
ethanol.
The influence of piston speed on the extrudate has shown to be on
both surface finishing and shape maintenance. Extrusion speed is directly proportional to the piston speed. It was observed that the lower the extrusion speed, the better is the surface and lower is the curvature
of the banana shape defect. To make it clear, piston speed is the velocity with which the
piston presses the feedstock against the die during the extrusion process.
Piston speed is set by the operator and controlled automatically by the device. Extrusion speed is the velocity with which the feedstock is
extruded, i.e. the velocity of tube production, and depends on the piston speed, piston section area and die section area. Larger die section areas allow higher volumes of material to be extruded, producing thus, for a
certain piston speed, lower extrusion speeds. Smaller die section areas allow lower volumes of materials to be extruded, producing, for the same piston speed, higher extrusion speeds.
A simple geometric analysis was used to estimate the extrusion speed as a function of piston speed. No extrudate swell or viscoelastic
behavior of the feedstock was included in the calculation, which gives only an approximate value as a reference.
The volume of feedstock displaced by the piston VP depends on
the piston speed vP, piston section area AP and time t, according to Equation 17.
0,00
0,50
1,00
1,50
2,00
2,50
0,00 1,00 2,00 3,00 4,00 5,00
Pre
ssu
re (M
Pa)
Piston speed (mm/min)
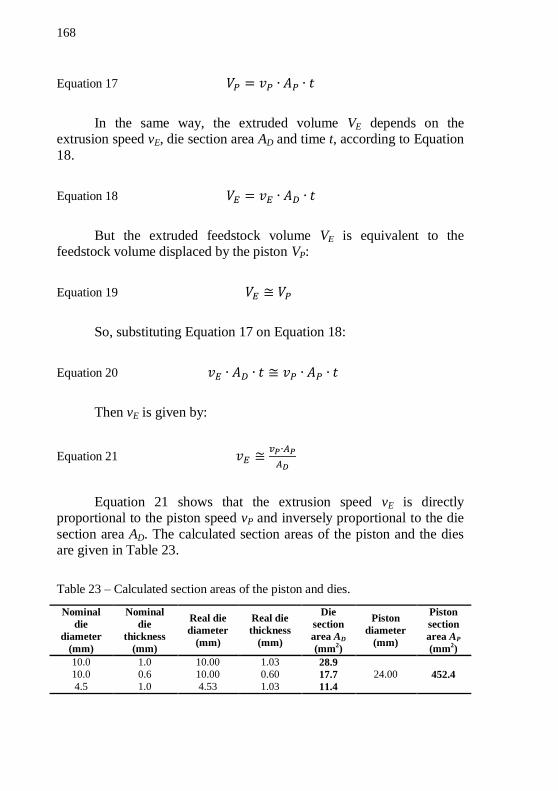
168
Equation 17
In the same way, the extruded volume VE depends on the extrusion speed vE, die section area AD and time t, according to Equation
18.
Equation 18
But the extruded feedstock volume VE is equivalent to the feedstock volume displaced by the piston VP:
Equation 19
So, substituting Equation 17 on Equation 18:
Equation 20
Then vE is given by:
Equation 21
Equation 21 shows that the extrusion speed vE is directly proportional to the piston speed vP and inversely proportional to the die
section area AD. The calculated section areas of the piston and the dies are given in Table 23.
Table 23 – Calculated section areas of the piston and dies.
Nominal
die
diameter
(mm)
Nominal
die
thickness
(mm)
Real die
diameter
(mm)
Real die
thickness
(mm)
Die
section
area AD
(mm2)
Piston
diameter
(mm)
Piston
section
area AP
(mm2)
10.0 1.0 10.00 1.03 28.9
24.00 452.4 10.0 0.6 10.00 0.60 17.7
4.5 1.0 4.53 1.03 11.4

169
For the quality of the extrudate, what really matters is the
extrudate speed vE. With a piston speed vP of 1.00 mm/min it was possible to produce defect-free tubes with the die of 10.0 mm of
diameter and 1.0 mm of thickness, as shown before in Figure 97. However, using the same piston speed for the other two dies, fish scale and banana shape defects were evident on the tubes, as it can be seen in
Figure 99.
(a) (b)
(c) (d) Figure 99 – Picture of tubes extruded with piston speed of 1.00 mm/min. (a)
IN718 tube with 4.5 mm of diameter and 1.0 mm of thickness showing fish scale and banana shape. (b) IN718 tube with 10.0 mm of diameter and 0.6 mm
of thickness showing fish scale and banana shape. (c) Defect-free IN718 tube with 10.0 mm of diameter and 1.0 mm of thickness. (d) Alumina tube with 4.5
mm of diameter and 1.0 mm of thickness showing fish scale and banana shape.
All tubes were produced with the use of the die cooling setup with ethanol as refrigerant.
The defects shown in Figure 99 (a), (b) and (d) were produced due to the high extrusion speed imposed to the tubes. Applying Equation
21 the extrusion speed vE is calculated for the three different dies geometries, using a piston speed vP of 1.00 mm/min. The results are shown in Table 24.
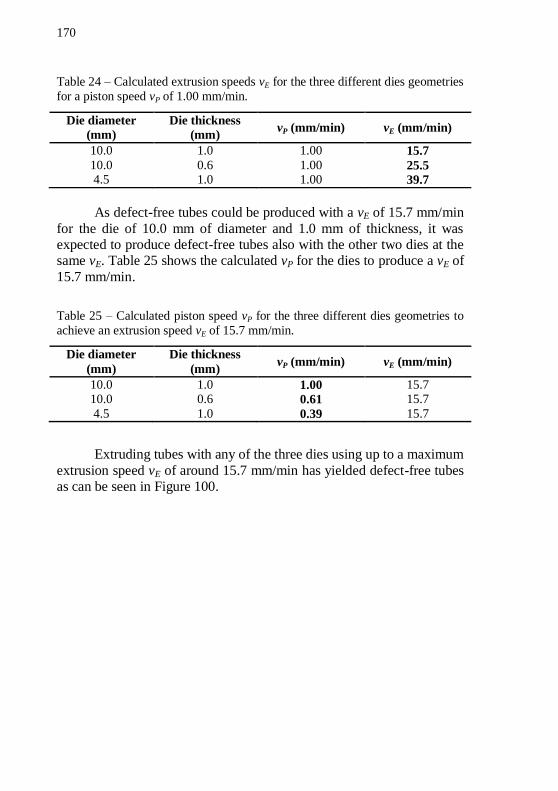
170
Table 24 – Calculated extrusion speeds vE for the three different dies geometries
for a piston speed vP of 1.00 mm/min.
Die diameter
(mm)
Die thickness
(mm) vP (mm/min) vE (mm/min)
10.0 1.0 1.00 15.7
10.0 0.6 1.00 25.5 4.5 1.0 1.00 39.7
As defect-free tubes could be produced with a vE of 15.7 mm/min
for the die of 10.0 mm of diameter and 1.0 mm of thickness, it was expected to produce defect-free tubes also with the other two dies at the same vE. Table 25 shows the calculated vP for the dies to produce a vE of
15.7 mm/min.
Table 25 – Calculated piston speed vP for the three different dies geometries to
achieve an extrusion speed vE of 15.7 mm/min.
Die diameter
(mm)
Die thickness
(mm) vP (mm/min) vE (mm/min)
10.0 1.0 1.00 15.7 10.0 0.6 0.61 15.7
4.5 1.0 0.39 15.7
Extruding tubes with any of the three dies using up to a maximum
extrusion speed vE of around 15.7 mm/min has yielded defect-free tubes as can be seen in Figure 100.
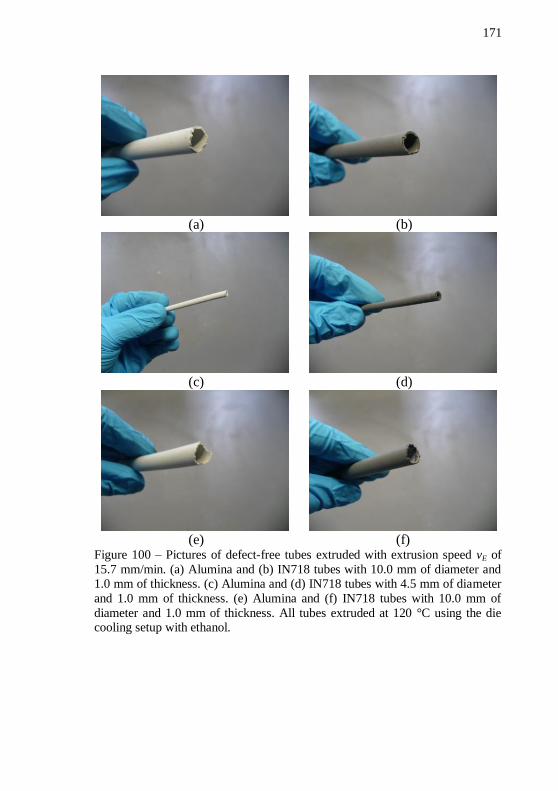
171
(a) (b)
(c) (d)
(e) (f) Figure 100 – Pictures of defect-free tubes extruded with extrusion speed vE of
15.7 mm/min. (a) Alumina and (b) IN718 tubes with 10.0 mm of diameter and 1.0 mm of thickness. (c) Alumina and (d) IN718 tubes with 4.5 mm of diameter
and 1.0 mm of thickness. (e) Alumina and (f) IN718 tubes with 10.0 mm of
diameter and 1.0 mm of thickness. All tubes extruded at 120 °C using the die cooling setup with ethanol.
172
4.4.4. Ultimate extrusion conditions
After several extrusion trials, to study the control of the parameters described in the three previous sub-sections, the ultimate
extrusion conditions have been defined as follows:
i. Cylinder temperature – 120 °C;
ii. Die temperature – using the die cooling setup with ethanol; a. Die entrance – 120 °C (cylinder set temperature);
b. Die exit – 78 °C (ethanol boiling point);
iii. Extrusion speed – 15.7 mm/min; a. Die of 10.0 mm of diameter and 1.0 mm of thickness
– Piston speed of 1.00 mm/min required;
b. Die of 10.0 mm of diameter and 0.6 mm of thickness – Piston speed of 0.61 mm/min required;
c. Die of 4.5 mm of diameter and 1.0 mm of thickness
– Piston speed of 0.39 mm/min required;
Figure 101 show the tubes produced under the above ultimate
extrusion parameters. It can be seen that tubes with high length/diameter ratio could be extruded. Tubes longer than 15 cm were not produced due to mere limitation of the ethanol beaker height.
173
(a) (b) (c) Figure 101 – Pictures of defect-free tubes extruded under the ultimate extrusion conditions. (a) IN718 [gray] and alumina [white] tubes with 10.0 mm of
diameter and 1.0 mm of thickness. (b) IN718 [gray] and alumina [white] tubes with 10.0 mm of diameter and 0.6 mm of thickness. (c) IN718 [gray] and
alumina [white] tubes with 4.5 mm of diameter and 1.0 mm of thickness.
No extruded tube showed the effect of extrudate swell. According to what could be found in the literature, the reasons for this phenomenon not to occur are the following:
i. Low die-end temperature – as the die end is at a temperature below the melting point of the backbone, which is the main binder of the system, its molecules are
already with too low mobility by the time the extrudate leaves the die. This is what happens in solid state
extrusion, which also shows virtually no extrudate swell (RAUWENDAAL, 1986).
ii. Low extrusion speed – molecular alignment is associated
with high shear rates, which on its turn happens under high extrusion speeds. With low degree of alignment of the molecules, a lower elastic recover shall occur
(CHEREMISINOFF, 1987). Moreover, even if the molecules could have been sufficiently aligned, the long
residence time inside the die avoided the elastic recover that is time-dependent and can only occur after a limited time subsequent to the undergone deformation
(RAUWENDAAL, 1986).
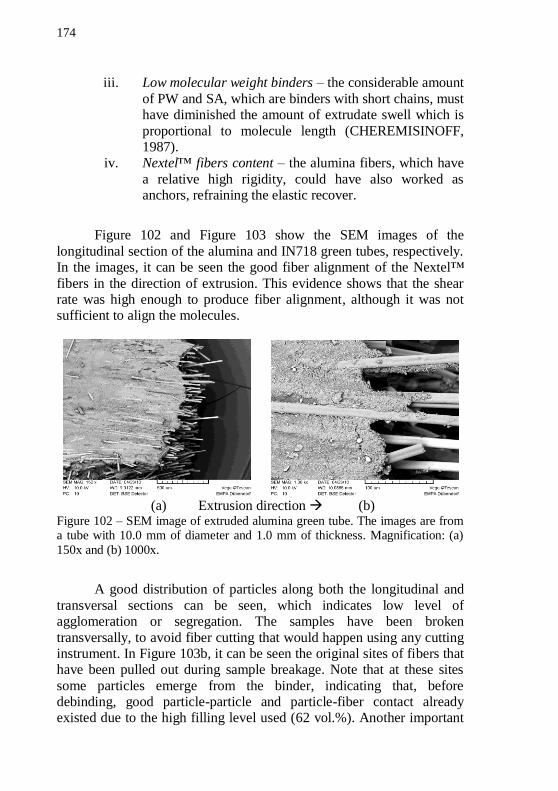
174
iii. Low molecular weight binders – the considerable amount
of PW and SA, which are binders with short chains, must have diminished the amount of extrudate swell which is
proportional to molecule length (CHEREMISINOFF, 1987).
iv. Nextel™ fibers content – the alumina fibers, which have
a relative high rigidity, could have also worked as anchors, refraining the elastic recover.
Figure 102 and Figure 103 show the SEM images of the
longitudinal section of the alumina and IN718 green tubes, respectively. In the images, it can be seen the good fiber alignment of the Nextel™
fibers in the direction of extrusion. This evidence shows that the shear rate was high enough to produce fiber alignment, although it was not sufficient to align the molecules.
(a) Extrusion direction (b) Figure 102 – SEM image of extruded alumina green tube. The images are from a tube with 10.0 mm of diameter and 1.0 mm of thickness. Magnification: (a)
150x and (b) 1000x.
A good distribution of particles along both the longitudinal and
transversal sections can be seen, which indicates low level of agglomeration or segregation. The samples have been broken
transversally, to avoid fiber cutting that would happen using any cutting instrument. In Figure 103b, it can be seen the original sites of fibers that have been pulled out during sample breakage. Note that at these sites
some particles emerge from the binder, indicating that, before debinding, good particle-particle and particle-fiber contact already existed due to the high filling level used (62 vol.%). Another important
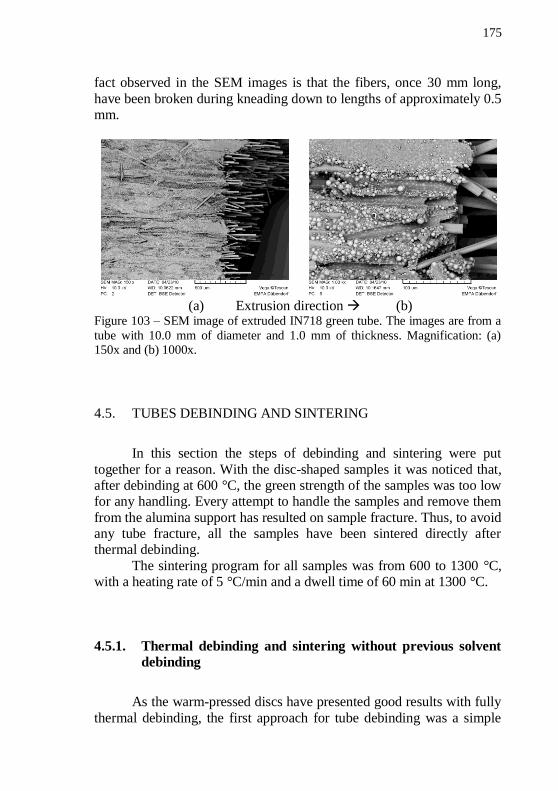
175
fact observed in the SEM images is that the fibers, once 30 mm long,
have been broken during kneading down to lengths of approximately 0.5 mm.
(a) Extrusion direction (b) Figure 103 – SEM image of extruded IN718 green tube. The images are from a
tube with 10.0 mm of diameter and 1.0 mm of thickness. Magnification: (a) 150x and (b) 1000x.
4.5. TUBES DEBINDING AND SINTERING
In this section the steps of debinding and sintering were put
together for a reason. With the disc-shaped samples it was noticed that, after debinding at 600 °C, the green strength of the samples was too low for any handling. Every attempt to handle the samples and remove them
from the alumina support has resulted on sample fracture. Thus, to avoid any tube fracture, all the samples have been sintered directly after thermal debinding.
The sintering program for all samples was from 600 to 1300 °C, with a heating rate of 5 °C/min and a dwell time of 60 min at 1300 °C.
4.5.1. Thermal debinding and sintering without previous solvent
debinding
As the warm-pressed discs have presented good results with fully
thermal debinding, the first approach for tube debinding was a simple
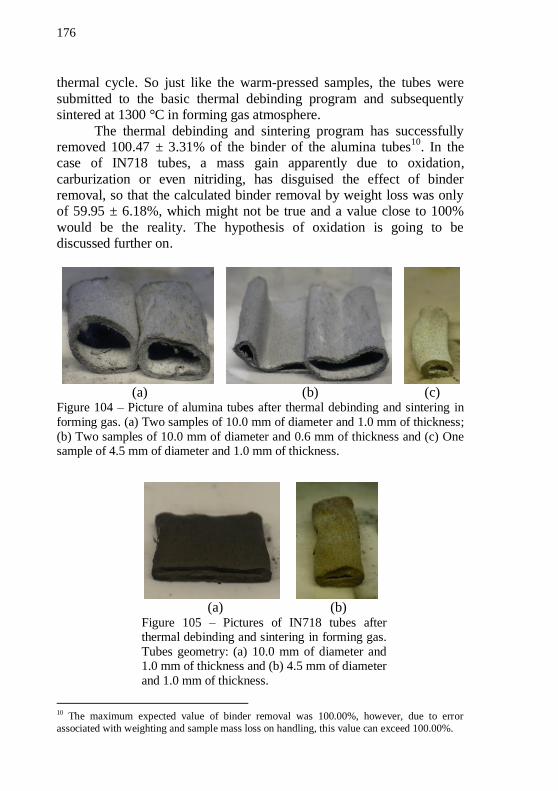
176
thermal cycle. So just like the warm-pressed samples, the tubes were
submitted to the basic thermal debinding program and subsequently sintered at 1300 °C in forming gas atmosphere.
The thermal debinding and sintering program has successfully removed 100.47 ± 3.31% of the binder of the alumina tubes
10. In the
case of IN718 tubes, a mass gain apparently due to oxidation,
carburization or even nitriding, has disguised the effect of binder removal, so that the calculated binder removal by weight loss was only of 59.95 ± 6.18%, which might not be true and a value close to 100%
would be the reality. The hypothesis of oxidation is going to be discussed further on.
(a) (b) (c) Figure 104 – Picture of alumina tubes after thermal debinding and sintering in
forming gas. (a) Two samples of 10.0 mm of diameter and 1.0 mm of thickness;
(b) Two samples of 10.0 mm of diameter and 0.6 mm of thickness and (c) One sample of 4.5 mm of diameter and 1.0 mm of thickness.
(a) (b)
Figure 105 – Pictures of IN718 tubes after thermal debinding and sintering in forming gas.
Tubes geometry: (a) 10.0 mm of diameter and 1.0 mm of thickness and (b) 4.5 mm of diameter
and 1.0 mm of thickness.
10 The maximum expected value of binder removal was 100.00%, however, due to error
associated with weighting and sample mass loss on handling, this value can exceed 100.00%.
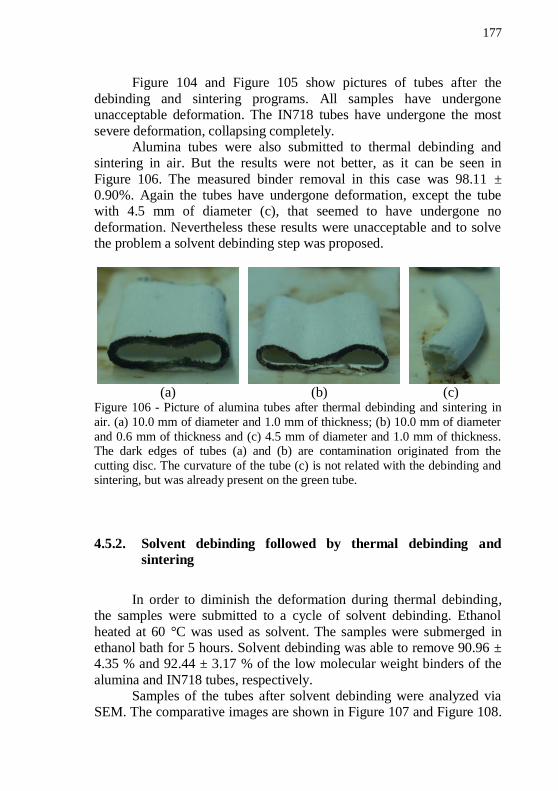
177
Figure 104 and Figure 105 show pictures of tubes after the
debinding and sintering programs. All samples have undergone unacceptable deformation. The IN718 tubes have undergone the most
severe deformation, collapsing completely. Alumina tubes were also submitted to thermal debinding and
sintering in air. But the results were not better, as it can be seen in
Figure 106. The measured binder removal in this case was 98.11 ± 0.90%. Again the tubes have undergone deformation, except the tube with 4.5 mm of diameter (c), that seemed to have undergone no
deformation. Nevertheless these results were unacceptable and to solve the problem a solvent debinding step was proposed.
(a) (b) (c) Figure 106 - Picture of alumina tubes after thermal debinding and sintering in
air. (a) 10.0 mm of diameter and 1.0 mm of thickness; (b) 10.0 mm of diameter
and 0.6 mm of thickness and (c) 4.5 mm of diameter and 1.0 mm of thickness. The dark edges of tubes (a) and (b) are contamination originated from the
cutting disc. The curvature of the tube (c) is not related with the debinding and sintering, but was already present on the green tube.
4.5.2. Solvent debinding followed by thermal debinding and
sintering
In order to diminish the deformation during thermal debinding, the samples were submitted to a cycle of solvent debinding. Ethanol
heated at 60 °C was used as solvent. The samples were submerged in ethanol bath for 5 hours. Solvent debinding was able to remove 90.96 ± 4.35 % and 92.44 ± 3.17 % of the low molecular weight binders of the
alumina and IN718 tubes, respectively. Samples of the tubes after solvent debinding were analyzed via
SEM. The comparative images are shown in Figure 107 and Figure 108.
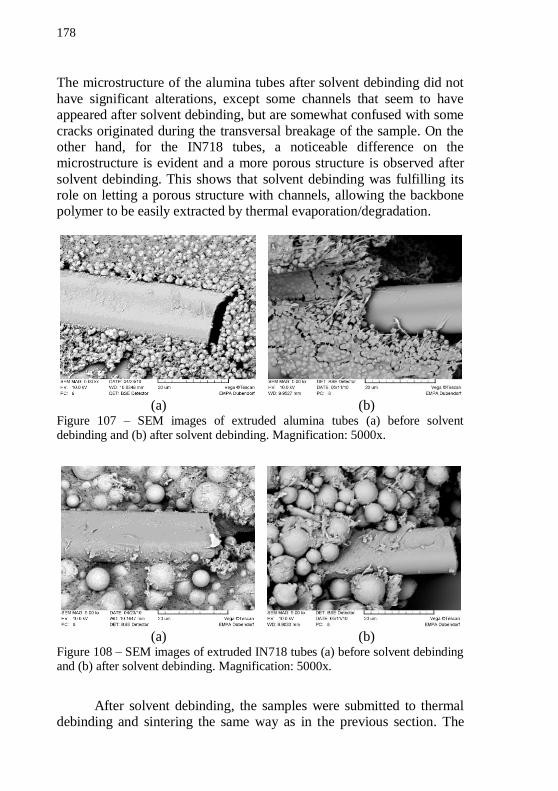
178
The microstructure of the alumina tubes after solvent debinding did not
have significant alterations, except some channels that seem to have appeared after solvent debinding, but are somewhat confused with some
cracks originated during the transversal breakage of the sample. On the other hand, for the IN718 tubes, a noticeable difference on the microstructure is evident and a more porous structure is observed after
solvent debinding. This shows that solvent debinding was fulfilling its role on letting a porous structure with channels, allowing the backbone polymer to be easily extracted by thermal evaporation/degradation.
(a) (b) Figure 107 – SEM images of extruded alumina tubes (a) before solvent debinding and (b) after solvent debinding. Magnification: 5000x.
(a) (b) Figure 108 – SEM images of extruded IN718 tubes (a) before solvent debinding and (b) after solvent debinding. Magnification: 5000x.
After solvent debinding, the samples were submitted to thermal debinding and sintering the same way as in the previous section. The
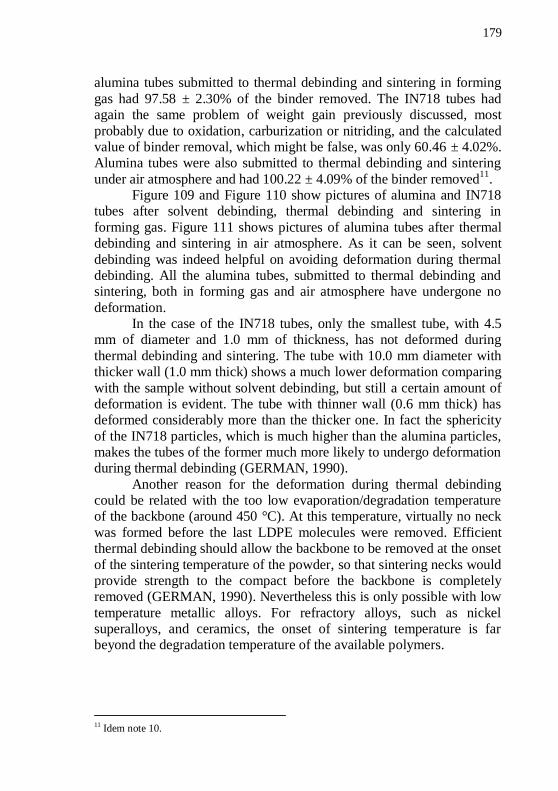
179
alumina tubes submitted to thermal debinding and sintering in forming
gas had 97.58 ± 2.30% of the binder removed. The IN718 tubes had again the same problem of weight gain previously discussed, most
probably due to oxidation, carburization or nitriding, and the calculated value of binder removal, which might be false, was only 60.46 ± 4.02%. Alumina tubes were also submitted to thermal debinding and sintering
under air atmosphere and had 100.22 ± 4.09% of the binder removed11
. Figure 109 and Figure 110 show pictures of alumina and IN718
tubes after solvent debinding, thermal debinding and sintering in
forming gas. Figure 111 shows pictures of alumina tubes after thermal debinding and sintering in air atmosphere. As it can be seen, solvent
debinding was indeed helpful on avoiding deformation during thermal debinding. All the alumina tubes, submitted to thermal debinding and sintering, both in forming gas and air atmosphere have undergone no
deformation. In the case of the IN718 tubes, only the smallest tube, with 4.5
mm of diameter and 1.0 mm of thickness, has not deformed during
thermal debinding and sintering. The tube with 10.0 mm diameter with thicker wall (1.0 mm thick) shows a much lower deformation comparing
with the sample without solvent debinding, but still a certain amount of deformation is evident. The tube with thinner wall (0.6 mm thick) has deformed considerably more than the thicker one. In fact the sphericity
of the IN718 particles, which is much higher than the alumina particles, makes the tubes of the former much more likely to undergo deformation during thermal debinding (GERMAN, 1990).
Another reason for the deformation during thermal debinding could be related with the too low evaporation/degradation temperature of the backbone (around 450 °C). At this temperature, virtually no neck
was formed before the last LDPE molecules were removed. Efficient thermal debinding should allow the backbone to be removed at the onset
of the sintering temperature of the powder, so that sintering necks would provide strength to the compact before the backbone is completely removed (GERMAN, 1990). Nevertheless this is only possible with low
temperature metallic alloys. For refractory alloys, such as nickel superalloys, and ceramics, the onset of sintering temperature is far beyond the degradation temperature of the available polymers.
11 Idem note 10.
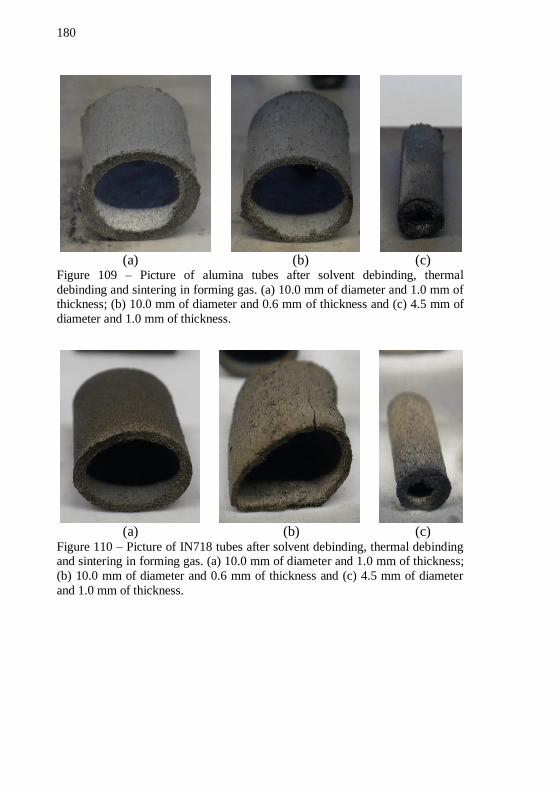
180
(a) (b) (c) Figure 109 – Picture of alumina tubes after solvent debinding, thermal
debinding and sintering in forming gas. (a) 10.0 mm of diameter and 1.0 mm of thickness; (b) 10.0 mm of diameter and 0.6 mm of thickness and (c) 4.5 mm of
diameter and 1.0 mm of thickness.
(a) (b) (c) Figure 110 – Picture of IN718 tubes after solvent debinding, thermal debinding and sintering in forming gas. (a) 10.0 mm of diameter and 1.0 mm of thickness;
(b) 10.0 mm of diameter and 0.6 mm of thickness and (c) 4.5 mm of diameter
and 1.0 mm of thickness.
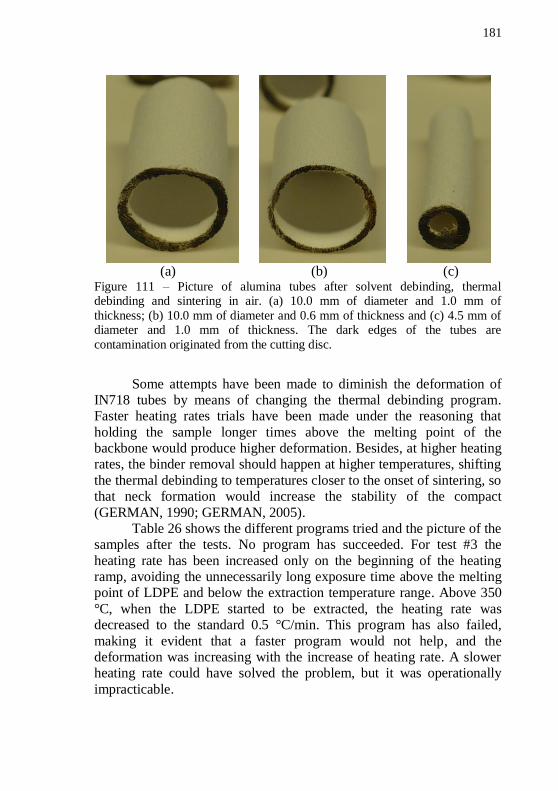
181
(a) (b) (c) Figure 111 – Picture of alumina tubes after solvent debinding, thermal debinding and sintering in air. (a) 10.0 mm of diameter and 1.0 mm of
thickness; (b) 10.0 mm of diameter and 0.6 mm of thickness and (c) 4.5 mm of diameter and 1.0 mm of thickness. The dark edges of the tubes are
contamination originated from the cutting disc.
Some attempts have been made to diminish the deformation of IN718 tubes by means of changing the thermal debinding program. Faster heating rates trials have been made under the reasoning that
holding the sample longer times above the melting point of the backbone would produce higher deformation. Besides, at higher heating rates, the binder removal should happen at higher temperatures, shifting
the thermal debinding to temperatures closer to the onset of sintering, so that neck formation would increase the stability of the compact
(GERMAN, 1990; GERMAN, 2005). Table 26 shows the different programs tried and the picture of the
samples after the tests. No program has succeeded. For test #3 the
heating rate has been increased only on the beginning of the heating ramp, avoiding the unnecessarily long exposure time above the melting point of LDPE and below the extraction temperature range. Above 350
°C, when the LDPE started to be extracted, the heating rate was decreased to the standard 0.5 °C/min. This program has also failed,
making it evident that a faster program would not help, and the deformation was increasing with the increase of heating rate. A slower heating rate could have solved the problem, but it was operationally
impracticable.
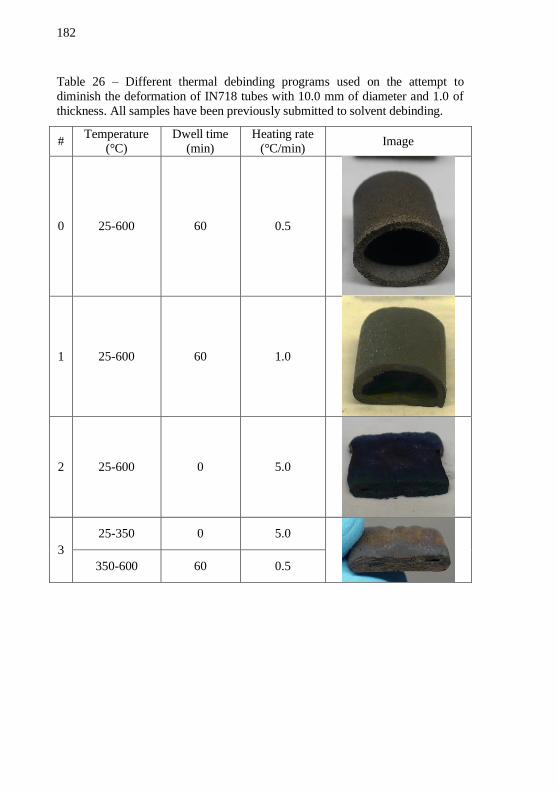
182
Table 26 – Different thermal debinding programs used on the attempt to
diminish the deformation of IN718 tubes with 10.0 mm of diameter and 1.0 of
thickness. All samples have been previously submitted to solvent debinding.
# Temperature
(°C) Dwell time
(min) Heating rate
(°C/min) Image
0 25-600 60 0.5
1 25-600 60 1.0
2 25-600 0 5.0
3
25-350 0 5.0
350-600 60 0.5
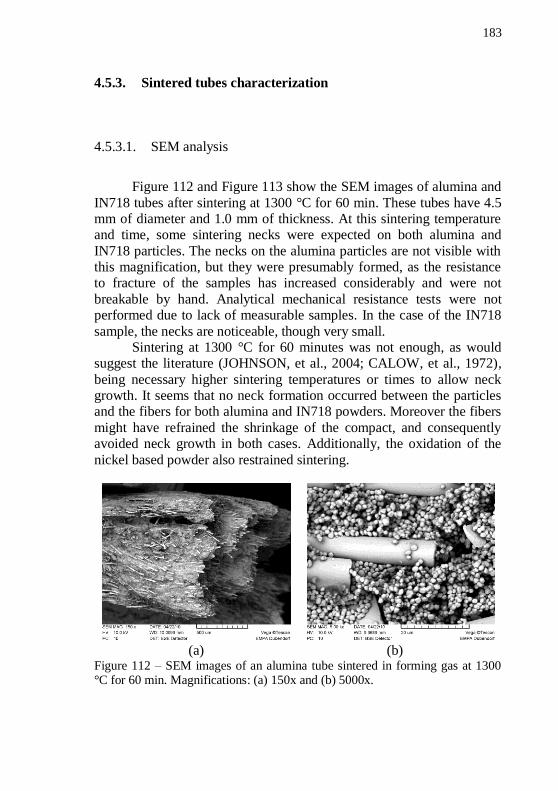
183
4.5.3. Sintered tubes characterization
4.5.3.1. SEM analysis
Figure 112 and Figure 113 show the SEM images of alumina and
IN718 tubes after sintering at 1300 °C for 60 min. These tubes have 4.5 mm of diameter and 1.0 mm of thickness. At this sintering temperature and time, some sintering necks were expected on both alumina and
IN718 particles. The necks on the alumina particles are not visible with this magnification, but they were presumably formed, as the resistance to fracture of the samples has increased considerably and were not
breakable by hand. Analytical mechanical resistance tests were not performed due to lack of measurable samples. In the case of the IN718
sample, the necks are noticeable, though very small. Sintering at 1300 °C for 60 minutes was not enough, as would
suggest the literature (JOHNSON, et al., 2004; CALOW, et al., 1972),
being necessary higher sintering temperatures or times to allow neck growth. It seems that no neck formation occurred between the particles and the fibers for both alumina and IN718 powders. Moreover the fibers
might have refrained the shrinkage of the compact, and consequently avoided neck growth in both cases. Additionally, the oxidation of the
nickel based powder also restrained sintering.
(a) (b) Figure 112 – SEM images of an alumina tube sintered in forming gas at 1300 °C for 60 min. Magnifications: (a) 150x and (b) 5000x.
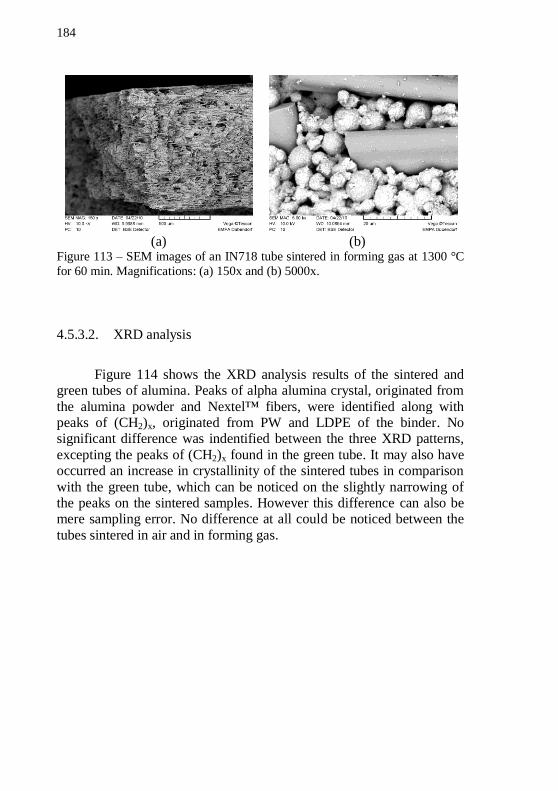
184
(a) (b) Figure 113 – SEM images of an IN718 tube sintered in forming gas at 1300 °C
for 60 min. Magnifications: (a) 150x and (b) 5000x.
4.5.3.2. XRD analysis
Figure 114 shows the XRD analysis results of the sintered and green tubes of alumina. Peaks of alpha alumina crystal, originated from
the alumina powder and Nextel™ fibers, were identified along with peaks of (CH2)x, originated from PW and LDPE of the binder. No significant difference was indentified between the three XRD patterns,
excepting the peaks of (CH2)x found in the green tube. It may also have occurred an increase in crystallinity of the sintered tubes in comparison
with the green tube, which can be noticed on the slightly narrowing of the peaks on the sintered samples. However this difference can also be mere sampling error. No difference at all could be noticed between the
tubes sintered in air and in forming gas.
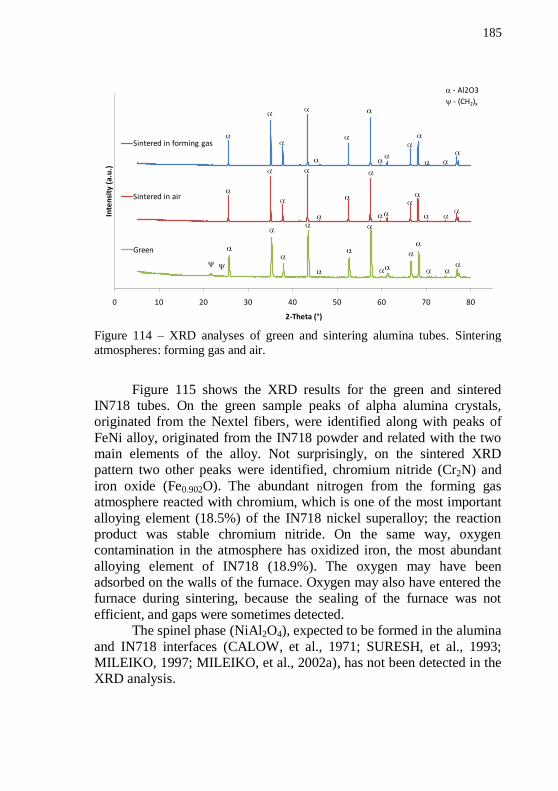
185
Figure 114 – XRD analyses of green and sintering alumina tubes. Sintering
atmospheres: forming gas and air.
Figure 115 shows the XRD results for the green and sintered IN718 tubes. On the green sample peaks of alpha alumina crystals, originated from the Nextel fibers, were identified along with peaks of
FeNi alloy, originated from the IN718 powder and related with the two main elements of the alloy. Not surprisingly, on the sintered XRD pattern two other peaks were identified, chromium nitride (Cr2N) and
iron oxide (Fe0.902O). The abundant nitrogen from the forming gas atmosphere reacted with chromium, which is one of the most important
alloying element (18.5%) of the IN718 nickel superalloy; the reaction product was stable chromium nitride. On the same way, oxygen contamination in the atmosphere has oxidized iron, the most abundant
alloying element of IN718 (18.9%). The oxygen may have been adsorbed on the walls of the furnace. Oxygen may also have entered the furnace during sintering, because the sealing of the furnace was not
efficient, and gaps were sometimes detected. The spinel phase (NiAl2O4), expected to be formed in the alumina
and IN718 interfaces (CALOW, et al., 1971; SURESH, et al., 1993; MILEIKO, 1997; MILEIKO, et al., 2002a), has not been detected in the XRD analysis.
0 10 20 30 40 50 60 70 80
Inte
nsi
ty (
a.u
.)
2-Theta (°)
Sintered in forming gas
Sintered in air
Green
- Al2O3
y - (CH2)x
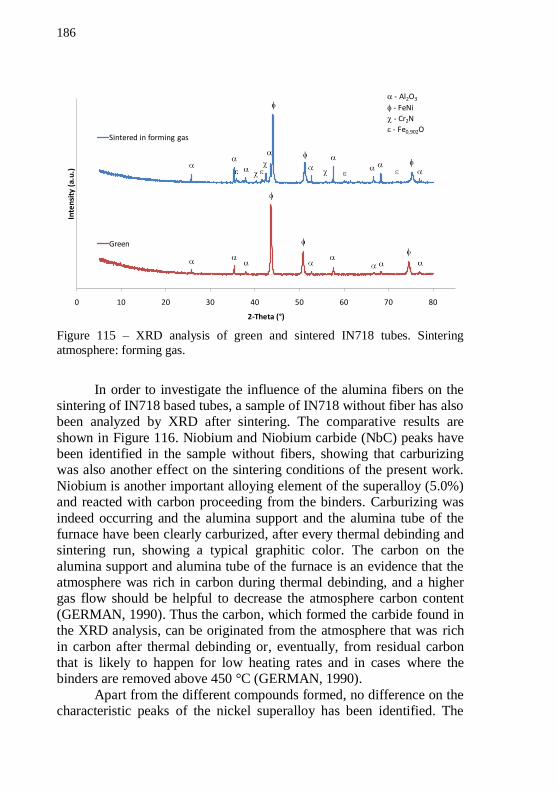
186
Figure 115 – XRD analysis of green and sintered IN718 tubes. Sintering
atmosphere: forming gas.
In order to investigate the influence of the alumina fibers on the sintering of IN718 based tubes, a sample of IN718 without fiber has also been analyzed by XRD after sintering. The comparative results are
shown in Figure 116. Niobium and Niobium carbide (NbC) peaks have been identified in the sample without fibers, showing that carburizing was also another effect on the sintering conditions of the present work.
Niobium is another important alloying element of the superalloy (5.0%) and reacted with carbon proceeding from the binders. Carburizing was
indeed occurring and the alumina support and the alumina tube of the furnace have been clearly carburized, after every thermal debinding and sintering run, showing a typical graphitic color. The carbon on the
alumina support and alumina tube of the furnace is an evidence that the atmosphere was rich in carbon during thermal debinding, and a higher gas flow should be helpful to decrease the atmosphere carbon content
(GERMAN, 1990). Thus the carbon, which formed the carbide found in the XRD analysis, can be originated from the atmosphere that was rich
in carbon after thermal debinding or, eventually, from residual carbon that is likely to happen for low heating rates and in cases where the binders are removed above 450 °C (GERMAN, 1990).
Apart from the different compounds formed, no difference on the characteristic peaks of the nickel superalloy has been identified. The
0 10 20 30 40 50 60 70 80
Inte
nsi
ty (
a.u
.)
2-Theta (°)
Sintered in forming gas
Green
- Al2O3
- FeNi
c - Cr2N
e - Fe0,902O
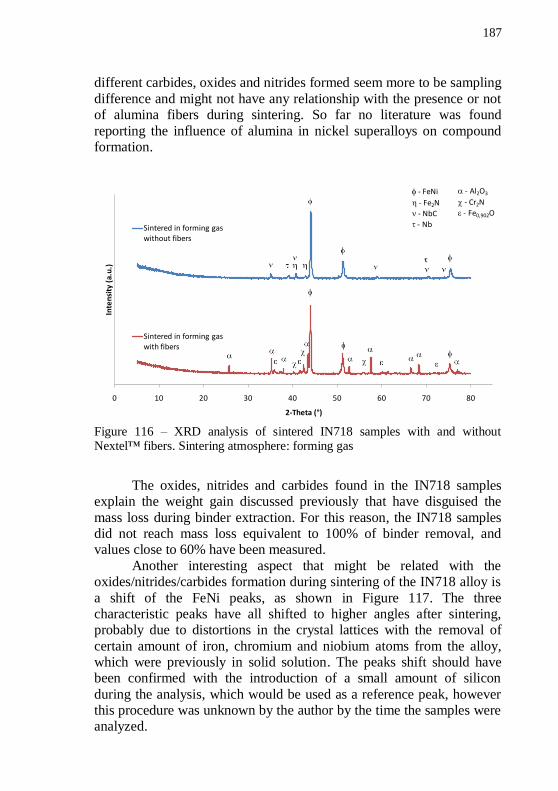
187
different carbides, oxides and nitrides formed seem more to be sampling
difference and might not have any relationship with the presence or not of alumina fibers during sintering. So far no literature was found
reporting the influence of alumina in nickel superalloys on compound formation.
Figure 116 – XRD analysis of sintered IN718 samples with and without Nextel™ fibers. Sintering atmosphere: forming gas
The oxides, nitrides and carbides found in the IN718 samples explain the weight gain discussed previously that have disguised the
mass loss during binder extraction. For this reason, the IN718 samples did not reach mass loss equivalent to 100% of binder removal, and values close to 60% have been measured.
Another interesting aspect that might be related with the oxides/nitrides/carbides formation during sintering of the IN718 alloy is
a shift of the FeNi peaks, as shown in Figure 117. The three characteristic peaks have all shifted to higher angles after sintering, probably due to distortions in the crystal lattices with the removal of
certain amount of iron, chromium and niobium atoms from the alloy, which were previously in solid solution. The peaks shift should have been confirmed with the introduction of a small amount of silicon
during the analysis, which would be used as a reference peak, however this procedure was unknown by the author by the time the samples were analyzed.
0 10 20 30 40 50 60 70 80
Inte
nsi
ty (
a.u
.)
2-Theta (°)
Sintered in forming gaswithout fibers
Sintered in forming gaswith fibers
- FeNi
- Fe2N
- NbC
- Nb
- Al2O3
c - Cr2N
e - Fe0,902O
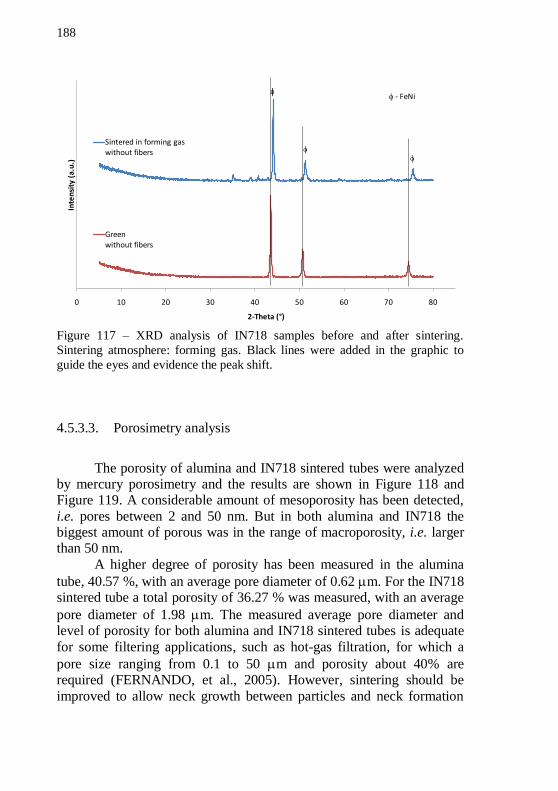
188
Figure 117 – XRD analysis of IN718 samples before and after sintering.
Sintering atmosphere: forming gas. Black lines were added in the graphic to
guide the eyes and evidence the peak shift.
4.5.3.3. Porosimetry analysis
The porosity of alumina and IN718 sintered tubes were analyzed by mercury porosimetry and the results are shown in Figure 118 and Figure 119. A considerable amount of mesoporosity has been detected,
i.e. pores between 2 and 50 nm. But in both alumina and IN718 the biggest amount of porous was in the range of macroporosity, i.e. larger than 50 nm.
A higher degree of porosity has been measured in the alumina
tube, 40.57 %, with an average pore diameter of 0.62 m. For the IN718 sintered tube a total porosity of 36.27 % was measured, with an average
pore diameter of 1.98 m. The measured average pore diameter and level of porosity for both alumina and IN718 sintered tubes is adequate
for some filtering applications, such as hot-gas filtration, for which a
pore size ranging from 0.1 to 50 m and porosity about 40% are required (FERNANDO, et al., 2005). However, sintering should be
improved to allow neck growth between particles and neck formation
0 10 20 30 40 50 60 70 80
Inte
nsi
ty (
a.u
.)
2-Theta (°)
Sintered in forming gaswithout fibers
Greenwithout fibers
- FeNi
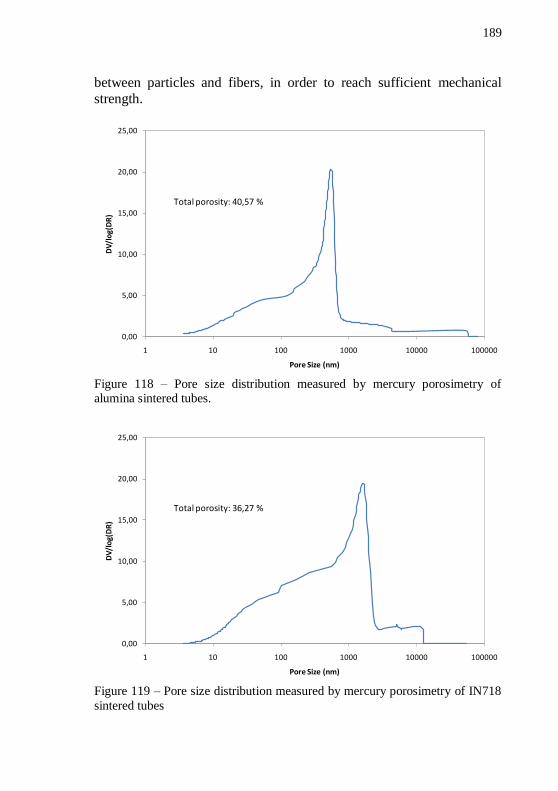
189
between particles and fibers, in order to reach sufficient mechanical
strength.
Figure 118 – Pore size distribution measured by mercury porosimetry of alumina sintered tubes.
Figure 119 – Pore size distribution measured by mercury porosimetry of IN718
sintered tubes
0,00
5,00
10,00
15,00
20,00
25,00
1 10 100 1000 10000 100000
DV
/lo
g(D
R)
Pore Size (nm)
Total porosity: 40,57 %
0,00
5,00
10,00
15,00
20,00
25,00
1 10 100 1000 10000 100000
DV
/lo
g(D
R)
Pore Size (nm)
Total porosity: 36,27 %

190
191
5. CONCLUSIONS
Regarding the preliminary tests:
i. The production of disc-shaped samples via feedstock
warm-pressing technique showed to be an easy, fast and versatile route for feedstocks development;
ii. A binder system composed uniquely of LDPE showed to
be inadequate for non-oxide powder processing, for which a reducing or inert atmosphere must be used during thermal debinding;
iii. The use of a LDPE with higher MFI, i.e. higher viscosity, does not solve the problems of blisters
formation, edge rounding and deformation, originated during thermal debinding in non-oxidizing atmospheres of warm-pressed samples with a binder system consisted
of plain LDPE;
Regarding feedstock development:
iv. Deformation and edge rounding could be eliminated by
increasing the solids content in the feedstocks; v. The viscosity model of Frankel and Acrivos showed to
be the best model to describe the viscosity as a function of solids content for the alumina powder used in the present work;
vi. The elimination of blisters could only be achieved by introducing at least 30 vol.% of PW in the binder system;
vii. The introduction of fibers into the feedstock increased
considerably the torque during mixing of IN718 feedstock, but not for alumina feedstock. This difference might be related with powder composition, particle shape
and particle size distribution; viii. Fiber breakage occurred during kneading and was
evident on torque decrease of mixing curves. After extrusion, SEM images showed that fiber length has decreased from 30 mm to about 0.5 mm;
ix. The fibers did not alter the debinding behavior of the warm-pressed samples;
192
Regarding powder thermoplastic extrusion:
x. Higher extrusion pressures, which leads to higher feedstock compaction, are achieved with low cylinder
temperature, low die temperature and high piston speed; xi. Cylinder temperature should be kept slightly above the
backbone melting point. For the feedstock of the present
work, the temperature of 120 °C is adequate. Above this temperature rough surface and banana shape defects happen, whereas below this temperature fish scale and
stains appear in the extruded tube. xii. Die temperature should be kept below the backbone
melting point, otherwise the extruded tubes show rough surface and banana shape. In the present work 78 °C has shown to be an adequate temperature;
xiii. Extrusion speed should be kept as low as possible in order to avoid defects such as fish scale and banana shape. For the present work extrusion speeds equal or
lower than 15.7 mm/min showed to be adequate, no matter the die geometry used;
xiv. Piston speed should be controlled in order to guarantee the same extrusion speed for different die geometries;
xv. Fiber alignment was successfully achieved with the use
of powder thermoplastic extrusion for the production of short fibers reinforced composites;
Regarding tubes debinding:
xvi. Thermal debinding of tubes showed to be more critical than thermal debinding of warm-pressed discs, and tubes were more prone to undergo deformation;
xvii. Deformation during thermal debinding could be diminished for IN718 tubes and completely avoided for
alumina tubes with the use of a solvent debinding step, before thermal debinding;
xviii. LDPE showed not to be the ideal binder for alumina and
IN718 powders, since the onset of sintering temperature is considerably higher than the temperature of LDPE thermal removal (around 450 °C).
193
xix. Ethanol showed to be a good solvent for solvent
debinding, being able to extract more than 90% of SA and PW from the compacts;
Regarding tubes sintering and tubes characterization:
xx. Sintering at 1300 °C for 60 min is enough for neck formation but not enough for neck growth of the used
alumina and IN718 powders. Sintering temperature or time should be increased to develop mechanical strength of the tubes;
xxi. XRD analysis of alumina tubes has shown that no unexpected phase or crystallinity change has occurred
after sintering of alumina powder together with alumina fibers;
xxii. XRD analysis of IN718 tubes has shown that the
expected, but undesired, spinel phase was not formed on IN718 particles and alumina fiber interfaces. On the other hand, undesired carbides, nitrides and oxides have
been formed, reducing the amount of this elements in the alloy and, consequently, causing a peak shift on the alloy
XRD pattern. The formation of these compounds has showed that the thermal debinding and sintering conditions were not appropriate;
xxiii. Porosimetry analysis have shown that, despite the sintering conditions, temperature and time were not adequate, the level of porosity and pore size distribution
was adequate for some filtering applications, such as hot-gas filtration. The increase in sintering level of would, however, decrease the porosity of the material, which
could make the tubes inadequate for such applications.
As a final conclusion it can be stated that the powder
thermoplastic extrusion has proved to be a promising processing route to produce short fibers reinforced porous MMCs and CMCs.

194

195
SUGGESTIONS FOR FUTURE WORK
i. Study of mixing, extrusion and sintering behavior of different powders (e.g. nickel superalloy IN625) and
other oxide fibers; ii. Investigation of the extrusion process with other binders
systems, using for example polymers with higher
viscosity, more adequate for the extrusion process; or polymers with higher evaporation/degradation temperature, allowing the onset of sintering to occur
before the total removal of the backbone; iii. Extrusion of other profile geometries, e.g. rods and
prisms; iv. Metrological analyses of the tubes after extrusion and
after sintering;
v. Study of the influence of sintering conditions and parameters on the microstructure evolution, especially regarding the neck growth and porosity;
vi. Test of mechanical strength of sintered tubes and comparison between tubes with and without fibers, e.g.
three point flexural strength; vii. Study the fatigue resistance of the porous tubes and the
influence of the fibers on this property;
viii. Investigation of filtration efficiency of the porous tubes; ix. Investigation of creep, wear and corrosion resistance of
the porous tubes and study the influence of the fibers on
these properties; x. Study other sintering techniques, such as hot isostatic
pressing, which allows reach a full dense sintered
compacts, for the use in other applications in which pores are undesirable.

196
197
REFERENCES
AKHTAR, Farid. 2009. Synthesis, microstructure and mechanical properties of Al2O3 reinforced Ni3Al matrix composite. Materials
Science and Engineering: A. 15 de January de 2009, Vol. 499, 1-2, pp. 415-420.
ASM International. 2000. ASM Specialty Handbook: Nickel, Cobalt,
and Their Alloys. [ed.] J. R. Davis. s.l. : ASM International, 2000. pp. 204-229. ISBN: 0-87170-685-7.
BANSAL, Narottam P. 2005. Handbook of ceramic composites. New
York : Kluwer Academic Publishers, 2005. ISBN 1-4020-8133-2.
BOSE, A., et al. 1997. Powder injection molding of inconel 718 alloy.
Advances in Powder Metallurgy and Particulate Materials. 1997, Vol. 3, pp. 18.99-18.112.
CALLISTER, Willian D. Jr. 2006. Fundamentos da ciência e
engenharia de materiais: uma abordagem integrada. [trad.] Sérgio Murilo Stamile Soares. Segunda Edição. Rio de Janeiro : LTC, 2006. ISBN 85-216-1515-9.
CALOW, C. A. and MOORE, A. 1972. No hope for ceramic whiskers or fibres as reinforcement of metal matrices at high temperature. Journal
of Materials Science. 1972, Vol. 7, 5, pp. 543-558.
—. 1971. Reinforcement of metals with ceramic whiskers and fibres. Composites. December 1971, Vol. 2, 4, pp. 231-236.
CHAWLA, K. K. 2003. Ceramic matrix composites. Second Edition. Dordrecht : Kluwer Academic Publishers, 2003. ISBN 1-40207262-7.
CHAWLA, N. and CHAWLA, K. K. 2006. Metal matrix composites.
New York : Springer Science+Business Media, Inc., 2006. ISBN 10 0-387-23306-7.
CHENG, Baojia, et al. 2001. Evaluation of rheological parameters of
polymer melts in torque rheometers. Polymer Testing. 2001, Vol. 20, 7, pp. 811-818.
198
CHEREMISINOFF, Nicholas P. 1987. Polymer mixing and extrusion
technology. New York : Marcel Dekker, Inc., 1987. ISBN 0-8247-7793-X.
CHONG, J. S., CHRISTIANSEN, E. B. and BAER, A. D. 1971. Rheology of concentrated suspensions. Journal of Applied Polymer Science. 1971, Vol. 15, pp. 2007-2021.
CHOU, T. W., KELLY, A. and OKURA, A. 1985. Fibre-reinforced metal-matrix composites. Composites. July 1985, Vol. 16, 3, pp. 187-206.
CHUNG, Chan I. 2000. Extrusion of polymers: theory and practice. Cincinnati : Hanser Gardner Publications, Inc., 2000. ISBN 3-446-
21376-7.
CINIBULK, Michael K., KELLER, Kristin A. and MAH, Tai-Il. 2004. Effect of ytrium aluminum garnet additions on alumina-fiber-
reinforced porous-alumina-matrix composites. Journal of the American Ceramic Society. May 2004, Vol. 87, 5, pp. 881-887.
COOPER, Rene M. 1993. Results on powder injection molding of
Ni3Al and Application to other intermetallic compositions. Material Research Society Symposium Proceeding. 1993, Vol. 288, pp. 903-908.
COOVATTANACHAI, Ornmanee, et al. 2010. Effect of heating rate on sintered series 300 stainless steel. Songklanakarin Journal of Science and Technology. 2010, Vol. 32, 2, pp. 163-167.
DEALY, John M. and SAUCIER, Peter C. 2000. Rheology in plastics quality control. Munich : Carl Hanser Verlag, 2000. ISBN 3-446-21069-5.
DEALY, John M. and WISSBRUN, Kurt F. 1999. Melt rheology and its role in plastic processing: theory and applications. Dordrecht : Kluwer Academic Publishers, 1999. ISBN 0-7923-5886-4.
DHINGRA, A. K. 1980. Alumina fiber FP. Philosophical Transactions of the Royal Society of London Series A - Mathematical Physical and
Engineering Sciences. 1980, Vol. 294, 1411, pp. 411-417.
199
DUO, Wenli, et al. 1999. The role of the filter cake in hot gas cleaning
with ceramic filters. Industrial & Engineering Chemistry Research. January 1999, Vol. 38, 260-269, pp. 260-269.
EILERS, H. 1941. Die Viskosität von Emulsionen hochviskoser Stoffe als Funktion der Konzentration. Kolloids-Zeitschrift. 1941, Vol. 97, 4, pp. 313-321.
—. 1949. The colloidal structure of asphalt. Journal of Physical and Colloid Chemistry. 1949, Vol. 53, 8, pp. 1195-1211.
FERNANDO, J. A. and CHUNG, D. L. L. 2002. Pore structure and
permeability of an alumina fiber filter membrane for hot gas filtration. Journal of porous materials 9. 2002, pp. 211-219.
FERNANDO, J.A. and CHUNG, D.L.L. 2005. Thermomechanical properties of alumina fiber membrane. Ceramics International. 2005, 31, pp. 453–460.
FRANKEL, N. A. and ACRIVOS, Andreas. 1967. On the viscosity of a concentrated suspension of solid spheres. Chemical Engineering Science. 1967, Vol. 22, pp. 847-853.
GERMAN, R. M. and BOSE, A. 1989. Fabrication of intermetallic matrix composites. Materials Science and Engineering: A. January
1989, Vol. 107, pp. 107-116.
GERMAN, Randall M. 1990. Powder injection molding. Princeton : MPFI Metal Powder Industries Federation, 1990. ISBN 0-918404-95-9.
—. 2005. Powder Metallurgy and Particulate Materials Processing. Princeton : MPIF Metal Powder Industries Federation, 2005. ISBN: 0-9762057-1-8.
HACKEMANN, S., FLUCHT, F. and BRAUE, W. 2010. Creep investigations of alumina-based all-oxide ceramic matrix composites. Composites Part A: Applied Science and Manufacturing. 2010. In Press,
Corrected Proof.
200
HAJMRLE, K. and ANGERS, R. 1980. Sintering of Inconel 718. The
International Journal of Powder Metallurgy & Powder Technology. 1980, Vol. 16, 3, pp. 255-266.
HU, W., KARDUCK, P. and GOTTSTEIN, G. 1997. Diffusion of Ni into Al2O3-fibres during hot pressing of Al2O3/Ni3Al long fibre composites. Acta Materialia. November 1997, Vol. 45, 11, pp. 991-997.
HU, W., WUNDERLICH, W. and GOTTSTEIN, G. 1996. Interfacial chemical stability during diffusion bonding of Al2O3-fibres with Ni3Al- and NiAl-matrices. Acta Materialia. 6, June 1996, Vol. 44, pp. 2383-
2396.
INNOCENTINI, M. D. M., et al. 2009. Permeability optimization and
performance evaluation of hot aerosol filters made using foam incorporated alumina suspension. Journal of Hazardous Materials. February 15, 2009, Vol. 162, 1, pp. 212-221.
IPMD Inovar Communications Ltd. 2010. Powder Metallurgy - A Dynamic and Evolving Industry. International Powder Metallurgy Directory. [Online] Orangeleaf Systems Ltd, 2010. [Cited: September 3,
2010.] http://www.ipmd.net/pmindustry/whatispm.
ISHIZAKI, K., KOMARNENI, S. and NANKO, M. 1998. Porous
materials: process technology and applications. Dordrecht : Kluwer Academic Publishers, 1998. ISBN 0-412-71110-9.
JOHNSON, J. L., et al. 2004. Mechanical properties and corrosion
resistance of MIM Ni-based supperalloys. Advances in Powder Metallurgy and Particulate Materials. July 2004, Part 4, pp. 89-101.
KRIEGER, Irvin M. and DOUGHERTY, Thomas J. 1959. A
mechanism for non-Newtonian flow in suspensions of rigid spheres. Transactions of The Society of Rheology. 1959, Vol. III, pp. 137-152.
LEE, P. Y., UCHIJIMA, T. and YANO, T. 2003. Processing and
performance of alumina fiber reinforced alumina composites. Journal of Materials Science and Technology. 2003, Vol. 19, 4, pp. 337-340.
201
LEV, L. C. and ARGON, A. S. 1995. Oxide-fiber-oxide-matrix
composites. Materials Science and Engineering A. June 1, 1995, Vol. 195, pp. 251-261.
LIN, Chung-Kwei, HONG, Shi-Shen and LEE, Pee-Yew. 2000. Formation of NiAl–Al2O3 intermetallic-matrix composite powders by mechanical alloying technique. Intermetallics. September 2000, Vol. 8,
9-11, pp. 1043-1048.
MAITY, A. K. and XAVIER, S. F. 1999. Rheological properties of ethylene–propylene block copolymer and EPDM rubber blends using a
torque rheometer. European Polymer Journal. January 1999, Vol. 35, 1, pp. 173-181.
MARSHALL, D. B. and DAVIS, J. B. 2001. Ceramics for future power generation technology: fiber reinforced oxide composites. Current Opinion in Solid State and Materials Science. 2001, Vol. 5, 4,
pp. 283-289.
MICHALSKI, A., et al. 2006. NiAl–Al2O3 composites produced by pulse plasma sintering with the participation of the SHS reaction.
Intermetallics. June de 2006, Vol. 14, 6, pp. 603-606.
MILEIKO, S. T. 1997. Metal and ceramic based composites. [ed.] R.
Byron Pipes. Amsterdam : Elsevier Science B.V., 1997. Vol. 12, Composite Materials Series. ISBN 0-444-82814-1.
—. 2002. Oxide-fibre/Ni-based matrix composites - III: a creep model
and analysis of experimental data. Composites Science and Technology. February 2002, Vol. 62, 2, pp. 195-204.
MILEIKO, S. T., et al. 2004. Oxide fibres in a nickel-base matrix - do
they degrade or become stronger? Proceedings of the Institution of Mechanical Engineers Part L - Journal of Materials - Design and Applications. August de 2004, Vol. 218, L3, pp. 193-199.
MILEIKO, S. T., et al. 2002b. Oxide-fibre/Ni-based matrix composites - II: mechanical behaviour. Composites Science and Technology.
February 2002b, Vol. 62, 2, pp. 181-193.
202
MILEIKO, S. T., et al. 2002a. Oxide-fibre/nickel-based matrix
composites - part I: fabrication and microstructure. Composites Science and Technology. February de 2002a, Vol. 62, 2, pp. 167-179.
MOONEY, M. 1951. The viscosity of a concetrated suspension of spherical particles. Journal of Colloid Science. 1951, Vol. 6, 2, pp. 162-170.
MURUT, Aldo E. and WHITE, Calvin L. 1997. Reinforcement/matrix interaction in Al2O3 and Al2O3-ZrO2 fiber-reinforced Ni3Al matrix composites. Acta Materialia. June 1997, Vol.
46, 6, pp. 2547-2563.
PADMAVARDHANI, D., GOMEZ, A. and ABBASCHIAN, R.
1998. Synthesis and microstructural characterization of NiAl-Al2O3 functionally gradient composites. Intermetallics. 1998, Vol. 6, 4, pp. 229-241.
Plastics Today. 2010. Sintering: A critical step. Home of modern plastic and injection molding. [Online] Canon Communications LLC, 2010. [Cited: October 11, 2010.]
http://www.plasticstoday.com/articles/sintering-critical-step.
POVIRK, G. L., et al. 1988. Interfaces in nickel aluminide/alumina
fibre composites. Journal of Materials Science. 1988, Vol. 23, pp. 3945-3950.
PRABHAKARAN, K., et al. 2005. A Novel Process for Low-Density
Alumina Foams. Journal of the American Ceramic Society. September de 2005, Vol. 88, 9, pp. 2600-2603.
PRENTICE, P. 1995. Rheology and its role in plastics processing. [ed.]
Rebecca Dolbey. Shawbury : Rapra Technology Ltd., 1995. Vol. 7, Number 12, Report 84. ISSN: 0889-3144.
QUEMADA, D. 1977. Rheology of concentrated disperse systems and
minimum energy dissipation principles. 1. Viscosity-concentration relationship. Rheologica Acta. 1977, Vol. 16, 1, pp. 82-94.
203
—. 1978. Rheology of concentrated disperse systems. 3. General
features of proposed non-Newtonian model - Comparison with experimental Data. Rheologica Acta. 1978, Vol. 17, pp. 643-653.
RAUWENDAAL, Chris. 1986. Polymer extrusion. Munich; Vienna; New York : Hansers Publishers, 1986. ISBN 3-446-14196-0.
REED, James S. 1995. Principles of Ceramics Processing. Second
Edition. New York : A Wiley-Interschience Publication, 1995. ISBN 0-471-59721-X.
ROUQUEROL, J., et al. 1994. Recommendations for the
characterization of porous solids (Technical Report). Pure and Applied Chemistry. 1994, Vol. 66, 8, pp. 1739-1758.
SHENOY, Aroon V. 1999. Rheology of filled polymer systems. Dordrecht : Kluwer Academic Publishers, 1999. ISBN 0-412-83100-7.
Special Metals Corporation. 2008. Special Metals. Special Metals.
[Online] Precision Castparts Corp. company, 2008. [Cited: Oktober 19, 2010.] http://www.specialmetals.com/.
STOLOFF, N. S. and ALMAN, D. E. 1991. Powder processing of
intermetallic alloys and intermetallic matrix composites. Materials Science and Engineering: A. October 1991, Vol. 144, 1-2, pp. 51-62.
STUDART, André R., et al. 2006. Processing Routes to Macroporous Ceramics: A Review. Journal of the American Ceramic Society. June 2006, Vol. 89, 6, pp. 1771–1789.
SURESH, S., MORTENSEN, A. and NEEDLEMAN, A. 1993. Fundamentals of metal matrix composites. Stoneham : Butterworth-Heinemann, 1993. ISBN 0-7506-9321-5.
TROPEA, Cameron, YARIN, Alexander and FOSS, John F. 2007. Springer handbook of experimental fluid mechanics. Berlin, Heidelberg : Springer-Verlag, 2007. ISBN 978-3-540-25141-5.
VALENCIA, J. J., et al. 1994. Microstructure and mechanical properties of INCONEL 625 and 718 alloys processed by powder

204
injection molding. [ed.] E. A. Loria. Superalloys 718, 625, 706 and
Various Derivatives. 1994.
VALENCIA, J. J., SPIRKO, J. and SCHMEES, R. 1997. Sintering
effect on the microstructure and mechanical properties of alloy 718 processed by powder injection molding. [ed.] E. A. Loria. Superalloys 718, 623, 706 and Various Derivatives. 1997.
WEGMANN, M. R., MISIOLEK, W. Z. and GERMAN, R. M. 1991. Injection Molding and Reactive Sintering of Ni3Al. Advances in Powder Metallurgy. 1991, Vol. 2, pp. 75-180.
WOOD, S. and HARRIS, A. T. 2008. Porous burners for lean-burn applications. Progress in Energy and Combustion Science. October
2008, Vol. 34, 5, pp. 667-684.
YE, Hezhou, LIU, Xing Yang and HONG, Hanping. 2008. Fabrication of metal matrix composites by metal injection molding - A
review. Journal of Materials Processing Technology. 2008, Vol. 200, 1-3, pp. 12-24.
ZHU, H. X. and ABBASCHIAN, R. 2000. In-situ processing of NiAl–
alumina composites by thermite reaction. Materials Science and Engineering A. April 30, 2000, Vol. 282, 1-2, pp. 1-7.
205
ANEXO A – Resumo estendido em português
Introdução e objetivos
Materiais com poros interconectados são utilizados em diversas
aplicações, em particular na filtragem. Exemplos de processos de filtragem são: purificação de água, filtração de óleo, filtração de aerossóis, filtração de gases quentes.
Nestes processos, os materiais porosos devem apresentar as seguintes propriedades:
i. Rede interconectada de poros;
ii. Distribuição de tamanho de poros adequada; iii. Resistência mecânica;
iv. Resistência térmica; v. Resistência a corrosão e a oxidação.
Contudo, se por um lado estes materiais devem apresentar uma
alta porosidade, por outro lado eles devem ter resistência mecânica suficiente para suportar os esforços impostos a estes componentes.
A introdução de fibras curtas é uma maneira inteligente de
aumentar a resistência mecânica destes componentes sem prejudicar a indispensável permeabilidade.
O principal objetivo deste trabalho é a obtenção de compósitos tubulares porosos de matrizes metálica e cerâmica, reforçados por fibras curtas, através da extrusão termoplástica de pós.
A extrusão termoplástica de pós é um processo capaz de produzir tubos de paredes finas, com alta razão de aspecto, isto é, tubos longos com diâmetro e espessura de parede muito inferiores ao comprimento.
Além disso, a extrusão é um processo contínuo, com capacidade produtiva relativamente alta. No caso da extrusão termoplástica, uma das vantagens é a manutenção do tamanho de fibras, pois este processo
impõe esforços cisalhantes muito inferiores se comparados com a extrusão convencional. Outra característica do processo em questão é o
alinhamento das fibras na direção da extrusão. Além do objetivo principal, são também objetivos deste trabalho:
i. Desenvolver um feedstock adequado aos processos de
remoção de ligantes e extrusão;
206
ii. Investigar a influência das fibras durante os processos de
mistura e remoção dos ligantes; iii. Investigar a influência dos parâmetros de extrusão,
notadamente, temperatura do cilindro, temperatura da matriz de extrusão e velocidade do pistão;
iv. Caracterizar os tubos sinterizados em termos de
microestrutura, porosidade e fases cristalinas.
Breve descrição experimental
Para compor a matriz dos compósitos de matriz metálica foi
escolhido pó de superliga de níquel IN718, com tamanho médio de
partícula de 6,5 m em formato esférico. No caso dos compósitos de
matriz cerâmica foi escolhido pó de -alumina, com tamanho médio de
partícula de 2,5 m em formato poligonal. Como reforço foram selecionadas fibras comerciais de alumina
Nextel™ 610, fornecidas pela 3M Company. As fibras foram fornecidas
picadas no comprimento de 30 mm, com diâmetro entre 10 e 12 m. Como ligantes foram utilizados dois polietilenos de baixa
densidade, um com índice de fluidez de 2,0 g/10min (LDPE02) e outro com índice de fluidez de 70,0 g/10min (LDPE70), parafina (PW) e ácido esteárico (SA).
O desenvolvimento do feedstock foi dividido em duas etapas. A primeira consistiu em definir o teor de sólidos. Para isto foi
utilizado somente polietileno (LDPE02 e LDPE70) e alumina, por ser o
pó que rendia feedstocks de maior viscosidade. O teor de sólidos variou entre 54 e 62 % em volume.
A segunda etapa consistiu em definir o teor de parafina no sistema ligante. Para isso foram utilizados como ligantes LDPE, PW e SA e, desta vez, feedstocks dos dois tipos de pós (alumina e IN718)
foram produzidos. O teor de LDPE, bem como o de PW, variou entre 0 e 95 % em volume. O teor de SA foi fixado em 5 % em volume. Nesta etapa foi utilizado o teor de sólidos definido na etapa anterior.
O procedimento utilizado em ambas as etapas do desenvolvimento do feedstock consistiu em misturar os pós com os ligantes em um kneader (reômetro de torque) a 180 °C por 30 minutos e,
em seguida a 152 °C por 40 minutos. Nesta etapa, o valor do torque necessário para a mistura foi importante na avaliação do teor de sólidos,
bem como do teor de PW. Em seguida o feedstock produzido foi granulado em um reômetro capilar através de uma matriz de 1 mm de
207
diâmetro a 140 °C. Após isso, os grânulos foram prensados a morno (a
temperaturas em torno da temperatura de fusão dos polietilenos) em forma de disco, através de uma prensa manual, sob força de 10 kN. A
matriz utilizada apresentava 28 mm de diâmetro. A quantidade de grânulos prensada foi suficiente para produzir discos com espessura de 0.8 mm. Os discos prensados foram então levados ao forno para a
remoção dos ligantes, que se deu à 600 °C por 60 minutos, com uma taxa de aquecimento de 0,5 °C/min, em atmosferas redutora (no caso dos compósitos de matrizes metálica e cerâmica) e oxidante (somente no
caso de compósitos de matriz cerâmica). Em seguida, os discos foram avaliados no tocante à de presença de bolhas e deformação, para
definição do teor de sólidos e teor de parafina. Para a extrusão de tubos, as fibras de alumina foram incorporadas
ao feedstock no teor de 30 % em volume. Tubos as seguintes geometrias
foram extrudados:
i. 10,0 mm de diâmetro e 1,0 mm de espessura; ii. 10,0 mm de diâmetro e 0.6 mm de espessura;
iii. 4,5 mm de diâmetro e 1,0 mm de espessura.
Os parâmetros de extrusão, isto é, temperatura do cilindro,
temperatura da matriz de extrusão e velocidade do pistão, foram controlados a fim de se obter extrudados visualmente sem defeitos.
Os ligantes foram removidos por meio de extração por solvente e
extração térmica. A extração por solventes se deu a 60 °C em um banho de etanol 95 % durante 5 horas. A extração térmica se deu a 600 °C durante 60 minutos, com uma taxa de aquecimento de 0,5 °C/min, em
atmosferas redutora e oxidante. Finalmente os tubos foram sinterizados a 1300 °C durante 60
minutos, a uma taxa de aquecimento de 5,0 °C/min, também em
atmosferas redutora e oxidante. Os tubos foram então caracterizados por microscopia eletrônica
de varredura, difração de raio-X e porosimetria.
Principais resultados
Durante os testes preliminares os discos de alumina apresentaram
defeitos após a extração do LDPE70, realizadas em atmosfera redutora. Os defeitos encontrados foram bolhas, arredondamentos das arestas e deformação. Nenhum defeito foi encontrado nos discos de alumina após
208
a remoção dos ligantes em atmosfera oxidante. No caso dos discos de
IN718, os mesmos defeitos surgiram após a remoção dos ligantes em atmosfera redutora. Não foram realizados testes de extração em
atmosfera oxidante para este pó, devido a potencial oxidação da matriz metálica.
Não foram obtidos resultados melhores com LDPE02, e este
polietileno não foi posteriormente utilizado, pois a viscosidade dos feedstocks com este ligante era muito elevada.
Através da análise do torque durante a mistura dos feedstocks de
alumina, com diferentes teores de sólidos, foi possível calcular o teor máximo de sólidos admissível para este sistema, no valor de 71,4 % em
volume. Com base nos resultados de extração térmica dos mesmos feedstocks, o teor de sólidos ficou definido em 62 % em volume.
Os valores de torque medidos durante esta etapa foram
comparados a diversos modelos de viscosidade, sendo que o modelo de Frankel e Acrivos foi o que melhor descreveu o comportamento do feedstock em questão.
A quantidade de bolhas nas amostras, após a extração dos ligantes, foi o parâmetro utilizado como critério para a definição do teor
de parafina. Sendo assim o teor de parafina mínimo necessário para evitar a formação deste defeito foi de 30 % em volume.
Por fim, o feedstock final para a extrusão foi definido, sendo
constituído da seguinte forma:
i. 62 % em volume de sólidos, dos quais: a. 70 % em volume composto de pós;
b. 30 % em volume composto de fibras; ii. 38 % em volume de ligantes, dos quais:
a. 5 % em volume de SA;
b. 30 % em volume de PW; c. 65 % em volume de LDPE70.
Durante a extrusão, a pressão interna do cilindro variou com a temperatura do cilindro seguindo a relação da equação de Arrhenius. Tubos extrudados com cilindro acima da temperatura de fusão do
LDPE70 apresentaram empenamento e superfície rugosa. Os tubos extrudados abaixo da temperatura de fusão ficaram retos, contudo outros dois defeitos superficiais ficaram evidentes, como escama de peixe e
manchamento.
209
A temperatura da matriz de extrusão foi controlada através do
contato com fluido refrigerante. Os fluidos refrigerantes utilizados foram etanol e água. Os melhores resultados foram obtidos através do
resfriamento da matriz com etanol e alguns tubos sem defeitos foram obtidos desta forma.
Finalmente, o último parâmetro de extrusão controlado foi a
velocidade do pistão. Foi observado que a velocidade do pistão não era o fator mais relevante, e sim, a velocidade de extrusão, à qual está diretamente relacionada a velocidade do pistão. Diversos testes foram
feitos a diferentes velocidades e, finalmente, a velocidade de extrusão ótima foi definida como sendo 15,7 mm/min.
Enfim os parâmetros de extrusão foram definidos da seguinte forma:
i. Temperatura do cilindro: 120 °C;
ii. Temperatura da matriz de extrusão: 120 °C na entrada e 78 °C na saída;
iii. Velocidade de extrusão: 15,7 mm/min.
Sob as condições acima descritas, os tubos produzidos não apresentavam qualquer tipo de defeito visual. Diversos tubos com
comprimento de aproximadamente 15 cm foram extrudados nas três diferentes geometrias.
Em seguida, foi realizada a extração dos ligantes dos tubos. A
tentativa inicial de remover os ligantes através de extração térmica foi ineficaz e os tubos colapsaram, perdendo, em alguns casos, totalmente a forma cilíndrica. Com base neste resultado decidiu-se por utilizar,
previamente à extração térmica, a extração por solvente. A análise das amostras através de microscopia eletrônica, antes e
depois da extração por solvente, mostrou que uma rede de poros surgiu
nas amostras após a extração por solvente. A obtenção desta rede de poros tem por finalidade facilitar a permeação dos gases produzidos
durante a posterior remoção térmica dos ligantes. Os resultados após a extração por solvente seguida por extração
térmica foram satisfatórios e a maioria dos tubos não apresentou
deformação. Finalmente, os tubos foram sinterizados a 1300 °C durante 60
minutos.
As imagens obtidas por microscopia eletrônica de varredura mostraram uma estrutura bastante porosa, na qual as partículas
210
praticamente não sinterizaram e o crescimento dos pescoços de
sinterização não foi observado. A formação dos pescoços pode ser somente observada entre as
partículas de IN718. As fibras, por sua vez, aparentemente não aderiram a nenhuma das partículas, tanto nos compósitos de matriz de IN718 quanto nos de matriz de alumina.
Os resultados de difração de raios-X mostraram que nenhuma
fase diferente de -alumina formou-se nos compósitos de matriz cerâmica. Já nos compósitos de matriz metálica, picos de nitretos,
carbonetos e óxidos foram identificados. Com base nestes resultados, pode-se dizer que a atmosfera redutora, rica em nitrogênio, interagiu
com as amostras formando nitretos. O carbono, oriundo dos ligantes, que não foi totalmente extraído na forma de gases, também interagiu com as partículas metálicas, formando os carbonetos. A oxidação das
amostras, por sua vez, mostrou que a vedação do forno não foi satisfatória, e uma quantidade significativa de oxigênio estava presente na atmosfera durante o tratamento térmico.
Outro aspecto interessante observado na difratometria dos compósitos de matriz metálica foi o deslocamento dos picos característicos da liga de níquel. Este deslocamento se deve,
provavelmente, a distorções na rede cristalina causada pelo empobrecimento da liga em relação aos elementos formadores de
carbonetos, nitretos e óxidos. Finalmente, a análise porosimétrica das amostras mostrou que os
tubos em matriz cerâmica apresentaram uma porosidade de 40,57 %,
com um tamanho médio de poros de 0,62 m. Os tubos em matriz metálica apresentaram uma porosidade de 36,27, com um tamanho
médio de poros de 1,98 m. A partir desses resultados pode-se dizer que
os compósitos tubulares porosos de matriz metálica e cerâmica, reforçados por fibras curtas, obtidos através da extrusão termoplástica de pós, são adequados à aplicação de filtragem de gases quentes, a qual
requer uma porosidade em torno de 40 %, com uma distribuição de
tamanho de poros entre 0,1 e 50 m.
Conclusões mais relevantes
Em relação ao desenvolvimento dos feedstocks:
211
i. Deformação e arredondamento de arestas, após remoção
dos ligantes dos discos prensados, puderam ser eliminados com o aumento do teor de sólidos;
ii. A eliminação de bolhas pode ser alcançada somente com a introdução de, no mínimo, 30 % em volume de PW;
iii. A quebra das fibras foi satisfatoriamente alcançada
durante a preparação da mistura.
Em relação à extrusão termoplástica de pós:
iv. Altas pressões de extrusão, que trazem como
consequência uma mais efetiva compactação do feedstock, são obtidas através de uma baixa temperatura
do cilindro, baixa temperatura da matriz de extrusão e alta velocidade de extrusão;
v. A temperatura do cilindro deve ser mantida ligeiramente
acima da temperatura de fusão do backbone. Para o feedstock deste trabalho, 120 °C é uma temperatura adequada. Acima desta temperatura, superfície rugosa e
empenamento dos tubos tornam-se evidentes, ao passo que, abaixo desta temperatura, escamas de peixes e
manchas surgem na superfície dos tubos; vi. A temperatura da matriz de extrusão deve ser mantida
abaixo da temperatura de fusão do backbone, caso
contrário, surgem defeitos como empenamento e rugosidade na superfície dos tubos. Para o presente trabalho, 78 °C foi a temperatura adequada para a matriz
de extrusão; vii. A velocidade de extrusão deve ser mantida a mais baixa
possível, para evitar defeitos como escama de peixe e
empenamento. Para o feedstock desenvolvido, a velocidade máxima que permitia a produção de
extrudados livres de defeitos foi de 15,7 mm/min; viii. A extrusão termoplástica promoveu o alinhamento das
fibras.
Em relação à remoção de ligantes dos tubos:
212
ix. A deformação dos tubos foi evitada com a utilização de
remoção de ligantes por solventes; x. Etanol é um bom solvente para extração de PW e SA;
Em relação à sinterização e caracterização dos tubos sinterizados:
xi. Sinterização a 1300 °C durante 60 minutos não é suficiente para promover o crescimento dos pescoços de
sinterização entre as partículas e entre as fibras e partículas;
xii. A análise difratométrica mostrou que nenhuma fase,
além de -alumina, formou-se durante a sinterização dos compósitos de matriz cerâmica;
xiii. Nitretos, carbonetos e óxidos foram encontrados nos compósitos de matriz metálica, indicando que a atmosfera utilizada não foi a mais adequada para a
sinterização destes compósitos; xiv. Porosimetria mostrou que os tubos produzidos
apresentam porosidade e distribuição de tamanho de
poros adequada para a filtração de gases quentes.
Finalmente, a extrusão termoplástica de pós provou ser um processo promissor para a obtenção de compósitos tubulares porosos em
matriz cerâmica e metálica reforçados por fibras curtas.