pontifÍcia universidade catÓlica do rio grande do … · a primeira escala de dureza foi criada...
TRANSCRIPT

PONTIFÍCIA UNIVERSIDADE CATÓLICA DO RIO GRANDE DO SUL
Análise de Metodologias de Microdureza aplicadas a Compósitos: é possível comparar
resultados utilizando-se diferentes protocolos?
Gustavo Frainer Barbosa –Doutorando em Odontologia, ênfase em Materiais Dentários
(PUCRS)
Orientador: Hugo Mitsuo Silva Oshima – Professor Doutor do Departamento de
Materiais Dentários (PUCRS)
Tese apresentada à Faculdade de Odontologia da Pontifícia Universidade Católica do Rio Grande do Sul como parte dos requisitos para a obtenção do título de Doutor.
Porto Alegre, Novembro de 2010

2
DEDICATÓRIA
Dedico este trabalho aos meus dois grandes amores. À minha esposa Raquel, companheira inseparável de todos os momentos, minha maior incentivadora e minha maior crítica. E ao meu filho Davi, que com seu lindo sorriso me incentiva e me mostra que, parafraseando Fernando Pessoa, “tudo vale a pena se a alma não é pequena”.

3
AGRADECIMENTOS
Agradeço aos meus pais, eternos incentivadores, que me ensinaram que a
educação é a chave do crescimento.
Agradeço aos meus irmãos, que mesmo distantes estão sempre comigo.
Agradeço aos meus colegas de Doutorado, que muito me ajudaram nas minhas
novas descobertas e na minha evolução do saber.
Agradeço ao meu Orientador, Professor Dr. Hugo Mitsuo Silva Oshima, que me
incentivou a ingressar no Programa de Doutorado e que compreendeu as minhas
ausências, para que eu pudesse me dedicar a minha família, mas que, no entanto,
jamais duvidou da minha capacidade e que sempre teve a certeza de que chegaríamos
a um resultado final de qualidade.
Agradeço aos Professores do Programa de Doutorado por todas as trocas e
ensinamentos, em especial ao Professor Dr. Eduardo Gonçalves Mota por todo o seu
apoio e suporte técnico e à Professora Dra Rosemary Sadami Arai Shinkai que com
sua dedicação, incentivo e preocupação tornaram esta passagem um momento
inesquecível.
Agradeço ao amigo Regênio Mahfuz Herbstrith Segundo pelas trocas e
ensinamentos, pelo seu apoio incondicional, pelo seu incentivo diário e por sempre ter
um tempo para me ouvir.
Agradeço ao amigo e eterno Mestre Celso Gustavo Schwalm Lacroix pelo apoio,
pelos ensinamentos, pelo incentivo e pela confiança que sempre me depositou. Celso,
continuas sendo um exemplo de Profissional a ser seguido.

4
Agradeço ao amigo Tomas Geremia por seus ensinamentos, por seu apoio e por
sua sincera amizade.
Agradeço a amiga Luciene Petcov Machado por suas verdades sarcásticas que
muito me fizeram rir e refletir.

5
RESUMO
Objetivo: Primeiramente, avaliar, em uma resina composta, a correlação existente, em testes
de microdureza, entre os fatores carga e tempo de aplicação, utilizando-se os métodos de
ensaio mecânico Vickers e Knoop. Em segundo lugar, avaliar, em uma resina composta, os
fatores carga e tempo de aplicação no teste de microdureza Knoop, e mostrar, com os
resultados obtidos, quando é possível, através dos testes, fazer uma comparação com o grau
de conversão da resina composta.
Materiais e Métodos: Resina Grandio (Voco, Cuxhaven, Alemanha), cor A2, foi utilizada para
confeccionar as amostras. Noventa (90) amostras foram feitas em uma matriz de
politetrafluoretileno com seis (6) mm de diâmetro por três (3) mm de profundidade, onde dois
incrementos equidistantes foram fotopolimerizados por 20s cada um através de um dispositivo
LED (Celalux, Voco, Cuxhaven, Alemanha, com 800 mW/cm2). As amostras foram divididas
aleatoriamente em três grupos de acordo com o fator carga. Os grupos I, II e III receberam
cargas de 50g, 100g e 500g, respectivamente. Estes grupos foram divididos em nove
subgrupos de acordo com o fator tempo de aplicação (15s, 30s, 45s). Cada amostra recebeu
edentações de um dispositivo Shimadzu HMV tester (Shimadzu, Kioto, Japão). Os resultados
foram analisados estatisticamente através de ANOVA com fatores fixos (carga e tempo de
aplicação), e ao teste de comparações múltiplas de Tukey (α = 0.05).
Resultados: Diferenças significativas foram encontradas entre os grupos para cada
metodologia, Vickers e Knoop (p<0.001). Entre as amostras testadas com a metodologia
Vickers (VHN), a média encontrada variou de 164.94 (50g 45s) até 210.33 (100g 45s). Os
valores de microdureza para a metodologia Knoop (KHN) variaram de 128.92 (500g 45s) até
184.26 (100g 15s). Para ambas as metodologias, tanto o fator tempo e o fator tempo de
aplicação foram estatisticamente significantes (p<0.001), isto mostra que diferentes cargas e
tempos de aplicação influenciam na microdureza das resinas.
Conclusão: Primeiramente, este estudo demonstrou que correlacionar os resultados de testes
de microdureza Vickers and Knoop não é recomendado, e protocolos similares devem ser
aplicados a fim de permitir comparações entre diferentes estudos que utilizam o mesmo tipo de
teste. Em Segundo lugar, este estudo demonstrou que os resultados de microdureza Knoop
não são recomendados para comparações com o grau de conversão das resinas compostas, e
protocolos similares devem ser aplicados a fim de permitir este tipo de correlação.
Key Words: Metodologias. Dureza. Resina composta.

6
ABSTRACT Objective: Firstly, to evaluate correlation between load and dwell time in composite resin
microhardness tests, using Vickers and Knoop mechanic test methods. Secondly, to correlate
time and load on Knoop microhardness test over a composite resin, and to show, with the
obtained results, whether composite resin conversion degree comparison is possible through
the tests.
Materials and Methods: Resin Grandio (Voco, Cuxhaven, Germany), shade A2, was used to
make the samples. . Ninety (90) samples were made on a six-(6)-mm-diameter by three-(3)-
mm-deep polytetrafluorethylene matrix, where two equidistant increments were each
photocured for 20s by the LED device (Celalux, Voco, Cuxhaven, Germany, with 800 mW/cm2).
The samples were randomly divided into three groups according to the load factor. Groups I, II
and III received loads at 50g, 100g and 500g respectively. These groups were divided into nine
subgroups according to the deal time (15s, 30s, 45s). Each sample received indentations from a
Shimadzu HMV tester (Shimadzu, Kyoto, Japan). The results were submitted to a two-way
ANOVA with fixed factors (load and dwell time), and to the post-hoc Tukey multiple comparison
test at α = 0.05.
Results: Significant differences were recorded between groups for each methodology, Vickers
and Knoop (p<0.001). Among the Vickers (VHN) tested samples, the average recorded ranged
from 164.94 (50g for 45s) to 210.33 (100g for 45s). Knoop microhardness (KHN) ranged from
128.92 (500g 45s) to 184.26 (100g 15s). For both methodologies, both load and dwell time were
statistically significant (p<0.001), this way showing that different loads and dwell time influence
the microhardness of resins.
Conclusion: Firstly, this study demonstrated that correlating both Vickers and Knoop
microhardness test results is not recommended, and similar protocols must be applied to allow
comparisons among the different studies that use the same kind of test. Secondly, this study
demonstrated that Knoop microhardness test results is not recommended for composite resin
conversion degree comparisons, and similar protocols should be applied to allow this kind of
correlation.
Key Words: Methods. Hardness. Composite resins.

7
Sumário
DEDICATÓRIA ............................................................................................................................. 2 AGRADECIMENTOS ................................................................................................................... 3 RESUMO ........................................................................................................................................ 5 ABSTRACT .................................................................................................................................... 6 1 Apresentação ........................................................................................................................... 8
2 Artigo Submetido ao Journal of Applied Oral Science ........................................................ 12 3 Artigo Submetido à Operative Dentistry .............................................................................. 22 4 Discussão Geral .................................................................................................................... 29 5 Referências Bibliográficas Adicionais .................................................................................. 32 ANEXO 2 – E-mail de confirmação de submissão de trabalho ao Journal of Applied Oral
Science .......................................................................................................................................... 34
ANEXO 3 – E-mail de confirmação de submissão de trabalho a Operative Dentistry ................ 35

8
1 Apresentação
A dureza é uma propriedade mecânica que pode ser conceituada como a
resistência que um material apresenta ao risco ou à formação de uma marca
permanente quando pressionado por outro material ou por marcadores padronizados
(Garcia, 2000).
Os valores de dureza apresentados por um determinado material possuem uma
dependência direta dos tipos de ligações atômicas, iônicas ou moleculares nele
existentes. Nos sólidos moleculares, como os plásticos, as forças de Van der Waals
atuam entre as moléculas e, por se tratarem de forças baixas, estes materiais são
considerados relativamente macios. Já nos sólidos metálicos e iônicos, como a
natureza das forças ligantes é mais intensa, esses materiais são mais duros, enquanto
os materiais de ligação covalente são, conhecidamente, os materiais de maior dureza
(Garcia, 2000).
No século XVIII, teve início a avaliação científica dessa propriedade dos
materiais, quando se convencionou, então, que a dureza de um material estava ligada
à capacidade que ele apresentava em arranhar outro material. Assim sendo, quanto
maior o risco provocado, mais duro era o material. A primeira escala de dureza foi
criada pelo mineralogista alemão Friedrich Mohs. Essa escala qualitativa atribui aos
materiais um número que indica a sua dureza, sendo o valor 1 atribuído ao talco e o
valor 10, valor máximo, ao diamante. A escala de Mohs é utilizada até os dias de hoje
como uma referência rápida quanto à dureza dos materiais (Blando, 2001).
Com a necessidade de qualificar e quantificar mais precisamente a dureza de
qualquer material, o desenvolvimento de pesquisas sobre o mecanismo dessa
propriedade nos materiais acarretou o surgimento de novas técnicas de medida. Dentre
as novas técnicas de medida de dureza, as mais difundidas e utilizadas até hoje
residem no método de identação (Blando, 2001).
O método identação, ou ensaio de dureza, consiste na aplicação de uma
pressão com uma ponta de penetração, a qual irá imprimir uma marca na superfície da
peça/material analisado. A medida da dureza será dada em função das características

9
da marca de impressão e da força aplicada. O primeiro ensaio de identação
padronizado e reconhecido industrialmente foi o ensaio de Brinell, proposto pelo
metalurgista sueco Johan August Brinell, por volta do ano de 1900. Posteriormente, em
1919, surgiu o teste de Rockwell, criado pelo metalurgista americano Stanley P.
Rockwell. Na década de 50, os estudos de Tabor permitiram avanços importantes para
os testes de dureza, ao relacionar a curva de descarga com propriedades plásticas e
elásticas dos materiais (Blando, 2001).
Os testes de microdureza surgiram, ainda na década de 50, da necessidade de
se utilizar cargas muito menores, porque os testes convencionais já não possuíam
cargas suficientemente baixas para medir somente a dureza de uma superfície tratada,
ou de um filme com espessura pequena (Blando, 2001). Atualmente os testes de
microdureza mais difundidos e utilizados são os métodos Vickers e Knoop. Ambos os
métodos são bem adequados para a medição de dureza em regiões pequenas e
selecionadas dos corpos de prova, sendo o método Knoop indicado para testar
materiais frágeis (Callister, 2002).
Uma vez que a Odontologia não é uma ciência ímpar, isolada dentro de um
contexto, a utilização destes métodos está presente na constante construção e
evolução do conhecimento odontológico e, conseqüentemente, no desenvolvimento de
novos materiais e aprimoramento dos materiais já existentes e utilizados no dia a dia
do Cirurgião Dentista.
Neste sentido, as resinas compostas têm sido constantemente testadas e
analisadas através de ensaios mecânicos in vitro. Dentre os inúmeros ensaios
mecânicos possíveis de serem realizados, o ensaio de microdureza possui especial
destaque, pois é definido como um teste simples para determinar a resistência do
material após submetê-lo a edentações (Polydorou et al., 2007; Nayif et al., 2007). Para
Mota et al. (2006), a microdureza de um material define sua capacidade de resistir ao
desgaste, principalmente, em regiões de áreas funcionais. Poskus et al. (2004), Correr
et al. (2005) e Tango et al. (2007), também destacam que os testes de dureza são
comumente usados para indicar o grau de conversão nas reações de polimerizações.

10
Para Poskus et al. (2004), existe uma correlação entre os valores de dureza e o
grau de conversão dos monômeros após a polimerização. Sendo assim, diversos
fatores externos podem influenciar no resultado dos testes de microdureza e,
consequentemente, no resultado final da restauração, tais como distância da fonte de
luz (Rode et al., 2007), o tempo de polimerização das resinas, a densidade de energia
(Tango et al., 2007). Fatores internos também podem influenciar os resultados obtidos,
podemos citar como exemplo a composição (Nayif et al., 2007), a cor e a opacidade da
resina (Correr et al., 2005).
No entanto, possíveis fatores relacionados diretamente aos métodos de
microdureza não estão descritos na literatura como sendo passíveis de influenciar nos
resultados obtidos. Nos trabalhos que utilizam ensaios mecânicos de microdureza não
é possível observar padronização nem na carga aplicada sobre as amostras, nem no
tempo que esta carga atua sobre a amostra. Também não há padronização quanto ao
tipo de teste de microdureza (Vickers ou Knoop) a ser empregado. Isto pode ser
observado em alguns trabalhos científicos descritos no quadro 1.
Portanto, o objetivo deste estudo é comparar os resultados obtidos em testes de
microdureza, sobre uma resina composta, quando utilizados diferentes protocolos, e
avaliar a possibilidade de se fazer analogias com base nos resultados obtidos.
Tabela 1: Diversificação das variáveis empregadas em testes de microdureza apresentados em artigos
científicos.
Artigo Força Tempo Ensaio
Hahnel S, Henrich A, Bürgers R, Handel G, Rosentritt M. Investigation of Mechanical Properties of Modern Dental Composites After Artificial Aging for One Year. Oper Dent. 2010; 30(4): 412-419.
500g 60seg Vickers
Komori PCP, Paula AB, Martin AA, Tango RN, Sinhoreti MAC, Correr-Sobrinho L. Effect of Light Energy Density on Conversion Degree and Hardness of Dual-cured Resin Cement. Oper Dent. 2010; 30(5): 120-124.
50g 15seg Knoop
Camargo EJ, Moreschi E, Baseggio W, Cury JA, Pascotto RC. Composite depth of cure using four Polymerization techniques. J Appl Oral Sci. 2009; 17(5):446-50.
25g 5seg Knoop
Fleming GJP, Awan M, Cooper PR, Sloan AJ. The potential of a resin-composite to be cured to a 4mm depth. Sloan. Dental Materials 24 (2008) 522–529.
500g 15seg Vickers

11
Aguiar FH, e Oliveria TR, Lima DA, Ambrosano G, Lovadino JR. Microhardness of different thicknesses of resin composite polymerized by conventional photocuring at different distances. Gen Dent. 2008 Mar-Apr;56 (2):144-8.
25g 10seg Knoop
Hannig C, Duong S, Becker K, Brunner E, Attin T. Effect of bleaching on subsurface micro-hardness of composite and a polyacid modified composite. Dent Mater. 2007; 23: 198–203.
2N - Knoop
David JR, Gomes OM, Gomes JC, Loguercio AD, Reis A. Effect of exposure time on curing efficiency of polymerizing units equipped with light-emitting diodes. Journal of Oral Science, Vol. 49, No.1, 19-24,2007.
50g 30seg Vickers
Aguiar FHB, Braceiro A, Lima DA, Ambrosano GMB, Lovadino JR. Effect of Light Curing Modes and Light Curing Time on the Microhardness of a Hybrid Composite Resin. The Journal of Contemporary Dental Practice, Volume 8, No. 6, September 1, 2007.
25g 10seg Knoop
Polydorou O, Mönting JS, Hellwig E, Auschill TM. Effect of in-office tooth bleaching on the microhardness of six dental esthetic restorative materials. Dental Materials 23 (2007) 153–158.
50g 30seg Knoop
Yazici AR, Kugel G, Gül G. The Knoop Hardness of a Composite Resin Polymerized with Different Curing Lights and Different Modes. The Journal of Contemporary Dental Practice, Volume 8, No. 2, February 1, 2007.
500g 15seg Knoop
Nayif MM, Nakajima M, Aksornmuang J, Ikeda M, Tagami J. Effect of adhesion to cavity walls on the mechanical properties of resin composites. Dent Mater. 2008; 24: 83–89.
50g 15seg Knoop
Tango RN, Sinhoreti MAC, Correr AB, Sobrinho LC, Consani RLX. Effect of Veneering Materials and Curing Methods on Resin Cement Knoop Hardness. Braz Dent J. 2007; 18(3): 235-239.
50g 15seg Knoop
Brandt WC, Moraes RR, Sobrinho LC, Sinhoreti MAC, Consani S. Effect of different photo-activation methods on push out force, hardness and cross-link density of resin composite restorations. Dent Mater. 2008; 24: 846-850.
50g 15seg Knoop
Rode KM, Kawano Y, Turbino ML. Evaluation of Curing Light Distance on Resin Composite Microhardness and Polymerization. Oper Dent. 2007; 32-6: 571-578.
50g 45seg Vickers
Mota EG, Oshima HMS, LHB, Pires LAG, Rosa RS. Evaluation of diametral tensile strength and knoop microhardness of five nanofilled composites in dentin and enamel shades. Stomatologija. 2006; 8:67-9.
100g 15seg Knoop
Correr AB, Sinhoreti MAC, Sobrinho LC, Tango RN, Schneider LFJ, Consani S. Effect of the Increase of Energy Density on Knoop Hardness of Dental Composites Light-Cured by Conventional QTH, LED and Xenon Plasma Arc. Braz Dent J. 2005; 16(3): 218-224.
50g 15seg Knoop
Poskus LT, Placido E, Cardoso PEC. Influence of placement techniques on Vickers and Knoop hardness of class II composite resin restorations. Dent Mater. 2004; 20: 726–732.
100g 15seg Knoop
Neves AD, Discacciati JAC, Oréfice RL, Jansen WC. Correlation between degree of conversion, microhardness and inorganic content in composites. Pesqui Odontol Bras. 2002; 16 (4): 349-354.
200g 15seg Vickers

12
2 Artigo Submetido ao Journal of Applied Oral Science
Analysis of microhardness methodologies applied to composites: is it possible to
compare results using different protocols?
Objective: To evaluate correlation between load and dwell time in composite resin
microhardness tests, using Vickers and Knoop mechanic test methods.
Materials and Methods: Resin Grandio (Voco, Cuxhaven, Germany), shade A2, was used to
make the samples. Ninety (90) samples were made on a six-(6)-mm-diameter by three-(3)-mm-
deep polytetrafluorethylene matrix, where two equidistant increments were each photocured for
20s by the LED device (Celalux, Voco, Cuxhaven, Germany, with 800 mW/cm2). The samples
were randomly divided into three groups according to the load factor. Groups I, II and III
received loads at 50g, 100g and 500g respectively. These groups were divided into nine
subgroups according to the deal time (15s, 30s, 45s). Then, the light exposed surface of each
composite resin sample was divided into two hemispheres. Each sample side received three
indentations, totaling 540 indentations with Shimadzu HMV tester (Shimadzu, Kyoto, Japan).
The Vickers (VHN) and Knoop (KHN) results were submitted to a two-way ANOVA with fixed
factors (load and dwell time), and to the post-hoc Tukey multiple comparison test at α = 0.05.
Results: Significant differences were recorded between groups for each methodology, Vickers
and Knoop (p<0.001). Among the Vickers (VHN) tested samples, the average recorded ranged
from 164.94 (50g for 45s) to 210.33 (100g for 45s). Knoop microhardness (KHN) ranged from
128.92 (500g 45s) to 184.26 (100g 15s). For both methodologies, both load and dwell time were
statistically significant (p<0.001), this way showing that different loads and dwell time influence
the microhardness of resins.
Conclusion: This study demonstrated that correlating both Vickers and Knoop microhardness
test results is not recommended, and similar protocols must be applied to allow comparisons
among the different studies that use the same kind of test.
Key Words: Methods. Hardness. Composite resins.

13
INTRODUCTION
Mechanical tests are commonly used to check-up and improve several classes of dental
materials. One of such commonly used tests on dentistry research is the hardness test.
Hardness can be defined as the resistance of a material to indentation 16. Moreover, hardness is
related to the material strength, its proportional limit and its ability to abrade or to be abraded by
opposing dental structures/materials16.
Development of materials, such as composite resins, filled with smaller particles, has
been increasingly using microhardness testers that use less than 1 Kgf during the indentation.
Historically, Vickers and Knoop microhardness tests have been used by the majority of
investigators for testing hardness of this kind of material 3-5,7,8,10,12-17,19,21,22,24,26. This can be
explained by the fact that such test is a simple and reliable method 14 to show the strength of
materials through their resistance to indentation.
Although microhardness tests are widely used tests, the measured hardness depends
on test load and dwell times 21. However, there is no standardization neither on the load applied
value, nor on the time of load application on the composite sample. Also, correlations between
Vickers and Knoop microhardness tests are commonly carried out, but no work to date has
related that possibility and there may be no correlation in hardness values when different
indenter shapes are compared 24.
Thus, the aim of this in vitro study was to correlate time and load of each kind of
microhardness test (Vickers / Knoop) on a composite resin and then show, with the obtained
results, if comparison between these two different microhardness tests is possible.
MATERIALS AND METHODS
A commercially available nanohybrid composite resin (Grandio, Voco, Cuxhaven,
Germany, Lot 732242), shade A2, was used to prepare 90 samples. These samples were
made using a PTFE (polytetrafluorethylene) 6 mm diameter and 3 mm high double entry mold.
The PTFE mold was placed on a glass plate and the composite resin was inserted in two 2-mm-
thick-maximum increments. To achieve a smooth surface on the last increment, a polyester strip
was used on the increment and pressed by means of a glass plate. Each increment was
photocured using a LED device (Celalux, Voco, Cuxhaven, Germany, with 800 mW/cm2) during
20s. The light source power was checked with a radiometer (Demetron, Kerr, Orange, CA, EUA)
every five exposures.
The samples were stored in a recipient with distilled water for 24h and protected from
light at 37 °C in a culture stove (model 002 CB, Fanem Ltda, São Paulo, SP, Brazil). Afterwards,

14
the samples were randomly divided into three groups according to the load factor. Groups I, II
and III received loads at 50g, 100g and 500g respectively. These groups were divided into nine
subgroups according to the deal time (15s, 30s, 45s) as shown on Table 1.
Then, the light exposed surface of each composite resin sample was divided into two
hemispheres. Each sample side received three indentations, totaling 540 indentations with
Shimadzu HMV tester (Shimadzu, Kyoto, Japan). The Vickers (VHN) and Knoop (KHN) results
were submitted to a two-way ANOVA with fixed factors (load and dwell time), and to the post-
hoc Tukey multiple comparison test at α = 0.05.
RESULTS
Significant differences were recorded between groups for each methodology, Vickers
and Knoop (p<0.001). Among the Vickers (VHN) tested samples, the average recorded ranged
from 164.94 (50g for 45s) to 210.33 (100g for 45s). Knoop microhardness (KHN) ranged from
128.92 (500g 45s) to 184.26 (100g 15s). Multiple comparisons are presented on Tables 2, 3, 4
and on Graphs 1, 2. For both methodologies, both load and dwell time were statistically
significant (p<0.001).
DISCUSSION
The Vickers and Knoop hardness tests have been used for analysis of composite resin
conversion degree in several studies 5,7,9,15,19. These studies advocate that higher obtained
values, through microhardness tests, correspond to higher composite resin conversion degree,
obtained by photo-polymerization 7,19. Recent studies have used different dwell times and
different load values to analyze this conversion. However, a direct analogy cannot be drawn,
because there are significant differences between these methods and between the variables
used 21. Some of these existing variables are a result of internal factors (such as filler, particle
size, polymeric matrix), and of external factors (such as distance from the light power source,
time of composite resin polymerization, energy density, composition, shade and resin composite
opacity) that may influence on the microhardness tests.
Another existing variable is the type of light power source. Different light units result in
conversion value variations 6,7,15,18,19,20,23, what can be explained by the existing characteristics
of each light source, such as light bulb type, number and disposition plus power and heat
produced inside the light source units. In a specific study 7, three different light power sources
(LED, PAC and quartz-tungsten-halogen light) were used on two different composite resins. The

15
hardness obtained from the composites photocured by PAC source was statistically lower when
compared with the composites photocured by LED or by the halogen light. But there is no
difference between these two last light sources, independently from the resin increment
thickness. Regarding dwell time, it was observed that the increase in time exposure increased
Knoop hardeness values in the composite resin when LED or PAC was used. As to the halogen
light, the increase in dwell time did not influence the Knoop hardness values, but these values
decreased as the resin increment thickness increased. Besides this, it was demonstrated that
the composite resin increment size can modify the polymerization degree 4. According to Aguiar,
et al.4. (2007), the polymerization method is a determinant factor and the manufacturer‟s
recommended time for polymerizing a composite resin is not enough for an “ideal
polymerization”.
For these reasons, this study used the same light source (LED), at the same distance,
with the same polymerization time (20s) and same dwell time on all samples. Since 2-mm-thick-
maximum increments were used for each polymerization, the thickness variant of the increment
did not act in this study, this way satisfying the works by David, et al.8. (2007), Aguiar, et al.4.
(2007). Following preparation, the samples were tested for Knoop and Vickers loads with
different dwell times. Significant non-linear differences among them were noted, demonstrating
that different loads and dwell times influence the resin microhardness, according to what
Shahdad et al.21. (2007) have stated, that is, the variation of hardness with load is a well-known
artifact of traditional hardness testing and is often known as the indentation size effect.
In this way, the strong correlation that some studies claim to exist between wear
resistance and hardness, as it is shown at Abe, et al.2. (2001) in their study, in which they found
a strong correlation between wear resistance and Knoop hardness of the materials tested, may
not exist. Other studies have either completely ruled it out or suggested a limited correlation
between the hardness and wear resistance 1,11,25. This correlation between wear resistance and
hardness can only be possible if the same testing protocol is applied, and the obtained results
are compared to different polymerization time.
To Shahdad et al.21. (2007) Vickers and Knoop hardness tests seem to be the preferred
choice of test among majority of the investigators. However, the comparisons could be
inappropriate, because there is a great deal of variability among the tests that have been
performed. And besides, these tests have a specific limitation that is the microscopic
measurements of hardness indentations after the indenter is removed. These measurements
can be affected by some factors, like as, the limitation in resolution of the optical system, the
perception of the operator and the elastic recovery of the material

16
Therefore, for the hardness test analysis to be faithful to both Knoop and Vickers, a
universal rule for future studies is needed, with equal dwell time and load values. This way, the
odds of loyalty of further studies will be greater. Moreover, direct comparisons between the two
different types of mechanical test, cited above, are not viable as show by the majority of the
obtained results where VHN are greater than KHN. Thus, we see that past studies „could not
have made comparisons' among different times and loads, because there are differences
between the tests and, consequently, in their results, making any comparative statement
unworkable.
CONCLUSION
This study demonstrated that correlating both, Vickers and Knoop, microhardness test
results is not recommended, and similar protocols must be applied to allow comparisons among
the different studies that use the same kind of test.
REFERENCES
1- Abe Y, Sato Y, Taji T, Akagawa Y, Lambrechts P, Vanherle G. An in vitro wear study
of posterior denture tooth materials on human enamel. J Oral Rehabil. 2001; 28: 407–
12.
2- Abe Y, Sato Y, Akagawa Y, Ohkawa S. An in vitro study of high-strength resin
posterior denture tooth wear. Int J Prosthodont. 1997; 10: 28–34.
3- Aguirar FH, e Oliveria TR, Lima DA, Ambrosano G, Lovadino JR. Microhardness of
different thicknesses of resin composite polymerized by conventional photocuring at
different distances. Gen Dent. 2008 Mar-Apr; 56 (2):144-8.
4- Aguiar FHB, Braceiro A, Lima DA, Ambrosano GMB, Lovadino JR. Effect of Light
Curing Modes and Light Curing Time on the Microhardness of a Hybrid Composite
Resin. J Contemp Dent Pract. 2007; V.8, No. 6, Sep 1.
5- Brandt WC, Moraes RR, Sobrinho LC, Sinhoreti MAC, Consani S. Effect of different
photo-activation methods on push out force, hardness and cross-link density of resin
composite restorations. Dent Mater. 2008; 24: 846-850.
6- Camargo EJ, Moreschi E, Baseggio W, Cury JA, Pascotto RC. Composite Depth of
Cure Using Four Polymerization Techniques. J Appl Oral Sci. 2009; 17(5): 446-50.

17
7- Correr AB, Sinhoreti MAC, Sobrinho LC, Tango RN, Schneider LFJ, Consani S. Effect
of the Increase of Energy Density on Knoop Hardness of Dental Composites Light-
Cured by Conventional QTH, LED and Xenon Plasma Arc. Braz Dent J. 2005; 16(3):
218-224.
8- David JR, Gomes OM, Gomes JC, Loguercio AD, Reis A. Effect of exposure time on
curing efficiency of polymerizing units equipped with light-emitting diodes. J Oral Sci.
2007; V.49, No.1:19-24.
9- Emami N, Sjödahl M, Söderholm KJM. How filler properties, filler fraction, sample
thickness and light source affect light attenuation in particulate filled resin
composites. Dent Mater. 2005; 21: 721–730.
10- Fleming GJP, Awan M, Cooper PR, Sloan AJ. The potential of a resin-composite to
be cured to a 4mm depth. Dent Mater. 2008; 24: 522–529.
11- Harrison A, Huggett R, Handley RW. A correlation between abrasion resistance and
other properties of some acrylic resins used in dentistry. J Biomed Mater Res. 1979;
13: 23–34.
12- Krishnan VK, Yamuna V. Effect of initiator concentration, exposure time and
particle size of the filler upon mechanical properties of a light-curing radiopaque
dental composite. J Oral Rehabil. 1998; 25: 747–751.
13- Mota EG, Oshima HMS, LHB, Pires LAG, Rosa RS. Evaluation of diametral tensile
strength and knoop microhardness of five nanofilled composites in dentin and
enamel shades. Stomatologija. 2006; 8:67-9.
14- Nayif MM, Nakajima M, Aksornmuang J, Ikeda M, Tagami J. Effect of adhesion to
cavity walls on the mechanical properties of resin composites. Dent Mater. 2008; 24:
83–89.
15- Neves AD, Discacciati JAC, Oréfice RL, Jansen WC. Correlation between degree of
conversion, microhardness and inorganic content in composites. Pesqui Odontol Bras.
2002; 16 (4): 349-354.
16- Polydorou O, Mönting JS, Hellwig E, Auschill TM. Effect of in-office tooth bleaching
on the microhardness of six dental esthetic restorative materials. Dent Mater. 2007; 23:
153–158.
17- Poskus LT, Placido E, Cardoso PEC. Influence of placement techniques on Vickers
and Knoop hardness of class II composite resin restorations. Dent Mater. 2004; 20:
726–732.
18
18- Retamoso LB, Onofre NML, Hann L, Marchioro EM. Effect of light-curing units in
shear bond strength of metallic brackets: an in vitro study. J Appl Oral Sci. 2010;
18(1):68-74.
19- Rode KM, Kawano Y, Turbino ML. Evaluation of Curing Light Distance on Resin
Composite Microhardness and Polymerization. Oper Dent. 2007; 32-6: 571-578.
20- Santos MJMC, Passos SP, Encarnação MOL, Santos Junior GC, Bottino MA.
Hardening of a dual-cure resin cement using QTH and LED curing units. J Appl Oral
Sci. 2010; 18(2):110-5.
21- Shahdad SA, McCabe JF, Bull S, Rusby S, Wassell RW. Hardness measured with
traditional Vickers and Martens hardness methods. Dent Mater. 2007; 23: 1079–1085.
22- Tango RN, Sinhoreti MAC, Correr AB, Sobrinho LC, Consani RLX. Effect of Veneering
Materials and Curing Methods on Resin Cement Knoop Hardness. Braz Dent J. 2007;
18(3): 235-239.
23- Thomé T, Steagall Jr. W, Tachibana A, Braga SRM, Turbino ML. Influence of the
distance of the curing light source and composite shade on hardness of two
composites. J Appl Oral Sci. 2007; 15(6):486-91.
24- Yazici AR, Kugel G, Gül G. The Knoop Hardness of a Composite Resin Polymerized
with Different Curing Lights and Different Modes. J Contemp Dent Pract. 2007; V.8, No.
2, Feb 1.
25- Wassell RW, McCabe JF, Walls AW. Subsurface deformation associated with
hardness measurements of composites. Dent Mater. 1992; 8:218–23.
26- Whitman DJ, McKinney JE, Hinman RW, Hesby RA, Pelleu Jr GB. In vitro wear rates
of three types of commercial denture tooth materials. J Prosthet Dent. 1987; 57:243–6.

19
Table 1: The random division has created 9 groups.
Table 2: Means comparison for all groups.
50g 100g 500g
VHN KHN VHN KHN VHN KHN
15s 179.32
168.13
202.04
184.25
181,58
140.77
30s 185.74
149.87
197.20
179.13
193.76
139.40
45s 164.94
180.33
210.33
148.09
186.56
128.92
n =90
LOAD
DWELL TIME
LOAD I
(50 g)
LOAD II
(100 g)
DWELL TIME I
(15 s)
n = 10
Knoop / Vickers
n = 10
Knoop / Vickers
DWELL TIME II
(30 s)
n = 10
Knoop / Vickers
n = 10
Knoop / Vickers
DWELL TIME III
(45 s)
n = 10
Knoop / Vickers
n = 10
Knoop / Vickers
LOAD III
(500 g)
n = 10
Knoop / Vickers
n = 10
Knoop / Vickers
n = 10
Knoop / Vickers

20
Table 3: Means for Vickers groups in homogeneous subsets are displayed.
Tukey HSDa
GROUP N Subset for alpha = .05
1 2 3
45s50g 30 164,9467
15s50g 30 179,3233 179,3233
15s500g 30 181,5867 181,5867
30s50g 30 185,7433 185,7433 185,7433
45s500g 30 186,5667 186,5667 186,5667
30s500g 30 193,7667 193,7667
30s100g 30 197,2000 197,2000
15s100g 30 202,0467 202,0467
45s100g 30 210,3333
Sig. ,282 ,220 ,136
Table 4: Means for Knoop groups in homogeneous subsets are displayed.
Tukey HSDa
GROUP N Subset for alpha = .05
1 2 3
45s500g 30 128,9200
30s500g 30 139,4067
15s500g 30 140,7767 140,7767
45s100g 30 148,0900 148,0900
30s50g 30 149,8700 149,8700
15s50g 30 168,1333 168,1333
30s100g 30 179,1333
45s50g 30 180,3333
15s100g 30 184,2667
Sig. ,350 ,070 ,708

21
Graph 1: Means and outliers in Vickers Microhardness results.
Graph 2: Means and outliers in Knoop Microhardness results.
.

22
3 Artigo Submetido à Operative Dentistry
Analysis of Knoop microhardness test: is it possible to make an analogy between
conversion degree and the obtained results using different protocols?
Objective: To correlate time and load on Knoop microhardness test over a composite resin and
to show, with the obtained results, whether composite resin conversion degree comparison is
possible through the tests.
Materials and Methods: Resin Grandio (Voco, Cuxhaven, Germany), shade A2, was used to
make the samples. Ninety (90) samples were made on a six-(6)-mm-diameter by three-(3)-mm-
deep polytetrafluorethylene matrix, where two equidistant increments were each photocured for
20s by the LED device (Celalux, Voco, Cuxhaven, Germany, with 800 mW/cm2). The samples
were randomly divided into three groups according to the load factor. Groups I, II and III
received loads at 50g, 100g and 500g respectively. These groups were divided into nine
subgroups according to the deal time (15s, 30s, 45s). Each sample received three indentations,
totaling 270 indentations with Shimadzu HMV tester (Shimadzu, Kyoto, Japan). The Knoop
(KHN) results were submitted to a two-way ANOVA with fixed factors (load and dwell time), and
to the post-hoc Tukey multiple comparison test at α = 0.05.
Results: Significant differences were recorded between groups. Among the Knoop
microhardness (KHN) tested samples, the average recorded ranged from 128.92 (500g 45s) to
184.26 (100g 15s). For this methodology, both load and dwell time were statistically significant
(p<0.001), this way showing that different loads and dwell time influence the microhardness of
resins.
Conclusion: This study demonstrated that Knoop microhardness test results is not
recommended for composite resin conversion degree comparisons, and similar protocols should
be applied to allow this kind of correlation.
Running (short) title: Analysis of Knoop microhardness test

23
INTRODUCTION
Composite resins are widely used in restorative dentistry. Patients‟ constant demands
for esthetic associated with the enhancement of mechanical properties have brought important
improvements to composite resins, and as a result, this restorative material has been given
universal applicability. On the posterior restorations, for example, the material is constantly
under masticatory stresses. So, composite resins with good mechanical properties should be
selected for that purpose.1
Thus, in order to check up the mechanical properties of this class of restorative materials,
mechanic tests have been commonly used, being the so-called hardness tests one of them.
Such test is a simple and reliable method to reflect the strength of a given material through its
resistance to indentation. Several studies have used the Knoop microhardness test for analysis
of the composite resin conversion degree.2,3,4,5,6 These studies advocate that higher obtained
values, through microhardness tests, correspond to higher composite resin conversion degree,
obtained by photo-polymerization. 3,6
However, although correlations between Knoop microhardness tests are commonly
performed to compare the composite resin conversion degree, there has not been any work to
date that has reported such possibility. Also, the measured hardness depends on load and dwell
times test, 7 but there is no standardization neither on the load applied value, nor on the time of
load application over the composite resin sample in the published studies.
Therefore, the aim of this in vitro study was to correlate time and load on Knoop
microhardness test over a composite resin and to show whether an analogy between the
composite resin conversion degree and the obtained results is possible.
MATERIALS AND METHODS
A commercially available nanohybrid composite resin (Grandio, Voco, Cuxhaven,
Germany, Lot 732242), shade A2, was used to prepare 90 samples. These samples were
made using a PTFE (polytetrafluorethylene) 6 mm diameter and 3 mm high double entry mold.
The PTFE mold was placed on a glass plate and the composite resin was inserted in two 2-mm-
thick-maximum increments. To achieve a smooth surface on the last increment, a polyester strip
was used on the increment and pressed by means of a glass plate. Each increment was
photocured using a LED device (Celalux, Voco, Cuxhaven, Germany, with 800 mW/cm2) during
20s. The light source power was checked with a radiometer (Demetron, Kerr, Orange, CA, EUA)
every five exposures.

24
The samples were stored in a recipient with distilled water for 24h and protected from
light at 37 °C in a culture stove (model 002 CB, Fanem Ltda, São Paulo, SP, Brazil). Afterwards,
samples were randomly divided into 9 groups according to load (50, 100 or 500g) and dwell
time (15, 30 or 45s) as shown on Table 1.
Each light exposed surface sample side received three indentations, totaling 270
indentations with Shimadzu HMV tester (Shimadzu, Kyoto, Japan). The Knoop (KHN) results
were submitted to a two-way ANOVA with fixed factors (load and dwell time), and to the post-
hoc Tukey multiple comparison test at α = 0.05.
RESULTS
Significant differences were recorded between groups. Among the Knoop microhardness
(KHN) tested samples, the average recorded ranged from 128.92 (500g 45s) to 184.26 (100g
15s). For this methodology, both load and dwell time were statistically significant (p<0.001), this
way showing that different loads and dwell time influence the microhardness of resins. Multiple
comparisons are presented on Tables 1 and 2.
DISCUSSION
The Knoop microhardness test has been shown as one of the best methods for testing
the hardness of composite resins 8 , and hardness has been shown to be an indirect measure of
the degree of conversion.9 Over the last few years, several studies related to the degree of
conversion and mechanical properties of composite resins have been developed.1 These
studies advocate that the radiant exposure generated by the light source can influence the
degree of conversion of composite resins and thereby influence their mechanical properties.1
So, higher obtained values through microhardness tests correspond to higher composite resin
conversion degree, obtained by photo-polymerization. 3,6
Recent studies have used different dwell times and different load values to analyze this
conversion on several composite resin brands. However, a direct analogy cannot be drawn,
because there are significant differences between these methods and between the variables
used.7 Besides, since the microhardness value is greatly influenced by some variables, a cross-
comparison between the different brands is limited.10 Some of these existing variables are a
result of internal factors (such as filler, particle size, polymeric matrix), and of external factors
(such as distance from the light power source, time of composite resin polymerization, energy

25
density, composition, shade and resin composite opacity) that may influence on the
microhardness tests.
Another existing variable is the type of light power source. Different light units result in
conversion value variations 3,5,6,11,12,13,14, what can be explained by the existing characteristics of
each light source, such as light bulb type, number and disposition plus power and heat
produced inside the light source units. The polymerization method is a determinant factor, but
the manufacturer‟s recommended time for polymerizing a composite resin is not enough for an
“ideal polymerization”. 15 Besides this, it was demonstrated that the composite resin increment
size can modify the polymerization degree. 15
For these reasons, this study used the same light source (LED), at the same distance,
with the same polymerization time (20s) and same dwell time on all samples. Since 2-mm-thick-
maximum increments were used for each polymerization, the thickness variant of the increment
did not act in this study. Following preparation, the samples were tested for Knoop loads with
different dwell times. Significant non-linear differences among them were noted, demonstrating
that different loads and dwell times influence the resin microhardness. The variation of hardness
with load is a well-known artifact of traditional hardness testing and is often known as the
indentation size effect. 7
In this way, the strong correlation that some studies claim to exist between conversion
degree and hardness may not exist. Other studies have either completely ruled it out or
suggested a limited correlation between the hardness and wear resistance 16,17,18. This
correlation between wear resistance and hardness can only be possible if the same testing
protocol is applied, and the obtained results are compared to different polymerization time.
Although Knoop hardness tests seem to be the preferred choice of test among the
majority of the investigators, the comparisons could be inappropriate, because the hardness
values were often greater at the center of the specimens.8 And besides, these tests have a
specific limitation that is the microscopic measurements of hardness indentations after the
indenter is removed. These measurements can be affected by some factors such as the
limitation in resolution of the optical system, the perception of the operator and the elastic
recovery of the material.
Therefore, for the Knoop microhardness test analysis to be faithful, a universal rule for
future studies is needed, with equal dwell time and load values. This way, the odds of loyalty of
further studies will be greater. Moreover, direct comparisons between hardness and composite
resin conversion degree, are not viable. Thus, we see that past studies „could not have made
analogies between conversion degree and Knoop microhardness tests' among different times

26
and loads, because there are differences between the tests and, consequently, in their results,
making any comparative statement unworkable.
CONCLUSION
This study demonstrated that Knoop microhardness test results are not recommended to
composite resin conversion degree comparisons, and similar protocols should be applied to
allow this kind of correlation.
REFERENCES
1. Silva EM, Poskus LT & Guimarães JGA (2008) Influence of Light-polymerization Modes on the Degree of Conversion and Mechanical Properties of Resin Composites: A Comparative Analysis Between a Hybrid and a Nanofilled Composite Operative Dentistry, 33 (3) 287-293.
2. Brandt WC, Moraes RR, Sobrinho LC, Sinhoreti MAC & Consani S (2008) Effect of different photo-activation methods on push out force, hardness and cross-link density of resin composite restorations Dental Materials 24 846-850.
3. Correr AB, Sinhoreti MAC, Sobrinho LC, Tango RN & Schneider LFJ, Consani S (2005) Effect of the Increase of Energy Density on Knoop Hardness of Dental Composites Light-Cured by Conventional QTH, LED and Xenon Plasma Arc Brazilian Dental Journal 16 (3) 218-224.
4. Emami N, Sjödahl M & Söderholm KJM (2005) How filler properties, filler fraction, sample thickness and light source affect light attenuation in particulate filled resin composites Dental Materials 21 721–730.
5. Neves AD, Discacciati JAC, Oréfice RL & Jansen WC (2002) Correlation between degree of conversion, microhardness and inorganic content in composites Pesquisa Odontológica Brasileira 16 (4) 349-354.
6. Rode KM, Kawano Y & Turbino ML (2007) Evaluation of Curing Light Distance on Resin Composite Microhardness and Polymerization Operative Dentistry 32 (6) 571-578.
7. Shahdad SA, McCabe JF, Bull S, Rusby S & Wassell RW (2007) Hardness measured with traditional Vickers and Martens hardness methods Dental Materials 23 1079–1085.
8. Price RBT, Fahey J & Felix CM (2010) Knoop Microhardness Mapping Used to Compare the Efficacy of LED, QTH and PAC Curing Lights Operative Dentistry 35 (1)
58-68.
9. Pollington S, Kahakachchi N & van Noort R (2009) The Influence of Plastic Light
Cure Sheaths on the Hardness of Resin Composite Operative Dentistry 34 (6) 741-
745.

27
10. Yan YL, Kim YK, Kim K-H & Kwon T-Y (2010) Changes in Degree of Conversion and
Microhardness of Dental Resin Cements Operative Dentistry 35 (2) 203-210.
11. Camargo EJ, Moreschi E, Baseggio W, Cury JA & Pascotto RC (2009) Composite Depth of Cure Using Four Polymerization Techniques. Journal of Applied Oral Science 17(5) 446-450.
12. Retamoso LB, Onofre NML, Hann L & Marchioro EM (2010) Effect of light-curing units in shear bond strength of metallic brackets: an in vitro study Journal of Applied Oral Science 18 (1) 68-74.
13. Santos MJMC, Passos SP, Encarnação MOL, Santos Junior GC & Bottino MA (2010) Hardening of a dual-cure resin cement using QTH and LED curing units Journal Applied Oral Science 18 (2) 110-115.
14. Thomé T, Steagall Jr. W, Tachibana A, Braga SRM & Turbino ML (2007) Influence of the distance of the curing light source and composite shade on hardness of two composites Journal of Applied Oral Science 15 (6) 486-491.
15. Aguiar FHB, Braceiro A, Lima DA, Ambrosano GMB & Lovadino JR (2007) Effect of Light Curing Modes and Light Curing Time on the Microhardness of a Hybrid Composite Resin Journal of Contemporary Dental Practice 8 (6) September 1.
16. Abe Y, Sato Y, Akagawa Y & Ohkawa S (1997) An in vitro study of high-strength resin posterior denture tooth wear International Journal of Prosthodontics 10 28–34.
17. Harrison A, Huggett R & Handley RW (1979) A correlation between abrasion resistance and other properties of some acrylic resins used in dentistry Journal of Biomedical Materials Research 13 23–34.
18. Whitman DJ, McKinney JE, Hinman RW, Hesby RA & Pelleu Jr GB (1987) In vitro wear rates of three types of commercial denture tooth materials Journal of Prosthetic Dentistry 57 243–246.

28
Table 1: Means comparison for all groups.
50g 100g 500g
KHN
168.13
149.87
180.33
KHN
184.25
179.13
148.09
KHN
140.77
139.40
128.92
15s
30s
45s
Table 2: Means for Knoop groups in homogeneous subsets are displayed.
Tukey HSDa
GROUP N Subset for alpha = .05
1 2 3
45s500g 30 128,9200
30s500g 30 139,4067
15s500g 30 140,7767 140,7767
45s100g 30 148,0900 148,0900
30s50g 30 149,8700 149,8700
15s50g 30 168,1333 168,1333
30s100g 30 179,1333
45s50g 30 180,3333
15s100g 30 184,2667
Sig. ,350 ,070 ,708

29
4 Discussão Geral
Os métodos de ensaio mecânico Vickers e Knoop têm sido utilizados para
avaliar as propriedades mecânicas dos materiais em diversos estudos. Na odontologia
a utilização destes testes é muito comum, sendo a resina composta um dos materiais
de uso odontológico que, frequentemente, recebe este tipo de análise. Uma
propriedade mecânica constantemente avaliada neste material é o grau de conversão
obtido com a fotoativação. Quanto maior for o tempo de fotoativação maior será o grau
de conversão alcançado. Desta forma, através dos resultados obtidos, é feita uma
analogia que cria uma relação direta entre o valor encontrado e o grau de conversão da
resina composta. Assim sendo, quanto maior forem os valores obtidos através dos
testes de microdureza, maior será, portanto, o grau de conversão alcançado com a
fotoativação das resinas compostas. Estudos recentes utilizaram diferentes tempos de
aplicação e diferentes valores de carga para avaliar esta conversão, como pode ser
verificado através dos trabalhos citados nos artigos apresentados e, também, através
da Tabela 1, presente na apresentação deste trabalho. Porém, existem diferenças
significativas entre estes estudos e entre as variáveis utilizadas que impossibilitam uma
analogia direta dos seus resultados. Um exemplo destas diferenças e/ou variáveis
existentes é a presença de fatores internos presentes em uma resina composta, tais
como, o tipo de carga, o tamanho da partícula e a matriz polimérica, que podem
influenciar os resultados alcançados. Segundo Yan et al. (2010), o valor de
microdureza é fortemente influenciado por fatores, tais como a carga das partículas que
compõe o compósito e, por este motivo, comparações entre diferentes marcas
comerciais são limitadas. Conforme Hahnel et al. (2010), existe um número
considerável de materiais compósitos no que tange o tipo de partícula empregada.
Todavia, diferenças entre estes materiais referentes ao tipo do sistema monomérico, ao
tipo de composição das partículas e ao tipo de união química das partículas matriciais
podem contabilizar performances mecânicas diferentes e podem ocasionar diferenças
na resistência dos materiais à degradação química e mecânica.

30
Existem, também, fatores externos, tais como a distância da fonte de luz, o
tempo de polimerização das resinas, a densidade de energia, a composição, a cor e
opacidade da resina que também podem influenciar nos testes de microdureza.
Para Fróes-Salgado et al. (2009), quando a distância entre o compósito e a fonte
de luz aumenta uma severa atenuação da luz é observada. Segundo Neves et al.
(2002) as diferentes unidades de luz resultam em variações nos valores de conversão,
por apresentarem diferenças em suas características, como tipo, número e disposicão
das lâmpadas, potência e calor gerado no interior dos aparelhos. Aguiar et al. (2007)
relataram que o método de polimerização é um fator determinante e que o tempo
recomendado pelo fabricante dos compósitos resinosos são insuficientes para uma
“ideal polimerização”. Para Correr et al. (2005) que analisaram diferentes fontes de luz
(LED, PAC, e Luz Halógena) em duas resinas diferentes, a dureza dos compósitos
fotoativados por PAC foi estatisticamente inferior em relação aos compósitos
fotoativados com luz halógena ou LED, que por sua vez, não se diferenciaram entre si,
independente da profundidade. Já em relação ao tempo de exposição, constatou-se
que o aumento do tempo produziu compósitos com maiores valores de dureza Knoop
quando se utilizou LED ou PAC. Para Luz Halógena o aumento de tempo de exposição
não influenciou os valores de dureza e que os valores de dureza Knoop diminuíram
com o aumento da profundidade. Além disto, Aguiar et al. (2007) constataram que o
tamanho do incremento de resina também pode modificar o grau de polimerização, o
que vai ao encontro do que é afirmado por Camargo et al. (2009) e por Pollington et al.
(2009), que preconizam que o incremento de resina possua no máximo 2mm de
espessura.
Por essas razões o presente estudo utilizou a mesma fonte de luz (LED), com a
mesma distância, com o mesmo tempo de polimerização (20s) e com o mesmo tempo
de aplicação de carga sobre todas as amostras. Assim como, foram realizados
incrementos com no máximo 2mm para cada fotoativação, para que esta variante não
atuasse neste trabalho, indo, desta forma, ao encontro dos trabalhos de Correr et al.
(2005), David et al. (2007), Aguiar et al. (2007). Após a confecção das amostras, estas
foram submetidas aos testes Knoop e Vickers com diferentes tempos e cargas
constatando-se diferenças significativas e não lineares entre os resultados obtidos,
31
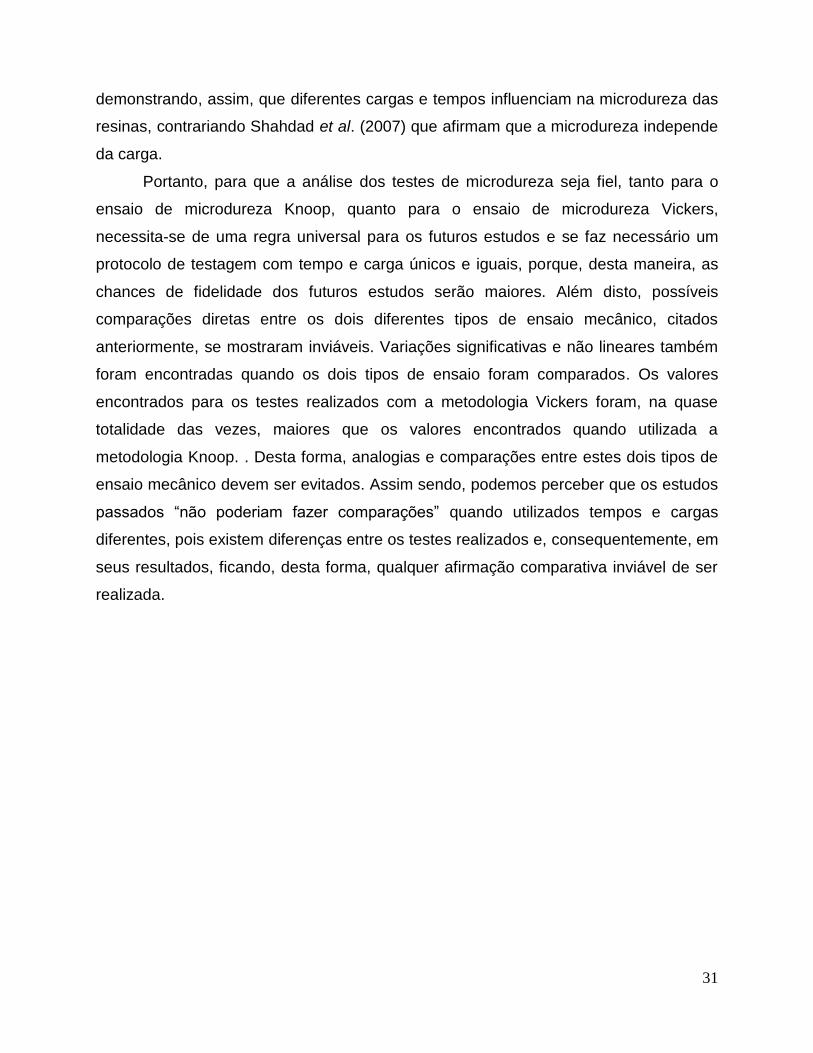
demonstrando, assim, que diferentes cargas e tempos influenciam na microdureza das
resinas, contrariando Shahdad et al. (2007) que afirmam que a microdureza independe
da carga.
Portanto, para que a análise dos testes de microdureza seja fiel, tanto para o
ensaio de microdureza Knoop, quanto para o ensaio de microdureza Vickers,
necessita-se de uma regra universal para os futuros estudos e se faz necessário um
protocolo de testagem com tempo e carga únicos e iguais, porque, desta maneira, as
chances de fidelidade dos futuros estudos serão maiores. Além disto, possíveis
comparações diretas entre os dois diferentes tipos de ensaio mecânico, citados
anteriormente, se mostraram inviáveis. Variações significativas e não lineares também
foram encontradas quando os dois tipos de ensaio foram comparados. Os valores
encontrados para os testes realizados com a metodologia Vickers foram, na quase
totalidade das vezes, maiores que os valores encontrados quando utilizada a
metodologia Knoop. . Desta forma, analogias e comparações entre estes dois tipos de
ensaio mecânico devem ser evitados. Assim sendo, podemos perceber que os estudos
passados “não poderiam fazer comparações” quando utilizados tempos e cargas
diferentes, pois existem diferenças entre os testes realizados e, consequentemente, em
seus resultados, ficando, desta forma, qualquer afirmação comparativa inviável de ser
realizada.

32
5 Referências Bibliográficas Adicionais
1-BLANDO, Eduardo. Estudo de técnicas de indentação dinâmica para avaliação de materiais na região de nano e microdureza. 2001, 172 f. Dissertação (Mestrado em Engenharia) - Faculdade de Engenharia, Pontifícia Universidade Católica do Rio Grande do Sul, Porto Alegre , 2001.
2-CALLISTER, William D. Ciência e engenharia de materiais: uma introdução. 5. ed. Rio de Janeiro : LTC, c2002. 589 p.
3-CAMARGO EJ, MORESCHI E, BASEGGIO W, CURY JA, PASCOTTO RC. Composite depth of cure using four Polymerization techniques. Journal of Applied Oral Science. 2009; 17(5):446-50.
4-FRÓES-SALGADO NRG, PFEIFER CSC, FRANCCI CE, KAWANO Y. Influence of Photoactivation Protocol and Light Guide Distance on Conversion and Microleakage of Composite Restorations. Operative Dentistry. 2009; 34(4): 408-414.
5-GARCIA, Amauri. Ensaios dos materiais. Rio de Janeiro : LTC, c2000. 247 p.
6-HAHNEL S, HENRICH A, BÜRGERS R, HANDEL G, ROSENTRITT M. Investigation of Mechanical Properties of Modern Dental Composites After Artificial Aging for One Year. Operative Dentistry. 2010; 35(4): 412-419.
7-HANNIG C, DUONG S, BECKER K, BRUNNER E, ATTIN T. Effect of bleaching on subsurface micro-hardness of composite and a polyacid modified composite. Dental Materials. 2007; 23: 198–203.
8-KOMORI PCP, PAULA AB, MARTIN AA, TANGO RN, SINHORETI MAC, CORRER-SOBRINHO L. Effect of Light Energy Density on Conversion Degree and Hardness of Dual-cured Resin Cement. Operative Dentistry. 2010; 30(5): 120-124.

33
ANEXO 1 – Carta de aprovação da Comissão Científica e de Ética da Faculdade de Odontologia da PUCRS

34
ANEXO 2 – E-mail de confirmação de submissão de trabalho ao Journal of Applied Oral Science
[JAOS] JAOS-1901 Submission Acknowledgement Quinta-feira, 16 de Setembro de 2010 13:48 De: "Carlos F. Santos" <[email protected]> Adicionar remetente à lista de contatos Para: "Gustavo Frainer Barbosa" <[email protected]>
Dear Dr. Gustavo Frainer Barbosa,
Thank you for submitting the manuscript, "JAOS-1901 - Analysis of
microhardness methodologies applied to composites: is it possible to
compare results using different protocols?" to Journal of Applied Oral
Science. With the online journal management system that we are using, you
will be able to track its progress through the editorial process by
logging
in to the journal web site:
Manuscript URL:
http://submission.scielo.br/index.php/jaos/author/submission/40525
Username: gfraibar
If you have any questions, please contact me. Thank you for considering
this journal as a venue for your work.
Yours sincerely,
_____________________________________________________
Carlos F. Santos, DDS, MSc, PhD, Associate Professor
Editor-in-Chief
Journal of Applied Oral Science
http://www.scielo.br/jaos

35
ANEXO 3 – E-mail de confirmação de submissão de trabalho a Operative Dentistry
6 10-319-L Manuscript received - Operative Dentistry
Terça-feira, 26 de Outubro de 2010 13:59
De:
"[email protected]" <[email protected]>
Adicionar remetente à lista de contatos
Para:
Cc:
[email protected], [email protected], [email protected],
[email protected], [email protected]
Dear Mr. Barbosa,
On October 26, 2010, I received your manuscript entitled "Analysis of Knoop microhardness test: is it
possible to make an analogy between conversion degree and the obtained results using different
protocols?" by Gustavo Barbosa, Hugo Oshima, Eduardo Gonçalves, Ana Maria Spohr, Luciana Hirakata,
and Marcel Farret.
Your manuscript has been assigned the Paper #: 10-319-L.
You may check on the status of this manuscript by visiting your author home page
at http://jopdent.allentrack.net.
Thank you for submitting your work to Operative Dentistry.
Sincerely,
Kevin Matis
Editorial Assistant
Operative Dentistry