pcr vs pra
TRANSCRIPT
8/16/2019 PCR vs PRA
http://slidepdf.com/reader/full/pcr-vs-pra 1/25
A c c e p t e d A r t i c l e
A c c e p t e d A r t i c l e
This article has been accepted for publication and undergone full peer review but has notbeen through the copyediting, typesetting, pagination and proofreading process, which maylead to differences between this version and the Version of Record. Please cite this article asdoi: 10.1111/jcpe.12350This article is protected by copyright. All rights reserved.
Article Type: Supplement Article
Risk Factor Assessment Tools for the Prevention of
Periodontitis ProgressionA Systematic Review
Niklaus P. Lang, Jean E. Suvan & Maurizio S. Tonetti
Universities of Berne and Zurich, Switzerland, University College London EastmanDental Institute, UK & European Resarch Group on Periodontology (ERGOPerio),Genova, Italy.
Running Head: Risk assessment tools in Periodontology Key words : Risk factor assessment, validity, periodontal disease progression,
attachment levels, tooth loss
Corresponding author:
Prof. Dr. Niklaus P. Lang Scheuermattweg 33 CH-3043 Uettligen, Switzerland
Phone: +41 79 301 5505
AbstractObjectives: i) to identify characteristics of currently published patient-based tools
used to assess levels of risk for periodontitis progression; and ii) systematically
review the evidence documenting the use of patient-based risk assessment tools forpredicting periodontitis progression.
Material and methods: A systematic review was prepared on the basis of an
electronic search of the literature supplemented with manually searching the relevant
8/16/2019 PCR vs PRA
http://slidepdf.com/reader/full/pcr-vs-pra 2/25
A c c e p t e d A r t i c l e
A c c e p t e d A r t i c l e
This article is protected by copyright. All rights reserved.
journals of the latest 5 years. Prospective and retrospective cohort studies were
included as no randomized controlled clinical trials were available.
Results: The search identified 336 titles and 19 articles were included in this
systematic review. The search identified 5 different risk assessment tools. Results of
9 of 10 cohort studies reporting outcomes of 2110 patients indicate that riskassessment tools are able to identify subjects with different probability of
periodontitis progression and/or tooth loss. Subjects with higher risk scores showed
more progression of periodontitis and tooth loss.
Conclusions: In treated populations, results of patient based risk assessments e.g.
Periodontal Risk Calculator (PRC) and Periodontal Risk Assessment (PRA)
predicted periodontitis progression and tooth loss in various populations. Additional
research on the utility of risk assessment results in improving patient management
are needed.
Clinical Relevance
Scientific rationale: It would be clinically beneficial to stratify subjects into risk
categories using tools accounting for the multifactorial nature of the disease as this
may help in improving case prognosis and management after completion of active
periodontal therapy.
Principal Findings: Results from this systematic review indicate that risk assessment
tools such as the Periodontal Risk Calculator or the Periodontal Risk Assessment
are predictors of periodontitis progression and tooth loss in treated populations.
Clinical Implications: Even in the absence of direct evidence of the clinical utility of
risk assessment in patient management, clinicians may consider application of these
principles to clinical practice.
Conflict of interest and source of funding statementThe authors declare no conflict of interest. This systematic review has been
supported by the Clinical Research Foundation (CRF) for the Promotion of Oral
8/16/2019 PCR vs PRA
http://slidepdf.com/reader/full/pcr-vs-pra 3/25
A c c e p t e d A r t i c l e
A c c e p t e d A r t i c l e
This article is protected by copyright. All rights reserved.
Health, Brienz, Switzerland and by the European Research Group on Periodontology
(ERGOPerio), Genova, Italy. Although two of the authors (NPL, MST) had over the
years developed a Periodontal Risk Assessment (PRA) for the progression of
periodontitis after active therapy (Lang & Tonetti 2003), the authors declare no
conflict of interest. The PRA is available for anybody at no cost (www.perio-tools.com/PRA). No financial compensation was ever provided to the authors. The
owner of the website is the Clinical Research Foundation (CRF) for the Promotion of
Oral Health, Brienz, Switzerland.
IntroductionThe host response to etiologic agents and routine periodontal treatment outcomes
vary among periodontitis patients; it is therefore clinically important to determine therelative risk for disease progression in a once treated patient. For the last several
decades, efforts have been made to evaluate the utility of various predictors for
periodontal disease progression. Unaided risk assessment and prognostication,
however, have shown significant variability because chronic periodontitis is a
multifactorial disease.
In that respect, single parameters have been assessed for their positive or negative
predictive values to indicate periodontal disease progression or stability. Initially,these efforts were hampered by the lack of consensus on a clear definition of
disease progression. Generally, the loss of periodontal attachment of ≥ 2mm was
used as an indication of progressive disease (Claffey et al. 1990;Lang et al.
1986;Tonetti & Claffey 2005). Occasionally, ≥ 3mm was chosen as a threshold
(Socransky et al. 1984). It is evident that with such thresholds minimal true loss of
attachment of <2mm were not detected as such. Consequently, an evaluation of
parameters usually underestimated predictive values in a given time.
As it was recognized that the extent and severity of previous disease is helpful in
identifying individuals at risk of further disease progression (Haffajee & Oliver 1990)
efforts focused on tooth and site based predictions. While originally single
parameters such as bleeding on probing (BOP) (Lang et al. 1986), suppuration and
probing pocket depth (PPD) (Claffey et al. 1990) were evaluated for their ability to

8/16/2019 PCR vs PRA
http://slidepdf.com/reader/full/pcr-vs-pra 4/25
A c c e p t e d A r t i c l e
A c c e p t e d A r t i c l e
This article is protected by copyright. All rights reserved.
predict disease progression, it was soon realized that the positive predictive values
of these parameters were at best approximately 30%. Hence, the search for
additional parameters and combinations of parameters was necessary.
Lang and Tonetti (1996) suggested the need for a continuous multilevel riskassessment at the patient, tooth and tooth site level to improve predictive values.
While tooth and site based risk assessment using the severity of the lesion (pocket
depth, attachment loss, remaining bone support, furcation involvement) and
inflammation (BOP) had been clinically utilized, the challenge was the incorporation
of subject-based factors.
The systematic assessment of known risk factors discussed at the World Workshop
on Periodontics (Papapanou 1996; Tonetti 1998) highlighted that known risk factors
for periodontitis could be clustered in 7 groups: aetiology, genetic predisposition,
medical conditions, lifestyle, psychological profile, access to care and background
factors. Each of these groups of factors may confer increased susceptibility to
disease onset and progression. In his paper, in the first attempt to account for the
multidimensional nature of patient-based risk, Tonetti (1998) proposed the use of a
target diagram to communicate and manage the multidimensional risk of
periodontitis progression.
Clinical implication of the principles, however, required the development and
validation of tools to measure and communicate risk in its multiple dimensions. The
significance of single subject attributes or exposure to outcomes of periodontal
supportive care has been recently systematically reviewed (Chambrone et al. 2010).
In that systematic review, different patient-related factors (i.e. age and smoking) and
tooth-related factors (tooth type and location, and the initial tooth prognosis) were
associated with tooth loss during supportive periodontal care. No systematic review
is available to understand the predictive value of multiple factors for periodontitis
progression and tooth loss in treated populations.
The specific aims of this review were to: i) identify the characteristics of currently
published patient-based tools or systems used to assess levels of risk for
periodontitis progression; and ii) systematically review the evidence documenting the
8/16/2019 PCR vs PRA
http://slidepdf.com/reader/full/pcr-vs-pra 5/25
A c c e p t e d A r t i c l e
A c c e p t e d A r t i c l e
This article is protected by copyright. All rights reserved.
use of patient-based risk assessment tools for predicting periodontitis progression.
For the second aim, the focused question was: “Are results from current patient-
based risk assessment tools predictive of periodontitis progression in adults treated
for this disease?”
Materials & methodsScope
The focus of this review was to provide a comprehensive summary of the evidence
of existing tools or methods proposed to assess patient level risk for the progression
of periodontitis. Hence, inclusion criteria were set to be broad and inclusive. Study
designs eligible for inclusion were randomized controlled clinical trials and cohort
studies for answering the focused question of prediction. Cross-sectional studieswere included in the summary of currently reported risk assessment tools. Risk
assessment tools for peri-implant disease initiation or progression were not within
the scope of this review.
Any published risk assessment tool was considered. For this review, a risk
assessment tool was defined to include any composite measure of patient level risk
directed towards determining the probability for further disease progression in adults
with periodontitis. Periodontitis was defined to include both chronic and aggressiveforms in adult populations. Periodontitis progression outcomes included changes in
attachment levels and/or deepening of periodontal pockets in millimetres in study
populations undergoing supportive periodontal therapy (SPT) (Tonetti & Claffey
2005).
Search and Screening
The electronic search strategy included the search of electronic databases to July
2014 using terms and strategy set a priori according to each database (Cochrane
Library, Ovid MEDLINE, EMBASE and LILACS). No language or year restrictions
were applied. Hand searching comprised of checking bibliographic references of
included articles and related review articles. In addition, on-line hand searching of
recent issues of key periodontal journals from the previous 5 years was performed
(Journal of Clinical Periodontology, Journal of Dental Research, Journal of
8/16/2019 PCR vs PRA
http://slidepdf.com/reader/full/pcr-vs-pra 6/25
A c c e p t e d A r t i c l e
A c c e p t e d A r t i c l e
This article is protected by copyright. All rights reserved.
Periodontal Research, Journal of Periodontology, Oral Health and Preventive
Dentistry).
The electronic search strategy framework was developed based on risk assessment
tools and periodontitis search terms and then tested to confirm its suitability to thefocus of the review. It was customised as appropriate before application to each
database. Table S1 provides an example of the basic search strategy.
Titles and abstracts (when available) of all reports identified through the search were
scanned by two reviewers independently (JES and NPL). Full reports were obtained
and reviewed independently for studies appearing to meet the inclusion criteria or for
which there was insufficient information in the title and abstract to allow a clear
decision (JES and NPL).
Bias Protection Assessment
Bias protection assessment of included studies was undertaken independently and
in duplicate by two reviewers. Studies were assessed using the validated
Newcastle-Ottawa Quality Assessment Scale as recommended by the Cochrane
Collaboration Guidelines for the assessment of non-randomised studies (Wells et al.
2009). These tools award stars (*) in three categories for each study based on
incorporation of design elements associated with minimising bias. Due to a lack of
validated tools to assess the risk of bias of cross sectional studies, cross-sectional
studies were not evaluated.
Data Abstraction
Data were abstracted from full text articles directly into electronically generated
evidence table templates. Data abstraction was performed on all included studies
independently and in collaboration (JES and NPL). Completed evidence tables were
rechecked to validate accuracy of the data abstraction (JES, NPL, MT).
8/16/2019 PCR vs PRA
http://slidepdf.com/reader/full/pcr-vs-pra 7/25
A c c e p t e d A r t i c l e
A c c e p t e d A r t i c l e
This article is protected by copyright. All rights reserved.
Data synthesis
Descriptive Methods
Descriptive summary was performed by summarizing the studies in evidence tables
to determine the quantity of data, checking further for study variations in study
characteristics (populations, outcomes, design, quality and results). Bias protection
assessment was also summarised in table format. Evidence tables provided the
framework to assess data suitability for further quantitative analyses such as meta-
analysis.
Quantitative Methods
Due to the heterogeneity of the studies, data were not adequate to warrant
performing a meta-analysis.
Results
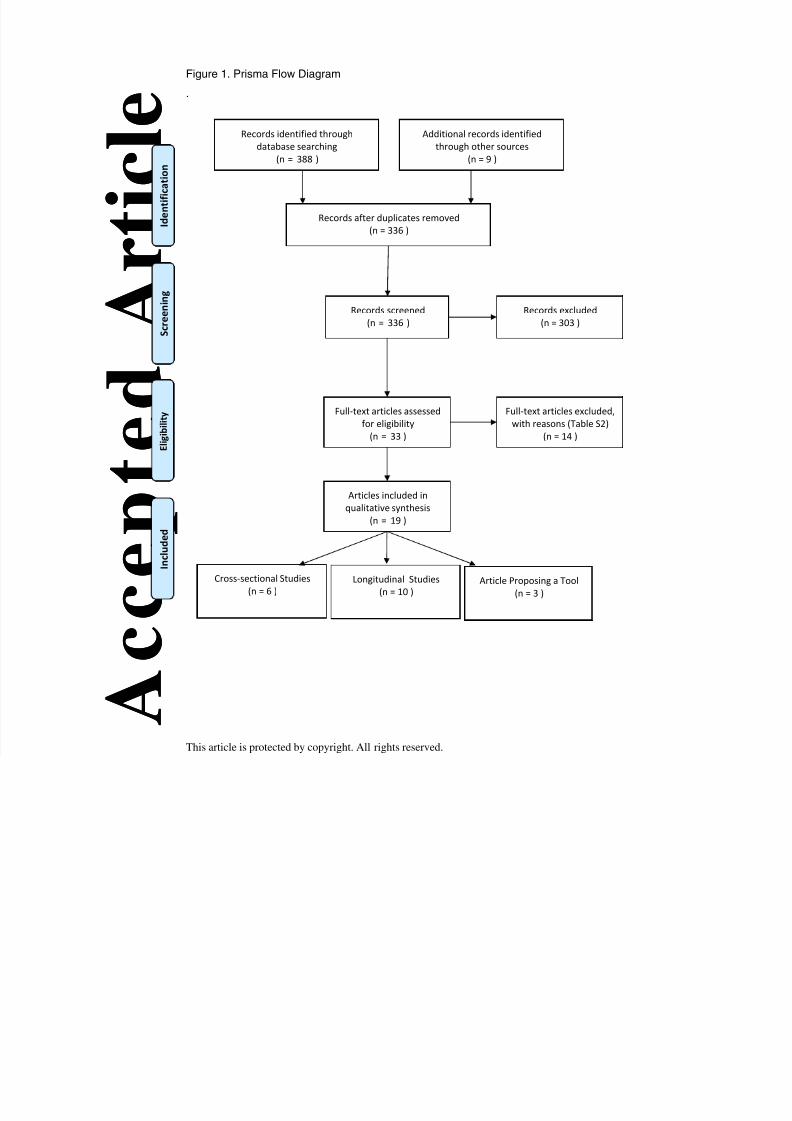
Search ResultsThe electronic search provided 388 citations, including 61 duplicate publications.
Hand searching provided 9 additional citations. 336 titles and abstracts were
screened in duplicate (Kappa score for screening agreement 0.95, 95% CI 0.90 to
0.99). Figure 1 illustrates the PRISMA flow diagram. 303 irrelevant citations wereexcluded, confirming the broad nature of the search. The majority of these contained
information pertaining to associations of specific risk factors to periodontitis.
Moreover, articles about risk factors for caries and periapical lesions as well as
narrative reviews were amongst the excluded titles and abstracts.
All 33 potentially relevant full text articles were screened independently in duplicate
according to the eligibility criteria. Reviewers were in full agreement on inclusion of
articles. This last screening excluded 14 citations that did not provide evidence forrisk assessment tools or were duplicate publications of already included articles, or
were narrative summaries or comments (Busby et al. 2013; Chapple 2007;
Giannobile et al. 2013; Martin et al 2009, Martin et al 2011, Matuliene et al. 2008;
Page et al. 2002; Page et al. 2005; Persson et al. 2003a; Persson et al. 2003c;
8/16/2019 PCR vs PRA
http://slidepdf.com/reader/full/pcr-vs-pra 8/25
A c c e p t e d A r t i c l e
A c c e p t e d A r t i c l e
This article is protected by copyright. All rights reserved.
Renvert et al. 2004; Sandberg 2004; Sandberg & Fors 2007; Thyvalikakath et al.
2013). Detailed reasons for exclusion are reported in Table S2.
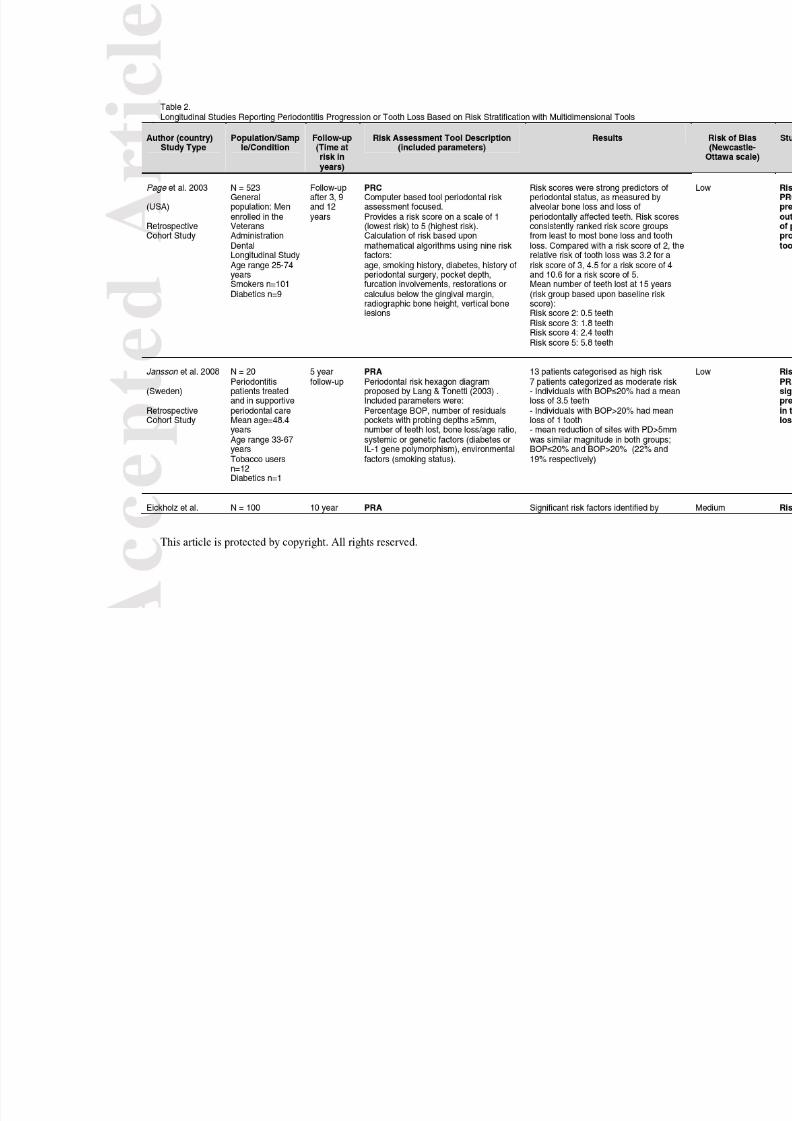
Characteristics of included studiesAll evidence was published within the last 13 years and 10 articles were published
since 2010. 3 included articles reported a risk assessment tool without providing
supporting data (Fors and Sandberg 2001, Lang & Tonetti 2003, Teich et al 2013).
Evidence comprised 10 cohort studies; in 7 of these, risk was calculated
retrospectively at the end of the follow-up period using available baseline data
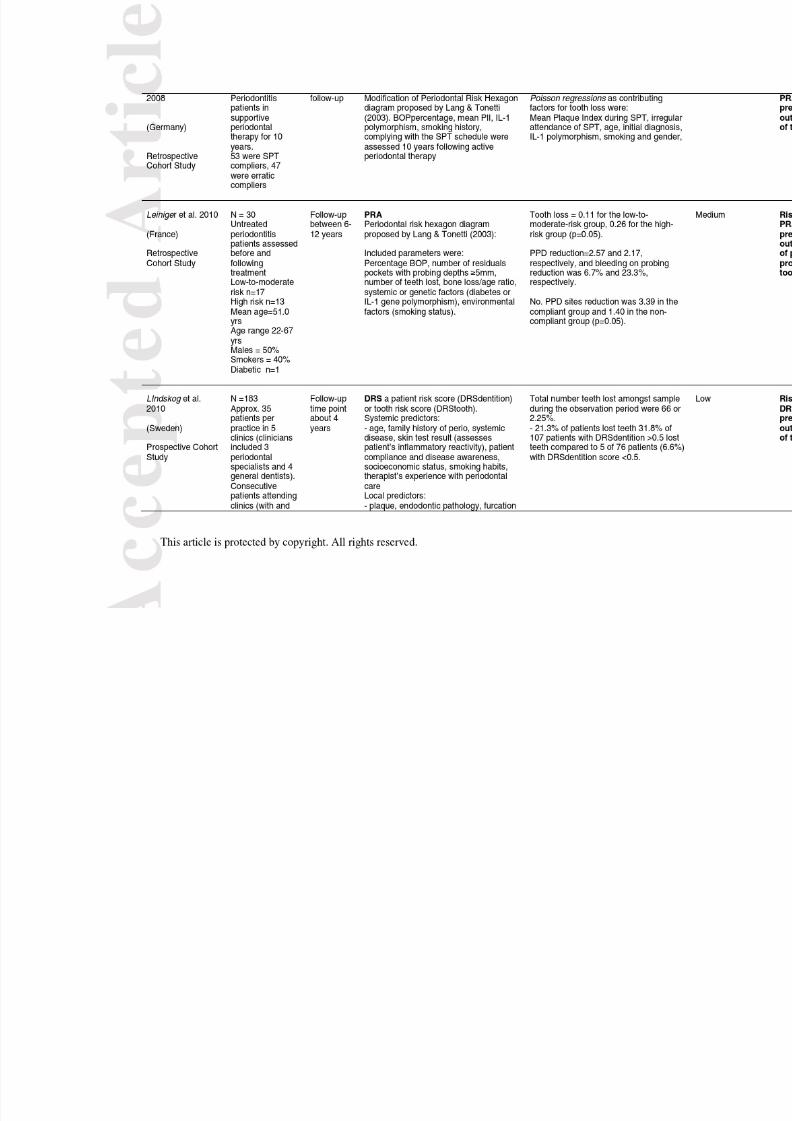
(Jansson & Norderyd 2008; Eickholz et al. 2008; Leininger et al. 2010; Lü et al.
2013; Martin et al. 2010, Matuliene et al. 2010; Page et al. 2003); in 1 risk was
calculated retrospectively using data assessed at the end of the study (Meyer-
Bäumer et al. 2012), while 2 studies were conducted fully with a prospective design
(Costa et al. 2012; Lindskog et al. 2010). 6 cross sectional studies were also
identified (Busby et al. 2014; Chandra 2007; Eshwar et al. 2010; Persson et al.
2003b; Renvert & Persson 2004; Trombelli et al. 2009).
Aim 1. Summary of identified patient-based periodontal risk assessmenttools.The 19 included studies reported on different patient-based periodontal risk
assessment tools. A total of five risk assessment tools were identified in the current
review. Five publications dealt with the DenPlan Excel/Previsor® PatientAssessment (DEPPA) and its modifications (Busby et al 2014; Martin et al. 2010,
Page et al. 2002; Persson et al. 2003b; Trombelli, et al. 2009). One article described
the HIDEP model, a computerized tool that used predetermined risk groups for
selecting and managing individual treatment and prevention schemes (Fors &
Sandberg 2001). One article presented the Risk Assessment-Based Individualized
Treatment (RABIT) (Teich 2013). One study (Lindskog et al. 2010) described the
Dentition Risk System (DRS) at both the patient and tooth level. 12 publications
reported on the Periodontal Risk Assessment (PRA) and it’s modifications (Chandra2007; Eickholz et al. 2008; Costa et al. 2012; Eshwar et al. 2010; Jansson &
Norderyd 2008; Lang & Tonetti 2003; Leiningeret al. 2010; Lü et al. 2013; Matuliene
et al. 2010; Meyer-Bäumeret al.2012; Persson et al. 2003c; Renvert & Persson
2004).
8/16/2019 PCR vs PRA
http://slidepdf.com/reader/full/pcr-vs-pra 9/25
A c c e p t e d A r t i c l e
A c c e p t e d A r t i c l e
This article is protected by copyright. All rights reserved.
Table 1 displays the characteristics and the parameters utilized by these tools. A
qualitative analysis indicates that the parameters that are taken into account are to a
large degree the same even though differences are evident with regards to the
actual assessment of the parameters. Furthermore, the majority of the tools are
variations of few basic approaches and in particular of the Periodontal RiskCalculator, PRC (Page et al. 2002) and of the Periodontal Risk Assessment, PRA
(Lang & Tonetti 2003). Variations frequently addressed different ways of assessing
the parameters included either in PRC or PRA.
A total of 6 studies reporting on 1078 patients had a cross-sectional design and
reported comparisons of different risk assessment tools and/or measures of adjusted
and unadjusted associations between periodontal outcomes and the subject risk
stratification provided by the assessment tools (Table S3).
Aim 2. Prediction of periodontitis progression10 included studies (Table 3) had a cohort design and reported on a total of 2130
patients. The observation period spanned from 3 years to 12 years. The time at risk
(follow-up time) was different for the different subjects enrolled in each study in 5 of
10 studies. In general, these studies report that the risk assessment tool was able to
effectively separate subjects with different probability of disease progression and
tooth loss. The observed effect was dose-dependent (the higher the estimation of
risk the higher the level of observed disease progression and/or tooth loss).
One study (Page et al. 2002) assessed the predictive value of risk estimation with
the Periodontal Risk Calculator (PRC), also known as PreViser® in a largely
untreated population. This study enrolled 523 men of the VA Dental Longitudinal
Study with data gathered over 15 years. The risk scores applied were strong
predictors for the periodontal status as measured by alveolar bone loss of
periodontally affected teeth. Increasing risk scores after 15 years also revealed
increasing numbers of teeth lost. A risk score of 2 corresponded to a loss of 0.5teeth, a risk score of 3 to a loss of 1.6 teeth, a risk score of 4 a tooth loss of 2.4 teeth
and a risk score of 5 a tooth loss of 5.8 teeth. The authors recommended the PRC
as a predictive tool for risk assessment in clinical decision-making. It should be noted
that determining risk subjectively by expert clinicians tended to underestimate the
8/16/2019 PCR vs PRA
http://slidepdf.com/reader/full/pcr-vs-pra 10/25
A c c e p t e d A r t i c l e
A c c e p t e d A r t i c l e
This article is protected by copyright. All rights reserved.
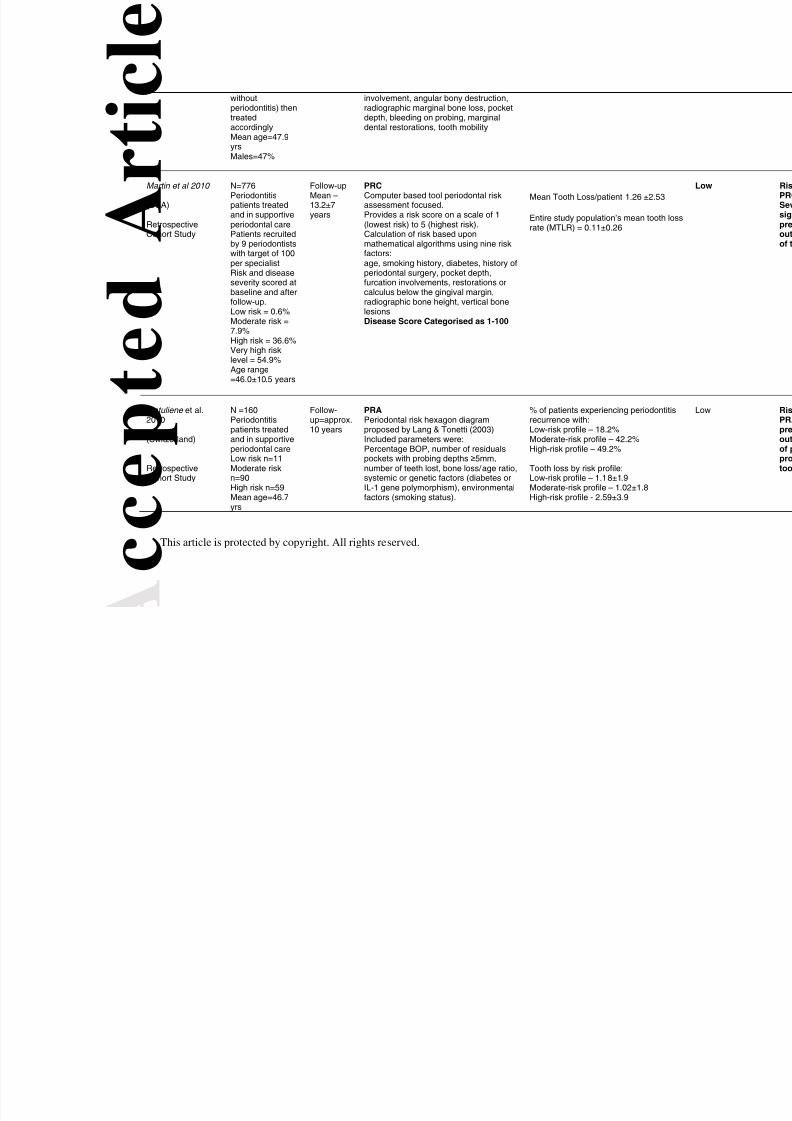
periodontitis risk compared to the PRC. Another study utilizing the PRC system
reported on 776 SPC patients from 9 periodontal practices (Martin et al 2010).
Another prospective cohort study (Lindskog et al. 2010) provided evidence for the
Dentition Risk System (DRS), a proposed combination of factors in assessingdisease progression at both the patient (dentition) and the tooth level in a population
comprising 183 subjects.
Seven studies reporting on 648 subjects assessed the predictive value of risk
estimation with the PRA or its modifications as a predictive tool for periodontal
disease progression (Costa et al. 2012; Jansson & Norderyd 2008; Eickholz et al.
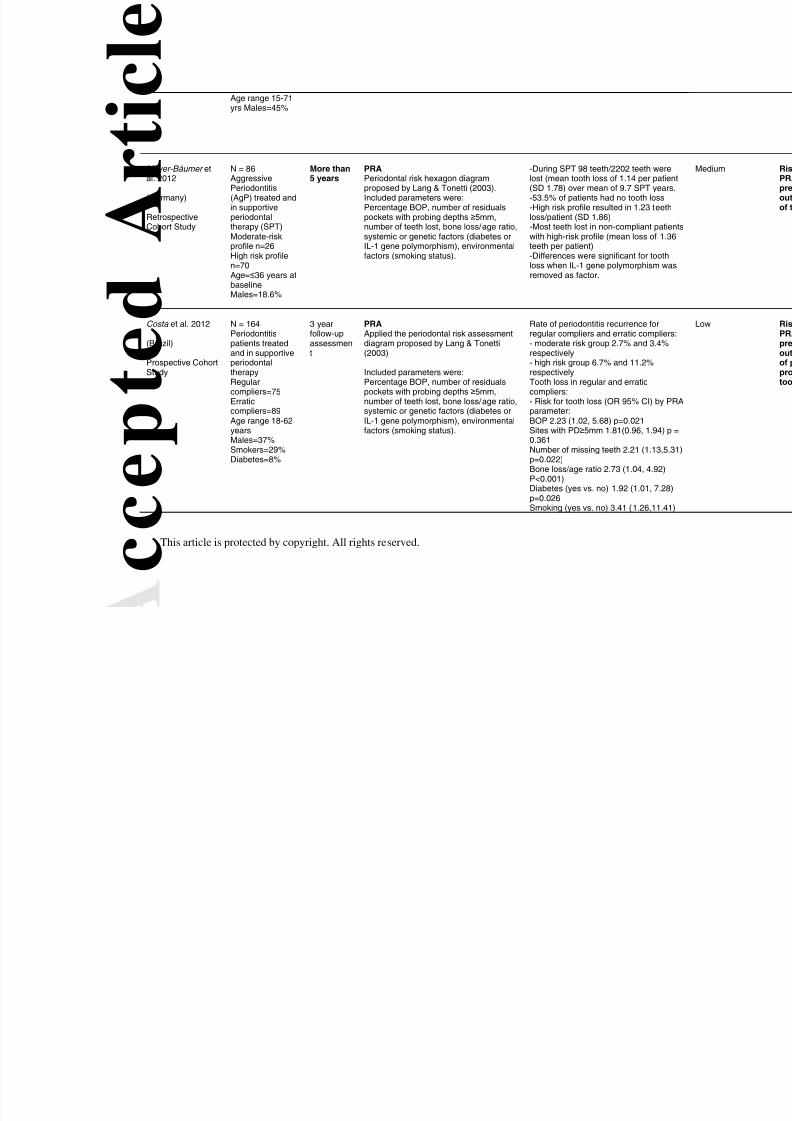
2008; Leininger et al. 2010; Lü et al. 2013; Matuliene et al. 2010; Meyer-Bäumer et
al. 2012). With the exception of one retrospective cohort study with 20 subjects and
a mean follow-up of 5 years (Jansson & Norderyd 2008), 6 of the 7 cohort studies
reported on a total of 628 subjects followed for 3 to12 years (Eickholz et al. 2008;
Costa et al. 2012; Leininger, et al. 2010; Lü et al. 2013; Matuliene et al. 2010;
Meyer-Bäumer et al. 2012). All provided a longitudinal external validation of the PRA
as a predictive tool for periodontitis progression and tooth loss. The study that failed
to report an association between PRA score and periodontitis progression (Jansson
& Norderyd 2008) assessed risk before treatment and after five years, while all other
studies assessed PRA at the end of active therapy. Matuliene et al. (2010) reported
that subjects with a Low Risk profile experienced an average tooth loss of 1.8 teeth
(S.D. 1.9 teeth), subjects with a Middle Risk profile 1.02 teeth (S.D: 1.8 teeth) and
subjects with a High Risk profile 2.59 teeth (S.D. 3.9 teeth)(Matuliene et al. 2010). In
a Chinese study with 88 patients (Lü et al. 2013), a modified PRA was used to
evaluate treatment outcomes in severe generalized aggressive periodontitis. High
Risk patients showed more tooth loss and less bone fill than Low Risk or Moderate
Risk patients. Another cohort study reporting on PRA in generalized aggressive
periodontitis patients, reported more tooth loss and shorter time to the first tooth loss
event in PRA defined high risk individuals compared to low risk and moderate risk
(Meyer-Bäumer et al. 2012). This latter study, however, retrieved risk profile data at
follow-up rather than after active periodontal therapy.
8/16/2019 PCR vs PRA
http://slidepdf.com/reader/full/pcr-vs-pra 11/25
A c c e p t e d A r t i c l e
A c c e p t e d A r t i c l e
This article is protected by copyright. All rights reserved.
Based on the Newcastle-Ottawa Quality Assessment Scale for the prospective and
retrospective cohort study design (Wells et al. 2009), 6 studies met the criteria to be
categorised as being at low risk of bias, while 4 studies were at medium risk of bias.
No retrieved study evaluated in a comparative way the effect of knowledge of the risk
assessment profile on the management of the patient.
Discussion
This systematic review identified five periodontal risk assessment tools in the
literature. These employed assessment of a small set of well documented risk
factors and indicators. Differences consisted mainly of the methods of estimation of
the different parameters, their number and the inclusion of tooth or site specific
factors. Among these, three tools - and their variations - have been assessed in
longitudinal studies. One tool termed the Periodontal Risk Calculator or PRC was
studied in two studies from the USA (Page et al. 2002, Martin et al 2010). Another
tool, the Periodontal Risk Assessment or PRA (Lang & Tonetti 2003) was tested in a
total of 7 studies including 648 subjects. One of the seven studies with a very limited
number of subjects (n=20) was unable to attribute a predictive function for
periodontitis progression or tooth loss to the Periodontal Risk Assessment (PRA),
but the other six studies confirmed such predictive value. Authors commented that
this result may have been influenced by a more aggressive treatment approach
including more extractions at initial therapy as baseline was defined as before initial
therapy. The last tool, the Dentition Risk System was evaluated in 183 individuals
recruited by 7 dental practitioners from 5 clinics in Sweden (Lindskog et al. 2010).
Taken together, these data support the possibility to predict periodontitis progression
and tooth loss in a treated population based on risk segmentation using these tools.
No data, however, is available on the impact that such risk assessment may have on
patient management. In this respect the use of risk assessment to determine the
frequency of supportive periodontal care appointments has been proposed along
with the idea that it may help in treatment planning. While rationale, these
suggestions remain unsubstantiated. In this situation of incomplete knowledge,
however, clinicians may wish to consider application of risk assessment tools to
improve their ability to identify, communicate and manage the multifactorial nature of
periodontitis. Both PRC and PRA seem well suited to satisfy the goals proposed with
8/16/2019 PCR vs PRA
http://slidepdf.com/reader/full/pcr-vs-pra 12/25
A c c e p t e d A r t i c l e
A c c e p t e d A r t i c l e
This article is protected by copyright. All rights reserved.
patient-based risk assessment (Tonetti 1998). It appears, however, particularly
important to emphasize that risk segmentation of recall populations with PRA or its
modifications have been validated in multiple populations and settings around the
world (Brazil, China, France, Germany, India, Sweden, and Switzerland) increasing
the generalizability and external validity of the tool and therefore, the potentialapplicability to clinical practice.
References
Busby, M., Chapple, E., Matthews, R., & Chapple, I.L. 2013. Practitioner evaluation
of a novel online integrated oral health and risk assessment tool: a practice
pilot.[Erratum appears in Br Dent J. 2013 Sep;215(5):212]. British Dental Journal ,
215, (3) 115-120
Busby, M., Chapple, L., Matthews, R., Burke, F.J., & Chapple, I. 2014. Continuing
development of an oral health score for clinical audit. Br.Dent.J. , 216, (9) E20
available from: PM:24809589
Chambrone, L., Chambrone, D., Lima, L.A., & Chambrone, L.A. 2010. Predictors of
tooth loss during long-term periodontal maintenance: a systematic review of
observational studies. J.Clin.Periodontol. , 37, (7) 675-684 available from:
PM:20528960
Chandra, R.V. 2007. Evaluation of a novel periodontal risk assessment model in
patients presenting for dental care. Oral Health & Preventive Dentistry , 5, (1) 39-48
Chapple, I.L. 2007. Management of periodontal diseases within the NHS three years
on: are things any better? British Dental Journal , 202, (9) 569-570
Claffey, N., Nylund, K., Kiger, R., Garrett, S., & Egelberg, J. 1990. Diagnostic
predictability of scores of plaque, bleeding, suppuration and probing depth for
probing attachment loss. 3 ½ years of observation following initial periodontal
therapy. J.Clin.Periodontol. , 17, (2) 108-114 available from: PM:2406292
Costa, F.O., Cota, L.O., Lages, E.J., Lima Oliveira, A.P., Cortelli, S.C., Cortelli, J.R.,
Lorentz, T.C., & Costa, J.E. 2012. Periodontal risk assessment model in a sample of
regular and irregular compliers under maintenance therapy: a 3-year prospective
study. Journal of Periodontology , 83, (3) 292-300
Eickholz, P., Kaltschmitt, J., Berbig, J., Reitmeir, P. & Pretzl, B. (2008) Tooth loss
after active periodontal therapy. 1: patient-related factors for risk, prognosis, and
quality of outcome. J. Clin. Periodontol. 35, 165–174.

8/16/2019 PCR vs PRA
http://slidepdf.com/reader/full/pcr-vs-pra 13/25
A c c e p t e d A r t i c l e
A c c e p t e d A r t i c l e
This article is protected by copyright. All rights reserved.
Eshwar, S., Ankola, A.V., Kumar, A., & Hebbal, M. 2010. Evaluation of periodontal
risk assessment model among adults aged 30-60 years attending KLE Dental
College, Belgaum: A hospital-based study. Journal of Indian Society of
Periodontology , 14, (3) 173-177
Fors, U.G. & Sandberg, H.C. 2001. Computer-aided risk management—a softwaretool for the Hidep model. Quintessence International , 32, (4) 309-320
Giannobile, W.V., Braun, T.M., Caplis, A.K., Doucette-Stamm, L., Duff, G.W., &
Kornman, K.S. 2013. Patient stratification for preventive care in dentistry.
J.Dent.Res. , 92, (8) 694-701 available from: PM:23752171
Haffajee & Oliver 1990, Periodontal Diseases Working Group Summary and
Recommendations In: Bader JD, editor. Risk Assessment in Dentistry, Chapel Hill,
University of NOrth Carolina Dental Ecology..
Jansson, H. & Norderyd, O. 2008. Evaluation of a periodontal risk assessment model
in subjects with severe periodontitis. A 5-year retrospective study. Swedish Dental
Journal , 32, (1) 1-7
Lang, N.P., Joss, A., Orsanic, T., Gusberti, F.A., & Siegrist, B.E. 1986. Bleeding on
probing. A predictor for the progression of periodontal disease? J.Clin.Periodontol. ,
13, (6) 590-596 available from: PM:3489010
Lang, N.P. & Tonetti, M.S. 1996. Periodontal diagnosis in treated periodontitis. Why,
when and how to use clinical parameters. [Review] [102 refs]. Journal of Clinical
Periodontology , 23, (3:Pt 2) t-50
Lang, N.P. & Tonetti, M.S. 2003. Periodontal risk assessment (PRA) for patients in
supportive periodontal therapy (SPT). Oral Health & Preventive Dentistry , 1, (1) 7-16
Leininger, M., Tenenbaum, H., & Davideau, J.L. 2010. Modified periodontal risk
assessment score: long-term predictive value of treatment outcomes. A retrospective
study. Journal of Clinical Periodontology , 37, (5) 427-435
Lindskog, S., Blomlof, J., Persson, I., Niklason, A., Hedin, A., Ericsson, L., Ericsson,
M., Jarncrantz, B., Palo, U., Tellefsen, G., Zetterstrom, O., & Blomlof, L. 2010.
Validation of an algorithm for chronic periodontitis risk assessment and
prognostication: risk predictors, explanatory values, measures of quality, and clinical
use. Journal of Periodontology , 81, (4) 584-593
Lü, D., Meng, H., Xu, L., Lu, R., Zhang, L., Chen, Z., Feng, X., Shi, D., Tian, Y., &
Wang, X. 2013. New attempts to modify periodontal risk assessment for generalized
8/16/2019 PCR vs PRA
http://slidepdf.com/reader/full/pcr-vs-pra 14/25
A c c e p t e d A r t i c l e
A c c e p t e d A r t i c l e
This article is protected by copyright. All rights reserved.
aggressive periodontitis: a retrospective study. Journal of Periodontology , 84:1536-
1545
Martin J., Page R., Loeb C., Kaye E., 2011 Reduction of Tooth Loss Associated withPeriodontal Treatment. International Journal of Periodontics and RestorativeDentistry. 31:471-9.
Martin J., Page R., Loeb C., Levi P Jr., 2010. Tooth Loss in 776 Treated PeriodontalPatients. Journal of Periodontology, Feb;81(2):244-50.
Martin J., Page R., Kaye E., Hamed, MT., Loeb C., 2009. Periodontitis Severity PlusRisk as a Tooth Loss Predictor. Journal of Periodontology,: 80:202-9
Matuliene, G., Pjetursson, B.E., Salvi, G.E., Schmidlin, K., Bragger, U., Zwahlen, M.,
& Lang, N.P. 2008. Influence of residual pockets on progression of periodontitis and
tooth loss: results after 11 years of maintenance. J.Clin.Periodontol. , 35, (8) 685-695
available from: PM:18549447
Matuliene, G., Studer, R., Lang, N.P., Schmidlin, K., Pjetursson, B.E., Salvi, G.E.,
Bragger, U., & Zwahlen, M. 2010. Significance of Periodontal Risk Assessment in
the recurrence of periodontitis and tooth loss. Journal of Clinical Periodontology , 37,
(2) 191-199
Meyer-Bäumer, A., Pritsch, M., Cosgarea, R., El, S.N., Kim, T.S., Eickholz, P., &
Pretzl, B. 2012. Prognostic value of the periodontal risk assessment in patients with
aggressive periodontitis. Journal of Clinical Periodontology , 39, (7) 651-658
Page, R.C., Krall, E.A., Martin, J., Mancl, L., & Garcia, R.I. 2002. Validity andaccuracy of a risk calculator in predicting periodontal disease. Journal of the
American Dental Association , 133, (5) 569-576
Page, R.C., Martin, J., Krall, E.A., Mancl, L., & Garcia, R. 2003. Longitudinal
validation of a risk calculator for periodontal disease. J.Clin.Periodontol. , 30, (9) 819-
827 available from: PM:12956658
Page, R.C., Martin, J.A., & Loeb, C.F. 2005. The Oral Health Information Suite
(OHIS): its use in the management of periodontal disease. Journal of Dental
Education , 69, (5) 509-520Papapanou, P.N. 1996. Periodontal diseases: epidemiology. Ann.Periodontol. , 1, (1)
1-36 available from: PM:9118256
Persson, G.R., Attström, R., Lang, N.P., & Page, R.C. 2003a. Perceived risk of
deteriorating periodontal conditions. Journal of Clinical Periodontology , 30, (11) 982-
989
8/16/2019 PCR vs PRA
http://slidepdf.com/reader/full/pcr-vs-pra 15/25
A c c e p t e d A r t i c l e
A c c e p t e d A r t i c l e
This article is protected by copyright. All rights reserved.
Persson, G.R., Mancl, L.A., Martin, J., & Page, R.C. 2003b. Assessing periodontal
disease risk: a comparison of clinicians’ assessment versus a computerized tool.
Journal of the American Dental Association , 134, (5) 575-582
Persson, G.R., Matuliene, G., Ramseier, C.A., Persson, R.E., Tonetti, M.S., & Lang,
N.P. 2003c. Influence of interleukin-1 gene polymorphism on the outcome ofsupportive periodontal therapy explored by a multi-factorial periodontal risk
assessment model (PRA). Oral Health & Preventive Dentistry , 1, (1) 17-27
Renvert, S., Ohlsson, O., Persson, S., Lang, N.P., & Persson, G.R. 2004. Analysis of
periodontal risk profiles in adults with or without a history of myocardial infarction.
J.Clin.Periodontol. , 31, (1) 19-24 available from: PM:15058370
Renvert, S. & Persson, G.R. 2004. Patient-based assessments of clinical periodontal
conditions in relation to alveolar bone loss. Journal of Clinical Periodontology , 31, (3)
208-213
Sandberg, H. 2004. Practice management based on risk assessment. Oral Health &
Preventive Dentistry , 2, Suppl-9
Sandberg, H.C. & Fors, U.G. 2007. The HIDEP model—a straightforward dental
health care model for prevention-based practice management. Swedish Dental
Journal , 31, (4) 171-179
Socransky, S.S., Haffajee, A.D., Goodson, J.M., & Lindhe, J. 1984. New concepts of
destructive periodontal disease. J.Clin.Periodontol. , 11, (1) 21-32 available from:
PM:6582072
Teich, S.T. 2013. Risk Assessment-Based Individualized Treatment (RABIT): a
comprehensive approach to dental patient recall. Journal of Dental Education , 77, (4)
448-457
Thyvalikakath, T.P., Padman, R., & Gupta, S. 2013. An integrated risk assessment
tool for team-based periodontal disease management. Studies in Health Technology
& Informatics , 192, 1150
Tonetti, M.S. 1998. Cigarette smoking and periodontal diseases: etiology and
management of disease. Ann.Periodontol. , 3, (1) 88-101 available from:
PM:9722693
Tonetti, M.S. & Claffey, N. 2005. Advances in the progression of periodontitis and
proposal of definitions of a periodontitis case and disease progression for use in risk
factor research. Group C consensus report of the 5 th European Workshop in

8/16/2019 PCR vs PRA
http://slidepdf.com/reader/full/pcr-vs-pra 16/25
A c c e p t e d A r t i c l e
A c c e p t e d A r t i c l e
This article is protected by copyright. All rights reserved.
Periodontology. J.Clin.Periodontol. , 32 Suppl 6, 210-213 available from:
PM:16128839
Trombelli, L., Farina, R., Ferrari, S., Pasetti, P., & Calura, G. 2009. Comparison
between two methods for periodontal risk assessment. Minerva Stomatologica , 58,
(6) 277-287Wells GA, Shea B, O’Connell D, Peterson J, Welch V, Losos M, & Tugwell P. The
Newcastle-Ottawa Scale (NOS) for assessing the quality of nonrandomised studies
in meta-analyses. http://www.lri.ca/programs/ceu/oxford.htm. 2009. Department of
Epidemiology and Community Medicine, University of Ottawa, Canada.
8/16/2019 PCR vs PRA
http://slidepdf.com/reader/full/pcr-vs-pra 17/25
8/16/2019 PCR vs PRA
http://slidepdf.com/reader/full/pcr-vs-pra 18/25
8/16/2019 PCR vs PRA
http://slidepdf.com/reader/full/pcr-vs-pra 19/25
8/16/2019 PCR vs PRA
http://slidepdf.com/reader/full/pcr-vs-pra 20/25
8/16/2019 PCR vs PRA
http://slidepdf.com/reader/full/pcr-vs-pra 21/25
8/16/2019 PCR vs PRA
http://slidepdf.com/reader/full/pcr-vs-pra 22/25
c c e p t e d
A r t i c l e
This article is protected by copyright. All rights reserved.
withoutperiodontitis) thentreatedaccordinglyMean age=47.9
yrsMales=47%
involvement, angular bony destruction,radiographic marginal bone loss, pocketdepth, bleeding on probing, marginaldental restorations, tooth mobility
Martin et al 2010
(USA)
RetrospectiveCohort Study
N=776Periodontitispatients treatedand in supportiveperiodontal carePatients recruitedby 9 periodontistswith target of 100per specialistRisk and diseaseseverity scored atbaseline and after
follow-up.Low risk = 0.6%Moderate risk =7.9%High risk = 36.6%Very high risklevel = 54.9%Age range=46.0±10.5 years
Follow-upMean –13.2±7years
PRCComputer based tool periodontal riskassessment focused.Provides a risk score on a scale of 1(lowest risk) to 5 (highest risk).Calculation of risk based uponmathematical algorithms using nine riskfactors:age, smoking history, diabetes, history ofperiodontal surgery, pocket depth,furcation involvements, restorations orcalculus below the gingival margin,
radiographic bone height, vertical bonelesions Disease Score Categorised as 1-100
Mean Tooth Loss/patient 1.26 ±2.53
Entire study population’s mean tooth lossrate (MTLR) = 0.11±0.26
Matuliene et al.2010
(Switzerland)
RetrospectiveCohort Study
N =160Periodontitispatients treatedand in supportive
periodontal careLow risk n=11Moderate riskn=90High risk n=59Mean age=46.7yrs
Follow-up=approx.10 years
PRAPeriodontal risk hexagon diagramproposed by Lang & Tonetti (2003)Included parameters were:
Percentage BOP, number of residualspockets with probing depths ≥ 5mm,number of teeth lost, bone loss/age ratio,systemic or genetic factors (diabetes orIL-1 gene polymorphism), environmentalfactors (smoking status).
% of patients experiencing periodontitisrecurrence with:Low-risk profile – 18.2%Moderate-risk profile – 42.2%
High-risk profile – 49.2%Tooth loss by risk profile:Low-risk profile – 1.18±1.9Moderate-risk profile – 1.02±1.8High-risk profile - 2.59±3.9
8/16/2019 PCR vs PRA
http://slidepdf.com/reader/full/pcr-vs-pra 23/25
c c e p t e d
A r t i c l e
This article is protected by copyright. All rights reserved.
Age range 15-71yrs Males=45%
Meyer-Bäumer etal. 2012
(Germany)
RetrospectiveCohort Study
N = 86AggressivePeriodontitis(AgP) treated andin supportiveperiodontaltherapy (SPT)Moderate-riskprofile n=26High risk profilen=70Age= ≤ 36 years atbaselineMales=18.6%
More than5 years
PRAPeriodontal risk hexagon diagramproposed by Lang & Tonetti (2003).Included parameters were:Percentage BOP, number of residualspockets with probing depths ≥ 5mm,number of teeth lost, bone loss/age ratio,systemic or genetic factors (diabetes orIL-1 gene polymorphism), environmentalfactors (smoking status).
-During SPT 98 teeth/2202 teeth werelost (mean tooth loss of 1.14 per patient(SD 1.78) over mean of 9.7 SPT years.-53.5% of patients had no tooth loss-High risk profile resulted in 1.23 teethloss/patient (SD 1.86)-Most teeth lost in non-compliant patientwith high-risk profile (mean loss of 1.36teeth per patient)-Differences were significant for toothloss when IL-1 gene polymorphism wasremoved as factor.
Costa et al. 2012
(Brazil)
Prospective CohortStudy
N = 164Periodontitispatients treatedand in supportiveperiodontaltherapyRegularcompliers=75Erraticcompliers=89Age range 18-62yearsMales=37%
Smokers=29%Diabetes=8%
3 yearfollow-upassessment
PRAApplied the periodontal risk assessmentdiagram proposed by Lang & Tonetti(2003)
Included parameters were:Percentage BOP, number of residualspockets with probing depths ≥ 5mm,number of teeth lost, bone loss/age ratio,systemic or genetic factors (diabetes orIL-1 gene polymorphism), environmentalfactors (smoking status).
Rate of periodontitis recurrence forregular compliers and erratic compliers:- moderate risk group 2.7% and 3.4%respectively- high risk group 6.7% and 11.2%respectivelyTooth loss in regular and erraticcompliers:- Risk for tooth loss (OR 95% CI) by PRAparameter:BOP 2.23 (1.02, 5.68) p=0.021Sites with PD ≥ 5mm 1.81(0.96, 1.94) p 0.361
Number of missing teeth 2.21 (1.13,5.31)p=0.022)Bone loss/age ratio 2.73 (1.04, 4.92)P<0.001)Diabetes (yes vs. no) 1.92 (1.01, 7.28)p=0.026Smoking (yes vs. no) 3.41 (1.26,11.41)
8/16/2019 PCR vs PRA
http://slidepdf.com/reader/full/pcr-vs-pra 24/25
c c e p t e d
A r t i c l e
This article is protected by copyright. All rights reserved.
p<0.001)
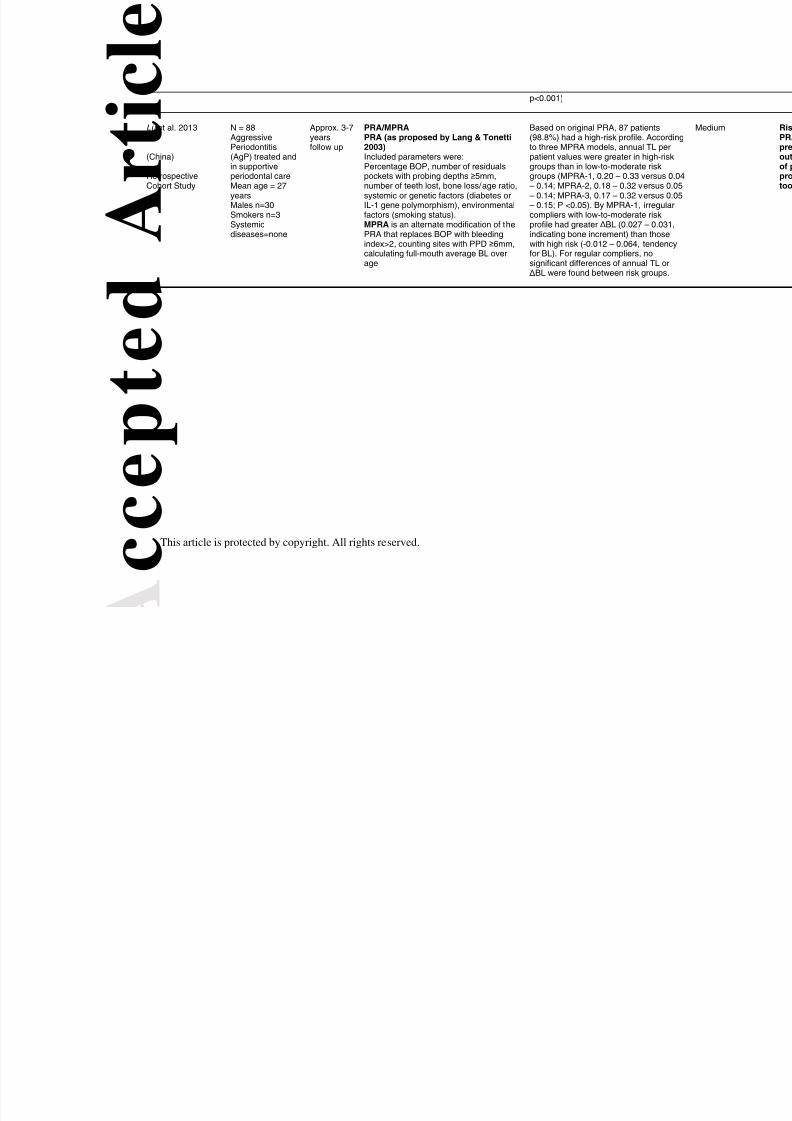
Lü et al. 2013
(China)
RetrospectiveCohort Study
N = 88Aggressive
Periodontitis(AgP) treated andin supportiveperiodontal careMean age = 27yearsMales n=30Smokers n=3Systemicdiseases=none
Approx. 3-7years
follow up
PRA/MPRAPRA (as proposed by Lang & Tonetti
2003)Included parameters were:Percentage BOP, number of residualspockets with probing depths ≥ 5mm,number of teeth lost, bone loss/age ratio,systemic or genetic factors (diabetes orIL-1 gene polymorphism), environmentalfactors (smoking status).MPRA is an alternate modification of thePRA that replaces BOP with bleedingindex>2, counting sites with PPD ≥ 6mm,calculating full-mouth average BL overage
Based on original PRA, 87 patients(98.8%) had a high-risk profile. Accordin
to three MPRA models, annual TL perpatient values were greater in high-riskgroups than in low-to-moderate riskgroups (MPRA-1, 0.20 – 0.33 versus 0.04– 0.14; MPRA-2, 0.18 – 0.32 versus 0.05– 0.14; MPRA-3, 0.17 – 0.32 versus 0.05– 0.15; P <0.05). By MPRA-1, irregularcompliers with low-to-moderate riskprofile had greater ∆ BL (0.027 – 0.031indicating bone increment) than thosewith high risk (-0.012 – 0.064, tendencyfor BL). For regular compliers, nosignificant differences of annual TL or ∆ BL were found between risk groups.
8/16/2019 PCR vs PRA
http://slidepdf.com/reader/full/pcr-vs-pra 25/25
A c c e p t e d A r t i c l e
A c c e p t e d A r t i c l e
Figure 1. Prisma Flow Diagram
.
S c r e e n i n g
I n c
l u d e
d
E l i g i b i l i t y
I d e n t i f i c a t i o n
Records after duplicates removed(n = 336 )
Records screened(n = 336 )
Records excluded(n = 303 )
Full-text articles assessedfor eligibility
(n = 33 )
Full-text articles excluded,with reasons (Table S2)
(n = 14 )
Articles included inqualitative synthesis
(n = 19 )
Cross-sectional Studies(n = 6 )
Records identified through
database searching(n = 388 )
Additional records identified
through other sources(n = 9 )
Longitudinal Studies(n = 10 )
Article Proposing a Tool(n = 3 )