nÍvel do lenÇol freÁtico É um melhor …...2012), nutriente escasso nos solos amazônicos da...
TRANSCRIPT

INSTITUTO NACIONAL DE PESQUISAS DA AMAZÔNIA – INPA
PROGRAMA DE PÓS-GRADUAÇÃO EM ECOLOGIA DO INPA
NÍVEL DO LENÇOL FREÁTICO É UM MELHOR PREDITOR QUE NUTRIENTES
PARA ASSEMBLEIAS DE PLANTAS VASCULARES EM UMA FLORESTA DE
TERRA FIRME NA AMAZÔNIA
DANIELA APARECIDA SAVARIZ BÔLLA
Manaus, Amazonas
Abril, 2019

2
DANIELA APARECIDA SAVARIZ BÔLLA
NÍVEL DO LENÇOL FREÁTICO É UM MELHOR PREDITOR QUE NUTRIENTES
PARA ASSEMBLEIAS DE PLANTAS VASCULARES EM UMA FLORESTA DE
TERRA FIRME NA AMAZÔNIA
Dissertação apresentada ao Instituto Nacional de
Pesquisas da Amazônia como parte do requerimento para
obtenção do título de Mestre em Biologia (Ecologia).
Manaus, Amazonas

3
AGRADECIMENTOS
Aos meus pais. Mãe e pai, muito obrigada por terem sido meus primeiros exemplos de
força, perseverança e amor. Obrigada por terem sido meus pilares e minha força nesses dois
anos, em todos os aspectos. E por nunca terem me deixado sequer pensar em desistir de
algum sonho.
À minha irmã, meu primeiro exemplo de cientista. Obrigada por ter sempre se
preocupado comigo e me ajudado até hoje.
Ao Juliano, por todo o amor, compreensão, ajuda e dedicação incansáveis. Tu fizeste
esses dois anos serem mais tranquilos e divertidos.
Ao Fabricio, por aceitar me orientar e construir uma relação saudável de orientador-
aluna. Obrigada por ter se preocupado além da dissertação e por ser essa pessoa [louca e]
incrível. Aprendi muito contigo, no âmbito profissional e pessoal. És pra mim um exemplo.
Aos meus amigos Pedro e Mari, pela ajuda, pelos ótimos momentos, por me
suportarem, por me aguentarem na casa de vocês, e etc. Não dá pra elencar o quão
importantes vocês foram nesse processo todo. Aos também meus amigos Tai e Daniel, por
tornarem os dias em Manaus suportáveis, pelos momentos de alegria e de decepção
compartilhados, pela parceria e por terem me ajudado a ver por outras perspectivas essa
Babilônia.
Aos amigos e colegas de laboratório da UFAM – Afonso (pai d’égua), Léo (deficiente
visual), Talitha (tu não sabe nem esquentar uma água, Danieli), Cláudio (que faz mapa
colorido sem saber as cores), Ceci Mara (marcou você em um meme), Dina (e suas “amigas”),
Nicolle (saco sem fundo), Isa (butterfly girl), Thays (PNC), Karol (business woman), Jadson
(ou Janis) e Érica (será que alguém vai notar que eu colei a cabeça dessa formiga?) – por
terem se tornado minha família (irmãos órfãos morando sozinhos) de convívio diário em
Manaus. Foi muito bom ter conhecido e aprendido com cada um de vocês.
A todos os meus colegas de turma do INPA por terem me ensinado tanto como
pessoas e como profissionais e pela parceria na alegria e na tristeza.
Aos colegas e professores do curso Ecologia da Floresta Amazônica (EFA 2017 –
Turma dos Desatentos) pelos melhores trinta dias nesses dois anos. Em especial, XL (Pink
spot), Potirica (“Precisamos tirar um retrato e ouvir uma canção”) e Mário (“Empatia,
„dotôra‟, empatia!”). Vocês foram/são/sempre serão demais!
Ao Bill, por sempre estar disposto a ajudar e incentivar e por ter me mostrado que o
meu “feijão com arroz” era na verdade “champagne com caviar”, em suas próprias palavras.
A todos os coautores, por terem aceitado colaborar com entusiasmo e fazer esse
trabalho digno de uma boa publicação.
A minha banca de qualificação – Marcelo Menin, Fernando Figueiredo e Bill, pelas
sugestões que resultaram em grandes melhorias no trabalho.
Ao Cristian Dambros, meu co-orientador, por ter aceitado me co-orientar e pelas
conversas.
Ao INPA, pelo conhecimento adquirido e oportunidade de estudar num lugar tão
incrível.
Ao CNPq pela bolsa a mim concedida.

4
RESUMO
Muitas espécies podem co-ocorrer ao longo do mesmo gradiente, mas a associação espécie-
habitat pode ser mais ou menos forte de acordo com o efeito que o gradiente exerce no
desempenho das espécies. Essa associação comumente leva à especialização ecológica que,
em plantas, envolve fatores abióticos como nutrientes e água. Nesse trabalho nós
investigamos como os gradientes hídrico (Altura acima da drenagem mais próxima - HAND)
e fertilidade (teor de fósforo e soma de bases K+, Ca2
+ e Mg2
+) restringem a distribuição de
espécies de seis formas de vida de comunidades vegetais em uma floresta tropical na
Amazônia Central. Nossa hipótese é que as formas de vida de maior biomassa devem ser
menos especializadas com base na profundidade e extensão da raiz e que os nutrientes
restringem mais as espécies do que a água, uma vez que nutrientes são mais limitantes que a
disponibilidade de água. Estimamos a especialização de cada espécie comparando os valores
observados de ocorrência ao longo dos gradientes, com distribuição esperada pelo modelo
nulo. Para comparação entre gradientes e formas de vida, calculamos o efeito padronizado
(SES – Standard Effect Size) de cada espécie para cada gradiente. Usamos o SES como
variável dependente em dois GLMMs. No primeiro comparamos os valores de SES para cada
gradiente (variável dependente) entre as formas de vida (variável independente). No segundo
GLMM comparamos os valores de SES de cada forma de vida (variável dependente) entre os
3 gradientes (variáveis independentes). Nos dois modelos a família foi declarada como
variável randômica para controlar o número de espécies entre formas de vida A água
restringiu mais as espécies de plantas - principalmente samambaias - do que a fertilidade. O
gradiente de fósforo restringiu mais as espécies do que as bases, mas ambos restringiram
mais as lianas e as palmeiras, comparado com outras formas de vida. Embora os nutrientes
sempre tenham sido considerados o maior determinante para a distribuição de espécies de
plantas na Amazônia, o HAND pode ser mais importante em mesoescala. Além disso, as
formas de vida podem responder de forma diferente dependendo da escala dos gradientes
edáficos analisados, não necessariamente seguindo o padrão baseado na profundidadedas
raizes.
PALAVRAS-CHAVE: especialização ecológica; especificidade do habitat; ecologia da
comunidade; tamanho de efeito padrão; Amazônia Central; formas de vida; fertilidade do
solo; altura acima da drenagem mais próxima; fósforo; soma de bases.

5
ABSTRACT
Many species can co-occur in the same habitat, but species-habitat association can be tighter
or looser depending on the gradient effect on the species performance. This association
commonly leads to ecological specialization that, in plants, involves abiotic factors such as
nutrients and water availability. Here we investigated how hydric (Height above the nearest
drainage - HAND) and fertility (phosphorus content and the sum of K+, Ca2+ and Mg2+)
gradients constrain the distribution of species from six life forms of plant communities in a
tropical forest in the Central Amazon. We hypothesized greater biomass life forms would be
less specialized based on root depth and span and that nutrients would constrain species more
than water since the soils are poor. We estimated the specialization by comparing the
observed values of occurrence along the gradients, with distribution expected by the null
model for each species. To compare gradients and life forms, we calculated the standard
effect (SES) of each species for each gradient. We used SES as the dependent variable in two
GLMMs. In the first, we compared the SES values for each gradient (dependent variable)
between life forms (independent variable). In the second GLMM we compared the SES
values of each life form (dependent variable) among the 3 gradients (independent variables).
In both models the family was declared as a random variable to control the number of species
among life forms. Water constrained species more – mainly ferns – than fertility. The
phosphorus gradient constrained more species than bases, but both constrained lianas and
palms the most. Although nutrients have always been considered the greatest determinant to
plant species distribution in the Amazon forests, HAND may have the same or even more
important at mesoscale. Also, life forms may respond differently depending on the scales of
the edaphic gradients analyzed, not necessarily following the pattern based on root depth.
KEY WORDS: ecological specialization; habitat specificity; community ecology; standard
effect size; Central Amazon; life forms; soil fertility; height above the nearest drainage;
phosphorus; sum of bases.

6
SUMÁRIO
INTRODUÇÃO GERAL .................................................................................................................. 7
OBJETIVOS ...................................................................................................................................... 10
Objetivo Geral ...................................................................................................................... 10
Objetivos Específicos........................................................................................................... 10
REFERÊNCIAS ............................................................................................................................... 11
CAPÍTULO ÚNICO ........................................................................................................................ 14
Water-table level is a better predictor than nutrients of vascular plant assemblages in an
Amazonian terra-firme forest .............................................................................................. 15
ABSTRACT ........................................................................................................................... 16
INTRODUCTION ................................................................................................................. 18
METHODS ............................................................................................................................. 22
Study Area ............................................................................................................. 22
Floristic data ......................................................................................................... 23
Environmental data ............................................................................................... 23
Data analysis ........................................................................................................ 24
RESULTS ............................................................................................................................... 27
DISCUSSION ........................................................................................................................ 29
ACKNOWLEDGEMENTS ................................................................................................. 34
LITERATURE CITED ................................................................................................ 35
FIGURE LEGENDS ............................................................................................................. 49
FIGURES ............................................................................................................................... 50
APPENDIX S1 ...................................................................................................................... 53
CONCLUSÃO GERAL .................................................................................................................. 83

7
INTRODUÇÃO GERAL
Florestas tropicais abrigam mais de 75% da diversidade de espécies de plantas e
animais conhecidos (Barlow et al. 2018) e mais da metade delas constituem o Bioma
Amazônico (Whitmore 1997), que é considerado um centro de biodiversidade (Barlow et al.
2018, Jenkins et al. 2013, Guénard et al. 2012, Kier et al. 2005). Entender os mecanismos e
processos que geraram essa diversidade é foco constante de pesquisas (e.g. Cracraft 1985,
Mayr e O‟Hara. 1986, Schnitzer e Carson 2001). Frequentemente gradientes abióticos, em
especial o topográfico, são usados para explicar a distribuição dos táxons em escala local em
ambientes tropicais (e.g. Capaverde-Jr et al. 2018; Vasconcelos et al. 2010, Laurance et al.
2010).
O gradiente topográfico na Amazônia Central envolve os gradientes hídrico e de
fertilidade, frequentemente correlacionados a altitude e elevação (Castilho et al. 2006). Uma
das variáveis de fertilidade de solo é a concentração de fósforo (e.g. Quesada et al. 2010,
2012), nutriente escasso nos solos amazônicos da porção central e não correlacionado com a
altitude localmente (Castilho et al. 2006). O fósforo é um elemento essencial biologicamente,
pois é um dos constituintes das moléculas de DNA e ATP (Raaimakers et al. 1995). As
plantas adquirem esse nutriente sobretudo pela decomposição da matéria orgânica de fonte
vegetal, tal como a serrapilheira (Quesada et al. 2012), o que faz do fósforo um nutriente
limitante para as plantas.
A soma de bases é outra variável comumente usada em estudos que relacionam a
distribuição de plantas com a fertilidade do solo (e.g. Tuomisto et al. 1996). Essa variável é a
soma de diversos cátions de macronutrientes, como cálcio, magnésio e potássio. Tais
elementos conferem fertilidade ao solo através do aumento da capacidade de liberação de
outros nutrientes aos quais esses cátions podem se ligar e torná-los absorvíveis pelas plantas
(Ronquim 2010). Assim como o fósforo, esses nutrientes são restituídos no solo pela matéria
orgânica vegetal, produzida majoritariamente por espécies maiores, tais como as árvores
(Paoli and Curran 2007). A soma de bases tem relação positiva com a biomassana Amazônia
(Laurance et al. 1999) e com o gradiente hídrico na Reserva Ducke (Castilho et al. 2006).
Portanto, essa variável está relacionada com outras que constituem o gradiente topográfico na
Amazônia, localmente ou em larga escala.
O gradiente hídrico é frequentemente relacionado à topografia na Amazônia Central e,
mais recentemente, variáveis em escalas mais finas foram criadas para tornar a relação entre
as espécies de plantas e a água mais acurada (veja Rennó et al. 2008). Uma dessas variáveis é

8
a distância vertical até o corpo d‟água mais próximo (HAND – Height Above the Nearest
Drainage), calculada por um algorítmo desenvolvido por Rennó et al. (2008). Esse algoritmo
se baseia no modelo de elevação digital e na Missão Topográfica Radar Shuttle para calcular
valores de HAND a partir da distância vertical entre pontos no terreno e a drenagem mais
próxima. HAND já foi correlacionado com as condições hidrológicas de terrenos e o nível do
lençol freático (Nobre et al. 2011, Rennó et al. 2008), além de ter se mostrado um bom
preditor para a distribuição de espécies vegetais na Reserva Ducke (Schietti et al. 2013).
Apesar do HAND e de outros gradientes já possuírem relações conhecidas com a distribuição
de muitos taxa na Amazônia Central, pouco se sabe sobre a especialização de espécies
vegetais em escala local.
A restrição de ocorrência de uma espécie, frequentemente denominada especialização
de habitat, pode ser caracterizada pela maior ocorrência dessa espécie em um intervalo de um
dado gradiente do que seria o esperado ao acaso (e.g. Mallis e Hurd 2005). Existem diversas
formas de calcular a restrição dos organismos ao longo de um gradiente (Fox e Morrow 1981,
Wilson e Yoshimura 1994, Bolnick et al. 2002, Chazdon et al. 2011, Stireman et al. 2017) e a
maioria usa valores de abundância (e.g. Chazdon et al. 2011, Draper et al. 2019). Mapear o
grau de restrição das espécies ao longo de gradientes pode contribuir para o entendimento dos
mecanismos que moldam a distribuição e ocorrência das espécies localmente (Clark et al.
1999). Medidas de restrição de ocorrência das espécies também são importantes para prever
efeitos de perturbações (e.g. Tylianakis et al. 2007), além de diretamente usadas em ações de
manejo e conservação.
Ecossistemas tropicais são constituídos majoritariamente por espécies infrequentes
(Stevens 1989), fator que impede a investigação confiável da restrição de taxa pouco
abundantes. Neste trabalho, propomos um método para avaliar a restrição de espécies
tropicais, o qual pode ser aplicado a comunidades com muitas espécies pouco frequentes.
Investigamos como os gradientes hídrico e edáfico (nutrientes do solo) afetam a restrição de
ocorrência das espécies de plantas em uma floresta tropical de terra firme. Esperamos que 1.
As formas de vida maiores quanto à biomassa (árvores e trepadeiras) sejam menos restritas
em todos os gradientes, dado que possuem caracteres morfológicos que permitem acessar
água (Nepstad et al. 2007) e nutrientes mais facilmente que as menores (i.e. ervas); 2. As
demais formas de vida (i.e. palmeiras, ervas e arbustos) estejam distribuídas entre esses dois
extremos, não apresentando padrões consistentes de restrição e; 3. Os gradientes de
fertilidade restrinjam mais grupos que o gradiente de água, dado que os solos da Amazônia

9
Central são considerados pobres em nutrientes e a estação seca abrange somente um quarto
do ano, diminuindo o déficit hídrico.

10
OBJETIVOS
Objetivo Geral
Entender como três gradientes ambientais (um hídrico e dois de fertilidade do solo) afetam a
restrição das espécies de plantas de uma floresta de terra firme na Amazônia Central.
Objetivos Específicos
1. Investigar as diferenças na restrição das espécies entre formas de vida para cada um
dos três gradientes (hídrico e de fertilidade do solo) e,
2. Investigar as diferenças na restrição das espécies entre os gradientes (hídrico e de
fertilidade do solo) para cada forma de vida.

11
REFERÊNCIAS
Barlow J., França, F., Gardner T.A., Hicks C.C., Lennox G.D., Berenguer E., Castello L.,
Economo E.P., Ferreira J.M., Guénard B. et al. 2018. The future of hyperdiverse tropical
ecosystems. Nature, 559:517-526.
Bolnick D.I., Yang L.H., Fordyce J.A., Davis J.M. & Svanbäck R. 2002. Measuring
individual‐level resource specialization. Ecology, 83(10):2936-2941.
Capaverde Jr. U.D., Pereira L.G.A., Tavares V.C., Magnusson W.E., Baccaro F.B.,
Bobrowiec P.E.D. 2018. Subtle changes in elevation shift bat-assemblage structure in Central
Amazonia. Biotropica, 50(4):674-683.
Castilho C.V., Magnusson W.E., Araújo R.N.O., Luizão R.C.C., Luizão, F.J., Lima, A.P. &
Higuchi N. 2006. Variation in aboveground tree live biomass in a central Amazonian Forest:
Effects of soil and topography. Forest ecology and management, 234(1):85-96.
Chazdon R.L., Chao A., Colwell R.K., Lin S.Y., Norden N., Letcher S.G., Clark, D.B.,
Finegan, B. & Arroyo, J. P. 2011. A novel statistical method for classifying habitat
generalists and specialists. Ecology, 92(6), 1332-1343.
Clark, D.B., Palmer, M.W. and Clark, D.A., 1999. Edaphic factors and the landscape‐scale
distributions of tropical rain forest trees. Ecology, 80(8), pp.2662-2675.
Costa F.R.C. 2006. Mesoscale Gradients of Herb Richness and Abundance in Central
Amazonia. Biotropica, 38(6):711-717.
Cracraft J. 1985. Historical biogeography and patterns of differentiation within the South
American avifauna: areas of endemisms. Ornithological Monographs, 36: 49-84.
Draper F.D., Gregory P., Asner, E.N., Coronado H., T.R. Baker, García-Villacorta R., Pitman
N.C.A., Fine P.V.A., Phillips O.L., Gómez R.Z. et al. 2019. Dominant tree species drive beta
diversity patterns in Western Amazonia. In press.
Fox L.A. & Morrow P.A. 1981. Specialization: species property or local phenomenon.
Science, 211(4485):887-893.
Guénard B., Weiser M.D., Dunn R.R. 2012. Global models of ant diversity suggest regions
where new discoveries are most likely are under disproportionate deforestation threat.
Proceedings of the National Academy of Sciences, 109(19):7368-7373
Laurance S.G.W., Laurance W.F., Andrade A., Fearnside P.M., Harms K.E., Vicentini A. &
Luizão R.C.C. 2010. Influence of soils and topography on Amazonian tree diversity: a
landscape-scale study. Journal of Vegetation Science, 21:96-106.
Jenkins C.N., Pimm S.L, Joppa L.N. 2013. Global patterns of terrestrial vertebrate diversity
and conservation. Proceedings of the National Academy of Sciences, 110 (28):2602-2610.

12
Kier G., Mutke J., Dinerstein E., Ricketts T.H., Kuper W., Kreft H., Barthlott W. 2005.
Global patterns of plant diversity and floristic knowledge. Journal of Biogeography, 32(7):
1107-1116
Mallis R.E. & Hurd L.E. 2005. Diversity among ground-dwelling spider assemblages: habitat
generalists and specialists. Journal of Arachnology, 33(1):101-109.
Mayr E. & O‟Hara R.J. 1986. The biogeographic evidence supporting the Pleistocene Forest
Refuge Hypothesis. Evolution, 40(1):55-67.
Nepstad, D.C., Tohver, I.M., Ray, D., Moutinho, P., & Cardinot, G. 2007. Mortality of large
trees and lianas following experimental drought in an Amazonf forest. Ecology, 88(9), 2259-
2269.
Nobre A.D., Cuartas L.A., Hodnett M., Rennó C.D., Rodrigues G., Silveira A., Waterloo M.,
Saleska S. 2011. Height above the nearest drainage – a hydrologically relevant new terrain
model. Journal of Hydrology, 404:13-29.
Paoli G.D., Curran L.M. 2007. Soil nutrients limit fine litter production and tree growth in
lowland tropical rain forest of southwestern Borneo. Ecosystems, 10:503–518
Quesada C.A., Lloy J., Anderson L.O., Fyllas N.M., Schwarz M.,Czimczik C.I. 2011. Soils
of Amazonia with particular reference to the RAINFOR sites. Biogeosciences 8:1415–1440.
Quesada C.A., Phillips O.L., Schwarz M., Czimczik C.I., Baker T.R., Patiño S., Fyllas N.M.,
Hodnett M.G., Herrera R., Almeida S., et al. 2012. Basin-wide variations in Amazon forest
structure and function are mediated by both soils and climate. Biogeosciences 9:2203–2246
Raaimakers D., Boot R.G.A., P. Dijkstra, S. Pot & Pons T. 1995. Photosynthetic rates in
relation to leaf phosphorus content in pioneer versus climax tropical rainforest trees.
Oecologia, 102:120-125.
Rennó C.D., Nobre A.D., Cuartas L.A., SoaresJ.V., Hodnett M.G., Tomasella J., Waterloo
M.J. 2008. HAND, a new terrain descriptor using SRTM-DEM: Mapping terra-firme
rainforest environments in Amazonia. Remote Sensing of Environment 112:3469–3481.
Ronquim, C.C. 2010. Conceitos de fertilidade do solo e manejo adequado para as regiões
tropicais. Campinas, São Paulo: Embrapa Monitoramento por Satélite.
Schietti J., Emilio T., Rennó C.D., Drucker D.P., Costa F.R., Nogueira A., Baccaro F.B.,
Figueiredo F., Castilho C.V., Kinupp V., Guillaumet J.L., Garcia A.R.M., Lima A.P. &
Magnusson W.E. 2014. Vertical distance from drainage drives floristic composition changes
in an Amazonian rainforest. Plant Ecology & Diversity, 7(1-2):241-253.
Stevens G.C.1989. The latitudinal gradient in geographical range: how so many species
coexist in the tropics. The American Naturalist, 133(2):240-256.
Schnitzer S.A. & Carson W.P. 2001. Treefall gaps and the maintenance of species diversity
in a tropical forest. Ecology, 82(4):913-919

13
Stireman, J.O. III, Dyer, L.A., and Greeney, H.F. 2017. Specialized generalists? Food web
structure of a tropical tachinid-caterpillar community. Insect Conservation and Diversity,
10:367-384.
Tuomisto H., Poulsen A.D. 1996. Influence of edaphic specialization on pteridophyte
distribution in neotropical rain forests. Journal of Biogeography, 23:283–293.
Tylianakis, J. M., Tscharntke, T., & Lewis, O. T. 2007. Habitat modification alters the
structure of tropical host–parasitoid food webs. Nature, 445(7124), 202.
Vasconcelos H.L., Vilhena J.M.S., Facure K.G., Albernaz A.L.K.M. 2010. Patterns of ant
species diversity and turnover across 2000 km of Amazonian floodplain forest. Journal of
Biogeography, 37:432-440.
Whitmore T.C. 1997. Tropical forest disturbance, disappearance, and species loss. Pages 3-12
in W.F. Laurance and R.O. Bierregaard Jr., editors. Tropical forest remnants: ecology,
management, and conservation of fragmented communities. University of Chicago Press,
Chicago, Illinois, USA.
Wilson D.S. & Yoshimura J. 1994. On the coexistence of specialists and generalists. The
American Naturalist, 144(4):692-707.

14
CAPÍTULO ÚNICO
Bôlla, D.A.S., W. E. Magnusson, A. Nogueira, F. R. C. Costa, J. Schietti, C. V. de Castilho,
A. R. M. Garcia, V. F. Kinupp, A. P. Lima, C. S. Dambros, F. B. Baccaro. Water-table level
is a better predictor than nutrients of vascular plant assemblages in an Amazonian terra-firme
forest. Manuscrito formatado para Ecology.

15
Water-table level is a better predictor than nutrients of vascular plant assemblages in 1
an Amazonian terra-firme forest 2
3
Daniela A. S. Bôlla1, William E. Magnusson
1, Anselmo Nogueira
2, Carolina V. de Castilho
3, 4
Flávia R. C. Costa1, Cristian de S. Dambros
4, Ana Raquel de M. Garcia
1, Valdely F. Kinupp
5, 5
Albertina P. Lima1, Juliana Schietti
1, Fabricio B. Baccaro
1,6,7 6
7 1
Programa de Pós-Graduação em Ecologia, Instituto Nacional de Pesquisas da Amazônia – 8
INPA, Manaus, Brazil 9
2 Centro de Ciências Naturais e Humanas, Universidade Federal do ABC, São Bernardo do 10
Campo, Brazil 11
3 Centro de Pesquisa Agroflorestal de Roraima, Empresa Brasileira de Pesquisa Agropecuária 12
– EMBRAPA, Boa Vista, Brazil 13
4 Departamento de Ecologia e Evolução, Universidade Federal de Santa Maria, Santa Maria, 14
Brazil 15
5 Instituto Federal de Educação, Ciência e Tecnologia do Amazonas, campus Manaus-Zona 16
Leste (IFAM-CMZL), Manaus, Brazil 17
6 Programa de Pós-Graduação em Zoologia, Universidade Federal do Amazonas (UFAM), 18
Manaus, Brazil 19
7 Departamento de Biologia, Universidade Federal do Amazonas (UFAM), Manaus, Brazil 20
21
22
23
24
25

16
ABSTRACT 26
27
Many species can co-occur in the same habitat, but species-habitat association can be tighter 28
or looser depending on the gradient effect in species performance. This association 29
commonly leads to ecological specialization that, in plants, involves abiotic factors such as 30
nutrients, water availability and light. Here we investigated how hydric (Height above the 31
nearest drainage - HAND) and fertility (phosphorus content and the sum of K+, Ca2+ and 32
Mg2+) gradients constrain the distribution of plant species from six life forms in a tropical 33
forest in the Central Amazon. We hypothesized that life forms with greater biomass would be 34
less specialized based on root depth and span and nutrients would constrain more species than 35
water since the soils are poor. We estimated the specialization by comparing the observed 36
values of occurrence along the gradients, with distribution expected by the null model for 37
each species. To compare gradients and life forms, we calculated the standard effect size 38
(SES) of each species for each gradient. We used SES as the dependent variable in two 39
GLMMs. In the first, we compared the SES values for each gradient (dependent variable) 40
between life forms (independent variable). In the second GLMM we compared the SES 41
values of each life form (dependent variable) among the 3 gradients (independent variables). 42
In both models the family was declared as a random variable to control the number of species 43
among life forms. Water constrained more species, mainly ferns,than fertility. The 44
phosphorus gradient constrained more species than bases, but constrained both lianas and 45
palms the most. Although nutrients have always been considered the greatest determinant of 46
plant species distribution in the Amazon, HAND may have the same or even more important 47
at mesoscale. Also, life forms may respond differently tothe edaphic gradients 48
analyzed,depending on the scale and not necessarily following a pattern based on root depth. 49

17
KEY WORDS: ecological specialization; habitat specificity; community ecology; standard 50
effect size; Central Amazon; life forms; soil fertility; height above the nearest drainage; 51
phosphorus; sum of bases. 52

18
INTRODUCTION 53
54
Spatial structure in ecological communities can be driven by dispersal processes, 55
mortality rates, social behavior and environmental heterogeneity (Hubbell 2000, Soininen 56
2016). Habitat heterogeneity encompasses the individual‟s needs, such as breeding and food 57
resources, and the abiotic conditions it can thrive (Futuyma and Moreno 1988). These needs 58
and tolerances lead their species to an environmentally induced spatial dependence (Cottenie 59
2005, Peres-Neto and Legendre 2010) that can result in an ecological specialization to certain 60
levels of resources and environmental conditions (Forister et al. 2012). 61
Specialization, and habitat specialization, is a framework of measures and concepts 62
constantly redefined in ecological literature (Ferry-Graham et al. 2002, Devictor et al. 2010). 63
The niche concept of Grinnell (1917) considers a species‟ responses to a specific set of 64
variables (e.g. resources). Other specialization measures make use of the niche concept 65
(MacArthur 1972) that accounts for evolutionary trade-offs between the exploitation of 66
various resources and the use of a limited subset (the hypothesis of the “jack-of-all-trades, 67
master of none”). Low abundance or absence of a species at some point in the gradient may 68
indicate that it has poor capacity to deal with those resource values (see Draper et al. 2019). 69
Different species can co-occur in the same habitat, but the effect of each local resource on 70
plant performance varies among species, resulting in tighter or looser associations to the 71
habitat (Whittaker 1972). 72
Vagile taxa, such as most animals, use various strategies to maximize foraging 73
andimproved dispersion, decreasing the impact of habitat heterogeneity on their survival 74
(Brown 1999). Sessile organisms can be more constrained by resource limitation and 75
competition, because low dispersal rates increase compositional differences among sites 76
(Amarasekare and Nisbet 2001), leading to a stronger association with the environment (De 77
Bie et al. 2012). Terrestrial plants disperse only reproductive material and rely mainly on 78

19
abiotic factors, such as light, nutrients and water from the soil (Connell 1978), and are more 79
likely to be constrained by the environment than other taxa because they are less affected by 80
the homogenizing effect of dispersal (Leiboldet al. 2004). Therefore, terrestrial plants may 81
show specialization over a variety of gradients. 82
Vascular plant communities are known to be associated with elevational gradients 83
(Stevens 1992, Clark et al. 1995, Bachman et al. 2004, Brunn et al. 2006), especially in 84
tropical systems (Lieberman et al. 1985, Tuomisto and Poulsen 2000, Vormisto et al. 2004, 85
Costa et al. 2009). Elevational gradients are commonly used as surrogates of other important 86
variables, such as soil fertility and water. Depending on terrain elevation, hydrological 87
conditions segregate species distributions by their capacity to deal with drier or wetter areas 88
(Silvertown 1999, Tuomisto and Poulsen 2000, Rodriguez-Iturbe 2000, Costa et al. 2005, 89
2009). Habitat heterogeneity created by seasonal droughts and floods (Arshad et al. 1996, 90
Ferry et al. 2010) can confine species that are unable to deal with stress caused by drier soils 91
inhigher areas (Costa et al. 2005, 2008) and species unable to withstand the waterlogging, 92
and consequent anoxia in lower areas (Piedade et al. 2010). 93
In the Amazon, the elevational gradient is highly related to edaphic variation 94
(Quesada et al. 2012). In the Peruvian Amazon (Western portion) soils in lower areas have 95
high clay and nutrient content, and sandy soils in higher areas are poor in nutrients (Vormisto 96
et al. 2000). This pattern is reversed in Central Amazonia, where clayey soils on plateaus are 97
richer in nutrients and poorer sandy soils are confined to the valleys (Castilho et al. 2006). 98
Soils in central Amazonia are relatively old (Fittkau 1971, Quesada et al. 2012) and 99
weathering has resulted in the loss of many nutrients, such as phosphorus and base cations 100
(Walker and Syers, 1976). Phosphorous is generally thought to be the most limiting nutrient 101
for primary production, as it is essential in photosynthesis, and in structuring ATP and DNA 102
molecules (see Raaimakers et al. 1995). While phosphorus is not correlated with some 103

20
altitudinal gradients, the sum of base cations is highly correlated with altitude, soil pH and 104
water, being locally more abundant in clay soils of higher areas in the Central Amazon 105
(Castilho et al. 2006). Valleys normally have more available water than higher areas, where 106
the water table is deeper (Daws et al. 2002, Brown et al. 2004). Nevertheless, because of 107
local geomorphological arrangements, even high-altitude areas far from streams in 108
cartographic distance can be close to the water table in the Central Amazon (Rennó et al. 109
2008, Schietti et al. 2013). Although many associations between plant communities and 110
abiotic gradients have been documented in the Amazon, it remains unclear to what extent 111
fertility and water availability constrain plant-species distributions. 112
Different plant life forms may differ in sensitivity to resource gradients due to their 113
different dispersal modes (Costa et al. 2005, Zuquim et al. 2019). Also, functional or 114
taxonomic groups are frequently used as environmental indicators or predictor of other plant 115
groups (see Landeiro et al. 2012 and Zuquim et al. 2014, 2019) though differences in 116
specialization between life forms are rarely compared. Here, we investigated how hydric and 117
fertility gradients constrain the distribution of vascular plant communities in a lowland 118
tropical forest at a mesoscale (1-100 km²). We also identified the most specialized life form 119
in each of the gradients, as well as the most constraining gradient for each life form, as these 120
indices can be used to explore different facets of species specialization (Forister et al. 2012). 121
We hypothesized that trees and lianas would be more generalists than other taxa because they 122
have greater root depth and span (Nepstad et al. 2007, Saleska et al. 2007, Metcalfe et al. 123
2008). A greater distribution of roots (Lynch 1995) may allow trees to access deeper soil 124
horizons than shallow-rooted plants, giving them greater access to available water (Nepstad 125
et al. 2007) and soil nutrients. Because herbs are generally shallow-rooted and have short life 126
spans, we hypothesized that they would be proportionally more specialist species. We 127
expected the other groups to be spread in the interval between these extremes because they 128

21
are generally considered to be intermediate in root depth and span. Additionally, we expected 129
that fertility gradients would constrain more groups than water availability, because soils in 130
the Central Amazon are poor in nutrients and precipitation seasonality is less marked than 131
other tropical regions. 132

22
METHODS 133
Study Area 134
Ducke Reserve is located north the city of Manaus (2º55‟ 47.80‟‟S; 59º58‟ 30.34‟‟W 135
at the reserve headquarters), in the Brazilian Amazon (Fig. 1). The Reserve covers 100 km² 136
of lowland evergreen tropical forest with a 30-37 m closed canopy and emergent trees 137
reaching more than 40 m (Ribeiro et al. 1999). A survey system in a grid format covering 64 138
km² with 72 permanent plots at least 1 km distant from each other and from the Reserve 139
border was installed in the area in 2000. Surveys were made along the entire length of the 140
250-m long plot center line in each plot (Costa and Magnusson 2010). The plots are regularly 141
spaced and the center lines follow topographic contour lines in order to minimize within-plot 142
edaphic variation, which varies with altitude (Chauvel and Boulet., 1987, Costa et al. 2005). 143
The topography is representative of that found in Central-Amazonian lowland forests 144
(30-120 m a.s.l.) and three zones have been distinguished: plateaus, valleys and slopes (Fig. 145
1). The plateaus are mostly composed by Oxisols (allic yellow latosols in the Brazilian 146
classification system), which are richer in nutrients and clay content. The valleys have 147
spodosols (Chauvel and Boulet 1987, Bravard and Righi 1989) that are sandy, poorer in 148
nutrients and strongly leached in the surface layer. The slopes are generally intermediate 149
between plateaus and valleys, with ultisols (podzol in the Brazilian classification system). In 150
general, all the soils are acidic and poor in essential nutrients, such as phosphorus and 151
potassium (Chauvel and Boulet 1987, Bravard and Righi 1989). 152
The Reserve has a dense network of streams; eastern streams flow to the Amazon 153
River and those in the western drainage to the Negro River. The streams are of first to third 154
order, some up to 10 m wide. The vertical distance to the nearest drainage in the 72 plots 155
ranges from 1-53 m (Schietti et al. 2013). The Reserve is not under direct influence of large 156

23
rivers overflow , but the valleys may be waterlogged for a few hours in the rainy season due 157
to their proximity to the water table. 158
The annual means of temperature and rainfall at the Reserve, both measured between 159
the years of 1965 and 1980, were 26ºC and ca. 2400 mm, respectively. Mean monthly rainfall 160
reach a minimum in August with less than 100 mm and a maximum in March with about 350 161
mm (Marques-Filho et al. 1981). The dry season occurs from July to September when 162
monthly rainfall is lower than 100 mm (Marques-Filho et al. 1981). 163
Floristic data 164
Many studies investigating floristic inventories have been done at Ducke Reserve, 165
each focusing on one life form. We compiled six datasets from trees, shrubs, lianas, palms, 166
non-fern herbs and ferns (Kinupp and Magnusson 2005, Costa et al. 2005, 2009, Castilho et 167
al. 2006, Nogueira et al. 2006). Some samples were taken in all 72 uniformly-distibuted plots 168
inthe Reserve, but only 22 plots were sampled for all life forms (Appendix S1: Figure S1). 169
The sampling period differed among these studies, ranging from 2001 for herbs and ferns to 170
2006 for lianas. Details on the sampling protocols can be found in Schietti et al. (2013). 171
Environmental data 172
We used soil fertility and soil-water availability to calculate habitat specialization. We 173
used phosphorus and sum of bases (the sum of K+, Ca
2+ and Mg
2+) as fertility measures, since 174
P is the most critical nutrient determining plant growth (Quesada et al. 2012) and the sum of 175
bases is strongly related to both regional and local plant diversity (Clark et al. 1995, Vormisto 176
et al. 2004, Castilho et al. 2006, John et al. 2007, Costa et al. 2009). The soil was sampled 5 177
cm deep in six points along the plot axis every 50 m. These samples were bulked into a single 178
composite sample per plot and cleaned of roots and detritus, air-dried and sieved through a 2 179
mm mesh. After that, the soil samples were chemically analyzed for the nutrients at the Soil 180
Laboratory of EMBRAPA-Manaus (see EMBRAPA, 1997 and Castilho et al. 2006). 181

24
Height above the nearest Drainage (HAND) is defined here as the vertical relative 182
draining potential, which may reflect the amount of water available to plant roots (Schietti et 183
al. 2013). The HAND algorithm used was developed by Rennó et al. (2008), which uses the 184
vertical distance between points on the terrain and the closest drainage, based on a digital 185
elevation model. Under the gravitational potential, water can infiltrate the soil or moves 186
downhill on the surface when soil is waterlogged, flowing to a stream. The algorithm 187
measures the water net capacity to drain from an elevated position to the nearest drainage 188
channel (Nobre et al. 2011). High HAND values mean greater draining potential and low 189
HAND values mean proximity to the water table, frequently causing short-term waterlogging, 190
especially after heavy rains. More details on the HAND calculation can be found in Nobre et 191
al. (2011) and Rennó et al. (2008) for the Amazon and Schietti et al. (2013) for its validation 192
at Ducke Reserve. 193
194
Data analysis 195
We calculated habitat specialization separately for three different abiotic gradients in 196
the Ducke Reserve. Concentration (mg. kg-1
) of phosphorus and sum of bases were used as 197
fertility gradients and HAND (meters above ground) as a proxy of soil-water availability. 198
The concept of habitat specialization is frequently related to the range of some 199
resource or environmental variable, such as soil fertility, water availability or hosts for 200
parasites, in which the species occur (e.g. Prudic et al. 2005, Costa et al. 2005). As the 201
number of occupied sites increases, the range of the environmental variables where a given 202
species occurs also increases (Brown 1984). Therefore, independent of habitat specificity, 203
more occurrences in different sites would mean greater habitat occupation (Clark et al. 1999). 204
To account for this relationship, we defined habitat specialization as the occurrence of a 205
species in a narrower range in a given gradient than expected by chance. We used a 206

25
resampling procedure to determine the variation in habitat variables expected to be found in 207
occupied sites when the null hypothesis (no habitat specificity) was true (Kinupp and 208
Magnusson 2005). For each species, we randomly sampled the survey sites and determined 209
the weighted standard deviations of phosphorus (WSDP), sum of bases (WSDB) and HAND 210
(WSDH).The standard deviation was weighted by the number of individuals sampled in plots. 211
We only considered species that occured in three or more plots. Even though all Ducke 212
Reserve sites could potentially harbor all life forms of our dataset, life forms were collected 213
at different numbers of sites. Therefore, we opted for a more conservative view, randomly 214
sampling the abundances of species only in the sites that the given life form was surveyed. 215
This process was repeated 999 times for each species. 216
We used the Standard Effect Size (SES) (Gotelli and McCabe 2002) as a measure of 217
the Ecological Specialization for each species in each gradient. The Ecological Specialization 218
(SES) measures the weighted standard deviations of the observed values that are above or 219
below the weighted standard deviations of the null model (i.e. simulated community data): 220
221
𝐸𝑆 (𝑆𝐸𝑆) =𝑊𝑠𝑑𝑜𝑏𝑠 − 𝑊𝑠𝑑𝑛𝑢𝑙𝑙
𝜎𝑊𝑠𝑑 𝑛𝑢𝑙𝑙
, 222
223
where Wsdobs corresponds to the weighted standard deviation calculated from the observed 224
data, Wsdnull corresponds to the mean of the weighted standard deviations calculated by the 225
randomization and σWsdnull corresponds to the standard deviation of the null weighted 226
standard deviations. Values of zero indicate no differences between observed distribution of 227
plant species and null models, while positive and negative values mean indicate that species 228
are less or more specialized than expected by chance, respectively. Species with positive and 229
zero SES values were considered generalists and negative SES values indicate specialist 230
26
species. Three Ecological Specialization (SES) values were obtained per species: one for 231
each of abiotic gradients investigated. 232
We fitted a generalized linear mixed model (GLMM) using the ES (SES) per species 233
for each gradient as dependent variable and life forms (trees, shrubs, lianas, palms, non-fern 234
herbs and ferns) as independent variable, since these groups are consistent in life history, 235
phylogeny and biology. We also compared the SES values of each life form among the 3 236
gradients. In both models the family was declared as a random variable to control the number 237
of species among life forms, since the number of taxa differs greatly among life forms (e.g. 238
trees correspond to 81% of all species). We also conducted post-hoc tests to compare the 239
Ecological Specialization (SES) between life forms using “single step” adjustment for P-240
values (Bretz et al. 2010). We calculated P-values for each species using 𝑊𝑠𝑑𝑜𝑏𝑠 and 241
𝑊𝑠𝑑𝑛𝑢𝑙𝑙 to assess the proportion of each life form was more different than expected by 242
chance. GLMM models were created with the lme4 package (Bates et al., 2015), and graphed 243
using ggplot2 (Wickham 2016) package in R (R core team 2018). 244
245

27
RESULTS 246
247
The Ecological Specialization (SES) was calculated for 723 trees, 32 shrubs, 28 248
lianas, 32 palms, 47 non-fern herbs and 16 ferns, totaling 875 species or morphospecies of 249
vascular plants. These species were distributed in plots where the gradients of HAND varied 250
from 1.44 to 52.4m, the sum of bases from 0.021 to 1.04 cmol/kg and phosphorus from 1 to 251
12 cmol/kg. 252
Considering plant species of all life forms, 65.71 % of species were more specialized 253
than expected by chance (p<0.05) in at least one abiotic gradient. HAND gradient, followed 254
by sum of bases and phosphorus, had a higher number of specialist species with 23.2 % of 255
specialist plant species. The sum of bases gradient had 21.48 % and phosphorus gradient 256
21.03 % of more specialized species. 257
There was a difference in the degree of specialization of plant species between plant 258
life forms (Fig. 2). For the HAND gradient, ferns and lianas species had on average the 259
lowest negative values of SES, while herbs and trees had the highest values (Fig. 2A). Ferns 260
were the most constrained life form by HAND gradient, differing from less constrained life 261
forms like herbs and trees (Fig. 2A). For the sum of bases gradient, lianas and palms had the 262
lowest values of SES, differing only from ferns that had the highest values of SES (Fig. 2B). 263
Similar to HAND gradient, differences among life forms in SES values were subtle in the 264
sum of bases gradient (Fig. 2B). For the phosphorus gradient, fern and shrub species had 265
smaller values of SES than herbs and trees, but there were no clear groups among life forms 266
(Fig. 2C). Ferns and herbs had higher values along the phosphorus gradient, with herbs 267
differing from all other groups except ferns. On average, lianas and palms seem to be the 268
most specialized life forms along this gradient (Fig. 2C). 269
There was a difference in the degree of specialization of plant species in each plant 270
life form among gradients (Fig. 3). For ferns, all species were specialized in the HAND 271

28
gradient (SES<0), with less specialized species in the sum of bases, and almost none species 272
specialized in the phosphorus gradient (Fig. 3A). The degree of specialization of fern species 273
differed substantially among the three gradients (F = 12.1, N = 10 , p<0.001). To all other life 274
forms, HAND had proportionally more specialist species, followed by phosphorus and bases. 275
Sum of bases had SES values centered at zero for most life form species with on average few 276
specialized species (Fig. 3B-F). For herbs, HAND gradient had a higher number of species 277
with low values of SES, differing from the other two gradients (F = 7.7, N = 20, p=0.001) 278
(Fig. 3B). Lianas (F = 2.3, N = 20, p=0.10) and palms (F = 3.25, N = 22, p=0.04) had no 279
differences among gradients (Fig. 3C-D). For shrubs, only sum of bases differed from HAND 280
and phosphorus (F = 9.7, N = 24, p<0.001) (Fig. 3E). For trees, the degree of specialization 281
of species differed among the three gradients (F = 57.0, N = 489, p<0.001). 282
283

29
DISCUSSION 284
285
Nutrients availability have been considered the most important factor determining the 286
distribution of Amazonian plant species (e.g. Young and Leon 1989, Nasto et al. 2017). 287
However, more recently, new ways to measure soil-water availability in larger scales (Rennó 288
et al. 2008) allowed a better investigation of its relation with plant diversity patterns (e.g. 289
Moulatlet et al. 2014, Schietti et al. 2013). We found that water (HAND) and fertility 290
gradients constrain species in similar ways but, on average, water gradient seems to be more 291
important to determine the ecological specialization of species. Water availability constrained 292
ferns and lianas the most, while sum of bases and phosphorus constrained on average more 293
species of lianas and palms. The ecological specificity was higher than expected by chance in 294
more than half of all life forms‟ species, but for ferns, all species were specialists in the water 295
gradient. In summary, liana and palm species formed a group specialized in the fertility 296
gradients, while water was more important to ferns, and also to a certain point to lianas. 297
Lianas had a greater proportion of species specialized in both water and nutrient gradients, 298
reinforcing their role as good predictors of other-taxa diversity (Landeiro et al. 2012). 299
Contrary to our hypothesis, that in general vascular plants would be strongly 300
constrained by nutrients, the hydrological gradient generated more specialism than fertility. 301
Species of all life forms tended to have narrow tolerances (WSDH) along hydrological 302
gradient than expected by chance. Schietti et al. (2013) found that each life-form assemblage 303
composition had different HAND thresholds mainly associated with slopes, which are 304
transitional areas between plateaus and valleys. Our data suggest that water may be the most 305
limiting factor for most of life forms, but we are unable to discern if this pattern emerges 306
from low tolerance to drought or to waterlogging. 307
High biomass life forms as trees, that corresponds to 82.6% of all species analyzed, 308
were relatively more specialized in the fertility gradient as we hypothesized, while in general 309

30
other life forms were more specialized in the hidrological gradient. Plant species fill very 310
similar niches (Gentry 1988) and generally acquire the resources by similar ways (Aarssen 311
and Epp 1990, Goldberg and Barton 1992, Gurevitch et al. 1992), therefore, interspecific 312
competition should be an important mechanism to promote coexistence in most plant 313
communities (Silvertown 2004), specially trees and lianas in the Amazon. Since plants niche 314
are related mainly to local resource availability promoting plant growth like light, nutrients 315
and water gradients, two of the most important axes of a species' niche are accounted for by 316
the habitat specialization we measured. Coexistence of trees may be more dependent more on 317
how the use of those resources mediates competition (MacArthur and Levins 1967) and how 318
the competition leads to a predictable non-random co-occurence pattern in trees (Diamond 319
1975, Silvertown 2004, Nasto et al. 2017), instead of the pure increased access to soil 320
nutrients by root span (Nepstad et al. 2007). 321
At a mesoscale, shallow-rooted life forms as ferns had more restricted distributions 322
along the HAND gradient. Since life forms differ in root span (Becker and Castillo 1990, 323
Nepstad et al. 1994, Lynch 1995, Restom and Nepstad 2004, Ramos et al. 2009) and drought 324
tolerance (Engelbrecht et al. 2007, Nepstad et al. 2007), the depletion of water availability in 325
superficial soil layers may induce mortality of shallow-rooted plants (Nepsted et al. 2007) 326
and prevent the sexual reproduction of ferns that depend on free water to complete their life 327
cycle (Page 2002). On the other hand, species with roots that do not tolerate anoxic 328
conditions may not occupy areas under seasonal flooding or frequently water-logged soils 329
(Piedade et al. 2010). 330
At fine-scales, the composition of herb and fern assemblages changes according to the 331
horizontal distance from streams (Drucker et al., 2008). Therefore, areas with low HAND 332
values near stream edges may harbor more herbaceous species than most plateaus at higher 333
elevation, and ferns be constrained to this portion of the water gradient. Competition between 334

31
herbaceous plants could be higher at lower areas intensifying ecological specialization (Costa 335
et al. 2005) since soil-water availability may enhance niche partitioning in tropical forests 336
(Engelbrecht et al. 2007 for tree species). Morphological and physiological traits related to 337
rooting systems probably enable the largest or the smallest life forms to colonize only one of 338
the HAND gradient extremes. 339
Liana was the second most specialized life form in the water gradient, even though 340
lianas have deep roots as trees (Nepstad et al. 2004) and high dispersal capacity (Macía et al. 341
2007). Several lianas species grow mainly during the dry season (Schnitzer and Heijden 342
2019), at larger scales, are more specious and abundant where droughts are pronounced 343
(Schnitzer, 2005). About three fourth of all individuals of the five most specialized species 344
are distributed in plots where HAND values are under five meters (maximum HAND value in 345
lianas plots = 45 m - data not shown). Therefore, specialization of lianas may be caused by 346
their growth requirements of greater amounts of water from the soil during dry seasons. 347
Most palms constituted the second most specialized life form in fertility gradients. 348
Lianas and palms were the most environmental and spatial congruent groups at the Ducke 349
Reserve (Landeiro et al. 2012). Costa et al. (2009), also working at Ducke, showed that palm 350
composition is associated with clay content and distance to the nearest water course, 351
evidencing soil texture as an important environmental factor to those populations. On the 352
other hand, bases content explained seven per cent of the variance in palm composition, while 353
distance from streams at lower areas explained 43%, at the same study. These results are in 354
accordance with ours: Palms and lianas are more restricted by soil nutrients, making fertility 355
a stronger generator of specialism than water. 356
Several lianas, palms and shrubs were more specialized than expected by chance along 357
the phosphorus gradient. This nutrient is an important axis in most plant niches due to its 358
major role in vegetative growth – wood density, litter production and forest growth rates 359
32
(Paoli and Curran 2007, Quesada et al. 2010) – and to the limitation of primary production at 360
community level caused by its deficiency (Quesada et al. 2009). Lianas and shrubs may be 361
the most important groups to contribute to primary production after trees, estimated to be 362
about 10% of the tree biomass increment for tropical forests (Clark et al. 2001). Most of high 363
biomass species may have evolved narrower niches by competition to optimize phosphorus 364
absorption in each part of the edaphic range. However, future investigations on plant 365
specialism would shed light on the width of the edaphic gradients each species occupies in 366
tropical forests. 367
Ferns and Angiosperm herbs were similarly associated to soil gradients in studies 368
comparing different functional groups (Tuomisto and Ruokolainen 1994, Vormisto et al. 369
2000, Costa et al. 2005). These life forms showed different degrees of specialization to the 370
fertility gradient in our study: Ferns were more specialized in HAND; while herbs were more 371
specialized in the sum of bases, but not on phosphorus. However, when gradients are 372
compared within each life form, water was more constraining than phosphorus and bases for 373
both life forms, and bases was more constraining in herbs than in ferns. 374
The generalism of ferns and herbs in sum of bases may be associated with the gradient 375
range, since large scale patterns of specialization may not be detected in mesoscale. Sum of 376
bases were considered a strong predictor of fern distribution at the Brazilian Amazon scale 377
(Zuquim et al 2014). Most fern species have small range of tolerance in the bases gradient 378
(0.1 – 1 cmol/kg from a total range of 0,1 – 50 cmol/kg) (Moulatlet et al. 2017). Except of 379
one plot analyzed in this study, the range of sum of bases varies from 0,02 to ~0.6 cmol/kg, 380
indicating the edaphic gradient at Ducke is not wide enough to evaluate broad-scale 381
specialization in ferns and, also may underestimate the tolerances of other life forms. 382
Nutrient and water gradients are known for creating opposite patterns on fern 383
distribution and specialization regarding to scales (see Costa et al. 2005, Schietti et al. 2013 384
33
and Zuquim et al. 2014). Therefore, based on other studies and on our own results, we 385
suggest that the adequacy of scale size may increase linearly with life form biomass to test 386
the influence of water gradients and decrease linearly to test the influence of fertility 387
gradients in the Amazon basin. 388
Even though mesoscales are very useful for ecological studies (e.g. ter Steege et al. 389
1993, Tuomisto and Ruokolainen 1994, Clark et al. 1999, Vormisto et al. 2000, Svenning et 390
al. 2004, Vormisto, Tuomisto and Oksanen 2004) and of utmost importance to define land 391
management (Costa et al. 2009), we still know relatively little about processes operating at 392
this scale. For instance, processes affecting species distribution may change in importance 393
when we scale down from region/landscape to mesoscale (Jones et al. 2006, Costa et al. 394
2009), as gradients depend on the scale to have distinguishable patterns. At larger scales, 395
nutrients may be strong predictor of plant species diversity, but our results suggests that at 396
mesoscale, the water availability may be more important for species distribution (see Bruun 397
et al. 2006 for altitude and topography in alpine assemblages and Drucker et al. 2008 for 398
stream‟s distance in tropical herb assemblages). 399
Specialization, as we measured, seems to be a good approach to understand the 400
environmentally induced tolerance of plants at mesoscale. Even though small ranges of 401
edaphic gradients may not account for the differences in specialization of widespread species, 402
we found consistent habitat specificity combining predicted to observed data in a unique 403
measure for both gradient types – hydrological and nutritional resources to vascular plants. 404
Soil fertility, mainly phosphorus, have always been thought of as the most important 405
predictor for plant distribution in tropical forests (Jordan and Herrera 1981). However, water-406
table level may better distinguish patterns of specialism among species with lower biomass, 407
as ferns and herbs. In a similar way, phosphorus may be a better predictor for higher biomass 408
life forms, as trees and lianas, and water may be a general predictor for habitat specificity in 409
34
the Amazon – even at regional scales (Moulatlet et al. 2014). We believe that the 410
investigation of habitat specifity in other scales, using this same approach, would enrich the 411
knowledge about how the environment limit the distribution of rare and widespread species 412
in the Amazon Basin. 413
ACKNOWLEDGEMENTS 414
415
We thank Pedro A. L. P. Pequeno for the valuable discussions and ideas, Afonso J. Pereira 416
for the help with the maps, and CNPq for the master scholarship awarded to D.A.S. Bôlla. 417
418

35
LITERATURE CITED 419
420
Aarssen, L. W., and G. A. Epp. 1990. Neighbour manipulations in natural vegetation a 421
review. Journal of Vegetation Science 1:13–30. 422
423
Amarasekare, P. and R.M. Nisbet. 2001. Spatial heterogeneity, source–sink dynamics and the 424
local coexistence of competing species. American Naturalist 164:572–584. 425
426
Arshad, M. A., B. Lowery, and B. Grossman,. 1996. Physical Tests for Monitoring Soil 427
Quality. In:Doran, J.W. and Jones, A.J., Eds., Methods for Assessing Soil Quality, Soil 428
Science Society of America, Madison, 123–142. 429
430
Bachman, S., W. J. Baker, N. Brummitt, J. Dransfield, and J. Moat. 2004. Elevational 431
gradients, area and tropical island diversity:an example from the palms of New Guinea. 432
Ecography 27:299–310. 433
Bates, D., M. Mächler, B. M. Bolker, and S. C. Walker. 2015. Fitting Linear Mixed–Effects 434
Models Using lme4. Journal of Statistical Software. URL http://lme4.r-forge.r-project.org/. 435
Becker, P., and A. Castillo. 1990. Root Architecture of Shrubs and Saplings in the 436
Understory of a Tropical Moist Forest in Lowland Panama. Biotropica 22:242–249. 437
438
Bravard, S., and D. Righi. 1989. Geochemical Differences in an Oxisol–Spodosol 439
Toposequence of Amazonia, Brazil. Geoderma 44:29–42. 440
441
Bretz, F., T. Hothorn, and P. Westfall. 2010. Multiple Comparisons Using R, CRC Press, 442
Boca Raton. 443

36
444
Brown, J. S. 1989. Desert rodent community structure:a test of four mechanisms of 445
coexistence. Ecological Monographs 59:1–20. 446
447
Brown, J. H. 2004. Toward a metabolic theory of ecology. Ecology 85:1771–1789. 448
449
Bruun, H. H., J. Moen, R. Virtanen, J. A. Grytnes, L. Oksanen, and A. Angerbjörn. 2006. 450
Effects of altitude and topography on species richness of vascular plants, bryophytes and 451
lichens in alpine communities. Journal of Vegetation Science 17:37–46. 452
453
Castilho, C. V., W. E. Magnusson, R. N. O. Araújo, R. C. C. Luizão, F. J. Luizão, A. P. 454
Lima, and N. Higuchi. 2006. Variation in aboveground tree live biomass in a central 455
Amazonian Forest: Effects of soil and topography. Forest Ecology and Management 234:85–456
96. 457
458
Chauvel, A., Y. Lucas, and R. Boulet. 1987. On the genesis of the soil mantle of the region of 459
Manaus, Central Amazonia, Brazil. Experientia 43:234–242. 460
461
Clark, D. A. M, S. Brown, D. W. Kicklighter, J. Q. Chambers, J. R.Thomlison, J. Ni, and E. 462
A. Holland. 2001. Net primary production in tropical forests: an evaluation and synthesis of 463
existing field data. Ecological Applications 11:371–384. 464
465
Clark, D. A., D. B. Clark, M. R. Sondoval, and M. V. Castro. 1995. Edaphic and Human 466
Effects on Landscape–Scale Distributions of Tropical Rain Forest Palms. Ecology, 76:258–467
2594. 468

37
469
Clark, D. A., M. W. Palmer, and D. B. Clark. 1999. Edaphic factors and the landscape–scale 470
distributions of tropical rain forest trees. Ecology 80:2662–2675. 471
472
Connell, J. H. 1978. Diversity in Tropical Rain Forests and Coral Reefs. Science 199:1302–473
1310. 474
475
Costa, F. R. C., and W. E. Magnusson. 2010. The need for large–scale, integrated studies of 476
biodiversity:the experience of the Program for Biodiversity Research in Brazilian 477
Amazonia. Natureza & Conservação 8:3–10. 478
479
Costa, F. R. C., J. L. Guillaumet, A. P. Lima, and O. S. Pereira. 2009. Gradients within 480
gradients:The mesoscale distribution patterns of palms in a central Amazonian forest. Journal 481
of Vegetation Science 20:69–78. 482
483
Costa, F. R. C., W. E. Magnusson, and R.C. Luizao. 2005. Mesoscale distribution patterns of 484
Amazonian understorey herbs in relation to topography, soil and watersheds. Journal of 485
Ecology 93:863–878. 486
487
Cottenie, K. Integrating environmental and spatial processes in ecological community 488
dynamics. 2005. Ecology Letters 8:1175–1182. 489
490
Daws, M. I., C. E. Mullins, D. F. R. P. Burslem, S. R. Paton, and J. W Dalling. 2002. 491
Topographic position affects the water regime in a semideciduous tropical forest in 492
Panamá. Plant and Soil 238:78–89. 493
38
494
De Bie, T., L. de Meester, L. Brendonck, K. Martens, B. Goddeeris, D. Ercken, H. 495
Hampel, L. Denys, L. Vanhecke, K. Van der Gucht, J. Van Wichelen, W. Vyverman, and S. 496
A. Declerck. 2012. Body size and dispersal mode as key traits determining metacommunity 497
structure of aquatic organisms. Ecology Letters. 15:740–747. 498
Devictor, V., J. Clavel, R. Julliard, S. Lavergne, D. Mouillot, W. Thuiller, P. Venail, S. 499
Villeger, and N. Mouquet. 2010. Defining and measuring ecological specialization. Journal of 500
Applied Ecology 47:15–25. 501
502
Diamond, J. M. 1975. Assembly of species communities. Pages 342–444 in M. L. Cody and 503
J. M. Diamond, editors. Ecology and evolution of communities. Harvard University Press, 504
Cambridge, Massachusetts, USA. 505
506
Draper, F. C., et al. 2019. Dominant tree species drive beta diversity patterns in Western 507
Amazonia. Ecology 0:e02636. 508
509
Drucker, D. P., F. R. C. Costa, and W. E. Magnusson. 2008. How wide is the riparian zone of 510
small streams in tropical forests? A test with terrestrial herbs. Journal of Tropical Ecology 511
24:65–74. 512
513
EMBRAPA, 1997. Manual de Métodos de Análises de Solos. Centro Nacional de Pesquisas 514
de Solo. SBLCS. Rio de Janeiro. 515
516

39
Engelbrecht, B. M. J., L. S. Comita, R. Condit, T. A. Kursar, M. T. Tyree, B. L. Turner, and 517
S. P. Hubbell. 2007. Drought sensitivity shapes species distribution patterns in tropical 518
forests. Nature 447:80–2. 519
520
Ferry, B., F. Morneau, J. D. Bontemps, L. Blanc, and V. Freycon. 2010. Higher treefall rates 521
on slopes and waterlogged soils result in lower stand biomass and productivity in a tropical 522
rain forest. Journal of Ecology 98:106–116. 523
524
Ferry–Graham, L.A., D.I. Bolnick, and P.C. Wainwright. 2002. Using functional morphology 525
to examine the ecology and evolution of specialization. Integrative and Comparative Biology 526
42:265–277. 527
528
Fittkau, E. J., and H. Klinge. 1973. On Biomass and Trophic Structure of the Central 529
Amazonian Rain Forest Ecosystem. Biotropica 5:2–14. 530
531
Forister, M. L., L. A. Dyer, M. S. Singer, J. O. Stireman III, and J. T. Lill. 2012. Revisiting 532
the evolution of ecological specialization, with emphasis on insect–plant interactions. 533
Ecology 93:981– 991. 534
535
Futuyma, D. J., and G. Moreno. 1988. The evolution of ecological specialization. Annual 536
Review of Ecology and Systematics 19:207–3. 537
538
Gentry, A. H. 1988. Changes in Plant Community Diversity and Floristic Composition on 539
Environmental and Geographical Gradients. Annals of the Missouri Botanical Garden 75:1–540
34. 541

40
542
Goldberg, D. E., and A. M. Barton. 1992. Patterns and Consequences of Interspecific 543
Competition in Natural Communities: A Review of Field Experiments with Plants. The 544
American Naturalist 139:771–801. 545
546
Gotelli, N. J., and D.K J. McCabe. 2002. Species co–occurrence: a meta–analysis of J. M. 547
Diamond‟s assembly rules model. Ecology, 83:2091–2096. 548
549
Grinnell, J. 1917. The Niche–Relationships of the California Thrasher. The Auk, 34:427–433. 550
551
Gurevitch, J., L. L. Morrow, A. M. Wallace, and J.S. Walsh, 1992. A Meta–Analysis of 552
Competition in Field Experiments. The American Naturalist 140:539–572. 553
554
Jones, R., J. W. Dalling, K. E. Harms, J. B. Yavitt, R. F. Stallard, M. Mirabello, Jones, M. 555
M., H. Tuomisto, D. B. Clark, and P. Olivas. 2006. Effects of mesoscale environmental 556
heterogeneity and dispersal limitation on floristic variation in rain forest ferns. Journal of 557
Ecology 94:181–195. 558
559
Jordan, C. F., and R. Herrera. 1981. Tropical Rain Forests: Are Nutrients Really Critical? The 560
American Naturalist 117:167–180. 561
562
Kinupp, V.F., and W. E. Magnusson. 2005. Spatial patterns in the understorey shrub genus 563
Psychotria in central Amazonia: effects of distance and topography. Journal of Tropical 564
Ecology 21:363–374. 565
566

41
Landeiro, V.L., L. M. Bini, F. R. C. Costa, E. Franklin, A. Nogueira, J. L. P. Souza, J. 567
Moraes, and W. E. Magnusson. 2012. How far can we go in simplifying biomonitoring 568
assessments? An integrated analysis of taxonomic surrogacy, taxonomic sufficiency and 569
numerical resolution in a megadiverse region. Ecological Indicators 23:366–373. 570
571
Leibold, M. A., M. Holyoak, N. Mouquet, P. Amarasekare, J. M. Chase, M. F. Hoopes, R. D. 572
Holt, J. B. Shurin, R. Law, D. Tilman, M. Loreau and A. Gonzalez. 2004. The 573
metacommunity concept: a framework for multi–scale community ecology. Ecology Letters 574
7:60–613. 575
576
Lieberman, M., D. Lieberman, G. S. Hartshorn, and R. Peralta. 1985. Small–Scale Altitudinal 577
Variation in Lowland Wet Tropical Forest Vegetation. Journal of Ecology 73:505–516. 578
579
Lynch, J..1995. Root Architecture and Plant Productivity. Plant Physiology 109:7–13. 580
581
MacArthur, R. H., and R. Levins. 1967. The limiting similarity, convergence and divergence 582
of coexisting species. American Naturalist 101:377–385. 583
584
MacArthur, Robert H. 1972. Geographical Ecology:Patterns in the Distribution of Species. 585
New York: Harper & Row. 586
587
Macía, M. J., K. Ruokolainen, H. Tuomisto, J. Quisbert, and V. Cala. 2007. Congruence 588
between floristic patterns of trees and lianas in a southwest Amazonian rain forest. Ecography 589
30:561–577. 590
591

42
Markesteijn, L., and L. Poorter. 2009. Seedling root morphology and biomass allocation of 592
62 tropical tree species in relation to drought– and shade–tolerance. Journal of Ecology 97, 593
311–325. 594
595
Marques-Filho, A. O., M. N. G. Ribeiro, H. M. Santos, and J. M. Santos. 1981. Estudos 596
climatologicos da Reserva Florestal Ducke – Manaus –AM. IV. Precipitação. Acta 597
Amazonica 11:759–768. 598
599
Metcalfe, D. B., P. Meir, L. E. O. C. Aragão, A. C. L. da Costa, A. P. Braga, P. H. L. 600
Gonçalves, J. A. Silva-Junior, S. S. Almeida, L. A. Dawson, Y. Malhi, and M. Williams. 601
2008. The effects of water availability on root growth and morphology in an Amazon 602
rainforest. Plant Soil 311:189–199. 603
604
Moulatlet, G. M., F. R. C. Costa, C. D. Rennó, T. Emilio, and J. Schietti. 2014. Local 605
Hydrological Conditions Explain Floristic Composition in Lowland Amazonian Forests. 606
Biotropica 46:395–403. 607
608
Moulatlet, G. M., G. Zuquim, F. O. G. Figueiredo, S. Lehtonen, T. Emilio, K. Ruokolainen, 609
and H. Tuomisto. 2017. Using digital soil maps to infer edaphic affinities of plant species in 610
Amazonia: Problems and prospects. Ecology and evolution 7:8463–8477. 611
612
Nasto, M. K., B. B. Osborne, Y. Lekberg, G. P. Asner, C. S. Balzotti, S. Ponder, P. G. 613
Taylor, A. R. Townsend, and C. C. Cleveland. 2017. Nutrient acquisition, soil phosphorus 614
partitioning and competition among trees in a lowland tropical rain forest. New Phytologist 615
214:1506–1517. 616

43
617
Nepstad, D. C., C. R. Carvalho, E. A. Davidson, P. H. Jipp, P. A. Lefebvre, G. H. Negreiros, 618
E. D. Silva, T. A. Stone, S. E. Trumbore, and S.Vieira. 1994. The role of deep roots in the 619
hydrological and carbon cycles of Amazonia forests and pastures. Nature 372:666–669. 620
621
Nepstad, D. C., I. M. Tohver, D. Ray, P. Moutinho, and G. Cardinot . 2007. Mortality of 622
large trees and lianas following experimental drought in an Amazon Forest. Ecology 623
88:2259–2269. 624
625
Nobre, A. D., L. A. Cuartas, M. Hodnett, C. D. Rennó, G. Rodrigues, A. Silveira, M. 626
Waterloo, and S. Saleska. 2011. Height above the nearest drainage – a hydrologically 627
relevant new terrain model. Journal of Hydrology 404:13–29. 628
629
Nogueira, A., F. R. C. Costa, and C. V. Castilho. 2011. Liana abundance patterns:the role of 630
ecological filters during development. Biotropica 43:442–449. 631
Page, C. N. 2002. Ecological strategies in fern evolution: a neopteridological overview. 632
Review of Palaeobotany and Palynology 119:1–33. 633
634
Paoli, G. D., and L. M. Curran. 2007. Soil Nutrients Limit Fine Litter Production and Tree 635
Growth in Mature Lowland Forest of Southwestern Borneo. Ecosystems 10:503–518. 636
637
Peres-Neto, P. R., and P. Legendre. 2010. Estimating and controlling for spatial structure in 638
the study of ecological communities. Global Ecology and Biogeography 19:174–184. 639
640

44
Piedade, M. T. F., C. Ferreira, A. Oliveira–Wittmann, M.S. Buckeridge, and P. Parolin. 641
Biochemistry of Amazonian Floodplain Trees. 2010. Pages 127-139. In: Junk W.J., M. T. F. 642
Piedade, P. Parolin, F. Wittmann, and J. Schöngart (Org.). Amazonian Floodplain Forests: 643
Ecophysiology, Biodiversity and Sustainable Management. Heidelberg: Springer, 2010, 644
618p. 645
646
Prudic, K. L., J. C. Oliver, and M. D. Bowers. 2005. Soil nutrient effects on oviposition 647
preference, larval performance, and chemical defense of a specialist insect herbivore. 648
Oecologia 143:578–587. 649
650
Quesada, C.A., J. Lloyd, L. O. Anderson, N. M. Fyllas, M. Schwarz, and C. I. Czimczik. 651
2011. Soils of Amazonia with particular reference to the RAINFOR sites. Biogeosciences 652
8:1415–1440. 653
654
Quesada, C. A., et al. 2009. Regional and large–scale patterns in Amazon forest structure and 655
function are mediated by variations in soil physical and chemical properties. Biogeosciences 656
Discussions 6:3993–4057. 657
658
Quesada, C. A., et al. 2012. Basin–wide variations in Amazon forest structure and function 659
are mediated by both soils and climate. Biogeosciences 9:2203–2246. 660
661
Quesada, C. A, et al. 2010.Variations in chemical and physical properties of Amazon forest 662
soils in relation to their genesis. Biogeosciences 7:1515–1541. 663
664

45
R Core Team. 2018. R: A language and environment for statistical computing. R Foundation 665
for Statistical Computing. Vienna, Austria. http://www.R–project.org/. 666
667
Raaimakers, D., R. G. A. Boot, R. Dijkstra, S. Pot, and T. Pons. 1995. Photosynthetic rates 668
in relation to leaf phosphorus content in pioneer versus climax tropical rainforest trees. 669
Oecologia 102:120–125. 670
671
Rennó, C. D., A. D. Nobre, L. A. Cuartas, J. V. Soares, M. G. Hodnett, J. Tomasella, and M. 672
J. Waterloo. 2008. HAND, a new terrain descriptor using SRTM–DEM: Mapping terra–firme 673
rainforest environments in Amazonia. Remote Sensing of Environment 112:3469–3481. 674
675
Restom, T. G., and D. D. Nepstad. 2004. Seedling growth dynamics of a deeply rooting liana 676
in a secondary forest in eastern Amazonia. Forest Ecology and Management 190:109–118. 677
678
Ribeiro, J. E. L. S. et al. 1999. Flora da Reserva Ducke. Guia de identificação de plantas 679
vasculares de uma floresta de terra firme da Amazônia central, Editora INPA, Manaus, 680
Amazonas, Brasil. 799 p. 681
682
Rodriguez–Iturbe, I. 2000. Ecohydrology:a hydrologic perspective of climate–soil–vegetation 683
dynamics. Water Resources Research 36:3–9. 684
685
John, R., J. W. Dalling, K. E. Harms, J. B. Yavitt, R. F. Stallard, M. Mirabello, S. P. Hubbell, 686
R. Valencia, H. Navarrete, M. Vallejo, and R. B. Foster. 2007. Soil nutrients influence spatial 687
distributions of tropical tree species. Proceedings of the National Academy of Sciences of the 688
United States of America (PNAS), 104:864–869. 689

46
690
Saleska, S. R., K. Didan, A. R. Huete, and H. R. Rocha. 2007. Amazon Forests Green–Up 691
during 2005 Drought. Science 318:612. 692
693
Schietti, J., T. Emilio, C. D. Rennó, D. P. Drucker, F. R. C. Costa, A. Nogueira, F. B. 694
Baccaro, F. Figueiredo , C. V. Castilho, V. Kinupp, J. L. Guillaumet , A. R. M. Garcia, A. P. 695
Lima, and W. E. Magnusson. 2013. Vertical distance from drainage drives floristic 696
composition changes in an Amazonian rainforest. Plant Ecology & Diversity 7:241–253. 697
698
Schnitzer, S. A. 2005. A mechanistic explanation for global patterns of liana abundance and 699
distribution. The American Naturalist 166:262–76. 700
701
Schnitzer, S. A. and G.M.F. van der Heijden. Lianas have a seasonal growth advantage over 702
co-occurring trees. Ecology, 0(0), 2019, e02655. 703
704
Silvertown, J. 2004. Plant coexistence and the niche. Trends in Ecology and Evolution 705
19:605–611. 706
707
Silvertown, J., M.E. Dodd, D. J. G. Gowing, and J.O. Mountford. 1999. Hydrologically 708
defined niches reveal a basis for species richness in plant communities. Nature 400:61–63. 709
710
Soininen, J. 2016. Spatial structure in ecological communities –a quantitative analysis. Oikos 711
125:160–166. 712
713

47
Stevens, G. C. 1992. The elevational gradient in altitudinal range:an extension of Rapoport's 714
latitudinal rule to altitude. 1992. The American Naturalist December 140:893–911. 715
716
Svenning, J. C., D. A. Kinner, R. F. Stallard, B. M. J. Engelbrecht, and S. J. Wright. 2004. 717
Ecological determinism in plant community structure across a tropical forest landscape. 718
Ecology 85:2526–2538. 719
720
ter Steege, H., V. G. Jetten, A. M. Polak, and M. J. A. Werger. 1993.Tropical rain forest 721
types and soil factors in a watershed area in Guyana. Journal of Vegetation Science 4:705–722
716. 723
724
Tuomisto, H., and A. D. Poulsen. 2000. Pteridophyte diversity and species composition in 725
four Amazonian rain forests. Journal of Vegetation Science 11:383–396. 726
727
Tuomisto, H., and K. Ruokolainen. 1993. Distribution of Pteridophyta and Melastomataceae 728
along an edaphic gradient in an Amazonian rain forest. Journal of Vegetation Science 4:25–729
34. 730
731
Vormisto, J., H. Tuomisto, and J. Oksanen. 2004. Palm distribution patterns in Amazonian 732
rainforests: What is the role of topographic variation? Journal of Vegetation Science 15:485–733
494. 734
735
Vormisto, J., J.C. Svenning, P. Hall, and H. Balslev. 2004. Diversity and dominance in palm 736
(Arecaceae) communities in terra firme forests in the western Amazon basin. Journal of 737
Ecology 92, 577–588. 738

48
739
Vormisto, J., O. L. Phillips, K. Ruokolainen, H. Tuomisto, and R. Vásquez. 2000. A 740
comparison of fine–scale distribution patterns of four plant groups in an Amazonian 741
rainforest. Ecography 23:349–359. 742
743
Walker, T. W., and J. K. Syers. 1976. The fate of phosphorus during pedogenesis. Geoderma 744
15:1–19. 745
746
Whittaker, R. H. 1972. Evolution and measurement of species diversity. Taxon 21:213–251. 747
748
Young, K. R., and B. Leon. 1989. Pteridophyte species diversity in the central peruvian 749
amazon:importance of edaphic specialization. Brittonia, 41:388–395. 750
751
Zuquim, G., F. R. C. Costa, H. Tuomisto, G. Moulatlet, and F. O. G. Figueiredo. 2019. The 752
importance of soils in predicting the future of plant habitat suitability in a tropical forest. 753
Plant Soil, 436:1-20 754
755
Zuquim, G., H. Tuomisto, M. M. Jones, J. Prado, F. O. G. Figueiredo, G. Moulatlet, F. R. C. 756
Costa, C. A. Quesada, and T. Emilio. 2014. Predicting environmental gradients with fern 757
species composition in Brazilian Amazonia. Journal of Vegetation Science 25:1195–1207.758

FIGURE LEGENDS
Fig. 1 Location of Ducke Reserve in Central Amazonia, Brazil. Brownish colors represent
higher areas (plateaus and vertentes) and blueishcolors represent lower areas (baixios). The
black lines show the Reserve limits and yellow dots indicate the locations of the 250 m-
longpermanent plots on a 1 km equidistant sampling grid.
Fig. 2 Differences of Ecological Specialization (SES) among life formsin each abiotic
gradient. A: HAND gradient; B: Sum of bases gradient; and C: Phosphorus gradient.
Different letters mean statistical difference after corrections for multiple tests. Species are
represented by gray points. Dashed red lines represent the point where there is no difference
between observed and expected specialization values. Positive values of SES indicate more
generalization in each gradient, while negative values more specialization than the expected
by the null model.
Fig. 3 Differences of Ecological Specialization (SES) among the three gradients in each life
form. A: Ferns; B: Herbs; C: Lianas; D: Palms; E: Shrubs; and F: Trees.Different letters
mean statistical difference after corrections for multiple tests. Species are represented by gray
points. Dashed red lines represent the point where there is no difference between observed
and expected specialization values. Positive values of SES indicate more generalization in
each gradient, while negative values more specialization than the expected by the null model.

50
FIGURES
Fig. 1

51
Fig. 2

52
Fig. 3
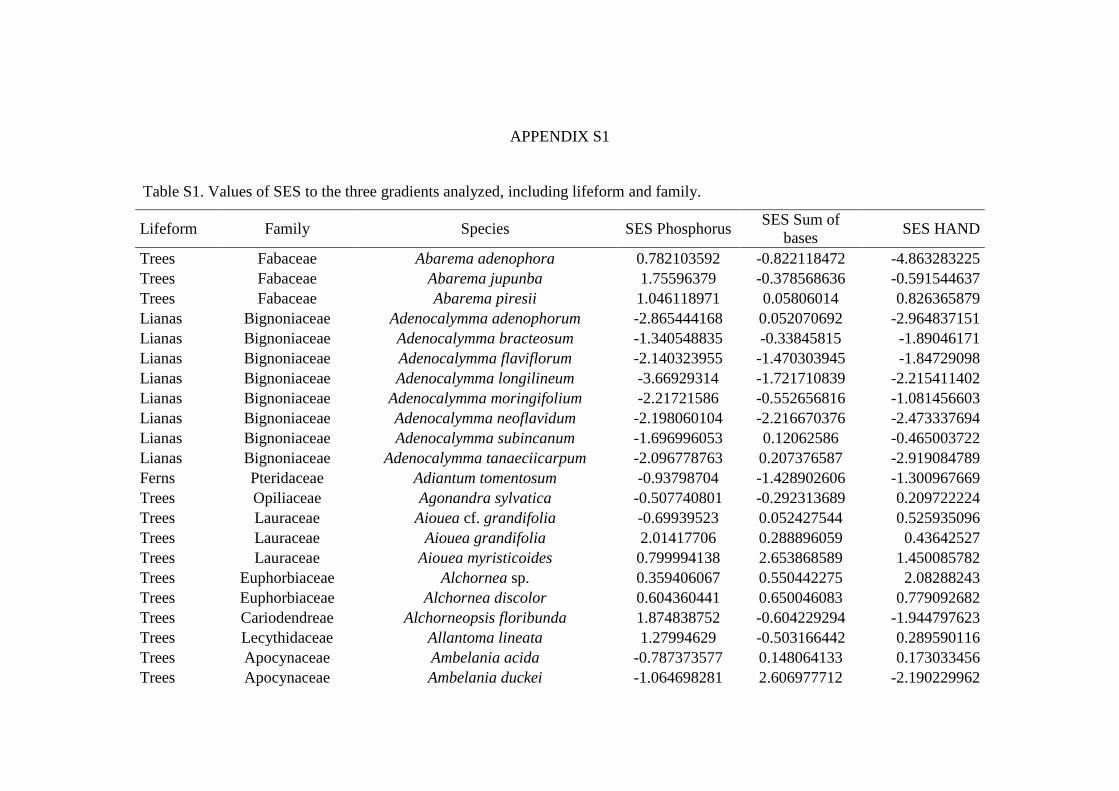
APPENDIX S1
Table S1. Values of SES to the three gradients analyzed, including lifeform and family.
Lifeform Family Species SES Phosphorus SES Sum of
bases SES HAND
Trees Fabaceae Abarema adenophora 0.782103592 -0.822118472 -4.863283225
Trees Fabaceae Abarema jupunba 1.75596379 -0.378568636 -0.591544637
Trees Fabaceae Abarema piresii 1.046118971 0.05806014 0.826365879
Lianas Bignoniaceae Adenocalymma adenophorum -2.865444168 0.052070692 -2.964837151
Lianas Bignoniaceae Adenocalymma bracteosum -1.340548835 -0.33845815 -1.89046171
Lianas Bignoniaceae Adenocalymma flaviflorum -2.140323955 -1.470303945 -1.84729098
Lianas Bignoniaceae Adenocalymma longilineum -3.66929314 -1.721710839 -2.215411402
Lianas Bignoniaceae Adenocalymma moringifolium -2.21721586 -0.552656816 -1.081456603
Lianas Bignoniaceae Adenocalymma neoflavidum -2.198060104 -2.216670376 -2.473337694
Lianas Bignoniaceae Adenocalymma subincanum -1.696996053 0.12062586 -0.465003722
Lianas Bignoniaceae Adenocalymma tanaeciicarpum -2.096778763 0.207376587 -2.919084789
Ferns Pteridaceae Adiantum tomentosum -0.93798704 -1.428902606 -1.300967669
Trees Opiliaceae Agonandra sylvatica -0.507740801 -0.292313689 0.209722224
Trees Lauraceae Aiouea cf. grandifolia -0.69939523 0.052427544 0.525935096
Trees Lauraceae Aiouea grandifolia 2.01417706 0.288896059 0.43642527
Trees Lauraceae Aiouea myristicoides 0.799994138 2.653868589 1.450085782
Trees Euphorbiaceae Alchornea sp. 0.359406067 0.550442275 2.08288243
Trees Euphorbiaceae Alchornea discolor 0.604360441 0.650046083 0.779092682
Trees Cariodendreae Alchorneopsis floribunda 1.874838752 -0.604229294 -1.944797623
Trees Lecythidaceae Allantoma lineata 1.27994629 -0.503166442 0.289590116
Trees Apocynaceae Ambelania acida -0.787373577 0.148064133 0.173033456
Trees Apocynaceae Ambelania duckei -1.064698281 2.606977712 -2.190229962

54
Trees Ulmaceae Ampelocera edentula -1.463788872 1.160203484 -1.237900221
Lianas Bignoniaceae Amphilophium magnoliifolium 1.304843835 -0.811068305 -2.633840751
Lianas Bignoniaceae Amphilophium parkeri -1.337123396 -0.77495616 -0.53089842
Lianas Bignoniaceae Amphilophium pulverulentum -1.187956032 0.281521854 -0.554077076
Trees Violaceae Amphirrhox longifolia -1.03295469 -0.093633028 -1.232671655
Trees Anacardiaceae Anacardium parvifolium -1.235442888 -0.097978104 -0.856593694
Trees Anacardiaceae Anacardium spruceanum -1.533252771 -0.633775611 0.082164164
Trees Fabaceae Andira sp. 0.136655498 -0.529474859 1.814786704
Trees Fabaceae Andira micrantha 2.087702105 -1.170965701 0.615822241
Trees Fabaceae Andira parviflora -0.34541277 -1.119627163 -0.948404601
Trees Fabaceae Andira unifoliolata -2.061334282 -0.329217794 1.436645728
Lianas Bignoniaceae Anemopaegma robustum 1.346704549 -0.23059763 -5.172108694
Trees Lauraceae Aniba sp. 0.311197322 -0.428541466 0.29034937
Trees Lauraceae Aniba aff. williamsii 2.132320743 -0.273975238 -1.020223915
Trees Lauraceae Aniba canelilla -1.484913465 -1.132374434 -0.080132031
Trees Lauraceae Aniba ferrea -1.108262174 0.37400302 0.338559139
Trees Lauraceae Aniba panurensis -0.867805199 -1.114458607 -0.906081059
Trees Lauraceae Aniba panurensis s.l. 1.695386055 -0.394247482 1.529889296
Trees Lauraceae Aniba parviflora -1.289689363 -0.012151999 0.582487646
Trees Lauraceae Aniba williamsii -1.514347599 -0.1920504 -0.569532104
Trees Anisophylleaceae Anisophyllea manausensis -1.859969155 0.425322943 -0.218592363
Trees Annonaceae Annona amazonica -0.807351902 -0.350357658 0.350227244
Trees Euphorbiaceae Anomalocalyx uleanus 1.341222851 -0.07563778 2.147912504
Trees Euphorbiaceae Aparisthmium cordatum -0.719033698 -0.146725071 -1.413632493
Trees Malvaceae Apeiba echinata 0.085391799 1.140209144 -1.683895499
Trees Olacaceae Aptandra tubicina 1.99304075 0.334701435 0.124934079
Trees Apocynaceae Aspidosperma sp. -0.509932403 -0.503712349 0.709971768
Trees Apocynaceae Aspidosperma desmanthum -0.893763935 -0.525341753 -0.500254581
Trees Apocynaceae Aspidosperma marcgravianum -0.211592512 2.738008386 -0.35050975
Trees Apocynaceae Aspidosperma nitidum -0.207588222 -0.558865036 -1.283232385

55
Trees Apocynaceae Aspidosperma sandwithianum 1.605819406 0.094175105 -0.397413516
Trees Apocynaceae Aspidosperma sp. 0.095544745 -0.541970898 -0.410091371
Palms Arecaceae Aspidosperma spruceanum -1.482795037 -0.997705237 -1.125291883
Palms Arecaceae Astrocaryum acaule -3.906068782 1.198899079 0.092488863
Palms Arecaceae Astrocaryum social -6.281977335 -0.075978153 -3.444427532
Trees Anacardiaceae˜ Astronium le.cointei -1.428947948 -1.234248463 0.255443491
Palms Arecaceae Attalea attaleoides -4.791075306 0.397233352 -2.690499717
Palms Arecaceae Attalea microcarpa 1.581195047 -0.813230234 -3.122983364
Palms Arecaceae Bactris acanthocarpa -3.716249282 -0.727191883 -0.503383787
Palms Arecaceae Bactris acanthocarpa var. intermedia -1.244380157 -0.77439258 -0.723285183
Palms Arecaceae Bactris acanthocarpa var. trailiana -1.273483072 -0.284587076 1.957626068
Palms Arecaceae Bactris acanthocarpoides 2.055034546 -0.1619849 -3.993599695
Palms Arecaceae Bactris concinna -0.74716457 -0.94640192 -1.566294598
Palms Arecaceae Bactris elegan -3.018290779 -1.20056335 -2.169139257
Palms Arecaceae Bactris gastoniana -2.414244926 -0.143765871 -2.305382189
Palms Arecaceae Bactris hirta 3.066312649 -0.510258218 -1.991379703
Palms Arecaceae Bactris simplicifron -1.110850314 -0.155786674 -0.6329005
Palms Arecaceae Bactris syagroides -1.430188129 -0.288201604 0.837335292
Palms Arecaceae Bactris tomentosa var. sphaerocarpa -2.215882199 -1.015970397 -0.630566664
Trees Fabaceae Balizia pedicellaris -0.974945252 0.476581644 0.41081309
Lianas Bignoniaceae Bignonia aequinoctialis 1.9176184 -1.298558589 1.412862918
Lianas Bignoniaceae Bignonia prieurei -1.810658966 -1.251369217 -0.727685685
Trees Annonaceae Bocageopsis multiflora -1.162822691 -1.143683894 -0.819652223
Trees Annonaceae Bocageopsis pleiosperma -1.237286189 -0.723252572 -1.5043215
Trees Fabaceae Bocoa viridiflora -3.678028926 -1.078754315 -2.680930298
Trees Malvaceae Bombacopsis macrocalyx -0.593562614 -1.091196697 -1.303776306
Trees Malvaceae Bombacopsis nervosa 1.135404001 2.082662178 -0.964696684
Trees Rubiaceae Botryarrhena pendula -1.121522366 0.176384333 1.611347602
Herbs Bromeliaceae Bromelia tubulosa -1.626912088 -0.7891837 -1.431444722
Trees Moraceae Brosimum sp. 1.469955498 -1.083091881 0.492250521

56
Trees Moraceae Brosimum acutifolium -1.114154886 -0.085953386 -0.280299665
Trees Moraceae Brosimum guianense -1.921241549 0.555426517 -1.316450869
Trees Moraceae Brosimum lactescens -2.065361926 2.138908495 -2.539013735
Trees Moraceae Brosimum longifolium 0.905963949 -0.239828124 1.595636389
Trees Moraceae Brosimum parinarioides -3.098586169 0.350740372 -1.174371688
Trees Moraceae Brosimum potabile 0.903365898 -0.636447288 -0.618719952
Trees Moraceae Brosimum rubescens -1.631119549 -1.962221604 -0.566115655
Trees Moraceae Brosimum utile -0.026076974 0.368990219 -1.127189954
Trees Combretaceae Buchenavia sp. -0.188744313 1.567811564 0.962767133
Trees Combretaceae Buchenavia congesta 0.44963403 -0.531356175 0.209923769
Trees Combretaceae Buchenavia grandis -1.238120066 -0.389116508 0.845870261
Trees Combretaceae Buchenavia guianensis 0.918273061 -0.014569512 -0.11156197
Trees Combretaceae Buchenavia macrophylla -0.748036587 -0.340020304 -0.856730602
Trees Combretaceae Buchenavia parvifolia -0.78209629 -0.224920382 -0.931537344
Trees Combretaceae Buchenavia tomentosa -1.545181149 -0.468073953 -0.49246086
Trees Malpighiaceae Byrsonima sp. 0.707418146 -0.094994852 0.199619475
Trees Malpighiaceae Byrsonima crispa -0.99961376 -0.004661909 -0.524134825
Trees Malpighiaceae Byrsonima duckeana -1.552101112 -0.604318497 -0.392252071
Trees Malpighiaceae Byrsonima incarnata 1.76073013 2.249585194 0.213644819
Herbs Marantaceae Calathea altissima -1.903469568 -0.81322349 -2.048987608
Herbs Marantaceae Calathea cannoides -0.685131484 1.026596099 -0.7969976
Herbs Marantaceae Calathea mansonis var.1 -0.012837144 -0.917562532 -0.973483876
Herbs Marantaceae Calathea panamensis 1.920477482 -1.046310167 -1.579445056
Herbs Marantaceae Calathea sp.1 2.328000253 -0.62640931 -1.475152103
Herbs Marantaceae Calathea sp.2 0.491541779 1.253842269 -1.697882488
Trees Fabaceae Calliandra tenuiflora -0.781407386 -0.116013427 -1.553890989
Lianas Bignoniaceae Callichlamys latifolia 1.087629082 1.324349149 1.403260486
Trees Myrtaceae Calophyllum brasiliense -0.034350012 -0.930392984 -1.03844291
Herbs Cyperaceae Calyptranthes cuspidata -0.928703812 0.11537663 -0.515363787
Herbs Cyperaceae Calyptrocarya aff. glomerulata 1.270110746 -0.649107839 1.367255643

57
Herbs Cyperaceae Calyptrocarya aff. poeppigiana 0.125085615 -1.034823062 -1.557723006
Trees Callophyllaceae Caraipa sp. 2.501278337 -0.580302909 -1.142104877
Trees Callophyllaceae Caraipa heterocarpa 0.576383236 4.414444946 -1.30209269
Trees Lecythidaceae Caraipa punctulata 2.211097308 -0.71672581 -3.036330714
Trees Lecythidaceae Cariniana decandra 1.015493153 3.201365441 0.019502128
Trees Lecythidaceae Cariniana integrifolia 1.628908722 -1.03302749 -3.785741725
Trees Lecythidaceae Cariniana micrantha -1.367880127 0.469356632 -1.625048932
Trees Achariaceae Carpotroche crispidentata -1.415457702 0.018585648 -0.981566284
Trees Caryocaraceae Caryocar sp. -0.656619404 0.318518429 -0.776723458
Trees Caryocaraceae Caryocar glabrum 0.93398908 0.801640186 1.458632251
Trees Caryocaraceae Caryocar pallidum 1.39451416 0.318908838 0.08573935
Trees Salicaceae Caryocar villosum -0.757764735 -0.316615089 -1.747587026
Trees Salicaceae Casearia sp. 2.257979215 0.293208522 0.916959005
Trees Salicaceae Casearia duckeana -1.137192734 -0.43456209 0.010984191
Trees Salicaceae Casearia javitensis -0.796130363 0.77103889 -2.194909481
Trees Salicaceae Casearia pitumba -0.745296606 2.136841304 1.346305881
Trees Fabaceae Cassia sp. -0.36842479 -0.171020477 1.587902423
Trees Fabaceae Cassia rubriflora 1.032079589 -0.3784459 0.397516895
Trees Malvaceae Catostemma milanezii 1.717558273 -1.087472235 -2.16226313
Trees Urticaceae Cecropia sp. 1.082680079 -0.323507892 -0.862339891
Trees Urticaceae Cecropia distachya 0.219588555 0.3888526 -1.064215577
Trees Urticaceae Cecropia sciadophylla -0.479202698 -0.443320785 0.078939759
Trees Fabaceae Cedrelinga cateniformis -0.824320494 -0.735221558 -1.483310361
Trees Fabaceae Chamaecrista adiantifolia 1.605223506 3.905090798 -1.254031911
Trees Olacaceae˜ Chaunochiton kappleri -0.993504303 1.671531508 -0.593891411
Trees Rubiaceae Chimarrhis barbata -1.652995036 0.394849347 -0.03719597
Trees Rubiaceae Chimarrhis duckeana -0.957717343 -0.408025612 -0.525736594
Trees Sapotaceae Chromolucuma rubriflora 0.298567274 -0.388407117 -3.118532136
Trees Sapotaceae Chrysophyllum sp. -0.280446416 0.081437289 0.170769804
Trees Sapotaceae Chrysophyllum amazonicum -0.134671351 0.207541115 -0.420953444

58
Trees Sapotaceae Chrysophyllum manaosense -0.512175701 -1.074497358 -1.146295844
Trees Sapotaceae Chrysophyllum pomiferum -0.517737522 3.258173353 -0.745612681
Trees Sapotaceae Chrysophyllum prieurii -1.890053575 -1.01023853 0.590923041
Trees Sapotaceae Chrysophyllum sanguinolentum 1.952974486 -0.518552915 -2.814730138
Trees Sapotaceae Chrysophyllum sparsiflorum 0.516775534 -0.118635334 0.814203637
Trees Sapotaceae Chrysophyllum ucuquirana.branca -1.247534034 -0.68055729 -0.316787642
Trees Moraceae Clarisia sp. 2.194246662 -0.356734462 1.152807819
Trees Moraceae Clarisia racemosa -1.588953381 0.513710866 -1.738605494
Trees Clusiaceae Clusia insignis 2.06694478 -0.379661939 2.66077922
Trees Euphorbiaceae Conceveiba guianensis -0.835615705 1.159670616 0.597785195
Trees Euphorbiaceae Conceveiba martiana 2.032490204 -0.093724234 -2.405281007
Trees Connaraceae Connarus perrottetii -0.761597379 -0.881597751 -3.065434269
Trees Fabaceae Copaifera multijuga -2.012008571 -1.237802187 -1.623939396
Trees Boraginaceae Cordia sp. -0.1200023 -0.067044763 -0.901569848
Trees Boraginaceae Cordia exaltata -0.819492674 -0.369230579 -0.739510928
Trees Lecythidaceae Corythophora alta -2.503331567 -0.721062028 -3.403671323
Trees Lecythidaceae Corythophora rimosa -1.486772133 -0.538013008 -1.80286222
Trees Chrysobalanaceae Couepia sp. 0.407461435 -0.810303538 0.339196293
Trees Chrysobalanaceae Couepia bracteosa -1.250967119 1.260361773 -0.081285181
Trees Chrysobalanaceae Couepia canomensis 0.453396333 -0.765363516 1.054413986
Trees Chrysobalanaceae Couepia elata -1.017769898 1.914332278 -2.157694754
Trees Chrysobalanaceae Couepia guianensis -2.316005856 0.114833997 -1.380854137
Trees Chrysobalanaceae Couepia longipendula -0.822305178 -0.026124377 -1.176221826
Trees Chrysobalanaceae Couepia magnoliifolia -1.489154241 -0.815816321 0.192111738
Trees Chrysobalanaceae Couepia obovata -0.323257848 -0.900625572 -1.335412354
Trees Chrysobalanaceae Couepia ulei -0.93707872 -1.107116559 -1.65055667
Trees Apocynaceae Couma guianensis 0.829905495 -0.949542246 -0.884051658
Trees Lecythidaceae Couratari guianensis 0.540170824 1.636775919 -0.422584523
Trees Lecythidaceae Couratari longipedicellata 0.799906241 -0.094477256 -0.295018567
Trees Lecythidaceae Couratari stellata -1.217554548 1.150357108 -1.202945675

59
Trees Lecythidaceae Couratari tauari 0.009865747 -0.720905544 -0.664398204
Trees Urticaceae Coussapoa trinervia 1.920873445 0.264949509 -1.224261482
Trees Rubiaceae Coussarea revoluta -0.485205897 0.903055187 -1.084278529
Trees Burseraceae Crepidospermum rhoifolium -0.817734066 0.318740052 -1.177961353
Trees Euphorbiaceae Croton lanjouwensis -1.91032272 -1.142006947 -2.015106257
Trees Burseraceae Dacryodes sp. -0.803512564 0.317952648 0.412650139
Ferns Maratticeae Danaea trifoliata -1.567321118 2.619551469 -2.178326978
Trees Metteniusaceae Dendrobangia boliviana 1.087643527 4.124109305 0.33001513
Palms Arecaceae Desmoncus polyacanthos -0.223934984 -0.723226321 0.257532598
Trees Fabaceae Dialium guianense -1.53940091 -0.813443887 -0.406253434
Trees Fabaceae Dicorynia paraensis 2.143094258 -0.01045079 0.497979772
Herbs Araceae Dieffenbachia elegans 1.606284375 -0.233220268 1.490759406
Herbs Araceae Dieffenbachia sp.1 1.219519193 -0.148966272 -0.510184163
Herbs Araceae Dieffenbachia sp.3 1.366862567 -0.140256659 -3.250591564
Herbs Araceae Dieffenbachia sp.4 0.274950463 2.4723734 0.972695808
Trees Fabaceae Dimorphandra sp. -0.330587834 0.093326922 0.718248856
Trees Fabaceae Dimorphandra parviflora -1.187231697 -0.523052382 -0.383122965
Trees Fabaceae Dimorphandra pennigera 0.135117001 -0.569193056 -2.596500576
Trees Fabaceae Dimorphandra sp.1 0.58895758 3.334512366 -1.719306237
Trees Fabaceae Dinizia excelsa -0.910560417 -0.550829743 -1.723702446
Trees Ebenaceae Diospyros cavalcantei -0.843127059 3.204613833 -1.739442624
Trees Ebenaceae Diospyros guianensis -1.183847594 -0.848527325 -0.78618935
Trees Ebenaceae Diospyros vestita -0.512995006 0.367201003 0.528215896
Herbs Cyperaceae Diplasia karataefolia -0.955869405 -0.891380608 0.439414752
Trees Fabaceae Diplotropis triloba -0.899049899 -0.469042246 -0.647493812
Trees Fabaceae Dipteryx magnifica -1.712497814 1.324164726 -0.044083783
Trees Fabaceae Dipteryx odorata -1.097748738 0.624008763 -0.375142395
Trees Fabaceae Dipteryx polyphylla -0.945051667 -0.084550555 -0.506741963
Trees Fabaceae Dipteryx punctata -1.072011627 -0.649483554 0.349244288
Herbs Araceae Dracontium longipes 0.26537267 -1.095244717 -0.240239562
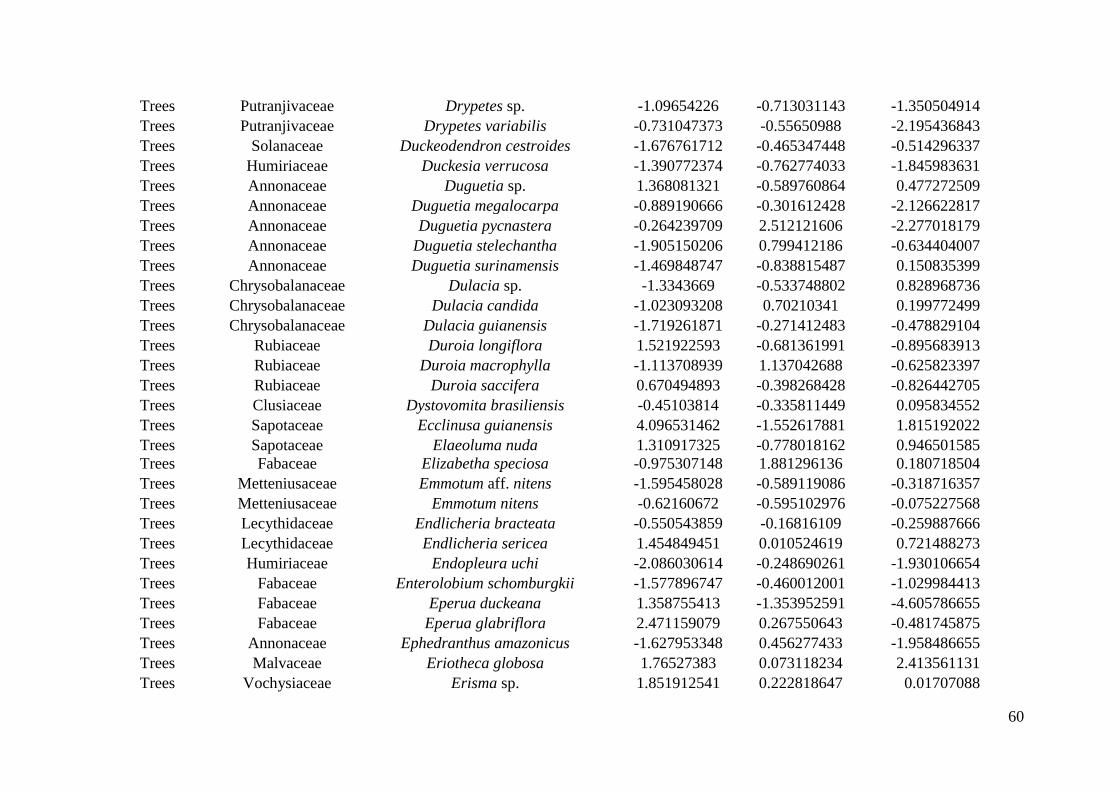
60
Trees Putranjivaceae Drypetes sp. -1.09654226 -0.713031143 -1.350504914
Trees Putranjivaceae Drypetes variabilis -0.731047373 -0.55650988 -2.195436843
Trees Solanaceae Duckeodendron cestroides -1.676761712 -0.465347448 -0.514296337
Trees Humiriaceae Duckesia verrucosa -1.390772374 -0.762774033 -1.845983631
Trees Annonaceae Duguetia sp. 1.368081321 -0.589760864 0.477272509
Trees Annonaceae Duguetia megalocarpa -0.889190666 -0.301612428 -2.126622817
Trees Annonaceae Duguetia pycnastera -0.264239709 2.512121606 -2.277018179
Trees Annonaceae Duguetia stelechantha -1.905150206 0.799412186 -0.634404007
Trees Annonaceae Duguetia surinamensis -1.469848747 -0.838815487 0.150835399
Trees Chrysobalanaceae Dulacia sp. -1.3343669 -0.533748802 0.828968736
Trees Chrysobalanaceae Dulacia candida -1.023093208 0.70210341 0.199772499
Trees Chrysobalanaceae Dulacia guianensis -1.719261871 -0.271412483 -0.478829104
Trees Rubiaceae Duroia longiflora 1.521922593 -0.681361991 -0.895683913
Trees Rubiaceae Duroia macrophylla -1.113708939 1.137042688 -0.625823397
Trees Rubiaceae Duroia saccifera 0.670494893 -0.398268428 -0.826442705
Trees Clusiaceae Dystovomita brasiliensis -0.45103814 -0.335811449 0.095834552
Trees Sapotaceae Ecclinusa guianensis 4.096531462 -1.552617881 1.815192022
Trees Sapotaceae Elaeoluma nuda 1.310917325 -0.778018162 0.946501585
Trees Fabaceae Elizabetha speciosa -0.975307148 1.881296136 0.180718504
Trees Metteniusaceae Emmotum aff. nitens -1.595458028 -0.589119086 -0.318716357
Trees Metteniusaceae Emmotum nitens -0.62160672 -0.595102976 -0.075227568
Trees Lecythidaceae Endlicheria bracteata -0.550543859 -0.16816109 -0.259887666
Trees Lecythidaceae Endlicheria sericea 1.454849451 0.010524619 0.721488273
Trees Humiriaceae Endopleura uchi -2.086030614 -0.248690261 -1.930106654
Trees Fabaceae Enterolobium schomburgkii -1.577896747 -0.460012001 -1.029984413
Trees Fabaceae Eperua duckeana 1.358755413 -1.353952591 -4.605786655
Trees Fabaceae Eperua glabriflora 2.471159079 0.267550643 -0.481745875
Trees Annonaceae Ephedranthus amazonicus -1.627953348 0.456277433 -1.958486655
Trees Malvaceae Eriotheca globosa 1.76527383 0.073118234 2.413561131
Trees Vochysiaceae Erisma sp. 1.851912541 0.222818647 0.01707088
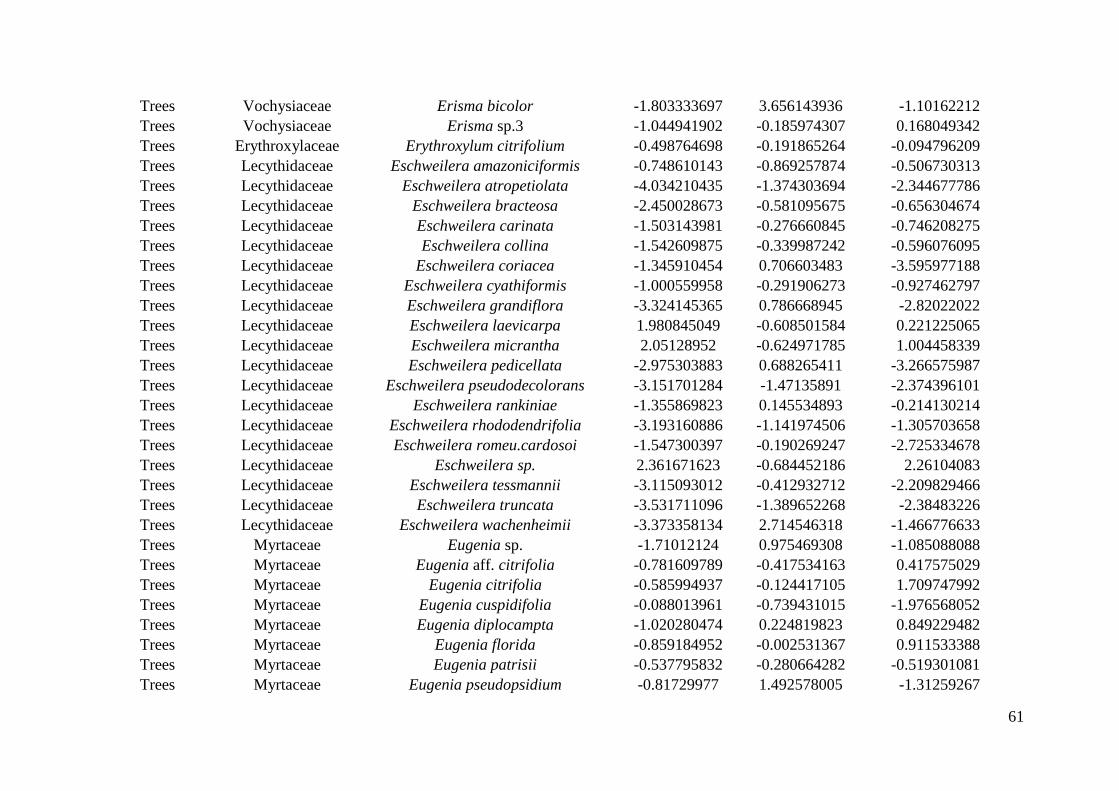
61
Trees Vochysiaceae Erisma bicolor -1.803333697 3.656143936 -1.10162212
Trees Vochysiaceae Erisma sp.3 -1.044941902 -0.185974307 0.168049342
Trees Erythroxylaceae Erythroxylum citrifolium -0.498764698 -0.191865264 -0.094796209
Trees Lecythidaceae Eschweilera amazoniciformis -0.748610143 -0.869257874 -0.506730313
Trees Lecythidaceae Eschweilera atropetiolata -4.034210435 -1.374303694 -2.344677786
Trees Lecythidaceae Eschweilera bracteosa -2.450028673 -0.581095675 -0.656304674
Trees Lecythidaceae Eschweilera carinata -1.503143981 -0.276660845 -0.746208275
Trees Lecythidaceae Eschweilera collina -1.542609875 -0.339987242 -0.596076095
Trees Lecythidaceae Eschweilera coriacea -1.345910454 0.706603483 -3.595977188
Trees Lecythidaceae Eschweilera cyathiformis -1.000559958 -0.291906273 -0.927462797
Trees Lecythidaceae Eschweilera grandiflora -3.324145365 0.786668945 -2.82022022
Trees Lecythidaceae Eschweilera laevicarpa 1.980845049 -0.608501584 0.221225065
Trees Lecythidaceae Eschweilera micrantha 2.05128952 -0.624971785 1.004458339
Trees Lecythidaceae Eschweilera pedicellata -2.975303883 0.688265411 -3.266575987
Trees Lecythidaceae Eschweilera pseudodecolorans -3.151701284 -1.47135891 -2.374396101
Trees Lecythidaceae Eschweilera rankiniae -1.355869823 0.145534893 -0.214130214
Trees Lecythidaceae Eschweilera rhododendrifolia -3.193160886 -1.141974506 -1.305703658
Trees Lecythidaceae Eschweilera romeu.cardosoi -1.547300397 -0.190269247 -2.725334678
Trees Lecythidaceae Eschweilera sp. 2.361671623 -0.684452186 2.26104083
Trees Lecythidaceae Eschweilera tessmannii -3.115093012 -0.412932712 -2.209829466
Trees Lecythidaceae Eschweilera truncata -3.531711096 -1.389652268 -2.38483226
Trees Lecythidaceae Eschweilera wachenheimii -3.373358134 2.714546318 -1.466776633
Trees Myrtaceae Eugenia sp. -1.71012124 0.975469308 -1.085088088
Trees Myrtaceae Eugenia aff. citrifolia -0.781609789 -0.417534163 0.417575029
Trees Myrtaceae Eugenia citrifolia -0.585994937 -0.124417105 1.709747992
Trees Myrtaceae Eugenia cuspidifolia -0.088013961 -0.739431015 -1.976568052
Trees Myrtaceae Eugenia diplocampta -1.020280474 0.224819823 0.849229482
Trees Myrtaceae Eugenia florida -0.859184952 -0.002531367 0.911533388
Trees Myrtaceae Eugenia patrisii -0.537795832 -0.280664282 -0.519301081
Trees Myrtaceae Eugenia pseudopsidium -0.81729977 1.492578005 -1.31259267

62
Trees Myrtaceae Eugenia sp.1 -0.787901551 -0.180766309 1.246113265
Trees Myrtaceae Eugenia sp.3 -0.706262212 -0.461381564 -1.008696396
Palms Arecaceae Euterpe precatoria 0.598878286 -0.232716332 0.098578755
Trees Rubiaceae Faramea sp. -0.887212873 -0.006762091 0.492344718
Trees Rubiaceae Faramea corymbosa -0.600439629 -0.507743125 -0.023129045
Trees Rubiaceae Faramea platyneura -0.568729358 0.220456611 -0.564535321
Trees Rubiaceae Ferdinandusa -1.702858645 -0.351863426 -1.203850449
Lianas Bignoniaceae Fridericia chica -0.576013293 0.850308592 -0.411152395
Lianas Bignoniaceae Fridericia cinnamomea -1.77768974 -0.641719551 -0.629100079
Lianas Bignoniaceae Fridericia nigrescens -1.472114103 2.428847149 -0.164302651
Lianas Bignoniaceae Fridericia prancei -0.260416665 2.192795094 1.128971493
Lianas Bignoniaceae Fridericia triplinervia -2.410461302 -0.754773395 -2.39594062
Trees Annonaceae Fusaea longifolia -1.705423389 -0.58208266 -1.140402776
Trees Apocynaceae Geissospermum argenteum -2.016682935 1.02618945 -3.029573428
Trees Apocynaceae Geissospermum urceolatum -1.75199819 -1.124694706 -2.970636848
Palms Arecaceae Geonoma aspidiifolia -1.353407684 0.00949315 -1.114530358
Palms Arecaceae Geonoma maxima var. chelinodura 2.118439484 -0.762104122 1.085655121
Palms Arecaceae Geonoma maxima var. maxim -1.533108348 0.119861225 -0.697967478
Palms Arecaceae Geonoma maxima var. spixiana -2.239104695 0.919774795 -1.649173011
Palms Arecaceae Geonoma sp.1 -0.803202512 0.702353297 -0.629246979
Palms Arecaceae Geonoma stricta 1.685348182 0.470759163 0.037557848
Herbs Rubiaceae Geophila cordifolia -0.802098173 -0.399612953 -0.877515043
Trees Malpighiaceae Glandonia macrocarpa 0.516497042 -0.448614375 -2.851510722
Trees Euphorbiaceae Glycydendron amazonicum -1.779369611 1.615677073 -1.392073701
Trees Goupiaceae Goupia glabra -1.764333827 -0.033323172 -1.156994227
Trees Nyctaginaceae Guapira sp.1 -0.956595397 -0.45504455 -1.356432003
Trees Meliaceae Guarea sp. 0.127378087 0.178994538 1.613418211
Trees Meliaceae Guarea cf. cinnamomea -0.56750415 -1.046326921 -1.058026461
Trees Meliaceae Guarea convergens -0.750480296 -0.275059331 0.144193273
Trees Meliaceae Guarea humaitensis -0.050284549 0.175761251 -0.994706295

63
Trees Meliaceae Guarea pubescens -0.731861428 -1.062601043 -2.06582774
Trees Meliaceae Guarea scabra 2.404797138 1.127192009 -0.825033907
Trees Meliaceae Guarea silvatica -1.26954585 -0.100163091 -1.009972496
Trees Meliaceae Guarea sp. -0.618308214 -0.413629525 -0.139424193
Trees Meliaceae Guarea trunciflora -1.31726688 -0.135156486 -1.668068694
Trees Annonaceae Guatteria sp. 1.46552317 -0.761410566 -1.611001039
Trees Annonaceae Guatteria citriodora -1.104037821 -0.464450576 -0.080423158
Trees Annonaceae Guatteria discolor -1.886857823 0.194146566 -0.173729655
Trees Annonaceae Guatteria foliosa -0.586108381 -0.568320083 0.43210168
Trees Annonaceae Guatteria guianensis 1.320847051 -0.75160379 -0.35669943
Trees Annonaceae Guatteria meliodora 0.212763029 0.622145657 -1.983582595
Trees Annonaceae Guatteria olivacea -1.582124804 -1.176153419 -0.926175543
Trees Lecythidaceae Gustavia elliptica -1.524773519 -1.166077425 -1.316576378
Trees Lecythidaceae Gustavia hexapetala -0.850944951 -1.047239288 -1.499259414
Trees Linaceae Hebepetalum humiriifolium 1.917376734 -1.093246189 0.247215421
Trees Olacaceae Heisteria sp. -0.052030252 -1.014048412 1.543879613
Trees Olacaceae Heisteria barbata -0.96657273 -0.082707222 -0.104426757
Trees Olacaceae Heisteria densifrons 0.570837789 -0.767313971 1.172761473
Trees Moraceae Helianthostylis sprucei -3.902229758 -0.83776843 -2.333797107
Herbs Heliconiaceae Heliconia acuminata 1.486295633 0.148117872 0.561423246
Herbs Heliconiaceae Heliconia psittacorum -1.237371733 -0.520587079 -0.60200959
Trees Moraceae Helicostylis scabra 0.359547021 -0.629780612 -1.783498785
Trees Moraceae Helicostylis tomentosa -2.837472692 0.178078687 -0.632656666
Trees Melastomataceae Henriettella caudata -0.521529134 -0.903910142 0.444030222
Trees Euphorbiaceae Hevea guianensis 0.773265344 1.26490723 -1.285594399
Trees Apocynaceae Himatanthus stenophyllus -1.250557099 -0.219542589 -3.224496926
Trees Apocynaceae Himatanthus sucuuba -0.647036667 -0.72622522 -1.887767658
Trees Chrysobalanaceae Hirtella bicornis -1.1652774 -1.199916965 -2.349007529
Trees Chrysobalanaceae Hirtella fasciculata 2.038821263 -1.20975036 0.272731993
Trees Chrysobalanaceae Hirtella rodriguesii -1.250863821 2.891098178 -3.769004964

64
Trees Fabaceae Humiria balsamifera -0.676830974 0.580388297 0.719044499
Trees Fabaceae Hymenaea sp. 2.059119553 -0.666654225 0.816076813
Trees Fabaceae Hymenaea intermedia 1.727303585 2.323843919 -0.250165186
Trees Fabaceae Hymenaea parvifolia 0.71781028 -0.408344282 -1.171865666
Trees Fabaceae Hymenaea sp.2 -0.403283701 -0.392676159 0.607297794
Trees Fabaceae Hymenolobium sp. 0.579843154 -0.602808685 -0.757028204
Trees Fabaceae Hymenolobium modestum -0.511160295 -0.331845498 0.279318558
Trees Fabaceae Hymenolobium sericeum -1.788711445 -0.482729543 -0.379809465
Palms Arecaceae Hyospathe elegans 1.462773906 0.15609939 -0.432700469
Herbs Cyperaceae Hypolytrum schraderianum 0.807339248 1.318979609 -1.84232057
Herbs Poaceae Ichnanthus panicoides -2.299778805 -0.200459388 0.58359746
Trees Fabaceae Inga sp. -2.55004383 -0.868500228 -1.761531789
Trees Fabaceae Inga alba -1.049030692 -0.299958551 -0.64145449
Trees Fabaceae Inga bicoloriflora 0.062383134 -0.415317699 -0.294328391
Trees Fabaceae Inga chrysantha -0.537333207 -1.009766603 -1.528736714
Trees Fabaceae Inga gracilifolia -2.178008681 -0.906949274 -0.421125683
Trees Fabaceae Inga grandiflora 0.903804941 -0.053967186 1.067546638
Trees Fabaceae Inga huberi -0.880458378 -0.275260291 -0.540464177
Trees Fabaceae Inga lateriflora 1.160407169 -0.618842934 1.238279931
Trees Fabaceae Inga laurina -0.948865198 0.347319045 -0.980522058
Trees Fabaceae Inga leiocalycina -0.593273686 -0.283630058 -2.013090148
Trees Fabaceae Inga marginata -0.600628917 0.20141304 -0.2128008
Trees Fabaceae Inga obidensis 1.399770334 -1.219785835 -0.283246946
Trees Fabaceae Inga paraensis -1.045142481 1.060289781 -0.213809544
Trees Fabaceae Inga pezizifera -0.959047428 0.116907007 -0.075099643
Trees Fabaceae Inga rhynchocalyx 0.309611076 0.165061078 -0.024286898
Trees Fabaceae Inga stipularis -0.924893013 -0.391907149 -0.105186841
Trees Fabaceae Inga thibaudiana 1.146751009 0.233405869 -1.233353839
Trees Fabaceae Inga umbratica -1.265565482 0.367955574 0.091962634
Palms Arecaceae Iriartella setigera 0.867683725 -0.979257626 -1.835959632

65
Trees Myristicaceae Iryanthera sp. 1.756437107 -0.920050049 -1.011207841
Trees Myristicaceae Iryanthera coriacea -0.881531385 0.287183995 -0.477811836
Trees Myristicaceae Iryanthera elliptica -0.702838272 -0.754820318 -0.648055205
Trees Myristicaceae Iryanthera juruensis 2.39606684 -0.666870145 -0.989911384
Trees Myristicaceae Iryanthera laevis -1.522578964 1.365998477 0.871141002
Trees Myristicaceae Iryanthera lancifolia 0.32310375 -0.101413323 -0.292935811
Trees Myristicaceae Iryanthera paradoxa 2.104043705 -0.506573969 -1.149192613
Trees Myristicaceae Iryanthera sp. 0.847203731 -0.598184028 0.026456709
Trees Myristicaceae Iryanthera ulei 0.989114995 0.556327859 -1.347230604
Herbs Marantaceae Ischnosiphon arouma 1.826817507 0.911092256 -0.529885104
Herbs Marantaceae Ischnosiphon gracilis -1.634062482 -1.145437095 -2.053059606
Herbs Marantaceae Ischnosiphon hirsutus -1.160554336 -0.173257339 0.973549071
Herbs Marantaceae Ischnosiphon killipii 0.934280838 -0.034625894 -0.088470853
Herbs Marantaceae Ischnosiphon martianus -1.775292622 0.290187135 -0.534324204
Herbs Marantaceae Ischnosiphon puberulus 1.202419732 -0.593268955 0.797276299
Trees Bignoniaceae Jacaranda sp. 1.100036018 -0.201946538 0.805610172
Trees Bignoniaceae Jacaranda copaia -0.625269859 1.390867065 -0.865731679
Trees Lauraceae Kubitzkia mezii -1.068484951 -0.386335809 -0.381813976
Trees Lacistemataceae Lacistema aggregatum 1.550608366 -0.209758964 0.743472709
Trees Lacistemataceae Lacistema polystachyum -0.410063079 -0.02683436 -1.115525175
Trees Apocynaceae Lacmellea gracilis 0.548503819 -0.907448155 -1.786606079
Trees Quiinaceae Lacunaria sp. -0.78794601 0.010555436 -0.352045818
Trees Quiinaceae Lacunaria jenmanii 0.675058977 2.107618785 -0.98724691
Trees Salicaceae Laetia procera -1.309405521 -0.695653117 -2.468543526
Trees Lecythidaceae Lecythis chartacea -0.846117064 -0.094378306 -1.00621853
Trees Lecythidaceae Lecythis gracieana -2.58200518 -0.984374124 -3.003276838
Trees Lecythidaceae Lecythis parvifructa -1.22291514 -0.166918027 -1.405934841
Trees Lecythidaceae Lecythis pisonis 1.903329749 -0.156994038 -0.709464245
Trees Lecythidaceae Lecythis poiteaui -2.10513834 -0.606684163 0.540089039
Trees Lecythidaceae Lecythis prancei -2.933949528 -0.777580147 -4.541976315

66
Trees Lecythidaceae Lecythis retusa -1.429185352 2.094686 -1.377355663
Trees Lecythidaceae Lecythis sp. -1.100729008 -0.566838966 0.147436924
Trees Lecythidaceae Lecythis zabucajo -0.036037875 -0.777579069 1.347182679
Trees Chrysobalanaceae Licania sp. -0.295994493 0.565621031 -0.885134085
Trees Chrysobalanaceae Licania adolphoduckei 1.416422456 -0.454209853 0.766484916
Trees Chrysobalanaceae Licania apelata -2.0246082 -1.044749662 -2.101157015
Trees Chrysobalanaceae Licania bracteata -2.530786478 0.225802715 -1.443376415
Trees Chrysobalanaceae Licania canescens -0.888737119 1.563827289 -0.399028553
Trees Chrysobalanaceae Licania caudata -0.733516679 1.588476594 -0.3190957
Trees Chrysobalanaceae Licania coriacea -1.635455652 0.191571282 0.05809669
Trees Chrysobalanaceae Licania egleri -0.724828207 -0.825906056 -1.967488371
Trees Chrysobalanaceae Licania gracilipes -0.874029448 -0.68516277 0.35501179
Trees Chrysobalanaceae Licania heteromorpha -2.836766205 -0.307593978 -0.764307106
Trees Chrysobalanaceae Licania impressa -1.292379559 -1.101740014 -1.969798153
Trees Chrysobalanaceae Licania laevigata 1.916367342 -0.622281168 -0.112523948
Trees Chrysobalanaceae Licania lata 1.499314554 -0.576919619 -2.593643926
Trees Chrysobalanaceae Licania latifolia 1.594138061 -0.130050065 -0.547389831
Trees Chrysobalanaceae Licania laxiflora -0.470541327 0.115797715 0.167876424
Trees Chrysobalanaceae Licania longistyla -0.700559955 -0.69929706 0.231541869
Trees Chrysobalanaceae Licania macrophylla 0.941297399 1.742273065 -1.288124186
Trees Chrysobalanaceae Licania micrantha -1.675423449 1.063086961 -2.031400843
Trees Chrysobalanaceae Licania niloi -1.054015033 -0.707925575 -0.162718318
Trees Chrysobalanaceae Licania oblongifolia 0.48543854 0.847465278 -4.095375572
Trees Chrysobalanaceae Licania octandra -1.839593285 0.432307898 -1.927049523
Trees Chrysobalanaceae Licania pallida -1.374531315 0.172016517 0.355611174
Trees Chrysobalanaceae Licania prismatocarpa -0.732101014 1.591298114 -1.042104281
Trees Chrysobalanaceae Licania reticulata -0.156946843 2.85268713 -2.137141235
Trees Chrysobalanaceae Licania rodriguesii -0.663013307 -0.124940625 -1.265260258
Trees Chrysobalanaceae Licania sandwithii -1.71315654 -0.522754677 -0.739135938
Trees Chrysobalanaceae Licania sothersiae -0.959100221 -0.794841878 0.131002534

67
Trees Chrysobalanaceae Licania sprucei -2.248074964 -0.07357289 -1.584184966
Trees Chrysobalanaceae Licania unguiculata -0.428425518 1.735962285 0.157210163
Trees Lauraceae Licaria sp. 1.788565509 -0.232724463 -0.235130339
Trees Lauraceae Licaria cannella 0.045005048 -1.57572672 1.002260074
Trees Lauraceae Licaria chrysophylla -0.987704611 0.269316586 -0.068980196
Trees Lauraceae Licaria guianensis -2.52810988 -0.335214866 -1.069124021
Trees Lauraceae Licaria martiniana -0.963403064 -0.422134495 1.118956807
Trees Lauraceae Licaria pachycarpa -1.346390844 -0.644498777 -0.870149489
Trees Lauraceae Licaria rodriguesii -1.086503702 -0.216005978 0.779612885
Ferns Dennstaedtiaceae Lindsaea guianensis 0.273221985 -0.455896464 -3.621270264
Ferns Dennstaedtiaceae Lindsaea lancea var falcata 1.782327174 -0.342286633 -4.057808216
Ferns Dennstaedtiaceae Lindsaea lancea var lancea -2.045574475 -1.006419601 -1.531123503
Trees Clusiaceae Lorostemon coelhoi -0.859843375 -0.356575342 -1.38240474
Trees Malvaceae Lueheopsis rosea -2.620493821 -0.851901964 -1.736389276
Trees Euphorbiaceae Mabea sp. -1.06780776 -0.772434353 0.252892131
Trees Euphorbiaceae Mabea angularis -0.269934187 -0.829342166 -1.745276599
Trees Euphorbiaceae Mabea piriri 1.555773612 -0.184903474 0.309938708
Trees Euphorbiaceae Mabea speciosa -1.256936964 1.631003564 -1.84083491
Trees Euphorbiaceae Mabea subsessilis 1.783350663 -0.631658522 -0.464951512
Trees Fabaceae Macrolobium limbatum 2.143697345 1.297655071 -2.902186702
Trees Fabaceae Macrolobium microcalyx 0.915228021 -0.360919318 0.85338654
Trees Fabaceae Macrolobium sp.2 0.150043991 -0.788769397 -3.953646342
Trees Fabaceae Macrolobium suaveolens 1.563585907 -0.98755902 -1.052235177
Trees Sapotaceae Manilkara sp. -1.062117988 -1.194435381 0.191383117
Trees Sapotaceae Manilkara bidentata -2.413991366 -0.916069265 0.023059667
Trees Sapotaceae Manilkara cavalcantei -1.180293747 -0.899080588 -2.285223152
Herbs Cyperaceae Mapania sylvatica -0.797082314 0.546288384 -1.033102026
Trees Moraceae Maquira calophylla -1.814739807 -0.981002492 -1.786043397
Trees Moraceae Maquira sclerophylla -1.482888193 2.202461465 -2.294708735
Trees Myrtaceae Marlierea umbraticola -0.641942858 -1.017366012 -0.101778844
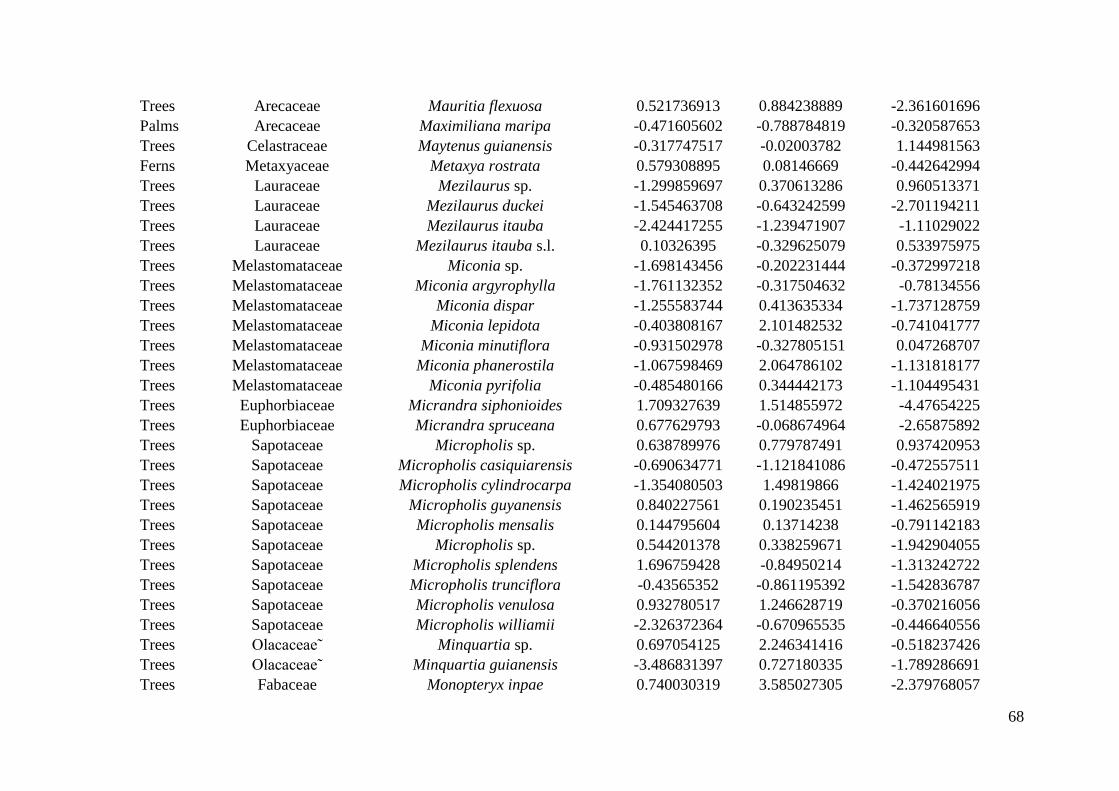
68
Trees Arecaceae Mauritia flexuosa 0.521736913 0.884238889 -2.361601696
Palms Arecaceae Maximiliana maripa -0.471605602 -0.788784819 -0.320587653
Trees Celastraceae Maytenus guianensis -0.317747517 -0.02003782 1.144981563
Ferns Metaxyaceae Metaxya rostrata 0.579308895 0.08146669 -0.442642994
Trees Lauraceae Mezilaurus sp. -1.299859697 0.370613286 0.960513371
Trees Lauraceae Mezilaurus duckei -1.545463708 -0.643242599 -2.701194211
Trees Lauraceae Mezilaurus itauba -2.424417255 -1.239471907 -1.11029022
Trees Lauraceae Mezilaurus itauba s.l. 0.10326395 -0.329625079 0.533975975
Trees Melastomataceae Miconia sp. -1.698143456 -0.202231444 -0.372997218
Trees Melastomataceae Miconia argyrophylla -1.761132352 -0.317504632 -0.78134556
Trees Melastomataceae Miconia dispar -1.255583744 0.413635334 -1.737128759
Trees Melastomataceae Miconia lepidota -0.403808167 2.101482532 -0.741041777
Trees Melastomataceae Miconia minutiflora -0.931502978 -0.327805151 0.047268707
Trees Melastomataceae Miconia phanerostila -1.067598469 2.064786102 -1.131818177
Trees Melastomataceae Miconia pyrifolia -0.485480166 0.344442173 -1.104495431
Trees Euphorbiaceae Micrandra siphonioides 1.709327639 1.514855972 -4.47654225
Trees Euphorbiaceae Micrandra spruceana 0.677629793 -0.068674964 -2.65875892
Trees Sapotaceae Micropholis sp. 0.638789976 0.779787491 0.937420953
Trees Sapotaceae Micropholis casiquiarensis -0.690634771 -1.121841086 -0.472557511
Trees Sapotaceae Micropholis cylindrocarpa -1.354080503 1.49819866 -1.424021975
Trees Sapotaceae Micropholis guyanensis 0.840227561 0.190235451 -1.462565919
Trees Sapotaceae Micropholis mensalis 0.144795604 0.13714238 -0.791142183
Trees Sapotaceae Micropholis sp. 0.544201378 0.338259671 -1.942904055
Trees Sapotaceae Micropholis splendens 1.696759428 -0.84950214 -1.313242722
Trees Sapotaceae Micropholis trunciflora -0.43565352 -0.861195392 -1.542836787
Trees Sapotaceae Micropholis venulosa 0.932780517 1.246628719 -0.370216056
Trees Sapotaceae Micropholis williamii -2.326372364 -0.670965535 -0.446640556
Trees Olacaceae˜ Minquartia sp. 0.697054125 2.246341416 -0.518237426
Trees Olacaceae˜ Minquartia guianensis -3.486831397 0.727180335 -1.789286691
Trees Fabaceae Monopteryx inpae 0.740030319 3.585027305 -2.379768057

69
Herbs Marantaceae Monotagma densiflorum -0.533996876 -0.754597121 -0.524141165
Herbs Marantaceae Monotagma spicatum 2.541048475 0.206979677 -0.673454547
Herbs Marantaceae Monotagma tomentosum 0.611698656 -0.277854534 -2.084902371
Herbs Marantaceae Monotagma vaginatum 0.716805103 -1.000895548 -2.304358732
Trees Clusiaceae Moronobea coccinea -0.782634658 -0.080736504 0.992474294
Trees Melastomataceae Mouriri sp. -1.918635822 -0.650330771 -0.851343228
Trees Melastomataceae Mouriri angulicosta -1.770049728 1.932921142 -0.845095675
Trees Melastomataceae Mouriri collocarpa -1.240462135 -0.36450096 -1.965338362
Trees Melastomataceae Mouriri dimorphandra -0.937536817 0.381557521 -1.23342068
Trees Melastomataceae Mouriri duckeana -1.760385005 -0.325226379 -1.127021722
Trees Melastomataceae Mouriri duckeanoides -0.096190697 0.536438124 1.289927714
Trees Melastomataceae Mouriri huberi -0.993965112 0.027785957 0.527927898
Trees Melastomataceae Mouriri lunatanthera -1.05987095 -0.875926349 -0.291568981
Trees Melastomataceae Mouriri nigra 2.224671756 1.268642803 -1.285700889
Trees Melastomataceae Mouriri torquata -0.291149175 -0.196315327 -0.610168362
Trees Myrtaceae Myrcia sp. -1.347834617 -0.497814754 -1.812395252
Trees Myrtaceae Myrcia fallax 1.454847604 -0.885530137 -0.199899528
Trees Myrtaceae Myrcia magnoliifolia -0.787483458 -0.315329429 0.825698141
Trees Moraceae Naucleopsis sp. -0.961911711 0.255599222 -1.171123579
Trees Moraceae Naucleopsis caloneura -2.773090351 -0.696423645 -2.337442407
Trees Moraceae Naucleopsis ulei -1.162570278 1.985881727 -2.250254533
Herbs Gesneriaceae˜ Nautilocalyx pictus 1.325946793 -0.132525971 0.096985805
Trees Euphorbiaceae Nealchornea yapurensis -0.516492736 -0.357561399 -1.134179818
Trees Nyctaginaceae Neea sp. -2.185253681 1.275042278 -0.850325634
Trees Nyctaginaceae Neea floribunda -0.365339846 -0.907320812 -0.845534037
Trees Nyctaginaceae Neea madeirana -1.355586094 -0.812151741 -1.096402661
Trees Nyctaginaceae Neea oppositifolia -0.809624393 -0.869623817 -2.10359887
Trees Nyctaginaceae Neea ovalifolia -0.860844847 -1.196050839 -0.892711016
Trees Lauraceae Ocotea sp. -1.782233776 0.922821174 -1.012334242
Trees Lauraceae Ocotea ceanothifolia 0.332007461 -0.908353293 0.028914561

70
Trees Lauraceae Ocotea cinerea -1.893633064 -1.066329304 -1.649716177
Trees Lauraceae Ocotea cujumari -0.807918865 0.127506223 0.779140003
Trees Lauraceae Ocotea immersa 1.234863683 -0.735299182 -2.729910467
Trees Lauraceae Ocotea matogrossensis -1.609894676 -0.526188452 -0.433686996
Trees Lauraceae Ocotea myriantha 1.39308161 0.132096364 0.564520254
Trees Lauraceae Ocotea nigrescens -1.738582417 -0.225273104 0.969389868
Trees Lauraceae Ocotea nitida -0.23938503 0.355965118 0.986637859
Trees Lauraceae Ocotea percurrens -1.750704679 -0.783361143 -1.126435676
Trees Lauraceae Ocotea puberula 0.104406765 -0.686367179 -1.486795689
Trees Lauraceae Ocotea rhodophylla -0.146908689 2.721315044 -0.586031416
Trees Lauraceae Ocotea rhynchophylla 1.098750365 -0.751639807 -2.186218324
Trees Lauraceae Ocotea sp.1 -1.020006189 -0.46642997 -0.525094408
Trees Lauraceae Ocotea sp.2 -1.213898867 -0.67559217 -1.042101168
Trees Lauraceae Ocotea sp.3 -0.997095365 -0.487009636 0.153373819
Trees Lauraceae Ocotea splendens -1.109692904 -0.288869602 -0.706888636
Trees Lauraceae Ocotea subterminalis -1.004524405 -0.109273809 0.394997114
Palms Arecaceae Oenocarpus bacab -3.714869826 -1.35585282 -2.610150249
Palms Arecaceae Oenocarpus bataua 2.416614768 -0.425499409 -4.471637013
Palms Arecaceae Oenocarpus minor -3.15402829 -0.732895835 -1.629202119
Trees Fabaceae Ormosia sp. -0.297739195 2.305170108 -1.206662278
Trees Fabaceae Ormosia grandiflora 0.675193035 -0.587790168 -0.783194177
Trees Fabaceae Ormosia grossa 1.924762498 -0.508524619 -1.875877462
Trees Fabaceae Ormosia paraensis -1.100385404 -0.139165306 -2.885095026
Trees Myristicaceae Osteophloeum platyspermum -0.054474601 1.299916727 -2.006186628
Trees Ochnaceae Ouratea sp. 1.737458742 -0.052442524 0.015781323
Trees Ochnaceae Ouratea discophora 0.427667546 -0.363040036 0.113775284
Lianas Bignoniaceae Pachyptera aromatica -2.73840867 -1.363047355 -2.162001065
Herbs Orchidaceae Palmorchis sobralioides -1.319613096 -0.386136165 0.591651817
Herbs Poaceae Pariana campestris 0.563786998 -0.673127141 -1.426845193
Herbs Poaceae Pariana graciles -2.243681544 1.102727595 -1.363239037

71
Herbs Poaceae Pariana radiciflora 1.05744876 -0.905629431 2.750625582
Herbs Poaceae Pariana sp.2 1.499992028 -0.319110786 -3.383592019
Trees Chrysobalanaceae Parinari excelsa -1.393682867 -1.115789309 -1.107640306
Trees Chrysobalanaceae Parinari parvifolia -0.903695338 -0.917999182 0.055981932
Trees Fabaceae Parkia sp. -0.982033523 -0.396438343 0.064284078
Trees Fabaceae Parkia igneiflora -0.466866358 -0.789284879 0.867860927
Trees Fabaceae Parkia multijuga -0.920993067 0.490266472 -1.107908595
Trees Fabaceae Parkia nitida -0.86207083 -0.014270488 -0.886769463
Trees Fabaceae Parkia panurensis 0.947191636 0.378220848 -2.637608233
Trees Fabaceae Parkia pendula -1.245880855 -0.342648832 -0.035648269
Trees Fabaceae Parkia velutina 1.481454878 2.421028894 -2.446614199
Trees Violaceae Paypayrola grandiflora 0.074092396 1.607449026 0.322671245
Trees Fabaceae Peltogyne sp. 0.636313837 2.452776162 -0.947758862
Trees Fabaceae Peltogyne catingae -0.559183951 0.319444397 -0.31804455
Trees Fabaceae Peltogyne excelsa -1.463581083 -0.922331551 -2.161213149
Trees Fabaceae Peltogyne paniculata -1.278330245 1.85221624 -0.159402391
Herbs Bromeliaceae Pepinia sprucei 1.327848787 -0.802988902 -2.395084671
Trees Peraceae Pera sp. -0.447381726 3.627850025 -0.442841658
Trees Peraceae Pera glabrata -0.847683935 0.288407519 0.378944828
Trees Peraceae Pera schomburgkiana -0.496541196 -0.117903275 -0.6372959
Trees Moraceae Perebea mollis -1.126353242 0.525969925 -1.476327133
Trees Peridiscaceae Peridiscus lucidus 1.229679135 3.040030554 -4.402673048
Herbs Strelitziaceae Phenakospermum guyanense 1.69069411 0.062142697 -1.052708135
Shrubs Piperaceae Piper alatabaccum -1.719386878 0.234882189 -1.0859352
Shrubs Piperaceae Piper baccans 1.36639314 -0.930820905 1.007998883
Shrubs Piperaceae Piper bartlingianum -3.229965695 0.139600555 -2.327089696
Shrubs Piperaceae Piper capitarianum -1.274676863 0.147654668 -0.367410566
Shrubs Piperaceae Piper curtistilum -1.011665338 -1.147036709 -0.004920112
Shrubs Piperaceae Piper cyrtopodon 0.262939813 -0.247262734 0.110644784
Shrubs Piperaceae Piper duckei -1.271727524 0.262323061 -1.541068976

72
Shrubs Piperaceae Piper durilignum -0.074028949 0.262925382 0.474823918
Shrubs Piperaceae Piper erectipilum -1.594751332 -0.403027561 -2.117777066
Shrubs Piperaceae Piper gurupanum -1.336686496 1.269629618 -0.935493756
Shrubs Piperaceae Piper humaytanum 1.114545218 -0.714211279 -0.836393183
Shrubs Piperaceae Piper humillimum -1.077077547 0.701573625 -1.466852686
Shrubs Piperaceae Piper liesneri 1.410759017 0.758936694 -0.619490776
Shrubs Piperaceae Piper mastersianum -0.820603841 0.149808053 -0.788717856
Shrubs Piperaceae Piper mourai -0.888961969 -0.670167007 -0.751849364
Shrubs Piperaceae Piper sp.1 0.240717124 0.491320058 0.036366864
Trees Fabaceae Platymiscium duckei -0.592670864 2.607701093 -0.909950239
Lianas Bignoniaceae Pleonotoma albiflora -1.279827094 -1.92440022 -2.489990896
Lianas Bignoniaceae Pleonotoma dendrotricha -0.702780411 -0.991146885 -0.411027518
Herbs Cyperaceae Pleurostachys sparsiflora -3.054431464 -0.738223153 -1.005923438
Trees Peraceae Pogonophora schomburgkiana -2.113417094 2.610792524 -0.105409854
Ferns Dryopteridaceae Polybotrya osmundaceae 0.760334798 3.646907108 -0.221818783
Trees Metteniusaceae Poraqueiba -0.821083024 -0.011994146 -0.557787965
Trees Metteniusaceae Poraqueiba guianensis -2.469461897 0.471560075 -0.843040387
Trees Urticaceae Pourouma 0.19759586 0.92886628 -1.304686959
Trees Urticaceae Pourouma bicolor -0.773057479 0.926580701 -1.348598503
Trees Urticaceae Pourouma guianensis -0.240258411 -0.940332576 -1.696487362
Trees Urticaceae Pourouma minor 0.112796583 -1.139770693 -2.140797116
Trees Urticaceae Pourouma ovata 0.009458947 -1.484332177 -4.207821344
Trees Urticaceae Pourouma tomentosa 0.032723219 -1.192539968 -2.36607788
Trees Sapotaceae Pouteria sp. -1.430115677 0.238871117 -0.169287577
Trees Sapotaceae Pouteria aff. cuspidata -1.355867437 -0.100928101 0.29082076
Trees Sapotaceae Pouteria aff. gardneri -0.756221536 3.811258645 0.426186059
Trees Sapotaceae Pouteria ambelaniifolia -0.467024774 -0.71177309 -0.177170561
Trees Sapotaceae Pouteria anomala -1.537427031 -1.361547008 -0.103083062
Trees Sapotaceae Pouteria caimito -1.984977507 -0.491846358 -0.700537669
Trees Sapotaceae Pouteria campanulata -1.785217321 0.710133419 -1.192211222

73
Trees Sapotaceae Pouteria cladantha -1.372876136 -0.329826226 1.699235302
Trees Sapotaceae Pouteria cuspidata -1.774558232 -0.533374117 0.905368707
Trees Sapotaceae Pouteria durlandii -2.148982123 -0.640119319 -2.200960225
Trees Sapotaceae Pouteria engleri -0.621049341 -0.334057797 -0.677123176
Trees Sapotaceae Pouteria erythrochrysa -1.550924209 -0.259846037 0.975386
Trees Sapotaceae Pouteria eugeniifolia -1.747782149 -0.067952299 -0.836023036
Trees Sapotaceae Pouteria filipes -2.38010374 -0.869113171 -1.594297081
Trees Sapotaceae Pouteria fimbriata -1.279575312 1.688247508 -1.697240622
Trees Sapotaceae Pouteria flavilatex -1.7717557 0.878858401 -1.420371465
Trees Sapotaceae Pouteria freitasii -1.897555634 -0.409555725 0.145245479
Trees Sapotaceae Pouteria guianensis -2.161212034 1.26385647 -1.397531937
Trees Sapotaceae Pouteria hispida -1.232726145 -0.233784591 -0.280722816
Trees Sapotaceae Pouteria laevigata -0.151014272 2.211878376 1.274712607
Trees Sapotaceae Pouteria macrophylla -1.160702399 0.008455206 -1.142348841
Trees Sapotaceae Pouteria manaosensis -1.379502408 -0.646695566 -0.914569784
Trees Sapotaceae Pouteria maxima 2.090690774 -1.386294177 -1.490440438
Trees Sapotaceae Pouteria minima -0.916547785 -1.125882224 -0.272981271
Trees Sapotaceae Pouteria oblanceolata -1.068881615 -0.937399149 -0.190333502
Trees Sapotaceae Pouteria opposita -1.242063925 -1.232916861 -3.223401634
Trees Sapotaceae Pouteria pallens -0.671284837 0.912118488 -0.29352091
Trees Sapotaceae Pouteria peruviensis -0.7562903 -0.271399509 0.620031592
Trees Sapotaceae Pouteria petiolata 0.028170847 -0.83610806 0.426730217
Trees Sapotaceae Pouteria platyphylla -1.217714416 0.118585266 -0.269007367
Trees Sapotaceae Pouteria reticulata -2.331466311 -1.093473109 -0.997006941
Trees Sapotaceae Pouteria retinervis -1.184316685 -0.597798103 -0.540285253
Trees Sapotaceae Pouteria stipulifera -0.891977212 -0.36820901 -0.032683159
Trees Sapotaceae Pouteria torta -0.814837139 -0.398178759 -2.800567858
Trees Sapotaceae Pouteria venosa -0.01457139 0.930662723 -1.687417739
Trees Sapotaceae Pouteria vernicosa -1.385157142 -0.796286391 -0.026227156
Trees Sapotaceae Pouteria virescens -2.07299455 -0.809694533 -0.719670242

74
Trees Sapotaceae Pouteria williamii 2.143296457 -0.689058309 -1.213731492
Trees Sapotaceae Pradosia cochlearia 1.355978949 0.400217342 1.442652054
Trees Sapotaceae Pradosia decipiens 1.631312891 -0.925741651 -1.923593974
Trees Sapotaceae Pradosia verticillata -0.962343902 -0.698043769 -0.634449328
Trees Burseraceae Protium sp. 2.546496263 -0.354104512 1.784727188
Trees Burseraceae Protium altsonii -1.660140558 1.060771109 -1.407503231
Trees Burseraceae Protium amazonicum -0.371676679 -1.098155178 -1.753939915
Trees Burseraceae Protium apiculatum -3.335232066 -1.07376102 -1.111851505
Trees Burseraceae Protium aracouchini 1.215559965 -0.336321046 -1.61001945
Trees Burseraceae Protium crassipetalum -0.087330071 -1.09253939 1.081252882
Trees Burseraceae Protium decandrum -1.289572927 1.458660812 -2.238528491
Trees Burseraceae Protium divaricatum 2.278639058 -0.399142848 -2.578781627
Trees Burseraceae Protium ferrugineum 0.962073086 -0.34159872 0.028718961
Trees Burseraceae Protium gallosum -0.896141671 -0.007279925 0.060764797
Trees Burseraceae Protium grandifolium 2.328427087 -0.420363478 -1.727115353
Trees Burseraceae Protium hebetatum -4.568234639 -0.870524325 -2.945689979
Trees Burseraceae Protium heptaphyllum 2.357196869 -1.077237811 0.124477454
Trees Burseraceae Protium klugii 1.079722391 -0.309481231 -0.47151273
Trees Burseraceae Protium nitidifolium -1.90813816 -1.187020009 -1.529292723
Trees Burseraceae Protium opacum 1.10098297 -0.266040496 -0.838951572
Trees Burseraceae Protium pallidum -0.685586476 2.962825749 -0.719300523
Trees Burseraceae Protium paniculatum -2.027354177 -0.544712325 -1.065518478
Trees Burseraceae Protium pilosissimum -0.594326679 3.560959211 -0.126344685
Trees Burseraceae Protium polybotryum 0.234228548 -0.853656248 0.233264458
Trees Burseraceae Protium rubrum 1.450228323 -1.086626897 0.207295055
Trees Burseraceae Protium sp. -0.147936732 -0.610868856 -0.657518619
Trees Burseraceae Protium spruceanum -1.526962332 1.176796739 -0.500770979
Trees Burseraceae Protium strumosum -2.102814651 0.479901295 -0.20496053
Trees Burseraceae Protium subserratum 0.598612283 -1.170253531 -0.136363777
Trees Burseraceae Protium trifoliolatum -2.233600378 1.410902581 -0.550351562

75
Trees Sapindaceae Pseudima sp.1 -1.657229203 -0.704941402 -0.475683938
Trees Sapindaceae Pseudolmedia sp. -0.8868003 -0.039375274 0.705853758
Trees Moraceae Pseudolmedia laevigata -1.486957386 -0.166883937 -1.835061671
Trees Moraceae Pseudolmedia laevis -1.889431377 1.770893494 -1.93344087
Trees Fabaceae Pseudopiptadenia psilostachya -2.003464945 -0.539554465 0.596092935
Trees Annonaceae Pseudoxandra coriacea -0.768672986 -0.541393863 0.900032441
Shrubs Rubiaceae Psychotria astrellantha -2.972425558 -0.665648192 -0.637982886
Shrubs Rubiaceae Psychotria bahiensis 1.783669185 0.095686933 -3.518319597
Shrubs Rubiaceae Psychotria brachybotrya -2.189376089 0.953359804 -1.467307874
Shrubs Rubiaceae Psychotria cincta -1.876072792 0.192618506 -0.115822058
Shrubs Rubiaceae Psychotria deinocalyx -0.755365216 -0.481579206 -1.797611485
Shrubs Rubiaceae Psychotria iodotricha -1.412597786 0.371175624 -0.64898057
Shrubs Rubiaceae Psychotria manauensis -1.075026061 0.245609048 -0.835513771
Shrubs Rubiaceae Psychotria mapourioides -0.366432588 -0.260787415 1.318051635
Shrubs Rubiaceae Psychotria medusula 0.094969408 1.804034348 0.672501604
Shrubs Rubiaceae Psychotria pacimonica 0.730669954 3.60866115 0.166323371
Shrubs Rubiaceae Psychotria podocephala -1.957660898 -0.564288022 -1.246402505
Shrubs Rubiaceae Psychotria polycephala -0.322637614 -0.353590862 -2.143148439
Shrubs Rubiaceae Psychotria prancei -2.163860166 0.097121024 -1.242163223
Shrubs Rubiaceae Psychotria rhombibractea -3.333970586 -0.383615955 -3.227846244
Shrubs Rubiaceae Psychotria sciaphila -0.842482938 2.562868695 -2.810250151
Shrubs Rubiaceae Psychotria sphaerocephala -0.843854669 -1.148245443 -2.08777969
Trees Malpighiaceae Pterandra arborea -0.75713884 3.362984235 0.254887657
Trees Fabaceae Pterocarpus officinalis 1.027677961 0.87193532 -0.684290744
Trees Fabaceae Pterocarpus rohrii 0.517088647 0.447215245 -0.886844415
Trees Olacaceae˜ Ptychopetalum olacoides -1.061031587 -0.528913177 0.170302189
Trees Vochysiaceae Qualea sp. -1.059062696 2.537891607 1.263176649
Trees Vochysiaceae Qualea paraensis -1.885367598 1.262974775 -1.662058732
Trees Vochysiaceae Qualea sp.1 0.594296094 -0.496270134 1.105767701
Trees Malvaceae Quararibea sp. -0.46290798 3.781456521 -1.427683551
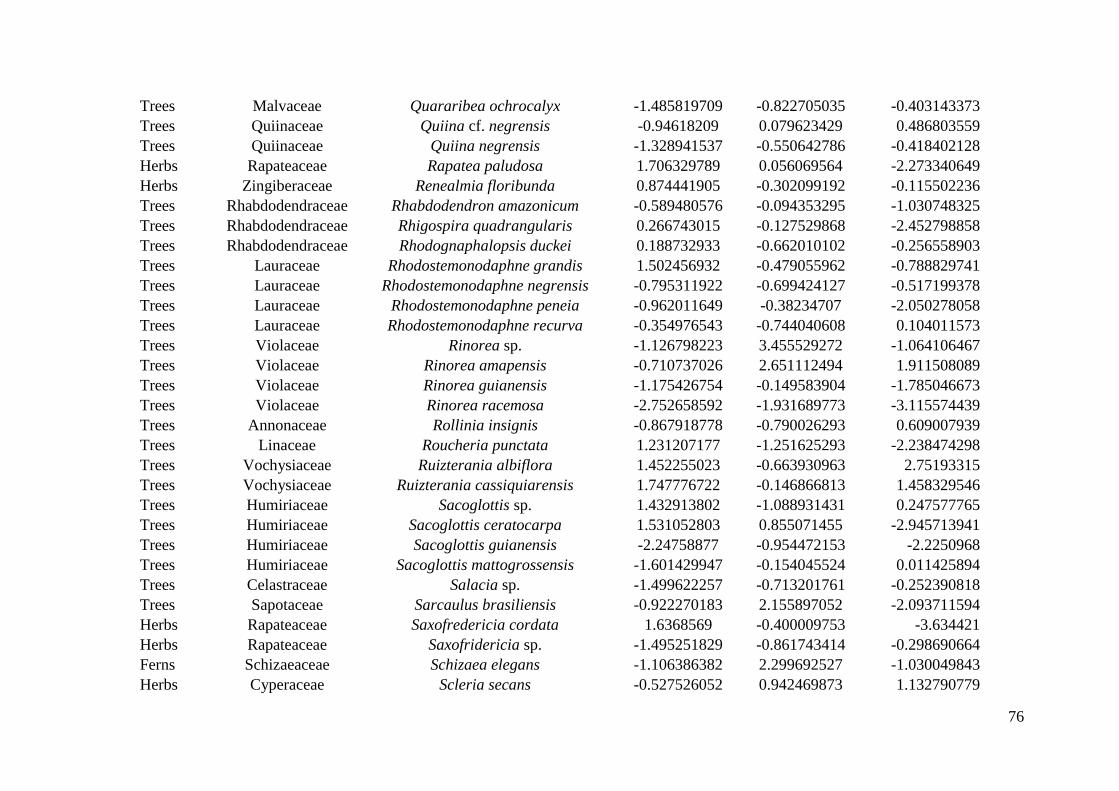
76
Trees Malvaceae Quararibea ochrocalyx -1.485819709 -0.822705035 -0.403143373
Trees Quiinaceae Quiina cf. negrensis -0.94618209 0.079623429 0.486803559
Trees Quiinaceae Quiina negrensis -1.328941537 -0.550642786 -0.418402128
Herbs Rapateaceae Rapatea paludosa 1.706329789 0.056069564 -2.273340649
Herbs Zingiberaceae Renealmia floribunda 0.874441905 -0.302099192 -0.115502236
Trees Rhabdodendraceae Rhabdodendron amazonicum -0.589480576 -0.094353295 -1.030748325
Trees Rhabdodendraceae Rhigospira quadrangularis 0.266743015 -0.127529868 -2.452798858
Trees Rhabdodendraceae Rhodognaphalopsis duckei 0.188732933 -0.662010102 -0.256558903
Trees Lauraceae Rhodostemonodaphne grandis 1.502456932 -0.479055962 -0.788829741
Trees Lauraceae Rhodostemonodaphne negrensis -0.795311922 -0.699424127 -0.517199378
Trees Lauraceae Rhodostemonodaphne peneia -0.962011649 -0.38234707 -2.050278058
Trees Lauraceae Rhodostemonodaphne recurva -0.354976543 -0.744040608 0.104011573
Trees Violaceae Rinorea sp. -1.126798223 3.455529272 -1.064106467
Trees Violaceae Rinorea amapensis -0.710737026 2.651112494 1.911508089
Trees Violaceae Rinorea guianensis -1.175426754 -0.149583904 -1.785046673
Trees Violaceae Rinorea racemosa -2.752658592 -1.931689773 -3.115574439
Trees Annonaceae Rollinia insignis -0.867918778 -0.790026293 0.609007939
Trees Linaceae Roucheria punctata 1.231207177 -1.251625293 -2.238474298
Trees Vochysiaceae Ruizterania albiflora 1.452255023 -0.663930963 2.75193315
Trees Vochysiaceae Ruizterania cassiquiarensis 1.747776722 -0.146866813 1.458329546
Trees Humiriaceae Sacoglottis sp. 1.432913802 -1.088931431 0.247577765
Trees Humiriaceae Sacoglottis ceratocarpa 1.531052803 0.855071455 -2.945713941
Trees Humiriaceae Sacoglottis guianensis -2.24758877 -0.954472153 -2.2250968
Trees Humiriaceae Sacoglottis mattogrossensis -1.601429947 -0.154045524 0.011425894
Trees Celastraceae Salacia sp. -1.499622257 -0.713201761 -0.252390818
Trees Sapotaceae Sarcaulus brasiliensis -0.922270183 2.155897052 -2.093711594
Herbs Rapateaceae Saxofredericia cordata 1.6368569 -0.400009753 -3.634421
Herbs Rapateaceae Saxofridericia sp. -1.495251829 -0.861743414 -0.298690664
Ferns Schizaeaceae Schizaea elegans -1.106386382 2.299692527 -1.030049843
Herbs Cyperaceae Scleria secans -0.527526052 0.942469873 1.132790779

77
Trees Fabaceae Sclerolobium -1.756121946 -0.980373188 -0.361542315
Trees Fabaceae Sclerolobium chrysophyllum -1.356945043 -0.232788374 1.120104723
Trees Fabaceae Sclerolobium guianense -0.335882216 1.466000788 -0.882885302
Trees Fabaceae Sclerolobium melanocarpum -0.785137954 -1.248040533 -1.773983672
Trees Fabaceae Sclerolobium micropetalum -1.459826572 -0.259092922 -1.782344805
Trees Fabaceae Sclerolobium setiferum -0.83990914 -0.016265606 -1.96150076
Trees Fabaceae Sclerolobium sp.1 0.609385677 -0.747938864 -0.613924797
Trees Fabaceae Sclerolobium sp.6 -0.27014441 -0.05446243 -0.156703942
Trees Malvaceae Scleronema micranthum 0.539126357 0.250180929 1.874418649
Ferns Selaginellaceae Selaginella palmiformis -0.641338782 -1.137826513 -0.663910273
Ferns Selaginellaceae Selaginella parkeri 1.293225085 1.634807893 -1.618017637
Trees Euphorbiaceae Senefeldera macrophylla 0.421340583 -0.928651904 -1.227184688
Trees Lauraceae Sextonia rubra -0.593791375 1.341174814 0.063253977
Trees Simaroubaceae Simaba sp. -0.153087301 0.13926986 0.595864018
Trees Simaroubaceae Simaba cedron -0.778186502 0.045114908 0.697932793
Trees Simaroubaceae Simaba polyphylla -0.973909155 -0.787180046 -0.963493595
Trees Simaroubaceae Simaba sp. nova -0.558633781 -1.172315894 0.405089318
Trees Simaroubaceae Simarouba amara 0.728272649 0.755475328 -1.231285888
Trees Siparunaceae Siparuna sp. -0.092653888 0.212806353 -1.623847366
Trees Siparunaceae Siparuna cuspidata -1.022091389 -0.289633225 0.237528078
Trees Siparunaceae Siparuna decipiens -2.317506477 -0.336602725 -1.469543294
Trees Siparunaceae Siparuna glycycarpa -0.555072322 -0.534725831 0.510548468
Trees Siparunaceae Siparuna guianensis -0.799824444 -0.530842285 -0.564238114
Trees Siparunaceae Siparuna sarmentosa -1.110553235 -1.063852548 -1.261984533
Trees Elaeocarpaceae Sloanea sp. 0.602991767 -0.441237744 1.737836734
Trees Elaeocarpaceae Sloanea excelsa -0.901152243 -0.875040951 -1.766197669
Trees Elaeocarpaceae Sloanea floribunda 1.032655884 0.445703826 1.034253856
Trees Elaeocarpaceae Sloanea guianensis 1.011117029 0.537505755 0.588617037
Trees Elaeocarpaceae Sloanea latifolia 0.459878611 2.358902731 1.32516236
Trees Elaeocarpaceae Sloanea nitida 1.74991228 -0.633473318 0.416602925

78
Trees Elaeocarpaceae Sloanea pubescens 0.461015214 -0.088459865 -1.097343474
Trees Elaeocarpaceae Sloanea rufa -0.783003624 -0.756262729 -1.378551721
Trees Elaeocarpaceae Sloanea schomburgkii -0.88365384 2.93809379 -0.896321176
Trees Elaeocarpaceae Sloanea sp.1 -0.973820915 0.608945285 0.59890293
Trees Elaeocarpaceae Sloanea sp.2 -0.802090664 -0.416665275 -0.383456906
Trees Elaeocarpaceae Sloanea synandra 0.547667453 -0.251592161 0.923679688
Palms Arecaceae Socratea exorrhiza 2.649562392 -0.170806858 -0.125342918
Trees Moraceae Sorocea sp. -1.212184925 -1.3420849 -0.28941654
Trees Moraceae Sorocea guilleminiana -1.793486797 -1.241831487 -1.682259697
Herbs Rapateaceae Spathanthus unilateralis 1.414673018 -0.08330975 -3.657234267
Herbs Rapateaceae Spathelia excelsa -0.576422746 -0.730576596 -0.096904208
Trees Malvaceae Sterculia sp. -0.285287983 -0.71313453 1.086266879
Trees Malvaceae Sterculia duckeana 1.255709802 -0.3699548 0.003194925
Trees Malvaceae Sterculia excelsa -1.003582474 -0.1208253 -0.438730218
Trees Malvaceae Sterculia frondosa 1.244871026 -0.638876609 0.146283247
Trees Malvaceae Sterculia pruriens 0.499058878 -0.314410817 -0.642750282
Trees Fabaceae Stryphnodendron -0.606913727 -1.064376265 -0.989004706
Trees Fabaceae Stryphnodendron guianense -0.646459862 0.112300632 0.169624439
Trees Fabaceae Stryphnodendron paniculatum -1.079333491 -0.880671857 -1.278249635
Trees Fabaceae Stryphnodendron pulcherrimum -0.876562231 -0.229592495 -1.042169897
Trees Fabaceae Stryphnodendron racemiferum -2.561345546 -1.023409118 -1.273129149
Trees Fabaceae Swartzia sp. 0.954368856 -0.637482994 0.727694448
Trees Fabaceae Swartzia arborescens -0.144678596 -0.663838926 0.310275959
Trees Fabaceae Swartzia brachyrachis -0.797861205 -0.29415078 0.592343943
Trees Fabaceae Swartzia corrugata 0.157936379 -0.138662937 0.558440623
Trees Fabaceae Swartzia cuspidata 1.648955612 -0.758525877 0.832957995
Trees Fabaceae Swartzia ingifolia -2.015358687 -0.835573271 -1.264489556
Trees Fabaceae Swartzia lamellata -0.536875276 -0.890293107 -1.419053201
Trees Fabaceae Swartzia oblanceolata 1.05039844 -0.24251323 1.125395941
Trees Fabaceae Swartzia panacoco 2.135835784 2.710449597 0.542300748
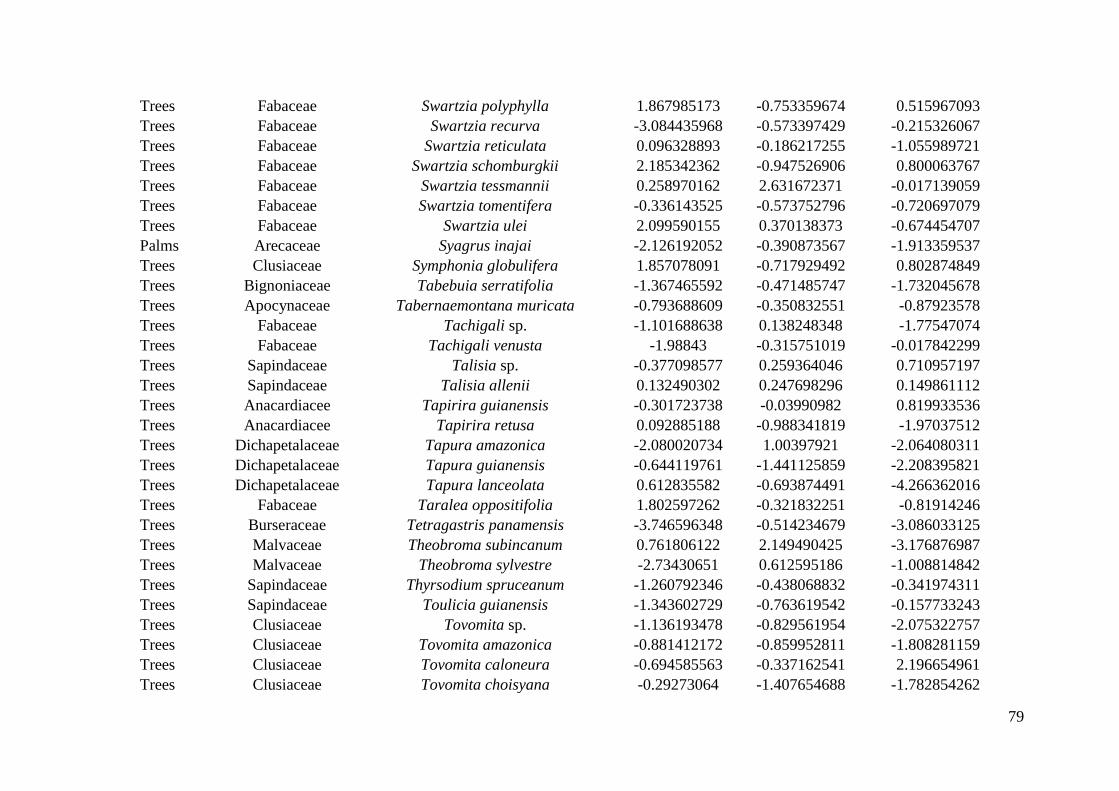
79
Trees Fabaceae Swartzia polyphylla 1.867985173 -0.753359674 0.515967093
Trees Fabaceae Swartzia recurva -3.084435968 -0.573397429 -0.215326067
Trees Fabaceae Swartzia reticulata 0.096328893 -0.186217255 -1.055989721
Trees Fabaceae Swartzia schomburgkii 2.185342362 -0.947526906 0.800063767
Trees Fabaceae Swartzia tessmannii 0.258970162 2.631672371 -0.017139059
Trees Fabaceae Swartzia tomentifera -0.336143525 -0.573752796 -0.720697079
Trees Fabaceae Swartzia ulei 2.099590155 0.370138373 -0.674454707
Palms Arecaceae Syagrus inajai -2.126192052 -0.390873567 -1.913359537
Trees Clusiaceae Symphonia globulifera 1.857078091 -0.717929492 0.802874849
Trees Bignoniaceae Tabebuia serratifolia -1.367465592 -0.471485747 -1.732045678
Trees Apocynaceae Tabernaemontana muricata -0.793688609 -0.350832551 -0.87923578
Trees Fabaceae Tachigali sp. -1.101688638 0.138248348 -1.77547074
Trees Fabaceae Tachigali venusta -1.98843 -0.315751019 -0.017842299
Trees Sapindaceae Talisia sp. -0.377098577 0.259364046 0.710957197
Trees Sapindaceae Talisia allenii 0.132490302 0.247698296 0.149861112
Trees Anacardiacee Tapirira guianensis -0.301723738 -0.03990982 0.819933536
Trees Anacardiacee Tapirira retusa 0.092885188 -0.988341819 -1.97037512
Trees Dichapetalaceae Tapura amazonica -2.080020734 1.00397921 -2.064080311
Trees Dichapetalaceae Tapura guianensis -0.644119761 -1.441125859 -2.208395821
Trees Dichapetalaceae Tapura lanceolata 0.612835582 -0.693874491 -4.266362016
Trees Fabaceae Taralea oppositifolia 1.802597262 -0.321832251 -0.81914246
Trees Burseraceae Tetragastris panamensis -3.746596348 -0.514234679 -3.086033125
Trees Malvaceae Theobroma subincanum 0.761806122 2.149490425 -3.176876987
Trees Malvaceae Theobroma sylvestre -2.73430651 0.612595186 -1.008814842
Trees Sapindaceae Thyrsodium spruceanum -1.260792346 -0.438068832 -0.341974311
Trees Sapindaceae Toulicia guianensis -1.343602729 -0.763619542 -0.157733243
Trees Clusiaceae Tovomita sp. -1.136193478 -0.829561954 -2.075322757
Trees Clusiaceae Tovomita amazonica -0.881412172 -0.859952811 -1.808281159
Trees Clusiaceae Tovomita caloneura -0.694585563 -0.337162541 2.196654961
Trees Clusiaceae Tovomita choisyana -0.29273064 -1.407654688 -1.782854262

80
Trees Clusiaceae Tovomita schomburgkii -0.541357668 -0.573841888 -1.980444518
Trees Burseraceae Trattinnickia sp. -0.895466811 -0.407860501 0.659887465
Trees Burseraceae Trattinnickia burserifolia -1.001183872 -0.93696226 -0.011556763
Trees Burseraceae Trattinnickia glaziovii -0.945424962 -0.441928287 -0.057808844
Trees Burseraceae Trattinnickia peruviana -1.621638769 -0.549230403 -1.549282941
Trees Burseraceae Trattinnickia rhoifolia -0.79494987 0.217443527 -1.233309537
Trees Meliaceae Trichilia sp. -1.415691559 -0.936136329 -2.510844092
Trees Meliaceae Trichilia aff. schomburgkii -0.952704131 0.122590692 -0.278590306
Trees Meliaceae Trichilia cipo -1.038073267 -0.206338953 -1.300646045
Trees Meliaceae Trichilia micrantha -1.246920909 -0.152626515 -0.754598411
Trees Meliaceae Trichilia pallida -1.61486559 -0.413611884 1.272554933
Trees Meliaceae Trichilia schomburgkii -0.855812057 -0.385340659 -0.733674488
Trees Meliaceae Trichilia septentrionalis -1.568952064 -0.010830455 -1.057310672
Ferns Hymenophyllaceae Trichomanes cellulosum 0.774586529 -0.541928437 -2.19644505
Ferns Hymenophyllaceae Trichomanes elegans -0.798835646 -1.212010605 -1.263164136
Ferns Hymenophyllaceae Trichomanes pinnatum -2.420697483 1.425287425 -3.304258084
Ferns Hymenophyllaceae Trichomanes sp.1 -3.190779139 -1.226961319 -3.308036089
Ferns Hymenophyllaceae Trichomanes trollii -0.263386674 3.840000789 -1.847255121
Ferns Tectariaceae Triplophyllum dicksonioides -3.050164823 1.317453106 -2.79934101
Trees Moraceae Trymatococcus amazonicus -3.069194109 0.815524293 -2.309752825
Lianas Bignoniaceae Tynanthus panurensis -1.511263461 -0.719735322 -1.843007607
Trees Annonaceae Unonopsis sp. -0.920799563 -0.554855379 0.638930994
Trees Annonaceae Unonopsis duckei -2.230182431 -1.276048124 -2.535624383
Trees Annonaceae Unonopsis stipitata -1.868952455 -0.489851092 -0.699873087
Trees Humiriaceae Vantanea sp. 1.907169382 0.749253644 0.09071856
Trees Humiriaceae Vantanea guianensis 0.278387025 -0.731060512 -0.596387087
Trees Humiriaceae Vantanea macrocarpa -1.088128711 -0.618825107 0.182192072
Trees Humiriaceae Vantanea micrantha -1.31561532 -0.245516942 -1.024896746
Trees Humiriaceae Vantanea parviflora 1.301997706 0.071517345 -1.344876411
Trees Fabaceae Vatairea paraensis 2.308896264 -0.690162815 1.575787416

81
Trees Fabaceae Vatairea sericea -1.708457528 -1.368855967 -1.619124298
Trees Myristicaceae Virola sp.1 1.80172201 -0.670786755 -0.035664163
Trees Myristicaceae Virola caducifolia 0.310029212 -0.101639538 2.210278569
Trees Myristicaceae Virola calophylla 0.988771288 1.616373616 -1.24099599
Trees Myristicaceae Virola guggenheimii -0.286558387 0.713902286 -2.101907352
Trees Myristicaceae Virola mollissima -1.777640218 -0.902795993 -1.484635158
Trees Myristicaceae Virola multicostata -0.738189259 -0.544185294 -1.897404335
Trees Myristicaceae Virola multinervia -1.471648586 -0.290182012 -0.494101143
Trees Myristicaceae Virola pavonis 1.311766892 -0.401699992 -2.267809311
Trees Myristicaceae Virola sp.2 0.594355735 -0.366221237 -1.281715282
Trees Myristicaceae Virola theiodora -1.481091055 -0.626676589 0.722971793
Trees Myristicaceae Virola venosa -2.478460201 0.158997853 -2.554347468
Trees Lamiaceae Vitex sprucei 1.249255458 -0.242088755 -3.441177804
Trees Lamiaceae Vitex triflora -0.751047109 -0.226498503 0.47924463
Trees Vochysiaceae Vochysia sp. -1.264171454 -0.072152907 -0.895316215
Trees Vochysiaceae Vochysia biloba -0.332187403 1.135856517 0.307153964
Trees Vochysiaceae Vochysia rufescens -0.946038071 -0.037996346 -0.151401429
Trees Vochysiaceae Vochysia sp.2 -0.392643761 0.109650892 -0.454973664
Trees Fabaceae Vouacapoua pallidior 0.420038886 3.139338145 -2.695130701
Trees Rubiaceae Warszewiczia schwackei -1.206993658 0.632425069 -1.686463567
Trees Annonaceae Xylopia sp. 1.903652884 -0.488380118 1.33277281
Trees Annonaceae Xylopia amazonica -0.299083337 0.468111524 -0.387835397
Trees Annonaceae Xylopia benthamii 2.373417669 -0.987288139 -0.528127966
Trees Annonaceae Xylopia nitida 0.242160146 -0.385343827 -0.285691846
Trees Annonaceae Xylopia parviflora -0.688227302 2.559058527 1.310357997
Trees Annonaceae Xylopia polyantha -0.164950294 0.303058294 1.816717768
Trees Fabaceae Zygia racemosa -4.331918178 -1.355643445 -3.300990952
Trees Fabaceae Zygia ramiflora -2.044062299 -0.873740787 -0.158110487

82
Fig. S1 Ducke Reserve in the Central Amazon, Brazil. Darker colors represent higher areas (plateaus and vertentes) and lighter colors represent
lower areas (baixios). White line countours the Reserve limits and yellow dots indicate the locations of the 250 m transect permanent plots on a 1
km equidistant sampling grid where it were sampled the lifeforms of A: Lianas, B: Herbs , C: Ferns, D: Trees, palms and shurbs.

CONCLUSÃO GERAL
Existem muitos trabalhos sobre a especialização de espécies, sendo esse um
tema recorrente na literatura desde o início do século passado. As medidas de
especialização geralmente usam a abundância maior das espécies em certos locais como
um indicativo de que a espécie é especialista (naquele mesmo local). Essa é uma
maneira pouco eficiente de se avaliar especialização na Amazônia, cujas comunidades
são compostas majoritariamente por espécies pouco abundantes. Dessa forma, o índice
de especialização adaptado do Standard Effect Size, usado nesse trabalho, parece
funcionar muito bem também para esse tipo de comunidade, dado que utiliza medidas
do desvio padrão da ocorrência, comparado com um modelo nulo. A principal vantagem
desse modelo é que ele pode ser calculado para espécies com poucas ocorrências.
A especialização nos gradientes que medimos varia entre as formas de vida
estudadas e não seguem o padrão de biomassa (espécies maiores não são
necessariamente mais generalistas que as menores). Isso deve se dar ao fato de que cada
forma de vida parece viver em uma faixa variável de tolerância no gradiente.
Acreditamos que samambaias, por exemplo, devem tolerar faixas muito maiores do
gradiente de soma de bases do que aquele encontrado na área de estudo. Além disso,
formas de vida de tamanho intermediário, como as lianas e as palmeiras, foram muito
congruentes às respostas aos gradientes, principalmente aos de fertilidade. Essas formas
de vida já foram consideradas muito congruentes em gradientes topográficos e também
bons substitutos para a comunidade de plantas (veja Landeiro et al. 2012 – referenciado
no artigo).
As formas de vida responderam de forma diferente aos três gradientes analisados
e, samambaias e árvores, foram aqueles que tiveram diferenças significativas entre os
três. A água (HAND) gerou mais especialização na maioria das formas de vida,
indicando que é um importante gerador de especialização nas comunidades vegetais.
Discordando de nossas hipóteses, o HAND foi o maior gerador de especialização
comparado ao fósforo e à soma de bases, dois dos mais importantes nutrientes para as
plantas e também muito escassos nos solos da Amazônia Central. Apesar de água estar
disponível na maior parte do ano, com uma curta estação seca, algumas espécies
parecem ou não tolerar a falta de água nos lugares mais altos (platôs) ou não conseguir
lidar com a anóxia e outras adversidades das áreas mais facilmente alagáveis (baixios).

84
Sugerimos que outros trabalhos busquem entender como as espécies se
especializam em certas faixas de gradientes e, como essa especialização difere entre os
diferentes grupos funcionais dentro das assembleias comumente estudadas. Além disso,
sugerimos o uso mais frequente do HAND nos trabalhos de ecologia, visto que é um
excelente preditor da comunidade de plantas e seus aspectos intrínsecos em mesoescala.