ministÉrio da educaÇÃo universidade federal ......11 resumo copernicia prunifera (miller) h.e....
TRANSCRIPT

MINISTÉRIO DA EDUCAÇÃO
UNIVERSIDADE FEDERAL DO RIO GRANDE DO NORTE
PRÓ-REITORIA DE PÓS-GRADUAÇÃO
UNIDADE ACADÊMICA ESPECIALIZADA EM CIÊNCIAS AGRÁRIAS - UECIA
PROGRAMA DE PÓS-GRADUAÇÃO EM CIÊNCIAS FLORESTAIS
DISSERTAÇÃO
MODELAGEM DE NICHO ECOLÓGICO E DIVERSIDADE GENÉTICA DE Copernicia
prunifera (Miller) H.E. Moore (ARECACEAE): IMPLICAÇÕES PARA A
CONSERVAÇÃO
JÉSSICA RITCHELE MOURA DOS SANTOS
Macaíba-RN
2017

2
JÉSSICA RITCHELE MOURA DOS SANTOS
MODELAGEM DE NICHO ECOLÓGICO E DIVERSIDADE GENÉTICA DE Copernicia
prunifera (Miller) H.E. Moore (ARECACEAE): IMPLICAÇÕES PARA A
CONSERVAÇÃO
Orientador: Prof. Dr. Fábio de Almeida Vieira
Macaíba-RN
2017
Dissertação de Mestrado apresentada ao Programa
de Pós-Graduação em Ciências Florestais da
Universidade Federal do Rio Grande do Norte,
como pré-requisito para obtenção do título de
Mestre.

3
Universidade Federal do Rio Grande do Norte - UFRN
Sistema de Bibliotecas - SISBI
Catalogação de Publicação na Fonte. UFRN - Biblioteca Setorial da Escola Agrícola Jundiaí - EAJ
Santos, Jéssica Ritchele Moura dos.
Modelagem de nicho ecológico e diversidade genética de
Copernicia prunifera (Miller) H.E. Moore (Arecaceae): implicações
para a conservação / Jéssica Ritchele Moura dos Santos. -
Macaíba/RN, 2017. 56f.: il.
Dissertação (Mestre) Universidade Federal do Rio Grande do
Norte, Unidade Acadêmica Especializada em Ciências Agrárias
Campus Macaíba, Programa de Pós-Graduação em Ciências Florestais.
Orientador: Prof. Dr. Fábio de Almeida Vieira.
1. Carnaúba - Dissertação. 2. Gargalo genético - Dissertação.
3. ISSR - Dissertação. 4. Predição de habitat - Dissertação. I.
Vieira, Fábio de Almeida. II. Título.
RN/UF/BSPRH CDU 633.9

4

5
DEDICO
A minha avó, Maria Araújo de Moura
- In Memoriam

6
AGRADECIMENTOS
A Deus, pela oportunidade de iniciar e concluir o mestrado e por me guiar em todos os momentos
da minha vida.
Aos meus pais Marilene e Sérgio, e ao meu irmão Jefferson pelo incentivo e por acreditarem em
mim.
Aos meus avós, Antônio e Conceição (in memoriam), Roselita e Zequinha, por construírem a
base da minha família.
A todos os familiares que acompanharam minha caminhada e que torceram por minha vitória.
Ao meu orientador, professor Dr. Fábio de Almeida Vieira, pela paciência e atenção.
A professora Drª Cristiane, pelo apoio em minha graduação e mestrado.
Aos meus queridos amigos, Anny e Richeliel por toda amizade e companheirismo em mais uma
etapa da minha formação.
A todos os amigos do Laboratório de Genética e Melhoramento Florestal (LabGeM) –
UAECIA/UFRN por me acolher e proporcionar bons momentos de aprendizado e descontração.
E a todos que de forma direta ou indiretamente contribuíram para a realização deste trabalho.
Meus sinceros agradecimentos!

7
SUMÁRIO
APRESENTAÇÃO ........................................................................................................................ 10
RESUMO....................................................................................................................................... 11
ABSTRACT .................................................................................................................................. 12
INTRODUÇÃO ............................................................................................................................. 13
REFERÊNCIAS ............................................................................................................................ 14
Capítulo 1: DISTRIBUIÇÃO GEOGRÁFICA DA PALMEIRA Copernicia prunifera (Miller) H.
E. Moore COM BASE EM MODELAGEM DE NICHO ECOLÓGICO ..................................... 16
RESUMO....................................................................................................................................... 16
ABSTRACT .................................................................................................................................. 16
INTRODUÇÃO ............................................................................................................................. 17
MATERIAL E MÉTODOS ........................................................................................................... 19
RESULTADOS E DISCUSSÃO................................................................................................... 20
CONCLUSÕES ............................................................................................................................. 22
AGRADECIMENTOS .................................................................................................................. 22
REFERÊNCIAS.............................................................................................................................23
ANEXO I........................................................................................................................................27
Capítulo 2: GENETIC DIVERSITY OF Copernicia prunifera (Miller) H.E. Moore
(ARECACEAE): IMPLICATIONS FOR CONSERVATION…………………….….................30
ABSTRACT...................................................................................................................................30
INTRODUCTION………………………………………………………………………………..30
MATERIAL AND METHODS……………………………………………………….….............32
RESULTS………………………………………………………………………………………...37
DISCUSSION…………………………………………...……………………………………......45
IMPLICATIONS FOR CONSERVATION……………………………………………………...48
ACKNOWLEDGMENTS…………………………………………………………………..........49
REFERENCES…………………………………………………………………………………...49
CONCLUSÕES ............................................................................................................................. 56

8
LISTA DE FIGURAS
CAPÍTULO 1:
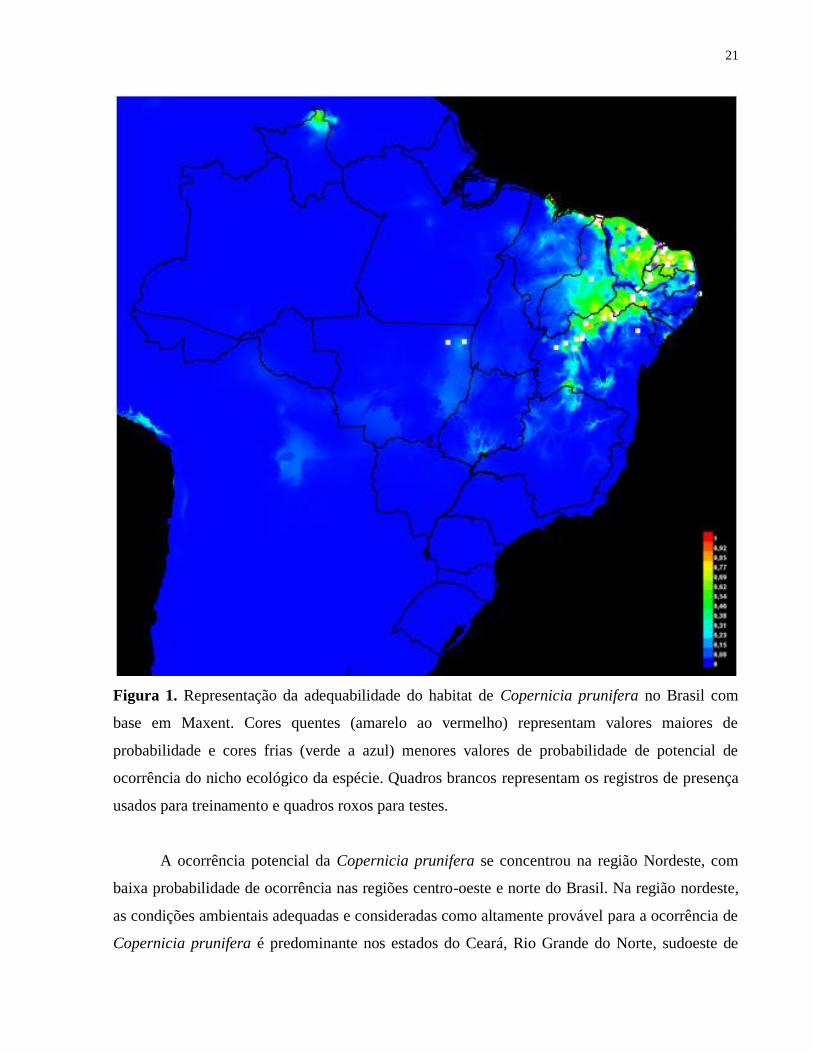
Figura 1. Representação da adequabilidade do habitat de Copernicia prunifera no Brasil com
base em Maxent. Cores quentes (amarelo ao vermelho) representam valores maiores de
probabilidade e cores frias (verde a azul) menores valores de probabilidade de potencial de
ocorrência do nicho ecológico da espécie. Quadros brancos representam os registros de presença
usados para treinamento e quadros roxos para testes.....................................................................21
CAPÍTULO 2:
Figure 1. Geographic location of the sampled populations of Copernicia prunifera in Rio Grande
do Norte and Ceará States, Brazil……………………………………………...…………………33
Figure 2. Pattern of ISSR amplification fragments resulting from UBC primer 857 for 12
Copernicia prunifera individuals from the Apodi population, Rio Grande do Norte. L = Ladder 1
kb....................................................................................................................................................37
Figure 3. Relationship between the genetic and geographic distances between Copernicia
prunifera populations….................................................................................................................40
Figure 4. UPGMA dendrogram based on Nei’s genetic identity between the 11 studied
Copernicia prunifera populations……..........................................................................................41
Figure 5. Principal component analysis of the studied Copernicia prunifera populations, based
on Nei’s genetic distance…….......................................................................................................42
Figure 6. Plot of the mean values of LnP (D) of the Bayesian analysis (solid line) and ΔK
analysis (dotted line). The bars indicate standard deviations of LnP (D) values...........................43
Figure 7. Bayesian analysis of Copernicia prunifera with the proportion of genotypes in the
sampled populations. The dark vertical lines delimit populations.................................................43

9
LISTA DE TABELAS
CAPÍTULO 1:
Tabela 1. Variáveis utilizadas na modelação da área de distribuição potencial de Copernicia
prunifera e sua contribuição percentual utilizadas na construção do modelo com Maxent. Fonte:
WorldClim (2016) .........................................................................................................................26
CAPÍTULO 2:
Table 1. Location of sampled Copernicia prunifera populations, population code, geographic
coordinates, number of individuals, and region of occurrence. RN - Rio Grande do Norte; CE –
Ceará…….......................................................................................................................................34
Table 2. Nucleotide sequence of ISSR primers, number of loci, and PIC value of each primer...37
Table 3. Genetic diversity parameters of Copernicia prunifera natural populations………...….38
Table 4. Estimates of genetic distance (Nei, 1978) below the diagonal, and geographic distance
(km) above the diagonal, between populations of Copernicia prunifera. Minimum and maximum
values are shown in bold................................................................................................................39
Table 5. Analysis of molecular variance (AMOVA) between and within Copernicia prunifera
populations……………………………..........................................................................................39
Table 6. Matrix of historical gene flow values among pairs of Copernicia prunifera populations.
Minimum and maximum values are shown in bold.......................................................................41
Table 7. Tests of equilibrium between mutation and genetic drift for the studied Copernicia
prunifera populations based on IAM and SMM models………………..………………………..44
10
APRESENTAÇÃO
A presente dissertação está organizada em dois capítulos constituídos de artigos
elaborados a partir de estudos realizados com a espécie Copernicia prunifera (Miller) H. E
Moore. O primeiro capítulo “Distribuição geográfica da palmeira Copernicia prunifera com base
em modelagem de nicho ecológico” tem como objetivo estudar a distribuição geográfica de
Copernicia prunifera e identificar as variáveis ambientais que influenciam na sua distribuição,
usando como ferramenta a modelagem de nicho ecológico. Foi submetido a revista Pesquisa
Agropecuária Brasileira.
O segundo capítulo se refere ao artigo “Genetic diversity of Copernicia prunifera (Miller)
H.E. Moore (Arecaceae): implications for conservation” e objetivou analisar a diversidade
genética entre populações naturais de Copernicia prunifera. Será submetido ao periódico
Biodiversity and Conservation.

11
RESUMO
Copernicia prunifera (Miller) H.E. Moore é uma palmeira nativa do nordeste do Brasil, possui
múltiplas formas de uso, sendo seu principal produto o pó cerífero. Devido ao extrativismo
realizado ao longo dos anos nas populações naturais da espécie, estudos sobre a distribuição
geográfica e diversidade genética de suas populações são cada vez mais necessários. Desta forma,
o presente trabalho teve como objetivos estudar a distribuição geográfica de Copernicia prunifera
como base em modelagem de nicho ecológico (MNE) e analisar a diversidade genética entre
populações naturais da espécie. Os modelos de nicho ecológico foram construídos baseados em
80 pontos de ocorrência da espécie e em 19 variáveis ambientais. Os resultados gerados sugerem
que o modelo de distribuição potencial da Copernicia prunifera se concentrou nos estados do
Ceará, Rio Grande do Norte, sudoeste de Pernambuco, norte da Bahia e vale do Rio São
Francisco, norte e sudoeste do Piauí e norte do Maranhão. A variável ambiental que mais
contribuiu com a MNE foi a precipitação do trimestre mais seco. No estudo de diversidade
genética foram amostrados 180 indivíduos distribuídos em 11 populações naturais nos estados do
Rio Grande do Norte e Ceará. Sete iniciadores ISSR foram utilizados e forneceram 100 locos
com 99,09% de polimorfismo. O Conteúdo de informação polimórfica (PIC) de cada iniciador foi
considerado mediamente informativo. A diversidade genética de Nei (He) variou de 0,071 a
0,288 e o Índice de Shannon (I) de 0,103 a 0,418. A AMOVA indicou maior variação genética
entre indivíduos dentro das populações (58,11%) do que entre as populações (41,89%). O teste de
Mantel revelou correlação positiva e significativa (r = 0,423; P = 0,006) entre as distâncias
genéticas e geográficas, sugerindo isolamento pela distância. O maior valor de fluxo gênico
ocorreu entre as populações de AR1 e AR2 (Nm = 29), assim como a maior semelhança genética.
A análise bayesiana revelou que os genótipos foram divididos em três grupos distintos (K=3). A
maioria das populações apresentaram gargalo genético populacionais. Os resultados obtidos
sugerem que as populações de Copernicia prunifera estão perdendo sua diversidade genética,
sendo necessárias medidas de conservação de suas populações a fim de minimizar a perda de
alelos importantes, contribuindo para manutenção da espécie.
Palavras-chave: Carnaúba; Gargalo genético; ISSR; Predição de habitat.

12
ABSTRACT
Copernicia prunifera (Miller) H.E. Moore is a native palm tree from northeastern Brazil, it has
multiple forms of use, its main product being the ceriferous powder. Due to the extractivism
carried out over the years in the natural populations of the species, studies on the geographical
distribution and genetic diversity of their populations are increasingly necessary. The present
study aimed to study the geographic distribution of Copernicia prunifera as a basis in ecological
niche modeling (MNE) and to analyze the genetic diversity among natural populations of the
species. The ecological niche models were constructed based on 80 species occurrence points and
on 19 environmental variables. The results suggest that the potential distribution model of
Copernicia prunifera was concentrated in the states of Ceará, Rio Grande do Norte, southwest of
Pernambuco, north of Bahia and the valley of the São Francisco River, north and southwest of
Piauí and north of Maranhão. The environmental variable that contributed most to the MNE was
the rainfall of the driest quarter. In the study of genetic diversity 180 individuals were sampled in
11 natural populations in the states of Rio Grande do Norte and Ceará. Seven ISSR primers were
used and provided 100 locus with 99.09% polymorphism. The Polymorphic Information Content
(PIC) of each primer was considered to be medium to informative. The genetic diversity of Nei
(He) ranged from 0.071 to 0.288 and the Shannon Index (I) ranged from 0.103 to 0.418. AMOVA
indicated greater genetic variation among individuals within populations (58.11%) than among
populations (41.89%). The Mantel test revealed a positive and significant correlation (r = 0.423;
P = 0.006) between the genetic and geographic distances, suggesting isolation by distance. The
highest value of gene flow occurred among the populations of AR1 and AR2 (Nm = 29), as well
as the greatest genetic similarity. Bayesian analysis revealed that the genotypes were divided into
three distinct groups (K = 3). Most populations presented genetic bottleneck populations. Most
populations presented genetic bottleneck populations. The results suggest that the populations of
Copernicia prunifera are losing their genetic diversity, being necessary measures of conservation
of their populations in order to minimize the loss of important alleles, contributing to the
maintenance of the species.
Key words: Carnauba; Bottleneck; Habitat prediction; ISSR.

13
INTRODUÇÃO
A palmeira Copernicia prunifera (Miller) H.E. Moore é uma espécie nativa do Nordeste
do Brasil, pertencente à família Arecaceae. Conhecida popularmente por carnaúba, pode ser
encontrada principalmente nos estados do Piauí, Ceará e Rio Grande do Norte. A espécie é
conhecida como árvore da vida, pois oferece ao homem uma infinidade de usos dos produtos dela
extraídos, com produtos bem aceitos no mercado e valor econômico agregado (GOMES et al.,
2009).
As práticas extrativistas da espécie vêm mantendo a várias décadas grande importância
econômica no Nordeste brasileiro, principalmente em períodos de estiagem com o corte das
folhas dos carnaubais. A extensa exploração das populações naturais de Copernicia prunifera
pode ocasionar fragmentação florestal que resulta na redução da diversidade genética
(CARDOSO et al., 2000). Ademais, as práticas extrativistas de forma desordenada favorecem a
redução do tamanho efetivo populacional, compromete a taxa de cruzamento entre os indivíduos
e o comportamento dos dispersores e polinizadores afetando a estrutura genética das populações,
assim, contribuindo com o aumento dos níveis de endogamia e na redução da heterozigosidade
(YOUNG et al., 1996). De fato, segundo Vieira et al. (2016), a extração mensal das folhas
imaturas da Coperncia prunifera a 50% e 75%, ocasionou a redução da produção de folhas,
flores, frutos e sementes, assim, tais autores sugerem que a taxa de extração mensal das folhas
não exceda 25% e que haja um pousio preferencialmente durante o período de maturação dos
frutos, para minimizar os danos no desenvolvimento da espécie.
Para se compreender como a diversidade genética é distribuída estudos de diversidade e
estrutura genética são necessários (NYBOM; BARTISH, 2000) aliado aos marcadores
moleculares que podem ser utilizados como ferramentas para avaliar a diversidade genética entre
indivíduos (CHAGAS et al., 2015) e dentro e entre populações (SANTOS et al., 2015).
Com isso, conhecer a diversidade genética de populações naturais é importante na geração
de informações úteis para definir estratégias de conservação e manejo das espécies (DUARTE et
al., 2015). Além disso, conhecer a distribuição geográfica de uma espécie é também fundamental
para elaboração de programas de conservação. Para isso, estudos de modelagem de nicho
ecológico são amplamente utilizados para estimar a relação entre as espécies e seus locais de
ocorrência, predizendo áreas que uma espécie pode potencialmente se estabelecer (ELITH et al.,
2011). Para tais estudos o software Maxent tem sido bastante empregado, necessitando apenas

14
dados de presença da espécie e de variáveis ambientais para gerar modelos de nicho ecológico e
tem frequentemente demonstrado melhor desempenho que outros algoritmos (ELITH et al., 2006;
PHILLIPS et al., 2006; PETERSON et al., 2007).
Neste contexto, o trabalho teve como objetivos:
• Estudar a distribuição geográfica de Copernicia prunifera e identificar as variáveis
ambientais que influenciam na sua distribuição;
• Analisar a diversidade genética entre populações naturais de Copernicia prunifera.
• Verificar se há correlação entre distância genética e distância geográfica nas populações
amostradas;
• Estimar o fluxo gênico histórico entre as populações de Copernicia prunifera;
• Avaliar a similaridade genética entre as populações estudadas;
• Observar a ocorrência de possíveis gargalos genéticos populacionais;
• Definir populações prioritárias para conservação.
REFERÊNCIAS
CARDOSO, S. R. S.; ELOY, N. B.; PROVAN, J.; CARDOSO, M. A.; FERREIRA, P. C. G.
Genetic differentiation of Euterpe edulis Mart. populations estimated by AFLP analysis.
Molecular Ecology, n. 9, p. 1753–1760, 2000.
CHAGAS, K. P. T.; SOUSA, R. F.; FAJARDO, C. G.; VIEIRA, F. A. Seleção de marcadores
ISSR e diversidade genética em uma população de Elaeis guineenses. Agrária, v.10, n.1, p.147-
152, 2015.
DUARTE, J. F.; CARVALHO, D.; VIEIRA, F. A. Genetic conservation of Ficus
bonijesulapensis R.M. Castro in a dry forest on limestone outcrops. Biochemical Systematics
and Ecology, v. 59, p. 54-62, 2015.
ELITH, J.; PHILLIPS, S. J.; HASTIE, T., DUDIK, M.; CHEE, Y.; YATES, C. J. A statistical
explanation of MaxEnt for ecologists. Diversity and Distributions, n 17, p. 43–57. 2011.
ELITH, J.; GRAHAM, C.H.; ANDERSON, R.P.; DUDÍK, M.; FERRIER, S.; GUISAN, A.;
HIJMANS, R.J.; HUETTMANN, F.; LEATHWICK, J.R.; LEHMANN, A.; LI, J.; LOHMANN,
L.G.; LOISELLE, B.A.; MANION, G.; MORITZ, C.; NAKAMURA, M.; NAKAZAWA, Y.;
OVERTON, J.M.; PETERSON, A.T.; PHILLIPS, S.J.; RICHARDSON, K.; SCACHETTI-

15
PEREIRA, R.; SCHAPIRE, R.E.; SOBERÓN, J.; WILLIAMS, S.; WISZ, M.S.;
ZIMMERMANN, N.E. Novel methods improve prediction of species distributions from
occurrence data. Ecography, v. 29, p. 129-151, 2006.
GOMES, J.A.F.; LEITE, E.R.; CAVALCANTE, A.C.R.; CÂNDIDO, M.J.D.; LEMPP, B.;
BOMFIM, M.A.D.; ROGÉRIO, M.C.P. Resíduo agroindustrial da carnaúba como fonte de
volumoso para a terminação de ovinos. Pesquisa Agropecuária Brasileira, v.44, n.1, p.58- 67,
2009.
NYBOM, H.; BARTISH, I. V. Effects of life history traits and sampling strategies on genetic
diversity estimates obtained with RAPD markers in plants. Perspectives in Plant Ecology,
Evolution and Systematics, Zurich, v. 3, n. 2, p. 93-114, 2000.
PETERSON, T.; PAPES, M.; EATON, M. Transferability and model evaluation in ecological
niche modeling: a comparison of GARP and Maxent. Ecography, v. 30, p. 550-560. 2007.
PHILLIPS, S. J.; ANDERSON, R. P.; SCHAPIRE, R. E. Maximum entropy modeling of species
geographic distributions. Ecological Modelling, v. 190, p. 231-259. 2006.
SANTOS, R. R. M.; CAVALLARI, M. M.; PIMENTA, M. A. S.; ABREU, A. G.; COSTA, M.
R.; GUEDES, M. L. Population genetic structure of Attalea vitrivir Zona (Arecaceae) in
fragmented areas of southeast Brazil. Genetics and Molecular Research, v.14, p. 6472-6481,
2015.
VIEIRA, I. R.; OLIVEIRA, J. S.; LOIOLA, M. I. B. Effects of harvesting on leaf production and
reproductive performance of Copernicia prunifera (Miller) H.E. Moore. Revista Árvore,
Viçosa-MG, v.40, n.1, p.117-123, 2016.
YOUNG, A.; BOYLE, T.; BROWN, T. The population genetic consequences of habitat
fragmentation for plants. Trends Ecology Evolutionary, Oxford, v. 11, n. 10, p. 413-418, Oct.
1996.
16
CAPÍTULO 1: DISTRIBUIÇÃO GEOGRÁFICA DA PALMEIRA Copernicia prunifera
COM BASE EM MODELAGEM DE NICHO ECOLÓGICO
RESUMO – Estudos de modelagem de nicho ecológico são ferramentas importantes para prever
áreas de potencial ocorrência para espécies, auxiliando programas de conservação. Dessa forma,
o objetivo deste trabalho foi estudar a distribuição geográfica da palmeira Copernicia prunifera e
identificar as variáveis ambientais que influenciam na sua distribuição. Através da modelagem de
nicho ecológico (MNE) utilizando o algoritmo de máxima entropia (Maxent) com base em 80
pontos de ocorrência conhecidos, foram gerados mapas preditivos da distribuição potencial da
espécie. A ocorrência potencial da Copernicia prunifera se concentrou nos estados do Ceará, Rio
Grande do Norte, sudoeste de Pernambuco, norte da Bahia e vale do Rio São Francisco, norte e
sudoeste do Piauí e norte do Maranhão. A variável ambiental que mais contribuiu para o modelo
foi a precipitação do trimestre mais seco. Este é o primeiro estudo utilizando a modelagem de
nicho ecológico para prever a distribuição da Copernicia prunifera no Brasil. Tais informações
serão úteis para estudos de filogeografia e distribuição geográfica, contribuindo com informações
para o estabelecimento de estratégias de conservação da espécie.
PALAVRAS-CHAVE: Arecaceae, Caatinga, Carnaúba, Maxent, Predição de habitat.
GEOGRAPHICAL DISTRIBUTION OF THE PALM Copernicia prunifera BASED ON
ECOLOGICAL NICHE MODELING
ABSTRACT – Ecological niche modeling studies are important tools for predicting areas of
potential occurrence for species, supporting conservation programs. Thus, the objective of this
work was to study the geographical distribution of the palm tree Copernicia prunifera known as
carnauba and identify environmental variables that influence on their distribution. Through
ecological niche modeling (MNE) using the Maximo entropy algorithm (Maxent) based on 80
known occurrence points, predictive maps of the potential distribution of the species were
generated. The potential occurrence of Copernicia prunifera was concentrated in the states of
Ceará, Rio Grande do Norte, southwest of Pernambuco, north of Bahia and the valley of the São
Francisco River, north and southwest of Piauí and north of Maranhão. The environmental
variable that contributed most to the model was the precipitation of the driest quarter. This is the

17
first study using ecological niche modeling to predict the distribution of Copernicia prunifera in
Brazil. Such information will be useful for studies of phylogeography and geographic
distribution, contributing with information for the establishment of conservation strategies of the
species.
KEYWORDS: Arecaceae, Caatinga, Carnauba, Maxent, Habitat prediction.
INTRODUÇÃO
O bioma Caatinga ocupa uma área de aproximadamente 844.453 km², que equivale a
cerca de 11% do território brasileiro tornando-se presente nos estados do Maranhão (1%), Piauí
(63%), Ceará (100%), Bahia (54%), Rio Grande do Norte (95%), Paraíba (92%), Pernambuco
(83%), Alagoas (48%), Sergipe (49%) e o norte de Minas Gerais (2%) (MMA, 2011). Diante da
escassez de água, as plantas que integram a Caatinga são xerófilas, espécies que se adaptam a
essas condições (BARBOSA, 2009; MMA, 2011). A precipitação média anual varia entre 240
mm e 1.500 mm, no entanto, grande parte da região recebe menos de 500 mm (PRADO, 2003).
A Caatinga possui um considerável número de espécies endêmicas que devem ser
consideradas como um patrimônio biológico de alto valor (KILL, 2002). São escassos os estudos
na Caatinga que relacionam a ocorrência de espécies florestais com o ambiente como o de Vieira
et al. (2015) em estudo de filogeografia e modelagem de nicho com Ficus bonijesulapensis, uma
espécie endêmica brasileira e restrita de afloramentos de rocha calcária, e o de Rodrigues et al.
(2015) que avaliaram a modelagem de nicho ecológico para as espécies Anadenanthera
colubrina, Aspidosperma pyrifolium e Myracrodruon urundeuva de florestas tropicais secas. Tais
autores tiveram como resultados que as áreas mais adequadas para a ocorrência das espécies em
estudo estão concentradas na região nordeste do Brasil.
Para espécies como Copernicia prunifera (Miller) H.E. Moore (Arecaceae), é importante
conhecer a sua distribuição geográfica e compreender as condições ecológicas que influenciam
na sua distribuição (PRIMACK; RODRIGUES, 2001). Silva et al. (2014), em estudo sobre
distribuição espacial em microescala da Copernicia prunifera, concluíram que os indivíduos
apresentam um padrão de distribuição espacial agregado até 10 metros que pode ser devido a
dispersão restrita ao parental. Segundo os autores, por ser uma espécie bastante utilizada por
extrativistas, foi observado uma diminuição na densidade populacional, sugerindo maior
aleatoriedade entre indivíduos com distâncias maiores a 10 metros do indivíduo focal. Tais fatos

18
podem contribuir para a divergência genética entre populações da espécie, associando-se a
fragmentação das populações, o que pode comprometer a distribuição geográfica da espécie.
Entretanto não há estudos avaliando a distribuição geográfica de Copernicia prunifera em macro-
escala espacial.
A distribuição geográfica potencial de uma espécie se relaciona ao conceito de nicho
ecológico proposto por Hutchinson (1957), no qual uma espécie pode ocorrer quando as
condições ambientais e recursos necessários são adequados para sua sobrevivência. Assim, os
modelos de nicho ecológico (MNE) são cada vez mais utilizados como ferramentas para prever a
distribuição geográfica de espécies (PHILLIPS et al., 2006; ELITH et al., 2010). Tais modelos
baseiam-se nas informações de ocorrências de espécies, como por exemplo de listas florísticas e
de herbários, com dados de variáveis ambientais para identificar ambientes propícios para a
ocorrência e manutenção das populações (PEARSON, 2007). Vários algoritmos têm sido
utilizados para modelagem de nichos ecológicos, como GAM (Generalised Additive Models),
GARP (Genetic Algorithm for Rule Set Production), GLM (Generalised Linear Models), ENFA
(Ecological-Niche Factor Analysis), BIOCLIM (Bioclimatic variables) e Maxent (Maximum
Entropy Modeling) (PHILLIPS et al., 2006).
O modelo de Máxima Entropia (Maxent) tem sido bastante utilizado, por ser de simples
manuseio e apresentar bom desempenho em relação aos outros (ELITH et al., 2006). Este modelo
utiliza dados de variáveis ambientais e dados de presença de espécies, sem nenhuma abordagem
quantitativa. A modelagem é feita através do software Maxent, que organiza as coordenadas
geográficas da espécie estudada em mapas que indicam sua distribuição potencial (PHILIPS et
al., 2006). É crescente o interesse por essa ferramenta, devido a possibilidade de obter
informações consistentes e rápidas para conduzir práticas conservacionistas, contribuindo para a
manutenção da biodiversidade (GIANNINI, 2012).
Estudos de modelagem de nicho auxiliam na previsão dos efeitos da mudança climática
na distribuição das espécies (RODRIGUES et al., 2015), para definir locais favoráveis para
adaptação das espécies visando plantio comercial ou conservação ex-situ (MEDINA et al., 2010),
para prever áreas susceptíveis a espécies invasoras (FABRICANTE et al., 2015), na compreensão
da história evolutiva da espécie, quando associada aos estudos de filogeografia (VIEIRA et al.,
2015),
19
Assim, o objetivo deste trabalho foi estudar a distribuição geográfica da Copernicia
prunifera e identificar as variáveis ambientais que influenciam na sua distribuição, com o intuito
de gerar subsídios para o estabelecimento de estratégias de conservação e manutenção da espécie.
MATERIAL E MÉTODOS
A espécie alvo do estudo é a Copernicia prunifera conhecida popularmente como
carnaúba, nativa do Nordeste brasileiro, representante da família Arecaceae. O extrativismo das
folhas dos carnaubais vem mantendo há várias décadas grande importância econômica no
Nordeste brasileiro, principalmente em períodos de estiagem. A atividade de produção de cera a
partir da palha de carnaúba representa a principal atividade extrativista (D’ALVA, 2007).
A distribuição da Copernicia prunifera ocorre principalmente nos estados do Ceará
(MORO et al., 2011), Piauí (FILHO et al., 2015) e Rio Grande do Norte (SOUSA et al., 2015),
podendo ser encontrada na Paraíba (GUERRA et al., 2012), Bahia, Alagoas, Sergipe, Maranhão,
Pernambuco, Mato Grosso e Tocantins (LEITMAN et al., 2015).
Os registros de ocorrência da Copernicia prunifera foram obtidos através do site Species
Link (http://splink.cria.org.br/), que é um sistema distribuído de informação que integra em
tempo real, dados primários de coleções científicas em ambiente computacional de acesso
gratuito (SPECIES LINK, 2012). Além disso, expedições foram realizadas pelos estados do Rio
Grande do Norte e Ceará. Os MNE foram construídos baseados em 80 pontos de ocorrência para
a palmeira Copernicia prunifera (Anexo 1).
As variáveis climáticas foram obtidas a partir da base de dados Worldclim (HIJMANS et
al., 2005), disponível em: http://www.worldclim.org/bioclim, em uma resolução de 1 km (30
arco-segundos). Foram consideradas no total 19 variáveis ambientais denominadas de ”Bio” na
base de dados (Tabela 1).
Foi utilizado o algoritmo de máxima entropia do software Maxent versão 3.3.3k
(PHILLIPS; DUDIK, 2008) para construção dos modelos de nicho ecológico. O Maxent se baseia
apenas nos dados de presença e variáveis ambientais para gerar modelos de nicho ecológico. O
Maxent calcula o índice AUC (area under the curve of receiver-operator characteristic) para
medir o nível de ajuste do modelo. Dessa forma, os valores da AUC próximos a 1 indicam que o
modelo é de alta precisão em prever a ocorrência da espécie enquanto que valores próximos ou
menores que 0,5 indicam que o modelo não é melhor em prever a ocorrência da espécie
(PHILLIPS et al., 2006).

20
RESULTADOS E DISCUSSÃO
O valor da AUC foi de 0,986, considerado alto, próximo a 1,0. O teste AUC foi 0,940
com desvio padrão de 0,026. Resultado semelhante foi encontrado por Vieira et al. (2015) com
Ficus bonijesulapensis, cujo valor da AUC foi 0,991. Visto que o valor máximo que este teste
pode assumir é inferior a 1,0 e que a AUC varia com a amplitude natural do nicho das espécies
(PHILLIPS et al., 2006), os indicadores avaliados sugerem que o modelo é satisfatório na
estimação da distribuição da adequabilidade do habitat potencial da Copernicia prunifera, pois o
valor da AUC foi superior a 0,9, ou seja, a acurácia do modelo foi considerada alta (SWETS,
1988).
A precipitação do trimestre mais seco foi a variável que mais contribuiu para o modelo
(39,4%), seguida da temperatura mínima do mês mais frio (17,5%), temperatura média anual
(12,1%). Estas variáveis têm uma contribuição mais forte (69%) do que as demais (Tabela 1).
Rodrigues et al. (2015) em estudo de modelagem de nicho ecológico para as espécies
Anadenanthera colubrina, Aspidosperma pyrifolium e Myracrodruon urundeuva de florestas
tropicais secas a variável “Precipitação do trimestre mais seco” teve pouca participação na
modelagem de nicho com 1,2% de contribuição, diferindo do presente trabalho.
Os modelos sugerem que são adequados para Copernicia prunifera os locais com variação
nas precipitações no trimestre mais seco (bio17), sugerindo que a espécie se adaptada bem a
ambientes estressantes quanto ao déficit hídrico temporal. De fato, indivíduos de Copernicia
prunifera podem ser encontrados nos vales de rios sazonais nordestinos, nos tabuleiros litorâneos
e em áreas alagadas intermitentes, demonstrando resistência tanto à ausência prolongada de água
como à inundação (D’ALVA, 2007).
A distribuição da adequabilidade do habitat da Copernicia prunifera desenvolvido com o
Maxent é mostrado no mapa da Figura 1. A imagem usa cores para indicar a probabilidade de que
as condições do ambiente são adequadas para a ocorrência da espécie.
21
Figura 1. Representação da adequabilidade do habitat de Copernicia prunifera no Brasil com
base em Maxent. Cores quentes (amarelo ao vermelho) representam valores maiores de
probabilidade e cores frias (verde a azul) menores valores de probabilidade de potencial de
ocorrência do nicho ecológico da espécie. Quadros brancos representam os registros de presença
usados para treinamento e quadros roxos para testes.
A ocorrência potencial da Copernicia prunifera se concentrou na região Nordeste, com
baixa probabilidade de ocorrência nas regiões centro-oeste e norte do Brasil. Na região nordeste,
as condições ambientais adequadas e consideradas como altamente provável para a ocorrência de
Copernicia prunifera é predominante nos estados do Ceará, Rio Grande do Norte, sudoeste de

22
Pernambuco, norte da Bahia e vale do Rio São Francisco, norte e sudoeste do Piauí e norte do
Maranhão. Dessa forma, essas áreas podem ser consideradas prioritárias para conservação da
espécie.
O modelo de distribuição da Copernicia prunifera foi similar à distribuição conhecida da
espécie em regiões da Caatinga e Cerrado (LEITMAN et al., 2015). Todavia, a região norte do
estado de Roraima também se mostrou com condições típicas dos locais de ocorrência da espécie.
A vegetação norte do estado de Roraima é caracterizada por savanas, com espécies adaptadas
para resistir ao estresse hídrico causado tanto pela falta de água no período seco, quanto pelo
excesso de água no período chuvoso (BARBOSA; MIRANDA, 2005; BARBOSA et al., 2007).
Há também a presença buritizais (Mauritia flexuosa L.) que acompanham pequenos cursos
d’agua (BARBOSA; MIRANDA, 2005). Segundo Leitman et al. (2015) a Copernicia prunifera
também pode ser encontrada no estado do Tocantins.
O presente estudo não avaliou os aspectos biológicos da espécie e as características do
solo, porém, são fatores importantes na ocupação potencial das espécies de plantas em relação às
mudanças climáticas, conforme estabelece Colombo e Joly (2010). Segundo Peterson et al.
(2001), a espécie pode dispersar, aclimatar, adaptar-se ou extinguir-se em resposta às alterações
climáticas. Sendo assim, torna-se necessários estudos complementares, como filogeografia das
populações naturais da Copernicia prunifera, para compreensão da história evolutiva e dos
padrões de dispersão geográfica, além de prever possíveis consequências frente às alterações
climáticas e gerar implicações para a conservação das populações naturais.
CONCLUSÕES
Os resultados obtidos sugerem, com base no modelo de nicho ecológico (MNE), que a
distribuição geográfica potencial para a ocorrência da Copernicia prunifera se concentra na
região nordeste do Brasil. A variável ambiental que mais contribui com o MNE foi a precipitação
do trimestre mais seco (bio17), sugerindo que Copernicia prunifera se adaptada bem a ambientes
estressantes ao déficit hídrico sazonal.
AGRADECIMENTOS
Ao Conselho Nacional de Desenvolvimento Científico e Tecnológico (CNPq) pelo auxílio
financeiro concedido, processo de n° 471099/2012-0. À Coordenação de Aperfeiçoamento de
Pessoal de Nível Superior (CAPES), pela bolsa de estudo (Mestrado).
23
REFERÊNCIAS
BARBOSA, R. I.; MIRANDA, I. S. Fitofisionomias das savanas de Roraima. In: BARBOSA, R.
I.; XAUD, H. A. M; COSTA E SOUZA, J. M. (eds.), Savanas de Roraima: Etnoecologia,
Biodiversidade e Potencialidades Agrosilvipastoris. Boa Vista, FEMACT. 2005.
BARBOSA, R. I.; CAMPOS, C.; PINTO, F.; FEARNSIDE, P.M. The “Lavrados” of Roraima:
Biodiversity and Conservation of Brazil’s Amazonian Savannas. Functional Ecosystems and
Communities, v. 1, n. 1, p. 29-41, 2007.
BARBOSA, F.; COSTA, A. M. B.; SILVA, F. M. Caatinga para o desenvolvimento sustentável
do semiárido brasileiro. Sociedade e Território, v.21, p.68-80, 2009.
COLOMBO, A. F.; JOLY, C. A. Brazilian Atlantic Forest lato sensu: the most ancient Brazilian
forest, and a biodiversity hotspot, is highly threatened by climate change. Brazilian Journal of
Biology, v. 70, n. 3, p. 697-708, 2010.
D’ALVA, O. A. O extrativismo da carnaúba no Ceará. Fortaleza: Banco do Nordeste do
Brasil. 172 p, 2007.
ELITH, J.; GRAHAM, C.H.; ANDERSON, R.P.; DUDÍK, M.; FERRIER, S.; GUISAN, A.;
HIJMANS, R.J.; HUETTMANN, F.; LEATHWICK, J.R.; LEHMANN, A.; LI, J.; LOHMANN,
L.G.; LOISELLE, B.A.; MANION, G.; MORITZ, C.; NAKAMURA, M.; NAKAZAWA, Y.;
OVERTON, J.M.; PETERSON, A.T.; PHILLIPS, S.J.; RICHARDSON, K.; SCACHETTI-
PEREIRA, R.; SCHAPIRE, R.E.; SOBERÓN, J.; WILLIAMS, S.; WISZ, M.S.;
ZIMMERMANN, N.E. Novel methods improve prediction of species distributions from
occurrence data. Ecography, v. 29, p. 129-151, 2006.
ELITH, J.; KEARNEY, M.; PHILLIPS, S. The art of modelling range-shifting species. Methods
in Ecology and Evolution, v.1, p. 330-342, 2010.
FABRICANTE, J. R.; CASTRO, R. A.; ARAÚJO, K. C. T.; FILHO, J. A. S. Atributos
ecológicos da bioinvasora Nicotiana glauca Graham (Solanaceae) e avaliação da susceptibilidade
de sua ocorrência no Brasil. Ciência Florestal, v. 25, n. 4, p. 959-967, 2015.
FILHO, F. S. S.; ALMEIDA, E. B. A.; LIMA, P. B.; SOARES, C. J. R. S. Checklist of the flora
of the restingas of Piauí state, Northeast Brazil. Check List the journal of biodiversity data, v.
11, n.2, 2015.

24
GIANNINI, T. C.; SIQUEIRA, M. F.; ACOSTA, A. L.; BARRETO, F. C. C.; SARAIVA, A. M.;
SANTOS, A. I. Desafios atuais da modelagem preditiva de distribuição de espécies.
Rodriguésia, v.63, p.733-749, 2012.
GUERRA, N. M.; RIBEIRO, J. E. S.; CARVALHO, T. K. N.; PEDROSA, K. M.; FELIX, L. P.;
LUCENA, R. F. P. Usos locais de espécies vegetais nativas em uma comunidade rural no
semiárido nordestino (São Mamede, Paraíba, Brasil). Revista de Biologia e Farmácia, Volume
Especial, p. 184-210, 2012.
HIJMANS, R. J.; CAMERON, S. E.; PARRA, J. L.; JONES, P. G.; JARVIS, A. Very high
resolution interpolated climate surfaces for global land areas. International Journal of
Climatology, v. 25: 1965–1978, 2005.
HUTCHINSON, G. E. Concluding remarks. Cold Spring Harbor Symposia on Quantitative
Biology, v. 22, p. 415–427, 1957.
KILL, L. H. P. Caatinga: Patrimônio Brasileiro ameaçado. Disponível em: <
http://www.agronline.com.br/artigos/caatinga-patrimonio-brasileiro-ameacado>. 2002. 2p.
Acesso em: 13 Nov. 2016.
LEITMAN, P.; SOARES, K.; HENDERSON, A.; NOBLICK, L.; MARTINS,
R.C. Arecaceae in Lista de Espécies da Flora do Brasil. Jardim Botânico do Rio de Janeiro.
2015. Disponível em: <http://floradobrasil.jbrj.gov.br/jabot/floradobrasil/FB15706>. Acesso em:
01 Set. 2016.
MEDINA, R. C.; VEJA, I. L.; M, C. A. R. Distribución de Taxus globosa (Taxaceae) en México:
Modelos ecológicos de nicho, efectos del cambio del uso de suelo y conservación. Revista
Chilena de Historia Natural, v. 83, p. 421-433, 2010.
MMA – Ministério do Meio Ambiente. Monitoramento dos Biomas brasileiros: Bioma
Caatinga. Brasília: MMA. 2011.
MORO, M. F.; CASTRO, A. S. F.; ARAÚJO, F. S. Composição florística e estrutura de um
fragmento de vegetação savânica sobre os tabuleiros pré-litorâneos na zona urbana de Fortaleza,
Ceará. Rodriguésia, v. 62, n. 2, p. 407-423, 2011.

25
PEARSON, R. G.; RAXWORTHY, C. J.; NAKAMURA, M.; PETERSON, A. T. Predicting
species distributions from small numbers of occurrence records: a test case using cryptic geckos
in Madagascar. Journal of Biogeography, v.34, p.102-117, 2007.
PETERSON, A. T.; SÁNCHEZ-CORDERO, V.; SOBERÓN, J.; BARTLEY, J.;
BUDDEMEIER, R. W; NAVARRO-SIGÜENZA, A.G. Effects of global climate change on
geographic distributions of Mexican Cracidae. Ecological Modelling, v. 144, n. 1, p. 21-30,
2001.
PHILLIPS, S. J.; ANDERSON, R. P.; SCHAPIRE, R. E. Maximum entropy modeling of species
geographic distributions. Ecological Modelling, v. 190, p. 231-259. 2006.
PHILLIPS, S. J.; DUDIK, M. Modeling of species distributions with Maxent: new extensions and
a comprehensive evaluation. Ecography, v.31, p.161-175. 2008.
PRADO, D. As caatingas da América do Sul. In: I.R. Leal, M. Tabarelli & J.M.C. Silva (eds.).
Ecologia e conservação da Caatinga. p. 3-73. Editora Universitária, Universidade Federal de
Pernambuco, Recife, Brasil, 2003.
PRIMACK, R. B; RODRIGUES, E. Biologia da conservação. Londrina, PR. 328p. 2001.
RODRIGUES, P. M. S.; SILVA, J. O.; EISENLOHR, P.V.; SCHAEFER, C. E. G. R. Climate
change effects on the geographic distribution of specialist tree species of the Brazilian tropical
dry forests. Brazilian Journal of Biology, v. 75, n. 3, p. 679-684, 2015.
SILVA, R. A. R.; SOUSA, R. F.; ARAÚJO, L. F. B.; PINHEIRO, L. G.; VIEIRA, F. A.
Distribuição espacial em microescala da palmeira carnaúba, Copernicia prunifera (Mill) H. E.
Moore. ACSA – Agropecuária Científica no Semi-Árido, v. 10, n. 1, p. 118-121, 2014.
SOUSA, R. F.; SILVA, R. A. R.; ROCHA, T. G. F.; SANTANA, J. A. S.; VIEIRA, F. A.
Etnoecologia e etnobotânica da palmeira carnaúba no Semiárido Brasileiro. Cerne, v. 21, n. 4, p.
587-594, 2015.
SWETS J. A. Measuring the accuracy of diagnostic systems. Science v. 240, p. 1285-1293, 1988.
SPECIES LINK, 2012. Rede de dados species link. Disponível em: <http://splink.cria.org.br/>.
Acesso em: 03 Ago. 2016.
VIEIRA, F. A.; NOVAES, RENAN M. L.; FAJARDO, C. G.; SANTOS, R. M.; ALMEIDA, H.
S.; CARVALHO, D.; LOVATO, M. D. Holocene southward expansion in seasonally dry tropical

26
forests in South America: phylogeography of Ficus bonijesulapensis (Moraceae). Botanical
Journal of the Linnean Society, v. 177, p. 189–201, 2015
WORLDCLIM – Global Climate Data. Disponível: <http://www.worldclim.org/>. Acesso em:
03 Ago, 2016.
Tabela 1. Variáveis utilizadas na modelação da área de distribuição potencial de Copernicia
prunifera e sua contribuição percentual utilizadas na construção do modelo com Maxent. Fonte:
WorldClim (2016).
Variáveis Contribuição percentual
bio17: Precipitação do trimestre mais seco (mm) 39,4
bio6: Temperatura mínima do mês mais frio (°C) 17,5
bio1: Temperatura média anual (ºC) 12,1
bio12: Precipitação anual (mm) 9,4
bio9: Temperatura média do trimestre mais seco (°C) 3,4
bio4: Sazonalidade da temperatura (desvio padrão *100) 3,2
bio18: Precipitação do trimestre mais quente (mm) 2,8
bio11: Temperatura média do trimestre mais frio (°C) 2,2
bio3: Isotermalidade (bio2/bio7) (*100) 1,9
bio2: Amplitude diurna média (ºC) 1,8
bio8: Temperatura média do trimestre mais úmido (°C) 1,5
bio5: Temperatura máxima do mês mais quente (°C) 1,3
bio7: Amplitude térmica anual (BIO5-BIO6) (°C) 1,1
bio19: Precipitação do trimestre mais frio (mm) 1
bio10: Temperatura média do trimestre mais quente (°C) 0,5
bio14: Precipitação do mês mais seco (mm) 0,3
bio15: Sazonalidade da precipitação (coeficiente de variação) 0,3
bio13: Precipitação do mês mais úmido (mm) 0,1
bio16: Precipitação do trimestre mais úmido (mm) 0

27
Anexo 1 - Localização geográfica das populações de Copernicia prunifera, coordenada
geográfica e Estado de ocorrência (SPECIES LINK, 2012).
Espécie Longitude Latitude Estado
1 Copernicia prunifera -43,233 -11,683 Bahia
2 Copernicia prunifera -44,476 -11,619 Bahia
3 Copernicia prunifera -43,833 -11,333 Bahia
4 Copernicia prunifera -43,133 -11,083 Bahia
5 Copernicia prunifera -42,767 -11,017 Bahia
6 Copernicia prunifera -42,700 -10,833 Bahia
7 Copernicia prunifera -39,000 -10,500 Bahia
8 Copernicia prunifera -42,504 -10,003 Bahia
9 Copernicia prunifera -40,591 -9,692 Bahia
10 Copernicia prunifera -41,279 -9,614 Bahia
11 Copernicia prunifera -40,653 -9,562 Bahia
12 Copernicia prunifera -42,188 -9,527 Bahia
13 Copernicia prunifera -40,598 -9,472 Bahia
14 Copernicia prunifera -40,498 -9,412 Bahia
15 Copernicia prunifera -40,499 -9,412 Bahia
16 Copernicia prunifera -38,998 -7,701 Ceará
17 Copernicia prunifera -39,015 -4,971 Ceará
18 Copernicia prunifera -38,637 -4,040 Ceará
19 Copernicia prunifera -38,486 -3,799 Ceará
20 Copernicia prunifera -38,543 -3,717 Ceará
21 Copernicia prunifera -38,792 -3,657 Ceará
22 Copernicia prunifera -38,968 -3,607 Ceará
23 Copernicia prunifera -37,354 -4,715 Ceará
24 Copernicia prunifera -37,915 -4,924 Ceará
25 Copernicia prunifera -37,734 -4,571 Ceará
26 Copernicia prunifera -37,456 -4,864 Ceará
27 Copernicia prunifera -40,000 -5,000 Ceará

28
28 Copernicia prunifera -42,800 -2,750 Maranhão
29 Copernicia prunifera -44,054 -2,473 Maranhão
30 Copernicia prunifera -51,750 -11,283 Mato Grosso
31 Copernicia prunifera -50,669 -11,222 Mato Grosso
32 Copernicia prunifera -35,333 -7,329 Paraíba
33 Copernicia prunifera -38,435 -7,164 Paraíba
34 Copernicia prunifera -38,211 -6,997 Paraíba
35 Copernicia prunifera -38,141 -6,981 Paraíba
36 Copernicia prunifera -38,228 -6,759 Paraíba
37 Copernicia prunifera -38,228 -6,759 Paraíba
38 Copernicia prunifera -40,674 -9,459 Pernambuco
39 Copernicia prunifera -40,729 -9,434 Pernambuco
40 Copernicia prunifera -40,387 -9,362 Pernambuco
41 Copernicia prunifera -40,334 -9,274 Pernambuco
42 Copernicia prunifera -40,334 -9,274 Pernambuco
43 Copernicia prunifera -39,310 -8,514 Pernambuco
44 Copernicia prunifera -39,330 -8,307 Pernambuco
45 Copernicia prunifera -39,330 -8,307 Pernambuco
46 Copernicia prunifera -39,368 -8,193 Pernambuco
47 Copernicia prunifera -39,368 -8,193 Pernambuco
48 Copernicia prunifera -38,593 -8,012 Pernambuco
49 Copernicia prunifera -34,855 -8,009 Pernambuco
50 Copernicia prunifera -34,845 -7,884 Pernambuco
51 Copernicia prunifera -38,760 -7,861 Pernambuco
52 Copernicia prunifera -42,131 -7,025 Piauí
53 Copernicia prunifera -42,608 -5,564 Piauí
54 Copernicia prunifera -41,520 -3,458 Piauí
55 Copernicia prunifera -41,867 -3,175 Piauí
56 Copernicia prunifera -41,779 -2,934 Piauí
57 Copernicia prunifera -41,336 -2,928 Piauí

29
58 Copernicia prunifera -41,463 -2,921 Piauí
59 Copernicia prunifera -41,716 -2,898 Piauí
60 Copernicia prunifera -41,717 -2,886 Piauí
61 Copernicia prunifera -41,724 -2,884 Piauí
62 Copernicia prunifera -41,667 -2,879 Piauí
63 Copernicia prunifera -41,821 -2,858 Piauí
64 Copernicia prunifera -38,255 -6,371 Rio Grande do Norte
65 Copernicia prunifera -38,316 -6,263 Rio Grande do Norte
66 Copernicia prunifera -37,919 -6,096 Rio Grande do Norte
67 Copernicia prunifera -37,020 -6,034 Rio Grande do Norte
68 Copernicia prunifera -37,783 -5,650 Rio Grande do Norte
69 Copernicia prunifera -37,783 -5,650 Rio Grande do Norte
70 Copernicia prunifera -37,344 -5,188 Rio Grande do Norte
71 Copernicia prunifera -37,155 -4,980 Rio Grande do Norte
72 Copernicia prunifera -35,384 -5,897 Rio Grande do Norte
73 Copernicia prunifera -35,505 -5,985 Rio Grande do Norte
74 Copernicia prunifera -35,485 -6,243 Rio Grande do Norte
75 Copernicia prunifera -35,461 6,209 Rio Grande do Norte
76 Copernicia prunifera -36,805 -5,530 Rio Grande do Norte
77 Copernicia prunifera -35,683 -5,108 Rio Grande do Norte
78 Copernicia prunifera -37,743 -5,726 Rio Grande do Norte
79 Copernicia prunifera -37,052 -6,068 Rio Grande do Norte
80 Copernicia prunifera -37,312 -5,195 Rio Grande do Norte

30
Capítulo 2: GENETIC DIVERSITY OF Copernicia prunifera (Miller) H.E. Moore
(ARECACEAE): IMPLICATIONS FOR CONSERVATION
ABSTRACT - The palm tree Copernicia prunifera (Miller) H.E. Moore is a natural resource that
suffers intense exploitation as it is economically important in extractive communities. The
objective of this study was analyze the genetic diversity among natural populations of Copernicia
prunifera. We sampled 180 individuals distributed across 11 natural populations in the states of
Rio Grande do Norte and Ceará, Brazil. Seven ISSR primers were used, providing 100 loci with
99.09% polymorphism. The polymorphic information content (PIC) of each primer is considered
to be moderately informative. Nei’s genetic diversity (He) ranged from 0.071 to 0.288 and the
Shannon Index (Ho) ranged from 0.103 to 0.418. The results from AMOVA indicate greater
genetic variation within populations (58.11%) than among populations (41.89%). Mantel’s test
revealed positive and significant correlation (r = 0.423; P = 0.006) between genetic and
geographic distances, suggesting isolation by distance. The greatest value for gene flow occurred
between the populations AR1 and AR2 (Nm = 29), which is consistent with the dendrogram
(UPGMA) of Nei's genetic identity, indicating genetic similarity between these two populations.
According to a Bayesian analysis, genotypes can be divided into three distinct groups (K = 3).
Only populations AR2 and SMG show balance between mutation and drift, while the others
present evidence of genetic bottleneck. Thus, conservation of Copernicia prunifera populations is
necessary to minimize the loss of important alleles and contribute to the maintenance of the
species.
KEYWORDS: Bottleneck; Carnauba; Genetic differentiation; ISSR; Palms.
INTRODUCTION
Indiscriminate exploitation of natural forest resources has significantly decreased the size
of natural populations, resulting in fragmented areas and population isolation (COTA et al., 2011;
MELO JÚNIOR et al., 2012). Furthermore, fragmentation can significantly limit the movement
of animals, pollen, and seeds, making the remaining populations susceptible to changes in gene
pool patterns, which can change the genetic structure of populations (FUCHS; HAMRICK,
2010). The reduced size of natural areas and fragmentation may also lead to a loss of the genetic
31
diversity contained within and among populations (YOUNG et al., 1996). Previous studies have
demonstrated the impact of population reduction on genetic diversity in natural populations
(GAIERO et al., 2011; SANTOS et al., 2015).
As such, studies of genetic structure and diversity in natural populations are needed to
understand how diversity is distributed, and the factors that affect this distribution, as well as to
quantify and evaluate the genetic diversity distributed between and within populations (NYBOM;
BARTISH, 2000). Factors that may influence the distribution of genetic diversity include the
effective population size (JABEEN et al., 2015), geographical occurrence of the species
(SANTOS et al., 2015), and reproduction mode and breeding systems (ABREU et al., 2012).
Gene flow (SILVA et al., 2011) also has an impact on genetic diversity, which is influenced not
only by the ability of dispersers and pollinators to reach other populations, but also by
geographical barriers that may exist between populations (BAWA, 1992).
Studies of genetic diversity are useful in defining conservation strategies and developing
management and genetic improvement programs for a species (LOUSADA et al., 2011;
BRANDÃO et al., 2015; DUARTE et al., 2015). To estimate genetic diversity, the use of
molecular markers based on the amplification of the DNA sequence is necessary, providing a
useful tool to study genetic structure and diversity between individuals (CHAGAS et al., 2015)
and within and between populations (SANTOS et al., 2015). Although several genetic studies of
palm tree populations have been published (LOUSADA et al., 2011; GAIERO et al., 2011;
SILVA et al., 2011; OLIVEIRA et al., 2012; SHAPCOTT et al., 2012), few studies use ISSR
(inter-simple sequence repeat) markers for palm tree species. Using ISSR markers is a quick and
simple method to effectively analyze the genetic diversity of natural populations: such markers
generate a large number of polymorphic bands; the method does not require prior information of
the genome; and it is low cost. Although ISSR markers cannot differentiate heterozygous from
homozygous individuals as they are dominant markers, analyzes multiple loci on a single reaction
(REDDY et al., 2002; WOLFE, 2005).
For species that have undergone extensive exploitation and are located in fragmented
areas, such as the palm Copernicia prunifera (Miller) H.E. Moore, greater genetic diversity is
expected between populations than within populations (GITZENDANNER; SOLTIS, 2000). In
addition, due to the impacts of anthropogenic activities on Copernicia prunifera populations,
genetic bottlenecks are expected to occur in natural populations (TANG et al., 2014). Thus, the

32
objective of this study is to analyze the genetic diversity among natural populations of
Copernicia prunifera to provide information that may be useful in defining strategies for the
maintenance and conservation of the species.
MATERIAL AND METHODS
Target species
Copernicia prunifera, commonly known as carnauba, is native to the semi-arid region in
northeastern Brazil. Copernicia prunifera individuals can be found in river valleys and in flooded
areas, where they generally form monodominant populations known as carnaubais. The species is
highly resistant to the prolonged absence of water and permanent floods (D'ALVA, 2007). The
main product extracted from the species is a wax produced from the leaves which is used in
cosmetics, pharmaceutical capsules, electronics, food products, polishing waxes, and coatings
(CAVALCANTE; DINIZ, 2005; SILVA et al., 2009).
The species presents multiple inflorescences, which are made up of yellowish,
hermaphroditic flowers (SILVA et al., 2014a). The flowers are composed of three sepals, three
petals, six stamen, and three carpels. The species is pollinated by insects like the irapuá bee
(Trigona spinipes Fabricius) and the maribondo-caboclo wasp (Polistes canadensis Linnaeus)
(SILVA, 2014a); the likely dispersers of the fruits are the Palm Tanager (sanhaçu-do-coqueiro;
Tangara palmarum Wied) (SILVA et al., 2014a) and bats (SOUSA et al., 2015).

33
Study locations and sampling
The study was conducted in 11 natural populations of Copernicia prunifera located in Rio
Grande do Norte and Ceará States, Brazil (Figure 1), from which 180 individuals were sampled
(Table 1).
Figure 1. Geographic location of the sampled populations of Copernicia prunifera in Rio Grande
do Norte and Ceará States, Brazil.
Target species (Copernicia prunifera)

34
The populations SER and LGP are the closest geographically, with a distance of 4.6 km,
and LGP and AR1 are separated by the greatest distance, at 310.4 km.
Table 1. Location of sampled Copernicia prunifera populations, population code, geographic
coordinates, number of individuals, and region of occurrence. RN - Rio Grande do Norte; CE –
Ceará.
Population/State Code Latitude/longitude N Region
Lagoa de Pedras (RN) LGP 6°12’ S/35°27’ W 15 Mesoregion of Agreste potiguar
Serrinha (RN) SER 6°14’ S/35°29’ W 15 Mesoregion of Agreste potiguar
Macaíba (RN) MAC 5º59’ S/35º30’ W 15 Mesoregion of east potiguar
São Miguel do Gostoso (RN) SMG 5°07’ S/35°41’ W 18 Mesoregion of east potiguar
Jucurutu (RN) JUC 6º04’ S/37º03’ W 12 Mesoregion of west potiguar
Apodi (RN) APD 5°43' S/37°44' W 12 Mesoregion of west potiguar
Mossoró (RN) MOS 5°11' S/37°18' W 22 Mesoregion of west potiguar
Icapuí (CE) ICA 4º46’ S/37º17’ W 14 Mesoregion of Jaguaribe
Aracati 1 (CE) AR1 4º34’ S/37º44’ W 22 Mesoregion of Jaguaribe
Aracati 2 (CE) AR2 4º51’ S/37º27’ W 11 Mesoregion of Jaguaribe
Russas (CE) RUS 4°55' S/37°54' W 24 Mesoregion of Jaguaribe
Sampling ranged from 11 to 24 individuals per population, which is consistent with other
studies on palm tree genetic diversity using ISSR markers (GAIEIRO et al., 2011; ROSSI et al.,
2014; SANTOS et al., 2015). Leaf samples were placed in plastic tubes containing 2 mL CTAB
2X (cationic hexadecyl trimethylammonium bromide), labelled, and stored in a freezer -20°C
until DNA extraction.
DNA extraction, PCR, and Electrophoresis
DNA extraction was performed using the CTAB method, as described by Doyle and
Doyle (1987). We tested 29 ISSR primers and selected seven that best amplified the DNA of
Copernicia prunifera. For polymerase chain reaction (PCR), the Veriti automatic thermocycler
was used in a volume of 12 μL containing genomic DNA. The PCR mix was composed of buffer
(10x), BSA (1.0 mg.mL-1), MgCl2 (50 mM), dNTP (2.5 mM), primer (2 μM), Taq polymerase
(5.0 U.μL), DNA (diluted 1:50), ISSR primer (2 µM), and ultrapure water. The reaction sequence
consisted of denaturation at 94 °C for 2 min followed by 37 cycles of amplification at 94 °C for
15 seconds, 47 °C for 30 seconds, and 72 °C for 1 min. The process was completed with a final
step at 72 °C for 7 min and then cooled to 4 °C. The products generated from the amplification

35
were subjected to 1.5% (p/v) agarose gel electrophoresis, stained with GelRed™ in 1 X TAE
(Tris-Acetate-EDTA) buffer using a horizontal vessel at a voltage of 100 V, for two and a half
hours. The 1 kb molecular weight size marker (Ladder) was used. Subsequently, the gels were
photographed in ultraviolet light using the E-Box VX2.
Statistical analyses
PIC value
Polymorphic information content (PIC) was calculated to test the ability of the ISSR
primers to distinguish polymorphism between individuals, with the absence or presence of bands
as indicators. According to Botstein et al. (1980), molecular markers with values lower than 0.25
are classified as being slightly informative, values ranging between 0.25 to 0.5 are reasonably
informative, and PIC values above 0.5 are satisfactory. For the calculation, we used the formula
proposed by Anderson et al. (1993): PICi = 1 − ∑ Pij2n
j=1 , where Pij is the frequency of allele "j"
in marker "i".
Genetic diversity
For analysis of genetic diversity parameters, we used the POPGENE program version 1.3
(YEH et al., 1997) to assess the total number of alleles observed (Na), number of effective alleles
(Ne), Nei's genetic diversity (He), and Shannon index (I) for each population. The genetic
distance obtained using POPGENE was classified into three classes based on Nei (1978): low,
when the distance is less than < 0.05; average, between 0.05 and 0.15; and high, when > 0.15. To
compare the values of Nei’s genetic diversity and Shannon index between populations, analysis
of variance (ANOVA) was conducted using the program Assistat 7.7 (SILVA, 2016), with
averages subjected to the Tukey test at 5% probability.
Genetic population structure
We used the program ALERQUIN 3.1 (EXCOFFIER et al., 2007) for the Analysis of
Molecular Variance (AMOVA) of the studied populations. Mantel’s test was performed using the
PC-Ord 4.14 program (MCCUNE; MEFFORD, 1999), resampled using the Monte Carlo method
(1000 permutations), to verify the existence of a correlation between Nei’s genetic distance
(1978) and geographic distance. The NTSYS program (ROHLF, 1993) was used to produce a
dendrogram of UPGMA (unweighted pair-group method with arithmetic mean) to simplify the
36
genetic identity of Nei’s (1978) obtained with the POPGENE program. For principal component
analysis (PCA), we used the GenAlEx program based on Nei’s genetic distance (PEAKALL;
SMOUSE, 2006). Historical gene flow (Nm) was calculated with the formula: Nm = 0.5 (1 -
GST) / GST (MCDERMOTT; MCDONALD, 1993), where GST is Nei’s genetic distance.
Bayesian analysis
Bayesian analysis was performed using the program Structure v.2.2 (PRITCHARD, 2002)
to infer the number of genetic groups (K) that represent the sampled populations. Ten
independent runs for each K (ranging from 1 to 13) were conducted, with the estimates of K
based on the model of mixed ancestry (admixture) and the frequency of correlated alleles. Each
run was comprised of 250.000 simulations via Markov Chain Monte Carlo (MCMC) and a burn-
in of 500.000 iterations. The number of K populations was identified according to the method ∆K
(EVANNO et al., 2005), as implemented in the Structure Harvester program (EARL;
VONHOLDT, 2012).
Detection of genetic bottlenecks
Recent reductions in effective population size were analyzed using the Bottleneck
program version 1.2 (CORNUET; LUIKART, 1996). The Infinite Allele Model (IAM) and
Stepwise Mutation Model (SMM), based on Kimura and Crow (1964) and Kimura and Otha
(1978), respectively, were used to infer the presence of genetic bottlenecks. The mutation model
of the ISSR loci is intermediary between IAM and SMM (LUIKART et al., 1998), thus we use
both models. Signal test was applied (α = 0.05) based on the frequency of alleles to determine the
existence of recent significant genetic bottlenecks (CORNUET; LUIKART, 1996).

37
RESULTS
Genetic polymorphism
The seven selected primers provided 100 loci with 99.09% polymorphism. The number of
loci per primer varied from 13 to 18 with an average of 14.4 (Table 2).
Table 2. Nucleotide sequence of ISSR primers, number of loci, and PIC value of each primer.
ISSR primers Sequence (5’ – 3’) Number of Loci PIC
UBC 825 (AC)8-T ACACACACACACACACT 14 0.424
UBC 841 (GA)8-YC GAGAGAGAGAGAGAGAYC 18 0.446
UBC 857 (AC)8-YG ACACACACACACACACYG 14 0.405
UBC 873 (GACA)4 GACAGACAGACAGACA 15 0.431
UBC 880 (GGAGA)3 GGAGAGGAGAGGAGA 13 0.411
UBC 881 (GGGTG)3 GGGTGGGGTGGGGTG 14 0.339
M1 CAA (GA)5 CAAGAGAGAGAGA 13 0.422
Average 14.4 0.418
R = purine (A or G); Y = pyrimidine (C or T); PIC = Polymorphic information content
The PIC of each primer used varied from 0.339 to 0.446, with an average of 0.418. The
profile of the loci using UBC primer 857 is shown in Figure 2.
Figure 2. Pattern of ISSR amplification fragments resulting from UBC primer 880 for 12
Copernicia prunifera individuals from the Apodi population, Rio Grande do Norte. L = Ladder 1
kb.

38
Genetic diversity
The percentage of polymorphic loci of the populations ranged from 16.83% in SER to
79.21% in SMG. Nei’s genetic diversity (He) for all populations was 0.356 and the Shannon
index (Ho) was 0.529 (Table 3).
Table 3. Genetic diversity parameters of Copernicia prunifera natural populations.
Code L / %P Na Ne He I
LGP (RN) 49/48.51 1.485±0.130 1.353±0.099 0.201±0.055abc 0.293±0.079abc
SER (RN) 17/16.83 1.168±0.097 1.125±0.074 0.071±0.041d 0.103±0.059d
MAC (RN) 46/45.54 1.455±0.129 1.322±0.100 0.182±0.054bc 0.267±0.077bc
SMG (RN) 80/79.21 1.792±0.095 1.490±0.090 0.280±0.045a 0.416±0.062a
JUC (RN) 37/36.63 1.366±0.139 1.245±0.104 0.140±0.057cd 0.205±0.082cd
APD (RN) 35/34.65 1.346±0.138 1.187±0.089 0.113±0.050cd 0.171±0.073cd
MOS (RN) 72/71.29 1.713±0.096 1.518±0.084 0.288±0.044a 0.418±0.062a
ICA (CE) 73/72.28 1.723±0.120 1.509±0.108 0.282±0.055a 0.411±0.077a
AR1 (CE) 74/73.27 1.733±0.095 1.475±0.082 0.270±0.042ab 0.400±0.059a
AR2 (CE) 63/62.38 1.624±0.146 1.407±0.117 0.232±0.063ab 0.342±0.088ab
RUS (CE) 70/69.31 1.693±0.094 1.495±0.079 0.280±0.041a 0.408±0.059a
Total 100 / 99.09 1.990±0.007 1.613±0.022 0.356±0.030 0.529±0.012
Polymorphic locus (L), percentage of polymorphic loci (% P), number of alleles observed (Na),
number of effective alleles (Ne), Nei’s index (He), Shannon index (I). The values represent the
mean ± standard error. Data followed by the same letter do not differ statistically at the 5%
confidence level based on the Tukey test.
In Rio Grande do Norte State, the populations MOS and SMG obtained the highest
percentage of polymorphic loci, at 71.29% and 79.21%, respectively. LGP, SMG, and MOS
populations differed statistically from the others, presenting higher values of Nei’s genetic
diversity. In Ceará State, Nei’s genetic diversity indexes (He) did not vary statistically among the
four populations. The results of the Shannon index show (I) that the LGP, SMG, MOS, ICA,
AR1, AR2, and RUS populations have higher values and differ statistically from the others.
According to the matrix of genetic distance and geographic distance (Table 4), we found the

39
greatest genetic distance between SMG and SER (0.581). The populations with the lowest genetic
distance were AR1 and AR2 (0.017). The mean genetic distance was 0.261.
Table 4. Estimates of genetic distance (Nei, 1978) below the diagonal, and geographic distance
(km) above the diagonal, between populations of Copernicia prunifera. Minimum and maximum
values are shown in bold.
LGP SER MAC SMG JUC APD MOS ICA AR1 AR2 RUS
LGP 0 4.6 25.5 124.2 176.8 258.3 233.8 257.43 310.4 266.5 306.9
SER 0.180 0 28.4 127.4 174.5 256.5 233.2 257.64 310.3 266.3 306.2
MAC 0.247 0.410 0 98.9 171.5 249.5 218.4 238.8 292.4 249.2 291.7
SMG 0.487 0.581 0.388 0 185.1 238.3 180.8 181.61 235.1 198.4 248.4
JUC 0.284 0.287 0.246 0.254 0 85.4 100.8 146.04 182 140.4 158.6
APD 0.316 0.396 0.274 0.229 0.134 0 75.7 117.42 127.7 100.4 90.7
MOS 0.270 0.272 0.323 0.135 0.175 0.134 0 47.26 83.4 39.9 73.3
ICA 0.301 0.337 0.315 0.110 0.233 0.226 0.122 0 54.38 21.73 71.97
AR1 0.256 0.301 0.249 0.148 0.124 0.072 0.064 0.117 0 44.8 43.9
AR2 0.265 0.289 0.277 0.133 0.104 0.084 0.064 0.102 0.017 0 51.4
RUS 0.238 0.248 0.260 0.147 0.117 0.096 0.035 0.124 0.053 0.048 0
Population genetic structure
The analysis of molecular variance (AMOVA) indicates that there is greater genetic
variation occurring among individuals within populations (58.11%) than between populations
(41.89%) (Table 5).
Table 5. Analysis of molecular variance (AMOVA) between and within Copernicia prunifera
populations.
Source of variation d.f Sum of
squares
Variance
components % of variance P
Between populations 10 544.438 3.08671 41.89 < 0.0001
Within populations 169 723.556 4.28140 58.11
Total 204 1033.073 5.25500
Fixation Index Fst: 0.419
d.f. = degrees of freedom.

40
The Mantel test revealed the existence of a positive and significant correlation (r = 0.423;
P = 0.006) between the genetic and geographic distances between populations (Figure 3).
Figure 3. Relationship between the genetic and geographic distances of Copernicia prunifera
populations.
According to the dendrogram, the results show that populations located in geographical
proximity to each other tend to have greater genetic similarity. We identified two groups (Figure
4): the first group consists of AR1, AR2, RUS, MOS, APD, JUC, ICA, SMG, and MAC, with
MAC being the most divergent of the group; the second group consists of LGP and SER. We
note that the greatest genotypic similarity between populations occurred between AR1 and AR2,
followed by RUS and MOS.
0
0,1
0,2
0,3
0,4
0,5
0,6
0,7
0 50 100 150 200 250 300 350
Geographic distance (km)
Gen
etic
dis
tance
fro
m N
eir= 0.423
P= 0.0060.7
0.6
0.5
0.4
0.3
0.2
0.1

41
Nei’s genetic identity
Figure 4. UPGMA dendrogram based on Nei’s genetic identity between the 11 studied
Copernicia prunifera populations.
The highest level of historical gene flow (Nm) was 29 between AR1 and AR2, and the
lowest level of gene flow was 0.4 between SER and SMG populations (Table 6). This result
corroborates the genetic distance matrix, in which SER and SMG had the highest value and AR1
and AR2 had the lowest (Table 4).
Table 6. Matrix of historical gene flow values among pairs of Copernicia prunifera populations.
Minimum and maximum values are shown in bold.
LGP SER MAC SMG JUC APD MOS ICA AR1 AR2 RUS
LGP
SER 2.3
MAC 1.5 0.7
SMG 0.5 0.4 0.8
JUC 1.2 1.2 1.5 1.5
APD 1.1 0.7 1.3 1.7 3.2
MOS 1.3 1.3 1.0 3.2 2.4 3.2
ICA 1.2 1.0 1.1 4.0 1.6 1.7 3.6
AR1 1.4 1.2 1.5 2.8 3.5 6.4 7.3 3.7
AR2 1.4 1.2 1.3 3.2 4.3 5.4 7.2 4.4 29.0
RUS 1.6 1.5 1.4 2.9 3.7 4.7 13.7 3.5 8.9 9.8

42
PCA revealed that the first and second principal components accounted for the majority of
total diversity (PC 1 = 47.73%; PC 2 = 14.66%) (Figure 5).
Figure 5. Principal component analysis of the studied Copernicia prunifera populations, based
on Nei’s genetic distance.
LGP
SER
MAC
SMGJUCAPD
MOSICA
AR1AR2
RUS
Axis
2
Axis 1
43
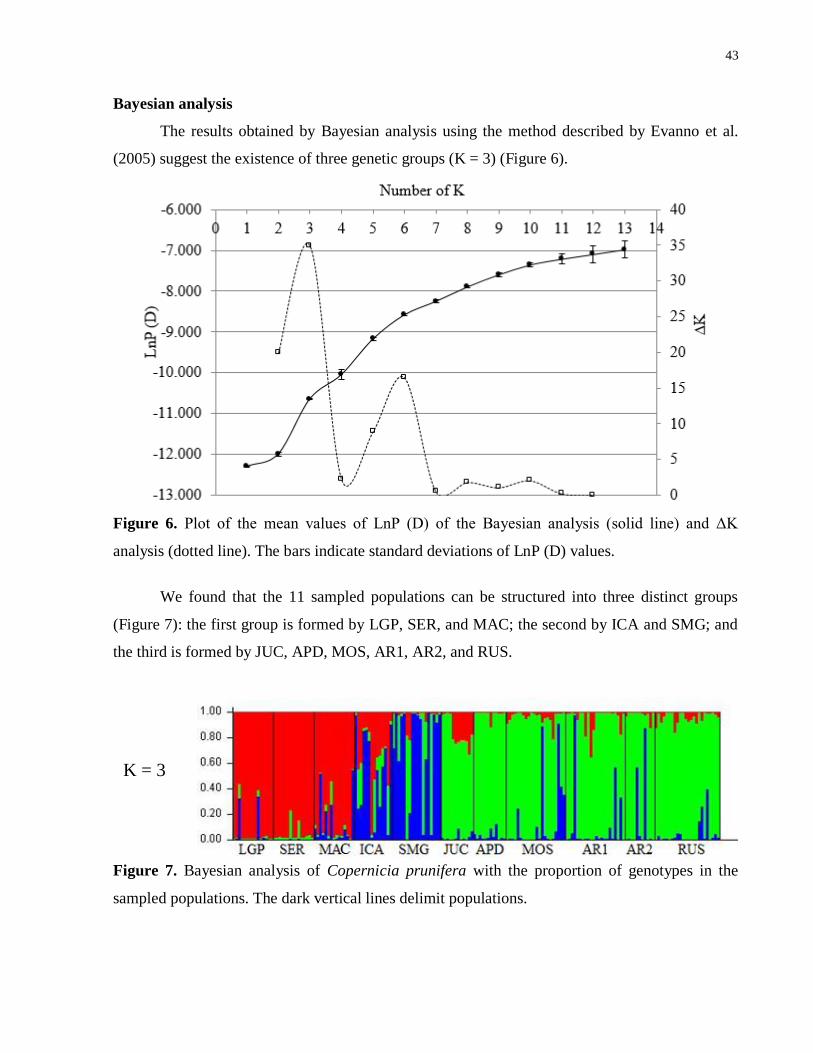
Bayesian analysis
The results obtained by Bayesian analysis using the method described by Evanno et al.
(2005) suggest the existence of three genetic groups (K = 3) (Figure 6).
Figure 6. Plot of the mean values of LnP (D) of the Bayesian analysis (solid line) and ΔK
analysis (dotted line). The bars indicate standard deviations of LnP (D) values.
We found that the 11 sampled populations can be structured into three distinct groups
(Figure 7): the first group is formed by LGP, SER, and MAC; the second by ICA and SMG; and
the third is formed by JUC, APD, MOS, AR1, AR2, and RUS.
Figure 7. Bayesian analysis of Copernicia prunifera with the proportion of genotypes in the
sampled populations. The dark vertical lines delimit populations.
K = 3

44
Genetic bottleneck testing
Most of the studied populations present a significant genetic bottleneck (Table 7).
Table 7. Tests of equilibrium between mutation and genetic drift for the studied Copernicia
prunifera populations based on IAM and SMM models.
IAM SMM
Population n Hd/He P n Hd/He P
LGP 47.72 54/47 0.483 57.55 54/47* 0.022
SER 47.85 84/17 0.000** 56.48 84/17 0.000**
MAC 47.94 63/38 0.029* 56.63 63/38 0.000**
SMG 51.36 43/58 0.110 50.80 49/52 0.445
JUC 42.51 69/32 0.020* 53.47 71/30 0.000**
APD 42.40 76/25 0.000** 53.44 78/23 0.000**
MOS 43.95 36/65 0.000** 53.16 41/60 0.102
ICA 46.26 43/58 0.012* 57.44 45/56 0.423
AR1 44.15 40/61 0.000** 53.42 42/59 0.155
AR2 40.42 55/46 0.151 50.76 57/44 0.106
RUS 45.58 35/66 0.000** 48.92 35/66 0.000**
n = expected number of loci with excess heterozygosity under the respective model; Hd / He =
number of loci with a deficit of heterozygosity / excess of heterozygosity; P = probability; * and
** = significant at 5% and 1% probability, respectively.
For SER, MAC, JUC, APD, and RUS, the signal test revealed a highly significant deficit
in heterozygosity under both IAM and SMM models, thus demonstrating the occurrence of
population bottlenecks. MOS, ICA, and AR1 populations show a significant bottleneck based on
the IAM model and only the LGP population showed a significant genetic bottleneck based on
the SMM model. The populations AR2 and SMG show equilibrium between mutation and drift.

45
DISCUSSION
PIC value
The polymorphic information content determines the effectiveness of molecular markers
in detecting polymorphism between individuals. From this we can infer the genetic diversity of a
population (RESENDE et al., 2009). Thus, according to Botstein et al. (1980), all the PIC values
found in the present study are classified as moderately informative, with values ranging from
0.339 to 0.446. Tiwari et al. (2015) and Vieira et al. (2015), using ISSR primers, found PIC
values ranging from 0.240 to 0.390 and 0.057 to 0.444, respectively. Thus, the values obtained in
the current study are comparable to previous studies.
Genetic diversity
We found a high percentage of polymorphic loci, which demonstrates that the ISSR
primers are effective in identifying the genetic diversity of the studied Copernicia prunifera
populations. In a study on Butia Becc. (Arecaceae) using ISSR primers, Gaiero et al. (2011)
found similar results to those reported herein with a percentage of polymorphic loci of 96%. The
results for Nei’s genetic diversity and Shannon index were also similar to those found in other
studies of palm trees using ISSR primers. Rossi et al. (2014), evaluating the distribution of
genetic diversity in natural populations of Mauritia flexuosa L. f. (Arecaceae), obtained Nei’s
index values ranging from 0.185 to 0.238. While Santos et al. (2015), in a study of the genetic
structure of Attalea vitrivir Zona (Arecaceae), found Nei’s genetic diversity index ranging from
0.259 to 0.340 and Shannon index ranging from 0.377 to 0.516, results that are slightly higher
than the present study. Furthermore, Chagas et al. (2015), studying a population of Elaeis
guineensis Jacq (Arecaceae), obtained a Shannon index value of 0.285. Most populations showed
lower genetic diversity for long-lived perennial species (0.250) (NYBOM, 2004).
Populations occurring in the northern region of the species geographic distribution,
particularly in the Jaguaribe mesoregion, present higher values of genetic diversity that differ
statistically from the others. We note that the highest level of gene flow occurs in this region,
which may have contributed to greater diversity in the populations of AR1, AR2, RUS, ICA, and
MOS. Thus, there is a clear need for further phylogeographic studies in order to determine if the
Jaguaribe mesoregion has a diverse lineage, and is thus a probable center of origin, or if it is a
center of genetic diversity. The low rates of genetic diversity found in some populations may
reflect anthropogenic pressures on Copernicia prunifera populations as shown by the presence of
46
genetic bottlenecks (Table 7). A decrease in effective population size may cause a decrease in
gene flow and favor a reduction in genetic diversity in populations (DEFAVARI et al., 2009).
Population genetic structure
According to AMOVA, greater genetic variation occurred among individuals within
populations than between populations. Other studies on palm trees show similar results, with
greater genetic variation occurring among individuals within populations (ROSSI et al., 2014;
SANTOS et al., 2015). However, in the present study genetic differentiation among populations
was high (Fst = 0.419), suggesting limited gene flow among populations, which may be related to
the large geographical distances between populations. According to Lee et al. (2002), historical
events and recent evolutionary processes may influence the genetic diversity maintained between
and within populations.
Thus, isolated populations with limited gene flow tend to have high levels of population
genetic differentiation, as found in the current study (TANG et al., 2014). In a study by Cardoso
et al. (2000) on the palm Euterpe edulis Mart., their results show 42.6% diversity among
populations and 57.4% within populations. The authors suggest that the observed genetic
divergence could be due to forest fragmentation. The results obtained by Cardoso et al. (2000) are
similar to those found herein, in which extractive exploitation of Copernicia prunifera
populations leads to fragmentation, which can result in the reduction of genetic diversity within
populations.
The Mantel test confirms the genetic divergence between the populations, suggesting that
there is isolation by distance between the sampled populations. Similar results were also found by
Gaiero et al. (2011) for Butia using ISSR primers. Silva et al. (2014b) suggest that Copernicia
prunifera individuals present an aggregate spatial distribution pattern up to 10 meters which may
be related to restricted seed and pollen dispersal. In addition, this result corroborates the genetic
distance between populations, with an average of 0.260, which is high according to Nei (1978).
This high level of divergence may be due to population fragmentation, extensive exploitation of
the species, and restricted range of pollinators and dispersers, leading to low levels of gene flow
among populations.
We found the greatest genetic similarities between populations AR1 and AR2, and RUS
and MOS, which are located near to each other geographically. In addition, this similarity can be

47
explained by the high values of gene flow Nm = 29 and 13.7, respectively (Table 6). The MAC
population was genetically isolated from the others, therefore its genetic divergence should be
considered when developing breeding programs. Despite the large geographic distance between
the ICA and SMG populations, they are grouped within the dendrogram. This grouping can be
related to the location of the populations near to the coast where the surrounding vegetation may
contribute to gene flow of the species. The results of the UPGMA dendrogram are similar to the
clusters generated by PCA based on Nei’s genetic distance.
According to Wang (2004), Nm values between 1.0 and 10 migrants per generation
among populations, can prevent differentiation due to genetic drift. Gene flow values greater than
4.0 migrants per generation may avoid the impacts of breeding among related individuals, which
can occur within populations (SLATKIN, 1987). In the current study, low historical gene flow
was found among the studied populations, with an average of 2.7. This result may be due to the
geographical distances between populations (average of 160.7 km). Other factors that may
contribute to low levels of gene flow is the efficiency of dispersers and pollinators in reaching
other populations, and geographical barriers between populations (BAWA, 1992). Rossi et al.
(2014) evaluated the distribution of genetic diversity in populations of the Mauritia flexuosa palm
and observed higher levels of gene flow than our study. This difference may be due to the
significantly shorter geographic distance between their studied populations (an average of 40
km), than in the present study.
Bayesian analysis revealed that Copernicia prunifera genotypes in the 11 analyzed natural
populations belong to three distinct groups (K = 3). Populations in similar geographic regions
share genotypes, such as the populations in the western mesoregion (JUC, APD, and MOS) and
the Jaguaripe mesoregion (AR1, AR2, and RUS), as well as the populations in the Agreste
potiguar (LGP and SER). The ICA and SMG populations share genotypes despite the large
geographical distance between them, as is also shown in the UPGMA dendrogram. All other
populations show limited genetic structure with higher allele frequencies. The groups formed
show a similar pattern to those identified by the UPGMA and PCA, based on Nei’s genetic
identity and distance.

48
Genetic bottleneck
In light of the high genetic divergence between the Copernicia prunifera populations and
the fragmentation of the areas sampled in this study, it is important to identify populations that
have undergone population decline, so as to understand the risks of possible local extinction due
to reduced population size (LEE et al., 2002). Most of the populations showed a genetic
bottleneck, which is possibly due to the significant anthropogenic pressures in these areas.
Although the SMG population indicates equilibrium between mutation and drift, it is affected by
extensive anthropization due to the development of wind power plants and the occurrence of
fires, which can result in future genetic bottlenecks.
The reductions in Copernicia prunifera population size found in the present study may be
the result of intense exploitation of the species, due to its wide range of uses in industry and
commerce (ARRUDA; CALBO, 2004), which has compromised the genetic diversity of these
populations. In a study by Chagas et al. (2015) on Elaeis guineenses Jacq. (Arecaceae), the
authors suggest that reductions in the species’ population size could be due to local agricultural
activities and the loss of habitats. According to Defavari et al. (2009), a reduction in effective
population size may lead to a reduction in gene flow, reducing the number of alleles, and
favoring the loss of genetic diversity within populations.
IMPLICATIONS FOR CONSERVATION
Based on the results of the present study, we can infer that the studied populations are
losing genetic diversity within their populations. This can be observed through the high genetic
divergence between populations, suggesting geographic isolation and limited gene flow, possibly
due to anthropogenic factors that have reduced population sizes. Thus, conservation measures for
natural populations of Copernicia prunifera are necessary in order to minimize the loss of
important alleles, which may have consequences for the future of the species. In addition to in
situ conservation of natural populations, one strategy would be the creation of germplasm banks
for ex situ conservation, with seeds coming from the most diverse populations.
For populations with greater genetic diversity, such as those located in the state of Ceará,
another strategy could include the preservation of several populations across the geographic
distribution of the species. This would contribute to the maintenance of gene flow and the genetic
diversity found in these populations.

49
Population genetic bottlenecks were observed in most populations sampled. As such,
Luikart et al. (1998) recommend mitigation procedures to manage or introduce immigrants to
avoid or minimize the deleterious effects of bottlenecks. Therefore, we suggest that in situ and ex
situ conservation of the populations that present genetic bottlenecks is a priority.
Copernicia prunifera is not on the list of endangered species, however it has been affected
by the expansion of agricultural activities over time (REIS et al., 2011), contributing to
reductions in the species’ natural populations. To counteract the effects of this anthropization,
there is a need to implement sustainable management of non-timber forest products, such as
leaves and waxes, which are the main extraction products of Copernicia prunifera. These
activities help limit the advance of livestock and deforestation of these natural areas (WADT et
al., 2005), as well as contribute to the income of rural communities (TICKTIN, 2004).
ACKNOWLEDGMENTS
The authors acknowledge the Conselho Nacional de Desenvolvimento Científico e
Tecnológico (CNPq) for their financial support (Process 471099/2012-0) and the Coordenação de
Aperfeiçoamento de Pessoal de Nível Superior (CAPES) for a Masters Grant. We also thank Dr.
Evelyn R. Nimmo for editing the English language of the manuscript.
REFERENCES
ABREU, A. G.; PRIOLLI, R. H. G.; AZEVEDO-FILHO, J. A.; NUCCI, S. M.; ZUCCHI, M. I.;
COELHO, R. M.; COLOMBO, C. A. The genetic structure and mating system of Acrocomia
aculeata (Arecaceae). Genetics and Molecular Biology, n. 35, p.119-121, 2012.
ANDERSON, J. A.; CHURCHILL, G. A.; AUTRIQUE, J. E.; TANKSLEY, S. D.; SORRELLS,
M. E. Optimizing parental selection for genetic linkage maps. Genome, v. 36, p. 181-186, 1993.
ARRUDA, G. M. T.; CALBO, M. E. R. Efeitos da inundação no crescimento, trocas gasosas e
porosidade radicular da carnaúba (Copernicia prunifera (Mill.) H.E. Moore). Acta Botânica
Brasileira, v.18, n.2, p.219-224, 2004
BAWA, K. S. Mating systems, genetic differentiation and speciation in tropical rain forest plants.
Biotropica, St. Louis, v. 24, n. 2, p. 250-255, 1992.

50
BOTSTEIN, D.; WHITE R. L.; SKOLNICK, M.; DAVIS, R. W. Construction of a genetic
linkage map in man using restriction fragment length polymorphisms. The American Journal of
Human Genetics, v. 32, p. 314-331, 1980.
BRANDÃO, M. M. ; VIEIRA, F. A.; NAZARENO, A. G.; CARVALHO, D. Genetic diversity of
neotropical tree Myrcia splendens (Myrtaceae) in a fragment-corridor system in the Atlantic
rainforest. Flora, v. 216, p. 35-41, 2015.
CARDOSO, S. R. S.; ELOY, N. B.; PROVAN, J.; CARDOSO, M. A.; FERREIRA, P. C. G.
Genetic differentiation of Euterpe edulis Mart. populations estimated by AFLP analysis.
Molecular Ecology, n. 9, p. 1753–1760, 2000.
CAVALCANTE, C. R.; DINIZ, S. F. O estudo da carnaúba no ensino de geografia no município
de Coreaú – CE. Revista da Casa da Geografia de Sobral, v.7, n.1, p.141-150, 2005.
CHAGAS, K. P. T.; SOUSA, R. F.; FAJARDO, C. G.; VIEIRA, F. A. Seleção de marcadores
ISSR e diversidade genética em uma população de Elaeis guineenses. Agrária, v.10, n.1, p.147-
152, 2015.
CORNUET, J. M.; LUIKART, G. Description and power analysis of two tests for detecting
recent population bottlenecks from allele frequency data. Genetics, v. 144, p. 2001-2014, 1996.
COTA, L.G.; VIEIRA, F.A.; MELO JÚNIOR, A.F.; BRANDÃO, M.M.; SANTANA, K.N.O.;
GUEDES, M.L.; OLIVEIRA, D.A. Genetic diversity of Annona crassiflora (Annonaceae) in
northern Minas Gerais State. Genetics and Molecular Research, v. 10, p. 2172-2180, 2011.
D’ALVA, O. A. O extrativismo da carnaúba no Ceará. Fortaleza: Banco do Nordeste do
Brasil. 172 p, 2007.
DEFAVARI, G. R.; TARAZI, R.; MORENO, M. A.; FERRAZ, E. M.; GANDARA, F. B.;
KAGEYAMA, P. Y. Estrutura genética espacial intrapopulacional de Hymenaea stigonocarpa
Mart. Ex Hayne na Estação Ecológica de Itirapina, SP. Scientia Forestalis, v.37, n.81, p.89-98,
2009.
DOYLE, J. J.; DOYLE, J. L. Isolation of plant DNA from fresh tissue. Focus, v.12, n.1, p.13-15,
1987.

51
DUARTE, J. F.; CARVALHO, D.; VIEIRA, F. A. Genetic conservation of Ficus
bonijesulapensis R.M. Castro in a dry forest on limestone outcrops. Biochemical Systematics
and Ecology, v. 59, p. 54-62, 2015.
EARL, D. A.; VONHOLDT, B. M. Structure Harvester: a website and program for visualizing
Structure output and implementing the Evanno method. Conservation Genetics Resources, v. 4,
n. 2, p. 359-361, 2012.
EVANNO, G.; REGNAUT, S.; GOUDET, J. Detecting the number of clusters of individuals
using the software STRUCTURE: a simulation study. Molecular Ecology, v. 14, p. 2611–2620,
2005.
EXCOFFIER, L.; LAVAL, G.; SCHNEIDER, S. Arlequin: a software for population data
analysis. Version 3.5. Geneva: University of Geneva, 2007. Available in: <http://
cmpg.unibe.ch/software/arlequin3>. Access in: 23 fevereiro de 2016.
FUCHS, E. J.; HAMRICK, J. L. Genetic diversity in the endangered tropical tree Guaiacum
sanctum (Zygophyllaceae). Journal of Heredity, Washington, v. 101, n. 3, p. 284-291, 2010.
GAIERO, P.; MAZZELLA, C.; AGOSTINI, G.; BERTOLAZZI, S.; ROSSATO, M. Genetic
diversity among endangered Uruguayan populations of Butia Becc. species based on ISSR. Plant
Systematics and Evolution, v. 292, p. 105–116, 2011.
GITZENDANNER, M. A.; SOLTIS, P. S. Patterns of genetic variation in rare and widespread
plant congeners. American Journal of Botany, v. 87, p. 783-792, 2000.
JABEEN, R.; PRENTIS, P.; ANJUM, T.; ADKINS, S. W. Genetic Structure of Invasive Weed
Parthenium hysterophorus in Australia and Pakistan. International journal of agriculture &
biology, v. 17, n. 2, p. 327‒333, 2015.
KIMURA M., CROW J. The Number of Alleles that Can Be Maintained in a Finite Population.
Genetics. p. 725–738, 1964.
KIMURA M., OTHA T. Stepwise mutation model and distribution of allelic frequencies in a
finite population. Proceedings of the National Academy of Sciences of the USA, p. 2868–
2872, 1978.
LEE, S. L.; NG, K.K. S.; SAW, L. G.; NORWATI, A.; SALWANA, M. H. S.; LEE, C. T.;
NORWATI, M. Population genetics of Intsia palembanica (Leguminosae) and genetic

52
conservation of Virgin Jungle Reserves in Peninsular Malaysia. American Journal of Botany, v.
89, p.447-459, 2002.
LOUSADA, J. M.; BORBA, E. L.; RIBEIRO, K. T.; RIBEIRO, L. C.; LOVATO, M. B. Genetic
structure and variability of the endemic and vulnerable Vellozia gigantea (Velloziaceae)
associated with the landscape in the Espinhaço Range, in southeastern Brazil: implications for
conservation. Genetica, v. 139, p. 431–440, 2011.
LUIKART, G.; ALLENDORF, F. W.; CORNUET, J. M.; SHERWIN, W. B. Distortion of allele
frequency distributions provides a test for recent population bottlenecks. Journal of Heredity,
v.89, n. 3, p. 238-247, 1998.
MCDERMOTT JM, MCDONALD. Gene flow in plant pathosystems. Annual Review of
Phytopathology, v. 31, p. 353-373, 1993.
MCCUNE, B.; MEFFORD, M. J. Multivariate Analysis of Ecological Data. Version 4.0. MjM
Sotware, Gleneden Beach, Oregon, 1999.
MELO JÚNIOR, A. F.; CARVALHO, D.; VIEIRA, F. A.; OLIVEIRA, D. A. Spatial genetic
structure in natural populations of Caryocar brasiliense Camb. (Caryocareceae) in the North of
Minas Gerais, Brazil. Biochemical Systematics and Ecology, v. 43, p. 205-209, 2012.
NEI, M. Estimation of average heterozygosity and genetic distance from a small number of
individuals. Genetics, v. 89, p. 583–590, 1978.
NYBOM, H. Comparison of different nuclear DNA markers for estimating intraspecific genetic
diversity in plants. Molecular Ecology, v. 13, p. 1143-1155, 2004.
NYBOM, H.; BARTISH, I. V. Effects of life history traits and sampling strategies on genetic
diversity estimates obtained with RAPD markers in plants. Perspectives in Plant Ecology,
Evolution and Systematics, Zurich, v. 3, n. 2, p. 93-114, 2000.
OLIVEIRA. D. A.; JÚNIOR, A. F. M.; BRANDÃO, M. M.; RODRIGUES, L. A. MENEZES, E.
V.; FERREIRA, P. R. B. Genetic diversity in populations of Acrocomia aculeata (Arecaceae) in
the northern region of Minas Gerais, Brazil. Genetics and Molecular Research, v. 11, p. 531-
538, 2012.
PEAKALL, R.; SMOUSE, P. E. GENALEX 6: genetic analysis in Excel. Population genetic
software for teaching and research. Mol. Ecol. Notes 6, 288–295, 2006.

53
PRITCHARD, J. K. Structure software version 2.3.4. Available in:
http://pritchardlab.stanford.edu/ 2002. Access in: 10 abril 2016.
REDDY, M. P.; SARLA, N.; SIDDIQ, E. A. Inter simple sequence repeat (ISSR) polymorphism
and its application plant breeding. Euphytica, v. 128, p. 9-17, 2002.
REIS, R.G.E.; PEREIRA, M.S.; GONÇALVES, N.R.; PEREIRA, D.S.; BEZERRA, A.M.E.
Emergência e qualidade de mudas de Copernicia prunifera em função da embebição das
sementes e sombreamento. Revista Caatinga, v.24, n.4, p.43-49, 2011.
RESENDE, R. K. S.; VILELA, P. L.; CHALFUN, J. A.; PEREIRA, T. P.; ELISA, M. T.
Divergência genética entre cultivares de gérbera utilizando marcadores RAPD. Ciência Rural, v.
39, n. 8, p. 2435-2440, 2009.
ROHLF, F. J. NTSYS: Numerical Taxonomy and Multivariate Analysis System (v. 1.8).
Exeter Software, New York. 1993.
ROSSI, F. S.; ROSSI, A. A. B.; DARDENGO, J. F. E.; BRAUWERS, L. R.; SILVA, M. L.;
SEBBENN, A. M. Diversidade genética em populações naturais de Mauritia flexuosa L. f.
(Arecaceae) com uso de marcadores ISSR. Scientia Florestalis, Piracicaba, v. 42, n. 104, p. 631-
639, dez. 2014.
SANTOS, R. R. M.; CAVALLARI, M. M.; PIMENTA, M. A. S.; ABREU, A. G.; COSTA, M.
R.; GUEDES, M. L. Population genetic structure of Attalea vitrivir Zona (Arecaceae) in
fragmented areas of southeast Brazil. Genetics and Molecular Research, v.14, p. 6472-6481,
2015.
SHAPCOTT, A.; HUTTON, I.; BAKER, W. J.; AULD, T. D. Conservation genetics and ecology
of an endemic montane palm on Lord Howe Island and its potential for resilience. Conservation
Genetics, v. 13, v. 257–270, 2012.
SILVA, F. D. B.; MEDEIROS FILHO, S.; BEZERRA, A. M. E.; FEITAS, J. B. S.;
ASSUNÇÃO, M. V. Pré-embebição e profundidade de semeadura na emergência de Copernicia
prunifera (Miller) H. E Moore. Revista Ciência Agronômica, v.40, n.2, p.272-278. 2009.
SILVA, M. S.; VIEIRA, F. A. CARVALHO, D. Diversity and genetic structure in natural
populations of Geonoma schottiana Mart (Arecaceae): implications for conservation. Cerne, v.
17, n. 2, p. 195-201, 2011.

54
SILVA, R. A. R.; VIEIRA, F. A.; ROCHA, T. G. F.; DANTAS, E. X. Reproductive ecology of
palm Copernicia prunifera (MILL) H. E. Moore (Arecaceae). Revista Floresta e Ambiente,
2014a.
SILVA, R. A. R.; SOUSA, R. F.; ARAÚJO, L. F. B.; PINHEIRO, L. G.; VIEIRA, F. A.
Distribuição espacial em microescala da palmeira carnaúba, Copernicia prunifera (Mill) H. E.
Moore. ACSA – Agropecuária Científica no Semi-Árido, v. 10, n. 1, p. 118-121, 2014b.
SILVA, F. A. S. ASSISTAT: Versão 7.7 beta. DEAG-CTRN-UFCG – Atualizado em 01 de
março de 2016. Available in <http://www.assistat.com/>. Access in : 08 de maio de 2016.
SLATKIN, M. The average number of sites separating DNA sequences drawn from a subdivided
population. Theoretical Populations Biology, v. 32, p. 42-49, 1987.
SOUSA, R. F.; SILVA, R. A. R.; ROCHA, T. G. F.; SANTANA, J. A. S.; VIEIRA, F. A.
Etnoecologia e etnobotânica da palmeira carnaúba no Semiárido Brasileiro. Cerne, v. 21, n. 4, p.
587-594, 2015.
TANG, N.; MO, G.; TUYL, J. M.; ARENS, P.; LIU, J.; TAMG, D. Genetic diversity and
structure of Lilium pumilum DC. in southeast of Qinghai–Tibet plateau. Plant Systematics and
Evolution, v. 300, p. 1453–1464, 2014.
TICKTIN, T. The ecological implications of harvesting non-timber forest products. Journal of
Applied Ecology, v. 41, n. 1, p. 11-21. 2004.
TIWARI, V.; MATHAR, K. S.; SINGH, N.; MEENA, B. NAIR, K. N.; DATT, B.; UPRETI, D.
K.; TAMTA, S.; RANA, T. S. Genetic variability and population structure of Bergenia ciliate
(Saxifragaceae) in the Western Himalaya inferred from DAMD and ISSR markers. Biochemical
Systematics and Ecology, v. 60, p. 165-170, 2015.
VIEIRA, F. A.; SOUSA, R. F., SILVA, R. A. R.; FAJARDO, C. G.; MOLINA, W. F.
Diversidade genética de Copernicia prunifera com o uso de marcadores moleculares ISSR.
Agrária - Revista Brasileira de Ciências Agrárias, v.10, n.4, p.525-531, 2015.
WADT, L. H. O.; KAINER, K. A.; GOMES-SILVA, D. A. P. Population structure and nut yield
of a Bertholletia excelsa stand in Southwestern Amazonia. Forest Ecology and Management, v.
211, n. 1, p. 371-384. 2005.

55
WANG, J. Application of the one-migrant-per-generation rule to conservation and management.
Conservation Bology, Essex, v. 18, p. 332-343, 2004.
WOLFE, A. D. ISSR techniques for evolutionary biology. Methods in Enzymology, v.395,
p.134-144, 2005.
YEH, F. C.; YANG, R. C.; BOYLE, T. B. J.; YE, Z. H.; MAO, J. X. POPGENE, theuser-
friendly shareware for population genetic analysis molecular biology and biotechnology center.
Edmonton, 1997.
YOUNG, A.; BOYLE, T.; BROWN, T. The population genetic consequences of habitat
fragmentation for plants. Trends Ecology Evolutionary, Oxford, v. 11, n. 10, p. 413-418, Oct.
1996.

56
CONCLUSÕES
A distribuição potencial da Copernicia prunifera concentra-se na região nordeste do
Brasil, sendo a precipitação do trimestre mais seco (bio17) a variável ambiental que mais
contribui com o MNE, sugerindo que Copernicia prunifera se adaptada bem a ambientes
estressantes ao déficit hídrico sazonal. A maior variação genotípica foi encontrada entre
indivíduos dentro das populações. No entanto, foi verificada a existência de correlação positiva e
significativa entre as distâncias genéticas e geográficas, sugerindo alta divergência genética entre
as populações que pode ser explicada pelo modelo de isolamento por distância.
Populações próximas geograficamente apresentaram maior similaridade genética, como
por exemplo, as populações AR1 e AR2 que também apresentam elevado fluxo gênico. A análise
de gargalo genético apontou que as populações de AR2 e SMG indicaram equilíbrio entre
mutação e deriva, no entanto, todas as outras populações estudadas apresentaram redução
populacional. As populações AR1, AR2, ICA, RUS e MOS podem ser prioritárias para
conservação, devido aos elevados índices de diversidade encontrados nessas áreas, quando
comparado com as outras populações. A população de SER apresentou os mais baixos valores de
diversidade genética e deve ser urgentemente protegida.