mid to late holocene paleoceanographic changes in the southern … · 2015. 2. 11. · the help...
TRANSCRIPT

Renata Hanae Nagai
Mid to Late Holocene paleoceanographic changes in the
Southern-Southeastern Brazilian shelf
Tese apresentada ao Instituto Oceanográfico
da Universidade de São Paulo, como parte
dos requisitos para obtenção do título de
Doutor em Ciências, Programa de
Oceanografia, área de Oceanografia
Geológica.
Orientador: Prof. Dr. Michel M. de Mahiques
Co-orientador: Profa. Dra. Silvia Helena de Mello e Sousa
São Paulo
2013

Universidade de São Paulo
Instituto Oceanográfico
Mid to Late Holocene paleoceanographic changes in the Southern-Southeastern Brazilian shelf
Renata Hanae Nagai
Tese apresentada ao Instituto Oceanográfico da Universidade de São Paulo, como parte dos requisitos para obtenção do título de Doutor em Ciências, Programa de Oceanografia, área de
Oceanografia Geológica
Julgada em/Evaluated in ____/____/____
_____________________________________________ _______________
Prof(a). Dr(a). Conceito/Grade
_____________________________________________ _______________
Prof(a). Dr(a). Conceito/Grade
_____________________________________________ _______________
Prof(a). Dr(a). Conceito/Grade
_____________________________________________ _______________
Prof(a). Dr(a). Conceito/Grade
_____________________________________________ _______________
Prof(a). Dr(a). Conceito/Grade

“Sem ética e competência não se faz ciência.”
Prof. Dr. Ricardo R. Brentani (In memoriam)

Acknowledgements
This work was only possible due to the support of innumerous people that closely
participated in the personal and professional fields of my life in the last 4 years (and beyond).
Specially, none of this would be possible without the love and support of my family. I am
forever thankful to my parents Maria Aparecida and Helio Mitsuo Nagai, my sister Paula
Junie Nagai and my partner Diogo Luiz Paes dos Santos.
The constant thirst for knowledge and love for science of my supervisor Prof. Dr.
Michel M. Mahiques (a.k.a. Chefinho) – you are the best!, and co-supervisor Prof. Dr. Silvia H.
M. Sousa pushed me to go further and inspired me.
As no science is ever done alone, especially paleosciences, a number of collaborators
participate providing lab infrastructure and data discussion in Brazil and overseas. The
sedimentary organic and inorganic composition of the sediments had incredible support from
IOUSP Prof. Dr. Rubens C.L. Figueira and his students (Dr. Andressa Ribeiro, Charles E.A.
Silva, and Alexandre B. Salaroli) and Prof. Dr. Marcia Caruso Bícego.
The mineralogy data could not have been obtained without Prof. Dr. Fernando Rocha
from Aveiro University (Portugal) and Dr. M. Virginia A. Martins to whom I am very grateful for
the help with the benthic foraminifera and hospitality in my stay in Aveiro.
The geochemical analysis in foram shells were done during a short stay in at the
MARUM Institute in Bremen (Germany) this was only possible because Dr. Stefan Mulitza
agreed to collaborate and receive me there, and due to Dr. Henning Kunhert for the patience
in showing me the Mg/Ca lab procedures (and explaining a thousand times how the ICPMS
worked!), I am indebted to you both. While in my stay in Bremen, I had contact with Dr. Till
Hanebuth and his working group, to whom I am also thankful for the hospitality and data
discussion in the Argentina Meetings. And a special thanks to Vera B. Bender (now Dr.) for the
good moments in Bremen in and out of the office!
I am also indebted with Prof. Dr. Cristiano M. Chiessi, with his never ending
enthusiasm over science, for all the data discussion, reference sharing and advices. And many
other USP professors for giving the background knowledge and tools necessary to achieve this

work goals, such as Prof. Dr. Alexander Turra, Prof. Dr. Francisco W. Cruz, Prof. Dr. Ilana
Wainer and Prof. Dr. Tércio Ambrizzi.
During these PhD years not only hard work and discussions were important, a good
working environment and some fun were also very much necessary. After endless hours at the
stereo-microscope the girls (Carlinha, Liz, Naira, Nancy, Pi, Poli and Thaisa) at the lab still
made me laugh! A special thanks to Cintia for all the doubt taking in the benthic foram
identification. The help from the undergraduate students Daniel (now MSc.), Ianco, Mariana
and Tito is also very much appreciated.
After work and during coffee pauses the companionship of friends from the
undergraduate times were fundamental Cintia (again), Hell, Luciana, João Carlos, Marcus,
and Marcos and the not so close but always present Michael, Paulinha and Simone. (love you
guys!). And during the weekends my dear friends Cacá, Caio, Cidão, Dani, Digo, Fi, Futoshi,
July, Lê, Sumô and Tchou brought me back to the social world and gave me perspective
outside science (after 20 many years still have you all as my friends is a privilege!).
At last but not least I am very grateful to everyone from of the administrative and
technical staff of all the involved institutions, especially those part of the IOUSP community, for
making this work possible.
This work would not be possible without the support and funding of FAPESP for core
collection, geochemical analysis and my scholarship (FAPESP n° 2009/01594-6). Also
supplementary financial support contributions were received from USP Pró Reitoria de Pós-
Graduação and GLOMAR.

i
Summary
Resumo ....................................................................................................................................... xiii
Abstract ....................................................................................................................................... xiv
1. Introduction ................................................................................................................................ 1
1.1. Primary productivity: the link between ocean and climate .................................................. 1
1.2. Mid- and Late Holocene ...................................................................................................... 2
2. Objectives .................................................................................................................................. 5
3. Study area ................................................................................................................................. 6
3.1. Sedimentology .................................................................................................................... 6
3.2. Modern oceanographic settings ......................................................................................... 9
3.3. Modern climatic conditions ............................................................................................... 12
4. Materials and methods ............................................................................................................ 17
4.1. Chronology........................................................................................................................ 17
4.2. Sedimentological analysis ................................................................................................ 18
4.3. Geochemical analyses ...................................................................................................... 19
4.3.1. Sedimentary organic matter ....................................................................................... 19
4.3.2. Calcium carbonate (CaCO3) ...................................................................................... 21
4.3.3. Sedimentary inorganic constituents ........................................................................... 21
4.3.4. Mineralogy .................................................................................................................. 23
4.3.5. Neodymiun (Nd) isotopes .......................................................................................... 25
4.4. Microfaunal analyses ........................................................................................................ 26
4.4.1. Chemical composition of planktonic foraminifera tests .............................................. 27
4.4.1.1. Elemental ratios in planktonic foraminifera tests - Mg/Ca ratios ............................. 28
4.3.4.3. Stable oxygen (δ18Oc) and carbon (δ13C) isotopic composition .............................. 31

ii
4.4.2. Benthic foraminifera community ................................................................................. 34
5. Results ..................................................................................................................................... 37
5.1. Core 7605 (27°6.24’S, 47°48.24’W – Itajaí/SC) ............................................................... 37
5.1.1. Chronology ................................................................................................................. 37
5.1.2. Sedimentological analyses ........................................................................................ 38
5.1.3. Geochemical analysis ................................................................................................ 39
5.1.4. Microfaunal analyses ................................................................................................. 46
5.1.4.1. Chemical composition of planktonic foraminifera tests ........................................... 46
5.1.4.2. Benthic foraminifera community .............................................................................. 47
5.2. Core 7610 (25°30.48’S, 46°38.1’W – Cananéia/SP) ........................................................ 53
5.2.1. Chronology ................................................................................................................. 53
5.2.2. Sedimentological analyses ........................................................................................ 55
5.2.3. Geochemical analysis ................................................................................................ 56
5.2.4. Microfaunal analyses ................................................................................................. 64
5.2.4.1. Chemical composition of planktonic foraminifera tests ........................................... 64
5.2.4.1.1. Elemental ratios in planktonic foraminifera tests - Mg/Ca and Ba/Ca ratios ....... 64
5.3. Core 7616 (25°5.88’S, 45°38.64’W – Santos/SP) ............................................................ 66
5.3.1. Chronology ................................................................................................................. 66
5.3.2. Sedimentological analyses ........................................................................................ 68
5.3.3. Geochemical analysis ................................................................................................ 70
5.3.4. Microfaunal analyses ................................................................................................ 77
5.3.4.1. Chemical composition of planktonic foraminifera tests ........................................... 77
5.3.4.2. Benthic foraminifera community .............................................................................. 79
6. Discussion ............................................................................................................................... 85

iii
6.1. Mid- to Late Holocene hydrodynamic changes in the S/SE Brazilian shelf - depositional
processes and sediment provenance. ..................................................................................... 85
6.2. Paleoproductivity changes in the S/SE Brazilian shelf during Mid- and Late Holocene .. 93
6.3. Tracing Mid- and Late Holocene La Plata River influence over the S Brazilian continental
shelf – insolation driven changes........................................................................................... 101
6.4. Surface waters temperature and salinity changes in the Santos Basin in the last 7000
years ...................................................................................................................................... 106
7. Summary and conclusions .................................................................................................... 114
8. References ............................................................................................................................ 116
Plate 1 ....................................................................................................................................... 143
Plate 2 ....................................................................................................................................... 144

iv
Table index
Table 1– Cores locations coordinates (latitude and longitude) and water depth, and sedimentary
column recovery. ......................................................................................................................... 17
Table 3– Diagnostic peaks and weighting factors applied for the identified minerals. ................ 24
Table 3 – 14C AMS radiocarbon dating results for core 7605 and 2σ calibrated age ranges, no
age inversion in radiocarbon dates was observed. ..................................................................... 37
Table 4 – εNd data obtained for core 7605. ................................................................................ 46
Table 5 - 14C AMS radiocarbon dating results for core 7610 and 2σ calibrated age ranges, no
age inversion in radiocarbon dates was observed. ..................................................................... 54
Table 6 - 14C AMS radiocarbon dating results for core 7616 and 2σ calibrated age ranges, no
age inversion in radiocarbon dates was observed. ..................................................................... 67
Table 7 – εNd data obtained for core 7616. ................................................................................ 75

v
Figure index
Figure 1– Location map, showing studied cores (7605, 7610 and 7616) site collection locations
with an (a) schematic drawing of the main oceanic currents influencing the S/SE Brazilian shelf
the Brazil Coastal Current (BCC) and the Brazil Current (BC), following the works of Souza and
Robinson (2004) and Silveira et al. (2000); and (b) Distribution of the mean diameter (Φ) of the
surface sediments, modified after Mahiques et al. (2004) and Gyllencreutz et al. (2010). ........... 7
Figure 2– (a) Geological framework of the South American continent (modified from Clapperton,
1993 by Mahiques et al., 2008). In a zoom, (b) the schematic geological map of the Paraná
River basin (from Depetris and Pasquini, 2007) and (c) a schematic diagram of the relative
contribution of major tributaries to La Plata River’s mean total discharge (from Pasquini and
Depetris, 2007). ........................................................................................................................... 10
Figure 3 – South America main atmospheric features the (annual mean 850 hPa geopotential
height NCEP-NCAR reanalysis (Kalnay et al. (1996). Where SALLJ stands for the South
America Low Level Jet and H for the South Atlantic High. ......................................................... 14
Figure 4 – Cross plot between C/N ratio and δ13C values, highlighting distinguish sources of
organic matter in sediments and in settling particles, redrawn from Meyers (1994). .................. 20
Figure 5- Latitudinal changes of the εNd values found by Mahiques et al. (2008) in SE South
America upper margin. ................................................................................................................ 26
Figure 6 – (a) vertical distribution of various planktonic foraminifera species in the Southwest
Atlantic, highlighting G. ruber (pink) occurrence in the upper part of the water column (modified
from Chiessi et al., 2007); and (b) the relationship between G.ruber (pink) abundance (%) and
seawater temperature (°C), black dots represent global sediment trap data obtained by Záric et
al. (2005), with the optimum temperature range of this species delimited by the gray bar, and
red dots represent SE Brazilian continental margin plankton net data from Sousa et al.
(submitted). .................................................................................................................................. 29
Figure 7 - Age model and uncorrected sedimentation rates (cm·kyr-1) for core 7605. Age model
was based on calibrated radiocarbon ages (red circles), interpolations were obtained through
the mixed effect model described by Heegard et al. (2005) – solid line; and the 95% confidence
interval - dashed lines. ................................................................................................................ 38

vi
Figure 8– Particle size distribution (PSD), frequency (%) in each size class (φ) are indicated by
colour-filled contours (legend in bottom), εNd data, the results of the grain size variations
Correspondence Analysis (CA) for core 7605, and representative grain size frequency
distributions (size class % versus Φ) for the corresponding core age levels (dashed lines) and
labels on the CA-plots. ................................................................................................................ 39
Figure 9 - Along core 7605 distribution of CaCO3 contents and sedimentary organic matter
(TOC and Ntot contents, isotopic compocition of the organic matter δ13C and δ15N and C/N ratio).
Black circles represent data and solid gray curves a moving average for every 3 samples....... 40
Figure 10 - (a) cross plot between TOC and Ntot, showing significant correlation between
variables (p<0.05) and highlighting three distinct groups of sediment samples; and (b) δ13C vs.
C/N plot, the different fields correspond to end member sources for organic matter preserved in
sediments (modified from Meyers, 1994). ................................................................................... 41
Figure 11 - Cross plots of (a) Fe vs. Al; (b) Ti vs. Al; (c) Ba/Al vs. TOC; and (d) Ba/Ca vs. TOC.
The first three plots (a, b and c) presented statistically significant values (p<0.05) of the
Correlation Coefficient. ................................................................................................................ 42
Figure 12 - Along core distribution of (a) sedimentary inorganic constitutents (Al, Fe, Ti, Ca and
Ba) and (b) elemental ratios (Fe/Ca, Ti/Ca, Ba/Ca and Ba/Al) obtained for core 7605. Black
circles represent data and solid black curves a moving average for every 3 samples. .............. 43
Figure 13 - Along core 7605 distribution of the main mineralogical components identified for the
< 63 µm size fraction and the Detrital Mineral Index (DM) and Fine Detrital Minerals/Coarse
Detrital Minerals (FDM/CDM) indexes. Black circles represent data and solid black curves a
moving average for every 3 samples. ......................................................................................... 45
Figure 14 – G. ruber (pink) δ18Oc and δ13C composition; alkenone based SST curve from core
7606 (Bícego, 2008); and δ18Ow-ivc estimates for core 7605. Black circles represent data and
solid gray curves a moving average for every 3 samples. .......................................................... 47
Figure 15 – Along core 7605 distribution of benthic foraminífera density (tests·10cc-1), epifauna
and infauna species percentages, and benthic foraminifera based indexes BFAR (tests·cm-2·kyr-
1) and BFHP (%).Black circles represent data and solid gray curves a moving average for every
3 samples. ................................................................................................................................... 48

vii
Figure 16 –Dendrogram classification resulting from the R-mode cluster analysis (correlation
method joined by UPGMA) based on the 12 species with relative abundances higher than 3% in
at least 10% of the samples from core 7605. .............................................................................. 49
Figure 17 – Along core 7605 distribution of the relative frequencies of the 12 benthic
foraminifera species considered as representative (>3% in at least 10% of samples), grouped
according to the R-mode cluster analysis. Black circles represent data and solid gray curves a
moving average for every 3 samples. ......................................................................................... 51
Figure 18 - Benthic assemblage parameters along core 7605 distribution. Where: R – species
richness; H’ – diversity; and J’ - equitability. ............................................................................... 53
Figure 19 - Age models and uncorrected sedimentation rates (cm·kyr-1) for core 7610. Age
model was based on calibrated radiocarbon ages (red circles), interpolations were obtained
through the mixed effect model described by Heegard et al. (2004) – solid line; and the 95%
confidence interval - dashed lines ............................................................................................... 54
Figure 20 - Particle size distribution (PSD), frequency (%) in each size class (φ) are indicated by
colour-filled contours (legend in bottom), εNd data, the results of the grain size variations
Correspondence Analysis (CA) for core 7610, and representative grain size frequency
distributions (size class % versus Φ) for the corresponding core age levels (dashed lines) and
labels on the CA-plots. ................................................................................................................ 55
Figure 21 – Along core 7610 distribution of CaCO3 contents and sedimentary organic matter
(TOC and Ntot contents, isotopic composition of the organic matter δ13C and δ15N and C/N ratio).
Black circles represent data and solid gray curves a moving average for every 3 samples....... 57
Figure 22 – (a) cross plot between TOC and Ntot, showing significant correlation between
variables (n-1=103; α= 0.05) and highlighting three distinct groups of sediment samples; and (b)
δ13C vs. C/N plot, the different fields correspond to end member sources for organic matter
preserved in sediments (modified from Meyers, 1994). .............................................................. 58
Figure 23 – Cross plots of (a) Fe vs. Al; (b) Ti vs. Al; (c) Ba/Al vs. TOC; and (d) Ba/Ca vs. TOC.
Statistically significant values (p<0.05) of the Correlation Coefficient are shown. ...................... 59
Figure 24 – Along core distribution of (a) the sedimentary inorganic constituents (Al, Fe, Ti, Ca
and Ba) and (b) the elemental ratios (Fe/Ca, Ti/Ca, Ba/Ca and Ba/Al) obtained for core 7610.
Black circles represent data and solid gray curves a moving average for every 3 samples....... 61

viii
Figure 25 - Along core 7610 distribution of the main mineralogical components identified for the
< 63 µm size fraction and the Detrital Mineral Index (DM) and Fine Detrital Minerals/Coarse
Detrital Minerals (FDM/CDM) indexes. Black circles represent data and solid gray curves a
moving average for every 3 samples. ......................................................................................... 63
Figure 26 - Crossplot between Mg/Ca ratios against (a) Mn/Ca and (b) Fe/Ca ratios, for core
7610, low R2 values highlight no contamination. ......................................................................... 65
Figure 27 - Along core distribution of chemical composition of G. ruber (pink) (Mg/Ca ratios,
δ18Oc and δ13C composition) and Mg/Ca based SST and δ18Ow-ivc estimates obtained for core
7610. ............................................................................................................................................ 66
Figure 28 - Age model and uncorrected sedimentation rates (cm·kyr-1) for core 7616. Age model
was based on calibrated radiocarbon ages (red circles), interpolations were obtained through
the mixed effect model described by Heegard et al. (2005) – solid line; and the 95% confidence
interval - dashed lines ................................................................................................................. 68
Figure 29 – Particle size distribution (PSD), frequency (%) in each size class (φ) are indicated
by colour-filled contours (legend in bottom), εNd data, the results of the grain size variations
Correspondence Analysis (CA) for core 7616, and representative grain size frequency
distributions (size class % versus Φ) for the corresponding core age levels (dashed lines) and
labels on the CA-plots. ................................................................................................................ 69
Figure 30 – Along core 7616 distribution of CaCO3 contents and sedimentary organic matter
(TOC and Ntot contents, isotopic composition of the organic matter δ13C and δ15N and C/N ratio).
Black circles represent data and solid gray curves a moving average for every 3 samples....... 70
Figure 31 - (a) cross plot between TOC and Ntot, showing significant correlation between
variables (n-1=103; α= 0.05) and highlighting three distinct groups of sediment samples; and (b)
δ13C vs. C/N plot, the different fields correspond to end member sources for organic matter
preserved in sediments (modified from Meyers, 1994). .............................................................. 71
Figure 32 - Cross plots of (a) Fe vs. Al; (b) Ti vs. Al; (c) Ba/Al vs. TOC; and (d) Ba/Ca vs. TOC.
Statistically significant values (p<0.05) of the Correlation Coefficient are shown. ...................... 72
Figure 33 - Along core distribution of (a) the sedimentary inorganic constitutents (Al, Fe, Ti, Ca,
and Ba) and (b) the elemental ratios (Fe/Ca, Ti/Ca, Ba/Ca and Ba/Al) obtained for core 7616.
Black circles represent data and solid gray curves a moving average for every 3 samples....... 73

ix
Figure 34 - Along core 7616 distribution of the main mineralogical components identified for the
< 63 µm size fraction and the Detrital Mineral Index (DM) and Fine Detrital Minerals/Coarse
Detrital Minerals (FDM/CDM) indexes. Black circles represent data and solid gray curves a
moving average for every 3 samples. ......................................................................................... 76
Figure 35 - Crossplot between Mg/Ca ratios against (a) Mn/Ca and (b) Fe/Ca ratios, for core
7616, low R2 values highlight no contamination. ......................................................................... 77
Figure 36 - Along core distribution of chemical composition of G. ruber (pink) (Mg/Ca ratios,
δ18Oc and δ13C composition) and Mg/Ca based SST and δ18Ow-ivc estimates obtained for core
7616. Black circles represent data and solid gray curves a moving average for every 3 samples.
..................................................................................................................................................... 78
Figure 37 - Along core 7616 distribution of benthic foraminífera density (tests·10cc-1), epifauna
and infauna species percentages, and benthic foraminifera based indexes BFAR (tests·cm-2·kyr-
1) and BFHP (%).Black circles represent data and solid gray curves a moving average for every
3 samples. ................................................................................................................................... 80
Figure 38 - Dendrogram classification resulting from the R-mode cluster analysis (correlation
method joined by UPGMA) based on the 13 species with relative abundances higher than 3% in
at least 10% of the samples from core 7616. .............................................................................. 81
Figure 39 - Along core 7616 distribution of the relative frequencies of the 13 benthic foraminifera
species considered as representative (>3% in at least 10% of samples), grouped according to
the R-mode cluster analysis. Black circles represent data and solid gray curves a moving
average for every 3 samples. ...................................................................................................... 82
Figure 40 – Benthic assemblage parameters along core 7616 distribution. Where: R – species
richness; H’ – diversity; and J’ - equitability. ............................................................................... 84
Figure 41 - Upper panel - Left: Particle size distribution (PSD) for cores 7605, 7610, and 7616,
where frequency % in each size class is indicated by colour-filled contours (legend in top).
Right: Results of a Correspondence Analysis (CA) of grain size variations. Lower panel:
Representative grain size frequency distributions (size class % versus Φ), for the cores. The
corresponding core age levels are indicated with dashed red lines and labels on the CFA-plots
..................................................................................................................................................... 88

x
Figure 42 – Relative sea-level curves along the SE South American coast. (A) Southern Rio de
la Plata, based on Cavalotto et al. (2004); (B) Salvador (Martin et al., 2003); and (C) envelope
for the Brazilian coast north of 28°S (solid lines) and south of 28°S (dashed lines) from Angulo
et al. (2006). (From: Gyllencreutz et al., 2010) ........................................................................... 88
Figure 43 – Latitudinal changes of the εNd values obtained for sediment samples between 55
and 20°S by Mahiques et al. (2008) and the εNd values obtained for core 7605 (yellow
hexagons) and core 7616 (purple cross) with sample estimated age (kyr cal. BP). ................... 89
Figure 44 – Along core distribution of the below 10 µm fraction (%), sortable silt mean size (φ)
and Fe/Ca ratios all three cores. Black line and dots represent core 7605; orange, 7610; and
purple, 7616................................................................................................................................. 92
Figure 45 – Schematic drawing showing variation of benthic foraminifera microhabitat depth
following the TROX model (Jorissen et al., 1995) and the depth critical levels of oxygen.
Modified from: Jorissen (1999) .................................................................................................... 96
Figure 46 – Comparison between δ18O temperature estimates from G. ruber (p) (black dots) with
annual mean (dashed line), winter (blue line) and summer (red line) temperature of the first 50m
of water column, highlighting that G. ruber (p) records mean annual to summer conditions
between 25 and 27°S. ............................................................................................................... 103
Figure 47 – (a) G. ruber (pink) δ18O values, (c) TOC contents and (d) Ti/Ca ratio values from
core 7605 compared with (b) alkenone based SST estimates from core 7606 (Bícego, 2008), (e)
from Al/Si ratio from a core collected at the Uruguay slope (Chiessi et al., 2010), (f) δ18O values
from Botuverá Cave spleothem record (Wang et al., 2007) and (g) summer insolation at 30°S.
................................................................................................................................................... 104
Figure 48 - Spatial distribution of precipitation anomalies between HT and HM (HM-HT) based
on 61 proxy-records from SE South America. Positive anomalies are represented as blue dots
(HM wetter than HT) and negative anomalies as red (HM drier than HT), the orange dot
indicating that the HT presented dry and wet episodes. ........................................................... 105
Figure 49 – Mid- and Late Holocene Mg/Ca based SST estimates (red) and seawater isotopic
δ18
O (blue) and δ13C (green) composition derived from the chemical analysis of the planktonic
foraminifera G. ruber (pink) tests for cores 7610 and 7616. Where data variation (shaded lines);
3 point moving average (bold lines); and significant linear regression (dashed lines). ............. 106

xi
Figure 50 – Stacked Mg/Ca based temperature (°C), δ18Ow-ivc and δ
13C records of the cores
obtained by averaging the detrended records; interpolation was done using the largest time
interval spacing found in the records (= 60 years). Periods with above mean values are painted
in red and with below mean values in blue. .............................................................................. 109
Figure 51 – Comparison between our (g) stacked record of Mg/Ca based SST (°C) for the SW
Atlantic and (f) South America Summer Monsoon precipitation changes recorded by a δ18O from
a speleothem from Central Brazil (Stiriks et al., 2012); (e) Mg/Ca based SST (°C) for the E
Equatorial Atlantic (Weldeab et al., 2005); (d) Mg/Ca based SST (°C) for the W Equatorial
Atlantic (Lea et al., 2003); (c) frequency of El-Niño events per 100 years (Moy et al., 2002); (b)
North Atlantic Deep Water – NADW - variations recorded by δ13C in C. wuellerstorfi tests (Oppo
et al., 2004); and (a) percentages of HSG in the N Atlantic marking Bonds events also marked
in blue numbered (Bond et al., 2001). ....................................................................................... 113

xii
Appendix index
Appendix 1 - Main sedimentological (grain size) and geochemical (sedimentary organic matter
and inorganic constituents, mineralogy, and planktonic G. ruber (p) isotopic composition) data
obtained for core 7605. (CD) ..................................................................................................... 145
Appendix 2 – Core 7605 benthic foraminifera community data, identified taxa microhabitat
classification and relative frequency (%), and values of density (tests·10cc-1), pecentages of
fragments, non-identified specimens, epifauna and infauna specimens, productivity indexes
BFHP (%) and BFAR (tests•cm-2
•kyr-1) and ecological parameters richness (S), Shannon
diversity (H') and equitability (J'). Where: epifauna (E) and infauna (I). (CD) ........................... 145
Appendix 3 – Main sedimentological (grain size) and geochemical (sedimentary organic matter
and inorganic constituents, mineralogy, and planktonic G. ruber (p) isotopic and elemental
composition) data obtained for core 7610. (CD) ....................................................................... 145
Appendix 4 – Main sedimentological (grain size) and geochemical (sedimentary organic matter
and inorganic constituents, mineralogy, and planktonic G. ruber (p) isotopic and elemental
composition) data obtained for core 7616. (CD) ....................................................................... 145
Appendix 5 - Core 7616 benthic foraminifera community data, identified taxa microhabitat
classification and relative frequency (%), and values of density (tests·10cc-1), pecentages of
fragments, non-identified specimens, epifauna and infauna specimens, productivity indexes
BFHP (%) and BFAR (tests•cm-2
•kyr-1) and ecological parameters richness (S), Shannon
diversity (H') and equitability (J'). Where: epifauna (E) and infauna (I). (CD) ........................... 145

xiii
Resumo
Neste estudo uma visão multi-proxy foi aplicada na compreensão das mudanças nas condições
oceanográficas em que a plataforma continental S/SE Brasileira foi submetida ao longo do
Holoceno Médio e Tardio. Para isso proxies sedimentológicos, geoquímicos e microfaunísticos
foram estudados em três testemunhos marinhos de alta resolução coletados ao longo da
plataforma S/SE do Brasil e discutidos sob uma perspectiva oceanográfica e climática regional
e global. No Holoceno Médio e Tardio, os processos deposicionais da plataforma S/SE
Brasileira foram influenciados por dois processos hidrodinâmicos distintos: (i) a presença da
Pluma do Rio La Plata, trazendo sedimentos oriundos da Bacia de drenagem do Rio La Plata, e
(ii) os movimentos onshore/offshore da Corrente do Brasil, no Holoceno Médio, trazendo
sedimentos oriundos da margem SE Brasileira para porção norte da Bacia de Santos (25°S). A
zona de influência do Rio La Plata estendeu-se a latitudes mais ao norte atingindo 25°S, no
Holoceno Tardio, especialmente nos últimos 3000 anos, como resultado do aumento nos
regimes de precipitação sobre a Bacia de drenagem desse rio. As águas superficiais da
plataforma S/SE Brasileira foram fertilizadas pelas águas mais frias e menos salinas da Pluma
do Rio La Plata, disponibilizando mais matéria orgânica para o sistema bentônico. Nas
proximidades de 25°S, a penetração na plataforma da Água Central do Atlântico Sul (ACAS)
também promoveu aumento na produtividade primária das águas superficiais. Ao longo do
Holoceno Médio e Tardio, uma tendência geral de diminuição da temperatura e salinidade das
águas superficiais corrobora com uma maior influência da Pluma do Rio La Plata sobre a
plataforma S/SE Brasileira como consequência de um aumento na precipitação no SE da
América do Sul. Essa tendência segue a tendência da insolação de verão em 30°S, e concorda
com outros registros proxy e modelos numéricos. Na porção norte da área de estudo,
sobreposta à tendência geral, duas grandes incursões negativas temperatura e salinidade, com
contatos abruptos, centradas em 5500 anos cal. BP e depois de 2800 anos cal. BP sugerem a
ocorrência de mudanças de escala multi-centenárias, possivelmente relacionadas a penetração
da ACAS na plataforma em decorrência de ventos de NE persistentes. Estas mudanças
ocorreram simultaneamente a eventos rápidos climáticos em escala regional e global. Eventos
de desaceleração da AMOC, mediada por mecanismos de amplificação, são propostos como o
mecanismo responsável por desencadear estas mudanças (triggering mechanism). Os
mecanismos amplificadores podem ter mudado ao longo do tempo e dado o não total
entendimento das teleconexões atmosféricas do sistema climático, colocamos como hipótese
que, no Holoceno Médio e Tardio, diferentes modos de variabilidade climática tais como, ENSO
e dipolo do Atlântico Sul, podem ter atuado.
Palavras-chave: Holoceno Médio e Tardio; Atlântico SW; Rio La Plata; Corrente do
Brasil; multi-proxies; sedimentação.

xiv
Abstract
Mid- and Late Holocene paleoceanographic changes over the S/SE Brazilian continental shelf
have been accessed through a multi-proxy approach. Sedimetological, geochemical and
microfaunal proxies were investigated in three high resolution marine sedimentary cores
collected along the S/SE Brazilian shelf and discussed under a regional and global
oceanographic and climatic perspective. The depositional processes of the S/SE Brazilian
margin were submitted to two different hydrodynamic controls during Mid- and Late Holocene:
(i) the northward penetration of the La Plata River Plume, bringing La Plata River derived
sediments, and (ii) the high energetic Brazil Current onshore/offshore movements transporting
SE Brazilian derived sediments for the northernmost part of the Santos Basin (25°S) during the
Mid-Holocene. In the Late Holocene, especially after 3000 yr cal. BP, La Plata River derived
sediments reached up to 25°S, highlighting a stronger influence of the La Plata River over the
S/SE Brazilian shelf as a result of increase in precipitation over the La Plata River drainage
basin. As the La Plata River colder and less saline waters influence over the S/SE Brazilian
shelf increased, the oligotrophic waters of the shelf were fertilized, promoting enhancement of
surface waters primary productivity and seafloor exportation. In the vicinity of 25°S, surface
waters primary productivity was also enhanced by increase in colder and less saline South
Atlantic Central Waters (SACW) shelf penetration. An overall a background trend of lower water
temperature and salinities corroborates to a stronger influence of the La Plata River Plume
waters during the Late Holocene as a result of higher precipitation over SE South America. This
trend followed the summer insolation at 30°S, in accordance to other proxy records and
numerical models. In the northernmost part of study area, superimposed to the general
background trend, two major temperature and salinity negative incursions with abrupt contacts
centered at 5500 yr cal. BP and after 2800 yr cal. BP highlight multi-centennial scale changes,
possibly related to SACW shelf penetrations due to persistent NE winds. These changes
occurred simultaneously to rapid climatic events at regional and global spatial scale. AMOC
slowdown events, mediated by amplifying mechanisms, are the proposed triggering mechanism
for the changes observed in the SE Brazilian shelf records. The amplifying mechanisms may
have changed throughout time and as atmospheric teleconnections are not yet fully understood
we hypothesize that different modes of climatic variability, such as ENSO and the South Atlantic
dipole, may have acted as mediators during Mid- and Late Holocene.
Keywords: Mid- and Late Holocene; SW Atlantic; La Plata River; Brazil Current; multi-
proxies, sedimentation.

1
1. Introduction
Marine sediments provide valuable information about environmental conditions at the
time of sediment deposition both in modern and past timescales. These archives are of most
importance in the comprehension of environmental changes as they also reflect changes in
processes at different spatial scales (i.e., local, regional and/or global). As the spatial and
temporal reconstruction of marine sediments distribution plays a major role in the understanding
of oceanic circulation and climatic processes, marine sedimentary records have been widely
applied in paleoceanographic and paleoenvironmental reconstructions (e.g., Haug et al ., 2001;
Leduc et al., 2010 amongst others). The complexity of the sedimentary signature of past
oceanographic and environmental conditions requires the use of high resolution records with a
multidisciplinary integration - a multi-proxy1 approach (e.g., Martins et al., 2007; Vénec-Peyré
and Caulet, 2000 amongst others).
In the context of global change, the comprehension of the mechanisms that influence
and control the Earth´s present and past variability are in the spotlight. Paleoceanographic and
paleoclimatic reconstructions based on environmental proxies from high resolution records are
fundamental tools in the understanding of climatic response to natural and anthropogenic
forcing (Villalba et al., 2009). The presence of regional proxy records with good temporal
resolution and the fact that the boundary conditions of the Earth system did not change
drastically (compared with glacial-intergalcial changes) make the Holocene Epoch (~11 650 yr
BP until the pre-industrial times) of particular interest (Wanner et al., 2008).
1.1. Primary productivity: the link between ocean and climate
Through primary productivity – the uptake of dissolved inorganic carbon and its
sequestration into organic compounds by marine primary producers – oceans act as regulators
in the carbon biochemical cycle, which affects the balance between the ocean and the
atmosphere. The distribution of carbon in the ocean is linked to biological productivity, sinking
1 In the parlance of paleoenvironmental reconstruction, proxies (or “proxy variables”) are measurable descriptors which
stand for the desired (but unobservable) variables such as temperature, salinity, nutrient content amongst others, also
known as target parameters (Wefer et al.,1999).

2
and degradation of organic matter and calcium carbonate and ocean circulation (Mix, 1989).
Thus, besides contributing to the understanding of the carbon cycle, studies related to
paleoproductivity provide insights in fields such as oceanic circulation, biogeography, wind
patterns, and climate (e.g., Boltovskoy, 1959; Vénec-Peyré and Caulet, 2000; Martins et al.,
2006; Paytan, 2008).
The concept of changing oceanic productivity and its relation to climate stands at the
beginning of paleoceanographic research (Paytan, 2008). Over the past 50 years, a large array
of proxies (qualitative and quantitative) has been applied to reconstruct productivity, confirming
the importance of this field (see Jorissen and Rohling, 2000; Paytan, 2008). Paleoproductivity
studies may use different complementary approaches by applying micropaleontological and/or
geochemical proxies. The first involves the application of microfossils such as foraminifera,
whether for its test chemical composition or community structure, as proxies in paleoproductivity
studies, providing also information about surface and bottom seawater hydrographic conditions
(temperature and salinity), benthic trophic state (organic carbon supply and quality) and redox
conditions, and bottom current energy (e.g., Mackensen et al., 1995; Fontanier et al., 2002;
Martins et al., 2007). While, the later focuses on detangling the chemical organic and/or
inorganic composition of marine sediments, providing also information about sediment
provenance, continental influence (sedimentary terrigenous supply), organic matter supply to
the bottom floor, as well as origin and quality (lability) of this organic matter (e.g., Paytan, 2008).
Continental margins (shelves and slopes) play a key role in the marine biogeochemical
cycling of carbon and associated elements (Walsh, 1991). The large input of nutrients of both
continental and oceanic sources (e.g., rivers and upwelling processes, respectively)
characterizes these regions as high primary productivity areas (Martinez et al., 1999), providing
sedimentary records that can reflect changes in oceanic and in the adjacent continent climatic
conditions.
1.2. Mid- and Late Holocene
Various chronostratigraphic terms have been used to subdivide the Holocene; these,
however, have not been consistently applied and generally refer to climatic stratigraphy that are,
at best, regional in validity (Wanner et al., op cit.). Generally the Holocene can be subdivided in

3
three phases: the Early Holocene, lasting from approximately 11,600 to 9000 years BP; the
second phase, the Mid-Holocene, covers the period from approximately 9000 to 5000–6000
years BP; and the Late Holocene, the third phase, lasting from approximately 5000–6000 years
BP to pre-industrial time. It was during the Holocene that human civilization development took
place. In this period humans were able to develop agriculture and domesticate animals; new
civilizations and population centers appeared and disappeared (Hetherington and Reid, 2010).
In the last 7000 years, in particular, the restructuring and collapse of numerous societies were
driven by local and/or regional climatic changes (Hodell et al.,1995; deMenocal, 2001; Araujo et
al., 2005; Bracco et al., 2010).
Over the last 30 years, the understanding of the Holocene Earth´s evolution has been
increasingly addressed in paleoceanographic and paleoclimatic reconstructions. However,
despite the advances in Holocene climate evolution the vast majority of these studies are
concentrated in the Northern Hemisphere. In South America most of the studies are focused
over the eastern Pacific coast and still little is known about the Southwestern Atlantic
oceanographic and South Eastern South America (SESA) climatic evolution. Even though this
portion of South America represents one the main economic force given its high demographic
density and well developed industries and agricultural production.
The climatic conditions over SESA in the Early Holocene are still under debate. Some
studies assume persistently dry conditions over SESA since the Last Glacial Maximum (LGM)
until the mid-Holocene (Ledru et al., 1998; Behling, 2002); others suggest relatively wet
conditions prevailing during the same period (Cruz et al., 2005, 2007); and others characterize it
as a period in which climate changed towards warmer and moister conditions (see Leonhart and
Lorscheitter, 2010 and references therein). During Mid- and Late Holocene SESA was
submitted to significant climatic fluctuations mainly characterized by the interchange between
dry and humid periods, controlled by changes in atmospheric circulation.
The hydrodynamic control, together with the relative tectonic stability and the absence
of post-glacial rebound, makes the S/SE Brazilian continental margin a favorable site for
investigations of the Late Quaternary climatic changes of the southwestern Atlantic (Mahiques
et al., 2011). Yet little is known about the Southwestern Atlantic continental margin Quaternary

4
history and evolution. For the Holocene Epoch pioneer works such as Mahiques et al. (2004,
2009) and Nagai et al. (2009) recognized, through a multi-proxy approach, oceanic productivity
changes linked to oceanic circulation in the S/SE Brazilian continental shelf. During Mid- and
Late Holocene SESA precipitation regime fluctuations also influenced depositional processes
over S/SE Brazilian shelf mainly concerning sediments source (Mahiques et al., 2009;
Gyllencreutz et al., 2010). These authors, through time-series analysis, recognized the
occurrence of Sub-Milankovitch cycles, Mahiques et al. (2009) related this cycles to temperature
cycles reported in the Northern Hemisphere; while Gyllencreutz et al. (2010) related the
approximately 1000 year cycles to changes in solar forcing.
In this scenario, this study primary hypothesis is that during the Mid- and Late Holocene
the S/SE Brazilian continental shelf experienced environmental changes influenced by the
Southwestern Atlantic oceanographic and SESA environmental conditions linked to changes in
oceanic circulation and climatic conditions at regional and/or global scale.
Thus, this study aims to understand the evolution of the S/SE Brazilian continental
margin during Mid- and Late Holocene. Through a multi-proxy approach in three high resolution
marine sedimentary cores collected along the S/SE Brazilian continental shelf, between 27° and
25°S, submitted to different oceanographic processes, in an attempt to better understand the
oceanographic and climatic mechanisms related to paleoenvironmental and paleoproductivity
changes. The Early Holocene was intentionally excluded from this study in order to dismiss the
influence of large sea-level fluctuations on the shelf.

5
2. Objectives
This study aims to understand the evolution of the S/SE Brazilian continental margin
during Mid- and Late Holocene through a multi-proxy approach . In order to achieve the main
goal of this study we propose the following specific objectives:
a) to evaluate changes in the depositional processes through sedimentological (grain
size) and geochemical (sedimentary inorganic constituents and εNd) proxies;
b) to evaluate paleoproductivity changes trough geochemical (sedimentary organic
matter and inorganic constituents, and chemical composition of planktonic
foraminifera tests) and microfaunal (benthic foraminifera assemblages) proxies;
c) to interpret and discuss Mid- and Late Holocene S/SE Brazilian shelf oceanographic
settings through an oceanographic and climatic fluctuations regional and global
perspective.
6
3. Study area
The northernmost part of the Southern Brazilian upper continental margin is known as
the São Paulo Bight, an arc-shaped embayment extending from Cabo de Santa Marta
(28°30’S–49°00’W) to Cabo Frio (23°00’S–42°00’W) (Figure 1, Zembruscki 1979). In this area
the shelf break is located between the isobaths of 120 and 180 meters and presents latitudinal
variation in width. In the northernmost and southernmost part of the study area the shelf is
narrower (i.e. approximately 70 km width off shore Cabo Frio) reaching its maximum width of
230 km at 25°S, with declivities ranging from 1:600 to 1:1300 (Zembruscki, 1979).
3.1. Sedimentology
The adjacent SE Brazil continental region is characterized by the presence of narrow
coastal plains bordered, landward, by a high plateau (approximately 1000 m height) and the
Serra do Mar mountain range (over 1500 m height) forcing most of the drainage systems to run
inland, nourishing the La Plata River Basin to the southwest of the study area (Gyllencreutz et
al., 2010), or the Paraíba do Sul River Basin, to the northeast (Figure 1).
In general, inner shelf sediments are composed mainly of sand, which usually
constitutes more than 50% of the sediments; silts and clays are predominant on the middle
shelf, between the 50 and 100 m isobaths; on the outer shelf sand and gravel contents
increase, sometimes accounting for more than 75% of the sediment distribution (Mahiques et
al., 2004). The calcium carbonate content presents a northward trend of increasing values,
especially on the outer shelf (Rocha et al., 1975; Nagai et al., submitted). (Figure 1)
Along the inner and middle shelves the sedimentation rate values are not higher than 70
cm.kyr-1, the highest values are found on zones where primary productivity and allochthonous
sources of terrigenous sediments (i.e. the Paraiba do Sul and La Plata rivers) play an important
role in the sedimentation processes (Mahiques et al., 2011). Meanwhile the outer shelf and
upper slope present negligible sedimentation rate values, reinforcing the relict character of the
sediments in these sectors (Mahiques et al., 2011).

7
Figure 1– Location map, showing studied cores (7605, 7610 and 7616) site collection
locations with an (a) schematic drawing of the main oceanic currents influencing the
S/SE Brazilian shelf the Brazil Coastal Current (BCC) and the Brazil Current (BC),
following the works of Souza and Robinson (2004) and Silveira et al. (2000); and (b)
Distribution of the mean diameter (Φ) of the surface sediments, modified after Mahiques
et al. (2004) and Gyllencreutz et al. (2010).

8
The S/SE Brazilian shelf has been studied since the 1970's (see Kowsmann and Costa,
1974 and Rocha et al., 1975). The absence of important adjacent fluvial sources has misled
Late Quaternary depositional processes on the São Paulo Bight to be considered for decades
as relict and palimpsest facies resulting of the reworking of sediments previously deposited at
sea level lowstands during the Late Pleistocene (Mahiques et al., 2008; 2011). In the last
decade, a series of papers has reassessed the modern sedimentary processes on the
continental shelf and upper slope in terms of hydrodynamic controlling factors and the input of
terrigenous sediments (Campos et al., 2008a, b; Figueira et al., 2006; Mahiques et al., 2004;
2008; Nagai et al., submitted). The latter is especially related to the transport of allochthonous
sediments from the La Plata River to the S/SE Brazilian margin (Campos et al., 2008b;
Mahiques et al., 2008; Nagai et al., submitted).
The La Plata River is the fifth largest river in volume of water in the world; its drainage
basin is the second largest in South America and covers approximately 20% of the South
American continent (an area of about 3 200000 km2), encompassing substantial portions of
Argentina, Bolivia, Brazil, Uruguay, and Paraguay. A mean of 23000 m3•s
-1 of water and
57000000 m3•yr
-1 of silt are discharged by the La Plata River into the Atlantic Ocean (Campos
et al., 2008b). The La Plata River drainage basin is composed by two main basins; the Uruguay
and the Paraná (composed by the Paraguay and the Upper Paraná sub-basins). The Uruguay
basin, the smallest in area (corresponding to 8% of the total drainage area, 22% of the mean
water discharge) corresponds mainly to terrains of tholeitic basalts, sedimentary rocks and
alluvial sediments; the Paraguay sub-basin (35% of the area and 16% of the water discharge)
drains several types of rocks, from pre-Cambrian metamorphic to Quaternary sediments,
including Paleozoic and Mesozoic sedimentary rocks; the Paraná sub-basin (27% of the area
and 56% of the river discharge), drains Paleozoic–Mesozoic sedimentary rocks, with
intercalated basalts, and supported by crystalline rocks on the boundaries of the Paraná
Sedimentary Basin (Figure 2). According to Mahiques et al. (2008) the basalts from the South
Paraná Magmatic Province may be identified as potential partial source rocks for the sediments
from the La Plata River as well as from the Southern Brazil sector located southward to 28°S.
S/SE Brazilian continental margin sedimentation processes are strongly dominated by
oceanic water mass dynamics and shelf circulation. On the inner and middle shelf, between 38°

9
to 27°S, the sedimentation is mainly determined by the seasonal input of sediments from the La
Plata River and, to a lesser extent, from the southern Brazilian coastal lagoons (Campos et al.,
2008a; Mahiques et al., 2008; Möller et al., 2008; Nagai et al., submitted) transported by the
Brazilian Coastal Current - BCC (Souza and Robinson 2004). Northward of 27°S, on the middle
and outer shelves and upper slope, the sedimentary processes are mainly influenced by the
southward flow of the Brazil Current (BC) along the continental margin (Mahiques et al., 2002;
2004; Nagai et al., submitted).
3.2. Modern oceanographic settings
The S/SE Brazilian continental margin is influenced by distinct hydrodynamic controls
which are reflected in the sedimentary processes and patterns found in the different sectors of
the shelf. The inner shelf is mainly influenced by the BCC transporting the low-salinity waters
derived from the La Plata River (Möller et al, 2008; Souza and Robinson, 2004). Meanwhile on
the middle and outer shelves, as well as on the upper slope, circulation is dominated by the BC
flowing southward and meandering around the 200 m isobaths (Souza and Robinson, 2004 ,
Figure 1).
Despite its economic and environmental impact, until recently, relatively little was known
about the La Plata River waters (Plata Plume Water – PPW) and its effect over the physical and
biological characteristics on the S/SE Brazilian shelf (Campos et al., 2008b). The PPW affects
circulation, water column stratification, and nutrient and species distribution over an extensive
portion of the inner continental shelf (Möller et al, 2008). Northward to the La Plata River
estuary the low salinity waters of the PPW are associated with high nutrient and chl-a
concentrations (Piola et al., 2008), phytoplankton (Ciotti et al., 1995), benthic foraminifera
(Eichler et al., 2008) and commercially important fisheries species (Muelbert and Sinque, 1996;
Sunyé and Servain, 1998).

10
Figure 2– (a) Geological framework of the South American continent (modified from
Clapperton, 1993 by Mahiques et al., 2008). In a zoom, (b) the schematic geological map
of the Paraná River basin (from Depetris and Pasquini, 2007) and (c) a schematic diagram
of the relative contribution of major tributaries to La Plata River’s mean total discharge
(from Pasquini and Depetris, 2007).

11
The freshwater outflow of the La Plata River northward displacement over the inner
S/SE Brazilian continental shelf is modulated by climatic variations over its drainage basin (river
discharge) and wind pattern (Gonzalez-Silvera et al., 2006; Piola et al., 2008). The PPW
reaches northern latitudes during winter season, when S/SW winds prevail, extending as far as
25°S north, being restricted to 32°S during summer when prevailing winds are from N/NE (Piola
et al., 2000, 2008). The precipitation regime over the La Plata River drainage basin impacts the
river discharge. Although mean annual rainfall is unevenly distributed, it is largely influenced by
the South American Monsoon System (SAMS) and its atmospheric features (Pasquini and
Depetris, 2007).
Hydrological records also show that global climate variability modes such as the El Niño
Southern Oscillation (ENSO) have a substantial effect on the magnitude of the Plata discharge,
stream flow increases during ENSO warm events (El Niño) and normal to low discharges occur
during cold events (La Niña) (Pasquini and Depetris, 2007 and references therein). However,
observations point to a northernmost extension of the PPW during La Niña events due to the
dominance of southerly winds forcing on the path of the plume (Piola et al., 2005). During El
Niño years the tendency of the plume to extend farther north as a consequence of higher
discharges is compensated by a reversal of the direction of the alongshore winds, which causes
offshore displacement of low-salinity water and the plume’s southwestward retreat (Piola et al.,
2005; Möller et al., 2008).
Wind pattern (direction and intensity) also influences other oceanographic processes,
such as the occurrence of coastal upwelling or seasonal differences in current strength (Palma
and Matano, 2009). The former involves changes in sea surface temperature (SST) distributions
due to shelf penetration of the Brazil Current (BC). During summer currents flow southwestward
at an mean speed of 40 cm•s-1, while in winter surface currents are less organized, being
southwestward at the 90 m isobath and towards the coast in the inner shelf (Palma and Matano,
2009).
The BC, the most important oceanographic current system of the S/SE Brazilian
continental margin, is a western boundary current, adjacent to the Brazilian coastline, that
closes the wind-driven Subtropical Gyre in the South Atlantic (Stramma and England, 1999).

12
This current transports Tropical Water (TW, Temperature>20°C and Salinity>36.40), at the
upper levels and South Atlantic Central Water (SACW, T<20°C and S<36.40) at the pycnocline
levels (Silveira et al., 2000; Rodrigues and Lorenzzetti, 2001). Therefore surface waters are
typically nutrient-poor, dominated by warm and salty TW. However, the existence of subsurface
peaks in chlorophyll values (>1.5 mg•m-3) at 30 to 40 m water depth, highlight bottom intrusions
of the cold, less saline and nutrient-rich SACW (Brandini, 1990; Castro et al., 2008).
The penetration of SACW into the shelf has been attributed to be a result of persistent
N/NE winds forcing (Castelão et al., 2004). More recently Palma and Matano (2009), through
numerical modeling have shown that the penetration of the colder and less saline SACW slope
waters into the shelf during the summer months is modulated by both wind pattern and onshore
intrusions of the BC. And, even though, the band of upwelling favorable winds extends
throughout the São Paulo Bight (south of 25.5°S) relatively warm SSTs occur in this region (as
far as 28°S), suggesting that this process is not controlled only by winds (Palma and Matano,
2009).
The interaction between the poleward flow of the BC and the bottom topography also
influences the near shore circulation, particularly in the bottom boundary layer. Changes in shelf
width modulate the alongshore pressure gradient and the magnitude of the shelf-break
upwelling and/or downwelling (Palma and Matano, 2009). The shelf-break upwelling processes
are associated with the BC cyclonic meanders that generate vertical velocities over the shelf
break and slope (Campos et al., 2000; Castelão et al., 2004). The cooling effect of this process
in the northern region of the Bight promotes a SST gradient between northern (colder) and
southern (warmer) parts of the São Paulo Bight during summer (Palma and Matano, 2009).
3.3. Modern climatic conditions
The latitudinal extension and diverse morphology of South America (SA) favor the
development of different atmospheric systems which contribute to a climatic heterogeneity of
the continent (Reboita et al. 2010). The SA continent also presents significant east-west
asymmetries due to the presence of the Andean chain, the variable width of the continent

13
(larger in low latitudes) and by the boundary conditions imposed by the cold waters of the
Pacific Ocean and the warm waters of the Southwestern Atlantic Ocean (Garreaud et al. 2009).
The regional low level atmospheric circulation is characterized by the presence of
atmospheric systems such as the Intertropical Convergence Zone (ITCZ), the South America
Low Level Jet (SALLJ), the South Atlantic High (SAH) and the South Atlantic Convergence
Zone (SACZ) (Figure 3). Over subtropical oceans low level circulation is characterized by
subtropical anticyclones, the so called subtropical highs that occupy 40% of Earth’s surface
(Rodwell and Hoskins, 2001). The SAH is a semi-permanent high pressure cell at about 20° to
35°S over the Atlantic Ocean maintained by subsidence and divergent winds, which originates
trade and West winds (Grimm, 1999; Garreaud et al. 2009), bringing NE winds to the
Southeastern Brazilian coastline between 15º and 25ºS (Wainer and Taschetto, 2006).
SA precipitation regime is related to interactions between regional atmospheric
circulation and the adjacent oceanic basins (Garreaud et al. 2009; Reboita et al. 2010). In
Southeastern South America - SESA (S/SE Brazil, S Paraguay and Uruguay) the precipitation
patterns are associated with the passage of frontal systems; cyclone and cold fronts; meso-
scale convective complexes; cyclonic systems; and atmospheric blockages. Cold front systems
can also promote precipitation over SESA directly or favoring the development of instability lines
(Reboita et al., 2010). SESA precipitation regimes are also influenced by local circulation
patterns (i.e., sea breeze) and the indirect action of the SACZ (Reboita et al., op cit.) modulated
by the SALLJ variability (Garreaud et al., 2009).
The pronounced seasonal cycle of the SESA precipitation regimes (more than 50% of
total annual precipitation during summer) sustains that the climate in the central part of the
continent be described as monsoonal (Zhou and Lau, 1998; Gan et al., 2004; Garreaud et al.,
2009). The main characteristics of the South America Monsoon System (SAMS) are well
described in the literature (i.e. Zhou e Lau, 1998; Gan et al., 2004; Vera et al., 2006a).
Meanwhile, during winter, regional precipitation is linked to mid latitude cyclones and humidity
from the SAH (Vera et al., 2002).
During austral summer, the southward displacement of the ITCZ and stronger trade
winds, efficiently transport humidity from the Tropical Atlantic into SA reaching the Amazon
14
Basin, where intense convective activity takes place (Drumond et al. 2008). The ITCZ, a region
with minimum pressure and intense trade winds low level convergence, is characterized by
intense convective precipitation (Garreaud et al., 2009; Reboita et al., 2010), and presents
seasonal displacement between 5º and 15ºN – from July to October, and between 5º and 15ºS
– from January to April (Aquino and Setzer, 2006).
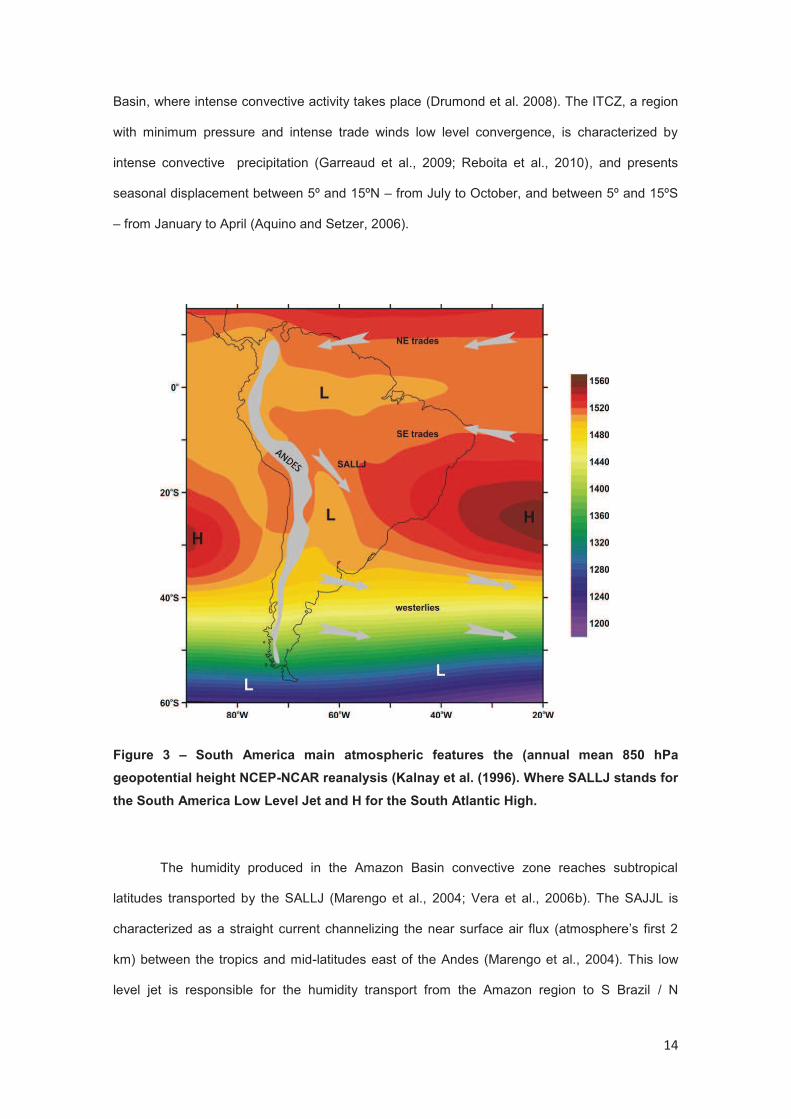
Figure 3 – South America main atmospheric features the (annual mean 850 hPa
geopotential height NCEP-NCAR reanalysis (Kalnay et al. (1996). Where SALLJ stands for
the South America Low Level Jet and H for the South Atlantic High.
The humidity produced in the Amazon Basin convective zone reaches subtropical
latitudes transported by the SALLJ (Marengo et al., 2004; Vera et al., 2006b). The SAJJL is
characterized as a straight current channelizing the near surface air flux (atmosphere’s first 2
km) between the tropics and mid-latitudes east of the Andes (Marengo et al., 2004). This low
level jet is responsible for the humidity transport from the Amazon region to S Brazil / N

15
Argentina during summer; and for the transport of tropical maritime air (less humid than the
tropical air masses from the SAH) during winter (Marengo et al., op cit.). In this sense, the
SALLJ modulates the precipitation regimes over Southern Brazil (Drumond et al. 2008).
The convergence of the northwestern flow of the SALLJ with the northeastern air flow
induced by the SAH forms a NW-SE oriented nebulosity band that extends from the South of
the Amazon to the Subtropical Atlantic, denominated SACZ, characterized by intense
precipitation (Drumond and Ambrizzi 2005 and references therein). During austral summer, the
SALLJ intensification promotes SACZ intensification and the penetration of cold frontal systems
in Southern end of the SALLJ (S Brazil and Argentina), increasing convective processes along
S/SE Brazil coast and lower humidity in Paraguay, Uruguay and N Argentina (Garreaud et al.,
2009; Marengo et al., 2004). There is apparently a relationship between SACZ and
Southwestern Atlantic Ocean sea surface temperatures (SST): positive (negative) anomalies of
SST in South Atlantic subtropical latitudes are associated with a southward (northward)
displacement of the SACZ which contributes to increase (decrease) in precipitation in SESA
(Diaz et al., 1998; Barros et al., 2000).
SESA climatic variability results from the superimposition of different large-scale
phenomenon’s such as: the El-Niño Southern Oscillation (ENSO), influencing a vast region of
South America both directly and indirectly (through atmospheric teleconnections); the Tropical
Atlantic SST meridional gradient, strongly impacting both weather and climate in SA; the Pacific
Decadal Oscillation (PDO); the Atlantic Multidecadal Oscillation (AMO); and high latitude
forcings such as the Antarctic Oscillation - AAO (see Garreaud et al., 2009 and references
therein).
ENSO events act as the main mode of variability in SA in the interannual timescale
(Garreaud et al., 2009), affecting SESA precipitation regimes (Grimm et al., 2000) and
promoting changes in wind pattern (Martin et al., 1993). In SESA El-Niño events are related to
positive anomalies in precipitation and temperature, this scenario is inverted during La-Niña
events (Garreaud et al., op cit.). The inter-hemispheric SST gradient is also affected by the SST
variations that accompany ENSO events, with significant impacts on the position and intensity

16
of the ITCZ which follows the displacement of the positive SST anomalies in the Tropical
Atlantic (Wainer and Taschetto, 2006).
In the decadal and inter-decadal timescales the PDO has similar spatial structure and
impacts over SESA temperature and precipitation regimes as ENSO events, however, with
smaller amplitudes (Garreaud et al., 2009). The AMO also influences SESA precipitation
regimes in decadal and inter-decadal timescales associated with changes in the intensity of the
Atlantic Meridional Overturning Circulation (AMOC). During AMO positive (negative) phase the
weakening (strengthening) of the AMOC promotes warmer (colder) Southwestern Atlantic SST,
increasing (decreasing) SACZ activity and precipitation over SESA (Chiessi et al., 2009). The
ITCZ position is also influenced by AMOC variability since it promotes positive SST anomalies
in the Southwestern Atlantic. During periods of strong (weak) AMOC the ITCZ occupies a
southernmost (northernmost) position, creating positive (negative) anomalies in humidity
transport into the Amazon Basin, resulting in an intensification (weakening) in SAMS/SACZ
activity (Zhang and Delworth, 2005).

17
4. Materials and methods
Three piston cores, #7605, #7610 and #7616, were collected from the SE Brazilian
shelf, on board R.V. Prof. W. Besnard, in 2005. The coring locations are presented in Figure 1
and Table 1. Surface sediments were lost during coring (probably splashed away on impact by
the piston corer). Following opening, cores were subsampled in the laboratory at 2 cm intervals,
for the sedimentological and geochemical analyses subsamples were immediately frozen and
subsequently freeze-dried, and for microfaunal analyses subsamples were oven dried (T
<60°C).
Table 1– Cores locations coordinates (latitude and longitude) and water depth, and
sedimentary column recovery.
4.1. Chronology
Organic matter was used for radiocarbon dating owing to the lack of suitable carbonate
material such as mono-specific foraminifers or well preserved mollusks. Approximately 7 g of
bulk sediment were sampled at every 50 cm down cores, and subsequently separated for AMS
radiocarbon dating at Beta Analytics Inc. (Miami/USA). Calibration of radiocarbon ages was
performed using Calib 5.0.2 (Stuiver et al., 2005) with the Marine04 Calibration Dataset
(Hughen et al., 2004). Correction for a regional reservoir effect of ΔR=82.0±46 was applied,
based on the mean value of three samples reported by Angulo et al. (2005).
The age–depth relationship was established using the mixed-effect model regression
calculated with the Cagedepth and Cagenew functions described by Heegard et al. (2005),
available at http://www.uib.no/bot/qeprg/Age-depth.htm (last accessed January 3, 2007). This
model was chosen owing to the possibility of better error estimation in sedimentation rates
according to Mahiques et al. (2009). Sedimentation rates (cm•kyr-1) were obtained from the age
model.
Core numberLatitude
(°S)
Longitude
(°W)
Water depth
(m)
Recovery
(cm)
7605 -27,104 -47,804 93 250
7610 -25,508 -46,635 89 410
7616 -25,098 -45,644 100 470

18
4.2. Sedimentological analysis
The size of the particles that compose sediments is the most relevant physical propriety
in sedimentary studies, providing information about diverse environments including those where
particles were formed and deposited, taking into account transport and/or remobilization
processes (Dias, 2004). Hence, grain size analysis is an important and widely applied tool in
paleoceanography studies (e.g. McCave et al., 1995, 2005; Gyllencreutz et al., 2010).
Sortable silt size has been applied as a proxy for past bottom current speed in deep
ocean basins (Bianchi and McCave, 1999; McCave et al., 1995; 2005) and in shallow marine
areas as a proxy for bottom current variability (Andrews et al., 2003; Chang et al., 2007;
Gyllencreutz, 2005; Gyllencreutz et al., 2010). In these areas, grain size distribution in its totality
(representing whole grain size distributions or the several populations involved in a grain size
spectrum) should be considered for a better interpretation of paleoclimatic and
paleoceanographic processes (Gyllencreutz et al., 2010 and references therein).
Grain size analyses were performed on the non-carbonate fraction of the sediment
samples after dissolution with 1 M HCl and thorough rinsing with de-ionized water until pH was
neutral. Grain size distributions of the samples were measured using a Malvern Mastersizer
2000 and recorded using standard phi (φ) notation (Eq. 1):
(Eq. 1)
where d is grain diameter in mm, and φ is dimensionless). Percentages of 53 intervals (0.25 φ-
subclasses) were determined between 12 and -1 φ. The results are presented using a Particle
Size Distribution (PSD) format with similar interpolation procedures used by Gyllencreutz et al.
(2010).
Following the procedure adopted by Gyllencreutz et al. (2010), for each core a
Correspondence Analysis (CA) a of the grain size distributions (Teil, 1975) was performed using
PAST version 2.16 available at http://folk.uio.no/ohammer/past (last accessed July, 2012). The
first two factors, which corresponded to more than 70% of the total explained variance in all of
19
the cores, were plotted against depth and used to identify the grain size classes with the
greatest influence on the distribution variability.
4.3. Geochemical analyses
4.3.1. Sedimentary organic matter
The organic matter preserved in sedimentary records provides a variety of proxies that
can be used to reconstruct paleoenvironments and paleoclimates, since both production and
preservation of organic matter are affected by environmental change (e.g., Meyers, 1997). Bulk
properties (i.e. elemental composition - total organic carbon - TOC, total nitrogen - Ntot, and C/N
ratio; carbon and nitrogen stable isotope ratios - δ13C and δ15N) can be applied to infer general
sources of the organic matter. These parameters register past availability of nutrients and,
therefore, can be applied as proxies of ocean surface mixing and continental runoff.
In marine environments C/N ratios have been widely applied to distinguish between
algal (marine) and land-plant (continental) origins of the organic matter (e.g. Prahl et al., 1980,
1994; Ishiwatari and Uzaki, 1987; Jasper and Gagosian, 1990; Silliman et al., 1996). In general,
algae derived organic matter presents C/N ratios between 4 and 10, whereas vascular land
plants have C/N ratios higher than 20 (Meyers, 1994). The abundance of cellulose in vascular
plants, and the protein richness of algal organic matter (higher amounts of nitrogen) can be
accounted for the differences in C/N ratios in the organic matter derived from these sources
(Meyers, 1997). The main consideration to be taken into account while interpreting C/N ratios of
organic matter in sediments, relies on the fact that this proxy is influenced by hydrodynamic
sorting of sediments, i.e. sediment size (Thompson and Eglinton, 1978; Keil et al., 1994; Prahl
et al., 1994; Meyers, 1997). Thus, it is important to associate other proxies in the reconstruction
of past sources of organic matter in changing depositional conditions settings (Figure 4), such
as carbon stable isotope ratios (δ13C), which are not affected by sediment size (Meyers, 1997).
The δ13C of organic matter reflects mainly the dynamics of carbon assimilation during
photosynthesis and the isotopic composition of the carbon source (Hayes, 1993). In terms of
characteristic values, marine organic matter in tropical to sub-tropical areas typically presents
δ13C values between -18 and -22‰ and continental organic matter presents values of -27‰

20
from C3 plants (most of the superior plants) and -14‰ from C4 plants (grass) (Meyers,1997). For
the Brazilian continental shelf, Mahiques et al. (1999) estimated as markers of continental
organic matter C/N ratio values of 24 and δ13C values of -26.00‰.
Figure 4 – Cross plot between C/N ratio and δ13
C values, highlighting distinguish sources
of organic matter in sediments and in settling particles, redrawn from Meyers (1994).
Similar to the δ13C, δ15N values can be applied in the recognition of sources of nutrients
based in the fact that when organisms assimilate N to produce biomass, the δ15N content of
their N source is imprinted in the organic matter eventually deposited in sediments (Robinson et
al., 2012). The δ15N value of dissolved nitrate ranges between +7‰ to +10‰, whereas the δ
15N
of atmospheric N2 is about 0‰ (Meyers, 1997). Dissolved nitrate derived from terrestrial
vascular plants present a wide range of δ15N values from -5‰ to +18‰, with mean value close
to 3‰, whereas marine δ15N values range from 3‰ to 12‰ with a mean value of 6‰ (Hu et al.,
2006). For the SE Brazilian coastal shelf zone, Matsuura and Wada (1994) determined δ15N
values between 6.9 and 9.0‰ as representative of marine (phyto- and microzooplankton) end
members.
The elemental and isotopic analysis of carbon and nitrogen measurements were
performed in samples representative of Mid- and Late Holocene, distributed along the cores at
every 2 cm intervals. Analyses were performed using a Costech elemental analyzer in line with
a Finnigan IRMS Delta V Plus stable isotope ratio mass spectrometer at IOUSP. For the TOC
contents samples were previously decarbonated by acidification using HCl 1M. The carbon and
21
nitrogen isotopes were measured simultaneously from the same sample by peak jumping with
mean standard deviation of 0.19‰ and 0.28‰ for δ13Corg and δ15Norg, respectively. All results
are reported relative to vPDB for δ13Corg and relative to air for δ15Norg. In addition, an internal
standard of lignin was used every 6 to 8 samples to ensure stable measurement without drifts.
4.3.2. Calcium carbonate (CaCO3)
The calcium carbonate (CaCO3) present in marine sediments is predominantly
composed by marine organisms shells (i.e. foraminifera and coccollithophores), has been
applied as a paleoproductivity proxy in past reconstructions (Moreno et al., 2004), since its
accumulation rates indirectly reflect organic carbon flux to the seafloor (Rühleman et al., 1999).
In this study, CaCO3 contents were obtained by weight difference before and after sample
acidification with HCl 1M.
4.3.3. Sedimentary inorganic constituents
Many elements are present in seawater either in soluble form or adsorbed onto
particles, the removal of dissolved elements from the water column to the sediments resuls from
either biotic (uptake of trace elements that serve as minor or micronutrients for plankton) or
abiotic processes (related to redox conditions) (Tribovillard et al., 2006). Hence, the analyses of
the inorganic constituents of marine sediments have been widely applied in paleoceanographic
studies since they reflect the environmental conditions at the time of deposition (Moreno et al.,
2004).
Several studies in marine sedimentary records have applied iron/calcium (Fe/Ca) and
titanium/ calcium (Ti/Ca) ratios as proxies of terrigenous sediment supply (e.g., Arz et al., 1998;
Haug et al., 2001; Mahiques et al., 2009). This is based on the premise that as a component of
calcite and aragonite, calcium (Ca) mainly reflects the marine carbonate content in the
sediment, whereas, titanium (Ti) and iron (Fe) are related to siliciclastic components and
especially clay minerals (Arz et al., 1998). Thus, Fe and Ti variations would represent a simple
chemical proxy for the input of land-derived materials, providing a direct measure of rainfall and
continental runoff into the oceans (Haug et al., 2001).

22
In order to verify if the Fe and Ti data obtained from our cores had detrital provenance,
we performed a cross plot of these elements versus aluminum (Al), which is considered to be of
detrital origin and is usually immobile during diagenesis (Tribovillard et al., 2006 and references
therein).
Barium (Ba) is one of the most widely used proxies in paleoproductivity estimates,
because of the relationship between marine barite (BaSO4), the major carrier of particulate Ba in
the water column, and carbon export flux to the sea floor (Dymond et al., 1992; Paytan, 2008).
In marine systems, Ba can be found associated to terrigenous material or associated with
organic material, denominated as excess-Ba (the Ba fraction not carried by terrigenous material
– Baexcess) (Paytan, 2008). The applicability of Ba as a productivity proxy, however, is still under
discussion (see Mahiques et al., 2009), presenting as major limitations the impossibility of
calculating Baexcess values from the Ba/Al ratios and possible diagenetic remobilization (Moreno
et al., 2004) and the absence of regional Ba/Al background values (Mahiques et al., 2009).
In order to apply Ba as a paleoproductivity proxy, the Baexcess portion in the sediments
must be distinguished from the Ba associated with the terrigenous material. According to Pfeifer
et al. (2001) Baexcess can be determined from the total Ba (Batot) concentration in the sediment
after subtracting the Ba associated with terrigenous material (Ba/Alterr), which is calculated from
total Al or Ti, and normalization to a constant detrital Ba/Al or Ba/Ti ratio (Eq. 2). For the
Southwestern South Atlantic these authors estimated values of 0.004 for the Ba/Alterr ratio.
Baexcess = Batot – (Al*Ba/Alterr) (Eq. 2)
Major and trace element contents (Al, Ba, Ca, Fe and Ti) of bulk sediment were
analyzed at a sample spacing of 2 cm by means of total digestion. Samples (approximately 0.2g
of sediment) were subsequently attacked with nitric acid (HNO3), hydrofluoric acid (HF) and
hydrogen peroxide (H2O2) under microwave action following the procedures tested by Sun et al.
(2001). Element contents were determined by optical emission spectrometry with inductively
coupled plasma (ICP-OES/Varian 710ES) at the Oceanographic Institute of the University of
São Paulo (Brazil). The analysis method was validated using a reference material, Estuarine
Sediment - SRM 1646a, with results that presented good precision and accuracy.

23
4.3.4. Mineralogy
The mineralogy of sediments reflects the cumulative effects of sediment source in terms
of composition and chemical weathering (Nesbitt et al., 1997). Hence, clay mineralogy is useful
in determining the distribution, sources, and dispersal routes of fine-grained sediments (e.g.;
Griggs and Hein, 1980; Karlin, 1980; Park and Khim, 1990; Hein et al., 2003) and to determine
the dispersal pattern or transport pathways of the bulk sediment (Petschick et al., 1996; Oliveira
et al., 2002). However, generally, the presence of multiple sources and transport processes
hampers the assessment of the main source area to a given clay mineral assemblage (Fagel,
2007). Thus, combining clay mineralogy and other proxies provides further constraints on the
identification of the source area.
The vast majority of clay mineral is derived from continents since their formation is
mainly controlled by climatic conditions (i.e. weathering) (Biscaye, 1965; Petschick et al., 1996).
In marine environments the mineralogy of sediments is widely applied as a tool for
comprehending interactions between oceans and climatic conditions in the adjacent continents
(e.g., Robert et al., 2005 and Martins et al., 2007).
Mineralogical analyses were carried out on the <63 µm (silt) fraction of the sediments
through X-ray diffraction (XRD) at the Geosciences Department of Aveiro University, under the
supervision of Prof. Dr. Fernando Tavares Rocha and Dra. Maria Virginia Alves Martins. XRD
measurements were performed using Philips PW1130/90 and X'Pert PW3040/60 equipment
using Cu Kα radiation. Scans were run between 2° and 60° 2θ (non-oriented powder mounts) in
the air-dry state after a previous glycerol saturation and heat treatment (300 and 500 °C).
Qualitative and semi-quantitative mineralogical analyses followed the criteria recommended by
Schultz (1964), Thorez (1976) and Mellinger (1979). For the semi-quantification of the identified
principal minerals, peak areas of the specific reflections were calculated and weighted by
empirically estimated factors (Table 2), according to Galhano et al. (1999) and Oliveira et al.
(2002).

24
Table 2– Diagnostic peaks and weighting factors applied for the identified minerals.
Mineral Peak (Å) Normalizing factor
Analcime 2.925 0.8
Anatase 3.52 1
Anidrite 3.49 1.5
Bassanite 3.00 3
Calcite 3.03 1
Clorite 7.2-7.1 0.75
Dolomite 2.88 1
K-feldspars 3.21 1
Phyllosilicates 4.45 0.2
Halite 2.82 2
Hematite 2.69 1.3
Magnetite/Maghemite 2.68 1.3
Mica-ilite 10.06 0.5
Opal C/CT 4.03-4.02 0.5
Plagioclase 3.19-3.16 1
Pyrite 3.18 1
Quartz 2.71 2
Rodrocrosite 3.34 1
Siderite 2.79-2.75 1
Zeolites 2.79 0.8
Two mineralogical indexes were calculated in the fraction <63 μm: Detrital Minerals
(DM, quartz+feldspars+phyllosilicates), Fine Detrital Minerals/Coarse Detrital Minerals
[FDM/CDM, phyllosilicates / (quartz +K-feldspars + plagioclases)] (Vidinha et al., 1998; Fradique
et al., 2006). These indexes demonstrate the relative importance of the terrigenous supply and
hydrodynamic sorting intensity, respectively (Martins et al., 2007). According to these authors
the XRD provides a minimum estimative for the occurrence of pyrite, thus it is possible that this
mineral is under estimated.

25
4.3.5. Neodymiun (Nd) isotopes
The Nd isotopic composition has been applied in several studies as a reliable tracer for
modern sedimentary dynamics and sediment provenance, and past reconstruction (Vroon et al.,
1995; Revel et al., 1996; Parra et al., 1997; Rutberg et al., 2000; Staubwasser and Sirocko,
2001; Ingram and Lin, 2002; Bayon et al., 2002; Kessarkar et al., 2003; Weldeab et al., 2002,
2003; Mahiques et al., 2008) due to the rapid incorporation of the river-originated neodymium in
the marine sediments (DePaolo, 1988). Also, according to Grousset et al. (1988) the Nd isotope
composition is little affected by grain-size differences of the sediment fractions.
Studies involving the application of this isotope in the comprehension of continental
margin sedimentation processes are recent (Staubwasser and Sirocko, 2001; Fagel et al., 2002;
Farmer et al., 2003). In a pioneer study for the Southwestern Atlantic continental shelf,
Mahiques et al. (2008) applied neodymium and lead isotope signatures as a tool for the
characterization of the modern sediment transport and their source rocks along the SE South
American upper margin, between the latitudes 55° and 20°S. These authors found latitudinal
variations in the εNd isotopic signatures related to changes in sediment provenance and
hydrodynamic transport agents, allowing them to divide the area into four distinct sectors
(Figure 5).
According to the findings of Mahiques et al. (2008) the sediments from the Argentinian
shelf presented εNd values ranging from -0.1 to -4.0 (mean=-1.9, σ =1.2, n=11), these
sediments were considered to be originated from the Andean rocks. The Basalts from the
Paraná Magmatic Province were found as potential source rocks for the Rio de La Plata
estuarine sediments with εNd values ranging from −8.2 to −10.3 (mean=−9.6, σ=0.7, n=12) as
for the sediments from S Brazil (mean=−9.3, σ=0.9, n=18) up to 28°S. The sediments from SE
Brazil presented a large variation in εNd values, ranging from −9.9 to −17.1 (mean=−13.0,
σ=2.1, n=18) and were possibly originated in the erosion of the Brazilian Shield and are carried
by the Brazil Current.
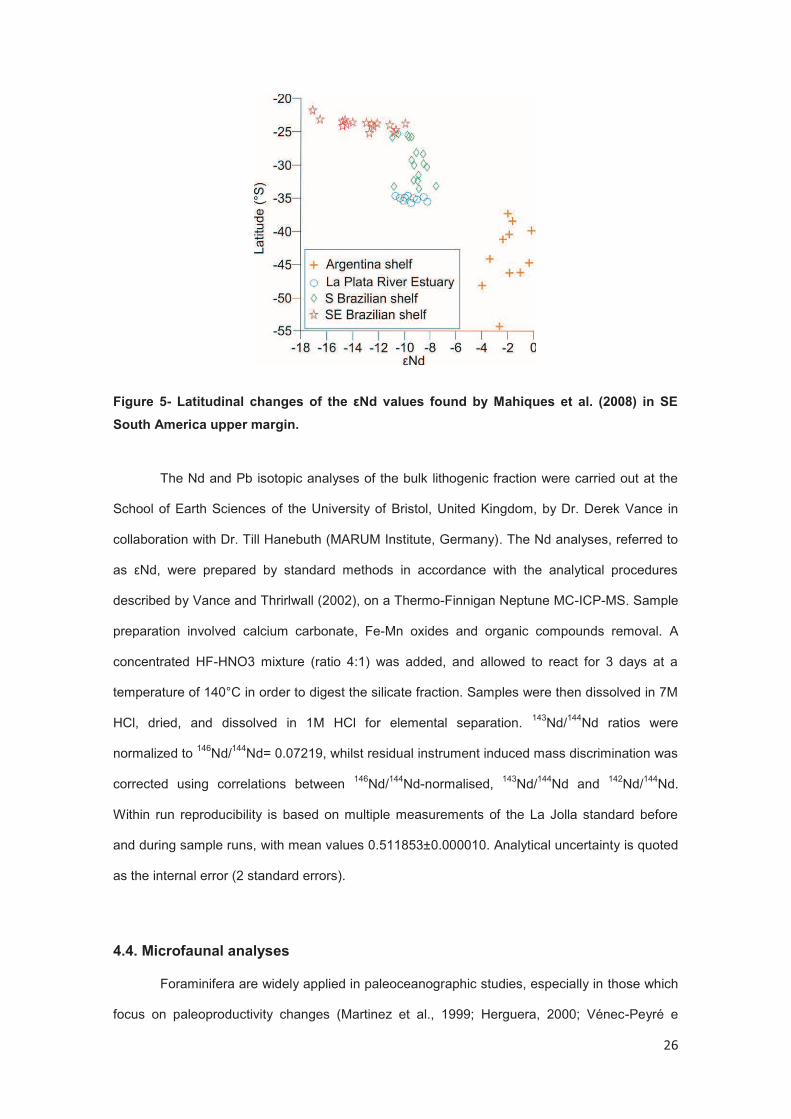
26
Figure 5- Latitudinal changes of the εNd values found by Mahiques et al. (2008) in SE
South America upper margin.
The Nd and Pb isotopic analyses of the bulk lithogenic fraction were carried out at the
School of Earth Sciences of the University of Bristol, United Kingdom, by Dr. Derek Vance in
collaboration with Dr. Till Hanebuth (MARUM Institute, Germany). The Nd analyses, referred to
as εNd, were prepared by standard methods in accordance with the analytical procedures
described by Vance and Thrirlwall (2002), on a Thermo-Finnigan Neptune MC-ICP-MS. Sample
preparation involved calcium carbonate, Fe-Mn oxides and organic compounds removal. A
concentrated HF-HNO3 mixture (ratio 4:1) was added, and allowed to react for 3 days at a
temperature of 140°C in order to digest the silicate fraction. Samples were then dissolved in 7M
HCl, dried, and dissolved in 1M HCl for elemental separation. 143Nd/144Nd ratios were
normalized to 146Nd/144Nd= 0.07219, whilst residual instrument induced mass discrimination was
corrected using correlations between 146Nd/144Nd-normalised, 143Nd/144Nd and 142Nd/144Nd.
Within run reproducibility is based on multiple measurements of the La Jolla standard before
and during sample runs, with mean values 0.511853±0.000010. Analytical uncertainty is quoted
as the internal error (2 standard errors).
4.4. Microfaunal analyses
Foraminifera are widely applied in paleoceanographic studies, especially in those which
focus on paleoproductivity changes (Martinez et al., 1999; Herguera, 2000; Vénec-Peyré e

27
Caulet, 2000; Martins et al., 2006, 2007; Nagai et al., 2009). The planktonic foraminifera can
provide information about past oceanic water column conditions in terms of water mass
distributions, sea surface temperature and productivity (Marchant et al., 1999). Whereas benthic
foraminifera provide a wide spectrum of information about environmental conditions, since these
organisms present changes in their community structure (Murray, 1991), vertical distribution in
the sedimentary column (Jorissen et al., 1995, Fontanier et al., 2003) and in size and
morphological aspects (Bernhard, 1986; Boltovskoy et al., 1991) as a response to changes in
environmental conditions.
4.4.1. Chemical composition of planktonic foraminifera tests
The chemical composition of the calcite from planktonic foraminifera tests is one of the
most important tools in paleoceanographic and paleoclimatic reconstructions. Since,
determining past temperature and salinity of ocean surface waters is essential for
understanding past changes in climate (Elderfield and Ganssen, 2000). The oxygen isotope
composition (δ18Oc) of calcite from planktonic foraminifera, for example, has been shown to
reflect both sea surface temperature and seawater isotopic composition (δ18Ow) and
magnesium/calcium (Mg/Ca) ratios in foraminiferal calcite also show temperature dependence
(Elderfield and Ganssen, 2000). The approach of measuring Mg/Ca and δ18O in single species
of foraminiferal calcite has gain importance in the past few years, mainly due to its potential of
estimating both temperature and δ18Ow from the same sample and associated with the same
parcel of seawater (Anand et al., 2003). The advantage of this approach is that synchronous
estimates of sea surface temperature (SST) and global ice volume can be determined and used
to calculate δ18Ow, a proxy for salinity, avoiding the bias of seasonality and/or habitat differences
that occur when proxy data from different faunal groups are used (Groeneveld et al., 2008;
Leduc et al., 2010).
There is a consensus over the importance of knowing the ecology of the foraminifera
species chosen as a proxy (i.e. foraminiferal depth habitat, seasonal flux variations amongst
others). In this study we picked the planktonic foraminfera Globigerinoides ruber pink variety -
G.ruber (pink) – for chemical composition analyses because: (i) it is widely applied in

28
paleoceanographic studies; (ii) it is present throughout the cores; (iii) it would be able to best
register shallow water changes over the S/SE Brazilian continental shelf (Chiessi et al., 2007).
G.ruber (pink) is one of the most commonly used planktonic foraminifera species in
paleoceanographic reconstructions. This tropical to subtropical species (Hemleben et al., 1989)
is considered to be a shallow dweller inhabiting the first 25 m of the water column (Anand et al.,
2003; Tedesco et al., 2007; Steph et al., 2009), with maximum development at an optimum
temperature range between 22.9 and 29.5°C (Záric et al., 2005). For the SE Brazilian margin
Sousa et al. (submitted) found G. ruber (pink) with occupying the first 50 m of the water column
and with an optimum temperature range between 22.9 and 26.8°C (Figure 6). It represents an
excellent species to be applied in near surface temperature reconstructions.
For paired isotopic composition and trace elemental measurements G. ruber (pink) tests
were picked in the 250–350 µm size fraction, approximately 10 and 15–30 specimens were
used for isotopic composition and trace element ratio measurements, respectively. For core
7605, due to the lack of sufficient number of tests, only the stable isotopic composition in
G.ruber (pink) was measured. Thus, to decouple temperature and salinity effects in the δ18O
values we used an alkenone based sea surface temperature record, the only available for the
region, obtained in core 7606 (26°59.28’S, 48°4.56’W) located close to core 7605, by Bícego
(2008).
4.4.1.1. Elemental ratios in planktonic foraminifera tests - Mg/Ca ratios
The Mg/Ca ratio in foraminiferal calcite is mainly dependent on the temperature of the
water in which the foraminifera calcifies (Elderfield and Ganssen, 2000; Dekens et al., 2002).
This categorizes it as an independent paleotemperature proxy and hence allows it to become a
widely applied tool in paleoceanography for the reconstruction of SSTs. The advantage of
Mg/Ca paleothermometry lies primarily in the potential to record changes in calcification
temperature (e.g., McConnell and Thunell, 2005) and to distinguish the temperature component
of the δ18O signal recorded in calcite from salinity and ice-volume effects through paired

29
measurements of Mg/Ca and δ18O (e.g., Elderfield and Ganssen, 2000; Lear et al., 2000, 2004;
Weldeab et al., 2006).
Figure 6 – (a) vertical distribution of various planktonic foraminifera species in the
Southwest Atlantic, highlighting G. ruber (pink) occurrence in the upper part of the water
column (modified from Chiessi et al., 2007); and (b) the relationship between G.ruber
(pink) abundance (%) and seawater temperature (°C), black dots represent global
sediment trap data obtained by Záric et al. (2005), with the optimum temperature range of
this species delimited by the gray bar, and red dots represent SE Brazilian continental
margin plankton net data from Sousa et al. (submitted).
Magnesium is one out of several divalent cations which may substitute calcium (Ca)
during the formation of biogenic calcite. Its incorporation into foraminiferal calcite is mainly
temperature-dependent (Lea et al., 1999; Elderfield and Ganssen, 2000). Nevertheless, it may
also be affected by other secondary factors, such as, salinity and pH (Lea et al., 2000; Nürnberg
et al., 2000). Additionally, as the incorporation of Mg2+ is biologically mediated, a temperature
calibration of Mg/Ca ratios based on foraminiferal calcite is required (Lea et al., 2000; Anand et
al., 2003; Regenberg et al., 2009). These calibrations are based on laboratory experiments
(e.g., Nürnberg et al., 1996), coretop calibrations (e.g., Elderfield and Ganssen, 2000; Cléroux
et al., 2007; Groeneveld and Chiessi, 2011) or sediment trap studies (Anand et al., 2003;
McConnell and Thunell, 2005).

30
Correlations between Mg/Ca and calcification temperature shows that an increase in
temperature is likely associated with an exponential increase in Mg/Ca ratios (e.g., Elderfield
and Ganssen, 2000; Anand et al., 2003; McConnell and Thunell, 2005). Hence, temperature
estimates based in Mg/Ca ratios in foraminiferal calcite follow the exponential calibration
equation (Eq. 3):
(Eq. 3)
The regression curve is defined by the slope α, which is the temperature sensitive
component, and the y-axis intercept b in mmol/mol. According to Anand et al. (2003) for G.
ruber (pink) correlations are poorer than for the multispecies calibration and reveal no size
fraction dependence, which is in agreement with the findings of Regenberg et al. (2009). Thus,
in this study we applied the coefficients values derived from Anand et al. (2003): b= 0.38 and α=
0.09, for the Mg/Ca based paleotemperature estimates.
For trace element analyses G. ruber (pink) tests, picked from cores 7610 and 7616 (at
every 2 cm intervals), were gently crushed between two glass plates to open the chambers and
placed into leached vials. Prior to elemental analyses samples were submitted to a cleaning
procedure following Martin and Lea (2002) methodology, excluding steps 4 (alkaline chelation)
and 5 (final heat rinse). In general terms, the cleaning procedure of foraminiferal samples prior
to analysis involves a number of discrete sequential steps aimed to remove various
contaminating phases: (1) clay materials; (2) organic matter; (3) Mn-Fe-oxide coatings, and, if
needed; (4) barite, with (5) a final ‘‘polishing’’ of the sample prior to analysis (Barker et al.,
2003). After cleaning, the tests were dissolved in a diluted acid (0.001M). The solution was then
analyzed for trace elements using a Thermo Finnigan Element 2 sector field inductively coupled
plasma mass spectrometry (ICP-MS) at the Geosciences Department of Bremen University
(Germany), under the supervision of Dr. Stefan Mulitza and Dr. Henning Kunhert. The 25Mg,
43Ca, 55Mn, 56Fe and 137Ba isotopes were measured. In order to correct instrumental sensibility
yttrium (Y) was used as an internal standard within samples. Manganese (Mn) and iron (Fe)
were measured at medium resolution, while the other elements were measured in low

31
resolution. A known uniformity standard was measured at every three (3) samples allowing
offline corrections due to instrumental deviation and differences in readings done in different
days. As indicators of contaminants manganese (Mn), present in clay minerals and iron-
manganese crusts, and iron (Fe), due to the presence of pyrite precipitates inside the chambers
of some specimens (observed in tests crushing) were measured. In order to check for
contamination cross plots between Mg/Ca and Ba/Ca ratios and Mn/Ca and Fe/Ca ratios were
performed.
4.3.4.3. Stable oxygen (δ18
Oc) and carbon (δ13
C) isotopic composition
δ18O in marine carbonates is one of the main tools in paleoceanography and is
presently widely applied in assessing past variability in ocean circulation (e.g. Vidal et al., 1997;
Matsumoto and Lynch-Stieglitz, 2003), upper water column structure (e.g. Mulitza et al., 1997;
Ruhlemann et al., 2001), continental ice volume (e.g. Waelbroeck et al., 2002; Sidall et al.,
2003), freshwater input into the oceans (e.g. Duplessy et al., 1991; Maslin et al., 2000),
seawater density (e.g. Lynch-Stieglitz et al., 1999), sea surface salinity (e.g. Lea et al., 2000;
Schmidt et al., 2004; Weldeab et al., 2006), deep-sea salinity (e.g. Adkins et al., 2002; Schrag
et al., 2002) as well as for stratigraphic purposes (e.g. Shackleton and Opdyke, 1973).
Isotopes are variants of an element containing different numbers of neutrons. There are
three stable isotopes of oxygen: 16O (99.76%), 17O (0.04%) and 18O (0.2%). The isotopic
composition of a measured sample is expressed as δ18O (Eq. 4), which represents the
difference in the 18O/16O ratios between the sample and the standard, expressed as parts per
thousand - ‰ (Mulitza et al., 2003).
(Eq. 4)
The oxygen isotopic composition in marine carbonates varies both with temperature and
δ18Ow. The first is a function of temperature-dependent fractionation processes (i) kinetic in
which stable isotopes are separated from each other by their mass through an unidirectional

32
process (e.g., evaporation, precipitation) and (ii) equilibrium fractionation, related to two or more
substances in chemical equilibrium (e.g. in the system CO2-H2O-CaCO3). The latter, in turn,
depends on local precipitation-evaporation balance and global continental ice volume. For a
more detailed description of the fractionation processes and interferences in the application of
δ18Oc as proxy see Mulitza et al. (2003). Carbonate samples are generally measured relative to
the VPDB-standard (Belemnitella americana from the Pee Dee Formation, Cretaceous, South
Carolina, USA - VPDB), whereas water samples refer to the Standard Mean Ocean Water
(VSMOW). Hence, on account of the different preparation techniques for carbonate and water
samples, a correction of -0.27 ‰ is necessary to convert the VSMOW scale into the VPDB
scale (Hut 1987).
Foraminifera also use marine total dissolved inorganic carbon (ΣCO2) to precipitate their
calcite shells, thereby recording δ13C of seawater ΣCO2 during calcification. And despite its
complexity (a wide variety of factors affecting seawater composition and foraminiferal calcite
incorporation), δ13C of foraminiferal calcite has been used as a proxy for past oceanic
circulation, variations of biological productivity, changes in nutrient cycling in surface waters and
variations in the global carbon cycle (Chiessi et al., 2007).
There are three major carbon isotopes: 12C (99%), 13C (1%) and 14C (10-10%). Due to
the different atomic weight, fractionation during the geochemical transfer of carbon produces
variations in the distribution of the isotopes of carbon (Mulitza et al., 1999). The isotopic
composition of the sample being measured is expressed as delta δ13C (Eq. 5) which represents
the difference in the 13C/12C ratios between the sample and the standard, expressed as parts
per thousand (‰, Mulitza et al., 1999):
(Eq. 5)
The ΣCO2 comprises the sum of the concentrations of CO2 (aqueous carbon dioxide),
HCO3 - (bicarbonate), and CO3
2- (carbonate ion), and seawater pH controls the relative
proportion of these components. Biological primary production (photosynthesis) in the euphotic

33
zone strongly fractionates stable carbon isotopes concentrating the light isotope 12C in organic
matter, thus after photosynthesis, the isotope 13C is depleted by 1.8% in comparison to its
natural ratios in the atmosphere (Harkness 1979 apud Mulitza et al., 1999). Planktonic
foraminifera dwelling in the euphotic layer thus record the resulting relative increase in seawater
δ13C. For a more detailed description of the fractionation processes and interferences in the
application of δ13C as proxy see Mulitza et al. (1999).
Stable isotopic composition analyses were performed in 10 to 15 G.ruber (pink) tests
picked from cores 7605, 7610 and 7616 at every 2 cm, using a FinniganMAT 252 mass
spectrometer equipped with an automatic carbonate preparation device. The standard deviation
of the laboratory standard was 0.01 and 0.02‰ for δ18O and δ13C, respectively, for the
measuring period at the University of Bremen.
With the oxygen isotopic composition of foraminiferal calcite and the temperature of
calcification data (via Mg/Ca paleothermometry for cores 7610 and 7616 and alkenone based
for core 7605) δ18Ow was determined based on Mulitza et al. (2003) empirical paleotemperature
equation (Eq.6):
T = - 4.44 (δ18Oc – δ18Ow) + 14.20 (Eq. 6)
where T stands for the in-situ temperature during calcite precipitation (°C), δ18Oc represents the
oxygen isotopic composition of the calcite (‰, VPDB), and δ18Ow stands for the oxygen isotopic
composition (‰, VPDB) of the seawater from which the calcite has been precipitated. The δ18Ow
values were transformed from VPDB to SMOW following Hut (1987) and corrected taking into
account global ice volume, subtracting a Dδ18Ow after Lambeck and Chappell (2001) and
Schrag et al. (2002), thus, obtaining the oxygen composition of the seawater corrected for
global ice volume (δ18Ow-ivc). The observed δ18Ow-ivc variations were interpreted as salinity
changes, as there is a linear relationship between salinity and δ18Ow, since both are affected by
freshwater fluxes and evaporation and precipitation (LeGrande and Schmidt, 2006).

34
4.4.2. Benthic foraminifera community
Foraminifera constitute a substantial part of the benthic biomass in the ocean. Benthic
foraminifera are widely used as microfossil proxies due to their relatively low position in oceanic
food webs (most of them are primary consumers), high abundance and diversity in numerous
marine environments, and excellent potential of fossilization (Jorissen and Rohling, 2000). In
the last two decades, benthic foraminifera have been increasingly used as proxies for oceanic
environmental changes, either related to circulation (e.g., Schmiedl and Mackensen, 1997;
Schönfeld, 2002), productivity (e.g., Lutze and Coulbourn, 1984; Mackensen et al., 1985;
Corliss and Chen, 1988; Loubere, 1996; Jorissen et al., 1998; Martinez et al., 1999; Wollenburg
et al., 2004; Martins et al., 2007) or climate (e.g., Hill et al., 2003; Gupta et al., 2006; Zarriess
and Mackensen, 2011).
In general, abundance, distribution pattern and habitat depth of benthic foraminifera are
controlled by dissolved oxygen concentrations of bottom and pore waters, and quality, quantity,
and seasonality of organic matter supply (e.g., Herguera and Berger, 1991; Loubere, 1998;
Loubere and Fariduddin, 1999; Schmiedl et al., 2000; Fontanier et al., 2002; Gooday, 2003;
Jorissen et al., 2007). These factors, allied with substrate type and the energetic state at the
benthic boundary layer, also control their distinct microhabitat distribution within the sediment
(Mackensen et al., 1995; Schmiedl et al., 1997).
The benthic foraminifera assemblage has been applied in a paleoproductivity
reconstruction for the Brazilian continental shelf (Nagai et al., 2009), with good correlations
between the benthic foraminifera based inferences and geochemical productivity proxies (e.g.,
organic carbon contents and elemental ratios). More recently, in an assessment to study the
southeastern Brazilian margin using modern vertical benthic foraminifera distribution, Burone et
al. (2010), found that the living benthic foraminifera distribution was able to reflect different
productivity and oceanographic conditions on the southeastern Brazilian shelf, presenting high
potential for reconstructions regarding not only the quantity but also the quality of the organic
input.
Samples for microfaunal analyses were selected along cores 7605 and 7616, in time
intervals of approximately 100 years and 200 to 1000 years, respectively. Aliquots of 10 cc were

35
sieve washed (meshes >250μm and >63μm) and oven dried in temperatures below 60°C.
Picking benthic foraminifera was done in two steps: first all the benthic foraminifera tests were
picked from the >250 μm fraction (generally very poor in benthic foraminifera) and transferred to
the 63-250 μm fraction, from now on denominated as the >63 μm fraction. Secondly the >63 μm
fraction was thinly spread on a gridded picking tray, and random grids were fully investigated
until a minimum of 300 individual foraminifera were counted, following the modified
methodology of Schröder et al. (1987) and Schmield et al. (1997). Tests were identified based
on specific literature, such as Van Morkhoven et al. (1986), Loeblich and Tappan (1988), Jones
(1994), and Barbosa (1998).
Foraminiferal parameters, such as density (D), species richness (R), equitability (J’) and
diversity (H’) were calculated using the PAST program (Hammer et al., 2008). The species
richness (R) was determined as the total number of species; equitability was calculated
according to Pielou (1975); and diversity was calculated according to Shannon and Weaver
(1999). These parameters may synthesize the population response to changes in environmental
trophic conditions (Burone, 2002; Burone and Pires-Vanin, 2006). Benthic foraminifera species
were also classified according to their micro-habitat (infaunal or epifaunal) based on Corliss
(1985, 1991), Corliss and Chen (1988), Murray (1991), Fontanier et al. (2002) amongst others.
Cluster analyses were performed using the PAST program (Hammer et al., 2008). A
matrix of data was constructed using species with abundance >3% in at least 10% of the
analyzed samples (Nagai et al., 2009). R-mode cluster analyses were used to group species
using the correlation method, and clusters were joined using the unweighted pair-group average
(UPGMA). In this method, clusters are joined based on the average distance between all
members in the two groups.
In order to observe variations in organic matter fluxes to seafloor, two benthic
foraminifera based productivity indexes were determined: the Benthic Foraminifera
Accumulation Rates index - BFAR (Herguera and Berger, 1991) and the Benthic Foraminifera
High Productivity index - BFHP (Martins et al., 2007). Benthic foraminifera productivity based
indexes, such as BFAR and BFHP can provide a useful proxy of the flux of organic matter to the
ocean floor resulting from surface productivity (e.g., Herguera and Berger, 1991; Martins et al.,
2007; Nagai et al., 2009). Although their use in a quantitative way has not been fully
36
investigated (Jorissen et al., 2007), qualitatively they have been successfully applied in
paleoproductivity studies in other continental margins (e.g., Martinez et al., 1999; Martins et al.,
2007) and in the SW Atlantic (Nagai et al., 2009).
The BFAR (tests in 10 cm2•kyr
-1), commonly applied in deep-sea sites where it is
correlated to the exported organic carbon flux to the sea floor, and thus correlated to primary
production, was calculated according to the modified methodology of Wollenburg and Kuhnt
(2000). However, this index has limitations, such as the dependence on sedimentation rates
and the assumption that lateral supply of organic carbon is low or absent. Hence, it was
cautiously applied in this study only to identify paleoproductivity trends. Whereas, the BFHP is
based on species-specific response of benthic foraminifera to changes in organic matter fluxes
to the seafloor, allowing the identification of periods of increased organic carbon fluxes (Martins
et al., 2007). This index was calculated according to the modified methodology of Martins et al.
(2007), through the quantification of specimens of species considered to be indicators of high
productivity, such as Brizalina spp., Bulimina spp., and Uvigerina peregrina, among others.

37
5. Results
5.1. Core 7605 (27°6.24’S, 47°48.24’W – Itajaí/SC)
5.1.1. Chronology
Core 7605 is 2.40 m long and consists of dark olive-gray mud, slightly fining upward,
with dispersed bioclasts (primary mollusk fragments). Due to the lack of sufficient organic
material in core base sediment samples, ages were only obtained for the uppermost 1.10 m of
the core, which ranges a time span from 7682 to 515 yr cal. BP; sediments younger than ~500
yr cal. BP were not recovered (Table 3, Figure 7). The uncorrected sedimentation rates inferred
from the age model range from close to 10 cm kyr-1 at the base of the core to 70 cm kyr-1 at the
top, increase starting at ca. 3000 yr cal. BP (Figure 7).
Table 3 – 14
C AMS radiocarbon dating results for core 7605 and 2σ calibrated age ranges,
no age inversion in radiocarbon dates was observed.
Core depth 14C age 13C/12C
(cm) (anos A.P.) ± 1σ (‰, PDB)
0 - 2 257051 1530 ± 40 -20.4 Cal BP 708 - 515
50 - 52 257052 2910 ± 40 -23,0 Cal BP 2263 - 1908
68 - 70 329078 4130 ± 40 -20,9 Cal BP 4260 - 3888
98 - 100 257053 6940 ± 50 -21.9 Cal BP 7140 - 6776
108-110 259339 7860 ± 50 -20.7 Cal BP 7962 - 7682
2σ cal. rangeBETA Analityc Inc. ID

38
Figure 7 - Age model and uncorrected sedimentation rates (cm·kyr-1
) for core 7605. Age
model was based on calibrated radiocarbon ages (red circles), interpolations were
obtained through the mixed effect model described by Heegard et al. (2005) – solid line;
and the 95% confidence interval - dashed lines.
5.1.2. Sedimentological analyses
The basal sediments present bimodal grain size distribution, lasting until ca. 1200 yr cal.
BP, with a strong sand contribution (± 68% at ca. 4700 yr cal. BP) centered at approximately 1.5
φ (Figure 8, Appendix 1). The sand contribution decreases in importance towards the top being
replaced by a second mode centered at approximately 5 φ after 3100 yr cal. BP. The second
mode is represented by muddy sediments (mainly silt) and it is present throughout the whole
core but with increasing in contribution from the base to coretop. This finning upward behavior is
also seen in the mean grain size distributions.
The first two factors of the CA (Figure 8) account for 84.1% of the total variance of the
grain size distribution. While factor 1 (69.5% of the total variance) opposes silt (5.00 to 6.25φ)
against sand (2.75 to 1.00φ) contributions, factor 2 (14.6% of the total variance) shows the

39
contrasts between the sandy contribution and silts. The CA of core 7605 reveals the transition
from a polymodal grain size distribution, which lasted until approximately 5600 yr cal. BP (Figure
8a), to a quasi-unimodal distribution (Figure 8c) starting at c. 2300 yr cal. BP.
Figure 8– Particle size distribution (PSD), frequency (%) in each size class (φ) are
indicated by colour-filled contours (legend in bottom), εNd data, the results of the grain
size variations Correspondence Analysis (CA) for core 7605, and representative grain
size frequency distributions (size class % versus ) for the corresponding core age
levels (dashed lines) and labels on the CA-plots.
5.1.3. Geochemical analysis
5.1.3.1. Sedimentary organic matter
Organic carbon and total nitrogen contents present an upward increase, with low values
in the lowermost part of the core (<0.25% and <0.05%, for TOC and Ntot respectively) until ca.
3000 yr cal. BP, followed by increase in TOC and Ntot contents to 1.0% e 0.15%, respectively
(Figure 9, Appendix 1). This period also represents a boundary for C/N ratios that present
increase in values up to coretop, where values range between 4 and 8. Organic matter isotopic

40
composition, δ13C and δ15N, present relatively stable behavior ranging between -21.5‰ and –
20.5‰ for δ13
C and between 1 and 3‰ for δ15N (Figure 9).
Figure 9 - Along core 7605 distribution of CaCO3 contents and sedimentary organic
matter (TOC and Ntot contents, isotopic compocition of the organic matter δ13
C and δ15
N
and C/N ratio). Black circles represent data and solid gray curves a moving average for
every 3 samples.
TOC and Ntot contents present significant correlation between each other, in the cross
plot it is possible to distinguish three distinct groups of samples, namely: sediments samples
found between 5300 and 3100 yr cal. BP, samples between 3100 and 1900 yr cal. BP, and
samples younger than 1900 yr cal. BP (Figure 9). And in the cross plot between δ13C and C/N
ratios all samples fall into the marine algae interval defined by Meyers et al. (1994) (Figure 10,
Appendix 1).
5.1.3.2. Calcium carbonate (CaCO3)
CaCO3 contents present progressive increase from core base (average 13%) towards
coretop, when CaCO3 contents reaches 17% (Figure 9, Appendix 1).

41
Figure 10 - (a) cross plot between TOC and Ntot, showing significant correlation between
variables (p<0.05) and highlighting three distinct groups of sediment samples; and (b)
δ13
C vs. C/N plot, the different fields correspond to end member sources for organic
matter preserved in sediments (modified from Meyers, 1994).
5.1.3.3. Sedimentary inorganic constituents
The cross plot between Fe and Ti versus Al highlight that the first two metals present
significant correlation with the last one (Figure 11a, b). Thus, Al, Fe and Ti present a similar
trend along core the with relatively lower values from core base until ca. 2800 yr cal. BP,
followed by a significant progressive increase towards coretop (Figure 12, Appendix 1). Fe/Ca
and Ti/Ca ratios present continuous increase from core base (0.10 and 0.01, respectively) until
ca. 6000 yr cal. BP (0.75 and 0.10, for Fe/Ca and Ti/Ca respectively), followed by a moderate
increase in values up to 2000 yr cal. BP. After 2000 yr cal. BP, significant increase in these
ratios can be observed from approximately 1 to 2 for Fe/Ca, and from 0.01 to 0.02 for Ti/Ca
ratios (Figure 12).
Meanwhile, Ca has relatively high concentrations at lowermost core sediments until
6000 yr cal. BP (approximately 80000 mg·kg-1), followed by a relative decrease in concentration
towards the top of the core. Ba presents relatively higher values between 7700 and 2000 yr cal.
BP (average 217 mg·kg-1) and slightly lower values after 2000 yr cal. BP (approximately 200
mg·kg-1).

42
Figure 11 - Cross plots of (a) Fe vs. Al; (b) Ti vs. Al; (c) Ba/Al vs. TOC; and (d) Ba/Ca vs.
TOC. The first three plots (a, b and c) presented statistically significant values (p<0.05) of
the Correlation Coefficient.
The cross plot between Ba/Al, Ba/Ca and TOC do not present a clear relationship
between these variables (Figure 11c, d), although a significant negative correlation is found
between Ba/Al and TOC. Different distribution pattern is observed between Ba/Al and Ba/Ca
ratios. The first presents an upward decreasing trend and, the later, a relatively stable
distribution pattern with a slight increase in values upward (Figure 12).

43
Figure 12 - Along core distribution of (a) sedimentary inorganic constitutents (Al, Fe, Ti,
Ca and Ba) and (b) elemental ratios (Fe/Ca, Ti/Ca, Ba/Ca and Ba/Al) obtained for core
7605. Black circles represent data and solid black curves a moving average for every 3
samples.

44
5.1.3.4. Mineralogy
The X-ray diffraction results for core 7605 in the < 63 µm fraction show the presence of
mainly siliciclastic minerals (Appendix 1). As main components were identified: phyllosilicates
(9.8 - 53%) and quartz (18.1 – 44.8%), followed by feldspars (6.4-26% - K-feldpars (0-15.8%)
and plagioclases (0.4-26%), calcite and opal representing 4.4-15.4% and 1.5-13.9%,
respectively (Figure 13). Accessory minerals are also represented by traces of several other
minerals such as analcime (0-4.2%), dolomite (0.5-5%), halite (0-4.2%), and pyrite (0-9%)
(Appendix 1). Other minerals such as anhydrite, chlorite, magnetite/maghematite, siderite and
zeolites are present in some samples of the core with percentages below 3%.
Sediments at the base of the core present relatively higher amounts of phyllosilicates
(average 40%), followed by a continuous decrease in values until 4000 yr cal. BP representing
approximately 9% of sediments mineralogy, with an increase upward in phyllosilicates
percentages (Figure 13). Meanwhile, an opposite distribution pattern was observed for quartz,
presenting relatively lower amounts at core base (± 24%) reaching maximum values of
approximately 40% at 4000 yr cal. BP, with decrease in quartz percentages after this period
towards coretop, where quartz represents close to 30% of sediments mineralogy (Figure 13).
Feldspars and opal amounts present continuous upward increase, for the first; however,
this increase lasts until approximately 2100 yr cal. BP followed by a decrease in their contents
after this (Figure 13). A constant decrease in calcite amounts is observed in the last 7900 yr cal.
BP from 10% to 8%. A relatively stable behavior was observed for the Detrital Mineral Index
(DM) with percentages varying between 52-83%, minimum values were observed at ca. 2800 yr
cal. BP, presenting an increase of about 5% after this period. A similar behavior was also
observed for the Fine Detrital Minerals/Coarse Detrital Minerals (FDM/CDM) ranging between
0.15 and 1.65.

45
Fig
ure
13 -
Alo
ng
co
re 7
60
5 d
istr
ibu
tio
n o
f th
e m
ain
min
era
log
ica
l c
om
po
ne
nts
id
en
tifi
ed
fo
r th
e <
63 µ
m s
ize
fra
cti
on
an
d t
he
De
trit
al
Min
era
l In
de
x
(DM
) a
nd
Fin
e D
etr
ita
l M
ine
rals
/Co
ars
e D
etr
ita
l M
ine
rals
(F
DM
/CD
M)
ind
exe
s.
Bla
ck
cir
cle
s r
ep
res
en
t d
ata
an
d s
oli
d b
lac
k c
urv
es a
mo
vin
g a
ve
rag
e
for
ev
ery
3 s
am
ple
s.

46
5.1.3.5. Neodymium (εNd) isotopes
For core 7605 relatively higher values (εNd = -7.50±0.12) of neodymium isotopic
composition of sediments are found at 7700 yr cal. BP, at 5600 yr cal. BP εNd values of -
8.71±0.12 are observed, and at 2000 yr cal. BP εNd values of -8.02±0.12 were found (Table 4,
Figure 8).
Table 4 – εNd data obtained for core 7605.
Core depth (cm)
Estimated age
(yr cal. BP) εNd
48 - 50 1989 -8.02 ± 0.12
88 - 90 5579 -8.71 ± 0.12
106 - 108 7715 -7.51 ± 0.12
5.1.4. Microfaunal analyses
5.1.4.1. Chemical composition of planktonic foraminifera tests
5.1.4.1.2. Stable oxygen (δ18
Oc) and carbon (δ13
C) isotopic composition
The δ18Oc composition of G. ruber (pink) from core 7605 presents relatively higher
values (average 0.90‰) between 7700 and approximately 4000 yr cal. BP, followed by a slight
decreasing trend in δ18O after 3000 yr cal. BP towards the coretop with average values of -
1,05‰ (Appendix 1, Figure 14). Meanwhile δ13C in G.ruber (pink) present relatively lower values
between 7700 and 2000 yr cal. BP (average value of 1.68 ‰); followed by a progressive
increase in δ13C values in the last 2000 yr cal. BP with average value of approximately 1.82‰
(Figure 14).
As previously stated we used an alkenone based SST curve from core 7606 (Bícego,
2008), collected close to core 7605 to calculate δ18Ow-ivc estimates. SST distributions for core
7606 present increase of approximately 2.5°C between 7700 and 6000 yr cal. BP, followed by
average values of 27°C until approximately 5000 yr cal. BP (Figure 14). In the last 5000 years a

47
decrease in SST occurs in two steps, the first, between 5000 and 2500 yr cal. BP with an
average decrease of 1.5°C and, the second, after 2500 yr cal. BP towards the present, presents
a progressive decrease from 25.5°C to 24°C.
δ18Ow-ivc estimates present a similar distribution pattern as alkenone based temperature,
between 7700 and 5200 cal yr BP values increase by approximately 0.60‰, and then show a
general trend towards lighter δ18Ow-ivc values (average decrease of approximately 0.70‰) until
present time with two superimposed high frequency steps with decreases of 0.20‰ and 0.70‰
(Figure 14).
Figure 14 – G. ruber (pink) δ18
Oc and δ13
C composition; alkenone based SST curve from
core 7606 (Bícego, 2008); and δ18
Ow-ivc estimates for core 7605. Black circles represent
data and solid gray curves a moving average for every 3 samples.
5.1.4.2. Benthic foraminifera community
A total of 182 species belonging to 68 genera of benthic foraminifera were identified,
mainly calcareous taxa (Appendix 2), tests presented good preservation and no apparent
evidence of shattered chambers in the sediments were observed. Benthic foraminiferal

48
densities (number of specimens in 10 cc of sediment) varied between 5392 and 41847
tests·10cc-1. In general, throughout the core foraminifera densities did not present large along
core variations (Figure 15).
Figure 15 – Along core 7605 distribution of benthic foraminífera density (tests·10cc-1
),
epifauna and infauna species percentages, and benthic foraminifera based indexes
BFAR (tests·cm-2
·kyr-1
) and BFHP (%).Black circles represent data and solid gray curves
a moving average for every 3 samples.
Angulogerina angulosa, Angulogerina spp., Bulimina marginata, Bulimina spp.,
Buliminella elegantissima, Cibicides ungerianus, Globocassidulina subglobosa,
Globocassidulina spp., Gyroidina umbonata, Gyroidina spp., Epistominella spp., and Islandiella
norcrossi were considered as representative species (relative frequency >3% in at least 10% of
samples) Plates 1 and 2. G. subglobosa was the most abundant and widespread species in the
core, representing in average over 20% of the total population in 32/33 samples, followed by A.
angulosa (average more than 18% of the total population in 32/33 samples). Representing in
average >5% of the total assemblage B. marginata, Globocassidulina spp. and G. umbonata.
As minor components of the benthic foraminifera fauna Angulogerina spp., Bulimina spp., B.

49
elegantíssima, C. ungerianus, Gyroidina spp., Epistominella spp., I.norcrossi (average <5% of
the total assemblage).
R-mode cluster analysis revealed four main assemblages, which were denominated
according to the dominant species: A. angulosa, B. marginata, G. subglobosa and G. umbonata
(Figure 16). The A. angulosa assemblage is composed of A. angulosa and Bulimina spp.
(Figure 16), this assemblage is present throughout the core with a slight increase in relative
frequencies from 3000 yr cal. BP towards core top (Figure 17).
Figure 16 –Dendrogram classification resulting from the R-mode cluster analysis
(correlation method joined by UPGMA) based on the 12 species with relative abundances
higher than 3% in at least 10% of the samples from core 7605.
The B. marginata assemblage is composed of B. marginata, C. ungerianus and I.
norcrossiI (Figure 16) this assemblage presents an overall increase trend in frequencies. B.
marginata and I. norcrossi presents decrease in frequencies after 3000 yr cal. BP, from mean
values of 9 to close to 0% and from mean values of 4% to close to 0, respectively (Figure 17).

50
Meanwhile C. ungerianus presents a sharp decrease in frequencies at approximately 4800 yr
cal. BP, going from mean 3% to 0 (Figure 17).
The G. subglobosa assemblage is composed of B. elegantissima, G. subglobosa,
Globocassidulina spp., Gyroidina spp. and Epistominella spp. (Figure 16). This assemblage is
present throughout the core and comprises over 30% of total benthic foraminifera assemblage.
As a general trend this assemblage presents an overall increase in relative frequencies from
3000 yr cal. B.P. towards core top particularly shown by B. elegantissima, Gyroidina spp. and
Epistominella spp. (Figure 17).
The G. umbonata assemblage is composed of Angulogerina spp. and G. umbonata
(Figure 16). G. umbonata presents increase in frequencies between 7000 and approximately 4
800 yr cal. BP, reaching values close to 9%, with decrease in frequencies from this age towards
core top (Figure 17). Meanwhile, Angulogerina spp. frequencies do not present large variations
troughout the core (Figure 17).
The benthic foraminifera assemblage from core 7605 is mainly composed by species
with infaunal (~67%, of shallow/intermediate/deep infauna species) microhabitat, with epifaunal
species representing approximately 10% of the total assemblage (Figure 15, Appendix 2).
Slightly higher percentages of epifaunal species (~15%) are observed in older sediments with a
decrease after approximately 6000 yr cal. BP (Figure 15). Approximately 12% of the identified
species lacked microhabitat classification, this undetermined microhabitat species however
accounted for less than 1% of the total benthic foraminifera assemblage.
Foraminiferal parameters are presented in Appendix 2. Sediment samples from core
base presented relatively higher values for R (mean = 36) and H’ (mean = 2.23), followed by a
continuous decrease in values until approximately 3000 yr cal. BP when values of both R and H’
parameters present mean values of approximately 29 and 2.10, respectively (Figure 18). J’
presented along core mean values around 0.63 (Figure 18).

51
Fig
ure
17 –
Alo
ng
co
re 7
605
dis
trib
uti
on
of
the
re
lati
ve
fre
qu
en
cie
s o
f th
e 1
2 b
en
thic
fo
ram
inif
era
sp
ecie
s c
on
sid
ere
d a
s r
ep
rese
nta
tiv
e (
>3
% i
n a
t
leas
t 1
0%
of
sam
ple
s),
gro
up
ed
acc
ord
ing
to
th
e R
-mo
de
clu
ste
r a
na
lysis
. B
lack
cir
cle
s r
ep
res
en
t d
ata
an
d s
oli
d g
ray c
urv
es a
mo
vin
g a
ve
rag
e f
or
ev
ery
3 s
am
ple
s.

52
Cont. Figure 17
Benthic foraminifera productivity indexes BFAR and BFHP are presented in Appendix 2
and represented Figure 15. In general both indexes presented increase in values after
approximately 2600 yr cal. BP (Figure 15). Relatively higher values of the BFAR index are
observed between 7000 and approximately 3500 yr cal. BP (~ 2.2x10⁵ tests·10cm-2·kyr-1),
followed by decrease in values to approximately 1.5x10⁵ tests·10cm-2·kyr-1 between 3 500 and
2100 yr cal. BP. After approximately 2100 yr cal. BP BFAR values increases to mean values of
4.5x10⁵ tests·10cm-2·kyr-1 reaching a maximum value of 10.0x10⁵ tests·10cm-2
·kyr-1 at core top
(611 yr cal. BP, Figure 15). BFHP index values range between 4 and 20% (mean values of
12%), after approximately 2600 yr cal. BP BFHP values present a slight increase towards core
top reaching 16% at approximately 940 yr cal. BP (Figure 15).

53
Figure 18 - Benthic assemblage parameters along core 7605 distribution. Where: R –
species richness; H’ – diversity; and J’ - equitability.
5.2. Core 7610 (25°30.48’S, 46°38.1’W – Cananéia/SP)
5.2.1. Chronology
The recovery for core 7610 was 4.04 m, however, in this study only the uppermost 2.3
m were analyzed, representing a time span of approximately 7000 yr cal. BP, sediments
younger than approximately 700 yr cal. BP were not recovered (Table 5, Figure 19). The first
2.4 m of the sedimentary column consists of dark olive gray muddy sands (with very fine sand)
with irregular lamination and the presence of disperse bioturbation. The uncorrected
sedimentation rates inferred from the age model (Figure 19) range from close to 30 cm kyr-1 at
the base of the core to 40 cm kyr-1 at the top, sedimentation rates start increasing after
approximately 5000 cal. BP.

54
Table 5 - 14
C AMS radiocarbon dating results for core 7610 and 2σ calibrated age ranges,
no age inversion in radiocarbon dates was observed.
Figure 19 - Age models and uncorrected sedimentation rates (cm·kyr-1
) for core 7610. Age
model was based on calibrated radiocarbon ages (red circles), interpolations were
obtained through the mixed effect model described by Heegard et al. (2004) – solid line;
and the 95% confidence interval - dashed lines
Core depth 14C age 13C/12C
(cm) (anos A.P.) ± 1σ (‰, PDB)
0 -- 2 248113 1140 ± 40 -20.3 Cal BP 820 - 563
50 -- 52 248114 2390 ± 40 -19.9 Cal BP 2189 - 1855
100 -- 102 248115 3210 ± 40 -20.3 Cal BP 3220 - 2846
150 -- 152 248116 4550 ± 40 -20.5 Cal BP 4864 - 4541
198 -- 200 248117 5650 ± 40 -20.8 Cal BP 6184 - 5901
238 -- 240 248118 7030 ± 40 -21.4 Cal BP 7608 - 7404
308 -- 310 248119 8880 ± 50 -21.6 Cal BP 9695 - 9392
BETA Analityc
Inc. ID2σ cal. range

55
5.2.2. Sedimentological analyses
Grain size analyses point to a predominance of muddy sediments along the core
(Appendix 3). The PSD of the basal part of this core, however, shows similar characteristics to
core 7605, with a pronounced bimodal distribution from core base until approximately 5000 yr
cal. BP (Figure 20). The sand contribution (centered at approximately 2φ) decreases in
importance towards coretop being replaced by a second mode centered at approximately 5φ,
represented by muddy sediments (mainly silt), after 5000 yr cal. BP.
Figure 20 - Particle size distribution (PSD), frequency (%) in each size class (φ) are
indicated by colour-filled contours (legend in bottom), εNd data, the results of the grain
size variations Correspondence Analysis (CA) for core 7610, and representative grain
size frequency distributions (size class % versus ) for the corresponding core age
levels (dashed lines) and labels on the CA-plots.
The two first factors of CFA in core 7610 depict the highest variability of the studied
cores, explaining 95.6% of the total variance. Factor 1 (81.2% of the total variance) opposes the
56
sediments between 3.50 and 1.25 (sands) against silts. Factor 2 (14.4% of the total variance)
opposes the medium to fine sands against the fine silts and clays (Figure 20).
5.2.3. Geochemical analysis
5.2.3.1. Sedimentary organic matter
Sedimentary organic matter contents parameters namely TOC, Ntot and C/N ratios
present similar distribution curves along core 7610 (Appendix 3, Figure 21). Throughout the
core a progressive increase in these parameters can be observed, occurring in three steps: the
first, between 7000 and 4800 yr cal. BP, with relatively lower values for TOC (0.29%), Ntot
(0.09%) and C/N ratios (±3); the second, between 4800 and 2300 yr cal. BP with average
values of 0.53% for TOC, 0.11% for Ntot and 4.5 for C/N ratios; and the third step, after 2300 yr
cal. BP, where average values of 0.75% for TOC, 0.12% for Ntot and 6 for C/N ratios are
observed (Figure 21).
For the isotopic composition of the organic matter a shift in values occurs at ca. 3800 yr
cal. BP in both δ13C and δ
15N values (Figure 21). The first presents values close to -22‰, in
younger than 3800 yr cal. BP sediments, after which δ13C presents average values of -20.5‰.
For δ15N values centered at around 5‰ are observed between ~7500 and 3800 yr cal BP and
towards coretop values oscillate between 0‰ and 2.5‰ (with average values around 2‰).
As for core 7605, TOC and Ntot contents also presented significant correlation between
each other and three distinct groups can also be identified in the cross plot between TOC and
Ntot, namely sediments samples found between 6300 and 4800 yr cal. BP, samples between
4800 and 2300 yr cal. BP, and samples younger than 2300 yr cal. BP. Also in the cross plot
between δ13C and C/N ratios all samples fall into the marine algae interval defined by Meyers et
al. (1994) (Figure 21).

57
Figure 21 – Along core 7610 distribution of CaCO3 contents and sedimentary organic
matter (TOC and Ntot contents, isotopic composition of the organic matter δ13
C and δ15
N
and C/N ratio). Black circles represent data and solid gray curves a moving average for
every 3 samples.
5.2.3.2. Calcium carbonate (CaCO3)
Calcium carbonate contents present relatively lower values (15-20%) between 7000 and
4000 yr cal., from this time interval until 3000 yr cal. BP relatively higher values (>25%) are
observed for CaCO3. After 3000 yr cal. BP towards coretop a slight decrease in CaCO3 contents
occur with values oscillating between average values of 22% (Appendix 3, Figure 21).

58
Figure 22 – (a) cross plot between TOC and Ntot, showing significant correlation between
variables (n-1=103; α= 0.05) and highlighting three distinct groups of sediment samples;
and (b) δ13
C vs. C/N plot, the different fields correspond to end member sources for
organic matter preserved in sediments (modified from Meyers, 1994).
5.2.3.3. Sedimentary inorganic constituents
The crossplot between Fe and Ti versus Al, with higher than 0.9 r2 values, highlights
correlation between the first have and the later (Figure 23a,b). Al, Fe and Ti present similar
along core distribution pattern with relatively lower values at core base and a progressive
increase towards coretop (Appendix 3, Figure 24).
An upward decreasing trend is observed for Ca concentrations, presenting relatively
higher concentrations at lowermost core sediments (approximately 34000 mg·kg-1). As an
exception, a peak in this constituent concentration occurs at ca. 1000 yr cal. BP. Meanwhile, Ba
concentrations presents a relatively stable behavior between 7700 and approximately 2800 yr
cal. BP (average 190 mg·kg-1), followed by a decrease until 2000 yr cal. BP, when Ba
concentration values are close to 150 mg·kg-1 and another increase after this period reaching
values of approximately 210 mg·kg-1 at coretop. (Figure 24)

59
Figure 23 – Cross plots of (a) Fe vs. Al; (b) Ti vs. Al; (c) Ba/Al vs. TOC; and (d) Ba/Ca vs.
TOC. Statistically significant values (p<0.05) of the Correlation Coefficient are shown.
The distribution of Fe/Ca and Ti/Ca ratios along core 7610 (Figure 24) have similar
trends to those presented for core 7605 (Figure 12) with a progressive increase from core base
towards coretop. This increase, however, occurs in three distinct steps: (1) between 6000 and
4200 yr cal. BP, with Fe/Ca ratios, for example, going from 0.5 to approximately 1.2; (2) from
4200 to 2200 yr cal. BP, Fe/Ca ratios reach values close to 1.7; and (3) after 2200 yr cal. BP
towards coretop Fe/Ca ratios presents values close to 2 (Figure 24).
The cross plot between Ba/Al and TOC do not present a clear relationship between
these variables (Figure 23c), while Ba/Ca and TOC present low, but positive and significant
correlation (Figure 23d). Different distribution pattern is observed between Ba/Al and Ba/Ca
ratios. The first presents an upward decreasing trend and, the later, a relatively stable
distribution pattern with a slight increase in values upward (Figure 24).

60

61
Figure 24 – Along core distribution of (a) the sedimentary inorganic constituents (Al, Fe,
Ti, Ca and Ba) and (b) the elemental ratios (Fe/Ca, Ti/Ca, Ba/Ca and Ba/Al) obtained for
core 7610. Black circles represent data and solid gray curves a moving average for every
3 samples.

62
5.2.3.3. Mineralogy
The X-ray diffraction results for core 7610 in the < 63 µm fraction highlight the presence
of mainly siliciclastic minerals (Figure 25). As main components were identified: phyllosilicates
(28 – 66.5%) and quartz (11 – 28%), followed by feldspars (0-15% - K-feldpars (0-8%) and
plagioclases (0-12%), calcite and opal representing 6-22% and 1.6-10%, respectively (Figure
25). Accessory minerals are also represented by traces of several other minerals such as
analcime (0-4.6%), halite (0-6.7%), and pyrite (0-7%) (Appendix 3). Other minerals such as
anatase, anhydrite, clorite, hematite, magnetite/maghematite and siderite are present in some
samples of the core with percentages below 3% (Appendix 3).
Sediments at the base of the core present relatively lower amounts of phyllosilicates
(average of 40%); followed by a continuous upward increase in values representing
approximately 70% of sediments mineralogy in coretop sediments (Figure 25). Meanwhile,
quartz amounts present relatively stable behavior until 2000 yr cal. BP with values oscillating
around 18%, followed by a slight decrease in quartz amounts (average of approximately 15%).
Feldspars contents range from 5 to 16% (average 10.9%) from core base until 3000 yr cal. BP
and present relatively lower values in younger than 3000 years sediments with average
percentages of 8 (Figure 25). Calcite amounts present a relatively stable behavior throughout
the core oscillating between 6 and 22%.
The detrital mineral index (DM) presents percentages varying between 53-85%, with an
upward increasing trend (Figure 25, Appendix 3). A similar behavior was also observed for the
Fine Detrital Minerals/Coarse Detrital Minerals (FDM/CDM) ranging between 0.7 and 3.7.
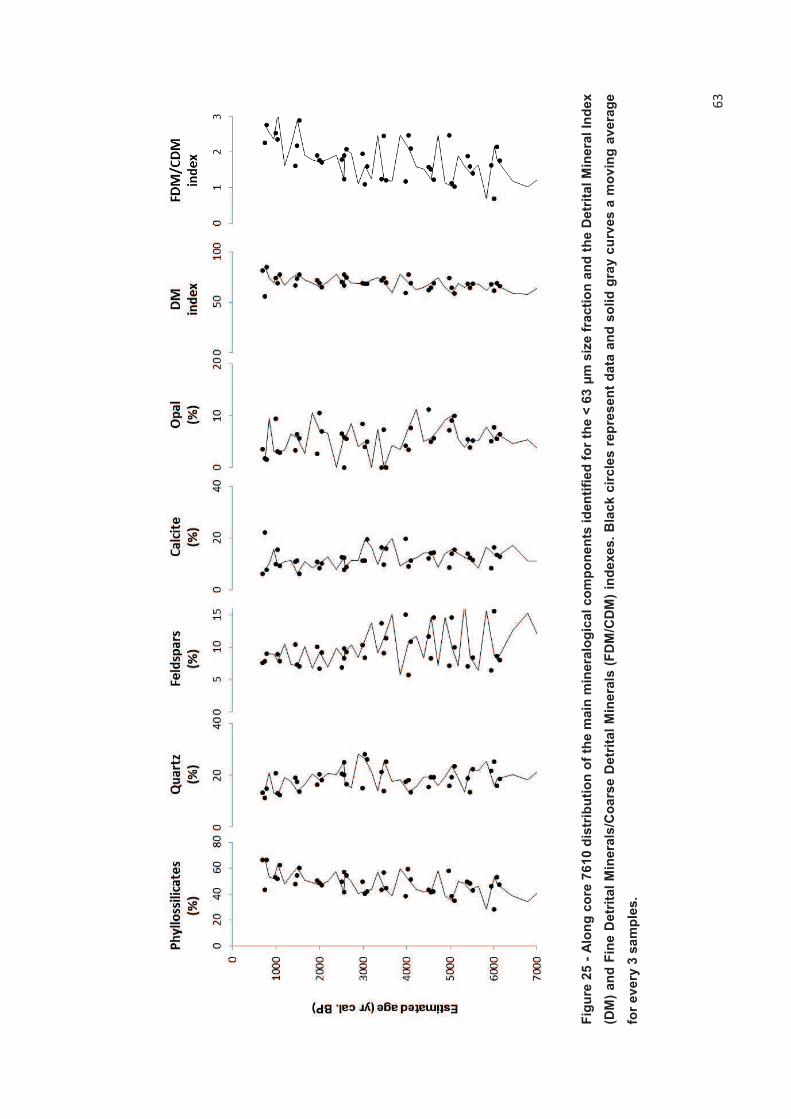
63
Fig
ure
25 -
Alo
ng
co
re 7
61
0 d
istr
ibu
tio
n o
f th
e m
ain
min
era
log
ica
l c
om
po
ne
nts
id
en
tifi
ed
fo
r th
e <
63 µ
m s
ize
fra
cti
on
an
d t
he
De
trit
al
Min
era
l In
de
x
(DM
) a
nd
Fin
e D
etr
ita
l M
ine
rals
/Co
ars
e D
etr
ita
l M
ine
rals
(F
DM
/CD
M)
ind
exe
s.
Bla
ck
cir
cle
s r
ep
res
en
t d
ata
an
d s
oli
d g
ray c
urv
es a
mo
vin
g a
ve
rag
e
for
ev
ery
3 s
am
ple
s.

64
5.2.4. Microfaunal analyses
5.2.4.1. Chemical composition of planktonic foraminifera tests
5.2.4.1.1. Elemental ratios in planktonic foraminifera tests - Mg/Ca and Ba/Ca ratios
Crossplots between Mn/Ca and Fe/Ca against Mg/Ca ratios presented no significant
correlation, attesting no contamination (Appendix 3, Figure 26). Mg/Ca ratios obtained in G.
ruber (pink) tests for core 7610 present a relatively stable distribution pattern, ranging between
3.45 and 4.65 mmol/mol and oscillating around an average of 4.07 mmol/mol (Appendix 3,
Figure 27). As a general pattern, periods with above average Mg/Ca ratio values are observed
between 5800-5000 yr cal. BP; 4500-4000 yr cal. BP and 3000-2000 yr cal. BP intercalated with
periods with below average. A clear exception to this pattern occurs after 1800 and 1400 yr cal.
BP when the lowest values for Mg/Ca ratios are observed (average = 3.70 mmol/mol) (Figure
27).
A similar pattern is also observed for Mg/Ca based SST estimates, presenting an
amplitude of about 3°C, ranging between minimum values of 24.5°C and maximum of 27.8°C
and average values of 26.3°C (Figure 27). As for Mg/Ca ratios, the period between 1800 and
1400 yr cal. BP presents the lowest SST estimates (average 25°C), presenting an average of
2°C difference from its former and later periods

65
Figure 26 - Crossplot between Mg/Ca ratios against (a) Mn/Ca and (b) Fe/Ca ratios, for
core 7610, low R2 values highlight no contamination.
5.2.4.1.2. Stable oxygen (δ18
O) and carbon (δ13
C) isotopic composition
The δ18Oc composition of G. ruber (pink) from core 7610 presents a progressive
decrease of approximately 0.75‰ between 6000 and 4700 yr cal. BP, followed by a rapid
increase with the same magnitude in a time span of 200 years (form 4700 to 4500 yr cal. BP)
(Appendix 3). After this rapid increase in δ18Oc values, a continuous decrease trend occurs
(≈0.50‰) lasting until 2500 yr cal. BP. After 2500 yr cal. BP another increase of approximately
0.60‰ in δ18Oc values is observed towards the coretop (Figure 27).
Meanwhile, δ13C values present a different distribution pattern, between 6000 and 5500
yr cal. BP and between 3500 and 2800 yr cal. BP, δ13C has average values of approximately
1.60‰ intercalated by a period with relatively higher values close to 1.75‰ (between 5500 and
3500 yr cal. BP). The highest values observed for G. ruber (pink) δ13C (average 1.80‰) are
located in the uppermost part of core 7610, after 2800 yr cal. BP (Figure 27).

66
δ18Ow-ivc values present an overall decreasing trend from core base towards coretop
(Figure 27). Between 6000 and 4700 yr cal. BP a progressive 1.00‰ magnitude decrease is
observed. As for SST estimates, this decrease is followed by a rapid increase with the same
magnitude (1.00‰) in δ18Ow-ivc values within a time span of 300 years (from 4700 to 4300 yr cal.
BP). From 4300 to approximately 1600 yr cal. BP a progressive decrease in δ18Ow-ivc takes
place, reaching values close to 0.71‰ at 1640 yr cal. BP. In the last 1400 years, δ18Ow-ivc values
increase oscillating around 1.45‰.
Figure 27 - Along core distribution of chemical composition of G. ruber (pink) (Mg/Ca
ratios, δ18
Oc and δ13
C composition) and Mg/Ca based SST and δ18
Ow-ivc estimates
obtained for core 7610.
5.3. Core 7616 (25°5.88’S, 45°38.64’W – Santos/SP)
5.3.1. Chronology
Core 7616 is 5.36 m long; however, in this study, only the uppermost 3 m were
analyzed (Figure 28), since the lower part of the core shows a significant erosional contact at 3
m depth, below which the sediments yield radiocarbon ages of about 13000–15000 yr cal. BP
(Table 6). The upper 3 m of the core consists of olive black (7.5GY 3/2) homogeneous mud with

67
sparse millimeter size mollusk fragments, and spans about 7000–900 cal. BP. The uncorrected
sedimentation rate inferred from the age model varies from 40 to 60 cm kyr-1 (Figure 28). The
base of the core, below the unconformity at 3 m, consists of bioturbated dark olive-gray (2.5GY)
mud with intercalations of sandy lenses and concentrations of centimeter-size mollusk
fragments. Sediments younger than about 900 cal. BP in core 7616 were not recovered (Table
6).
Table 6 - 14
C AMS radiocarbon dating results for core 7616 and 2σ calibrated age ranges,
no age inversion in radiocarbon dates was observed.
Core depth 14C age 13C/12C
(cm) (anos A.P.) ± 1σ (‰, PDB)
0 -- 2 224522 1460 ± 40 -21.1 Cal BP 1060 - 773
50 -- 52 224523 2420 ± 40 -21.2 Cal BP 2117 - 1813
100 -- 102 224524 3300 ± 40 -21.4 Cal BP 3211 - 2853
150 -- 152 224525 3470 ± 40 -21.7 Cal BP 3395 - 3075
200 -- 202 224526 4510 ± 40 -21.3 Cal BP 4786 - 4431
250 -- 252 224527 5320 ± 50 -21.6 Cal BP 5750 - 5444
300 -- 302 224528 6610 ± 60 -21.4 Cal BP 7225 - 6853
350 -- 352 224529 12170 ± 70 -23.3 Cal BP 13730 - 13349
400 -- 402 224530 13300 ± 80 -22.9 Cal BP 15494 - 14816
450 -- 452 224531 13340 ± 70 -23.1 Cal BP 15517 - 14909
BETA Analityc
Inc. ID2σ cal. range
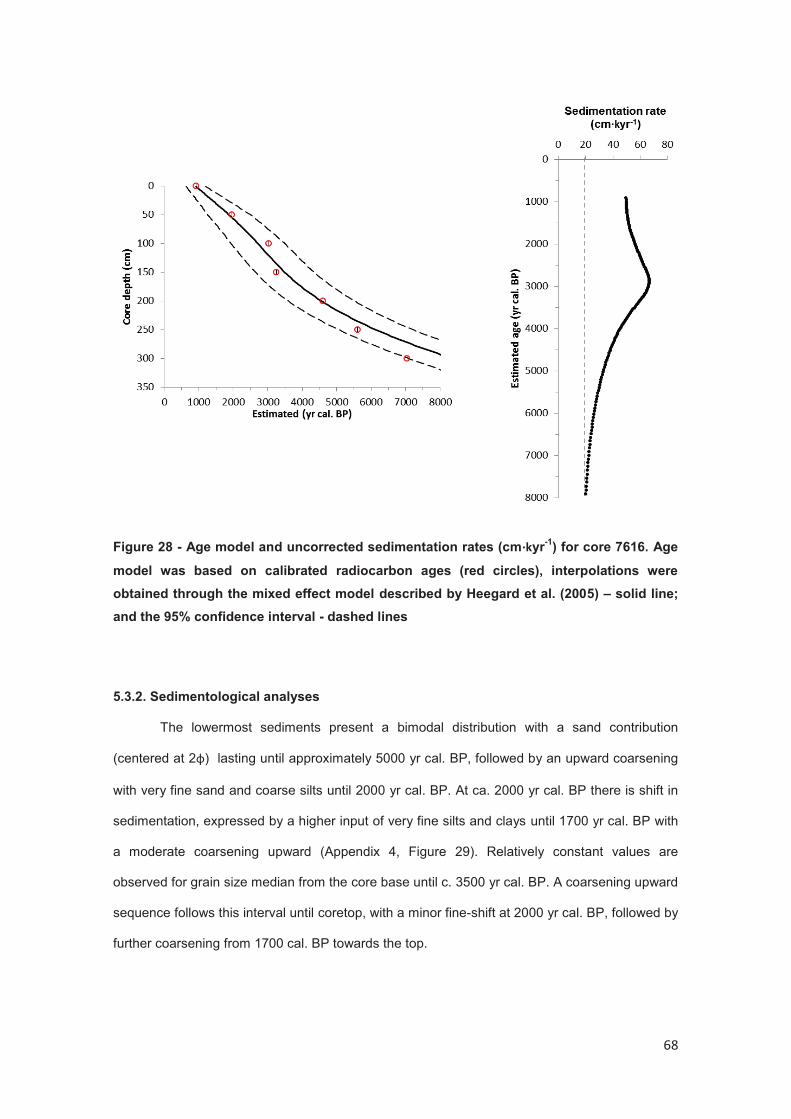
68
Figure 28 - Age model and uncorrected sedimentation rates (cm·kyr-1
) for core 7616. Age
model was based on calibrated radiocarbon ages (red circles), interpolations were
obtained through the mixed effect model described by Heegard et al. (2005) – solid line;
and the 95% confidence interval - dashed lines
5.3.2. Sedimentological analyses
The lowermost sediments present a bimodal distribution with a sand contribution
(centered at 2φ) lasting until approximately 5000 yr cal. BP, followed by an upward coarsening
with very fine sand and coarse silts until 2000 yr cal. BP. At ca. 2000 yr cal. BP there is shift in
sedimentation, expressed by a higher input of very fine silts and clays until 1700 yr cal. BP with
a moderate coarsening upward (Appendix 4, Figure 29). Relatively constant values are
observed for grain size median from the core base until c. 3500 yr cal. BP. A coarsening upward
sequence follows this interval until coretop, with a minor fine-shift at 2000 yr cal. BP, followed by
further coarsening from 1700 cal. BP towards the top.
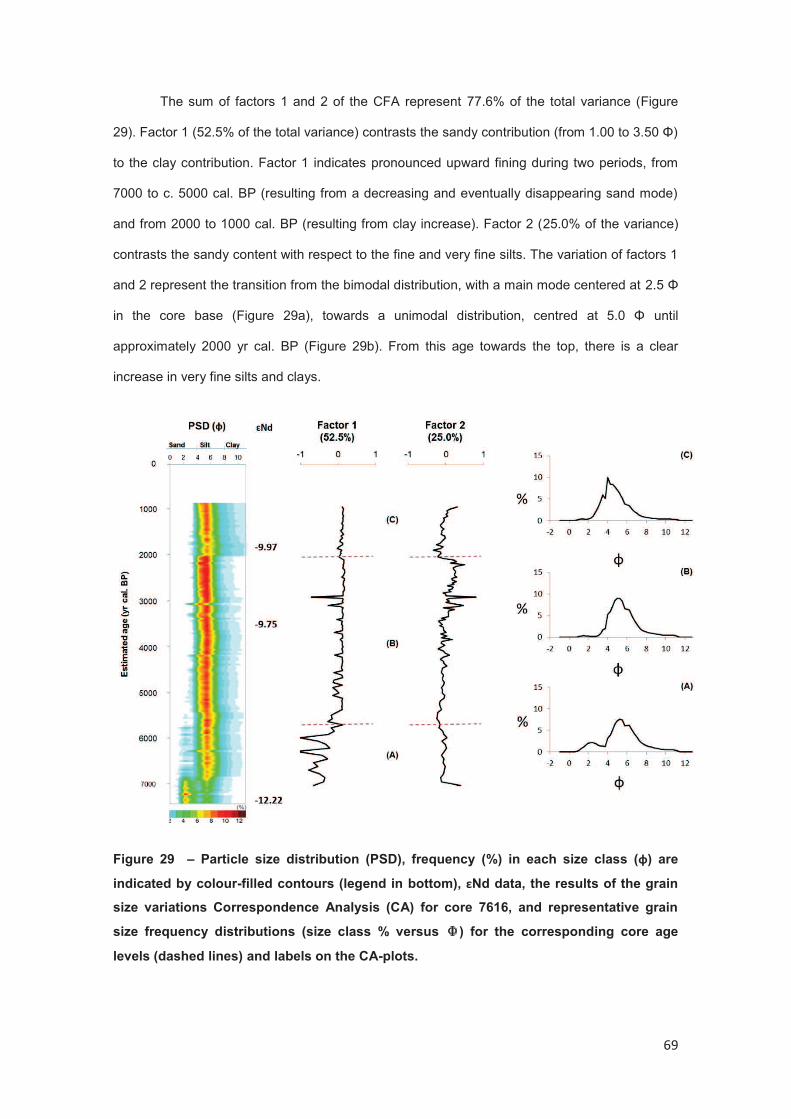
69
The sum of factors 1 and 2 of the CFA represent 77.6% of the total variance (Figure
29). Factor 1 (52.5% of the total variance) contrasts the sandy contribution (from 1.00 to 3.50 Φ)
to the clay contribution. Factor 1 indicates pronounced upward fining during two periods, from
7000 to c. 5000 cal. BP (resulting from a decreasing and eventually disappearing sand mode)
and from 2000 to 1000 cal. BP (resulting from clay increase). Factor 2 (25.0% of the variance)
contrasts the sandy content with respect to the fine and very fine silts. The variation of factors 1
and 2 represent the transition from the bimodal distribution, with a main mode centered at 2.5 Φ
in the core base (Figure 29a), towards a unimodal distribution, centred at 5.0 Φ until
approximately 2000 yr cal. BP (Figure 29b). From this age towards the top, there is a clear
increase in very fine silts and clays.
Figure 29 – Particle size distribution (PSD), frequency (%) in each size class (φ) are
indicated by colour-filled contours (legend in bottom), εNd data, the results of the grain
size variations Correspondence Analysis (CA) for core 7616, and representative grain
size frequency distributions (size class % versus ) for the corresponding core age
levels (dashed lines) and labels on the CA-plots.

70
5.3.3. Geochemical analysis
5.3.3.1. Sedimentary organic matter
As for the other two cores, core 7616 presents progressive increase in TOC contents in
the last 7000 years, the lowermost sediments present lower than 0.5% TOC contents reaching
up to 1.5% at coretop. Meanwhile, Ntot contents present a slight increase between 7000 and
2400 yr cal. BP from values close to 0.12% to 0.15%, respectively; followed by a shift in Ntot
contents after 2400 yr cal. BP, when values reach approximately 0.22%. (Appendix 4, Figure
30)
C/N ratios present relatively lower values between 7000 and approximately 6000 yr cal.
BP, with a mean of 3; followed by a slight increase (mean values of 5) until approximately 2400
yr cal. BP when values shift to 4, followed by another increase in C/N ratios towards coretop
when values reach approximately 6. Meanwhile the isotopic composition of the organic matter,
δ13C and δ15N present a small increase in values in the last 7000 years, oscillating between -
22‰ and -21.3‰ and around an average of 5‰, respectively (Figure 30).
Figure 30 – Along core 7616 distribution of CaCO3 contents and sedimentary organic
matter (TOC and Ntot contents, isotopic composition of the organic matter δ13
C and δ15
N
and C/N ratio). Black circles represent data and solid gray curves a moving average for
every 3 samples.

71
In the cross plot between TOC and Ntot contents it is possible to distinguish three distinct
groups of samples, namely: sediments samples younger than 2400 yr cal. BP, these are
samples with higher TOC and Ntot contents, sediment samples between 5800 and 2400 yr cal.
BP, and between 7000 and 5800 yr cal. BP (Figure 31). In the cross plot between δ13C and C/N
ratios all samples fall into the marine algae interval defined by Meyers et al. (1994) (Figure 31).
Figure 31 - (a) cross plot between TOC and Ntot, showing significant correlation between
variables (n-1=103; α= 0.05) and highlighting three distinct groups of sediment samples;
and (b) δ13
C vs. C/N plot, the different fields correspond to end member sources for
organic matter preserved in sediments (modified from Meyers, 1994).
5.3.3.2. Calcium carbonate (CaCO3)
Calcium carbonate contents present relatively higher values (average 25%) between
7000 and 2700 yr cal., between 2700 and 2200 yr cal. BP values range from 23 to 21%, and
after 2200 yr cal. BP a decrease in CaCO3 contents occur reaching values close to 17% in
coretop sediments (Appendix 4, Figure 30).
5.3.3.3. Sedimentary inorganic constituents
The crossplot between Fe and Ti versus Al, with higher than 0.7 r2 values, highlights
correlation between the first and the later (Figure 32a,b). Al, Fe and Ti present similar along
core distribution patterns, with relatively lower values at core base and a progressive increase

72
towards coretop (Appendix 4, Figure 33). V also presents a similar distribution pattern as
described for Al, Fe and Ti.
Figure 32 - Cross plots of (a) Fe vs. Al; (b) Ti vs. Al; (c) Ba/Al vs. TOC; and (d) Ba/Ca vs.
TOC. Statistically significant values (p<0.05) of the Correlation Coefficient are shown.
An upward decreasing trend is observed for Ca concentrations, presenting relatively
higher concentrations at lowermost core sediments (approximately 64000 mg·kg-1) and relatively
lower concentrations (average values of 40000 mg·kg-1), especially after 2000 yr cal. BP (Figure
33). In the meantime, Ba concentrations presents a relatively stable behavior throughout the
core (average values of 185 mg·kg-1), with two periods with higher and lower than average
values between 3400 and 3200 yr cal. BP (average 220 mg·kg-1) and between 2000 and 1500
yr cal. BP (average 160 mg·kg-1), respectively (Figure 33).

73
Figure 33 - Along core distribution of (a) the sedimentary inorganic constitutents (Al, Fe,
Ti, Ca, and Ba) and (b) the elemental ratios (Fe/Ca, Ti/Ca, Ba/Ca and Ba/Al) obtained for
core 7616. Black circles represent data and solid gray curves a moving average for every
3 samples.

74
The distribution of Fe/Ca and Ti/Ca ratios along core 7616 (Figure 33) have similar
trends to those presented for core 7610 presenting progressive increase from core base
towards coretop in three distinct steps. The first, between 7000 and approximately 6000 yr cal.
BP, with Fe/Ca ratios, for example, going from 0.4 to approximately 0.6; in the second step,
from approximately 6000 to 2000 yr cal. BP, Fe/Ca ratios present stable behavior; and after
2000 yr cal. BP towards coretop, the third increase step, Fe/Ca ratios presents values close to 1
(Figure 33). The same pattern is observed for Ti/Al ratios.
The cross plot between Ba/Al and TOC do not present a clear relationship between
these variables (Figure 32c), while Ba/Ca and TOC present low, but positive and significant
correlation (Figure 32d). Different distribution pattern is observed between Ba/Al and Ba/Ca
ratios. The first presents an upward decreasing trend and, the later, a relatively stable
distribution pattern with a slight increase in values upward (Figure 33)
5.3.3.4. Mineralogy
The X-ray diffraction results for core 7616 in the < 63 µm fraction highlight the presence
of mainly siliciclastic minerals (Appendix 4, Figure 34). As main components were identified:
phyllosilicates (27 -64.6%) and calcite (10 – 30%), followed by quartz (9 – 25%), feldspars (4-
16% - K-feldpars (0-5%) and plagioclases (1-16%)) and opal representing 0-9% (Figure 34).
Accessory minerals are also represented by traces of several other minerals such as analcime
(0-3.3%), halite (0-7%), and pyrite (0-3%) (Appendix 4). Other minerals such as anatase,
anhydrite, clorite, hematite, magnetite/maghematite and siderite are present in some samples of
the core with percentages below 3% (Appendix 4).
Sediments at the base of the core present relatively lower amounts of phyllosilicates
(average 40%); followed by a continuous upward increase in values representing approximately
50% in coretop sediments (Figure 34). Meanwhile, calcite presents an opposite trend, with a
progressive decrease in contents from older than 7000 yr cal. BP sediments (approximately
30%) towards coretop when calcite represents 10% of the minerals. Quartz amounts present a
relatively stable behavior throughout the core oscillating around 17% (Figure 34). Feldspars
contents range from 4 to 16% (average 9%) from core base until approximately 1500 yr cal. BP,

75
with decrease in values towards younger sediments with average percentages of about 6%
(Figure 34).
The detrital mineral index (DM) presents percentages varying between 45-76%, with an
upward increasing trend (Appendix 4, Figure 34). A similar behavior was also observed for the
Fine Detrital Minerals/Coarse Detrital Minerals (FDM/CDM) ranging between 0.7 and 4.0.
5.3.3.5. Neodymiun (εNd) isotopes
For core 7616 relatively lower values (εNd = -12.22 ± 0.12) of neodymium isotopic
composition of sediments were found at older than 8000 yr cal. BP, at approximately 3600 yr
cal. BP εNd values of -9.74±0.12 are observed, and at around 1800 yr cal. BP εNd values of -
9.97±0.12 were found (Table 7, Figure 29).
Table 7 – εNd data obtained for core 7616.
Core depth (cm)
Estimated age
(yr cal. BP) εNd
46 -48 1817 -9.97 ± 0.12
154 -156 3579 -9.75 ± 0.12
306 - 308 8615 -12.22 ± 0.12

76
Fig
ure
34 -
Alo
ng
co
re 7
61
6 d
istr
ibu
tio
n o
f th
e m
ain
min
era
log
ica
l c
om
po
ne
nts
id
en
tifi
ed
fo
r th
e <
63 µ
m s
ize
fra
cti
on
an
d t
he
De
trit
al
Min
era
l In
de
x
(DM
) a
nd
Fin
e D
etr
ita
l M
ine
rals
/Co
ars
e D
etr
ita
l M
ine
rals
(F
DM
/CD
M)
ind
exe
s.
Bla
ck
cir
cle
s r
ep
res
en
t d
ata
an
d s
oli
d g
ray c
urv
es a
mo
vin
g a
ve
rag
e
for
ev
ery
3 s
am
ple
s.

77
5.3.4. Microfaunal analyses
5.3.4.1. Chemical composition of planktonic foraminifera tests
5.3.4.1.1. Elemental ratios in planktonic foraminifera tests - Mg/Ca and Ba/Ca ratios
Crossplots between Mn/Ca and Fe/Ca against Mg/Ca ratios presented no significant
correlation, attesting no contamination (Figure 35). As a general pattern, Mg/Ca ratios obtained
in G. ruber (pink) tests for core 7616, present periods with values above average ( 3.97
mmol/mol) between 7000-5800 yr cal. BP (4.07 mmol/mol) and 4600-2800 yr cal. BP (4.05
mmol/mol), and periods with below average values between 5800-4600 yr cal. BP (3.83
mmol/mol) and after 2800 yr cal. BP (3.92 mmol/mol) (Appendix 4, Figure 36).
As for core 7610, a similar pattern is also observed for Mg/Ca based SST estimates,
presenting an approximately 3.5°C amplitude, ranging between minimum values of 24.0°C and
maximum of 27.5°C and average values of 26.0°C (Figure 36). The period between 5800 and
4600 yr cal. BP presents the lowest SST estimates (average 25.6°C), presenting an average of
1°C difference from its former and later periods (Figure 36).
Figure 35 - Crossplot between Mg/Ca ratios against (a) Mn/Ca and (b) Fe/Ca ratios, for
core 7616, low R2 values highlight no contamination.

78
5.3.4.1.2. Stable oxygen (δ18
O) and carbon (δ13
C) isotopic composition
The δ18Oc composition of G. ruber (pink) from core 7616 presents a relatively stable
behavior between 7000 and approximately 3000 yr cal. BP, oscillating around the average -
0.79‰. After 3000 yr cal. BP a progressive decrease of approximately 0.80‰ takes place, with
lowest values (-1.59‰) occurring between 2000 and 1000 yr cal. BP (Appendix 4, Figure 36).
Meanwhile, δ13C values present a different distribution pattern, between 7000 and
approximately 3000 yr cal. BP, δ13C presents a progressive decrease of approximately 0.60‰,
followed by an increase trend from 3000 to approximately 1000 yr cal. BP in the same
magnitude (approximately 0.60‰) as the decrease from the previous period (Figure 36).
δ18Ow-ivc values present an overall decreasing trend from core base towards coretop
(Figure 36). Between 7000 and 4400 yr cal. BP δ18Ow-ivc presents average values of
approximately 2.10‰, from 4400 until 2800 yr cal. BP. δ18Ow-ivc values increase reaching
average values of 2.40‰, this increase is followed by a decrease in δ18Ow-ivc values of
approximately 0.60‰ magnitude (Figure 36).
Figure 36 - Along core distribution of chemical composition of G. ruber (pink) (Mg/Ca
ratios, δ18
Oc and δ13
C composition) and Mg/Ca based SST and δ18
Ow-ivc estimates
obtained for core 7616. Black circles represent data and solid gray curves a moving
average for every 3 samples.

79
5.3.4.2. Benthic foraminifera community
A total of 127 species belonging to 59 genera of benthic foraminifera were identified in
core 7616, mainly calcareous taxa (Appendix 5), tests presented good preservation and no
apparent evidence of shattered chambers in the sediments was observed. Benthic foraminiferal
densities (number of specimens in 10 cc of sediment) varied between 2.5 and 78x103
tests·10cc-1 (Appendix 5). Between approximately 7000 and 4000 yr cal. BP benthic
foraminifera densities presents mean values of approximately 36x103 tests·10cc-1, followed by a
significant increase in values from 4000 yr cal. BP until 3 600 yr cal. BP when densities reach
78x103 tests·10cc-1 (Figure 37). After 3 600 yr cal. BP benthic foraminífera densities decrease
again reaching a minimum values of approxiamtely 2.5x10³ tests·10cc-1 approximately 1000 yr
cal. BP (core top, Figure 37).
The following species were considered as representative species (relative frequency
>3% in at least 10% of samples): Angulogerina angulosa, Angulogerina spp., Bolivina
subspinensis, Brizalina spp., Bulimina marginata, Bulimina spp., Globocassidulina subglobosa,
Globocassidulina spp., Gyroidina umbonata, Gyroidina spp., Epistominella spp., Islandiella
norcrossi and Seabrookia earlandi and are represented in Plates 1 and 2.
G. subglobosa was the most abundant and widespread species in the core,
representing in average over 30% of the total population in 19/19 samples, followed by A.
angulosa (average more than 10% of the total population in 19/19 samples) and Epistominella
spp. (average more than 11% of the total population in 16/19 samples). The species B.
marginata, Globocassidulina spp., G. umbonata and I. norcrossi represent in average >5% of
the total assemblage. Angulogerina spp., B. subspinensis, Brizalina spp., Bulimina spp.,
Gyroidina spp., and S. earlandi are minor components of the benthic foraminifera fauna
(average <5% of the total assemblage).
R-mode cluster analysis revealed three main assemblages, which were denominated
according to the dominant species: A. angulosa-B. marginata, G. subglobosa and I. tumidula
(Figure 38). The A. angulosa-B. marginata assemblage is composed by A. angulosa,
Angulogerina spp., B. subspinensis, B. marginata, Bulimina spp., G. umbonata, Gyroidina spp.
and I. norcrossi (Figure 38). This assemblage presents an overall decrease in relative
frequencies from 7000 until 3000 yr cal. BP, followed by a period with a slight increase in

80
species relative frequencies and a clear trend of increase after 2800 yr cal. BP towards core top
(Figure 39).
Figure 37 - Along core 7616 distribution of benthic foraminífera density (tests·10cc-1
),
epifauna and infauna species percentages, and benthic foraminifera based indexes
BFAR (tests·cm-2
·kyr-1
) and BFHP (%).Black circles represent data and solid gray curves
a moving average for every 3 samples.
The G. subglobosa assemblage is composed of G. subglobosa and Globocassidulina
spp. (Figure 38) this assemblage is present throughout the core and comprises over 30% of
total benthic foraminifera assemblage. As a general trend this assemblage presents an overall
decrease in relative frequencies from 4000 yr cal. B.P. towards core top (Figure 39).
The Epistominella spp. assemblage is composed of Brizalina spp., Epistominella spp.
and S. earlandi (Figure 38). This assemblage presents an overall decreasing trend in
frequencies towards core top particularly shown by the Brizalina spp. and S. earlandi species
(Figure 39). Meanwhile, Epistominella spp. presents relatively higher frequencies between 4
500 and 2800 yr cal. BP (reaching relative frequency values of 40%), followed by a continuous
decrease in frequencies, reaching 0% at core top (Figure 39).
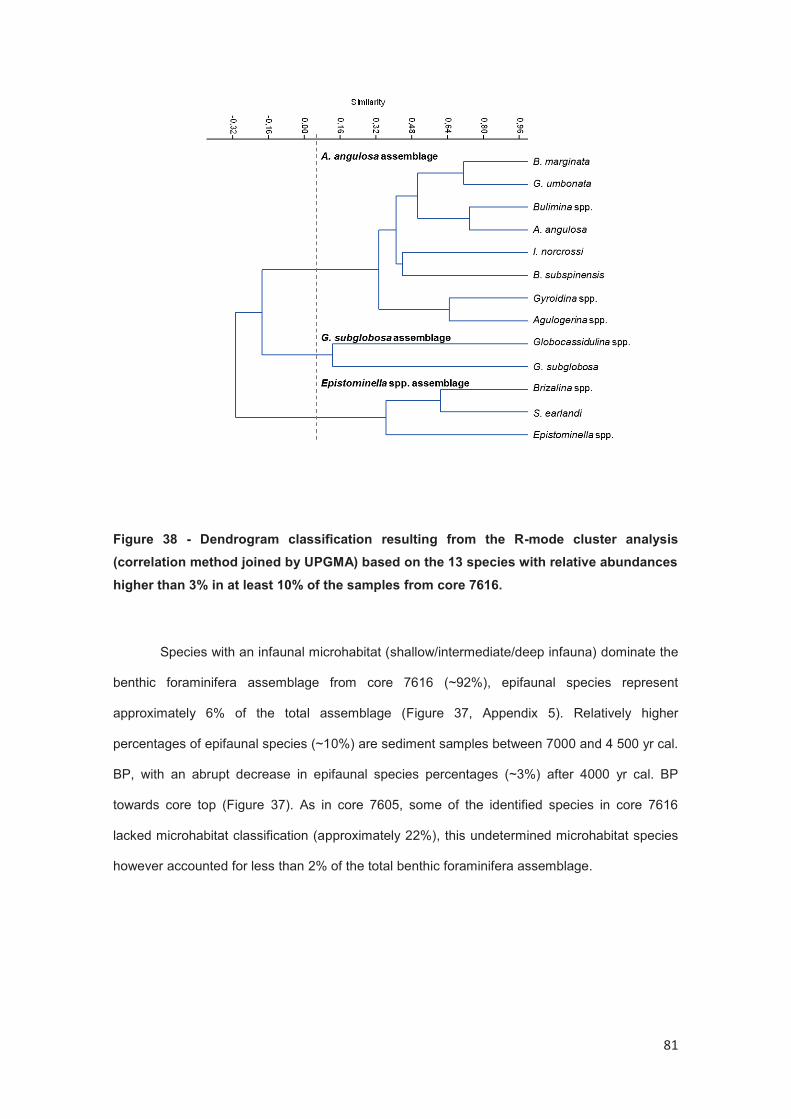
81
Figure 38 - Dendrogram classification resulting from the R-mode cluster analysis
(correlation method joined by UPGMA) based on the 13 species with relative abundances
higher than 3% in at least 10% of the samples from core 7616.
Species with an infaunal microhabitat (shallow/intermediate/deep infauna) dominate the
benthic foraminifera assemblage from core 7616 (~92%), epifaunal species represent
approximately 6% of the total assemblage (Figure 37, Appendix 5). Relatively higher
percentages of epifaunal species (~10%) are sediment samples between 7000 and 4 500 yr cal.
BP, with an abrupt decrease in epifaunal species percentages (~3%) after 4000 yr cal. BP
towards core top (Figure 37). As in core 7605, some of the identified species in core 7616
lacked microhabitat classification (approximately 22%), this undetermined microhabitat species
however accounted for less than 2% of the total benthic foraminifera assemblage.

82
Fig
ure
39 -
Alo
ng
co
re 7
61
6 d
istr
ibu
tio
n o
f th
e r
ela
tiv
e f
req
ue
nc
ies o
f th
e 1
3 b
en
thic
fo
ram
inif
era
sp
ec
ies
co
ns
ide
red
as r
ep
res
en
tati
ve
(>
3%
in
at
leas
t 1
0%
of
sam
ple
s),
gro
up
ed
acc
ord
ing
to
th
e R
-mo
de
clu
ste
r a
na
lysis
. B
lack
cir
cle
s r
ep
res
en
t d
ata
an
d s
oli
d g
ray c
urv
es a
mo
vin
g a
ve
rag
e f
or
ev
ery
3 s
am
ple
s.

83
Cont. Figure 39 -
Foraminiferal parameters are presented in Appendix 5 and represented in Figure 40.
Between approximately 7000 and 4000 yr cal. BP higher values for R (mean = 43) and H’
(mean = 2.59) are observed, followed by a decrease in values until approximately 2 600 yr cal.
BP when values of both R and H’ parameters present values of approximately 20 and 1.90,
respectively (Figure 40). J’ presented along core mean values around 0.68 (Figure 40).
Benthic foraminifera productivity indexes BFAR and BFHP are presented in Appendix 5
and represented Figure 37. In general, BFAR index follows the same along core distribution as
observed for benthic foraminifera densities (Figure 37), with a relatively higher value at
approximately 3 600 yr cal. BP (42x105 tests·102cm-2·kyr-1) and lower values in sediment
samples older (mean values of 10x105 tests·102cm-2·kyr-1 approximately between 7000 and 4
500 yr cal. BP) and younger (mean values of 8x10⁴ tests·102cm-2·kyr-1 approximately between
3000 and 1000 yr cal. BP) than this period (Figure 37). Meanwhile the BFHP index values
presented an opposite trend to BFAR, with relatively lower values at approximately 3 600 yr cal.
BP (~9%) and higher values in sediment samples older (mean values of 18% approximately

84
between 7000 and 4 500 yr cal. BP) and younger (mean values of 20% approximately between
3000 and 1000 yr cal. BP) than this period (Figure 37).
Figure 40 – Benthic assemblage parameters along core 7616 distribution. Where: R –
species richness; H’ – diversity; and J’ - equitability.

85
6. Discussion
The good resolution of the three marine records chosen for this study allied to the
application of a multi-proxy approach allowed the inference of significant paleoceanographic
changes that took place over the S/SE Brazilian shelf during Mid- to Late Holocene.
In order to better explore the data and in an attempt to link the paleoceanographic
changes observed to changes in environmental conditions over SE South America, during Mid-
and Late Holocene, mainly related to precipitation and wind regimes, discussion was divided
into 4 items. In the first item (6.1.) sedimentological and geochemical data is discussed in an
effort to link changes observed in depositional processes and sediment provenance to
hydrodynamic conditions over the S/SE Brazilian shelf, establishing a general scenario of the
Mid- to Late Holocene oceanographic and environmental conditions; the second item (6.2.)
seeks to link geochemical and microfaunal based productivity proxies to the oceanographic and
environmental conditions scenario, also reinforcing the need of applying a multi-proxy approach
when tackling productivity reconstructions. In the last two items the established oceanographic
scenarios for Mid- and Late Holocene are discussed through a regional and global perspective
taking into account climatic forcings; the third item (6.3.) views changes in the La Plata River
influence over the S/SE Brazilian shelf as a result of SE South America precipitation regime
changes driven insolation and the forth item (6.4.) presents an stacked record from cores 7610
and 7616 and discuss multi-centennial changes in water temperature and salinity at the
northern portion of Santos Basin, as a result of lt SACW shelf penetration, exploring possible
triggering mechanisms.
6.1. Mid- to Late Holocene hydrodynamic changes in the S/SE Brazilian shelf -
depositional processes and sediment provenance.
The analysis of the sedimentological and geochemical data of the three cores reveals
that in the last 7000 years significant changes occurred in the depositional patterns of the S/SE
Brazilian shelf. In general, all three cores show a pronounced bimodal distribution with a sand
mode during Mid- Holocene, which experience a conspicuous decrease beginning at
approximately 7000 yr cal. BP. The disappearance of the sand modes, however, took place at

86
different time intervals in each core: in the northernmost core (7616) the sand mode
disappeared at approximately 5600 yr cal. BP; in core 7610, at approximately 5000 yr cal. BP;
and in the southernmost core (7605) the sand mode enters into the Late Holocene,
disappearing approximately at 1800 yr cal. BP. The second (and most important) grain size
mode is represented by finer sediments centered at approximately 5 φ (medium to coarse silts)
(Figure 41).
Grain size in marine records (including data from core 7616) have been previously
applied to assess Mid- to Late Holocene paleoceanographic conditions over the S/SE Brazilian
shelf by Gyllencreutz et al. (2010). These authors also found varying deposition of sands during
the Mid-Holocene; and attributed these variations to changes in sediment provenance rather
than in current speed. Taking into account relative sea-level oscillations and environmental
variations Gyllencreutz et al. (2010) proposed that the Mid-Holocene sands found in cores south
of 25°S were derived from the Argentinian shelf. According to these authors, Mid-Holocene
coarser sediment deposition would be the result of the combination of higher sea-level
conditions, inhibiting the La Plata River outflow hydraulic gradient and SW winds that enhanced
the northward sediment transport along the SE South American coast. It is important to highlight
that this hypothesis, however, was based solely in grain size data and in the fact that sand
content and sortable silt size lacked correlation.
In fact, latitudinal (south to north) differences of the sand mode representativeness in
grain size populations suggests a southern source of these coarser sediments. However, grain
size data alone cannot assign the origin of the Mid-Holocene sands, since it is also possible that
the Mid-Holocene sands represent reworked S Brazil shelf sediments made available by the
Early to Mid-Holocene sea level rise (Figure 42). Likewise the εNd data obtained in our cores
cannot confirm nor contradict Gyllencreutz et al. (2010) hypothesis. Since the modern εNd
signatures found by Mahiques et al. (2008) were obtained in sediments mostly composed of
silts; and, consequently, the inferences based in the εNd data, obtained for cores 7605 and
7616, most likely assess the provenance signature of the <63 µm size fraction rather than of the
quartzose sands.

87
Fig
ure
41 -

88
Figure 41 - Upper panel - Left: Particle size distribution (PSD) for cores 7605, 7610, and
7616, where frequency % in each size class is indicated by colour-filled contours (legend
in top). Right: Results of a Correspondence Analysis (CA) of grain size variations. Lower
panel: Representative grain size frequency distributions (size class % versus ), for the
cores. The corresponding core age levels are indicated with dashed red lines and labels
on the CFA-plots
In the northernmost core (7616), εNd values show a clear change in sediment
provenance from Mid- to Late Holocene; core base sediments presented similar εNd signatures
to modern granitic SE Brazilian shelf sediments found by Mahiques et al. (2008). Whereas, Late
Holocene sediments have similar εNd signatures to modern basaltic La Plata River derived
sediments (Figure 43). Meanwhile, in the southernmost core (7605) sediments presented similar
εNd signatures to modern La Plata River derived sediments and do not indicate changes in
sediment provenance in the last 7000 yr cal. BP (Figure 43).
Figure 42 – Relative sea-level curves along the SE South American coast. (A) Southern
Rio de la Plata, based on Cavalotto et al. (2004); (B) Salvador (Martin et al., 2003); and (C)
envelope for the Brazilian coast north of 28°S (solid lines) and south of 28°S (dashed
lines) from Angulo et al. (2006). (From: Gyllencreutz et al., 2010)

89
Therefore, during Mid-Holocene, the northernmost part of the study area received
sediments derived from the SE Brazilian margin transported by southward currents, whereas in
the southernmost part of the study area, sediments came from the La Plata River and, hence,
were transported by northward currents. Whereas, during the Late Holocene, εNd data reveals
that sediments deposited in the S/SE Brazilian shelf were derived from the La Plata River. In a
similar situation to the present day conditions, when La Plata River sediments reach the S/SE
Brazilian shelf transported by inner and mid- shelf northward flow of the BCC (Mahiques et al.,
2008).
Figure 43 – Latitudinal changes of the εNd values obtained for sediment samples
between 55 and 20°S by Mahiques et al. (2008) and the εNd values obtained for core 7605
(yellow hexagons) and core 7616 (purple cross) with sample estimated age (kyr cal. BP).
Following Gyllencreutz et al. (2010) rationale, if we consider that the inner- and mid-
shelf currents in the São Paulo Bight (including the BCC) are strongly correlated to wind stress
(Dottori and Castro, 2009), and while acknowledging that sedimentary properties alone cannot
distinguish whether changes in grain size results from changes in current speed or in the
variability of the speed (McCave et al., 1995), it is reasonable to assume that grain size
variations in our study area reflect changes in wind pattern. However, owing to the lack of

90
provenance confirmation for the sand mode in our records and taking into account that
Gyllencreutz et al. (2010) hypothesis implies that the changes in sand contents are related to
variations in the La Plata River outflow rather than in currents strength. We chose to apply fine
fraction grain size variations in order to assess changes in S/SE Brazilian inner and mid-shelf
currents.
During the Mid-Holocene, SE Brazilian shelf derived sediments were probably
transported to the northernmost part of the study area by the southward flow of the BC. In this
part of the São Paulo Bight, cross-shelf circulation is characterized by onto the shelf intrusions
of the BC, with substantial onshore bottom flow, extending from the slope to the middle shelf,
during winter when downwelling favorable S/SW winds occur (Palma and Matano, 2009). Thus,
coarser sortable silt might be related to onshore intrusions of the BC, occupying a position
closer to the coast. Two main factors could have promoted the displacement of the BC towards
the coast in the Mid-Holocene: (i) the sea-level highstand (Mahiques et al., 2007; Nagai et al.,
2010) and/or (ii) the presence of persistent downwelling favorable S/SW winds (Palma and
Matano, 2009). As Mid- and Late Holocene sea-level oscillations magnitude (Figure 42) may be
considered negligible for general circulation pattern in the coring site depth (100 m isobath), we
favor factor (ii) as the main driving mechanism of the onshore displacement of the BC during the
Mid-Holocene. From Mid- to Late Holocene as the BC influence over the shelf decreased, finer
sediments derived from the La Plata River were deposited, also leading to an increase in
sedimentation rates.
In the southernmost part of the study area, from Mid- to Late Holocene, sortable silt size
presents an oscillatory pattern leading to a general coarsening trend (Figure 44), suggesting
increase in strength of the inner and mid-shelf northward flow of the BCC. Although no εNd data
was obtained for core 7610 in terms of grain size distribution, namely in the fine fraction, during
Mid and Late Holocene this core presents in between core 7605 and core 7616 values (Figure
44). Thus, it is reasonable to assume that this core, collected in the vicinity of 25.5°S (literally
between the other two records), portraits a transitional limit between past hydrodynamic
controlling features acting over the S/SE Brazilian shelf depositional processes. To the north,
the high energetic conditions promoted by the BC onshore/offshore movements and to the

91
south the variations of the wind driven BCC, in accordance to the modern sedimentary
distribution pattern proposed by Nagai et al. (submitted).
During the Late Holocene, no significant changes in sortable silt sizes were observed in
all records until approximately 2000 yr cal. BP, when a coarsening shift in sortable silt size is
observed in the northernmost core (Figure 44). This shift suggests more intense cross-shore
circulation similar to the Mid-Holocene conditions. Simultaneously to the shift in sortable silt
size, higher deposition of very fine sediments (<10 µm) is also observed (Figure 44). If we
assume that there is a suspension sedimentary load (particles smaller than 10 µm) associated
with the La Plata River Plume, it seems reasonable to apply this fine sediment fraction as a
proxy of the extension of the influence of this plume over the S/SE Brazilian shelf. Thus, this
increase in the deposition of sediments smaller than 10 µm highlights that in the last 2000 yr
cal. BP the La Plata River Plume influenced the S/SE Brazilian shelf sedimentation processes
up to 25°S.
The input of terrigenous sediments derived from the La Plata River Estuary, into the
S/SE Brazilian shelf during the Late Holocene is also supported by other geochemical proxies,
such as Fe/Ca and Ti/Ca ratios and mineralogy. In all cores, Fe/Ca and Ti/Ca ratios presented a
general trend of increase in values during the Late Holocene, with significant increase in values
especially after 2000 yr cal. BP, suggesting higher input of terrigenous sediments (Haug et al.,
2001). Although, Fe/Ca and Ti/Ca ratios do not provide information regarding provenance, the
presence and progressive increase of predominantly siliciclastic sediments dominated by
terrigenous particles, such as phyllosilicates and quartz, during the Late Holocene primarily
derived from continental soils and the weathering of the rocks that cover the La Plata River
drainage basin (Campos et al., 2008; Mahiques et al., 2008) reinforces this hypothesis.
Mahiques et al. (2009) also applied Fe/Ca and Ti/Ca ratios as proxies of terrigenous
sediment input in the S Brazilian shelf; these authors found an increase in these ratios in Late
Holocene sediments and associated it to an increase in terrigenous sediment input derived from
the La Plata River. Due to the fact that the northward displacement of the La Plata River plume
depends both on precipitation over its drainage basin and favorable south-southwesterly winds
(Möller et al., 2008; Piola et al., 2008); Mahiques et al. (2009) attributed their results to climatic

92
oscillations, namely increased moisture conditions and intensification of southerly winds in the
Late Holocene. Gyllencreutz et al. (2010) also proposed that, during the Late Holocene,
changes in the depositional processes of the São Paulo Bight were a result of changes in
precipitation regimes and wind patterns over SE South America. Moreover, increase in
precipitation over SE South America has also been reported as a main factor influencing
increase in terrigenous supply for the Uruguayan slope from Mid- to Late Holocene (Chiessi et
al., 2010).
As discussed before, no significant changes in the northerly inner and mid-shelf
currents strength were observed. Consequently, our data does not support the proposition of
intensification but of persistent S/SW winds, during Late Holocene. On the other hand, the
Fe/Ca and Ti/Ca ratios significant increase observed in the Late Holocene strongly suggests
that the higher input of terrigenous sediments into the S/SE Brazilian shelf, especially after 2000
yr cal. BP (Figure 44), was a result of increased precipitation over the La Plata River drainage
basin.
Figure 44 – Along core distribution of the below 10 µm fraction (%), sortable silt mean
size (φ) and Fe/Ca ratios all three cores. Black line and dots represent core 7605; orange,
7610; and purple, 7616.

93
In accordance with the grain size variations, Fe/Ca and Ti/Ca ratios also highlight the
decrease in the La Plata River influence over the S/SE Brazilian shelf with decreasing latitudes
(i.e. distance to river mouth - Figure 44). In fact, core 7616 is located in the modern northern
latitudinal limit (25°S) of the La Plata Plume influence (Piola et al., 2000; 2008). This scenario is
in accordance to modern sediment distribution processes in the São Paulo Bight. Although La
Plata River derived sediments reach the SE Brazilian shelf (up to 25°S) transported by inner
and mid-shelf wind driven northward currents (Mahiques et al., 2008); northward of 27°S, mid-
and outer shelves sediment distribution is mainly controlled by the BC (Mahiques et al., 2002;
2004; Nagai et al., submitted).
In summary, during Mid- and Late Holocene the depositional processes over the
southernmost part of the S/SE Brazilian shelf were influence by the input of terrigenous
sediments derived from La Plata River. Whereas, in the northernmost part of the study area
only in the Late Holocene, especially in the last 2000 years, is this influence observed as a
consequence of a positive change in the precipitation regime over the La Plata River discharge
basin and more persistent winter S/SW winds.
6.2. Paleoproductivity changes in the S/SE Brazilian shelf during Mid- and Late
Holocene
The S/SE Brazilian continental shelf also experienced productivity changes during the
Mid- and Late Holocene as highlighted by the geochemical and microfaunal data. As a general
trend, all three cores presented continuous increase in TOC contents from Mid- to Late
Holocene. In addition, the δ13C values and the cross-plot between δ13C and C/N ratios, also
point to the presence of marine derived organic matter throughout the cores; this allows us to
state that from Mid- to Late Holocene the S/SE Brazilian shelf experienced increase in oceanic
productivity, leading to higher flux of marine derived organic matter to the seafloor.
It is important to highlight that we are aware of the overlying problems of applying TOC
contents as a paleoproductivity proxy, especially those related to organic matter preservation
(i.e., organic matter degradation and selection trough grain size variations). Higher amounts of
nitrogen in younger sediment samples (Figure 10, Figure 22,Figure 31) underline the possibility

94
of the occurrence of organic matter degradation throughout the sedimentary column (i.e., better
preservation at core top); and, significant grain size variations between Mid- and Late Holocene
sediments (coarser sediments at core base and a finning upward trend, respectively, Figure 41);
might also represent a bias as organic matter is better retained in finer sediments (Meyers,
1997). Nevertheless, the significant increase (almost twice of the observed TOC content from
Mid- to Late Holocene, even when TOC content are normalized by mud contents, and the fact
that other proxies, such as, CaCO3 contents and benthic foraminifera community structure
support that the observed TOC content variations reflects changes in the flux of organic matter
to the seafloor (i.e., oceanic productivity) rather than being an artifact of organic matter
preservation degree and/or grain size changes.
Interestingly, bulk sedimentary organic nitrogen isotopic signature (δ15N) reflects
differences in nutrient source in the S/SE Brazilian shelf, northern and southern parts. In the
northernmost part of the study area (25°S, core 7616) Mid- and Late Holocene sediments δ15N
values suggest a marine source for the dissolved nitrogen incorporated by the phytoplankton
(Hu et al., 2006). Meanwhile, in the southernmost part of the study area (27°S, core 7605) Mid-
and Late Holocene sediments δ15N values suggest the presence of continental derived nutrients
for this part of the S/SE Brazilian shelf (Hu et al., 2006). Whereas, δ15N values observed for core
7610 point to changes in nutrient source from Mid- to Late Holocene, from marine to continental
derived nutrients, respectively, in accordance with the previously established oceanographic
and depositional scenario in item 6.1.
The benthic foraminifera community also responded to the environmental changes that
occurred in the S/SE Brazilian shelf during Mid- and Late Holocene. In general, Mid- and Late
Holocene S/SE Brazilian shelf benthic foraminifera community is dominated by infaunal species
(Appendix 2, 5) with higher percentages of infaunal species observed during the Late Holocene
(Figure 15Figure 37) which, considering the TROX model2 (Jorissen et al., 1995, Figure 45)
point to increase in food availability. In both cores benthic foraminifera assemblages were
2 The TROX model is a conceptual model that considers the interplay between food availability and oxygen
concentration. According to this model, proposed by Jorissen et al. (1995) in oligotrophic environments, a critical food
level determines the penetration depth of most species, whereas in eutrophic settings, a critical oxygen level would
determine this depth (Figure 45).

95
composed of individuals of very small size, reflecting a clear dominance of opportunistic, r-
selected foraminiferal taxa (Gooday and Rathburn 1999; Duchemin et al. 2007). The dominance
of very small sized individuals in the living benthic foraminifera assemblages of the S/SE
Brazilian margin has been previously reported by Burone et al. (2010), whom attributed this to
episodic deposition of phytodetritus related to phytoplankton blooms. This supports the increase
in the flux of organic matter to the seafloor (i.e., oceanic productivity) suggested by TOC and
other sedimentary organic matter parameters.
In the southernmost part of the study area the B. marginata assemblage dominates Mid-
Holocene (between approximately 7000 and 5000 yr cal. BP) benthic foraminifera total
assemblage (Figure 17). The B. marginata assemblage is composed of epifaunal species
commonly associated with high productivity waters (B. marginata, Murray et al., 2003; Martins et
al., 2006; Burone et al., 2010) and with relatively high organic matter quality (C. ungerianus,
Contreras-Rosales et al., 2012), having been previously linked to environments with high food
supply and oxygen depletion (Lutze and Colbourn, 1984; Alve and Nagy, 1986; Jorissen et al.,
2007). I. norcrossi has previously been associated with low bottom water temperatures in the N
Atlantic (Saher et al., 2012). In the SW Atlantic B. marginata has been found composing living
foraminiferal assemblages in latitudes from 22° to 30°S also related to input of organic material
into the seafloor (Eichler et al., 2008; Burone et al., 2010). Taking into account that modern
oxygen levels are above the critical values for hypoxia (Eichler et al., 2008) due to the high
energetic oceanographic conditions in the study area and the presence of coarser sediments in
this period. It is reasonable to assume that between 7000 and 5000 yr cal. BP, the B. marginata
assemblage must be associated with food availability from cooler, fertile water masses, rather
than with low oxygen levels.
After 5000 yr cal. BP the benthic foraminifera total assemblage is dominated by the G.
subglobosa assemblage and higher frequencies of infaunal species (Figure 17, Figure 18). G.
subglobosa is the main component of the G. subglobosa assemblage. This species has a
cosmopolitan distribution in the oceans and its abundance has been linked to a number of
variables including various water masses (e.g., Corliss, 1979; Schnitker, 1980; Mackensen et
al., 1995) and pulsed phytodetrital input (e.g., Gooday, 1988, 1994; Gupta and Thomas, 2003;
Eberwein and Mackensen, 2006; Smart et al., 2010). In the modern SE Atlantic, Schmiedl et al.
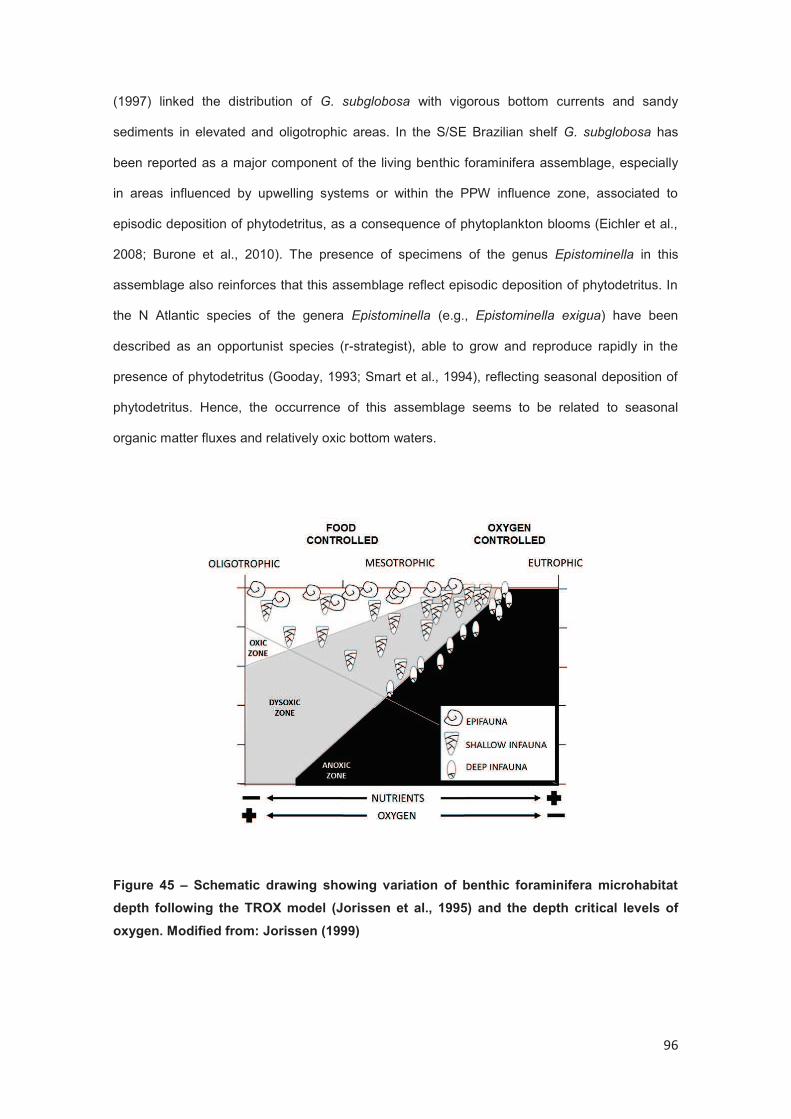
96
(1997) linked the distribution of G. subglobosa with vigorous bottom currents and sandy
sediments in elevated and oligotrophic areas. In the S/SE Brazilian shelf G. subglobosa has
been reported as a major component of the living benthic foraminifera assemblage, especially
in areas influenced by upwelling systems or within the PPW influence zone, associated to
episodic deposition of phytodetritus, as a consequence of phytoplankton blooms (Eichler et al.,
2008; Burone et al., 2010). The presence of specimens of the genus Epistominella in this
assemblage also reinforces that this assemblage reflect episodic deposition of phytodetritus. In
the N Atlantic species of the genera Epistominella (e.g., Epistominella exigua) have been
described as an opportunist species (r-strategist), able to grow and reproduce rapidly in the
presence of phytodetritus (Gooday, 1993; Smart et al., 1994), reflecting seasonal deposition of
phytodetritus. Hence, the occurrence of this assemblage seems to be related to seasonal
organic matter fluxes and relatively oxic bottom waters.
Figure 45 – Schematic drawing showing variation of benthic foraminifera microhabitat
depth following the TROX model (Jorissen et al., 1995) and the depth critical levels of
oxygen. Modified from: Jorissen (1999)

97
Between 5000 yr cal. BP and approximately 2500 yr cal. BP, the G. subglobosa
assemblage occurs in association with the G. umbonata assemblage (Figure 17). This
assemblage is composed by epifaunal to infaunal species (Murray, 1991; Fontanier et al., 2008)
and commonly considered to inhabit oligotrophic environments (G. umbonata, De Rijk et al.,
2000) with intense bottom currents (Angulogerina spp., Schönfeld, 2002).
Whereas, in younger than 2500 yr cal. BP sediments where higher frequencies of the
species that compose the G. subglobosa assemblage are observed in association with the A.
angulosa assemblage (Figure 17). A. angulosa is a cosmopolitan infaunal species, and occurs
in low to moderate abundances from subtidal to middle bathyal depths (Schönfeld, 2001). High
percentages of this species are recorded from current-swept passages (Hayward et al., 1994),
coarse, biogenic sands on the inner shelf (McGann, 1996 apud Schönfeld, 2002), and deep,
high-energy environments on the outer shelf and upper slope (Mackensen et al., 1985;
Schönfeld, 2002). A. angulosa species is commonly considered to be indicators of well
oxygenated bottom waters and low concentrations of organic carbon (e.g., Mackensen et al.,
1995; Schönfeld, 2002). Due to the presence of the species of the Bulimina genus in this
assemblage it is reasonable to assume that this assemblage mostly reflects intense bottom
currents and moderate to low food availability, since, in general, the infaunal Buliminids are
closely associated with high nutrient levels (Mackensen et al., 1990; Murray, 1991) and are also
reported as markers of upwelling in other continental shelves (Debenay and Redois, 1997;
Mendes et al., 2004).
In addition, after 2500 yr cal. BP, an increase of the G. subglobosa assemblage and
especially in the frequencies of B. elegantíssima, Gyroidina spp. and Epistominella spp. is also
observed (Figure 17). B. elegantissima is an infaunal deposit-feeder (Murray, 2006) typical of
shelf environments (Murray, 2006; Burone et al., 2007). This species composes the living
benthic foraminifera assemblage from the shelf sector between the La Plata River mouth
(Burone et al., in press) and Itajaí (Eichler et al., 2008), it inhabits sediments with high mud and
carbon contents (Burone et al., in press) and environments with freshwater influence (Eichler et
al., 2008). Thus, the increase of the G. subglobosa assemblage and the presence of the A.
angulosa assemblage, after 2500 yr cal. BP, reinforces the hypothesis of occurrence of episodic
inputs of organic matter to the seafloor, probably promoted by the input of continental derived

98
nutrients (δ15N values) brought to the S Brazilian shelf by the La Plata River Plume during the
Late Holocene.
Most of the representative species found in the southernmost core, with the exception of
B. elegantissima, were also identified as main components of the benthic foraminifera
community in the northernmost core. In addition, the northern core also presented as
representative species other infaunal species as B. subspinensis (Murray, 1991), Brizalina spp.
(Murray, 1991) and epifaunal/infauna S. earlandi (Heinz et al., 2001). The identified benthic
foraminifera assemblages in the northernmost core have as component species that reflect high
food availability, whether reaching the seafloor as high organic matter fluxes (e.g., B. marginata
and Brizalina spp.) or as episodic pulses of phytodetritus (e.g., G. subglobosa and Epistominella
spp.), and well oxygenated bottom waters (e.g., A. angulosa and G. subglobosa). These
assemblages occur in association with one another throughout the core and most likely reflect
changes in the intensity and frequency of organic matter input into the benthic system.
In the northernmost part of the study area, during Mid- Holocene (between 7000 yr cal.
BP and approximately 4500 yr cal. BP) coarser sediments (Figure 29) inhabited by A. angulosa,
G. subglobosa and Epistominella spp. assemblages (Figure 40) and relatively higher
percentages of epifaunal species (Figure 37) reflect an environment with low food availability
and well oxygenated bottom waters probably related to a relatively stronger influence of the BC
onshore/offshore movements over the shelf promoting vigorous bottom currents, supporting the
Mid-Holocene oceanographic scenario established by the sedimentological and geochemical
data for this part of the SE Brazilian shelf.
The Late Holocene is marked by higher frequencies of infaunal species (>90%)
suggesting increase in organic carbon flux to the seafloor (Figure 37). Between 4500 and 2800
yr cal. BP, the dominance of the benthic foraminifera total assemblage by phytodetritus species
(e.g., G.subglobosa and Epistominella spp.) and relatively low percentages of taxa considered
to be indicative of high productivity areas, such as Bulimina spp., Bolivina spp., Cassidulina spp
amongst others characterizes this period as an overall low to moderate productivity period
affected by episodic fluxes of phytodetritus to the seafloor (Smart et al., 2008). Also, during this
period, relatively smaller equitability (J’) and diversity (H’) values suggest a less stable
environment (Figure 40) (Burone and Vanin, 2006), supporting the occurrence of episodic food

99
supply. The decrease of A. angulosa assemblage importance, between 4500 and 2800 yr cal.
BP also suggests a relative reduction in bottom current strength.
A conspicuous decrease in Epistominella spp. assemblage occurs at approximately
2800 yr cal. BP, after which relative frequencies of G. subglobosa also decrease (Figure 40)
suggest decrease in episodic input of phytodetritus to the seafloor. Meanwhile, relative
frequencies of species composing the A. angulosa assemblage increase, suggesting high food
availability (e.g., B. marginata, Murray et al., 2003), relatively colder bottom water masses (e.g.,
I. norcrossi, Saher et al., 2012) and relatively stronger bottom currents (e.g., A. angulosa,
Schönfeld, 2002) in this period. Two different oceanographic processes can be accounted for
the increase in oceanic productivity and, hence, high food availability and cooler water masses
after 2 800 yr cal. BP; the presence over the northernmost part of the SE Brazilian shelf of the
cold and less saline waters of the (i) La Plata River Plume and/or (ii) South Atlantic Central
Water.
As previously discussed, sedimentological and geochemical data (item 6.1) showed that
during the Late Holocene, especially after 2000 yr cal. BP, the input of sediments derived from
the La Plata River reached the northernmost part of the study area (up to 25°S). However, δ15N
values suggest marine derived N as a main nutrient source for the phytoplankton throughout
core 7616. Thus it seems that although during the Late Holocene the La Plata River extended
its influence over the northernmost part of the SE Brazilian continental shelf depositional
processes, its waters did not significantly change the nutrient source signature. Conversely the
penetration of SACW into the shelf would deliver marine nutrients to the euphotic zone
increasing productivity. The presence of the SACW in the Brazilian shelf, especially in the last
approximately 3000 years was also reported by Nagai et al. (2009), at Cabo Frio (23°S). That
area is influenced by coastal upwelling events, in which persistent NE winds promote the colder
and nutrient enriched SACW shelf penetration, promoting increase in oceanic productivity.
However, both of the suggested processes are characteristic of seasonal occurrence (the La
Plata River Plume, during winter and SACW shelf penetration, during summer) and the
decrease in the phytodetritus assemblages suggests that in this period episodic organic matter
fluxes decreased. Hence, it is possible to assume that in the last approximately 2800 yr cal. BP

100
both processes positively influenced oceanic productivity, resulting in an overall increase in
oceanic productivity and organic matter flux to the seafloor.
The Benthic Foraminifera High Productivity index (BFHP) values observed for both
cores are also in agreement with the general trend of increase in food availability from Mid- to
Late Holocene (Figure 15, Figure 37) suggested by TOC contents. This index, however, does
not include phytodetritus species indicative of episodic input of organic matter, which represents
a disadvantage in applying this index as a reliable productivity proxy, as it might underestimate
oceanic productivity in areas such as the S/SE Brazilian continental shelf affected by episodic
fluxes of phytodetritus to the seafloor (as shown by the assemblage data).
Analogously, the use of the Benthic Foraminifera Accumulation Rate index (BFAR)
should be interpreted with caution as its values are dependent on sedimentation rates.
According to Smart et al. (2010), since relative foraminifera abundances are not dependent
upon such estimates, the reliability of the BFAR data can be assessed through comparisons
between environmental information from BFAR and relative abundance data. Both cores
presented highly variable sedimentation rates (Figure 7, Figure 28) and along core distribution
pattern of BFAR values (Figure 15,Figure 37) closely followed sedimentation rates changes. In
the southernmost core environmental information provided by BFAR values from core 7605 are
in agreement with assemblage relative frequencies data, whereas in the northernmost part of
the study area BFAR values do not represent the increase in productivity shown by the benthic
foraminifera assemblages.
In addition, the BFAR index was initially defined in the >150 μm size-fraction (Herguera
and Berger, 1991), when calculated in the >63 μm size-fraction which is mainly made up of
small-sized species that quickly proliferate and build up large populations in the presence of a
seasonal, pulsed and unpredictable food supply (Smart et al., 2008). In areas with low to
moderate productivity affected by episodic fluxes of phytodetritus to the seafloor, such as the
S/SE Brazilian shelf, BFAR fluctuations may not be linear in the presence of abundant
phytodetritus species (e.g., Schmiedl and Mackensen, 1997) and are probably not simply
related to the flux of organic matter to the seafloor (Smart et al., 2008).
We also proposed to apply inorganic elemental ratios to access Mid- to Late Holocene
productivity changes. There is still some debate over the use of sedimentary Ba contents as

101
productivity proxies, terrigenous background values are not so easy to determine (see
Mahiques et al., 2009 and references therein). The vast majority of the Ba/Al values obtained
for cores 7610 and 7616 were smaller than 0.0075, which may be considered as a terrigenous
background value (Dymond et al., 1992), 0.0040, determined by Pfeifer et al. (2001) for the
Southwest South Atlantic or even than 0.0028, determined by Klump et al. (2000) in the
Chilean continental margin surface sediments. This gives negative values of Baexcess,
invalidating the determination of Baexcess values. Thus, we followed Mahiques et al. (2009) and
compared Ba content as well as Ba/Al, Ba/Ti, and Ba/Ca ratios with the TOC to evaluate if the
data could be compared qualitatively to establish temporal changes in productivity.
However, Ba/Ca showed positive significant correlation with TOC in cores 7610 and
7616, and no significant correlation in core 7605. Additionally, in this core, Ba/Al and TOC
content presented negative significant correlation. Insight of this it is possible to state that
sedimentary Ba contents should be carefully applied in the northernmost part of the study area
as a productivity proxy, whereas for the southernmost part of the study area it is closely related
to the strong continental influence of the La Plata River. Although Ba/Ca ratios distribution along
cores 7610 and 7616 presented a general trend of increasing values from Mid- to Late
Holocene indicating increase in productivity, it is important to highlight that in order to properly
apply Ba/element ratios as productivity proxies in the Brazilian continental margin further
constraints and knowledge in order to determinate Baexcess values are necessary to be exploited
by future studies.
6.3. Tracing Mid- and Late Holocene La Plata River influence over the S Brazilian
continental shelf – insolation driven changes
Mid- and Late Holocene depositional and productivity processes over the S Brazilian
shelf were influenced by the northward penetration of shelf waters associated with the La Plata
River Plume, as previously established by sedimentological, geochemical and microfaunal
proxies obtained for core 7605 (27°S). In order to better address the influence of the La Plata
River Plume waters over the S Brazilian shelf we applied the isotopic composition of the
planktonic foraminifera G. ruber (pink) in core 7605. The Holocene variability of the La Plata

102
River discharge and its impact on the depositional processes over the southern Brazilian shelf
have been recently discussed by Mahiques et al. (2009), pointing to an increase in the La Plata
River influence from Mid- to Late Holocene. However, these authors applied sedimentological
and geochemical proxies, not specific for paleotemperature and salinity changes, a more direct
proxy for the presence of La Plata River Plume colder and less saline waters.
As stated earlier (see Material and Methods item 4.4.1.) the knowledge of the ecology of
the foraminifera species chosen is of sum importance in paleoceanographic reconstruction
studies. According to Anand et al. (2003), surface dwelling planktonic species, such as the G.
ruber (pink), present strong intra-annual variability (seasonality) in the foraminiferal Mg/Ca and
δ18Oc. At Cariaco Basin, for instance, a sediment trap study indicates that this species registers
annual mean SST (Tedesco et al., 2007). Thus, in order to determine if G. ruber (pink) reflects
mean annual, summer or winter conditions and since there are no sediment trap data for the
S/SE Brazilian continental margin, we compared modern G.ruber (pink) δ18O based temperature
estimates with the mean temperature of the first 50m of the water column taken from the World
Ocean Atlas 2009. For this, modern G. ruber (pink) calcification temperature estimates were
obtained by applying the equation for G. ruber set by Mulitza et al. (2003) (Eq. 6) to coretop
δ18Oc values obtained, between 20.5° and 36.5°S and 53.4° to 37°W, for G. ruber (pink) by
Chiessi et al. (2007). The δ18Ow values were extracted from the global gridded data set of
LeGrande and Schmidt (2006) and scaled to VPDB by subtracting 0.27‰ (Hut, 1987). As
shown in Figure 46, it is possible to assume that in the S/SE Brazilian margin, G. ruber (pink)
reflects mean annual to summer conditions.
As the oxygen isotopic composition of marine carbonates is a function of temperature
and salinity (Mulitza et al., 2003) we chose to compare the G. ruber (pink) δ18Oc data with an
alkenone3 (Uk’37 index) based sea surface temperature curve from a core collected in the vicinity
of our core (core 7606, 26°59′ S/48°4′ W/60 m water depth) from Bicego (2008), the only
available for the region, in order to evaluate relative changes in salinity that might have
3 SST reconstructions can be obtained by measuring the unsaturation ratio of long-chain (C37, C38, C39), methyl and
ethyl ketones compounds found in marine sediments, known collectively as ‘alkenones’, are biomarkers of specific
haptophyte algae, such as the coccolithophorid Emiliania huxleyi (Brassell,1993).
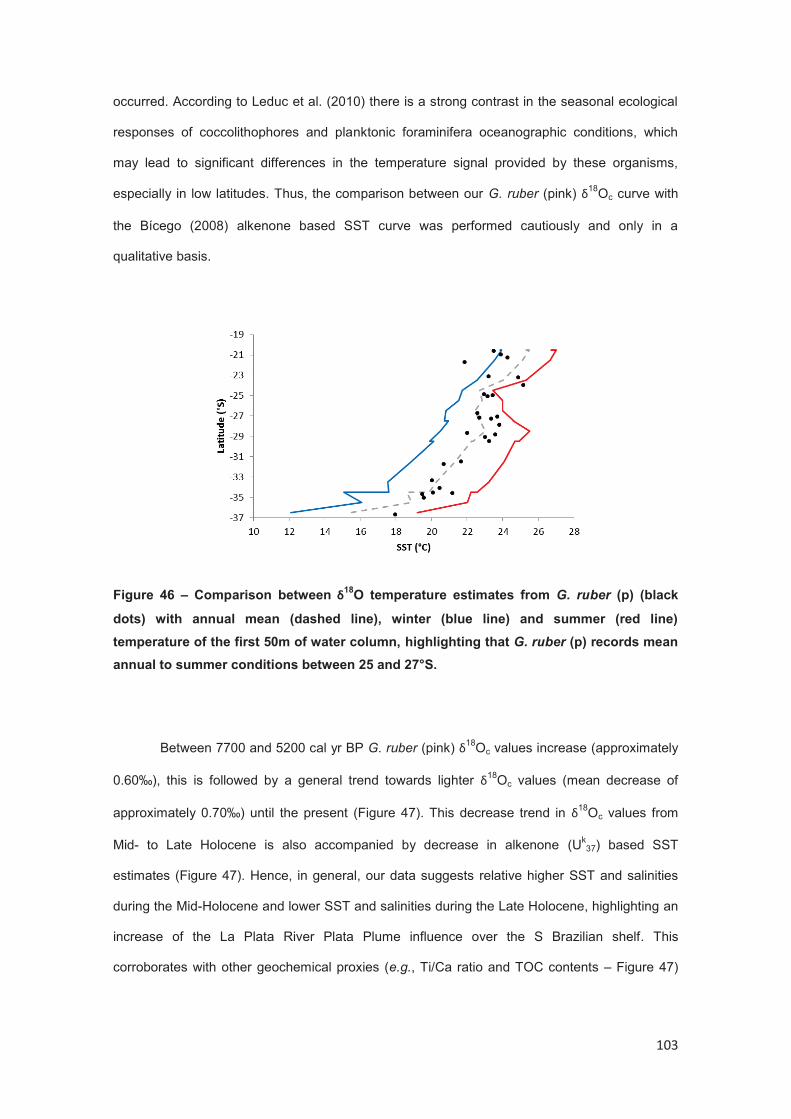
103
occurred. According to Leduc et al. (2010) there is a strong contrast in the seasonal ecological
responses of coccolithophores and planktonic foraminifera oceanographic conditions, which
may lead to significant differences in the temperature signal provided by these organisms,
especially in low latitudes. Thus, the comparison between our G. ruber (pink) δ18Oc curve with
the Bícego (2008) alkenone based SST curve was performed cautiously and only in a
qualitative basis.
Figure 46 – Comparison between δ18
O temperature estimates from G. ruber (p) (black
dots) with annual mean (dashed line), winter (blue line) and summer (red line)
temperature of the first 50m of water column, highlighting that G. ruber (p) records mean
annual to summer conditions between 25 and 27°S.
Between 7700 and 5200 cal yr BP G. ruber (pink) δ18Oc values increase (approximately
0.60‰), this is followed by a general trend towards lighter δ18Oc values (mean decrease of
approximately 0.70‰) until the present (Figure 47). This decrease trend in δ18Oc values from
Mid- to Late Holocene is also accompanied by decrease in alkenone (Uk37) based SST
estimates (Figure 47). Hence, in general, our data suggests relative higher SST and salinities
during the Mid-Holocene and lower SST and salinities during the Late Holocene, highlighting an
increase of the La Plata River Plata Plume influence over the S Brazilian shelf. This
corroborates with other geochemical proxies (e.g., Ti/Ca ratio and TOC contents – Figure 47)
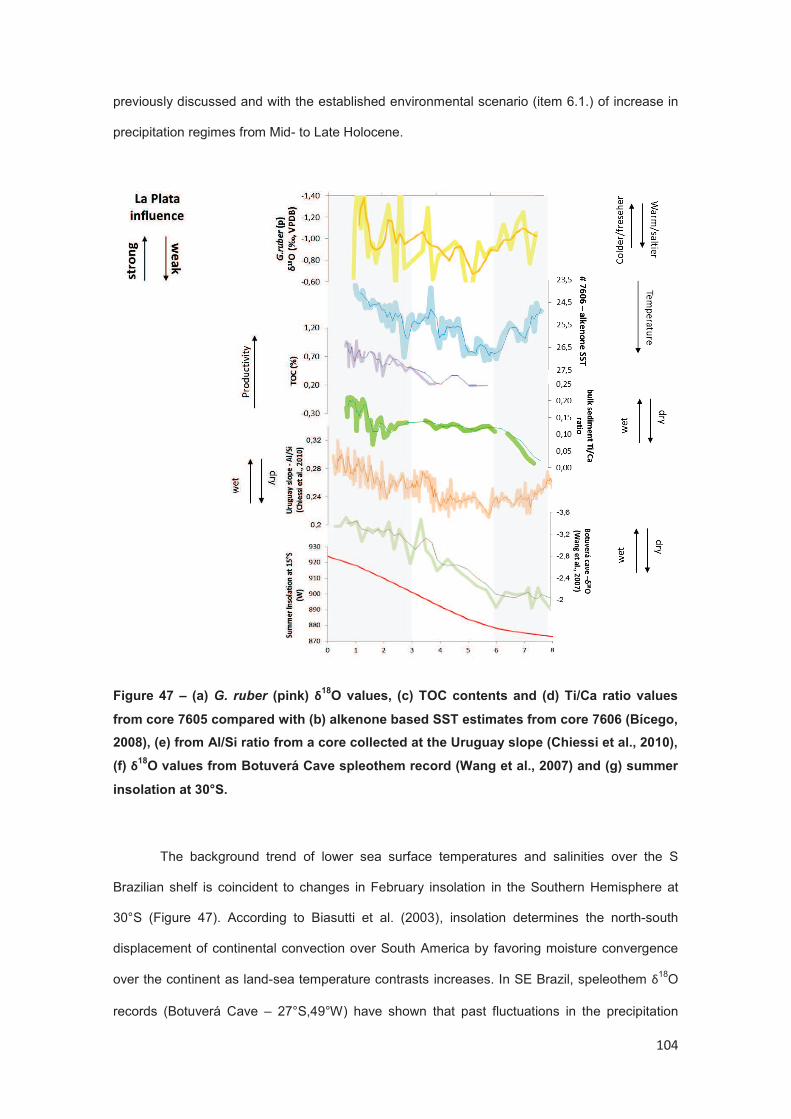
104
previously discussed and with the established environmental scenario (item 6.1.) of increase in
precipitation regimes from Mid- to Late Holocene.
Figure 47 – (a) G. ruber (pink) δ18
O values, (c) TOC contents and (d) Ti/Ca ratio values
from core 7605 compared with (b) alkenone based SST estimates from core 7606 (Bícego,
2008), (e) from Al/Si ratio from a core collected at the Uruguay slope (Chiessi et al., 2010),
(f) δ18
O values from Botuverá Cave spleothem record (Wang et al., 2007) and (g) summer
insolation at 30°S.
The background trend of lower sea surface temperatures and salinities over the S
Brazilian shelf is coincident to changes in February insolation in the Southern Hemisphere at
30°S (Figure 47). According to Biasutti et al. (2003), insolation determines the north-south
displacement of continental convection over South America by favoring moisture convergence
over the continent as land-sea temperature contrasts increases. In SE Brazil, speleothem δ18O
records (Botuverá Cave – 27°S,49°W) have shown that past fluctuations in the precipitation

105
regime over SE South America, related to the SASM and SACZ, were dominated by changes in
insolation (Cruz et al., 2005; Wang et al., 2006, 2007).
Mid-Holocene paleoenvironmental and paleoclimatic records from the S/SE Brazil
suggest the presence of relatively drier climatic conditions during this period (e.g., Behling,
1995; Ledru et al., 2009; Pessenda et al., 2004, Figure 48) and portrait the Late Holocene as
marked by the gradual increase of moisture until the establishment of the modern (e.g., Ledru,
1993, Ledru et al., 1998, 2009; Behling et al., 2004, 2005) (Figure 48). The reported changes in
precipitation or moisture conditions over S/SE Brazil were a consequence of the SH insolation
increase through the Mid- and Late Holocene that lead to the southward displacement of the
ITCZ and, consequently, to an overall increase in precipitation regimes due to the strengthening
of the SASM and SACZ (Cruz et al., 2005; Wang et al., 2006, 2007; Melo and Marengo, 2008
among others).
Figure 48 - Spatial distribution of precipitation anomalies between HT and HM (HM-HT)
based on 61 proxy-records from SE South America. Positive anomalies are represented
as blue dots (HM wetter than HT) and negative anomalies as red (HM drier than HT), the
orange dot indicating that the HT presented dry and wet episodes.
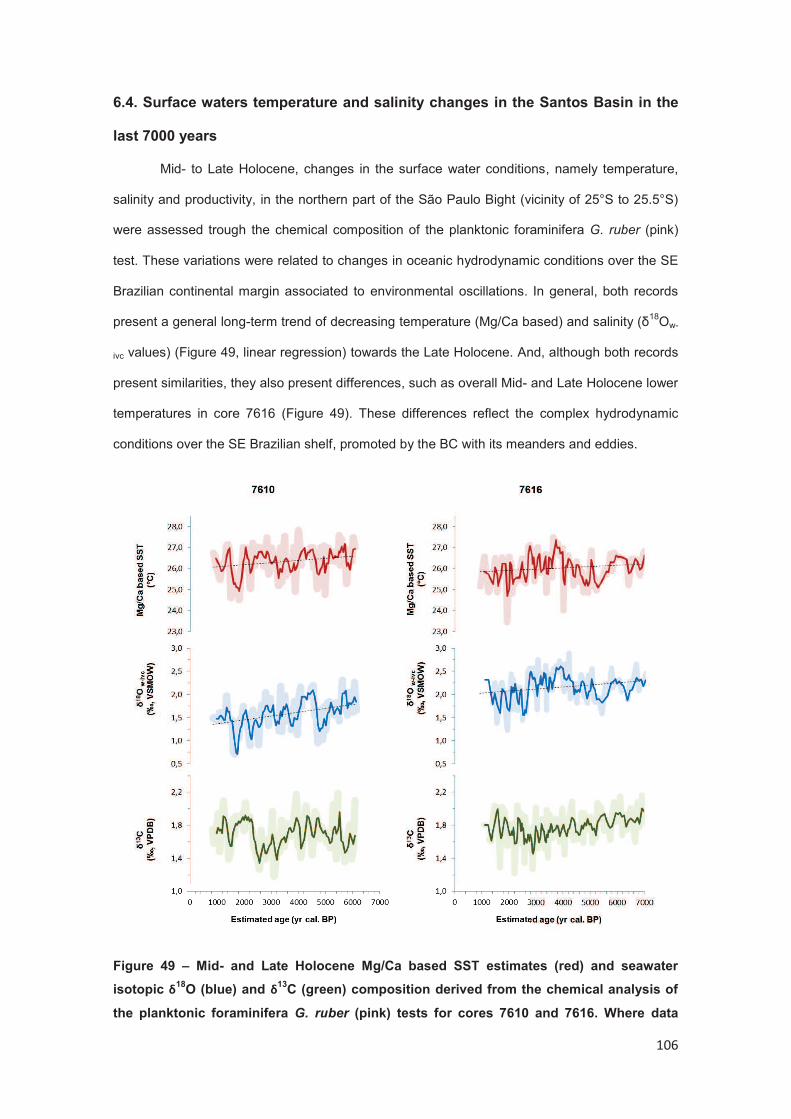
106
6.4. Surface waters temperature and salinity changes in the Santos Basin in the
last 7000 years
Mid- to Late Holocene, changes in the surface water conditions, namely temperature,
salinity and productivity, in the northern part of the São Paulo Bight (vicinity of 25°S to 25.5°S)
were assessed trough the chemical composition of the planktonic foraminifera G. ruber (pink)
test. These variations were related to changes in oceanic hydrodynamic conditions over the SE
Brazilian continental margin associated to environmental oscillations. In general, both records
present a general long-term trend of decreasing temperature (Mg/Ca based) and salinity (δ18Ow-
ivc values) (Figure 49, linear regression) towards the Late Holocene. And, although both records
present similarities, they also present differences, such as overall Mid- and Late Holocene lower
temperatures in core 7616 (Figure 49). These differences reflect the complex hydrodynamic
conditions over the SE Brazilian shelf, promoted by the BC with its meanders and eddies.
Figure 49 – Mid- and Late Holocene Mg/Ca based SST estimates (red) and seawater
isotopic δ18
O (blue) and δ13
C (green) composition derived from the chemical analysis of
the planktonic foraminifera G. ruber (pink) tests for cores 7610 and 7616. Where data

107
variation (shaded lines); 3 point moving average (bold lines); and significant linear
regression (dashed lines).
As similarities, both cores presented two periods with relatively lower temperature
(Mg/Ca based) and salinity (δ18Ow-ivc values), and higher primary productivity (δ
13C values)
approximately between 5500 and 4800 yr cal. BP and after ~2800 cal yrs BP, intercalated with a
period of relatively warmer and more saline waters are predominant between 4800 and ~2600
cal yrs BP, relatively higher primary productivity is observed until 3500 cal yrs BP, with
subsequent decrease in δ13C values until ~2600 cal yrs BP (Figure 49). The warmer periods
present a small lower temperature incursion between 3400 and 3200 yr cal. BP, however this is
not clearly reflected in salinity or primary productivity (Figure 49). As the similarities between the
records exceed the differences we chose to do evaluate the Mid- and Late Holocene changes
through the stacked record of both cores, which also provides a broader picture (a regional
signal) of the Mid- to Late Holocene environmental conditions over the SE Brazilian shelf
(Figure 50). The stacked record was obtained by averaging the detrended records; interpolation
was done using the largest time interval spacing found in the records (= 60 years).
G. ruber (pink) represents mean annual to summer conditions (Figure 46), hence during
Mid-Holocene the presence of colder (low Mg/Ca based temperature) and fresher (lower δ18Ow-
ivc values) waters over the shelf reflects shelf penetration of the colder and less saline waters
over the S/SE Brazilian shelf and SACW, also promoting higher primary productivity of surface
waters (higher δ13C values). Nowadays, SACW slope waters penetration into the SE Brazilian
shelf occurs mainly during the summer months, modulated, primarily, by wind pattern (N/NE
winds) and, secondarily, by the onshore intrusions of the BC (Castelão et al., 2004; Palma and
Matano, 2009). As a common feature associated to the SACW penetration into the shelf
enhancement of surface waters primary productivity is observed (Brandini, 1990), as shown by
higher δ13C values associated with lower temperatures. The fact that core 7616 presented
overall colder temperatures than core 7610 also highlights the presence of SACW as, according
to Palma and Matano (2009), the northernmost part of the São Paulo Bight is generally colder
due to shelf-break upwelling.

108
Meanwhile, for the Late Holocene, previously discussed geochemical and microfaunal
proxies have shown that the northernmost part of the SE Brazilian shelf has also been
influenced by La Plata River Plume waters. The northward extension of the colder and less
saline waters of the La Plata River over the S/SE Brazilian shelf is a predominantly winter
phenomena (Möller et al., 2008; Piola et al., 2008) also leading to enhancement in surface
waters primary productivity (Ciotti et al., 1995). Simultaneously, sedimentary organic matter
parameters and microfaunal proxies point to the presence of labile organic matter production
and availability derived from marine nutrient source. Additionally, Nagai et al. (2009) and
Mahiques (unpublished data) also found increase in upwelling events in the Cabo Frio (23°S)
area due to SACW shelf penetration as a consequence of stronger and more persistent NE
winds during summer. Thus, during the Late Holocene, it is reasonable to assume that the
presence of colder and less saline waters over the shelf reflects both the presence of the La
Plata River Plume and the penetration of the SACW in the shelf.
The long-term trend of decreasing temperature and salinity towards the Late Holocene
(Figure 49) follows the increase in austral summer insolation over the Southern Hemisphere
promoting a southward shift of the ITCZ (see Figure 18 of Wanner et al., 2008). The southward
displacement of the ITCZ lead to an overall increase in precipitation regimes due to the
strengthening of the SASM and SACZ (Cruz et al., 2005; Wang et al., 2006; Chiessi et al., 2010
among others), also favoring predominantly NE winds in the study area, by promoting a
westward enhancement of the South Atlantic High (Lenters and Cook, 1999), and, hence,
resulting in an overall Late Holocene with higher La Plata River Plume and SACW shelf
penetration in the SE Brazilian margin. Superimposed to this long-term trend, however, an
alternation between periods with relatively higher SACW shelf penetration (i.e., lower Mg/Ca
based temperature, between 5500 and 4800 yr cal. BP and after ~2800 yr cal. BP) and smaller
SACW shelf penetration (i.e., higher Mg/Ca based temperature, 5500-4800 and ~2800 yr cal.
BP) with abrupt contacts seems to reflect multicentennial-scale changes (Figure 50).
During the Holocene, other proxy based records have shown the occurrence of
multicentennial-scale changes in oceanographic and climatic conditions fluctuating between

109
Figure 50 – Stacked Mg/Ca based temperature (°C), δ18
Ow-ivc and δ13
C records of the
cores obtained by averaging the detrended records; interpolation was done using the
largest time interval spacing found in the records (= 60 years). Periods with above mean
values are painted in red and with below mean values in blue.
warm and cold, and humid and arid states (Wanner et al., 2011 and references therein). The
transitions between these climatic fluctuations happened in a rapid fashion, also called as ‘rapid
climate changes’4 (Mayewski et al., 2004). And have been mostly represented in records
concentrated in the Northern Hemisphere - NH (e.g. Bond et al., 1997, 2001; Came et al., 2007;
4 Mayewshi et al. (2004) applied the term ‘rapid climate change’ (RCC) for the intervals of climate change (9000–8000,
6000–5000, 4200–3800, 3500–2500, 1200–1000, and 600–150 yr cal. BP) sufficiently fast from the point of view of
human civilization (i.e., a few hundred years and shorter). This term, however, does not imply that these changes are
comparable in magnitude or rapidity to the abrupt climate changes of the Last Glacial period.

110
DeMenocal et al., 2000; Lea et al., 2003; Oppo et al., 2003; Weldeab et al., 2011 among
others). Nevertheless, Holocene multicentennial-scale changes have also been reported for the
Southern Hemisphere - SH (e.g. Arz et al., 2001; Gyllencreutz et al., 2010; Mahiques et al.,
2009; Stríkis et al., 2011). The dynamical triggering mechanisms responsible for these events,
however, are still under discussion. The most reported mechanisms are changes in solar
activity, in the dynamics of deep-water flow, and in the Atlantic Meridional Oceanic Circulation
(AMOC) or teleconnections with the Indo-Pacific sea surface temperatures (SST), ENSO and
the Asian monsoon systems (for a more detailed review see Wanner et al., 2011).
The NH experienced four major cold periods, during Mid- and Late Holocene, with
peaks at 1400, 2800, 4200 and 5900 yr cal. BP denominated Bond events5, sequentially
numbered, after the works of Bond et al. (1997; 2001). These events are consistent with glacier
fluctuations and overall colder conditions in the NH extra-tropical area (Wanner et al., 2011), in
the SH, however, a high spatiotemporal variability of temperature and humidity/precipitation
exists, mainly due to differences in the sensitivity of different proxies (Mayewski et al., 2004;
Wanner et al., 2011). Our records, for example, present different responses for Bond events 4
and 2, in the first, SACW shelf penetration is highlighted by colder SST, lower salinity and
higher surface waters primary productivity; whereas for Bond event 2 proxies point to opposite
conditions. Mayweski et al (2004) also observed diverging conditions between RCC that
occurred between 6000–5000 and 3500– 2500 yr cal. BP, especially in the SH. And Wanner et
al. (2011) found a variable and complex global pattern for the cool event that occurred between
3300 and 2500 yr BP which corresponds with Bond event 2. A different response to Bond
events has also been observed by Stríkis et al. (2011) in a speleothem record over central
Brazil (Lapa Grande, 14°25’S; 44°21’W), these authors found increased precipitation coherent
with Bond events 4 and 2, but no precipitation response for Bond events 1 and 3. Interestingly,
following the end of Bond events our record shows similar responses, to shifts in the
environmental conditions.
5 Based on studies of ice rafted debris (IRD) in the North Atlantic Ocean Bond et al. (1997, 2001) postulated the
existence of a 1500 years cycle characterized as series of shifts in ocean surface hydrography during which drift ice and
cooler surface waters in the Nordic and Labrador Seas were repeatedly advected southward and eastward, promoting
overall cold conditions over the Northern Hemisphere. In total nine Bond cycles were detected during the Holocene, with
peaks at about 1400, 2800, 4200, 5900, 8100, 9400, 10300, and 11100 years ago (Bond et al., 1997; 2001).
111
According to Oppo et al. (2003) Holocene Bond event 4 was accompanied by significant
reduction in the North Atlantic Deep Water (NADW) production. Numerical simulations show
that an AMOC slowdown would promote an anomalous southward ITCZ displacement,
increasing northeasterly trades (Zhang and Delworth, 2005; Chiang et al., 2008). As a result of
the reorganization of the ocean-atmospheric system, negative (positive) SST anomalies would
be observed in the North (Tropical) Atlantic (subpolar North Atlantic - Came et al., 2007 and
Farmer et al., 2008; Cariaco Basin - Lea et al., 2003; NE Brazil - Weldeab et al., 2006; and NW
Africa Weldeab et al., 2011) (Figure 51) While there is still some debate over the magnitude of
the AMOC changes during the Holocene (e.g. Lynch-Stieglitz et al., 2009) the overall scenario
observed in Figure 51 appears to be consistent with AMOC slowdown during Bond event 4. In
addition, 231Pa/231Th in the subtropical North Atlantic (McManus et al., 2004) and a decrease of
northern sourced water mass over the Southern portion of the Brazilian margin (27°S, 1200 m -
Came et al., 2008) point to decrease in AMOC.
In the SH, this colder period also corresponds to higher precipitation (SASM increase)
over central Brazil found by Stríkis et al. (2011, Figure 51). These authors reported differences
in inter-hemispheric monsoonal systems responses during the Holocene, proposing that the
abrupt events observed would be a result of a slowdown of the AMOC associated with
freshwater pulses in the North Atlantic, potentially influenced by feedback processes such as El-
Niño like events. In a more recent work Cheng et al. (2012) taking into account that during the
Holocene rather small in amplitude solar radiation variability occurred hypothesized that an
amplifying mechanism would be necessary to trigger worldwide climate change, such as ENSO
events. The presence of an amplifying mechanism and/or a feedback process would explain the
different responses recorded as a consequence of Mid- and Late Holocene AMOC changes.
Even though the teleconnection dynamics between ENSO and SW Atlantic SSTs is not
fully understood, we might consider ENSO as a possible amplifying mechanism. As this feature
plays a major role in the climate variability over South America (see Garreaud et al., 2009).
Furthermore, El-Niño events promote positive anomalies in the precipitation over South America
with associated negative SST anomalies in SE Brazil coast during summer (Grimm, 2003).
Higher occurrence and intensification of ENSO events simultaneously to both of our colder
periods has been observed in proxy based records from S Ecuador (Moy et al., 2002) and from
112
the East Equatorial Pacific (Marchitto et al., 2010). However, recent works point only to increase
in ENSO variability in the last 3000 years, emphasizing a ‘damped ENSO’ state for the Mid-
Holocene (e.g., Koutavas and Joanides, 2012). Nevertheless, we propose that ENSO might
have been the acting amplifying mechanism in the colder period observed in our record after
2800 yr cal. BP; however, insight of the new information it cannot be considered as a possible
mechanism for the colder period centered at 5500 yr cal. BP and alternative mechanisms have
to be explored.
The comparison between the SST obtained from our record and SST obtained in
marine records from NE Brazil (Weldeab et al., 2006) and NW African (Weldeab et al., 2011)
(Figure 51), highlights the presence of the South Atlantic dipole6 in its positive phase, during
Mid-Holocene colder periods. According to Haarsma et al. (2003), during the positive phase of
the South Atlantic dipole the ITCZ experiences a southward displacement. Hence, this feature
may be an alternative positive feedback mechanism for the Mid-Holocene colder period
observed in our records, as it that would also enhance ITCZ southward displacement during
AMOC slowdown periods.
Other triggering and amplifying mechanisms have been proposed to explain the abrupt
environmental shifts observed during the Holocene, such as the desertification of the Sahara
(e.g., deMenocal et al., 2000; Muschitiello et al., 2013) and sea-ice expansion over the circum-
Antartic (e.g., Kim et al., 2003). Still, we are far from fully understanding the causes of past
climate events, to accomplish this knowledge of the spatial and phase relationships between
different paleoenvironmental records is requiered. As the climatic system presents a single
resulting response to innumerous variables, detangling forcing changes and the modes of
variability is neither simple nor easy.
6 The South Atlantic dipole is the dominant mode of atmosphere– ocean coupled variability over the South Atlantic,
acting over the tropical and extratropical South Atlantic (e.g. Venegas et al., 1997; Sterl and Hazeleger, 2003). This
dipole pattern is related to the variability of the South Atlantic Subtropical High (Haarsma et al., 2003), which influences
low level atmospheric circulation and forces SST fluctuations in a north–south dipole structure (Venegas et al. 1997).
When the equatorward pole has positive SST anomalies the dipole is called positive (Haarsma et al., 2003)

113
Figure 51 – Comparison between our (g) stacked record of Mg/Ca based SST (°C) for the
SW Atlantic and (f) South America Summer Monsoon precipitation changes recorded by
a δ18
O from a speleothem from Central Brazil (Stiriks et al., 2012); (e) Mg/Ca based SST
(°C) for the E Equatorial Atlantic (Weldeab et al., 2005); (d) Mg/Ca based SST (°C) for the
W Equatorial Atlantic (Lea et al., 2003); (c) frequency of El-Niño events per 100 years
(Moy et al., 2002); (b) North Atlantic Deep Water – NADW - variations recorded by δ13
C in
C. wuellerstorfi tests (Oppo et al., 2004); and (a) percentages of HSG in the N Atlantic
marking Bonds events also marked in blue numbered (Bond et al., 2001).

114
7. Summary and conclusions
In this study a multi-proxy approach was applied in three high resolution marine
sedimentary cores collected along the S/SE Brazilian continental shelf, between 27° and 25°S,
in order to better understand the Mid- and Late Holocene evolution of this part of the Brazilian
margin and the oceanographic and climatic mechanisms that promoted these
paleoenvironmental and paleoproductivity changes.
The depositional processes of the S/SE Brazilian margin were submitted to two different
oceanographic controls during Mid-Holocene. In the vicinity of 27°S La Plata River derived
sediments were brought by the northward penetration of the La Plata River Plume. Meanwhile,
in the northernmost part of the Santos Basin the high energetic Brazil Current onshore/offshore
movements brought SE Brazilian derived sediments. In the Late Holocene, especially after 3000
yr cal. BP, La Plata River derived sediments reached up to 25°S, highlighting a stronger
influence of the La Plata River over the S/SE Brazilian shelf due to increase in precipitation over
the La Plata River drainage basin.
As the La Plata River influence over the S/SE Brazilian shelf increased, bringing its
colder and less saline waters during the Late Holocene, the oligotrophic waters of the shelf were
fertilized by the La Plata River Plume waters, promoting enhancement of surface waters primary
productivity and, consequently, organic carbon flux to the seafloor. The benthic foraminifera
assemblages responded to the seasonal input increase of organic matter, as shown by the
increase in opportunistic species. In the vicinity of 25°S, surface waters primary productivity was
also enhanced by increase in colder and less saline SACW shelf penetration.
A general trend of lower temperature and salinities observed in the geochemical
composition of planktonic foraminifera tests corroborates to a stronger influence of the La Plata
River Plume waters followed the summer insolation at 30°S, in accordance to other proxy
records and numerical models for SE South America. As insolation increased through Mid- and
Late Holocene the southward displacement of the ITCZ promoted enhancement of the
SASM/SACZ and, consequently, precipitation increase over the La Plata River drainage basin
and intensification of the NE winds derived from the SAH. In the northernmost part of Santos
Basin, superimposed to the general background trend, two major temperature and salinity

115
negative incursions with abrupt contacts centered at 5500 yr cal. BP and after 2800 yr cal. BP
highlight multi-centennial scale changes, possibly related to SACW shelf penetrations due to
persistent NE winds. These changes occurred simultaneously to rapid climatic events at
regional and global spatial scale. AMOC slowdown events, mediated by amplifying
mechanisms, is the proposed triggering mechanism for the changes observed in the SE
Brazilian shelf records as it promotes southward shifts of the ITCZ. As amplifying mechanisms
may have changed throughout time and as atmospheric teleconnections are not yet fully
understood we hypothesize that different modes of climatic variability, such as ENSO and the
South Atlantic dipole, may have acted as mediators.
Based on the data obtained we present the following conclusions:
! Mid- to Late Holocene S/SE Brazilian shelf environmental (depositional and
oceanographic processes) conditions were influenced by two different hydrodynamic controls,
the onshore/offshore movements of the BC and the La Plata River Plume northward
penetration;
! the La Plata River has been the main source of fine sediments to the S/SE Brazilian
shelf up to 27°S since the Mid-Holocene and to northern latitudes up to 25°S since the Late
Holocene;
! after 3000 yr cal. BP, insolation driven precipitation increase over the La Plata River
drainage basin promoted a northward extension of the La Plata River plume waters influence
over the S/SE Brazilian shelf;
! a stronger La Plata River influence over S/SE Brazilian shelf and SACW shelf
penetration, during the Late Holocene, promoted enhancement of surface waters productivity
and its export to the seafloor, affecting benthic communities;
! in the vicinity of 25°S two major temperature and salinity negative incursions, centered
at at 5500 yr cal. BP and after 2800 yr cal. BP, occurred as a result of SACW shelf penetrations
due to persistent NE winds;
! These multi-centennial scale changes occurred simultaneously to rapid climatic events
in the NH and SH, as a result of a southward shift of the ITCZ in response to AMOC slowdown
events mediated by amplifying mechanisms, such as ENSO and the South Atlantic dipole.

116
8. References
ADKINS, J. F.; MCINTYRE, K.; SCHRAG, D. P. The salinity, temperature, and delta O-
18 of the glacial deep ocean. Science, v. 298, n. 5599, p. 1769-1773 2002.
ALVE, E.; NAGY, J. Estuarine Foraminiferal Distribution in Sandebukta, a Branch of the
Oslo Fjord. Journal of Foraminiferal Research, v. 16, n. 4, p. 261-284 1986.
ANAND, P.; ELDERFIELD, H.; CONTE, M. H. Calibration of Mg/Ca thermometry in
planktonic foraminifera from a sediment trap time series. Paleoceanography, v. 18, n. 2, 2003.
ANDREWS, J. T.; HARDADOTTIR, J.; STONER, J. S.; MANN, M. E.;
KRISTJANSDOTTIR, G. B.; KOC, N. Decadal to millennial-scale periodicities in North Iceland
shelf sediments over the last 12000 cal yr: long-term North Atlantic oceanographic variability
and solar forcing. Earth and Planetary Science Letters, v. 210, n. 3-4, p. 453-465 2003.
ANGULO, R. A.; LESSA, G. C.; SOUZA, M. C. A critical review of mid- to late-Holocene
sea-level fluctuations on the eastern Brazilian coastline. Quaternary Science Reviews, v. 25,
p. 486-506 2006.
ANGULO, R. A.; SOUZA, M. C.; REIMER, P. J.; SASAOKA, S. K. Reservoir effect of
the southern and southeastern Brazilian coast. Radiocarbon, v. 47, p. 67-73 2005.
AQUINO, F. E.; SETZER, A. O clima da Amazzônia Azul. In: SERAFIM, C. F. S. e
CHAVES, P. T. (Ed.). Geografia: ensino fundamental e ensino médio: o mar no espaço
geográfico brasileiro. Brasília: Ministério da Educação, v.8, 2006. cap. 226-230,
ARAÚJO, A. G. M.; NEVES, W. A.; PILÓ, L. B.; ATUI, J. P. V. Holocene dryness and
human occupation in Brazil during the ‘‘Archaic Gap”. Quaternary Research, v. 64, p. 298-307
2005.
ARZ, H. W.; GERHARDT, S.; PATZOLD, J.; ROHL, U. Millennial-scale changes of
surface- and deep-water flow in the western tropical Atlantic linked to Northern Hemisphere
high-latitude climate during the Holocene. Geology, v. 29, n. 3, p. 239-242 2001.
ARZ, H. W.; PATZOLD, J.; WEFER, G. Correlated millennial-scale changes in surface
hydrography and terrigenous sediment yield inferred from last-glacial marine deposits off
northeastern Brazil. Quaternary Research, v. 50, n. 2, p. 157-166 1998.
BARBOSA, V. P. Foraminíferos Bentônicos Quaternários do Talude Continental da
Bacia de Santos: Sistemática, Paleobatimetria e Paleoecologia. 1998. 427 (PhD thesis).
Instituto de Geociências, Universidade Federal do Rio Grande do Sul, São Paulo.
BARKER, S.; GREAVES, M.; ELDERFIELD, H. A study of cleaning procedures used for
foraminiferal Mg/Ca paleothermometry. Geochemistry Geophysics Geosystems, v. 4, 2003.

117
BARROS, V.; GONZALEZ, M.; LIEBMANN, B.; CAMILLONI, I. A. Influence of the South
Atlantic convergence zone and South Atlantic Sea surface temperature on interannual summer
rainfall variability in Southeastern South America. Theoretical and Applied Climatology, v. 67,
p. 123-133 2000.
BAYON, G.; BOELLA, G. R. M.; MILTON, J. A.; TAYLOR, R. N.; NESBITT, R. W. An
improved method for extracting marine sediment fractions and its application to Sr and Nd
isotopic analysis. Chemical Geology, v. 187, p. 179-199 2002.
BEHLING, H. A High-Resolution Holocene Pollen Record from Lago Do Pires, Se Brazil
- Vegetation, Climate and Fire History. Journal of Paleolimnology, v. 14, n. 3, p. 253-268
1995.
______. South and southeast Brazilian grasslands during Late Quaternary times: a
synthesis. Palaeogeography Palaeoclimatology Palaeoecology, v. 177, n. 1-2, p. 19-27
2002.
BEHLING, H.; COHEN, M. C. L.; LARA, R. J. Late Holocene mangrove dynamics of
Marajo Island in Amazonia, northern Brazil. Vegetation History and Archaeobotany, v. 13, n.
2, p. 73-80 2004.
BEHLING, H.; PILLAR, V. D.; BAUERMANN, S. G. Late Quaternary grassland
(Campos), gallery forest, fire and climate dynamics, studied by pollen, charcoal and multivariate
analysis of the Sao Francisco de Assis core in western Rio Grande do Sul (southern Brazil).
Review of Palaeobotany and Palynology, v. 133, n. 3-4, p. 235-248 2005.
BERNHARD, J. M. Characteristic Assemblages and Morphologies of Benthic
Foraminifera from Anoxic, Organic-Rich Deposits - Jurassic through Holocene. Journal of
Foraminiferal Research, v. 16, n. 3, p. 207-215 1986.
BIANCHI, G. G.; MCCAVE, I. N. Holocene periodicity in North Atlantic climate and
deep-ocean flow south of Iceland. Nature, v. 397, n. 6719, p. 515-517 1999.
BIASUTTI, M.; BATTISTI, D. S.; SARACHIK, E. S. The annual cycle over the tropical
Atlantic, South America, and Africa. Journal of Climate, v. 16, n. 15, p. 2491-2508 2003.
BÍCEGO, M. C. Reconstrução Paleoceanográfica dos últimos 7500 anos na
Plataforma Continental do Atlântico Sudoeste Baseada em Marcadores Geoquímicos
Orgânicos. 2008. (Livre-docência thesis). Instituto Oceanográfico, Universidade de São Paulo,
São Paulo.
BISCAYE, P. E. Mineralogy and Sedimentation of Recent Deep-Sea Clay in Atlantic
Ocean and Adjacent Seas and Oceans. Geological Society of America Bulletin, v. 76, n. 7,
p. 803-805 1965.

118
BOLTOVSKOY, E. Foraminíferos recientes. Biología, métodos de estudio,
aplicación oceanografica. Buenos Aires: Eudeba Editorial Universitaria de Buenos Aires,
1965. 510.
BOLTOVSKOY, E.; SCOTT, D. B.; MEDIOLI, F. S. Morphological variations of benthic
foraminiferal tests in response to changes in ecological parametres: a review. Journal of
Paleontology, v. 65, n. 2, p. 175-185 1991.
BOND, G.; KROMER, B.; BEER, J.; MUSCHELER, R.; EVANS, M. N.; SHOWERS, W.;
HOFFMANN, S.; LOTTI-BOND, R.; HAJDAS, I.; BONANI, G. Persistent solar influence on north
Atlantic climate during the Holocene. Science, v. 294, n. 5549, p. 2130-2136 2001.
BOND, G.; SHOWERS, W.; CHESEBY, M.; LOTTI, R.; ALMASI, P.; DEMENOCAL, P.;
PRIORE, P.; CULLEN, H.; HAJDAS, I.; BONANI, G. A pervasive millennial-scale cycle in North
Atlantic Holocene and glacial climates. Science, v. 278, n. 5341, p. 1257-1266 1997.
BRACCO, R.; DEL PUERTO, L.; INDA, H.; PANARIO, D.; CASTINEIRA, C.; GARCIA-
RODRIGUEZ, F. The relationship between emergence of mound builders in SE Uruguay and
climate change inferred from opal phytolith records. Quaternary International, v. 245, n. 1, p.
62-73 2011.
BRANDINI, F. P. Hydrography and Characteristics of the Phytoplankton in Shelf and
Oceanic Waters Off Southeastern Brazil during Winter (July August 1982) and Summer
(February March 1984). Hydrobiologia, v. 196, n. 2, p. 111-148 1990.
BRASSELL, S. C. Applications of biomarkers for delineating marine paleoclimate
fluctuations during the Quaternary. In: ENGEL, M. H. e MACKO, S. A. (Ed.). Organic
Geochemistry. New York: Plenum, 1993. p.699-738.
BURONE, L. Foraminíferos bentônicos e parâmetros físico-químicos da Enseada
de Ubatuba, São Paulo: estudo ecológico em uma área com poluição orgânica. 2002.
(PhD thesis). Instituto Oceanográfico, Univesidade de São Paulo, São Paulo.
BURONE, L.; ORTEGA, L.; FRANCO-FRAGUAS, P.; MAHIQUES, M.; GARCÍA-
RODRIGUEZ, F.; VENTURINI, N.; MARIN, Y.; BRUGNOLI, E.; NAGAI, R.; MUNIZ, P.;
BÍCEGO, M.; FIGUEIRA, R.; SALAROLI, A. A multiproxy study between the Río de la Plata and
the adjacent South-western Atlantic inner shelf to assess the sediment footprint of river vs.
marine influence. Continental Shelf Research, in press.
BURONE, L.; PIRES-VANIN, A. M. S. Foraminiferal assemblages in Ubatuba Bay,
south-eastern Brazilian coast. Scientia Marina, v. 70, n. 2, p. 203-217 2006.
BURONE, L.; SOUSA, S. H. M.; MAHIQUES, M. M.; VALENTE, P.; CIOTTI, A.;
YAMASHITA, C. Benthic foraminiferal distribution on the southeastern Brazilian shelf and upper
slope. Marine Biology, v. 158, n. 1, p. 159-179 2010.

119
BURONE, L.; VALENTE, P.; PIRES-VANIN, A. M. S.; SOUSA, S. H. D. E.; MAHIQUES,
M. M.; BRAGA, E. Benthic foraminiferal variability on a monthly scale in a subtropical bay
moderately affected by urban sewage. Scientia Marina, v. 71, n. 4, p. 775-792 2007.
CAME, R. E.; EILER, J. M.; VEIZER, J.; AZMY, K.; BRAND, U.; WEIDMAN, C. R.
Coupling of surface temperatures and atmospheric CO2 concentrations during the Palaeozoic
era. Nature, v. 449, n. 7159, p. 198-U3 2007.
CAME, R. E.; OPPO, D. W.; CURRY, W. B.; LYNCH-STIEGLITZ, J. Deglacial variability
in the surface return flow of the Atlantic meridional overturning circulation. Paleoceanography,
v. 23, n. 1, 2008.
CAMPOS, E. J. D.; MULKHERJEE, S.; PIOLA, A. R.; DE CARVALHO, F. M. S. A note
on a mineralogical analysis of the sediments associated with the Plata River and Patos Lagoon
outflows. Continental Shelf Research, v. 28, n. 13, p. 1687-1691 2008.
CAMPOS, E. J. D.; PIOLA, A. R.; MATANO, R. P.; MILLER, J. L. PLATA: A synoptic
characterization of the southwest Atlantic shelf under influence of the Plata River and Patos
Lagoon outflows. Continental Shelf Research, v. 28, n. 13, p. 1551-1555 2008.
CAMPOS, E. J. D.; VELHOTE, D.; DA SILVEIRA, I. C. A. Shelf break upwelling driven
by Brazil Current cyclonic meanders. Geophysical Research Letters, v. 27, n. 6, p. 751-754
2000.
CASTELAO, R. M.; CAMPOS, E. J. D.; MILLER, J. L. A modelling study of coastal
upwelling driven by wind and meanders of the Brazil current. Journal of Coastal Research, v.
20, n. 3, p. 662-671 2004.
CASTRO, B. M.; BRANDINI, F. P.; PIRES-VANIN, A. M. S.; MIRANDA, L. B.
Multidisciplinary oceanographic processes on the western Atlantic continental shelf between
4°N and 34°S. In: ROBINSON, A. R. e BRINK, K. H. (Ed.). The Global Coastal Ocean:
Interdisciplinary Regional Studies and Syntheses, Pan-Regional Syntheses and the
Coasts of North and South America and Asia. Cambridge: Harvard University Press, v.14A,
2008. cap. 8,
CAVALLOTTO, J.; VIOLANTE, R. A.; PARKER, G. Sea-level fluctuations during the last
8600 years in the de la Plata river (Argentina). Quaternary International, v. 114, p. 155-165
2004.
CHANG, T. S.; FLEMMING, B. W.; BARTHOLOMA, A. Distinction between sortable silts
and aggregated particles in muddy intertidal sediments of the East Frisian Wadden Sea,
southern North Sea. Sedimentary Geology, v. 202, n. 3, p. 453-463 2007.

120
CHENG, H.; SINHA, A.; WANG, X.; CRUZ, F. W.; EDWARDS, R. L. The Global
Paleomonsoon as seen through speleothem records from Asia and the Americas. Climate
Dynamics, v. 39, n. 5, p. 1045-1062 2012.
CHIANG, J. C. H.; CHENG, W.; BITZ, C. M. Fast teleconnections to the tropical Atlantic
sector from Atlantic thermohaline adjustment. Geophysical Research Letters, v. 35, n. 7,
2008.
CHIESSI, C.; MULITZA, S.; PÄTZOLD, J.; WEFER, G. How different proxies record
precipitation variability over southeastern South America. IOP Conference Series: Earth and
Environmental Sciences, v. 9, n. 012007, p. 1-6 2010.
CHIESSI, C.; ULRICH, S.; MULITZA, S.; PATZOLD, J.; WEFER, G. SigNature of the
Brazil-Malvinas Confluence (Argentine Basin) in the isotopic composition of planktonic
foraminifera from surface sediments. Marine Micropaleontology, v. 64, n. 1-2, p. 52-66 2007.
CIOTTI, A. M.; ODEBRECHT, C.; FILLMANN, G.; MOLLER, O. O. Fresh-Water Outflow
and Subtropical Convergence Influence on Phytoplankton Biomass on the Southern Brazilian
Continental-Shelf. Continental Shelf Research, v. 15, n. 14, p. 1737-1756 1995.
CLAPPERTON, C. M. Quaternary Geology and Geomorphology of South America.
Amsterdam: Elsevier, 1993.
CLEROUX, C.; CORTIJO, E.; DUPLESSY, J. C.; ZAHN, R. Deep-dwelling foraminifera
as thermocline temperature recorders. Geochemistry Geophysics Geosystems, v. 8, 2007.
CONTRERAS-ROSALES, L. A.; KOHO, K. A.; DUIJNSTEE, I. A. P.; DE STIGTER, H.
C.; GARCIA, R.; KONING, E.; EPPING, E. Living deep-sea benthic foraminifera from the Cap
de Creus Canyon (western Mediterranean): Faunal-geochemical interactions. Deep-Sea
Research Part I, v. 64, p. 22-42 2012.
CORLISS, B. H. Response of Deep-Sea Benthonic Foraminifera to Development of the
Psychrosphere near the Eocene-Oligocene Boundary. Nature, v. 282, n. 5734, p. 63-65 1979.
______. Microhabitats of Benthic Foraminifera within Deep-Sea Sediments. Nature, v.
314, n. 6010, p. 435-438 1985.
______. Morphology and Microhabitat Preferences of Benthic Foraminifera from the
Northwest Atlantic-Ocean. Marine Micropaleontology, v. 17, n. 3-4, p. 195-236 1991.
CORLISS, B. H.; CHEN, C. Morphotype Patterns of Norwegian Sea Deep-Sea Benthic
Foraminifera and Ecological Implications. Geology, v. 16, n. 8, p. 716-719 1988.
CRUZ, F. W.; BURNS, S. J.; JERCINOVIC, M.; KARMANN, I.; SHARP, W. D.; VUILLE,
M. Evidence of rainfall variations in Southern Brazil from trace element ratios (Mg/Ca and

121
Sr/Ca) in a Late Pleistocene stalagmite. Geochimica Et Cosmochimica Acta, v. 71, n. 9, p.
2250-2263 2007.
CRUZ, F. W.; BURNS, S. J.; KARMANN, I.; SHARP, W. D.; VUILLE, M.; CARDOSO, A.
O.; FERRARI, J. A.; DIAS, P. L. S.; VIANA, O. Insolation-driven changes in atmospheric
circulation over the past 116,000 years in subtropical Brazil. Nature, v. 434, n. 7029, p. 63-66
2005.
DEBENAY, J. P.; REDOIS, F. Distribution of the twenty seven dominant species of shelf
benthic foraminifers on the continental shelf, north of Dakar (Senegal). Marine
Micropaleontology, v. 29, n. 3-4, p. 237-255 1997.
DEKENS, P. S.; LEA, D. W.; PAK, D. K.; SPERO, H. J. Core top calibration of Mg/Ca in
tropical foraminifera: Refining paleotemperature estimation. Geochemistry Geophysics
Geosystems, v. 3, 2002.
DEMENOCAL, P. Cultural responses to climate change during the Late Holocene.
Science, v. 292, n. 5517, p. 667-673 2001.
DEMENOCAL, P.; ORTIZ, J.; GUILDERSON, T.; ADKINS, J.; SARNTHEIN, M.;
BAKER, L.; YARUSINSKY, M. Abrupt onset and termination of the African Humid Period: rapid
climate responses to gradual insolation forcing. Quaternary Science Reviews, v. 19, n. 1-5, p.
347-361 2000.
DEPAOLO, D. J. Neodymium Isotope Geochemistry. An Introduction. Berlin:
Springer-Verlag, 1988.
DERIJK, S.; JORISSEN, F.; ROHLING, E. J.; TROELSTRA, S. R. Organic flux control
on bathymetric zonation of Mediterranean benthic foraminífera. Marine Micropaleontology, v.
40, p. 151-166 2000.
DIAS, J. M. A. A análise sedimentar e o conhecimento dos sistemas marinhos
(Uma introdução à Oceanografia Geológica) 2004.
DIAZ, A.; STUDZINSKI, C. D.; MECHOSO, C. R. Relationship between precipitation
anomalies in Uruguay and Southern Brazil and Sea Surface Temperature in the Pacific and
Atlantic Ocean. Journal of Climate, v. 11, p. 251-271 1998.
DOTTORI, M.; CASTRO, B. M. The response of the Sao Paulo Continental Shelf,
Brazil, to synoptic winds. Ocean Dynamics, v. 59, n. 4, p. 603-614 2009.
DRUMOND, A.; AMBRIZZI, T. The role of SST on the South American atmospheric
circulation during January, February and March 2001. Climate Dynamics, v. 24, n. 7-8, p. 781-
791 2005.

122
DRUMOND, A.; NIETO, R.; GIMENO, L.; AMBRIZZI, T. A Lagrangian identification of
major sources of moisture over Central Brazil and La Plata Basin. Journal of Geophysical
Research, v. 113, n. D14, 2008.
DUCHEMIN, G.; FONTANIER, C.; JORISSEN, F.; BARRAS, C.; GRIVEAUD, C. Living
small-sized (63-150um) formainifera from mid-shelf to mid-slope environmentas in the Bay of
Biscay. Journal of Foraminiferal Research, v. 37, n. 1, p. 12-32 2007.
DUPLESSY, J. C.; LABEYRIE, L.; JUILLETLECLERC, A.; MAITRE, F.; DUPRAT, J.;
SARNTHEIN, M. Surface Salinity Reconstruction of the North-Atlantic Ocean during the Last
Glacial Maximum. Oceanologica Acta, v. 14, n. 4, p. 311-324 1991.
DYMOND, J.; SUESS, E.; LYLE, M. Barium in Deep-Sea Sediment: A Geochemical
Proxy for Paleoproductivity. Paleoceanography, v. 7, n. 2, p. 163-181 1992.
EBERWEIN, A.; MACKENSEN, A. Regional primary productivity differences off
Morocco (NW-Africa) recorded by modern benthic foraminifera and their stable carbon isotopic
composition. Deep Sea Research Part I, v. 53, n. 8, p. 1379-1405 2006.
EICHLER, P. P. B.; SEN GUPTA, B. K.; EICHLER, B. B.; BRAGA, E. S.; CAMPOS, E.
J. Benthic foraminiferal assemblages of the South Brazil: Relationship to water masses and
nutrient distributions. Continental Shelf Research, v. 28, n. 13, p. 1674-1686 2008.
ELDERFIELD, H.; GANSEN, G. Past temperature and d18O of surface waters inferred
from foraminiferal Mg/Ca ratios. Nature, v. 405, p. 442-445 2000.
FAGEL, N. Chapter Four Clay Minerals, Deep Circulation and Climate. In: (Ed.).
Developments in Marine Geology - Proxies in Late Cenozoic Paleoceanography: Elsevier,
v.1, 2007. cap. 4, p.139-184. ISBN 15725480.
FAGEL, N.; INNOCENT, C.; GARIEPY, C.; HILLAIRE-MARCEL, C. Sources of
Labrador Sea sediments since the last glacial maximum from Nd-Pb isotopes. Geochimica Et
Cosmochimica Acta, v. 66, n. 14, p. 2569-2581 2002.
FARMER, E. J.; CHAPMAN, M. R.; ANDREWS, J. E. Centennial-scale Holocene North
Atlantic surface temperatures from Mg/Ca ratios in Globigerina bulloides. Geochemistry,
Geophysics, Geosystems, v. 9, n. 12, p. n/a-n/a 2008.
FARMER, G. L.; BARBER, D.; ANDREWS, J. Provenance of Late Quaternary ice-
proximal sediments in the North Atlantic: Nd, Sr and Pb isotopic evidence. Earth and Planetary
Science Letters, v. 209, n. 1-2, p. 227-243 2003.
FIGUEIRA, R. C. L.; TESSLER, M. G.; MAHIQUES, M. M.; CUNHA, I. I. L. Distribution
Of (CS)-C-137 Pu-238 and Pu239+240 in sediments of the southeastern Brazilian shelf-SW
Atlantic margin. Science of the Total Environment, v. 357, n. 1-3, p. 146-159 2006.

123
FONTANIER, C.; JORISSEN, F.; LICARI, L.; ALEXANDRE, A.; ANSCHUTZ, P.;
CARBONEL, P. Live benthic foraminiferal faunas from the Bay of Biscay: faunal density,
composition and microhabitats. Deep-Sea Research Part I, v. 49, p. 751-785 2002.
FONTANIER, C.; JORISSEN, F. J.; CHAILLOU, G.; DAVID, C.; ANSCHUTZ, P.;
LAFON, V. Seasonal and interannual variability of benthic foraminiferal faunas at 550m depth in
the Bay of Biscay. Deep Sea Research Part I, v. 50, n. 4, p. 457-494 2003.
FONTANIER, C.; JORISSEN, F. J.; LANSARD, B.; MOURET, A.; BUSCAIL, R.;
SCHMIDT, S.; KERHERVÉ, P.; BURON, F.; ZARAGOSI, S.; HUNAULT, G.; ERNOULT, E.;
ARTERO, C.; ANSCHUTZ, P.; RABOUILLE, C. Live foraminifera from the open slope between
Grand Rhône and Petit Rhône Canyons (Gulf of Lions, NW Mediterranean). Deep Sea
Research Part I, v. 55, n. 11, p. 1532-1553 2008.
FRADIQUE, C.; CASCALHO, J.; DRAGO, T.; ROCHA, F.; SILVEIRA, T. The meaning
of heavy minerals in the recent sedimentary record of the Douro estuary (Portugal). Journal of
Coastal Research, v. 39, p. 165-169 2006.
GALHANO, C.; ROCHA, F.; GOMES, C. Geostatistical analysis of the influence of
textural, mineralogical and geochemical parameters on the geotechnical behaviour of the
'Argilas de Aveiro' formation (Portugal). Clay Minerals, v. 34, n. 1, p. 109-116 1999.
GAN, M. A.; KOUSKY, V. E.; ROPELEWSKI, C. F. The South America Monsoon
circulation and its relationship to rainfall over west-central Brazil. Journal of Climate, v. 17, p.
47-66 2004.
GARREAUD, R. D.; VUILLE, M.; COMPAGNUCCI, R.; MARENGO, J. Present-day
South American climate. Palaeogeography, Palaeoclimatology, Palaeoecology, v. 281, n. 3-
4, p. 180-195 2009.
GONZALEZ-SILVERA, A.; SANTAMARIA-DEL-ANGEL, E.; MILLAN-NUNEZ, R. Spatial
and temporal variability of the Brazil-Malvinas Confluence and the La Plata Plume as seen by
SeaWiFS and AVHRR imagery. Journal of Geophysical Research-Oceans, v. 111, n. C6,
2006.
GOODAY, A. J. A Response by Benthic Foraminifera to the Deposition of Phytodetritus
in the Deep-Sea. Nature, v. 332, n. 6159, p. 70-73 1988.
______. Deep-Sea Benthic Foraminiferal Species Which Exploit Phytodetritus -
Characteristic Features and Controls on Distribution. Marine Micropaleontology, v. 22, n. 3, p.
187-205 1993.
______. The Biology of Deep-Sea Foraminifera - a Review of Some Advances and
Their Applications in Paleoceanography. Palaios, v. 9, n. 1, p. 14-31 1994.

124
______. Benthic foraminifera (protista) as tools in deep-water palaeoceanography:
Environmental influences on faunal characteristics. Advances in Marine Biology, Vol 46, v. 46,
p. 1-90 2003.
GOODAY, A. J.; RATHBURN, A. E. Temporal variability in living deep-sea benthic
foraminifera: a review. Earth-Science Reviews, v. 46, n. 1-4, p. 187-212 1999.
GRIGGS, G. B.; HEIN, J. R. Sources, Dispersal, and Clay Mineral-Composition of Fine-
Grained Sediment Off Central and Northern California. Journal of Geology, v. 88, n. 5, p. 541-
566 1980.
GRIMM, A. M. Meteorologia básica - Notas de aula., 1999. Disponível em: <
http://fisica.ufpr.br/grimm/aposmeteo>. Acesso em: 02/2009.
GRIMM, A. M. The El Nino impact on the summer monsoon in Brazil: Regional
processes versus remote influences. Journal of Climate, v. 16, n. 2, p. 263-280 2003.
GRIMM, A. M.; BARROS, V. R.; DOYLE, M. E. Climate variability in southern South
America associated with El Nino and La Nina events. Journal of Climate, v. 13, n. 1, p. 35-58
2000.
GROENEVELD, J.; CHIESSI, C. M. Mg/Ca ofGloborotalia inflataas a recorder of
permanent thermocline temperatures in the South Atlantic. Paleoceanography, v. 26, n. 2,
2011.
GROENEVELD, J.; NÜRNBERG, D.; TIEDEMANN, R.; REICHART, G.-J.; STEPH, S.;
REUNING, L.; CRUDELI, D.; MASON, P. Foraminiferal Mg/Ca increase in the Caribbean during
the Pliocene: Western Atlantic Warm Pool formation, salinity influence, or diagenetic overprint?
Geochemistry, Geophysics, Geosystems, v. 9, n. 1, p. n/a-n/a 2008.
GROUSSET, F.; BISCAYE, P. E.; ZINDLER, A.; PROSPERO, J.; CHESTER, R.
Neodymium isotopes as tracers in marine sediments and aerosols: North Atlantic. Earth and
Planetary Science Letters, v. 87, p. 367-378 1988.
GUPTA, A. K.; SARKAR, S.; MUKHERJEE, B. Paleoceanographic changes during the
past 1.9 Myr at DSDP Site 238, Central Indian Ocean Basin: Benthic foraminiferal proxies.
Marine Micropaleontology, v. 60, n. 2, p. 157-166 2006.
GUPTA, A. K.; THOMAS, E. Initiation of Northern Hemisphere glaciation and
strengthening of the northeast Indian monsoon: Ocean Drilling Program Site 758, eastern
equatorial Indian Ocean. Geology, v. 31, n. 1, p. 47-50 2003.
GYLLENCREUTZ, R. Late Glacial and Holocene Paleoceanography in the Skagerrak
from high-resolution grain size records. Palaeogeography Palaeoclimatology Palaeoecology,
v. 222, n. 3-4, p. 344-369 2005.

125
GYLLENCREUTZ, R.; MAHIQUES, M. M.; ALVES, D. V. P.; WAINER, I. K. C. Mid- to
late-Holocene paleoceanographic changes on the southeastern Brazilian shelf based on grain
size records. Holocene, v. 20, n. 6, p. 863-875 2010.
HAARSMA, R. J.; CAMPOS, E. J. D.; MOLTENI, F. Atmospheric response to South
Atlantic SST dipole. Geophysical Research Letters, v. 30, n. 16, 2003.
HAMMER, O.; HARPER, D. A. T.; RYAN, P. D. PAST: Paleontological Statistics
software package for education and data analysis. Paleontologia Electronica, v. 4, n. 1, p. 9
2001.
HAUG, G. H.; HUGHEN, K. A.; SIGMAN, D. M.; PETERSON, L. C.; RÖHL, U.
Southward migration of the Intertropical Convergence Zone through the Holocene. Science, v.
293, p. 1304-1308 2001.
HAYES, J. M. Factors Controlling C-13 Contents of Sedimentary Organic-Compounds -
Principles and Evidence. Marine Geology, v. 113, n. 1-2, p. 111-125 1993.
HAYWARD, B. W.; HOLLIS, C. J.; GRENFELL, H. Foraminiferal Associations in Port
Pegasus, Stewart-Island, New-Zealand. New Zealand Journal of Marine and Freshwater
Research, v. 28, n. 1, p. 69-95 1994.
HEEGARD, E., BIRKS, H.J.B. AND TELFORD, R.J. Relationships between calibrated
ages and depth in stratigraphical sequences: an estimation procedure by mixed-effect
regression. The Holocene, v.15, p. 612–618 2005.
HEIN, J. R.; DOWLING, J. S.; SCHUETZE, A.; LEE, H. J. Clay-mineral suites, sources,
and inferred dispersal routes: Southern California continental shelf. Marine Environmental
Research, v. 56, n. 1-2, p. 79-102 2003.
HEINZ, P.; KITAZATO, H.; SCHMIEDL, G.; HEMLEBEN, C. Response of deep-sea
benthic foraminifera from the Mediterranean Sea to simulated phytoplankton pulses under
laboratory conditions. Journal of Foraminiferal Research, v. 31, n. 3, p. 210-227 2001.
HERGUERA, J. C. Last glacial paleoproductivity patterns in the eastern equatorial
Pacific: benthic foraminifera records. Marine Micropaleontology, v. 40, p. 259-275 2000.
HERGUERA, J. C.; BERGER, W. H. Paleoproductivity from Benthic Foraminifera
Abundance - Glacial to Postglacial Change in the West-Equatorial Pacific. Geology, v. 19, n.
12, p. 1173-1176 1991.
HETHERINGTON, R.; REID, R. G. B. The Climate Connection: Climate change and
Human evolution. New York: Cambridge University Press, 2010.

126
HILL, T. M.; BROOKS, G. R.; DUNCAN, D. S.; MEDIOLI, F. S. Benthic foraminifera of
the Holocene transgressive west-central Florida inner shelf: paleoenvironmental implications.
Marine Geology, v. 200, n. 1-4, p. 263-272 2003.
HODELL, D. A.; CURTIS, J. H.; BRENNER, M. Possible Role of Climate in the Collapse
of Classic Maya Civilization. Nature, v. 375, n. 6530, p. 391-394 1995.
HU, J.; PENG, P. A.; JIA, G.; MAI, B.; ZHANG, G. Distribution and sources of organic
carbon, nitrogen and their isotopes in sediments of the subtropical Pearl River estuary and
adjacent shelf, Southern China. Marine Chemistry, v. 98, n. 2-4, p. 274-285 2006.
HUGHEN, K. A.; BAILLIE, M. G. L.; BARD, E.; BECK, J. W.; BERTRAND, C. J. H.;
BLACKWELL, P. G.; BUCK, C. E.; BURR, G. S.; CUTLER, K. B.; DAMON, P. E.; EDWARDS,
R. L.; FAIRBANKS, R. G.; FRIEDRICH, M.; GUILDERSON, T. P.; KROMER, B.; MCCORMAC,
G.; MANNING, S.; RAMSEY, C. B.; REIMER, P. J.; REIMER, R. W.; REMMELE, S.;
SOUTHON, J. R.; STUIVER, M.; TALAMO, S.; TAYLOR, F. W.; VAN DER PLICHT, J.;
WEYHENMEYER, C. E. Marine04 marine radiocarbon age calibration, 0-26 cal kyr BP.
Radiocarbon, v. 46, n. 3, p. 1059-1086 2004.
HUT, G. Consultants group meeting on stable isotope reference samples for
geochemical and hydrological investigations. Report to the Director General. International
Atomic Energy Agency. Vienna, p.42. 1987
INGRAM, B. L.; LIN, J. C. Geochemical tracers of sediment sources to San Francisco
Bay. Geology, v. 30, n. 6, p. 575-578 2002.
ISHIWATARI, R.; UZAKI, M. Diagenetic Changes of Lignin Compounds in a More Than
0.6 Million-Year-Old Lacustrine Sediment (Lake Biwa, Japan). Geochimica Et Cosmochimica
Acta, v. 51, n. 2, p. 321-328 1987.
JASPER, J. P.; GAGOSIAN, R. B. The Sources and Deposition of Organic-Matter in the
Late Quaternary Pygmy Basin, Gulf of Mexico. Geochimica Et Cosmochimica Acta, v. 54, n.
4, p. 1117-1132 1990.
JONES, R. W. The Challenger foramifera. London: Oxford University Press, 1994.
JORISSEN, F. Benthic foraminiferal successions across Late Quaternary
Mediterranean spropels. Marine Micropaleontology, v. 153, p. 91-101 1999.
JORISSEN, F.; FONTANIER, C.; THOMAS, E. Paleoceanographical proxies based on
deep-sea benthic foraminiferal assemblage characteristics. In: HILLAIRE-MARCEL and C.
VERNAL, A. (Ed.) Proxies in Late Cenozoic Paleoceanography: Pt. 2: Biological tracers
and biomarkers, Elsevier, 2007. p. 263-326.

127
JORISSEN, F.; ROHLING, E. J. Faunal perspectives on paloproductivity. Marine
Micropaleontology, v. 40, p. 131-134 2000.
JORISSEN, F.; STIGER, H. C.; WIDMARK, J. G. V. A conceptual model explaning
benthic formainiferal microhabitats. Marine Micropaleontology, v. 26, p. 3-15 1995.
JORISSEN, F.; WITTLING, I.; PEYPOUQUET, J. P.; RABOUILLE, C.; RELEXANS, J.
C. Live benthic foraminferal faunas off Cape Blanc, NW-Africa: community structure and
microhabitats. Deep-Sea Research Part I, v. 45, p. 2157-2188 1998.
KALNAY, E.; KANAMITSU, M.; KISTLER, R.; COLLINS, W.; DEAVEN, D.; GANDIN, L.;
IREDELL, M.; SAHA, S.; WHITE, G.; WOOLLEN, J.; ZHU, Y.; CHELLIAH, M.; EBISUZAKI, W.;
HIGGINS, W.; JANOWIAK, J.; MO, K. C.; ROPELEWSKI, C.; WANG, J.; LEETMAA, A.;
REYNOLDS, R.; JENNE, R.; JOSEPH, D. The NCEP/NCAR 40-year reanalysis project.
Bulletin of the American Meteorological Society, v. 77, n. 3, p. 437-471 1996.
KARLIN, R. Sediment Sources and Clay Mineral Distributions Off the Oregon Coast.
Journal of Sedimentary Petrology, v. 50, n. 2, p. 543-560 1980.
KEIL, R. G.; TSAMAKIS, E.; FUH, C. B.; GIDDINGS, J. C.; HEDGES, J. I. Mineralogical
and Textural Controls on the Organic Composition of Coastal Marine-Sediments -
Hydrodynamic Separation Using Splitt-Fractionation. Geochimica Et Cosmochimica Acta, v.
58, n. 2, p. 879-893 1994.
KESSARKAR, P. M.; RAO, V. P.; AHMAD, S. M.; BABU, G. A. Clay minerals and Sr–
Nd isotopes of the sediments along the western margin of India and their implication for
sediment provenance. Marine Geology, v. 202, n. 1-2, p. 55-69 2003.
KIM, J. H.; SCHNEIDER, R. R.; MULITZA, S.; MULLER, P. J. Reconstruction of SE
trade-wind intensity based on sea-surface temperature gradients in the Southeast Atlantic over
the last 25 kyr. Geophysical Research Letters, v. 30, n. 22, 2003.
KLUMP, J.; HEBBELN, D.; WEFER, G. The impact of sediment provenance on barium-
based productivity estimates. Marine Geology, v. 169, p. 259-271 2000.
KOUTAVAS, A.; JOANIDES, S. El Niño–Southern Oscillation extrema in the Holocene
and Last Glacial Maximum. Paleoceanography, v. 27, n. 4, 2012.
KOWSMANN, R. O.; COSTA, M. P. A. Paleolinhas de costa na plataforma continental
das regiões sul e norte brasileiras. Revista Brasileira de Geociências, v. 4, p. 215-222 1974.
LAMBECK, K.; CHAPPELL, J. Sea level change through the last glacial cycle. Science,
v. 292, n. 5517, p. 679-86 2001.

128
LEA, D. W.; MASHIOTTA, T. A.; SPERO, H. J. Controls on magnesium and strontium
uptake in planktonic foraminifera determined by live culturing. Geochimica Et Cosmochimica
Acta, v. 63, n. 16, p. 2369-2379 1999.
LEA, D. W.; PAK, D. K.; PETERSON, L. C.; HUGHEN, K. A. Synchroneity of tropical
and high-latitude Atlantic temperatures over the last glacial termination. Science, v. 301, n.
5638, p. 1361-4 2003.
LEAR, C.; ELDERFIELD, H.; WILSON, P. Cenozoic Deep-Sea Temperatures and
Global Ice Volumes from Mg/Ca in Benthic Foraminiferal Calcite. Science of the Total
Environment, v. 287, n. 269-272, 2000.
LEAR, C.; ROSENTHAL, Y.; COXALL, H. K.; WILSON, P. A. Late Eocene to early
Miocene ice sheet dynamics and the global carbon cycle. Paleoceanography, v. 19, n. 4,
2004.
LEDRU, M. P. Late Quaternary Environmental and Climatic Changes in Central Brazil.
Quaternary Research, v. 39, n. 1, p. 90-98 1993.
LEDRU, M. P.; MOURGUIART, P.; RICCOMINI, C. Related changes in biodiversity,
insolation and climate in the Atlantic rainforest since the last interglacial. Palaeogeography
Palaeoclimatology Palaeoecology, v. 271, n. 1-2, p. 140-152 2009.
LEDRU, M. P.; SALGADO-LABOURIAU, M. L.; LORSCHEITTER, M. L. Vegetation
dynamics in southern and central Brazil during the last 10,000 yr BP. Review of Palaeobotany
and Palynology, v. 99, n. 2, p. 131-142 1998.
LEDUC, G.; SCHNEIDER, R.; KIM, J. H.; LOHMANN, G. Holocene and Eemian sea
surface temperature trends as revealed by alkenone and Mg/Ca paleothermometry.
Quaternary Science Reviews, v. 29, n. 7-8, p. 989-1004 2010.
LEGRANDE, A. N.; SCHMIDT, G. A. Global gridded data set of the oxygen isotopic
composition in seawater. Geophysical Research Letters, v. 33, n. 12, 2006.
LENTERS, J. D.; COOK, K. H. Summertime precipitation variability over South America:
Role of the large-scale circulation. Monthly Weather Review, v. 127, n. 3, p. 409-431 1999.
LEONHARDT, A.; LORSCHEITTER, M. L. The last 25,000 years in the Eastern Plateau
of Southern Brazil according to Alpes de São Francisco record. Journal of South American
Earth Sciences, v. 29, n. 2, p. 454-463 2010.
LOEBLICH, A. R.; TAPPAN, H. Foraminiferal genera and their classification -
PLATES. New York: Van Nostrand Reinhold, 1988. 970.

129
LOUBERE, P. The surface ocean productivity and bottom water oxygen signals in deep
water benthic foraminiferal assemblages. Marine Micropaleontology, v. 28, n. 3-4, p. 247-261
1996.
______. The impact of seasonality on the benthos as reflected in the assemblages of
deep-sea foraminifera. Deep-Sea Research Part I, v. 45, n. 2-3, p. 409-432 1998.
LOUBERE, P.; FARIDUDDIN, M. Quantitative estimation of global patterns of surface
ocean biological productivity and its seasonal variation on timescales from centuries to
millennia. Global Biogeochemical Cycles, v. 13, n. 1, p. 115-133 1999.
LUTZE, G. F.; COULBOURN, W. T. Recent Benthic Foraminifera from the Continental-
Margin of Northwest Africa - Community Structure and Distribution. Marine Micropaleontology,
v. 8, n. 5, p. 361-401 1984.
LYNCH-STIEGLITZ, J.; CURRY, W. B.; LUND, D. C. Florida Straits density structure
and transport over the last 8000 years. Paleoceanography, v. 24, 2009.
LYNCH-STIEGLITZ, J.; CURRY, W. B.; SLOWEY, N. Weaker Gulf Stream in the
Florida straits during the last glacial maximum. Nature, v. 402, n. 6762, p. 644-648 1999.
MACKENSEN, A.; GROBE, H.; KUHN, G.; FUTTERER, D. K. Benthic foraminiferal
assemblages from the eastern Weddell Sea between 68 and 73°S: distribution, ecology and
fossilization potential. Marine Micropaleontology, v. 16, p. 241-283 1990.
MACKENSEN, A.; SCHMIEDL, G.; HARLOFF, J.; GIESE, M. Deep-sea foraminifera in
the South Atlantic ocean: Ecology and assemblage generation. Micropaleontology, v. 41, n. 4,
p. 342-358 1995.
MACKENSEN, A.; SEJRUP, H. P.; JANSEN, E. The Distribution of Living Benthic
Foraminifera on the Continental-Slope and Rise Off Southwest Norway. Marine
Micropaleontology, v. 9, n. 4, p. 275-306 1985.
MAHIQUES, M. M.; DA SILVEIRA, I. C. A.; SOUSA, S. H. D. E.; RODRIGUES, M. Post-
LGM sedimentation on the outer shelf-upper slope of the northernmost part of the Sao Paulo
Bight, southeastern Brazil. Marine Geology, v. 181, n. 4, p. 387-400 2002.
MAHIQUES, M. M.; FUKUMOTO, M. M.; SILVEIRA, I. C. A.; FIGUEIRA, R. C. L.;
BICEGO, M. C.; LOURENCO, R. A.; MELLO-E-SOUSA, S. H. Sedimentary changes on the
Southeastern Brazilian upper slope during the last 35,000 years. Anais Da Academia
Brasileira De Ciencias, v. 79, n. 1, p. 171-181 2007.
MAHIQUES, M. M.; MISHIMA, Y.; RODRIGUES, M. Characteristics of the sedimentary
organic matter on the inner and middle continental shelf between Guanabara Bay and Sao

130
Francisco do Sul, southeastern Brazilian margin. Continental Shelf Research, v. 19, n. 6, p.
775-798 1999.
MAHIQUES, M. M.; SOUSA, S. H. M.; BURONE, L.; NAGAI, R. H.; SILVEIRA, I. C. A.;
FIGUEIRA, R. C. L.; SOUTELINO, R. G.; PONSONI, L.; KLEIN, D. A. Radiocarbon
geochronology of the sediments of the Sao Paulo Bight (southern Brazilian upper margin).
Anais Da Academia Brasileira De Ciencias, v. 83, n. 3, p. 817-834 2011.
MAHIQUES, M. M.; TASSINARI, C. C. G.; MARCOLINI, S.; VIOLANTE, R. A.;
FIGUEIRA, R. C. L.; SILVEIRA, I. C. A.; BURONE, L.; SOUSA, S. H. M. Nd and Pb isotope
sigNatures on the Southeastern South American upper margin: Implications for sediment
transport and source rocks. Marine Geology, v. 250, n. 1-2, p. 51-63 2008.
MAHIQUES, M. M.; TESSLER, M. G.; CIOTTI, A. M.; SILVEIRA, I. C. A.; SOUSA, S. H.
D. E.; FIGUEIRA, R. C. L.; TASSINARI, C. C. G.; FURTADO, V. V.; PASSOS, R. F.
Hydrodynamically driven patterns of recent sedimentation in the shelf and upper slope off
Southeast Brazil. Continental Shelf Research, v. 24, n. 15, p. 1685-1697 2004.
MAHIQUES, M. M.; WAINER, I. K. C.; BURONE, L.; NAGAI, R.; SOUS, S. H. D. E.;
FIGUEIRA, R. C. L.; SILVEIRA, I. C. A.; BICEGO, M. C.; ALVES, D. P. V.; HAMMER, O. A
high-resolution Holocene record on the Southern Brazilian shelf: Paleoenvironmental
implications. Quaternary International, v. 206, p. 52-61 2009.
MARCHANT, M.; HEBBLEN, D.; WEFER, G. High resolution planktonic foraminiferal
record of the last 13,300 years from an upwelling area off Chile. Marine Geology, v. 161, p.
115-128 1999.
MARCHITTO, T. M.; MUSCHELER, R.; ORTIZ, J. D.; CARRIQUIRY, J. D.; VAN GEEN,
A. Dynamical Response of the Tropical Pacific Ocean to Solar Forcing During the Early
Holocene. Science, v. 330, n. 6009, p. 1378-1381 2010.
MARENGO, J. A.; SOARES, W. R.; SAULO, C.; NICOLINI, M. Climatology of the low-
level jet east of the Andes as derived from the NCEP-NCAR reanalyses: Characteristics and
temporal variability. Journal of Climate, v. 17, n. 12, p. 2261-2280 2004.
MARTIN, L.; DOMINGUEZ, J. M. L.; BITTENCOURT, A. C. S. P. Fluctuating Holocene
sea levels in eastern and southeastern Nrazil: evidence from multiple fossil and geometric
indicators. Journal of Coastal Research, v. 19, n. 1, p. 101-124 2003.
MARTIN, L.; FOURNIER, M.; MOURGUIART, P.; SIFEDDINE, A.; TURCQ, B. Southern
Oscillation signal in South American paleoclimatic data of the last 7000 years. Quaternary
Research, v. 39, p. 338-346 1993.
MARTIN, P. A.; LEA, D. W. A simple evaluation of cleaning procedures on fossil benthic
foraminiferal Mg/Ca. Geochemistry Geophysics Geosystems, v. 3, 2002.

131
MARTINEZ, P.; BERTRAND, P.; SHIMMIELD, G. B.; COCHRANE, K.; JORISSEN, F.;
FOSTER, D.; DIGNAN, M. Upwelling intensity and ocean producitivity changes off Cape Blanc
(northwest Africa) during the last 70,000 years: geochemical and micropalaeontological
evidence. Marine Geology, v. 158, p. 57-74 1999.
MARTINS, V.; DUBERT, J.; JOUANNEAU, J.-M.; WEBER, O.; DA SILVA, E. F.;
PATINHA, C.; ALVEIRINHO DIAS, J. M.; ROCHA, F. A multiproxy approach of the Holocene
evolution of shelf–slope circulation on the NW Iberian Continental Shelf. Marine Geology, v.
239, n. 1-2, p. 1-18 2007.
MARTINS, V.; JOUANNEAU, J.-M.; WEBER, O.; ROCHA, F. Tracing the late Holocene
evolution of the NW Iberian upwelling system. Marine Micropaleontology, v. 59, n. 1, p. 35-55
2006.
MASLIN, M. A.; DURHAM, E.; BURNS, S. J.; PLATZMAN, E.; GROOTES, P.; GREIG,
S. E. J.; NADEAU, M. J.; SCHLEICHER, M.; PFLAUMANN, U.; LOMAX, B.; RIMINGTON, N.
Palaeoreconstruction of the Amazon River freshwater and sediment discharge using sediments
recovered at Site 942 on the Amazon Fan. Journal of Quaternary Science, v. 15, n. 4, p. 419-
434 2000.
MATSUMOTO, K.; LYNCH-STIEGLITZ, J. Persistence of Gulf Stream separation during
the Last Glacial Period: Implications for current separation theories. Journal of Geophysical
Research-Oceans, v. 108, n. C6, 2003.
MATSUURA, Y.; WADA, E. Carbon and nitrogen stable isotope ratios in marine organic
matters of the coastal ecosystem in Ubatuba, southern Brazil. Ciência e Cultura, v. 46, p. 142-
146 1994.
MAYEWSKI, P. A.; ROHLING, E. E.; STAGER, J. C.; KARLEN, W.; MAASCH, K. A.;
MEEKER, L. D.; MEYERSON, E. A.; GASSE, F.; VAN KREVELD, S.; HOLMGREN, K.; LEE-
THORP, J.; ROSQVIST, G.; RACK, F.; STAUBWASSER, M.; SCHNEIDER, R. R.; STEIG, E. J.
Holocene climate variability. Quaternary Research, v. 62, n. 3, p. 243-255 2004.
MCCAVE, I. N.; KIEFER, T.; THORNALLEY, D. J. R.; ELDERFIELD, H. Deep flow in
the Madagascar-Mascarene Basin over the last 150 000 years. Philosophical Transactions of
the Royal Society of London Series a-Mathematical Physical and Engineering Sciences,
v. 363, n. 1826, p. 81-99 2005.
MCCAVE, I. N.; MANIGHETTI, B.; ROBINSON, S. G. Sortable Silt and Fine Sediment
Size Composition Slicing - Parameters for Paleocurrent Speed and Paleoceanography.
Paleoceanography, v. 10, n. 3, p. 593-610 1995.

132
MCCONNELL, M. C.; THUNELL, R. C. Calibration of the planktonic foraminiferal Mg/Ca
paleothermometer: sediment trap results from the Guaymas Basin, Gulf of California.
Paleoceanography, v. 20, n. 2, 2005.
MCMANUS, J. F.; FRANCOIS, R.; GHERARDI, J. M.; KEIGWIN, L. D.; BROWN-
LEGER, S. Collapse and rapid resumption of Atlantic meridional circulation linked to deglacial
climate changes. Nature, v. 428, n. 6985, p. 834-837 2004.
MELLINGER, R. M. Quantitative X-ray diffraction analysis of clay minerals. An
evaluation. Saskatchewan Res. Council. Canada, p.1-46. 1979
MELO, L. D.; MARENGO, J. A. The influence of changes in orbital parameters over
South American climate using the CPTEC AGCM: simulation of climate during the mid
Holocene. The Holocene, v. 18, n. 4, p. 501-516 2008.
MENDES, I.; GONZALEZ, R.; DIAS, J. M. A.; LOBO, F.; MARTINS, V. Factors
influencing recent benthic foraminifera distribution on the Guadiana shelf (Southwestern Iberia).
Marine Micropaleontology, v. 51, n. 1-2, p. 171-192 2004.
MEYERS, P. A. Preservation of Elemental and Isotopic Source Identification of
Sedimentary Organic-Matter. Chemical Geology, v. 114, n. 3-4, p. 289-302 1994.
______. Organic geochemical proxies of paleoceanographic, paleolimnologic, and
paleoclimatic processes. Organic Geochemistry, v. 27, n. 5-6, p. 213-250 1997.
MIX, A. C. Influence of Productivity Variations on Long-Term Atmospheric Co2. Nature,
v. 337, n. 6207, p. 541-544 1989.
MOLLER, O. O.; PIOLA, A. R.; FREITAS, A. C.; CAMPOS, E. J. D. The effects of river
discharge and seasonal winds on the shelf off southeastern South America. Continental Shelf
Research, v. 28, n. 13, p. 1607-1624 2008.
MORENO, A.; CACHO, I.; CANALS, M.; GRIMALT, J. O.; SANCHEZ-VIDAL, A.
Millennial-scale variability in the productivity signal from the Alboran Sea record, Western
Mediterranean Sea. Palaeogeography, Palaeoclimatology, Palaeoecology, v. 211, n. 3-4, p.
205-219 2004.
MOY, C. M.; SELTZER, G. O.; RODBELL, D. Y.; ANDERSON, D. M. Variability of El
Niño/Southern Oscillation activity at millennial timescales during the Holoce epoch. Nature, v.
420, n. 6912, p. 162-165 2002.
MUELBERT, J. H.; SINQUE, C. Distribution of bluefish (Pomatomus saltatrix) larvae
along the Continental Shelf off southern Brazil. Marine and Freshwater Research, v. 47, n. 2,
p. 311-314 1996.

133
MULITZA, S.; ARZ, H.; MÜCKE, K.-V.; MOOS, C.; NIEBLER, H. S.; PÄTZOLD, J.;
SEGL, M. The South Atlantic isotope record of planktonic foraminifera. In: FISHER, G. and
WEFER, G. (Ed.). Use of proxies in Paleoceanography: examples from the South Atlantic.
Berlin: Springer-Verlag, 1999. p.427-445.
MULITZA, S.; BOLTOVSKOY, D.; DONNER, B.; MEGGERS, H.; PAUL, A.; WEFER, G.
Temperature: delta O-18 relationships of planktonic foraminifera collected from surface waters.
Palaeogeography Palaeoclimatology Palaeoecology, v. 202, n. 1-2, p. 143-152 2003.
MULITZA, S.; DURKOOP, A.; HALE, W.; WEFER, G.; NIEBLER, H. S. Planktonic
foraminifera as recorders of past surface-water stratification. Geology, v. 25, n. 4, p. 335-338
1997.
MURRAY, J. W. Ecology and palaeoecology of benthic foraminifera. London:
Longman Scientific and Technical, 1991.
______. Ecology and Applications of Benthic Foraminifera. Cambridge: Cambridge
University Press, 2006.
MURRAY, J. W.; ALVE, E.; CUNDY, A. The origin of modern agglutinated foraminiferal
assemblages: evidence from a stratified fjord. Estuarine Coastal and Shelf Science, v. 58, n.
3, p. 677-697 2003.
MUSCHITIELLO, F.; HAMMARLUND., D.; WOHLFARTH, B. New insights into the
Holocene Thermal Maximum: feedback and triggering mechanisms. PAGES 4th Open Science
Meeting, 2013, Goa, India. PAGES.
NAGAI, R. H.; FERREIRA, P. A. L.; MULKHERJEE, S.; MARTINS, V. M.; FIGUEIRA, R.
C. L.; SOUSA, S. H. M.; MAHIQUES, M. M. Hydrodynamic controls on the mineralogy and
natural and artificial radionuclide distributions in surface sediments from the Brazilian
continental shelf between Cabo Frio (23°S) and the mouth of the Rio de La Plata (38°S).
Continental Shelf Research, submitted.
NAGAI, R. H.; SOUSA, S. H. M.; BURONE, L.; MAHIQUES, M. M. Paleoproductivity
changes during the Holocene in the inner shelf of Cabo Frio, southeastern Brazilian continental
margin: Benthic foraminifera and sedimentological proxies. Quaternary International, v. 206, p.
62-71 2009.
NESBITT, H. W.; FEDO, C. M.; YOUNG, G. M. Quartz and feldspar stability, steady and
non-steady-state weathering, and petrogenesis of silisiclastic sands and muds. The Journal of
Geology, v. 105, n. 2, p. 173-192 1997.
NURNBERG, D.; BIJMA, J.; HEMLEBEN, C. Assessing the reliability of magnesium in
foraminiferal calcite as a proxy for water mass temperatures. Geochimica Et Cosmochimica
Acta, v. 60, n. 5, p. 803-814 1996.
134
NURNBERG, D.; MULLER, A.; SCHNEIDER, R. R. Paleo-sea surface temperature
calculations in the equatorial east Atlantic from Mg/Ca ratios in planktic foraminifera: A
comparison to sea surface temperature estimates from U-37(K '), oxygen isotopes, and
foraminiferal transfer function. Paleoceanography, v. 15, n. 1, p. 124-134 2000.
OLIVEIRA, A.; ROCHA, F.; RODRIGUES, A.; JOUANNEAU, J.; DIAS, A.; WEBER, O.;
GOMES, C. Clay minerals from the sedimentary cover from the Northwest Iberian shelf.
Progress in Oceanography, v. 52, n. 2-4, p. 233-247 2002.
OPPO, D. W.; MCMANUS, J.; CULLEN, J. L. Deepwater variability in the Holocene
epoch. Nature GeoScience, v. 422, p. 277-278 2003.
PALMA, E. D.; MATANO, R. P. Disentangling the upwelling mechanisms of the South
Brazil Bight. Continental Shelf Research, v. 29, n. 11-12, p. 1525-1534 2009.
PARK, Y. A.; KHIM, B. K. Clay-Minerals of the Recent Fine-Grained Sediments on the
Korean Continental Shelves. Continental Shelf Research, v. 10, n. 12, p. 1179-1191 1990.
PARRA, M.; FAUGÈRES, J.-C.; GROUSSET, F.; PUJOL, C. Sr-Nd isotopes as tracers
of fine-grained detrital sediments: the South-Barbados accretionary prism during the last 150
kyr. Marine Geology, v. 136, p. 225-243 1997.
PASQUINI, A. I.; DEPETRIS, P. J. Discharge trends and flow dynamics of South
American rivers draining the southern Atlantic seaboard: An overview. Journal of Hydrology,
v. 333, n. 2-4, p. 385-399 2007.
PAYTAN, A. Ocean Paleoproductivity. In: GORNITZ, V. (Ed.). Encyclopedia of
Paleoclimatology and Ancient Environments. London: Kluwer Academic Publishers, 2008.
p.643-651.
PAYTAN, A.; SHELLENBARGER, G. G.; STREET, J. H.; GONNEEA, M. E.; DAVIS, K.;
YOUNG, M. B.; MOORE, W. S. Submarine groundwater discharge: An important source of new
inorganic nitrogen to coral reef ecosystems. Limnology and Oceanography, v. 51, n. 1, p.
343-348 2006.
PESSENDA, L. C. R.; GOUVEIA, S. E. M.; ARAVENA, R.; BOULET, R.; VALENCIA, E.
P. E. Holocene fire and vegetation changes in southeastern Brazil as deduced from fossil
charcoal and soil carbon isotopes. Quaternary International, v. 114, p. 35-43 2004.
PETSCHICK, R.; KUHN, G.; GINGELE, F. Clay mineral distribution in surface
sediments of the South Atlantic: Sources, transport, and relation to oceanography. Marine
Geology, v. 130, n. 3-4, p. 203-229 1996.

135
PFEIFER, K.; KASTEN, S.; HENSEN, C.; SCHULZ, H. D. Reconstruction of primary
productivity from the barium contents on surface sediments of the South Atlantic Ocean. Marine
Geology, v. 177, p. 13-24 2001.
PIELOU, E. C. Ecological diversity. New York: John Wiley, 1975.
PIOLA, A. R.; MATANO, R. P.; PALMA, E. D.; MOLLER, O. O.; CAMPOS, E. J. D. The
influence of the Plata River discharge on the western South Atlantic shelf. Geophysical
Research Letters, v. 32, n. 1, 2005.
PIOLA, A. R.; ROMERO, S. I.; ZAJACZKOVSKI, U. Space-time variability of the Plata
plume inferred from ocean color. Continental Shelf Research, v. 28, n. 13, p. 1556-1567 2008.
PRAHL, F. G.; BENNETT, J. T.; CARPENTER, R. The early diagenesis of aliphatic
hydrocarbons and organic matter in sedimentary particulates from Dabob Bay, Washington.
Geochimica Et Cosmochimica Acta, v. 44, p. 1967-1976 1980.
PRAHL, F. G.; ERTEL, J. R.; GONI, M. A.; SPARROW, M. A.; EVERSMEYER, B.
Terrestrial Organic-Carbon Contributions to Sediments on the Washington Margin. Geochimica
Et Cosmochimica Acta, v. 58, n. 14, p. 3035-3048 1994.
REBOITA, M. S.; GAN, M. A.; ROCHA, R. P.; AMBRIZZI, T. Regimes de precipitação
na América do Sul: uma rveisão bibliográfica. Revista Brasileira de Meteorologia, v. 25, n. 2,
p. 185-204 2010.
REGENBERG, M.; STEPH, S.; NURNBERG, D.; TIEDEMANN, R.; GARBE-
SCHONBERG, D. Calibrating Mg/Ca ratios of multiple planktonic foraminiferal species with
delta O-18-calcification temperatures: Paleothermometry for the upper water column. Earth and
Planetary Science Letters, v. 278, n. 3-4, p. 324-336 2009.
REVEL, M.; SINKO, J. A.; GROUSSET, F. E.; BISCAYE, P. E. Sr and Nd isotopes as
tracers of north Atlantic lithic particles: Paleoclimatic implications. Paleoceanography, v. 11, n.
1, p. 95-113 1996.
ROBERT, C.; DIESTER-HAASS, L.; PATUREL, J. Clay mineral assemblages,
siliciclastic input and paleoproductivity at ODP Site 1085 off Southwest Africa: A late Miocene-
early Pliocene history of Orange river discharges and Benguela current activity, and their
relation to global sea level change. Marine Geology, v. 216, n. 4, p. 221-238 2005.
ROBINSON, R. S.; KIENAST, M.; LUIZA ALBUQUERQUE, A.; ALTABET, M.;
CONTRERAS, S.; DE POL HOLZ, R.; DUBOIS, N.; FRANCOIS, R.; GALBRAITH, E.; HSU, T.-
C.; IVANOCHKO, T.; JACCARD, S.; KAO, S.-J.; KIEFER, T.; KIENAST, S.; LEHMANN, M.;
MARTINEZ, P.; MCCARTHY, M.; MÖBIUS, J.; PEDERSEN, T.; QUAN, T. M.; RYABENKO, E.;
SCHMITTNER, A.; SCHNEIDER, R.; SCHNEIDER-MOR, A.; SHIGEMITSU, M.; SINCLAIR, D.;

136
SOMES, C.; STUDER, A.; THUNELL, R.; YANG, J.-Y. A review of nitrogen isotopic alteration in
marine sediments. Paleoceanography, v. 27, n. 4, 2012.
ROCHA, J.; MILLIMAN, J. D.; SANTANA, C. I.; VICALVI, M. A. Continental margin
sedimentation off Brazil. Part 5: Southern Brazil. Contributions to Sedimentology, v. 4, p.
117-150 1975.
RODRIGUES, R. R.; LORENZZETTI, J. A. A numerical study of the effects of bottom
topography and coastline geometry on the Southeast Brazilian coastal upwelling. Continental
Shelf Research, v. 21, p. 371-394 2001.
RODWELL, M. J.; HOSKINS, B. J. Subtropical anticyclones and summer monsoons.
Journal of Climate, v. 14, p. 3192-3211 2001.
RUHLEMANN, C.; DIEKMANN, B.; MULITZA, S.; FRANK, M. Late Quaternary changes
of western equatorial Atlantic surface circulation and Amazon lowland climate recorded in Ceara
Rise deep-sea sediments. Paleoceanography, v. 16, n. 3, p. 293-305 2001.
RUHLEMANN, C.; MULITZA, S.; MULLER, P. J.; WEFER, G.; ZAHN, R. Warming of
the tropical Atlantic Ocean and slowdown of thermohaline circulation during the last
deglaciation. Nature, v. 402, n. 6761, p. 511-514 1999.
RUTBERG, R. L.; HEMMING, S. R.; GOLDSTEIN, S. L. Reduced North Atlantic Deep
Water flux to the glacial Southern Ocean inferred from neodymium isotope ratios. Nature, v.
405, n. 6789, p. 935-938 2000.
SAHER, M.; KRISTENSEN, D. K.; HALD, M.; PAVLOVA, O.; JØRGENSEN, L. L.
Changes in distribution of calcareous benthic foraminifera in the central Barents Sea between
the periods 1965–1992 and 2005–2006. Global and Planetary Change, v. 98-99, p. 81-96
2012.
SCHMIDT, M. W.; SPERO, H. J.; LEA, D. W. Links between salinity variation in the
Caribbean and North Atlantic thermohaline circulation. Nature, v. 428, n. 6979, p. 160-163
2004.
SCHMIEDL, G.; BOVÉE, F.; BUSCAIL, R.; HEMLEBEN, C.; MEDERNACH, L.; PICON,
P. Trophic control of benthic foraminiferal abundance and microhabitat in the bathyal Gulf of
Lions, western Mediterranean Sea. Marine Micropaleontology, v. 40, p. 167-188 2000.
SCHMIEDL, G.; MACKENSEN, A. Late Quaternary paleoproductivity and deep water
circulation in the eastern South Atlantic Ocean: Evidence from benthic foraminifera.
Palaeogeography Palaeoclimatology Palaeoecology, v. 130, p. 43-80 1997.

137
SCHMIEDL, G.; MACKENSEN, A.; MULLER, G. Recent benhtic foraminifera from the
eastern South Atlantic Ocean: dependence on food supply and water masses. Marine
Micropaleontology, v. 32, p. 249-287 1997.
SCHONFELD, J. Benthic foraminifera and pore-water oxygen profiles: A re-assessment
of species boundary conditions at the western Iberian Margin. Journal of Foraminiferal
Research, v. 31, n. 2, p. 86-107 2001.
SCHÖNFELD, J. Recent benthic foraminifera assemblages in deep high-energy
environments from the Gulf of Cadiz (Spain). Marine Micropaleontology, v. 44, p. 141-162
2002.
SCHRAG, D. P.; ADKINS, J. F.; MCINTYRE, K.; ALEXANDER, J. L.; HODELL, A.;
CHARLES, C. D.; MCMANUS, J. F. The oxygen isotopic composition of seawater during the
Last Glacial Maximum. Quaternary Science Reviews, v. 21, p. 331-342 2002.
SCHRODER, C. J.; SCOTT, D. B.; MEDIOLI, F. S. Can Smaller Benthic Foraminifera
Be Ignored in Paleoenvironmental Analyses. Journal of Foraminiferal Research, v. 17, n. 2,
p. 101-105 1987.
SCHULTZ, L. G. Quantitative interpretation of mineralogical composition from X-ray and
chemical data for the Pierre Shale. U.S. Geol. Surv. Prof. Pap., v. 391-C, p. 1-31 1964.
SHACKLETON, N. J.; OPDYKE, N. D. Oxygen isotope and paleomagnetic stratigraphy
of equatorial Pacific core V28-238: Oxygen isotope temperatures and ice volumes on a 105
year scale. Quaternary Research, v. 3, p. 39-55 1973.
SHANNON, C.; WEAVER, W. The Mathematical Theory of Communication. 5th.
1999.
SIDDALL, M.; ROHLING, E. E.; ALMOGI-LABIN, A.; HEMBLEBEN, C.; MEISCHNER,
D.; SCHMELZER, I.; SMEED, D. A. Sea-level fluctuations durint the last glacial cycle. Nature, v.
423, n. 6942, p. 853-858 2003.
SILLIMAN, J. E.; MEYERS, P. A.; BOURBONNIERE, R. A. Record of postglacial
organic matter delivery and burial in sediments of Lake Ontario. Organic Geochemistry, v. 24,
n. 4, p. 463-472 1996.
SILVEIRA, I. C. A.; SCHMIDT, A. C. K.; CAMPOS, E. J. D.; GODOI, S. S.; IKEDA, Y. A
Corrente do Brasil ao largo da costa leste Brasileira. Revista Brasileira de Oceanografia, v.
48, n. 2, p. 171-183 2000.
SMART, C. W. Abyssal NE Atlantic benthic foraminifera during the last 15 kyr: Relation
to variations in seasonality of productivity. Marine Micropaleontology, v. 69, n. 2, p. 193-211
2008.

138
SMART, C. W.; KING, S. C.; GOODAY, A. J.; MURRAY, J. W.; THOMAS, E. A benthic
foraminiferal proxy of pulsed organic matter paleofluxes. Marine Micropaleontology, v. 23, p.
89-99 1994.
SMART, C. W.; WAELBROECK, C.; MICHEL, E.; MAZAUD, A. Benthic foraminiferal
abundance and stable isotope changes in the Indian Ocean sector of the Southern Ocean
during the last 20 kyr: Paleoceanographic implications. Palaeogeography Palaeoclimatology
Palaeoecology, v. 297, n. 3-4, p. 537-548 2010.
SOUSA, S. H. M.; GODOI, S. S.; AMARAL, P.; COELHO, T. M.; CIOTTI, A. Distribution
of living planktonic foraminifera in relation to oceanic processes on the southeastern continental
Brazilian margin (23° - 25° S and 40° - 44° W). Continental Shelf Research, submitted.
SOUZA, R. B.; ROBINSON, I. S. Lagrangian and satellite observations of the Brazilian
Coastal Current. Continental Shelf Research, v. 24, n. 2, p. 241-262 2004.
STAUBWASSER, M.; SIROCKO, F. On the formation of laminated sediments on the
continental margin off Pakistan: the effects of sediment provenance and sediment redistribution.
Marine Geology, v. 172, n. 1-2, p. 43-56 2001.
STEPH, S.; REGENBERG, M.; TIEDEMANN, R.; MULITZA, S.; NÜRNBERG, D. Stable
isotopes of planktonic foraminifera from tropical Atlantic/Caribbean core-tops: Implications for
reconstructing upper ocean stratification. Marine Micropaleontology, v. 71, n. 1-2, p. 1-19
2009.
STRAMMA, L.; ENGLAND, M. H. On the water masses and mean circulation of the
South Atlantic Ocean. Journal of Geophysical Research-Oceans, v. 104, n. C9, p. 20863-
20883 1999.
STRIKIS, N. M.; CRUZ, F. W.; CHENG, H.; KARMANN, I.; EDWARDS, R. L.; VUILLE,
M.; WANG, X.; DE PAULA, M. S.; NOVELLO, V. F.; AULER, A. S. Abrupt variations in South
American monsoon rainfall during the Holocene based on a speleothem record from central-
eastern Brazil. Geology, v. 39, n. 11, p. 1075-1078 2011.
SUN, Y. C.; CHI, P. H.; SHIUE, M. Y. Comparison of different digestion methods for
total decomposition of siliceous and organic environmental samples. Analytical Sciences, v.
17, n. 12, p. 1395-1399 2001.
SUNYÉ, P. S.; SERVAIN, J. Effects of seasonal variations in meteorology and
oceanography on the Brazilian sardine fishery. Fisheries Oceanography, v. 7, n. 2, p. 89-100
1998.
TEDESCO, K.; THUNELL, R.; ASTOR, Y.; MULLER-KARGER, F. The oxygen isotope
composition of planktonic foraminifera from the Cariaco Basin, Venezuela: Seasonal and
interannual variations. Marine Micropaleontology, v. 62, n. 3, p. 180-193 2007.

139
TEIL, H. Correspondence Factor-Analysis - an Outline of Its Method. Journal of the
International Association for Mathematical Geology, v. 7, n. 1, p. 3-13 1975.
THOMPSON, S.; EGLINTON, G. Fractionation of a Recent Sediment for Organic
Geochemical Analysis. Geochimica Et Cosmochimica Acta, v. 42, n. 2, p. 199-& 1978.
THOREZ, J. Practical Identification of Clay Minerals A Handbook for Teachers and
Students in Clay Mineralogy. Belgium: Lelotte (Dison), 1976.
TRIBOVILLARD, N.; ALGEO, T. J.; LYONS, T.; RIBOULLEAU, A. Trace metals as
paleoredox and paleoproductivity proxies: An update. Chemical Geology, v. 232, n. 1-2, p. 12-
32 2006.
VAN MORKHOVEN, F. P. C. M.; BERGGREN, W. A.; EDWARDS, A. S. Cenozoic
cosmopolitan deep-water benthic foraminifera. Elf Aquitaine, 1986.
VANCE, D.; THIRLWALL, M. An assessment of mass discriminations in MC-ICPMS
using Nd isotopes. Chemical Geology, v. 185, p. 227-240 2002.
VÉNEC-PEYRÉ, M.-T.; CAULET, J.-P. Paleoproductivity changes in the upwelling
system of Socotra (Somali Basin, NW Indian Ocean) during the last 72,000 years: evidences
from biological sigNatures. Marine Micropaleontology, v. 40, p. 321-344 2000.
VERA, C.; BAEZ, J.; DOUGLAS, M.; EMMANUEL, C. B.; MARENGO, J.; MEITIN, J.;
NICOLINI, M.; NOGUES-PAEGLE, J.; PAEGLE, J.; PENALBA, O.; SALIO, P.; SAULO, C.;
SILVA DIAS, M. A.; SILVA DIAS, P.; ZIPSER, E. The South American Low-Level Jet
Experiment. Bulletin of the American Meteorological Society, v. 87, n. 1, p. 63-77 2006.
VERA, C.; HIGGINS, W.; AMADOR, J.; AMBRIZZI, T.; GARREAUD, R.; GOCHIS, D.;
GUTZLER, D.; LETTENMAIER, D.; MARENGO, J.; MECHOSO, C. R.; NOGUES-PAEGLE, J.;
DIAS, P. L. S.; ZHANG, C. Toward a unified view of the American Monsoon Systems. Journal
of Climate, v. 19, n. 20, p. 4977-5000 2006.
VERA, C.; VIGLIAROLO, P. K.; BERBERY, E. H. Cold season synoptic-scale waves
over subtropical South America. Monthly Weather Review, v. 130, n. 3, p. 684-699 2002.
VIDAL, L.; LABEYRIE, L.; CORTIJO, E.; ARNOLD, M.; DUPLESSY, J. C.; MICHEL, E.;
BECQUE, S.; VANWEERING, T. C. E. Evidence for changes in the North Atlantic Deep Water
linked to meltwater surges during the Heinrich events. Earth and Planetary Science Letters, v.
146, n. 1-2, p. 13-27 1997.
VIDINHA, J. M.; ROCHA, F.; ANDRADE, C.; GOMES, C. Mineralogical characterization
of the fine fraction of the beach and dune sediments situated between Espinho and Torreira
(Portugal). Cuaternary Geomorfology, v. 12, n. 49-56, 1998.

140
VILLALBA, R.; GROSJEAN, M.; KIEFER, T. Long-term multi-proxy climate
reconstructions and dynamics in South America (LOTRED-SA): State of the art and
perspectives. Palaeogeography, Palaeoclimatology, Palaeoecology, v. 281, n. 3-4, p. 175-
179 2009.
VROON, P. Z.; VANBERGEN, M. J.; KLAVER, G. J.; WHITE, W. M. Strontium,
Neodymium, and Lead Isotopic and Trace-Element Signatures of the East Indonesian
Sediments - Provenance and Implications for Banda Arc Magma Genesis. Geochimica Et
Cosmochimica Acta, v. 59, n. 12, p. 2573-2598 1995.
WAELBROECK, C.; LABEYRIE, L.; MICHEL, E.; DUPLESSY, J. C.; MCMANUS, J. F.;
LAMBECK, K.; BALBON, E.; LABRACHERIE, M. Sea-level and deep water temperature
changes derived from benthic foraminifera isotopic records. Quaternary Science Reviews, v.
21, n. 1-3, p. 295-305 2002.
WAINER, I.; TASCHETTO, A. S. Climatologia na região entre o Cabo de São Tomé
(RJ) e o Chuí (RS). Diagnóstico para os períodos relativos aos levantamentos pesqueiros do
Programa REVIZEE. In: ROSSI-WONGTSHOWSKI, C. L. D. B. e MADUREIRA, L. S.-P. (Ed.).
O ambiente oceanográfico da plataforma continental e do talude na região Sul/Sudeste
do Brasil: Edusp, 2006. p.121-160.
WALSH, J. J. Importance of Continental Margins in the Marine Biogeochemical Cycling
of Carbon and Nitrogen. Nature, v. 350, n. 6313, p. 53-55 1991.
WANG, X. F.; AULER, A. S.; EDWARDS, R. L.; CHENG, H.; ITO, E.; SOLHEID, M.
Interhemispheric anti-phasing of rainfall during the last glacial period. Quaternary Science
Reviews, v. 25, n. 23-24, p. 3391-3403 2006.
WANG, X. F.; AULER, A. S.; EDWARDS, R. L.; CHENG, H.; ITO, E.; WANG, Y. J.;
KONG, X. G.; SOLHEID, M. Millennial-scale precipitation changes in southern Brazil over the
past 90,000 years. Geophysical Research Letters, v. 34, n. 23, 2007.
WANNER, H.; BEER, J.; BUTIKOFER, J.; CROWLEY, T. J.; CUBASCH, U.;
FLUCKIGER, J.; GOOSSE, H.; GROSJEAN, M.; JOOS, F.; KAPLAN, J. O.; KUTTEL, M.;
MULLER, S. A.; PRENTICE, I. C.; SOLOMINA, O.; STOCKER, T. F.; TARASOV, P.; WAGNER,
M.; WIDMANN, M. Mid- to Late Holocene climate change: an overview. Quaternary Science
Reviews, v. 27, n. 19-20, p. 1791-1828 2008.
WANNER, H.; SOLOMINA, O.; GROSJEAN, M.; RITZ, S. P.; JETEL, M. Structure and
origin of Holocene cold events. Quaternary Science Reviews, v. 30, n. 21-22, p. 3109-3123
2011.
WEFER, G.; BERGER, W. H.; BIJMA, J.; FISHER, G. Clues to the Ocean histoty: a
brief overview of proxies. In: FISHER, G. e WEFER, G. (Ed.). Use of proxies in

141
Paleoceanography: examples from the South Atlantic. Berlin: Springer-Verlag, 1999. cap. 1-
68,
WELDEAB, S.; EMEIS, K. C.; HEMLEBEN, C.; VENNEMENN, T. W.; SCHULZ, H. Sr
and Nd isotope composition of Late Pleistocene sapropels and nonsapropelic sediments from
the Eastern Mediterranean Sea: Implications for detrital influx and climatic conditions in the
source areas. Geochimica Et Cosmochimica Acta, v. 66, n. 20, p. 3585-3598 2002.
WELDEAB, S.; FRANK, M.; STICHEL, T.; HALEY, B.; SANGEN, M. Spatio-temporal
evolution of the West African monsoon during the last deglaciation. Geophysical Research
Letters, v. 38, 2011.
WELDEAB, S.; SCHNEIDER, R. R.; KÖLLING, M. Deglacial sea surface temperature
and salinity increase in the western tropical Atlantic in synchrony with high latitude climate
instabilities. Earth and Planetary Science Letters, v. 241, n. 3-4, p. 699-706 2006.
WELDEAB, S.; SIEBEL, W.; WEHAUSEN, R.; EMEIS, K. C.; SCHMIEDL, G.;
HEMLEBEN, C. Late Pleistocene sedimentation in the Western Mediterranean Sea:
implications for productivity changes and climatic conditions in the catchment areas.
Palaeogeography Palaeoclimatology Palaeoecology, v. 190, p. 121-137 2003.
WOLLENBURG, J. E.; KNIES, J.; MACKENSEN, A. High-resolution paleoproductivity
fluctuations during the past 24 kyr as indicated by benthic foraminifera in the marginal Arctic
Ocean. Palaeogeography, Palaeoclimatology, Palaeoecology, v. 204, n. 3-4, p. 209-238
2004.
WOLLENBURG, J. E.; KUHNT, W. The response of benthic foraminifers to carbon flux
and primary production in the Artic Ocean. Marine Micropaleontology, v. 40, p. 189-231 2000.
ŽARIĆ, S.; DONNER, B.; FISCHER, G.; MULITZA, S.; WEFER, G. Sensitivity of
planktic foraminifera to sea surface temperature and export production as derived from
sediment trap data. Marine Micropaleontology, v. 55, n. 1-2, p. 75-105 2005.
ZARRIESS, M.; MACKENSEN, A. Testing the impact of seasonal phytodetritus
deposition on delta C-13 of epibenthic foraminifer Cibicidoides wuellerstorfi: A 31,000 year high-
resolution record from the northwest African continental slope. Paleoceanography, v. 26,
2011.
ZEMBRUSCKI, S. G. Geomorfologia da margem continental sul brasileira e das bacias
oceânicas adjacentes. In: CHAVES, H. A. F. (Ed.). Geomorfologia da margem continental
brasileira e das bacias oceânicas adjacentes. Série Projeto REMAC. Rio de Janeiro:
PETROBRAS-CENPES-DINTEP, v.7, 1979. p.129-177.
ZHANG, R.; DELWORTH, T. L. Simulated tropical response to a substantial weakening
of the Atlantic thermohaline circulation. Journal of Climate, v. 18, n. 12, p. 1853-1860 2005.

142
ZHOU, J. Y.; LAU, K. M. Does a monsoon climate exist over South America? Journal
of Climate, v. 11, n. 5, p. 1020-1040 1998.

143
Plate 1
Benthic foraminifera - A. angulosa (a, b); B. subspinensis (c, d); Brizalina spp. (e, broken specimen); B. marginata (f); B. elegantissima (j); C. ungerianus (h,i); G. subglobosa (l, m); and G. umbonata (n,o,p). Planktonic foraminifera – G. ruber (p) (j,k).

144
Plate 2
Benthic foraminifera – Epistominella spp. (a, b, bronke specimens); I. norcrossi (c,d); and S.
earlandi (e,f).

145
Appendix 1 - Main sedimentological (grain size) and geochemical (sedimentary organic
matter and inorganic constituents, mineralogy, and planktonic G. ruber (p) isotopic
composition) data obtained for core 7605. (CD)
Appendix 2 – Core 7605 benthic foraminifera community data, identified taxa
microhabitat classification and relative frequency (%), and values of density (tests·10cc-
1), pecentages of fragments, non-identified specimens, epifauna and infauna specimens,
productivity indexes BFHP (%) and BFAR (tests•cm-2
•kyr-1
) and ecological parameters
richness (S), Shannon diversity (H') and equitability (J'). Where: epifauna (E) and infauna
(I). (CD)
Appendix 3 – Main sedimentological (grain size) and geochemical (sedimentary organic
matter and inorganic constituents, mineralogy, and planktonic G. ruber (p) isotopic and
elemental composition) data obtained for core 7610. (CD)
Appendix 4 – Main sedimentological (grain size) and geochemical (sedimentary organic
matter and inorganic constituents, mineralogy, and planktonic G. ruber (p) isotopic and
elemental composition) data obtained for core 7616. (CD)
Appendix 5 - Core 7616 benthic foraminifera community data, identified taxa microhabitat
classification and relative frequency (%), and values of density (tests·10cc-1
), pecentages
of fragments, non-identified specimens, epifauna and infauna specimens, productivity
indexes BFHP (%) and BFAR (tests•cm-2
•kyr-1
) and ecological parameters richness (S),
Shannon diversity (H') and equitability (J'). Where: epifauna (E) and infauna (I). (CD)

Ap
pen
dix
1 -
Main
sed
imen
tolo
gic
al (g
rain
siz
e)
an
d g
eo
ch
em
ical (s
ed
imen
tary
org
an
ic m
att
er
an
d in
org
an
ic c
on
sti
tuen
ts, m
inera
log
y,
an
d p
lan
kto
nic
G. ru
ber
(p
) is
oto
pic
co
mp
osit
ion
) d
ata
ob
tain
ed
fo
r co
re 7
605. W
here
, *
sta
nd
s f
or
ab
sen
ce o
f d
ata
.
Cla
y
(%)
Silt
(%)
San
d
(%)
Mean
dia
mete
r
(Φ)
CaC
o3
(%)
TO
C
(%)
Nto
t
(%)
δ1
3C
(‰
vs.
VP
DB
)
δ1
5N
(‰
vs.
VP
DB
)
CN
rati
o
061
13,
9956
,83
39,1
84,
6019
,60
*0,
13*
1,54
*2
639
4,59
66,9
328
,48
4,85
17,9
40,
880,
13-2
0,73
2,37
6,85
466
86,
4277
,98
15,6
05,
2820
,10
0,96
0,12
-20,
262,
298,
186
696
4,23
70,1
925
,58
4,88
17,7
60,
960,
13-2
0,54
3,13
7,09
872
64,
5262
,30
33,1
84,
7417
,34
0,87
0,12
-20,
741,
507,
0110
757
3,70
55,5
940
,71
4,56
16,9
10,
520,
12-2
0,55
2,10
4,41
1279
03,
8256
,31
39,8
64,
5717
,56
0,92
0,12
-20,
621,
597,
5414
824
4,98
74,8
620
,16
5,08
21,2
50,
820,
11-2
0,71
2,98
7,42
1686
0*
**
*18
,29
0,86
0,10
-20,
352,
408,
6418
899
**
**
20,2
40,
650,
10-2
0,67
3,59
6,53
2094
17,
0577
,43
15,5
25,
329,
470,
520,
11-2
0,03
2,35
4,61
2298
6*
**
*21
,06
0,67
0,10
-20,
323,
816,
4924
1034
4,92
75,9
419
,14
5,08
15,9
90,
970,
11-2
0,71
3,11
8,58
2610
865,
8179
,73
14,4
75,
2813
,43
0,68
0,12
-20,
842,
205,
8228
1142
5,62
79,2
215
,16
5,25
25,9
50,
810,
10-2
0,50
1,47
7,89
3012
02*
**
*18
,65
0,60
0,09
-20,
432,
546,
8532
1267
**
**
18,1
00,
610,
09-2
0,21
2,15
6,69
3413
374,
3674
,88
20,7
64,
9418
,12
0,78
0,11
-20,
502,
257,
2536
1412
3,80
74,9
721
,23
4,92
17,7
7*
0,10
*2,
76*
3814
923,
3867
,86
28,7
54,
6618
,79
*0,
09-2
0,60
2,21
*40
1578
**
**
17,6
00,
78*
-20,
05*
*42
1671
4,36
58,8
636
,78
4,65
15,5
30,
730,
09-2
0,24
2,60
7,70
4417
704,
4268
,56
27,0
24,
8216
,61
0,44
0,13
-20,
402,
293,
3246
1876
4,10
64,6
431
,26
4,68
17,6
90,
750,
11-2
0,59
2,03
6,76
4819
894,
4274
,21
21,3
74,
9317
,24
0,35
0,09
-20,
852,
514,
09
Gra
in s
ize
Esti
mate
d a
ge
(yr
cal. B
P)
Co
re d
ep
th
(cm
)
Sed
imen
tary
org
an
ic m
att
er

Co
nt.
Ap
pen
dix
1 -
Cla
y
(%)
Silt
(%)
San
d
(%)
Mean
dia
mete
r
(Φ)
CaC
o3
(%)
TO
C
(%)
Nto
t
(%)
δ1
3C
(‰
vs.
VP
DB
)
δ1
5N
(‰
vs.
VP
DB
)
CN
rati
o
5021
093,
9162
,23
33,8
64,
4316
,39
0,61
0,09
-20,
373,
896,
5152
2237
3,26
60,9
735
,78
4,44
17,2
10,
710,
09-2
0,78
3,13
8,35
5423
723,
1263
,91
32,9
74,
6117
,51
0,66
0,09
-20,
584,
587,
2656
2514
4,10
64,3
231
,58
4,63
15,7
20,
540,
08-2
0,85
3,59
6,90
5826
643,
1448
,81
48,0
54,
2016
,01
0,56
0,09
-20,
653,
516,
4660
2820
**
**
12,9
70,
44*
-20,
96*
*68
3507
3,49
54,4
642
,05
4,18
15,9
10,
520,
08-2
0,41
2,66
6,59
7036
94*
**
*15
,76
0,36
0,07
-20,
582,
095,
2272
3885
3,65
54,6
141
,73
4,23
14,1
20,
340,
06-2
0,97
3,95
5,60
7440
826,
5770
,46
22,9
75,
0314
,51
0,29
0,08
-20,
684,
273,
6376
4283
4,57
62,8
832
,56
4,57
14,0
20,
210,
07-2
1,15
2,98
2,86
7844
893,
0549
,25
47,7
04,
0613
,46
0,22
0,06
-21,
102,
713,
4580
4699
3,76
49,4
246
,81
3,90
13,6
5*
0,05
*2,
76*
8249
142,
6343
,09
54,2
83,
6813
,67
0,36
*-2
0,95
**
8451
323,
9847
,40
48,6
23,
8914
,06
*0,
06*
2,79
*86
5354
5,28
60,1
834
,54
4,43
15,2
5*
0,06
*2,
91*
8855
791,
6030
,97
67,4
23,
0314
,49
*0,
07*
3,95
*90
5807
3,10
46,6
450
,26
3,69
13,6
40,
190,
05-2
1,35
2,69
3,48
9260
388,
0771
,06
20,8
75,
1813
,83
0,19
*-2
0,93
**
9462
721,
2025
,86
72,9
52,
6213
,23
*0,
05*
3,69
*96
6508
4,14
43,7
052
,16
3,80
15,8
9*
0,05
*3,
37*
9867
463,
1935
,10
61,7
13,
2512
,73
**
**
*10
069
870,
5014
,14
85,3
62,
0611
,77
*0,
04*
3,60
*10
272
28*
**
*11
,12
*0,
25*
5,00
*10
474
71*
**
*11
,29
**
**
*10
677
15*
**
*12
,34
**
**
*
Co
re d
ep
th
(cm
)
Esti
mate
d a
ge
(yr
cal. B
P)
Gra
in s
ize
Sed
imen
tary
org
an
ic m
att
er

Co
nt.
Ap
pen
dix
1 -
Al (m
g/k
g)
Ca
(mg
/kg
)
Fe
(mg
/kg
)
Ti
(mg
/kg
)
Ba
(mg
/kg
)
Fe/C
a
rati
o
Ti/C
a
rati
o
Ba/A
l
rati
o
Ba/C
a
rati
o
061
171
442,
4021
712,
1038
209,
5039
16,2
620
0,43
1,76
0,18
0,00
0,01
263
949
619,
9016
593,
3026
098,
8025
19,1
020
5,41
1,57
0,15
0,00
0,01
466
885
653,
2019
817,
7042
872,
2041
40,5
920
3,56
2,16
0,21
0,00
0,01
669
697
751,
3025
540,
9054
588,
0052
39,8
420
4,77
2,14
0,21
0,00
0,01
872
612
5738
,00
2777
0,70
5642
9,70
5171
,05
197,
042,
030,
190,
000,
0110
757
7513
2,10
2106
8,50
4313
2,40
4433
,22
211,
212,
050,
210,
000,
0112
790
9202
1,00
2565
9,20
4930
7,90
4848
,92
216,
871,
920,
190,
000,
0114
824
7900
0,50
2056
6,90
4254
4,30
4273
,19
222,
372,
070,
210,
000,
0116
860
7582
1,50
2066
4,50
3970
0,40
4015
,22
226,
931,
920,
190,
000,
0118
899
9509
5,30
2853
6,50
5053
8,20
5193
,55
217,
141,
770,
180,
000,
0120
941
8717
0,20
2404
8,70
4733
7,90
4824
,42
215,
921,
970,
200,
000,
0122
986
*38
618,
00*
4276
,36
219,
78*
0,11
*0,
0124
1034
8909
7,00
2474
5,40
4744
5,00
4761
,17
221,
031,
920,
190,
000,
0126
1086
1229
54,0
031
546,
7053
064,
5047
91,0
222
7,57
1,68
0,15
0,00
0,01
2811
4267
514,
1021
500,
1037
149,
3037
02,4
419
4,34
1,73
0,17
0,00
0,01
3012
02*
2068
8,00
*42
14,3
021
7,57
*0,
20*
0,01
3212
6797
163,
5030
531,
4060
305,
3059
21,8
016
7,42
1,98
0,19
0,00
0,01
3413
3715
6983
,00
3742
7,70
6219
4,20
5908
,78
203,
711,
660,
160,
000,
0136
1412
*31
682,
40*
3537
,56
220,
85*
0,11
*0,
0138
1492
5424
9,80
1879
5,80
2474
4,40
2670
,90
233,
021,
320,
140,
000,
0140
1578
**
194,
64*
*42
1671
*32
180,
10*
3598
,07
244,
00*
0,11
*0,
0144
1770
9833
0,10
2537
4,40
3612
4,00
3582
,38
209,
631,
420,
140,
000,
0146
1876
6055
9,80
2307
5,80
3160
6,70
3459
,85
211,
041,
370,
150,
000,
0148
1989
*49
461,
80*
4464
,34
208,
07*
0,09
*0,
00
Sed
imen
tary
in
org
an
ic c
on
sti
tuen
ts
Co
re d
ep
th
(cm
)
Esti
mate
d a
ge
(yr
cal. B
P)

Co
nt.
Ap
pen
dix
1 -
Al (m
g/k
g)
Ca
(mg
/kg
)
Fe
(mg
/kg
)
Ti
(mg
/kg
)
Ba
(mg
/kg
)
Fe/C
a
rati
o
Ti/C
a
rati
o
Ba/A
l
rati
o
Ba/C
a
rati
o
5021
09*
4054
2,90
*38
97,3
720
6,74
*0,
10*
0,01
5222
3710
5267
,00
2930
7,30
3945
1,30
3747
,86
203,
301,
350,
130,
000,
0154
2372
*28
004,
30*
3231
,28
211,
77*
0,12
*0,
0156
2514
5817
4,80
2240
8,70
2691
7,50
2978
,28
221,
761,
200,
130,
000,
0158
2664
6041
4,40
2462
0,90
2878
5,90
3290
,65
217,
501,
170,
130,
000,
0160
2820
5389
9,30
2347
9,70
2629
6,50
3166
,17
230,
461,
120,
130,
000,
0168
3507
4432
1,20
1987
8,80
2213
9,50
2808
,73
250,
601,
110,
140,
010,
0170
3694
4064
0,10
1878
4,60
2117
9,80
2491
,39
231,
941,
130,
130,
010,
0172
3885
5014
4,90
2635
5,40
2593
6,60
3065
,52
214,
130,
980,
120,
000,
0174
4082
4035
1,20
1843
1,00
2022
2,50
2311
,25
208,
061,
100,
130,
010,
0176
4283
5259
1,50
2422
5,50
2549
5,50
2977
,97
220,
691,
050,
120,
000,
0178
4489
4606
8,00
2055
3,60
2292
5,50
2683
,58
206,
551,
120,
130,
000,
0180
4699
4471
3,00
2207
3,60
2123
2,20
2769
,18
217,
010,
960,
130,
000,
0182
4914
3054
5,50
1930
2,60
1418
0,60
2138
,73
193,
840,
730,
110,
010,
0184
5132
3244
9,60
1777
6,20
1461
9,50
1983
,30
266,
110,
820,
110,
010,
0186
5354
4446
1,40
2384
6,10
2206
2,40
2721
,07
221,
860,
930,
110,
000,
0188
5579
4757
0,50
2570
2,40
2444
2,30
3161
,87
212,
000,
950,
120,
000,
0190
5807
4267
7,40
2079
6,90
2052
1,50
2589
,22
225,
170,
990,
120,
010,
0192
6038
8526
0,40
3855
7,20
3626
0,10
4175
,08
218,
980,
940,
110,
000,
0194
6272
**
**
211,
40*
**
*96
6508
5446
8,30
2403
4,10
1978
0,10
2445
,64
239,
060,
820,
100,
000,
0198
6746
5654
0,20
3599
3,20
2390
1,80
2951
,93
269,
420,
660,
080,
000,
0110
069
8746
425,
8049
020,
4022
499,
7028
85,2
420
0,51
0,46
0,06
0,00
0,00
102
7228
2483
7,30
5207
0,10
1192
8,60
1501
,24
197,
970,
230,
030,
010,
0010
474
7120
010,
0079
446,
3082
28,0
410
59,4
219
5,95
0,10
0,01
0,01
0,00
106
7715
2344
5,50
2307
0,00
**
205,
050,
000,
000,
01*
Sed
imen
tary
in
org
an
ic c
on
sti
tuen
ts
Co
re d
ep
th
(cm
)
Esti
mate
d a
ge
(yr
cal. B
P)
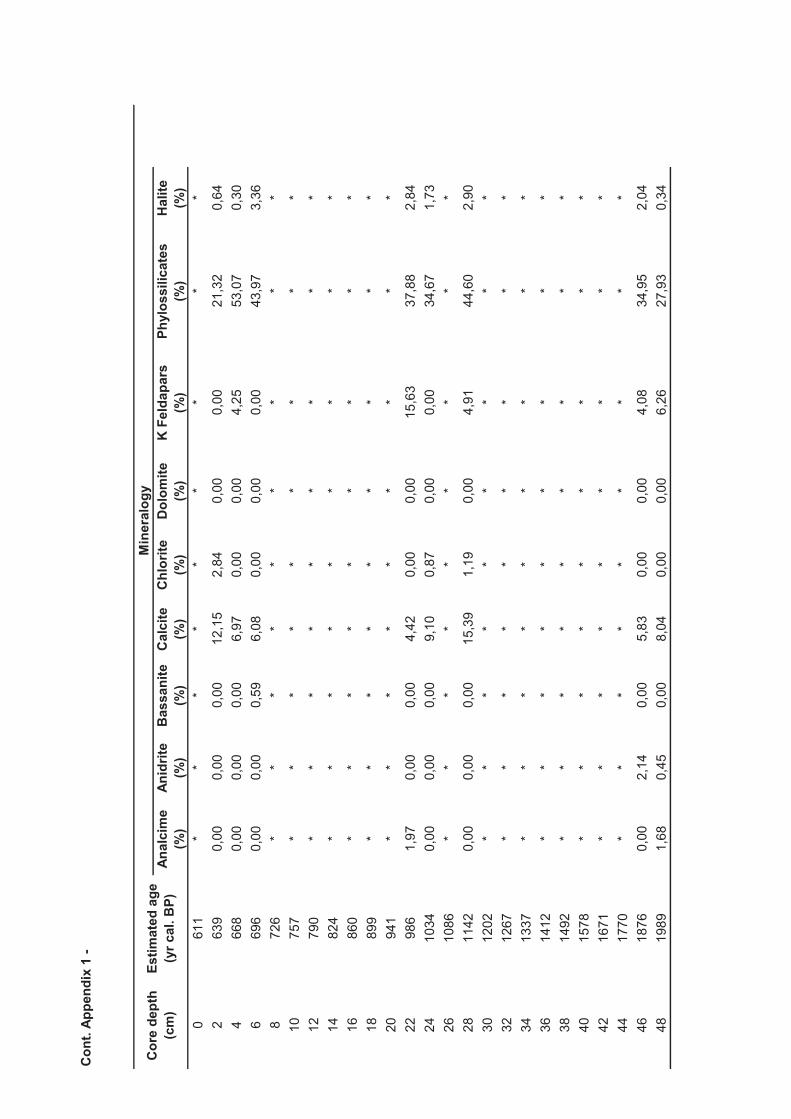
Co
nt.
Ap
pen
dix
1 -
An
alc
ime
(%)
An
idri
te
(%)
Bassan
ite
(%)
Calc
ite
(%)
Ch
lori
te
(%)
Do
lom
ite
(%)
K F
eld
ap
ars
(%)
Ph
ylo
ssilic
ate
s
(%)
Halite
(%)
061
1*
**
**
**
**
263
90,
000,
000,
0012
,15
2,84
0,00
0,00
21,3
20,
644
668
0,00
0,00
0,00
6,97
0,00
0,00
4,25
53,0
70,
306
696
0,00
0,00
0,59
6,08
0,00
0,00
0,00
43,9
73,
368
726
**
**
**
**
*10
757
**
**
**
**
*12
790
**
**
**
**
*14
824
**
**
**
**
*16
860
**
**
**
**
*18
899
**
**
**
**
*20
941
**
**
**
**
*22
986
1,97
0,00
0,00
4,42
0,00
0,00
15,6
337
,88
2,84
2410
340,
000,
000,
009,
100,
870,
000,
0034
,67
1,73
2610
86*
**
**
**
**
2811
420,
000,
000,
0015
,39
1,19
0,00
4,91
44,6
02,
9030
1202
**
**
**
**
*32
1267
**
**
**
**
*34
1337
**
**
**
**
*36
1412
**
**
**
**
*38
1492
**
**
**
**
*40
1578
**
**
**
**
*42
1671
**
**
**
**
*44
1770
**
**
**
**
*46
1876
0,00
2,14
0,00
5,83
0,00
0,00
4,08
34,9
52,
0448
1989
1,68
0,45
0,00
8,04
0,00
0,00
6,26
27,9
30,
34
Co
re d
ep
th
(cm
)
Esti
mate
d a
ge
(yr
cal. B
P)
Min
era
log
y

Co
nt.
Ap
pen
dix
1 -
An
alc
ime
(%)
An
idri
te
(%)
Bassan
ite
(%)
Calc
ite
(%)
Ch
lori
te
(%)
Do
lom
ite
(%)
K F
eld
ap
ars
(%)
Ph
ylo
ssilic
ate
s
(%)
Halite
(%)
5021
090,
000,
000,
0011
,67
0,00
0,00
6,23
17,5
10,
7852
2237
**
**
**
**
*54
2372
**
**
**
**
*56
2514
**
**
**
**
*58
2664
4,24
1,36
0,00
9,66
0,23
0,00
3,05
38,1
40,
3460
2820
4,23
0,00
0,00
9,38
0,00
0,78
0,00
36,4
80,
9168
3507
2,65
0,00
0,00
7,64
0,00
0,00
6,69
40,8
71,
7070
3694
**
**
**
**
*72
3885
0,00
1,56
0,00
8,35
0,20
0,00
15,8
218
,31
2,49
7440
820,
000,
000,
0011
,13
0,31
4,17
6,03
9,28
2,09
7642
83*
**
**
**
**
7844
89*
**
**
**
**
8046
990,
001,
040,
007,
530,
520,
007,
0151
,91
0,91
8249
143,
770,
400,
009,
510,
000,
001,
6636
,97
1,51
8451
320,
900,
000,
008,
690,
241,
276,
8818
,10
1,99
8653
54*
**
**
**
**
8855
79*
**
**
**
**
9058
071,
290,
390,
009,
260,
000,
0010
,58
30,8
54,
1992
6038
1,32
0,71
0,00
9,12
0,00
1,32
4,50
19,8
31,
3294
6272
1,26
0,00
0,00
13,3
30,
000,
006,
0642
,40
3,43
9665
08*
**
**
**
**
9867
46*
**
**
**
**
100
6987
**
**
**
**
*10
272
281,
310,
600,
0011
,65
0,00
0,00
4,78
36,5
81,
4910
474
713,
670,
000,
008,
810,
000,
004,
4138
,55
2,75
106
7715
0,49
0,00
0,00
10,6
50,
001,
316,
3147
,32
0,00
Co
re d
ep
th
(cm
)
Esti
mate
d a
ge
(yr
cal. B
P)
Min
era
log
y

Co
nt.
Ap
pen
dix
1 -
Mag
n/M
ag
he
(%)
Op
al C
/CT
(%)
Pla
gio
cla
se
(%)
Pir
ite (
%)
Qu
art
z
(%)
Sid
eri
te (
%)
Zeó
lito
s
(%)
DM
ind
ex
FD
M/F
CM
ind
ex
061
1*
**
**
**
**
263
90,
009,
0026
,44
1,07
38,3
80,
000,
0059
,70
0,33
466
80,
005,
467,
281,
5220
,70
0,45
0,00
78,0
11,
656
696
1,72
6,72
6,40
1,44
29,7
40,
000,
0073
,71
1,22
872
6*
**
**
**
**
1075
7*
**
**
**
**
1279
0*
**
**
**
**
1482
4*
**
**
**
**
1686
0*
**
**
**
**
1889
9*
**
**
**
**
2094
1*
**
**
**
**
2298
60,
006,
954,
423,
1622
,73
0,00
0,00
76,2
40,
8924
1034
0,00
13,8
710
,40
0,65
29,5
80,
000,
0064
,25
0,87
2610
86*
**
**
**
**
2811
420,
008,
034,
010,
0920
,07
0,00
0,00
69,5
81,
5430
1202
**
**
**
**
*32
1267
**
**
**
**
*34
1337
**
**
**
**
*36
1412
**
**
**
**
*38
1492
**
**
**
**
*40
1578
**
**
**
**
*42
1671
**
**
**
**
*44
1770
**
**
**
**
*46
1876
0,00
1,75
5,24
0,29
43,6
90,
000,
0082
,72
0,66
4819
891,
037,
1513
,85
0,45
32,8
40,
000,
0067
,02
0,53
Co
re d
ep
th
(cm
)
Esti
mate
d a
ge
(yr
cal. B
P)
Min
era
log
y
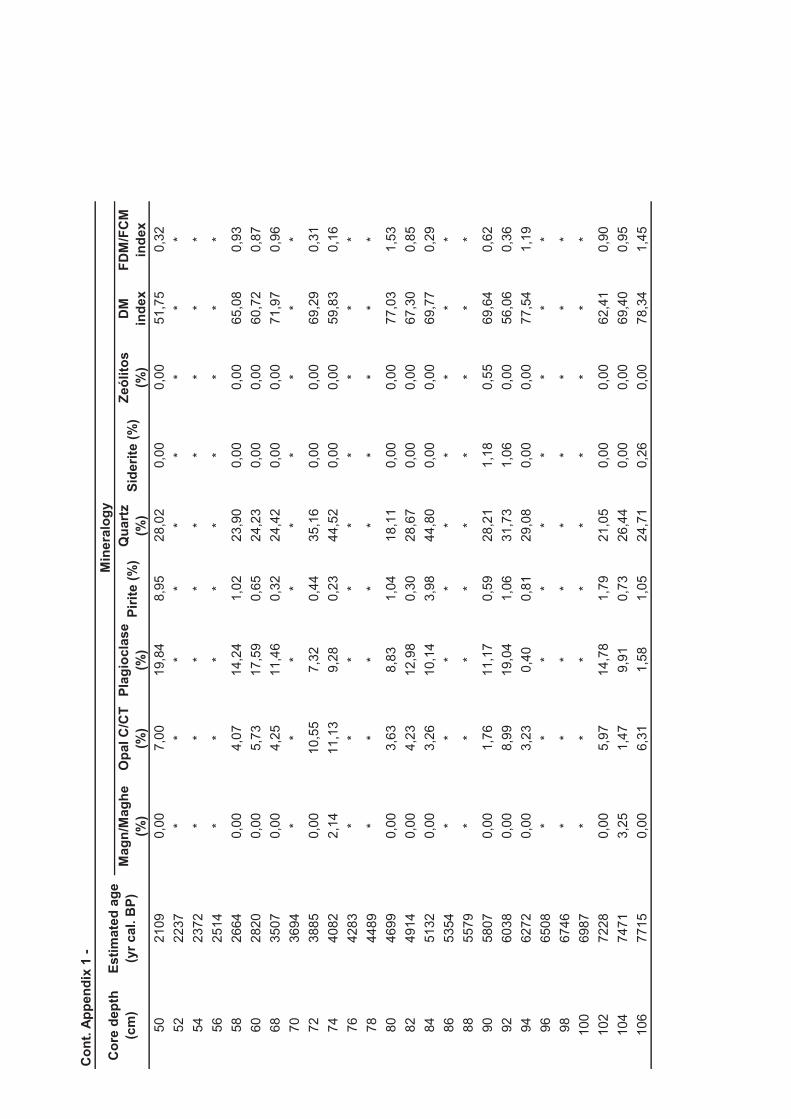
Co
nt.
Ap
pen
dix
1 -
Mag
n/M
ag
he
(%)
Op
al C
/CT
(%)
Pla
gio
cla
se
(%)
Pir
ite (
%)
Qu
art
z
(%)
Sid
eri
te (
%)
Zeó
lito
s
(%)
DM
ind
ex
FD
M/F
CM
ind
ex
5021
090,
007,
0019
,84
8,95
28,0
20,
000,
0051
,75
0,32
5222
37*
**
**
**
**
5423
72*
**
**
**
**
5625
14*
**
**
**
**
5826
640,
004,
0714
,24
1,02
23,9
00,
000,
0065
,08
0,93
6028
200,
005,
7317
,59
0,65
24,2
30,
000,
0060
,72
0,87
6835
070,
004,
2511
,46
0,32
24,4
20,
000,
0071
,97
0,96
7036
94*
**
**
**
**
7238
850,
0010
,55
7,32
0,44
35,1
60,
000,
0069
,29
0,31
7440
822,
1411
,13
9,28
0,23
44,5
20,
000,
0059
,83
0,16
7642
83*
**
**
**
**
7844
89*
**
**
**
**
8046
990,
003,
638,
831,
0418
,11
0,00
0,00
77,0
31,
5382
4914
0,00
4,23
12,9
80,
3028
,67
0,00
0,00
67,3
00,
8584
5132
0,00
3,26
10,1
43,
9844
,80
0,00
0,00
69,7
70,
2986
5354
**
**
**
**
*88
5579
**
**
**
**
*90
5807
0,00
1,76
11,1
70,
5928
,21
1,18
0,55
69,6
40,
6292
6038
0,00
8,99
19,0
41,
0631
,73
1,06
0,00
56,0
60,
3694
6272
0,00
3,23
0,40
0,81
29,0
80,
000,
0077
,54
1,19
9665
08*
**
**
**
**
9867
46*
**
**
**
**
100
6987
**
**
**
**
*10
272
280,
005,
9714
,78
1,79
21,0
50,
000,
0062
,41
0,90
104
7471
3,25
1,47
9,91
0,73
26,4
40,
000,
0069
,40
0,95
106
7715
0,00
6,31
1,58
1,05
24,7
10,
260,
0078
,34
1,45
Co
re d
ep
th
(cm
)
Esti
mate
d a
ge
(yr
cal. B
P)
Min
era
log
y

Co
nt.
Ap
pen
dix
1 -
δ1
3C
(‰
, V
PD
B)
δ1
8O
(‰
, V
PD
B)
061
11,
84-1
,28
**
263
91,
94-1
,01
**
466
81,
29-0
,81
**
669
61,
83-0
,92
**
872
62,
21-0
,95
**
1075
71,
91-0
,91
**
1279
01,
71-1
,14
**
1482
4*
**
*
1686
02,
05-1
,13
**
1889
9*
**
*
2094
11,
83-0
,63
23,7
50,
8722
986
1,88
-1,1
724
,16
0,42
2410
341,
14-1
,14
**
2610
86*
**
*
2811
421,
83-1
,57
24,3
30,
0530
1202
1,98
-1,0
923
,97
0,46
3212
67*
**
*
3413
371,
94-1
,48
24,7
30,
2336
1412
1,82
-1,0
424
,61
0,65
3814
921,
88-0
,83
24,7
20,
8840
1578
1,53
-0,9
724
,41
0,68
4216
711,
59-0
,95
24,6
10,
7444
1770
1,70
-0,7
724
,60
0,91
4618
761,
53-1
,17
**
4819
891,
51-1
,05
25,2
80,
78
δ1
8O
w-i
vc (
‰,
SM
OW
)
G. ru
ber
(p)
iso
top
ic c
om
po
sit
ion
co
re 7
606 a
lken
on
e
based
tem
pera
ture
(°C
,
Bic
eg
o, 2005)
Co
re d
ep
th
(cm
)
Esti
mate
d a
ge
(yr
cal. B
P)
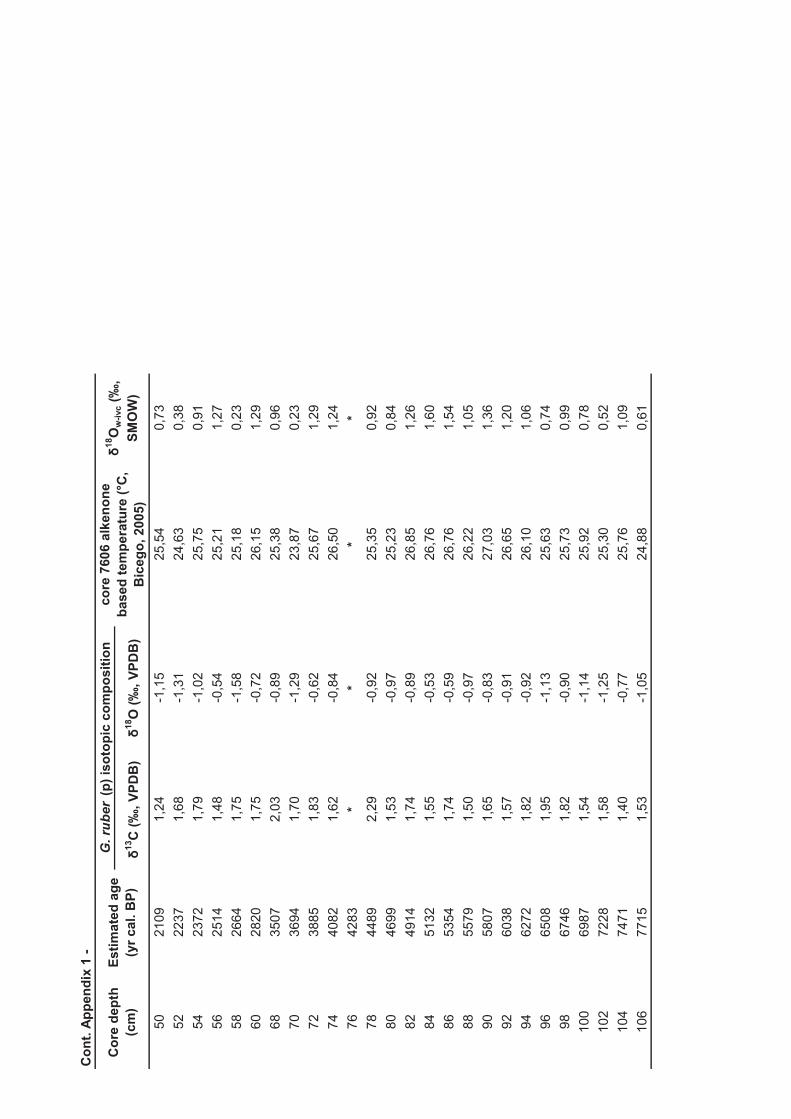
Co
nt.
Ap
pen
dix
1 -
δ1
3C
(‰
, V
PD
B)
δ1
8O
(‰
, V
PD
B)
5021
091,
24-1
,15
25,5
40,
7352
2237
1,68
-1,3
124
,63
0,38
5423
721,
79-1
,02
25,7
50,
9156
2514
1,48
-0,5
425
,21
1,27
5826
641,
75-1
,58
25,1
80,
2360
2820
1,75
-0,7
226
,15
1,29
6835
072,
03-0
,89
25,3
80,
9670
3694
1,70
-1,2
923
,87
0,23
7238
851,
83-0
,62
25,6
71,
2974
4082
1,62
-0,8
426
,50
1,24
7642
83*
**
*
7844
892,
29-0
,92
25,3
50,
9280
4699
1,53
-0,9
725
,23
0,84
8249
141,
74-0
,89
26,8
51,
2684
5132
1,55
-0,5
326
,76
1,60
8653
541,
74-0
,59
26,7
61,
5488
5579
1,50
-0,9
726
,22
1,05
9058
071,
65-0
,83
27,0
31,
3692
6038
1,57
-0,9
126
,65
1,20
9462
721,
82-0
,92
26,1
01,
0696
6508
1,95
-1,1
325
,63
0,74
9867
461,
82-0
,90
25,7
30,
9910
069
871,
54-1
,14
25,9
20,
7810
272
281,
58-1
,25
25,3
00,
5210
474
711,
40-0
,77
25,7
61,
0910
677
151,
53-1
,05
24,8
80,
61
δ1
8O
w-i
vc (
‰,
SM
OW
)
G. ru
ber
(p)
iso
top
ic c
om
po
sit
ion
Co
re d
ep
th
(cm
)
Esti
mate
d a
ge
(yr
cal. B
P)
co
re 7
606 a
lken
on
e
based
tem
pera
ture
(°C
,
Bic
eg
o, 2005)

Ap
pen
dix
2 -
Co
re 7
605 b
en
thic
fo
ram
inif
era
co
mm
un
ity d
ata
, id
en
tifi
ed
taxa m
icro
hab
itat
cla
ssif
icati
on
an
d r
ela
tiv
e f
req
uen
cy (
%),
an
d
valu
es o
f to
tal d
en
sit
y (
tests
·10cc-1
), p
ecen
tag
es o
f fr
ag
men
ts, n
on
-id
en
tifi
ed
sp
ecim
en
s, ep
ifau
na a
nd
in
fau
na s
pecim
en
s, p
rod
ucti
vit
y
ind
exes B
FH
P (
%)
an
d B
FA
R (
tests
•cm
-2•k
yr-1
) an
d e
co
log
ical p
ara
mete
rs r
ich
ness (
S),
Sh
an
no
n d
ivers
ity (
H')
an
d e
qu
itab
ilit
y (
J')
. W
here
:
ep
ifau
na (
E)
an
d in
fau
na (
I).
611
824
941
Am
mo
nia
be
ccari
i (L
inn
é,
1758)
IM
urra
y, 1
991
- ge
nera
Am
mon
ia0,
750,
000,
00A
mm
on
ia s
pp
.I
Mur
ray,
199
1 0,
000,
000,
00A
mp
hic
ory
na
scala
ris
(B
ats
ch
, 1791)
IF
onta
nier
et a
l., 2
003
- ge
nera
Am
phyc
orin
a0,
000,
000,
00A
mp
hic
ory
na
sp
p.
IF
onta
nier
et a
l., 2
003
0,00
0,00
0,00
An
gu
log
eri
na a
ng
ulo
sa
(W
illi
am
so
n,
1858)
IC
orlis
s, 1
985;
Cor
liss
e C
hen,
198
825
,53
20,0
323
,36
An
gu
log
eri
na
sp
p.
IC
orlis
s, 1
985;
Cor
liss
e C
hen,
198
90,
751,
590,
82B
olivin
a a
lba
tro
ssi
Cu
sh
man
, 1922
IM
urra
y, 1
991;
Fon
tani
er e
t al.,
200
3 -
gene
ra B
oliv
ina
0,00
0,00
0,00
Bo
livin
a d
on
iezi
Cu
sh
man
& W
icken
de
n,
1929
IC
orlis
s, 1
985;
Cor
liss
e C
hen,
198
80,
000,
000,
00B
olivin
a p
seu
do
plicata
Hero
n-A
llen
& E
arl
an
d,
1930
IM
urra
y, 1
991;
Fon
tani
er e
t al.,
200
3 -
gene
ra B
oliv
ina
0,00
0,00
0,00
Bo
livin
a p
ulc
he
lla (
d’O
rbig
ny,
1839)
IM
urra
y, 1
991;
Fon
tani
er e
t al.,
200
3 -
gene
ra B
oliv
ina
0,00
0,00
0,00
Bo
livin
a p
ulc
he
lla f
. p
rim
itiv
a C
us
hm
an
, 1930
IM
urra
y, 1
991;
Fon
tani
er e
t al.,
200
3 -
gene
ra B
oliv
ina
0,00
0,23
0,00
Bo
livin
a s
em
inu
da
Cu
sh
man
, 1911
IM
urra
y, 1
991;
Fon
tani
er e
t al.,
200
3 -
gene
ra B
oliv
ina
0,00
0,00
0,00
Bo
livin
a s
kag
err
aken
sis
Qvale
& N
iga
m,
1985
IM
urra
y, 1
991;
Fon
tani
er e
t al.,
200
3 -
gene
ra B
oliv
ina
0,00
0,00
0,00
Bo
livin
a s
ub
sp
ine
nsis
Cu
sh
man
, 1922
IM
urra
y, 1
991;
Fon
tani
er e
t al.,
200
3 -
gene
ra B
oliv
ina
0,00
0,00
0,61
Bo
livin
a t
ran
slu
cen
s P
hle
ge
r &
Park
er,
1951
IM
urra
y, 1
991;
Fon
tani
er e
t al.,
200
3 -
gene
ra B
oliv
ina
0,00
0,00
0,00
Bo
livin
a s
p.1
IM
urra
y, 1
991;
Fon
tani
er e
t al.,
200
3 -
gene
ra B
oliv
ina
0,00
0,00
0,00
Bo
livin
a s
pp
.
IC
orlis
s,19
85; M
urra
y, 1
991
0,25
0,00
0,20
Bri
zalin
a o
rdin
ari
a (
Ph
leg
er
& P
ark
er,
1952)
IM
urra
y, 1
991;
Fon
tani
er e
t al.,
200
3 -
gene
ra B
rizal
ina
0,00
0,00
0,41
Bri
zalin
a s
path
ula
ta (
Wil
liam
so
n,
1858)
IM
urra
y, 1
991;
Fon
tani
er e
t al.,
200
3 -
gene
ra B
rizal
ina
0,00
0,00
0,00
Bri
zalin
a s
ub
aen
ari
en
sis
(C
us
hm
an
, 1922)
IC
orlis
s, 1
985;
Cor
liss
e C
hen,
198
81,
251,
591,
64B
rizalin
a s
p.1
IM
urra
y, 1
991;
Fon
tani
er e
t al.,
200
3 -
gene
ra B
rizal
ina
0,25
0,00
0,00
Bri
zalin
a s
p.2
IM
urra
y, 1
991;
Fon
tani
er e
t al.,
200
3 -
gene
ra B
rizal
ina
0,00
0,00
0,00
Bri
zalin
a s
pp
.I
Mur
ray,
199
1; F
onta
nier
et a
l., 2
003
- ge
nera
Briz
alin
a0,
251,
590,
41B
uc
cella p
eru
via
na
(d'O
rbig
ny,
1839)
IM
urra
y, 1
991
- ge
nera
Buc
cella
0,00
0,00
0,00
Bu
ccella s
pp
.I
Mur
ray,
199
10,
000,
230,
00B
ulim
ina
acu
leata
d´O
rbig
ny,
1826
IM
urra
y, 1
991;
Fon
tani
er e
t al.,
200
2 -
gene
ra B
ulim
ina
2,00
0,23
0,41
Bu
lim
ina
elo
ng
ata
d’
Orb
ign
y,
1846
IM
urra
y, 1
991;
Fon
tani
er e
t al.,
200
2 -
gene
ra B
ulim
ina
0,00
0,23
0,00
Bu
lim
ina
gib
ba
Fo
rna
sin
i, 1
900
IM
urra
y, 1
991;
Fon
tani
er e
t al.,
200
2 -
gene
ra B
ulim
ina
1,00
0,00
0,00
Bu
lim
ina
marg
ina
ta d
’ O
rbib
ny,
1826
IM
urra
y, 1
991;
Cor
liss
e C
hen,
198
8; F
onta
nier
et a
l., 2
002
- ge
nera
Bul
imin
a3,
756,
839,
84B
ulim
ina
mexic
an
a C
us
hm
an
, 1922
IM
urra
y, 1
991;
Fon
tani
er e
t al.,
200
2 -
gene
ra B
ulim
ina
0,00
0,00
0,00
Bu
lim
ina
pseu
do
aff
inis
Kle
inp
ell
, 1938
IM
urra
y, 1
991;
Fon
tani
er e
t al.,
200
2 -
gene
ra B
ulim
ina
0,00
0,23
0,82
Bu
lim
ina
su
bu
lata
Cu
sh
man
& P
ark
er,
1947
IM
urra
y, 1
991;
Fon
tani
er e
t al.,
200
2 -
gene
ra B
ulim
ina
0,00
0,00
0,00
Ben
thic
fo
ram
inif
era
(%
)
Ben
thic
fo
ram
inif
era
taxa
Mic
roh
ab
itat
Refe
ren
ces
Esti
mate
d a
ge
(yr
cal.
BP
)
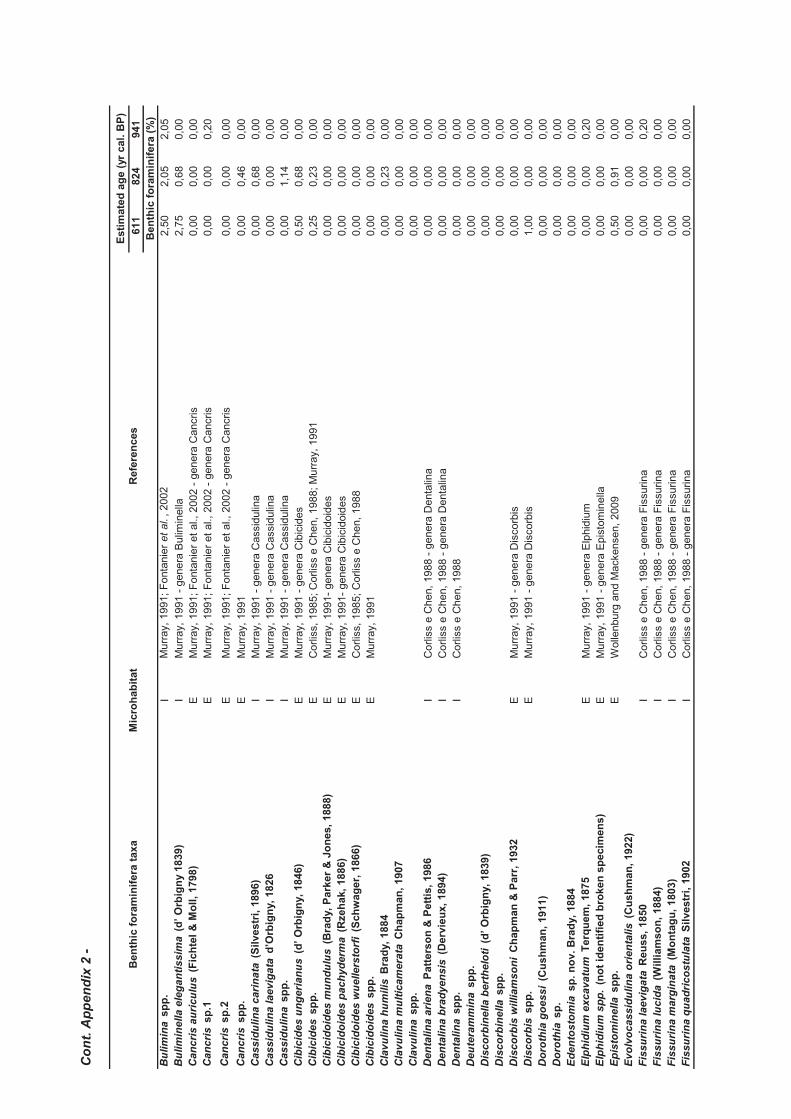
Co
nt.
Ap
pen
dix
2 -
611
824
941
Bu
lim
ina
sp
p.
IM
urra
y, 1
991;
Fon
tani
er e
t al.
, 200
22,
502,
052,
05B
ulim
ine
lla e
leg
an
tissim
a (
d’
Orb
ign
y 1
839)
IM
urra
y, 1
991
- ge
nera
Bul
imin
ella
2,75
0,68
0,00
Can
cri
s a
uri
cu
lus
(F
ich
tel
& M
oll
, 1798)
EM
urra
y, 1
991;
Fon
tani
er e
t al.,
200
2 -
gene
ra C
ancr
is0,
000,
000,
00C
an
cri
s s
p.1
EM
urra
y, 1
991;
Fon
tani
er e
t al.,
200
2 -
gene
ra C
ancr
is0,
000,
000,
20
Can
cri
s s
p.2
EM
urra
y, 1
991;
Fon
tani
er e
t al.,
200
2 -
gene
ra C
ancr
is0,
000,
000,
00C
an
cri
s s
pp
.E
Mur
ray,
199
1 0,
000,
460,
00C
assid
ulin
a c
ari
na
ta (
Sil
vestr
i, 1
896)
IM
urra
y, 1
991
- ge
nera
Cas
sidu
lina
0,00
0,68
0,00
Cassid
ulin
a laevig
ata
d’O
rbig
ny,
1826
IM
urra
y, 1
991
- ge
nera
Cas
sidu
lina
0,00
0,00
0,00
Cassid
ulin
a s
pp
.I
Mur
ray,
199
1 -
gene
ra C
assi
dulin
a0,
001,
140,
00C
ibic
ide
s u
ng
eri
an
us
(d
’ O
rbig
ny,
1846)
EM
urra
y, 1
991
- ge
nera
Cib
icid
es0,
500,
680,
00C
ibic
ide
s s
pp
.E
Cor
liss,
198
5; C
orlis
s e
Che
n, 1
988;
Mur
ray,
199
1 0,
250,
230,
00C
ibic
ido
ide
s m
un
du
lus
(B
rad
y,
Park
er
& J
on
es,
1888)
EM
urra
y, 1
991-
gen
era
Cib
icid
oide
s0,
000,
000,
00C
ibic
ido
ide
s p
ach
yd
erm
a (
Rzeh
ak,
1886)
EM
urra
y, 1
991-
gen
era
Cib
icid
oide
s0,
000,
000,
00C
ibic
ido
ide
s w
uellers
torf
i (S
ch
wag
er,
1866)
EC
orlis
s, 1
985;
Cor
liss
e C
hen,
198
80,
000,
000,
00C
ibic
ido
ide
s s
pp
.E
Mur
ray,
199
10,
000,
000,
00C
lavu
lin
a h
um
ilis
Bra
dy,
1884
0,00
0,23
0,00
Cla
vu
lin
a m
ult
icam
era
ta C
ha
pm
an
, 1907
0,00
0,00
0,00
Cla
vu
lin
a s
pp
.0,
000,
000,
00D
en
talin
a a
rien
a P
att
ers
on
& P
ett
is,
1986
IC
orlis
s e
Che
n, 1
988
- ge
nera
Den
talin
a0,
000,
000,
00D
en
talin
a b
rad
yen
sis
(D
erv
ieu
x,
1894)
IC
orlis
s e
Che
n, 1
988
- ge
nera
Den
talin
a0,
000,
000,
00D
en
talin
a s
pp
.I
Cor
liss
e C
hen,
198
80,
000,
000,
00D
eu
tera
mm
ina
sp
p.
0,00
0,00
0,00
Dis
co
rbin
ella b
ert
he
loti
(d
’ O
rbig
ny,
1839)
0,00
0,00
0,00
Dis
co
rbin
ella
sp
p.
0,00
0,00
0,00
Dis
co
rbis
william
so
ni
Ch
ap
man
& P
arr
, 1932
EM
urra
y, 1
991
- ge
nera
Dis
corb
is0,
000,
000,
00D
isco
rbis
sp
p.
EM
urra
y, 1
991
- ge
nera
Dis
corb
is1,
000,
000,
00D
oro
thia
go
essi
(Cu
sh
man
, 1911)
0,00
0,00
0,00
Do
roth
ia s
p.
0,00
0,00
0,00
Ed
en
tos
tom
ia s
p.
no
v.
Bra
dy,
1884
0,00
0,00
0,00
Elp
hid
ium
excavatu
m T
erq
ue
m,
1875
EM
urra
y, 1
991
- ge
nera
Elp
hidi
um0,
000,
000,
20E
lph
idiu
m s
pp
. (n
ot
ide
nti
fied
bro
ken
sp
ecim
en
s)
EM
urra
y, 1
991
- ge
nera
Epi
stom
inel
la0,
000,
000,
00E
pis
tom
ine
lla s
pp
.E
Wol
lenb
urg
and
Mac
kens
en, 2
009
0,50
0,91
0,00
Evo
lvo
cassid
ulin
a o
rien
talis
(C
us
hm
an
, 1922)
0,00
0,00
0,00
Fis
su
rin
a laevig
ata
Reu
ss,
1850
IC
orlis
s e
Che
n, 1
988
- ge
nera
Fis
surin
a0,
000,
000,
20F
issu
rin
a lu
cid
a (
Wil
liam
so
n,
1884)
IC
orlis
s e
Che
n, 1
988
- ge
nera
Fis
surin
a0,
000,
000,
00F
issu
rin
a m
arg
ina
ta (
Mo
nta
gu
, 1803)
IC
orlis
s e
Che
n, 1
988
- ge
nera
Fis
surin
a0,
000,
000,
00F
issu
rin
a q
ua
dri
co
stu
lata
Sil
vestr
i, 1
902
IC
orlis
s e
Che
n, 1
988
- ge
nera
Fis
surin
a0,
000,
000,
00
Ben
thic
fo
ram
inif
era
taxa
Mic
roh
ab
itat
Refe
ren
ces
Esti
mate
d a
ge
(yr
cal.
BP
)
Ben
thic
fo
ram
inif
era
(%
)

Co
nt.
Ap
pen
dix
2 -
611
824
941
Fis
su
rin
a s
tap
hy
lleari
a S
ch
wag
er,
1866
IC
orlis
s e
Che
n, 1
988
- ge
nera
Fis
surin
a0,
000,
000,
00F
issu
rin
a s
p.
1I
Cor
liss
e C
hen,
198
8 -
gene
ra F
issu
rina
0,00
0,00
0,00
Fis
su
rin
a s
p.
2I
Cor
liss
e C
hen,
198
8 -
gene
ra F
issu
rina
0,00
0,00
0,00
Fis
su
rin
a s
p.
3I
Cor
liss,
198
5; C
orlis
s e
Che
n, 1
988
0,00
0,00
0,00
Fis
su
rin
a s
pp
. I
Cor
liss
e C
hen,
198
8 -
gene
ra F
issu
rina
0,00
0,00
0,00
Fa
vu
lin
a h
exag
on
a (
Wil
liam
so
n,
1848)
IC
orlis
s e
Che
n, 1
988
- ge
nera
Fla
vulin
a0,
000,
000,
00F
avu
lin
a m
elo
(d
’ O
rbig
ny,
1839)
IC
orlis
s, 1
985;
Cor
liss
e C
hen,
198
80,
000,
000,
00F
urs
en
ko
ina
co
mp
lan
ata
(E
gg
er,
1893)
IM
urra
y, 1
991
- ge
nera
Fur
senk
oina
0,00
0,23
0,00
Fu
rsen
ko
ina
sp
p.
IM
urra
y, 1
991
- ge
nera
Fur
senk
oina
0,00
0,23
0,00
Gavelin
op
sis
pra
eg
eri
(H
ero
n-A
llen
& E
arl
an
d,
1913)
EM
urra
y, 1
991
- ge
nera
Gav
elin
opsi
s1,
000,
230,
00G
avelin
op
sis
um
bo
nif
er
(P
arr
, 1950)
EM
urra
y, 1
991
- ge
nera
Gav
elin
opsi
s0,
000,
000,
00G
avelin
op
sis
sp
p.
EC
orlis
s, 1
985;
Cor
liss
e C
hen,
198
80,
500,
680,
00G
lab
rate
lla m
ille
tti
(Wri
gh
t, 1
911)
EM
urra
y, 1
991
- ge
nera
Gla
brat
ella
0,00
0,23
0,00
Glo
bo
cassid
ulin
a m
inu
ta (
Cu
sh
man
, 1933)
IM
urra
y, 1
991
- ge
nera
Glo
boca
ssid
ulin
a0,
000,
000,
00G
lob
oc
assid
ulin
a s
ub
glo
bo
sa
(B
rad
y,
1881)
IM
urra
y, 1
991
- ge
nera
Glo
boca
ssid
ulin
a; F
onta
nier
et
al.
, 200
227
,53
21,4
018
,03
Glo
bo
cassid
ulin
a s
pp
.I
Mur
ray,
199
17,
264,
322,
87G
yro
idin
a a
ltif
orm
is R
.E.
& K
.C.
Ste
wart
, 1930
EF
onta
nier
et
al.
, 200
20,
000,
000,
00G
yro
idin
a u
mb
on
ata
(S
ilvestr
i, 1
898)
EM
urra
y, 1
991;
Cor
liss
e C
hen,
198
8 -
gene
ra G
yroi
dina
; Fon
tani
er e
t al.,
200
83,
005,
466,
76
Gyro
idin
a s
pp
.E
Fon
tani
er e
t al.
, 200
31,
250,
461,
02H
oe
glu
nd
ina
ele
ga
ns (
d’
Orb
ign
y,
1826)
EC
orlis
s, 1
985;
Fon
tani
er e
t al.,
2002
0,00
0,00
0,41
Isla
nd
iella n
orc
ros
si
(Cu
sh
man
, 1933)
IM
urra
y, 1
991-
gen
era
Isla
ndie
lla;
Cor
liss
e C
hen,
198
8 0,
001,
590,
82Is
lan
die
lla
sp
p.
IM
urra
y, 1
991
1,50
0,00
0,82
La
gen
a c
lavata
(d
’Orb
ign
y,
1846)
IC
orlis
s e
Che
n, 1
988
- ge
nera
Lag
ena
0,00
0,00
0,00
La
gen
a h
isp
idu
la C
us
hm
an
, 1913
IC
orlis
s e
Che
n, 1
988
- ge
nera
Lag
ena
0,00
0,00
0,00
La
gen
a laevis
(M
on
tag
u,
1803)
IC
orlis
s e
Che
n, 1
988
- ge
nera
Lag
ena
0,00
0,00
0,00
La
gen
a laevis
, f.
ten
uis
Wil
liam
so
n,
1848
IC
orlis
s e
Che
n, 1
988
- ge
nera
Lag
ena
0,00
0,00
0,00
La
gen
a laevis
, f.
typ
ica W
illi
am
so
n,
1848
IC
orlis
s e
Che
n, 1
988
- ge
nera
Lag
ena
0,00
0,00
0,00
La
gen
a s
tria
ta (
d’O
rbig
ny,
1839)
IC
orlis
s e
Che
n, 1
988
- ge
nera
Lag
ena
0,25
0,23
0,00
La
gen
a s
pp
.I
Cor
liss
e C
hen,
198
80,
000,
000,
00L
en
ticu
lin
a t
halm
an
i (H
essla
nd
, 1943)
EC
orlis
s, 1
985;
Cor
liss
e C
hen,
198
80,
000,
000,
00L
en
ticu
lin
a s
p.1
EM
urra
y, 1
991;
Fon
tani
er e
t al.,
200
2; 2
003
- ge
nera
Len
ticul
ina
0,00
0,00
0,00
Le
nti
cu
lin
a s
p.3
EM
urra
y, 1
991;
Fon
tani
er e
t al.,
200
2; 2
003
- ge
nera
Len
ticul
ina
0,00
0,00
0,00
Le
nti
cu
lin
a s
p.4
EM
urra
y, 1
991;
Fon
tani
er e
t al.,
200
2; 2
003
- ge
nera
Len
ticul
ina
0,00
0,00
0,00
Le
nti
cu
lin
a s
p.5
EM
urra
y, 1
991;
Fon
tani
er e
t al.,
200
2; 2
003
- ge
nera
Len
ticul
ina
0,00
0,00
0,00
Ben
thic
fo
ram
inif
era
taxa
Mic
roh
ab
itat
Refe
ren
ces
Esti
mate
d a
ge
(yr
cal.
BP
)
Ben
thic
fo
ram
inif
era
(%
)

Co
nt.
Ap
pen
dix
2 -
611
824
941
Le
nti
cu
lin
a s
p.6
EM
urra
y, 1
991;
Fon
tani
er e
t al.,
200
2; 2
003
- ge
nera
Len
ticul
ina
0,00
0,00
0,00
Le
nti
cu
lin
a s
pp
.E
Mur
ray,
199
10,
000,
000,
20L
iesb
us
ella s
p.
0,00
0,00
0,00
Lo
ba
tula
lo
ba
tula
(W
alk
er
& J
aco
b,
1798)
EW
olle
nbur
g an
d M
acke
nsen
, 200
90,
000,
000,
20M
elo
nis
ba
rleean
us
(W
illi
am
so
n,
1858)
IM
urra
y, 1
992;
Cor
liis
and
Che
n, 1
988
- ge
nera
Mel
onis
0,00
0,00
0,00
Melo
nis
sp
p.
IM
urra
y, 1
992;
Cor
liis
and
Che
n, 1
989
0,00
0,00
0,00
Milio
lin
ella s
ub
rotu
nd
a (
Mo
nta
gu
, 1803)
EC
orlis
s, 1
991
- M
iliol
ídeo
s 0,
000,
000,
00N
eo
len
ticu
lin
a v
ari
ab
ilis
(R
eu
ss,
1850)
EC
orlis
s, 1
985;
Cor
liss
e C
hen,
198
8 -
gene
ra N
eole
ntic
ulin
a0,
000,
000,
00N
on
ion
sp
.1I
Mur
ray,
199
1; F
onta
nier
et a
l., 2
002
- g
ener
a N
onio
n0,
000,
000,
00N
on
ion
sp
. I
Mur
ray,
199
1 ; F
onta
nier
et a
l., 2
002
0,00
0,00
0,20
No
nio
ne
lla t
urg
ida
(W
illi
am
so
n,
1858)
IC
orlis
s, 1
985;
Cor
liss
e C
hen,
198
80,
000,
000,
00N
on
ion
ella
sp
p.
IM
urra
y, 1
991
0,25
0,00
0,00
No
nio
no
ide
s g
rate
lou
pi
(d’O
rbig
ny,
1826)
IM
urra
y, 1
991
- ge
nera
Non
iono
ides
0,00
0,23
0,00
No
nio
no
ide
s s
p.1
IM
urra
y, 1
991
- ge
nera
Non
iono
ides
0,00
0,00
0,00
No
nio
no
ide
s s
pp
.I
Mur
ray,
199
1 0,
000,
000,
00O
olin
a a
lco
cki
(Wh
ite,
1956)
0,00
0,00
0,00
Oo
lin
a b
ore
alis
Lo
eb
lich
& T
ap
pa
n,
1954
0,00
0,00
0,00
Ori
do
rsalis s
pp
.E
Mur
ray,
199
10,
000,
000,
00O
rid
ors
alis u
mb
on
atu
s (
Reu
ss,
1851)
EM
urra
y, 1
991
- ge
nera
Orid
orsa
lis0,
000,
000,
00O
san
gu
riella u
mb
on
ifera
(C
us
hm
an
, 1933)
0,00
0,00
0,00
Para
cassid
ulin
a n
ipp
on
en
sis
(E
ad
e,
1969)
IC
orlis
s, 1
985;
Cor
liss
e C
hen,
198
8 -
gene
ra P
arac
assi
dulin
a0,
250,
000,
00P
lan
ulin
a u
mb
ilic
ata
EC
orlis
s, 1
985;
Cor
liss
e C
hen,
198
8; M
urra
y, 1
991
- ge
nera
Pla
nulin
a0,
000,
000,
00P
lan
ulin
a s
pp
.E
Cor
liss,
198
5; C
orlis
s e
Che
n, 1
988;
Mur
ray,
199
1 -
gene
ra P
lanu
lina
0,00
0,00
0,00
Po
lym
orp
hin
ella
sp
.0,
000,
000,
00P
rocero
lag
en
a g
racilis
(W
illi
am
so
n,
1848)
EC
orlis
s, 1
985;
Cor
liss
e C
hen,
198
80,
000,
230,
00P
rocero
lag
en
a s
eti
ge
ra M
ille
tt,
1901
0,00
0,00
0,00
Pseu
do
gau
dry
na
sp
. n
ov
. B
aker,
1960
0,00
0,23
0,20
Pseu
do
no
nio
n a
tlan
ticu
m
(Cu
sh
man
, 1936)
IC
orlis
s, 1
985;
Cor
liss
e C
hen,
198
8 -
gene
ra P
seud
onon
ion
0,75
0,00
0,41
Pu
len
ia q
ua
dri
lob
aI
Mur
ray,
199
1 -
gene
ra P
ulle
nia
0,00
0,00
0,00
Pu
llen
ia b
ullo
ide
s (
d’O
rbig
ny,
1846)
IM
urra
y, 1
991
- ge
nera
Pul
leni
a0,
000,
000,
00P
ullen
ia o
slo
en
sis
Fe
yli
ng
-Han
ssen
, 1954
IM
urra
y, 1
991
- ge
nera
Pul
leni
a0,
000,
000,
00P
ullen
ia q
uin
qu
elo
ba
(R
eu
ss,
1851)
IM
urra
y, 1
991
- ge
nera
Pul
leni
a0,
000,
000,
00P
yrg
o d
ep
ressa (
d’
Orb
ign
y,
1826)
EC
orlis
s, 1
991
- M
iliol
ídeo
s ; M
urra
y, 1
991
- ge
nera
Pyr
go0,
000,
000,
00P
yrg
o e
lon
ga
ta (
d’O
rbig
ny,
1826)
EC
orlis
s, 1
991
- M
iliol
ídeo
s ; M
urra
y, 1
991
- ge
nera
Pyr
go0,
000,
230,
00P
yrg
o m
urr
hin
a (
Sch
wag
er,
1866)
EC
orlis
s, 1
991
- M
iliol
ídeo
s ; M
urra
y, 1
991
- ge
nera
Pyr
go0,
000,
000,
00P
yrg
o n
asu
ta C
us
hm
an
, 1935
EC
orlis
s, 1
991
- M
iliol
ídeo
s ; M
urra
y, 1
991
- ge
nera
Pyr
go0,
000,
000,
00P
yrg
o o
blo
ng
a (
d´
Orb
ign
y,
1839)
EC
orlis
s, 1
991
- M
iliol
ídeo
s ; M
urra
y, 1
991
- ge
nera
Pyr
go0,
000,
000,
00
Ben
thic
fo
ram
inif
era
taxa
Mic
roh
ab
itat
Refe
ren
ces
Esti
mate
d a
ge
(yr
cal.
BP
)
Ben
thic
fo
ram
inif
era
(%
)

Co
nt.
Ap
pen
dix
2 -
611
824
941
Pyrg
o r
ing
en
s (
La
marc
k,
1804)
EC
orlis
s, 1
991
- M
iliol
ídeo
s ; M
urra
y, 1
991
- ge
nera
Pyr
go0,
000,
230,
00P
yrg
o s
p.1
EC
orlis
s, 1
991
- M
iliol
ídeo
s ; M
urra
y, 1
991
- ge
nera
Pyr
go0,
250,
000,
00
Pyrg
o s
p.2
EC
orlis
s, 1
991
- M
iliol
ídeo
s ; M
urra
y, 1
991
- ge
nera
Pyr
go0,
000,
000,
00
Pyrg
o s
p.3
EC
orlis
s, 1
991
- M
iliol
ídeo
s ; M
urra
y, 1
991
- ge
nera
Pyr
go0,
000,
000,
00
Pyrg
o s
p.4
EC
orlis
s, 1
991
- M
iliol
ídeo
s ; M
urra
y, 1
991
0,00
0,00
0,00
Pyrg
o s
pp
.E
Cor
liss,
199
1 -
Mili
olíd
eos
0,00
0,00
0,00
Qu
inq
ue
loc
ulin
a a
kn
eri
an
a d
’ O
rbig
ny,
1846
EC
orlis
s, 1
991
- M
iliol
ídeo
s ; M
urra
y, 1
991
- ge
nera
Qui
nque
locu
lina
0,00
0,00
0,00
Qu
inq
ue
loc
ulin
a a
myg
da
loid
es
(B
rad
y,
1884)
EC
orlis
s, 1
991
- M
iliol
ídeo
s ; M
urra
y, 1
991
- ge
nera
Qui
nque
locu
lina
0,00
0,00
0,00
Qu
inq
ue
loc
ulin
a a
tlan
tica
Bo
lto
vsko
y,
1957
EC
orlis
s, 1
991
- M
iliol
ídeo
s ; M
urra
y, 1
991
- ge
nera
Qui
nque
locu
lina
0,00
0,00
0,00
Qu
inq
ue
loc
ulin
a i
ntr
icata
(T
erq
ue
m,
1878)
EC
orlis
s, 1
991
- M
iliol
ídeo
s ; M
urra
y, 1
991
- ge
nera
Qui
nque
locu
lina
0,00
0,00
0,00
Qu
inq
ue
loc
ulin
a lam
arc
kia
na
d´O
rbig
ny,
1839
EC
orlis
s, 1
991
- M
iliol
ídeo
s ; M
urra
y, 1
991
- ge
nera
Qui
nque
locu
lina
0,25
0,00
0,61
Qu
inq
ue
loc
ulin
a m
ille
tti
(Wie
sn
er,
1923)
EC
orlis
s, 1
991
- M
iliol
ídeo
s ; M
urra
y, 1
991
- ge
nera
Qui
nque
locu
lina
0,00
0,00
0,00
Qu
inq
ue
loc
ulin
a s
pp
. E
Cor
liss,
199
1 -
Mili
olíd
eos
; Mur
ray,
199
10,
000,
230,
61R
os
alin
a g
lob
ula
ris
(d
’ O
rbig
ny,
1826)
EM
urra
y, 1
991
- ge
nera
Ros
alin
a0,
000,
000,
00R
os
alin
a s
p.1
EM
urra
y, 1
991
- ge
nera
Ros
alin
a0,
000,
000,
00R
os
alin
a s
p2
.E
Mur
ray,
199
1 -
gene
ra R
osal
ina
0,00
0,00
0,00
Ro
salin
a s
pp
.E
Mur
ray,
199
10,
000,
000,
00S
ara
cen
ari
a s
p.
0,00
0,00
0,20
Seab
roo
kia
earl
an
di
Wri
gh
t, 1
891
EH
einz
et a
l., 2
004
0,00
0,00
0,00
Sig
mo
ilo
ps
is s
ch
lum
be
rge
ri (
Sil
vestr
i, 1
904)
ED
i Ste
fano
et a
l., 2
010;
Pìp
per
and
Rei
chen
bach
er, 2
010
- ge
nera
Sig
moi
lops
is0,
500,
000,
00S
iph
on
ap
ert
a s
p.1
0,00
0,23
0,00
Sip
ho
nap
ert
a s
p.2
0,00
0,00
0,00
Sip
ho
nin
a b
rad
yan
a C
us
hm
an
, 1927
0,00
0,00
0,00
Sip
ho
nin
a s
p1
.0,
000,
000,
00S
pir
og
luti
na
sp
p.
EC
orlis
s, 1
985;
Cor
liss
e C
hen,
198
8; C
orlis
s, 1
991
0,00
0,00
0,00
Sp
iro
loc
ulin
a s
p.1
EC
orlis
s, 1
985;
Cor
liss
e C
hen,
198
8; C
orlis
s, 1
991
0,00
0,00
0,00
Sp
iro
loc
ulin
a s
p.2
EC
orlis
s, 1
985;
Cor
liss
e C
hen,
198
8; C
orlis
s, 1
992
0,00
0,00
0,00
Sp
iro
ple
cti
ne
lla w
rig
hti
i (S
ilvestr
i, 1
903)
0,00
0,00
0,00
Sta
info
rth
ia c
om
pla
na
ta (
Eg
ge
r, 1
895)
IB
uben
shch
ikov
a et
al.,
200
80,
000,
000,
00S
tain
fort
hia
sp
p.
IB
uben
shch
ikov
a et
al.,
200
80,
000,
000,
00T
extu
llari
a s
p.1
EC
orlis
s, 1
985;
Cor
liss
e C
hen,
198
8; M
urra
y, 1
991
0,00
0,00
0,00
Te
xtu
llari
a s
p.2
EC
orlis
s, 1
985;
Cor
liss
e C
hen,
198
8; M
urra
y, 1
991
0,00
0,00
0,00
Te
xtu
llari
a s
p.3
EC
orlis
s, 1
985;
Cor
liss
e C
hen,
198
8; M
urra
y, 1
991
0,00
0,00
0,00
Te
xtu
llari
a s
p.4
EC
orlis
s, 1
985;
Cor
liss
e C
hen,
198
8; M
urra
y, 1
991
0,00
0,00
0,00
Ben
thic
fo
ram
inif
era
taxa
Mic
roh
ab
itat
Refe
ren
ces
Esti
mate
d a
ge
(yr
cal.
BP
)
Ben
thic
fo
ram
inif
era
(%
)

Co
nt.
Ap
pen
dix
2 -
611
824
941
Te
xtu
llari
a s
pp
.E
Cor
liss,
198
5; C
orlis
s e
Che
n, 1
988;
Mur
ray,
199
10,
000,
000,
00T
rifa
rin
a a
ng
ulo
sa
(W
illi
am
so
n,
1858)
IC
orlis
s, 1
985;
Cor
liss
e C
hen,
198
8; M
urra
y, 1
991
- ge
nera
Trif
arin
a0,
000,
000,
00T
rifa
rin
a b
rad
yi
Cu
sh
man
, 1923
IC
orlis
s, 1
985;
Cor
liss
e C
hen,
198
8; M
urra
y, 1
991
- ge
nera
Trif
arin
a0,
000,
000,
00T
rilo
cu
lin
a s
p.2
EC
orlis
s, 1
991
- M
iliol
ídeo
s 0,
000,
000,
00T
rilo
cu
lin
a s
pp
.E
Cor
liss,
199
1 -
Mili
olíd
eos
0,00
0,68
0,00
Tri
loc
ulin
ella
sp
p.
EC
orlis
s, 1
991
- M
iliol
ídeo
s 0,
000,
000,
00U
vig
eri
na
au
be
rian
a d
’ O
rbig
ny,
1839
IM
urra
y, 1
991;
Fon
tani
er e
t al.,
200
2 -
gene
ra U
vige
rina
0,00
0,00
0,00
Uvig
eri
na
pere
gri
na
Cu
sh
man
, 1923
IM
urra
y, 1
991;
Cor
liss
e C
hen,
198
8 -
gene
ra U
vige
rina
0,00
0,23
0,00
Uvig
eri
na
sp
p.
IM
urra
y, 1
991
Fon
tani
er e
t al.,
200
2 -
gene
ra U
vige
rina
0,00
0,00
0,20
Valv
ulin
eri
a b
rad
yan
a (
Fo
rna
sin
i, 1
900)
IF
onta
nier
et
al.,
2002
0,
000,
000,
00
tota
l d
en
sit
y (
tests•10 c
c-1
)14
784
8160
8060
frag
men
ts (
%)
9,38
14,1
28,
68
no
t id
en
tifi
ed
(%
)0,
005,
000,
74E
(%
)7,
7610
,47
8,81
I (%
)80
,09
66,2
465
,57
BF
HP
in
de
x (
%)
14,2
714
,34
16,6
0
BF
AR
in
de
x (
tests
•cm
-2•k
yr-1
)10
6071
744
7178
3597
60R
2937
29H
'2,
192,
362,
16J'
0,65
0,65
0,64
Ben
thic
fo
ram
inif
era
(%
)
Ben
thic
fo
ram
inif
era
taxa
Mic
roh
ab
itat
Refe
ren
ces
Esti
mate
d a
ge
(yr
cal.
BP
)

Co
nt.
Ap
pen
dix
2 -
1034
1142
1202
1337
1492
1671
1876
2109
2372
2514
2664
3507
3694
4082
4283
Am
mo
nia
be
ccari
i (L
inn
é,
1758)
0,00
0,00
0,00
0,00
0,00
0,00
0,00
0,00
0,00
0,00
0,00
0,00
0,00
0,00
0,00
Am
mo
nia
sp
p.
0,00
0,00
0,00
0,00
0,00
0,22
0,20
0,00
0,00
0,00
0,00
0,00
0,00
0,00
0,00
Am
ph
ico
ryn
a s
cala
ris
(B
ats
ch
, 1791)
0,00
0,00
0,00
0,00
0,00
0,00
0,00
0,35
0,00
0,00
0,00
0,00
0,00
0,13
0,00
Am
ph
ico
ryn
a s
pp
.0,
000,
000,
000,
000,
000,
000,
000,
000,
000,
000,
000,
180,
170,
000,
00A
ng
ulo
ge
rin
a a
ng
ulo
sa
(W
illi
am
so
n,
1858)
13,7
619
,03
18,1
933
,68
32,0
712
,15
21,1
620
,15
17,9
525
,35
10,6
221
,82
2,42
19,1
817
,70
An
gu
log
eri
na
sp
p.
5,22
3,12
2,87
4,33
3,36
7,95
7,12
2,48
2,28
0,00
1,89
0,00
22,0
01,
781,
96B
olivin
a a
lba
tro
ssi
Cu
sh
man
, 1922
0,00
0,16
0,00
0,00
0,00
0,00
0,00
0,00
0,00
0,00
0,00
0,00
0,00
0,00
0,00
Bo
livin
a d
on
iezi
Cu
sh
man
& W
icken
de
n,
1929
0,24
0,00
0,00
0,00
0,19
0,00
0,00
0,00
0,00
0,00
0,00
0,00
0,00
0,13
0,00
Bo
livin
a p
seu
do
plicata
Hero
n-A
llen
& E
arl
an
d,
1930
0,00
0,00
0,00
0,00
0,00
0,00
0,41
0,00
0,00
0,00
0,24
0,00
0,17
0,00
0,10
Bo
livin
a p
ulc
he
lla (
d’O
rbig
ny,
1839)
0,00
0,00
0,00
0,00
0,00
0,00
0,00
0,00
0,00
0,00
0,00
0,00
0,00
0,00
0,00
Bo
livin
a p
ulc
he
lla f
. p
rim
itiv
a C
us
hm
an
, 1930
0,00
0,00
0,64
0,00
0,19
0,00
0,00
0,27
0,25
0,00
0,00
0,00
0,00
0,00
0,00
Bo
livin
a s
em
inu
da
Cu
sh
man
, 1911
0,00
0,00
0,00
0,00
0,19
0,00
0,00
0,00
0,00
0,00
0,00
0,00
0,00
0,00
0,00
Bo
livin
a s
kag
err
aken
sis
Qvale
& N
iga
m,
1985
0,00
0,00
0,00
0,00
0,00
0,00
0,00
0,09
0,00
0,00
0,00
0,00
0,00
0,00
0,00
Bo
livin
a s
ub
sp
ine
nsis
Cu
sh
man
, 1922
0,24
0,00
0,00
0,33
0,00
0,00
0,00
0,00
0,00
0,00
0,00
0,18
0,35
0,13
0,00
Bo
livin
a t
ran
slu
cen
s P
hle
ge
r &
Park
er,
1951
0,00
0,00
0,00
0,33
0,00
0,00
0,00
0,00
0,00
0,00
0,00
0,00
0,00
0,00
0,00
Bo
livin
a s
p.1
0,00
0,16
0,00
0,00
0,00
0,00
0,00
0,00
0,00
0,00
0,00
0,00
0,00
0,00
0,00
Bo
livin
a s
pp
.
0,00
0,16
0,00
0,00
0,00
0,00
0,20
0,00
0,25
0,00
0,71
0,00
0,17
0,00
0,00
Bri
zalin
a o
rdin
ari
a (
Ph
leg
er
& P
ark
er,
1952)
0,00
0,00
0,00
0,00
0,00
0,00
0,00
0,00
0,00
0,00
0,00
0,00
0,00
0,00
0,00
Bri
zalin
a s
path
ula
ta (
Wil
liam
so
n,
1858)
0,00
0,00
0,00
0,00
0,00
0,00
0,00
0,18
0,00
0,54
0,00
0,00
0,00
0,13
0,00
Bri
zalin
a s
ub
aen
ari
en
sis
(C
us
hm
an
, 1922)
1,66
0,33
0,96
0,33
2,42
0,44
0,61
0,88
1,26
2,16
0,00
1,79
1,39
0,38
0,39
Bri
zalin
a s
p.1
0,95
0,00
0,32
0,67
0,00
0,44
0,00
0,00
0,00
0,00
0,24
0,18
0,17
0,00
0,10
Bri
zalin
a s
p.2
0,00
0,00
0,00
0,00
0,00
0,00
0,00
0,00
0,00
0,00
0,00
0,00
0,00
0,00
0,00
Bri
zalin
a s
pp
.0,
710,
160,
960,
670,
002,
650,
200,
351,
520,
540,
710,
540,
690,
130,
39B
uc
cella p
eru
via
na
(d'O
rbig
ny,
1839)
0,00
0,49
0,32
0,00
0,00
0,00
0,00
0,00
0,00
0,00
0,00
0,18
0,00
0,00
0,20
Bu
ccella s
pp
.0,
000,
000,
000,
000,
000,
000,
000,
000,
000,
000,
000,
000,
000,
000,
00B
ulim
ina
acu
leata
d´O
rbig
ny,
1826
0,95
0,33
0,32
0,33
0,37
0,00
0,00
0,09
0,00
0,00
0,00
0,18
0,00
0,00
0,10
Bu
lim
ina
elo
ng
ata
d’
Orb
ign
y,
1846
0,00
0,00
0,00
0,00
0,00
0,00
0,00
0,00
0,00
0,00
0,00
0,00
0,00
0,00
0,00
Bu
lim
ina
gib
ba
Fo
rna
sin
i, 1
900
0,47
0,00
0,00
0,00
0,00
0,66
0,00
0,18
0,00
0,27
0,00
0,00
0,00
0,00
0,00
Bu
lim
ina
marg
ina
ta d
’ O
rbib
ny,
1826
5,46
5,90
2,55
2,67
7,09
3,53
4,68
2,83
6,83
7,82
2,83
13,7
75,
895,
978,
80B
ulim
ina
mexic
an
a C
us
hm
an
, 1922
0,00
0,00
0,00
0,00
0,00
0,00
0,00
0,00
0,00
0,00
0,00
0,00
0,00
0,00
0,00
Bu
lim
ina
pseu
do
aff
inis
Kle
inp
ell
, 1938
0,00
0,49
0,32
1,00
0,00
0,66
0,61
0,00
0,00
0,00
0,00
0,00
0,17
0,00
0,00
Bu
lim
ina
su
bu
lata
Cu
sh
man
& P
ark
er,
1947
0,00
0,00
0,00
0,00
0,00
0,00
0,00
0,00
0,00
0,00
0,00
0,00
0,00
0,00
0,00
Esti
mate
d a
ge
(yr
cal.
BP
)
Ben
thic
fo
ram
inif
era
(%
)
Ben
thic
fo
ram
inif
era
taxa

Co
nt.
Ap
pen
dix
2 -
1034
1142
1202
1337
1492
1671
1876
2109
2372
2514
2664
3507
3694
4082
4283
Bu
lim
ina
sp
p.
0,71
1,31
0,96
1,00
0,93
1,10
1,63
1,06
0,76
0,00
0,00
1,79
0,87
0,64
1,76
Bu
lim
ine
lla e
leg
an
tissim
a (
d’
Orb
ign
y 1
839)
3,32
4,10
1,91
5,00
0,75
1,32
2,03
1,77
0,51
0,81
0,71
0,00
0,87
0,51
0,39
Can
cri
s a
uri
cu
lus
(F
ich
tel
& M
oll
, 1798)
0,00
0,00
0,32
0,00
0,00
0,00
0,00
0,00
0,00
0,00
0,00
0,00
0,00
0,00
0,00
Can
cri
s s
p.1
0,00
0,00
0,00
0,00
0,00
0,00
0,00
0,09
0,00
0,00
0,00
0,00
0,00
0,00
0,00
Can
cri
s s
p.2
0,00
0,00
0,00
0,00
0,00
0,00
0,00
0,09
0,00
0,00
0,00
0,00
0,00
0,00
0,00
Can
cri
s s
pp
.0,
000,
000,
000,
000,
750,
000,
000,
180,
000,
000,
000,
000,
000,
000,
00C
assid
ulin
a c
ari
na
ta (
Sil
vestr
i, 1
896)
0,00
0,00
0,00
0,00
0,00
0,00
0,00
0,00
0,00
0,00
0,00
0,00
0,00
0,00
0,00
Cassid
ulin
a laevig
ata
d’O
rbig
ny,
1826
0,00
0,00
0,32
0,00
0,00
0,00
0,00
0,00
0,00
0,00
0,00
0,00
0,00
0,00
0,00
Cassid
ulin
a s
pp
.0,
240,
160,
000,
000,
370,
000,
410,
711,
010,
540,
001,
250,
000,
250,
49C
ibic
ide
s u
ng
eri
an
us
(d
’ O
rbig
ny,
1846)
0,24
0,00
0,00
0,00
0,00
0,00
0,00
0,00
0,00
0,00
0,00
0,00
0,00
0,00
0,00
Cib
icid
es s
pp
.0,
000,
000,
000,
000,
190,
000,
000,
180,
510,
270,
000,
360,
170,
000,
49C
ibic
ido
ide
s m
un
du
lus
(B
rad
y,
Park
er
& J
on
es,
1888)
0,00
0,00
0,00
0,00
0,00
0,00
0,00
0,00
0,00
0,00
0,00
0,00
0,00
0,00
0,00
Cib
icid
oid
es p
ach
yd
erm
a (
Rzeh
ak,
1886)
0,00
0,00
0,00
0,00
0,00
0,00
0,00
0,00
0,00
0,27
0,00
0,00
0,00
0,25
0,00
Cib
icid
oid
es w
uellers
torf
i (S
ch
wag
er,
1866)
0,00
0,00
0,00
0,00
0,00
0,00
0,00
0,00
0,00
0,00
0,00
0,00
0,00
0,00
0,00
Cib
icid
oid
es s
pp
.0,
000,
000,
000,
000,
000,
000,
000,
000,
000,
000,
000,
000,
000,
000,
00C
lavu
lin
a h
um
ilis
Bra
dy,
1884
0,00
0,16
0,00
0,00
0,00
0,00
0,00
0,00
0,00
0,00
0,00
0,00
0,00
0,00
0,00
Cla
vu
lin
a m
ult
icam
era
ta C
ha
pm
an
, 1907
0,00
0,00
0,32
0,00
0,00
0,00
0,00
0,00
0,00
0,00
0,00
0,00
0,00
0,00
0,00
Cla
vu
lin
a s
pp
.0,
000,
000,
000,
000,
190,
000,
410,
090,
000,
000,
240,
000,
000,
000,
20D
en
talin
a a
rien
a P
att
ers
on
& P
ett
is,
1986
0,00
0,00
0,00
0,00
0,00
0,00
0,00
0,00
0,00
0,00
0,00
0,00
0,00
0,00
0,00
Den
talin
a b
rad
yen
sis
(D
erv
ieu
x,
1894)
0,00
0,00
0,00
0,00
0,00
0,00
0,00
0,00
0,00
0,00
0,00
0,00
0,00
0,00
0,00
Den
talin
a s
pp
.0,
000,
000,
000,
000,
000,
000,
000,
000,
000,
000,
000,
000,
000,
000,
10D
eu
tera
mm
ina
sp
p.
0,24
0,00
0,00
0,00
0,00
0,00
0,00
0,00
0,00
0,00
0,00
0,00
0,00
0,00
0,00
Dis
co
rbin
ella b
ert
he
loti
(d
’ O
rbig
ny,
1839)
0,00
0,00
0,00
0,33
0,00
0,00
0,00
0,00
0,00
0,00
0,00
0,00
0,00
0,00
0,00
Dis
co
rbin
ella
sp
p.
0,00
0,00
0,00
0,00
0,00
0,00
0,00
0,00
0,00
0,00
0,00
0,18
0,00
0,00
0,00
Dis
co
rbis
william
so
ni
Ch
ap
man
& P
arr
, 1932
0,00
0,00
0,00
0,00
0,00
0,00
0,00
0,00
0,00
0,00
0,00
0,00
0,00
0,00
0,00
Dis
co
rbis
sp
p.
0,24
0,00
0,00
0,00
0,00
0,00
0,00
0,00
0,00
0,00
0,00
0,00
0,00
0,00
0,20
Do
roth
ia g
oe
ssi
(Cu
sh
man
, 1911)
0,00
0,00
0,00
0,00
0,00
0,66
0,00
0,00
0,00
0,00
0,00
0,18
0,00
0,00
0,00
Do
roth
ia s
p.
0,00
0,00
0,00
0,00
0,00
0,00
0,00
0,00
0,00
0,00
0,00
0,00
0,00
0,00
0,00
Ed
en
tos
tom
ia s
p.
no
v.
Bra
dy,
1884
0,00
0,16
0,00
0,00
0,00
0,00
0,00
0,00
0,00
0,00
0,00
0,00
0,00
0,00
0,00
Elp
hid
ium
excavatu
m T
erq
ue
m,
1875
0,00
0,00
0,00
0,00
0,00
0,00
0,00
0,00
0,00
0,00
0,00
0,00
0,00
0,00
0,00
Elp
hid
ium
sp
p.
(no
t id
en
tifi
ed
bro
ken
sp
ecim
en
s)
0,00
0,00
0,00
0,00
0,00
0,00
0,00
0,00
0,00
0,00
0,00
0,00
0,00
0,00
0,00
Ep
isto
min
ella s
pp
.0,
001,
973,
834,
670,
002,
872,
441,
241,
520,
815,
430,
001,
042,
792,
35E
vo
lvo
cassid
ulin
a o
rien
talis
(C
us
hm
an
, 1922)
0,00
0,00
0,00
0,00
0,00
0,00
0,00
0,00
0,00
0,00
0,00
0,00
0,00
0,00
0,00
Fis
su
rin
a laevig
ata
Reu
ss,
1850
0,00
0,00
0,00
0,00
0,00
0,00
0,00
0,00
0,00
0,00
0,00
0,00
0,00
0,00
0,00
Fis
su
rin
a lu
cid
a (
Wil
liam
so
n,
1884)
0,00
0,00
0,00
0,00
0,00
0,00
0,00
0,00
0,00
0,00
0,00
0,00
0,00
0,00
0,00
Fis
su
rin
a m
arg
ina
ta (
Mo
nta
gu
, 1803)
0,00
0,00
0,00
0,00
0,00
0,00
0,00
0,00
0,00
0,00
0,00
0,00
0,17
0,00
0,00
Fis
su
rin
a q
ua
dri
co
stu
lata
Sil
vestr
i, 1
902
0,00
0,00
0,00
0,00
0,00
0,00
0,00
0,00
0,51
0,00
0,00
0,00
0,35
0,00
0,00
Ben
thic
fo
ram
inif
era
taxa
Esti
mate
d a
ge
(yr
cal.
BP
)
Ben
thic
fo
ram
inif
era
(%
)

Co
nt.
Ap
pen
dix
2 -
1034
1142
1202
1337
1492
1671
1876
2109
2372
2514
2664
3507
3694
4082
4283
Fis
su
rin
a s
tap
hy
lleari
a S
ch
wag
er,
1866
0,24
0,00
0,00
0,00
0,19
0,00
0,20
0,00
0,00
0,00
0,00
0,00
0,17
0,00
0,00
Fis
su
rin
a s
p.
10,
000,
000,
000,
000,
000,
000,
000,
000,
000,
000,
000,
000,
000,
130,
00F
issu
rin
a s
p.
20,
000,
000,
000,
000,
000,
000,
000,
000,
000,
000,
000,
000,
000,
000,
00F
issu
rin
a s
p.
30,
000,
000,
000,
000,
000,
000,
000,
000,
000,
000,
000,
000,
000,
000,
00F
issu
rin
a s
pp
. 0,
000,
000,
320,
000,
000,
000,
000,
000,
250,
000,
000,
180,
000,
000,
20F
avu
lin
a h
exag
on
a (
Wil
liam
so
n,
1848)
0,24
0,00
0,00
0,00
0,00
0,00
0,20
0,00
0,00
0,00
0,00
0,00
0,00
0,00
0,10
Fa
vu
lin
a m
elo
(d
’ O
rbig
ny,
1839)
0,00
0,00
0,00
0,00
0,00
0,00
0,20
0,00
0,00
0,00
0,00
0,00
0,00
0,00
0,00
Fu
rsen
ko
ina
co
mp
lan
ata
(E
gg
er,
1893)
0,00
0,00
0,00
0,00
0,00
0,00
0,00
0,09
0,00
0,00
0,00
0,00
0,00
0,00
0,00
Fu
rsen
ko
ina
sp
p.
0,00
0,00
0,00
0,00
0,00
0,00
0,00
0,00
0,00
0,27
0,00
0,00
0,00
0,00
0,00
Gavelin
op
sis
pra
eg
eri
(H
ero
n-A
llen
& E
arl
an
d,
1913)
0,00
0,16
0,00
0,00
1,31
0,00
0,41
0,09
0,00
0,27
0,00
0,00
0,69
0,00
0,39
Gavelin
op
sis
um
bo
nif
er
(P
arr
, 1950)
0,00
0,00
0,00
0,00
0,00
0,00
0,00
0,00
0,00
0,00
0,00
0,00
0,00
0,00
0,00
Gavelin
op
sis
sp
p.
0,95
0,00
0,32
0,00
0,00
0,22
0,00
0,00
0,00
0,00
0,00
0,00
0,00
0,00
0,00
Gla
bra
tella m
ille
tti
(Wri
gh
t, 1
911)
0,00
0,00
0,00
0,00
0,00
0,00
0,00
0,00
0,00
0,00
0,00
0,00
0,00
0,00
0,00
Glo
bo
cassid
ulin
a m
inu
ta (
Cu
sh
man
, 1933)
0,00
0,00
0,00
0,00
0,19
0,00
0,00
0,18
0,00
0,00
0,00
0,00
0,00
0,25
0,00
Glo
bo
cassid
ulin
a s
ub
glo
bo
sa
(B
rad
y,
1881)
28,9
430
,34
38,3
022
,67
13,4
337
,32
35,4
041
,55
29,3
317
,53
35,1
79,
4821
,82
28,5
832
,67
Glo
bo
cassid
ulin
a s
pp
.6,
407,
057,
664,
332,
614,
425,
706,
362,
785,
3911
,33
1,25
2,94
5,59
3,33
Gyro
idin
a a
ltif
orm
is R
.E.
& K
.C.
Ste
wart
, 1930
0,00
0,00
0,00
0,00
0,19
0,00
0,00
0,00
0,00
0,00
0,00
0,00
0,00
0,00
0,00
Gyro
idin
a u
mb
on
ata
(S
ilvestr
i, 1
898)
3,08
8,04
2,87
5,00
4,66
3,75
3,66
3,27
7,08
2,97
3,54
6,26
8,83
1,65
5,48
Gyro
idin
a s
pp
.1,
901,
153,
833,
001,
490,
882,
030,
440,
001,
081,
651,
070,
351,
141,
17H
oe
glu
nd
ina
ele
ga
ns (
d’
Orb
ign
y,
1826)
0,24
0,00
0,00
0,33
0,00
0,00
0,00
0,00
0,00
0,00
0,00
0,00
0,00
0,00
0,10
Isla
nd
iella n
orc
ros
si
(Cu
sh
man
, 1933)
0,00
1,31
0,64
0,33
1,49
1,10
1,22
1,68
2,28
3,24
0,94
4,65
2,77
4,06
2,05
Isla
nd
iella
sp
p.
0,00
0,00
0,00
0,00
0,00
0,00
0,00
0,00
0,00
0,00
0,00
0,00
0,00
0,00
0,00
La
gen
a c
lavata
(d
’Orb
ign
y,
1846)
0,00
0,00
0,00
0,00
0,00
0,00
0,00
0,00
0,00
0,00
0,00
0,00
0,00
0,00
0,00
La
gen
a h
isp
idu
la C
us
hm
an
, 1913
0,00
0,00
0,00
0,00
0,00
0,00
0,00
0,00
0,00
0,00
0,00
0,00
0,00
0,00
0,00
La
gen
a laevis
(M
on
tag
u,
1803)
0,00
0,00
0,00
0,00
0,00
0,00
0,00
0,00
0,00
0,00
0,00
0,00
0,00
0,13
0,00
La
gen
a laevis
, f.
ten
uis
Wil
liam
so
n,
1848
0,00
0,00
0,00
0,00
0,19
0,00
0,00
0,00
0,00
0,00
0,00
0,00
0,00
0,00
0,00
La
gen
a laevis
, f.
typ
ica W
illi
am
so
n,
1848
0,00
0,00
0,00
0,00
0,00
0,22
0,00
0,09
0,00
0,00
0,00
0,00
0,00
0,00
0,00
La
gen
a s
tria
ta (
d’O
rbig
ny,
1839)
0,00
0,00
0,00
0,00
0,19
0,00
0,00
0,00
0,00
0,00
0,00
0,18
0,00
0,00
0,20
La
gen
a s
pp
.0,
000,
160,
000,
000,
000,
000,
000,
090,
000,
000,
000,
180,
000,
000,
10L
en
ticu
lin
a t
halm
an
i (H
essla
nd
, 1943)
0,00
0,00
0,00
0,00
0,00
0,00
0,00
0,00
0,00
0,00
0,00
0,00
0,00
0,00
0,00
Le
nti
cu
lin
a s
p.1
0,00
0,00
0,00
0,00
0,00
0,00
0,00
0,00
0,00
0,00
0,00
0,00
0,00
0,00
0,00
Le
nti
cu
lin
a s
p.3
0,00
0,00
0,00
0,00
0,00
0,00
0,20
0,00
0,00
0,00
0,00
0,00
0,00
0,00
0,00
Le
nti
cu
lin
a s
p.4
0,00
0,00
0,00
0,00
0,00
0,00
0,00
0,00
0,00
0,00
0,00
0,00
0,00
0,00
0,00
Le
nti
cu
lin
a s
p.5
0,00
0,00
0,00
0,00
0,00
0,00
0,00
0,00
0,00
0,00
0,00
0,00
0,17
0,00
0,00
Ben
thic
fo
ram
inif
era
taxa
Esti
mate
d a
ge
(yr
cal.
BP
)
Ben
thic
fo
ram
inif
era
(%
)

Co
nt.
Ap
pen
dix
2 -
1034
1142
1202
1337
1492
1671
1876
2109
2372
2514
2664
3507
3694
4082
4283
Le
nti
cu
lin
a s
p.6
0,00
0,00
0,00
0,00
0,00
0,00
0,00
0,00
0,00
0,00
0,00
0,00
0,00
0,00
0,00
Le
nti
cu
lin
a s
pp
.0,
000,
000,
000,
000,
190,
000,
000,
090,
250,
270,
000,
000,
000,
000,
10L
iesb
us
ella s
p.
0,00
0,00
0,00
0,00
0,00
0,00
0,00
0,00
0,00
0,00
0,00
0,00
0,00
0,00
0,00
Lo
ba
tula
lo
ba
tula
(W
alk
er
& J
aco
b,
1798)
0,00
0,00
0,32
0,00
0,00
0,00
0,41
0,00
0,00
0,27
0,00
0,36
0,69
0,00
0,29
Melo
nis
ba
rleean
us
(W
illi
am
so
n,
1858)
0,00
0,00
0,00
0,00
0,00
0,00
0,20
0,00
1,01
0,54
0,24
0,89
0,87
0,38
0,29
Melo
nis
sp
p.
0,00
0,00
0,00
0,00
0,00
0,00
0,00
0,00
0,00
0,00
0,00
0,00
0,00
0,00
0,00
Milio
lin
ella s
ub
rotu
nd
a (
Mo
nta
gu
, 1803)
0,00
0,16
0,00
0,00
0,00
0,00
0,00
0,00
0,00
0,00
0,00
0,18
0,00
0,00
0,00
Neo
len
ticu
lin
a v
ari
ab
ilis
(R
eu
ss,
1850)
0,00
0,00
0,00
0,00
0,00
0,22
0,00
0,00
0,00
0,00
0,00
0,00
0,00
0,13
0,00
No
nio
n s
p.1
0,00
0,00
0,00
0,00
0,19
0,00
0,00
0,00
0,00
0,00
0,00
0,00
0,00
0,00
0,00
No
nio
n s
p.
0,00
0,00
0,00
0,00
0,00
0,00
0,00
0,09
0,00
0,00
0,00
0,00
0,00
0,00
0,00
No
nio
ne
lla t
urg
ida
(W
illi
am
so
n,
1858)
0,24
0,16
0,00
0,00
0,19
0,00
0,00
0,00
0,25
0,54
0,24
0,00
0,35
0,13
0,00
No
nio
ne
lla
sp
p.
0,47
0,16
0,00
0,00
0,37
0,00
0,00
0,00
0,00
0,00
0,00
0,36
0,35
0,64
0,00
No
nio
no
ide
s g
rate
lou
pi
(d’O
rbig
ny,
1826)
0,00
0,16
0,00
0,00
0,00
0,22
0,00
0,00
0,00
0,00
0,00
0,00
0,00
0,00
0,39
No
nio
no
ide
s s
p.1
0,00
0,00
0,00
0,00
0,00
0,00
0,00
0,00
0,00
0,00
0,00
0,00
0,00
0,00
0,00
No
nio
no
ide
s s
pp
.0,
000,
160,
320,
000,
000,
660,
200,
000,
000,
000,
240,
180,
690,
000,
00O
olin
a a
lco
cki
(Wh
ite,
1956)
0,00
0,00
0,00
0,00
0,00
0,00
0,20
0,00
0,00
0,00
0,00
0,18
0,00
0,00
0,00
Oo
lin
a b
ore
alis
Lo
eb
lich
& T
ap
pa
n,
1954
0,00
0,00
0,00
0,00
0,00
0,00
0,00
0,00
0,00
0,00
0,00
0,00
0,00
0,00
0,00
Ori
do
rsalis s
pp
.0,
000,
000,
000,
000,
000,
000,
000,
000,
000,
000,
000,
000,
000,
000,
00O
rid
ors
alis u
mb
on
atu
s (
Reu
ss,
1851)
0,00
0,00
0,00
0,00
0,00
0,00
0,00
0,00
0,00
0,00
0,00
0,00
0,00
0,00
0,00
Osan
gu
riella u
mb
on
ifera
(C
us
hm
an
, 1933)
0,00
0,00
0,00
0,00
0,00
0,00
0,00
0,00
0,00
0,00
0,00
0,00
0,00
0,00
0,00
Para
cassid
ulin
a n
ipp
on
en
sis
(E
ad
e,
1969)
0,00
0,00
0,00
0,00
0,00
0,00
0,00
0,00
0,00
0,00
0,00
0,00
0,00
0,00
0,00
Pla
nulin
a um
bilic
ata
0,00
0,00
0,00
0,00
0,00
0,00
0,00
0,09
0,00
0,00
0,00
0,00
0,00
0,38
0,00
Pla
nu
lin
a s
pp
.0,
000,
000,
000,
000,
000,
000,
000,
000,
000,
000,
000,
000,
000,
000,
00P
oly
mo
rph
ine
lla
sp
.0,
000,
160,
000,
000,
000,
000,
000,
000,
000,
000,
000,
000,
000,
000,
00P
rocero
lag
en
a g
racilis
(W
illi
am
so
n,
1848)
0,00
0,00
0,00
0,00
0,00
0,00
0,20
0,00
0,00
0,00
0,00
0,00
0,00
0,00
0,00
Pro
cero
lag
en
a s
eti
ge
ra M
ille
tt,
1901
0,00
0,00
0,00
0,00
0,00
0,00
0,00
0,00
0,00
0,00
0,00
0,00
0,00
0,00
0,00
Pseu
do
gau
dry
na
sp
. n
ov
. B
aker,
1960
0,00
0,33
0,00
0,00
0,00
0,22
0,00
0,00
0,00
0,00
0,00
0,00
0,00
0,00
0,10
Pseu
do
no
nio
n a
tlan
ticu
m
(Cu
sh
man
, 1936)
0,24
0,00
0,00
0,00
0,56
0,00
0,00
0,35
0,00
0,00
0,00
0,18
0,17
0,13
0,29
Pu
len
ia q
ua
dri
lob
a0,
000,
000,
000,
000,
000,
000,
000,
000,
000,
000,
000,
000,
000,
000,
00P
ullen
ia b
ullo
ide
s (
d’O
rbig
ny,
1846)
0,00
0,00
0,00
0,00
0,00
0,00
0,00
0,00
0,00
0,00
0,00
0,00
0,00
0,00
0,00
Pu
llen
ia o
slo
en
sis
Fe
yli
ng
-Han
ssen
, 1954
0,00
0,00
0,00
0,00
0,00
0,00
0,00
0,00
0,00
0,00
0,00
0,00
0,00
0,00
0,00
Pu
llen
ia q
uin
qu
elo
ba
(R
eu
ss,
1851)
0,00
0,00
0,00
0,00
0,00
0,00
0,00
0,00
0,00
0,00
0,00
0,00
0,00
0,00
0,00
Pyrg
o d
ep
ressa (
d’
Orb
ign
y,
1826)
0,00
0,00
0,00
0,00
0,00
0,00
0,20
0,00
0,00
0,00
0,00
0,00
0,00
0,00
0,10
Pyrg
o e
lon
ga
ta (
d’O
rbig
ny,
1826)
0,00
0,00
0,00
0,00
0,00
0,00
0,00
0,00
0,00
0,00
0,00
0,00
0,00
0,00
0,00
Pyrg
o m
urr
hin
a (
Sch
wag
er,
1866)
0,00
0,00
0,00
0,00
0,00
0,00
0,00
0,00
0,00
0,00
0,00
0,00
0,00
0,00
0,00
Pyrg
o n
asu
ta C
us
hm
an
, 1935
0,00
0,16
0,00
0,00
0,00
0,00
0,00
0,00
0,00
0,27
0,00
0,00
0,00
0,13
0,00
Pyrg
o o
blo
ng
a (
d´
Orb
ign
y,
1839)
0,24
0,00
0,00
0,00
0,00
0,00
0,00
0,00
0,00
0,00
0,00
0,00
0,00
0,00
0,00
Ben
thic
fo
ram
inif
era
taxa
Esti
mate
d a
ge
(yr
cal.
BP
)
Ben
thic
fo
ram
inif
era
(%
)
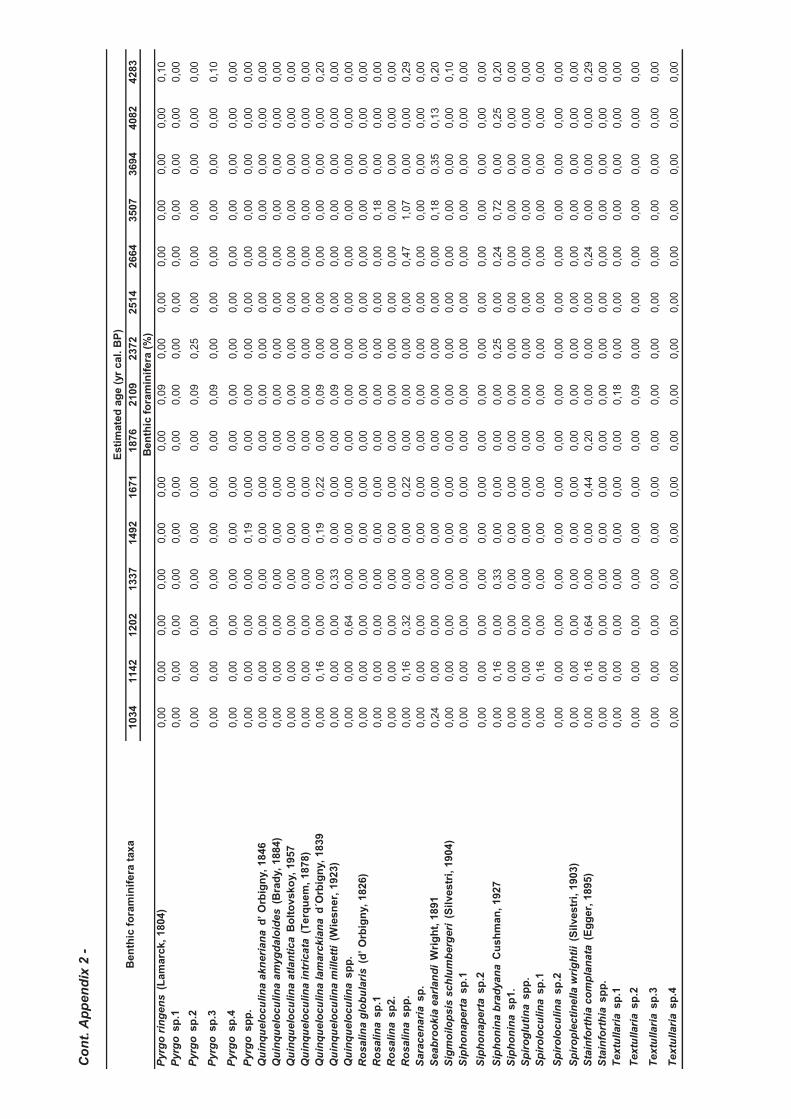
Co
nt.
Ap
pen
dix
2 -
1034
1142
1202
1337
1492
1671
1876
2109
2372
2514
2664
3507
3694
4082
4283
Pyrg
o r
ing
en
s (
La
marc
k,
1804)
0,00
0,00
0,00
0,00
0,00
0,00
0,00
0,09
0,00
0,00
0,00
0,00
0,00
0,00
0,10
Pyrg
o s
p.1
0,00
0,00
0,00
0,00
0,00
0,00
0,00
0,00
0,00
0,00
0,00
0,00
0,00
0,00
0,00
Pyrg
o s
p.2
0,00
0,00
0,00
0,00
0,00
0,00
0,00
0,09
0,25
0,00
0,00
0,00
0,00
0,00
0,00
Pyrg
o s
p.3
0,00
0,00
0,00
0,00
0,00
0,00
0,00
0,09
0,00
0,00
0,00
0,00
0,00
0,00
0,10
Pyrg
o s
p.4
0,00
0,00
0,00
0,00
0,00
0,00
0,00
0,00
0,00
0,00
0,00
0,00
0,00
0,00
0,00
Pyrg
o s
pp
.0,
000,
000,
000,
000,
190,
000,
000,
000,
000,
000,
000,
000,
000,
000,
00Q
uin
qu
elo
cu
lin
a a
kn
eri
an
a d
’ O
rbig
ny,
1846
0,00
0,00
0,00
0,00
0,00
0,00
0,00
0,00
0,00
0,00
0,00
0,00
0,00
0,00
0,00
Qu
inq
ue
loc
ulin
a a
myg
da
loid
es
(B
rad
y,
1884)
0,00
0,00
0,00
0,00
0,00
0,00
0,00
0,00
0,00
0,00
0,00
0,00
0,00
0,00
0,00
Qu
inq
ue
loc
ulin
a a
tlan
tica
Bo
lto
vsko
y,
1957
0,00
0,00
0,00
0,00
0,00
0,00
0,00
0,00
0,00
0,00
0,00
0,00
0,00
0,00
0,00
Qu
inq
ue
loc
ulin
a i
ntr
icata
(T
erq
ue
m,
1878)
0,00
0,00
0,00
0,00
0,00
0,00
0,00
0,00
0,00
0,00
0,00
0,00
0,00
0,00
0,00
Qu
inq
ue
loc
ulin
a lam
arc
kia
na
d´O
rbig
ny,
1839
0,00
0,16
0,00
0,00
0,19
0,22
0,00
0,09
0,00
0,00
0,00
0,00
0,00
0,00
0,20
Qu
inq
ue
loc
ulin
a m
ille
tti
(Wie
sn
er,
1923)
0,00
0,00
0,00
0,33
0,00
0,00
0,00
0,09
0,00
0,00
0,00
0,00
0,00
0,00
0,00
Qu
inq
ue
loc
ulin
a s
pp
. 0,
000,
000,
640,
000,
000,
000,
000,
000,
000,
000,
000,
000,
000,
000,
00R
os
alin
a g
lob
ula
ris
(d
’ O
rbig
ny,
1826)
0,00
0,00
0,00
0,00
0,00
0,00
0,00
0,00
0,00
0,00
0,00
0,00
0,00
0,00
0,00
Ro
salin
a s
p.1
0,00
0,00
0,00
0,00
0,00
0,00
0,00
0,00
0,00
0,00
0,00
0,18
0,00
0,00
0,00
Ro
salin
a s
p2
.0,
000,
000,
000,
000,
000,
000,
000,
000,
000,
000,
000,
000,
000,
000,
00R
os
alin
a s
pp
.0,
000,
160,
320,
000,
000,
220,
000,
000,
000,
000,
471,
070,
000,
000,
29S
ara
cen
ari
a s
p.
0,00
0,00
0,00
0,00
0,00
0,00
0,00
0,00
0,00
0,00
0,00
0,00
0,00
0,00
0,00
Seab
roo
kia
earl
an
di
Wri
gh
t, 1
891
0,24
0,00
0,00
0,00
0,00
0,00
0,00
0,00
0,00
0,00
0,00
0,18
0,35
0,13
0,20
Sig
mo
ilo
ps
is s
ch
lum
be
rge
ri (
Sil
vestr
i, 1
904)
0,00
0,00
0,00
0,00
0,00
0,00
0,00
0,00
0,00
0,00
0,00
0,00
0,00
0,00
0,10
Sip
ho
nap
ert
a s
p.1
0,00
0,00
0,00
0,00
0,00
0,00
0,00
0,00
0,00
0,00
0,00
0,00
0,00
0,00
0,00
Sip
ho
nap
ert
a s
p.2
0,00
0,00
0,00
0,00
0,00
0,00
0,00
0,00
0,00
0,00
0,00
0,00
0,00
0,00
0,00
Sip
ho
nin
a b
rad
yan
a C
us
hm
an
, 1927
0,00
0,16
0,00
0,33
0,00
0,00
0,00
0,00
0,25
0,00
0,24
0,72
0,00
0,25
0,20
Sip
ho
nin
a s
p1
.0,
000,
000,
000,
000,
000,
000,
000,
000,
000,
000,
000,
000,
000,
000,
00S
pir
og
luti
na
sp
p.
0,00
0,00
0,00
0,00
0,00
0,00
0,00
0,00
0,00
0,00
0,00
0,00
0,00
0,00
0,00
Sp
iro
loc
ulin
a s
p.1
0,00
0,16
0,00
0,00
0,00
0,00
0,00
0,00
0,00
0,00
0,00
0,00
0,00
0,00
0,00
Sp
iro
loc
ulin
a s
p.2
0,00
0,00
0,00
0,00
0,00
0,00
0,00
0,00
0,00
0,00
0,00
0,00
0,00
0,00
0,00
Sp
iro
ple
cti
ne
lla w
rig
hti
i (S
ilvestr
i, 1
903)
0,00
0,00
0,00
0,00
0,00
0,00
0,00
0,00
0,00
0,00
0,00
0,00
0,00
0,00
0,00
Sta
info
rth
ia c
om
pla
na
ta (
Eg
ge
r, 1
895)
0,00
0,16
0,64
0,00
0,00
0,44
0,20
0,00
0,00
0,00
0,24
0,00
0,00
0,00
0,29
Sta
info
rth
ia s
pp
.0,
000,
000,
000,
000,
000,
000,
000,
000,
000,
000,
000,
000,
000,
000,
00T
extu
llari
a s
p.1
0,00
0,00
0,00
0,00
0,00
0,00
0,00
0,18
0,00
0,00
0,00
0,00
0,00
0,00
0,00
Te
xtu
llari
a s
p.2
0,00
0,00
0,00
0,00
0,00
0,00
0,00
0,09
0,00
0,00
0,00
0,00
0,00
0,00
0,00
Te
xtu
llari
a s
p.3
0,00
0,00
0,00
0,00
0,00
0,00
0,00
0,00
0,00
0,00
0,00
0,00
0,00
0,00
0,00
Te
xtu
llari
a s
p.4
0,00
0,00
0,00
0,00
0,00
0,00
0,00
0,00
0,00
0,00
0,00
0,00
0,00
0,00
0,00
Ben
thic
fo
ram
inif
era
taxa
Esti
mate
d a
ge
(yr
cal.
BP
)
Ben
thic
fo
ram
inif
era
(%
)

Co
nt.
Ap
pen
dix
2 -
1034
1142
1202
1337
1492
1671
1876
2109
2372
2514
2664
3507
3694
4082
4283
Te
xtu
llari
a s
pp
.0,
000,
000,
000,
330,
000,
000,
000,
090,
000,
000,
000,
000,
000,
000,
00T
rifa
rin
a a
ng
ulo
sa
(W
illi
am
so
n,
1858)
1,42
0,00
0,00
0,00
2,61
0,00
0,00
0,53
0,00
0,00
0,00
0,00
0,00
0,38
0,00
Tri
fari
na
bra
dy
i C
us
hm
an
, 1923
0,00
0,00
0,00
0,00
0,00
0,00
0,00
0,00
0,00
0,00
0,00
0,00
0,00
0,00
0,00
Tri
loc
ulin
a s
p.2
0,00
0,00
0,00
0,00
0,00
0,00
0,00
0,00
0,00
0,00
0,00
0,00
0,00
0,00
0,00
Tri
loc
ulin
a s
pp
.0,
000,
000,
000,
000,
000,
000,
000,
000,
000,
000,
000,
000,
000,
000,
00T
rilo
cu
lin
ella
sp
p.
0,00
0,00
0,32
0,00
0,00
0,00
0,20
0,00
0,00
0,00
0,00
0,00
0,00
0,00
0,00
Uvig
eri
na
au
be
rian
a d
’ O
rbig
ny,
1839
0,24
0,00
0,00
0,00
0,00
0,00
0,00
0,00
0,00
0,00
0,00
0,00
0,00
0,00
0,00
Uvig
eri
na
pere
gri
na
Cu
sh
man
, 1923
0,00
0,00
0,00
0,00
0,00
0,00
0,00
0,00
0,00
0,00
0,00
0,00
0,00
0,00
0,00
Uvig
eri
na
sp
p.
0,00
0,00
0,32
0,00
0,00
0,00
0,00
0,00
0,00
0,00
0,00
0,00
0,00
0,00
0,00
Valv
ulin
eri
a b
rad
yan
a (
Fo
rna
sin
i, 1
900)
0,24
0,00
0,00
0,00
0,00
0,00
0,00
0,27
0,00
0,27
0,00
0,00
0,00
0,00
0,00
tota
l d
en
sit
y (
tests•10 c
c-1
)53
9219
476
2592
021
883
6816
2150
425
648
3030
013
146
1125
613
200
9432
2214
815
175
3027
5
frag
men
ts (
%)
5,93
4,62
2,43
1,44
3,99
8,33
0,00
5,05
5,75
16,0
44,
553,
314,
652,
473,
24
no
t id
en
tifi
ed
(%
)0,
002,
221,
740,
720,
001,
820,
000,
002,
560,
003,
641,
786,
420,
330,
81E
(%
)4,
9810
,99
8,94
10,3
47,
467,
517,
736,
109,
615,
399,
448,
5811
,95
5,46
10,3
7I
(%)
74,7
176
,76
82,6
581
,02
71,7
976
,41
84,8
483
,09
69,0
366
,87
67,9
960
,45
66,3
370
,88
73,6
5
BF
HP
in
de
x (
%)
15,8
913
,61
9,89
12,3
412
,68
11,2
610
,58
8,04
11,6
313
,21
5,90
18,7
811
,43
8,76
12,3
2
BF
AR
in
de
x (
tests
•cm
-2•k
yr-1
)20
7831
6470
3779
9773
5837
2015
7835
4344
6645
4574
4740
3918
4496
1506
0216
9002
1012
8223
1267
1507
0929
4014
R29
3630
2330
2731
4023
2321
3330
2842
H'
2,25
2,18
2,11
2,06
2,16
2,09
2,09
1,83
2,06
2,02
1,88
2,27
2,17
1,91
2,13
J'
0,67
0,61
0,62
0,66
0,63
0,63
0,61
0,50
0,66
0,64
0,62
0,65
0,64
0,57
0,57
Esti
mate
d a
ge
(yr
cal.
BP
)
Ben
thic
fo
ram
inif
era
(%
)
Ben
thic
fo
ram
inif
era
taxa

Co
nt.
Ap
pen
dix
2 -
4489
4699
4914
5132
5354
5579
5807
6038
6508
6987
7228
7471
7715
7959
Am
mo
nia
be
ccari
i (L
inn
é,
1758)
0,00
0,00
0,00
0,00
0,00
0,12
0,00
0,00
0,00
0,07
0,00
0,00
0,00
0,00
Am
mo
nia
sp
p.
0,00
0,12
0,00
0,00
0,00
0,00
0,66
0,00
0,00
0,07
0,00
0,00
0,00
0,51
Am
ph
ico
ryn
a s
cala
ris
(B
ats
ch
, 1791)
0,00
0,00
0,15
0,00
0,13
0,00
0,00
0,00
0,00
0,00
0,19
0,12
0,14
0,00
Am
ph
ico
ryn
a s
pp
.0,
190,
000,
000,
000,
000,
000,
000,
000,
000,
000,
000,
240,
000,
00A
ng
ulo
ge
rin
a a
ng
ulo
sa
(W
illi
am
so
n,
1858)
21,2
518
,57
18,2
814
,81
18,4
617
,16
15,4
426
,72
18,1
48,
2815
,09
6,59
13,1
411
,59
An
gu
log
eri
na
sp
p.
0,00
2,35
1,77
1,89
1,06
2,54
2,65
2,24
1,56
0,00
1,53
1,08
1,00
0,64
Bo
livin
a a
lba
tro
ssi
Cu
sh
man
, 1922
0,00
0,00
0,00
0,00
0,00
0,00
0,00
0,00
0,00
0,00
0,00
0,00
0,00
0,00
Bo
livin
a d
on
iezi
Cu
sh
man
& W
icken
de
n,
1929
0,00
0,00
0,00
0,00
0,00
0,18
0,00
0,00
0,18
0,00
0,00
0,48
0,00
0,00
Bo
livin
a p
seu
do
plicata
Hero
n-A
llen
& E
arl
an
d,
1930
0,00
0,00
0,08
0,00
0,13
0,18
1,10
0,00
0,00
0,00
0,19
0,00
0,00
0,38
Bo
livin
a p
ulc
he
lla (
d’O
rbig
ny,
1839)
0,00
0,00
0,00
0,00
0,00
0,00
0,22
0,00
0,00
0,00
0,00
0,00
0,00
0,00
Bo
livin
a p
ulc
he
lla f
. p
rim
itiv
a C
us
hm
an
, 1930
0,00
0,00
0,00
0,00
0,00
0,00
0,00
0,00
0,00
0,00
0,00
0,00
0,00
0,00
Bo
livin
a s
em
inu
da
Cu
sh
man
, 1911
0,00
0,00
0,00
0,00
0,00
0,00
0,00
0,00
0,00
0,00
0,96
0,00
0,00
0,00
Bo
livin
a s
kag
err
aken
sis
Qvale
& N
iga
m,
1985
0,00
0,00
0,00
0,00
0,00
0,00
0,00
0,11
0,00
0,00
0,00
0,00
0,00
0,00
Bo
livin
a s
ub
sp
ine
nsis
Cu
sh
man
, 1922
0,19
0,12
0,08
0,27
0,00
0,00
0,00
0,00
0,00
0,00
0,38
0,00
0,14
0,00
Bo
livin
a t
ran
slu
cen
s P
hle
ge
r &
Park
er,
1951
0,00
0,00
0,00
0,00
0,00
0,00
0,00
0,00
0,00
0,00
0,00
0,00
0,14
0,00
Bo
livin
a s
p.1
0,00
0,00
0,00
0,00
0,00
0,00
0,00
0,00
0,00
0,00
0,00
0,00
0,00
0,00
Bo
livin
a s
pp
.
0,19
0,00
0,00
0,00
0,00
0,00
0,00
0,00
0,00
0,00
0,00
0,00
0,00
0,13
Bri
zalin
a o
rdin
ari
a (
Ph
leg
er
& P
ark
er,
1952)
0,00
0,00
0,00
0,00
0,00
0,00
0,44
0,00
0,00
0,00
0,00
0,00
0,00
0,00
Bri
zalin
a s
path
ula
ta (
Wil
liam
so
n,
1858)
0,00
0,00
0,00
0,00
0,00
0,24
0,00
0,11
0,37
0,07
0,00
0,24
0,00
0,00
Bri
zalin
a s
ub
aen
ari
en
sis
(C
us
hm
an
, 1922)
1,74
0,94
0,23
1,08
0,66
0,24
0,88
0,67
0,27
0,00
0,57
0,48
0,57
0,89
Bri
zalin
a s
p.1
0,39
0,00
0,08
0,27
0,00
0,00
0,00
0,00
0,00
0,00
0,00
0,00
0,00
0,00
Bri
zalin
a s
p.2
0,00
0,00
0,08
0,00
0,00
0,00
0,00
0,00
0,00
0,00
0,00
0,00
0,00
0,00
Bri
zalin
a s
pp
.0,
580,
590,
230,
540,
930,
421,
760,
110,
460,
290,
000,
000,
430,
13B
uc
cella p
eru
via
na
(d'O
rbig
ny,
1839)
0,19
0,00
0,00
0,00
0,00
0,00
0,00
0,00
0,00
0,00
0,00
0,00
0,14
0,00
Bu
ccella s
pp
.0,
000,
000,
080,
000,
000,
000,
000,
000,
000,
000,
000,
000,
000,
00B
ulim
ina
acu
leata
d´O
rbig
ny,
1826
0,19
0,00
0,00
0,54
0,27
0,06
0,00
0,00
0,00
0,00
0,00
0,00
0,00
0,00
Bu
lim
ina
elo
ng
ata
d’
Orb
ign
y,
1846
0,19
0,35
0,00
0,27
0,40
0,00
0,00
0,00
0,00
0,00
0,76
0,00
1,00
0,38
Bu
lim
ina
gib
ba
Fo
rna
sin
i, 1
900
0,00
0,00
0,00
0,00
0,27
0,12
0,44
0,00
0,00
0,07
0,19
0,12
0,00
0,64
Bu
lim
ina
marg
ina
ta d
’ O
rbib
ny,
1826
10,6
311
,28
5,40
15,0
86,
775,
626,
847,
047,
792,
2012
,80
15,3
312
,57
8,91
Bu
lim
ina
mexic
an
a C
us
hm
an
, 1922
0,00
0,12
0,00
0,00
0,00
0,00
0,00
0,00
0,00
0,00
0,00
0,00
0,00
0,00
Bu
lim
ina
pseu
do
aff
inis
Kle
inp
ell
, 1938
0,00
0,00
0,00
0,00
0,66
0,00
0,00
0,00
0,00
0,00
0,00
0,00
0,57
0,89
Bu
lim
ina
su
bu
lata
Cu
sh
man
& P
ark
er,
1947
0,00
0,00
0,00
0,00
0,00
0,00
0,00
0,00
0,00
0,00
0,00
0,12
0,00
0,00
Esti
mate
d a
ge
(yr
cal.
BP
)
Ben
thic
fo
ram
inif
era
(%
)
Ben
thic
fo
ram
inif
era
taxa

Co
nt.
Ap
pen
dix
2 -
4489
4699
4914
5132
5354
5579
5807
6038
6508
6987
7228
7471
7715
7959
Bu
lim
ina
sp
p.
0,77
0,12
0,93
0,00
0,00
0,97
0,00
1,68
0,92
1,03
3,82
1,08
0,29
1,02
Bu
lim
ine
lla e
leg
an
tissim
a (
d’
Orb
ign
y 1
839)
0,19
0,24
0,23
0,27
0,80
0,18
0,00
0,11
0,27
0,00
0,19
0,00
0,43
0,76
Can
cri
s a
uri
cu
lus
(F
ich
tel
& M
oll
, 1798)
0,00
0,00
0,00
0,00
0,13
0,00
0,00
0,00
0,00
0,00
0,00
0,00
0,14
0,13
Can
cri
s s
p.1
0,00
0,00
0,00
0,00
0,00
0,00
0,00
0,00
0,09
0,00
0,00
0,00
0,00
0,00
Can
cri
s s
p.2
0,00
0,00
0,00
0,00
0,00
0,00
0,00
0,00
0,00
0,00
0,00
0,00
0,00
0,00
Can
cri
s s
pp
.0,
000,
000,
000,
000,
270,
120,
000,
450,
000,
000,
380,
240,
000,
13C
assid
ulin
a c
ari
na
ta (
Sil
vestr
i, 1
896)
0,00
0,00
0,00
0,00
0,00
0,12
0,00
0,00
0,00
0,00
0,00
0,00
0,00
0,00
Cassid
ulin
a laevig
ata
d’O
rbig
ny,
1826
0,00
0,00
0,00
0,00
0,00
0,00
0,00
0,00
0,00
0,00
0,00
0,00
0,00
0,00
Cassid
ulin
a s
pp
.0,
190,
470,
310,
810,
000,
120,
660,
220,
370,
000,
381,
320,
290,
00C
ibic
ide
s u
ng
eri
an
us
(d
’ O
rbig
ny,
1846)
0,00
0,00
0,15
2,15
1,33
0,06
1,76
0,67
2,02
0,59
5,92
3,95
3,14
3,57
Cib
icid
es s
pp
.0,
580,
590,
000,
270,
000,
180,
000,
560,
820,
590,
192,
400,
000,
38C
ibic
ido
ide
s m
un
du
lus
(B
rad
y,
Park
er
& J
on
es,
1888)
0,00
0,00
0,00
0,00
0,00
0,00
0,00
0,00
0,09
0,07
0,00
0,00
0,00
0,00
Cib
icid
oid
es p
ach
yd
erm
a (
Rzeh
ak,
1886)
0,00
0,00
0,00
0,00
0,00
0,00
0,00
0,11
0,09
0,07
0,00
0,00
0,00
0,00
Cib
icid
oid
es w
uellers
torf
i (S
ch
wag
er,
1866)
0,00
0,00
0,00
0,54
0,00
0,00
0,00
0,00
0,00
0,00
0,96
0,00
0,00
0,00
Cib
icid
oid
es s
pp
.0,
390,
000,
000,
540,
000,
000,
220,
000,
730,
070,
380,
000,
570,
00C
lavu
lin
a h
um
ilis
Bra
dy,
1884
0,00
0,00
0,08
0,00
0,13
0,00
0,22
0,00
0,00
0,07
0,38
0,00
0,14
0,00
Cla
vu
lin
a m
ult
icam
era
ta C
ha
pm
an
, 1907
0,00
0,12
0,00
0,00
0,00
0,00
0,00
0,00
0,00
0,00
0,00
0,00
0,00
0,00
Cla
vu
lin
a s
pp
.0,
390,
000,
000,
000,
000,
060,
000,
110,
000,
000,
000,
000,
000,
00D
en
talin
a a
rien
a P
att
ers
on
& P
ett
is,
1986
0,00
0,00
0,00
0,00
0,00
0,00
0,00
0,11
0,00
0,00
0,00
0,00
0,00
0,00
Den
talin
a b
rad
yen
sis
(D
erv
ieu
x,
1894)
0,00
0,00
0,00
0,00
0,00
0,00
0,00
0,11
0,00
0,00
0,00
0,00
0,00
0,00
Den
talin
a s
pp
.0,
000,
000,
000,
000,
130,
000,
220,
000,
000,
000,
000,
000,
000,
13D
eu
tera
mm
ina
sp
p.
0,00
0,00
0,00
0,00
0,00
0,00
0,00
0,00
0,00
0,00
0,00
0,00
0,00
0,00
Dis
co
rbin
ella b
ert
he
loti
(d
’ O
rbig
ny,
1839)
0,00
0,00
0,00
0,00
0,00
0,00
0,00
0,00
0,00
0,00
0,00
0,00
0,00
0,00
Dis
co
rbin
ella
sp
p.
0,00
0,00
0,00
0,00
0,00
0,00
0,00
0,00
0,00
0,00
0,00
0,00
0,00
0,00
Dis
co
rbis
william
so
ni
Ch
ap
man
& P
arr
, 1932
0,19
0,12
0,08
0,00
0,00
0,00
0,00
0,00
0,00
0,00
0,00
0,24
0,00
0,00
Dis
co
rbis
sp
p.
0,00
0,00
0,08
0,00
0,00
0,97
0,00
0,11
1,65
0,59
0,57
0,48
0,57
1,53
Do
roth
ia g
oe
ssi
(Cu
sh
man
, 1911)
0,00
0,00
0,00
0,27
0,00
0,00
0,00
0,00
0,00
0,00
0,00
0,00
0,00
0,00
Do
roth
ia s
p.
0,00
0,00
0,00
0,00
0,00
0,00
0,00
0,00
0,00
0,00
0,00
0,12
0,29
0,00
Ed
en
tos
tom
ia s
p.
no
v.
Bra
dy,
1884
0,00
0,00
0,00
0,00
0,00
0,00
0,00
0,00
0,00
0,00
0,00
0,00
0,00
0,00
Elp
hid
ium
excavatu
m T
erq
ue
m,
1875
0,00
0,00
0,00
0,00
0,00
0,00
0,00
0,00
0,00
0,00
0,00
0,00
0,00
0,00
Elp
hid
ium
sp
p.
(no
t id
en
tifi
ed
bro
ken
sp
ecim
en
s)
0,00
0,00
0,00
0,00
0,00
0,00
0,00
0,00
0,00
0,00
0,00
0,00
0,00
0,13
Ep
isto
min
ella s
pp
.0,
580,
941,
310,
000,
930,
910,
660,
001,
100,
950,
190,
602,
141,
02E
vo
lvo
cassid
ulin
a o
rien
talis
(C
us
hm
an
, 1922)
0,00
0,00
0,00
0,00
0,00
0,00
0,00
0,11
0,00
0,07
0,00
0,00
0,00
0,00
Fis
su
rin
a laevig
ata
Reu
ss,
1850
0,00
0,00
0,15
0,00
0,00
0,06
0,00
0,00
0,00
0,07
0,00
0,12
0,00
0,00
Fis
su
rin
a lu
cid
a (
Wil
liam
so
n,
1884)
0,00
0,00
0,15
0,00
0,00
0,00
0,00
0,00
0,18
0,07
0,00
0,12
0,14
0,13
Fis
su
rin
a m
arg
ina
ta (
Mo
nta
gu
, 1803)
0,00
0,12
0,00
0,00
0,13
0,06
0,00
0,00
0,00
0,07
0,00
0,12
0,14
0,25
Fis
su
rin
a q
ua
dri
co
stu
lata
Sil
vestr
i, 1
902
0,00
0,00
0,08
0,00
0,00
0,06
0,00
0,00
0,09
0,07
0,00
0,12
0,00
0,00
Ben
thic
fo
ram
inif
era
taxa
Esti
mate
d a
ge
(yr
cal.
BP
)
Ben
thic
fo
ram
inif
era
(%
)

Co
nt.
Ap
pen
dix
2 -
4489
4699
4914
5132
5354
5579
5807
6038
6508
6987
7228
7471
7715
7959
Fis
su
rin
a s
tap
hy
lleari
a S
ch
wag
er,
1866
0,00
0,00
0,00
0,00
0,00
0,00
0,00
0,00
0,00
0,00
0,00
0,00
0,14
0,13
Fis
su
rin
a s
p.
10,
000,
000,
000,
000,
000,
000,
000,
000,
000,
070,
000,
000,
000,
00F
issu
rin
a s
p.
20,
000,
000,
080,
000,
000,
060,
000,
000,
000,
000,
000,
120,
000,
00F
issu
rin
a s
p.
30,
000,
000,
230,
000,
000,
000,
000,
000,
090,
070,
000,
000,
000,
00F
issu
rin
a s
pp
. 0,
000,
120,
000,
000,
000,
000,
000,
000,
090,
150,
190,
000,
430,
38F
avu
lin
a h
exag
on
a (
Wil
liam
so
n,
1848)
0,00
0,00
0,08
0,00
0,00
0,00
0,00
0,11
0,09
0,00
0,00
0,24
0,00
0,25
Fa
vu
lin
a m
elo
(d
’ O
rbig
ny,
1839)
0,00
0,00
0,08
0,00
0,00
0,18
0,22
0,11
0,09
0,07
0,00
0,24
0,00
0,13
Fu
rsen
ko
ina
co
mp
lan
ata
(E
gg
er,
1893)
0,00
0,00
0,08
0,00
0,00
0,24
0,00
0,34
0,00
0,00
0,00
0,00
0,00
0,00
Fu
rsen
ko
ina
sp
p.
0,00
0,00
0,08
0,00
0,00
0,00
0,00
0,00
0,00
0,00
0,00
0,24
0,00
0,00
Gavelin
op
sis
pra
eg
eri
(H
ero
n-A
llen
& E
arl
an
d,
1913)
0,00
0,00
0,00
0,00
0,00
0,06
0,00
0,22
0,27
0,00
0,00
1,20
0,00
0,00
Gavelin
op
sis
um
bo
nif
er
(P
arr
, 1950)
0,00
0,00
0,00
0,00
0,00
0,00
0,00
0,00
0,00
0,29
0,00
0,00
0,00
0,00
Gavelin
op
sis
sp
p.
0,00
0,00
0,00
0,00
0,53
0,00
0,00
0,00
0,00
0,07
0,00
0,12
0,00
0,00
Gla
bra
tella m
ille
tti
(Wri
gh
t, 1
911)
0,00
0,00
0,00
0,00
0,00
0,00
0,00
0,00
0,00
0,00
0,00
0,00
0,00
0,00
Glo
bo
cassid
ulin
a m
inu
ta (
Cu
sh
man
, 1933)
0,00
0,00
0,00
0,00
0,00
0,00
0,00
0,00
0,00
0,00
0,00
0,12
0,00
0,00
Glo
bo
cassid
ulin
a s
ub
glo
bo
sa
(B
rad
y,
1881)
18,5
526
,68
29,6
911
,31
26,3
035
,59
24,9
312
,19
18,1
40,
0012
,23
10,5
425
,99
15,9
2G
lob
oc
assid
ulin
a s
pp
.2,
134,
237,
251,
893,
986,
104,
632,
793,
120,
001,
341,
443,
432,
04G
yro
idin
a a
ltif
orm
is R
.E.
& K
.C.
Ste
wart
, 1930
0,00
0,00
0,00
0,00
0,00
0,00
0,00
0,00
0,00
0,00
0,00
0,00
0,00
0,00
Gyro
idin
a u
mb
on
ata
(S
ilvestr
i, 1
898)
9,47
7,76
7,09
6,73
4,65
3,69
5,07
4,47
1,56
0,73
3,06
1,80
2,14
3,06
Gyro
idin
a s
pp
.0,
001,
181,
160,
001,
061,
031,
541,
340,
180,
290,
001,
080,
000,
00H
oe
glu
nd
ina
ele
ga
ns (
d’
Orb
ign
y,
1826)
0,00
0,00
0,00
0,00
0,13
0,00
0,00
0,00
0,00
0,00
0,00
0,00
0,00
0,00
Isla
nd
iella n
orc
ros
si
(Cu
sh
man
, 1933)
2,90
4,70
3,01
6,46
5,45
2,05
6,40
1,34
2,93
0,88
4,01
0,72
2,00
0,13
Isla
nd
iella
sp
p.
0,00
0,00
0,00
0,00
0,00
0,00
0,00
0,00
0,00
0,00
0,00
0,00
0,00
0,00
La
gen
a c
lavata
(d
’Orb
ign
y,
1846)
0,58
0,00
0,00
0,00
0,00
0,00
0,00
0,00
0,00
0,00
0,00
0,00
0,00
0,00
La
gen
a h
isp
idu
la C
us
hm
an
, 1913
0,00
0,00
0,00
0,00
0,00
0,00
0,00
0,00
0,09
0,00
0,00
0,00
0,00
0,00
La
gen
a laevis
(M
on
tag
u,
1803)
0,00
0,00
0,00
0,00
0,00
0,00
0,00
0,00
0,00
0,00
0,38
0,00
0,00
0,00
La
gen
a laevis
, f.
ten
uis
Wil
liam
so
n,
1848
0,00
0,00
0,00
0,00
0,00
0,00
0,00
0,00
0,00
0,00
0,00
0,00
0,00
0,00
La
gen
a laevis
, f.
typ
ica W
illi
am
so
n,
1848
0,00
0,00
0,00
0,00
0,00
0,00
0,00
0,00
0,00
0,00
0,00
0,00
0,00
0,00
La
gen
a s
tria
ta (
d’O
rbig
ny,
1839)
0,00
0,00
0,08
0,00
0,00
0,18
0,00
0,11
0,00
0,00
0,00
0,24
0,29
0,00
La
gen
a s
pp
.0,
000,
000,
000,
270,
000,
180,
000,
000,
000,
070,
000,
000,
000,
00L
en
ticu
lin
a t
halm
an
i (H
essla
nd
, 1943)
0,00
0,00
0,00
0,27
0,00
0,00
0,00
0,00
0,00
0,00
0,00
0,00
0,00
0,00
Le
nti
cu
lin
a s
p.1
0,00
0,00
0,00
0,00
0,13
0,00
0,00
0,00
0,00
0,00
0,00
0,00
0,00
0,00
Le
nti
cu
lin
a s
p.3
0,00
0,00
0,00
0,00
0,00
0,00
0,00
0,00
0,00
0,00
0,00
0,00
0,00
0,00
Le
nti
cu
lin
a s
p.4
0,00
0,00
0,00
0,00
0,00
0,00
0,00
0,00
0,09
0,00
0,00
0,00
0,00
0,00
Le
nti
cu
lin
a s
p.5
0,00
0,00
0,00
0,00
0,00
0,00
0,00
0,00
0,00
0,00
0,00
0,00
0,00
0,00
Ben
thic
fo
ram
inif
era
taxa
Esti
mate
d a
ge
(yr
cal.
BP
)
Ben
thic
fo
ram
inif
era
(%
)

Co
nt.
Ap
pen
dix
2 -
4489
4699
4914
5132
5354
5579
5807
6038
6508
6987
7228
7471
7715
7959
Le
nti
cu
lin
a s
p.6
0,00
0,12
0,00
0,00
0,00
0,00
0,00
0,00
0,00
0,00
0,00
0,00
0,00
0,00
Le
nti
cu
lin
a s
pp
.0,
190,
000,
000,
000,
000,
000,
000,
000,
000,
070,
190,
000,
000,
00L
iesb
us
ella s
p.
0,00
0,00
0,00
0,00
0,00
0,00
0,00
0,00
0,00
0,00
0,00
0,00
0,14
0,00
Lo
ba
tula
lo
ba
tula
(W
alk
er
& J
aco
b,
1798)
0,19
0,59
0,69
0,00
0,27
0,00
0,00
0,00
0,64
0,00
0,57
0,00
0,43
0,89
Melo
nis
ba
rleean
us
(W
illi
am
so
n,
1858)
0,97
0,35
0,00
1,08
0,40
0,24
0,22
0,11
0,00
0,00
0,19
0,48
0,14
0,00
Melo
nis
sp
p.
0,00
0,00
0,00
0,00
0,00
0,00
0,00
0,00
0,18
0,00
0,00
0,12
0,00
0,00
Milio
lin
ella s
ub
rotu
nd
a (
Mo
nta
gu
, 1803)
0,00
0,00
0,00
0,00
0,00
0,00
0,22
0,00
0,00
0,00
0,19
0,00
0,71
0,25
Neo
len
ticu
lin
a v
ari
ab
ilis
(R
eu
ss,
1850)
0,00
0,00
0,00
0,00
0,00
0,00
0,00
0,00
0,00
0,00
0,00
0,00
0,00
0,13
No
nio
n s
p.1
0,00
0,00
0,00
0,00
0,00
0,00
0,00
0,00
0,00
0,00
0,00
0,00
0,00
0,00
No
nio
n s
p.
0,00
0,12
0,00
0,00
0,13
0,00
0,22
0,00
0,00
0,00
0,00
0,00
0,00
0,00
No
nio
ne
lla t
urg
ida
(W
illi
am
so
n,
1858)
0,00
0,00
0,15
0,00
0,40
0,30
0,22
0,11
0,00
0,00
0,19
0,00
0,14
0,51
No
nio
ne
lla
sp
p.
0,19
0,00
0,08
0,54
0,00
0,30
0,00
0,11
0,27
0,00
0,00
0,36
0,00
0,00
No
nio
no
ide
s g
rate
lou
pi
(d’O
rbig
ny,
1826)
0,00
0,00
0,00
0,54
0,00
0,00
0,00
0,00
0,00
0,00
0,00
0,00
0,00
0,00
No
nio
no
ide
s s
p.1
0,00
0,00
0,00
0,00
0,00
0,00
0,00
0,00
0,18
0,00
0,00
0,00
0,00
0,00
No
nio
no
ide
s s
pp
.0,
390,
470,
230,
000,
130,
000,
440,
110,
180,
000,
570,
000,
290,
13O
olin
a a
lco
cki
(Wh
ite,
1956)
0,00
0,00
0,08
0,00
0,00
0,12
0,00
0,11
0,09
0,00
0,00
0,00
0,00
0,00
Oo
lin
a b
ore
alis
Lo
eb
lich
& T
ap
pa
n,
1954
0,00
0,00
0,00
0,00
0,00
0,00
0,22
0,00
0,00
0,00
0,00
0,00
0,00
0,00
Ori
do
rsalis s
pp
.0,
000,
000,
000,
000,
000,
000,
000,
110,
090,
000,
000,
000,
000,
00O
rid
ors
alis u
mb
on
atu
s (
Reu
ss,
1851)
0,00
0,00
0,00
0,00
0,00
0,00
0,00
0,00
0,00
0,00
0,00
0,00
0,14
0,00
Osan
gu
riella u
mb
on
ifera
(C
us
hm
an
, 1933)
0,00
0,24
0,00
0,00
0,00
0,00
0,00
0,00
0,00
0,00
0,00
0,00
0,00
0,00
Para
cassid
ulin
a n
ipp
on
en
sis
(E
ad
e,
1969)
0,00
0,00
0,00
0,00
0,00
0,00
0,00
0,00
0,00
0,00
0,00
0,00
0,00
0,00
Pla
nulin
a um
bilic
ata
0,00
0,00
0,00
0,00
0,00
0,12
0,00
0,11
0,00
0,81
0,00
1,44
0,00
0,00
Pla
nu
lin
a s
pp
.0,
000,
000,
000,
000,
000,
000,
000,
000,
090,
000,
000,
000,
000,
00P
oly
mo
rph
ine
lla
sp
.0,
000,
000,
000,
000,
000,
000,
000,
000,
000,
000,
000,
000,
000,
00P
rocero
lag
en
a g
racilis
(W
illi
am
so
n,
1848)
0,00
0,00
0,00
0,00
0,00
0,00
0,00
0,00
0,00
0,00
0,00
0,00
0,00
0,00
Pro
cero
lag
en
a s
eti
ge
ra M
ille
tt,
1901
0,00
0,00
0,00
0,00
0,00
0,00
0,00
0,00
0,09
0,00
0,00
0,00
0,00
0,00
Pseu
do
gau
dry
na
sp
. n
ov
. B
aker,
1960
0,00
0,35
0,00
0,00
0,27
0,00
0,66
0,00
0,00
0,00
0,00
0,00
0,00
0,00
Pseu
do
no
nio
n a
tlan
ticu
m
(Cu
sh
man
, 1936)
0,19
0,00
0,23
0,00
0,13
0,36
0,22
0,56
0,46
0,00
0,00
0,60
0,86
0,38
Pu
len
ia q
ua
dri
lob
a0,
000,
710,
000,
000,
000,
000,
000,
000,
000,
000,
000,
000,
000,
00P
ullen
ia b
ullo
ide
s (
d’O
rbig
ny,
1846)
0,00
0,00
0,00
0,00
0,00
0,00
0,00
0,00
0,09
0,00
0,00
0,00
0,00
0,00
Pu
llen
ia o
slo
en
sis
Fe
yli
ng
-Han
ssen
, 1954
0,00
0,00
0,00
0,00
0,00
0,00
0,00
0,11
0,00
0,00
0,00
0,12
0,00
0,00
Pu
llen
ia q
uin
qu
elo
ba
(R
eu
ss,
1851)
0,00
0,00
0,00
0,00
0,00
0,00
0,00
0,00
0,00
0,00
0,00
0,00
0,14
0,00
Pyrg
o d
ep
ressa (
d’
Orb
ign
y,
1826)
0,00
0,00
0,00
0,00
0,00
0,00
0,00
0,00
0,00
0,00
0,00
0,00
0,00
0,00
Pyrg
o e
lon
ga
ta (
d’O
rbig
ny,
1826)
0,00
0,12
0,00
0,00
0,00
0,00
0,00
0,00
0,00
0,00
0,00
0,00
0,00
0,00
Pyrg
o m
urr
hin
a (
Sch
wag
er,
1866)
0,00
0,00
0,00
0,00
0,00
0,00
0,22
0,11
0,00
0,00
0,00
0,12
0,00
0,00
Pyrg
o n
asu
ta C
us
hm
an
, 1935
0,19
0,00
0,00
0,00
0,00
0,18
0,00
0,11
0,09
0,00
0,19
0,12
0,00
0,00
Pyrg
o o
blo
ng
a (
d´
Orb
ign
y,
1839)
0,00
0,00
0,00
0,00
0,00
0,00
0,00
0,00
0,00
0,07
0,00
0,12
0,00
0,00
Ben
thic
fo
ram
inif
era
taxa
Esti
mate
d a
ge
(yr
cal.
BP
)
Ben
thic
fo
ram
inif
era
(%
)

Co
nt.
Ap
pen
dix
2 -
4489
4699
4914
5132
5354
5579
5807
6038
6508
6987
7228
7471
7715
7959
Pyrg
o r
ing
en
s (
La
marc
k,
1804)
0,00
0,00
0,00
0,00
0,13
0,06
0,00
0,00
0,00
0,07
0,00
0,12
0,00
0,00
Pyrg
o s
p.1
0,00
0,12
0,00
0,00
0,00
0,00
0,00
0,00
0,00
0,00
0,00
0,00
0,00
0,00
Pyrg
o s
p.2
0,00
0,00
0,00
0,00
0,00
0,00
0,00
0,00
0,09
0,00
0,00
0,00
0,14
0,00
Pyrg
o s
p.3
0,19
0,00
0,00
0,00
0,00
0,00
0,00
0,00
0,00
0,00
0,00
0,00
0,00
0,00
Pyrg
o s
p.4
0,00
0,00
0,08
0,00
0,00
0,00
0,00
0,00
0,00
0,00
0,00
0,00
0,00
0,13
Pyrg
o s
pp
.0,
000,
000,
000,
000,
000,
000,
000,
000,
000,
000,
000,
240,
000,
00Q
uin
qu
elo
cu
lin
a a
kn
eri
an
a d
’ O
rbig
ny,
1846
0,00
0,00
0,00
0,00
0,00
0,00
0,00
0,11
0,18
0,37
0,00
0,72
0,00
0,00
Qu
inq
ue
loc
ulin
a a
myg
da
loid
es
(B
rad
y,
1884)
0,00
0,00
0,00
0,00
0,00
0,00
0,00
0,00
0,00
0,00
0,00
0,12
0,00
0,00
Qu
inq
ue
loc
ulin
a a
tlan
tica
Bo
lto
vsko
y,
1957
0,00
0,00
0,00
0,00
0,00
0,00
0,00
0,00
0,27
0,00
0,00
0,24
0,00
0,13
Qu
inq
ue
loc
ulin
a i
ntr
icata
(T
erq
ue
m,
1878)
0,00
0,00
0,00
0,00
0,00
0,00
0,00
0,00
0,00
0,00
0,00
0,00
0,00
0,13
Qu
inq
ue
loc
ulin
a lam
arc
kia
na
d´O
rbig
ny,
1839
0,00
0,00
0,00
0,00
0,13
0,00
0,44
0,11
0,09
0,07
0,00
0,24
0,14
0,51
Qu
inq
ue
loc
ulin
a m
ille
tti
(Wie
sn
er,
1923)
0,00
0,00
0,00
0,00
0,00
0,00
0,00
0,00
0,00
0,00
0,00
0,00
0,00
0,00
Qu
inq
ue
loc
ulin
a s
pp
. 0,
190,
000,
000,
270,
000,
000,
220,
000,
000,
000,
190,
120,
140,
13R
os
alin
a g
lob
ula
ris
(d
’ O
rbig
ny,
1826)
0,00
0,00
0,00
2,15
0,93
0,00
0,00
0,00
0,00
0,00
0,00
0,00
0,00
0,00
Ro
salin
a s
p.1
0,00
0,00
0,85
0,00
0,00
0,00
0,00
2,24
2,93
0,00
0,00
0,36
0,00
0,00
Ro
salin
a s
p2
.0,
000,
000,
000,
000,
000,
000,
000,
110,
000,
070,
000,
000,
000,
00R
os
alin
a s
pp
.0,
000,
000,
000,
000,
270,
000,
660,
000,
000,
002,
100,
000,
860,
51S
ara
cen
ari
a s
p.
0,00
0,00
0,00
0,00
0,13
0,00
0,00
0,00
0,00
0,00
0,00
0,00
0,00
0,00
Seab
roo
kia
earl
an
di
Wri
gh
t, 1
891
0,39
0,00
0,31
0,27
0,13
0,42
0,66
0,00
0,37
0,07
0,57
0,12
0,43
0,64
Sig
mo
ilo
ps
is s
ch
lum
be
rge
ri (
Sil
vestr
i, 1
904)
0,19
0,00
0,00
0,00
0,00
0,00
0,00
0,00
0,18
0,00
0,38
0,00
0,57
0,13
Sip
ho
nap
ert
a s
p.1
0,00
0,00
0,15
0,00
0,00
0,00
0,00
0,00
0,00
0,00
0,00
0,00
0,14
0,00
Sip
ho
nap
ert
a s
p.2
0,00
0,00
0,00
0,00
0,00
0,00
0,00
0,00
0,00
0,00
0,00
0,00
0,00
0,13
Sip
ho
nin
a b
rad
yan
a C
us
hm
an
, 1927
0,39
0,00
0,00
0,00
0,13
0,00
0,22
0,00
0,00
0,00
0,19
0,00
0,14
0,13
Sip
ho
nin
a s
p1
.0,
000,
000,
150,
000,
000,
060,
000,
110,
000,
000,
000,
000,
000,
00S
pir
og
luti
na
sp
p.
0,00
0,00
0,00
0,00
0,00
0,00
0,22
0,00
0,00
0,00
0,00
0,00
0,00
0,00
Sp
iro
loc
ulin
a s
p.1
0,00
0,00
0,00
0,00
0,00
0,00
0,00
0,00
0,00
0,00
0,00
0,00
0,00
0,13
Sp
iro
loc
ulin
a s
p.2
0,00
0,00
0,00
0,00
0,00
0,06
0,00
0,00
0,00
0,00
0,00
0,00
0,00
0,00
Sp
iro
ple
cti
ne
lla w
rig
hti
i (S
ilvestr
i, 1
903)
0,00
0,00
0,00
0,00
0,00
0,00
0,22
0,00
0,00
0,00
0,19
0,12
0,43
0,25
Sta
info
rth
ia c
om
pla
na
ta (
Eg
ge
r, 1
895)
0,00
0,00
0,00
0,54
0,00
0,00
0,00
0,00
0,00
0,00
0,00
0,00
0,00
0,25
Sta
info
rth
ia s
pp
.0,
000,
000,
000,
000,
130,
000,
000,
000,
000,
000,
190,
000,
000,
00T
extu
llari
a s
p.1
0,00
0,00
0,00
0,00
0,00
0,00
0,00
0,00
0,00
0,22
0,00
0,36
0,43
0,76
Te
xtu
llari
a s
p.2
0,00
0,00
0,00
0,00
0,00
0,00
0,00
0,00
0,18
0,00
0,00
0,12
0,00
0,38
Te
xtu
llari
a s
p.3
0,00
0,00
0,00
0,00
0,00
0,00
0,00
0,11
0,00
0,00
0,38
0,48
0,00
0,00
Te
xtu
llari
a s
p.4
0,00
0,00
0,00
0,00
0,00
0,00
0,00
0,11
0,00
0,00
0,00
0,00
0,00
0,00
Ben
thic
fo
ram
inif
era
taxa
Esti
mate
d a
ge
(yr
cal.
BP
)
Ben
thic
fo
ram
inif
era
(%
)

Co
nt.
Ap
pen
dix
2 -
4489
4699
4914
5132
5354
5579
5807
6038
6508
6987
7228
7471
7715
7959
Te
xtu
llari
a s
pp
.0,
000,
000,
000,
000,
000,
000,
660,
000,
270,
000,
000,
240,
000,
00T
rifa
rin
a a
ng
ulo
sa
(W
illi
am
so
n,
1858)
0,00
0,00
0,77
0,00
0,00
1,33
0,00
1,34
0,64
0,29
0,00
1,08
0,00
0,00
Tri
fari
na
bra
dy
i C
us
hm
an
, 1923
0,00
0,12
0,00
0,00
0,00
0,00
0,00
0,00
0,00
0,00
0,00
0,00
0,00
0,00
Tri
loc
ulin
a s
p.2
0,00
0,00
0,00
0,00
0,00
0,00
0,00
0,00
0,00
0,07
0,00
0,00
0,00
0,00
Tri
loc
ulin
a s
pp
.0,
000,
000,
000,
000,
000,
000,
000,
000,
000,
000,
190,
000,
290,
00T
rilo
cu
lin
ella
sp
p.
0,00
0,00
0,00
0,00
0,00
0,00
0,22
0,00
0,00
0,00
0,19
0,00
0,00
0,51
Uvig
eri
na
au
be
rian
a d
’ O
rbig
ny,
1839
0,00
0,00
0,00
0,00
0,00
0,00
0,00
0,00
0,00
0,07
0,00
0,00
0,14
0,00
Uvig
eri
na
pere
gri
na
Cu
sh
man
, 1923
0,00
0,00
0,00
0,00
0,00
0,00
0,00
0,00
0,09
0,00
0,00
0,00
0,00
0,00
Uvig
eri
na
sp
p.
0,00
0,00
0,00
0,00
0,00
0,00
0,00
0,00
0,00
0,00
0,00
0,00
0,00
0,00
Valv
ulin
eri
a b
rad
yan
a (
Fo
rna
sin
i, 1
900)
0,00
0,00
0,00
0,00
0,00
0,00
0,00
0,00
0,00
0,00
0,00
0,00
0,00
0,00
tota
l d
en
sit
y (
tests•10 c
c-1
)19
355
3547
632
310
1922
423
960
3472
541
847
1587
519
700
5760
2786
413
025
4010
415
000
frag
men
ts (
%)
5,06
3,31
4,27
8,24
2,84
2,52
3,98
2,68
4,57
4,51
6,46
2,88
4,85
2,80
no
t id
en
tifi
ed
(%
)2,
780,
970,
934,
120,
500,
582,
390,
160,
890,
692,
840,
001,
621,
20E
(%
)12
,75
10,3
410
,64
13,2
09,
836,
8311
,25
9,84
14,0
15,
9416
,81
16,2
913
,00
15,2
8I
(%)
62,7
974
,04
71,5
658
,45
69,0
776
,61
70,3
760
,03
57,5
414
,37
56,3
645
,40
65,1
347
,63
BF
HP
in
de
x (
%)
15,2
613
,75
7,71
19,3
911
,42
9,06
11,9
110
,40
10,6
33,
7420
,25
18,4
516
,42
14,9
0
BF
AR
in
de
x (
tests
•cm
-2•k
yr-1
)18
4103
3310
2429
6180
1733
6521
2856
3042
8136
2131
1358
3116
5348
4766
322
9483
1069
3632
8741
2054
36R
3632
4628
4147
4047
5637
4556
5154
H'
2,21
2,13
2,15
2,36
2,25
2,08
2,51
2,29
2,57
2,30
2,67
2,79
2,48
2,74
J'
0,62
0,61
0,56
0,71
0,61
0,54
0,68
0,59
0,64
0,64
0,70
0,69
0,63
0,69
Ben
thic
fo
ram
inif
era
taxa
Esti
mate
d a
ge
(yr
cal.
BP
)
Ben
thic
fo
ram
inif
era
(%
)

Ap
pen
dix
3 -
Main
sed
imen
tolo
gic
al (g
rain
siz
e)
an
d g
eo
ch
em
ical (s
ed
imen
tary
org
an
ic m
att
er
an
d in
org
an
ic c
on
sti
tuen
ts, m
inera
log
y,
an
d p
lan
kto
nic
G. ru
ber
(p
) is
oto
pic
an
d e
lem
en
tal co
mp
osit
ion
) d
ata
ob
tain
ed
fo
r co
re 7
610. W
here
, *
sta
nd
s f
or
ab
sen
ce o
f d
ata
.
Cla
y
(%)
Silt
(%)
San
d
(%)
Mean
dia
mete
r
(Φ)
CaC
o3 (
%)
TO
C (
%)
Nto
t (%
)δ
13C
(‰
vs. V
PD
B)
δ1
5N
(‰
vs.
VP
DB
)C
N r
ati
o
0--2
691
6,05
87,0
26,
935,
9620
,81
0,88
0,14
-20,
801,
876,
102-
-474
15,
3867
,00
27,6
25,
28*
**
**
*4-
-679
13,
2952
,97
43,7
44,
64*
**
**
*6-
-884
15,
1685
,68
9,17
5,82
20,2
80,
910,
14-2
0,78
1,98
6,64
8--1
089
15,
9387
,66
6,41
5,97
20,9
50,
75*
-20,
91*
*10
--12
941
5,68
82,8
611
,46
5,79
19,8
70,
830,
17-2
1,01
1,00
4,97
12--
1499
15,
9186
,54
7,54
5,94
20,5
50,
870,
12-2
0,93
1,44
7,23
14--
1610
415,
3582
,18
12,4
75,
7519
,59
0,82
*-2
0,83
**
16--
1810
917,
3887
,93
4,69
6,21
19,7
40,
780,
13-2
0,96
1,31
6,11
18--
2011
416,
2588
,67
5,08
6,08
20,5
10,
690,
11-2
1,42
2,86
6,52
20--
2211
916,
3188
,49
5,20
6,07
19,7
30,
820,
13-2
1,23
1,14
6,39
22--
2412
416,
6088
,15
5,24
6,08
20,1
00,
810,
12-2
1,25
1,88
6,86
24--
2612
916,
0684
,05
9,89
5,88
23,0
90,
770,
13-2
1,09
2,18
6,06
26--
2813
415,
9885
,92
8,10
5,95
22,1
20,
820,
11-2
1,09
2,69
7,20
28--
3013
915,
9984
,21
9,80
5,89
19,9
30,
740,
11-2
0,62
2,76
6,96
30--
3214
425,
7383
,35
10,9
25,
8118
,91
0,76
0,12
-21,
161,
926,
1432
--34
1492
6,24
86,2
27,
545,
9819
,81
0,72
0,11
-20,
851,
956,
4134
--36
1542
**
**
**
**
**
38--
4016
435,
9188
,53
5,57
6,02
20,5
60,
74*
-20,
73*
*40
--42
1694
5,64
81,6
312
,74
5,76
20,6
50,
680,
12-2
0,82
1,49
5,50
42--
4417
45*
**
**
**
**
*44
--46
1795
5,42
90,7
43,
846,
0520
,79
0,67
0,13
-20,
652,
635,
2946
--48
1846
**
**
**
**
**
48--
501897
**
**
**
**
**
50--
521948
**
**
**
**
**
Co
re d
ep
th
(cm
)
Esti
mate
d a
ge
(yr
cal. B
P)
Gra
in s
ize
Sed
imen
tary
org
an
ic m
att
er

Co
nt.
Ap
pen
dix
3 -
Cla
y
(%)
Silt
(%)
San
d
(%)
Mean
dia
mete
r
(Φ)
CaC
o3 (
%)
TO
C (
%)
Nto
t (%
)δ
13C
(‰
vs. V
PD
B)
δ1
5N
(‰
vs.
VP
DB
)C
N r
ati
o
52--
5419
99*
**
**
**
**
*54
--56
2050
**
**
**
**
**
56--
5821
016,
4388
,21
5,36
6,08
21,6
80,
800,
14-2
0,62
0,80
5,91
58--
6021
538,
8989
,20
1,92
6,46
21,6
40,
800,
14-2
0,69
-2,3
95,
8660
--62
2204
7,19
88,9
33,
876,
2220
,86
0,67
0,10
-20,
800,
906,
4362
--64
2256
6,50
87,2
96,
216,
0621
,57
0,62
0,12
-21,
342,
015,
0964
--66
2307
7,32
88,6
44,
046,
2220
,98
0,49
0,12
-20,
951,
894,
0466
--68
2359
7,50
89,3
63,
136,
3121
,55
0,50
0,12
-20,
461,
324,
2668
--70
2411
8,55
89,5
51,
906,
4422
,68
0,48
0,11
-20,
360,
544,
2270
--72
2463
8,13
88,4
53,
426,
3221
,18
0,49
0,12
-20,
031,
824,
2072
--74
2515
7,74
89,4
12,
846,
3222
,51
0,58
0,11
-20,
770,
225,
0974
--76
2567
6,46
89,6
03,
936,
1620
,31
0,65
*-2
1,24
**
76--
7826
205,
1387
,49
7,38
5,90
20,7
20,
700,
12-2
0,85
1,59
5,78
78--
8026
726,
7389
,39
3,88
6,20
20,6
00,
490,
11-2
0,11
1,41
4,49
80--
8227
257,
6191
,35
1,05
6,36
20,2
90,
460,
18-1
9,95
2,55
2,60
82--
8427
785,
7492
,97
1,28
6,22
20,9
80,
42*
-19,
78*
*84
--86
2831
6,95
88,8
84,
176,
1921
,41
0,47
*-2
0,44
**
86--
8828
847,
8889
,83
2,28
6,38
20,3
30,
49*
-20,
70*
*88
--90
2937
8,19
90,9
70,
846,
4320
,35
0,51
0,10
-21,
011,
024,
9590
--92
2991
5,80
91,0
73,
136,
0720
,02
0,60
0,13
-20,
670,
914,
6592
--94
3044
7,44
89,1
83,
386,
2521
,15
0,52
0,13
-20,
101,
994,
0094
--96
3098
8,15
89,9
11,
946,
4119
,73
0,43
0,13
-19,
472,
373,
3296
--98
3152
6,06
87,1
46,
806,
0120
,52
0,59
0,12
-21,
733,
184,
9698
--10
032
066,
3187
,26
6,44
6,04
19,9
50,
550,
13-2
0,46
1,48
4,30
100-
-102
3261
6,82
84,8
78,
316,
0521
,14
0,50
*-2
0,16
**
102-
-104
3315
6,50
86,7
96,
716,
0421
,01
0,48
0,11
-20,
412,
104,
3410
4--1
0633
707,
2188
,52
4,27
6,22
20,7
60,
540,
12-2
0,72
2,83
4,45
Co
re d
ep
th
(cm
)
Esti
mate
d a
ge
(yr
cal. B
P)
Gra
in s
ize
Sed
imen
tary
org
an
ic m
att
er

Co
nt.
Ap
pen
dix
3 -
Cla
y
(%)
Silt
(%)
San
d
(%)
Mean
dia
mete
r
(Φ)
CaC
o3 (
%)
TO
C (
%)
Nto
t (%
)δ
13C
(‰
vs. V
PD
B)
δ1
5N
(‰
vs.
VP
DB
)C
N r
ati
o
106-
-108
3425
6,78
89,8
13,
406,
2020
,86
0,36
0,11
-20,
232,
313,
2710
8--1
1034
805,
8085
,16
9,04
5,89
19,9
80,
380,
11-2
0,30
2,29
3,27
110-
-112
3536
5,79
87,8
76,
346,
0020
,57
0,54
0,11
-20,
502,
874,
7911
2--1
1435
915,
5174
,20
20,2
95,
5220
,64
0,39
0,12
-20,
621,
063,
2211
4--1
1636
476,
4688
,84
4,70
6,13
20,0
00,
460,
11-1
9,95
2,64
4,04
116-
-118
3703
6,72
90,0
33,
256,
1820
,41
0,54
0,11
-21,
383,
524,
8011
8--1
2037
596,
0980
,82
13,0
95,
7820
,19
0,60
0,11
-21,
343,
135,
2512
0--1
2238
154,
9778
,22
16,8
15,
5519
,93
0,63
0,13
-21,
505,
654,
9212
2--1
2438
725,
7785
,17
9,05
5,89
19,4
60,
640,
13-2
1,39
5,50
4,85
124-
-126
3928
6,04
84,4
29,
535,
8919
,41
0,53
0,13
-21,
715,
443,
9312
6--1
2839
855,
8078
,65
15,5
55,
7020
,05
0,66
0,13
-21,
194,
805,
2712
8--1
3040
425,
5881
,64
12,7
85,
7520
,05
0,67
0,12
-21,
454,
945,
7713
0--1
3240
995,
7283
,03
11,2
55,
8120
,53
0,54
0,12
-21,
224,
844,
6213
2--1
3441
576,
9188
,67
4,43
6,19
20,3
30,
550,
12-2
1,35
4,66
4,40
134-
-136
4214
6,31
79,9
013
,80
5,79
20,8
70,
530,
11-2
1,36
4,75
4,80
136-
-138
4272
6,55
83,1
310
,32
5,96
20,4
50,
470,
12-2
1,43
5,23
3,98
138-
-140
4330
6,25
83,2
110
,54
5,90
20,6
70,
78*
-21,
37*
*14
0--1
4243
886,
3479
,67
13,9
95,
7820
,26
0,63
0,11
-21,
494,
705,
5614
2--1
4444
466,
8383
,87
9,30
5,99
20,6
50,
630,
08-2
1,84
4,39
8,15
144-
-146
4505
6,69
81,2
112
,11
5,91
21,1
50,
630,
11-2
1,40
4,61
5,58
146-
-148
4563
7,16
83,9
88,
866,
0521
,21
0,48
0,10
-21,
394,
345,
0014
8--1
5046
227,
4186
,63
5,96
6,17
20,6
80,
470,
09-2
1,63
4,59
5,07
150-
-152
4681
7,19
81,9
910
,82
6,00
19,8
50,
290,
09-2
1,95
4,84
3,16
152-
-154
4741
8,76
89,9
01,
346,
5321
,58
0,52
0,09
-21,
804,
755,
6715
4--1
5648
007,
2484
,15
8,61
6,07
22,8
40,
340,
10-2
1,81
4,95
3,42
156-
-158
4860
9,01
89,9
71,
026,
5220
,92
0,40
0,08
-21,
774,
984,
9415
8--1
6049
197,
7584
,66
7,59
6,17
19,6
40,
210,
07-2
2,05
4,55
3,01
Co
re d
ep
th
(cm
)
Esti
mate
d a
ge
(yr
cal. B
P)
Gra
in s
ize
Sed
imen
tary
org
an
ic m
att
er

Co
nt.
Ap
pen
dix
3 -
Cla
y
(%)
Silt
(%)
San
d
(%)
Mean
dia
mete
r
(Φ)
CaC
o3 (
%)
TO
C (
%)
Nto
t (%
)δ
13C
(‰
vs. V
PD
B)
δ1
5N
(‰
vs.
VP
DB
)C
N r
ati
o
160-
-162
4979
7,23
83,9
68,
826,
0720
,19
0,18
0,08
-21,
964,
162,
1016
2--1
6450
397,
2181
,19
11,6
05,
9919
,86
0,34
0,09
-21,
635,
363,
6516
4--1
6650
997,
2679
,76
12,9
85,
9521
,42
0,15
0,08
-22,
485,
301,
8116
6--1
6851
607,
6985
,48
6,83
6,16
20,6
00,
48*
-21,
80*
*16
8--1
7052
208,
1683
,61
8,23
6,18
20,6
60,
320,
10-2
1,74
4,59
3,35
170-
-172
5281
5,39
70,9
423
,67
5,37
20,2
10,
210,
10-2
1,77
4,51
2,18
172-
-174
5342
4,84
67,6
327
,52
5,20
21,1
90,
210,
09-2
2,01
4,86
2,45
174-
-176
5402
5,19
73,7
721
,05
5,44
24,7
00,
330,
09-2
1,79
5,01
3,49
176-
-178
5463
4,60
63,9
731
,43
5,06
17,1
10,
19*
-21,
78*
*17
8--1
8055
246,
4273
,92
19,6
75,
6221
,06
0,39
0,11
-21,
485,
073,
6218
0--1
8255
866,
0576
,88
17,0
75,
6621
,10
0,25
0,10
-21,
875,
072,
4118
2--1
8456
476,
8580
,66
12,4
95,
8920
,66
0,39
0,10
-21,
585,
183,
8818
4--1
8657
085,
6477
,52
16,8
45,
6319
,85
0,27
0,09
-21,
643,
683,
0918
6--1
8857
705,
5773
,90
20,5
25,
5020
,43
0,42
0,09
-22,
545,
064,
8118
8--1
9058
325,
7872
,34
21,8
85,
4920
,28
0,38
0,10
-21,
724,
483,
9619
0--1
9258
935,
8879
,95
14,1
75,
7421
,04
0,49
0,10
-21,
614,
775,
0619
2--1
9459
556,
3976
,20
17,4
25,
7120
,45
0,26
0,09
-21,
654,
242,
8819
4--1
9660
175,
8374
,07
20,0
95,
5521
,64
0,19
0,09
-22,
254,
222,
0919
6--1
9860
795,
4368
,39
26,1
75,
3220
,90
0,17
0,09
-21,
905,
311,
8119
8--2
0061
415,
4365
,25
29,3
35,
2321
,41
0,33
0,09
-22,
254,
753,
65
Co
re d
ep
th
(cm
)
Esti
mate
d a
ge
(yr
cal. B
P)
Gra
in s
ize
Sed
imen
tary
org
an
ic m
att
er

Co
nt.
Ap
pen
dix
3 -
Al
(mg
/kg
)
Ba
(mg
/kg
)
Ca
(mg
/kg
)
Fe
(mg
/kg
)
Ti
(mg
/kg
)
Fe/C
a
rati
o
Ti/C
a
rati
o
Ba/A
l
rati
o
Ba/C
a
rati
o
0--2
691
6894
7,90
193,
9720
814,
0040
988,
5038
68,1
81,
969
0,18
60,
003
0,00
92-
-474
144
564,
1020
7,45
4146
7,90
2503
4,40
2455
,39
0,60
40,
059
0,00
50,
005
4--6
791
6872
9,50
206,
1624
741,
3045
225,
2042
55,2
81,
828
0,17
20,
003
0,00
86-
-884
129
067,
6021
5,63
4699
3,50
1844
8,50
1835
,07
0,39
30,
039
0,00
70,
005
8--1
089
170
888,
8020
1,01
2103
7,00
4194
6,50
3941
,14
1,99
40,
187
0,00
30,
010
10--
1294
167
777,
3020
1,94
2657
3,40
4082
5,10
3766
,94
1,53
60,
142
0,00
30,
008
12--
1499
165
581,
9019
1,56
2918
7,60
3951
4,30
3609
,74
1,35
40,
124
0,00
30,
007
14--
1610
4165
402,
8019
4,64
2076
1,30
3896
0,40
3631
,74
1,87
70,
175
0,00
30,
009
16--
1810
9171
963,
0019
3,77
2338
5,30
4223
1,00
3978
,78
1,80
60,
170
0,00
30,
008
18--
2011
4168
699,
8019
8,35
2101
6,80
3992
8,20
3778
,87
1,90
00,
180
0,00
30,
009
20--
2211
9167
816,
9018
1,66
2170
5,20
4021
6,70
3795
,71
1,85
30,
175
0,00
30,
008
22--
2412
4172
043,
0019
6,72
2277
2,00
4212
9,40
4026
,10
1,85
00,
177
0,00
30,
009
24--
2612
9167
671,
4016
7,40
2093
0,60
3949
7,70
3681
,79
1,88
70,
176
0,00
20,
008
26--
2813
4165
279,
7017
5,41
2348
4,30
3849
6,50
3553
,24
1,63
90,
151
0,00
30,
007
28--
3013
9161
243,
5015
7,99
2488
9,40
3747
6,70
3614
,77
1,50
60,
145
0,00
30,
006
30--
3214
4266
466,
2017
9,95
2249
9,80
3895
5,20
3740
,81
1,73
10,
166
0,00
30,
008
32--
3414
9267
723,
2019
3,11
2475
8,90
4066
0,60
3866
,61
1,64
20,
156
0,00
30,
008
34--
3615
4266
971,
8019
1,00
2374
3,90
3934
3,00
3748
,08
1,65
70,
158
0,00
30,
008
38--
4016
4360
788,
8016
5,44
2060
1,20
3602
5,60
3415
,29
1,74
90,
166
0,00
30,
008
40--
4216
9465
819,
3018
7,22
2325
3,00
3854
0,50
3624
,82
1,65
70,
156
0,00
30,
008
42--
4417
45*
**
**
**
**
44--
4617
9564
331,
4018
9,65
2244
8,50
3809
1,70
3611
,06
1,69
70,
161
0,00
30,
008
46--
4818
46*
**
**
**
**
48--
501897
**
**
**
**
*50
--52
1948
**
**
**
**
*
Sed
imen
tary
in
org
an
ic c
on
sti
tuen
ts
Co
re d
ep
th
(cm
)
Esti
mate
d a
ge
(yr
cal. B
P)

Co
nt.
Ap
pen
dix
3 -
Al
(mg
/kg
)
Ba
(mg
/kg
)
Ca
(mg
/kg
)
Fe
(mg
/kg
)
Ti
(mg
/kg
)
Fe/C
a
rati
o
Ti/C
a
rati
o
Ba/A
l
rati
o
Ba/C
a
rati
o
52--
5419
99*
**
**
**
**
54--
5620
5065
362,
6018
3,57
2469
5,40
3851
0,50
3634
,38
1,55
90,
147
0,00
30,
007
56--
5821
0159
961,
2017
8,47
2629
2,90
3471
3,50
3342
,05
1,32
00,
127
0,00
30,
007
58--
6021
53*
**
**
**
**
60--
6222
0461
636,
9018
0,71
2888
0,50
3544
8,90
3450
,44
1,22
70,
119
0,00
30,
006
62--
6422
5661
632,
5017
9,26
2439
7,30
3583
8,50
3395
,09
1,46
90,
139
0,00
30,
007
64--
6623
0757
471,
8018
7,58
2378
6,10
3345
4,60
3216
,46
1,40
60,
135
0,00
30,
008
66--
6823
5956
665,
1017
6,74
2547
5,50
3254
4,30
3215
,91
1,27
70,
126
0,00
30,
007
68--
7024
1156
142,
8017
6,04
2856
1,40
3233
4,60
3197
,82
1,13
20,
112
0,00
30,
006
70--
7224
6357
697,
8018
9,83
2729
8,20
3433
4,60
3411
,44
1,25
80,
125
0,00
30,
007
72--
7425
1557
876,
3018
2,61
2607
3,70
3518
2,20
3391
,23
1,34
90,
130
0,00
30,
007
74--
7625
6762
195,
1018
1,33
2753
3,00
3594
4,50
3582
,42
1,30
60,
130
0,00
30,
007
76--
7826
2072
764,
2017
9,12
2444
6,60
4257
1,50
4062
,32
1,74
10,
166
0,00
20,
007
78--
8026
72*
**
**
**
**
80--
8227
2567
749,
0019
8,60
2831
4,00
3907
3,80
3758
,26
1,38
00,
133
0,00
30,
007
82--
8427
7862
927,
7019
9,55
2905
2,70
3609
4,80
3614
,11
1,24
20,
124
0,00
30,
007
84--
8628
3159
132,
2018
8,42
2840
2,70
3542
9,90
3541
,96
1,24
70,
125
0,00
30,
007
86--
8828
8462
272,
3019
2,52
2670
9,40
3559
8,80
3538
,56
1,33
30,
132
0,00
30,
007
88--
9029
3761
929,
8019
2,56
2804
3,00
3594
3,80
3537
,79
1,28
20,
126
0,00
30,
007
90--
9229
9164
100,
3019
1,00
2781
4,90
3695
5,80
3608
,75
1,32
90,
130
0,00
30,
007
92--
9430
4462
275,
7018
7,02
2741
2,60
3630
1,40
3542
,61
1,32
40,
129
0,00
30,
007
94--
9630
9864
061,
5019
7,22
2775
7,10
3781
8,70
3619
,88
1,36
20,
130
0,00
30,
007
96--
9831
5258
423,
0018
5,93
2586
0,30
3497
3,90
3318
,25
1,35
20,
128
0,00
30,
007
98--
100
3206
6315
2,30
181,
8126
600,
8037
322,
9036
73,9
11,
403
0,13
80,
003
0,00
710
0--1
0232
6159
458,
7018
5,35
2630
9,50
3520
5,50
3442
,90
1,33
80,
131
0,00
30,
007
102-
-104
3315
5895
5,60
181,
5626
010,
3034
363,
3034
30,3
01,
321
0,13
20,
003
0,00
710
4--1
0633
7060
735,
2018
3,58
2800
5,00
3547
8,50
3446
,67
1,26
70,
123
0,00
30,
007
Co
re d
ep
th
(cm
)
Esti
mate
d a
ge
(yr
cal. B
P)
Sed
imen
tary
in
org
an
ic c
on
sti
tuen
ts
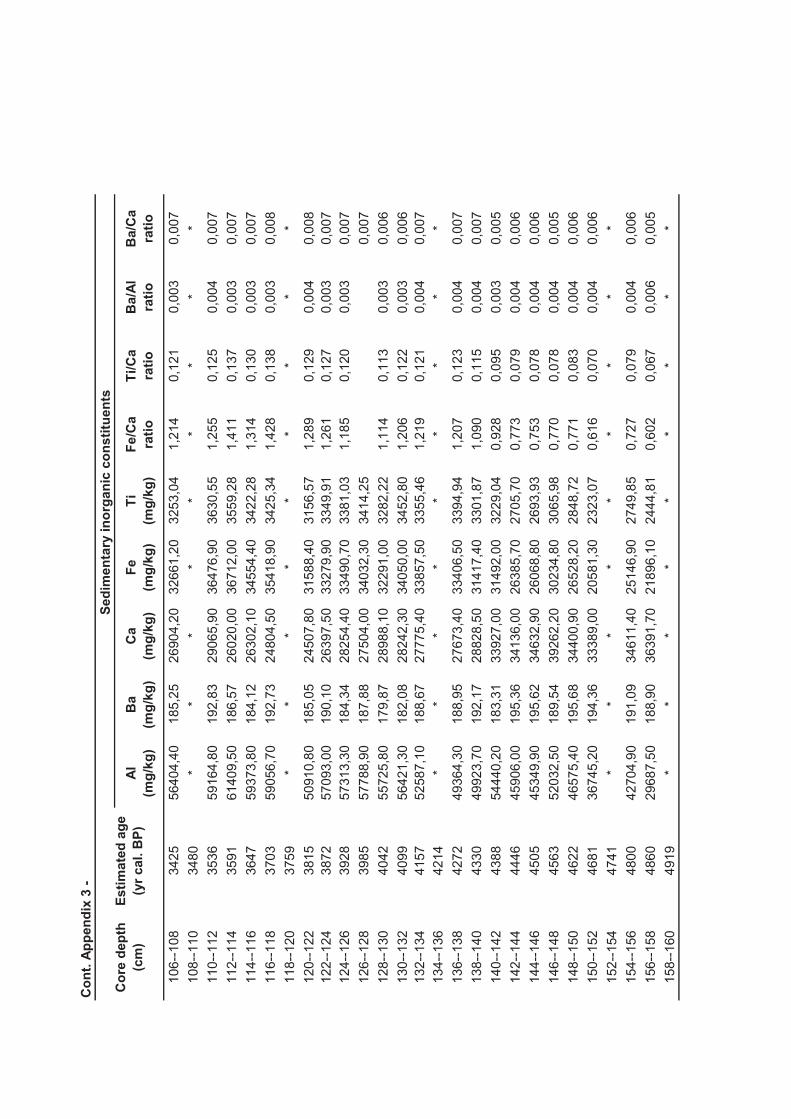
Co
nt.
Ap
pen
dix
3 -
Al
(mg
/kg
)
Ba
(mg
/kg
)
Ca
(mg
/kg
)
Fe
(mg
/kg
)
Ti
(mg
/kg
)
Fe/C
a
rati
o
Ti/C
a
rati
o
Ba/A
l
rati
o
Ba/C
a
rati
o
106-
-108
3425
5640
4,40
185,
2526
904,
2032
661,
2032
53,0
41,
214
0,12
10,
003
0,00
710
8--1
1034
80*
**
**
**
**
110-
-112
3536
5916
4,80
192,
8329
065,
9036
476,
9036
30,5
51,
255
0,12
50,
004
0,00
711
2--1
1435
9161
409,
5018
6,57
2602
0,00
3671
2,00
3559
,28
1,41
10,
137
0,00
30,
007
114-
-116
3647
5937
3,80
184,
1226
302,
1034
554,
4034
22,2
81,
314
0,13
00,
003
0,00
711
6--1
1837
0359
056,
7019
2,73
2480
4,50
3541
8,90
3425
,34
1,42
80,
138
0,00
30,
008
118-
-120
3759
**
**
**
**
*12
0--1
2238
1550
910,
8018
5,05
2450
7,80
3158
8,40
3156
,57
1,28
90,
129
0,00
40,
008
122-
-124
3872
5709
3,00
190,
1026
397,
5033
279,
9033
49,9
11,
261
0,12
70,
003
0,00
712
4--1
2639
2857
313,
3018
4,34
2825
4,40
3349
0,70
3381
,03
1,18
50,
120
0,00
30,
007
126-
-128
3985
5778
8,90
187,
8827
504,
0034
032,
3034
14,2
50,
007
128-
-130
4042
5572
5,80
179,
8728
988,
1032
291,
0032
82,2
21,
114
0,11
30,
003
0,00
613
0--1
3240
9956
421,
3018
2,08
2824
2,30
3405
0,00
3452
,80
1,20
60,
122
0,00
30,
006
132-
-134
4157
5258
7,10
188,
6727
775,
4033
857,
5033
55,4
61,
219
0,12
10,
004
0,00
713
4--1
3642
14*
**
**
**
**
136-
-138
4272
4936
4,30
188,
9527
673,
4033
406,
5033
94,9
41,
207
0,12
30,
004
0,00
713
8--1
4043
3049
923,
7019
2,17
2882
8,50
3141
7,40
3301
,87
1,09
00,
115
0,00
40,
007
140-
-142
4388
5444
0,20
183,
3133
927,
0031
492,
0032
29,0
40,
928
0,09
50,
003
0,00
514
2--1
4444
4645
906,
0019
5,36
3413
6,00
2638
5,70
2705
,70
0,77
30,
079
0,00
40,
006
144-
-146
4505
4534
9,90
195,
6234
632,
9026
068,
8026
93,9
30,
753
0,07
80,
004
0,00
614
6--1
4845
6352
032,
5018
9,54
3926
2,20
3023
4,80
3065
,98
0,77
00,
078
0,00
40,
005
148-
-150
4622
4657
5,40
195,
6834
400,
9026
528,
2028
48,7
20,
771
0,08
30,
004
0,00
615
0--1
5246
8136
745,
2019
4,36
3338
9,00
2058
1,30
2323
,07
0,61
60,
070
0,00
40,
006
152-
-154
4741
**
**
**
**
*15
4--1
5648
0042
704,
9019
1,09
3461
1,40
2514
6,90
2749
,85
0,72
70,
079
0,00
40,
006
156-
-158
4860
2968
7,50
188,
9036
391,
7021
896,
1024
44,8
10,
602
0,06
70,
006
0,00
515
8--1
6049
19*
**
**
**
**
Co
re d
ep
th
(cm
)
Esti
mate
d a
ge
(yr
cal. B
P)
Sed
imen
tary
in
org
an
ic c
on
sti
tuen
ts

Co
nt.
Ap
pen
dix
3 -
Al
(mg
/kg
)
Ba
(mg
/kg
)
Ca
(mg
/kg
)
Fe
(mg
/kg
)
Ti
(mg
/kg
)
Fe/C
a
rati
o
Ti/C
a
rati
o
Ba/A
l
rati
o
Ba/C
a
rati
o
160-
-162
4979
4543
2,80
188,
7230
327,
3026
379,
4028
08,4
80,
870
0,09
30,
004
0,00
616
2--1
6450
3948
297,
9018
5,86
3204
1,00
2724
6,90
2966
,83
0,85
00,
093
0,00
40,
006
164-
-166
5099
4087
8,30
193,
6035
470,
9026
269,
2028
85,9
00,
741
0,08
10,
005
0,00
516
6--1
6851
6040
784,
0019
2,13
3528
3,70
2634
2,80
2887
,83
0,74
70,
082
0,00
50,
005
168-
-170
5220
4573
7,50
188,
6131
824,
8027
216,
1030
00,5
50,
855
0,09
40,
004
0,00
617
0--1
7252
8149
982,
9020
4,64
3301
8,50
2863
0,80
3070
,90
0,86
70,
093
0,00
40,
006
172-
-174
5342
**
**
**
**
*17
4--1
7654
0241
930,
0019
1,23
3124
2,80
2557
6,50
2813
,66
0,81
90,
090
0,00
50,
006
176-
-178
5463
4578
6,30
181,
4433
652,
4026
749,
2029
94,9
20,
795
0,08
90,
004
0,00
517
8--1
8055
24*
**
**
**
**
180-
-182
5586
**
**
**
**
*18
2--1
8456
4753
018,
6018
7,48
3028
8,60
3005
3,00
3170
,86
0,99
20,
105
0,00
40,
006
184-
-186
5708
5571
5,70
192,
7131
858,
6031
920,
7034
62,5
71,
002
0,10
90,
003
0,00
618
6--1
8857
7052
813,
2019
0,99
3255
1,40
3037
8,10
3274
,65
0,93
30,
101
0,00
40,
006
188-
-190
5832
4686
9,20
191,
8431
630,
9026
708,
4029
13,5
90,
844
0,09
20,
004
0,00
619
0--1
9258
9346
255,
4018
1,79
3419
0,20
2695
4,20
2983
,64
0,78
80,
087
0,00
40,
005
192-
-194
5955
4660
2,50
191,
2736
164,
2026
844,
5028
87,3
30,
742
0,08
00,
004
0,00
519
4--1
9660
1748
071,
1019
5,83
3696
1,80
2774
2,40
2944
,06
0,75
10,
080
0,00
40,
005
196-
-198
6079
5154
5,50
202,
6936
304,
1029
348,
3032
03,4
20,
808
0,08
80,
004
0,00
619
8--2
0061
41*
**
**
**
**
Esti
mate
d a
ge
(yr
cal. B
P)
Sed
imen
tary
in
org
an
ic c
on
sti
tuen
ts
Co
re d
ep
th
(cm
)

Co
nt.
Ap
pen
dix
3 -
An
alc
ime
(%)
An
ata
se
(%)
An
idri
te
(%)
Bassan
ite
(%)
Calc
ite
(%)
Ch
lori
te
(%)
Do
lom
ite
(%)
K F
eld
ap
ars
(%)
Ph
ylo
ssilic
ate
s
(%)
Halite
(%)
0--2
691
1,66
0,00
0,69
0,00
6,36
0,10
0,00
2,07
66,5
30,
002-
-474
10,
000,
000,
470,
0022
,16
0,00
0,00
1,33
43,6
05,
614-
-679
10,
000,
000,
000,
007,
840,
150,
003,
6466
,48
0,00
6--8
841
**
**
**
**
**
8--1
089
1*
**
**
**
**
*10
--12
941
**
**
**
**
**
12--
1499
10,
000,
001,
890,
0010
,05
0,63
0,00
0,00
53,4
23,
4614
--16
1041
2,24
0,00
0,00
0,00
15,5
01,
060,
004,
1752
,16
2,98
16--
1810
911,
610,
000,
860,
009,
360,
020,
002,
7562
,42
2,07
18--
2011
41*
**
**
**
**
*20
--22
1191
**
**
**
**
**
22--
2412
41*
**
**
**
**
*24
--26
1291
**
**
**
**
**
26--
2813
41*
**
**
**
**
*28
--30
1391
**
**
**
**
**
30--
3214
420,
001,
680,
000,
0011
,02
0,00
0,00
0,00
47,7
42,
2032
--34
1492
0,00
0,00
1,17
0,00
11,3
90,
000,
001,
5654
,53
1,27
34--
3615
422,
020,
001,
210,
006,
250,
540,
003,
3360
,51
2,42
38--
4016
43*
**
**
**
**
*40
--42
1694
**
**
**
**
**
42--
4417
45*
**
**
**
**
*44
--46
1795
**
**
**
**
**
46--
4818
46*
**
**
**
**
*48
--50
1897
**
**
**
**
**
50--
521948
2,71
0,00
0,56
0,00
10,8
20,
480,
005,
0550
,50
4,51
Min
era
log
yC
ore
dep
th
(cm
)
Esti
mate
d a
ge
(yr
cal. B
P)

Co
nt.
Ap
pen
dix
3 -
An
alc
ime
(%)
An
ata
se
(%)
An
idri
te
(%)
Bassan
ite
(%)
Calc
ite
(%)
Ch
lori
te
(%)
Do
lom
ite
(%)
K F
eld
ap
ars
(%)
Ph
ylo
ssilic
ate
s
(%)
Halite
(%)
52--
5419
990,
920,
000,
690,
008,
550,
000,
000,
0048
,64
2,36
54--
5620
502,
351,
610,
000,
0010
,21
0,00
0,00
0,00
47,0
32,
8256
--58
2101
**
**
**
**
**
58--
6021
53*
**
**
**
**
*60
--62
2204
**
**
**
**
**
62--
6422
56*
**
**
**
**
*64
--66
2307
**
**
**
**
**
66--
6823
59*
**
**
**
**
*68
--70
2411
**
**
**
**
**
70--
7224
630,
690,
000,
730,
0012
,78
0,00
0,66
0,00
49,5
60,
8872
--74
2515
1,16
0,00
0,71
0,00
12,3
70,
000,
000,
0041
,91
4,19
74--
7625
672,
330,
000,
000,
008,
930,
500,
003,
7254
,42
1,58
76--
7826
20*
**
**
**
**
*78
--80
2672
**
**
**
**
**
80--
8227
25*
**
**
**
**
*82
--84
2778
**
**
**
**
**
84--
8628
31*
**
**
**
**
*86
--88
2884
**
**
**
**
**
88--
9029
37*
**
**
**
**
*90
--92
2991
1,11
0,00
1,33
0,00
11,3
10,
000,
003,
9949
,92
0,78
92--
9430
442,
020,
000,
810,
0011
,32
0,27
0,00
0,00
40,4
44,
0494
--96
3098
3,36
0,00
0,00
0,00
19,5
80,
260,
000,
0042
,23
2,50
96--
9831
52*
**
**
**
**
*98
--10
032
06*
**
**
**
**
*10
0--1
0232
61*
**
**
**
**
*10
2--1
0433
15*
**
**
**
**
*10
4--1
0633
701,
950,
000,
830,
0016
,38
0,00
0,00
7,18
43,6
90,
86
Co
re d
ep
th
(cm
)
Esti
mate
d a
ge
(yr
cal. B
P)
Min
era
log
y

Co
nt.
Ap
pen
dix
3 -
An
alc
ime
(%)
An
ata
se
(%)
An
idri
te
(%)
Bassan
ite
(%)
Calc
ite
(%)
Ch
lori
te
(%)
Do
lom
ite
(%)
K F
eld
ap
ars
(%)
Ph
ylo
ssilic
ate
s
(%)
Halite
(%)
106-
-108
3425
0,76
0,00
0,00
0,00
9,76
0,00
0,00
3,66
56,9
11,
6810
8--1
1034
800,
000,
000,
000,
0016
,13
0,00
0,00
0,00
44,8
01,
6111
0--1
1235
36*
**
**
**
**
*11
2--1
1435
91*
**
**
**
**
*11
4--1
1636
47*
**
**
**
**
*11
6--1
1837
03*
**
**
**
**
*11
8--1
2037
59*
**
**
**
**
*12
0--1
2238
15*
**
**
**
**
*12
2--1
2438
72*
**
**
**
**
*12
4--1
2639
28*
**
**
**
**
*12
6--1
2839
850,
970,
000,
000,
0019
,70
0,26
0,00
3,09
38,6
33,
6712
8--1
3040
420,
000,
001,
060,
009,
230,
000,
000,
0059
,37
2,11
130-
-132
4099
2,48
0,00
0,00
0,00
11,2
90,
000,
004,
1651
,49
2,08
132-
-134
4157
**
**
**
**
**
134-
-136
4214
**
**
**
**
**
136-
-138
4272
**
**
**
**
**
138-
-140
4330
**
**
**
**
**
140-
-142
4388
**
**
**
**
**
142-
-144
4446
**
**
**
**
**
144-
-146
4505
3,80
0,00
0,00
0,00
12,1
50,
150,
003,
8343
,32
0,90
146-
-148
4563
0,00
0,00
0,00
0,00
14,2
70,
000,
003,
6441
,96
9,65
148-
-150
4622
1,41
0,00
0,00
0,00
14,3
70,
000,
007,
6142
,25
0,85
150-
-152
4681
**
**
**
**
**
152-
-154
4741
**
**
**
**
**
154-
-156
4800
**
**
**
**
**
156-
-158
4860
**
**
**
**
**
158-
-160
4919
**
**
**
**
**
Co
re d
ep
th
(cm
)
Esti
mate
d a
ge
(yr
cal. B
P)
Min
era
log
y

Co
nt.
Ap
pen
dix
3 -
An
alc
ime
(%)
An
ata
se
(%)
An
idri
te
(%)
Bassan
ite
(%)
Calc
ite
(%)
Ch
lori
te
(%)
Do
lom
ite
(%)
K F
eld
ap
ars
(%)
Ph
ylo
ssilic
ate
s
(%)
Halite
(%)
160-
-162
4979
0,60
0,00
0,00
0,00
8,70
0,00
0,00
0,00
58,0
11,
3316
2--1
6450
390,
000,
000,
000,
0014
,06
0,18
0,69
6,89
38,6
11,
3816
4--1
6650
991,
670,
000,
000,
0015
,55
0,00
0,00
0,00
35,1
23,
0116
6--1
6851
60*
**
**
**
**
*16
8--1
7052
20*
**
**
**
**
*17
0--1
7252
81*
**
**
**
**
*17
2--1
7453
42*
**
**
**
**
*17
4--1
7654
020,
000,
001,
100,
0014
,05
0,00
0,00
0,00
49,5
91,
1017
6--1
7854
632,
220,
000,
000,
0012
,45
0,13
0,00
2,96
48,4
21,
0917
8--1
8055
243,
010,
001,
120,
0011
,55
0,00
1,68
3,13
43,3
01,
8018
0--1
8255
86*
**
**
**
**
*18
2--1
8456
47*
**
**
**
**
*18
4--1
8657
08*
**
**
**
**
*18
6--1
8857
70*
**
**
**
**
*18
8--1
9058
32*
**
**
**
**
*19
0--1
9258
93*
**
**
**
**
*19
2--1
9459
554,
620,
002,
460,
738,
540,
000,
000,
0046
,15
0,17
194-
-196
6017
1,55
0,00
1,18
0,00
16,4
90,
000,
008,
1628
,37
1,95
196-
-198
6079
0,58
0,00
0,00
0,00
13,6
60,
000,
000,
0053
,12
1,17
198-
-200
6141
1,69
0,00
0,54
0,00
13,0
20,
000,
000,
0047
,46
3,39
Co
re d
ep
th
(cm
)
Esti
mate
d a
ge
(yr
cal. B
P)
Min
era
log
y

Co
nt.
Ap
pen
dix
3 -
Hem
ati
te
(%)
Mag
n/M
ag
he
(%)
Op
al
C/C
T (
%)
Pla
gio
cla
se
(%)
Pir
ite
(%)
Qu
art
z
(%)
Sid
eri
te
(%)
Ro
do
cro
sit
e
(%)
DM
ind
ex
FD
M/F
CM
ind
ex
0--2
691
0,00
0,00
3,55
5,62
0,22
13,3
10,
000,
0081
,90
3,17
2--4
741
0,00
0,00
1,78
6,58
7,12
11,3
50,
000,
0056
,28
2,26
4--6
791
0,00
0,00
1,59
5,45
0,00
15,0
00,
000,
0085
,11
2,76
6--8
841
**
**
**
**
**
8--1
089
1*
**
**
**
**
*10
--12
941
**
**
**
**
**
12--
1499
10,
000,
009,
430,
000,
7920
,97
0,00
0,00
74,3
92,
5514
--16
1041
0,00
1,68
3,18
4,77
0,20
13,1
20,
000,
0069
,45
2,36
16--
1810
910,
000,
002,
945,
140,
4612
,39
0,00
0,00
77,5
73,
0818
--20
1141
**
**
**
**
**
20--
2211
91*
**
**
**
**
*22
--24
1241
**
**
**
**
**
24--
2612
91*
**
**
**
**
*26
--28
1341
**
**
**
**
**
28--
3013
91*
**
**
**
**
*30
--32
1442
0,00
0,00
3,36
10,4
94,
4119
,10
0,00
0,00
66,8
41,
6132
--34
1492
0,00
0,00
6,43
5,84
0,29
17,5
30,
000,
0073
,61
2,19
34--
3615
420,
000,
005,
653,
831,
0113
,77
0,00
0,00
77,6
12,
8938
--40
1643
**
**
**
**
**
40--
4216
94*
**
**
**
**
*42
--44
1745
**
**
**
**
**
44--
4617
95*
**
**
**
**
*46
--48
1846
**
**
**
**
**
48--
501897
**
**
**
**
**
50--
521948
0,00
1,39
2,65
5,05
0,36
16,4
10,
000,
0071
,96
1,90
Co
re d
ep
th
(cm
)
Esti
mate
d a
ge
(yr
cal. B
P)
Min
era
log
y

Co
nt.
Ap
pen
dix
3 -
Hem
ati
te
(%)
Mag
n/M
ag
he
(%)
Op
al
C/C
T (
%)
Pla
gio
cla
se
(%)
Pir
ite
(%)
Qu
art
z
(%)
Sid
eri
te
(%)
Ro
do
cro
sit
e
(%)
DM
ind
ex
FD
M/F
CM
ind
ex
52--
5419
990,
000,
0010
,61
6,78
0,88
20,5
60,
000,
0069
,21
1,78
54--
5620
500,
001,
456,
999,
270,
1318
,14
0,00
0,00
65,1
61,
7256
--58
2101
**
**
**
**
**
58--
6021
53*
**
**
**
**
*60
--62
2204
**
**
**
**
**
62--
6422
56*
**
**
**
**
*64
--66
2307
**
**
**
**
**
66--
6823
59*
**
**
**
**
*68
--70
2411
**
**
**
**
**
70--
7224
630,
000,
006,
616,
940,
4420
,71
0,00
0,00
70,2
71,
7972
--74
2515
0,00
0,00
5,85
8,38
0,40
25,0
10,
000,
0066
,93
1,25
74--
7625
670,
000,
005,
585,
581,
1216
,74
0,00
0,00
74,8
82,
0976
--78
2620
**
**
**
**
**
78--
8026
72*
**
**
**
**
*80
--82
2725
**
**
**
**
**
82--
8427
78*
**
**
**
**
*84
--86
2831
**
**
**
**
**
86--
8828
84*
**
**
**
**
*88
--90
2937
**
**
**
**
**
90--
9229
910,
000,
008,
436,
430,
8915
,14
0,67
0,00
69,0
51,
9592
--94
3044
0,00
0,00
4,04
8,49
0,61
28,2
10,
000,
0068
,66
1,10
94--
9630
980,
000,
004,
990,
001,
1526
,20
0,00
0,00
68,4
31,
6196
--98
3152
**
**
**
**
**
98--
100
3206
**
**
**
**
**
100-
-102
3261
**
**
**
**
**
102-
-104
3315
**
**
**
**
**
104-
-106
3370
0,00
0,00
0,00
6,55
1,25
21,3
00,
000,
0072
,17
1,25
Co
re d
ep
th
(cm
)
Esti
mate
d a
ge
(yr
cal. B
P)
Min
era
log
y

Co
nt.
Ap
pen
dix
3 -
Hem
ati
te
(%)
Mag
n/M
ag
he
(%)
Op
al
C/C
T (
%)
Pla
gio
cla
se
(%)
Pir
ite
(%)
Qu
art
z
(%)
Sid
eri
te
(%)
Ro
do
cro
sit
e
(%)
DM
ind
ex
FD
M/F
CM
ind
ex
106-
-108
3425
0,00
0,00
7,32
5,49
0,41
14,0
20,
000,
7174
,59
2,46
108-
-110
3480
0,00
0,00
0,00
11,4
70,
7225
,27
0,00
0,00
70,0
71,
2211
0--1
1235
36*
**
**
**
**
*11
2--1
1435
91*
**
**
**
**
*11
4--1
1636
47*
**
**
**
**
*11
6--1
1837
03*
**
**
**
**
*11
8--1
2037
59*
**
**
**
**
*12
0--1
2238
15*
**
**
**
**
*12
2--1
2438
72*
**
**
**
**
*12
4--1
2639
28*
**
**
**
**
*12
6--1
2839
850,
150,
004,
2511
,97
0,00
17,5
80,
000,
0059
,29
1,18
128-
-130
4042
0,00
0,00
3,43
5,80
0,79
18,2
10,
000,
0077
,57
2,47
130-
-132
4099
0,00
0,00
7,72
6,73
0,40
13,6
60,
000,
0069
,31
2,10
132-
-134
4157
**
**
**
**
**
134-
-136
4214
**
**
**
**
**
136-
-138
4272
**
**
**
**
**
138-
-140
4330
**
**
**
**
**
140-
-142
4388
**
**
**
**
**
142-
-144
4446
**
**
**
**
**
144-
-146
4505
0,00
0,00
11,2
57,
881,
3515
,53
0,00
0,00
62,6
71,
5914
6--1
4845
630,
000,
005,
034,
761,
4019
,30
0,00
0,00
64,9
01,
5214
8--1
5046
220,
000,
005,
637,
041,
4119
,44
0,00
0,00
69,3
01,
2415
0--1
5246
81*
**
**
**
**
*15
2--1
5447
41*
**
**
**
**
*15
4--1
5648
00*
**
**
**
**
*15
6--1
5848
60*
**
**
**
**
*15
8--1
6049
19*
**
**
**
**
*
Co
re d
ep
th
(cm
)
Esti
mate
d a
ge
(yr
cal. B
P)
Min
era
log
y

Co
nt.
Ap
pen
dix
3 -
Hem
ati
te
(%)
Mag
n/M
ag
he
(%)
Op
al
C/C
T (
%)
Pla
gio
cla
se
(%)
Pir
ite
(%)
Qu
art
z
(%)
Sid
eri
te
(%)
Ro
do
cro
sit
e
(%)
DM
ind
ex
FD
M/F
CM
ind
ex
160-
-162
4979
0,00
0,00
7,25
7,25
0,73
16,1
30,
000,
0074
,14
2,48
162-
-164
5039
0,00
1,27
9,10
7,72
0,83
19,4
40,
000,
0064
,94
1,13
164-
-166
5099
0,00
0,00
10,0
310
,03
1,00
23,5
80,
000,
0058
,70
1,04
166-
-168
5160
**
**
**
**
**
168-
-170
5220
**
**
**
**
**
170-
-172
5281
**
**
**
**
**
172-
-174
5342
**
**
**
**
**
174-
-176
5402
0,00
0,00
5,51
7,16
2,48
19,0
10,
000,
0068
,60
1,89
176-
-178
5463
0,00
0,00
3,95
13,8
31,
5813
,49
0,00
0,00
64,8
71,
6017
8--1
8055
240,
000,
005,
295,
291,
4422
,37
0,00
0,00
68,8
11,
4118
0--1
8255
86*
**
**
**
**
*18
2--1
8456
47*
**
**
**
**
*18
4--1
8657
08*
**
**
**
**
*18
6--1
8857
70*
**
**
**
**
*18
8--1
9058
32*
**
**
**
**
*19
0--1
9258
93*
**
**
**
**
*19
2--1
9459
550,
002,
495,
086,
461,
6221
,69
0,00
0,00
67,8
41,
6419
4--1
9660
170,
000,
007,
807,
451,
7725
,27
0,00
0,00
61,8
00,
6919
6--1
9860
790,
000,
005,
608,
761,
1715
,94
0,00
0,00
69,0
62,
1519
8--2
0061
410,
000,
006,
518,
140,
5418
,71
0,00
0,00
66,1
71,
77
Co
re d
ep
th
(cm
)
Esti
mate
d a
ge
(yr
cal. B
P)
Min
era
log
y

Co
nt.
Ap
pen
dix
3 -
G. ru
ber
(p)
geo
ch
em
ical co
mp
osit
ion
δ1
3C
(‰
,
VP
DB
)
δ1
8O
(‰
,
VP
DB
)
Ba/C
a
(um
ol/m
ol)
Mg
/Ca
(mm
ol/m
ol)
0--2
691
**
**
**
2--4
741
**
**
**
4--6
791
**
**
**
6--8
841
1,75
-1,0
71,19
4,21
26,72
1,48
8--1
089
11,
58-1
,02
1,21
4,16
26,60
1,50
10--
1294
11,
78-0
,97
1,62
3,99
26,13
1,44
12--
1499
11,
94-0
,70
**
**
14--
1610
411,
48-0
,66
1,05
3,76
25,48
1,61
16--
1810
911,
82-0
,90
0,94
3,94
25,99
1,48
18--
2011
411,
81-1
,01
1,12
4,01
26,19
1,42
20--
2211
912,
10-1
,06
1,00
4,09
26,40
*
22--
2412
411,
78-1
,17
1,24
4,36
27,12
1,47
24--
2612
911,
69-0
,67
1,29
4,37
27,13
1,97
26--
2813
411,
76-1
,10
1,49
4,21
26,71
1,45
28--
3013
911,
39-0
,59
1,10
3,48
24,61
1,48
30--
3214
421,
49-0
,98
1,47
3,93
25,95
1,39
32--
3414
921,
76-0
,75
1,16
3,66
25,18
1,45
34--
3615
421,
87-1
,36
1,59
3,55
24,83
0,77
38--
4016
431,
68-1
,53
1,42
3,72
25,35
0,71
40--
4216
941,
91-0
,84
**
**
42--
4417
451,
82-0
,90
**
**
44--
4617
951,
82-0
,99
1,26
3,45
24,52
1,06
46--
4818
461,
84-0
,89
1,16
3,91
25,89
1,47
48--
501897
1,90
-0,9
71,51
3,99
26,11
1,45
50--
521948
1,95
-0,8
71,59
4,32
27,01
1,74
Esti
mate
d a
ge
(yr
cal. B
P)
Co
re d
ep
th
(cm
)
Mg
/Ca b
ased
tem
pera
ture
(°C
)
δ1
8O
w-i
vc (
‰,
SM
OW
)

Co
nt.
Ap
pen
dix
3 -
G. ru
ber
(p)
geo
ch
em
ical co
mp
osit
ion
δ1
3C
(‰
,
VP
DB
)
δ1
8O
(‰
,
VP
DB
)
Ba/C
a
(um
ol/m
ol)
Mg
/Ca
(mm
ol/m
ol)
52--
5419
991,
74-1
,03
**
**
54--
5620
502,
07-1
,02
1,01
4,31
26,99
1,59
56--
5821
011,
78-1
,02
1,31
3,94
25,98
1,36
58--
6021
531,
84-1
,30
1,20
4,06
26,31
1,16
60--
6222
041,
91-1
,27
1,18
3,62
25,04
0,90
62--
6422
56*
*1,19
4,10
26,43
*
64--
6623
071,
75-0
,99
1,34
4,39
27,20
1,67
66--
6823
591,
54-1
,23
1,12
3,99
26,13
1,18
68--
7024
111,
49-0
,98
1,21
4,09
26,40
1,50
70--
7224
631,
41-1
,10
1,25
4,29
26,94
1,49
72--
7425
151,
36-1
,71
1,23
4,32
27,02
0,91
74--
7625
671,
27-0
,97
1,09
4,09
26,40
1,51
76--
7826
201,
74-0
,83
1,23
4,31
26,98
1,77
78--
8026
721,
55-0
,95
1,35
4,14
26,55
1,56
80--
8227
251,
45-0
,76
1,09
3,98
26,09
1,64
82--
8427
781,
39-0
,54
1,60
4,26
26,86
2,04
84--
8628
311,
53-1
,11
*4,50
27,45
1,60
86--
8828
841,
63-0
,99
1,25
3,85
25,74
1,33
88--
9029
371,
51-0
,46
1,19
3,94
25,98
1,92
90--
9229
911,
59-0
,97
1,27
4,31
26,98
1,63
92--
9430
441,
97-1
,32
**
**
94--
9630
981,
18-1
,09
1,25
4,00
26,16
1,33
96--
9831
521,
29-0
,66
**
**
98--
100
3206
1,68
-0,8
31,15
3,89
25,85
1,52
100-
-102
3261
1,53
-0,9
81,15
3,67
25,18
1,22
102-
-104
3315
1,48
-0,4
3*
4,31
26,97
2,17
104-
-106
3370
1,86
-1,0
41,21
3,72
25,35
1,20
Co
re d
ep
th
(cm
)
Esti
mate
d a
ge
(yr
cal. B
P)
Mg
/Ca b
ased
tem
pera
ture
(°C
)
δ1
8O
w-i
vc (
‰,
SM
OW
)

Co
nt.
Ap
pen
dix
3 -
G. ru
ber
(p)
geo
ch
em
ical co
mp
osit
ion
δ1
3C
(‰
,
VP
DB
)
δ1
8O
(‰
,
VP
DB
)
Ba/C
a
(um
ol/m
ol)
Mg
/Ca
(mm
ol/m
ol)
106-
-108
3425
1,57
-0,6
11,35
4,05
26,29
1,83
108-
-110
3480
1,54
-0,7
51,67
4,53
27,54
1,98
110-
-112
3536
1,68
-0,7
41,16
3,82
25,65
1,57
112-
-114
3591
1,82
-0,9
31,24
3,91
25,90
1,43
114-
-116
3647
1,78
-1,0
31,13
**
*
116-
-118
3703
1,70
-1,1
31,19
3,94
25,98
1,24
118-
-120
3759
1,67
-0,9
61,73
3,88
25,82
1,38
120-
-122
3815
1,82
-0,7
61,16
4,32
27,02
1,85
122-
-124
3872
**
**
**
124-
-126
3928
2,17
-1,0
01,24
3,57
24,90
1,14
126-
-128
3985
1,55
-0,5
21,58
4,08
26,37
1,95
128-
-130
4042
1,59
-0,6
3*
4,65
27,82
2,16
130-
-132
4099
1,41
-0,6
71,37
4,00
26,16
1,74
132-
-134
4157
**
**
**
134-
-136
4214
1,90
-1,0
5*
**
*
136-
-138
4272
2,03
-0,5
11,27
4,23
26,77
2,04
138-
-140
4330
1,81
-0,8
9*
**
*
140-
-142
4388
1,83
-0,5
81,40
4,22
26,74
1,97
142-
-144
4446
1,76
-0,4
71,18
4,32
27,01
2,13
144-
-146
4505
1,44
-0,4
14,32
27,00
2,19
146-
-148
4563
1,75
-0,8
21,22
3,95
26,01
1,55
148-
-150
4622
1,96
-0,9
41,35
4,04
26,26
1,49
150-
-152
4681
1,92
-1,2
03,62
25,04
0,96
152-
-154
4741
1,79
-1,1
81,22
3,87
25,80
1,15
154-
-156
4800
1,64
-0,9
31,42
4,32
27,01
1,67
156-
-158
4860
1,78
-1,2
41,18
3,78
25,53
1,03
158-
-160
4919
1,68
-0,8
81,35
4,35
27,08
1,74
Co
re d
ep
th
(cm
)
Mg
/Ca b
ased
tem
pera
ture
(°C
)
δ1
8O
w-i
vc (
‰,
SM
OW
)
Esti
mate
d a
ge
(yr
cal. B
P)

Co
nt.
Ap
pen
dix
3 -
G. ru
ber
(p)
geo
ch
em
ical co
mp
osit
ion
δ1
3C
(‰
,
VP
DB
)
δ1
8O
(‰
,
VP
DB
)
Ba/C
a
(um
ol/m
ol)
Mg
/Ca
(mm
ol/m
ol)
160-
-162
4979
1,73
-0,8
61,04
3,53
24,78
1,24
162-
-164
5039
1,59
-0,7
71,25
4,28
26,92
1,81
164-
-166
5099
1,64
-0,7
51,18
4,31
26,98
1,84
166-
-168
5160
1,53
-0,5
9*
**
*
168-
-170
5220
1,64
-0,8
61,36
4,08
26,38
1,60
170-
-172
5281
2,05
-0,9
4*
4,15
26,57
1,56
172-
-174
5342
1,65
-0,7
21,23
4,24
26,80
1,83
174-
-176
5402
1,39
-0,7
01,35
4,05
26,31
1,74
176-
-178
5463
2,18
-1,0
61,50
4,14
26,53
1,43
178-
-180
5524
**
1,42
4,54
27,56
*
180-
-182
5586
1,73
-0,6
71,55
4,01
26,18
1,74
182-
-184
5647
1,50
-0,3
71,59
4,47
27,39
2,31
184-
-186
5708
1,55
-0,5
8*
**
*
186-
-188
5770
1,36
-0,7
31,50
4,30
26,97
1,85
188-
-190
5832
1,57
-0,6
5*
3,70
25,27
1,55
190-
-192
5893
1,71
-0,4
51,50
4,16
26,58
2,05
192-
-194
5955
1,81
-0,7
3*
**
*
194-
-196
6017
1,39
-0,8
21,19
4,07
26,34
1,62
196-
-198
6079
1,53
-0,4
31,32
4,50
27,47
2,27
198-
-200
6141
2,10
-0,9
41,69
4,32
27,01
1,65
Co
re d
ep
th
(cm
)
Esti
mate
d a
ge
(yr
cal. B
P)
Mg
/Ca b
ased
tem
pera
ture
(°C
)
δ1
8O
w-i
vc (
‰,
SM
OW
)

Ap
pen
dix
4 -
Main
sed
imen
tolo
gic
al (g
rain
siz
e)
an
d g
eo
ch
em
ical (s
ed
imen
tary
org
an
ic m
att
er
an
d in
org
an
ic c
on
sti
tuen
ts, m
inera
log
y,
an
d p
lan
kto
nic
G. ru
ber
(p
) is
oto
pic
an
d e
lem
en
tal co
mp
osit
ion
) d
ata
ob
tain
ed
fo
r co
re 7
605. W
here
, *
sta
nd
s f
or
ab
sen
ce o
f d
ata
.
Cla
y
(%)
Silt
(%)
San
d
(%)
Mean
dia
mete
r
(Φ)
CaC
o3
(%)
TO
C
(%)
Nto
t
(%)
δ1
3C
(‰
vs.
VP
DB
)
δ1
5N
(‰
vs.
VP
DB
)
CN
rati
o
091
712
,17
80,1
67,
676,
18*
**
**
*2
957
13,3
782
,50
4,13
6,40
26,4
81,
350,
23-2
1,30
4,92
5,82
499
714
,17
82,3
23,
506,
51*
**
**
*6
1037
13,7
481
,99
4,28
6,49
**
0,24
*5,
34*
810
7714
,71
81,5
83,
706,
5725
,91
1,24
0,21
-21,
304,
585,
8210
1117
13,1
983
,17
3,64
6,46
25,6
21,
180,
23-2
1,35
5,16
5,23
12
1157
15,7
281
,42
2,86
6,67
25,0
41,
250,
21-2
1,38
4,79
5,91
14
1197
13,5
883
,77
2,65
6,58
**
**
**
16
1237
15,2
482
,03
2,73
6,65
27,3
91,
190,
21-2
1,57
5,24
5,57
18
1276
14,4
482
,86
2,71
6,68
25,8
11,
210,
19-2
1,33
4,56
6,20
20
1316
16,5
381
,81
1,66
6,78
25,2
61,
140,
22-2
1,44
5,44
5,12
22
1355
15,7
881
,73
2,48
6,72
21,0
01,
150,
22-2
1,50
5,49
5,24
24
1395
14,8
082
,23
2,98
6,63
25,4
41,
150,
21-2
1,24
5,35
5,36
26
1434
16,7
079
,99
3,32
6,75
26,6
31,
000,
22-2
1,35
5,36
4,56
28
1473
16,0
081
,20
2,80
6,73
23,5
01,
220,
22-2
1,39
5,39
5,68
30
1512
14,4
984
,37
1,14
6,69
25,1
51,
140,
21-2
1,49
5,34
5,45
32
1551
16,0
179
,34
4,65
6,65
24,5
51,
130,
21-2
1,50
5,30
5,39
34
1589
15,3
780
,74
3,89
6,61
24,3
61,
090,
21-2
1,25
5,25
5,26
36
1628
16,1
278
,71
5,17
6,70
24,7
61,
130,
21-2
1,24
5,28
5,30
38
1666
16,7
977
,83
5,39
6,77
23,2
21,
160,
21-2
1,25
5,13
5,55
40
1704
16,7
381
,16
2,12
6,79
23,5
91,
150,
21-2
1,38
5,03
5,37
42
1742
16,8
282
,72
0,46
6,90
23,5
51,
150,
21-2
1,26
5,16
5,33
44
1779
16,3
877
,77
5,85
6,73
24,2
41,
090,
22-2
1,25
5,35
4,97
46
1817
19,1
274
,32
6,56
6,89
25,3
31,
060,
22-2
1,15
5,35
4,92
48
1854
21,3
477
,26
1,39
7,14
24,7
91,
120,
22-2
1,43
5,43
5,17
Co
re d
ep
th
(cm
)
Esti
mate
d a
ge (
yr
cal. B
P)
Gra
in s
ize
Sed
imen
tary
org
an
ic m
att
er

Co
nt.
A
pp
en
dix
4 -
Cla
y
(%)
Silt
(%)
San
d
(%)
Mean
dia
mete
r
(Φ)
CaC
o3
(%)
TO
C
(%)
Nto
t
(%)
δ1
3C
(‰
vs.
VP
DB
)
δ1
5N
(‰
vs.
VP
DB
)
CN
rati
o
50
1890
17,5
278
,21
4,27
6,83
24,3
61,
060,
25-2
1,27
6,02
4,29
52
1927
16,9
979
,41
3,60
6,80
24,6
61,
150,
20-2
1,30
5,24
5,74
54
1963
18,6
877
,71
3,61
6,89
25,0
21,
030,
20-2
1,22
4,97
5,04
56
1999
18,7
576
,61
4,64
6,96
24,5
90,
920,
21-2
1,57
5,28
4,47
58
2035
17,2
978
,79
3,93
6,73
26,1
41,
180,
20-2
1,30
5,25
5,91
60
2070
6,34
89,8
33,
846,
0825
,65
0,94
0,21
-21,
365,
134,
5262
2105
5,97
89,3
44,
696,
0025
,21
1,02
0,23
-21,
675,
494,
4464
2140
6,93
90,1
12,
956,
1929
,09
0,95
0,21
-21,
505,
064,
5366
2175
5,04
86,4
48,
525,
7324
,26
1,06
0,21
-21,
505,
194,
9868
2209
6,27
88,5
65,
176,
0119
,24
1,05
0,21
-21,
404,
934,
8770
2243
8,08
86,9
44,
986,
1624
,78
0,96
0,21
-21,
435,
224,
5472
2277
6,23
90,7
13,
066,
0824
,20
1,09
0,21
-21,
524,
875,
1074
2311
5,96
90,5
43,
516,
0324
,45
1,00
0,21
-21,
405,
214,
7876
2344
5,75
90,7
73,
486,
0124
,10
0,99
0,21
-21,
455,
564,
8178
2377
7,15
88,7
14,
146,
1024
,11
1,06
0,21
-21,
615,
025,
1480
2410
7,30
88,2
44,
456,
1125
,30
1,01
0,21
-21,
645,
504,
7082
2443
6,90
87,0
96,
016,
0223
,57
0,96
0,15
-21,
485,
696,
3384
2475
7,33
89,8
12,
866,
1625
,47
1,03
0,15
-21,
485,
496,
9086
2508
6,49
91,0
12,
506,
1324
,57
0,93
0,15
-21,
545,
156,
1888
2540
7,09
87,7
35,
196,
0325
,62
0,98
0,15
-21,
725,
486,
7190
2571
7,66
88,3
83,
976,
1725
,85
1,04
0,15
-21,
605,
767,
0392
2603
7,62
87,4
64,
936,
1226
,17
1,00
0,15
-21,
715,
366,
8894
2634
9,05
88,2
32,
726,
3626
,49
0,91
0,15
-21,
865,
496,
1796
2665
6,51
90,3
43,
166,
1124
,13
1,09
0,15
-21,
565,
357,
0898
2696
6,61
90,3
73,
026,
1426
,54
1,01
0,15
-21,
635,
676,
78100
2727
7,56
90,8
31,
616,
2726
,20
0,96
0,14
-21,
775,
306,
70102
2758
7,95
88,4
93,
566,
2232
,59
0,91
0,13
-21,
685,
316,
90
Co
re d
ep
th
(cm
)
Esti
mate
d a
ge (
yr
cal. B
P)
Gra
in s
ize
Sed
imen
tary
org
an
ic m
att
er

Co
nt.
A
pp
en
dix
4 -
Cla
y
(%)
Silt
(%)
San
d
(%)
Mean
dia
mete
r
(Φ)
CaC
o3
(%)
TO
C
(%)
Nto
t
(%)
δ1
3C
(‰
vs.
VP
DB
)
δ1
5N
(‰
vs.
VP
DB
)
CN
rati
o
104
2788
10,3
687
,83
1,81
6,52
31,5
30,
780,
14-2
1,72
5,21
5,55
106
2818
9,64
87,7
52,
616,
4233
,39
0,70
0,14
-21,
825,
454,
90108
2848
9,77
87,7
92,
456,
410,
381,
220,
15-2
1,41
5,65
8,20
110
2878
5,56
70,5
123
,92
5,32
6,10
1,13
0,14
-21,
755,
608,
11112
2908
8,99
87,3
53,
666,
3027
,62
0,85
0,14
-21,
615,
475,
92114
2938
9,69
87,5
62,
766,
4067
,90
0,44
0,14
-21,
665,
843,
11116
2968
8,78
87,1
04,
126,
3037
,53
0,78
0,14
-21,
725,
345,
45118
2998
9,49
88,0
72,
436,
4013
,99
1,13
0,15
-21,
775,
597,
77120
3028
8,25
85,9
55,
816,
1726
,56
0,96
0,15
-21,
504,
846,
55122
3058
6,96
79,5
313
,52
5,77
37,2
80,
740,
15-2
1,67
5,49
4,98
124
3089
7,47
85,2
57,
286,
0239
,11
0,72
0,15
-21,
455,
594,
79126
3119
9,96
88,0
42,
006,
4926
,91
0,86
0,14
-21,
545,
526,
09128
3150
7,65
86,9
45,
416,
1225
,94
1,01
0,15
-21,
555,
686,
88130
3181
8,85
87,1
83,
976,
3139
,18
0,72
0,14
-21,
495,
215,
24132
3212
9,01
87,4
03,
596,
3436
,09
0,81
0,15
-21,
815,
535,
43134
3243
8,58
88,0
83,
346,
3120
,25
1,03
0,15
-21,
635,
217,
02136
3275
8,92
87,6
13,
476,
3344
,62
0,59
0,14
-21,
775,
394,
14138
3307
9,11
87,1
93,
706,
3341
,51
0,64
0,14
-21,
915,
334,
62140
3339
9,82
88,6
61,
526,
5625
,56
0,95
0,15
-21,
935,
656,
47142
3372
9,12
85,7
65,
126,
370,
481,
340,
15-2
1,84
5,37
9,11
144
3405
10,7
088
,36
0,94
6,66
27,7
7*
0,15
*5,
27*
146
3439
10,7
486
,98
2,28
6,62
27,5
91,
000,
15-2
2,07
5,40
6,70
148
3473
10,3
787
,12
2,51
6,55
26,4
10,
780,
15-2
1,96
5,60
5,29
150
3508
10,0
488
,99
0,97
6,61
27,7
60,
750,
14-2
1,82
5,45
5,40
152
3543
9,43
88,2
12,
366,
4827
,64
0,83
0,14
-21,
895,
235,
79154
3579
9,54
88,2
72,
196,
4827
,47
0,80
0,14
-21,
965,
195,
79156
3615
9,97
87,3
72,
666,
4926
,71
0,87
0,14
-21,
935,
576,
05
Co
re d
ep
th
(cm
)
Esti
mate
d a
ge (
yr
cal. B
P)
Gra
in s
ize
Sed
imen
tary
org
an
ic m
att
er

Co
nt.
A
pp
en
dix
4 -
Cla
y
(%)
Silt
(%)
San
d
(%)
Mean
dia
mete
r
(Φ)
CaC
o3
(%)
TO
C
(%)
Nto
t
(%)
δ1
3C
(‰
vs.
VP
DB
)
δ1
5N
(‰
vs.
VP
DB
)
CN
rati
o
158
3652
9,26
85,0
25,
726,
3127
,50
0,87
0,14
-21,
545,
476,
12160
3690
10,8
187
,40
1,79
6,61
28,1
80,
850,
14-2
1,68
5,00
6,21
162
3728
8,80
88,3
12,
896,
3626
,57
0,82
0,15
-21,
915,
135,
56164
3767
10,2
388
,09
1,69
6,56
28,3
50,
810,
15-2
2,14
5,37
5,30
166
3806
8,83
84,9
26,
256,
2227
,41
0,71
0,15
-21,
755,
244,
79168
3846
10,7
687
,07
2,17
6,57
15,5
71,
070,
15-2
1,96
5,18
7,08
170
3887
11,0
086
,99
2,02
6,60
27,2
20,
810,
16-2
1,65
5,17
5,15
172
3928
9,89
87,0
13,
116,
4626
,62
0,84
0,16
-21,
745,
535,
33174
3970
8,73
90,6
80,
606,
5027
,21
0,73
0,16
-22,
125,
434,
64176
4013
11,8
086
,77
1,43
6,71
25,8
70,
680,
16-2
1,70
5,52
4,16
178
4056
9,04
89,1
01,
866,
4727
,21
0,89
0,16
-21,
635,
605,
62180
4100
9,51
87,7
32,
766,
4425
,90
0,94
0,16
-21,
945,
966,
01182
4145
8,70
84,4
96,
816,
2226
,49
1,38
0,14
-22,
385,
159,
80184
4191
10,0
087
,42
2,57
6,51
27,3
50,
640,
15-2
1,77
5,51
4,19
186
4237
10,6
287
,66
1,72
6,62
18,3
00,
800,
15-2
1,49
5,08
5,34
188
4284
9,61
88,1
92,
206,
4825
,34
0,76
0,15
-21,
565,
405,
22190
4332
9,91
87,3
52,
746,
48*
1,05
0,14
-21,
595,
257,
39192
4380
9,45
86,8
83,
666,
4025
,82
0,83
0,15
-21,
695,
445,
51194
4430
10,9
886
,03
2,99
6,56
24,0
40,
850,
14-2
1,73
4,77
5,90
196
4480
10,2
787
,83
1,90
6,55
23,4
80,
860,
14-2
1,57
4,84
5,92
198
4531
10,8
084
,47
4,74
6,48
25,3
30,
850,
14-2
1,74
5,23
5,95
200
4583
10,1
787
,03
2,80
6,51
25,2
70,
900,
15-2
1,77
5,47
6,13
202
4635
9,74
88,2
02,
066,
5125
,77
0,80
0,42
-21,
754,
521,
90204
4689
10,2
184
,65
5,14
6,43
24,7
30,
720,
14-2
1,71
4,16
5,30
206
4743
10,0
484
,10
5,86
6,37
24,2
70,
830,
12-2
1,74
4,85
6,83
208
4798
10,0
087
,54
2,46
6,50
26,2
20,
910,
13-2
1,62
4,05
7,06
210
4854
10,5
084
,35
5,15
6,46
25,1
00,
710,
14-2
1,75
4,59
5,14
212
4911
10,2
385
,64
4,13
6,47
24,3
00,
810,
13-2
1,63
4,45
6,31
Co
re d
ep
th
(cm
)
Esti
mate
d a
ge (
yr
cal. B
P)
Gra
in s
ize
Sed
imen
tary
org
an
ic m
att
er

Co
nt.
A
pp
en
dix
4 -
Cla
y
(%)
Silt
(%)
San
d
(%)
Mean
dia
mete
r
(Φ)
CaC
o3
(%)
TO
C
(%)
Nto
t
(%)
δ1
3C
(‰
vs.
VP
DB
)
δ1
5N
(‰
vs.
VP
DB
)
CN
rati
o
214
4969
8,29
88,9
32,
786,
4625
,84
1,01
0,14
-21,
854,
676,
99216
5028
9,41
84,8
35,
766,
3225
,38
0,95
0,14
-22,
004,
256,
98218
5087
8,72
89,1
62,
136,
4525
,80
0,71
0,13
-22,
085,
465,
40220
5148
10,0
788
,01
1,92
6,60
24,3
80,
880,
14-2
1,94
4,87
6,22
222
5209
11,3
287
,01
1,66
6,65
25,1
90,
990,
14-2
1,73
4,26
6,87
224
5272
11,8
385
,94
2,24
6,65
25,3
50,
930,
14-2
1,85
4,99
6,54
226
5335
10,4
587
,39
2,16
6,57
26,7
00,
920,
14-2
1,87
4,43
6,40
228
5400
12,6
683
,72
3,63
6,68
26,5
40,
840,
14-2
1,85
4,83
6,07
230
5465
12,1
582
,90
4,95
6,62
26,4
70,
760,
13-2
1,96
4,81
5,83
232
5532
13,0
282
,30
4,69
6,68
27,8
20,
510,
14-2
1,87
4,87
3,69
234
5599
12,3
281
,11
6,56
6,55
26,7
9*
0,14
*4,
82*
236
5667
9,12
90,3
80,
506,
5831
,85
0,73
0,13
-21,
824,
485,
62238
5737
11,0
883
,78
5,14
6,54
26,1
90,
680,
13-2
2,03
4,73
5,24
240
5807
9,98
85,0
84,
936,
4327
,02
0,49
0,12
-21,
874,
694,
24242
5879
9,58
83,3
77,
056,
3128
,87
0,79
0,12
-21,
945,
466,
32244
5952
9,32
73,7
916
,89
5,92
26,2
31,
590,
12-2
2,19
4,52
12,7
6246
6025
9,98
80,1
99,
836,
2625
,95
0,49
0,12
-21,
844,
684,
19248
6100
9,00
83,2
17,
786,
2230
,53
0,77
0,11
-21,
934,
847,
04250
6176
7,00
86,5
56,
466,
1826
,11
0,42
0,11
-22,
695,
104,
04252
6253
9,77
72,8
117
,42
5,96
25,2
30,
580,
12-2
2,11
4,70
4,98
254
6331
10,4
380
,70
8,87
6,33
25,3
90,
190,
12-2
1,23
4,89
1,63
256
6411
10,1
681
,96
7,88
6,34
25,0
60,
620,
12-2
1,80
4,80
5,02
258
6491
10,2
477
,96
11,8
06,
2124
,99
0,40
0,12
-22,
145,
063,
46260
6572
9,80
79,3
910
,82
6,18
28,4
90,
39*
-21,
15*
*262
6655
10,2
376
,24
13,5
26,
1126
,20
0,37
0,12
-22,
334,
983,
03264
6738
10,4
379
,59
9,98
6,27
26,2
60,
570,
13-2
2,20
4,70
4,56
266
6823
11,6
380
,47
7,90
6,45
26,2
80,
27*
-22,
81*
*268
6908
11,0
880
,36
8,56
6,40
26,5
40,
53*
-21,
96*
*
Co
re d
ep
th
(cm
)
Esti
mate
d a
ge (
yr
cal. B
P)
Gra
in s
ize
Sed
imen
tary
org
an
ic m
att
er

Co
nt.
A
pp
en
dix
4 -
Cla
y
(%)
Silt
(%)
San
d
(%)
Mean
dia
mete
r
(Φ)
CaC
o3
(%)
TO
C
(%)
Nto
t
(%)
δ1
3C
(‰
vs.
VP
DB
)
δ1
5N
(‰
vs.
VP
DB
)
CN
rati
o
270
6995
8,17
74,0
917
,74
5,73
27,8
50,
530,
13-2
1,96
5,09
4,00
272
7083
11,1
877
,48
11,3
46,
2830
,88
0,30
0,13
-22,
725,
192,
29274
7171
10,9
976
,13
12,8
86,
2225
,61
0,26
*-2
2,54
**
276
7261
10,6
281
,78
7,60
6,41
28,8
50,
430,
12-2
1,78
5,31
3,62
278
7352
10,9
481
,50
7,56
6,43
*1,
120,
12-2
1,95
4,53
9,61
280
7443
11,1
374
,07
14,8
16,
17*
0,61
0,11
-21,
994,
895,
33282
7536
12,0
586
,27
1,68
6,70
29,5
10,
490,
11-2
1,57
5,03
4,31
284
7629
11,1
978
,61
10,1
96,
3226
,86
0,39
0,12
-21,
893,
873,
27
Co
re d
ep
th
(cm
)
Esti
mate
d a
ge (
yr
cal. B
P)
Gra
in s
ize
Sed
imen
tary
org
an
ic m
att
er

Co
nt.
A
pp
en
dix
4 -
Al
(mg
/kg
)
Ba
(mg
/kg
)
Ca
(mg
/kg
)
Fe
(mg
/kg
)
Ti
(mg
/kg
)
Fe/C
a
rati
o
Ti/C
a
rati
o
Ba/A
l
rati
o
Ba/C
a
rati
o
091
7*
**
**
**
**
295
784
380,
3019
1,27
4374
6,90
3836
3,80
3723
,62
0,87
70,
085
0,00
20,
004
499
7*
**
**
**
**
610
3778
516,
3019
5,21
4252
7,40
3880
1,40
3611
,07
0,91
20,
085
0,00
20,
005
810
77*
**
**
**
**
10
1117
7385
2,40
193,
2947
666,
7041
282,
5039
04,3
20,
866
0,08
20,
003
0,00
412
1157
7516
7,60
202,
0038
196,
1035
150,
0033
47,4
80,
920
0,08
80,
003
0,00
514
1197
7629
8,90
192,
8641
055,
8039
829,
0037
64,3
50,
970
0,09
20,
003
0,00
516
1237
7330
5,00
194,
6440
658,
3039
088,
5036
60,2
70,
961
0,09
00,
003
0,00
518
1276
7513
9,00
218,
9941
490,
8038
749,
9036
55,1
90,
934
0,08
80,
003
0,00
520
1316
7404
6,80
198,
0543
195,
6039
465,
6036
22,3
60,
914
0,08
40,
003
0,00
522
1355
7531
3,20
4010
4,30
3730
3,80
3492
,27
0,93
00,
087
24
1395
7478
1,80
187,
7639
134,
3033
488,
2031
75,7
60,
856
0,08
10,
003
0,00
526
1434
7301
1,70
200,
7640
724,
6036
511,
9035
00,5
90,
897
0,08
60,
003
0,00
528
1473
7411
7,30
197,
5541
386,
0037
151,
0035
15,2
90,
898
0,08
50,
003
0,00
530
1512
6834
8,90
189,
2743
111,
7036
285,
3034
69,3
80,
842
0,08
00,
003
0,00
432
1551
6764
8,00
195,
3541
860,
9035
386,
0033
97,3
00,
845
0,08
10,
003
0,00
534
1589
7091
4,10
*41
631,
1036
622,
5034
62,2
60,
880
0,08
3*
*36
1628
6518
6,30
196,
7847
525,
4041
390,
5040
02,9
50,
871
0,08
40,
003
0,00
438
1666
7390
1,50
147,
8243
934,
9037
311,
4036
35,2
30,
849
0,08
30,
002
0,00
340
1704
7328
9,90
137,
8440
454,
8036
393,
9034
81,8
00,
900
0,08
60,
002
0,00
342
1742
7649
7,50
*38
905,
6034
420,
4032
30,1
50,
885
0,08
3*
*44
1779
7760
4,20
152,
9542
540,
0036
557,
2035
31,2
60,
859
0,08
30,
002
0,00
446
1817
7304
6,10
150,
6342
874,
3036
258,
8034
15,3
40,
846
0,08
00,
002
0,00
448
1854
7091
9,90
168,
4741
287,
2033
293,
5031
38,2
40,
806
0,07
60,
002
0,00
4
Co
re d
ep
th
(cm
)
Esti
mate
d a
ge
(yr
cal. B
P)
Sed
imen
tary
in
org
an
ic c
on
sti
tuen
ts

Co
nt.
A
pp
en
dix
4 -
Al
(mg
/kg
)
Ba
(mg
/kg
)
Ca
(mg
/kg
)
Fe
(mg
/kg
)
Ti
(mg
/kg
)
Fe/C
a
rati
o
Ti/C
a
rati
o
Ba/A
l
rati
o
Ba/C
a
rati
o
50
1890
7773
1,20
161,
1148
659,
9040
029,
5038
67,9
90,
823
0,07
90,
002
0,00
352
1927
6923
6,80
162,
9747
457,
7034
718,
5033
38,8
20,
732
0,07
00,
002
0,00
354
1963
6744
3,70
164,
2150
793,
3037
071,
8035
81,6
90,
730
0,07
10,
002
0,00
356
1999
8068
8,60
162,
1351
372,
6036
674,
6035
45,3
60,
714
0,06
90,
002
0,00
358
2035
7007
8,90
*49
514,
7035
269,
7034
28,8
60,
712
0,06
9*
*60
2070
7077
7,30
188,
2955
422,
4035
088,
1037
44,2
00,
633
0,06
80,
003
0,00
362
2105
7247
8,60
187,
2559
109,
5035
764,
9038
55,8
10,
605
0,06
50,
003
0,00
364
2140
6537
6,30
185,
2551
532,
3031
881,
9034
08,5
80,
619
0,06
60,
003
0,00
466
2175
**
**
**
**
*68
2209
7792
4,80
185,
8861
181,
0037
823,
7041
16,8
40,
6182
30,
0672
90,
0023
850,
0030
470
2243
7935
8,30
186,
8262
264,
9038
673,
7041
54,6
70,
6211
20,
0667
30,
0023
540,
003
72
2277
7197
3,90
193,
6558
303,
1035
232,
6038
18,8
40,
6043
0,06
550,
0026
910,
0033
274
2311
7382
2,00
192,
0958
495,
7036
674,
6039
03,7
40,
6269
60,
0667
40,
0026
020,
0032
876
2344
7826
8,60
199,
0860
903,
1037
984,
6041
18,3
10,
6236
90,
0676
20,
0025
440,
0032
778
2377
8402
7,40
195,
3767
028,
0041
855,
4045
86,8
00,
6244
50,
0684
30,
0023
250,
0029
180
2410
7707
1,60
191,
9461
912,
2038
294,
6040
96,8
50,
6185
30,
0661
70,
0024
90,
0031
82
2443
7467
8,70
177,
4560
720,
2036
238,
8039
24,7
80,
5968
20,
0646
40,
0023
760,
0029
284
2475
7255
2,10
196,
9657
751,
1035
128,
9037
72,7
70,
6082
80,
0653
30,
0027
150,
0034
186
2508
7480
7,70
191,
0759
937,
0036
746,
6039
28,6
80,
6130
90,
0655
50,
0025
540,
0031
988
2540
7252
5,10
175,
2061
264,
4035
591,
3038
02,4
30,
5809
50,
0620
70,
0024
160,
0028
690
2571
7132
9,50
183,
7557
853,
9034
844,
2036
70,9
80,
6022
80,
0634
50,
0025
760,
0031
892
2603
6168
2,20
174,
3148
821,
4030
074,
0031
33,2
10,
616
0,06
418
0,00
2826
0,00
357
94
2634
**
**
**
**
*96
2665
6419
0,90
194,
7951
805,
7031
435,
6033
02,6
10,
6068
0,06
375
0,00
3035
0,00
376
98
2696
6727
7,40
185,
0055
431,
9032
658,
2034
95,3
20,
5891
60,
0630
60,
0027
50,
0033
4100
2727
7534
8,80
191,
2869
503,
5036
642,
1039
85,8
60,
5272
0,05
735
0,00
2539
0,00
275
102
2758
**
**
**
**
*
Co
re d
ep
th
(cm
)
Esti
mate
d a
ge
(yr
cal. B
P)
Sed
imen
tary
in
org
an
ic c
on
sti
tuen
ts

Co
nt.
A
pp
en
dix
4 -
Al
(mg
/kg
)
Ba
(mg
/kg
)
Ca
(mg
/kg
)
Fe
(mg
/kg
)
Ti
(mg
/kg
)
Fe/C
a
rati
o
Ti/C
a
rati
o
Ba/A
l
rati
o
Ba/C
a
rati
o
104
2788
6951
8,60
169,
8965
565,
1033
601,
6036
76,6
60,
5124
90,
0560
80,
0024
440,
0025
9106
2818
6384
8,50
189,
8460
178,
8031
067,
2033
68,7
90,
5162
50,
0559
80,
0029
730,
0031
5108
2848
7373
5,40
190,
0762
900,
2035
809,
9038
79,1
90,
5693
10,
0616
70,
0025
780,
0030
2110
2878
7925
6,30
186,
6774
222,
8038
835,
2041
40,1
80,
5232
20,
0557
80,
0023
550,
0025
1112
2908
6204
2,00
174,
9472
755,
6030
442,
9032
00,9
20,
4184
30,
044
0,00
282
0,00
24114
2938
7188
1,70
179,
0584
547,
0035
358,
3037
43,8
10,
4182
10,
0442
80,
0024
910,
0021
2116
2968
7372
1,60
183,
8670
523,
5035
893,
3038
67,2
50,
5089
60,
0548
40,
0024
940,
0026
1118
2998
5974
4,50
184,
6160
808,
9030
678,
2033
34,4
20,
5045
0,05
483
0,00
309
0,00
304
120
3028
6002
2,10
176,
0869
316,
7036
910,
4041
31,7
70,
5324
90,
0596
10,
0029
340,
0025
4122
3058
6162
2,80
178,
4966
154,
8033
347,
3036
85,4
60,
5040
80,
0557
10,
0028
970,
0027
124
3089
6770
2,70
176,
7472
883,
6038
786,
2043
04,5
00,
5321
70,
0590
60,
0026
110,
0024
2126
3119
5665
7,60
176,
4463
193,
2034
129,
3038
02,6
10,
5400
80,
0601
70,
0031
140,
0027
9128
3150
5634
7,10
174,
6362
429,
1033
953,
3037
64,8
80,
5438
70,
0603
10,
0030
990,
0028
130
3181
6749
1,40
212,
9266
737,
9034
145,
2037
02,6
20,
5116
30,
0554
80,
0031
550,
0031
9132
3212
6441
3,00
220,
9461
970,
2032
229,
7034
99,0
30,
5200
80,
0564
60,
0034
30,
0035
7134
3243
6660
2,60
217,
3664
266,
2034
226,
9036
95,2
30,
5325
80,
0575
0,00
3264
0,00
338
136
3275
6813
0,80
221,
1669
984,
1034
895,
5038
86,1
60,
4986
20,
0555
30,
0032
460,
0031
6138
3307
5419
5,10
209,
9267
542,
4033
973,
5037
56,5
10,
503
0,05
562
0,00
3873
0,00
311
140
3339
6814
7,40
216,
4465
914,
8034
294,
4038
93,0
10,
5202
80,
0590
60,
0031
760,
0032
8142
3372
6545
3,20
209,
2562
884,
3033
544,
8037
07,9
60,
5334
40,
0589
60,
0031
970,
0033
3144
3405
5472
4,30
214,
2052
649,
9027
849,
7030
69,1
50,
5289
60,
0582
90,
0039
140,
0040
7146
3439
6077
8,80
212,
3562
286,
1033
040,
5036
79,0
60,
5304
60,
0590
70,
0034
940,
0034
1148
3473
6442
0,40
175,
5257
672,
5033
661,
0036
16,3
00,
5836
60,
0627
0,00
2725
0,00
304
150
3508
6369
4,60
179,
2056
941,
9032
915,
4035
94,8
00,
5780
50,
0631
30,
0028
130,
0031
5152
3543
6334
1,50
180,
1157
162,
8032
659,
7036
46,3
00,
5713
50,
0637
90,
0028
440,
0031
5154
3579
4856
7,30
184,
2545
071,
8025
152,
9027
79,3
80,
5580
60,
0616
70,
0037
940,
0040
9156
3615
6464
9,90
178,
6959
934,
5033
142,
5036
57,3
20,
5529
80,
0610
20,
0027
640,
0029
8
Co
re d
ep
th
(cm
)
Esti
mate
d a
ge
(yr
cal. B
P)
Sed
imen
tary
in
org
an
ic c
on
sti
tuen
ts

Co
nt.
A
pp
en
dix
4 -
Al
(mg
/kg
)
Ba
(mg
/kg
)
Ca
(mg
/kg
)
Fe
(mg
/kg
)
Ti
(mg
/kg
)
Fe/C
a
rati
o
Ti/C
a
rati
o
Ba/A
l
rati
o
Ba/C
a
rati
o
158
3652
6084
2,50
174,
3455
243,
6031
412,
7034
37,7
60,
5686
20,
0622
30,
0028
650,
0031
6160
3690
6362
6,70
183,
1160
100,
9033
277,
5037
33,0
70,
5536
90,
0621
10,
0028
780,
0030
5162
3728
6170
7,50
181,
6158
098,
5031
925,
5035
31,0
00,
5495
10,
0607
80,
0029
430,
0031
3164
3767
6011
1,40
183,
4657
090,
0030
994,
4034
46,8
50,
5429
0,06
038
0,00
3052
0,00
321
166
3806
5764
4,60
183,
5755
845,
1029
992,
1033
55,9
80,
5370
60,
0600
90,
0031
850,
0032
9168
3846
4413
0,20
173,
5750
278,
6028
861,
0032
85,6
80,
5740
20,
0653
50,
0039
330,
0034
5170
3887
5935
1,70
183,
0756
736,
3032
175,
1035
69,8
30,
5671
0,06
292
0,00
3085
0,00
323
172
3928
**
**
**
**
*174
3970
5926
2,50
181,
3754
531,
8031
338,
4035
01,2
10,
5746
80,
0642
0,00
306
0,00
333
176
4013
6367
3,20
190,
5557
540,
4032
852,
4037
21,4
50,
5709
40,
0646
80,
0029
930,
0033
1178
4056
4244
6,70
181,
5939
214,
7022
145,
8024
55,9
40,
5647
30,
0626
30,
0042
780,
0046
3180
4100
6612
2,40
181,
2762
758,
0034
028,
9038
51,4
10,
5422
20,
0613
70,
0027
410,
0028
9182
4145
6018
6,50
182,
8258
284,
1030
616,
2034
66,9
30,
5252
90,
0594
80,
0030
380,
0031
4184
4191
6520
1,30
180,
9263
709,
8033
373,
2037
66,6
70,
5238
30,
0591
20,
0027
750,
0028
4186
4237
5245
1,60
185,
2051
012,
4026
751,
4030
12,3
60,
5244
10,
0590
50,
0035
310,
0036
3188
4284
4089
9,00
180,
8743
189,
9022
149,
3024
41,9
60,
5128
40,
0565
40,
0044
220,
0041
9190
4332
7253
0,10
183,
7868
527,
8034
980,
6040
99,4
40,
5104
60,
0598
20,
0025
340,
0026
8192
4380
**
**
**
**
*194
4430
4597
0,00
164,
4152
861,
2029
573,
0034
52,5
70,
5594
50,
0653
10,
0035
770,
0031
1196
4480
5731
2,80
187,
1457
107,
5029
469,
5033
20,4
30,
5160
40,
0581
40,
0032
650,
0032
8198
4531
4954
8,00
169,
1855
056,
7031
887,
4036
73,2
50,
5791
70,
0667
20,
0034
140,
0030
7200
4583
6101
6,90
184,
4860
599,
6031
053,
4035
09,3
10,
5124
40,
0579
10,
0030
230,
0030
4202
4635
3536
3,30
179,
1947
838,
7026
425,
1030
10,2
70,
5523
80,
0629
30,
0050
670,
0037
5204
4689
4951
9,70
179,
8957
067,
4029
877,
3033
80,9
10,
5235
40,
0592
40,
0036
330,
0031
5206
4743
5902
6,10
173,
3262
324,
9033
133,
2036
34,2
90,
5316
20,
0583
10,
0029
360,
0027
8208
4798
**
**
**
**
*210
4854
6073
6,90
175,
3662
229,
6031
237,
1034
73,4
50,
5019
70,
0558
20,
0028
870,
0028
2212
4911
6260
1,60
170,
8361
632,
0032
642,
7037
44,8
80,
5296
40,
0607
60,
0027
290,
0027
7
Co
re d
ep
th
(cm
)
Esti
mate
d a
ge
(yr
cal. B
P)
Sed
imen
tary
in
org
an
ic c
on
sti
tuen
ts

Co
nt.
A
pp
en
dix
4 -
Al
(mg
/kg
)
Ba
(mg
/kg
)
Ca
(mg
/kg
)
Fe
(mg
/kg
)
Ti
(mg
/kg
)
Fe/C
a
rati
o
Ti/C
a
rati
o
Ba/A
l
rati
o
Ba/C
a
rati
o
214
4969
4713
3,90
153,
7043
733,
5030
154,
3037
72,2
00,
6895
0,08
625
0,00
3261
0,00
351
216
5028
4511
0,50
166,
2646
988,
0025
026,
2028
71,7
40,
5326
10,
0611
20,
0036
860,
0035
4218
5087
3474
3,60
171,
1634
707,
8019
035,
1021
21,0
70,
5484
40,
0611
10,
0049
260,
0049
3220
5148
6023
8,60
161,
9357
280,
6034
135,
7040
26,0
30,
5959
40,
0702
90,
0026
880,
0028
3222
5209
5593
0,00
169,
2552
000,
4029
686,
1032
75,4
60,
5708
80,
0629
90,
0030
260,
0032
5224
5272
7470
4,60
193,
5661
851,
6035
444,
7037
20,4
70,
5730
60,
0601
50,
0025
910,
0031
3226
5335
6981
3,80
188,
7260
239,
3033
417,
7034
97,4
00,
5547
50,
0580
60,
0027
030,
0031
3228
5400
**
**
**
**
*230
5465
7721
2,50
224,
7870
763,
0037
174,
1040
34,3
40,
5253
30,
0570
10,
0029
110,
0031
8232
5532
6410
2,20
195,
1559
028,
0030
183,
8032
23,9
00,
5113
50,
0546
20,
0030
440,
0033
1234
5599
7243
8,00
184,
1563
473,
5034
255,
5036
67,9
50,
5396
80,
0577
90,
0025
420,
0029
236
5667
**
**
**
**
*238
5737
6056
8,60
192,
0755
526,
5028
237,
7029
75,4
20,
5085
40,
0535
90,
0031
710,
0034
6240
5807
6261
2,50
194,
2758
379,
4029
094,
5031
72,1
60,
4983
70,
0543
40,
0031
030,
0033
3242
5879
5377
5,00
192,
0761
141,
8025
978,
4030
40,8
00,
4248
90,
0497
30,
0035
720,
0031
4244
5952
5141
8,60
196,
8565
270,
6028
344,
1030
67,2
50,
4342
60,
0469
90,
0038
280,
0030
2246
6025
6205
0,10
195,
0267
029,
4029
206,
5032
32,4
40,
4357
30,
0482
20,
0031
430,
0029
1248
6100
5817
9,70
187,
9564
011,
9026
987,
0030
26,6
30,
4215
90,
0472
80,
0032
310,
0029
4250
6176
5635
6,80
190,
0765
362,
1026
222,
8029
39,0
60,
4011
90,
0449
70,
0033
730,
0029
1252
6253
5144
2,60
189,
1588
450,
4024
318,
1027
94,6
90,
2749
30,
0316
0,00
3677
0,00
214
254
6331
6109
2,20
204,
9163
081,
2028
254,
8031
78,5
20,
4479
10,
0503
90,
0033
540,
0032
5256
6411
5903
0,10
200,
1461
702,
8027
336,
9030
74,7
70,
4430
40,
0498
30,
0033
90,
0032
4258
6491
**
**
**
**
*260
6572
5652
7,70
190,
0057
938,
9026
101,
5029
01,9
10,
4505
0,05
009
0,00
3361
0,00
328
262
6655
5137
5,40
190,
6958
302,
2023
675,
0026
67,7
30,
4060
70,
0457
60,
0037
120,
0032
7264
6738
5484
2,00
196,
9558
332,
0025
447,
2027
99,2
60,
4362
50,
0479
90,
0035
910,
0033
8266
6823
5740
0,80
191,
4260
074,
6027
166,
8029
02,8
90,
4522
20,
0483
20,
0033
350,
0031
9268
6908
5479
1,80
179,
8259
674,
1025
849,
3027
73,7
00,
4331
70,
0464
80,
0032
820,
0030
1
Co
re d
ep
th
(cm
)
Esti
mate
d a
ge
(yr
cal. B
P)
Sed
imen
tary
in
org
an
ic c
on
sti
tuen
ts

Co
nt.
A
pp
en
dix
4 -
Al
(mg
/kg
)
Ba
(mg
/kg
)
Ca
(mg
/kg
)
Fe
(mg
/kg
)
Ti
(mg
/kg
)
Fe/C
a
rati
o
Ti/C
a
rati
o
Ba/A
l
rati
o
Ba/C
a
rati
o
270
6995
5644
5,10
181,
9476
602,
3028
635,
0032
24,8
40,
3738
10,
0421
0,00
3223
0,00
238
272
7083
5723
2,80
178,
1864
236,
7026
582,
7029
16,2
30,
4138
20,
0454
0,00
3113
0,00
277
274
7171
5671
6,00
182,
4564
922,
2026
809,
0029
73,7
50,
4129
40,
0458
0,00
3217
0,00
281
276
7261
4171
8,10
178,
0846
928,
8019
854,
5021
57,2
80,
4230
80,
0459
70,
0042
690,
0037
9278
7352
5803
8,30
184,
3764
241,
5026
318,
9029
12,1
10,
4096
90,
0453
30,
0031
770,
0028
7280
7443
5381
4,90
170,
9785
833,
1024
966,
7027
47,5
40,
2908
70,
0320
10,
0031
770,
0019
9282
7536
5053
5,50
160,
4974
545,
3023
969,
6026
31,6
70,
3215
40,
0353
0,00
3176
0,00
215
284
7629
5418
5,60
182,
7261
071,
5024
895,
3027
50,4
90,
4076
40,
0450
40,
0033
720,
0029
9
Co
re d
ep
th
(cm
)
Esti
mate
d a
ge
(yr
cal. B
P)
Sed
imen
tary
in
org
an
ic c
on
sti
tuen
ts

Co
nt.
A
pp
en
dix
4 -
An
alc
ime
(%)
An
ata
se
(%)
An
idri
te
(%)
Bassan
ite
(%)
Ch
lori
te
(%)
Calc
ite
(%)
Do
lom
ite
(%)
K F
eld
sp
ars
(%)
Gesso
(%)
Halite
(%)
Op
al
C/C
T (
%)
091
70,
000,
000,
000,
003,
6311
,16
0,00
0,00
0,00
5,03
0,00
295
71,
810,
001,
350,
001,
7417
,86
0,00
0,00
0,00
5,37
5,23
499
7*
**
**
**
**
**
610
370,
000,
001,
620,
000,
0010
,77
0,00
0,00
0,00
4,04
2,33
810
770,
000,
002,
970,
001,
4114
,00
0,00
0,00
0,00
2,33
5,52
10
1117
**
**
**
**
**
*12
1157
**
**
**
**
**
*14
1197
**
**
**
**
**
*16
1237
**
**
**
**
**
*18
1276
**
**
**
**
**
*20
1316
**
**
**
**
**
*22
1355
**
**
**
**
**
*24
1395
**
**
**
**
**
*26
1434
**
**
**
**
**
*28
1473
0,80
0,00
1,28
0,00
0,00
12,8
00,
000,
000,
002,
038,
9630
1512
0,00
0,00
0,00
0,00
2,56
12,7
90,
003,
410,
002,
563,
8432
1551
1,94
0,00
0,00
0,00
1,29
12,8
10,
002,
910,
002,
044,
2734
1589
**
**
**
**
**
*36
1628
**
**
**
**
**
*38
1666
**
**
**
**
**
*40
1704
**
**
**
**
**
*42
1742
**
**
**
**
**
*44
1779
**
**
**
**
**
*46
1817
**
**
**
**
**
*48
1854
**
**
**
**
**
*
Min
era
log
yC
ore
dep
th
(cm
)
Esti
mate
d a
ge (
yr
cal. B
P)

Co
nt.
A
pp
en
dix
4 -
An
alc
ime
(%)
An
ata
se
(%)
An
idri
te
(%)
Bassan
ite
(%)
Ch
lori
te
(%)
Calc
ite
(%)
Do
lom
ite
(%)
K F
eld
sp
ars
(%)
Gesso
(%)
Halite
(%)
Op
al
C/C
T (
%)
50
1890
**
**
**
**
**
*52
1927
**
**
**
**
**
*54
1963
**
**
**
**
**
*56
1999
0,00
0,00
0,00
0,00
0,00
15,1
90,
000,
000,
002,
415,
0658
2035
**
**
**
**
**
*60
2070
0,00
0,00
0,00
0,00
0,29
17,0
90,
000,
000,
002,
416,
5762
2105
**
**
**
**
**
*64
2140
**
**
**
**
**
*66
2175
**
**
**
**
**
*68
2209
**
**
**
**
**
*70
2243
**
**
**
**
**
*72
2277
**
**
**
**
**
*74
2311
**
**
**
**
**
*76
2344
**
**
**
**
**
*78
2377
**
**
**
**
**
*80
2410
**
**
**
**
**
*82
2443
**
**
**
**
**
*84
2475
**
**
**
**
**
*86
2508
2,15
0,00
1,27
0,00
0,76
14,0
31,
534,
200,
002,
964,
5888
2540
0,00
0,00
1,46
0,00
0,88
16,1
40,
000,
000,
004,
173,
5190
2571
0,00
0,00
1,67
0,00
1,00
18,3
70,
000,
000,
003,
374,
0092
2603
**
**
**
**
**
*94
2634
**
**
**
**
**
*96
2665
**
**
**
**
**
*98
2696
**
**
**
**
**
*100
2727
**
**
**
**
**
*102
2758
**
**
**
**
**
*
Esti
mate
d a
ge (
yr
cal. B
P)
Min
era
log
yC
ore
dep
th
(cm
)

Co
nt.
A
pp
en
dix
4 -
An
alc
ime
(%)
An
ata
se
(%)
An
idri
te
(%)
Bassan
ite
(%)
Ch
lori
te
(%)
Calc
ite
(%)
Do
lom
ite
(%)
K F
eld
sp
ars
(%)
Gesso
(%)
Halite
(%)
Op
al
C/C
T (
%)
104
2788
**
**
**
**
**
*106
2818
**
**
**
**
**
*108
2848
**
**
**
**
**
*110
2878
**
**
**
**
**
*112
2908
**
**
**
**
**
*114
2938
**
**
**
**
**
*116
2968
**
**
**
**
**
*118
2998
0,00
0,00
0,00
0,00
0,37
11,8
00,
000,
000,
003,
297,
14120
3028
1,64
0,00
0,00
0,00
1,97
24,6
70,
000,
000,
005,
767,
89122
3058
3,32
0,00
1,25
0,00
1,25
20,6
40,
003,
750,
002,
035,
00124
3089
**
**
**
**
**
*126
3119
**
**
**
**
**
*128
3150
**
**
**
**
**
*130
3181
**
**
**
**
**
*132
3212
**
**
**
**
**
*134
3243
**
**
**
**
**
*136
3275
**
**
**
**
**
*138
3307
**
**
**
**
**
*140
3339
**
**
**
**
**
*142
3372
**
**
**
**
**
*144
3405
**
**
**
**
**
*146
3439
**
**
**
**
**
*148
3473
**
**
**
**
**
*150
3508
2,64
0,00
0,00
0,00
0,63
15,8
30,
000,
000,
003,
690,
00152
3543
2,23
0,00
0,74
0,00
0,89
15,3
60,
004,
670,
002,
454,
45154
3579
1,69
0,00
0,00
0,00
0,72
18,2
20,
000,
000,
002,
566,
48156
3615
**
**
**
**
**
*
Co
re d
ep
th
(cm
)
Esti
mate
d a
ge (
yr
cal. B
P)
Min
era
log
y

Co
nt.
A
pp
en
dix
4 -
An
alc
ime
(%)
An
ata
se
(%)
An
idri
te
(%)
Bassan
ite
(%)
Ch
lori
te
(%)
Calc
ite
(%)
Do
lom
ite
(%)
K F
eld
sp
ars
(%)
Gesso
(%)
Halite
(%)
Op
al
C/C
T (
%)
158
3652
**
**
**
**
**
*160
3690
**
**
**
**
**
*162
3728
**
**
**
**
**
*164
3767
**
**
**
**
**
*166
3806
**
**
**
**
**
*168
3846
**
**
**
**
**
*170
3887
**
**
**
**
**
*172
3928
**
**
**
**
**
*174
3970
1,17
0,00
1,79
0,00
0,00
20,1
20,
004,
830,
002,
418,
58176
4013
1,27
0,00
1,49
0,00
0,27
14,0
50,
004,
480,
000,
974,
48178
4056
1,21
0,00
1,47
0,00
0,73
19,8
40,
000,
000,
002,
206,
61180
4100
**
**
**
**
**
*182
4145
**
**
**
**
**
*184
4191
**
**
**
**
**
*186
4237
**
**
**
**
**
*188
4284
**
**
**
**
**
*190
4332
**
**
**
**
**
*192
4380
**
**
**
**
**
*194
4430
**
**
**
**
**
*196
4480
0,90
0,00
0,00
0,00
0,00
24,7
80,
000,
000,
002,
875,
75198
4531
0,00
0,00
1,52
0,00
1,01
22,7
60,
000,
000,
083,
794,
55200
4583
0,00
0,00
0,00
0,00
0,95
17,3
70,
000,
000,
000,
775,
20202
4635
**
**
**
**
**
*204
4689
**
**
**
**
**
*206
4743
**
**
**
**
**
*208
4798
**
**
**
**
**
*210
4854
**
**
**
**
**
*212
4911
**
**
**
**
**
*
Co
re d
ep
th
(cm
)
Esti
mate
d a
ge (
yr
cal. B
P)
Min
era
log
y

Co
nt.
A
pp
en
dix
4 -
An
alc
ime
(%)
An
ata
se
(%)
An
idri
te
(%)
Bassan
ite
(%)
Ch
lori
te
(%)
Calc
ite
(%)
Do
lom
ite
(%)
K F
eld
sp
ars
(%)
Gesso
(%)
Halite
(%)
Op
al
C/C
T (
%)
214
4969
1,72
0,00
0,00
0,00
0,00
20,2
30,
000,
000,
003,
584,
40216
5028
**
**
**
**
**
*218
5087
1,85
0,00
0,00
0,00
0,22
21,2
30,
000,
000,
002,
961,
98220
5148
**
**
**
**
**
*222
5209
**
**
**
**
**
*224
5272
**
**
**
**
**
*226
5335
**
**
**
**
**
*228
5400
**
**
**
**
**
*230
5465
**
**
**
**
**
*232
5532
2,91
0,00
0,00
0,00
0,34
21,7
30,
000,
000,
002,
076,
21234
5599
2,12
0,00
0,00
0,00
1,13
22,9
10,
000,
000,
002,
557,
36236
5667
0,00
0,00
0,00
0,00
0,00
18,4
60,
002,
240,
002,
354,
03238
5737
**
**
**
**
**
*240
5807
**
**
**
**
**
*242
5879
**
**
**
**
**
*244
5952
**
**
**
**
**
*246
6025
1,11
0,00
0,59
0,00
0,00
20,5
10,
000,
000,
007,
344,
56248
6100
0,00
0,00
0,85
0,00
0,34
18,7
10,
000,
000,
003,
693,
82250
6176
1,70
0,00
0,78
0,00
0,00
20,4
60,
000,
000,
001,
953,
51252
6253
**
**
**
**
**
*254
6331
**
**
**
**
**
*256
6411
**
**
**
**
**
*258
6491
**
**
**
**
**
*260
6572
0,00
0,00
0,00
0,00
1,06
20,2
10,
004,
490,
002,
114,
23262
6655
3,02
1,34
0,00
0,00
0,00
19,7
30,
000,
000,
001,
485,
37264
6738
0,00
0,00
1,34
0,00
1,19
20,9
50,
003,
790,
001,
895,
35266
6823
**
**
**
**
**
*268
6908
**
**
**
**
**
*
Co
re d
ep
th
(cm
)
Esti
mate
d a
ge (
yr
cal. B
P)
Min
era
log
y

Co
nt.
A
pp
en
dix
4 -
An
alc
ime
(%)
An
ata
se
(%)
An
idri
te
(%)
Bassan
ite
(%)
Ch
lori
te
(%)
Calc
ite
(%)
Do
lom
ite
(%)
K F
eld
sp
ars
(%)
Gesso
(%)
Halite
(%)
Op
al
C/C
T (
%)
270
6995
**
**
**
**
**
*272
7083
1,68
0,00
1,34
0,00
0,45
27,6
50,
000,
000,
003,
028,
04274
7171
0,98
0,00
1,26
1,67
0,42
23,0
70,
004,
710,
002,
512,
51276
7261
0,00
0,00
0,00
0,00
0,68
30,2
40,
004,
610,
002,
825,
64278
7352
**
**
**
**
**
*280
7443
**
**
**
**
**
*282
7536
**
**
**
**
**
*284
7629
**
**
**
**
**
*
Min
era
log
yC
ore
dep
th
(cm
)
Esti
mate
d a
ge (
yr
cal. B
P)

Co
nt.
A
pp
en
dix
4 -
Ph
ylo
ssilic
ate
s
(%)
Mag
n/M
ag
he
(%)
Mic
a-i
lite
(%)
Pla
gio
cla
se
(%)
Pir
ite
(%)
Qu
art
z
(%)
Ro
do
cro
sit
e
(%)
Sid
eri
te
(%)
Zeó
lito
s
(%)
091
753
,97
0,00
0,00
6,80
0,36
19,0
50,
000,
000,
002
957
31,9
40,
000,
008,
270,
8725
,55
0,00
0,00
0,00
499
7*
**
**
**
**
610
3764
,60
0,00
0,00
4,31
0,63
11,7
10,
000,
000,
008
1077
51,9
70,
000,
006,
681,
2713
,84
0,00
0,00
0,00
10
1117
**
**
**
**
*12
1157
**
**
**
**
*14
1197
**
**
**
**
*16
1237
**
**
**
**
*18
1276
**
**
**
**
*20
1316
**
**
**
**
*22
1355
**
**
**
**
*24
1395
**
**
**
**
*26
1434
**
**
**
**
*28
1473
48,5
30,
000,
004,
911,
4919
,20
0,00
0,00
0,00
30
1512
48,5
10,
000,
006,
721,
0718
,55
0,00
0,00
0,00
32
1551
50,9
41,
490,
004,
070,
9717
,27
0,00
0,00
0,00
34
1589
**
**
**
**
*36
1628
**
**
**
**
*38
1666
**
**
**
**
*40
1704
**
**
**
**
*42
1742
**
**
**
**
*44
1779
**
**
**
**
*46
1817
**
**
**
**
*48
1854
**
**
**
**
*
Co
re d
ep
th
(cm
)
Esti
mate
d a
ge (
yr
cal. B
P)
Min
era
log
y

Co
nt.
A
pp
en
dix
4 -
Ph
ylo
ssilic
ate
s
(%)
Mag
n/M
ag
he
(%)
Mic
a-i
lite
(%)
Pla
gio
cla
se
(%)
Pir
ite
(%)
Qu
art
z
(%)
Ro
do
cro
sit
e
(%)
Sid
eri
te
(%)
Zeó
lito
s
(%)
50
1890
**
**
**
**
*52
1927
**
**
**
**
*54
1963
**
**
**
**
*56
1999
49,3
70,
000,
009,
621,
2717
,09
0,00
0,00
0,00
58
2035
**
**
**
**
*60
2070
53,6
90,
000,
447,
890,
669,
641,
310,
000,
0062
2105
**
**
**
**
*64
2140
**
**
**
**
*66
2175
**
**
**
**
*68
2209
**
**
**
**
*70
2243
**
**
**
**
*72
2277
**
**
**
**
*74
2311
**
**
**
**
*76
2344
**
**
**
**
*78
2377
**
**
**
**
*80
2410
**
**
**
**
*82
2443
**
**
**
**
*84
2475
**
**
**
**
*86
2508
46,7
60,
000,
004,
390,
9516
,41
0,00
0,00
0,00
88
2540
49,4
10,
000,
008,
561,
5414
,33
0,00
0,00
0,00
90
2571
43,7
33,
750,
007,
000,
6216
,49
0,00
0,00
0,00
92
2603
**
**
**
**
*94
2634
**
**
**
**
*96
2665
**
**
**
**
*98
2696
**
**
**
**
*100
2727
**
**
**
**
*102
2758
**
**
**
**
*
Co
re d
ep
th
(cm
)
Esti
mate
d a
ge (
yr
cal. B
P)
Min
era
log
y

Co
nt.
A
pp
en
dix
4 -
Ph
ylo
ssilic
ate
s
(%)
Mag
n/M
ag
he
(%)
Mic
a-i
lite
(%)
Pla
gio
cla
se
(%)
Pir
ite
(%)
Qu
art
z
(%)
Ro
do
cro
sit
e
(%)
Sid
eri
te
(%)
Zeó
lito
s
(%)
104
2788
**
**
**
**
*106
2818
**
**
**
**
*108
2848
**
**
**
**
*110
2878
**
**
**
**
*112
2908
**
**
**
**
*114
2938
**
**
**
**
*116
2968
**
**
**
**
*118
2998
52,8
40,
950,
007,
412,
2012
,35
1,65
0,00
0,00
120
3028
32,8
90,
000,
008,
551,
9714
,64
0,00
0,00
0,00
122
3058
28,1
42,
651,
256,
572,
8121
,34
0,00
0,00
0,00
124
3089
**
**
**
**
*126
3119
**
**
**
**
*128
3150
**
**
**
**
*130
3181
**
**
**
**
*132
3212
**
**
**
**
*134
3243
**
**
**
**
*136
3275
**
**
**
**
*138
3307
**
**
**
**
*140
3339
**
**
**
**
*142
3372
**
**
**
**
*144
3405
**
**
**
**
*146
3439
**
**
**
**
*148
3473
**
**
**
**
*150
3508
52,7
70,
000,
007,
041,
4116
,01
0,00
0,00
0,00
152
3543
43,4
00,
000,
009,
681,
1115
,02
0,00
0,00
0,00
154
3579
47,2
40,
000,
008,
911,
8912
,28
0,00
0,00
0,00
156
3615
**
**
**
**
*
Co
re d
ep
th
(cm
)
Esti
mate
d a
ge (
yr
cal. B
P)
Min
era
log
y

Co
nt.
A
pp
en
dix
4 -
Ph
ylo
ssilic
ate
s
(%)
Mag
n/M
ag
he
(%)
Mic
a-i
lite
(%)
Pla
gio
cla
se
(%)
Pir
ite
(%)
Qu
art
z
(%)
Ro
do
cro
sit
e
(%)
Sid
eri
te
(%)
Zeó
lito
s
(%)
158
3652
**
**
**
**
*160
3690
**
**
**
**
*162
3728
**
**
**
**
*164
3767
**
**
**
**
*166
3806
**
**
**
**
*168
3846
**
**
**
**
*170
3887
**
**
**
**
*172
3928
**
**
**
**
*174
3970
33,5
30,
000,
008,
051,
6117
,91
0,00
0,00
0,00
176
4013
44,7
90,
000,
007,
740,
6118
,53
1,32
0,00
0,00
178
4056
41,3
40,
000,
005,
792,
2018
,60
0,00
0,00
0,00
180
4100
**
**
**
**
*182
4145
**
**
**
**
*184
4191
**
**
**
**
*186
4237
**
**
**
**
*188
4284
**
**
**
**
*190
4332
**
**
**
**
*192
4380
**
**
**
**
*194
4430
**
**
**
**
*196
4480
26,9
30,
000,
0010
,77
3,23
24,7
80,
000,
000,
00198
4531
39,8
20,
000,
007,
591,
5217
,45
0,00
0,00
0,00
200
4583
45,4
80,
000,
007,
321,
6521
,26
0,00
0,00
0,00
202
4635
**
**
**
**
*204
4689
**
**
**
**
*206
4743
**
**
**
**
*208
4798
**
**
**
**
*210
4854
**
**
**
**
*212
4911
**
**
**
**
*
Co
re d
ep
th
(cm
)
Esti
mate
d a
ge (
yr
cal. B
P)
Min
era
log
y

Co
nt.
A
pp
en
dix
4 -
Ph
ylo
ssilic
ate
s
(%)
Mag
n/M
ag
he
(%)
Mic
a-i
lite
(%)
Pla
gio
cla
se
(%)
Pir
ite
(%)
Qu
art
z
(%)
Ro
do
cro
sit
e
(%)
Sid
eri
te
(%)
Zeó
lito
s
(%)
214
4969
41,2
81,
060,
007,
431,
9318
,37
0,00
0,00
0,00
216
5028
**
**
**
**
*218
5087
39,5
00,
000,
006,
912,
6322
,71
0,00
0,00
0,00
220
5148
**
**
**
**
*222
5209
**
**
**
**
*224
5272
**
**
**
**
*226
5335
**
**
**
**
*228
5400
**
**
**
**
*230
5465
**
**
**
**
*232
5532
40,7
40,
000,
006,
211,
5518
,24
0,00
0,00
0,00
234
5599
31,8
20,
000,
0011
,03
1,98
19,0
90,
000,
000,
00236
5667
49,2
20,
000,
0011
,41
2,24
10,0
70,
000,
000,
00238
5737
**
**
**
**
*240
5807
**
**
**
**
*242
5879
**
**
**
**
*244
5952
**
**
**
**
*246
6025
41,7
80,
000,
005,
061,
7717
,28
0,00
0,00
0,00
248
6100
41,9
90,
000,
0011
,45
1,78
17,3
70,
000,
000,
00250
6176
38,9
70,
000,
0016
,76
1,75
13,1
50,
000,
000,
97252
6253
**
**
**
**
*254
6331
**
**
**
**
*256
6411
**
**
**
**
*258
6491
**
**
**
**
*260
6572
35,6
70,
000,
005,
812,
3824
,04
0,00
0,00
0,00
262
6655
36,2
40,
000,
0011
,81
2,68
18,3
20,
000,
000,
00264
6738
42,9
10,
000,
005,
571,
7815
,21
0,00
0,00
0,00
266
6823
**
**
**
**
*268
6908
**
**
**
**
*
Co
re d
ep
th
(cm
)
Esti
mate
d a
ge (
yr
cal. B
P)
Min
era
log
y
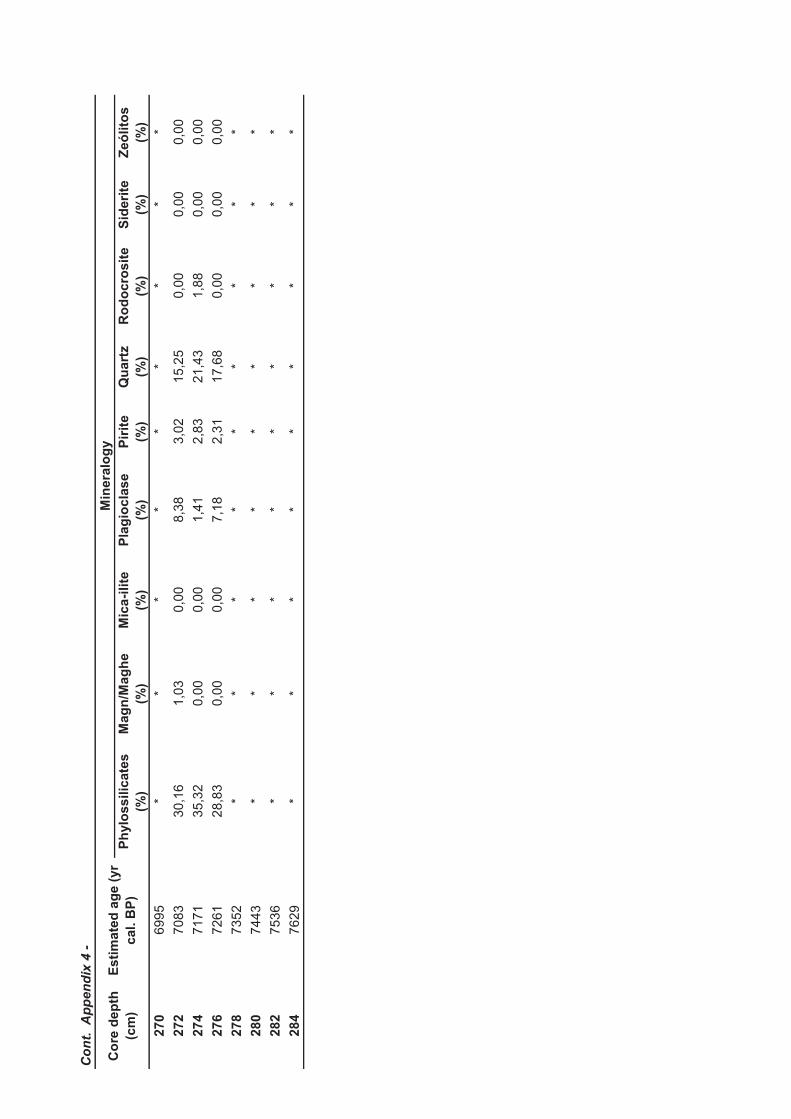
Co
nt.
A
pp
en
dix
4 -
Ph
ylo
ssilic
ate
s
(%)
Mag
n/M
ag
he
(%)
Mic
a-i
lite
(%)
Pla
gio
cla
se
(%)
Pir
ite
(%)
Qu
art
z
(%)
Ro
do
cro
sit
e
(%)
Sid
eri
te
(%)
Zeó
lito
s
(%)
270
6995
**
**
**
**
*272
7083
30,1
61,
030,
008,
383,
0215
,25
0,00
0,00
0,00
274
7171
35,3
20,
000,
001,
412,
8321
,43
1,88
0,00
0,00
276
7261
28,8
30,
000,
007,
182,
3117
,68
0,00
0,00
0,00
278
7352
**
**
**
**
*280
7443
**
**
**
**
*282
7536
**
**
**
**
*284
7629
**
**
**
**
*
Co
re d
ep
th
(cm
)
Esti
mate
d a
ge (
yr
cal. B
P)
Min
era
log
y

Co
nt.
A
pp
en
dix
4 -
DM
ind
ex
FD
M/F
CM
ind
ex
δ1
3C
(‰
,
VP
DB
)
δ1
8O
(‰
,
VP
DB
)
Ba/C
a
(um
ol/m
ol)
Mg
/Ca
(mm
ol/m
ol)
091
773
,02
2,09
**
0,81
3,66
25,1
5*
295
757
,49
0,94
**
**
**
499
7*
**
**
**
*6
1037
76,3
14,
03*
**
**
*8
1077
65,8
12,
531,
80-0
,74
1,15
4,15
26,5
72,
3210
1117
**
**
**
**
12
1157
**
1,81
-1,1
41,
51*
**
14
1197
**
**
**
**
16
1237
**
**
*3,
5624
,86
*18
1276
**
1,62
-1,0
2*
**
*20
1316
**
**
**
**
22
1355
**
1,61
-1,1
3*
**
*24
1395
**
1,85
-1,0
51,
043,
8125
,62
1,79
26
1434
**
**
**
**
28
1473
67,7
32,
012,
03-0
,79
1,17
4,12
26,5
02,
2530
1512
70,4
71,
69*
**
**
*32
1551
71,1
22,
102,
02-1
,30
1,14
3,56
24,8
71,
3834
1589
**
1,93
-1,2
80,
923,
7625
,46
1,52
36
1628
**
**
**
**
38
1666
**
1,29
-0,9
50,
903,
8225
,64
1,89
40
1704
**
1,71
-0,7
01,
003,
9225
,92
2,21
42
1742
**
2,02
-0,7
90,
844,
1426
,53
2,26
44
1779
**
**
**
**
46
1817
**
**
**
**
48
1854
**
1,96
-1,2
60,
963,
9225
,94
1,65
G. ru
ber
(p)
geo
ch
em
ical co
mp
osit
ion
δ1
8O
w-i
vc (
‰,
SM
OW
)
Co
re
dep
th
(cm
)
Esti
mate
d a
ge (
yr
cal. B
P)
Min
era
log
yM
g/C
a b
ased
tem
pera
ture
(°C
)

Co
nt.
A
pp
en
dix
4 -
DM
ind
ex
FD
M/F
CM
ind
ex
δ1
3C
(‰
,
VP
DB
)
δ1
8O
(‰
,
VP
DB
)
Ba/C
a
(um
ol/m
ol)
Mg
/Ca
(mm
ol/m
ol)
50
1890
**
**
**
**
52
1927
**
1,55
-1,1
30,
843,
1323
,44
1,22
54
1963
**
**
**
**
56
1999
66,4
61,
851,
67-0
,99
2,10
4,15
26,5
72,
0658
2035
**
1,82
-0,9
21,
193,
9526
,01
2,00
60
2070
63,3
33,
061,
55-0
,55
1,10
4,05
26,2
92,
4462
2105
**
1,81
-0,9
81,
023,
5424
,80
1,67
64
2140
**
1,69
-0,5
21,
043,
8425
,69
2,34
66
2175
**
1,82
-0,6
21,
133,
6925
,25
2,14
68
2209
**
1,22
-0,6
61,
003,
8625
,76
2,21
70
2243
**
**
**
**
72
2277
**
1,71
-1,1
30,
963,
7325
,39
1,66
74
2311
**
2,04
-1,1
91,
523,
8325
,66
1,65
76
2344
**
1,92
-0,7
61,
383,
7825
,53
2,06
78
2377
**
1,66
-0,6
61,
023,
7925
,54
2,16
80
2410
**
1,95
-0,8
90,
924,
0026
,14
2,07
82
2443
**
1,58
-0,9
7*
**
*84
2475
**
1,93
-1,5
94,
1126
,46
1,44
86
2508
67,3
81,
871,
70-1
,13
2,02
3,74
25,4
21,
6688
2540
63,7
32,
161,
66-1
,10
**
**
90
2571
60,2
21,
861,
35-0
,71
**
**
92
2603
**
1,90
-1,1
6*
3,70
25,3
01,
6194
2634
**
**
**
**
96
2665
**
1,52
-0,7
61,
064,
0426
,26
2,22
98
2696
**
1,64
-0,6
51,
234,
3427
,06
2,51
100
2727
**
**
**
**
102
2758
**
1,66
-0,6
01,
074,
3627
,12
2,57
Min
era
log
yG
. ru
ber
(p)
geo
ch
em
ical co
mp
osit
ion
Mg
/Ca b
ased
tem
pera
ture
(°C
)
δ1
8O
w-i
vc (
‰,
SM
OW
)
Co
re
dep
th
(cm
)
Esti
mate
d a
ge (
yr
cal. B
P)
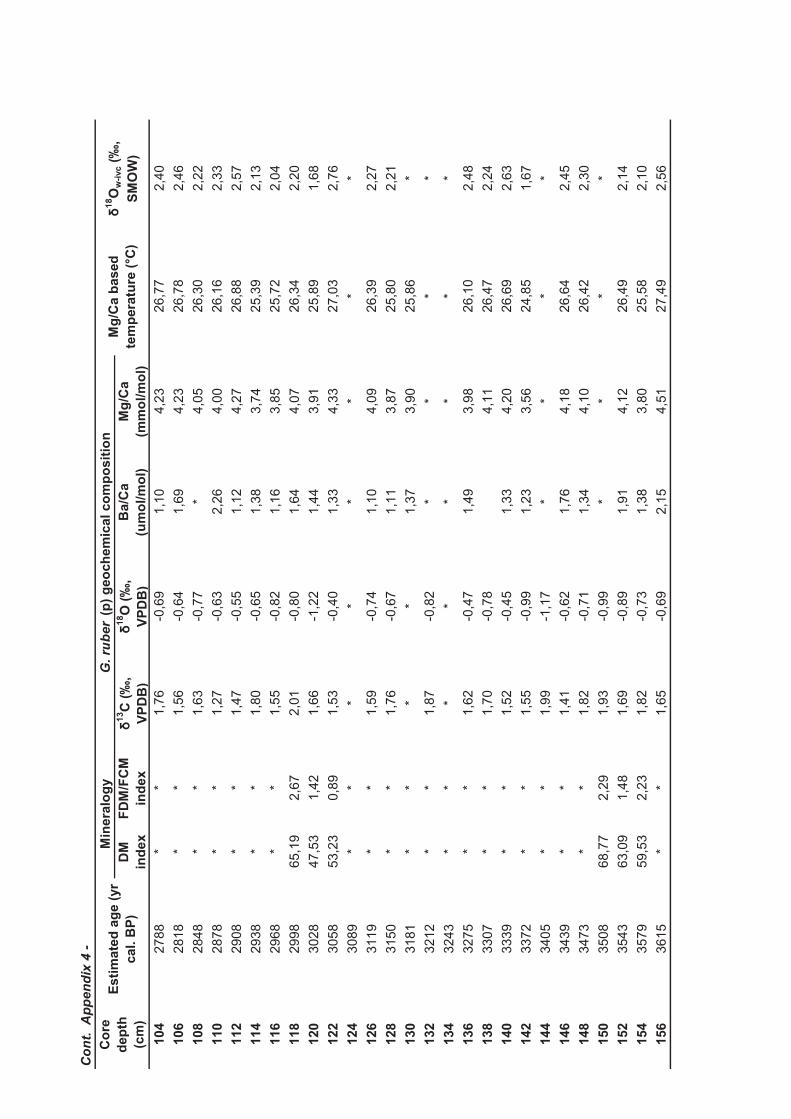
Co
nt.
A
pp
en
dix
4 -
DM
ind
ex
FD
M/F
CM
ind
ex
δ1
3C
(‰
,
VP
DB
)
δ1
8O
(‰
,
VP
DB
)
Ba/C
a
(um
ol/m
ol)
Mg
/Ca
(mm
ol/m
ol)
104
2788
**
1,76
-0,6
91,
104,
2326
,77
2,40
106
2818
**
1,56
-0,6
41,
694,
2326
,78
2,46
108
2848
**
1,63
-0,7
7*
4,05
26,3
02,
22110
2878
**
1,27
-0,6
32,
264,
0026
,16
2,33
112
2908
**
1,47
-0,5
51,
124,
2726
,88
2,57
114
2938
**
1,80
-0,6
51,
383,
7425
,39
2,13
116
2968
**
1,55
-0,8
21,
163,
8525
,72
2,04
118
2998
65,1
92,
672,
01-0
,80
1,64
4,07
26,3
42,
20120
3028
47,5
31,
421,
66-1
,22
1,44
3,91
25,8
91,
68122
3058
53,2
30,
891,
53-0
,40
1,33
4,33
27,0
32,
76124
3089
**
**
**
**
126
3119
**
1,59
-0,7
41,
104,
0926
,39
2,27
128
3150
**
1,76
-0,6
71,
113,
8725
,80
2,21
130
3181
**
**
1,37
3,90
25,8
6*
132
3212
**
1,87
-0,8
2*
**
*134
3243
**
**
**
**
136
3275
**
1,62
-0,4
71,
493,
9826
,10
2,48
138
3307
**
1,70
-0,7
84,
1126
,47
2,24
140
3339
**
1,52
-0,4
51,
334,
2026
,69
2,63
142
3372
**
1,55
-0,9
91,
233,
5624
,85
1,67
144
3405
**
1,99
-1,1
7*
**
*146
3439
**
1,41
-0,6
21,
764,
1826
,64
2,45
148
3473
**
1,82
-0,7
11,
344,
1026
,42
2,30
150
3508
68,7
72,
291,
93-0
,99
**
**
152
3543
63,0
91,
481,
69-0
,89
1,91
4,12
26,4
92,
14154
3579
59,5
32,
231,
82-0
,73
1,38
3,80
25,5
82,
10156
3615
**
1,65
-0,6
92,
154,
5127
,49
2,56
Mg
/Ca b
ased
tem
pera
ture
(°C
)
δ1
8O
w-i
vc (
‰,
SM
OW
)
Co
re
dep
th
(cm
)
Esti
mate
d a
ge (
yr
cal. B
P)
Min
era
log
yG
. ru
ber
(p)
geo
ch
em
ical co
mp
osit
ion

Co
nt.
A
pp
en
dix
4 -
DM
ind
ex
FD
M/F
CM
ind
ex
δ1
3C
(‰
,
VP
DB
)
δ1
8O
(‰
,
VP
DB
)
Ba/C
a
(um
ol/m
ol)
Mg
/Ca
(mm
ol/m
ol)
158
3652
**
1,74
-1,1
5*
**
*160
3690
**
**
**
**
162
3728
**
1,88
-0,5
91,
464,
4227
,27
2,62
164
3767
**
1,78
-0,6
01,
264,
2426
,79
2,49
166
3806
**
1,71
-0,6
81,
724,
3927
,19
2,51
168
3846
**
1,70
-0,3
81,
434,
2526
,83
2,73
170
3887
**
1,60
-0,4
41,
174,
1726
,61
2,62
172
3928
**
**
**
**
174
3970
56,2
61,
092,
00-0
,79
1,77
4,31
26,9
82,
35176
4013
67,8
01,
461,
82-0
,41
1,30
3,30
24,0
22,
06178
4056
59,9
41,
691,
44-0
,35
1,80
4,10
26,4
22,
66180
4100
**
1,85
-0,6
51,
483,
9125
,90
2,24
182
4145
**
1,70
-0,8
61,
054,
0626
,32
2,13
184
4191
**
1,69
-0,1
61,
254,
1726
,63
2,90
186
4237
**
1,91
-1,0
61,
444,
0326
,23
1,91
188
4284
**
**
**
**
190
4332
**
2,09
-0,9
31,
863,
9926
,12
2,01
192
4380
**
1,62
-0,6
51,
213,
6725
,21
2,09
194
4430
**
1,81
-0,6
71,
253,
9425
,99
2,24
196
4480
51,7
10,
761,
71-1
,18
1,43
4,07
26,3
41,
82198
4531
57,2
71,
591,
63-0
,68
1,35
3,95
26,0
32,
24200
4583
66,7
51,
591,
71-0
,81
1,53
3,98
26,0
92,
13202
4635
**
1,74
-0,3
31,
163,
7125
,33
2,43
204
4689
**
1,95
-0,5
71,
193,
9025
,86
2,32
206
4743
**
1,59
-0,7
11,
013,
5624
,87
1,95
208
4798
**
1,95
-0,8
31,
293,
7625
,48
1,97
210
4854
**
1,87
-0,9
81,
153,
7725
,50
1,82
212
4911
**
1,82
-0,2
31,
263,
5624
,86
2,42
δ1
8O
w-i
vc (
‰,
SM
OW
)
Co
re
dep
th
(cm
)
Esti
mate
d a
ge (
yr
cal. B
P)
Min
era
log
yG
. ru
ber
(p)
geo
ch
em
ical co
mp
osit
ion
Mg
/Ca b
ased
tem
pera
ture
(°C
)
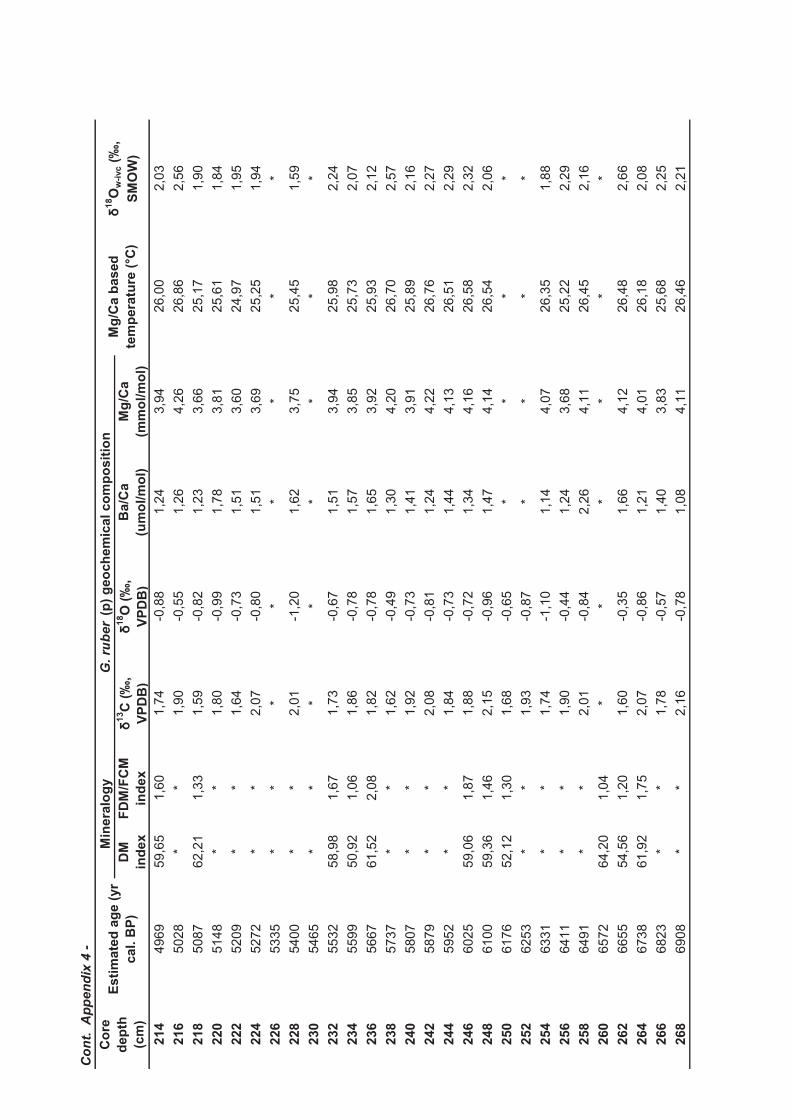
Co
nt.
A
pp
en
dix
4 -
DM
ind
ex
FD
M/F
CM
ind
ex
δ1
3C
(‰
,
VP
DB
)
δ1
8O
(‰
,
VP
DB
)
Ba/C
a
(um
ol/m
ol)
Mg
/Ca
(mm
ol/m
ol)
214
4969
59,6
51,
601,
74-0
,88
1,24
3,94
26,0
02,
03216
5028
**
1,90
-0,5
51,
264,
2626
,86
2,56
218
5087
62,2
11,
331,
59-0
,82
1,23
3,66
25,1
71,
90220
5148
**
1,80
-0,9
91,
783,
8125
,61
1,84
222
5209
**
1,64
-0,7
31,
513,
6024
,97
1,95
224
5272
**
2,07
-0,8
01,
513,
6925
,25
1,94
226
5335
**
**
**
**
228
5400
**
2,01
-1,2
01,
623,
7525
,45
1,59
230
5465
**
**
**
**
232
5532
58,9
81,
671,
73-0
,67
1,51
3,94
25,9
82,
24234
5599
50,9
21,
061,
86-0
,78
1,57
3,85
25,7
32,
07236
5667
61,5
22,
081,
82-0
,78
1,65
3,92
25,9
32,
12238
5737
**
1,62
-0,4
91,
304,
2026
,70
2,57
240
5807
**
1,92
-0,7
31,
413,
9125
,89
2,16
242
5879
**
2,08
-0,8
11,
244,
2226
,76
2,27
244
5952
**
1,84
-0,7
31,
444,
1326
,51
2,29
246
6025
59,0
61,
871,
88-0
,72
1,34
4,16
26,5
82,
32248
6100
59,3
61,
462,
15-0
,96
1,47
4,14
26,5
42,
06250
6176
52,1
21,
301,
68-0
,65
**
**
252
6253
**
1,93
-0,8
7*
**
*254
6331
**
1,74
-1,1
01,
144,
0726
,35
1,88
256
6411
**
1,90
-0,4
41,
243,
6825
,22
2,29
258
6491
**
2,01
-0,8
42,
264,
1126
,45
2,16
260
6572
64,2
01,
04*
**
**
*262
6655
54,5
61,
201,
60-0
,35
1,66
4,12
26,4
82,
66264
6738
61,9
21,
752,
07-0
,86
1,21
4,01
26,1
82,
08266
6823
**
1,78
-0,5
71,
403,
8325
,68
2,25
268
6908
**
2,16
-0,7
81,
084,
1126
,46
2,21
Co
re
dep
th
(cm
)
Esti
mate
d a
ge (
yr
cal. B
P)
Min
era
log
yG
. ru
ber
(p)
geo
ch
em
ical co
mp
osit
ion
Mg
/Ca b
ased
tem
pera
ture
(°C
)
δ1
8O
w-i
vc (
‰,
SM
OW
)

Co
nt.
A
pp
en
dix
4 -
DM
ind
ex
FD
M/F
CM
ind
ex
δ1
3C
(‰
,
VP
DB
)
δ1
8O
(‰
,
VP
DB
)
Ba/C
a
(um
ol/m
ol)
Mg
/Ca
(mm
ol/m
ol)
270
6995
**
1,96
-0,6
11,
544,
2526
,84
2,46
272
7083
45,4
11,
281,
80-0
,70
**
**
274
7171
61,4
51,
28*
**
**
*276
7261
51,1
30,
98*
**
**
*278
7352
**
**
**
**
280
7443
**
**
**
**
282
7536
**
**
**
**
284
7629
**
**
**
**
Mg
/Ca b
ased
tem
pera
ture
(°C
)
δ1
8O
w-i
vc (
‰,
SM
OW
)
Co
re
dep
th
(cm
)
Esti
mate
d a
ge (
yr
cal. B
P)
Min
era
log
yG
. ru
ber
(p)
geo
ch
em
ical co
mp
osit
ion

Ap
pen
dix
5 -
Co
re 7
616 b
en
thic
fo
ram
inif
era
co
mm
un
ity d
ata
, id
en
tifi
ed
taxa m
icro
hab
itat
cla
ssif
icati
on
an
d r
ela
tiv
e f
req
uen
cy (
%),
an
d
valu
es o
f to
tal d
en
sit
y (
tests
·10cc-1
), p
ecen
tag
es o
f fr
ag
men
ts, n
on
-id
en
tifi
ed
sp
ecim
en
s, ep
ifau
na a
nd
in
fau
na s
pecim
en
s, p
rod
ucti
vit
y
ind
exes B
FH
P (
%)
an
d B
FA
R (
tests
•cm
-2•k
yr-1
) an
d e
co
log
ical p
ara
mete
rs r
ich
ness (
S),
Sh
an
no
n d
ivers
ity (
H')
an
d e
qu
itab
ilit
y (
J')
. W
here
:
ep
ifau
na (
E)
an
d in
fau
na (
I).
1037
1434
1551
Am
ph
ico
ryn
a s
pp
.I
Fon
tani
er e
t al.,
200
40,
000,
000,
20
An
gu
log
eri
na a
ng
ulo
sa
(W
illi
am
so
n,
1858)
IC
orlis
s, 1
985;
Cor
liss
e C
hen,
198
815
,19
17,1
115
,86
An
gu
log
eri
na
sp
p.
IC
orlis
s, 1
985;
Cor
liss
e C
hen,
198
92,
471,
782,
41
Asta
co
lus
cre
pid
ulu
s0,
000,
000,
00
Bo
livin
a d
on
iezi
Cu
sh
man
& W
icken
de
n,
1929
IC
orlis
s, 1
985;
Cor
liss
e C
hen,
198
80,
000,
000,
00
Bo
livin
a p
seu
do
plicata
Hero
n-A
llen
& E
arl
an
d,
1930
IM
urra
y, 1
991;
Fon
tani
er e
t al.,
200
3 -
gene
ra B
oliv
ina
0,00
0,00
0,00
Bo
livin
a p
ulc
he
lla (
d’O
rbig
ny,
1839)
IM
urra
y, 1
991;
Fon
tani
er e
t al.,
200
3 -
gene
ra B
oliv
ina
0,00
0,00
0,00
Bo
livin
a p
ulc
he
lla f
. p
rim
itiv
a C
us
hm
an
, 1930
IM
urra
y, 1
991;
Fon
tani
er e
t al.,
200
3 -
gene
ra B
oliv
ina
0,00
0,00
0,00
Bo
livin
a s
kag
err
aken
sis
Qvale
& N
iga
m,
1985
IM
urra
y, 1
991;
Fon
tani
er e
t al.,
200
3 -
gene
ra B
oliv
ina
0,00
0,00
0,00
Bo
livin
a s
ub
sp
ine
nsis
Cu
sh
man
, 1922
IM
urra
y, 1
991;
Fon
tani
er e
t al.,
200
3 -
gene
ra B
oliv
ina
1,06
0,22
0,60
Bri
zalin
a o
rdin
ari
a (
Ph
leg
er
& P
ark
er,
1952)
IM
urra
y, 1
991;
Fon
tani
er e
t al.,
200
3 -
gene
ra B
oliv
ina
0,00
0,22
0,00
Bo
livin
a s
pp
.
IM
urra
y, 1
991;
Fon
tani
er e
t al.,
200
30,
000,
000,
20
Bri
zalin
a s
ub
aen
ari
en
sis
(C
us
hm
an
, 1922)
IC
orlis
s, 1
985;
Cor
liss
e C
hen,
198
80,
000,
890,
00
Bri
zalin
a s
path
ula
ta (
Wil
liam
so
n,
1858)
IM
urra
y, 1
991;
Fon
tani
er e
t al.,
200
3 -
gene
ra B
rizal
ina
0,00
0,00
0,40
Bri
zalin
a s
p.1
IM
urra
y, 1
991;
Fon
tani
er e
t al.,
200
3 -
gene
ra B
rizal
ina
0,00
0,22
0,40
Bri
zalin
a s
pp
.I
Mur
ray,
199
1; F
onta
nier
et a
l., 2
003
- ge
nera
Briz
alin
a1,
060,
440,
60
Bu
ccella p
eru
via
na
(d'O
rbig
ny,
1839)
IM
urra
y, 1
991
- ge
nera
Buc
cella
0,00
0,00
0,00
Bu
lim
ina
acu
leata
d´O
rbig
ny,
1826
IM
urra
y, 1
991;
Fon
tani
er e
t al.,
200
2 -
gene
ra B
ulim
ina
0,00
0,22
0,20
Bu
lim
ina
elo
ng
ata
d’
Orb
ign
y,
1846
IM
urra
y, 1
991;
Fon
tani
er e
t al.,
200
2 -
gene
ra B
ulim
ina
0,00
0,22
0,20
Bu
lim
ina
gib
ba
Fo
rna
sin
i, 1
900
IM
urra
y, 1
991;
Fon
tani
er e
t al.,
200
2 -
gene
ra B
ulim
ina
0,00
0,00
0,00
Bu
lim
ina
marg
ina
ta d
’ O
rbib
ny,
1826
IM
urra
y, 1
991;
Cor
liss
e C
hen,
198
8; F
onta
nier
et a
l., 2
002
- ge
nera
Bul
imin
a15
,90
11,1
110
,44
Bu
lim
ina
mexic
an
a C
us
hm
an
, 1922
IM
urra
y, 1
991;
Fon
tani
er e
t al.,
200
2 -
gene
ra B
ulim
ina
0,00
0,00
0,00
Bu
lim
ina
pseu
do
aff
inis
Kle
inp
ell
, 1938
IM
urra
y, 1
991;
Fon
tani
er e
t al.,
200
2 -
gene
ra B
ulim
ina
1,41
0,44
1,20
Bu
lim
ina
sp
p.
IM
urra
y, 1
991;
Fon
tani
er e
t al.
, 200
24,
592,
673,
61
Ben
thic
fo
ram
inif
era
taxa
Mic
roh
ab
itat
Refe
ren
ces
Esti
mate
d a
ge
(yr
cal.
BP
)
Ben
thic
fo
ram
inif
era
(%
)

Co
nt.
Ap
pen
dix
5 -
1037
1434
1551
Bu
lim
ine
lla e
leg
an
tissim
a (
d’
Orb
ign
y 1
839)
IM
urra
y, 1
991
- ge
nera
Bul
imin
ella
0,00
0,00
0,00
Can
cri
s a
uri
cu
lus
(F
ich
tel
& M
oll
, 1798)
EM
urra
y, 1
991;
Fon
tani
er e
t al.,
200
2 -
gene
ra C
ancr
is0,
000,
000,
00
Can
cri
s s
pp
.E
Mur
ray,
199
1; F
onta
nier
et a
l., 2
002
0,35
0,00
0,20
Cassid
ulin
a c
ari
na
ta (
Sil
vestr
i, 1
896)
IM
urra
y, 1
991
- ge
nera
Cas
sidu
lina
0,00
0,00
0,40
Cassid
ulin
a laevig
ata
d’O
rbig
ny,
1826
IM
urra
y, 1
991
- ge
nera
Cas
sidu
lina
0,00
0,00
0,20
Cassid
ulin
a s
pp
.I
Mur
ray,
199
10,
000,
670,
40
Cib
icid
es s
pp
.E
Cor
liss,
198
5; C
orlis
s e
Che
n, 1
988;
Mur
ray,
199
1 0,
000,
220,
00
Cib
icid
es u
ng
eri
an
us
(d
’ O
rbig
ny,
1846)
EM
urra
y, 1
991-
gen
era
Cib
icid
oide
s0,
350,
000,
40
Cib
icid
oid
es w
uellers
torf
i (S
ch
wag
er,
1866)
EM
urra
y, 1
991-
gen
era
Cib
icid
oide
s0,
000,
220,
00
Cib
icid
oid
es s
pp
.E
Mur
ray,
199
10,
000,
000,
00
Cla
vu
lin
a h
um
ilis
Bra
dy,
1884
0,00
0,00
0,20
Cla
vu
lin
a m
ult
icam
era
ta C
ha
pm
an
, 1907
0,00
0,00
0,00
Cla
vu
lin
a s
pp
.0,
350,
000,
60
Cri
bo
elp
hid
ium
in
cert
um
0,00
0,00
0,00
Den
talin
a a
rien
a P
att
ers
on
& P
ett
is,
1986
IC
orlis
s e
Che
n, 1
988
- ge
nera
Den
talin
a0,
000,
000,
00
Den
talin
a s
pp
.I
Cor
liss
e C
hen,
198
80,
000,
220,
00
Dis
co
rbin
ella
sp
p.
0,00
0,00
0,00
Dis
co
rbis
william
so
ni
Ch
ap
man
& P
arr
, 1932
EM
urra
y, 1
991
- ge
nera
Dis
corb
is0,
000,
000,
00
Do
roth
ia g
oe
ssi
(Cu
sh
man
, 1911)
0,00
0,67
0,00
Ep
isto
min
ella
sp
p.
0,00
13,1
11,
20
Evo
lvo
cassid
ulin
a o
rien
talis
(C
us
hm
an
, 1922)
0,00
0,00
0,00
Fis
su
rin
a laevig
ata
Reu
ss,
1850
IC
orlis
s e
Che
n, 1
988
- ge
nera
Fis
surin
a0,
000,
000,
00
Fis
su
rin
a lu
cid
a (
Wil
liam
so
n,
1884)
IC
orlis
s e
Che
n, 1
988
- ge
nera
Fis
surin
a0,
000,
000,
00
Fis
su
rin
a m
arg
ina
ta (
Mo
nta
gu
, 1803)
IC
orlis
s e
Che
n, 1
988
- ge
nera
Fis
surin
a0,
000,
000,
00
Fis
su
rin
a q
ua
dri
co
stu
lata
Sil
vestr
i, 1
902
IC
orlis
s e
Che
n, 1
988
- ge
nera
Fis
surin
a0,
000,
000,
20
Fis
su
rin
a s
pp
. I
Cor
liss
e C
hen,
198
8 -
gene
ra F
issu
rina
0,00
0,00
0,40
Fis
su
rin
a s
tap
hy
lleari
a S
ch
wag
er,
1866
IC
orlis
s e
Che
n, 1
988
- ge
nera
Fis
surin
a0,
000,
220,
20
Fa
vu
lin
a h
exag
on
a (
Wil
liam
so
n,
1848)
IC
orlis
s e
Che
n, 1
988
- ge
nera
Fla
vulin
a0,
000,
000,
00
Ben
thic
fo
ram
inif
era
(%
)
Ben
thic
fo
ram
inif
era
taxa
Mic
roh
ab
itat
Refe
ren
ces
Esti
mate
d a
ge
(yr
cal.
BP
)
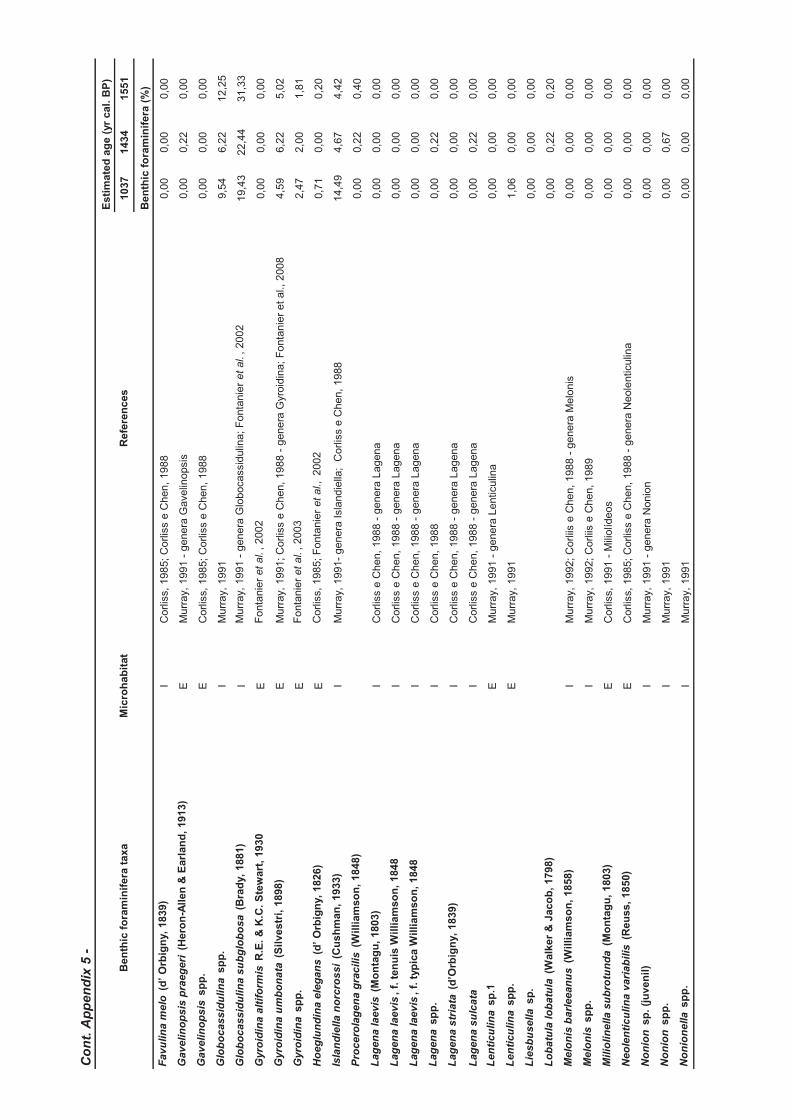
Co
nt.
Ap
pen
dix
5 -
1037
1434
1551
Fa
vu
lin
a m
elo
(d
’ O
rbig
ny,
1839)
IC
orlis
s, 1
985;
Cor
liss
e C
hen,
198
80,
000,
000,
00
Gavelin
op
sis
pra
eg
eri
(H
ero
n-A
llen
& E
arl
an
d,
1913)
EM
urra
y, 1
991
- ge
nera
Gav
elin
opsi
s0,
000,
220,
00
Gavelin
op
sis
sp
p.
EC
orlis
s, 1
985;
Cor
liss
e C
hen,
198
80,
000,
000,
00
Glo
bo
cassid
ulin
a s
pp
.I
Mur
ray,
199
19,
546,
2212
,25
Glo
bo
cassid
ulin
a s
ub
glo
bo
sa
(B
rad
y,
1881)
IM
urra
y, 1
991
- ge
nera
Glo
boca
ssid
ulin
a; F
onta
nier
et
al.
, 200
219
,43
22,4
431
,33
Gyro
idin
a a
ltif
orm
is R
.E.
& K
.C.
Ste
wart
, 1930
EF
onta
nier
et
al.
, 200
20,
000,
000,
00
Gyro
idin
a u
mb
on
ata
(S
ilvestr
i, 1
898)
EM
urra
y, 1
991;
Cor
liss
e C
hen,
198
8 -
gene
ra G
yroi
dina
; Fon
tani
er e
t al.,
200
84,
596,
225,
02
Gyro
idin
a s
pp
.E
Fon
tani
er e
t al.
, 200
32,
472,
001,
81
Ho
eg
lun
din
a e
leg
an
s (
d’
Orb
ign
y,
1826)
EC
orlis
s, 1
985;
Fon
tani
er e
t al.,
2002
0,71
0,00
0,20
Isla
nd
iella n
orc
ros
si
(Cu
sh
man
, 1933)
IM
urra
y, 1
991-
gen
era
Isla
ndie
lla;
Cor
liss
e C
hen,
198
8 14
,49
4,67
4,42
Pro
cero
lag
en
a g
racilis
(W
illi
am
so
n,
1848)
0,00
0,22
0,40
La
gen
a laevis
(M
on
tag
u,
1803)
IC
orlis
s e
Che
n, 1
988
- ge
nera
Lag
ena
0,00
0,00
0,00
La
gen
a laevis
, f.
ten
uis
Wil
liam
so
n,
1848
IC
orlis
s e
Che
n, 1
988
- ge
nera
Lag
ena
0,00
0,00
0,00
La
gen
a laevis
, f.
typ
ica W
illi
am
so
n,
1848
IC
orlis
s e
Che
n, 1
988
- ge
nera
Lag
ena
0,00
0,00
0,00
La
gen
a s
pp
.I
Cor
liss
e C
hen,
198
80,
000,
220,
00
La
gen
a s
tria
ta (
d’O
rbig
ny,
1839)
IC
orlis
s e
Che
n, 1
988
- ge
nera
Lag
ena
0,00
0,00
0,00
La
gen
a s
ulc
ata
IC
orlis
s e
Che
n, 1
988
- ge
nera
Lag
ena
0,00
0,22
0,00
Le
nti
cu
lin
a s
p.1
EM
urra
y, 1
991
- ge
nera
Len
ticul
ina
0,00
0,00
0,00
Le
nti
cu
lin
a s
pp
.E
Mur
ray,
199
11,
060,
000,
00
Lie
sb
us
ella s
p.
0,00
0,00
0,00
Lo
ba
tula
lo
ba
tula
(W
alk
er
& J
aco
b,
1798)
0,00
0,22
0,20
Melo
nis
ba
rleean
us
(W
illi
am
so
n,
1858)
IM
urra
y, 1
992;
Cor
liis
e C
hen,
198
8 -
gene
ra M
elon
is0,
000,
000,
00
Melo
nis
sp
p.
IM
urra
y, 1
992;
Cor
liis
e C
hen,
198
90,
000,
000,
00
Milio
lin
ella s
ub
rotu
nd
a (
Mo
nta
gu
, 1803)
EC
orlis
s, 1
991
- M
iliol
ídeo
s 0,
000,
000,
00
Neo
len
ticu
lin
a v
ari
ab
ilis
(R
eu
ss,
1850)
EC
orlis
s, 1
985;
Cor
liss
e C
hen,
198
8 -
gene
ra N
eole
ntic
ulin
a0,
000,
000,
00
No
nio
n s
p.
(ju
ven
il)
IM
urra
y, 1
991
- ge
nera
Non
ion
0,00
0,00
0,00
No
nio
n s
pp
. I
Mur
ray,
199
1 0,
000,
670,
00
No
nio
ne
lla
sp
p.
IM
urra
y, 1
991
0,00
0,00
0,00
Ben
thic
fo
ram
inif
era
(%
)
Ben
thic
fo
ram
inif
era
taxa
Mic
roh
ab
itat
Refe
ren
ces
Esti
mate
d a
ge
(yr
cal.
BP
)

Co
nt.
Ap
pen
dix
5 -
1037
1434
1551
No
nio
no
ide
s t
urg
ida
(W
illi
am
so
n,
1858)
IC
orlis
s, 1
985;
Cor
liss
e C
hen,
198
80,
000,
890,
20
No
nio
no
ide
s g
rate
lou
pi
(d’O
rbig
ny,
1826)
IM
urra
y, 1
991
- ge
nera
Non
iono
ides
0,00
0,00
0,20
No
nio
no
ide
s p
un
ctu
latu
sI
Mur
ray,
199
1 -
gene
ra N
onio
noid
es0,
000,
000,
00
No
nio
no
ide
s s
pp
.I
Mur
ray,
199
1 0,
000,
000,
00
Oo
lin
a a
cu
tico
sta
0,00
0,00
0,00
Oo
lin
a m
elo
0,00
0,00
0,00
Osan
gu
riella u
mb
on
ifera
(C
us
hm
an
, 1933)
0,00
0,00
0,20
Pla
nu
lin
a s
pp
.E
Cor
liss,
198
5; C
orlis
s e
Che
n, 1
988;
Mur
ray,
199
1 -
gene
ra P
lanu
lina
0,00
0,00
0,00
Po
lym
orp
hin
ella
sp
.0,
000,
000,
00
Pseu
do
gau
dry
na s
p.
no
v.
1,06
0,00
0,60
Pseu
do
no
nio
n a
tlan
ticu
m
(Cu
sh
man
, 1936)
IC
orlis
s, 1
985;
Cor
liss
e C
hen,
198
8 -
gene
ra P
seud
onon
ion
0,00
0,00
0,40
Pu
llen
ia b
ullo
ide
s (
d’O
rbig
ny,
1846)
I0,
000,
000,
00
Pu
llen
ia o
slo
en
sis
Fe
yli
ng
-Han
ssen
, 1954
0,00
0,00
0,00
Pu
len
ia q
ua
dri
lob
a0,
000,
000,
00
Pu
llen
ia q
uin
qu
elo
ba
(R
eu
ss,
1851)
0,00
0,00
0,00
Pyrg
o d
ep
ressa (
d’
Orb
ign
y,
1826)
EC
orlis
s, 1
991
- M
iliol
ídeo
s ; M
urra
y, 1
991
- ge
nera
Pyr
go0,
000,
000,
00
Pyrg
o m
urr
hin
a (
Sch
wag
er,
1866)
EC
orlis
s, 1
991
- M
iliol
ídeo
s ; M
urra
y, 1
991
- ge
nera
Pyr
go0,
000,
000,
00
Pyrg
o n
asu
ta C
us
hm
an
, 1935
EC
orlis
s, 1
991
- M
iliol
ídeo
s ; M
urra
y, 1
991
- ge
nera
Pyr
go0,
000,
000,
40
Pyrg
o r
ing
en
s (
La
marc
k,
1804)
EC
orlis
s, 1
991
- M
iliol
ídeo
s ; M
urra
y, 1
991
- ge
nera
Pyr
go0,
350,
220,
00
Pyrg
o s
p.3
EC
orlis
s, 1
991
- M
iliol
ídeo
s ; M
urra
y, 1
991
- ge
nera
Pyr
go0,
000,
000,
20
Pyrg
o s
pp
.E
Cor
liss,
199
1 -
Mili
olíd
eos
0,35
0,00
0,20
Qu
inq
ue
loc
ulin
a a
kn
eri
an
a d
’ O
rbig
ny,
1846
EC
orlis
s, 1
991
- M
iliol
ídeo
s ; M
urra
y, 1
991
- ge
nera
Qui
nque
locu
lina
0,00
0,00
0,00
Qu
inq
ue
loc
ulin
a a
tlan
tica
EC
orlis
s, 1
991
- M
iliol
ídeo
s ; M
urra
y, 1
991
- ge
nera
Qui
nque
locu
lina
0,00
0,22
0,00
Qu
inq
ue
loc
ulin
a lam
arc
kia
na
d´O
rbig
ny,
1839
EC
orlis
s, 1
991
- M
iliol
ídeo
s ; M
urra
y, 1
991
- ge
nera
Qui
nque
locu
lina
0,35
0,00
0,00
Qu
inq
ue
loc
ulin
a s
pp
. E
Cor
liss,
199
1 -
Mili
olíd
eos
; Mur
ray,
199
10,
350,
000,
40
Reo
ph
ax
sp
.0,
350,
000,
20
Ro
salin
a g
lob
ula
ris
(d
’ O
rbig
ny,
1826)
EM
urra
y, 1
991
- ge
nera
Ros
alin
a0,
000,
670,
00
Ro
salin
a s
pp
.E
Mur
ray,
199
10,
000,
000,
00
Ben
thic
fo
ram
inif
era
(%
)
Ben
thic
fo
ram
inif
era
taxa
Mic
roh
ab
itat
Refe
ren
ces
Esti
mate
d a
ge
(yr
cal.
BP
)

Co
nt.
Ap
pen
dix
5 -
1037
1434
1551
Sara
cen
ari
a s
p.
0,00
0,00
0,00
Seab
roo
kia
earl
an
di
Wri
gh
t, 1
891
EH
einz
et a
l., 2
004
0,00
0,67
0,00
Sig
mo
ilo
ps
is s
ch
lum
be
rge
ri (
Sil
vestr
i, 1
904)
ED
i Ste
fano
et a
l., 2
010;
Pìp
per
and
Rei
chen
bach
er, 2
010
- ge
nera
Sig
moi
lops
is0,
000,
670,
00
Sip
ho
nin
a b
rad
yan
a C
us
hm
an
, 1927
0,00
0,67
0,20
Sip
ho
textu
llari
a s
p.
0,35
0,00
0,00
Sp
iro
glu
tin
a s
pp
.E
Cor
liss,
198
5; C
orlis
s e
Che
n, 1
988;
Cor
liss,
199
10,
350,
220,
20
Sp
iro
ple
cti
ne
lla w
rig
hti
i (S
ilvestr
i, 1
903)
0,00
0,00
0,00
Sta
info
rth
ia c
om
pla
na
ta (
Eg
ge
r, 1
895)
SI
Bub
ensh
chik
ova
et a
l., 2
008
0,00
0,44
0,00
Sta
info
rth
ia s
pp
.S
IB
uben
shch
ikov
a et
al.,
200
80,
000,
000,
00
Te
xtu
llari
a p
seu
do
gra
men
0,00
0,00
0,00
Te
xtu
llari
a s
p.1
EC
orlis
s, 1
985;
Cor
liss
e C
hen,
198
8; M
urra
y, 1
991
0,00
0,00
0,00
Te
xtu
llari
a s
p.2
0,00
0,00
0,00
Te
xtu
llari
a s
p.4
0,00
0,00
0,00
Te
xtu
llari
a s
pp
.E
1,41
0,00
0,00
Tri
loc
ulin
a s
pp
.E
Cor
liss,
199
1 -
Mili
olíd
eos
0,00
0,44
0,00
Uvig
eri
na
au
be
rian
a d
’ O
rbig
ny,
1839
IM
urra
y, 1
991;
Fon
tani
er e
t al.,
200
2 -
gene
ra U
vige
rina
0,00
0,00
0,00
Uvig
eri
na
pere
gri
na
Cu
sh
man
, 1923
IM
urra
y, 1
991;
Cor
liss
e C
hen,
198
8 -
gene
ra U
vige
rina
0,00
0,67
0,20
Uvig
eri
na
sp
p.
IM
urra
y, 1
991
Fon
tani
er e
t al.,
200
2 -
gene
ra U
vige
rina
0,00
0,00
0,00
tota
l d
en
sit
y (
tests•10 c
c-1
)25
4710
800
1494
0
frag
men
ts (
%)
13,0
78,
0012
,45
no
t id
en
tifi
ed
(%
)1,
410,
891,
81
E (
%)
7,42
5,78
3,82
I (%
)90
,46
92,4
493
,57
BF
HP
in
de
x (
%)
24,0
318
,67
18,2
7
BF
AR
in
de
x (
tests
•cm
-2•k
yr-1
)12
7202
5524
5577
4170
R26
4145
H'
2,42
2,56
2,42
J'
0,74
0,69
0,64
Ben
thic
fo
ram
inif
era
(%
)
Ben
thic
fo
ram
inif
era
taxa
Mic
roh
ab
itat
Refe
ren
ces
Esti
mate
d a
ge
(yr
cal.
BP
)

Co
nt.
Ap
pen
dix
5 -
1742
2035
2209
2540
2603
2998
3119
3307
3439
3615
3846
4013
4531
Am
ph
ico
ryn
a s
pp
.0,
000,
000,
000,
000,
000,
000,
000,
000,
000,
000,
000,
000,
00
An
gu
log
eri
na a
ng
ulo
sa
(W
illi
am
so
n,
1858)
11,5
28,
4312
,50
16,0
58,
0614
,57
3,89
10,8
811
,04
5,00
8,19
12,2
416
,80
An
gu
log
eri
na
sp
p.
2,42
3,19
2,50
0,86
2,09
1,76
1,95
1,36
2,99
1,80
1,26
1,53
4,34
Asta
co
lus
cre
pid
ulu
s0,
000,
000,
000,
290,
000,
000,
000,
000,
000,
000,
000,
000,
00
Bo
livin
a d
on
iezi
Cu
sh
man
& W
icken
de
n,
1929
0,00
0,00
0,00
0,00
0,00
0,00
0,00
0,00
0,00
0,00
0,00
0,00
0,27
Bo
livin
a p
seu
do
plicata
Hero
n-A
llen
& E
arl
an
d,
1930
0,00
0,00
0,25
0,00
0,60
0,00
0,00
0,00
0,00
1,20
0,21
0,38
0,00
Bo
livin
a p
ulc
he
lla (
d’O
rbig
ny,
1839)
0,00
0,00
0,00
0,00
0,00
0,00
0,00
0,00
0,00
0,20
0,00
0,00
0,00
Bo
livin
a p
ulc
he
lla f
. p
rim
itiv
a C
us
hm
an
, 1930
0,56
0,00
0,00
0,00
0,00
0,50
0,00
0,00
0,00
0,00
0,00
0,00
0,00
Bo
livin
a s
kag
err
aken
sis
Qvale
& N
iga
m,
1985
0,19
0,00
0,00
0,00
0,00
0,00
0,00
0,00
0,00
0,00
0,00
0,00
0,00
Bo
livin
a s
ub
sp
ine
nsis
Cu
sh
man
, 1922
0,56
0,68
1,00
1,15
0,90
1,76
0,39
0,00
1,19
0,00
0,84
1,72
2,98
Bri
zalin
a o
rdin
ari
a (
Ph
leg
er
& P
ark
er,
1952)
0,00
0,00
0,00
0,00
0,00
0,00
0,00
0,00
0,00
0,80
0,21
0,00
0,27
Bo
livin
a s
pp
.
0,19
0,00
0,25
0,00
0,00
0,25
0,00
0,00
0,00
0,00
0,00
0,00
0,00
Bri
zalin
a s
ub
aen
ari
en
sis
(C
us
hm
an
, 1922)
0,00
0,00
0,00
0,29
0,00
0,25
0,00
0,00
0,00
0,00
0,21
0,76
0,81
Bri
zalin
a s
path
ula
ta (
Wil
liam
so
n,
1858)
0,56
0,23
0,00
0,29
0,00
0,25
0,00
0,00
0,30
0,00
0,00
0,76
0,27
Bri
zalin
a s
p.1
0,56
0,46
0,25
0,29
0,30
0,50
0,00
0,68
0,00
0,40
0,21
0,38
0,00
Bri
zalin
a s
pp
.1,
300,
681,
250,
862,
091,
012,
330,
680,
300,
801,
261,
151,
36
Bu
ccella p
eru
via
na
(d'O
rbig
ny,
1839)
0,00
0,00
0,00
0,00
0,00
0,00
0,00
0,00
0,00
0,00
0,00
0,19
0,00
Bu
lim
ina
acu
leata
d´O
rbig
ny,
1826
0,37
0,46
0,00
0,29
0,00
0,25
0,00
0,34
0,90
0,00
0,00
0,38
0,54
Bu
lim
ina
elo
ng
ata
d’
Orb
ign
y,
1846
0,19
0,00
0,25
0,00
0,00
0,00
0,78
0,00
0,00
0,00
0,00
0,00
0,00
Bu
lim
ina
gib
ba
Fo
rna
sin
i, 1
900
0,19
0,00
0,25
0,00
0,90
0,00
0,39
0,00
0,00
0,00
0,00
0,00
0,00
Bu
lim
ina
marg
ina
ta d
’ O
rbib
ny,
1826
9,29
14,5
812
,75
10,8
96,
5716
,58
5,84
7,48
12,5
43,
606,
308,
4111
,65
Bu
lim
ina
mexic
an
a C
us
hm
an
, 1922
0,00
0,00
0,00
0,00
0,00
0,25
0,00
0,00
0,00
0,00
0,00
0,00
0,00
Bu
lim
ina
pseu
do
aff
inis
Kle
inp
ell
, 1938
0,93
2,28
0,50
0,86
0,60
0,75
0,39
0,34
0,60
0,20
0,63
0,76
0,27
Bu
lim
ina
sp
p.
2,23
2,28
4,00
3,44
0,90
2,26
0,78
1,70
1,79
1,20
1,47
2,10
2,44
Esti
mate
d a
ge
(yr
cal.
BP
)
Ben
thic
fo
ram
inif
era
(%
)
Ben
thic
fo
ram
inif
era
taxa

Co
nt.
Ap
pen
dix
5 -
1742
2035
2209
2540
2603
2998
3119
3307
3439
3615
3846
4013
4531
Bu
lim
ine
lla e
leg
an
tissim
a (
d’
Orb
ign
y 1
839)
0,00
0,23
0,00
0,00
0,00
0,00
0,00
0,00
0,00
0,00
0,00
0,19
0,00
Can
cri
s a
uri
cu
lus
(F
ich
tel
& M
oll
, 1798)
0,19
0,00
0,00
0,00
0,00
0,00
0,00
0,00
0,00
0,00
0,00
0,00
0,00
Can
cri
s s
pp
.0,
190,
000,
000,
000,
000,
250,
000,
000,
000,
000,
000,
000,
00
Cassid
ulin
a c
ari
na
ta (
Sil
vestr
i, 1
896)
0,00
0,00
0,00
0,00
0,00
0,00
0,00
0,00
0,00
0,20
0,00
0,00
0,00
Cassid
ulin
a laevig
ata
d’O
rbig
ny,
1826
0,00
0,00
0,00
0,00
0,00
0,00
0,00
0,00
0,00
0,00
0,00
0,00
0,00
Cassid
ulin
a s
pp
.0,
370,
000,
750,
000,
000,
000,
000,
000,
000,
000,
000,
000,
00
Cib
icid
es s
pp
.0,
000,
000,
000,
000,
000,
250,
000,
000,
000,
400,
000,
000,
00
Cib
icid
es u
ng
eri
an
us
(d
’ O
rbig
ny,
1846)
0,00
0,00
0,00
0,00
0,00
0,00
0,00
0,00
0,30
0,00
0,63
0,19
0,00
Cib
icid
oid
es w
uellers
torf
i (S
ch
wag
er,
1866)
0,00
0,00
0,00
0,00
0,00
0,00
0,00
0,00
0,00
0,00
0,00
0,00
0,00
Cib
icid
oid
es s
pp
.0,
000,
000,
000,
000,
000,
000,
000,
000,
000,
000,
000,
000,
27
Cla
vu
lin
a h
um
ilis
Bra
dy,
1884
0,37
0,00
0,25
0,29
0,00
0,25
0,39
0,00
0,00
0,20
0,21
0,19
0,00
Cla
vu
lin
a m
ult
icam
era
ta C
ha
pm
an
, 1907
0,19
0,00
0,00
0,00
0,00
0,00
0,00
0,00
0,00
0,00
0,00
0,00
0,00
Cla
vu
lin
a s
pp
.0,
190,
000,
000,
000,
000,
000,
000,
000,
000,
000,
000,
000,
00
Cri
bo
elp
hid
ium
in
cert
um
0,00
0,00
0,25
0,00
0,00
0,00
0,00
0,00
0,00
0,40
0,21
0,00
0,00
Den
talin
a a
rien
a P
att
ers
on
& P
ett
is,
1986
0,00
0,00
0,00
0,00
0,00
0,00
0,00
0,00
0,00
0,00
0,00
0,00
0,00
Den
talin
a s
pp
.0,
000,
000,
000,
000,
000,
000,
000,
000,
000,
000,
000,
000,
00
Dis
co
rbin
ella
sp
p.
0,00
0,00
0,00
0,00
0,00
0,00
0,00
0,00
0,00
0,20
0,00
0,00
0,00
Dis
co
rbis
william
so
ni
Ch
ap
man
& P
arr
, 1932
0,00
0,00
0,00
0,00
0,00
0,00
0,00
0,00
0,00
0,00
0,00
0,00
0,00
Do
roth
ia g
oe
ssi
(Cu
sh
man
, 1911)
0,19
0,00
0,75
0,00
0,00
0,00
0,00
0,34
0,00
0,00
0,00
0,00
0,00
Ep
isto
min
ella
sp
p.
16,5
42,
0514
,50
13,7
637
,91
0,00
23,7
411
,56
0,00
25,0
023
,53
12,0
40,
27
Evo
lvo
cassid
ulin
a o
rien
talis
(C
us
hm
an
, 1922)
0,00
0,23
0,25
0,00
0,00
0,00
0,00
0,00
0,00
0,00
0,00
0,00
0,00
Fis
su
rin
a laevig
ata
Reu
ss,
1850
0,19
0,00
0,00
0,00
0,00
0,00
0,00
0,00
0,00
0,20
0,00
0,19
0,27
Fis
su
rin
a lu
cid
a (
Wil
liam
so
n,
1884)
0,00
0,00
0,00
0,00
0,00
0,00
0,00
0,00
0,00
0,20
0,00
0,19
0,00
Fis
su
rin
a m
arg
ina
ta (
Mo
nta
gu
, 1803)
0,37
0,23
0,00
0,00
0,00
0,00
0,00
0,34
0,00
0,00
0,00
0,38
0,00
Fis
su
rin
a q
ua
dri
co
stu
lata
Sil
vestr
i, 1
902
0,00
0,00
0,00
0,00
0,00
0,00
0,00
0,00
0,00
0,00
0,00
0,00
0,00
Fis
su
rin
a s
pp
. 0,
190,
000,
250,
290,
000,
000,
000,
000,
000,
200,
210,
000,
00
Fis
su
rin
a s
tap
hy
lleari
a S
ch
wag
er,
1866
0,19
0,00
0,00
0,29
0,00
0,00
0,00
0,00
0,00
0,20
0,00
0,19
0,00
Fa
vu
lin
a h
exag
on
a (
Wil
liam
so
n,
1848)
0,00
0,00
0,00
0,00
0,00
0,00
0,00
0,00
0,00
0,00
0,00
0,19
0,00
Ben
thic
fo
ram
inif
era
(%
)
Esti
mate
d a
ge
(yr
cal.
BP
)
Ben
thic
fo
ram
inif
era
taxa

Co
nt.
Ap
pen
dix
5 -
1742
2035
2209
2540
2603
2998
3119
3307
3439
3615
3846
4013
4531
Fa
vu
lin
a m
elo
(d
’ O
rbig
ny,
1839)
0,00
0,00
0,00
0,00
0,00
0,00
0,00
0,00
0,00
0,00
0,21
0,00
0,00
Gavelin
op
sis
pra
eg
eri
(H
ero
n-A
llen
& E
arl
an
d,
1913)
0,37
0,46
1,00
2,01
0,00
0,25
0,00
0,00
0,30
0,00
0,21
0,19
1,08
Gavelin
op
sis
sp
p.
0,00
0,00
0,00
0,00
0,00
0,25
0,00
0,34
0,00
0,00
0,00
0,00
0,00
Glo
bo
cassid
ulin
a s
pp
.6,
889,
574,
006,
884,
789,
307,
0014
,97
8,66
8,80
2,31
3,25
8,13
Glo
bo
cassid
ulin
a s
ub
glo
bo
sa
(B
rad
y,
1881)
27,3
230
,07
19,0
024
,36
25,6
728
,64
37,3
535
,37
42,3
936
,80
37,6
136
,14
20,6
0
Gyro
idin
a a
ltif
orm
is R
.E.
& K
.C.
Ste
wart
, 1930
0,00
0,00
0,00
0,00
0,00
0,00
0,00
0,34
0,00
0,00
0,00
0,00
0,00
Gyro
idin
a u
mb
on
ata
(S
ilvestr
i, 1
898)
4,46
6,83
5,25
4,87
3,58
8,29
3,11
2,72
5,67
2,20
5,88
4,40
5,96
Gyro
idin
a s
pp
.1,
673,
193,
001,
151,
791,
510,
780,
682,
690,
601,
051,
151,
90
Ho
eg
lun
din
a e
leg
an
s (
d’
Orb
ign
y,
1826)
0,19
0,23
0,25
0,00
0,00
0,00
0,00
0,00
0,00
0,20
0,21
0,00
0,00
Isla
nd
iella n
orc
ros
si
(Cu
sh
man
, 1933)
4,46
8,88
8,25
5,73
1,79
6,53
5,06
2,72
6,27
4,60
3,78
4,97
10,3
0
Pro
cero
lag
en
a g
racilis
(W
illi
am
so
n,
1848)
0,00
0,00
0,25
0,00
0,00
0,00
0,00
0,00
0,00
0,00
0,00
0,00
0,00
La
gen
a laevis
(M
on
tag
u,
1803)
0,00
0,00
0,25
0,00
0,00
0,00
0,00
0,00
0,00
0,00
0,00
0,00
0,00
La
gen
a laevis
, f.
ten
uis
Wil
liam
so
n,
1848
0,00
0,00
0,00
0,00
0,00
0,00
0,00
0,00
0,00
0,00
0,00
0,00
0,00
La
gen
a laevis
, f.
typ
ica W
illi
am
so
n,
1848
0,19
0,00
0,00
0,00
0,00
0,00
0,00
0,00
0,00
0,00
0,00
0,19
0,00
La
gen
a s
pp
.0,
190,
000,
000,
570,
000,
000,
000,
340,
000,
000,
000,
190,
27
La
gen
a s
tria
ta (
d’O
rbig
ny,
1839)
0,00
0,00
0,00
0,00
0,00
0,00
0,00
0,00
0,60
0,20
0,00
0,00
0,00
La
gen
a s
ulc
ata
0,56
0,23
0,00
0,00
0,00
0,00
0,00
0,00
0,00
0,00
0,00
0,00
0,00
Le
nti
cu
lin
a s
p.1
0,00
0,00
0,00
0,00
0,00
0,00
0,00
0,00
0,00
0,00
0,00
0,00
0,00
Le
nti
cu
lin
a s
pp
.0,
000,
000,
250,
000,
000,
250,
780,
340,
000,
000,
210,
000,
00
Lie
sb
us
ella s
p.
0,00
0,00
0,00
0,29
0,00
0,00
0,00
0,00
0,00
0,00
0,00
0,00
0,00
Lo
ba
tula
lo
ba
tula
(W
alk
er
& J
aco
b,
1798)
0,56
0,46
0,25
0,00
0,00
0,00
0,00
0,34
0,30
1,00
0,21
0,00
0,00
Melo
nis
ba
rleean
us
(W
illi
am
so
n,
1858)
0,00
0,23
0,00
0,00
0,00
0,00
0,00
0,00
0,00
0,00
0,00
0,00
0,00
Melo
nis
sp
p.
0,00
0,00
0,00
0,00
0,00
0,00
0,00
0,34
0,00
0,00
0,00
0,00
0,00
Milio
lin
ella s
ub
rotu
nd
a (
Mo
nta
gu
, 1803)
0,00
0,00
0,25
0,00
0,00
0,00
0,00
0,34
0,00
0,00
0,00
0,00
0,00
Neo
len
ticu
lin
a v
ari
ab
ilis
(R
eu
ss,
1850)
0,00
0,00
0,25
0,00
0,00
0,00
0,00
0,00
0,00
0,20
0,00
0,00
0,00
No
nio
n s
p.
(ju
ven
il)
0,00
0,00
0,25
0,00
0,00
0,00
0,00
0,00
0,00
0,00
0,00
0,00
0,00
No
nio
n s
pp
. 0,
190,
000,
000,
290,
000,
000,
000,
000,
300,
200,
210,
190,
00
No
nio
ne
lla
sp
p.
0,19
0,00
0,00
0,00
0,00
0,00
0,00
0,68
0,00
0,60
0,21
0,38
0,00
Ben
thic
fo
ram
inif
era
(%
)
Esti
mate
d a
ge
(yr
cal.
BP
)
Ben
thic
fo
ram
inif
era
taxa

Co
nt.
Ap
pen
dix
5 -
1742
2035
2209
2540
2603
2998
3119
3307
3439
3615
3846
4013
4531
No
nio
no
ide
s t
urg
ida
(W
illi
am
so
n,
1858)
0,00
0,23
1,00
0,29
0,00
0,00
0,39
0,34
0,30
0,00
0,21
0,96
0,00
No
nio
no
ide
s g
rate
lou
pi
(d’O
rbig
ny,
1826)
0,19
0,00
0,00
0,00
0,00
0,00
0,00
0,00
0,00
0,00
0,00
0,00
0,00
No
nio
no
ide
s p
un
ctu
latu
s0,
000,
000,
000,
000,
000,
000,
000,
000,
000,
200,
000,
000,
00
No
nio
no
ide
s s
pp
.0,
000,
230,
250,
570,
000,
000,
390,
680,
000,
200,
000,
000,
00
Oo
lin
a a
cu
tico
sta
0,00
0,00
0,00
0,00
0,00
0,00
0,00
0,00
0,00
0,00
0,00
0,00
0,27
Oo
lin
a m
elo
0,00
0,00
0,00
0,00
0,00
0,00
0,00
0,00
0,00
0,00
0,00
0,00
0,27
Osan
gu
riella u
mb
on
ifera
(C
us
hm
an
, 1933)
0,00
0,23
0,00
0,00
0,00
0,25
0,00
0,00
0,00
0,00
0,00
0,00
0,00
Pla
nu
lin
a s
pp
.0,
000,
000,
000,
000,
000,
000,
000,
000,
000,
000,
000,
000,
27
Po
lym
orp
hin
ella
sp
.0,
000,
230,
000,
000,
000,
000,
000,
000,
000,
000,
000,
000,
00
Pseu
do
gau
dry
na s
p.
no
v.
0,00
0,46
0,00
0,00
0,00
0,00
0,39
0,00
0,00
0,00
0,21
0,00
0,00
Pseu
do
no
nio
n a
tlan
ticu
m
(Cu
sh
man
, 1936)
0,00
0,00
0,00
0,00
0,00
0,00
0,00
0,00
0,00
0,00
0,00
0,00
0,00
Pu
llen
ia b
ullo
ide
s (
d’O
rbig
ny,
1846)
0,00
0,23
0,00
0,00
0,00
0,00
0,00
0,00
0,00
0,00
0,00
0,00
0,00
Pu
llen
ia o
slo
en
sis
Fe
yli
ng
-Han
ssen
, 1954
0,00
0,00
0,00
0,00
0,00
0,25
0,00
0,34
0,00
0,00
0,21
0,00
0,00
Pu
len
ia q
ua
dri
lob
a0,
190,
000,
000,
000,
000,
000,
000,
000,
000,
000,
000,
000,
00
Pu
llen
ia q
uin
qu
elo
ba
(R
eu
ss,
1851)
0,00
0,00
0,00
0,00
0,00
0,00
0,00
0,00
0,00
0,00
0,00
0,19
0,00
Pyrg
o d
ep
ressa (
d’
Orb
ign
y,
1826)
0,19
0,00
0,00
0,00
0,00
0,00
0,00
0,00
0,00
0,00
0,00
0,00
0,00
Pyrg
o m
urr
hin
a (
Sch
wag
er,
1866)
0,00
0,00
0,00
0,00
0,00
0,00
0,00
0,00
0,00
0,00
0,00
0,00
0,27
Pyrg
o n
asu
ta C
us
hm
an
, 1935
0,00
0,00
0,00
0,00
0,00
0,25
0,00
0,00
0,00
0,00
0,00
0,00
0,00
Pyrg
o r
ing
en
s (
La
marc
k,
1804)
0,00
0,00
0,00
0,00
0,00
0,00
0,00
0,00
0,00
0,00
0,00
0,00
0,00
Pyrg
o s
p.3
0,00
0,00
0,00
0,00
0,00
0,00
0,00
0,00
0,00
0,00
0,00
0,00
0,00
Pyrg
o s
pp
.0,
190,
230,
250,
290,
300,
250,
000,
000,
000,
000,
000,
000,
00
Qu
inq
ue
loc
ulin
a a
kn
eri
an
a d
’ O
rbig
ny,
1846
0,19
0,00
0,00
0,00
0,00
0,25
0,00
0,00
0,00
0,00
0,00
0,00
0,27
Qu
inq
ue
loc
ulin
a a
tlan
tica
0,00
0,00
0,75
0,00
0,00
0,00
0,00
0,00
0,00
0,00
0,00
0,19
0,00
Qu
inq
ue
loc
ulin
a lam
arc
kia
na
d´O
rbig
ny,
1839
0,00
0,23
0,25
0,00
0,30
0,25
0,39
0,00
0,00
0,00
0,21
0,00
0,27
Qu
inq
ue
loc
ulin
a s
pp
. 0,
000,
680,
000,
000,
300,
250,
000,
340,
000,
000,
000,
000,
27
Reo
ph
ax
sp
.0,
000,
000,
000,
000,
000,
000,
000,
000,
000,
000,
000,
000,
27
Ro
salin
a g
lob
ula
ris
(d
’ O
rbig
ny,
1826)
0,19
0,23
0,50
0,57
0,00
0,25
0,39
0,00
0,00
0,00
0,00
0,00
2,44
Ro
salin
a s
pp
.0,
000,
000,
000,
000,
000,
000,
000,
000,
000,
000,
000,
190,
00
Ben
thic
fo
ram
inif
era
(%
)
Esti
mate
d a
ge
(yr
cal.
BP
)
Ben
thic
fo
ram
inif
era
taxa

Co
nt.
Ap
pen
dix
5 -
1742
2035
2209
2540
2603
2998
3119
3307
3439
3615
3846
4013
4531
Sara
cen
ari
a s
p.
0,00
0,00
0,00
0,00
0,00
0,00
0,00
0,00
0,00
0,00
0,00
0,19
0,00
Seab
roo
kia
earl
an
di
Wri
gh
t, 1
891
0,74
0,00
1,00
0,29
0,60
0,00
2,33
1,36
0,00
1,20
0,84
1,15
0,27
Sig
mo
ilo
ps
is s
ch
lum
be
rge
ri (
Sil
vestr
i, 1
904)
0,00
0,00
0,00
0,00
0,00
0,00
0,39
0,00
0,00
0,00
0,00
0,19
1,08
Sip
ho
nin
a b
rad
yan
a C
us
hm
an
, 1927
0,00
0,23
0,00
1,43
0,00
0,00
0,00
0,00
0,00
0,20
0,00
0,19
0,27
Sip
ho
textu
llari
a s
p.
0,00
0,00
0,00
0,00
0,00
0,00
0,00
0,00
0,00
0,00
0,00
0,00
0,00
Sp
iro
glu
tin
a s
pp
.0,
190,
000,
000,
000,
001,
010,
000,
340,
000,
000,
210,
190,
27
Sp
iro
ple
cti
ne
lla w
rig
hti
i (S
ilvestr
i, 1
903)
0,00
0,00
0,25
0,00
0,00
0,00
0,00
0,00
0,00
0,00
0,00
0,00
0,00
Sta
info
rth
ia c
om
pla
na
ta (
Eg
ge
r, 1
895)
0,56
0,00
0,25
0,29
0,00
0,00
0,00
0,34
0,00
0,20
0,42
0,76
0,00
Sta
info
rth
ia s
pp
.0,
000,
000,
000,
000,
000,
000,
000,
340,
000,
000,
000,
000,
27
Te
xtu
llari
a p
seu
do
gra
men
0,00
0,00
0,00
0,00
0,00
0,00
0,00
0,00
0,00
0,00
0,00
0,00
0,00
Te
xtu
llari
a s
p.1
0,00
0,00
0,00
0,00
0,00
0,00
0,00
0,00
0,00
0,00
0,00
0,00
0,27
Te
xtu
llari
a s
p.2
0,00
0,23
0,00
0,00
0,00
0,00
0,00
0,00
0,00
0,00
0,00
0,00
0,00
Te
xtu
llari
a s
p.4
0,00
0,00
0,00
0,00
0,00
0,00
0,00
0,00
0,30
0,00
0,00
0,00
0,00
Te
xtu
llari
a s
pp
.0,
000,
000,
250,
000,
000,
000,
390,
340,
000,
200,
000,
001,
08
Tri
loc
ulin
a s
pp
.0,
000,
000,
000,
000,
000,
000,
000,
000,
000,
000,
000,
000,
00
Uvig
eri
na
au
be
rian
a d
’ O
rbig
ny,
1839
0,00
0,00
0,00
0,00
0,00
0,00
0,00
0,00
0,30
0,00
0,00
0,00
0,00
Uvig
eri
na
pere
gri
na
Cu
sh
man
, 1923
0,00
0,46
0,00
0,00
0,00
0,25
0,00
0,34
0,00
0,00
0,00
0,00
0,27
Uvig
eri
na
sp
p.
0,00
0,00
0,00
0,00
0,00
0,00
0,00
0,00
0,00
0,00
0,00
0,00
0,54
tota
l d
en
sit
y (
tests•10 c
c-1
)19
368
1053
619
200
8376
3015
013
930
3109
729
400
1641
578
000
6283
237
656
2214
0
frag
men
ts (
%)
7,62
13,4
49,
759,
173,
8816
,08
11,2
810
,88
10,4
514
,20
10,9
25,
1612
,20
no
t id
en
tifi
ed
(%
)2,
421,
141,
001,
150,
304,
020,
391,
363,
581,
001,
053,
063,
79
E (
%)
4,09
5,01
7,75
4,30
3,28
5,28
5,45
4,08
3,28
2,60
3,36
3,44
10,0
3
I (%
)94
,24
92,9
490
,00
93,1
296
,72
93,9
793
,77
94,9
096
,12
95,4
095
,59
95,0
388
,89
BF
HP
in
de
x (
%)
17,8
422
,55
22,0
018
,91
12,8
424
,87
11,2
813
,27
18,2
19,
2012
,18
19,1
221
,95
BF
AR
in
de
x (
tests
•cm
-2•k
yr-1
)10
3196
259
5168
1125
483
5271
6319
2365
992
6731
2029
979
1814
731
9605
5842
2097
330
8833
317
3525
085
5161
R49
3743
3320
3525
3422
3735
4440
H'
2,55
2,43
2,68
2,47
1,96
2,32
2,09
2,26
2,00
2,13
2,10
2,42
2,63
J'
0,66
0,67
0,71
0,71
0,65
0,65
0,65
0,64
0,65
0,59
0,59
0,64
0,71
Esti
mate
d a
ge
(yr
cal.
BP
)
Ben
thic
fo
ram
inif
era
(%
)
Ben
thic
fo
ram
inif
era
taxa

Co
nt.
Ap
pen
dix
5 -
5028
6025
7083
Am
ph
ico
ryn
a s
pp
.0,
000,
000,
00
An
gu
log
eri
na a
ng
ulo
sa
(W
illi
am
so
n,
1858)
11,2
210
,22
9,07
An
gu
log
eri
na
sp
p.
0,33
1,50
2,55
Asta
co
lus
cre
pid
ulu
s0,
000,
000,
00
Bo
livin
a d
on
iezi
Cu
sh
man
& W
icken
de
n,
1929
0,00
0,00
0,00
Bo
livin
a p
seu
do
plicata
Hero
n-A
llen
& E
arl
an
d,
1930
0,00
0,75
0,00
Bo
livin
a p
ulc
he
lla (
d’O
rbig
ny,
1839)
0,00
0,00
0,00
Bo
livin
a p
ulc
he
lla f
. p
rim
itiv
a C
us
hm
an
, 1930
0,00
0,00
0,00
Bo
livin
a s
kag
err
aken
sis
Qvale
& N
iga
m,
1985
0,00
0,00
0,00
Bo
livin
a s
ub
sp
ine
nsis
Cu
sh
man
, 1922
1,65
0,50
0,57
Bri
zalin
a o
rdin
ari
a (
Ph
leg
er
& P
ark
er,
1952)
0,00
0,00
0,00
Bo
livin
a s
pp
.
0,00
0,00
0,00
Bri
zalin
a s
ub
aen
ari
en
sis
(C
us
hm
an
, 1922)
0,66
0,00
0,85
Bri
zalin
a s
path
ula
ta (
Wil
liam
so
n,
1858)
0,00
0,75
0,28
Bri
zalin
a s
p.1
0,00
0,25
0,00
Bri
zalin
a s
pp
.0,
990,
252,
55
Bu
ccella p
eru
via
na
(d'O
rbig
ny,
1839)
0,00
0,00
0,28
Bu
lim
ina
acu
leata
d´O
rbig
ny,
1826
0,00
0,25
0,00
Bu
lim
ina
elo
ng
ata
d’
Orb
ign
y,
1846
0,00
0,50
0,85
Bu
lim
ina
gib
ba
Fo
rna
sin
i, 1
900
0,33
0,00
0,28
Bu
lim
ina
marg
ina
ta d
’ O
rbib
ny,
1826
8,58
8,98
11,3
3
Bu
lim
ina
mexic
an
a C
us
hm
an
, 1922
0,00
0,00
0,00
Bu
lim
ina
pseu
do
aff
inis
Kle
inp
ell
, 1938
0,99
0,25
1,42
Bu
lim
ina
sp
p.
1,32
1,75
1,42
Ben
thic
fo
ram
inif
era
taxa
Ben
thic
fo
ram
inif
era
(%
)
Esti
mate
d a
ge
(yr
cal.
BP
)

Co
nt.
Ap
pen
dix
5 -
5028
6025
7083
Bu
lim
ine
lla e
leg
an
tissim
a (
d’
Orb
ign
y 1
839)
0,00
0,25
0,00
Can
cri
s a
uri
cu
lus
(F
ich
tel
& M
oll
, 1798)
0,33
0,00
0,00
Can
cri
s s
pp
.0,
000,
000,
00
Cassid
ulin
a c
ari
na
ta (
Sil
vestr
i, 1
896)
0,00
0,50
0,00
Cassid
ulin
a laevig
ata
d’O
rbig
ny,
1826
0,00
0,00
0,00
Cassid
ulin
a s
pp
.0,
000,
500,
28
Cib
icid
es s
pp
.0,
000,
250,
28
Cib
icid
es u
ng
eri
an
us
(d
’ O
rbig
ny,
1846)
0,66
0,50
1,42
Cib
icid
oid
es w
uellers
torf
i (S
ch
wag
er,
1866)
0,00
0,00
0,00
Cib
icid
oid
es s
pp
.0,
330,
500,
57
Cla
vu
lin
a h
um
ilis
Bra
dy,
1884
0,00
0,75
0,28
Cla
vu
lin
a m
ult
icam
era
ta C
ha
pm
an
, 1907
0,00
0,00
0,00
Cla
vu
lin
a s
pp
.0,
000,
000,
28
Cri
bo
elp
hid
ium
in
cert
um
0,66
0,25
0,28
Den
talin
a a
rien
a P
att
ers
on
& P
ett
is,
1986
0,33
0,00
0,00
Den
talin
a s
pp
.0,
000,
000,
00
Dis
co
rbin
ella
sp
p.
0,00
0,00
0,00
Dis
co
rbis
william
so
ni
Ch
ap
man
& P
arr
, 1932
0,00
0,25
0,00
Do
roth
ia g
oe
ssi
(Cu
sh
man
, 1911)
0,00
0,00
0,00
Ep
isto
min
ella
sp
p.
8,91
15,2
16,
80
Evo
lvo
cassid
ulin
a o
rien
talis
(C
us
hm
an
, 1922)
0,00
0,00
0,00
Fis
su
rin
a laevig
ata
Reu
ss,
1850
0,33
0,00
0,00
Fis
su
rin
a lu
cid
a (
Wil
liam
so
n,
1884)
0,00
0,00
0,00
Fis
su
rin
a m
arg
ina
ta (
Mo
nta
gu
, 1803)
0,33
0,00
0,00
Fis
su
rin
a q
ua
dri
co
stu
lata
Sil
vestr
i, 1
902
0,00
0,00
0,00
Fis
su
rin
a s
pp
. 0,
000,
000,
00
Fis
su
rin
a s
tap
hy
lleari
a S
ch
wag
er,
1866
0,66
0,00
0,00
Fa
vu
lin
a h
exag
on
a (
Wil
liam
so
n,
1848)
0,00
0,00
0,00
Ben
thic
fo
ram
inif
era
taxa
Esti
mate
d a
ge
(yr
cal.
BP
)
Ben
thic
fo
ram
inif
era
(%
)

Co
nt.
Ap
pen
dix
5 -
5028
6025
7083
Fa
vu
lin
a m
elo
(d
’ O
rbig
ny,
1839)
0,00
0,00
0,00
Gavelin
op
sis
pra
eg
eri
(H
ero
n-A
llen
& E
arl
an
d,
1913)
0,66
1,25
0,85
Gavelin
op
sis
sp
p.
0,00
0,00
0,28
Glo
bo
cassid
ulin
a s
pp
.3,
963,
991,
98
Glo
bo
cassid
ulin
a s
ub
glo
bo
sa
(B
rad
y,
1881)
30,0
332
,92
24,0
8
Gyro
idin
a a
ltif
orm
is R
.E.
& K
.C.
Ste
wart
, 1930
0,00
0,00
0,00
Gyro
idin
a u
mb
on
ata
(S
ilvestr
i, 1
898)
6,27
3,24
5,10
Gyro
idin
a s
pp
.0,
991,
502,
83
Ho
eg
lun
din
a e
leg
an
s (
d’
Orb
ign
y,
1826)
0,00
0,00
0,00
Isla
nd
iella n
orc
ros
si
(Cu
sh
man
, 1933)
10,5
66,
739,
63
Pro
cero
lag
en
a g
racilis
(W
illi
am
so
n,
1848)
0,00
0,00
0,00
La
gen
a laevis
(M
on
tag
u,
1803)
0,00
0,00
0,00
La
gen
a laevis
, f.
ten
uis
Wil
liam
so
n,
1848
0,00
0,00
0,28
La
gen
a laevis
, f.
typ
ica W
illi
am
so
n,
1848
0,00
0,00
0,00
La
gen
a s
pp
.0,
000,
000,
00
La
gen
a s
tria
ta (
d’O
rbig
ny,
1839)
0,00
0,00
0,28
La
gen
a s
ulc
ata
0,00
0,00
0,00
Le
nti
cu
lin
a s
p.1
0,00
0,00
0,57
Le
nti
cu
lin
a s
pp
.0,
330,
250,
00
Lie
sb
us
ella s
p.
0,00
0,00
0,00
Lo
ba
tula
lo
ba
tula
(W
alk
er
& J
aco
b,
1798)
0,00
0,00
0,57
Melo
nis
ba
rleean
us
(W
illi
am
so
n,
1858)
0,00
0,00
0,00
Melo
nis
sp
p.
0,00
0,00
0,00
Milio
lin
ella s
ub
rotu
nd
a (
Mo
nta
gu
, 1803)
0,00
0,00
0,00
Neo
len
ticu
lin
a v
ari
ab
ilis
(R
eu
ss,
1850)
0,00
0,00
0,00
No
nio
n s
p.
(ju
ven
il)
0,00
0,00
0,00
No
nio
n s
pp
. 0,
000,
000,
28
No
nio
ne
lla
sp
p.
0,00
0,00
0,57
Ben
thic
fo
ram
inif
era
taxa
Esti
mate
d a
ge
(yr
cal.
BP
)
Ben
thic
fo
ram
inif
era
(%
)

Co
nt.
Ap
pen
dix
5 -
5028
6025
7083
No
nio
no
ide
s t
urg
ida
(W
illi
am
so
n,
1858)
0,33
0,00
1,42
No
nio
no
ide
s g
rate
lou
pi
(d’O
rbig
ny,
1826)
0,00
0,00
0,00
No
nio
no
ide
s p
un
ctu
latu
s0,
330,
500,
28
No
nio
no
ide
s s
pp
.0,
330,
000,
28
Oo
lin
a a
cu
tico
sta
0,00
0,00
0,28
Oo
lin
a m
elo
0,00
0,00
0,00
Osan
gu
riella u
mb
on
ifera
(C
us
hm
an
, 1933)
0,66
0,00
0,28
Pla
nu
lin
a s
pp
.0,
000,
250,
28
Po
lym
orp
hin
ella
sp
.0,
000,
000,
00
Pseu
do
gau
dry
na s
p.
no
v.
0,66
0,25
0,28
Pseu
do
no
nio
n a
tlan
ticu
m
(Cu
sh
man
, 1936)
0,00
0,00
0,00
Pu
llen
ia b
ullo
ide
s (
d’O
rbig
ny,
1846)
0,00
0,00
0,00
Pu
llen
ia o
slo
en
sis
Fe
yli
ng
-Han
ssen
, 1954
0,00
0,00
0,00
Pu
len
ia q
ua
dri
lob
a0,
000,
000,
00
Pu
llen
ia q
uin
qu
elo
ba
(R
eu
ss,
1851)
0,00
0,00
0,00
Pyrg
o d
ep
ressa (
d’
Orb
ign
y,
1826)
0,33
0,00
0,00
Pyrg
o m
urr
hin
a (
Sch
wag
er,
1866)
0,00
0,00
0,00
Pyrg
o n
asu
ta C
us
hm
an
, 1935
0,00
0,25
0,00
Pyrg
o r
ing
en
s (
La
marc
k,
1804)
0,00
0,00
0,00
Pyrg
o s
p.3
0,00
0,00
0,00
Pyrg
o s
pp
.0,
000,
000,
00
Qu
inq
ue
loc
ulin
a a
kn
eri
an
a d
’ O
rbig
ny,
1846
0,33
0,50
0,85
Qu
inq
ue
loc
ulin
a a
tlan
tica
0,33
0,00
0,00
Qu
inq
ue
loc
ulin
a lam
arc
kia
na
d´O
rbig
ny,
1839
0,33
0,00
0,00
Qu
inq
ue
loc
ulin
a s
pp
. 0,
000,
000,
28
Reo
ph
ax
sp
.0,
000,
000,
00
Ro
salin
a g
lob
ula
ris
(d
’ O
rbig
ny,
1826)
0,33
1,25
1,42
Ro
salin
a s
pp
.0,
000,
000,
00
Ben
thic
fo
ram
inif
era
taxa
Esti
mate
d a
ge
(yr
cal.
BP
)
Ben
thic
fo
ram
inif
era
(%
)

Co
nt.
Ap
pen
dix
5 -
5028
6025
7083
Sara
cen
ari
a s
p.
0,00
0,00
0,00
Seab
roo
kia
earl
an
di
Wri
gh
t, 1
891
1,98
0,75
2,83
Sig
mo
ilo
ps
is s
ch
lum
be
rge
ri (
Sil
vestr
i, 1
904)
0,00
0,25
0,00
Sip
ho
nin
a b
rad
yan
a C
us
hm
an
, 1927
0,33
0,25
0,00
Sip
ho
textu
llari
a s
p.
0,00
0,00
0,00
Sp
iro
glu
tin
a s
pp
.0,
990,
250,
28
Sp
iro
ple
cti
ne
lla w
rig
hti
i (S
ilvestr
i, 1
903)
0,00
0,00
0,00
Sta
info
rth
ia c
om
pla
na
ta (
Eg
ge
r, 1
895)
0,00
0,00
0,85
Sta
info
rth
ia s
pp
.0,
000,
000,
00
Te
xtu
llari
a p
seu
do
gra
men
0,33
0,00
0,00
Te
xtu
llari
a s
p.1
0,33
0,25
0,28
Te
xtu
llari
a s
p.2
0,00
0,00
0,00
Te
xtu
llari
a s
p.4
0,00
0,00
0,00
Te
xtu
llari
a s
pp
.0,
000,
000,
85
Tri
loc
ulin
a s
pp
.0,
000,
000,
00
Uvig
eri
na
au
be
rian
a d
’ O
rbig
ny,
1839
0,33
0,00
0,00
Uvig
eri
na
pere
gri
na
Cu
sh
man
, 1923
0,33
0,25
0,28
Uvig
eri
na
sp
p.
0,00
0,25
0,00
tota
l d
en
sit
y (
tests•10 c
c-1
)36
360
4170
444
831
frag
men
ts (
%)
9,24
5,74
6,23
no
t id
en
tifi
ed
(%
)1,
320,
501,
42
E (
%)
8,25
8,23
13,8
8
I (%
)89
,11
90,2
783
,57
BF
HP
in
de
x (
%)
15,5
114
,96
22,6
6
BF
AR
in
de
x (
tests
•cm
-2•k
yr-1
)12
1912
811
1480
610
1153
6
R42
4250
H'
2,59
2,46
2,90
J'
0,69
0,66
0,74
Ben
thic
fo
ram
inif
era
taxa
Esti
mate
d a
ge
(yr
cal.
BP
)
Ben
thic
fo
ram
inif
era
(%
)