lupatech registra lucro lÍquido de r$15,4 milhÕes …lupatech.infoinvest.com.br/ptb/1394/lupa3 er...
TRANSCRIPT

1
LUPATECH REGISTRA LUCRO LÍQUIDO DE
R$15,4 MILHÕES EM 2009
Caxias do Sul, 29 de março de 2010 - A Lupatech S.A. (BM&FBovespa: LUPA3) (OTCQX:
LUPAY) (“Lupatech” ou “Companhia”), líder no Mercosul na fabricação de válvulas industriais e
fabricante de equipamentos para o setor de petróleo e gás e de conjuntos para a cadeia
automotiva, anuncia o resultado do quarto trimestre de 2009 (4T09) e do exercício de 2009. As
informações trimestrais e demonstrações financeiras consolidadas anuais da Companhia são
elaboradas de acordo com as normas internacionais de relatório financeiro – IFRS
(International Financial Reporting Standard). As comparações apresentadas, exceto quando
indicado o contrário, referem-se aos números verificados no terceiro trimestre de 2009 (3T09) e
exercício fiscal de 2008.
TELECONFERÊNCIAS PARA APRESENTAÇÃO DOS RESULTADOS DO 4T09
INGLÊS – INVESTIDORES ASIÁTICOS
Data: 30 de março de 2010Horário: 22:30h (Brasília) /09:30h (HKT) do dia 31/03Telefone: +1 412 858 4600Código: Lupatech
PORTUGUÊS
Data: 31 de março de 2010Horário: 10:00h (Brasília) /09:00h (US-ET)Telefone: +55 11 2188-0188Código: Lupatech
INGLÊS
Data: 31 de março de 2010Horário: 12:00h (Brasília) /11:00h (US-ET)Telefone: +1 412 858 4600Código: Lupatech
RELAÇÕES COM INVESTIDORES - CONTATOS
Thiago Alonso de Oliveira - CFO & IROCynthia Burin - Gerente de RI
Telefone: + 55 (11) 2134-7000 ou + 55 (11) 2134-7088Email: [email protected] : www.twitter.com/LUPA3Blog : www.lupatech.com.br/blog
Assessoria de Imprensa: MZ Consult +55 11 3529-3800

2
PRINCIPAIS INDICADORES:
Lupatech S.A. - Dados Consolidados em R$ mil
Indicadores Financeiros 3T09 4T09 Var % 2008 2009 Var %
Receita Líquida 128.230 107.818 -15,9% 704.673 555.162 -21,2%
Energy Products 85.634 66.670 -22,1% 450.934 386.404 -14,3%
Flow Control 29.623 28.034 -5,4% 164.203 117.080 -28,7%
Metalurgia 12.972 13.114 1,1% 89.535 51.678 -42,3%
Lucro Bruto 28.547 22.619 -20,8% 286.637 152.166 -46,9%Margem 22,3% 21,0% 40,7% 27,4%
Energy Products 15.600 11.555 -25,9% 192.956 104.291 -46,0%Margem 18,2% 17,3% 42,8% 27,0%
Flow Control 13.371 11.188 -16,3% 78.055 48.935 -37,3%Margem 45,1% 39,9% 47,5% 41,8%
Metalurgia (425) (124) -70,8% 15.626 (1.059) -106,8%Margem -3,3% -0,9% 17,5% -2,0%
EBITDA 11.606 6.925 -40,3% 209.708 81.572 -61,1%
Margem 9,1% 6,4% 29,8% 14,7%
Energy Products 4.267 1.313 -69,2% 144.667 54.621 -62,2%Margem 5,0% 2,0% 32,1% 14,1%
Flow Control 7.465 7.828 4,9% 55.809 30.332 -45,6%Margem 25,2% 27,9% 34,0% 25,9%
Metalurgia (126) (2.216) 1663,3% 9.232 (3.381) -136,6%Margem -1,0% -16,9% 10,3% -6,5%
Resultado Líquido 33.365 (47.072) -241,1% (29.530) 15.408 -152,2%Margem 26,0% -43,7% -4,2% 2,8%
Indicadores Operacionais 2008 2009 Var %
Capex Orgânico 124.928 54.014 -56,8%
Aquisições de investimentos 76.869 71.282 -7,3%
[O restante dessa página foi deixado intencionalmente em branco]
3
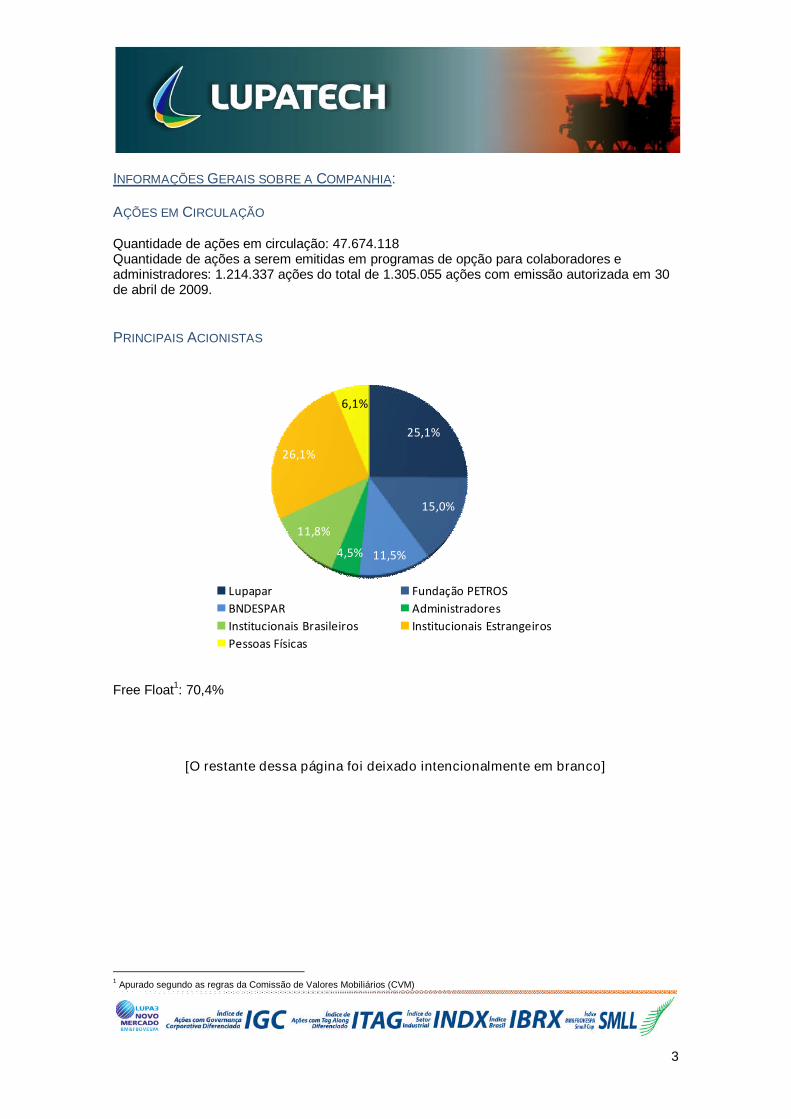
INFORMAÇÕES GERAIS SOBRE A COMPANHIA:
AÇÕES EM CIRCULAÇÃO
Quantidade de ações em circulação: 47.674.118Quantidade de ações a serem emitidas em programas de opção para colaboradores eadministradores: 1.214.337 ações do total de 1.305.055 ações com emissão autorizada em 30de abril de 2009.
PRINCIPAIS ACIONISTAS
Free Float1: 70,4%
[O restante dessa página foi deixado intencionalmente em branco]
1Apurado segundo as regras da Comissão de Valores Mobiliários (CVM)
25,1%
15,0%
11,5%4,5%
11,8%
26,1%
6,1%
Lupapar Fundação PETROS
BNDESPAR Administradores
Institucionais Brasileiros Institucionais Estrangeiros
Pessoas Físicas

4
Prezados Senhores,
A Administração da Lupatech S.A. (“Companhia”) apresenta o Relatório da Administração e asInformações Financeiras Anuais Consolidadas da Companhia referentes ao exercícioencerrado em 31 de dezembro de 2009 (2009).
Recomenda-se a leitura deste material em conjunto com as Notas Explicativas às InformaçõesFinanceiras Anuais Consolidadas.
PERFIL DA COMPANHIA E DESCRIÇÃO DOS NEGÓCIOS
A Lupatech S.A. possui três segmentos de negócios: Energy Products2, Flow Control
3e
Metalurgia4, e conta com aproximadamente 2.971 colaboradores.
O Segmento Energy Products oferece produtos de alto valor agregado e serviços para aindústria de petróleo e gás, como cabos para ancoragem de plataformas em águas profundas,válvulas, equipamentos para exploração de poços, revestimentos de tubos, compressores paraGNV, sensores e serviços, através das marcas “Lupatech MNA”, “Lupatech CSL”, “LupatechTecval”, “Lupatech Oil Tools”, “Lupatech Esferomatic”, “Lupatech Oil & Gas Services”,“Lupatech Tubular Services”, “Lupatech Monitoring Systems”, “Aspro”, “Sinergás” e“Norpatagonica”.
O Segmento Flow Control possui posição de liderança no Mercosul na produção ecomercialização de válvulas industriais, principalmente para as indústrias química,farmacêutica, papel e celulose e construção civil, através das marcas “Lupatech Valmicro”,“Lupatech Mipel”, “ValBol” e “Jefferson”.
O Segmento de Metalurgia ocupa posição de destaque no mercado internacional e éespecializado no desenvolvimento e na produção de peças, partes complexas e subconjuntosdirecionados principalmente para a indústria automotiva mundial através dos processos defundição de precisão e de injeção de aço, onde a Companhia é pioneira na América Latina.Opera ainda na fundição de peças em ligas metálicas com alta resistência a corrosão, voltadaspara os setores de válvulas industriais e bombas, principalmente para aplicações nosprocessos para a indústria de petróleo e gás, através das marcas “Microinox”, “Steelinject” e“Itasa”.
[O restante dessa página foi deixado intencionalmente em branco]
2Antigo Oil & Gas
3Antigo Flow
4Antigo Metal
5
MENSAGEM DA ADMINISTRAÇÃO AOS ACIONISTAS E AGENTES DO MERCADO DE CAPITAIS
Prezados acionistas e agentes do mercado de capitais,
Apresentamos os resultados da Lupatech S.A. para o exercício social de 2009.
O exercício de 2009 foi, sem dúvida, o mais difícil para os negócios da Companhia nos últimosdez anos, quando a demanda por nossos produtos foi fortemente impactada pela crisefinanceira mundial que teve início nos últimos meses de 2008.
Nossos negócios do Segmento Energy Products, voltados essencialmente para o mercadobrasileiro de petróleo e gás, foram impactados negativamente por atrasos na execução deinvestimentos discricionários traçados anteriormente para o setor, decorrentes da forte reduçãona oferta de fontes de financiamento de longo prazo e da queda generalizada do preço dopetróleo. No Segmento Flow Control, de válvulas industriais, também foi sentida retração dosnegócios, principalmente na Argentina. No Segmento Metalurgia, nossos negócios seressentiram da retração na demanda oriunda da cadeia automotiva no hemisfério norte. Aconsequência sentida foi queda da Receita Líquida da Companhia em 21,2% em 2009 quandocomparada a 2008.
Desde 2007 vínhamos num processo de expansão de capacidade de nossas unidadesindustriais, principalmente as voltadas para o Segmento Energy Products e a grande maioriadesses investimentos entrou em operação justamente em 2009. Apesar de operarem ao longodo ano com baixa utilização de capacidade, cerca de 35% do total disponível, acreditamos queessa nova capacidade permitirá a Lupatech atender mais e maiores projetos nos anos a frente,para quando é esperada a retomada da demanda.
No transcorrer do ano as condições macro-econômicas mundiais evoluíram e no encerramentodo exercício começamos a perceber melhoria na demanda. Nosso conforto advêm de diversosprocessos de licitação ou de tomada de preços que participamos através dos segmentosEnergy Products e Flow Control, cujos reflexos serão percebidos ao longo de 2010 e nos anosseguintes.
Durante o ano de 2009 iniciamos diversos projetos que visam melhorar o grau de integração erealização de sinergias nas 15 empresas que foram adquiridas nos últimos anos como parte donosso processo de diversificação de linhas de produtos e serviços. Entendemos que ao longode 2010 os primeiros efeitos positivos dessas medidas serão sentidos, principalmente naredução de custos fixos e de despesas administrativas e gerais. Dentre as principais medidasem curso estão a centralização de atividades industriais e a implantação do Centro de ServiçosCompartilhados Lupatech.
Abaixo destacamos os principais objetivos concluídos ao longo de 2009:
Joint Venture V&M: fornecimento de revestimento para tubos
Joint Venture Cameron: fabricação de compressores recíprocos
Fornecimento de válvulas e cabos de ancoragem para projetos da Petrobras como as
plataforma P-55, P-57 e Capixaba, refinarias como REPLAN, REPAR entre outras; e
Bloco 31 da British Petroleum (em Angola)
Conclusão da expansão das unidades Lupatech MNA, Lupatech Oil Services e
Lupatech Oil Tools.
Implantação do conceito de EVA na gestão dos negócios da Companhia
Nova estrutura de endividamento
6
Redução do capital de giro utilizado nas operações
Mesmo com o ambiente adverso para nossos negócios e após dois anos consecutivos deprejuízos, a Companhia apresentou Lucro Líquido de R$15,4 milhões (R$0,03 por lote de 100ações), evolução de R$44,9 milhões sobre o resultado que apresentamos em 2008.
VISÃO GERAL DOS SEGMENTOS DE NEGÓCIOS
SEGMENTO ENERGY PRODUCTS
O segmento Energy Products, conforme acima mencionado, vem observando importanteretomada dos projetos relacionados a produção de petróleo e gás no Brasil, que beneficiamdiretamente a Lupatech. A Companhia participou desde o final de 2009 de diversas cotaçõesrelacionadas a válvulas, serviços e revestimentos sendo vitoriosa em grande parte delas. Comisso, foi capaz de montar uma carteira de pedidos significativa para os próximos períodos.
A recuperação da demanda por projetos de produção no setor de petróleo e gás no Brasiliniciou-se primeiramente com projetos relacionados a manutenção, reposição e operação(MRO), e com prestação de serviços. Estes contratos caracterizam-se por serem de longoprazo (acima de um ano) e negociados diretamente com os clientes finais (petroleiras),trazendo boa previsibilidade de receita para a Companhia.
A demanda oriunda de novos projetos como plataformas, refinarias, etc., que se caracteriza porcontratos de curto prazo (até um ano) e negociados com EPCistas, começou a apresentarrecuperação, principalmente aqueles voltados para refinarias, sendo que os projetos deplataformas ainda apresentam baixo nível de atividade.
SEGMENTO FLOW CONTROL
O segmento Flow Control tem grande exposição à atividade industrial no Brasil e na Argentina.Com a recuperação econômica de grande parte dos setores da economia no Brasil, estesegmento tem observado não só crescente melhoria na atividade comercial como também nautilização de sua capacidade, o que refletirá em melhores índices operacionais durante oexercício de 2010.
SEGMENTO METALURGIA
O segmento Metalurgia tem grande exposição à cadeia automotiva. Ainda que tenha seobservado melhora no setor automotivo no Brasil, a demanda deste segmento para aCompanhia é direcionada para exportações para Europa e México (mercado americano),mercados onde este setor ainda não se recuperou ou apresentou sinais muito leves derecuperação.
[O restante dessa página foi deixado intencionalmente em branco]

7
ARGENTINA
A Companhia possui negócios na Argentina com exposição aos setores industriais,destacadamente o de petróleo e gás. Ainda que a melhora no cenário mundial tenha impactadotambém a Argentina, o país enfrenta outros problemas de caráter interno que nos leva aesperar que em 2010 o nível de atividade ainda seja modesto, dado a falta de incentivos parainvestimentos no país neste momento. A expectativa é que as unidades presentes naArgentina, com exceção do negócio de compressores de gás que apresentou considerávelrecuperação comercial no encerramento de 2009, devam trabalhar em patamares próximos a60% daqueles registrados no exercício de 2008.
PERSPECTIVAS PARA 2010
O ambiente macro-econômico para 2010 em diversos aspectos apresenta-se mais favorável doque o verificado em 2009, o que permite a Companhia trabalhar com a expectativa decrescimento da Receita Líquida, que deverá situar-se próxima à verificada em 2008.
A distribuição da Receita Líquida ao longo de 2010 terá maior concentração no segundosemestre, marcando a saída de um período de fraca demanda durante o primeiro semestrepara entrar num período mais robusto de demanda para nossos produtos e serviços.
Observamos desde outubro de 2009 recuperação na atividade comercial que já impactou econtinuará por impactar a carteira de pedidos da Companhia, contribuindo para receitasmaiores que as verificadas em 2009.
Eventuais impactos nas margens operacionais para 2010 estão associados aos progressos desinergias e reduções de custos e gastos fixos iniciados ainda em 2009. Entendemos ainda queexiste espaço para ganhos com a alavancagem operacional na medida em que a utilização dacapacidade ocupada cresça.
Em relação às perspectivas para 2011 em diante, a Companhia continua esperando fortecrescimento do setor de petróleo e gás especialmente no Brasil. A grande quantidade decampos de petróleo e gás que foram descobertos, traduzindo-se em reservas que necessitamser desenvolvidas, criarão ambiente extremamente favorável para os negócios da Lupatech.Há também novas reservas a serem exploradas e desenvolvidas assim como novos entrantesno mercado que poderão tornar-se clientes da Companhia.
COMPORTAMENTO DE MERCADO – CONCORRÊNCIA E CONTEÚDO LOCAL
A Companhia acompanha de perto a competição nos mercados onde atua, e onde observamaior atratividade para novos competidores é no mercado brasileiro de equipamentos eserviços para petróleo e gás, que cresce a taxas superiores aos demais mercados em queatua.
O market share dos nossos negócios mantiveram-se estáveis em 2009, ainda que a demandageral tenha caído. Temos observado condições de competição similares a de outros anos namaioria dos nossos negócios, exceto em válvulas, por serem produtos com menor barreiratecnológica e maior número de fornecedores. Embora esse seja o cenário, não percebemosalteração na participação de mercado em válvulas.

8
Para manter nossa posição de mercado, investimos constantemente em tecnologia, novaslinhas de produtos e redesenho de linhas de produtos, nos antecipando a possíveis demandasde mercado e melhor posicionando a Companhia. Temos também buscado oferecer soluçõesaos nossos clientes e não apenas produtos, agregando aos equipamentos que fornecemosserviços de instalação, manutenção e operação, entregando soluções customizadas, criandomais um diferencial competitivo em nossos mercados.
A tendência de crescimento da exigência mínima de Conteúdo Local no mercado brasileiro éuma realidade que promove nosso modelo de negócio. Somos uma Companhia quedesenvolve, produz e comercializa seus produtos e serviços com alto índice de ConteúdoLocal. Temos observado que as novas concessões licitadas pela Agência Nacional de Petróleo(ANP) têm apresentado percentuais mínimos de Conteúdo Local cada vez maiores, o que nosfaz acreditar que estamos bem posicionados para fornecer equipamentos que se adequam àsexigências mínimas de Conteúdo Local da ANP e das empresas produtoras de petróleo e gás,dadas a nossas competências industriais aliadas a capacidade instalada no Brasil.
JOINT VENTURES E PARCERIAS
Com o crescimento esperado para o setor de petróleo e gás no Brasil, tem crescido também ointeresse de outras empresas de entrarem neste mercado. Dado as peculiaridades do mercadobrasileiro e da exigência de Conteúdo Local mínimo, muitas delas tem como alternativa estaentrada através de parcerias estratégicas e joint ventures. A Lupatech é um parceiro naturalpara essas empresas, e temos sido procurados por algumas empresas que gostariam de sealiar à Lupatech para adentrarem no mercado brasileiro, permitindo à Companhia oferecer linhamais ampla de produtos e serviços.
Consideramos estas possíveis joint ventures e parcerias extremamente positivas para aCompanhia, que poderá em alguns casos acelerar o desenvolvimento tecnológico de produtos,acessar melhores fontes de matéria-prima assim como relacionamento comercial com novosclientes e mercados.
CRESCIMENTO DOS INVESTIMENTOS NO SETOR
A Lupatech tem seu posicionamento e estratégia focados no setor de petróleo e gás emdiversos mercados, mas com maior exposição ao mercado brasileiro onde o crescimentohistórico e projetado para os próximos anos vem crescendo a taxas anuais expressivas.Somente a Petrobras pretende investir nos próximos cinco anos entre US$200 bilhões eUS$220 bilhões, sendo que no decorrer de 2010 os investimentos deverão somar R$88,5bilhões.
Existe a expectativa no mercado de que a Petrobras receba uma capitalização. Em nossaavaliação, este movimento é positivo para todos os fornecedores da Petrobras, que terá maiorcapacidade de investimento bem como novas reservas a serem exploradas.
O mercado brasileiro, apesar de concentrado em Petrobras, vem mostrando evolução emtermos de novos entrantes e potenciais clientes para a Lupatech. Temos observado a presençade algumas empresas de petróleo evoluindo no mercado brasileiro, destacadamente a OGX,assim como novos EPCistas, com os quais pretendemos estabelecer relações comerciais.
[O restante dessa página foi deixado intencionalmente em branco]

9
IMPACTO PROCESSO ELEITORAL DE 2010
A Companhia espera que o processo eleitoral de 2010, que definirá o próximo presidente doBrasil, tenha reduzido impacto no mercado brasileiro. Acreditamos que os diversos programasde investimentos em vigor superarão a agenda política.
PROCESSO DE REESTRUTURAÇÃO
A estratégia de crescimento mais recente da Lupatech contempla aquisições, principalmenteno segmento Energy Products e Flow Control. Assim sendo, adquirimos 15 empresas desde2006. Num primeiro momento optamos por incorporar essas empresas à Lupatech semgrandes alterações na gestão e dia-a-dia, de forma a garantir a normal continuidade dosnegócios. Em 2009 aprofundamos o processo de integração desses quinze negóciosadquiridos entre 2006 e 2008 depois da fase inicial de incorporação.
Elaboramos um plano de incorporação destas empresas focando na geração de sinergias.Para isso foram revistas as práticas industriais, comerciais, administrativas, de recursoshumanos, entre outras, buscando eficiência de gestão e redução de custos e despesas fixas.
A conclusão dessa etapa está projetada para o ano de 2010 e deverá representar importantesevoluções em produtividade, eficiência e ganhos de competitividade.
Acreditamos que este é um grande passo para nos tornarmos cada vez mais preparados parao forte crescimento orgânico esperado para o setor de petróleo e gás, buscando cada vez maiscriação de valor para os acionistas.
CAPEX
A Companhia investiu nos últimos três anos cerca de R$250 milhões em expansão orgânica deseus negócios. Ampliamos a capacidade industrial de grande parte de nossos negócios nospreparando para o crescimento esperado para o setor de petróleo e gás, e esperamos que estacapacidade seja totalmente ocupada entre 2012 e 2013. Em 2009 operamos com utilização dacapacidade instalada próxima a 35% (média das unidades fabris) e para 2010 estimamosocupação média ao longo do ano da ordem de 50%.
Para os próximos dois anos não prevemos grandes investimentos de capital dada acapacidade industrial atualmente disponível na Companhia.
[O restante dessa página foi deixado intencionalmente em branco]
10
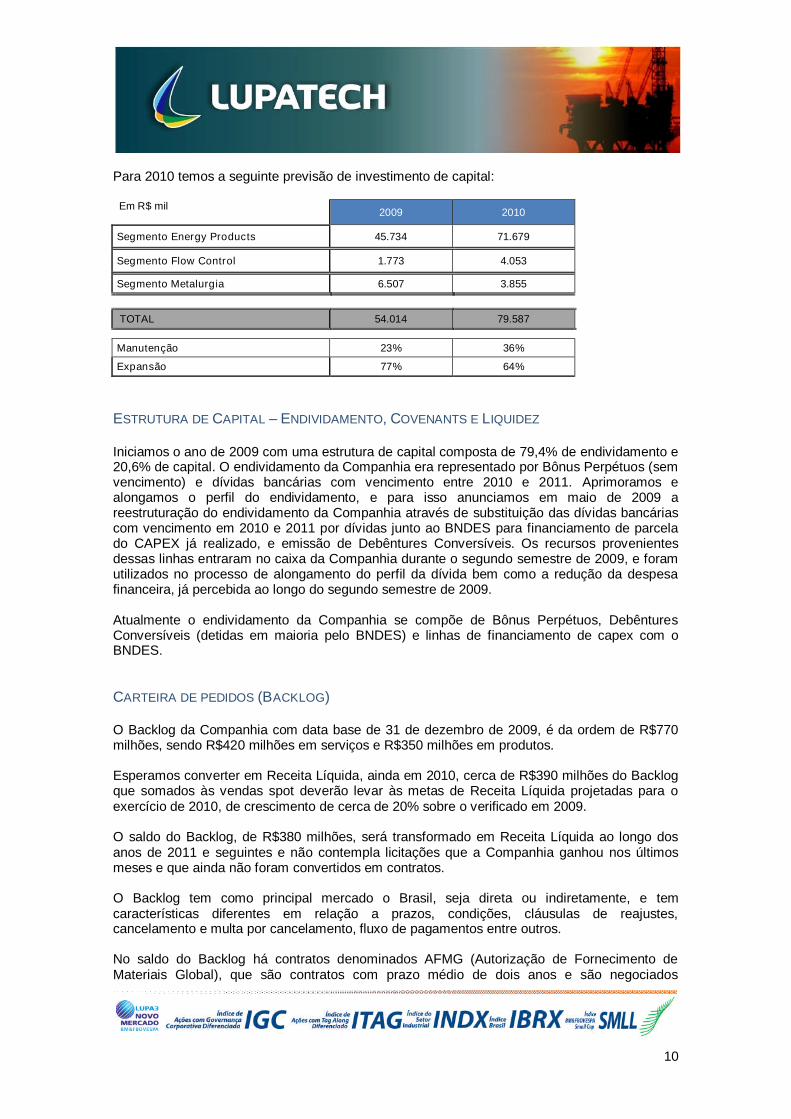
Para 2010 temos a seguinte previsão de investimento de capital:
Em R$ mil2009 2010
Segmento Energy Products 45.734 71.679
Segmento Flow Control 1.773 4.053
Segmento Metalurgia 6.507 3.855
TOTAL 54.014 79.587
Manutenção 23% 36%
Expansão 77% 64%
ESTRUTURA DE CAPITAL – ENDIVIDAMENTO, COVENANTS E LIQUIDEZ
Iniciamos o ano de 2009 com uma estrutura de capital composta de 79,4% de endividamento e20,6% de capital. O endividamento da Companhia era representado por Bônus Perpétuos (semvencimento) e dívidas bancárias com vencimento entre 2010 e 2011. Aprimoramos ealongamos o perfil do endividamento, e para isso anunciamos em maio de 2009 areestruturação do endividamento da Companhia através de substituição das dívidas bancáriascom vencimento em 2010 e 2011 por dívidas junto ao BNDES para financiamento de parcelado CAPEX já realizado, e emissão de Debêntures Conversíveis. Os recursos provenientesdessas linhas entraram no caixa da Companhia durante o segundo semestre de 2009, e foramutilizados no processo de alongamento do perfil da dívida bem como a redução da despesafinanceira, já percebida ao longo do segundo semestre de 2009.
Atualmente o endividamento da Companhia se compõe de Bônus Perpétuos, DebênturesConversíveis (detidas em maioria pelo BNDES) e linhas de financiamento de capex com oBNDES.
CARTEIRA DE PEDIDOS (BACKLOG)
O Backlog da Companhia com data base de 31 de dezembro de 2009, é da ordem de R$770milhões, sendo R$420 milhões em serviços e R$350 milhões em produtos.
Esperamos converter em Receita Líquida, ainda em 2010, cerca de R$390 milhões do Backlogque somados às vendas spot deverão levar às metas de Receita Líquida projetadas para oexercício de 2010, de crescimento de cerca de 20% sobre o verificado em 2009.
O saldo do Backlog, de R$380 milhões, será transformado em Receita Líquida ao longo dosanos de 2011 e seguintes e não contempla licitações que a Companhia ganhou nos últimosmeses e que ainda não foram convertidos em contratos.
O Backlog tem como principal mercado o Brasil, seja direta ou indiretamente, e temcaracterísticas diferentes em relação a prazos, condições, cláusulas de reajustes,cancelamento e multa por cancelamento, fluxo de pagamentos entre outros.
No saldo do Backlog há contratos denominados AFMG (Autorização de Fornecimento deMateriais Global), que são contratos com prazo médio de dois anos e são negociados

11
diretamente com clientes finais, ou seja, sem intermediação de EPCistas (empresas deEngineering, Procurement and Constructing - Engenharia, Compras e Construção).
As AFMGs são direcionadas, principalmente, para manutenção, reposição e operação da infra-estrutura já instalada, onde se determina o preço para os produtos a serem fornecidos, sendoautomaticamente reajustado anualmente refletindo a variação dos custos, destacadamentematérias-primas e mão-de-obra.
[O restante dessa página foi deixado intencionalmente em branco]

12
CONSIDERAÇÕES FINAIS
A Administração deseja reafirmar seu compromisso de longo prazo com clientes, acionistas,credores, colaboradores e com o mercado de capitais.
Os Auditores Independentes, Deloitte Touche Tohmatsu Auditores Independentes (Deloitte),que examinam as demonstrações financeiras desde 2008, prestaram somente serviços àLupatech S.A. relacionados à auditoria das demonstrações financeiras.
Estão disponíveis no site www.lupatech.com.br/ri os comentários sobre o desempenhoconsolidado dos negócios da Companhia.
A Companhia está vinculada à arbitragem na Câmara de Arbitragem do Mercado, conformecláusula compromissória constante do Estatuto Social.
Caxias do Sul, 29 de março de 2010.
Conselho de AdministraçãoNestor PeriniAlcinei Cardoso RodriguesClóvis Benoni MeurerJosé Coutinho BarbosaJosé Mauro Mettrau Carneiro da CunhaJosé Teófilo Abu-JamraMarcelo Cabrera da Costa
Conselheiros SuplentesFabio Sotelino da RochaTeresa Rodriguez Cao
DiretoresNestor PeriniJosé Teófilo Abu-JamraGilberto Pasquale da SilvaThiago Alonso de Oliveira
[O restante dessa página foi deixado intencionalmente em branco]

13
COMENTÁRIOS DA ADMINISTRAÇÃO AO DESEMPENHO ECONÔMICO-FINANCEIRO
CONSOLIDADO – BASE IFRS
RECEITA LÍQUIDA
Receita Líquida (em R$ Mil) 3T09 4T09 Var. % 2008 2009 Var. %
Energy Products 85.634 66.670 -22,1% 450.934 386.404 -14,3%
Energy Products - Mercado Interno 71.725 39.233 -45,3% 339.095 251.096 -26,0%
Energy Products - Mercado Externo 13.909 27.437 97,3% 111.839 135.308 21,0%
Flow Control 29.623 28.034 -5,4% 164.203 117.080 -28,7%
Flow Control - Mercado Interno 28.000 26.488 -5,4% 149.809 108.312 -27,7%
Flow Control - Mercado Externo 1.623 1.546 -4,7% 14.394 8.768 -39,1%
Metalurgia 12.972 13.114 1,1% 89.535 51.678 -42,3%
Metalurgia - Mercado Interno 10.771 10.633 -1,3% 59.216 37.642 -36,4%
Metalurgia - Mercado Externo 2.201 2.481 12,7% 30.319 14.036 -53,7%
Total 128.230 107.818 -15,9% 704.673 555.162 -21,2%
% Energy Products 66,8% 61,8% 64,0% 69,6%
% Energy Products - Mercado Interno 83,8% 58,8% 75,2% 65,0%
% Energy Products - Mercado Externo 16,2% 41,2% 24,8% 35,0%
% Flow Control 23,1% 26,0% 23,3% 21,1%
% Flow Control - Mercado Interno 94,5% 94,5% 91,2% 92,5%
% Flow Control - Mercado Externo 5,5% 5,5% 8,8% 7,5%
% Metalurgia 10,1% 12,2% 12,7% 9,3%
% Metalurgia - Mercado Interno 83,0% 81,1% 66,1% 72,8%
% Metalurgia - Mercado Externo 17,0% 18,9% 33,9% 27,2%
A Receita Líquida Consolidada do exercício de 2009 é 21,2% menor em comparação com oexercício de 2008, atingindo R$555,2 milhões. A queda é atribuída às condiçõesmercadológicas que causaram desaquecimento de demanda em todos os segmentos deatuação da Companhia assim como queda de preços.
A Receita Líquida Consolidada do 4T09 atingiu R$107,8 milhões, 15,9% inferior ao 3T09quando somou R$128,2 milhões. A queda observada durante o 4T09 é consequência da quedade atividade comercial observadas durante o exercício de 2009 que teve seus maioresimpactos neste trimestre.
A Receita Líquida do Segmento Energy Products no exercício de 2009 alcançou R$386,4milhões, queda de 14,3% em comparação ao exercício de 2008 quando atingiu R$450,9milhões. Este segmento foi fortemente afetado pela queda de demanda no setor de petróleo egás, especificamente nos projetos de produção onde a Companhia tem grande exposição, equeda de preços.
A Receita Líquida do Segmento Energy Products no 4T09 alcançou R$66,7 milhões, queda de22,1% em comparação ao 3T09 quando atingiu R$85,6 milhões. Conforme acima mencionado,a queda observada durante o 4T09 é consequência da queda de atividade comercialobservada durante o exercício de 2009 que teve maiores impactos neste trimestre.
A Receita Líquida do Segmento Flow Control no exercício de 2009 alcançou R$117,1 milhões,queda de 28,7% em comparação ao exercício de 2008 quando atingiu R$164,2 milhões. Este
14
segmento foi fortemente afetado pela queda de atividade industrial no Brasil e Argentina, frutoda crise mundial iniciada em 2008, assim como queda de preços.
A Receita Líquida do Segmento Flow Control no 4T09 alcançou R$28,0 milhões, queda de5,4% em comparação ao 3T09 quando atingiu R$29,6 milhões. Esta queda é fruto do mix depedidos com menor valor agregado que foram produzidos nas unidades de válvulas no Brasil.
A Receita Líquida do Segmento Metalurgia no exercício de 2009 alcançou R$51,7 milhões,queda de 42,3% em comparação ao exercício de 2008 quando atingiu R$89,5 milhões. Estesegmento foi fortemente impactado pela crise mundial que afetou diretamente o setorautomobilístico, principalmente nos EUA e Europa, mercados de grande representatividade nofaturamento das unidades deste segmento.
A Receita Líquida do Segmento Metalurgia no 4T09 alcançou R$13,1 milhões, crescimento de1,1% em comparação ao 3T09 quando atingiu R$13,0 milhões. Este crescimento é fruto deleve recuperação nos pedidos relacionados à indústria automotiva no Brasil.
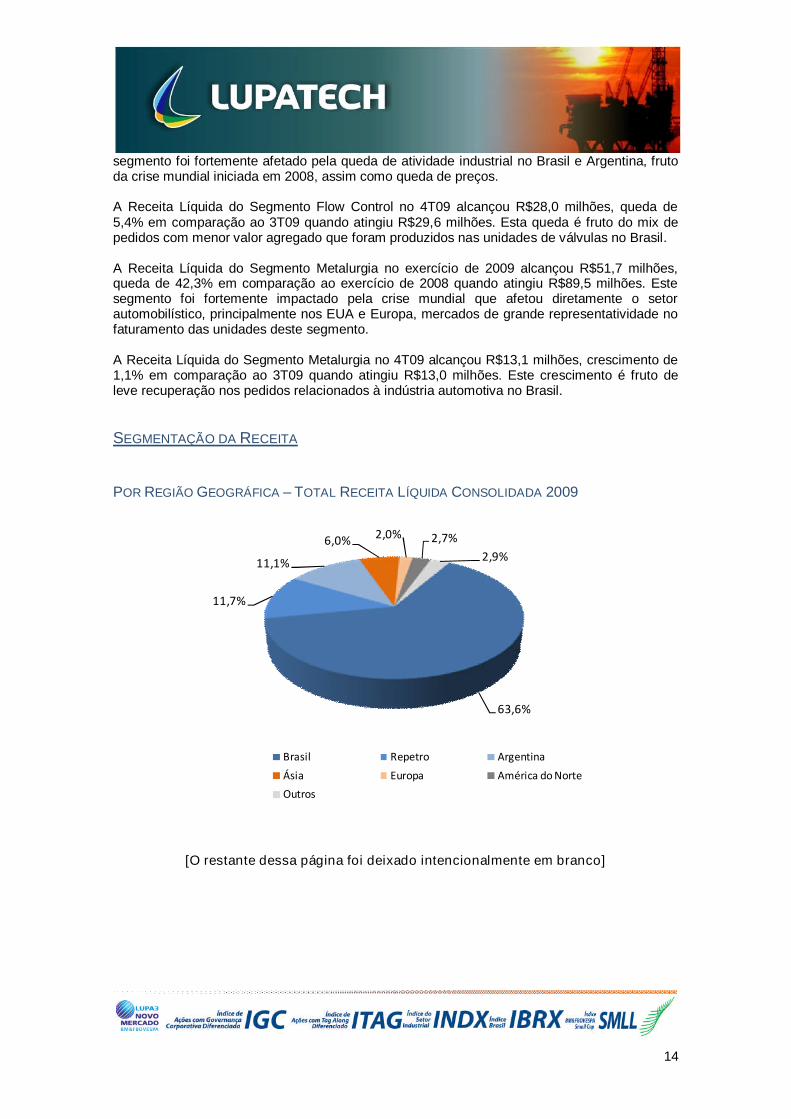
SEGMENTAÇÃO DA RECEITA
POR REGIÃO GEOGRÁFICA – TOTAL RECEITA LÍQUIDA CONSOLIDADA 2009
[O restante dessa página foi deixado intencionalmente em branco]
63,6%
11,7%
11,1%
6,0% 2,0% 2,7%
2,9%
Brasil Repetro Argentina
Ásia Europa América do Norte
Outros
15
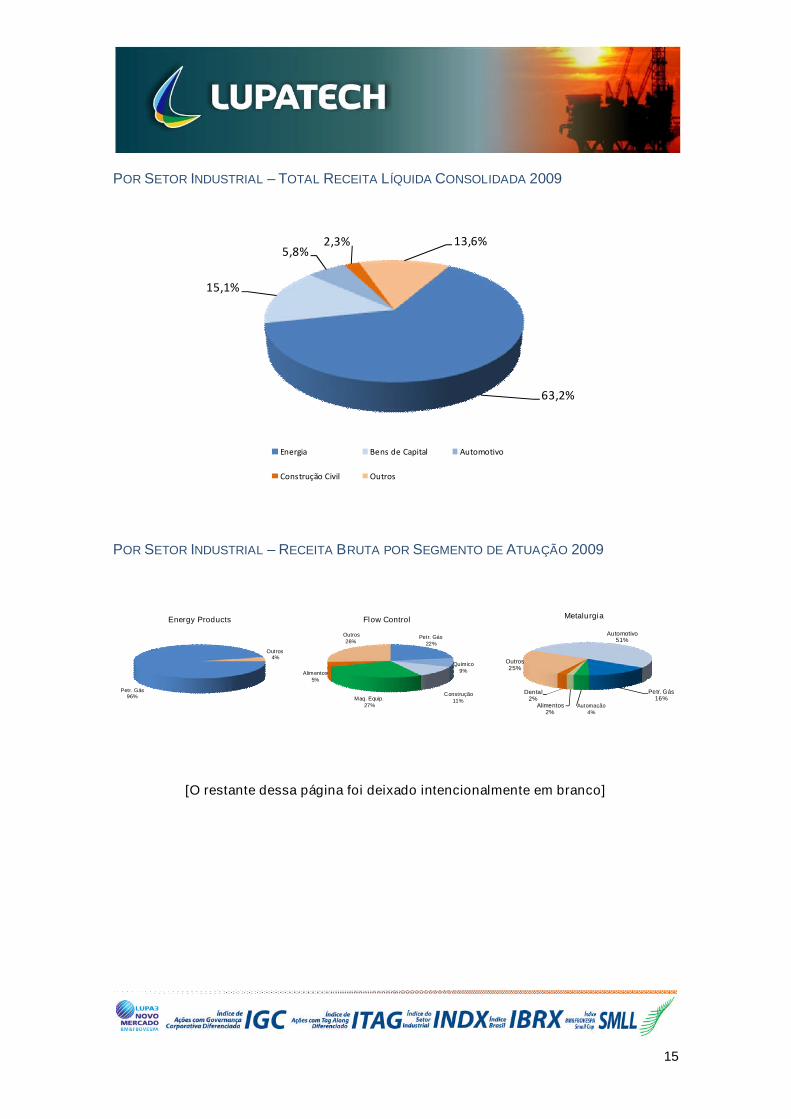
POR SETOR INDUSTRIAL – TOTAL RECEITA LÍQUIDA CONSOLIDADA 2009
POR SETOR INDUSTRIAL – RECEITA BRUTA POR SEGMENTO DE ATUAÇÃO 2009
[O restante dessa página foi deixado intencionalmente em branco]
63,2%
15,1%
5,8%2,3% 13,6%
Energia Bens de Capital Automotivo
Construção Civil Outros
Petr. Gás22%
Químico9%
Construção11%Maq. Equip.
27%
Alimentos5%
Outros26%
Automotivo51%
Petr. Gás16%
Automação4%
Alimentos2%
Dental2%
Outros25%
Petr. Gás96%
Outros4%
Energy Products Flow Control Metalurgia
16
CUSTO DOS PRODUTOS VENDIDOS
CPV (em R$ Mil) 3T09 4T09 Var. % 2008 2009 Var. %
Energy Products 70.034 55.115 -21,3% 257.978 282.113 9,4%
Flow Control 16.252 16.846 3,7% 86.148 68.145 -20,9%
Metalurgia 13.397 13.238 -1,2% 73.909 52.737 -28,6%Total 99.683 85.199 -14,5% 418.036 402.996 -3,6%
% Energy Products 70,3% 64,7% 61,7% 70,0%
% Flow Control 16,3% 19,8% 20,6% 16,9%
% Metalurgia 13,4% 15,5% 17,7% 13,1%
CPV/Receita Líquida Total 77,7% 79,0% 59,3% 72,6%
CPV/Receita Líquida Energy Products 81,8% 82,7% 57,2% 73,0%
CPV/Receita Líquida Flow Control 54,9% 60,1% 52,5% 58,2%
CPV/Receita Líquida Metalurgia 103,3% 100,9% 82,5% 102,0%
O Custo dos Produtos Vendidos (CPV) Consolidado em 2009 atingiu R$403,0 milhões, quedade 3,6% comparado a 2008 quando atingiu R$418,0 milhões.
O CPV Consolidado no 4T09 atingiu R$85,2 milhões, queda de 14,5% comparado ao 3T09quando atingiu R$99,7 milhões. A queda do CPV Consolidado durante o 4T09 é consequênciadireta da queda da Receita Líquida em 15,9% no mesmo período.
O CPV do Segmento Energy Products em 2009 atingiu R$282,1 milhões, crescimento de 9,4%comparado a 2008 quando atingiu R$258,0 milhões. O crescimento do CPV do SegmentoEnergy Products é devido a consolidação de quatro trimestres de CPV das empresasadquiridas em 2008 no exercício de 2009, quando no ano anterior somente parte do CPVdestas empresas foi consolidado no resultado.
O CPV do Segmento Energy Products no 4T09 atingiu R$55,1milhões, queda de 21,3%comparado ao 3T09 quando atingiu R$70,0 milhões. A queda do CPV Consolidado durante o4T09 é consequência direta da queda da Receita Líquida em 22,1% no mesmo período.
O CPV do Segmento Flow Control em 2009 atingiu R$68,1 milhões, queda de 20,9%comparado a 2008 quando atingiu R$86,1 milhões. A queda do CPV do Segmento FlowControl durante 2009 é consequência da queda da Receita Líquida em 28,7% no mesmoperíodo.
O CPV do Segmento Flow Control no 4T09 atingiu R$16,8 milhões, crescimento de 3,7%comparado ao 3T09 quando atingiu R$16,3 milhões. O crescimento do CPV do Segmento FlowControl durante o 4T09 é consequência de maiores custos de inspeção e usinagem atrelados aprojetos especiais entregues no trimestre.
O CPV do Segmento Metalurgia em 2009 atingiu R$52,7 milhões, queda de 28,6% comparadoa 2008 quando atingiu R$73,9 milhões.
O CPV do Segmento Metalurgia no 4T09 atingiu R$13,2 milhões, queda de 1,2% comparadoao 3T09 quando atingiu R$13,4 milhões.
[O restante dessa página foi deixado intencionalmente em branco]

17
ESTRUTURA DE CUSTOS
Abaixo, apresenta-se a evolução da estrutura de custos do 1T09 até o 4T09.
Estrutura de Custos (em %) 1T09 2T09 3T09 4T09
Energy Products
Matéria-Prima 64,5 60,6 52,0 37,5
Mão de Obra 20,1 20,6 25,5 32,5
GGF 9,0 13,8 15,1 21,4
Depreciações 6,4 5,0 7,4 8,6
Flow Control
Matéria-Prima 62,6 66,1 63,5 61,2
Mão de Obra 20,2 18,7 18,8 23,7
GGF 11,4 9,2 12,4 8,9
Depreciações 5,8 6,0 5,3 6,2
Metalurgia
Matéria-Prima 36,5 36,4 39,5 36,9
Mão de Obra 27,6 29,8 30,0 29,5
GGF 15,2 12,4 11,4 14,9
Energia Elétrica 5,7 6,5 5,2 5,9
Depreciações 15,0 14,9 13,9 12,8*GGF: gastos gerais de fabricação (água, luz, etc.)
CPV - PRINCIPAIS COMPONENTES DO TOTAL DE MATÉRIA-PRIMA EM 2009
[O restante dessa página foi deixado intencionalmente em branco]
17,2%
23,0%12,1%
47,7%
Aço inoxidável
Aço carbono
Poliéster
Ceras & Outros
18
LUCRO BRUTO E MARGEM BRUTA
Lucro Bruto (em R$ Mil) 3T09 4T09 Var. % 2008 2009 Var. %
Energy Products 15.600 11.555 -25,9% 192.956 104.291 -46,0%
Margem Bruta - Energy Products 18,2% 17,3% 42,8% 27,0%
Flow Control 13.371 11.188 -16,3% 78.055 48.935 -37,3%
Margem Bruta - Flow Control 45,1% 39,9% 47,5% 41,8%
Metalurgia (425) (124) 70,8% 15.626 (1.059) -106,8%
Margem Bruta - Metalurgia -3,3% -0,9% 17,5% -2,0%
Total 28.547 22.619 -20,8% 286.637 152.166 -46,9%
Margem Bruta Total 22,3% 21,0% 40,7% 27,4%
% Energy Products 54,6% 51,1% 67,3% 68,5%
% Flow Control 46,8% 49,5% 27,2% 32,2%
% Metalurgia -1,5% -0,5% 5,5% -0,7%
O Lucro Bruto Consolidado em 2009 atingiu R$152,2 milhões, queda de 46,9% emcomparação com 2008 quando atingiu R$286,7 milhões, devido a queda da Receita LíquidaConsolidada em 21,2% e menor queda do CPV Consolidado em 3,6%. A queda de margembruta é justificada pela queda nos preços praticados durante o ano de 2009 e de custos fixos.
O Lucro Bruto Consolidado no 4T09 atingiu R$22,6 milhões, queda de 20,8% em comparaçãocom o 3T09 quando atingiu R$28,5 milhões, devido a queda da Receita Líquida Consolidada,em 15,9% e queda do CPV Consolidado em 14,5%.
O Lucro Bruto do Segmento Energy Products em 2009 atingiu R$104,3 milhões, queda de46,0% em comparação com 2008 quando atingiu R$193,0 milhões, devido a queda da ReceitaLíquida, em 14,3% e crescimento do CPV em 9,4%. Observou-se neste segmento, além dequeda de preços, maior nível de custos fixos relacionados às aquisições incorporadas ao finalde 2008 e novos custos fixos oriundos da expansão da capacidade.
O Lucro Bruto do Segmento Energy Products no 4T09 atingiu R$11,6 milhões, queda de 25,9%em comparação ao 3T09 quando atingiu R$15,6 milhões, devido a queda da Receita Líquida,em 22,1% e queda do CPV em 21,3%.
O Lucro Bruto do Segmento Flow Control em 2009 atingiu R$48,9 milhões, queda de 37,3% emcomparação com 2008 quando atingiu R$78,1 milhões, devido a queda da Receita Líquida, em28,7% e queda do CPV em 20,9%.
O Lucro Bruto do Segmento Flow Control no 4T09 atingiu R$11,2 milhões, queda de 16,3% emcomparação ao 3T09 quando atingiu R$13,4 milhões, devido a queda da Receita Líquida em5,4% e crescimento do CPV em 3,7%.
O Lucro Bruto do Segmento Metalurgia em 2009 atingiu o montante negativo de R$1,1 milhão,queda de 106,8% em comparação com 2008 quando atingiu R$15,6 milhões, devido a quedada Receita Líquida em 42,3% e queda do CPV em 28,6%.
O Lucro Bruto do Segmento Metalurgia no 4T09 atingiu o montante negativo de R$0,1 milhão,crescimento de 70,8% em comparação ao 3T09 quando atingiu o montante negativo de R$0,4milhão, devido ao crescimento da Receita Líquida em 1,1% e queda do CPV em 1,2%.

19
DESPESAS
Despesas (em R$ Mil) 3T09 4T09 Var. % 2008 2009 Var. %
Total de Despesas com vendas 11.959 14.859 24,2% 60.993 57.170 -6,3%
Total de Despesas administrativas 14.360 12.056 -16,0% 47.621 51.972 9,1%
Energy Products 16.775 17.396 3,7% 64.764 72.484 11,9%
Despesas com vendas - Energy Products 7.070 9.490 34,2% 36.592 37.822 3,4%
Despesas administrativas - Energy Products 9.705 7.906 -18,5% 28.172 34.662 23,0%
Flow Control 7.099 7.329 3,2% 30.008 27.190 -9,4%
Despesas com vendas - Flow Control 3.676 4.077 10,9% 15.828 14.118 -10,8%
Despesas administrativas - Flow Control 3.423 3.252 -5,0% 14.180 13.072 -7,8%
Metalurgia 2.445 2.190 -10,4% 13.841 9.469 -31,6%
Despesas com vendas - Metalurgia 1.213 1.292 6,5% 8.572 5.230 -39,0%
Despesas administrativas - Metalurgia 1.232 898 -27,1% 5.269 4.239 -19,6%
Total de vendas e administrativas 26.319 26.915 2,3% 108.614 109.142 0,5%
Honorários dos Administradores 678 870 28,3% 1.991 2.750 38,1%
Total Desp. vendas, admin. e honorários 26.997 27.785 2,9% 110.604 111.892 1,2%
% Energy Products 63,7% 64,6% 59,6% 66,4%
% Flow Control 27,0% 27,2% 27,6% 24,9%
% Metalurgia 9,3% 8,1% 12,7% 8,7%
Despesas com vendas/Total Rec. Líquida 9,3% 13,8% 8,7% 10,3%
Despesas administrativas/Total Rec. Líquida 11,2% 11,2% 6,8% 9,4%
Despesas com honorários/Total Rec. Líquida 0,5% 0,8% 0,3% 0,5%
Despesas/Receita Líquida Total 21,1% 25,8% 15,7% 20,2%
Despesas/Receita Líquida Energy Products 19,6% 26,1% 14,4% 18,8%
Despesas/Receita Líquida Flow Control 24,0% 26,1% 18,3% 23,2%
Despesas/Receita Líquida Metalurgia 18,8% 16,7% 15,5% 18,3%
As Despesas Gerais com Vendas, Administrativas e Honorários Consolidadas cresceram 1,2%em 2009 e atingiram R$111,9 milhões, contra R$110,6 milhões em 2008. Essa variaçãodecorre principalmente do crescimento das despesas administrativas em 9,1% atingindoR$52,0 milhões, devido à maior nível de despesas administrativas para dar suporte à novaestrutura industrial oriunda das expansões concluídas ao final de 2008 e durante o ano de2009, assim como a consolidação de quatro trimestres de despesas das empresas adquiridasem 2008 no exercício de 2009, quando no ano anterior somente parte das despesas destasempresas foram consolidadas no resultado.
As Despesas Gerais com Vendas, Administrativas e Honorários Consolidadas cresceram 2,9%no 4T09 e atingiram R$27,8 milhões, contra R$27,0 milhões no 3T09. Ainda que tenha seobservado queda nas Despesas Administrativas Consolidadas no 4T09 em 16,0%, primeirosfrutos do processo de reestruturação, houve crescimento das Despesas com VendasConsolidadas em 24,2%, devido a principalmente custos de frete, aumento de despesas comcomissões e outras despesas comerciais.
As Despesas Gerais com Vendas e Administrativas do Segmento Energy Products cresceram11,9% em 2009 e atingiram R$72,5 milhões, contra R$64,8 milhões em 2008. Este crescimentoé decorrente principalmente do crescimento das Despesas Administrativas deste segmento em23,0%. As expansões que foram efetuadas nas unidades assim como novas unidades que

20
foram construídas neste segmento, resultaram em maior nível de despesas administrativasnecessárias para dar suporte às operações.
As Despesas Gerais com Vendas e Administrativas do Segmento Energy Products cresceram3,7% no 4T09 e atingiram R$17,4 milhões, contra R$16,8 milhões no 3T09. Este crescimento édecorrente principalmente do crescimento das Despesas com Vendas deste segmento em34,2%, devido maiores custos com frete e outras despesas comerciais.
As Despesas Gerais com Vendas e Administrativas do Segmento Flow Control decresceram9,4% em 2009 e atingiram R$27,2 milhões, contra R$30,0 milhões em 2008. Esta queda édecorrente da queda das Despesas com Vendas em 10,8%, fruto de menor atividade comercialno ano, e também queda das Despesas Administrativas em 7,8%.
As Despesas Gerais com Vendas e Administrativas do Segmento Flow Control cresceram 3,2%no 4T09 e atingiram R$7,3 milhões, contra R$7,1 milhões no 3T09. Este crescimento édecorrente principalmente do crescimento das Despesas com Vendas deste segmento em10,9%.
As Despesas Gerais com Vendas e Administrativas do Segmento Metalurgia decresceram31,6% em 2009 e atingiram R$9,5 milhões, contra R$13,8 milhões em 2008. Esta queda édecorrente da queda das Despesas com Vendas em 39,0%, fruto de menor atividade comercialno ano, e também queda das Despesas Administrativas em 19,6%.
As Despesas Gerais com Vendas e Administrativas do Segmento Metalurgia decresceram10,4% no 4T09 e atingiram R$2,2 milhões, contra R$2,4 milhões no 3T09. Esta queda édecorrente da queda das Despesas Administrativas deste segmento em 27,1%.
OUTRAS RECEITAS E DESPESAS OPERACIONAIS E RESULTADO DE EQUIVALÊNCIA EM
OUTRAS COLIGADAS
Receitas e Despesas Operacionais (em R$Mil) 3T09 4T09 Var. % 2008 2009 Var. %
Receitas Operacionais 794 3.859 386,0% 6.088 6.631 8,9%
Despesas Operacionais (2.488) (6.909) 177,7% (13.512) (17.775) 31,6%
Despesas Operacionais (1.758) (6.482) 268,7% (6.540) (10.588) 61,9%
Despesas Operacionais não recorrentes (730) (427) -41,5% (6.970) (7.187) 3,1%
Resultado da Equivalência Patrimonial 217 92 -57,6% 928 749 -19,3%
Total (1.477) (2.958) 100,3% (6.495) (10.394) 60,0%
As Outras Receitas Operacionais somaram R$6,7 milhões em 2009, contra R$6,1 milhões em2008. Estas receitas operacionais são relacionadas à venda de imobilizado, recuperação decontingências e impostos.
As Outras Receitas Operacionais somaram R$3,9 milhões no 4T09, contra R$0,8 milhão no3T09. Estas receitas operacionais são relacionadas a recuperação de contingências eimpostos.
As Outras Despesas Operacionais somaram R$17,8 milhões em 2009 contra R$13,5 milhõesem 2008. Essas despesas são relacionadas a perdas com contingências, baixa de estoqueobsoleto, custo do imobilizado baixado, e outras despesas não recorrentes relacionadasprincipalmente a gastos diferidos apropriados no resultado quando da realização de aquisições,que em 2009 somaram R$7,2 milhões versus R$7,0 milhões em 2008.

21
As Outras Despesas Operacionais somaram R$6,9 milhões no 4T09 contra R$2,5 milhões no3T09. Essas despesas se referem a baixa de estoque obsoleto e custo do imobilizado baixado,assim como despesas não recorrentes no valor de R$0,4 milhão.
O Resultado da Equivalência Patrimonial decresceu 19,3% em 2009 em comparação com2008, atingindo R$0,7 milhão, devido aos resultados das empresas coligadas Aspro Carwal eAspro Serviços (ver Nota Explicativa nº. 08). No 4T09, o Resultado da Equivalência Patrimonialrepresentou R$0,1 milhão versus R$0,2 milhão no 3T09.
As Outras Receitas e Despesas Operacionais verificadas em 2009 alcançaram o valor negativo(despesa) de R$10,4 milhões, contra uma despesa de R$6,5 milhões em 2008, o querepresenta crescimento de 60,0%.
As Outras Receitas e Despesas Operacionais verificadas no 4T09 alcançaram o valor negativo(despesa) de R$3,0 milhões, contra uma despesa de R$1,5 milhão no 3T09, o que representacrescimento de 100,3%.
RESULTADO FINANCEIRO
Resultado Financeiro Líquido (R$ Mil) 2008 2009 Var. %
Receita com Juros 6.562 11.412 73,9%
Outros 1.977 14.978 657,4%
Receita Financeira (excluindo VC*) 8.540 26.390 209,0%
Despesa com Juros 92.498 99.743 7,8%
Derivativos embutidos (debêntures conversíveis) - 11.597 n.a.
Impostos Financeiros 6.373 4.575 -28,2%
Outros 4.992 10.898 118,3%
Despesa Financeira (excluindo VC*) 103.863 126.813 22,1%
Resultado Financeiro Líquido (excluindo VC*) (95.323) (100.423) 5,4%
Receita de Variação Cambial 34.956 162.933 366,1%
Despesa de Variação Cambial (134.151) (65.029) -51,5%
Variação Cambial Líquida (99.195) 97.904 198,7%
Resultado Financeiro Líquido TOTAL (194.518) (2.519) -98,7%
*Variação Cambial
A Receita Financeira (excluindo Variação Cambial) Total da Companhia em 2009 atingiuR$26,4 milhões, 209,0% superior a 2008 quando atingiu R$8,5 milhões. Este crescimento édecorrente de maior receita com juros consequência da aplicação de recursos financeiros noBrasil, que permitiu à companhia acessar melhores taxas de remuneração do que as obtidasem 2008 quando os excedentes de caixa estavam no exterior. A variação também pode serjustificada pela inclusão de receitas financeiras relacionadas ao Ajuste a Valor Presente (AVP)sobre o Contas a Receber.
A Despesa Financeira (excluindo Variação Cambial) Total da Companhia em 2009 cresceu22,1% atingindo o valor de R$126,8 milhões versus R$103,9 milhões em 2008. Ainda que coma reestruturação da dívida mencionada no Relatório da Administração que resultou em menorcusto total de endividamento, o crescimento da Despesa Financeira pode ser justificado pordiversos fatores, entre eles (i) o pagamento de juros sobre o total dos Bônus Perpétuos

22
(US$275 milhões) durante todo o ano de 2009 enquanto 2008 foram pagos juros sobre o totalsomente a partir de junho (até aquela data representavam apenas US$200 milhões); (ii) opagamento de juros relacionados às Debêntures Conversíveis a partir de abril de 2009; e (iii) ainclusão da despesa relacionada a precificação a valor justo de derivativos embutidos naescritura das Debêntures Conversíveis relacionados a cláusula de conversão mandatória ouresgate antecipado (item não caixa).
A Variação Cambial Líquida em 2009 resultou em receita de R$97,9 milhões versus despesade R$99,2 milhões em 2008. Este resultado é justificado pela apreciação da moeda brasileira(Real) perante o Dólar Americano durante o ano de 2009.
Efeito da variação cambial sobre ativos e passivos
A Companhia possui ativos e passivos denominados em moedas estrangeiras, principalmenteo dólar americano, o que pode gerar ganhos ou perdas com flutuações nas taxas de câmbio.
EBITDA AJUSTADO5
EBITDA Ajustado (em R$ Mil) 3T09 4T09 Var. % 2008 2009 Var. %
Energy Products 4.267 1.313 -69,2% 144.667 54.621 -62,2%
Margem EBITDA - Energy Products 5,0% 2,0% 32,1% 14,1%
Flow Control 7.465 7.828 4,9% 55.809 30.332 -45,6%
Margem EBITDA - Flow Control 25,2% 27,9% 34,0% 25,9%
Metalurgia (126) (2.216) 1663,3% 9.232 (3.381) -136,6%
Margem EBITDA - Metalurgia -1,0% -16,9% 10,3% -6,5%
Total EBITDA Ajustado 11.606 6.925 -40,3% 209.708 81.572 -61,1%
Margem EBITDA Total 9,1% 6,4% 29,8% 14,7%
% Energy Products 36,8% 19,0% 69,0% 67,0%
% Flow Control 64,3% 113,0% 26,6% 37,2%
% Metalurgia -1,1% -32,0% 4,4% -4,1%
O EBITDA Ajustado Consolidado recuou 61,1% em 2009 quando comparado a 2008, e atingiuR$81,6 milhões versus R$210,0 milhões em 2008. A Margem EBITDA Consolidada alcançou14,7% em 2009 versus 29,8% em 2009. A expressiva queda da Margem EBITDA Consolidadaé consequência direta da queda do Lucro Bruto em 46,9% e aumento das DespesasAdministrativas em 9,1%, conforme já apresentado.
O EBITDA Ajustado Consolidado decresceu 40,3% no 4T09 quando comparado ao 3T09, eatingiu R$6,9 milhões, versus R$11,6 milhões no 3T09. A Margem EBITDA Consolidadaalcançou 6,4% no 4T09 versus 9,1% no 3T09. A queda da Margem EBITDA Consolidada é
5EBITDA é calculado ajustando o lucro líquido pelo resultado de equivalência patrimonial, participações de empregados, imposto de
renda e contribuição social (e diferimentos), despesas não recorrentes relacionadas às atividades operacionais da Companhia(despesas com aquisições de empresas, gastos com captações de recursos atrelados a aquisições de companhias, etc.), amortizaçãode ágio e a depreciação e amortização. O EBITDA não é uma medida utilizada nas práticas contábeis adotadas no Brasil, nãorepresentando o fluxo de caixa para os períodos apresentados e não deve ser considerado como sendo uma alternativa ao lucro líquidona qualidade de indicador do desempenho operacional ou como uma alternativa ao fluxo de caixa na qualidade de indicador de liquidez.O EBITDA não tem um significado padronizado e a definição de EBITDA da Companhia pode não ser comparável ao EBITDA ouEBITDA ajustado conforme definido por outras Companhias. Ainda que o EBITDA não forneça, de acordo com as práticas contábeisutilizadas no Brasil uma medida do fluxo de caixa operacional, a Administração o utiliza para mensurar seu desempenho operacional.Adicionalmente, a Companhia entende que determinados investidores e analistas financeiros utilizam o EBITDA como indicador dodesempenho operacional de uma Companhia e/ou de seu fluxo de caixa. A reconciliação do EBITDA conforme calculado pelaCompanhia pode ser encontrado no Anexo II deste relatório.

23
consequência direta da queda do Lucro Bruto em 20,8% e aumento das Despesas com Vendasem 24,2%, conforme já apresentado.
O EBITDA Ajustado do Segmento Energy Products decresceu 62,2% em 2009 quandocomparado a 2008, e atingiu R$54,6 milhões versus R$144,7 milhões em 2008. A MargemEBITDA do Segmento Energy Products alcançou 14,1% em 2009 versus 32,1% em 2008. Aexpressiva queda da Margem EBITDA deste segmento é consequência direta da queda doLucro Bruto em 46,0% e aumento das Despesas Administrativas em 23,0%.
O EBITDA Ajustado do Segmento Energy Products decresceu 69,2% no 4T09 quandocomparado ao 3T09, e atingiu R$1,3 milhão versus R$4,3 milhões no 3T09. A Margem EBITDAdo Segmento Energy Products alcançou 2,0% no 4T09 versus 5,0% no 3T09. A queda daMargem EBITDA deste segmento é consequência direta da queda do Lucro Bruto em 25,9% eaumento das Despesas com Vendas em 34,2%.
O EBITDA Ajustado do Segmento Flow Control decresceu 45,6% em 2009 quando comparadoa 2008, e atingiu R$30,3 milhões versus R$55,8 milhões em 2008. A Margem EBITDA doSegmento Flow Control alcançou 25,9% em 2009 versus 34,0% em 2008. A queda da MargemEBITDA deste segmento é consequência direta da queda do Lucro Bruto em 37,3% frente apolíticas de preços mais agressivas praticadas durante o ano.
O EBITDA Ajustado do Segmento Flow Control cresceu 4,9% no 4T09 quando comparado ao3T09, e atingiu R$7,8 milhões versus R$7,5 milhões no 3T09. A Margem EBITDA do SegmentoFlow Control alcançou 27,9% no 4T09 versus 25,2% no 3T09. O crescimento da MargemEBITDA deste segmento é consequência do crescimento da depreciação em 4,4%.
O EBITDA Ajustado do Segmento Metalurgia decresceu 136,6% em 2009 quando comparado a2008, e atingiu o montante negativo de R$3,4 milhões versus o montante positivo de R$9,2milhões em 2008. A Margem EBITDA do Segmento Metalurgia alcançou o percentual negativode 6,5% em 2009 versus 10,3% em 2008. A queda da Margem EBITDA deste segmento éconsequência direta da queda do Lucro Bruto em 106,8%.
O EBITDA Ajustado do Segmento Metalurgia atingiu o montante negativo de R$2,2 milhõesversus o montante negativo de R$0,1 milhão no 3T09. A Margem EBITDA do SegmentoMetalurgia alcançou o valor negativo de 16,9% no 4T09 versus o valor negativo de 1,0% no3T09. A queda da Margem EBITDA deste segmento é consequência direta da queda do LucroBruto em 70,8% e aumento das Despesas com Vendas em 6,5%.
Abaixo se encontra a reconciliação do EBITDA Ajustado por segmento, conforme calculadopela Companhia.
[O restante dessa página foi deixado intencionalmente em branco]
24
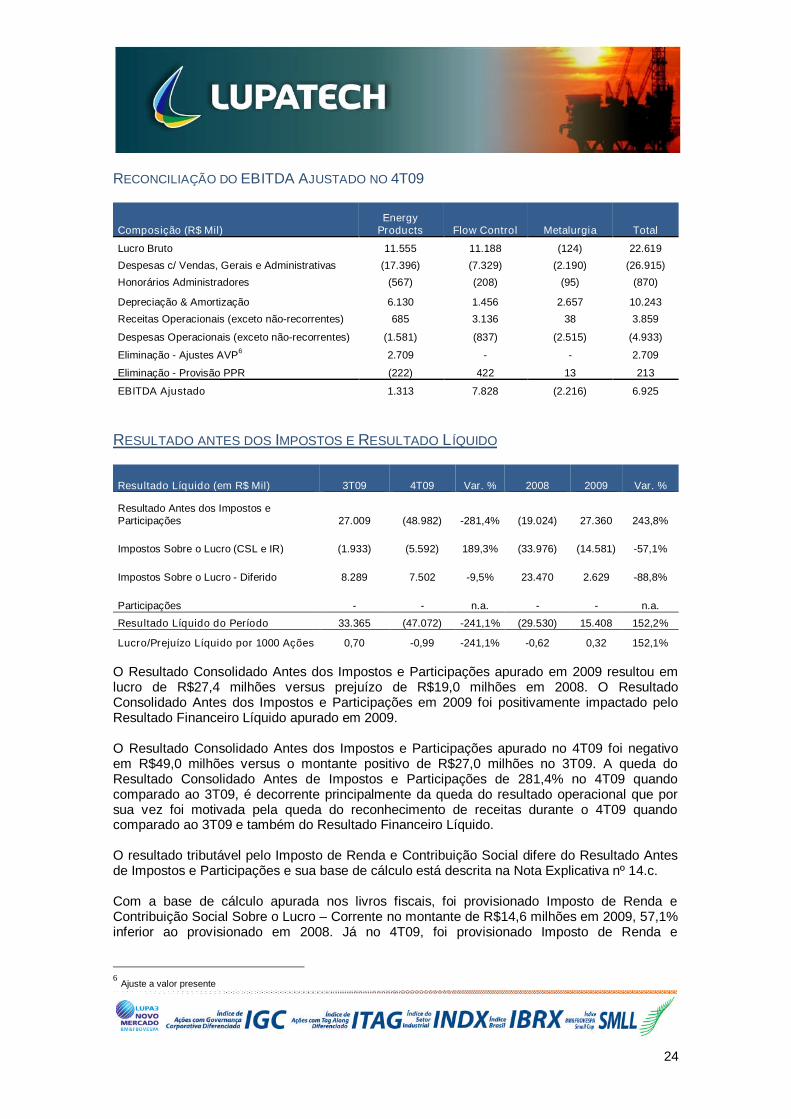
RECONCILIAÇÃO DO EBITDA AJUSTADO NO 4T09
Composição (R$ Mil)Energy
Products Flow Control Metalurgia Total
Lucro Bruto 11.555 11.188 (124) 22.619
Despesas c/ Vendas, Gerais e Administrativas (17.396) (7.329) (2.190) (26.915)
Honorários Administradores (567) (208) (95) (870)
Depreciação & Amortização 6.130 1.456 2.657 10.243
Receitas Operacionais (exceto não-recorrentes) 685 3.136 38 3.859
Despesas Operacionais (exceto não-recorrentes) (1.581) (837) (2.515) (4.933)
Eliminação - Ajustes AVP6
2.709 - - 2.709
Eliminação - Provisão PPR (222) 422 13 213
EBITDA Ajustado 1.313 7.828 (2.216) 6.925
RESULTADO ANTES DOS IMPOSTOS E RESULTADO LÍQUIDO
Resultado Líquido (em R$ Mil) 3T09 4T09 Var. % 2008 2009 Var. %
Resultado Antes dos Impostos eParticipações 27.009 (48.982) -281,4% (19.024) 27.360 243,8%
Impostos Sobre o Lucro (CSL e IR) (1.933) (5.592) 189,3% (33.976) (14.581) -57,1%
Impostos Sobre o Lucro - Diferido 8.289 7.502 -9,5% 23.470 2.629 -88,8%
Participações - - n.a. - - n.a.
Resultado Líquido do Período 33.365 (47.072) -241,1% (29.530) 15.408 152,2%
Lucro/Prejuízo Líquido por 1000 Ações 0,70 -0,99 -241,1% -0,62 0,32 152,1%
O Resultado Consolidado Antes dos Impostos e Participações apurado em 2009 resultou emlucro de R$27,4 milhões versus prejuízo de R$19,0 milhões em 2008. O ResultadoConsolidado Antes dos Impostos e Participações em 2009 foi positivamente impactado peloResultado Financeiro Líquido apurado em 2009.
O Resultado Consolidado Antes dos Impostos e Participações apurado no 4T09 foi negativoem R$49,0 milhões versus o montante positivo de R$27,0 milhões no 3T09. A queda doResultado Consolidado Antes de Impostos e Participações de 281,4% no 4T09 quandocomparado ao 3T09, é decorrente principalmente da queda do resultado operacional que porsua vez foi motivada pela queda do reconhecimento de receitas durante o 4T09 quandocomparado ao 3T09 e também do Resultado Financeiro Líquido.
O resultado tributável pelo Imposto de Renda e Contribuição Social difere do Resultado Antesde Impostos e Participações e sua base de cálculo está descrita na Nota Explicativa nº 14.c.
Com a base de cálculo apurada nos livros fiscais, foi provisionado Imposto de Renda eContribuição Social Sobre o Lucro – Corrente no montante de R$14,6 milhões em 2009, 57,1%inferior ao provisionado em 2008. Já no 4T09, foi provisionado Imposto de Renda e
6Ajuste a valor presente

25
Contribuição Social Sobre o Lucro – Corrente no montante de R$5,6 milhões versus R$1,9milhão no 3T09.
O Lucro Líquido Consolidado de 2009 foi de R$15,4 milhões versus prejuízo de R$29,5 milhõesapurado em 2008. Já no 4T09, o Resultado Líquido Consolidado atingiu prejuízo de R$47,1milhões, versus lucro de R$33,4 milhões no 3T09.
[O restante dessa página foi deixado intencionalmente em branco]

26
COMENTÁRIOS DA ADMINISTRAÇÃO A EVOLUÇÃO DO BALANÇO PATRIMONIAL
Os Comentários da Evolução do Balanço Patrimonial, exceto quando indicado o contrário,referem-se ao exercício de 2009 comparativamente ao exercício de 2008.
CAPITAL DE GIRO OPERACIONAL
Capital de Giro (R$ Mil) 2008 2009 Var. % Variação Nominal
Contas a Receber 264.294 188.116 -28,8% (76.178)
Estoques 195.801 164.015 -16,2% (31.786)
Fornecedores 54.064 35.897 -33,6% (18.167)
Adiantamentos de Clientes 17.564 8.126 -53,7% (9.438)
Capital de Giro Aplicado 388.467 308.108 -20,7% (80.359)
Variação do Capital de Giro Aplicado (80.359)
O saldo das Contas a Receber decresceu R$76,2 milhões em 2009, o que representa 28,8% amenos que o saldo de 2008. A queda do Contas a Receber decorre principalmente de menornível de atividades nos negócios assim como o efetivo recebimento de clientes.
O saldo do Estoque decresceu R$31,8 milhões em 2009, o que representa 16,2% a menos queo saldo de 2008, devido à diminuição dos volumes de compra assim como o efeito da variaçãocambial (R$20,6 milhões) entre o Real e o Peso Argentino que impactou a valorização contábildo saldo de estoque mantido na Argentina.
A conta Fornecedores apresentou queda de R$18,2 milhões em 2009, ou 33,6% sobre o saldode 2008, resultante de menores volumes de compras.
A conta Adiantamentos de Clientes apresentou queda de R$9,4 milhões em 2009, ou queda de53,7% em comparação com 2008. A queda é decorrente de menor atividade comercial emprojetos que trabalham com antecipação dos clientes.
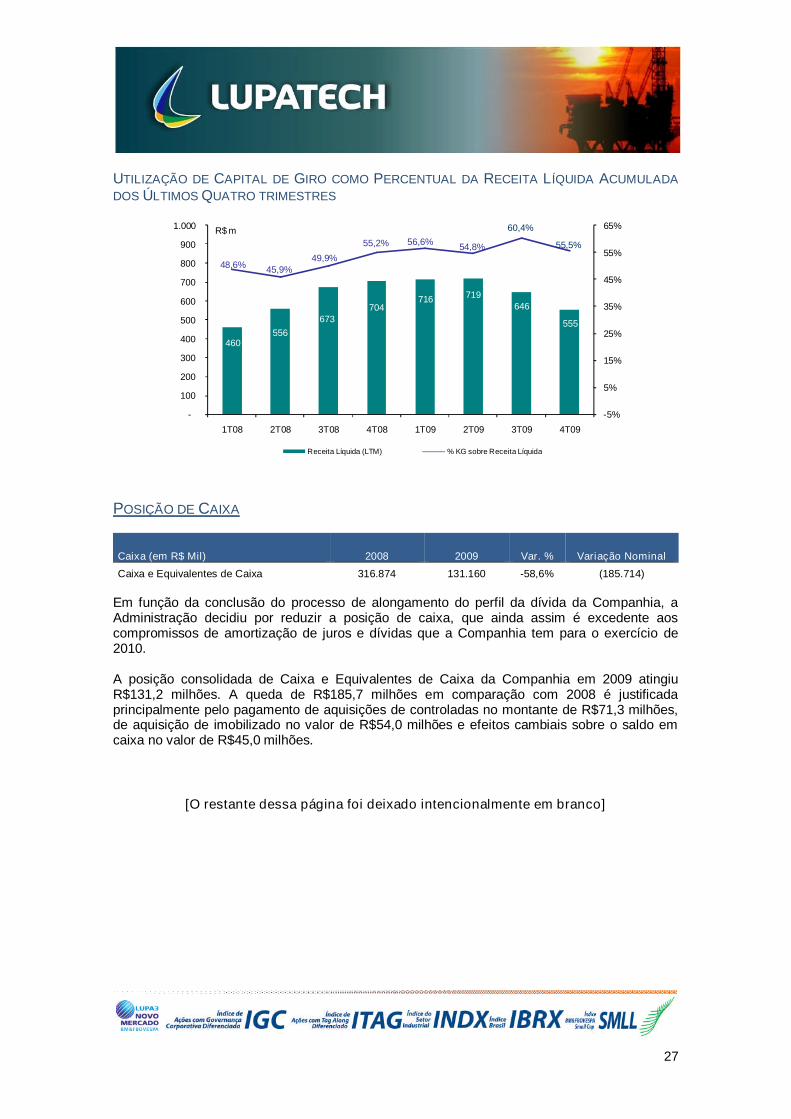
A variação do Capital de Giro Operacional em 2009 resultou em geração de caixa de R$80,4milhões. O índice de Necessidade de Capital de Giro sobre Receita Líquida Consolidada daCompanhia acumulada nos últimos quatro trimestres ficou em 55,5%.
Abaixo encontra-se o gráfico demonstrando a evolução trimestral do uso de capital de girocomo percentual da Receita Líquida Consolidada dos últimos doze meses.
[O restante dessa página foi deixado intencionalmente em branco]
27
UTILIZAÇÃO DE CAPITAL DE GIRO COMO PERCENTUAL DA RECEITA LÍQUIDA ACUMULADA
DOS ÚLTIMOS QUATRO TRIMESTRES
POSIÇÃO DE CAIXA
Caixa (em R$ Mil) 2008 2009 Var. % Variação Nominal
Caixa e Equivalentes de Caixa 316.874 131.160 -58,6% (185.714)
Em função da conclusão do processo de alongamento do perfil da dívida da Companhia, aAdministração decidiu por reduzir a posição de caixa, que ainda assim é excedente aoscompromissos de amortização de juros e dívidas que a Companhia tem para o exercício de2010.
A posição consolidada de Caixa e Equivalentes de Caixa da Companhia em 2009 atingiuR$131,2 milhões. A queda de R$185,7 milhões em comparação com 2008 é justificadaprincipalmente pelo pagamento de aquisições de controladas no montante de R$71,3 milhões,de aquisição de imobilizado no valor de R$54,0 milhões e efeitos cambiais sobre o saldo emcaixa no valor de R$45,0 milhões.
[O restante dessa página foi deixado intencionalmente em branco]
460556
673704
716 719646
555
48,6%45,9%
49,9%
55,2% 56,6%54,8%
60,4%
55,5%
-5%
5%
15%
25%
35%
45%
55%
65%
-
100
200
300
400
500
600
700
800
900
1.000
1T08 2T08 3T08 4T08 1T09 2T09 3T09 4T09
R$ m
Receita Líquida (LTM) % KG sobre Receita Líquida

28
ENDIVIDAMENTO
Endividamento (em R$ Mil) 2008 2009 Var. % Variação Nominal
Curto Prazo 171.727 56.784 -66,9% (114.943)
Longo Prazo 377.978 174.304 -53,9% (203.674)
Debêntures - 340.228 n.a. 340.228
Bônus Perpétuos 634.999 475.023 -25,2% (159.976)
Total do Endividamento 1.184.704 1.046.339 -11,7% (138.365)
Disponibilidades 316.874 131.160 -58,6% (185.714)
Dívida Líquida de Disponibilidades (867.830) (915.179) 5,5% (47.349)
Conforme citado no Relatório da Administração, a Companhia concluiu durante ao fim doexercício de 2009 a reestruturação do perfil de seu endividamento. Esta reestruturação permitiua redução do custo total do endividamento bem como alongamento do prazo médio devencimento, resultando na alteração do saldo total de endividamento, que decresceu 11,7% emcomparação com 2008 atingindo R$1,0 bilhão.
A Dívida Consolidada de Curto Prazo em 2009 atingiu R$56,8 milhões, queda de 66,9%comparada a 2008 decorrente do pagamento de dívidas de curto prazo.
A Dívida de Longo Prazo, que não inclui os Perpetual Bonds e as Debêntures Conversíveis,apresentou queda de 53,9% ou R$203,7 milhões, também decorrente do pré pagamento delinhas de financiamento com vencimentos previstos para 2009 e 2010.
Os recursos utilizados para amortização das linhas de financiamento de curto e longo prazomencionadas acima são oriundos da captação de linhas de crédito junto ao Banco Nacional deDesenvolvimento Econômico e Social (BNDES), sendo R$121 milhões em linhas de repassealocados no longo prazo e R$320 milhões em Debêntures Conversíveis.
O preço de conversão para as Debêntures Conversíveis ainda não foi definido, sendo a datalimite para sua definição o dia 15 de Abril de 2011. Em decorrência da verificação das médiasmóveis, o piso do preço sobre o qual incidirá o prêmio, foi elevado de R$17,50 para R$26,93,reduzindo-se assim o percentual de diluição na hipótese de conversão das DebênturesConversíveis.
O saldo dos Perpetual Bonds em 2009 decresceu 25,2%, atingindo R$475,0 milhões quandocomparado a 2008, consequência da variação cambial verificada no período. A Companhia nãomantém hegde (proteção) para o principal dos Bônus Perpétuos.
Com isso, a Dívida Líquida Consolidada atingiu, no encerramento do exercício de 2009, opatamar de R$915,2 milhões, crescimento de 5,5% contra o exercício de 2008, que decorreessencialmente de redução da posição de caixa.
A Dívida Líquida Consolidada com vencimento (exclui os Bônus Perpétuos), que inclui asDebêntures, alcançou R$571,3 milhões, sendo 59,6% em Debêntures Conversíveis, 9,9% deCurto Prazo e 30,5% de Longo Prazo.
[O restante dessa página foi deixado intencionalmente em branco]
29
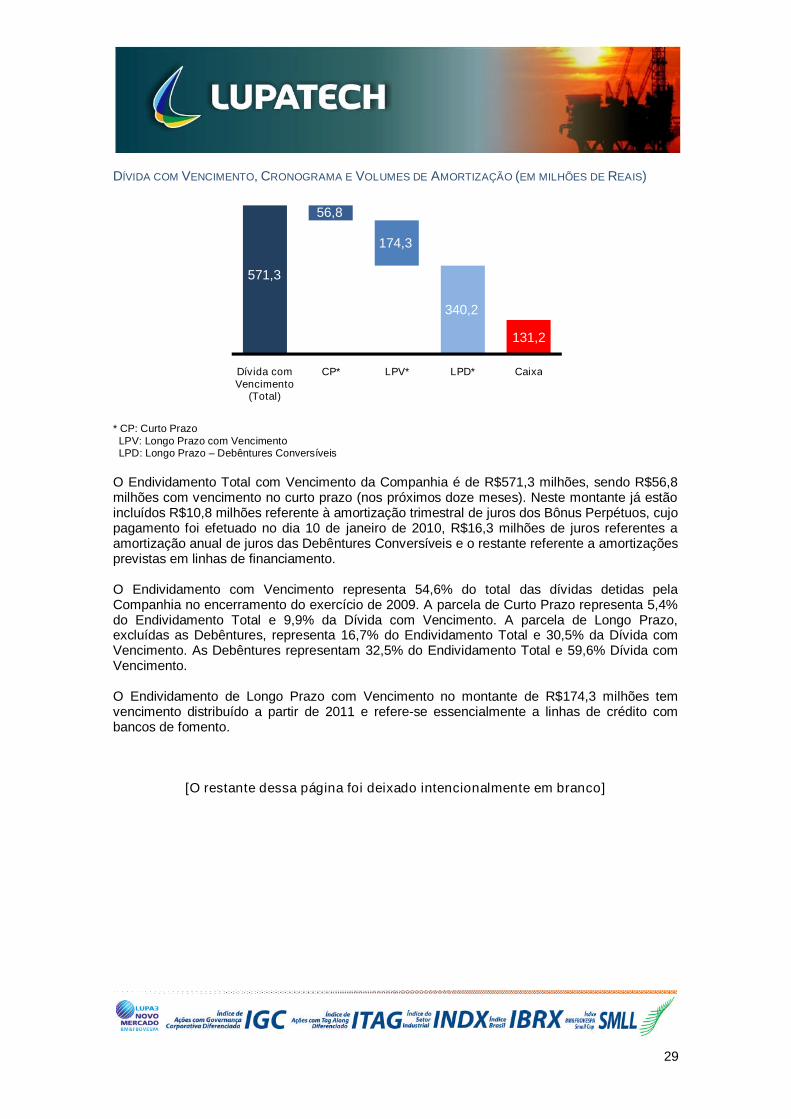
DÍVIDA COM VENCIMENTO, CRONOGRAMA E VOLUMES DE AMORTIZAÇÃO (EM MILHÕES DE REAIS)
* CP: Curto PrazoLPV: Longo Prazo com VencimentoLPD: Longo Prazo – Debêntures Conversíveis
O Endividamento Total com Vencimento da Companhia é de R$571,3 milhões, sendo R$56,8milhões com vencimento no curto prazo (nos próximos doze meses). Neste montante já estãoincluídos R$10,8 milhões referente à amortização trimestral de juros dos Bônus Perpétuos, cujopagamento foi efetuado no dia 10 de janeiro de 2010, R$16,3 milhões de juros referentes aamortização anual de juros das Debêntures Conversíveis e o restante referente a amortizaçõesprevistas em linhas de financiamento.
O Endividamento com Vencimento representa 54,6% do total das dívidas detidas pelaCompanhia no encerramento do exercício de 2009. A parcela de Curto Prazo representa 5,4%do Endividamento Total e 9,9% da Dívida com Vencimento. A parcela de Longo Prazo,excluídas as Debêntures, representa 16,7% do Endividamento Total e 30,5% da Dívida comVencimento. As Debêntures representam 32,5% do Endividamento Total e 59,6% Dívida comVencimento.
O Endividamento de Longo Prazo com Vencimento no montante de R$174,3 milhões temvencimento distribuído a partir de 2011 e refere-se essencialmente a linhas de crédito combancos de fomento.
[O restante dessa página foi deixado intencionalmente em branco]
571,3
56,8
174,3
340,2
131,2
Dívida comVencimento
(Total)
CP* LPV* LPD* Caixa

30
ESTRUTURA DE CAPITAL
As dívidas da Companhia têm vencimento de longo prazo, exceto por uma parcela de 5,4% dototal do endividamento ou 4,3% da estrutura de capital, que vence nos próximos doze meses.Nesse montante já se incluem os juros devidos pelas linhas de longo prazo.
Considerando a parcela dos Perpetual Bonds (fonte estável de financiamento para aCompanhia) no Patrimônio Líquido, observa-se a dívida (com vencimento) representando42,9% do capital empregado na Companhia.
No gráfico acima é possível notar a evolução da estrutura de capital e perfil de endividamentoda Companhia de 2008 para 2009. As dívidas de curto prazo que representavam 11,5% daestrutura de capital em 2008, no encerramento de 2009 representavam apenas 4,3%. Asdívidas de longo prazo que representavam 25,3%, passaram a representar 13,1%. Os BônusPerpétuos, que representavam 42,6% ao final de 2008, em 2009 representaram 35,6% daestrutura de capital da Lupatech.
INVESTIMENTOS (ATIVO PERMANENTE)
Investimentos (em R$ Mil) 2008 2009 Var. % Variação Nominal
Investimentos em Coligadas 2.435 2.386 -2,0% (49)
Imobilizado Líquido 307.156 317.960 3,5% 10.804
Intangível 503.674 506.670 0,6% 2.996
Total 813.265 827.016 1,7% 13.751
Os Investimentos Totais da Companhia em 2009 cresceram 1,7%, atingindo R$827,0 milhõesversus R$813,3 milhões em 2008, devido principalmente a investimentos em compras deimobilizado.
[O restante dessa página foi deixado intencionalmente em branco]
Debêntures25,5%
LP 25,3%
LP 13,1%
CP 11,5%
CP 4,3%
2008 2009
BônusPerpétuos
42,6% Dívida36,8%
Capital20,6%
BônusPerpétuos
35,6%
Capital21,5%
Dívida42,9%
ESTRUTURA DE CAPITAL2008
DÍVIDA COM VENCIMENTO COMOPERCENTUAL DA ESTRUTURA DE
CAPITAL TOTAL
ESTRUTURA DE CAPITAL2009

31
ANEXO I – DEMONSTRAÇÕES DE RESULTADOS (EM R$ MIL)
ANEXO II – RECONCILIAÇÃO DO EBITDA AJUSTADO7 (EM R$ MIL)
[O restante dessa página foi deixado intencionalmente em branco]
7Reconciliado partindo-se do Lucro Líquido Consolidado da Companhia.
Demonstrações do Resultado Consolidado 2009 2008 % Variação
Receita Bruta Vendas e Serviços 627.374 777.721 -19%
Impostos e Deduções da Receita Bruta (72.212) (73.048) -1%
Receita Líquida de Vendas e Serviços 555.162 704.673 -21%
Custo de Bens e Serviços Vendidos (402.996) (418.036) -4%
Resultado Bruto 152.166 286.637 -47%
Receitas/Despesas Operacionais (124.806) (305.661) -59%
Com Vendas (57.170) (60.993) -6%
Gerais e Administrativas (54.722) (49.612) 10%
Resultado Financeiro Líquido (2.519) (194.518) -99%
Receitas Financeiras 189.323 43.495 335%
Despesas Financeiras (191.842) (238.013) -19%
Outras Receitas Operacionais 6.631 6.088 9%
Deságio Aquisição de Investimentos - 5.958 -100%
Outras Despesas Operacionais (17.775) (13.512) 32%
Resultado da Equivalência Patrimonial 749 928 -19%
Resultado Operacional 27.360 (19.024) -244%
Resultados Antes dos Impostos e Participações 27.360 (19.024) -244%
Provisão para IR e Contribuição Social (14.581) (33.976) -57%
IR Diferido 2.629 23.470 -89%
Participação Minoritária - - n.a.
Resultado Líquido do Período 15.408 (29.530) 152%
Reconciliação do EBITDA Ajustado 2009 2008 % Variação
EBITDA Ajustado 81.572 209.708 -61%
Depreciação e Amortização (36.227) (23.607) 53%
Deságio realizado 0 5.958 n.a.
Despesas operacionais não recorrentes (7.187) (6.970) 3%
Despesas operacionais* (8.006) (2.265) 253%
Resultado Financeiro Líquido (2.519) (194.518) -99%
Imposto de Renda e Contribuição Social (14.581) (33.976) -57%
Imposto de Renda e CS - Diferidos 2.629 23.470 140%
Verbas trabalhistas (1.021) (8.258) -88%
Resultado da Equivalência Patrimonial 749 928 -19%Lucro Líquido 15.408 (29.530) 152%
*Despesas Não-Caixa referente ao Programa de Opções de Ações (stock option) e Ajuste a Valor Presente

32
ANEXO III – BALANÇO PATRIMONIAL (EM R$ MIL)
[O restante dessa página foi deixado intencionalmente em branco]
Balanço Patrimonial Consolidado (R$ mil) 2009 2008 % Variação
Ativo Total 1.477.442 1.729.699 -15%
Ativo Circulante 554.419 836.153 -34%
Disponibilidades 131.160 316.874 -59%
Caixa 131.160 316.874 -59%
Créditos 230.194 313.874 -27%
Clientes 184.659 262.062 -30%
Créditos Diversos 45.535 51.812 -12%
Impostos a Recuperar 45.535 51.812 -12%
Estoques 164.015 195.801 -16%
Outros 29.050 9.604 202%
Ativo Não Circulante 923.023 893.546 3%
Créditos Diversos 90.811 57.601 58%
Depósitos Judiciais 1214 5988 -80%
Clientes 3.457 2.232 55%
Impostos a Recuperar 23.432 10.544 122%
Imposto de Renda e Contribuição Social Diferido 62.708 38.837 61%
Outros 5.196 22.680 -77%
Investimentos 2.386 2.435 -2%
Imobilizado 317.960 307.156 4%
Intangível 506.670 503.674 1%
Passivo Total 1.477.442 1.729.699 -15%
Passivo Circulante 150.572 381.727 -61%
Empréstimos e Financiamentos 29.711 157.814 -81%
Juros Bônus Perpétuos 10.760 13.913 -23%
Juros de Debêntures 16.313 - n.a.
Fornecedores 35.897 54.064 -34%
Impostos, Taxas e Contribuições 17.648 28.152 -37%
Dividendos a Pagar - - n.a.
Provisões 8.782 8.614 2%
Dívidas com Pessoas Ligadas - - n.a.
Outros 31.461 119.170 -74%
Contas a pagar c/ Aquis. de Investimentos 2.240 78.620 n.a.
Salários a Pagar 5.398 4.979 8%
Adiantamento de Clientes 8.126 17.564 -54%
Participações no resultado 930 7.132 -87%
Outros 14.767 10.875 36%
Passivo Não Circulante 1.039.610 1.041.346 0%
Empréstimos e Financiamentos 174.304 377.978 -54%
Bônus Perpétuos 475.023 634.999 -25%
Debêntures 340.228 - n.a.
Provisões 42.682 27.195 57%
Provisão para Contingência 7.860 13.615 -42%
Imposto de Renda e Contr. Social Diferido 34.822 13.580 156%
Outros 7.373 1.174 528%
Part. De Acionistas Não Controladores - - n.a.
Patrimônio Líquido 287.260 306.626 -6%
Capital Social Realizado 311.525 309.850 1%
Reservas de Reavaliação - - n.a.
Reservas de Capital 11.002 7.516 46%
Reservas de Lucro - - n.a.
Ajustes de Avaliação Patrimonial (30.497) 9.438 -423%
Prejuízos Acumulados (4.770) (20.178) -76%

33
ANEXO IV – FLUXO DE CAIXA (EM R$ MIL)
[O restante dessa página foi deixado intencionalmente em branco]
Fluxo de Caixa Consolidado Findos em: 2009 2008 % Variação
Lucro líquido/prejuízo do período 15.408 (29.530) 255%
Ajustes para conciliar o resultado as disponibilidades geradas pelas atividades operacionais
Depreciação do imobilizado 36.227 23.607 53%
Deságio na aquisição de investimento - (5.958) n.a.
Resultado da Equivalência Patrimonial (749) (928) -19%
Custo na baixa ou alienação de ativo permanente 706 13.162 -95%
Encargos Financeiros e Variação Cambial 11.702 225.416 -95%
Despesas com opções outorgadas 3.486 2.532 38%
Imposto de renda e contribuição social diferido (2.629) (23.470) -89%
Variações nos ativos e passivos 32.574 (157.770) -121%
(Aumento) redução em contas a receber 55.703 (119.922) -146%
(Aumento) redução em estoques 9.415 (45.685) -121%
(Aumento) redução em impostos a recuperar (12.311) (26.784) -54%
(Aumento) redução em outros ativos 751 11.542 -93%
Aumento (redução) em fornecedores (11.988) 571 -2199%
Aumento (redução) em impostos a recolher (6.221) 4.429 -240%
Aumento (redução) em outras contas a pagar (2.775) 18.079 -115%
Disponibilidades líquidas aplicadas nas atividades operacionais 96.725 47.061 106%
Fluxos de caixa das atividades de investimentos
Investimentos (77.876) (105.372) -26%
Aquisição de imobilizado (54.014) (124.928) -57%
Adições ao Intangível (4.589) (6.437) -29%
Recebimento por venda de imobilizado - - n.a.
Títulos e valores mobiliários - conta restrita - (18.844) n.a.
Disponibilidades líquidas aplicadas nas atividades de investimento (136.479) (255.581) -47%
Fluxos de caixa das atividades de financiamentos
Captação de empréstimos e financiamentos 136.760 332.267 -59%
Captação de debêntures 328.631 - n.a.
Captação de Bônus Perpétuos - 118.900 n.a.
Integralização de capital 1.675 2.339 -28%
Pagamento de empréstimos e financiamentos (567.978) (224.813) 153%
Efeitos das oscilações de câmbio sobre o caixa e equivalentes de caixa (45.048) 58.385 -177%
de controladas no exterior
Disponibilidades líquidas geradas (aplicadas) nas atividades de financiamento (100.912) 228.693 -144%
Aumento (redução) nas disponibilidades (185.714) 78.558 -336%
No início do exercício 316.874 238.316 33%
No final do exercício 131.160 316.874 -59%
34
CONTATOS – RELAÇÕES COM INVESTIDORES
Thiago Alonso de Oliveira Cynthia BurinCFO & IRO Gerente de RI
Telefone: + 55 (11) 2134-7000 ou + 55 (11) 2134-7088Email: [email protected]
SOBRE A LUPATECH
A Lupatech S.A. possui três segmentos de negócios: Energy Products, Flow Control eMetalurgia. No Segmento Energy Products oferece produtos de alto valor agregado eserviços para a indústria de petróleo e gás, como cabos para ancoragem de plataformas emáguas profundas, válvulas, equipamentos para exploração de poços, revestimentos de tubos,compressores para GNV, sensores e serviços, através das marcas “Lupatech MNA”, “LupatechCSL”, “Lupatech Tecval”, “Lupatech Oil Tools”, “Lupatech Esferomatic”, “Lupatech Oil & GasServices”, “Lupatech Tubular Services”, “Lupatech Monitoring Systems”, “Aspro”, “Sinergás” e“Norpatagonica”. No Segmento Flow Control possui posição de liderança no Mercosul naprodução e comercialização de válvulas industriais, principalmente para as indústrias química,farmacêutica, papel e celulose e construção civil, através das marcas “Lupatech Valmicro”,“Lupatech Mipel”, “ValBol” e “Jefferson”. No Segmento de Metalurgia ocupa posição dedestaque no mercado internacional e especializa-se no desenvolvimento e na produção depeças, partes complexas e subconjuntos direcionados principalmente para a indústriaautomotiva mundial através dos processos de fundição de precisão e de injeção de aço, onde éa pioneira na América Latina. Opera, ainda, na fundição de peças em ligas metálicas com altaresistência a corrosão, voltadas para os setores de válvulas industriais e bombas,principalmente para aplicações nos processos para a indústria de petróleo e gás, através dasmarcas “Microinox”, “Steelinject” e “Itasa”.
A Companhia não faz declarações sobre eventos futuros que estão sujeitas a riscos e incertezas. Tais declarações têm como base estimativas e suposiçõesda Administração e informações a que a Companhia atualmente tem acesso. Declarações sobre eventos futuros incluem informações sobre suas intenções,estimattivas ou expectativas atuais, assim como aquelas dos membros do Conselho de Administração e Diretores da Companhia. As ressalvas com relação adeclarações e informações acerca do futuro também incluem informações sobre resultados operacionais possíveis ou presumidos, bem como declarações quesão precedidas, seguidas ou que incluem as palavras "acredita", "poderá", "irá", "continua", "espera", "prevê", "pretende", "planeja", "estima" ou expressõessemelhantes. As declarações e informações sobre o futuro não são garantias de desempenho. Elas envolvem riscos, incertezas e suposições porque sereferem a eventos futuros, dependendo, portanto, de circunstâncias que poderão ocorrer ou não. Os resultados futuros e a criação de valor para os acionistaspoderão diferir de maneira significativa daqueles expressos ou estimados pelas declarações com relação ao futuro. Muitos dos fatores que irão determinarestes resultados e valores estão além da capacidade de controle ou previsão da Lupatech

35
LUPATECH’S NET PROFIT REACHES
R$15.4 MILLION IN 2009
Caxias do Sul, March 29, 2010 – Lupatech S.A. (BM&FBovespa: LUPA3) (OTCQX: LUPAY)
(“Lupatech” or “Company”), leading manufacturer of industrial valves in Mercosul and producer
of equipment for the oil and gas sector and parts for the automotive chain, announces its results
for the fourth quarter of 2009 (4Q09) and 2009. The Company’s consolidated annual financial
statements are drawn up in line with the International Financial Reporting Standards (IFRS).
The comparisons, except when otherwise indicated, refers to the third quarter of 2009 (3Q09)
and to the 2008 results.
CONFERENCE CALLS – 4Q09
ENGLISH – ASIAN INVESTORS
Date: March 31, 2010Time: 09:30 am (HKT) / 10:30 p.m. (Brasilia) of 03/30Telephone: +1 412 858 4600Code: Lupatech
PORTUGUESE
Date: March 31, 2010Time: 09:00 a.m. (US-ET) / 10:00 a.m. (Brasilia)Telephone: + 55 11 2188 0188Code: Lupatech
ENGLISH
Date: March 31, 2010Time: 11:00 a.m. (US-ET) / 12:00 p.m. (Brasilia)Telephone: + 1 412 858 4600Code: Lupatech
INVESTOR RELATIONS - CONTACTS
Thiago Alonso de Oliveira - CFO & IROCynthia Burin – IR Manager
Telephone: + 55 (11) 2134-7000 or + 55 (11) 2134-7088Email: [email protected] : www.twitter.com/LupatechSA
Press Relations: MZ Consult +55 11 3529-3800
36
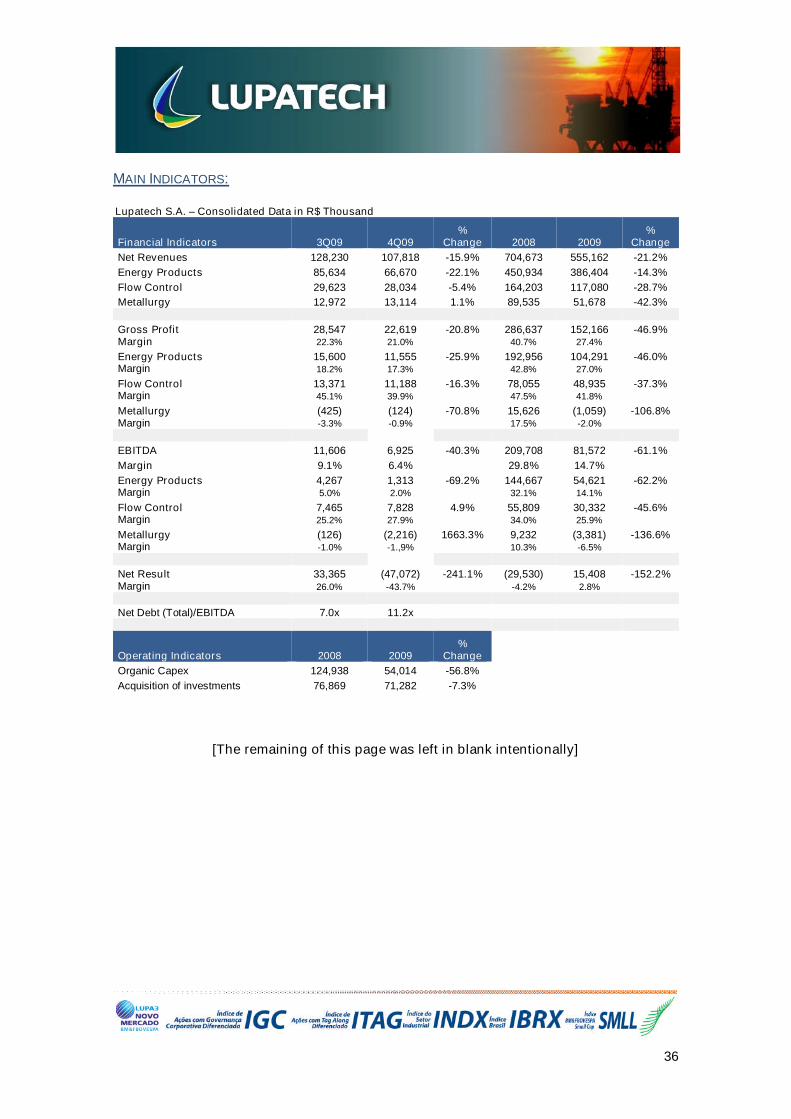
MAIN INDICATORS:
Lupatech S.A. – Consolidated Data in R$ Thousand
Financial Indicators 3Q09 4Q09%
Change 2008 2009%
Change
Net Revenues 128,230 107,818 -15.9% 704,673 555,162 -21.2%
Energy Products 85,634 66,670 -22.1% 450,934 386,404 -14.3%
Flow Control 29,623 28,034 -5.4% 164,203 117,080 -28.7%
Metallurgy 12,972 13,114 1.1% 89,535 51,678 -42.3%
Gross Profit 28,547 22,619 -20.8% 286,637 152,166 -46.9%Margin 22.3% 21.0% 40.7% 27.4%
Energy Products 15,600 11,555 -25.9% 192,956 104,291 -46.0%Margin 18.2% 17.3% 42.8% 27.0%
Flow Control 13,371 11,188 -16.3% 78,055 48,935 -37.3%Margin 45.1% 39.9% 47.5% 41.8%
Metallurgy (425) (124) -70.8% 15,626 (1,059) -106.8%Margin -3.3% -0.9% 17.5% -2.0%
EBITDA 11,606 6,925 -40.3% 209,708 81,572 -61.1%
Margin 9.1% 6.4% 29.8% 14.7%
Energy Products 4,267 1,313 -69.2% 144,667 54,621 -62.2%Margin 5.0% 2.0% 32.1% 14.1%
Flow Control 7,465 7,828 4.9% 55,809 30,332 -45.6%Margin 25.2% 27.9% 34.0% 25.9%
Metallurgy (126) (2,216) 1663.3% 9,232 (3,381) -136.6%Margin -1.0% -1.,9% 10.3% -6.5%
Net Result 33,365 (47,072) -241.1% (29,530) 15,408 -152.2%Margin 26.0% -43.7% -4.2% 2.8%
Net Debt (Total)/EBITDA 7.0x 11.2x
Operating Indicators 2008 2009%
Change
Organic Capex 124,938 54,014 -56.8%
Acquisition of investments 76,869 71,282 -7.3%
[The remaining of this page was left in blank intentionally]

37
38
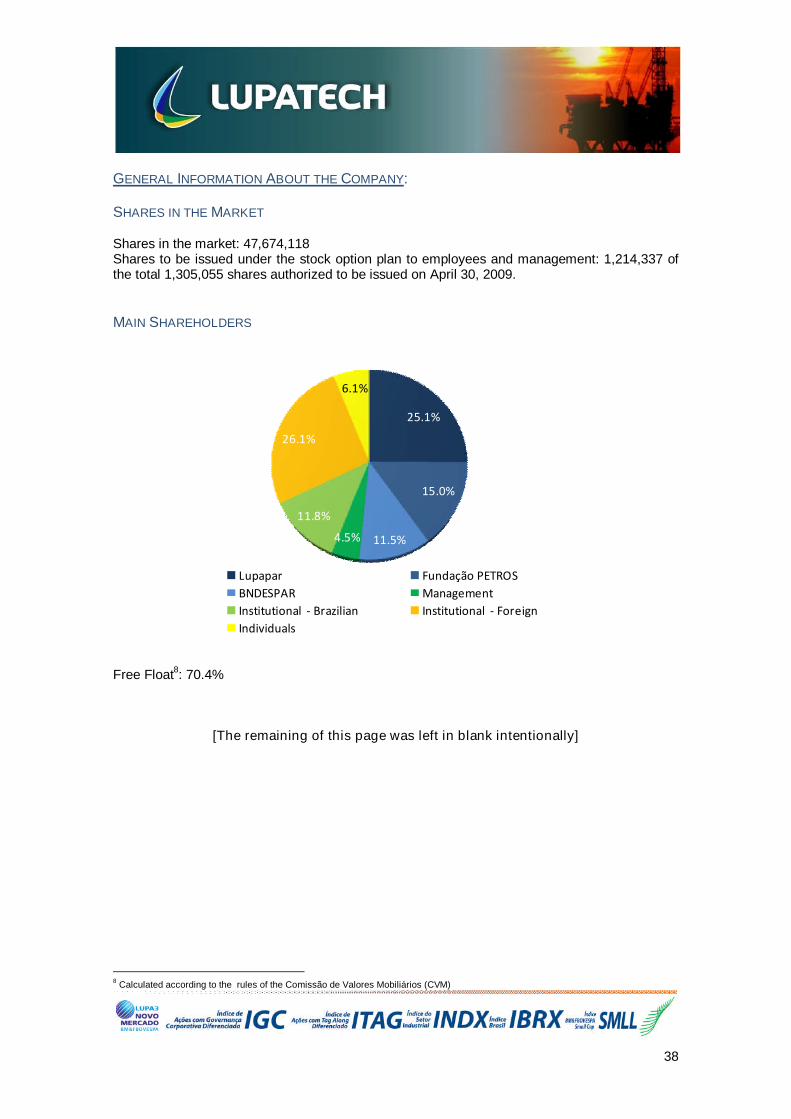
GENERAL INFORMATION ABOUT THE COMPANY:
SHARES IN THE MARKET
Shares in the market: 47,674,118Shares to be issued under the stock option plan to employees and management: 1,214,337 ofthe total 1,305,055 shares authorized to be issued on April 30, 2009.
MAIN SHAREHOLDERS
Free Float8: 70.4%
[The remaining of this page was left in blank intentionally]
8Calculated according to the rules of the Comissão de Valores Mobiliários (CVM)
25.1%
15.0%
11.5%4.5%
11.8%
26.1%
6.1%
Lupapar Fundação PETROS
BNDESPAR Management
Institutional - Brazilian Institutional - Foreign
Individuals

39
Dear Sirs,
Lupatech S.A. (“Company”) presents the Management Report and the Company’s ConsolidatedAnnual Financial Statements for the fiscal year ended on December 31, 2009 for yourappreciation.
It is recommended to read this material together with the Notes to the Consolidated FinancialStatements.
COMPANY AND BUSINESS PROFILE
Lupatech S.A. has three business segments: Energy Products9, Flow Control
10and
Metallurgy11
, and around 2,971 employees.
The Energy Products Segment offers high value-added products and services for the Oil &Gas sector, including deepwater platform anchoring ropes, valves, oil wells completion tools,coating, VNG compressors, sensors and services through “Lupatech MNA”, “Lupatech CSL”,“Lupatech Tecval”, “Lupatech Oil Tools”, “Lupatech Esferomatic”, “Lupatech Oil & GasServices”, “Lupatech Tubular Services”, “Lupatech Monitoring Systems”, “Aspro”, “Sinergás”and “Norpatagonica” brands.
The Flow Control Segment heads the national rankings in the Mercosul in the production andsale of industrial valves, primarily for the chemical, pharmaceutical, pulp and paper andconstruction industries, under “Lupatech Valmicro”, “Lupatech Mipel”, “ValBol” and “Jefferson”brands.
The Metallurgy Segment is among the international leaders in the development and productionof parts, complex parts and sub-assemblies, mainly for power train systems to the global autoindustry. It employs the precision casting and steel injection processes, techniques that itpioneered in Latin America. It also produces high-corrosion-resistant cast-alloy housings forindustrial valves and pumps, chiefly for applications in the oil and gas industry under“Microinox”, “Steelinject” and “Itasa” brands.
[The remaining of this page was left in blank intentionally]
9Former Oil & Gas
10Former Flow
11Former Metal

40
MESSAGE TO SHAREHOLDERS AND MARKET AGENTS
Dear shareholders and market agents,
Lupatech presents its results for the fiscal year of 2009, which was, undoubtedly, the mostdifficult year for the Company's business in the last ten years, when the demand for ourproducts has been strongly impacted by the global financial crisis that began in the last monthsof 2008.
Our business related to the Energy Products Segment, focused mainly on the Brazilian oil andgas industry, were negatively impacted by the delays in the execution of discretionaryinvestments initially planned for the sector, as a result of the strong reduction in the availabilityof long-term funding and of the oil price reduction. In the Flow Control Segment there was alsoa slowdown of business, mainly in Argentina. In the Metallurgy Segment, our businesses wereaffected by the contraction in demand due to the automotive chain in the northern hemisphere.The consequence was the reduction of the Company Net Revenues in 21.2% in 2009 whencompared to 2008.
Since 2007 we have been expanding the capacity of our industrial plants, mainly in thosefacilities related to Energy and the majority of these investments started to operate in 2009.Besides operating during the year with low capacity utilization, around 35% of the total availablecapacity, we believe this new capacity will enable Lupatech attend more and larger projects inthe years ahead when it is expect a recover in demand.
The global macro-economic conditions have improved along the year, and at the end of 2009we began to see improvement in demand. The Company is comfortable with this scenario dueto several bidding processes and quotations that we participated through the Energy Productsand Flow Control Segments, whose effects will be noticed throughout 2010 and in beyond.
During 2009 we initiated several projects aiming the improvement of the integration andsynergies in the 15 companies that were acquired in the recent years as part of our process ofthe portfolio diversification of products and services. We believe that throughout 2010 the firstpositive effects of these measures will be noticed, mainly in the reduction of fixed costs andGeneral and Administrative Expenses. Among the main measures are the centralization ofindustrial activities and the implementation of a Lupatech’ Shared Services Center.
Below we highlight the main objectives concluded in 2009:
Joint Venture V&M: Liners contract
Joint Venture Cameron: manufacturing of Reciprocal Compressors
Supplying of valves and anchoring ropes for Petrobras’ projects such as platforms P-55,
P-57 and Capixaba, refineries as REPLAN, REPAR among others; and Block 31 of
British Petroleum (in Angola)
Conclusion of the expansion of the Lupatech MNA, Lupatech Oil Services and Lupatech
Oil Tools plants
Implementation of the EVA
New debt structure
Reduction of the Working Capital used in the operations
41
Even with the adverse environment for our business and after two consecutive years of losses,the Company reported Net Income of R$15.4 million (R$0.03 per lot of 100 shares), an increaseof R$44.9 million when compared to the results presented in 2008.
OVERVIEW OF THE BUSINESS SEGMENTS
ENERGY PRODUCTS SEGMENT
The Energy Products Segment, as mentioned above, has verified an important recover onprojects related to the oil and gas industry in Brazil, which directly benefit Lupatech. Since theend of 2009, the Company has participated in several bidding rounds related to valves, servicesand coating, winning the most of them. With that, it was able to build up a significant backlog forthe next periods.
The demand recovery for production projects in the oil and gas industry in Brazil began first withprojects related to maintenance, replacement and operations (MRO), and services. Thesecontracts are long-term (over one year) contracts and are negotiated directly with endcustomers (oil companies), bringing good revenues predictability for the Company.
Demand from new projects such as platforms, refineries, etc.., that are related to short-termcontracts (up to a year) and negotiated with EPC Companies, began to recover, especiallythose for refineries, while platform projects are still with low levels of activity.
FLOW CONTROL SEGMENT
The Flow Control segment is widely exposed to industrial activity in Brazil and Argentina. Withthe economic recovery in most of the economy sectors in Brazil, this segment has verified notonly increased improvement in the commercial activity as well as in the capacity utilization,which will result in better operational rates during the fiscal year of 2010.
METALLURGY SEGMENT
Metallurgy Segment has great exposure to the automotive chain. Although it has been verifiedimprovement in the automotive sector in Brazil, the demand of this segment for the Company isfocused on the exports to Europe and Mexico (US market), markets where this sector has notrecovered or has showed very slight signs of recovery.
[The remaining of this page was left in blank intentionally]

42
ARGENTINA
The Company has business in Argentina with exposure to industrial sectors, mainly to the oiland gas industry. Although the improvement in the global scenario has also impacted Argentina,the country faces other internal problems that lead us to expect that in 2010 the activity level willstill be modest, given the lack of incentives for investments in the country at this moment. Theexpectation is that the plants located in Argentina, excluding the gas compressors business thatshowed considerable commercial recovery at the end of 2009, should work at levels close to60% of those recorded in the 2008.
PERSPECTIVES FOR 2010
The macro-economic environment for 2010 in many aspects has become more favorable thanthe verified in 2009, which allows the company to work with the expectation of an increase inthe Net Revenues, which will probably account for a Net Revenues similar to the one reportedin 2008.
The distribution of the Net Revenues along 2010 will be more concentrated in the second half ofthe year, pointing the end of a period of weak demand during the first and the beginning of aperiod of more robust demand for our products and services.
We have verified since October 2009 a recovery in the commercial activity that has alreadyimpacted and will continue to impact the backlog of the Company, contributing to revenueshigher than those reported in 2009.
Possible impacts on operating margins for 2010 are associated to the progress of synergies andreduction of costs and fixed costs started in 2009. We also believe that there is room for gainsfrom operating leverage due to the increase of the capacity utilization.
In relation to the perspectives of 2011 and onwards, the Company continues to expect stronggrowth of the oil and gas industry mainly in Brazil. The new discovery of oil and gas fieldsmeans reserves that need to be developed and it will create an extremely favorableenvironment for Lupatech’ businesses. There are also new reserves to be explored anddeveloped as well as new market entrants that may become customers of the Company.
MARKET PERFORMANCE – COMPETITION AND LOCAL CONTENT
The Company monitors closely the competition in the markets where it operates, and where itverifies attractiveness for new competitors is the Brazilian market for equipment and services forthe oil and gas industry, which grows at rates higher than other markets where it operates.
The market share of our business remained stable in 2009 even though the demand hasreduced. We have verified similar conditions of competition to other years in most of ourbusiness, except for valves, due to the lower technological barriers and a larger number ofsuppliers. Although this scenario, we did not noticed changes in market share of the valvesmarket.
To keep our market position, we constantly invest in technology, new product lines and productredesigns, in anticipation of possible market demands and better positioning the Company. Wehave also intended to provide solutions to our customers and not just products, adding to theequipments we provide, services installation, maintenance and operation, delivering customizedsolutions, creating another competitive advantage in our markets.
43
The trend of a growing percentage of a minimum Local Content requirement in the Brazilianmarket is a reality that promotes our business model. We are a company that develops,produces and sells its products and service with a high level of Local Content. We have noticedthat the new concessions granted by the National Petroleum Agency (ANP) have an increasedminimal percentage of Local Content, which makes us believe we are well positioned to provideequipments and services that meets the minimum percentage of the Local Content required byANP and by the oil and gas companies, given to our industry expertise combined with theinstalled capacity in Brazil.
JOINT VENTURES E PARTNERSHIPS
Due to the expected growth of the oil and gas industry in Brazil, the interest from othercompanies to enter this market has also increased. Given the peculiarities of the Brazilianmarket and the requirement of a minimum Local Content, many of them have as an alternativethe entry through strategic partnerships and joint ventures. Lupatech is a natural partner forthese companies, and we have been contacted by some companies that would like to establishrelationship with Lupatech in order to enter the Brazilian market, allowing the Company to offerwider range of products and services.
We consider these possible joint ventures and partnerships extremely positive for the company,which may in some cases accelerate the technological development of products, access bettersources of raw materials as well as business relationships with new customers and markets.
GROWTH IN THE SECTOR INVESTMENTS
Lupatech is positioned and its strategy is focused on the oil and gas sector in several markets,but with greater exposure to the Brazilian market where the historical and projected growth forthe coming years has been growing at expressive annual rates. Only Petrobras plans to investover the next five years between US$ 200 billion and US$ 220 billion, and during 2010 theinvestment should amount R$ 88.5 billion.
There is an expectation in the market that Petrobras will be capitalized. In our view, thismovement is positive for all suppliers of Petrobras, which will have greater capacity forinvestment as well as new reserves to be explored.
The Brazilian market, although being concentrated in Petrobras, has shown progress in terms ofnew entrants and potential customers to Lupatech. We have verified some oil companiesincreasing its presence in the Brazilian market, specially OGX, as well as new EPC Companies,which we intend to establish relationships with.
[The remaining of this page was left in blank intentionally]
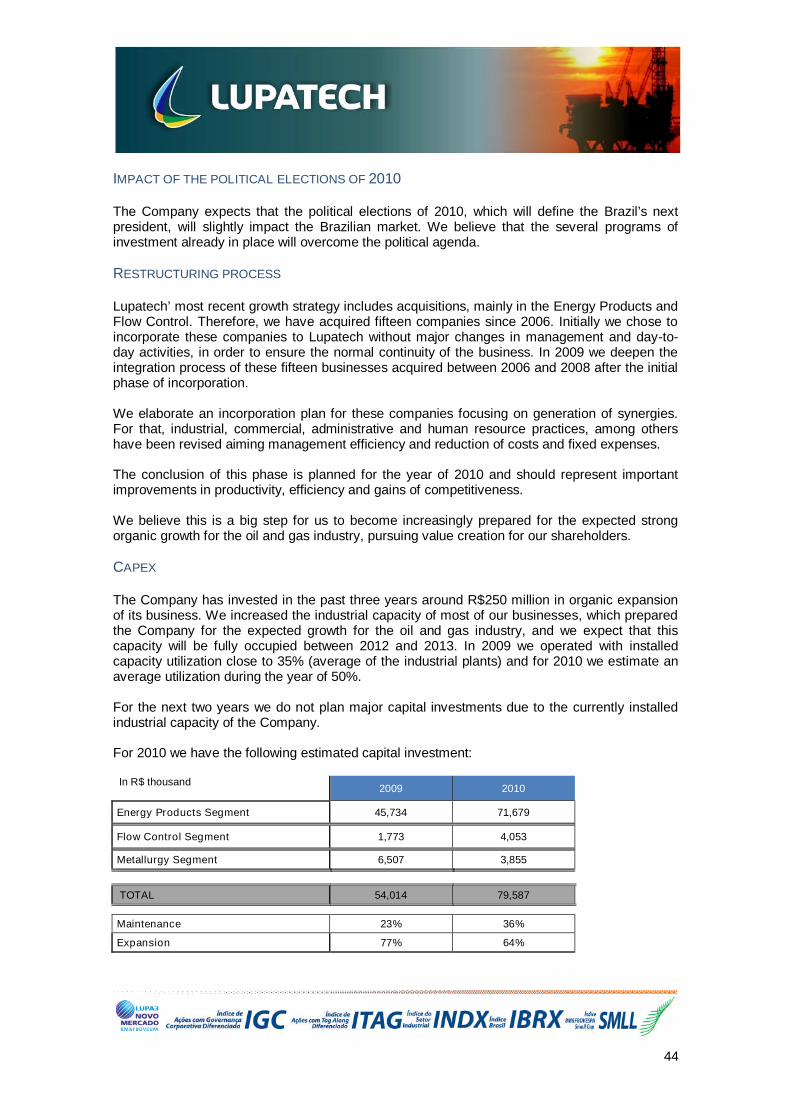
44
IMPACT OF THE POLITICAL ELECTIONS OF 2010
The Company expects that the political elections of 2010, which will define the Brazil’s nextpresident, will slightly impact the Brazilian market. We believe that the several programs ofinvestment already in place will overcome the political agenda.
RESTRUCTURING PROCESS
Lupatech’ most recent growth strategy includes acquisitions, mainly in the Energy Products andFlow Control. Therefore, we have acquired fifteen companies since 2006. Initially we chose toincorporate these companies to Lupatech without major changes in management and day-to-day activities, in order to ensure the normal continuity of the business. In 2009 we deepen theintegration process of these fifteen businesses acquired between 2006 and 2008 after the initialphase of incorporation.
We elaborate an incorporation plan for these companies focusing on generation of synergies.For that, industrial, commercial, administrative and human resource practices, among othershave been revised aiming management efficiency and reduction of costs and fixed expenses.
The conclusion of this phase is planned for the year of 2010 and should represent importantimprovements in productivity, efficiency and gains of competitiveness.
We believe this is a big step for us to become increasingly prepared for the expected strongorganic growth for the oil and gas industry, pursuing value creation for our shareholders.
CAPEX
The Company has invested in the past three years around R$250 million in organic expansionof its business. We increased the industrial capacity of most of our businesses, which preparedthe Company for the expected growth for the oil and gas industry, and we expect that thiscapacity will be fully occupied between 2012 and 2013. In 2009 we operated with installedcapacity utilization close to 35% (average of the industrial plants) and for 2010 we estimate anaverage utilization during the year of 50%.
For the next two years we do not plan major capital investments due to the currently installedindustrial capacity of the Company.
For 2010 we have the following estimated capital investment:
In R$ thousand2009 2010
Energy Products Segment 45,734 71,679
Flow Control Segment 1,773 4,053
Metallurgy Segment 6,507 3,855
TOTAL 54,014 79,587
Maintenance 23% 36%
Expansion 77% 64%

45
CAPITAL STRUCTURE – DEBT, COVENANTS AND LIQUIDITY
We started the year of 2009 with a capital structure composed by 79.4% of debt and 20.6% ofcapital. The debt of the Company was represented by Perpetual Bonds (with no maturity) andfacilities from commercial banks with maturity between 2010 and 2011. We improved andextended the debt profile, and for that we announced in May 2009 the restructuring of theCompany’s debt through the replacement of bank loans with maturity between 2010 and 2011for proceeds from BNDES, and the issuance of convertible debentures. The proceeds fromthese financial lines were available for the Company’s usage during the second half of 2009,and were used in the process of extension of the debt profile as well as the reduction of thefinancial expenses, already noticed during the second half of 2009.
Currently, the Company's debt consists of Perpetual Bonds, Convertible Debentures (majorityheld by BNDES) and financial proceeds from BNDES to finance Capex.
BACKLOG
The Company's backlog as of December, 31 of 2009 was around R$770 million, being R$420million in services and R$350 million in products.
We expect to convert it into Net Revenues, still in 2010, around R$390 million of the backlogthat if added to the spot market should lead to reach the Net Revenues targets projected for theyear of 2010, growth of around 20% over the reported in 2009.
The backlog balance of R$380 million, will be converted into Net Revenues during the 2011 andthe years ahead and does not include bidding rounds that the Company has won in the lastmonths and that have not yet been converted into contracts.
The backlogs has Brazil as its main market, either directly or indirectly, and have differentcharacteristics with respect to terms, conditions, terms of adjustments, cancellation andcancellation penalty fee, the payment flow among others.
In the balance of the backlog there are contracts named Autorização de Fornecimento deMateriais Global (Authorization of Supply of Materials Global), which are contracts with anaverage term of two years and are negotiated directly with end customers, i.e. without theintermediation of EPC Companies (companies of Engineering, Procurement and Constructing).
The AFMGs are directed mainly to maintenance, replacement and operation of infrastructurealready installed, which determines the price for the products to be supplied, beingautomatically annually adjusted reflecting changes in costs, mainly raw materials and laborcosts.
[The remaining of this page was left in blank intentionally]
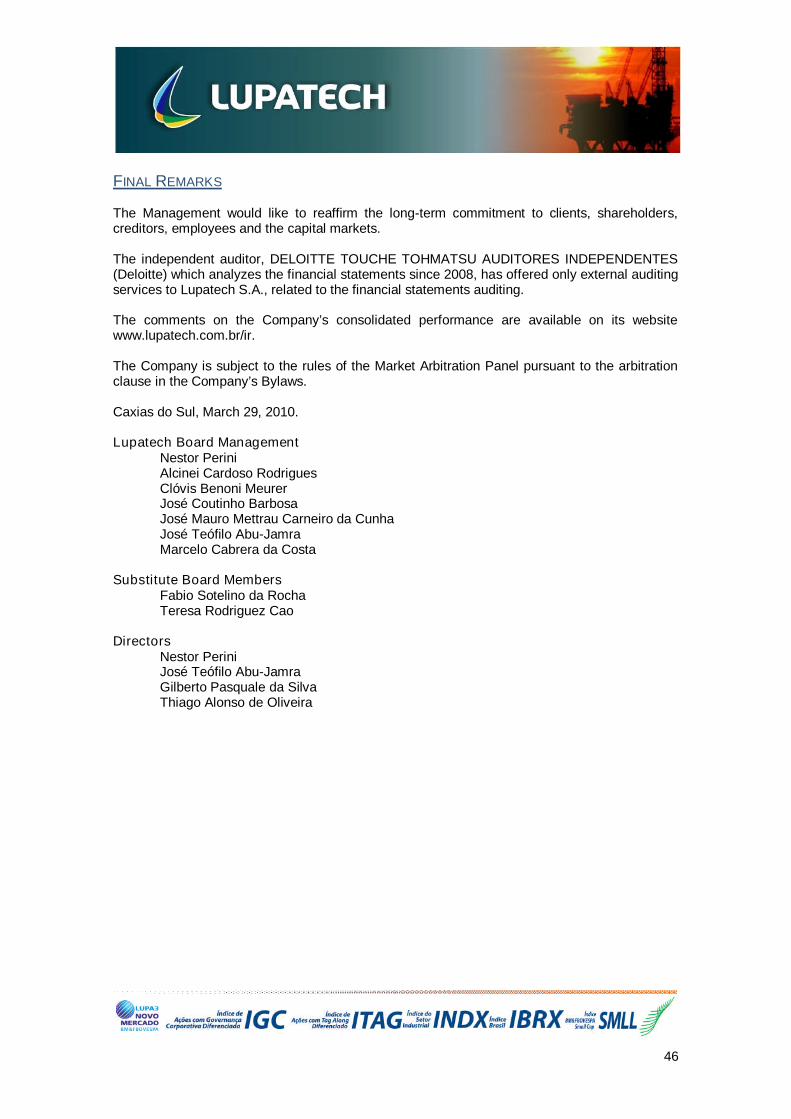
46
FINAL REMARKS
The Management would like to reaffirm the long-term commitment to clients, shareholders,creditors, employees and the capital markets.
The independent auditor, DELOITTE TOUCHE TOHMATSU AUDITORES INDEPENDENTES(Deloitte) which analyzes the financial statements since 2008, has offered only external auditingservices to Lupatech S.A., related to the financial statements auditing.
The comments on the Company’s consolidated performance are available on its websitewww.lupatech.com.br/ir.
The Company is subject to the rules of the Market Arbitration Panel pursuant to the arbitrationclause in the Company’s Bylaws.
Caxias do Sul, March 29, 2010.
Lupatech Board ManagementNestor PeriniAlcinei Cardoso RodriguesClóvis Benoni MeurerJosé Coutinho BarbosaJosé Mauro Mettrau Carneiro da CunhaJosé Teófilo Abu-JamraMarcelo Cabrera da Costa
Substitute Board MembersFabio Sotelino da RochaTeresa Rodriguez Cao
DirectorsNestor PeriniJosé Teófilo Abu-JamraGilberto Pasquale da SilvaThiago Alonso de Oliveira

47
MANAGEMENT COMMENTS ON CONSOLIDATED ECONOMIC AND FINANCIAL
PERFORMANCE
NET REVENUES
Net Revenues (in R$ thousand) 3Q09 4Q09%
Change 2008 2009%
Change
Energy Products 85,634 66,670 -22.1% 450,934 386,404 -14.3%
Energy Products - Local Market 71,725 39,233 -45.3% 339,095 251,096 -26.0%
Energy Products - Exports 13,909 27,437 97.3% 111,839 135,308 21.0%
Flow Control 29,623 28,034 -5.4% 164,203 117,080 -28.7%
Flow Control - Local Market 28,000 26,488 -5.4% 149,809 108,312 -27.7%
Flow Control - Exports 1,623 1,546 -4.7% 14,394 8,768 -39.1%
Metallurgy 12,972 13,114 1.1% 89,535 51,678 -42.3%
Metallurgy - Local Market 10,771 10,633 -1.3% 59,216 37,642 -36.4%
Metallurgy - Exports 2,201 2,481 12.7% 30,319 14,036 -53.7%
Total 128,230 107,818 -15.9% 704,673 555,162 -21.2%
% Energy Products 66.8% 61.8% 64.0% 69.6%
% Energy Products - Local Market 83.8% 58.8% 75.2% 65.0%
% Energy Products - Exports 16.2% 41.2% 24.8% 35.0%
% Flow Control 23.1% 26.0% 23.3% 21.1%
% Flow Control - Local Market 94.5% 94.5% 91.2% 92.5%
% Flow Control - Exports 5.5% 5.5% 8.8% 7.5%
% Metallurgy 10.1% 12.2% 12.7% 9.3%
% Metallurgy - Local Market 83.0% 81.1% 66.1% 72.8%
% Metallurgy - Exports 17.0% 18.9% 33.9% 27.2%
The Consolidated Net Revenues of 2009 is 21.2% lower when compared to 2008, reachingR$555.2 million. The decrease is due to the market conditions that caused a demand slowdownin all segments where the Company operates, as well as prices decrease.
The Consolidated Net Revenues of 4Q09 was R$107.8 million, 15.9% lower than 3Q09 whentotaled R$128.2 million. The decline during the 4Q09 is a consequence of the slowdown ofcommercial activity verified during the year of 2009 that had its major impacts on this quarter.
The Net Revenues of the Energy Products Segment in 2009 reached R$386.4 million, down14.3% when compared to 2008 when it reached R$450.9 million. This segment was stronglyand negatively affected by the reduction of the demand in the oil and gas industry, specifically inthe production projects where the Company has significant exposure and by the pricesdecrease.
The Net Revenues of the Energy Products Segment in the 4Q09 reached R$66.7 million, down22.1% when compared to 3Q09 when it reached R$85.6 million. As mentioned above, thedecrease verified during the 4Q09 is a consequence of the slowdown of the commercial activityduring the year of 2009 that had major impacts on this quarter.
The Net Revenues of the Flow Control Segment in the year of 2009 reached R$117.1 million,down 28.7% when compared to 2008 when it reached R$164.2 million. This segment wasstrongly affected by the slowdown of the industrial activity in Brazil and Argentina, as a result ofthe global crisis started in 2008 and the prices decrease.

48
The Net Revenues of the Flow Control Segment in the 4Q09 reached R$28.0 million, down5.4% when compared to 3Q09 when it reached R$29.6 million. This decrease is the result of themix of orders with less value added of the Brazilian plants of valves.
The Net Revenues of the Metallurgy Segment in the year of 2009 reached R$51.7 million, down42.3% when compared to 2008 when it reached R$89.5 million. This segment was stronglyimpacted by the global crisis that directly affected the automotive industry, mainly in the U.S.and Europe, markets with great representative sales for the units in this segment.
The Net Revenues of the Metallurgy Segment in the 4Q09 reached R$13.1 million, up 1.1%when compared to 3Q09 when it reached R$13.0 million. This growth is the result of a slightrecovery in the orders related to the Brazilian automotive industry.
REVENUE BREAKDOWN
BY GEOGRAPHIC REGION – TOTAL 2009 NET CONSOLIDATED REVENUES
[The remaining of this page was left in blank intentionally]
63.6%
11.7%
11.1%
6.0% 2.0% 2.7%
2.9%
Brazil Repetro Argentina
Asia Europe North America
Other

49
BY INDUSTRIAL SECTOR – TOTAL NET CONSOLIDATED REVENUES IN 2009
BY INDUSTRIAL SECTOR – 2009 GROSS REVENUES PER SEGMENT
[The remaining of this page was left in blank intentionally]
63.2%
15.1%
5.8%2.3% 13.6%
Energy Capital Goods Automotive
Civil Construction Others
Oil & Gas22%
Chemical9%
Construction11%
Machines &Equipments
27%
Food5%
Other26%
Automotive51%
Oil & Gas16%Automation
4%Food2%
Dental2%
Other25%
Oil & Gas96%
Other4%

50
COSTS OF GOODS SOLD
COGS (in R$ thousand) 3Q09 4Q09%
Change 2008 2009%
Change
Energy Products 70,034 55,115 -21.3% 257,978 282,113 9.4%
Flow Control 16,252 16,846 3.7% 86,148 68,145 -20.9%
Metallurgy 13,397 13,238 -1.2% 73,909 52,737 -28.6%
Total 99,683 85,199 -14.5% 418,036 402,996 -3.6%
% Energy Products 70.3% 64.7% 61.7% 70.0%
% Flow Control 16.3% 19.8% 20.6% 16.9%
% Metallurgy 13.4% 15.5% 17.7% 13.1%
COGS/Net Revenues Total 77.7% 79.0% 59.3% 72.6%
COGS/Net Revenues Energy Products 81.8% 82.7% 57.2% 73.0%
COGS/Net Revenues Flow Control 54.9% 60.1% 52.5% 58.2%
COGS/Net Revenues Metallurgy 103.3% 100.9% 82.5% 102.0%
The Consolidated Cost of Goods Sold (COGS) in 2009 reached R$403.0 million, down 3.6%when compared to 2008 when it reached R$418.0 million.
Consolidated COGS of 4Q09 reached R$85.2 million, down 14.5% when compared to 3Q09when reached R$99.7 million. The decrease of the Consolidated COGS during the 4Q09 is adirect consequence of the 15.9% reduction of the Net Revenues in the same period.
The COGS of the Energy Products Segment in 2009 reached R$282.1 million, up 9.4% whencompared to 2008 when it reached R$258.0 million. The increase of the Energy ProductsSegment COGS is due to the consolidation in the 2009 of four quarters of COGS related to thecompanies acquired in 2008, while in the prior year only part of the COGS of these companieshad been consolidated in the result.
The COGS of the Energy Products Segment in the 4Q09 reached R$55.1 million, down 21.3%when compared to 3Q09 when reached R$70.0 million. The reduction of the ConsolidatedCOGS during the 4Q09 is a direct consequence of the decrease of 22.1% of the Net Revenuesin the same period.
The COGS of the Flow Control Segment in 2009 reached R$68.1 million, down 20.9% whencompared to 2008 when it reached R$86.1 million. The reduction of the Flow Control SegmentCOGS for 2009 is due to the decrease of 28.7% in the Net Revenues in the same period.
The COGS of the Flow Control Segment in the 4Q09 reached R$16.8 million, up 3.7% whencompared to 3Q09 when reached R$16.3 million. The growth of the COGS of the Flow ControlSegment in the 4Q09 is the result of higher costs of inspection and machining process relatedto special projects delivered during the quarter.
The COGS of the Metallurgy Segment in 2009 reached R$52.7 million, down 28.6% whencompared to 2008 when it reached R$73.9 million.
The COGS of the Metallurgy Segment in the 4Q09 reached R$13.2 million, down 1.2% whencompared to 3Q09 when reached R$13.4 million.

51
COST STRUCTURE
The following table shows the behavior of fixed costs between the 1Q09 and 4Q09.
Cost Structure (in %) 1Q09 2Q09 3Q09 4Q09
Energy Products:
Raw Material 64.5 60.6 52.0 37.5
Labor 20.1 20.6 25.5 32.5
Manufacturing Expenses 9.0 13.8 15.1 21.4
Depreciation 6.4 5.0 7.4 8.6
Flow Control
Raw Material 62.6 66.1 63.5 61.2
Labor 20.2 18.7 18.8 23.7
Manufacturing Expenses 11.4 9.2 12.4 8.9
Depreciation 5.8 6.0 5.3 6.2
Metallurgy:
Raw Material 36.5 36.4 39.5 36.9
Labor 27.6 29.8 30.0 29.5
Manufacturing Expenses 15.2 12.4 11.4 14.9
Energy 5.7 6.5 5.2 5.9
Depreciation 15.0 14.9 13.9 12.8
COGS – MAIN COMPONENTS OF TOTAL RAW MATERIAL – 2009
17.2%
23.0%
12.1%
47.7%
Stainless Steel Carbon Steel
Polyester Wax for casting & Others
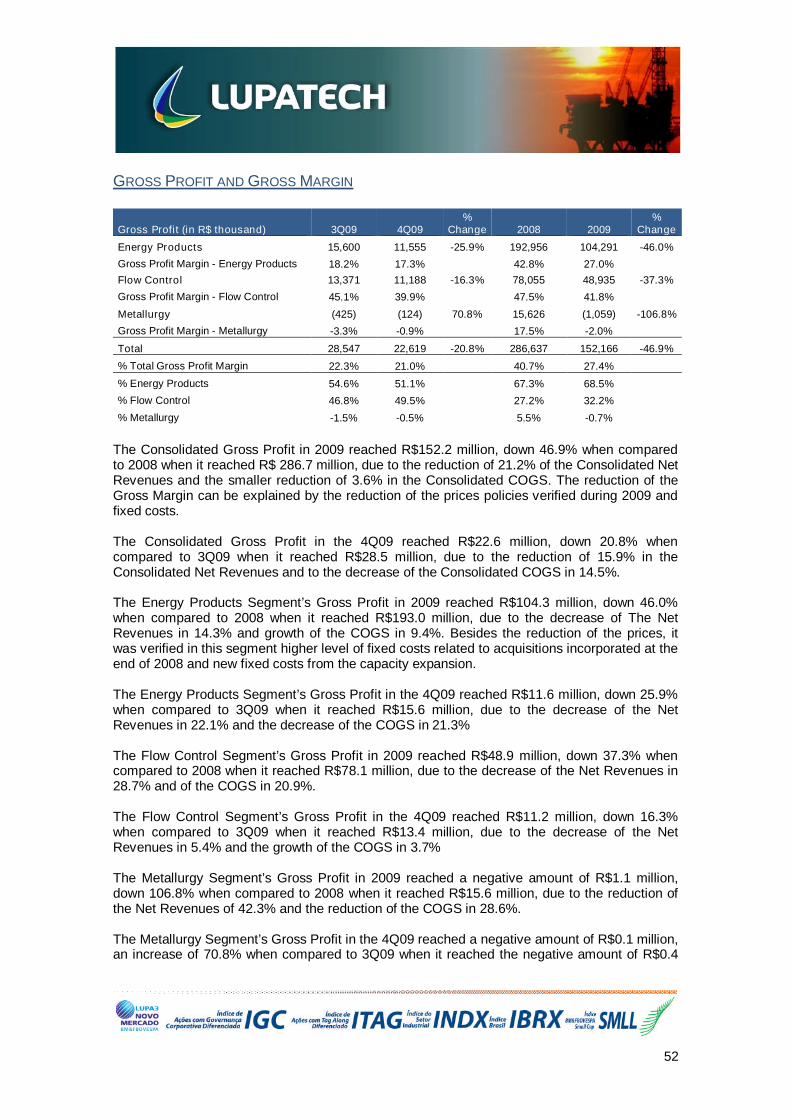
52
GROSS PROFIT AND GROSS MARGIN
Gross Profit (in R$ thousand) 3Q09 4Q09%
Change 2008 2009%
Change
Energy Products 15,600 11,555 -25.9% 192,956 104,291 -46.0%
Gross Profit Margin - Energy Products 18.2% 17.3% 42.8% 27.0%
Flow Control 13,371 11,188 -16.3% 78,055 48,935 -37.3%
Gross Profit Margin - Flow Control 45.1% 39.9% 47.5% 41.8%
Metallurgy (425) (124) 70.8% 15,626 (1,059) -106.8%
Gross Profit Margin - Metallurgy -3.3% -0.9% 17.5% -2.0%
Total 28,547 22,619 -20.8% 286,637 152,166 -46.9%
% Total Gross Profit Margin 22.3% 21.0% 40.7% 27.4%
% Energy Products 54.6% 51.1% 67.3% 68.5%
% Flow Control 46.8% 49.5% 27.2% 32.2%
% Metallurgy -1.5% -0.5% 5.5% -0.7%
The Consolidated Gross Profit in 2009 reached R$152.2 million, down 46.9% when comparedto 2008 when it reached R$ 286.7 million, due to the reduction of 21.2% of the Consolidated NetRevenues and the smaller reduction of 3.6% in the Consolidated COGS. The reduction of theGross Margin can be explained by the reduction of the prices policies verified during 2009 andfixed costs.
The Consolidated Gross Profit in the 4Q09 reached R$22.6 million, down 20.8% whencompared to 3Q09 when it reached R$28.5 million, due to the reduction of 15.9% in theConsolidated Net Revenues and to the decrease of the Consolidated COGS in 14.5%.
The Energy Products Segment’s Gross Profit in 2009 reached R$104.3 million, down 46.0%when compared to 2008 when it reached R$193.0 million, due to the decrease of The NetRevenues in 14.3% and growth of the COGS in 9.4%. Besides the reduction of the prices, itwas verified in this segment higher level of fixed costs related to acquisitions incorporated at theend of 2008 and new fixed costs from the capacity expansion.
The Energy Products Segment’s Gross Profit in the 4Q09 reached R$11.6 million, down 25.9%when compared to 3Q09 when it reached R$15.6 million, due to the decrease of the NetRevenues in 22.1% and the decrease of the COGS in 21.3%
The Flow Control Segment’s Gross Profit in 2009 reached R$48.9 million, down 37.3% whencompared to 2008 when it reached R$78.1 million, due to the decrease of the Net Revenues in28.7% and of the COGS in 20.9%.
The Flow Control Segment’s Gross Profit in the 4Q09 reached R$11.2 million, down 16.3%when compared to 3Q09 when it reached R$13.4 million, due to the decrease of the NetRevenues in 5.4% and the growth of the COGS in 3.7%
The Metallurgy Segment’s Gross Profit in 2009 reached a negative amount of R$1.1 million,down 106.8% when compared to 2008 when it reached R$15.6 million, due to the reduction ofthe Net Revenues of 42.3% and the reduction of the COGS in 28.6%.
The Metallurgy Segment’s Gross Profit in the 4Q09 reached a negative amount of R$0.1 million,an increase of 70.8% when compared to 3Q09 when it reached the negative amount of R$0.4

53
million, due to the increase of the Net Revenues in 1.1% and the reduction of the COGS in1.2%.
EXPENSES
Expenses (in R$ thousand) 3Q09 4Q09%
Change 2008 2009%
Change
Total Sales Expenses 11,959 14,859 24.2% 60,993 57,170 -6.3%
Total Administrative Expenses 14,360 12,056 -16.0% 47,621 51,972 9.1%
Energy Products 16,775 17,396 3.7% 64,764 72,484 11.9%
Sales expenses 7,070 9,490 34.2% 36,592 37,822 3.4%
Administrative expenses 9,705 7,906 -18.5% 28,172 34,662 23.0%
Flow Control 7,099 7,329 3.2% 30,008 27,190 -9.4%
Sales expenses 3,676 4,077 10.9% 15,828 14,118 -10.8%
Administrative expenses 3,423 3,252 -5.0% 14,180 13,072 -7.8%
Metallurgy 2,445 2,190 -10.4% 13,841 9,469 -31.6%
Sales expenses 1,213 1,292 6.5% 8,572 5,230 -39.0%
Administrative expenses 1,232 898 -27.1% 5,269 4,239 -19.6%
Total Sales & Administrative 26,319 26,915 2.3% 108,614 109,142 0.5%
Management Salary 678 870 28.3% 1,991 2,750 38.1%Total Sales, Administrative & ManagementSalary 26,997 27,785 2.9% 110,604 111,892 1.2%
% Energy Products 63.7% 64.6% 59.6% 66.4%
% Flow Control 27.0% 27.2% 27.6% 24.9%
% Metallurgy 9.3% 8.1% 12.7% 8.7%
Sales expenses/Net Revenues 9.3% 13.8% 8.7% 10.3%
Administrative expenses/Net Revenues 11.2% 11.2% 6.8% 9.4%
Management Salary/Net Revenues 0.5% 0.8% 0.3% 0.5%
Expenses/Net Revenues Total 21.1% 25.8% 15.7% 20.2%
Expenses/Net Revenues Energy Products 19.6% 26.1% 14.4% 18.8%
Expenses/Net Revenues Flow Control 24.0% 26.1% 18.3% 23.2%
Expenses/Net Revenues Metallurgy 18.8% 16.7% 15.5% 18.3%
The Sales and Administrative General Expenses and Management Salary grew 1.2% in 2009and reached R$111.9 million, against R$110.6 million in 2008. This variation is mainly due tothe growth of the administrative expenses in 9.1% to R$52.0 million due to higher levels ofadministrative expenses to support the new industrial capacity resulted from the capacityexpansion concluded at the end of 2008 and during 2009, as well as the consolidation in 2009of four quarters of expenses from the companies acquired in 2008, while in the previous yearonly part of the expenses from these companies was consolidated in the result.
The Sales and Administrative General Expenses and Management Salary grew 2.9% in the4Q09, reaching R$27.8 million, against R$27.0 million in the 3Q09. Even though it was verifieda decrease in the Consolidated Administrative Expenses of 16.0% in the 4Q09, first results fromthe restructuring process, there was an increase in the Consolidated Selling Expenses of24.2%, mainly due to freight costs, increase in commission expenses and other commercialexpenses.
The Sales and Administrative General Expenses of the Energy Products segment grew 11.9%in 2009 and reached R$72.5 million, against R$64.8 million in 2008. This growth is mainly dueto the growth of the Administrative Expenses of this segment in 23.0%. The expansions thathave been made in the industrial plants and the new plants that were built in this segment

54
resulted in a higher level of Administrative Expenses that was necessary to support theoperations.
The Sales and Administrative General Expenses of the Energy Products Segment grew 3.7% inthe 4Q09, reaching R$17.4 million, against R$16.8 million in the 3Q09. This growth is mainlydue to the increase of Sales Expenses of this segment in 34.2%, due to higher freight costs andother commercial expenses.
The Sales and Administrative General Expenses of the Flow Control Segment decreased 9.4%in 2009 and reached R$27.2 million, against R$ 30.0 million in 2008. This reduction is due tothe decline of the Sales Expenses in 10.8% cause by a slowdown in the commercial activityduring the year, and also by the reduction of the Administrative Expenses in 7.8%.
The Sales and Administrative General Expenses of the Flow Control Segment grew 3.2% in the4Q09, reaching R$7.3 million, against R$7.1 million in the 3Q09. This growth is mainly due tothe increase of the Sales Expenses in this segment in 10.9%.
The Sales and Administrative General Expenses of the Metallurgy Segment decreased 31.6%in 2009 and reached R$9.5 million, against R$ 13.8 million in 2008. This decrease is due to thedecline of the Sales Expenses in 39.0%, due to the slowdown of commercial activity during theyear, and also to the decrease of Administrative Expenses in 19.6%.
The Sales and Administrative General Expenses of the Metallurgy Segment decreased 10.4%in the 4Q09, reaching R$2.2 million, against R$2.4 million in the 3Q09. This decrease is due tothe decline in the Administrative Expenses of this segment in 27.1%.
OPERATING EXPENSES AND EQUITY PICK-UP RESULT OVER AFFILIATES
Operating Revenues & Expenses (in R$thousand) 3Q09 4Q09
%Change 2008 2009
%Change
Operating Revenues 794 3,859 386.0% 6,088 6,631 8.9%
Operating Expenses (2,488) (6,909) 177.7% (13,512) (17,775) 31.6%
Operating Expenses (1,758) (6,482) 268.7% (6,540) (10,588) 61.9%
Operating Expenses - Non-recurring (730) (427) -41.5% (6,970) (7,187) 3.1%
Equity Pickup Result 217 92 -57.6% 928 749 -19.3%
Total (1,477) (2,958) 100.3% (6,495) (10,394) 60.0%
Other Operating Revenues totaled R$6.7 million in 2009 against R$6.1 million in 2008. TheseOperating Revenues are related to the sale of fixed assets, recovery of contingent liabilities andtaxes.
Other Operating Revenues totaled R$3.9 million in the 4Q09, against R$0.8 million in the 3Q09.These Operating Revenues are related to the recovery of contingencies and taxes.
Other Operating Expenses totaled R$17.8 million in 2009 against R$13.5 million in 2008. Theseexpenses are related to losses from contingencies, obsolescence of inventory, book value offixed assed sold and other non-recurring expenses related to deferred expenses booked in theresult when the acquisitions were made, which in 2009 totaled R$7.2 million versus R$7.0million in 2008.

55
Other Operating Expenses totaled R$6.9 million in the 4Q09 against R$2.5 million in the 3Q09.These expenses are related to obsolescence of inventory and book value of fixed assed sold aswell as non-recurring expenses in the amount of R$0.4 million.
The Equity Pickup result decreased 19.3% in 2009 when compared to the 2008, reaching R$0.7million due to the results of the affiliates Aspro Carwal and Aspro Services (see Notes nº 08). Inthe 4Q09 the Equity Pickup result amounted R$0.1 million versus R$0.2 million in the 3Q09.
Other Operating Revenues and Expenses recorded in 2009 reached a negative amount(expense) of R$10.4 million against an expense of R$6.5 million in 2008, which represents a60.0% growth.
Other Operating Revenues and Expenses recorded in the 4Q09 reached a negative amount(expense) of R$3.0 million against an expense of R$1.5 million in the 3Q09, which represents a100.3% growth.
FINANCIAL RESULT
Net Financial Result (R$ thousand) 2008 2009%
Change
Interest Income 6,562 11,412 73.9%
Others 1,977 14,978 657.4%
Financial Income (excluding EV*) 8,540 26,390 209.0%
Interest Expense 92,498 99,743 7.8%
Embedded Derivative (Convertible Debentures) - 11,597 n.a.
Financial Taxes 6,373 4,575 -28.2%
Others 4,992 10,898 118.3%
Financial Expense (excluding EV*) 103,863 126,813 22.1%
Net Financial Result (excluding EV*) (95,323) (100,423) 5.4%
Exchange Variance Income 34,956 162,933 366.1%
Exchange Variance Expense (134,151) (65,029) -51.5%
Net Exchange Variance (99,195) 97,904 198.7%
TOTAL Net Financial Result (194,518) (2,519) -98.7%* Exchange Variation
The total Financial Income (excluding Exchange Variation) of the Company in 2009 reached R$26.4 million, 209.0% higher than in 2008 when it reached R$8.5 million. This growth is due tohigher Interest Income, result of investments made in Brazil, which allowed the company toaccess interest rates better than the ones accessed in 2008 when the cash position was keptabroad. The variation can also be justified by the inclusion of Financial Income related to thePresent Value Adjustment of the Accounts Receivable.
The total Financial Expenses (excluding Exchange Variation) of the Company in 2009 grew22.1% reaching R$126.8 million versus R$103.9 million in 2008. Even with the debtrestructuring described in the Management Report which resulted in lower total debt cost, thegrowth of the Financial Expenses can be explained by several factors, including (i) the paymentof interest on the principal of the Perpetual Bonds (US$275 million) during the whole year of2009 while in 2008 the interest was paid based on the principal as of June (until that date itamounted US$200 million); (ii) the provision of the payment of interest related to theConvertible Debentures as of April 2009, and (iii) the inclusion of expenses related to the pricing
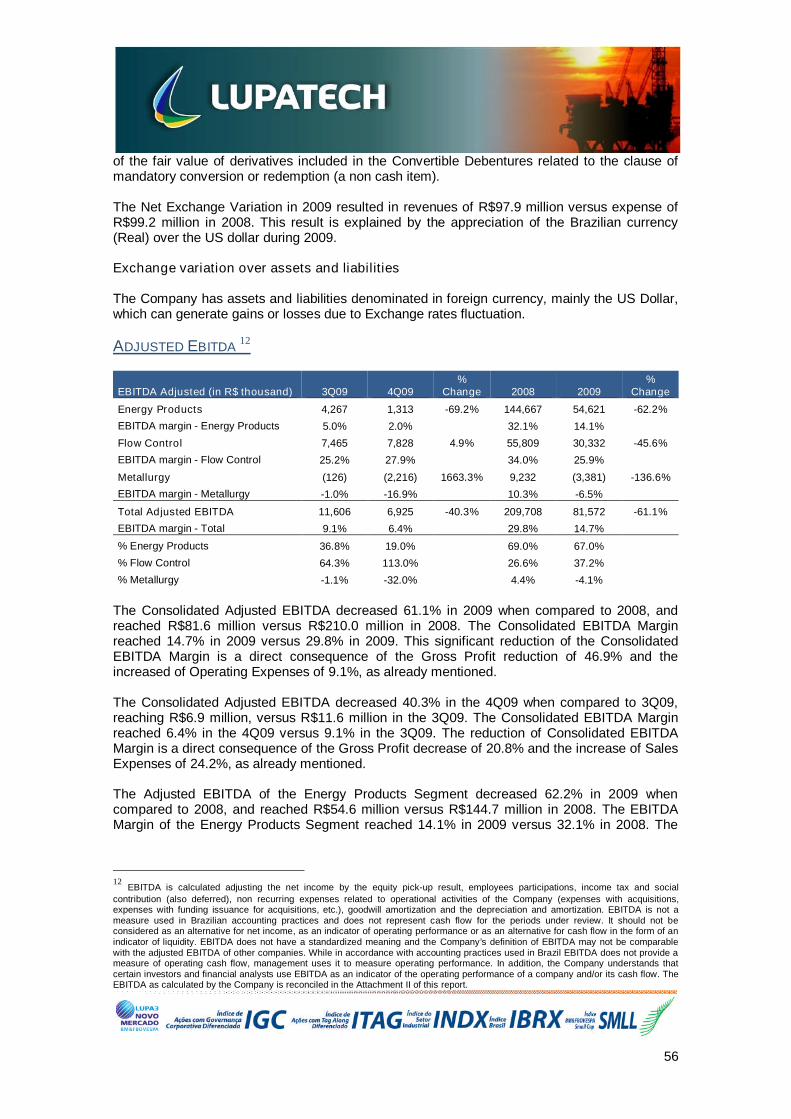
56
of the fair value of derivatives included in the Convertible Debentures related to the clause ofmandatory conversion or redemption (a non cash item).
The Net Exchange Variation in 2009 resulted in revenues of R$97.9 million versus expense ofR$99.2 million in 2008. This result is explained by the appreciation of the Brazilian currency(Real) over the US dollar during 2009.
Exchange variation over assets and liabilities
The Company has assets and liabilities denominated in foreign currency, mainly the US Dollar,which can generate gains or losses due to Exchange rates fluctuation.
ADJUSTED EBITDA12
EBITDA Adjusted (in R$ thousand) 3Q09 4Q09%
Change 2008 2009%
Change
Energy Products 4,267 1,313 -69.2% 144,667 54,621 -62.2%
EBITDA margin - Energy Products 5.0% 2.0% 32.1% 14.1%
Flow Control 7,465 7,828 4.9% 55,809 30,332 -45.6%
EBITDA margin - Flow Control 25.2% 27.9% 34.0% 25.9%
Metallurgy (126) (2,216) 1663.3% 9,232 (3,381) -136.6%
EBITDA margin - Metallurgy -1.0% -16.9% 10.3% -6.5%
Total Adjusted EBITDA 11,606 6,925 -40.3% 209,708 81,572 -61.1%
EBITDA margin - Total 9.1% 6.4% 29.8% 14.7%
% Energy Products 36.8% 19.0% 69.0% 67.0%
% Flow Control 64.3% 113.0% 26.6% 37.2%
% Metallurgy -1.1% -32.0% 4.4% -4.1%
The Consolidated Adjusted EBITDA decreased 61.1% in 2009 when compared to 2008, andreached R$81.6 million versus R$210.0 million in 2008. The Consolidated EBITDA Marginreached 14.7% in 2009 versus 29.8% in 2009. This significant reduction of the ConsolidatedEBITDA Margin is a direct consequence of the Gross Profit reduction of 46.9% and theincreased of Operating Expenses of 9.1%, as already mentioned.
The Consolidated Adjusted EBITDA decreased 40.3% in the 4Q09 when compared to 3Q09,reaching R$6.9 million, versus R$11.6 million in the 3Q09. The Consolidated EBITDA Marginreached 6.4% in the 4Q09 versus 9.1% in the 3Q09. The reduction of Consolidated EBITDAMargin is a direct consequence of the Gross Profit decrease of 20.8% and the increase of SalesExpenses of 24.2%, as already mentioned.
The Adjusted EBITDA of the Energy Products Segment decreased 62.2% in 2009 whencompared to 2008, and reached R$54.6 million versus R$144.7 million in 2008. The EBITDAMargin of the Energy Products Segment reached 14.1% in 2009 versus 32.1% in 2008. The
12EBITDA is calculated adjusting the net income by the equity pick-up result, employees participations, income tax and social
contribution (also deferred), non recurring expenses related to operational activities of the Company (expenses with acquisitions,expenses with funding issuance for acquisitions, etc.), goodwill amortization and the depreciation and amortization. EBITDA is not ameasure used in Brazilian accounting practices and does not represent cash flow for the periods under review. It should not beconsidered as an alternative for net income, as an indicator of operating performance or as an alternative for cash flow in the form of anindicator of liquidity. EBITDA does not have a standardized meaning and the Company’s definition of EBITDA may not be comparablewith the adjusted EBITDA of other companies. While in accordance with accounting practices used in Brazil EBITDA does not provide ameasure of operating cash flow, management uses it to measure operating performance. In addition, the Company understands thatcertain investors and financial analysts use EBITDA as an indicator of the operating performance of a company and/or its cash flow. TheEBITDA as calculated by the Company is reconciled in the Attachment II of this report.

57
significant reduction of the EBITDA Margin of this segment is a direct consequence of the GrossProfit reduction in 46.0% and the increase of Operating Expenses of 23.0%.
The Adjusted EBITDA of the Energy Products Segment decreased 69.2% in the 4Q09 whencompared to the 3Q09, reaching R$1.3 million versus R$4.3 million in the 3Q09. The EBITDAMargin of the Energy Products segment reached 2.0% in the 4Q09 versus 5.0% in the 3Q09.The reduction of the EBITDA Margin of this segment is a direct consequence of the Gross Profitreduction of 25.9% and the increase of Sales Expenses of 34.2%
The Adjusted EBITDA of the Flow Control Segment decreased 45.6% in 2009 when comparedto 2008, and reached R$30.3 million versus R$55.8 million in 2008. The EBITDA Margin of theFlow Control Segment reached 25.9% in 2009 versus 34.0% in 2008. The reduction of theEBITDA Margin of this segment is a direct consequence of the Gross Profit decrease of 37.3%due to more aggressive price policies applied during the year.
The Adjusted EBITDA of the Flow Control Segment increased 4.9% in the 4Q09 whencompared to the 3Q09, reaching R$7.8 million versus R$7.5 million in the 3Q09. The EBITDAMargin of the Flow Control Segment reached 27.9% in the 4Q09 versus 25.2% in the 3Q09.The growth of the EBITDA Margin of this segment is due to the increase of the depreciation in5.0%.
The Adjusted EBITDA of the Metallurgy Segment decreased 136.6% in 2009 when compared to2008, and reached the negative amount of R$3.4 million versus the positive amount of R$9.2million in 2008. The EBITDA Margin of the Metallurgy Segment reached the negativepercentage of 6.5% in 2009 versus 10.3% in 2008. The reduction of the EBITDA Margin of thissegment is a direct consequence of the Gross Profit reduction of 106.8%.
The Adjusted EBITDA of the Metallurgy Segment reached the negative amount of R$2.2 millionin the 4Q09 versus the negative amount of R$0.1 million in the 3Q09. The EBITDA Margin ofthe Metallurgy Segment reached the negative amount of 16.9% in the 4Q09 4T09 versus thenegative amount of 1.0% in the 3Q09. The reduction of the EBITDA Margin of this segment is adirect consequence of the Gross Profit reduction of 70.8% and the increase of the SalesExpenses in 6.5%.
Below is available the Adjusted EBITDA reconciliation per segment, as calculated by theCompany.
[The remaining of this page was left in blank intentionally]

58
ADJUSTED EBITDA RECONCILIATION IN 4Q09
Components (in R$ thousand)Energy
Products Flow Control Metallurgy Total
Gross Profit 11,555 11,188 (124) 22,619
SG&A (17,396) (7,329) (2,190) (26,915)
Management Salary (567) (208) (95) (870)
Depreciation and Amortization 6,130 1,456 2,657 10,243
Operating Income (except non-recurring) 685 3,136 38 3,859
Operating Expense (except non-recurring) (1,581) (837) (2,515) (4,933)
Elimination - Adjustments Law 11,638 – AVP13
2,709 - - 2,709Elimination - Provision PPR (variablecompensation) (222) 422 13 213
Adjusted EBITDA 1,313 7,828 (2,216) 6,925
RESULT BEFORE TAXES AND NET RESULT
Net Result (in R$ Million) 3Q09 4Q09%
Variation 2008 2009%
Variation
Result Before Taxes and Participations 27,009 (48,982) -281.4% (19,024) 27,360 243.8%
Current Income Tax & Social Contribution (1,933) (5,592) 189.3% (33,976) (14,581) -57.1%
Deferred Income Tax & SocialContribution 8,289 7,502 -9.5% 23,470 2,629 -88.8%
Participations - - n.a. - - n.a.
Net Result 33,365 (47,072) -241.1% (29,530) 15,408 152.2%
Net Profit/Loss per 1000 shares 0.70 -0.99 -241.1% -0.62 0.32 152.1%
The Consolidated Result Before Taxes and Participations recorded in 2009 is a Profit of R$27.4million versus a Loss of R$19.0 million in 2008. The Consolidated Result Before Taxes andParticipations in 2009 was positively impacted by the Net Financial Result recorded in 2009.
The Consolidated Result Before Taxes and Participations in the 4Q09 was negative in R$ 49.0million versus a positive amount of R$27.0 million in the 3Q09. The reduction of 281.4% in theConsolidated Result Before Taxes and Participations in the 4Q09 when compared to the 3Q09is mainly due to the reduction in the Operating Result cause by decrease of Revenuesrecognized during the 4Q09 when compared to the 3Q09 and also in the Financial Result.
The taxable result by the Income Tax and Social Contribution differs from the Result BeforeTaxes and Participations, and its calculation basis is described in Note 14.c.
With the calculation basis according to the accounting records, it was accrued Income Tax andSocial Contribution on the Result - Current in the amount of R$14.6 million in 2009, 57.1% lowerthan that accrued in 2008. In the 4Q09, it was accrued Income Tax and Social Contribution onthe Result - Current in the amount of R$5.6 million versus R$1.9 million in the 3Q09
13Present value adjustment

59
The Consolidated Net Result in 2009 was R$15.4 million versus a loss of R$29.5 millionrecorded in 2008. In the 4Q09, the Consolidated Net result amounted to loss of R$47.1 million,versus a profit of R$33.4 million in the 3Q09.
[The remaining of this page was left in blank intentionally]

60
MANAGEMENT COMMENTS ON THE BALANCE SHEET PERFORMANCE
These comments, except when otherwise stated, refer to the fourth quarter of 2009 (4Q09),comparatively to the 3Q09.
OPERATIONAL WORKING CAPITAL
Working Capital (R$ thousand) 2008 2009%
Change Nominal Change
Accounts Receivable 264,294 188,116 -28.8% (76,178)
Inventories 195,801 164,015 -16.2% (31,786)
Accounts Payable 54,064 35,897 -33.6% (18,167)
Advances from Clients 17,564 8,126 -53.7% (9,438)
Employed Working Capital 388,467 308,108 -20.7% (80,359)
Employed Working Capital Variation (80,359)
The balance of Accounts Receivable decreased R$76.2 million in 2009, representing 28.8%less than the balance of 2008. The reduction of the Accounts Receivable is mainly due to loweractivity levels as well as the effective receivables collection.
The Inventories balance decreased R$31.8 million in 2009, representing 16.2% less than thebalance of 2008 due to the decrease in purchasing volumes as well as the effect of exchangevariance (R$20.6 million) of the Brazilian Real and Argentinean Peso which impacted theaccounting value of inventories kept in Argentina.
The Accounts Payable (suppliers) decreased R$18.2 million in 2009, or 33.6% over the 2008balance, as a result of lower purchasing volumes.
Advances from Clients decreased R$9.4 million in 2009, or 53.7% when compared to 2008.This decrease is due to lower commercial activity on projects that include advances from clients.
The Operating Working Capital change in 2009 resulted in a cash generation of R$80.4 million.The ratio of Working Capital invested over the Net Consolidated Revenues of the Company inthe last four quarters reached 55.5%.
Below it is presented a chart with the quarterly trend of the working capital usage as apercentage of the Net Consolidated Revenues of the last twelve months.
[The remaining of this page was left in blank intentionally]

61
WORKING CAPITAL UTILIZATION AS A PERCENTAGE OF THE CONSOLIDATED NET REVENUES
OF THE LAST FOUR QUARTERS
CASH POSITION
Cash and Cash Equivalents (In R$thousand) 2008 2009
%Change Nominal Change
Cash & Cash Equivalents 316,874 131,160 -58.6% (185,714)
Due to the conclusion of the debt profile extension process of the Company, the Managementdecided to reduce the cash position, which still exceeds the payments of interest amortizationand debt of the Company for the year 2010.
The Company’s Consolidated Cash and Cash Equivalents in the 2009 reached R$131.2 million.The reduction of R$185.7 million when compared to 2008 is mainly explained by the payment ofacquisitions of subsidiaries in the amount of R$71.3 million, purchase of fixed asset in theamount of R$54.0 million and exchange variation effects verified in the cash position totaling R$45.0 million.
[The remaining of this page was left in blank intentionally]
460556
673704
716 719
646
555
48.6% 45.9%
49.9%
55.2% 56.6%54.8%
60.4%
55.5%
-5%
5%
15%
25%
35%
45%
55%
65%
-
100
200
300
400
500
600
700
800
900
1,000
1Q08 2Q08 3Q08 4Q08 1Q09 2Q09 3Q09 4Q09
R$ m
Net Revenues (LTM) WC as % of Net Revenues

62
DEBT
Debt (R$ thousand) 2008 2009%
Change Nominal Change
Short Term 171,727 56,784 -66.9% (114,943)
Long Term 377,978 174,304 -53.9% (203,674)
Debentures - 340,228 n.a. 340,228
Perpetual Bond 634,999 475,023 -25.2% (159,976)
Total Debt 1,184,704 1,046,339 -11.7% (138,365)
Cash & Marketable Securities 316,874 131,160 -58.6% (185,714)
Net Cash Position (867,830) (915,179) 5.5% (47,349)
As mentioned in the Management Report, the Company concluded during the end of 2009 therestructuring of its debt structure profile. This restructuring enabled the reduction of the totaldebt cost as well as the extension of the average maturity, resulting in a change of the total debtbalance, which decreased 11.7% when compared to 2008 reaching R$1.0 billion.
The Consolidated Short Term Debt in 2008 reached R$56.8 million, a decrease of 66.9% whencompared to 2008, due to the settlement of short term debt.
The Long Term Debt, which does not include the Perpetual Bonds and the ConvertibleDebentures, decreased 53.9% or R$203.7 million, also due to the pre-settlement of financialloans with maturity expected for 2009 and 2010.
The proceeds used to settle the short term financial debt mentioned above came from financialloans received from the BNDES, being R$131 million of loans booked as short term and R$320million as Convertible Debentures.
The conversion price for the Convertible Debentures has not been defined yet, with a deadlinedate of April 15, 2011, due to the calculation of the moving averages, the minimum price onwhich the premium will be added, increased from of R$17.50 to R$26.93, thereby reducing thepercentage of dilution in the event of conversion of the Convertible Debentures.
The Perpetual Bonds balance in the 2009 decreased 25.2% reaching R$475.0 million whencompared to 2008, due to the exchange variance verified during the period. The Company doesnot hedge the FX exposure on the principal of the Perpetual Bonds.
Thus, the Consolidated Net Debt reached at the end of 2009 the level of R$915.2 million, anincrease of 5.5% versus 2008, mainly due to the reduction of the cash position.
The Consolidated Net Debt with maturity (excluding the Perpetual Bonds) including theDebentures, reached R$571.3 million, being 59.6% of Convertible Debentures, 9.9% of ShortTerm and 30.5% of Long Term.
[The remaining of this page was left in blank intentionally]
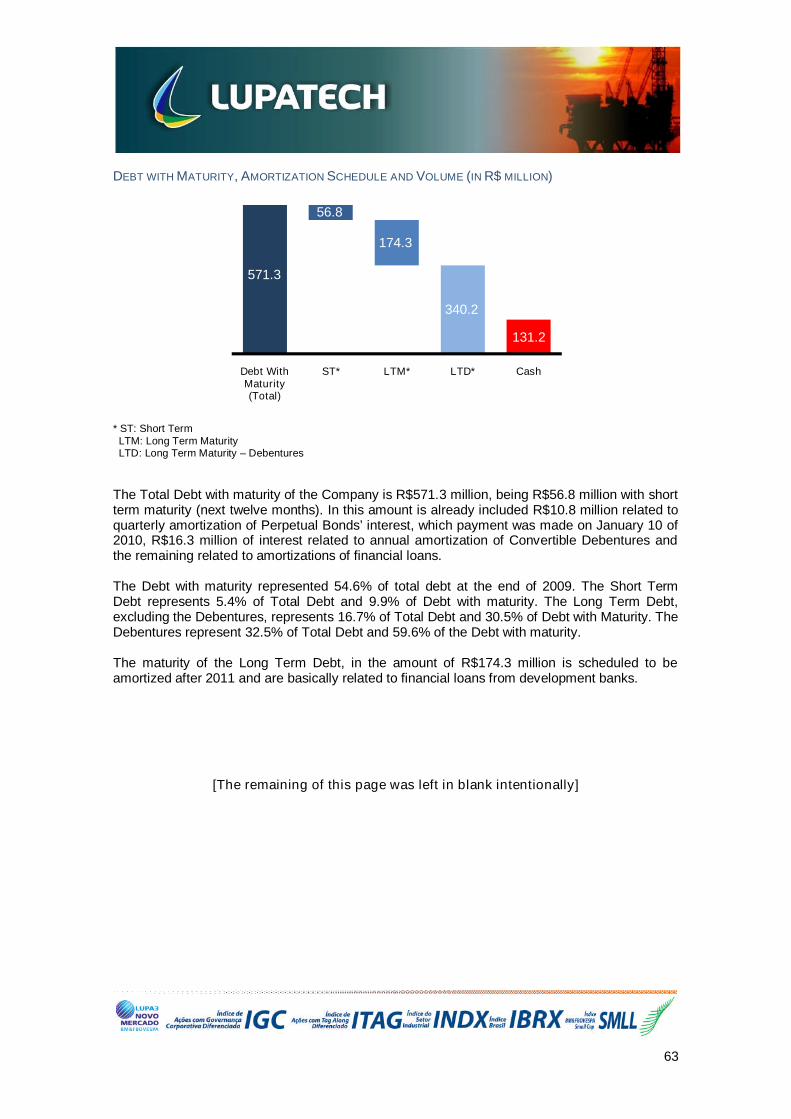
63
DEBT WITH MATURITY, AMORTIZATION SCHEDULE AND VOLUME (IN R$ MILLION)
* ST: Short TermLTM: Long Term MaturityLTD: Long Term Maturity – Debentures
The Total Debt with maturity of the Company is R$571.3 million, being R$56.8 million with shortterm maturity (next twelve months). In this amount is already included R$10.8 million related toquarterly amortization of Perpetual Bonds’ interest, which payment was made on January 10 of2010, R$16.3 million of interest related to annual amortization of Convertible Debentures andthe remaining related to amortizations of financial loans.
The Debt with maturity represented 54.6% of total debt at the end of 2009. The Short TermDebt represents 5.4% of Total Debt and 9.9% of Debt with maturity. The Long Term Debt,excluding the Debentures, represents 16.7% of Total Debt and 30.5% of Debt with Maturity. TheDebentures represent 32.5% of Total Debt and 59.6% of the Debt with maturity.
The maturity of the Long Term Debt, in the amount of R$174.3 million is scheduled to beamortized after 2011 and are basically related to financial loans from development banks.
[The remaining of this page was left in blank intentionally]
571.3
56.8
174.3
340.2
131.2
Debt WithMaturity(Total)
ST* LTM* LTD* Cash

64
CAPITAL STRUCTURE
The Debt of the Company has a long term maturity, except for 5.4% of the total debt or 4.3% ofthe capital structure, which matures in the next twelve months. This amount also includes theinterest on the long term debt.
Adjusting the Equity to the Perpetual Bonds (a stable source of financing for the Company), thedebt (with maturity) represents 42.9% of the Company’s Total Capital.
In the chart above it can be noticed the improvement of the capital structure and debt profile ofthe Company from 2008 to 2009. The short term debt which accounted for 11.5% of the capitalstructure in 2008, at the end of 2009 it represented only 4.3%. The long term debt whichaccounted for 25.3%, now account for 13.1%. The Perpetual Bonds, which represented 42.6%at the end of 2008, in 2009 accounted for 35.6% of Lupatech’ capital structure.
INVESTMENTS (FIXED ASSETS)
Investments (R$ thousand) 2008 2009%
Change Nominal Change
Investments in Affiliates 2,435 2,386 -2.0% (49)
Fixed Assets 307,156 317,960 3.5% 10,804
Intangible 503,674 506,670 0.6% 2,996
Total 813,265 827,016 1.7% 13,751
The Total Investments of the Company grew 1.7% in 2009, reaching R$827.0 million versus R$813.3 million in 2008, mainly due to investments in purchase of fixed asset.
Debentures25.5%
LT 25.3%
LT 13.1%
ST 11.5%
ST 4.3%
2008 2009
CAPITAL STRUCTURE2008
DEBT WITH MATURITY AS A
PERCENTAGE OF THE TOTAL CAPITALSTRUCTURE
CAPITAL STRUCTURE2009
PerpetualBond42.6% Debt
36.8%
Equityl20.6%
PerpetualBond35.6%
Equity21.5%
Debt42.9%

65
ATTACHMENT I – INCOME STATEMENT (IN R$ THOUSAND)
ATTACHMENT II – ADJUSTED EBITDA RECONCILIATION14 (IN R$ THOUSAND)
14Reconciliation starting from the Net Consolidated Result of the Company
Consolidated Income Statement 2009 2008 % Change
Gross Sales and Services 627,374 777,721 -19%
Sales Taxes & Deductions from Gross Sales (72,212) (73,048) -1%
Net Sales and Services 555,162 704,673 -21%
Cost of Goods and Services Sold (402,996) (418,036) -4%
Gross Profit 152,166 286,637 -47%
Operating Revenues/Expenses (124,806) (305,661) -59%
Sales (57,170) (60,993) -6%
General and Administrative (54,722) (49,612) 10%
Net Financial Result (2,519) (194,518) -99%
Financial Income 189,323 43,495 335%
Financial Expenses (191,842) (238,013) -19%
Other Operating Revenues 6,631 6,088 9%
Negative Goodwill - 5,958 -100%
Other Operating Expenses (17,775) (13,512) 32%
Goodwill Amortization - - n.a.
Other (6,307) (9,210) -32%
Equity Pickup 749 928 -19%
Operating Result 27,360 (19,024) -244%
Earnings Before Income Tax 27,360 (19,024) -244%
Provision for Income Tax and Social Contribution (14,581) (33,976) -57%
Deferred Income Tax 2,629 23,470 -89%
Minority Interest - - n.a.Current Result 15,408 (29,530) 152%
EBITDA Reconciliation 2009 2008 % Change
EBITDA 81,572 209,708 -61%
Depreciation and Amortization (36,227) (23,607) 53%
Negative goodwill - 5,958 n.a.
Non-recurring operationg expenses (7,187) (6,970) 3%
Operationg expenses* (8,006) (2,265) 253%
Net Financial Result (2,519) (194,518) -99%
Income Tax and Social Contribution (14,581) (33,976) -57%
Deferred ncome Tax and Social Contribution 2,629 23,470 140%
Workforce expenses (1,021) (8,258) -88%
Equity pick-up result 749 928 -19%
Net Income 15,408 (29,530) 152%

66
ATTACHMENT III – BALANCE SHEET (IN R$ THOUSAND)
Consolidated Balance Sheet 2009 2008 % Change
Total Asset 1.477.442 1.729.699 -15%
Current Assets 554.419 836.153 -34%
Available 131.160 316.874 -59%
Cash and Cash Equivalents 131.160 316.874 -59%
Credits 230.194 313.874 -27%
Clients 184.659 262.062 -30%
Other Credits 45.535 51.812 -12%
Recoverable Taxes 45.535 51.812 -12%
Deferred Income Taxes and Social Contribution - - n.a.
Inventories 164.015 195.801 -16%
Other 29.050 9.604 202%
Non-current Assets 923.023 893.546 3%
Other Credits 90.811 57.601 58%
Judicial Deposits 1.214 5.988 -80%
Clients 3.457 2.232 55%
Recoverable Taxes 23.432 10.544 122%
Deferred Income Taxes and Social Contribution 62.708 38.837 61%
Other 5.196 22.680 -77%
Investiments 2.386 2.435 -2%
Fixed Assets 317.960 307.156 4%
Intangible 506.670 503.674 1%
Total Liabilities and shareholders´equity 1.477.442 1.729.699 -15%
Current Liabilities 150.572 381.727 -61%
Borrowings 29.711 157.814 -81%
Interest on Perpetual Bonds 10.760 13.913 -23%
Interest on Debentures 16.313 - n.a.
Suppliers 35.897 54.064 -34%
Income Tax and Social Contribution 17.648 28.152 -37%
Dividends - - n.a.
Provisions 8.782 8.614 2%
Other Liabilities 31.461 119.170 -74%
Accounts Payable from Investments 2.240 78.620 n.a.
Payroll 5.398 4.979 8%
Client Advances 8.126 17.564 -54%
Profit Sharing Programs 930 7.132 -87%
Other 14.767 10.875 36%
Non-current Liabilities 1.039.610 1.041.346 0%
Borrowings 174.304 377.978 -54%
Perpetual Bonds 475.023 634.999 -25%
Debentures 340.228 - n.a.
Provisions 42.682 27.195 57%
Provision for Contingencies 7.860 13.615 -42%
Provision for Income Tax & Social Contribution 34.822 13.580 156%
Others 7.373 1.174 528%
Non Controlling Shareholder Stake - - n.a.
Shareholders Equity 287.260 306.626 -6%
Capital Stock 311.525 309.850 1%
Revaluation Reserves - - n.a.
Capital Reserves 11.002 7.516 46%
Profit Reserves - - n.a.
Equity Evaluation Adjustment (30.497) 9.438 -423%
Current Result (4.770) (20.178) -76%

67
ATTACHMENT IV – CASH FLOW STATEMENT (IN R$ THOUSAND)
Consolidated Cash Flow (ended in): 2009 2008 % Change
Net Income (loss) in the period 15.408 (29.530) 255%
Adjustments to reconcile the income to cash equivalents from operating activities
Depreciation of fixed assets 36.227 23.607 53%
Negative goodwill - (5.958) n.a.
Equity pick-up result (749) (928) -19%
Cost of write-off or sale of fixed assets 706 13.162 -95%
Financial expenses and exchange variation 11.702 225.416 -95%
Expenses with stock option exercise 3.486 2.532 38%
Income Tax and Social Contribution - Deferred (2.629) (23.470) -89%
Changes in assets & liabilities 32.574 (157.770) -121%
(Increase) Decrease in accounts receivable 55.703 (119.922) -146%
(Increase) Decrease in inventories 9.415 (45.685) -121%
(Increase) Decrease in recoverable taxes (12.311) (26.784) -54%
(Increase) Decrease in other assets 751 11.542 -93%
(Increase) Decrease in suppliers (11.988) 571 -2199%
(Increase) Decrease in taxes payable (6.221) 4.429 -240%
(Increase) Decrease in accounts payable (2.775) 18.079 -115%
Net cash equivalents invested in operating activities 96.725 47.061 106%
Cash flow from investment activities
Investments (77.876) (105.372) -26%
Aquisition of fixed assets (54.014) (124.928) -57%
Addition to intangible (4.589) (6.437) -29%
Sale of fixed assets - - n.a.
Cash & Marketable Securities of acquisitions - (18.844) n.a.
Net cash equivalents used in operating activities (136.479) (255.581) 0%
Cash flow from financing activities
Borrowings and financing contracted 136.760 332.267 -59%
Issuance of Debentures 328.631 - n.a.
Issuance of Perpetual Bonds - 118.900 n.a.
Capital payment 1.675 2.339 -28%
Borrowings and financing paid (567.978) (224.813) 153%
Effects of exchange variation over cash and cash equivalents of subsidiaries abroad (45.048) 58.385 -177%
Net cash equivalents generated (invested in) financing activities (100.912) 228.693 -144%
Increase (Decrease) in cash equivalents (185.714) 78.558 -336%
At the beginning of the year 316.874 238.316 33%
At the end of the year 131.160 316.874 -59%
68
CONTACTS – INVESTOR RELATIONS
Thiago Alonso de Oliveira Cynthia BurinCFO & IRO IR Manager
Telephone: + 55 (11) 2134-7000 or + 55 (11) 2134-7088Email: [email protected]
ABOUT LUPATECH
Lupatech S.A. has three business segments: Energy Products, Flow Control and Metallurgy.The Energy Products Segment offers high value-added products and services for the Oil &Gas sector, including deepwater platform anchoring ropes, valves, oil wells completion tools,tube coating, natural gas compressors, sensors and services through the “Lupatech MNA”,“Lupatech CSL”, “Lupatech Tecval”, “Lupatech Oil Tools”, “Lupatech Esferomatic”, “LupatechOil & Gas Services”, “Lupatech Tubular Services”, “Lupatech Monitoring Systems”, “Aspro”,“Sinergás” and “Norpatagonica” brands. The Flow Control Segment heads the nationalrankings in the production and sale of industrial valves, primarily for the chemical,petrochemical, pharmaceutical, pulp and paper and construction industries, under the “LupatechValmicro”, “Lupatech Mipel”, “ValBol” and “Jefferson” brand names. The Metallurgy Segmentis among the international leaders in the development and production of parts, complex partsand sub-assemblies, mainly for the global auto industry. It employs the precision casting andsteel injection processes, techniques that it pioneered in Latin America. It also produces high-corrosion-resistant cast-alloy housings for industrial valves and pumps, chiefly for applicationsin the oil and gas industry under the “Microinox”, “Steelinject” and “Itasa” brands.
This release contains forward-looking statements subject to risks and uncertainties. Such forward-looking statements are based on the management’s beliefsand assumptions and information currently available to the Company. Forward-looking statements include information on our intentions, beliefs or currentexpectations, as well as on those of the Company’s Board of Directors and Officers. The reservations as to forward-looking statements and information alsoinclude information on possible or presumed operating results, as well as any statements preceded, followed or including words such as “believes”, “may”, “will”,“expects”, “intends”, “plans”, “estimates” or similar expressions. Forward-looking statements are not performance guarantees; they involve risks, uncertaintiesand assumptions because they refer to future events and, therefore, depend on circumstances which may or may not occur. Future results may differ materiallyfrom those expressed or suggested by forward-looking statements. Many of the factors which will determine these results and figures are beyond Lupatech’control or prediction capacity.