life-history patterns of lizards of the worlddshepard/pdfs/mesquita et al amnat 2016.pdf ·...
TRANSCRIPT

Life-History Patterns of Lizards of the World
Daniel O. Mesquita,1,*,† Gabriel C. Costa,2,† Guarino R. Colli,3 Taís B. Costa,1 Donald B. Shepard,4
Laurie J. Vitt,5 and Eric R. Pianka6
1. Departamento de Sistemática e Ecologia, Centro de Ciências Exatas e da Natureza, Universidade Federal da Paraíba, Avenida CasteloBranco, s/n, João Pessoa, Paraíba, 58000-000, Brazil; 2. Departamento de Ecologia, Centro de Biociências, Universidade Federal do RioGrande do Norte, Lagoa Nova, Natal, Rio Grande do Norte, 59072-970, Brazil; 3. Departamento de Zoologia, Instituto de CiênciasBiológicas, Universidade de Brasília, Brasília, Distrito Federal, 70910-900, Brazil; 4. Department of Biology, University of Central Arkansas,Conway, Arkansas 72035; 5. Sam Noble Museum and Department of Biology, University of Oklahoma, Norman, Oklahoma 73072;6. Department of Integrative Biology, University of Texas, Austin, Texas 78712
Submitted January 21, 2015; Accepted January 7, 2016; Electronically published March 31, 2016
Online enhancements: supplemental material. Dryad data: http://dx.doi.org/10.5061/dryad.55610.
abstract: Identification of mechanisms that promote variation inlife-history traits is critical to understand the evolution of divergentreproductive strategies. Here we compiled a large life-history data set(674 lizard populations, representing 297 species from 263 sites glob-ally) to test a number of hypotheses regarding the evolution of life-history traits in lizards. We found significant phylogenetic signal inmost life-history traits, although phylogenetic signal was not par-ticularly high. Climatic variables influenced the evolution of manytraits, with clutch frequency being positively related to precipitationand clutches of tropical lizards being smaller than those of temperatespecies. This result supports the hypothesis that in tropical and lessseasonal climates, many lizards tend to reproduce repeatedly through-out the season, producing smaller clutches during each reproductiveepisode. Our analysis also supported the hypothesis that viviparityhas evolved in lizards as a response to cooler climates. Finally, we alsofound that variation in trait values explained by clade membership isunevenly distributed among lizard clades, with basal clades and a fewyounger clades showing the most variation. Our global analyses arelargely consistent with life-history theory and previous results basedon smaller and scattered data sets, suggesting that these patterns are re-markably consistent across geographic and taxonomic scales.
Keywords: Squamata, life history, reproduction, historical factors,climatic factors, phylogenetic analysis.
Introduction
Life-history traits are fundamentally constrained by trade-offs among survival, growth, and reproduction (Stearns1992). Considering that resources may be limited, differ-ential allocation of energy to one of these life functionsreduces investment in others. As a consequence, individu-
als cannot simultaneously optimize all life-history traits.Therefore, traits are shaped by a complex natural selectionlandscape that is influencedby a variety of factors, such as phys-ical condition of individuals, climate, food supply, bauplan,and evolutionary history, which are often correlated and dif-ficult to tease apart (Dunham and Miles 1985; Miles andDunham 1992). Identification of mechanisms that generatevariation in life-history traits is critical for understandingevolution of divergent reproductive strategies. The timingandmagnitude of reproductive investment, size and numberof offspring, growth patterns, age at maturity, reproductivelife span, and age-specific mortality schedules are examplesof life-history traits that have traditionally been consideredas key variables in life-history studies (Mesquita et al. 2016b;Roff 1992; Roff 2002; Stearns 1992). Here, we use a new globaldata set on lizard life-history traits (Mesquita et al. 2015), withhigh geographic and taxonomic coverage, to explore patternsof covariation in life-history traits. We use this new and ex-tended data set to test general hypotheses derived from life-history theory. In addition, we attempt to unravel whetherobserved life-history patterns are shaped by climate, foragingmode, tropical versus temperate distribution, and/or habitatspecialization.The evolution of phenotypic characteristics such as life-
history traits is a complex phenomenon, influenced bymany different processes affecting rates and mode of evolu-tion (Ackerly 2009; Mahler et al. 2010; Revell et al. 2012).The interaction of different phenotypic rates (e.g., slow orfast evolution) with different evolutionary modes (e.g., sta-bilizing and/or directional selection, genetic drift) will re-sult in a range of patterns regarding the phenotypic similar-ity among related species (Revell et al. 2008). At one endof the range, closely related species may show similar life-history traits. Many underlying mechanisms—such as stabi-lizing selection, genetic constraints, and/or gene flow—maycontribute to this pattern (i.e., niche conservatism; Losos
* Corresponding author; e-mail: [email protected].† These authors contributed equally to this work.
Am. Nat. 2016. Vol. 187, pp. 689–705. q 2016 by The University of Chicago.0003-0147/2016/18706-56003$15.00. All rights reserved.DOI: 10.1086/686055
vol . 1 8 7 , no . 6 the amer ican natural i st june 20 16

2011; Pyron et al. 2015; Wiens and Graham 2005). For in-stance, if life-history traits show adaptive responses to cli-matic conditions and related species continue to occupy sim-ilar climates, then natural selection will prevent speciesdivergence in those traits. In this scenario, the predicted out-come is a strong pattern of phylogeny predicting life-historytraits. At the other end of the range, phenotypic similaritymay be largely independent of phylogenetic relationships,and in some cases, even closely related species can be verydissimilar in some ecological attributes (e.g., in adaptive radia-tions). This can be caused by rapid rates of phenotypic evolu-tion or stabilizing selection on a single optimum (Ornstein-Uhlenbeck model; Revell et al. 2008). Previous studies foundstrong evidence for niche conservatism of reproductive traitsin squamates. For instance, some clades of tropical SouthAmerican lizards show high phylogenetic conservatism inbody and clutch size (Mesquita and Colli 2010). Conversely,other studies showed high lability in life-history traits. Forexample, viviparity in squamate reptiles is a well-known caseof multiple convergences evolving as a response to cooler cli-mates (Fraipont et al. 1996; Shine 2005; Pyron and Burbrink2014). Therefore, understanding how traits evolve is essentialto quantify life-history variation and test hypotheses aboutwhat factors affect life-history traits.
Many hypotheses have been proposed to explain varia-tion in life-history traits in lizards. For instance, some stud-ies suggest that body size and relative clutch mass (RCM)have coevolved with foraging mode (see Vitt and Congdon1978; Huey and Pianka 1981). By virtue of their streamlinedbodies, active foragers tend to have clutches representing asmall proportion of total body mass. Conversely, sit-and-wait ambush foragers tend to have stockier bodies andhigher RCM (Vitt and Congdon 1978). Therefore, this hy-pothesis predicts that RCM will be higher in sit-and-waitforagers. Other hypotheses suggest that reproductive modeis influenced by thermal regimes associated with develop-ment: in tropical regions, ectotherms can rely on warm tem-peratures for egg development, whereas in cold climates, asin temperate regions, maternal thermoregulation (i.e., vivi-parity) can yield more efficient embryo protection and morerapid development (Huey 1977; Blackburn 1982; Shine 2005).Therefore, this hypothesis predicts that viviparity should bemore common in colder climates. Also, many studies suggestdifferent hypotheses about the relationship of climate andlife-history traits. For instance, as a result of increased compe-tition, higher predation on hatchlings, energetic advantagesof frequent oviposition, and/or lower clutch mass due to ma-ternal mobility in tropical lizards (e.g., Inger and Greenberg1966; Tinkle et al. 1970; Andrews and Rand 1974), largerclutches are expected in more seasonal climates (James andShine 1988). Previous studies have also suggested that habitatspecialization can constrain life-history traits. For example,use of rock crevices as shelter strongly influences body shape,
suggestingmorphological constraints on the evolution of life-history traits, including clutch/litter size, size at birth, andRCM (see Vitt 1981; Zamora-Abrego et al. 2007). Therefore,this hypothesis predicts differences in life-history traits amongdifferent habitat use specialization categories, such as arboreal,fossorial, and saxicolous (Losos 2011).Herein we apply modern phylogenetic comparative meth-
ods to analyze the data set mentioned above (Mesquita et al.2015).With these new data and tools, we aim to effectively ac-count for evolutionary history while testing the following spe-cific ecological hypotheses: (1) Foraging mode constrains RCM.Prediction: active foragers will have lower RCM. (2) Temper-ature affects reproductive mode. Prediction: viviparity willbe more conspicuous in temperate species and those foundat higher elevations. (3) Habitat specialization constrains life-history traits. Prediction: lizards with different habitat spe-cializations will show differences in traits, such as clutch/litter size, size at birth, and/or RCM. (4) Evolutionary historyexplains trait characteristics but in varying degrees acrossclades (see Vitt and Pianka 2005). Prediction: variation intrait values explained by clademembership will be unevenlydistributed among lizard clades.
Methods
Lizard Life-History Data Set
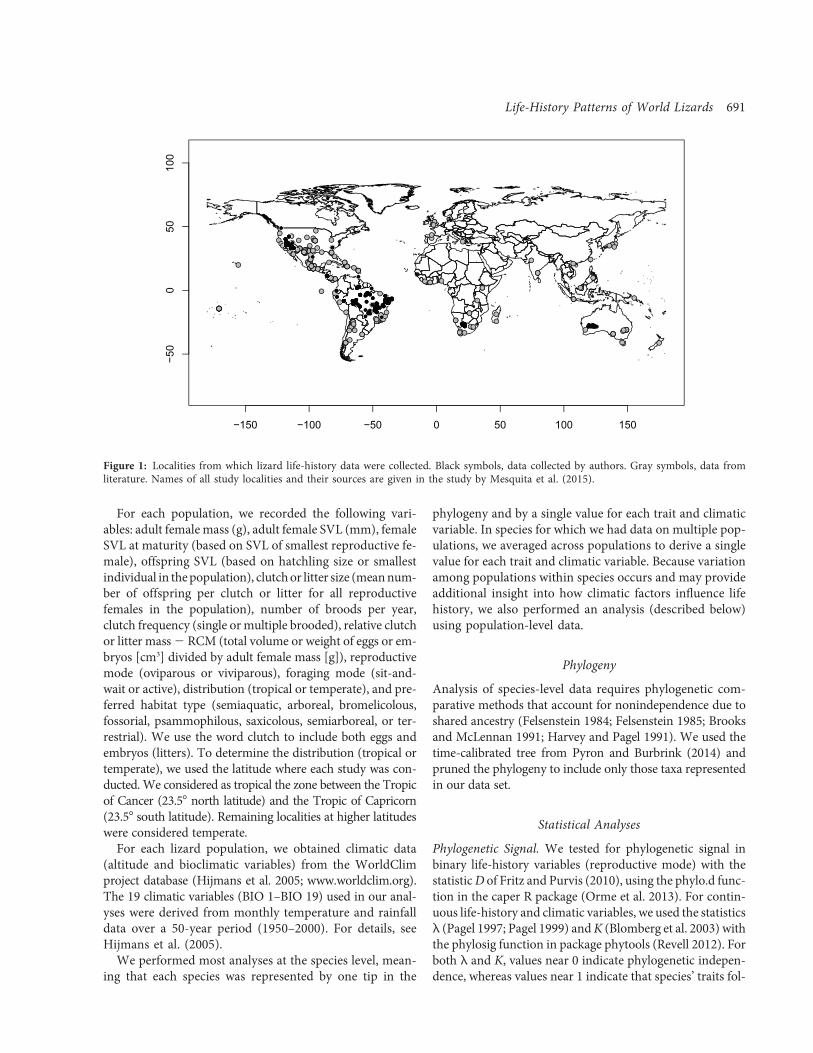
Our data set consists of life-history data for 674 lizard pop-ulations, representing 297 species in 33 families, from 263study sites including all continents except Antarctica (fig. 1).About 65% of these data were collected directly by the au-thors, and remaining data were obtained from the literature(fig. 1). All data collected are described in a data paper anddeposited in Ecological Archives, http://dx.doi.org/10.1890/14-1453.1 (Mesquita et al. 2015), and in the Dryad DigitalRepository, http://dx.doi.org/10.5061/dryad.55610 (Mesquitaet al. 2016a), and a summary is presented in the supplementalmaterial, table S1 (available online).Regarding data collected by authors, lizards were sexed
by dissection and direct examination of gonads. Femaleswere considered reproductive if vitellogenic follicles or ovi-ductal eggs were present. We regarded the simultaneouspresence of enlarged vitellogenic follicles and either oviduc-tal eggs or corpora lutea as evidence for the sequential pro-duction of more than one clutch of eggs per year. Two dif-ferent and possibly valid ways to determine clutch size exist.One is based on the number of oviductal eggs or enlargedvitellogenic follicles. The other is based on the number ofeggs an individual would place in a nest (number of eggs ac-tually deposited). Since we do not have data on lizard nests,we used the first estimate. For each lizard, we measuredsnout-vent length (SVL) with calipers or rulers to the nearestmillimeter.
690 The American Naturalist
For each population, we recorded the following vari-ables: adult female mass (g), adult female SVL (mm), femaleSVL at maturity (based on SVL of smallest reproductive fe-male), offspring SVL (based on hatchling size or smallestindividual in thepopulation), clutchor litter size (meannum-ber of offspring per clutch or litter for all reproductivefemales in the population), number of broods per year,clutch frequency (single or multiple brooded), relative clutchor litter mass2 RCM (total volume or weight of eggs or em-bryos [cm3] divided by adult female mass [g]), reproductivemode (oviparous or viviparous), foraging mode (sit-and-wait or active), distribution (tropical or temperate), and pre-ferred habitat type (semiaquatic, arboreal, bromelicolous,fossorial, psammophilous, saxicolous, semiarboreal, or ter-restrial). We use the word clutch to include both eggs andembryos (litters). To determine the distribution (tropical ortemperate), we used the latitude where each study was con-ducted. We considered as tropical the zone between the Tropicof Cancer (23.57 north latitude) and the Tropic of Capricorn(23.57 south latitude). Remaining localities at higher latitudeswere considered temperate.
For each lizard population, we obtained climatic data(altitude and bioclimatic variables) from the WorldClimproject database (Hijmans et al. 2005; www.worldclim.org).The 19 climatic variables (BIO 1–BIO 19) used in our anal-yses were derived from monthly temperature and rainfalldata over a 50-year period (1950–2000). For details, seeHijmans et al. (2005).
We performed most analyses at the species level, mean-ing that each species was represented by one tip in the
phylogeny and by a single value for each trait and climaticvariable. In species for which we had data on multiple pop-ulations, we averaged across populations to derive a singlevalue for each trait and climatic variable. Because variationamong populations within species occurs and may provideadditional insight into how climatic factors influence lifehistory, we also performed an analysis (described below)using population-level data.
Phylogeny
Analysis of species-level data requires phylogenetic com-parative methods that account for nonindependence due toshared ancestry (Felsenstein 1984; Felsenstein 1985; Brooksand McLennan 1991; Harvey and Pagel 1991). We used thetime-calibrated tree from Pyron and Burbrink (2014) andpruned the phylogeny to include only those taxa representedin our data set.
Statistical Analyses
Phylogenetic Signal. We tested for phylogenetic signal inbinary life-history variables (reproductive mode) with thestatisticD of Fritz and Purvis (2010), using the phylo.d func-tion in the caper R package (Orme et al. 2013). For contin-uous life-history and climatic variables, we used the statisticsl (Pagel 1997; Pagel 1999) andK (Blomberg et al. 2003) withthe phylosig function in package phytools (Revell 2012). Forboth l and K, values near 0 indicate phylogenetic indepen-dence, whereas values near 1 indicate that species’ traits fol-
−150 −100 −50 0 50 100 150
−50
050
100
Figure 1: Localities from which lizard life-history data were collected. Black symbols, data collected by authors. Gray symbols, data fromliterature. Names of all study localities and their sources are given in the study by Mesquita et al. (2015).
Life-History Patterns of World Lizards 691
20 myr

low a Brownianmotionmodel of trait evolution (Pagel 1999;Freckleton et al. 2002; Blomberg et al. 2003; Losos 2008).Additionally, K 1 1 implies that close relatives are moresimilar than expected under a Brownian motion model oftrait evolution (i.e., niche conservatism; Blomberg et al.2003; Münkemüller et al. 2012). We tested for significancein the phylogenetic signal (null hypothesis of l and K near 0)given by K using 1,000 randomizations of species names inthe phylogeny (Blomberg et al. 2003). The significance of lwas assessed with a likelihood ratio test (Pagel 1999). Thelikelihood ratio test compares the likelihood of l calculatedfrom the true tree to the likelihood of l ¼ 1.
Relationship between Climate and Life-History Traits. Toassess the influence of climate on life-history traits, we builtordinary least squares models for continuous traits (adultfemale mass and SVL, female SVL at maturity, offspring SVL,clutch size, and RCM), general linear models with Poissonerror structure for count traits (broods per year, clutch fre-quency), and binomial error structure for binary traits (re-productive mode). We also built phylogenetic regressionmodels for each trait against abiotic climatic variables. Thephylogenetic models comprised the phylogenetic logistic re-gression (Ives and Garland 2010) for binary traits, phyloge-netic Poisson regression (Paradis and Claude 2002) for counttraits, and phylogenetic generalized least squares (Grafen1989) for continuous traits. We checked the assumptionsof normality and homoscedasticity of phylogenetic general-ized least squares residuals by examining residual plots andwith Shapiro and Bartlett tests, respectively (Quinn andKeough 2002). Whenever such assumptions were not met,we employed the Box-Cox transformation (Box and Cox1964) of the response variable using R package MASS (Ven-ables and Ripley 2002). To generate climatic predictors inthese models, we reduced the 19 bioclimatic variables usingtwo principal component analyses (PCAs), one with temper-ature variables (BIO1–BIO11) and another with precipitationvariables (BIO12–BIO19). The first (61.9%) and second(25.9%) axes of the temperature PCA captured 87.8% of thetotal variation. The first axis was positively correlated withBIO1, BIO3, BIO6, BIO9, and BIO11 (mean and minimumtemperatures) and negatively correlated with BIO7 and BIO4(temperature seasonality), representing a gradient of climatewith colder temperatures and high seasonality to warmertemperatures and low seasonality. The second axis was posi-tively correlated with BIO5 and BIO10 (maximum tempera-tures). The first (67.6%) and second (20.9%) axes of the pre-
cipitation PCA summarized 88.4% of the total variation. Thefirst axis was positively correlated with BIO12, BIO13, BIO14,BIO16, BIO17, BIO18, and BIO19 (overall precipitation),representing a gradient of drier to wetter climates. The sec-ond axis was positively correlated with BIO15 (precipitationseasonality), representing a gradient of low to high rainfallseasonality. We retained the first two axes of each PCA andsaved factor scores for each species (TempPC1, TempPC2,PrecipPC1, PrecipPC2) for use in analyses. We implementedphylogenetic logistic and phylogenetic Poisson regressionswith package phylolm of R (Ho and Ane 2014). To imple-ment phylogenetic generalized least squares models, we builtexpected covariance matrices under the Brownian motionand the Ornstein-Uhlenbeck models of trait evolution withR package ape (Paradis et al. 2004) and used them in a gen-eralized least squares framework with package nlme (Pin-heiro et al. 2015). While trait variance accrues linearly withtime in the Brownian motion model (Cavalli-Sforza andEdwards 1967), in the Ornstein-Uhlenbeck model (Lande1976) trait variance tends to be constant with time, becausetrait values tend to return to a long-termmean if they evolveaway. Thus, the Brownian motion model describes the evo-lution of continuous traits under random drift or adaptiveevolution tracking randomly wandering adaptive optimafor each lineage, whereas the Ornstein-Uhlenbeck model de-scribes the evolution of continuous traits around an adaptiveoptimum toward which they are pulled or the evolution ofthe adaptive optimum itself (O’Meara and Beaulieu 2014).By using these two different models, we account for differ-ences in modes of trait evolution, and we used the Akaike in-formation criterion (AIC) to determine which model losesthe least amount of information.To test whether phylogenetic conservatism or convergence
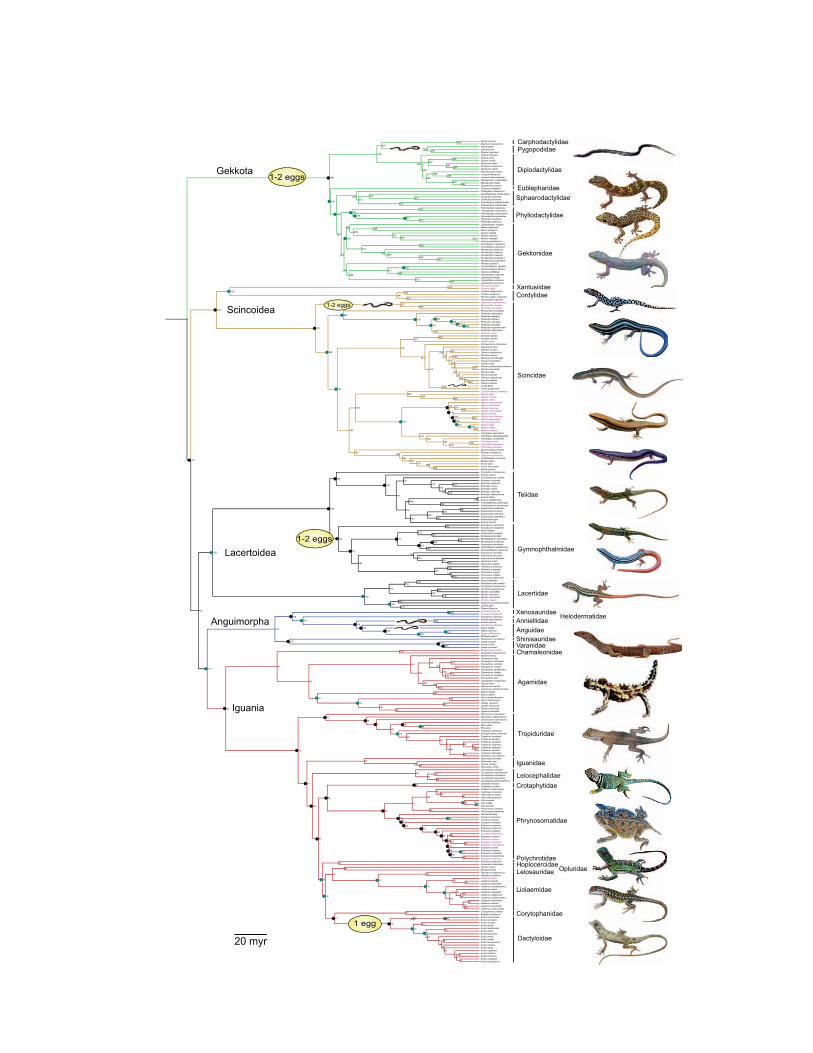
is more conspicuous in our data set, we used canonical phy-logenetic ordination (CPO; Giannini 2003). CPO is a modifi-cation of canonical correspondence analysis (CCA; Ter Braak1986), a constrained ordination method that promotes ordi-nation of a set of variables so that its association with a secondset of variables is maximized. The significance of the associa-tion is tested via null model randomizations of one or bothdata sets. In our CPO, one matrix (Y) contained life-historydata measured for lizard populations (adult female mass, adultfemale SVL, female SVL at maturity, offspring SVL, meanclutch size, reproduction mode, number of broods per year,clutch frequency, and RCM), whereas the secondmatrix (X)consisted of a tree matrix that contained all monophyleticgroups of species and populations (fig. 2), each coded sepa-
Figure 2: Individual groups used in canonical phylogenetic ordination (CPO) with life-history data. Phylogeny based on Pyron et al. (2013).Black circles represent a very significant historical effect (P < :01) and green circles a moderate effect (:01 < P < :05), on the basis of a com-plete CPO. Viviparous species represented in purple. Limb-reduced and fixed-clutch species are indicated on tree. All lizard photos are byLaurie J. Vitt and Eric. R. Pianka except Liolaemus multicolor, which is by Robert E. Espinoza.
Life-History Patterns of World Lizards 693

rately as a binary variable (0 if population/species is not amember of the group, 1 if the population/species is a groupmember), and climatic variables (altitude, TempPC1, Tem-pPC2, PrecipPC1, PrecipPC2, foraging mode, distribution,and preferred habitat type). This analysis thus consisted offinding the subset ofX that best captured variation inY, usingCCA coupled with Monte Carlo permutations. One advan-tage of CPO is that it can tease apart specific clades that arehighly correlated with life-history variation, showing whetheror not variation in trait values explained by clademembershipis clustered in specific areas of the tree (Vitt and Pianka 2005;Colston et al. 2010). The CPO analysis is designed to rank theclades that maximize explanation of the variance in the traitdata set; therefore, clades that explain more variation in thetrait data set are ranked higher. Much like an ANOVA, a sig-nificant CPO analysis indicates differences in trait values be-tween the focal clade and the remaining clades, based on theratio of the between- and the within-group variance. In theCPO, the variance is represented by x2 values (inertia or meansquared contingency coefficient). We implemented the CPOin CANOCO 4.5 for Windows, using the following param-eters: symmetric scaling, biplot scaling, manual selection ofclimatic variables (monophyletic groups and climatic param-eters), 9,999 permutations, and unrestricted permutations.After determining the significance of the full model—thatis, including all predictors—we used an information theoryapproach based on the AIC to identify the best predictorsand build a reduced model (Burnham and Anderson 2002),with vegan (Oksanen et al. 2007). We used a stepwise ap-proach, starting with an intercept-only model and sequen-
tially adding and trying to drop predictors on the basis ofmodel significance and AIC values (Oksanen et al. 2013).Model significance was assessed with 1,000 Monte Carlosimulations. We conducted other statistical analyses usingSYSTAT 13.0 for Windows and R (R Development CoreTeam 2015), with a significance level of 5% to reject null hy-potheses. Means are presented 51 SE.
Relationship of Life-History Traits with Foraging Mode,Tropical versus Temperate Distribution, and Habitat Spe-cialization.To determine whether and how life-history traitsvary between sit-and-wait and active foragers, between tem-perate and tropical regions, and with habitat specializationuse, we used nonphylogenetic and phylogenetic regressionmodels as described above. To test the hypothesis that vivi-parity evolved as an adaptation to cold climates, we testedfor differences in altitude and mean temperature (BIO1) be-tween reproductive modes using the same procedures.
Results
Relationship between Climate and Life-History Traits
We collected life-history data for 297 lizard species from33 families (out of a total of 36) distributed on all continentsexcept Antarctica (fig. 1). Phylogenetic signal was signifi-cant in all life-history traits examined (table 1). In mostof our phylogenetic models, regressions with Brownianmo-tion structure were superior to Ornstein-Uhlenbeck, asassessed by AIC values (table 2). The phylogenetic general-ized least squares models showed significant influence of
Table 1: Estimates of phylogenetic signal in life-history traits of lizards of the world and climatic data
Variable Pagel’s l/D P Blomberg’s K P
Life history:Adult female mass .886 !.001 .484 .004Adult female SVL .989 !.001 .658 .001Female SVL at maturity .966 !.001 .585 .001Offspring SVL .976 !.001 .481 .001Clutch size 1.003 !.001 .383 .001Broods per year .966 .002 .292 .004Clutch frequency .614 !.001 .234 .001Relative clutch mass .756 !.001 .334 .001Reproductive mode 2.23 0 … …
Climatic data:Altitude .323 !.001 .229 .002Temp_PC1 .977 !.001 .605 .001Temp_PC2 .683 !.001 .285 .001Prec_PC1 .964 !.001 .439 .001Prec_PC2 .805 !.001 .277 .001
Note: For reproductive mode, phylogenetic signal was estimated with the D statistic (Fritz and Purvis 2010). Values of Dcloser to 0 indicate phylogenetically conserved traits as expected under a Brownian threshold model, whereas values of 1indicate traits evolving at random. The value of D can be both !0 (highly conserved) and 11 (overdispersed). Phylogeneticsignals for all variables are strongly significant statistically. PC, principal component; SVL, snout-vent length.
694 The American Naturalist

climatic parameters on adult female mass, adult femaleSVL, female SVL at maturity, clutch size, offspring SVL,and RCM (table 2; fig. 3). However, in general, all re-gressions showed very low effect sizes, indicating extensiveunexplained variation in the data. Number of broods peryear is positively related to temperature and negatively re-
lated to seasonality in precipitation (table 2; fig. 3). Clutchfrequency is positively related to precipitation and nega-tively related to minimum andmean temperatures, whereasclutch size is negatively related to mean and minimum tem-peratures and positively related to precipitation and precipi-tation seasonality (table 2; fig. 3). Offspring SVL is positively
Table 2: Regression results between life-history traits and climatic variables (first two principal component [PC] axes fromtemperature and precipitation Bioclim variables)
Response variableand model
Regression summaries b (explanatory variables)
Adjusted r 2 F/x2 df P Intercept PC1temp PC2temp PC1prec PC2prec AIC
Adult female mass:OLS .039 2.62 4, 155 .04 1.83*** 2.22* .07 .15 .07 …PGLSBM 2.022 9.35 4 .002 1.79** 2.06 .13 .03 .08 451.4PGLSOU 2.004 2.30 4 .128 1.83*** 2.23* .06 .15 .07 528.28
Adult female SVL:OLS .009 1.64 4, 264 .162 1.85*** 2.004* .002 .002 .002 …PGLSBM .04 37.8 4 !.001 1.86*** .002 .02 !.001 .003 2861PGLSOU .04 35.17 4 !.001 1.85*** 2.004* .002 .002 .002 2728.3
Female SVLatmaturity:OLS .036 3.52 4, 268 .008 1.72*** 2.006** .002 .003 .002 …PGLSBM .036 33.52 4 !.001 1.74*** !2.001 !2.001 2.001 .005 2877.2PGLSOU .035 29.05 4 !.001 1.72*** 2.006*** .002 .003 .002 2794.5
Offspring SVL:OLS !.001 .64 4, 226 .63 1.90*** !.001 2.001 2.004 .008 …PGLSBM .06 29.59 4 !.001 1.92*** 2.002 .009* .004 .008 2421.1PGLSOU .08 33.12 4 !.001 1.91*** !.001 2.001 2.004 .008 2332.1
Clutch size:OLS .16 14.8 4, 284 !.001 .94*** 2.11*** .009 .05* .08** …PGLSBM 2.05 11.03 4 !.001 .96*** 2.02† .02 .006 .06*** 219.75PGLSOU .07 28.93 4 !.001 .94*** 2.11*** .009 .045** .07** 403.52
Broods per year:GLMPoisson !.01 3.81 4 .43 .41*** .009 .06 2.006 2.07 …PhyloPoisson … … … … .38* .03* .05** .02 2.12*** …
Clutch frequency:GLMPoisson !.01 2.48 4 .65 .269*** 2.02 .009 .05 .02 …PhyloPoisson … … … … .218† 2.04*** .01 .04*** .02 …
RCM:OLS .21 11.69 4, 152 !.001 1.52*** 2.06*** 2.04* .014 2.006 …PGLSBM 2.01 .82 4 .36 21.46*** 2.04** 2.05** .05** .02 78.62PGLSOU .25 15.98 4 !.001 21.52*** 2.06** 2.04* .01 2.006 60.41
Reproductive mode:GLMbinomial .10 25.9 4 !.001 21.87*** 2.02 2.42*** 2.23 .16 …Phylologistic .07 11.65 4 !.001 21.87* .01 2.28* 2.12 .01 …
Note: For continuous traits, we used ordinary least squares (OLS) and phylogenetic general least squares (PGLS) models with Brownian movement (BM) andOrnstein-Uhlenbeck (OU) process correlation structures (PGLSBM, PGLSOU). For count traits, we used general linear models (GLMs) with Poisson error struc-ture and phylogenetic Poisson regression. For binary traits, we used GLMs with binomial error structure and phylogenetic logistic regression. For GLMs andphylogenetic models, adjusted r 2 is calculated as McFadden’s pseudo r 2 (McFadden 1973). Akaike information criterion (AIC) is used to compare PGLS modelswith Brownian or Ornstein-Uhlenbeck structures. Phylogenetic Poisson regression is a non-likelihood-based method; therefore, regression summaries cannotbe calculated.
* P < :05.** P < :01.*** P < :001.† Marginally significant.
Life-History Patterns of World Lizards 695

related tomaximum temperature, whereas RCM is negativelyrelated to mean and minimum temperatures and seasonalityin temperature (table 2; fig. 3).
The stepwise CPO revealed that variation in trait valuesexplained by clade membership is unevenly distributed
among lizard clades. Results show that basal clades tendto explain more of the variation in trait values, but alsosome specific clades—such as Teiidae, Gymnophthalmidae,and Lacertoidea—were shown to explain significant varia-tion in the trait values (table 3; fig. 4). On the basis of the
Precipitation PC2
Precipitation PC2
Bro
ods
per y
ear
Clu
tch
frequ
ency
Mea
n cl
utch
siz
e
Temperature PC1
Offs
prin
g S
VL
Rel
ativ
e cl
utch
mas
s
Mea
n cl
utch
siz
e
Precipitation PC1
Temperature PC2Temperature PC1
C
E
D
F
−2 −1 0 1 2 3
01
23
45
6
−2 0 2 4 6 8
0.0
0.5
1.0
1.5
2.0A B
−4 −2 0 2 4
0.0
0.5
1.0
1.5
2.0
−8 −6 −4 −2 0 2 4
0.0
0.5
1.0
1.5
2.0
−6 −4 −2 0 2 4
1.6
1.7
1.8
1.9
2.0
2.1
2.2
−4 −2 0 2 4
−2.2
−1.8
−1.4
−1.0
Figure 3: Bivariate scatterplots of the relationships between number of broods per year, mean clutch size, and precipitation principal com-ponent 2 (PC2; A, C), clutch frequency and precipitation PC1 (B), mean clutch size and temperature PC1 (D), offspring SVL and temperaturePC2 (F), and relative clutch mass and temperature PC1 (E). PCs are scores from two principal component analyses, one with temperaturevariables and another with precipitation variables from Bioclim (Hijmans et al. 2005; see “Methods”). Solid lines represent partial regressioncoefficients (intercept and slope) from phylogenetic regression models (phylogenetic generalized least squares), and dashed lines representconventional (ordinary least squares) regression models. All relations were statistically significant (see table 2).
696 The American Naturalist

complete CPO (available in the supplemental material, ta-ble S2), results were very similar, withmost trait variation be-ing explained by basal clades and specific clades—such asCrotaphytidae, Varanidae, Phynosomatidae, Anguimorpha,Scincoidea, Iguania, Tropiduridae, Gymnophthalmidae, Teii-dae, Anguidae, Scincidae, and Liolaemidae—and no varia-tion being explained by Anolis and Gekkota, with the excep-tion of Phyllodactylidae (fig. 2; table S2). CPO results alsoshow that life-history traits were also explained by climatevariables, including precipitation seasonality, precipitationof warmest quarter, mean temperature of driest quarter, max-imum temperature of warmest month, temperature season-ality, isothermality, mean temperature of coldest quarter,temperature annual range, minimum temperature of coldestmonth, distribution (tropical vs. temperate), and annual meantemperature (table S2).
Relationship of Life-History Traits with Foraging Mode,Tropical versus Temperate Distribution,
and Habitat Specialization
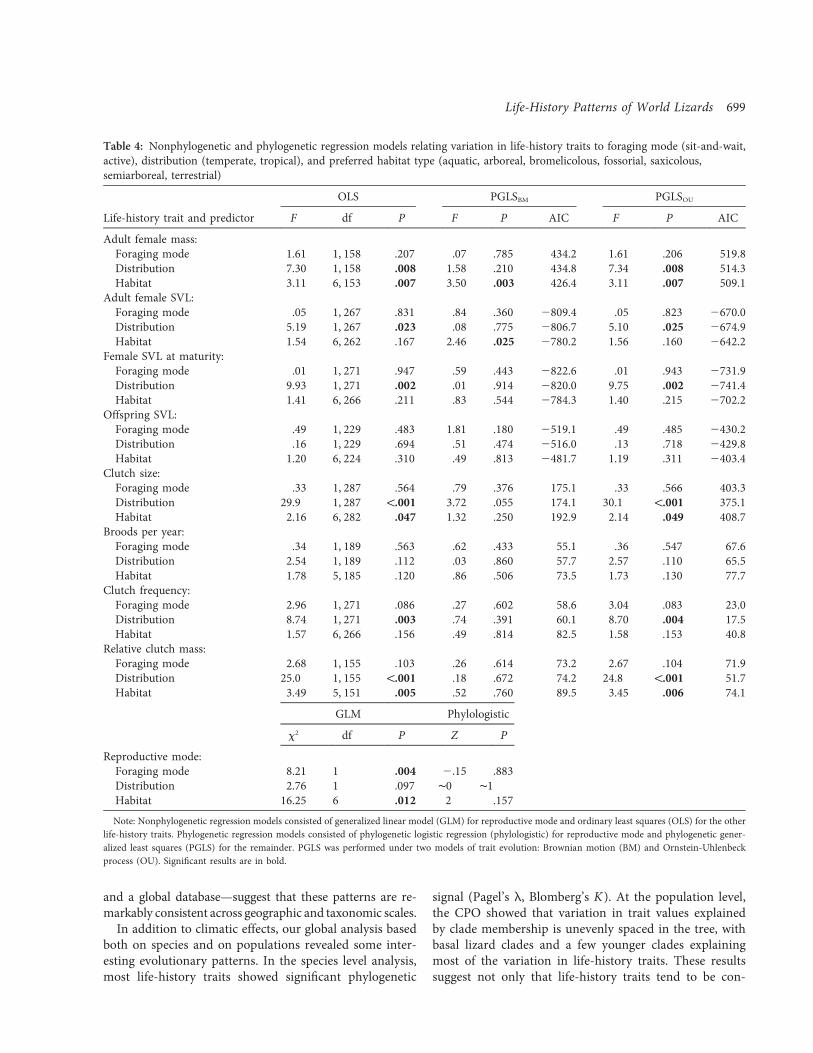
For the nonphylogenetic analysis, among the life-historytraits examined, clutch size was larger in temperate and semi-arboreal species and smaller in aquatic species (tables 4, 5).Adult female mass was greater in temperate and in aquaticspecies and smaller in fossorial species (tables 4, 5). Adultfemale SVL was bigger in temperate species, similar to fe-male SVL at maturity (tables 4, 5). Clutch frequency waslarger in tropical species (tables 4, 5). RCM was bigger intemperate and semiarboreal species and smaller in aquaticspecies (tables 4, 5). Surprisingly, we did not find significant
differences in RCM between foraging modes (table 4). Re-productivemode proportions differ between foragingmodeand habitat type (table 4). Taking phylogenetic relation-ships into account, the fit of models of almost all life-historyvariables based on Brownian motion was far superior toOrnstein-Uhlenbeck process, as assessed by AIC values (ta-ble 4). Adult female mass was greater in aquatic species andsmaller in fossorial species (tables 4, 5). Adult female SVLwas also larger in aquatic species but smaller in terrestrialspecies (tables 4, 5).Eighty-five percent of tropical lizard populations that we
analyzed are oviparous, and 15% are viviparous. In temper-ate lizard populations, 79% are oviparous, and 21% are vi-viparous. Viviparous lizard species occur at higher elevations(571:84� 75:52) than oviparous species (451:30� 27:73).The difference is significant when taking phylogenetic re-lationships into account and marginal in nonphylogeneticanalysis (ANOVA; F1,289 ¼ 3:60, P ¼ :059; F1,289 phylo ¼ 4:23,Pphylo ¼ :04). Mean temperature (BIO1) differs between re-productive modes (ANOVA; F1,289 ¼ 13:37, P < :001), withviviparous species occurring in locations with lowertemperatures (oviparous ¼ 21:71○ � 3:06○C, viviparous ¼19:51○ � 7:84○C). This difference is marginally significantwhen considering phylogenetic relationships among species(ANOVA; F1,289 phylo ¼ 3:63, Pphylo ¼ :057).
Discussion
Relationship between Climate and Life-History Traits
The phylogenetic generalized least squares and ordinaryleast squares models showed a significant influence of cli-
Table 3: Results of stepwise canonical phylogenetic ordination analysis
Group(s) AIC F P
159 (Teiidae) 335.97 40.2820 .005Foraging mode 357.64 14.3833 .005139 (Teiidae 1 Gymnophthalmidae) 358.94 12.9698 .005160 (Teiidae clade within) 360.24 11.5645 .010140 (Gymnophthalmidae) 361.21 10.5305 .025141 (Gymnophthalmidae clade within) 361.71 9.9966 .070128 (Lacertoidea) 361.97 9.7148 .01015 (Anolis clade within) 362.07 9.6068 .07017 (Dactyloidae 1 Corytophanidae) 362.07 9.6068 .040Distribution (tropical vs. temperate)a 362.90 8.7386 .035TempPC1a 363.29 8.3235 .070PrecipPC1a 363.60 8.0004 .025177/244 (Gekkota vs. everything else) 363.92 7.6640 .055245 (Gekkota clade within) 363.92 7.6640 .055
Note: Group(s) shows the rank order of phylogenetic clades, climate, and ecological attributes explaining variation intrait values. Results of Monte Carlo permutation tests of individual groups (defined in fig. 2) and climatic variables forthe Y matrix of life-history data. Akaike information criterion (AIC), F, and P values for each variable based on 1,000permutations.
a Climatic variables (principal component analysis [PCA] scores; for details about meaning of PCA scores of climaticvariables, see “Methods”).
Life-History Patterns of World Lizards 697

mate variables on broods per year, clutch frequency, clutchsize, offspring SVL, and RCM. Although our analysis iden-tified significant effects, most regressions had very low ef-fect sizes. This result indicates that much of the variationin life-history traits remains unexplained. Our data set con-sists of many species from many regions of the world. Adata set of this magnitude is expected to have lots of noise(e.g., sampling error). Large amounts of unexplained varia-tion are not uncommon in ecological studies with large data sets(Ter Braak 1986; Ter Braak and Van Tongeren 1995; GuisanandZimmermann 2000; Gilbert andBennett 2010). In addition,life-history traits can be affected by multiple factors in differentways, therefore resulting in weak relationships.
Number of broods per year is positively related to max-imum temperature and negatively related to seasonalityin precipitation. Clutch frequency varies positively withprecipitation. We also found that lizard clutch size is nega-tively related to mean and minimum temperatures, posi-tively related to seasonality in temperature, and positivelyrelated to precipitation seasonality. These results suggest
that lizards from aseasonal, warm and wet regions tend toreproduce more frequently during the year. Also, lizardsfrom colder and seasonal climates tend to produce clutchesat lower frequency but with larger sizes. As a result, lizardsfrom colder regions also tend to have a higher RCM. Intemperate regions, reproduction is usually seasonal andfollows temperature and day length patterns, with the rigor-ous winter being a limiting factor for reproduction (Duvallet al. 1982; Fitch 1970). In tropical regions, lizards tend toexhibit greater variation in clutch frequency/broods peryear (Vitt 1992; Clerke and Alford 1993;Mesquita and Colli2010). Many species tend to reproduce continuously withseveral small clutches (Vitt and Colli 1994; Mesquita andColli 2003b, 2010). Some of these results have been shownbefore in other studies looking at intraspecific variation(Vitt 1986; Colli 1991; Vitt and Colli 1994; Colli et al.2003; Mesquita and Colli 2003a, 2003b; Menezes et al.2011) as well as in interspecific comparisons among tropi-cal lizards (Mesquita and Colli 2010). Our results—usingpowerful methods to account for evolutionary relationships
20
15
10
5
0174130.58743.5
Distance from root (myr)
seulav tnac ifingis citenego lyhP
100
80
60
40
20
0
)latot fo %( seulav tnacifingis citene golyh
PNo nodes
174130.58743.5
174130.58743.5
Figure 4: Distribution of statistically significant nodes according to distance of nodes from root of tree, on the basis of a canonical phylo-genetic ordination analysis relating nine life-history traits of lizard species and populations worldwide to phylogenetic tree structure andclimatic parameters. Bottom, raw number of nodes with significant effects. Top, percentage of total nodes.
698 The American Naturalist
and a global database—suggest that these patterns are re-markably consistent across geographic and taxonomic scales.
In addition to climatic effects, our global analysis basedboth on species and on populations revealed some inter-esting evolutionary patterns. In the species level analysis,most life-history traits showed significant phylogenetic
signal (Pagel’s l, Blomberg’s K ). At the population level,the CPO showed that variation in trait values explainedby clade membership is unevenly spaced in the tree, withbasal lizard clades and a few younger clades explainingmost of the variation in life-history traits. These resultssuggest not only that life-history traits tend to be con-
Table 4: Nonphylogenetic and phylogenetic regression models relating variation in life-history traits to foraging mode (sit-and-wait,active), distribution (temperate, tropical), and preferred habitat type (aquatic, arboreal, bromelicolous, fossorial, saxicolous,semiarboreal, terrestrial)
OLS PGLSBM PGLSOU
Life-history trait and predictor F df P F P AIC F P AIC
Adult female mass:Foraging mode 1.61 1, 158 .207 .07 .785 434.2 1.61 .206 519.8Distribution 7.30 1, 158 .008 1.58 .210 434.8 7.34 .008 514.3Habitat 3.11 6, 153 .007 3.50 .003 426.4 3.11 .007 509.1
Adult female SVL:Foraging mode .05 1, 267 .831 .84 .360 2809.4 .05 .823 2670.0Distribution 5.19 1, 267 .023 .08 .775 2806.7 5.10 .025 2674.9Habitat 1.54 6, 262 .167 2.46 .025 2780.2 1.56 .160 2642.2
Female SVL at maturity:Foraging mode .01 1, 271 .947 .59 .443 2822.6 .01 .943 2731.9Distribution 9.93 1, 271 .002 .01 .914 2820.0 9.75 .002 2741.4Habitat 1.41 6, 266 .211 .83 .544 2784.3 1.40 .215 2702.2
Offspring SVL:Foraging mode .49 1, 229 .483 1.81 .180 2519.1 .49 .485 2430.2Distribution .16 1, 229 .694 .51 .474 2516.0 .13 .718 2429.8Habitat 1.20 6, 224 .310 .49 .813 2481.7 1.19 .311 2403.4
Clutch size:Foraging mode .33 1, 287 .564 .79 .376 175.1 .33 .566 403.3Distribution 29.9 1, 287 !.001 3.72 .055 174.1 30.1 !.001 375.1Habitat 2.16 6, 282 .047 1.32 .250 192.9 2.14 .049 408.7
Broods per year:Foraging mode .34 1, 189 .563 .62 .433 55.1 .36 .547 67.6Distribution 2.54 1, 189 .112 .03 .860 57.7 2.57 .110 65.5Habitat 1.78 5, 185 .120 .86 .506 73.5 1.73 .130 77.7
Clutch frequency:Foraging mode 2.96 1, 271 .086 .27 .602 58.6 3.04 .083 23.0Distribution 8.74 1, 271 .003 .74 .391 60.1 8.70 .004 17.5Habitat 1.57 6, 266 .156 .49 .814 82.5 1.58 .153 40.8
Relative clutch mass:Foraging mode 2.68 1, 155 .103 .26 .614 73.2 2.67 .104 71.9Distribution 25.0 1, 155 !.001 .18 .672 74.2 24.8 !.001 51.7Habitat 3.49 5, 151 .005 .52 .760 89.5 3.45 .006 74.1
GLM Phylologistic
x2 df P Z P
Reproductive mode:Foraging mode 8.21 1 .004 2.15 .883Distribution 2.76 1 .097 ∼0 ∼1Habitat 16.25 6 .012 2 .157
Note: Nonphylogenetic regression models consisted of generalized linear model (GLM) for reproductive mode and ordinary least squares (OLS) for the otherlife-history traits. Phylogenetic regression models consisted of phylogenetic logistic regression (phylologistic) for reproductive mode and phylogenetic gener-alized least squares (PGLS) for the remainder. PGLS was performed under two models of trait evolution: Brownian motion (BM) and Ornstein-Uhlenbeckprocess (OU). Significant results are in bold.
Life-History Patterns of World Lizards 699

Table
5:Means
5SE
sof
life-historytraitsassociated
withforaging
mod
e(sit-and
-wait,active),distribu
tion
(tem
perate,trop
ical),andpreferredhabitattype
(aqu
atic,
arboreal,brom
elicolou
s,fossorial,saxicolous,semiarboreal,terrestrial)
Life-history
trait
Adu
ltfemalemass
Adu
ltfemaleSV
LFemaleSV
Lat
maturity
Offspring
SVL
Clutchsize
Brood
sper
year
Clutch
frequency
Relative
clutch
mass
Foraging
mod
e:Sit-and-wait
22.612
58.130
(62)
76.511
53.189
(138)
67.070
52.707
(142)
33.990
51.167
(144)
4.5505
.433
(104)
1.4805
.092
(99)
1.2705
.036
(139)
.156
5.007
(93)
Active
15.721
52.180
(89)
80.487
55.736
(79)
69.680
54.837
(85)
35.670
52.186
(86)
3.5205
.247
(85)
1.2805
.063
(55)
1.1805
.034
(81)
.172
5.008
(53)
Distribution:
Tem
perate
21.710
56.029
(76)
81.782
53.873
(122)
72.540
53.496
(122)
34.620
51.600
(125)
4.67
5.349
(125)
1.5205
.091
(66)
1.2005
.035
(124)
.180
5.007
(90)
Tropical
15.348
53.803
(75)
73.047
54.370
(95)
62.830
53.429
(105)
34.620
51.465
(105)
3.56
5.472
(104)
1.3305
.087
(88)
1.2805
.039
(96)
.133
5.008
(56)
Habitat:
Aqu
atic
86.310
581.854
(3)
105.9865
32.883
(5)
99.600
532.525
(5)
37.710
510.763
(5)
3.3905
1.078
(5)
1.2005
.200
(5)
1.4005
.187
(5)
.095
5.037
(2)
Arboreal
25.296
56.703
(35)
80.855
55.625
(45)
67.720
54.903
(49)
34.280
52.244
(49)
3.9905
.566
(49)
1.4605
.179
(33)
1.2805
.063
(46)
.144
5.014
(29)
Bromelicolous
4.7025
.132
(2)
65.008
52.105
(2)
60.020
51.523
(2)
41.680
58.395
(2)
3.6205
.713
(2)
1.0005
.000
(2)
1.1705
.167
(2)
…
Fossorial
1.6185
.560
(4)
96.871
517.249
(7)
89.850
514.721
(8)
33.680
55.791
(9)
3.6205
1.060
(9)
1.0005
.000
(6)
1.0005
.000
(9)
.167
5.013
(4)
Saxicolous
13.571
52.698
(11)
83.387
58.171
(34)
71.840
56.327
(34)
39.690
52.634
(34)
5.4405
1.235
(34)
1.3905
.118
(30)
1.3105
.082
(34)
.202
5.019
(16)
Semiarboreal
31.700
516.381
(3)
88.225
58.171
(4)
75.000
510.855
(4)
31.250
53.326
(4)
8.8405
2.585
(4)
…1.0005
.000
(4)
.226
5.040
(3)
Terrestrial
15.017
54.510
(93)
72.937
53.834
(120)
64.390
53.279
(125)
33.340
51.524
(127)
3.8205
.312
(126)
1.4505
.088
(78)
1.2205
.033
(120)
.159
5.007
(92)
Note:Sign
ificantdifferencesarein
bold
intable4.
served in the evolutionary tree but also that variation inlife-history traits is mainly explained by a few shifts thatoccurred early in the evolutionary history of the group.These interesting results may explain different broad pat-terns observed in lizard ecology. For instance, almost everyknown lizard reproductive strategy can be seen in a singleassemblage in Neotropical lizards from the Caatinga biomein Brazil (see Vitt 1992). All this variation among species ex-posed to the same climatic conditions suggests that a strongphylogenetic component must influence life-history patterns(Vitt 1990; Vitt 1992). Also, many clades present remarkablysimilar life-history traits, despite the climatic context they oc-cupy (Mesquita and Colli 2010). For example, clutch size andegg volume were not significantly different between majorclades of Kentropyx occupying different ecosystems (savan-nah vs. forest; Werneck et al. 2009).More broadly, our resultsmirror analysis based on diet composition for 184 lizard spe-cies from four continents (Vitt et al. 2003; Vitt and Pianka2005). These authors found that most variation in lizard dietsis explained by a few shifts in early diversification of thegroup. Interestingly, the clades in which we found most ofexplained variance in life-history traits were nearly the sameones that Vitt and Pianka (2005) identified using diet data.These parallel results suggest that diets and life histories areevolutionarily linked. Moreover, distinct lizard traits can belargely independent of the ecological context they inhabit.
Another interesting result is the lack of variation beingexplained by the Anolis clade. Anoles are one of most eco-logically diverse clades among squamates and apparentlywere heavily influenced by environment and by presenceof competitors (Losos et al. 1993; Losos and de Queiroz1997; Losos 2009). Some species—depending on the den-sity and/or diversity of potential competitors—evolvedrapidly, and changes in habitat use and morphology wereperceived in less than a decade (Losos et al. 1993). How-ever, some studies have also reported evidence of evolu-tionary relatedness within these events of rapid morpho-logical evolution (Revell et al. 2007; Pennell et al. 2014).Anoles have long been a model system for the study ofcommunity ecology (Losos 1994, 2009), and the influen-tial work done in this system has affected how ecologiststhink generally about how communities are structured(Losos 1995, 2009; Losos et al. 2003). Our results suggestthat the ecological lability presented by anoles is in factan exception when analyzed in the context of a larger tax-onomic scope.
Relationship of Life-History Traits with Foraging Mode,Tropical versus Temperate Distribution,
and Habitat Specialization
We found no relationship between foraging mode and anyof the life-history traits. Our results of no difference in
RCM among foraging modes require a more in-depth dis-cussion. RCM, body shape, and foraging mode have beenhypothesized to be coevolved in lizards (Vitt and Congdon1978; Vitt and Price 1982). Active foraging lizards havestreamlined bodies, allowing an increase in speed; thistrade-off may limit reproductive investment. Their clutchestypically comprise a relatively low proportion of total bodymass (Vitt and Congdon 1978; Huey and Pianka 1981; Vittand Price 1982; Shine and Schwarzkopf 1992; Warne andCharnov 2008). Conversely, sit-and-wait lizards have astocky body shape, which could enhance reproductive ef-fort and RCM (Vitt and Congdon 1978; Huey and Pianka1981; Vitt and Price 1982; Shine and Schwarzkopf 1992;Warne and Charnov 2008). Surprisingly, our results donot support this hypothesis, since we found no differencein RCM among foraging modes. Our results suggest thatthe expected relationship between body size and RCMmay not be as conspicuous as previous work suggests. How-ever, because of problems with RCM estimates, interpreta-tion of analyses of this variable must be performed withcaution (Dunham et al. 1988). RCM has been estimatedin several different ways, and some authors do not alwaysclearly state what method they used (Vitt and Price 1982;Cuellar 1984; Dunham et al. 1988; Greer 1989). Sourcesof variation could be related to the freshness of material(preserved or fresh), ratios based on wet or dry mass, or fe-male mass based on total or somatic mass only (Vitt andPrice 1982; Cuellar 1984; Dunham et al. 1988). In addition,RCM estimates could be confounded by bodymass estimates(Vitt and Price 1982; Seigel and Fitch 1984; Dunham andMiles 1985; Dunham et al. 1988). Although we collected agood proportion of our data, part of our data set came fromother sources; thus, our results could be influenced by differ-ent methods used to estimate RCM. In addition, our study,like most others, considered single reproductive episodes,whereas the trade-offs of reproductive allocation over a pro-longed period (e.g., lifetime) cannot be incorporated. Futurestudies with more standardized measures of RCM shouldhelp to elucidate this question.We found differences in clutch size, clutch frequency,
and RCM among tropical and temperate species. Theseresults are largely related to what was discussed in “Rela-tionship between Climate and Life-History Traits.” Wefound no difference in reproductive mode between tropicaland temperate species. However, viviparity is associatedwith colder temperatures and higher altitudes. These resultssuggest that viviparous species within tropical regions tendto occupy regions with colder climates and/or higher alti-tudes. Reproductive mode evolution is complex in squa-mate reptiles, with both major modes (oviparity and vivi-parity) occurring within the same family (Shine 2004;Blackburn 2006; Pyron and Burbrink 2014) and even withindifferent populations of the same species (Howard 1974;
Life-History Patterns of World Lizards 701

Tinkle and Gibbons 1977). The main hypothesis is thatviviparity evolved from oviparity via egg retention as an ad-aptation to colder climates because it facilitates egg protec-tion and more rapid development via maternal thermo-regulation (Huey 1977; Blackburn 1982; Shine 2005). Ourresults support this hypothesis because we found that vivip-arous lizards tend to occur in colder temperatures and athigher elevations.
We found differences among habitat specializations infemale size (SVL and mass) and RCM, with females beinglarger and having higher RCM in semiarboreal and saxico-lous habitats. Previous work suggested that the use ofcrevices by saxicolous lizards to avoid predators limits evo-lution of bauplan and clutch mass (Vitt 1981). Our resultsdo not support this hypothesis; females of saxicolous lizardsin fact tend to have large bodies and higher RCM whencompared with species that are specialized in other habitats.Our result may reflect variation among the ecology of sax-icolous lizards—not all saxicolous species rely on use ofcrevices to avoid predation. Our data set did not haveenough resolution to compare different lizard species withinthe saxicolous habitat specialization. Future studies with moredetailed ecological information may help to further test thishypothesis.
Conclusions
Complex interactions of factors that are often correlatedand difficult to tease apart can potentially influence theevolution of life-history traits (Dunham and Miles 1985;Miles and Dunham 1992). In our work, we assembled thelargest life-history data set on lizards to date, with data cov-ering most of the group’s evolutionary history from manydifferent geographical locations representing very distinctclimatic regions. On the basis of our global analysis, wefound some consistent patterns regarding the associationof life-history traits and climatic variables. Our results showthat in warmer tropical and less seasonal climates, lizardstend to reproduce more continuously, producing smallerclutches over the course of a year. These results are largelyconsistent with life-history theory and previous resultsbased on smaller and scattered data sets (e.g., Colli 1991;Vitt and Colli 1994; Mesquita and Colli 2010). We alsorevealed some interesting evolutionary patterns where var-iation in trait values explained by clade membership is un-evenly distributed among lizard clades, with traits frombasal clades and a few specific younger clades concentratingmost of the explained variance. These results mirror otherlarge-scale analysis of lizard ecological traits (Vitt andPianka 2005), suggesting that our results may be generalto different ecological traits. Finally, we found significantdifferences in average temperature between reproductivemodes, with viviparous species occurring in cooler climates
and/or higher altitudes. Therefore, our analysis supportsthe hypothesis that viviparity evolved as a response to coolerclimates (Fraipont et al. 1996; Shine 2005; Pyron and Bur-brink 2014). One caveat of our analysis is that the varianceexplained in the data was low (low r 2 values for all analysis).This highlights the complexity regarding life-history traitevolution, especially when many species from divergent evo-lutionary lineages are analyzed together. Future studies withmore focused data sets (e.g., detailed sampleswithin lineages)may help understanding whether our low effect size resultsare general on life-history traits or whether it is a particularresult due to the high variation in our global data set.
Acknowledgments
We thank Coordenação de Aperfeiçoamento de Pessoal deNível Superior (CAPES) and Conselho Nacional de Desen-volvimento Científico e Tecnológico (CNPq) for D.O.M.’spostdoctorate and research fellowship. E.R.P. thanks theDenton A. Cooley Centennial Professorship in Zoology atthe University of Texas at Austin. L.J.V. acknowledges sup-port from the University of Oklahoma Research Council viaa George Lynn Cross Research Professorship. G.R.C. thanksCAPES, CNPq, and Fundação de Apoio à Pesquisa do Dis-trito Federal for financial support. G.C.C. thanks CNPq grants302776/2012-5, 201413/2014-0, and 563352/2010-8.We thankA. Garda and CNPq/Instituto Chico Mendes de Conservaçãoda Biodiversidade (ICMBio; processo 552031/2011-9). Wethank ICMBio for granting thenecessary permissions to sam-ple animals. We also thank D. D. Ackerly and J. L. Bronsteinas well as two reviewers for many suggestions for improve-ments that added clarity to our article. We thank R. E.Espinoza for the photo of Liolaemus multicolor.
Literature Cited
Ackerly, D. 2009. Conservatism and diversification of plant functionaltraits: evolutionary rates versus phylogenetic signal. Proceedings ofthe National Academy of Sciences of the USA 106:19699–19706.
Andrews, R., and A. S. Rand. 1974. Reproductive effort in anolinelizards. Ecology 55:1317–1327.
Blackburn, D. G. 1982. Evolutionary origins of viviparity in theReptilia. I. Sauria. Amphibia-Reptilia 3:185–205.
———. 2006. Squamate reptiles as model organisms for the evolu-tion of viviparity. Herpetological Monographs 20:131–146.
Blomberg, S. P., T. Garland, and A. R. Ives. 2003. Testing for phylo-genetic signal in comparative data: behavioral traits are more la-bile. Evolution 57:717–745.
Box, G. E. P., and D. R. Cox. 1964. An analysis of transformations.Journal of the Royal Society of Western Australia 26:211–252.
Brooks, D. R., and D. A. McLennan. 1991. Phylogeny, ecology, andbehavior: a research program in comparative biology. Universityof Chicago Press, Chicago.
Burnham, K. P., and D. R. Anderson. 2002. Model selection andmultimodel inference: a practical information-theoretic approach.Springer, New York.
702 The American Naturalist

Cavalli-Sforza, L. L., and A. W. F. Edwards. 1967. Phylogenetic anal-ysis: models and estimation procedures. Evolution 21:550–570.
Clerke, R. B., and R. A. Alford. 1993. Reproductive biology of fourspecies of tropical Australian lizards and comments on the factorsregulating lizard reproductive cycles. Journal of Herpetology27:400–406.
Colli, G. R. 1991. Reproductive ecology of Ameiva ameiva (Sauria:Teiidae) in the cerrado of central Brazil. Copeia 1991:1002–1012.
Colli, G. R., D. O. Mesquita, P. V. V. Rodrigues, and K. Kitayama.2003. The ecology of the gecko Gymnodactylus geckoides amaraliin a Neotropical savanna. Journal of Herpetology 37:694–706.
Colston, T. J., G. C. Costa, and L. J. Vitt. 2010. Snake diets and thedeep history hypothesis. Biological Journal of the Linnean Society101:476–486.
Cuellar, O. 1984. Reproduction in a parthenogenetic lizard: with a dis-cussion of optimal clutch size and a critique of the clutch weight/body weight ratio. American Midland Naturalist 111:242–258.
Dunham, A. E., and D. B. Miles. 1985. Patterns of covariation in lifehistory traits of squamate reptiles: the effects of size and phylog-eny reconsidered. American Naturalist 126:231–257.
Dunham, A. E., D. B. Miles, and D. N. Reznick. 1988. Life historypatterns in squamate reptiles. Pages 441–522 in C. Gans and R. B.Huey, eds. Biology of the Reptilia. Vol. 16: Ecology B. Defense andlife history. Liss, New York.
Duvall, D., L. J. Guillette Jr., and R. E. Jones. 1982. Environmental con-trol of reptilian reproductive cycles. Pages 201–231 in C. Gans andH. Pough, eds. Biology of the Reptilia. Academic Press, New York.
Felsenstein, J. 1984. Distance methods for inferring phylogenies: ajustification. Evolution 38:16–24.
———. 1985. Phylogenies and the comparative method. AmericanNaturalist 125:1–15.
Fitch, H. S. 1970. Reproductive cycles of lizards and snakes. Univer-sity of Kansas Museum of Natural History Miscellaneous Publica-tion 52:1–247.
Fraipont, M., J. Clobert, and R. Barbault. 1996. The evolution ofoviparity with egg guarding and viviparity in lizards and snakes:a phylogenetic analysis. Evolution 50:391–400.
Freckleton, R. P., P. H. Harvey, andM. Pagel. 2002. Phylogenetic anal-ysis and comparative data: a test and review of evidence. AmericanNaturalist 160:712–726.
Fritz, S. A., and A. Purvis. 2010. Selectivity in mammalian extinctionrisk and threat types: a newmeasure of phylogenetic signal strengthin binary traits. Conservation Biology 24:1042–1051.
Giannini, N. P. 2003. Canonical phylogenetic ordination. SystematicBiology 52:684–695.
Gilbert, B., and J. R. Bennett. 2010. Partitioning variation in ecologicalcommunities: do the numbers add up? Journal of Applied Ecology47:1071–1082.
Grafen, A. 1989. The phylogenetic regression. Philosophical Trans-actions of the Royal Society B: Biological Sciences 326:119–157.
Greer, A. E. 1989. The biology and evolution of Australian lizards.Surrey Beatty, Chipping Norton.
Guisan, A., and N. E. Zimmermann. 2000. Predictive habitat distri-bution models in ecology. Ecological Modelling 35:147–186.
Harvey, P. H., and M. D. Pagel. 1991. The comparative method inevolutionary biology. Oxford Series in Ecology and Evolution. Ox-ford University Press, New York.
Hijmans, R. J., S. E. Cameron, J. L. Parra, P. G. Jones, and A. Jarvis.2005. Very high resolution interpolated climate surfaces for globalland areas. International Journal of Climatology 25:1965–1978.
Ho, L. S. T., and C. Ane. 2014. A linear-time algorithm for Gaussianand non-Gaussian trait evolution models. Systematic Biology63:397–408.
Howard, C. W. 1974. Comparative reproductive ecology of hornedlizards (genus Phrynosoma) in southwestern United States and north-ern Mexico. Journal of the Arizona Academy of Science 9:108–116.
Huey, R. B. 1977. Egg retention in some high-altitude Anolis lizards.Copeia 1977:373–375.
Huey, R. B., and E. R. Pianka. 1981. Ecological consequences of for-aging mode. Ecology 62:991–999.
Inger, R. F., and B. Greenberg. 1966. Annual reproductive patterns oflizards from a Bornean rain forest. Ecology 47:1007–1021.
Ives, A. R., and T. Garland. 2010. Phylogenetic logistic regression forbinary dependent variables. Systematic Biology 59:9–26.
James, C., and R. Shine. 1988. Life history strategies of Australianlizards: a comparison between the tropics and the temperate zone.Oecologia (Berlin) 75:307–316.
Lande, R. 1976. Natural selection and random genetic drift in phe-notypic evolution. Evolution 30:314–334.
Losos, J. B. 1994. Integrative approaches to evolutionary ecology:Anolis lizards as model systems. Annual Review of Ecology andSystematics 25:467–493.
———. 1995. Community evolution in greater antillean Anolis liz-ards: phylogenetic patterns and experimental tests. PhilosophicalTransactions of the Royal Society B: Biological Sciences 349:69–75.
———. 2008. Phylogenetic niche conservatism, phylogenetic signaland the relationship between phylogenetic relatedness and ecolog-ical similarity among species. Ecology Letters 11:995–1003.
———. 2009. Lizards in an evolutionary tree: ecology and adaptiveradiation of anoles. University of California Press, Berkeley.
———. 2011. Seeing the forest for the trees: the limitations of phylog-enies in comparative biology. American Naturalist 177:709–727.
Losos, J. B., and K. de Queiroz. 1997. Evolutionary consequences ofecological release in Caribbean Anolis lizards. Biological Journal ofthe Linnean Society 61:459–483.
Losos, J. B., M. Leal, R. E. Glor, K. de Queiroz, P. E. Hertz, L. R.Schettino, A. C. Lara, et al. 2003. Niche lability in the evolutionof a Caribbean lizard community. Nature 424:542–545.
Losos, J. B., J. C. Marks, and T. W. Schoener. 1993. Habitat use andecological interactions of an introduced and a native species ofAnolis lizard on Grand Cayman, with a review of the outcomesof anole introductions. Oecologia (Berlin) 95:525–532.
Mahler, D. L., L. J. Revell, R. E. Glor, and J. B. Losos. 2010. Ecologicalopportunity and the rate of morphological evolution in the diver-sification of Greater Antillean anoles. Evolution 64:2731–2745.
McFadden, D. 1973. Conditional logit analysis of qualitative choicebehavior. Pages 105–142 in P. Zarembka, ed. Frontiers in econo-metrics. Academic Press, New York.
Menezes, V. A., M. Van Sluys, A. F. Fontes, and C. F. D. Rocha.2011. Living in a caatinga-rocky field transitional habitat: ecologicalaspects of the whiptail lizard Cnemidophorus ocellifer (Teiidae) innortheastern Brazil. Zoologia 28:8–16.
Mesquita, D. O., and G. R. Colli. 2003a. The ecology of Cnemidophorusocellifer (Squamata, Teiidae) in aNeotropical savanna. Journal of Her-petology 37:498–509.
———. 2003b. Geographical variation in the ecology of populationsof some Brazilian species of Cnemidophorus (Squamata, Teiidae).Copeia 2003:285–298.
———. 2010. Life history patterns in South American tropical lizards.Pages 45–71 in O. H. Gallegos, F. R. M. Cruz, and J. F. M. Sánchez,
Life-History Patterns of World Lizards 703

eds. Reproducción en reptiles: morfología, ecología y evolución.Universidad Autónoma del Estado de México, México.
Mesquita, D. O., G. C. Costa, G. R. Colli, T. B. Costa, D. B. Shepard,L. J. Vitt, and E. R. Pianka. 2016a. Data from: Life-history patternsof lizards of the world. American Naturalist, Dryad Digital Repos-itory, http://dx.doi.org/10.5061/dryad.55610.
Mesquita, D. O., R. G. Faria, G. R. Colli, L. J. Vitt, and E. R. Pianka.2016b. Lizard life-history strategies. Austral Ecology 41:1–5.
Mesquita, D. O., L. J. Vitt, G. R. Colli, D. B. Shepard, G. C. Costa,T. B. Costa, and E. R. Pianka. 2015. Life history data of lizardsof the world. Ecology 96:594–594. http://dx.doi.org/10.1890/14-1453.1.
Miles, D. B., and A. E. Dunham. 1992. Comparative analyses of phylo-genetic effects in the life-history patterns of iguanid reptiles. AmericanNaturalist 139:848–869.
Münkemüller, T., S. Lavergne, B. Bzeznik, S. Dray, T. Jombart, K.Schiffers, and W. Thuiller. 2012. How to measure and test phylo-genetic signal. Methods in Ecology and Evolution 3:743–756.
Oksanen, J., F. G. Blanchet, R. Kindt, P. Legendre, P. R. Minchin, R. B.O‘Hara, G. L. Simpson, et al. 2013. vegan: community ecologypackage. R package, version 2.0–10.
Oksanen, J. R., P. Kindt, and P. Legendre. 2007. The vegan package.Community ecology package.
O’Meara, B. C., and J. M. Beaulieu. 2014. Modelling stabilizing se-lection: the attraction of Ornstein-Uhlenbeck models. Pages 381–393 in L. Z. Garamszegi, ed. Modern phylogenetic comparativemethods and their application in evolutionary biology. Springer,Berlin.
Orme, D., R. Freckleton, G. Thomas, T. Petzoldt, S. Fritz, N. Isaac, andW. Pearse. 2013. caper: comparative analyses of phylogenetics andevolution in R. R package, version 0.5.2. http://CRAN.R-project.org/packagepcaper.
Pagel, M. 1997. Inferring evolutionary processes from phylogenies.Zoologica Scripta 26:331–348.
———. 1999. Inferring the historical patterns of biological evolu-tion. Nature 401:877–884.
Paradis, E., and J. Claude. 2002. Analysis of comparative data usinggeneralized estimating equations. Journal of Theoretical Biology218:175–185.
Paradis, E., J. Claude, and K. Strimmer. 2004. APE: analyses of phylo-genetics and evolution in R language. Bioinformatics 20:289–290.
Pennell, M. W., L. J. Harmon, and J. C. Uyeda. 2014. Speciation isunlikely to drive divergence rates. Trends in Ecology and Evolu-tion 29:72–73.
Pinheiro, J., D. Bates, S. DebRoy, D. Sarkar, and R Development CoreTeam. 2015. nlme: linear and nonlinear mixed effects models. R pack-age, version 3.1–120. http://CRAN.R-project.org/packagepnlme.
Pyron, R. A., and F. T. Burbrink. 2014. Early origin of viviparity andmultiple reversions to oviparity in squamate reptiles. EcologyLetters 17:13–21.
Pyron, R. A., F. T. Burbrink, and J. J. Wiens. 2013. A phylogeny andrevised classification of Squamata, including 4161 species of lizardsand snakes. BMC Evolutionary Biology 13:1–53.
Pyron, R. A., G. C. Costa, M. A. Patten, and F. T. Burbrink. 2015.Phylogenetic niche conservatism and the evolutionary basis ofecological speciation. Biological Reviews 90:1248–1262.
Quinn, G. P., and M. J. Keough. 2002. Experimental design and dataanalysis for biologists. Cambridge University Press, Cambridge.
RDevelopment Core Team. 2015. R: a language and environment for sta-tistical computing. R Foundation for Statistical Computing, Vienna.
Revell, L. J. 2012. phytools: an R package for phylogenetic compar-ative biology (and other things). Methods in Ecology and Evolu-tion 3:217–223.
Revell, L. J., L. J. Harmon, and D. C. Collar. 2008. Phylogenetic signal,evolutionary process, and rate. Systematic Biology 57:591–601.
Revell, L. J., L. J. Harmon, R. B. Langerhans, and J. J. Kolbe. 2007. Aphylogenetic approach to determining the importance of con-straint on phenotypic evolution in the Neotropical lizard Anoliscristatellus. Evolutionary Ecology Research 9:261–282.
Revell, L. J., D. L. Mahler, P. R. Peres-Neto, and B. D. Redelings.2012. A new phylogenetic method for identifying exceptional phe-notypic diversification. Evolution 66:135–146.
Roff, D. A. 1992. The evolution of life histories: theory and analysis.Chapman and Hall, London.
———. 2002. Life history evolution. Sinauer, Sunderland, MA.Seigel, R. A., and H. S. Fitch. 1984. Ecological patterns of relative
clutch mass in snakes. Oecologia (Berlin) 61:293–301.Shine, R. 2004. Does viviparity evolve in cold climate reptiles because
pregnant females maintain stable (not high) body temperatures?Evolution 58:1809–1818.
———. 2005. Life-history evolution in reptiles. Annual Review ofEcology, Evolution, and Systematics 36:23–46.
Shine, R., and L. Schwarzkopf. 1992. The evolution of reproductiveeffort in lizards and snakes. Evolution 46:62–75.
Stearns, S. C. 1992. The evolution of life histories. Oxford UniversityPress, Oxford.
Ter Braak, C. J. F. 1986. Canonical correspondence analysis: a neweigenvector technique for multivariate direct gradient analysis.Ecology 67:1167–1179.
Ter Braak, C. J. F., and O. F. R. Van Tongeren. 1995. Data analysis incommunity and landscape ecology. Cambridge University Press,Cambridge.
Tinkle, D. W., and J. W. Gibbons. 1977. The distribution and evolu-tion of viviparity in reptiles. Miscellaneous Publications, Museumof Zoology, University of Michigan 154:1–47.
Tinkle, D. W., H. M. Wilbur, and S. G. Tilley. 1970. Evolutionarystrategies in lizard reproduction. Evolution 24:55–74.
Venables, W. N., and B. D. Ripley. 2002. Modern applied statisticswith S. Springer, New York.
Vitt, L. J. 1981. Lizard reproduction: habitat specificity and constraintson relative clutch mass. American Naturalist 117:506–514.
———. 1986. Reproductive tactics of sympatric gekkonid lizardswith a comment on the evolutionary and ecological consequencesof invariant clutch size. Copeia 1986:773–786.
———. 1990. The influence of foraging mode and phylogeny on sea-sonality of tropical lizard reproduction. Papéis Avulsos de Zoo-logia, São Paulo 37:107–123.
———. 1992. Diversity of reproductive strategies among Brazilianlizards and snakes: the significance of lineage and adaptation.Pages 135–149 inW. C. Hamlett, ed. Reproductive biology of SouthAmerican vertebrates. Springer, New York.
Vitt, L. J., and G. R. Colli. 1994. Geographical ecology of a Neotrop-ical lizard: Ameiva ameiva (Teiidae) in Brazil. Canadian Journal ofZoology 72:1986–2008.
Vitt, L. J., and J. D. Congdon. 1978. Body shape, reproductive effort,and relative clutch mass in lizards: resolution of a paradox. Amer-ican Naturalist 112:595–608.
Vitt, L. J., and E. R. Pianka. 2005. Deep history impacts present-dayecology and biodiversity. Proceedings of the National Academy ofSciences of the USA 102:7877–7881.
704 The American Naturalist

Vitt, L. J., E. R. Pianka, W. E. Cooper Jr., and K. Schwenk. 2003. His-tory and the global ecology of squamate reptiles. American Natu-ralist 162:44–60.
Vitt, L. J., andH. J. Price. 1982. Ecological and evolutionary determinantsof relative clutch mass in lizards. Herpetologica 38:237–255.
Warne, R.W., and E. L. Charnov. 2008. Reproductive allometry and thesize-number trade-off for lizards. American Naturalist 172:E80–E98.
Werneck, F. D., L. G. Giugliano, R. G. Collevatti, and G. R. Colli. 2009.Phylogeny, biogeography and evolution of clutch size in SouthAmerican lizards of the genus Kentropyx (Squamata: Teiidae). Mo-lecular Ecology 18:262–278.
Wiens, J. J., and C. H. Graham. 2005. Niche conservatism: integrat-ing evolution, ecology, and conservation biology. Annual Reviewof Ecology, Evolution, and Systematics 36:519–539.
Zamora-Abrego, J. G., J. J. Zuniga-Vega, and A. N. M. De Oca. 2007.Variation in reproductive traits within the lizard genus Xenosaurus.Journal of Herpetology 41:630–637.
Associate Editor: David D. AckerlyEditor: Judith L. Bronstein
“Although many turtles, and the alligators [illustrated], crocodiles, and gavials, are exceedingly rapacious, they are also among the prom-inent scavengers, eagerly feeding upon the dead animals which they find in the streams which they inhabit.” From “A Few Words AboutScavengers” by Sanborn Tenney (The American Naturalist, 1877, 11:129–135).
Life-History Patterns of World Lizards 705