kera international conference 2008 global fÓrum on ... · para este congresso internacional do...
TRANSCRIPT
1kera International Conference 2008
KERA INTERNATIONAL CONFERENCE 2008GLOBAL FÓRUM ON EDUCATION: QUANTITY AND
QUALITY.
27-29 de novembro, Seul – Korea
APRESENTAÇÃO
Com grade satisfação represento o Brasil e o Estado do Rio de Janeiro, nacondição de Presidente da Fundação Escola de Serviço Público – FESPRJ, Escola de Governo, participando deste importante evento: o KERAInternational Conference 2008 e o Global Fórum on Education: Quantityand Quality.
A participação neste espaço de debates sobre quantidade e qualidade daEducação é uma oportunidade que temos para apresentar alguns dadosrelevantes e as ações de investimentos que constituem o perfil de nossosistema educacional brasileiro. Com esta experiência, esperamos participarde amplos debates e estabelecer uma troca de conhecimentos com osprofissionais reunidos no evento.
O desenvolvimento da Educação é uma tarefa cuja responsabilidade cabea todos nós. Vejo aqui, um grande passo para vencer o desafio de realizaruma educação de qualidade, nas vozes de pessoas ilustres convidadaspara este Congresso Internacional do KERA 2008.
Nossa gratidão ao Professor Chong Jae Lee, do Departamento de Educaçãoda Universidade Nacional de Seoul (Korea), que nos convidou paraparticipar deste evento, possibilitando-nos compartilhar as experiênciasbrasileiras na área de Educação, com foco especial no Estado do Rio deJaneiro.
Agradecimentos especiais também ao Governo do Estado do Rio de Janeiro,representado pelo Secretário de Estado de Planejamento e Gestão – Dr.Sérgio Ruy Barbosa Guerra Martins, que nos confiou e delegou esta missãode disseminar as ações governamentais em nível internacional.
A todos, desejo um bom encontro.
Rio de Janeiro (Brasil), novembro de 2008.
CLAUDIO MENDONÇAPresidente da FESP RJ

3kera International Conference 2008
Excelentíssimo SenhorCHUNG-LI YUNPresidentOrganization CommitteeKERA International Conference 2008
REF.: Apresentação da Fundação Escola de Serviço Público do Estadodo Rio de Janeiro – FESP RJ, Escola de Governo.
Senhor Presidente,
Cumprimentando Vossa Excelência, vimos apresentar o Ilustríssimo SenhorCLAUDIO MENDONÇA, Presidente da Fundação Escola de ServiçoPúblico – FESP RJ, uma Instituição vinculada à Secretaria de Estado dePlanejamento e Gestão – SEPLAG, da estrutura administrativa do PoderExecutivo do governo do Estado do Rio de Janeiro.
A FESP RJ, na qualidade de Escola de Governo, tem como missão recrutare selecionar candidatos para provimento de cargos públicos, capacitarservidores públicos por meio de atividades educacionais, assim como realizarcursos gerenciais, técnico-administrativos, de informática, de pós-graduaçãoe outros projetos sob demanda.
Cabe salientar que, cumulativamente à gestão institucional da FESP RJ, oSr. Claudio Mendonça também responde, interinamente, pela Direção daFundação Centro de Informações e Dados do Estado do Rio de Janeiro –CIDE, para o qual foi nomeado pelo Governador do Estado do Rio deJaneiro, desde 06 de maio de 2008.
Desejando sucesso ao evento, apresentamos nossas
Cordiais Saudações
SERGIO RUY BARBOSASecretário de Estado de Planejamento e Gestão
5kera International Conference 2008
NNovembro de 2007. Assisto a uma reunião de pais em uma escola particular que
que exibe outdoors pela cidade comemorando o “primeiro lugar no Enem”. Presentes o
Diretor Geral da unidade e a Coordenadora Geral Pedagógica. A mãe de um aluno per-
guntava como havia sido o desempenho de uma turma de sétima série na prova de Mate-
mática.
Ao ouvir que mais de 60% dos alunos haviam tirado nota inferior ao grau estabele-
cido como mínimo para aprovação, ela declarou: “Meu filho gosta da professora e da matéria
e faz o “reforço” da própria escola todos os dias, mas jura que ele e muitos colegas estudaram
até a página 92 do livro e essa matéria estava na página 97. Aliás, algumas questões são
cópias exatas de exercícios do livro”.
Seguiu-se então um longo debate sobre se o professor havia informado “o que ia
cair na prova” de forma correta, se os alunos haviam anotado no caderno ou “confiado na
memória” e, o que mereceu maior atenção do diretor, o fato de existirem questões idênticas
às do livro; o que poderia, segundo ele, gerar “um favorecimento” daquele aluno que fez
repetitivamente os exercícios do material didático.
Alguns pais exigiam uma nova prova, o que era prontamente rechaçado pela equi-
pe pedagógica, afinal, “seria injusto com os demais”. Não consegui entender claramente as
“razões” e não me atrevi a propor as soluções para o impasse, mas estava claro ali que a
avaliação parecia se colocar num patamar de disputa entre professor e alunos, e deles entre
si, onde a prova fixaria os limites e regras do embate.
Mais adiante, assistimos a uma minuciosa explicação do professor de Matemática,
que demonstrou uma curva de graus que dispunha necessariamente um grupo de alunos
na média, acima da média e abaixo da média, o desvio padrão e a esperada taxa de repro-
vação “cientificamente arbitrada”.
A curva garantia uma taxa constante de reprovação, relativizando as notas dos
alunos em função da aprendizagem geral da turma. Nesse ponto a Coordenadora Pedagó-
gica afirmava: “Está certo, afinal, numa recuperação onde todo mundo passa de ano há algo
de errado...”.
Todos balançavam a cabeça concordando. A partir daí me ocorreu o pensamento de
que algumas verdades absolutas dos sistemas de avaliação ultrapassam as fronteiras das
salas de aula e ganham contornos em alguns, digamos, fundamentos de nossa sociedade.
Parece absolutamente razoável em nosso país que o professor se coloque numa
posição de “fonte do conhecimento”; que toda a aprendizagem gire entorno “do que vai
cair” na prova e que se fixem metas cognitivas onde, se alguns alunos conseguem atingi-las
os demais poderiam ter chegado lá se não fossem desinteressados, bagunceiros ou pregui-
çosos.

6kera International Conference 2008
A repetência parece ser necessária, inclusive, pra emprestar seriedade ao sistema
educacional e a recuperação de estudos uma ferramenta que mistura oportunidade de
nota e punição. A competitividade entre os alunos acontece no dia-a-dia da sala de aula,
e o fracasso de uma parcela numerosa destes num teste parece reconfortar os pais (seus
filhos não estão sozinhos nas notas baixas) além de aprisionar o professor que luta pela
padronização cada vez maior da avaliação, buscando comparar os estudantes entre si.
A conhecida “segunda chamada” tem necessariamente que ser mais difícil que a
primeira, afinal, os alunos terão mais tempo pra estudar e, se for diferente, é provável que
todos os alunos “fiquem doentes” (!) para fazer a prova depois, com mais calma e fora da
inexorável pressão estabelecida na semana de testes. Os trabalhos em grupo são raros e
encarados com pouca seriedade pelos alunos e pais.
Numa outra oportunidade ouvi o seguinte relato de um responsável: “Meu filho,
no ano passado, começou a ler um livro do Sherlock Holmes por sugestão da própria
escola e se apaixonou pelo gênero. No final do ano fomos à Bienal e ele escolheu com
entusiasmo mais dois dessa série. Leu um nas férias e agora gostaria de ler o seguinte,
mas como a agenda dele de aulas extraclasse, dever de casa e provas semanais é muito
intensa, ele não consegue conciliar essa leitura com a “leitura obrigatória” de Dom Cas-
murro, do Machado de Assis”. Por que ele não pode ler o livro que escolheu? Perguntei.
O professor disse que isso seria impossível, senão ele não teria como fazer a avaliação
para constatar se o aluno havia mesmo lido o livro, afinal a avaliação deveria ser padroni-
zada e sem o temor da nota baixa “ninguém lê”. Dias antes assistia a uma palestra de
Rubem Alves em que ele contava sobre uma escrita no mural da biblioteca da Escola da
Ponte (Cidade do Porto, Portugal), com os mandamentos do setor e o primeiro deles era
“nenhuma criança será obrigada a ler aquilo que não deseja ler...”.
Até que ponto essa padronização é necessária? Por que a escola não desenvolve
estratégias de aprendizagem cooperativa buscando que os alunos não apenas desenvol-
vam atividades em grupo, mas aprendam como um time, ajudando e encorajando um ao
outro a aprender e superar os desafios1?
O aluno, simplesmente, quando não atinge as notas das provas, “leva bomba”. A
avaliação escolar frequentemente não é utilizada, para diagnosticar problemas e buscar
soluções. Ao revés, é encarada como um duelo onde uma pegadinha (manobra para
confundir) na prova é esperada com ansiedade pelo estudante. Por conta disso, dentre
outras razões, do total de 53 milhões de crianças matriculadas nas escolas, identificam-se
apenas 47 milhões entre 6 e 17 anos.
Ou seja, temos seis milhões de pessoas a mais no sistema (repetentes em sua
imensa maioria), resultando em um custo para o Brasil de cerca de R$12 bilhões a cada
ano. Dinheiro jogado fora se analisarmos os números do Prova Brasil que mostram clara-
mente que o desempenho dos alunos com um histórico de retenções é inferior ao dos que
nunca repetiram o ano. Ainda que seja óbvio, vale lembrar que a repetência, via de regra,
não faz alunos melhores.
Para melhor ilustrar esses desafios que as redes educacionais dos diversos países
enfrentam, reproduzo2 abaixo o trecho da reportagem especial que analisa os primeiros
resultados do programa No Children Left Behind (Nenhuma Criança Deixada para
1 - Cooperative Learning – Robert Slaving – 19952 - Tradução livre
7kera International Conference 2008
Trás), que foi publicado no The New York Times Magazine, em 26 de novembro de
20063
O texto fala sobre os diferentes níveis de desempenho escolar entre crianças em
razão de sua maior ou menor vulnerabilidade social:
“(...) A situação foi complicada pelo fato de que realmente existem dois abismos
entre as avaliações: aquele entre as crianças brancas e negras e outro entre as pobres e as
que estão acima da linha da pobreza. A partir daí essas categorias tendem a se sobrepor
- as crianças negras têm três vezes mais chances de crescer na pobreza do que as brancas
- e muitos pensam se focar na raça é realmente uma abordagem útil. Por que não concen-
trar em corrigir as desvantagens acadêmicas para as crianças pobres? Solucione este
ponto e o abismo entre negros e brancos se resolverá por si só.
Durante muito tempo houve evidências de que as crianças pobres ficavam para
trás desde cedo em relação às ricas e de classe média, e assim se mantinham. No entanto,
pesquisadores não conseguiram isolar as razões. Pais ricos têm os genes melhores? Eles
valorizam mais a educação? Será que é porque eles compram mais livros e brinquedos
educacionais para seus filhos ou porque se divorciam menos do que pais pobres? Crian-
ças ricas comem comida mais nutritiva, se mudam menos de residência, dormem mais ou
assistem menos TV? Incapazes de identificar os fatores importantes e eliminar os
irrelevantes, não foi possível nem começar a traçar uma estratégia para reduzir o abismo.
Foi aí que pesquisadores começaram a mergulhar profundamente nos hábitos
das famílias americanas, estudando de perto os relacionamentos entre pais e filhos. Os
primeiros estudiosos que mostraram resultados específicos foram Betty Hart e Todd R.
Risley, psicólogos infantis na Universidade de Kansas, que em 1995 publicaram os resul-
tados da pesquisa minuciosa em aprendizagem da língua. Dez anos antes eles recruta-
ram 42 famílias com crianças recém nascidas em Kansas City e durante 3 anos consecu-
tivos visitaram cada uma, durante um dia no mês, gravando praticamente tudo o que
acontecia entre a criança e os pais ou responsável (s).
Os pesquisadores então transcreveram todas as gravações, cruzaram e analisa-
ram os dados de aprendizagem de linguagem de cada criança e o estilo de comunicação
de cada pai, mãe ou responsável. O primeiro resultado é que o crescimento do vocabulá-
rio difere enormemente de uma classe para outra e que a diferença entre as classes se
abre rapidamente. A partir dos 3 anos, crianças cujos pais ou responsáveis tinham uma
carreira profissional, adquiriam um vocabulário de cerca de 1.100 palavras, enquanto
que aquelas cujos pais estavam desempregados tinham um vocabulário de cerca de 525
palavras. Os Q.Is. das crianças se relacionavam próximos aos vocabulários. A média do
Q.I. entre as crianças com pais “profissionais” era de 117, e das crianças com pais de
classes trabalhadoras de 79.
Quando Hart e Risley levantaram a questão sobre o que causava as variações, a
resposta foi surpreendente. Comparando os testes de vocabulário com as observações
sobre cada vida familiar, eles puderam concluir que o tamanho de cada vocabulário se
relacionava de perto com um fator simples: o número de palavras que os pais falavam
com as crianças. Isso variava muito de uma casa para outra e, também, de acordo com a
classe social. Nas casas dos pais que exerciam atividade profissional, eles dirigiam às
crianças cerca de 487 “expressões vocais” - variando de comandos curtos a “pensamentos
3 - www.wehaitians.com/still%20left%20behind.html.

8kera International Conference 2008
altos” - por hora. Nas casas dos pais das classes menos favorecidas, a criança ouvia cerca
de 178 expressões vocais por hora.
E tem mais, os tipos de palavras e frases que as crianças ouviam variavam de
acordo com a classe social. A diferença básica estava no número de “desencorajamentos”
que a criança ouvia - proibições e palavras de desaprovação - comparadas com o número
de encorajamentos, ou palavras ou frases de aprovação. A partir dos 3 anos, a criança de
pais empregados ouviam, em média, 500.000 encorajamentos e 80.000
desencorajamentos. Para as crianças com pais desempregados a situação se revertia:
75.000 encorajamentos e 200.000 desencorajamentos.
Hart e Risley descobriram que a complexidade da linguagem da criança melhora-
va ao passo que o número de palavras que ela ouvia aumentava. As conversas passavam
de simples instruções a discussões sobre passado e presente, sentimentos, abstrações,
situações de causa e efeito - e tudo isso estimula o desenvolvimento intelectual. Eles
demonstraram que o Q.I. está diretamente ligado à linguagem à qual a criança é exposta
durante a infância, assim como o sucesso acadêmico durante sua vida. Ouvir menos
palavras e muitas proibições e desencorajamentos têm efeito negativo no Q.I.; ouvir
muitas palavras, mais afirmações e frases complexas, têm efeito positivo no Q.I. Os pais
com atividades profissionais consolidadas estavam proporcionando às crianças vanta-
gens a cada palavra falada, e esta vantagem só fez aumentar.
Desde que Hart e Risley publicaram seus achados, cientistas sociais têm exami-
nado outros elementos da relação de pais e filhos, e, enquanto os métodos variaram, as
conclusões sempre apontaram para grandes diferenças de classe social como principal
fator no crescimento intelectual das crianças. Jeanne Broocks-Gunn, professor na Uni-
versidade do Professor (Teacher College), supervisionou centenas de entrevistas de pais
e coletou milhares de horas de filmagem dos pais com os filhos, que a equipe pesquisa-
dora escalonou.
Conclusão: crianças com situação financeira satisfatória tendem a experimentar
atitudes parentais mais sensíveis, encorajadoras, menos intrusivas e imparciais - tudo o
que, segundo a descoberta, ajuda à aumentar o Q.I. e o desenvolvimento escolar. Eles
analisaram os dados para ver se existia alguma outra coisa acontecendo nos lares da
classe média que poderia contar como vantagem, mas descobriram que, enquanto a
situação financeira importa, a maneira de como a criança é tratada importa muito mais.
Martha Farah, pesquisadora na Universidade da Pennsylvania, trabalhou no
grupo do professor Brooks Gunn usando as ferramentas da neurociência para calcular
exatamente que habilidades faltam às crianças pobres e que comportamentos parentais
afetam o desenvolvimento de tais habilidades. Descobriu, por exemplo, que, geralmente,
quando as crianças de classe média são alimentadas pelos pais, o lobo temporal medial do
cérebro é mais estimulado, o que provoca o desenvolvimento da memória. (...)”.
Este tema é retratado com maior profundidade no livro Unequal Childhoods:
Class, Race, and Family Life - Annete Laureau - 2004.
Seguindo a mesma linha de pensamento da reportagem a ONG norte americana
The Education Trust (Washington D.C., EUA)4- Educação de Confiança, numa tradu-
ção livre - se especializou em realizar estudos no sentido de fazer o governo atentar para
a diferença educacional entre crianças das classes operárias e das classes mais favorecidas.
4 - (http://www2.edtrust.org/edtrust/)
9kera International Conference 2008
A educação pode melhorar esse abismo social e cultural, mas pode, também,
aprofundá-lo. Esse é um tema importantíssimo para os países desenvolvidos, mas ainda
pouco falado no Brasil, onde o problema é especialmente grave. Dados do exame interna-
cional de avaliação PISA (realizado com 43 países, dos quais trinta da união européia e
outros convidados, inclusive o Brasil) com os alunos de 15 anos de diversos países demons-
tram que temos absurdos 54% de nossos estudantes no nível de desempenho considerado
mais baixo, contra 19,8% da média da OCDE (Organização para a Cooperação e Desen-
volvimento Econômico). O Chile tem 38%, a Coréia 9%, a Irlanda 17% e a Finlândia 7%.
Assim, a ONG Norte Americana divulgou um relatório que mostra que nos estados
americanos onde as crianças são menos favorecidas as escolas oferecem professores com
menos experiência e base acadêmica.
No estado de Illinois, foi criado um indicador de qualidade do professor que leva em
conta a média do vestibular, o nível da universidade freqüentada e o percentual de profes-
sores de uma escola que fracassaram na prova de certificação docente.
Nos Estados Unidos, como no Brasil, existem inúmeros estudos que mostram clara-
mente a relação entre qualidade do professor e os resultados de aprendizagem dos alunos.
Por outro lado, a organização norte americana denuncia que quanto mais pobres ou negros
tem uma escola, mais professores com baixa qualificação lhe são oferecidos. Esse estudo
derruba o mito de que as crianças pobres vão mal na escola apenas porque não têm acesso
aos bens culturais na família, tese bastante difundida em nosso país.
Existem diversos cenários que contribuem para aprofundar essas diferenças, como
por exemplo, a prerrogativa (justa, diga-se) do magistério de escolher o posto de trabalho na
relação direta de sua colocação nos concursos públicos. Quando isso ocorre, os professores
melhores colocados tendem a escolher as escolas melhores localizadas, com acessos mais
fáceis, mais equipamentos e com alunos que já possuem melhor desempenho.
Neste ano de 2008, coordenamos5 uma pesquisa da Fundação Escola de Serviço
Público (www.fesp.rj.gov.br) que analisou os dados do concurso público do estado do Rio
de Janeiro realizado em 2005. Foram estudados os 15% melhores colocados e os 15% piores
classificados nas provas para as carreiras de Professor Docente I de Língua Portuguesa e
Matemática, e sua posterior distribuição nas diferentes escolas da rede, chegando-se à
mesma conclusão.
Diversos educadores defendem que o “ensinante” tem de ser, antes de tudo, um
ótimo “aprendente”, que o mestre que tem maior domínio sobre os conteúdos de uma
determinada disciplina tem melhor perspectiva de desempenho, e ainda se levarmos em
conta que existe alguma relação entre a proficiência do professor e a sua classificação nos
exames, podemos supor que os professores melhores colocados nos concursos tendem a ter
melhor capacidade de ensinar.
Existem algumas medidas que contribuiriam para reduzir o abismo entre menos
pobres e mais pobres na escola pública, tais como o incentivo financeiro para os melhores
diretores de escola atuarem nas unidades que atendem às crianças mais pobres; identifica-
ção e oferecimento de incentivo aos melhores professores para eles ensinarem nas escolas
onde há mais repetência e, ainda, não incentivar com maior orçamento as escolas com
melhor desempenho, sem levar em consideração a realidade socioeconômica dos alunos.
5 - Em conjunto com Márcia Martinez

10kera International Conference 2008
E qual a opinião dos pais sobre a escola pública? Pesquisa realizada pelo IBOPE6
em novembro de 2006 com responsáveis por alunos que estudam em escolas públicas
municipais ou estaduais do Rio de Janeiro trouxe várias informações bastante interes-
santes: 81% dos consultados aprovam a realização de provas de avaliação externa das
escolas, como o Prova Brasil. Por outro lado, 71% não tiveram qualquer informação sobre
o desempenho das mesmas. 96% demonstraram interesse em receber estas informações.
O mesmo percentual de 96% defende que haja avaliação de desempenho dos professo-
res da rede pública no estado do Rio de Janeiro.
Um número menor, porém expressivo, de 68%, acham que os professores deveri-
am ganhar de acordo com o mérito ou a qualidade de seu desempenho. Nada menos que
72% acreditam que os diretores de escola deveriam poder demitir os professores que não
tivessem desempenho de acordo com as exigências da escola, pagando as indenizações
correspondentes.
A pesquisa se baseou num modelo quem vem sendo, ano após ano, aplicado no
Chile pelo Centro de Estudos Públicos7 uma organização não governamental financiada
por empresas privadas sediadas naquele país. A pesquisa avalia, também, a satisfação
dos pais em relação ao sistema educacional, entre outros temas. Esse conjunto de infor-
mações nos leva a crer que cada vez mais os usuários do serviço de educação valorizam a
avaliação externa e gostariam de ter mais informações para exigir resultados do trabalho
realizado pelas escolas. Enfim, esperam um bom desempenho do sistema educacional
em benefício de seus filhos.
A Professora Lina Kátia da Universidade Federal de Juiz de Fora concluiu uma
análise da implementação de programas de avaliação em larga escala nos 15 estados da
federação que já o possuem. Coincidentemente são estados com melhores indicadores no
setor. Os estudos mostram a evidente correlação entre a existência de sistemas de avali-
ação externa e o desempenho das redes, inclusive com a piora nos resultados quando os
programas foram interrompidos.
John Patten, Ministro da Educação na época da implementação do sistema de
avaliação na Inglaterra já em 1992, declarou que estava havendo uma melhoria no
desempenho dos alunos a partir do segundo ano pelo fato de os professores ensinarem
mais intensamente o que era exigido pelos testes e tarefas padronizados: pontuação,
ortografia, caligrafia e aritmética mental. Deram mais atenção ao básico e isso apareceu
nos níveis mais elevados de desempenho das crianças.
Sob outro prisma, não causa estranheza que setores sindicais se oponham à ava-
liação do sistema e por vezes consigam até o apoio de parcela dos estudantes. Foi assim
na implantação do Provão, nos cursos superiores, com os famosos boicotes; ocorreu no
Chile, no Rio de Janeiro, na Inglaterra e em diversas outras localidades.
Políticos, por seu turno, sem uma análise mais aprofundada do tema correm o risco
de ceder às pressões da corporação que prefere, naturalmente, ganhos salariais lineares e
progressões por formação e tempo de serviço. O Chile, mais uma vez, nos oferece um bom
exemplo. O governo precisou negociar durante 11 anos com o sindicato para estabelecer
no plano de cargos as primeiras relações entre desempenho e carreira. A PUC de Santi-
6 - (http://www.ibope.com.br/calandraWeb/servlet CalandraRedirect?temp=5&proj=PortalIBOPE&pub=T&db=caldb&comp=Notícias&docid=7D4968A678BF3E828325724B0068FD04)7 - (http://www.cepchile.cl/dms/lang_1/home.html)

11kera International Conference 2008
ago está filmando as aulas dos professores e avaliando-os através de uma equipe de 400
especialistas. A cidade de Boston nos Estados Unidos chega ao extremo de fechar uni-
dades escolares que apresentam baixo desempenho.
Não avaliar o sistema é desprezar informações valiosíssimas para a elaboração dos
programas educacionais. Significa desperdiçar recursos públicos na medida em que estes
programas acabam por tratar de forma igual escolas, professores e alunos bastante desi-
guais. Sem conhecer as deficiências pontuais de cada escola e até das turmas de alunos,
parece-nos extremamente difícil definir os conteúdos e a abrangência da capacitação do
magistério ou do reforço escolar, apenas para dar dois exemplos.
É a avaliação do sistema - que possui em todo o Brasil exemplos claros de
disparidade, como veremos a seguir - que pode melhorar a sua eficiência. No ano de
2007, coordenamos um pesquisa, também realizada, pela FESP que cruzou os dados
sobre o gasto com educação por aluno, salário do professor e desempenho dos estudantes
nas redes municipais. Esse estudo se baseou num modelo semelhante desenvolvido pelo
Professor Naércio Menezes, da Universidade de São Paulo - USP.
O objetivo foi retratar alguns aspectos da situação da educação no estado do Rio
de Janeiro, mas reflete muito do que é a educação nacional.
O primeiro ponto deste diagnóstico mostra que existe uma diferença bastante
expressiva entre as redes municipais nos gastos com educação no Ensino Fundamental,
por aluno, por ano, conforme dados da Secretaria do Tesouro Nacional. Podemos obser-
var que os gastos vão de R$ 900,00, chegando a R$ 5.300,00. A média nacional é de R$
1.975,00.
Os gráficos seguintes procuram retratar o desempenho dos alunos em Português
e Matemática nas 4as e das 8as séries na Prova Brasil do MEC - INEP de 2005.
Gastos do Município por aluno do Ensino Fundamental (Anual) RS

12kera International Conference 2008
A análise dos números nos permite observar um fato surpreendente: Temos
resultados de 4ª série superiores ao de alunos de 8ª série nas diferentes redes municipais
do Rio de Janeiro. E ainda, contrario senso, e o que é muito grave, alunos concluindo o
Prova Brasil Matemática 4 série
Prova Brasil Matemática 8a série
Prova Brasil Português 8a série
13kera International Conference 2008
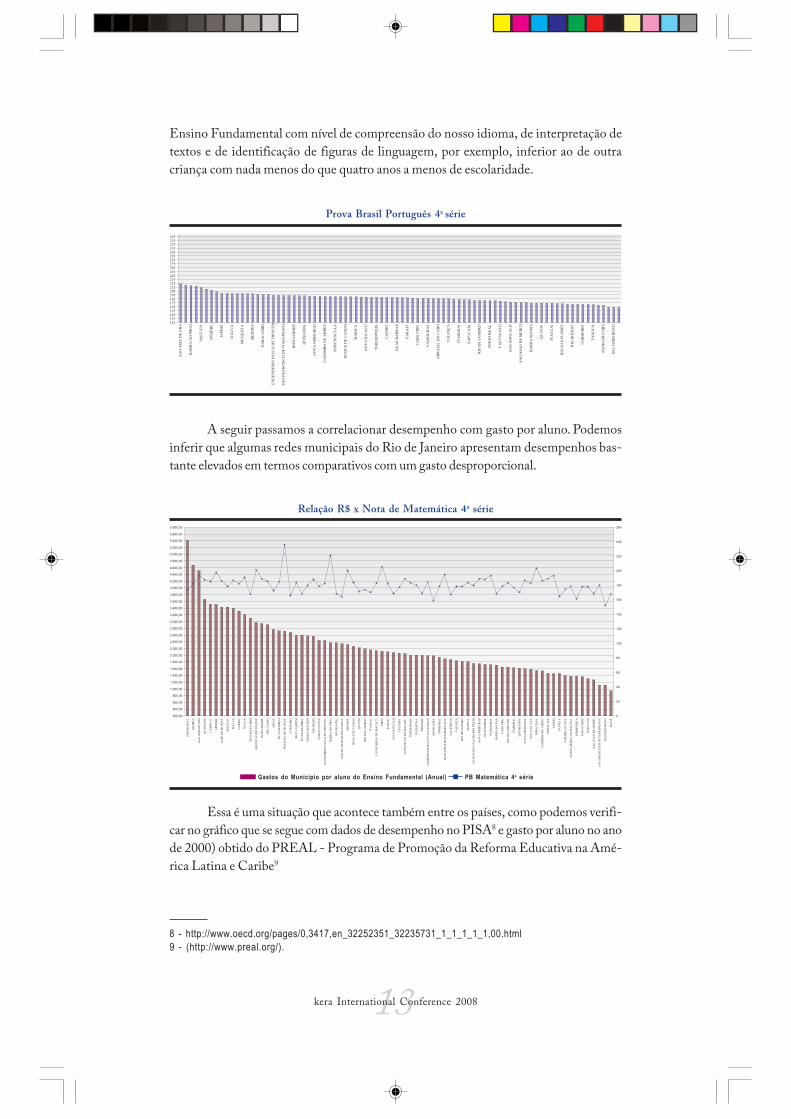
Ensino Fundamental com nível de compreensão do nosso idioma, de interpretação de
textos e de identificação de figuras de linguagem, por exemplo, inferior ao de outra
criança com nada menos do que quatro anos a menos de escolaridade.
A seguir passamos a correlacionar desempenho com gasto por aluno. Podemos
inferir que algumas redes municipais do Rio de Janeiro apresentam desempenhos bas-
tante elevados em termos comparativos com um gasto desproporcional.
8 - http://www.oecd.org/pages/0,3417,en_32252351_32235731_1_1_1_1_1,00.html9 - (http://www.preal.org/).
Essa é uma situação que acontece também entre os países, como podemos verifi-
car no gráfico que se segue com dados de desempenho no PISA8 e gasto por aluno no ano
de 2000) obtido do PREAL - Programa de Promoção da Reforma Educativa na Amé-
rica Latina e Caribe9
Prova Brasil Português 4a série
Relação R$ x Nota de Matemática 4a série
Gastos do Município por aluno do Ensino Fundamental (Anual) PB Matemática 4a série

14kera International Conference 2008
Vale ressaltar que temos países com um gasto menor e um desempenho seme-
lhante. É o caso de Portugal em relação à Espanha: o primeiro tem o mesmo gasto e um
desempenho inferior. O gasto dos Estados Unidos por aluno é bastante significativo e a
nota no PISA é inferior à da Finlândia e de diversos outros países.
Não há, também, proporcionalidade entre gasto por aluno e os salários do magis-
tério de onde podemos concluir que os investimentos não priorizaram a melhoria salarial
do professor.
No gráfico anterior, nova desproporcionalidade, nesse caso na relação entre o
salário do professor e o desempenho na avaliação externa das redes .
A conclusão a que chegamos é que tão importante quanto gastar mais é gastar
melhor, de maneira mais eficiente, o que pode se atingido por diversos caminhos. Um
deles, que parece ser um ponto de unanimidade entre os sistemas educacionais de alta
performance, é o de estabelecer a relação de ensino-aprendizagem com foco no aluno e
não exclusivamente no conhecimento. O sistema de mediação do conhecimento, onde o
Gastos do Município por aluno do Ensino Fundamental (Anual) RS
0 10,000 20,000 30,000 40,000 50,000 60,000 70,000 80,000
600
550
500
450
400
350
300
Gasto cumulativo por aluno (SPPP)
No
tam
édia
no
PIS
A(l
eitu
ra, m
atem
átic
a,ci
ênci
as)
CoréiaCanadá
EUAEspanha
Portugal
Polônia
Chile
México Argentina
IndonésiaBrasil
Peru
Salário x nota Português/ Matemática 4a
PB Matemática 4a série PB Português 4a série Salário dos Prof. 1a a 4a série

15kera International Conference 2008
professor estimula as atividades de pesquisa e de construção coletiva do aprendizado,
parece ser o eixo fundamental do sistema educacional dos países membros da OCDE10.
A Irlanda, por exemplo, está realizando uma enorme transformação na área das
dificuldades de aprendizagem dos alunos. Foram alocados, nos últimos cinco anos, mais
de 5 mil novos professores, representando um aumento de 300 para 8 mil profissionais
de diferentes áreas (professores especializados, psicoterapeutas, fonoaudiólogos, psicólo-
gos) envolvidos nesta missão. Isso significa que 1 a cada 5 professores no Ensino Funda-
mental se dedica a alunos com necessidades especiais.
De fato, entrevistando uma equipe de professores que se dedicam a esses alunos,
em uma escola de Educação Fundamental Irlandesa, ouvi a declaração de que esta
realidade mudou bastante, pois a equipe, atualmente com oito profissionais, não contaria,
sequer, com dois há sete anos atrás. Essa política de atendimento aos alunos é o ponto
forte do sistema educacional irlandês. O conceito de necessidades especiais é bastante
amplo nas escolas e abrange desde situações de natureza emocional (crises familiares,
divórcios), até problemas de comportamento, como dificuldades de aprendizagem e defi-
ciências de origem neurológica ou física, em geral.
Nesse sentido as autoridades do Ministério da Educação da Finlândia são unâni-
mes em apontar os eixos principais de uma reforma educacional bem sucedida: consenso
político que permita dar o tempo necessário para que as mudanças surtam efeito; inves-
timento na formação, avaliação e motivação dos professores; atenção individualizada a
cada aluno, onde o professor é o mediador entre ele e o conhecimento (assim como o
treinador na atividade esportiva), e não uma “fonte de sabedoria”.
O sistema educacional rural colombiano atingiu bons indicadores de desempe-
nho e o reconhecimento da UNESCO. No mesmo sentido, seus principais fundamentos
são: colocar o aluno, ao invés do conhecimento, no centro do processo educacional; ensi-
nar por atividades e atender e avaliar de forma individualizada ou em pequenos grupos.
O programa colombiano de escolas rurais, que inclui o Programa Escuela Nueva, está em
implantação em países como o Brasil, Chile, México, Peru, Etiópia, Uganda e Quênia. As
escolas rurais na maioria dos países em desenvolvimento não recebem recursos, a infra-
estrutura é precária e isto acaba refletindo no desempenho dos alunos. Dentro deste
contexto aquele país montou uma estratégia educacional bastante inovadora. Iniciou
com uma discriminação positiva destas escolas, oferecendo material didático diferencia-
do, e buscou capacitar os mestres em uma nova metodologia educacional.
O mais surpreendente é uma política pública educacional se manter durante 30
anos a ponto de trazer resultados numa área onde as mudanças demoram décadas a
aparecer. Na Colômbia, como no restante da América do Sul, os programas governamen-
tais flutuam ao sabor das composições políticas e do mosaico de poder que cada eleição
estabelece. Então por que este projeto constituiu-se numa exceção? Segundo a Educa-
dora Vicky Colbert, vários fatores levaram a isto: as avaliações positivas de organismos
internacionais como o Banco Mundial, que financiou parte dos programas; as articula-
ções com os professores da comunidade local, que fizeram com que a metodologia perma-
necesse, a despeito da anuência do governo; e, o mais importante, a aliança com o setor
produtivo que, mesmo sendo agrícola, entendeu que uma maior escolarização poderia
trazer uma maior produtividade.
10 - Organização para a Cooperação e Desenvolvimento Econômico (http://www.oecd.org)
16kera International Conference 2008
Quando recebi o telefonema da Professora Ângela Rocha com o convite para
escrever o prefácio dessa obra tive um misto de preocupação e alegria. Preocupação com
o fato de não possuir um perfil acadêmico que pudesse proporcionar ao leitor um texto à
altura dos capítulos deste livro e, ao mesmo tempo, uma enorme alegria em razão da
admiração que tenho pelos autores.
Essa admiração não se deve somente à leitura dos artigos e livros dos mesmos,
mas também às ações que tivemos a oportunidade de desenvolver juntos quando ocupei,
pela segunda vez, o cargo de Secretário de Educação do Estado do Rio de Janeiro.
A Secretaria de Estado de Educação do Rio de Janeiro realizou, ao longo de 2005,
em parceria com a UFRJ, cursos para os professores docentes de diferentes disciplinas,
onde foram apropriados os conceitos e diretrizes propostos na Reorientação Curricular. A
partir de subsídios teóricos, os professores produziram os materiais de práticas pedagógi-
cas para utilização em sala de aula que integram este fascículo.
O produto elaborado pelos próprios professores da rede resultou em materiais
orientadores para que cada disciplina pudesse trabalhar a nova proposta curricular, no
dia-a-dia da sala de aula.
Podemos considerar aquele material um roteiro com sugestões para que os pro-
fessores regentes, de todas as escolas, trabalhem a sua disciplina com os diferentes recur-
sos disponibilizados na escola. O material produzido representa a consolidação da pro-
posta de Reorientação Curricular, amadurecida durante dois anos (2004-2005), na pers-
pectiva da relação teoria-prática.
Cabe ressaltar que a Reorientação Curricular foi uma proposta que deveria ga-
nhar contornos diferentes face à contextualização de cada escola. Assim, sugestões foram
apresentadas nos volumes para serem redimensionadas de acordo com os valores e prá-
ticas de cada docente.
Esta ação objetivou propiciar a implementação de um currículo que, em sintonia
com as novas demandas sociais, busque o enfrentamento da complexidade que caracte-
riza este novo século.
Nesta perspectiva, é necessário envolver cada vez mais toda a escola no importan-
te trabalho de construção de práticas pedagógicas voltadas para a formação de alunos
cidadãos, compromissados com a ordem democrática.
Soma-se a esta iniciativa o esforço na recomposição das equipes pedagógicas das
escolas, com a designação dos Coordenadores e Orientadores Pedagógicos e o programa
de formação continuada dos mesmos, também desenvolvido em parceria com a Univer-
sidade Federal do Rio de Janeiro.
Esses podem se contiruir em avanços na política educacional de nosso estado: o
fortalecimento do elemento responsável pela articulação docente, a realização de estudos
e a promoção de estratégias coletivas para melhorar o desempenho escolar dos alunos,
além de buscar fortalecer os aspectos formativos do sistema de avaliação escolar.
Claudio Mendonça
Presidente da Fundação Escola de Serviço Público do Estado do Rio de Janeiro
(FESP-RJ)

17kera International Conference 2008
Dados de CoberturaTaxas de matrículas e atendimento escolar
BRASIL
Brasil: Evolução da Taxa de Atendimento (2000/2005)
Fonte: IBGE/Censo Demográfico 2000 e IBGE-PNADs 2001 a 2005.
Educação Básica - Taxa líquida e bruta de matrícula eatendimento escolar
Fonte: MEC/INEP - Censo Escolar e IBGE-PNAD 2001 e 2003 - Dados calculados por MEC/INEP
1980 80,9 49,7 80,1 98,3 14,3 33,3
1991 89,0 62,3 83,8 105,8 17,6 40,8
1994 92,7 68,7 87,5 110,2 20,8 47,6
1996 91,2 69,4 86,5 112,3 24,1 50,7
1998 95,8 81,1 95,3 128,1 30,8 68,1
1999 97,0 84,5 95,4 130,5 32,6 74,8
2001 96,5 81,1 93,1 121,3 36,9 73,9
2003 97,2 82,4 93,8 119,3 43,1 81,1
2004 97,1 81,9 93,8 117,6 44,4 81,4
Ano7 a 14 anos 15 a 17 anos
Taxa deEscolarização
Líquida
Taxa deEscolarização
Bruta
Taxa deEscolarização
Líquida
Taxa deEscolarização
Bruta
Taxa de Atendimento Ensino Fundamental Ensino Médio
18kera International Conference 2008
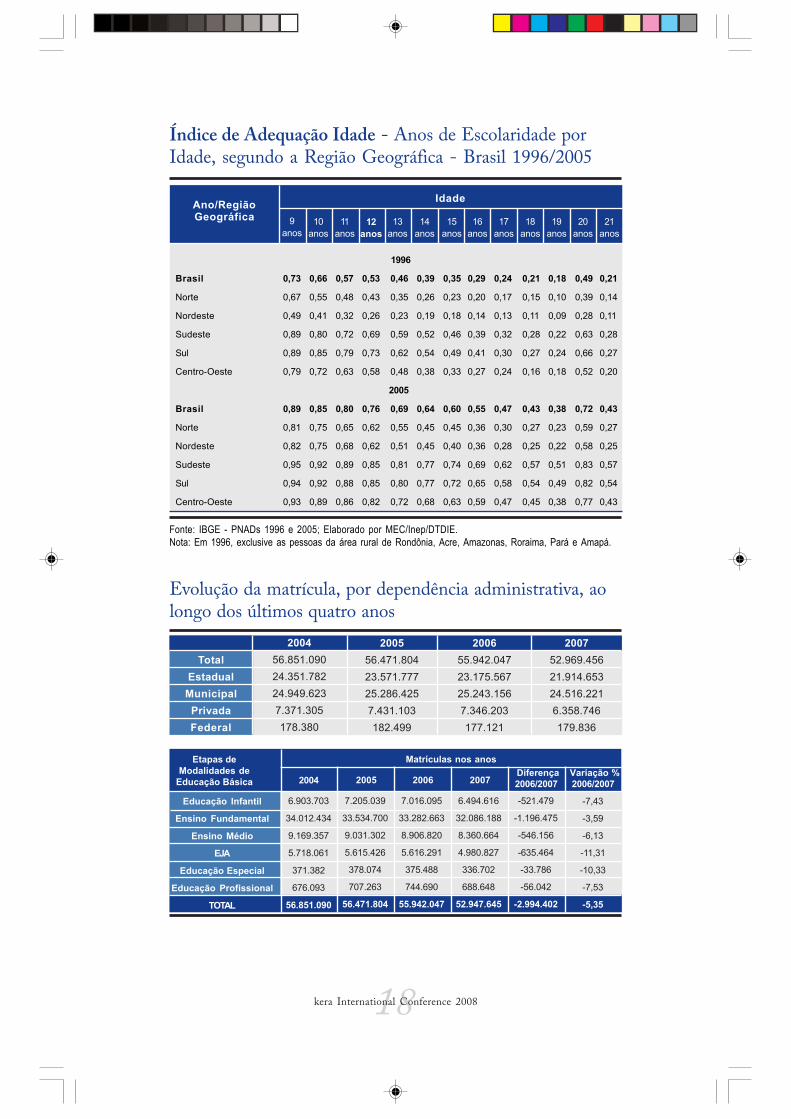
Índice de Adequação Idade - Anos de Escolaridade porIdade, segundo a Região Geográfica - Brasil 1996/2005
Fonte: IBGE - PNADs 1996 e 2005; Elaborado por MEC/Inep/DTDIE.Nota: Em 1996, exclusive as pessoas da área rural de Rondônia, Acre, Amazonas, Roraima, Pará e Amapá.
1996
Brasil 0,73 0,66 0,57 0,53 0,46 0,39 0,35 0,29 0,24 0,21 0,18 0,49 0,21
Norte 0,67 0,55 0,48 0,43 0,35 0,26 0,23 0,20 0,17 0,15 0,10 0,39 0,14
Nordeste 0,49 0,41 0,32 0,26 0,23 0,19 0,18 0,14 0,13 0,11 0,09 0,28 0,11
Sudeste 0,89 0,80 0,72 0,69 0,59 0,52 0,46 0,39 0,32 0,28 0,22 0,63 0,28
Sul 0,89 0,85 0,79 0,73 0,62 0,54 0,49 0,41 0,30 0,27 0,24 0,66 0,27
Centro-Oeste 0,79 0,72 0,63 0,58 0,48 0,38 0,33 0,27 0,24 0,16 0,18 0,52 0,20
2005
Brasil 0,89 0,85 0,80 0,76 0,69 0,64 0,60 0,55 0,47 0,43 0,38 0,72 0,43
Norte 0,81 0,75 0,65 0,62 0,55 0,45 0,45 0,36 0,30 0,27 0,23 0,59 0,27
Nordeste 0,82 0,75 0,68 0,62 0,51 0,45 0,40 0,36 0,28 0,25 0,22 0,58 0,25
Sudeste 0,95 0,92 0,89 0,85 0,81 0,77 0,74 0,69 0,62 0,57 0,51 0,83 0,57
Sul 0,94 0,92 0,88 0,85 0,80 0,77 0,72 0,65 0,58 0,54 0,49 0,82 0,54
Centro-Oeste 0,93 0,89 0,86 0,82 0,72 0,68 0,63 0,59 0,47 0,45 0,38 0,77 0,43
Ano/RegiãoGeográfica
Idade
9anos
10anos
11anos
12anos
13anos
14anos
15anos
16anos
17anos
18anos
19anos
20anos
21anos
Evolução da matrícula, por dependência administrativa, aolongo dos últimos quatro anos
200456.851.090
24.351.782
24.949.623
7.371.305
178.380
200556.471.804
23.571.777
25.286.425
7.431.103
182.499
200655.942.047
23.175.567
25.243.156
7.346.203
177.121
200752.969.456
21.914.653
24.516.221
6.358.746
179.836
TotalEstadualMunicipal
PrivadaFederal
7.016.095
33.282.663
8.906.820
5.616.291
375.488
744.690
55.942.047
6.903.703
34.012.434
9.169.357
5.718.061
371.382
676.093
56.851.090
Etapas deModalidades de
Educação Básica
Matrículas nos anos
Educação Infantil
Ensino Fundamental
Ensino Médio
EJA
Educação Especial
Educação Profissional
TOTAL
7.205.039
33.534.700
9.031.302
5.615.426
378.074
707.263
56.471.804
6.494.616
32.086.188
8.360.664
4.980.827
336.702
688.648
52.947.645
-521.479
-1.196.475
-546.156
-635.464
-33.786
-56.042
-2.994.402
-7,43
-3,59
-6,13
-11,31
-10,33
-7,53
-5,35
2004 2005 2006 2007 Diferença2006/2007
Variação %2006/2007

19kera International Conference 2008
Dados de QualidadeTaxas de rendimento: Aprovação, Reprovação e Abandono
BRASIL
Taxa de Aprovação (%) 1997/2007 - Anos Iniciais doEnsino Fundamental (SI – 4a série)
Fonte: INEP/MECFonte: Censo Escolar Inep/MEC
Brasil 75,2 78,0 79,7 80,8 81,6 85,6Norte 62,9 68,0 69,6 71,3 71,8 76,0
Nordeste 63,8 69,5 71,0 71,9 73,1 79,2
Sudeste 88,5 88,7 90,2 90,4 90,5 91,6
Sul 83,6 86,8 87,7 88,5 87,8 91,0
Centro-Oeste 75,0 78,2 80,3 82,1 83,8 89,0
Região 1997 1999 2001 2003 2005 2007
Taxa de Aprovação (%) 1997/2007 - Anos Finais doEnsino Fundamental (5a – 8a série)
Região 1997 1999 2001 2003 2005 2007
Brasil 77,4 78,6 78,9 78,0 77,0 79,6
Norte 68,0 74,1 76,1 77,0 75,3 76,9
Nordeste 70,4 72,8 71,5 70,0 69,3 72,6
Sudeste 83,7 84,4 86,2 84,8 83,5 84,7
Sul 78,4 79,0 80,7 81,6 78,8 82,2
Centro-Oeste 69,7 71,7 72,7 73,2 75,2 80,4
Fonte: INEP/MECFonte: Censo Escolar Inep/MEC

20kera International Conference 2008
Taxa de Aprovação (%) 1997/2007 - Ensino Médio
Fonte: INEP/MECFonte: Censo Escolar Inep/MEC
Região 1997 1999 2001 2003 2005 2007
Brasil 76,7 76,4 77,0 75,2 73,2 74,0
Norte 66,7 73,1 73,1 72,7 70,5 69,5
Nordeste 72,3 75,7 76,0 72,7 70,9 71,6
Sudeste 81,0 77,8 79,5 78,1 76,1 76,3
Sul 75,7 75,6 73,7 73,8 72,3 75,9
Centro-Oeste 71,4 73,2 73,3 71,2 71,5 73,0
Brasil: Taxa de Aprovação por etapa de ensino (%) (1997/2007)
Fonte: Censo Escolar – Inep/MEC
Brasil: Taxa de Abandono (%) por etapa de ensino (1997/ 2007)
Fonte: Censo Escolar – Inep/MEC

21kera International Conference 2008
Taxa de analfabetismo segundo categorias selecionadasBrasil (1992-2007)
15 anos ou mais
BrasilNorte
Nordeste Sudeste
Sudeste
Sul
Centro-Oeste
LocalizaçãoUrbano
Metropolitana
Raça ou CorBranca
Negra
Faixa Etária15 a 17 anos
18 a 24 anos
25 a 29 anos
30 a 39 anos
40 anos+
17,2
14,2
32,7
10,9
10,2
14,5
8,1
35,9
10,6
25,7
8,2
8,6
10,0
12,0
29,2
16,4
14,8
31,8
9,9
9,8
14,0
7,4
34,5
10,1
24,8
8,2
8,2
9,3
11,6
27,8
15,6
13,3
30,5
9,3
9,1
13,3
7,0
32,7
9,5
23,5
6,6
7,2
9,3
11,0
26,1
14,7
12,4
28,7
8,7
8,9
11,6
6,5
31,2
9,4
21,8
5,9
6,5
8,1
10,2
24,9
14,7
13,5
29,4
8,6
8,3
12,4
6,5
32,0
8,9
22,2
5,4
6,8
8,6
10,3
24,8
13,8
12,6
27,5
8,1
8,1
11,1
5,9
30,2
8,4
20,8
4,6
5,4
7,7
10,1
23,3
13,3
12,3
26,6
7,8
7,8
10,8
5,8
29,0
8,3
19,8
3,7
4,9
7,2
9,6
22,8
12,4
11,2
24,3
7,5
7,1
10,2
5,6
28,7
7,7
18,2
3,0
4,2
6,8
9,0
21,2
11,8
10,4
23,4
7,2
6,7
9,6
5,4
27,7
7,5
17,2
2,6
3,7
6,3
8,4
20,4
11,6
10,6
23,2
6,8
6,4
9,5
5,2
27,2
7,1
16,8
2,3
3,4
5,8
8,3
19,9
11,4
12,7
22,4
6,6
6,3
9,2
5,2
25,8
7,2
16,2
2,1
3,2
5,8
7,9
19,6
11,1
11,6
21,9
6,6
5,9
8,9
5,0
25,0
7,0
15,4
1,9
2,9
5,7
7,7
19,0
10,4
11,3
20,8
6,0
5,7
8,3
4,4
24,1
6,5
14,6
1,6
2,4
4,7
7,2
17,9
10,0
10,9
20,0
5,8
5,4
8,1
4,4
23,3
6,1
14,1
1,7
2,4
4,4
6,6
17,2
Categorias 1992 1993 1995 1996 1997 1998 1999 2001 2002 2003 2004 2005 2006 2007
Fonte: Microdados do Pnad (IBGE).Elaboração: Disoc/Ipea.Obs: 1 - A Pnad não foi realizada em 1994 e 2000
2 - Raça negra é composta de pretos e pardos3 - A partir de 2004 a Pnad passa a contemplar a população rural de Rondônia, Acre, Amazonas,Roraima, Pará e Amapá.
Analfabetismo
BRASIL
22kera International Conference 2008
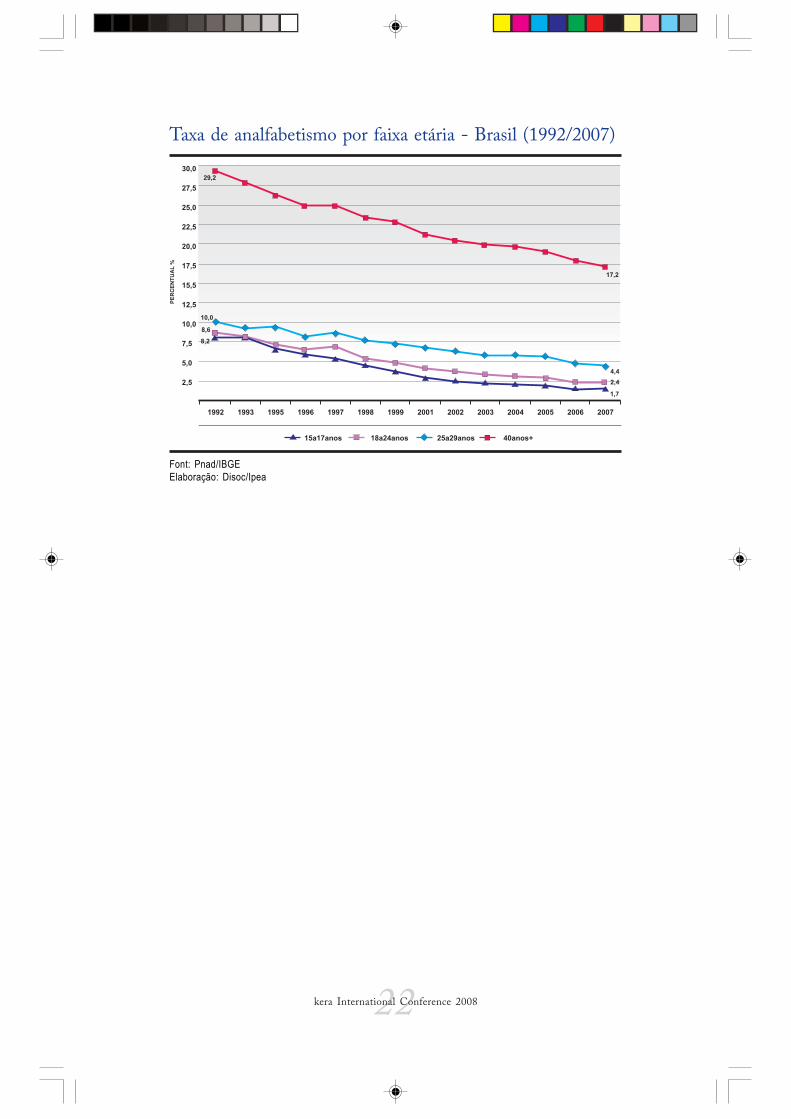
Taxa de analfabetismo por faixa etária - Brasil (1992/2007)
Font: Pnad/IBGEElaboração: Disoc/Ipea
23kera International Conference 2008
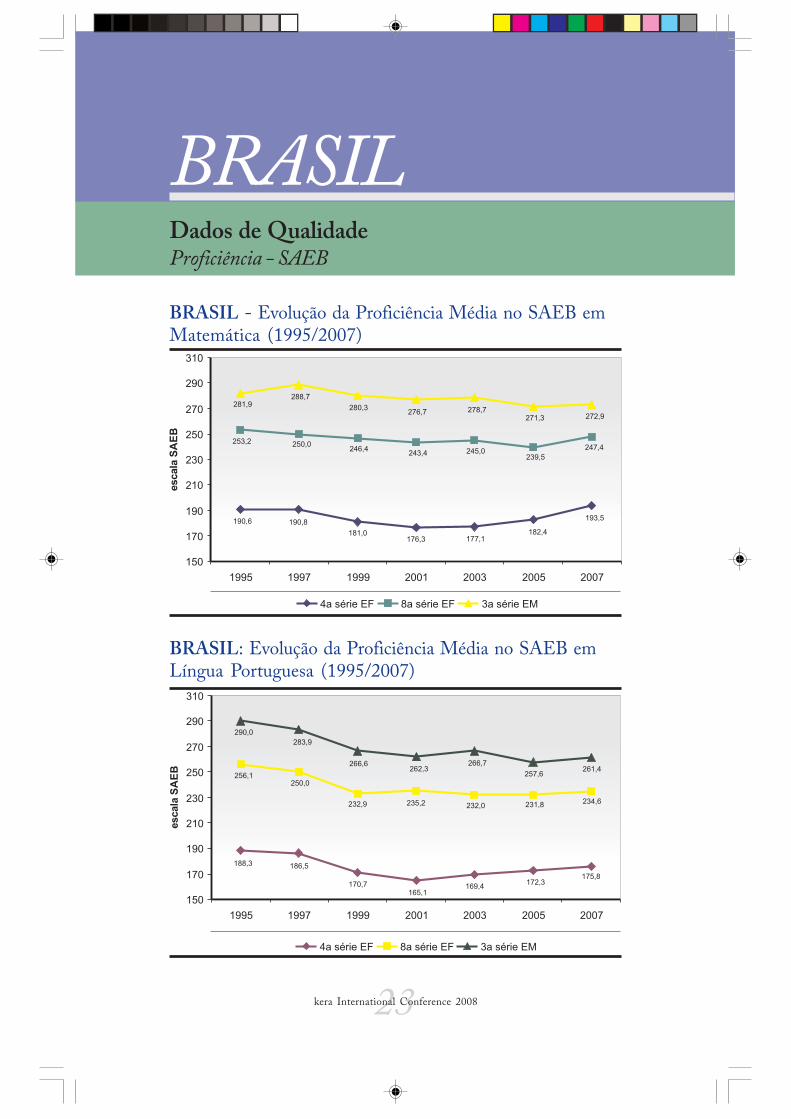
Dados de QualidadeProficiência - SAEB
BRASIL
BRASIL: Evolução da Proficiência Média no SAEB emLíngua Portuguesa (1995/2007)
BRASIL - Evolução da Proficiência Média no SAEB emMatemática (1995/2007)
24kera International Conference 2008
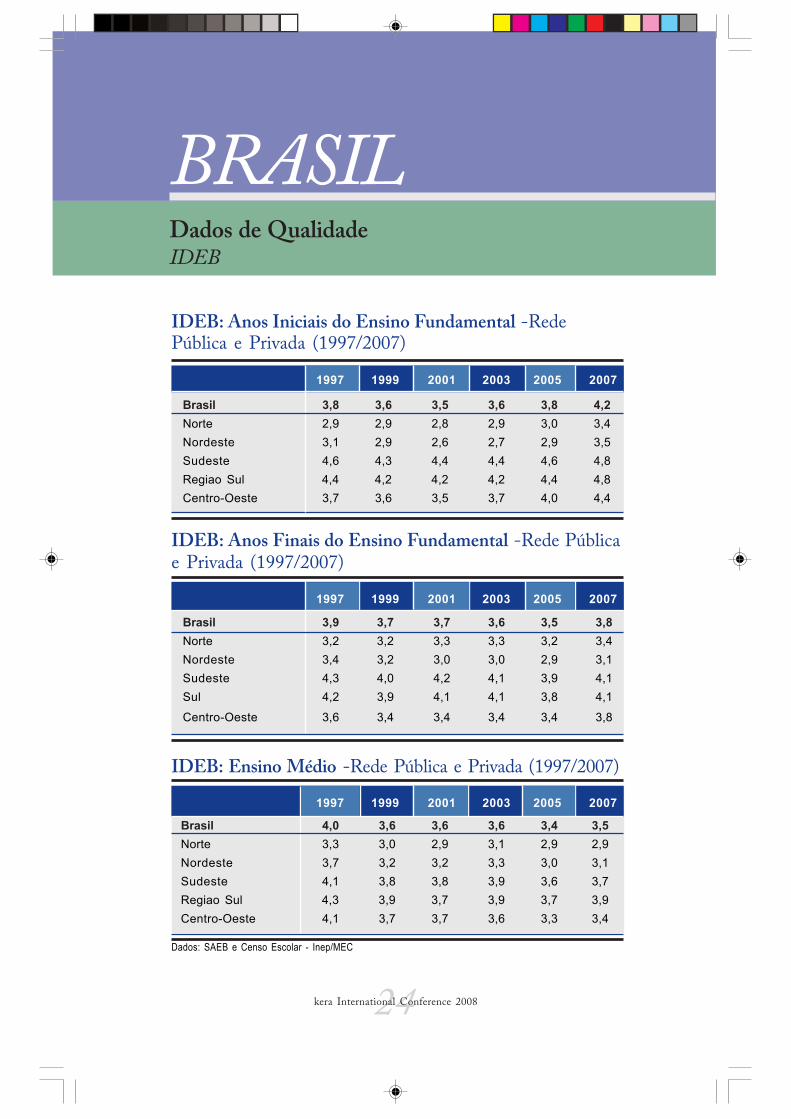
Dados de QualidadeIDEB
BRASIL
IDEB: Anos Iniciais do Ensino Fundamental -RedePública e Privada (1997/2007)
Brasil 3,8 3,6 3,5 3,6 3,8 4,2Norte 2,9 2,9 2,8 2,9 3,0 3,4
Nordeste 3,1 2,9 2,6 2,7 2,9 3,5
Sudeste 4,6 4,3 4,4 4,4 4,6 4,8
Regiao Sul 4,4 4,2 4,2 4,2 4,4 4,8
Centro-Oeste 3,7 3,6 3,5 3,7 4,0 4,4
1997 1999 2001 2003 2005 2007
IDEB: Anos Finais do Ensino Fundamental -Rede Públicae Privada (1997/2007)
Brasil 3,9 3,7 3,7 3,6 3,5 3,8Norte 3,2 3,2 3,3 3,3 3,2 3,4
Nordeste 3,4 3,2 3,0 3,0 2,9 3,1
Sudeste 4,3 4,0 4,2 4,1 3,9 4,1
Sul 4,2 3,9 4,1 4,1 3,8 4,1
Centro-Oeste 3,6 3,4 3,4 3,4 3,4 3,8
1997 1999 2001 2003 2005 2007
IDEB: Ensino Médio -Rede Pública e Privada (1997/2007)
Dados: SAEB e Censo Escolar - Inep/MEC
Brasil 4,0 3,6 3,6 3,6 3,4 3,5Norte 3,3 3,0 2,9 3,1 2,9 2,9
Nordeste 3,7 3,2 3,2 3,3 3,0 3,1
Sudeste 4,1 3,8 3,8 3,9 3,6 3,7
Regiao Sul 4,3 3,9 3,7 3,9 3,7 3,9
Centro-Oeste 4,1 3,7 3,7 3,6 3,3 3,4
1997 1999 2001 2003 2005 2007
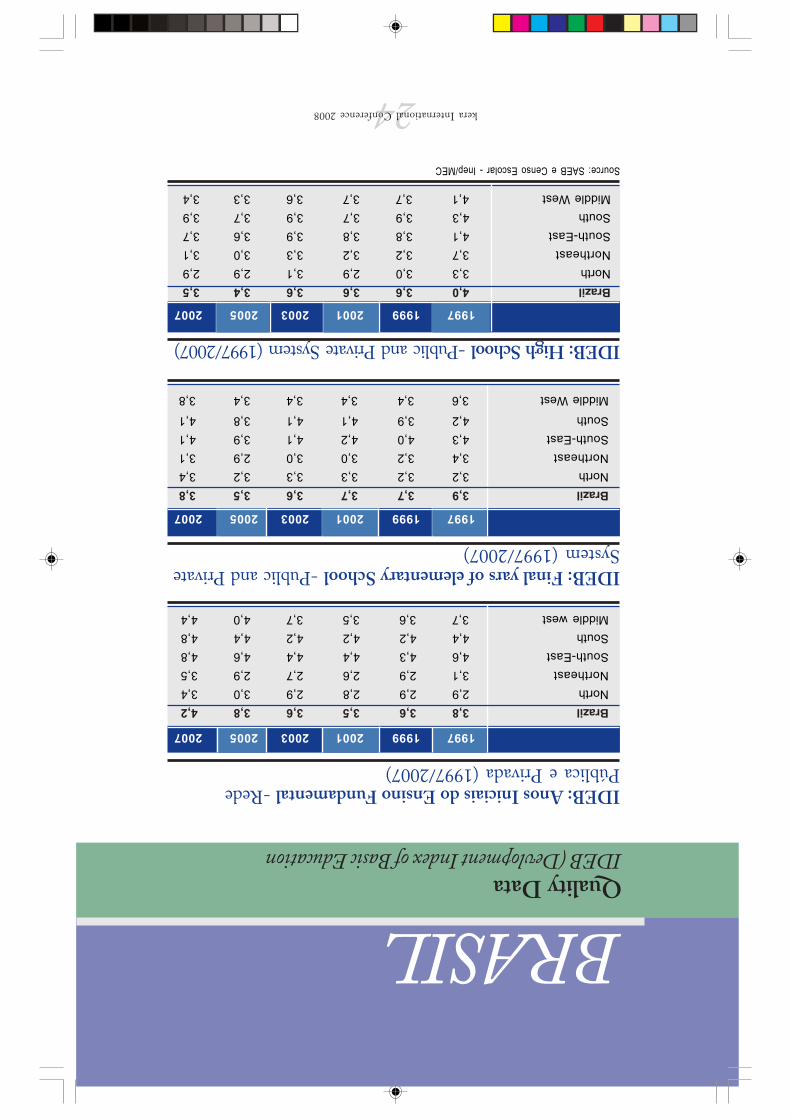
Quality DataIDEB (Devlopment Index of Basic Education
BRASIL
IDEB: Anos Iniciais do Ensino Fundamental -RedePública e Privada (1997/2007)
Brazil3,83,63,53,63,84,2North2,92,92,82,93,03,4
Northeast3,12,92,62,72,93,5
South-East4,64,34,44,44,64,8
South4,44,24,24,24,44,8
Middle west3,73,63,53,74,04,4
199719992001200320052007
IDEB: Final yars of elementary School -Public and PrivateSystem (1997/2007)
Brazil3,93,73,73,63,53,8North3,23,23,33,33,23,4
Northeast3,43,23,03,02,93,1
South-East4,34,04,24,13,94,1
South4,23,94,14,13,84,1
Middle West3,63,43,43,43,43,8
199719992001200320052007
IDEB: High School -Public and Private System (1997/2007)
Source: SAEB e Censo Escolar - Inep/MEC
Brazil4,03,63,63,63,43,5North3,33,02,93,12,92,9
Northeast3,73,23,23,33,03,1
South-East4,13,83,83,93,63,7
South4,33,93,73,93,73,9
Middle West4,13,73,73,63,33,4
199719992001200320052007
24kera International Conference 2008

BRAZIL: Average Proficiency Evolution on SAEB inPortuguese (1995/2007)
BRAZIL - Average Proficiency Evolution on SAEB inmathematics (1995/2007)
Quality DataProficiêncy - SAEB (Evalution System of Basic Education)
BRASIL
23kera International Conference 2008

Analphabetism tax by age group - Brasil (1992/2007)
Source: Pnad/IBGEElaboration: Disoc/Ipea
22kera International Conference 2008
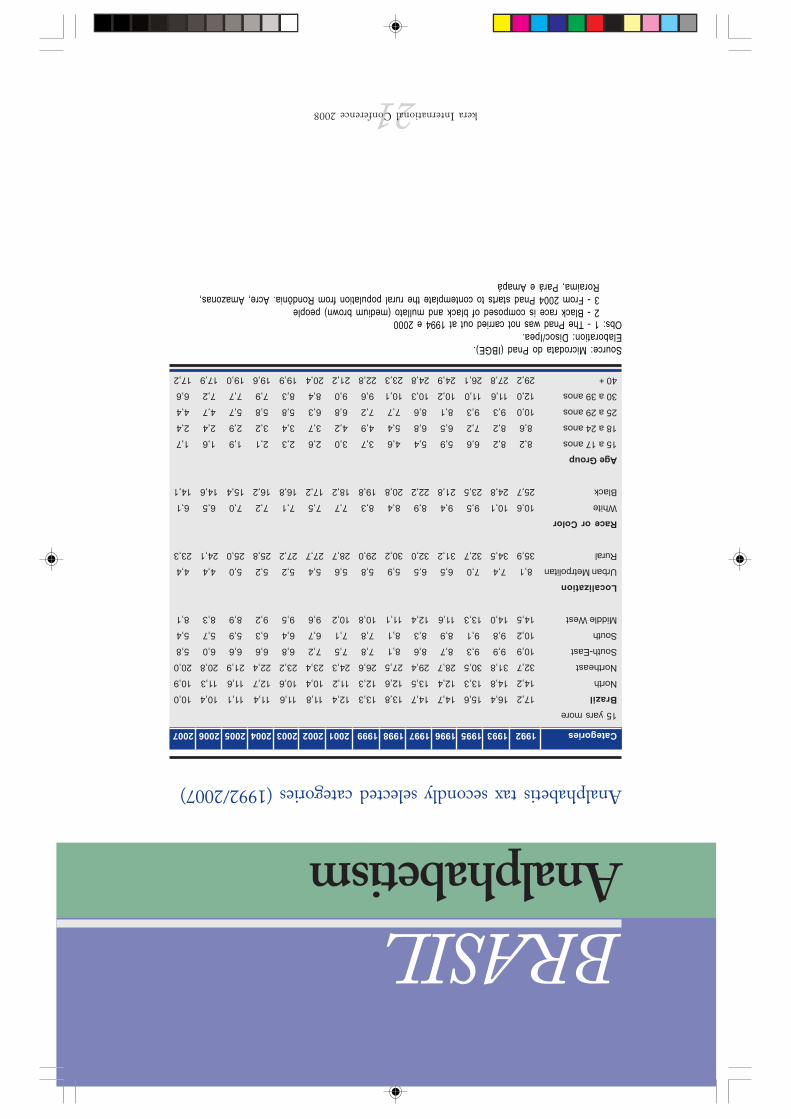
Analphabetism
BRASIL
Analphabetis tax secondly selected categories (1992/2007)
15 yars more
BrazilNorth
Northeast
South-East
South
Middle West
LocalizationUrban Metrpolitan
Rural
Race or ColorWhite
Black
Age Group15 a 17 anos
18 a 24 anos
25 a 29 anos
30 a 39 anos
40 +
17,2
14,2
32,7
10,9
10,2
14,5
8,1
35,9
10,6
25,7
8,2
8,6
10,0
12,0
29,2
16,4
14,8
31,8
9,9
9,8
14,0
7,4
34,5
10,1
24,8
8,2
8,2
9,3
11,6
27,8
15,6
13,3
30,5
9,3
9,1
13,3
7,0
32,7
9,5
23,5
6,6
7,2
9,3
11,0
26,1
14,7
12,4
28,7
8,7
8,9
11,6
6,5
31,2
9,4
21,8
5,9
6,5
8,1
10,2
24,9
14,7
13,5
29,4
8,6
8,3
12,4
6,5
32,0
8,9
22,2
5,4
6,8
8,6
10,3
24,8
13,8
12,6
27,5
8,1
8,1
11,1
5,9
30,2
8,4
20,8
4,6
5,4
7,7
10,1
23,3
13,3
12,3
26,6
7,8
7,8
10,8
5,8
29,0
8,3
19,8
3,7
4,9
7,2
9,6
22,8
12,4
11,2
24,3
7,5
7,1
10,2
5,6
28,7
7,7
18,2
3,0
4,2
6,8
9,0
21,2
11,8
10,4
23,4
7,2
6,7
9,6
5,4
27,7
7,5
17,2
2,6
3,7
6,3
8,4
20,4
11,6
10,6
23,2
6,8
6,4
9,5
5,2
27,2
7,1
16,8
2,3
3,4
5,8
8,3
19,9
11,4
12,7
22,4
6,6
6,3
9,2
5,2
25,8
7,2
16,2
2,1
3,2
5,8
7,9
19,6
11,1
11,6
21,9
6,6
5,9
8,9
5,0
25,0
7,0
15,4
1,9
2,9
5,7
7,7
19,0
10,4
11,3
20,8
6,0
5,7
8,3
4,4
24,1
6,5
14,6
1,6
2,4
4,7
7,2
17,9
10,0
10,9
20,0
5,8
5,4
8,1
4,4
23,3
6,1
14,1
1,7
2,4
4,4
6,6
17,2
Categories 1992 1993 1995 1996 1997 1998 1999 2001 2002 2003 2004 2005 2006 2007
Source: Microdata do Pnad (IBGE).Elaboration: Disoc/Ipea.Obs: 1 - The Pnad was not carried out at 1994 e 2000
2 - Black race is composed of black and mullato (medium brown) people3 - From 2004 Pnad starts to contemplate the rural population from Rondônia. Acre, Amazonas,Roraima, Pará e Amapá
21kera International Conference 2008
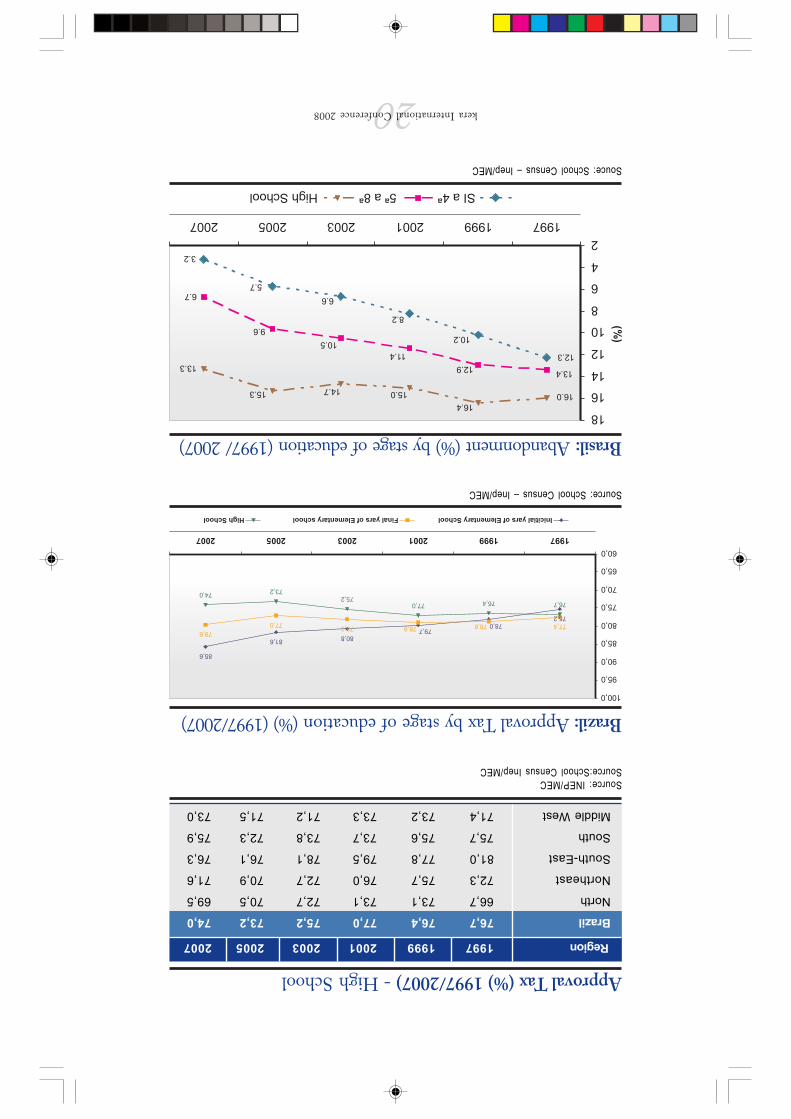
Approval Tax (%) 1997/2007) - High School
Source: INEP/MECSource:School Census Inep/MEC
Region199719992001200320052007
Brazil76,776,477,075,273,274,0
North66,773,173,172,770,569,5
Northeast72,375,776,072,770,971,6
South-East81,077,879,578,176,176,3
South75,775,673,773,872,375,9
Middle West71,473,273,371,271,573,0
Brazil: Approval Tax by stage of education (%) (1997/2007)
Source: School Census – Inep/MEC
Brasil: Abandonment (%) by stage of education (1997/ 2007)
Souce: School Census – Inep/MEC
20kera International Conference 2008
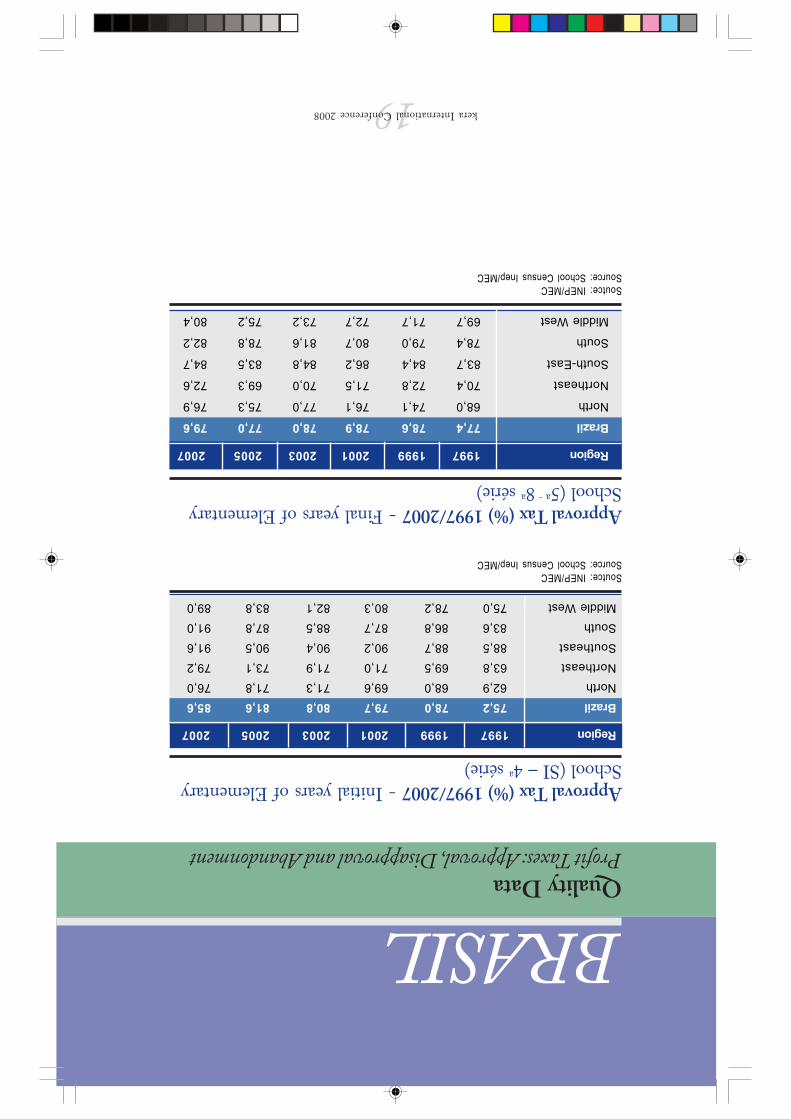
Quality DataProfit Taxes: Approval, Disapproval and Abandonment
BRASIL
Approval Tax (%) 1997/2007 - Initial years of ElementarySchool (SI – 4
a série)
Soutce: INEP/MECSource: School Census Inep/MEC
Brazil75,278,079,780,881,685,6North62,968,069,671,371,876,0
Northeast63,869,571,071,973,179,2
Southeast88,588,790,290,490,591,6
South83,686,887,788,587,891,0
Middle West75,078,280,382,183,889,0
Region199719992001200320052007
Approval Tax (%) 1997/2007 - Final years of ElementarySchool (5
a - 8
a série)
Region199719992001200320052007
Brazil77,478,678,978,077,079,6
North68,074,176,177,075,376,9
Northeast70,472,871,570,069,372,6
South-East83,784,486,284,883,584,7
South78,479,080,781,678,882,2
Middle West69,771,772,773,275,280,4
Soutce: INEP/MECSource: School Census Inep/MEC
19kera International Conference 2008
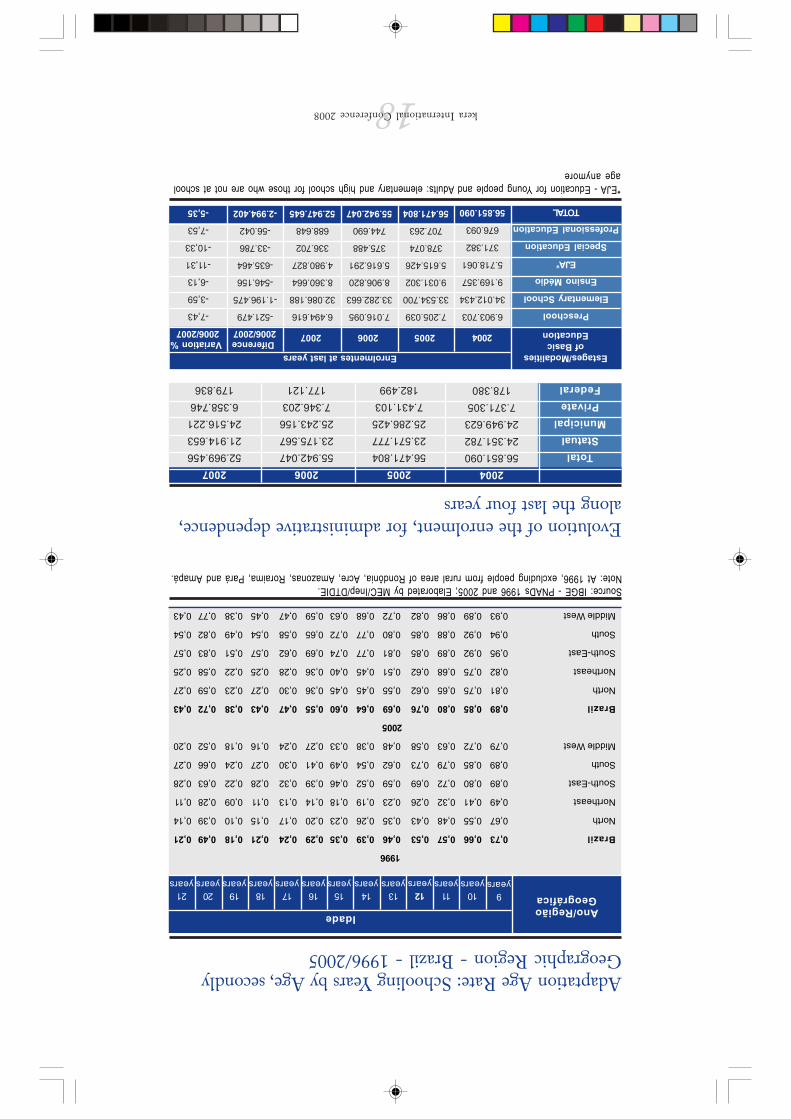
Adaptation Age Rate: Schooling Years by Age, secondlyGeographic Region - Brazil - 1996/2005
1996
Brazil0,730,660,570,530,460,390,350,290,240,210,180,490,21
North0,670,550,480,430,350,260,230,200,170,150,100,390,14
Northeast0,490,410,320,260,230,190,180,140,130,110,090,280,11
South-East0,890,800,720,690,590,520,460,390,320,280,220,630,28
South0,890,850,790,730,620,540,490,410,300,270,240,660,27
Middle West0,790,720,630,580,480,380,330,270,240,160,180,520,20
2005
Brazil0,890,850,800,760,690,640,600,550,470,430,380,720,43
North0,810,750,650,620,550,450,450,360,300,270,230,590,27
Northeast0,820,750,680,620,510,450,400,360,280,250,220,580,25
South-East0,950,920,890,850,810,770,740,690,620,570,510,830,57
South0,940,920,880,850,800,770,720,650,580,540,490,820,54
Middle West0,930,890,860,820,720,680,630,590,470,450,380,770,43
Ano/RegiãoGeográfica
Idade
9years
10years
11years
12years
13years
14years
15years
16years
17years
18years
19years
20years
21years
Source: IBGE - PNADs 1996 and 2005; Elaborated by MEC/Inep/DTDIE.Note: At 1996, excluding people from rural area of Rondônia, Acre, Amazonas, Roraima, Pará and Amapá.
Evolution of the enrolment, for administrative dependence,along the last four years
200456.851.090
24.351.782
24.949.623
7.371.305
178.380
200556.471.804
23.571.777
25.286.425
7.431.103
182.499
200655.942.047
23.175.567
25.243.156
7.346.203
177.121
200752.969.456
21.914.653
24.516.221
6.358.746
179.836
TotalStatual
MunicipalPrivateFederal
7.016.095
33.282.663
8.906.820
5.616.291
375.488
744.690
55.942.047
6.903.703
34.012.434
9.169.357
5.718.061
371.382
676.093
56.851.090
Estages/Modalitiesof Basic
Education
Enrolmentes at last years
Preschool
Elementary School
Ensino Médio
EJA*
Special Education
Professional Education
TOTAL
7.205.039
33.534.700
9.031.302
5.615.426
378.074
707.263
56.471.804
6.494.616
32.086.188
8.360.664
4.980.827
336.702
688.648
52.947.645
-521.479
-1.196.475
-546.156
-635.464
-33.786
-56.042
-2.994.402
-7,43
-3,59
-6,13
-11,31
-10,33
-7,53
-5,35
2004 2005 2006 2007 Diference2006/2007
Variation %2006/2007
*EJA - Education for Young people and Adults: elementary and high school for those who are not at schoolage anymore
18kera International Conference 2008
The product elaborated by these professionals from the school network resulted
in guiding material so that each discipline could work on the new curricular proposal in
the day-to-day of the classroom.
We can consider this material a guide with suggestions so that the conducting
professor, from all schools, can teach their discipline with different resources available at
the school. The material produced represents a consolidation of the curriculum changes
proposed and matured during a period of two years (2004-2005), and based on a
theoretical-practical relationship perspective.
It is worth noting that the curriculum reorientation was a proposal that should
have a different outline according to the context of each school. As such, suggestions
were presented in the chapters to be remodeled according to the values and practices of
each faculty.The objective of this work was to propitiate the implementation of a curriculum
that, in tune with new social demands, seeks to confront the complexity that characterizes
this new century.
With this perspective, it is necessary to involve the school ever more in the important
work of constructing pedagogical practices directed towards the formation of citizen
students with a compromise for democratic order.
Add to this initiative the efforts to recompose pedagogical teams for schools with
the designation of Coordinators and Pedagogical supervisors and a program for their
continual training, also developed in partnership with the Federal University of Rio de
Janeiro.
These may contribute to advances in educational policies in our state: the
strengthening of the element responsible for faculty articulation, the realization of studies
and the promotion of collective strategies for a better scholastic performance by students,
besides seeking to strengthen the aspects of the scholastic evaluation system that help to
prepare students academically.
Claudio Mendonça
President of the Public Service School Foundation of the state of Rio de Janeiro
(FESP-RJ)
17kera International Conference 2008

In this way the authorities of the Ministry of Education in Finland are unanimous
in pointing to the principal axis of a successful scholastic reform: political consensus that
allows the necessary time for the changes to have effect, investment in education, where
the teacher is the mediator between himself and knowledge (just as a coach is for sports)
and not a “source of knowledge”.
The Columbian rural education system reached good performance indicators
and the recognition of UNESCO. In the same way, its fundamental principals are: place
the student, rather than knowledge, at the center of the scholastic process; teach per
activity and attend and evaluate in an individual fashion or in small groups. The
Columbian program for rural schools, which includes the New School Program (Progra-
ma Escuela Nueva), is being implemented in countries such as Brazil, Chile, Mexico,
Peru, Ethiopia, Uganda and Kenya. Rural schools in the majority of developing countries
do not receive resources, infrastructure is precarious and this ends up reflecting on the
performance of the students. Within this context, Columbia established a very innovative
scholastic strategy. It began with a positive discrimination of these schools, offering
differentiated textbooks and attempting to qualify teachers in a new scholastic
methodology.
The most astonishing fact is that the public education policy has maintained for
over 30 years to the point where it has brought results in an area where changes take
years to show results. In Columbia, as in the rest of South America, government programs
fluctuate towards the wishes of the political parties and to the mosaic of power that each
election establishes. So why then has this project become an exception? According to
the educator Vicky Colbert, several factors has brought us to this situation: the positive
evaluations of international organizations such as the World Bank which financed part
of the programs, the cooperative work with teachers from the local communities which
helped to solidify the methodology despite the lack of support from the government, and,
most importantly, the alliance with the productive sector, even the agricultural sector,
which understood that a better education could bring greater productivity.
When I received the telephone call of professor Ângela Rocha with the invitation
to write a preface for this work, I felt a mixture of concern and joy. Concerned that I did
not possess the academic profile to offer the reader an introduction worthy of the chapters
of this book and, at the same time, a great joy as a result of the admiration that I hold for
the authors of this book.
This admiration is not only due to the articles and books written by these authors
but also for their work that I had the opportunity to develop together with them when I
was, for the second time, the Secretary of Education of the State of Rio de Janeiro.
The Rio de Janeiro State Secretary for Education, conducted, throughout 2005, in
partnership with the Federal University of Rio de Janeiro (UFRJ), courses for university
professors from varying disciplines where the proposed concepts and guidelines for the
Curriculum changes were aligned. Based on theoretical inputs, the teachers produced
the material for pedagogical practices for classroom use that integrated this fascicle.
16kera International Conference 2008
15kera International Conference 2008
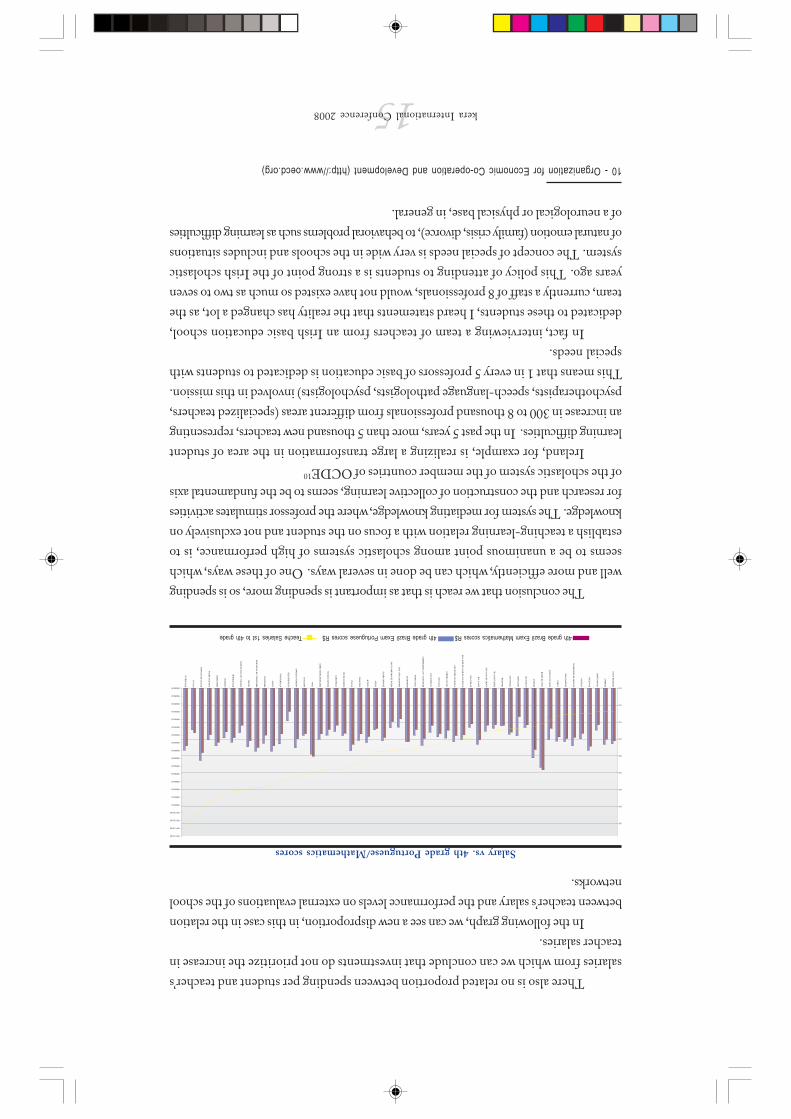
There also is no related proportion between spending per student and teacher’s
salaries from which we can conclude that investments do not prioritize the increase in
teacher salaries.
In the following graph, we can see a new disproportion, in this case in the relation
between teacher’s salary and the performance levels on external evaluations of the school
networks.
10 - Organization for Economic Co-operation and Development (http://www.oecd.org)
The conclusion that we reach is that as important is spending more, so is spending
well and more efficiently, which can be done in several ways. One of these ways, which
seems to be a unanimous point among scholastic systems of high performance, is to
establish a teaching-learning relation with a focus on the student and not exclusively on
knowledge. The system for mediating knowledge, where the professor stimulates activities
for research and the construction of collective learning, seems to be the fundamental axis
of the scholastic system of the member countries of OCDE10
Ireland, for example, is realizing a large transformation in the area of student
learning difficulties. In the past 5 years, more than 5 thousand new teachers, representing
an increase in 300 to 8 thousand professionals from different areas (specialized teachers,
psychotherapists, speech-language pathologists, psychologists) involved in this mission.
This means that 1 in every 5 professors of basic education is dedicated to students with
special needs.
In fact, interviewing a team of teachers from an Irish basic education school,
dedicated to these students, I heard statements that the reality has changed a lot, as the
team, currently a staff of 8 professionals, would not have existed so much as two to seven
years ago. This policy of attending to students is a strong point of the Irish scholastic
system. The concept of special needs is very wide in the schools and includes situations
of natural emotion (family crisis, divorce), to behavioral problems such as learning difficulties
of a neurological or physical base, in general.
Salary vs. 4th grade Portuguese/Mathematics scores
4th grade Brazil Exam Mathematics scores R$ 4th grade Brazil Exam Portuguese scores R$ Teache Salaries 1st to 4th grade
14kera International Conference 2008
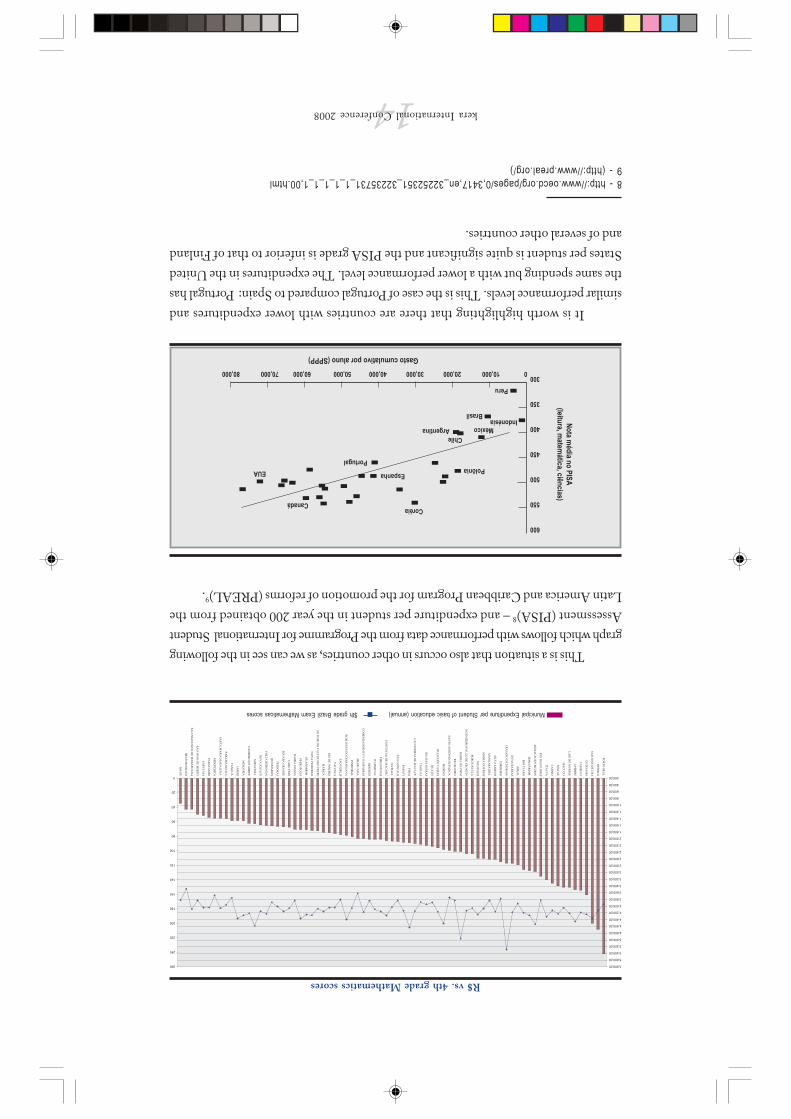
It is worth highlighting that there are countries with lower expenditures and
similar performance levels. This is the case of Portugal compared to Spain: Portugal has
the same spending but with a lower performance level. The expenditures in the United
States per student is quite significant and the PISA grade is inferior to that of Finland
and of several other countries.
8 - http://www.oecd.org/pages/0,3417,en_32252351_32235731_1_1_1_1_1,00.html9 - (http://www.preal.org/)
This is a situation that also occurs in other countries, as we can see in the following
graph which follows with performance data from the Programme for International Student
Assessment (PISA)8 – and expenditure per student in the year 200 obtained from the
Latin America and Caribbean Program for the promotion of reforms (PREAL)9.
010,00020,00030,00040,00050,00060,00070,00080,000
600
550
500
450
400
350
300
Gastocumulativoporaluno(SPPP)
No
tam
édia
no
PIS
A(leitu
ra,matem
ática,ciências)
CoréiaCanadá
EUA Espanha
Portugal
Polônia
Chile
MéxicoArgentina
IndonésiaBrasil
Peru
R$ vs. 4th grade Mathematics scores
Municipal Expenditure per Student of basic education (annual) $th grade Brazil Exam Mathematicas scores
13kera International Conference 2008
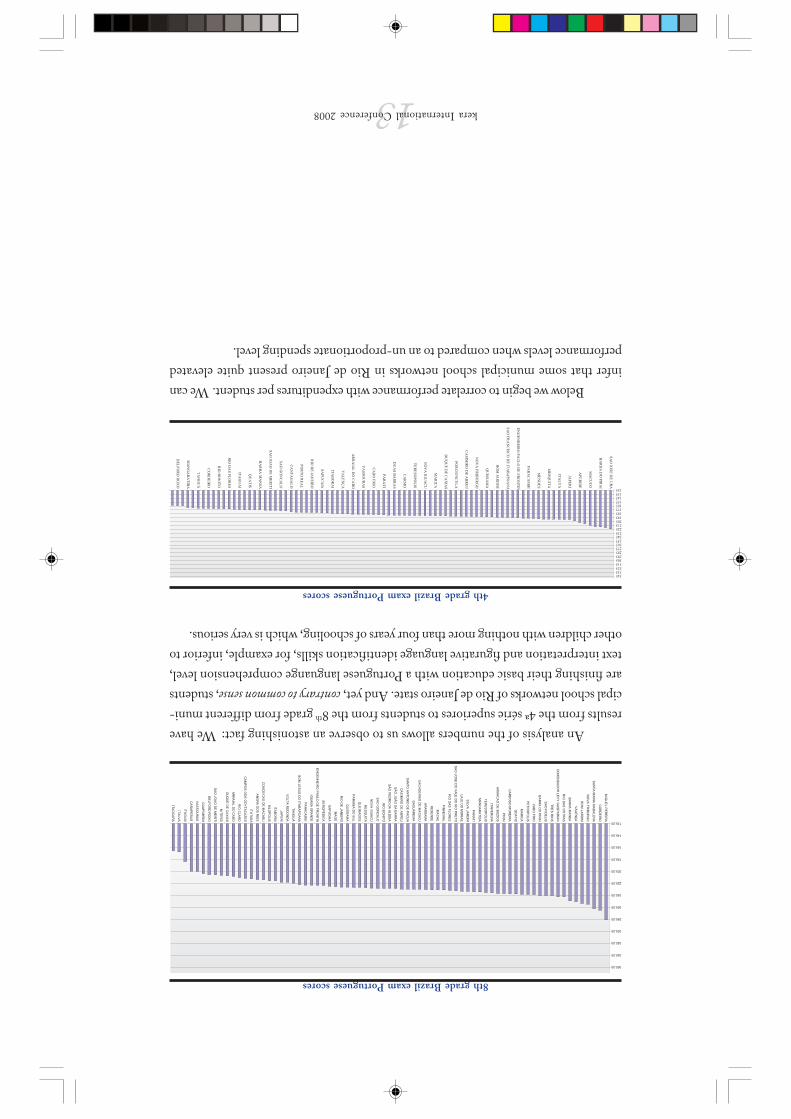
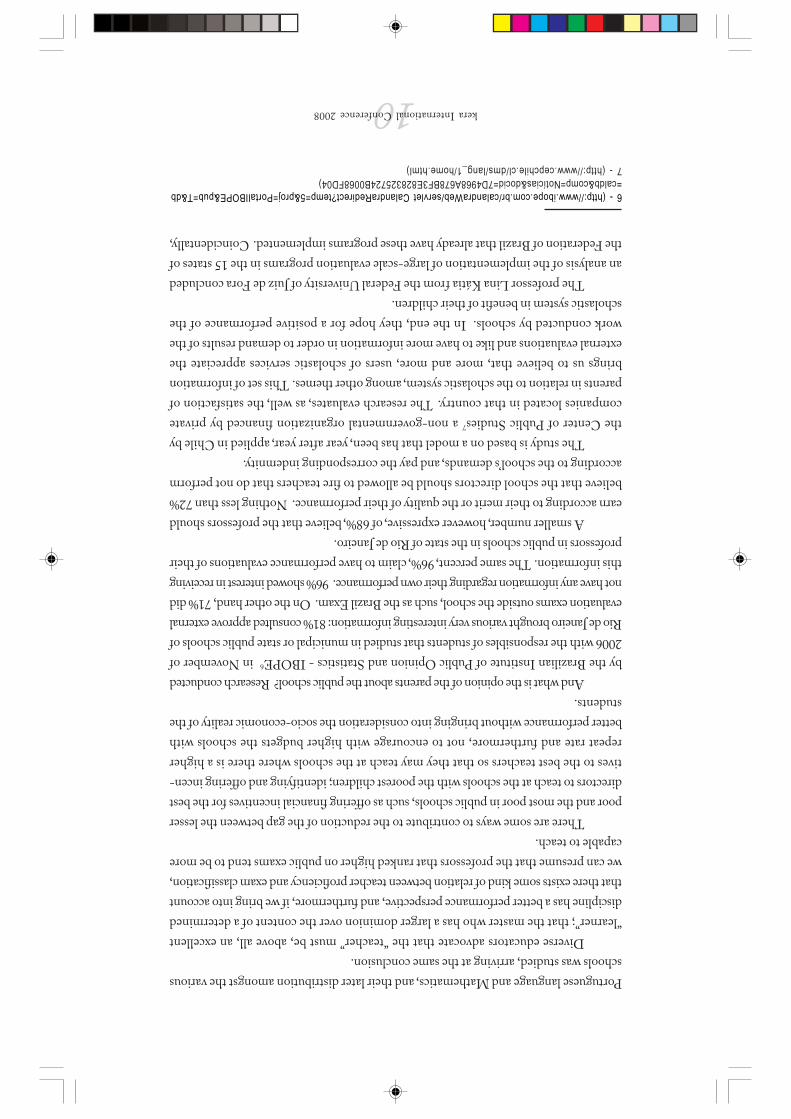
An analysis of the numbers allows us to observe an astonishing fact: We have
results from the 4ª série superiores to students from the 8th grade from different muni-
cipal school networks of Rio de Janeiro state. And yet, contrary to common sense, students
are finishing their basic education with a Portuguese languange comprehension level,
text interpretation and figurative language identification skills, for example, inferior to
other children with nothing more than four years of schooling, which is very serious.
Below we begin to correlate performance with expenditures per student. We can
infer that some municipal school networks in Rio de Janeiro present quite elevated
performance levels when compared to an un-proportionate spending level.
8th grade Brazil exam Portuguese scores
4th grade Brazil exam Portuguese scores

12kera International Conference 2008
The first point of this diagnostic shows that there exists an expressive difference
between the expenses of municipal school networks in basic education, per student, per
year, as per data from the Secretary of National Treasury. We can observe that expenses
go from R$900,00 up to R$5,300.00. The national average is R$1,975.00.
The following graphs illustrate the performance of Portuguese and Math students
in the 4th and 8
th grades on the “Prova Brasil” (Brazil Exam) of the Ministry of Education
(MEC) – National Institute of Studies and Research (INEP) in 2005.
8th grade Brazil exam Mathematics scores
4th grade Brazil exam Mathematics scores
Municipal expenditures per student of basic education (Anual) R$

these are the states with better performance indicators for the sector. Studies show the
evident correlation between the existence of external evaluation systems and the
performance of the school networks, including a deterioration of results when the programs
were interrupted.
John Patten, Minister of Education during the era of the implementation of the
evaluation system in England, already in 1992, declared that there was an improvement
in the performance of students starting from the second year due to the fact that the
teachers taught more intensely than was demanded by the tests and standardized tasks:
punctuation, spelling, writing and mental arithmetic. More attention was given to the
basics and this appeared in the higher level of performance of the children.
From another perspective, it’s not strange that syndicates are against an evaluation
of the system and sometimes are able to get the support of some students. It was like this
during the implementation of the test in university courses, with their famous boycotts in
Chile, Rio de Janeiro, England and in other diverse locations.
Politicians, on the other hand, without a more in-depth analysis of the topic, run
the risk of yielding to the pressures of corporations that prefer, naturally, leanear increases
in salary and promotions for education levels and years with the company. Chile, once
again, offers us a good example. The government, for 11 years, had to negotiate with a
syndicate in order to establish the first links between performance and career in their
career planning. The Pontifical Catholic University (PUC) in Santiago is filming classes
and evaluation the professors with a team of 400 specialists. The city of Boston in the
United States has reached the extreme of closing school units that show low performance
results.
To not evaluate a system is to disregard very valuable information for the elaboration
of scholastic programs. It means a waste of public resources as these programs end up
treating schools, professors and students equally when the yare greatly different. Without
knowing the current deficiencies of each school and even of each class, it seems to us
extremely difficult to define the class content and professor preparation material or the
school’s extra tutoring classes, just to give two examples.
It is the evaluation of the system – which has, in all of Brazil, clear examples of
disparity, as we will see below – that could improve its efficiency. In 2007, we coordinated
a research, also realized by the Social and Political School Foundation (FESP), which
crossed data regarding education expenses per student, teacher salaries and student
performance in the municipal school networks. This study was based on a similar model
developed by Professor Naércio Menezes from the University of Sao Paulo – USP.
The objective of the research was to portray some aspects of the education situation
in the state of Rio de Janeiro, but it reflects strongly the national education situation.
11kera International Conference 2008
10kera International Conference 2008
Portuguese language and Mathematics, and their later distribution amongst the various
schools was studied, arriving at the same conclusion.
Diverse educators advocate that the “teacher” must be, above all, an excellent
“learner”; that the master who has a larger dominion over the content of a determined
discipline has a better performance perspective, and furthermore, if we bring into account
that there exists some kind of relation between teacher proficiency and exam classification,
we can presume that the professors that ranked higher on public exams tend to be more
capable to teach.
There are some ways to contribute to the reduction of the gap between the lesser
poor and the most poor in public schools, such as offering financial incentives for the best
directors to teach at the schools with the poorest children; identifying and offering incen-
tives to the best teachers so that they may teach at the schools where there is a higher
repeat rate and furthermore, not to encourage with higher budgets the schools with
better performance without bringing into consideration the socio-economic reality of the
students.
And what is the opinion of the parents about the public school? Research conducted
by the Brazilian Institute of Public Opinion and Statistics - IBOPE6 in November of
2006 with the responsibles of students that studied in municipal or state public schools of
Rio de Janeiro brought various very interesting information: 81% consulted approve external
evaluation exams outside the school, such as the Brazil Exam. On the other hand, 71% did
not have any information regarding their own performance. 96% showed interest in receiving
this information. The same percent, 96%, claim to have performance evaluations of their
professors in public schools in the state of Rio de Janeiro.
A smaller number, however expressive, of 68%, believe that the professors should
earn according to their merit or the quality of their performance. Nothing less than 72%
believe that the school directors should be allowed to fire teachers that do not perform
according to the school’s demands, and pay the corresponding indemnity.
The study is based on a model that has been, year after year, applied in Chile by
the Center of Public Studies7 a non-governmental organization financed by private
companies located in that country. The research evaluates, as well, the satisfaction of
parents in relation to the scholastic system, among other themes. This set of information
brings us to believe that, more and more, users of scholastic services appreciate the
external evaluations and like to have more information in order to demand results of the
work conducted by schools. In the end, they hope for a positive performance of the
scholastic system in benefit of their children.
The professor Lina Kátia from the Federal University of Juiz de Fora concluded
an analysis of the implementation of large-scale evaluation programs in the 15 states of
the Federation of Brazil that already have these programs implemented. Coincidentally,
6 - (http://www.ibope.com.br/calandraWeb/servlet CalandraRedirect?temp=5&proj=PortalIBOPE&pub=T&db=caldb&comp=Notícias&docid=7D4968A678BF3E828325724B0068FD04)7 - (http://www.cepchile.cl/dms/lang_1/home.html)

9kera International Conference 2008
has found, for instance, that the “parental nurturance” that middle-class parents, on
average, are more likely to provide stimulates the brain’s medial temporal lobe, which in
turn aids the development of memory skills. (…)”
This theme is portrayed in more debth in the book Unequal Childhoods: Class,
Race, and Family Life – Annete Laureau – 2004.
Following the same line of thought as the above-mentioned report, the North
American NGO “The Education Trust” (Washington D.C., USA)4 – specialized in
conducting studies to help the government reduce the scholastic differences between
low-income children and children from more favorable income classes.
Education can reduce this social and cultural gap, but it could also increase it.
This theme is very important for developing countries, but still hardly spoken of in Brazil
where the problem is especially critical.
Data from the international Evaluation exam PISA (realized in 43 countries, of
which 30 are from the European Union and other invited countries, including Brazil) of
students 15 years of age from diverse countries shows that an absurd number of our
students, 54%, have a level of performance considered the lowest, compared to 19.8% on
average for the OEDE (Organization for Economic Cooperation). Chile has 38%, Korea
9%, Ireland 17% and Finland 7%.
The North American NGO divulged a report which showed that in the States
where children were less favored, the schools had less experienced teachers and teachers
with a lower academic base.
In the state of Illinois, a teacher quality indicator was created which brings into
account the average SAT score, the level of the university where the teacher studied and
the percentage of professors that fail on the faculty certificate test.
In the United States, as in Brazil, there are innumerous studies that clearly show
a relation between teacher quality and the learning results of the students. On the other
hand, the North American Organization denounced that the more poor black children
there are at a school, the more low qualified teachers are present. This study overthrows
the myth that poor children do badly at school simply because they do not have access to
family cultural assets, a thesis quite widespread in our country.
There are several scenarios that contribute to the widening of these differences,
as, for example, the privilege (just privilege, they say) of the professor to choose his/her
work location based on his/her ranking in the public competitions.
When this happens, the best teachers tend to choose the schools with the best
locations, easier access, more equipment and with students that already have a better
performance.
This year, 2008, we coordinated5 a study of the Public Service School Foundation
which analyzed the data of a public contest of the state of Rio de Janeiro realized in 2005.
The top 15% and the lowest 15% from the exam for careers as Faculty 1 Teachers of the
4 - http://www2.edtrust.org/edtrust/5 - Together with Márcia Martinez
and children whose parents were on welfare had vocabularies of about 525 words. The
children’s I.Q.’s correlated closely to their vocabularies. The average I.Q. among the
professional children was 117, and the welfare children had an average I.Q. of 79.
When Hart and Risley then addressed the question of just what caused those
variations, the answer they arrived at was startling. By comparing the vocabulary scores
with their observations of each child’s home life, they were able to conclude that the size
of each child’s vocabulary correlated most closely to one simple factor: the number of
words the parents spoke to the child. That varied greatly across the homes they visited,
and again, it varied by class. In the professional homes, parents directed an average of
487 “utterances” — anything from a one-word command to a full soliloquy — to their
children each hour. In welfare homes, the children heard 178 utterances per hour.
What’s more, the kinds of words and statements that children heard varied by
class. The most basic difference was in the number of “discouragements” a child heard —
prohibitions and words of disapproval — compared with the number of encouragements,
or words of praise and approval. By age 3, the average child of a professional heard about
500,000 encouragements and 80,000 discouragements. For the welfare children, the
situation was reversed: they heard, on average, about 75,000 encouragements and
200,000 discouragements.
Hart and Risley found that as the number of words a child heard increased, the
complexity of that language increased as well. As conversation moved beyond simple
instructions, it blossomed into discussions of the past and future, of feelings, of abstractions,
of the way one thing causes another — all of which stimulated intellectual development.
Hart and Risley showed that language exposure in early childhood correlated strongly
with I.Q. and academic success later on in a child’s life. Hearing fewer words, and a lot of
prohibitions and discouragements, had a negative effect on I.Q.; hearing lots of words,
and more affirmations and complex sentences, had a positive effect on I.Q. The
professional parents were giving their children an advantage with every word they spoke,
and the advantage just kept building up.
In the years since Hart and Risley published their findings, social scientists have
examined other elements of the parent-child relationship, and while their methods have
varied, their conclusions all point to big class differences in children’s intellectual growth.
Jeanne Brooks-Gunn, a professor at Teachers College, has overseen hundreds of
interviews of parents and collected thousands of hours of videotape of parents and
children, and she and her research team have graded each one on a variety of scales.
Their conclusion: Children from more well-off homes tend to experience parental attitudes
that are more sensitive, more encouraging, less intrusive and less detached — all of
which, they found, serves to increase I.Q. and school-readiness. They analyzed the data
to see if there was something else going on in middle-class homes that could account for
the advantage but found that while wealth does matter, child-rearing style matters more.
Martha Farah, a researcher at the University of Pennsylvania, has built on Brooks-
Gunn’s work, using the tools of neuroscience to calculate exactly which skills poorer
children lack and which parental behaviors affect the development of those skills. She
8kera International Conference 2008
7kera International Conference 2008
In other words, we have an extra six million people in the system (the majority of
which are students repeating the school year), resulting in a yearly cost for Brazil of
approximately R$12 billion. Money thrown away if you analyze the numbers from the
Brazil Test that clearly demonstrate that the performance of students with a history of
repeating subjects is inferior to those who have never had to repeat a school year. Even
if it is obvious, it is important to remember that repeating a subject, by rule, does not make
the student better.
To better illustrate these challenges that face the scholastic systems of diverse
countries, I would like to quote2 here a part of a special report that analyses the first
results of a program “No Children Left Behind” published in The New York Times
Magazine on November 26th, 2006
3.
The text talks about the different school performance levels amongst children as
a result of their stronger or weaker social vulnerability:
“(...) The issue was complicated by the fact that there are really two overlapping
test-score gaps: the one between black children and white children, and the one between
poor children and better-off children. Given that those categories tend to overlap —
black children are three times as likely to grow up in poverty as white children — many
people wondered whether focusing on race was in fact a useful approach. Why not just
concentrate on correcting the academic disadvantages of poor people? Solve those, and
the black-white gap will solve itself. “
There had, in fact, been evidence for a long time that poor children fell behind rich
and middle-class children early, and stayed behind. But researchers had been unable to
isolate the reasons for the divergence. Did rich parents have better genes? Did they
value education more? Was it that rich parents bought more books and educational toys
for their children? Was it because they were more likely to stay married than poor parents?
Or was it that rich children ate more nutritious food? Moved less often? Watched less
TV? Got more sleep? Without being able to identify the important factors and eliminate
the irrelevant ones, there was no way even to begin to find a strategy to shrink the gap.
Researchers began peering deep into American homes, studying up close the
interactions between parents and children. The first scholars to emerge with a specific
culprit in hand were Betty Hart and Todd R. Risley, child psychologists at the University
of Kansas, who in 1995 published the results of an intensive research project on language
acquisition. Ten years earlier, they recruited 42 families with newborn children in Kansas
City, and for the following three years they visited each family once a month, recording
absolutely everything that occurred between the child and the parent or parents. The
researchers then transcribed each encounter and analyzed each child’s language
development and each parent’s communication style. They found, first, that vocabulary
growth differed sharply by class and that the gap between the classes opened early. By
age 3, children whose parents were professionals had vocabularies of about 1,100 words,
2 - Free Translation3 - www.wehaitians.com/still%20left%20behind.html

6kera International Conference 2008
It seems absolutely reasonable in our country that a teacher places him/herself as
a “source of knowledge”; that all learning revolves around “what will be on” the exam and
that cognitive goals are set whereby if some students are able to reach these goals, the
others could have also reached them if it were not for disinterest, disorder or laziness.
Repeating a school subject seems necessary, in fact, for the scholastic system to be
taken seriously and the repetition of the material is a tool that offers both opportunity to
pass or punishment for failure. Competition amongst students occurs day-to-day in the
classroom and the failure of a significant number of students on a test seems to comfort
the parents (their child is not the only one with a low mark) as well as trapping the teacher
who is fighting for the ever-more standardized evaluation, in order to be able to compare
the students.
The famous “make-up test” must necessarily be more difficult than the original
test, after all, the students would have more time to study and, if it were not more difficult,
it is likely that all the students would “be sick” (!) in order to take the exam later, when it
is calmer and they will not have to suffer the relentless pressure of exam week. Group
work is rare and not taken too seriously by students and parents.
On another occasion, I heard the following account from a parent: “Last year my
son started to read a book by Sherlock Holmes that was recommended to him by the
school and he became infatuated with the genre. At the end of the year, we visited the
“Bienal book fair” and he enthusiastically chose two more books from this series. He read
one during the holidays and now he would like to read the second, but as his agenda with
extracurricular activities, homework and weekly exams is very intense, he is not able to
integrate this reading into his agenda on top of the “mandatory reading” such as Dom
Casmurro by Machado de Assisis. Why can’t he read the book he chose? I asked. The
professor said that this would be impossible as it would not allow for the professor to
evaluate whether the student actually read the book, after all the evaluation should be
standardized and if there is no fear of getting a low grade on the evaluation, “no-one
reads the book”. Days before I had watched a speech by Rubem Alves whereby he
spoke about a writing on a wall in the library of the “Escola da Ponte” (Ponte School).
(City of Porto, Portugal), with the commandments of the department, the first of which
was “no child shall be obliged to read what he/she does not desire to read…”
Until what point is this standardization necessary? Why don’t schools develop
strategies of cooperative learning, incentivizing students to not only develop attitudes in
groups but also to learn as a team, helping and encouraging one another to overcome
challenges1?
Students simply “fail” when they are not able to get good grades. The school
evaluation frequently is not used to diagnose problems and search for solutions. Rather,
it is seen as a duel where the student anxiously expects a trick (with a confusing maneuver)
on the test. For this reason, among others, of the 53 million children enrolled in school, a
mere 47 million are between 6 and 17 years of age.
1 - Cooperative Learning – Robert Slaving – 1995
5kera International Conference 2008
November 2007. I am participating in a parent-teacher meeting of a private
school that has outdoor exhibits throughout the city announcing “First place on the
Middle School National Exam (Enem)” The General Director and the Pedagogical
General Coordinator are present. One of the mothers asked how the performance was
of one of the 7th grade classes on the math test.
Upon hearing that more than 60% of the students scored below the mark
established as the minimum passing grade, she declared: “My son likes his teacher and
the subject and participates in the school’s extra tutoring lessons every day, but I swear
he and other students studied up to page 92 in the book and this material was on page
97. In fact, some questions are exact copies of the exercises in the book”.
Henceforth followed a long debate regarding whether the teacher had correctly
informed “what would be on the exam”, whether the students had properly taken note
in their books or “trusted the information to memory” and, whether questions on the
exam had been identical to those in the book – a question that deserved the most
attention from the director because it could generate, in the director’s opinion, a “favoritism”
towards the students that repeated the exercises in the lessons book.
Some of the parents demanded a new exam, which was immediately “cast out”
by the pedagogical team, in the end, “it would be unfair to the others”. I couldn’t clearly
understand the “reasons” and didn’t “atrevi” to suggest some solutions for the impasse,
but it was clear there that the evaluation appeared to bring the students and teachers to
a level of dispute, even amongst themselves, where proof would set the limits and rules
of the standoff.
Later, the Mathematics teacher, using a Bell curve diagram, meticulously explained
that it is necessary to have a certain number of average students, above-average students,
and below-average students, as well as the standard distribution pattern and the expected
failure rate as “scientifically determined”.
The curve guaranteed a constant failure rate, relating the students’ marks in
function of the general learning of the class. At this point, the Pedagogical Coordinator
affirmed: “That’s correct, after all, there is something wrong if everyone passes the year,
even after a second exam.”
Everyone nodded their head in accordance. From that point on it occurred to me
that some absolute truths of the evaluation systems surpass the frontiers of the classroom
and are molded by the, let’s say, fundamentals of our society.
N


3kera International Conference 2008
Dear Mr.CHUNG-LI YUNPresidentOrganization CommitteeKERA International Conference 2008
REF.: Presentation from Government School Foundation ofthe State of Rio de Janeiro FESP-RJ.
Dear President,
We take this time to congratulate you on your initiative and tointroduce Mr. CLAUDIO MENDONÇA, the President of theGovernment School Foundation of the State of Rio de Janeiro –FESP-RJ, to you. FESP-RJ is an institution related to the StateSecretary of Planning and Management – SEPLAG and isorganizationally part of the executive board of the Governmentof the State of Rio de Janeiro.
FESP – RJ, as being the Government School, performs its missionthrough recruitment and allocation of professionals for differentpositions in the public sector and also providing training and/orpost-graduation courses to fulfill specific needs in specializationor in demand basis.
In addition to the institutional management of FESP-RJ, Mr.CLAUDIO MENDONÇA has been fully in charge of CIDE(Government Research & Analysis Foundation of the State ofRio de Janeiro) as Governor’s nomination, since May 6
th, 2008.
Wishing you the Best on your Event,
Yours Faithfully,
SERGIO RUY BARBOSASecretary of Planning and Management of the State of Rio deJaneiro


1kera International Conference 2008
KERA INTERNATIONAL CONFERENCE 2008GLOBAL FÓRUM ON EDUCATION: QUANTITY AND
QUALITY.
November 27th
-29th
, Seoul – Korea
INTRODUCTION
It’s with great pleasure that I represent both Brazil and the State of Rio deJaneiro, meanwhile being the President of the Government SchoolFoundation of the State of Rio de Janeiro – FESP – RJ GovernmentSchool, at this important event: KERA International Conference 2008and the Global Forum on Education: Quantity and Quality.
The opportunity of participating at this forum of debates on quantity andquality on Education allow us to showcase relevant data and financialactions happening at our Brazilian educational system and also to stretchour points of view through interaction and sharing among differentprofessionals and participants.
The development of Education is a hard task that belongs to all of us.Here we are stepping forward to overcome the challenge of enabling ahigh quality education, through the voices of high professionals attendingthis International Congress.
Our gratitude and appreciation to Professor Chong Jae Lee, Departmentof Education of the Seoul National University, from whom we got invitedto participate at this conference and to also share Brazilian case practices,especially those happening in the State of Rio de Janeiro.
A special thanks to the Government of the State of Rio de Janeiro,represented in person by the Secretary of Planning and Management –Dr. Sérgio Ruy Barbosa Guerra Martins, who has trust in our representationand has delegated the mission of spreading government actions atinternational level.
Wishing you all a wonderful event,
Rio de Janeiro, Brazil, November, 2008.
CLAUDIO MENDONÇAPresident of FESP - RJ