instituto de quÍmica programa de pÓs-graduaÇÃo … figueiredo... · e em restauração, na mata...
TRANSCRIPT
INSTITUTO DE QUÍMICA
PROGRAMA DE PÓS-GRADUAÇÃO EM GEOCIÊNCIAS - GEOQUÍMICA
VIVIANE FIGUEIREDO SOUZA
MECANISMOS DA CICLAGEM DO NITROGÊNIO E EMISSÃO DE ÓXIDO NITROSO (N2O) EM SOLOS DE DIFERENTES LATITUDES
NITERÓI
2017

VIVIANE FIGUEIREDO SOUZA
MECANISMOS DA CICLAGEM DO NITROGÊNIO E EMISSÃO
DE ÓXIDO NITROSO (N2O) EM SOLOS DE DIFERENTES
LATITUDES
Tese apresentada ao Curso de Pós-Graduação em Geociências da Universidade Federal Fluminense, para a obtenção do Grau de Doutor. Área de Concentração: Geoquímica Ambiental.
Orientador:
Profº. Drº. Alex Enrich Prast
NITERÓI
2017

UFF. SDC. Biblioteca de Pós-Graduação em Geoquímica
S729 Souza, Viviane Figueiredo.
Mecanismos da ciclagem do nitrogênio e emissão de óxido nitroso (N2O) em solos de diferentes latitudes / Viviane Figueiredo Souza. – Niterói : [s.n.], 2017.
115 f. : il. ; 30 cm.
Tese (Doutorado em Geociências - Geoquímica Ambiental) - Universidade Federal Fluminense, 2017. Orientadora: Profº Drº Alex Enrich Prast.
1. Geoquímica. 2. Nitrogênio. 3. Óxido nitroso. 4. Solo. 5. Floresta
Atlântica. 6. Floresta Amazônica. 7. Produção intelectual. I. Título.
CDD 551.9


AGRADECIMENTOS
Ao Professor Alex Enrich Prast pela orientação, pelos mais de 10 anos de trabalho
juntos, pelas inúmeras oportunidades profissionais e pessoais, que influenciaram
profundamente a profissional que me tornei. Agradeço a confiança de sempre!
Ao Professor Tobias Rütting pela paciência de me ensinar muito sobre nitrogênio em
solos e todas as metodologias que aplicamos, e por ter me ajudado imensamente com o
inglês em nosso primeiro artigo publicado!
Aos membros da pré-banca, Professora Luciane Silva Moreira e Professor William
Zamboni de Mello, pelas correções atenciosas e sugestões enriquecedoras.
Aos membros da banca, Professora Luciane Silva Moreira e Professor William
Zamboni de Mello, Professor Jean Ometto e Dr. Renato Rodrigues, pelas sugestões e
críticas construtivas.
Ao Nivaldo Camacho por esclarecer minhas dúvidas e sempre me ajudar.
Ao CNPq e ao Programa de Pós-Graduação em Geociências – Geoquímica Ambiental
pela concessão da bolsa de doutorado.
Programa do CAPES/STINT, pelo financiamento do projeto “Fatores controladores da
produção e emissão de óxido nitroso (N2O) em solos intactos, impactados por pecuária
e em restauração, na Mata Atlântica (Guapiaçu/RJ)” Proc. Nr. BEX 10827/14-5, o qual
está inserido nessa tese, com a concessão da bolsa de doutorado sanduíche na Suécia.
Ao pessoal do Laboratório de Biogeoquímica da Universidade Federal do Rio de
Janeiro, pela ajuda durante os quatro anos de doutorado, seja nas saídas de campo,
análises laboratoriais, discussões científicas e estatísticas, ou na companhia do dia a dia
de laboratório: Roberta Peixoto, Fausto da Silva, Rafael Feijó, Lisa Tavares, João
Felizardo, Tainá Soares Leonardo Amora, nas análises laboratoriais Ricardo Pollery,
Lívia Cosme, Vinícius Perruzi, Ana Lúcia Santoro, Laís Rodrigues, Nayara Gomes,
Cristiane Caetano, Eliane Cristina, Tainá Stauffer, dentre outros. Obrigada!

À técnica da Universidade de Gotemburgo Aila Schachinger pela ajuda com as análises
de NH4+ e NO3
- e pelo carinho.
À minha mãe que sempre apoiou minhas escolhas profissionais, dando suporte e
carinho, e participando dos momentos mais importantes e decisivos.
À minha irmã que sempre torceu e se orgulhou de mim, me apoiando e aconselhando.
Ao meu pai por ler meus textos, ficar feliz e querer entender mais meu trabalho. Seu
interesse e participação são muito importantes!
À Renata Souza e Orlando Moreira, que me acompanhando a muito tempo como
madrastra e padastro, sempre ajudando e tendo papéis muito importantes no suporte da
nossa família.
Ao meu namorado Thadeo Pinhão, pelo carinho, pela paciência comigo nos momentos
de estresse e das mil mudanças de planos, por me ajudar tanto quando estávamos
distantes, e mais ainda quando estamos juntos. Obrigada!
À todas as minhas amigas e amigos que ajudaram a descontrair e tornaram esses anos
mais leves! Em especial à Fernanda Rimes, Maria Carolina Barroso, Juliana Valle,
Roberta Peixoto e Thaís Guedes, por segurarem minha mão, compartilharem momentos
de alegria e angustia, sempre ajudando!
À todos que não citei, mas que, de alguma forma, contribuíram para a realização deste
trabalho.

"A verdadeira viagem da descoberta não consiste em procurar
novas paisagens, mas em vê-las com novos olhos."
Marcel Proust

RESUMO
O nitrogênio (N) é um elemento imprescindível para todos os organismos do nosso planeta,
entretanto o composto nitrogenado mais abundante, o gás dinitrogênio (N2), é assimilável
apenas por poucos micro-organismos. Isso torna o N limitante, refletindo na sua
disponibilização via mineralização de matéria orgânica (MO) e a nitrificação, que produzem
amônio (NH4+) e nitrato (NO3
-), respectivamente. Em solos, esses processos são regulados por
fatores como conteúdo de MO e água no solo, pH e temperatura. Em ecossistemas florestais,
tropicais e boreais, esses processos são muito relevantes e ainda pouco estudados,
principalmente em áreas de floresta secundária sob influência de manejo. A mudança de uso
do solo causa alterações na ciclagem e disponibilidade do N, nos fatores reguladores, e na
emissão de óxido nitroso (N2O), um gás de efeito estufa. Padrões de recuperação florestal são
bastante distintos entre diferentes florestas tropicais, como visto para floresta de Mata
Atlântica e Amazônica, com taxas de mineralização em florestas jovens (10 anos) muito
elevadas na Amazônia (20,9 µg N g-1 SWD d-1) e mais baixas na Mata Atlântica (3,2 µg N g-1
SWD d-1). Já a nitrificação teve um padrão semelhante, com baixas taxas em ambas as
florestas jovens (0,6 6,8 µg N g-1 SWD d-1 na Mata Atlântica e Amazônia, respectivamente), o
que indica uma ciclagem de N conservativa, evitando perdas via emissão de gás e lixiviação
de NO3-. Entretanto, a emissão de N2O em área de restauração na Mata Atlântica foi maior do
que na pristina (22 e 2,5 µg N2O-N g-1 SWD h-1, respectivamente) devido à maior temperatura
do solo que estimula os processos microbianos produtores de N2O. Em termos de floresta
pristina, a taxa de nitrificação foi bastante distinta entre a floresta de Mata Atlântica e
Amazônica (0,08 e 15,9 µg N2O-N g-1 SWD h-1, respectivamente). Isso evidencia os
diferentes fatores reguladores de cada região tropical, como regime de chuvas, composição
vegetal, tipos de solo, etc. Em florestas boreais, foi visto que o conteúdo de MO e água do
solo e o pH do solo são os principais reguladores, limitando a disponibilidade de N em
florestas bem drenadas dominadas por coníferas, em comparação com florestas pouco
drenadas dominadas por turfa. Dessa forma, verificamos que a mineralização e,
principalmente, a nitrificação, são processos muito relevantes no controle de N, e mesmo em
ecossistemas diferentes, os fatores reguladores muitas vezes são os mesmos. Isso evidencia a
necessidade de mais estudos acerca da dinâmica do N nesses ambientes, principalmente em
florestas em restauração.
Palavras-chave: Nitrogênio. Mineralização. Nitrificação. Fatores reguladores. Floresta de
Mata Atlântica. Floresta Amazônica. Floresta boreal.

ABSTRACT
Nitrogen (N) is an essential element for all organisms; however, the most abundant nitrogen
compound, dinitrogen (N2), is assimilable only by a few microorganisms. This makes N
limiting, which reflects in its availability via organic matter (OM) mineralization and
nitrification, which produce ammonium (NH4+) and nitrate (NO3
-), respectively. In soils, these
processes are regulated by factors such as OM and soil water content, pH and temperature. In
forest ecosystems, tropical and boreal, these processes are very relevant and still poorly
understood, especially in secondary forest previously deforested. The land use change causes
alterations in cycling and availability of N, regulating factors, and emission of nitrous oxide
(N2O), a greenhouse gas. Forest recovery patterns are quite distinct among different
rainforests, as seen for Atlantic and Amazon rainforest, with very high levels of
mineralization in young forests (10 years) in Amazonia (20.9 µg N2O-N g-1 SWD h-1) and low
in the Atlantic Forest (3.2 µg N2O-N g-1 SWD h-1). Nitrification had a similar pattern between
them, with low rates in both young forests (0.6 and 6.8 µg N2O-N g-1 SWD h-1 in the Atlantic
and Amazon forest, respectively), indicating a conservative N cycling, avoiding losses
through gas emission and NO3- leaching. However, the N2O emission in restoration area in
the Atlantic Forest was higher than in pristine (22 and 2.5 µg N2O-N g-1 SWD h-1,
respectively) due to the higher soil temperature, which stimulates microbial production of
N2O. In terms of pristine forest, the nitrification rate was very different between the Atlantic
forest and Amazonian forest (0.08 and 15.9 µg N2O-N g-1 SWD h-1, respectively), showing
the different regulatory factors of each tropical region, such as rainfall regime, vegetal
composition, soil types, etc. In boreal forests, OM, soil water content and soil pH were the
main regulators, limiting the availability of N in conifer-dominated well-drained forests
compared to peat-dominated poorly drained forests. In this way, we verified that
mineralization and, mainly, nitrification are very relevant processes in the control of N, and
even in extremely different ecosystems, the regulating factors are often the same. This
evidences the need for more studies about N dynamics in these environments, especially in
restoration forests.
Keywords: Nitrogen. Mineralization. Nitrification. Regulating factors. Atlantic forest.
Amazon rainforest. Boreal forest.

LISTA DE FIGURAS
Figura 1. Esquema apresentando a organização em que a presente tese está dividida...............17
Figura 2. Esquema representativo do ciclo do nitrogênio simplificado com os processos
microbianos responsáveis pela transformação do nitrogênio em solos. Siglas: NOP = nitrogênio
orgânico particulado; NOD = nitrogênio orgânico dissolvido; NOS = nitrogênio orgânico no
solo...............................................................................................................................................21
Figura 3. Relação entre a taxa de desnitrificação e o conteúdo de água nos poros do solo
(CAPS) em 15 cm de perfil no solo de plantação de milho. Adaptado de Ju et al.,
(2011)...........................................................................................................................................24
Figura 4. Distribuição das áreas de desmatamento e reflorestamento no Brasil e alguns países
da América Latina entre os anos de 2000 e 2010. Os nomes originais dos biomas estão incluídos
na legenda, associados às cores do mapa. Adaptado de AIDE et al.,
2013.............................................................................................................................................29
Figura 5. Precipitação mensal (a) e flutuação do nível de água (b) no rio Madeira em Porto
Velho, rio Amazonas em Manaus, e rio Negro em Barcelos, correspondendo às regiões sul,
central e norte da bacia Amazônica. (Retirado de Junk 1984b apud Junk,
1997).............................................................................................................................................31
Figure 6. Esquema do experimento de 15N in situ em cada área de estudo com três subáreas,
cada uma contendo dois transectos com dois locais de marcação. Cada transecto recebe uma
espécie de 15N (15NH4+ e 15NO3
-), e são distantes entre si 1 m. Os locais de marcação no mesmo
transecto são separados 0,3 m entre si. B – Esquema de cada local de marcação com 11 15N
injeções de solução. Após a marcação, a amostra de solo é retirada do círculo preto no tempo 0,
imediatamente após a adição da solução, e no tempo 24, 24 horas após a adição da
solução..........................................................................................................................................36
Figure 7. Map showing the Ecological Reserve of Guapiaçú (REGUA) localization in Rio de
Janeiro state, Brazil. Adapted from DAMASCENO (2012)………………………………..…..44
Figure 8. Gross soil N transformation rates in pristine forest soils (upper graph) and restored
forest soils (lower graph) in Ecological Reserve of Guapiaçú (REGUA) at Rio de Janeiro state,
Brazil. N = 3. Student’s T test (P < 0.05) was done between forests to test the same gross N
transformation. None of them was significantly different. Rates were calculated between hour
zero and hour 24 after 15N solutions added. Rates unit is µg N g-1 soil dry weight (SDW) d-
1……………………………………………………………………………………………….…48
Figure 9. Rates of N2O flux (µg N2O-N m-2 h-1; median, minimum and maximum) in soils from
pristine and restored Atlantic forest at Ecological Reserve of Guapiaçú (REGUA), in Rio de
Janeiro/Brazil. Student’s T test (P < 0.05) was done to compare the means, which are
significantly different between the forests (N = 20)………………………………………….…49

Figure 10. Relationship between N2O flux (µg N-N2O m-2 h-1) and soil temperature (°C) for
restored Atlantic forest. Correlation was significant and positive (P < 0.05; Pearson’s r =
0.79)……………………………………………………………………………………………..51
Figure 11. Map of the Ecological Station of Cunia, Porto Velho municipality, at Rondônia
state, Brazil. The red star represent our sampling area. (Map from PPBio
INPA)…………………………………………………………………………………...………64
Figure 12. Gross N mineralization (top) and nitrification (bottom) rates (µg N g-1 SDW day-1;
Mean ± Standard Error) in five forest soils at Cuniã Ecological Station, Rondônia, with one
pristine forest (set to t = 0 years) and three regrowth forests (10 years; 20 years; and 40 years).
For gross N mineralization, the 10 years old regrowth forest was statistically different from the
40 years old forest (One way ANOVA with Tukey’s post hoc test P < 0.05). For gross
nitrification the pristine forest was significantly different from all three regrowth forests (One
way ANOVA with Tukey’s post hoc test P <
0.05)……………………………………………………………………………………………..68
Figure 13. Content of soil NH4+ and NO3
- (µg N g-1 SDW; Mean ± SE) as well as the ratio
between the two mineral N forms in pristine forests (set to t=0 years) and three regrowth forests
(10, 20 and 40 years) at the Ecological Station of Cuniã, Rondônia (Brazil). The contents were
calculated from the first extraction after 15N labelling by subtracting the amount of tracer
recovered (based on 15N enrichment)……………………………………….…………...……..72
Figure 14. Rates of gross N transformation for riparian (RZ) and upland (UpL) soils in two
Swedish boreal forests on a soil dry weight (SDW) basis and on a soil organic matter (SOM)
basis (mean ± standard error). The gross rates of N transformation evaluated here were: (a)
mineralization on SDW, (b) consumption of NH4+ on SDW, (c) nitrification on SDW, (d)
consumption of NO3- on SDW, (e) mineralization on SOM, (f) consumption of NH4
+ on SOM,
(g) nitrification on SOM and (h) consumption of NO3- on SOM……………………………….86
Figure 15. Contribution of NH4+ oxidation (white), NO3
- reduction (grey) and organic N
oxidation (black) to N2O production in riparian (RZ) and upland (UpL) soils in two Swedish
boreal forests (sites 1 and 8). Means ± standard error are shown (n = 6)..……………………..90

LISTA DE TABELAS
Table 1 - Physico-chemical soil properties of pristine and restored Atlantic forests in the
Ecological Reserve of Guapiaçú/Rio de Janeiro, Brazil………………………….…….………47
Table 2 - Rates of gross N transformations (mineralization, NH4+ consumption, nitrification and
NO3- consumption) in two Atlantic forests, a pristine forest and a young restored
forest…………………………………………………………………………………………….49
Table 3 - Compilation of gross N transformations data in different tropical forest soils from the
literature (µg N g-1 d-1)……………………………………………………………………...…...52
Table 4 - Soil properties of pristine forest and three regrowth forests (10, 20 and 40 year old) at
Ecological Station of Cuniã, Rondônia (Brazil). Mean ± Standard Error………………..……..69
Table 5 - Physicochemical soil properties of the riparian and upland zones of two forest sites in
northern Sweden. Summary statistics of raw data of pH, SOM, GWC, TC, TN and C/N ratio.
Soil properties with skewness coefficients outside the limits ±1 were transformed to common
logarithms (log10) for further statistical analysis. The missing data in the log10 column indicate
that the property had a near-normal distribution and was not –transformed….………………...80
Table 6 - Two-way ANOVA results to determine the effects of sampling sites (1 and 8) and
zones (riparian and upland) on soil properties……………………………………………....….84
Table 7 - Results of two-way ANOVA to determine the effects of sampling sites (1 and 8) and
zones (riparian and upland) on gross N transformations (mineralization, NH4+ consumption,
nitrification and NO3- consumption) on a soil dry weight basis (µg N g-1 SDW day-1) and a soil
organic matter basis (µg N g-1 SOM day-1)……………………………………………….…….88
Table 8 - Gross rates of N transformation (mineralization, NH4+ consumption, nitrification and
NO3- consumption) on a soil dry weight basis (µg N g-1 SDW day-1) and a soil organic matter
basis (µg N g-1 SOM day-1) at sampling sites (1 and 8) and zones (riparian and
upland)…………………………………………………………………………………….….…90
Table 9 - Rates of gross autotrophic and heterotrophic nitrification (µg N g-1 SDW day-1) at
sites 1 and 8, riparian and upland zones (n = 6; mean of each process at different sites and zones
and standard errors)……………………………………………………………………………..91
Table 10 - Physicochemical soil properties of the riparian and upland zones of two forest sites
in northern Sweden……………………………………………………………………..….…....92
Tabela 11 - Taxas brutas de mineralização nas três florestas de diferentes latitudes que foram
investigadas no presente estudo (Mata Atlântica, Amazônia e Boreal; Média ± Erro
Padrão)........................................................................................................................................100
Tabela 12 - Taxas brutas de nitrificação nas três florestas de diferentes latitudes que foram
investigadas no presente estudo (Mata Atlântica, Amazônia e Boreal; Média ± Erro
Padrão)........................................................................................................................................100

Tabela 13 - Taxas brutas de mineralização e nitrificação nas três florestas de diferentes latitudes
que foram investigadas no presente estudo (Mata Atlântica, Amazônia e Boreal; Média ± Erro
Padrão)........................................................................................................................................102

LISTA DE SIGLAS
CAPS = conteúdo de água nos poros do solo
CH4 = metano (methane)
CO2 = dióxido de carbono (carbon dioxide)
C/N = carbon / nitrogen ratio
GEE = gás de efeito estufa
GHG = greenhouse gas
GWC = gravimetric water content
MOS (SOM) = matéria orgânica do solo
N = nitrogênio
N2 = dinitrigênio
NO = óxido nítrico
N2O = óxido nitroso (nitrous oxide)
NH3 = amônia
NH4+ = íon amônio
NO2- = nitrito
NO3- = nitrato
NOD = nitrogênio orgânico dissolvido
NOP = nitrogênio orgânico particulado
RDNA = redução dissimilatória de nitrato à amônia
SD = standard deviation
SE = standard error
SDW = soil dry weight
SON = soil organic nitrogen
T = temperature
TC = total carbon
TN = total nitrogen

SUMÁRIO
RESUMO..........................................................................................................................6
ABSTRACT.....................................................................................................................7
LISTA DE FIGURAS......................................................................................................8
LISTA DE TABELAS...................................................................................................10
LISTA DE SIGLAS.......................................................................................................12
1 INTRODUÇÃO GERAL...........................................................................................16
2 BASE TEÓRICA........................................................................................................18
2.1 NITROGÊNIO E SUA RELEVÂNCIA GLOBAL..................................................18
2.2 CICLO DO N.............................................................................................................20
2.2.1 N2 e a Fixação Biológica de Nitrogênio (FBN)...................................................20
2.2.2 Mineralização do nitrogênio orgânico no solo...................................................21
2.2.3 Nitrificação............................................................................................................22
2.2.3.1 Nitrificação autotrófica........................................................................................22
2.2.3.2 Nitrificação heterotrófica.....................................................................................23
2.2.4 Desnitrificação......................................................................................................23
2.2.5 Redução Dissimilatória de Nitrato à Amônio (RDNA).....................................24
2.2.6 Oxidação Anaeróbica de Amônio (ANAMMOX)..............................................25
2.3 FATORES REGULADORES...................................................................................25
2.4 ECOSSISTEMAS FLORESTAIS DE DIFERENTES LATITUDES.......................27
2.4.1 Floresta tropical....................................................................................................28
2.4.1.1 Floresta de Mata Atlântica...................................................................................28
2.4.1.2 Floresta Amazônica.............................................................................................30
2.4.2 Floresta Boreal......................................................................................................32
2.5 DESMATAMENTO E MANEJO.............................................................................33
2.6 OBJETIVO GERAL..................................................................................................34
2.6.1 Objetivos específicos.............................................................................................34
2.7 HIPÓTESES..............................................................................................................35
3 METODOLOGIAS APLICADAS............................................................................36
3.1 EXPERIMENTO DE 15N IN SITU............................................................................36
3.2 AVALIAÇÃO DO FLUXO DE N2O........................................................................38
3.3 EXPERIMENTO DE 15N EM LABORATÓRIO.....................................................39

4 EFFECTS OF RESTORATION FOREST ON SHORT-TERM NITROGEN
TRANSFORMATIONS AND N2O FLUX IN TROPICAL ATLANTIC
FOREST…………………………………………………………………………..…...41
4.1 INTRODUCTION………………………………………………………………….41
4.2 MATERIAL AND METHODS…………………………………………………….43
4.2.1 Study region……………..………………………………………………………43
4.2.2 Experimental design………………………………………………………….…44
4.2.2.1 15N experiment………………………………………………………………….44
4.2.2.2 N2O flux measurement……………………………………………………...….46
4.2.2.3 Statistical analyses……………………………………………………………...46
4.3 RESULTS…………………………………………………………………………..47
4.3.1 Differences between pristine and restored Atlantic forests in terms of soil
properties………………………………………………………………………...…….47
4.3.2 Gross N transformations in pristine and restored Atlantic forest………..….48
4.3.3 N2O fluxes from pristine and restored Atlantic forest soils…………………..49
4.4 DISCUSSION………………………………………………………………………50
4.4.1 Gross N transformations and their relationship with soil properties in both
pristine and restored forests……………………………………………………….....50
4.4.2 N2O Restoration emission in restoration forest soil……………….………….53
4.4.3 Effects of soil compaction from restoration forest……….…………………...55
4.5 CONCLUSION………………………………………………………………...…..55
4.6 REFERENCES..……………………………………………………………………56
5 RECOVERY OF SOIL N MECHANISMS IN REGROWING AMAZONIAN
RAINFOREST………………………………………………………………………...62
5.1 INTRODUCTION………………………………………………………………….62
5.2 METHODS…………………………………………………………………………64
5.2.1 Study area………………………………………………………………………..64
5.2.2 In situ 15N labelling……………………………………………………………..65
5.2.3 Data analysis…………………………………………………………………….66
5.3 RESULTS AND DISCUSSION……………………………………………………67
5.4 CONCLUSION…………………………………………………………...………..72
5.5 REFERENCES..........................................................................................................72
6 SOIL ORGANIC MATTER CONTENT CONTROLS GROSS NITROGEN
DYNAMICS AND N2O PRODUCTION IN RIPARIAN AND UPLAND BOREAL
SOIL…………..……………………………………………………………………..…77
Damasceno (2008)

6.1 INTRODUCTION………………………………………………………………….78
6.2 MATERIAL AND METHODS…………………………………………………….79
6.2.1 Study site…………………………………..…………………………………….79
6.2.2 The 15N experiment……………………………………….…………..….……...81
6.2.3 Calculations and statistics………………………………………………………82
6.3 RESULTS…………………………………………………………………………..86
6.4 DISCUSSION………………………………………………………………………91
6.5 CONCLUSION…......……………………………………………………….…..…94
6.6 REFERENCES……………………………………………………………….…….95
7 VIAS DO CICLO DO NITROGÊNIO EM SOLOS DE DIFERENTES
LATITUDES..................................................................................................................99
7.1 COMPARAÇÃO ENTRE FLORESTAS PRISTINAS DE DIFERENTES
LATITUDES...................................................................................................................99
7.2 MINERALIZAÇÃO E NITRIFICAÇÃO EM FLORESTAS EM ESTÁGIO
INICIAL DE RECUPERAÇÃO....................................................................................102
7.3 EMISSÃO DE N2O EM SOLOS TROPICAIS.......................................................103
8 CONCLUSÕES.........................................................................................................104
9 REFERÊNCIAS........................................................................................................105

16
1 INTRODUÇÃO GERAL
Ecossistemas florestais de diferentes latitudes apresentam fatores ambientais
(conteúdo de matéria orgânica, carbono, nitrogênio e água no solo, pH, dentre outros) e
fatores climáticos (temperatura, precipitação), que regulam de maneira sinérgica, as taxas dos
processos do ciclo do N, o que torna imprescindível a avaliação de tais fatores em estudos
ambientais relacionados ao nitrogênio (DE BOER; KOWALCHUK, 2001; KARHU et al.,
2010; LIU et al., 2015; BOOTH et al., 2005). Florestas tropicais, como floresta de Mata
Atlântica e Amazônica, e florestas boreais apresentam características ambientais diferentes,
dentre elas, a temperatura (PETTERSSON; BAATH, 2003) e a dominância de espécies
(LAMBERS et al., 2009). Em florestas tropicais, as temperaturas médias são mais altas (20
°C) e estes ecossistemas apresentam uma enorme diversidade vegetal, sendo considerados hot
spots de diversidade (SOS MATA ATLÂNTICA/INPE 2015). Já as florestas boreais,
apresentam uma ampla variação de temperatura ao longo do ano, indo de -54 a 21 °C, e uma
baixa diversidade de espécies, com dominância de vegetação conífera (NILSSON; WARDLE,
2005). Dessa forma, tais exemplos das características bastante distintas, influenciam os
processos do ciclo do N e as principais vias e formas nitrogenadas (NH4+ e NO3
-) dominantes
nos solos.
Tanto florestas tropicais quanto florestas boreais estão suscetíveis à intensa
interferência humana através do desmatamento. Essa mudança de uso do solo ocorre,
geralmente, para abertura de área destinada à agricultura e pastagem, e também para obtenção
de madeira. Essa alteração da cobertura do solo gera drásticas modificações das suas
características pristinas (ROBERTSON; TIEDJE, 1988; KELLER; REINERS, 1994), como
alteração da vegetação nativa, compactação do solo, aumento da lixiviação de nutrientes
devido à maior exposição à chuva, dentre outros. Além disso, há alteração do estoque natural
de nitrogênio disponível no solo (LAL, 2004), atrelada à consideráveis perdas desse nutriente,
uma vez que as árvores protegem o solo do efeito da erosão e participam da manutenção e
conservação das características do solo, minimizando as perdas de N do sistema
(DAMASCENO, 2012). Dessa forma, ações de reflorestamento em locais desmatados podem
auxiliar no aumento do estoque de N no solo (LAL, 2005). Entretanto, ainda são escassos os
estudos a cerca da recuperação da ciclagem do N em solos que sofreram mudança do seu uso.
A redação da tese foi separada por capítulos, onde cada um representa um artigo que
será submetido (Capítulos 4 e 5) e que já está publicado (Capítulo 6) em periódico
especializado. Também, é apresentada uma revisão teórica sobre o estado da arte do

17
conhecimento relacionado com o nitrogênio, sua ciclagem, fatores reguladores e a
caracterização dos ambientes estudados em cada capítulo (Capítulo 2). O capítulo 3 apresenta
as diferentes metodologias que foram aplicadas em cada estudo mostrado nos capítulos
seguintes. O capítulo 4 (Effects of restoration forest on short-term nitrogen transformations
and N2O flux in tropical Atlantic forest), aborda a dinâmica do N, com foco nos processos de
mineralização, nitrificação e emissão de N2O, em solos de floresta pristina e floresta com 10
anos de restauração em área de Mata Atlântica. O capítulo 5 (Recovery of soil N mechanisms
in regrowing amazonian rainforest), trata da recuperação da ciclagem de N em solos de uma
floresta amazônica pristina e três florestas amazônicas secundárias de diferentes idades,
abandonadas após sofrerem a prática de corte e queima. O capítulo 6 apresenta o artigo
publicado em 2016 no periódico European Journal of Soil Science, intitulado “Soil organic
matter content controls gross nitrogen dynamics and N2O production in riparian and upland
boreal soil”. Nesse capítulo foi avaliada a importância do conteúdo de matéria orgânica como
fator regulador da dinâmica do N e da produção de N2O em duas diferentes zonas de floresta
boreal. No capítulo 7 são discutidas as hipóteses propostas de acordo com os resultados
encontrados. A presente tese está estruturada seguindo o esquema abaixo:
Figura 1: Esquema apresentando a organização em que a presente tese está dividida.
Capítulo 3
Capítulo 4
Objetivos e Hipóteses
Capítulos 1 e 2
Introdução Geral
Base teórica
Capítulo 5
• Relevância do N
• Processos de ciclagem de N
• Fatores reguladores
• Desmatamento e manejo
Effects of restoration forest on short-term nitrogen
transformations and N2O flux in tropical Atlantic forest
Recovery of soil N mechanisms in regrowing Amazonian rainforest
Soil organic matter content controls gross nitrogen dynamics and N2O
production in riparian and upland boreal soil Capítulo 6
Metodologias Aplicadas
Vias do ciclo do nitrogênio em solos de diferentes latitudes Capítulo 7
Conclusões

18
2 BASE TEÓRICA
2.1 NITROGÊNIO E SUA RELEVÂNCIA GLOBAL
O nitrogênio (N) é o quinto elemento mais abundante do Sistema solar, compondo
aproximadamente 78 % da atmosfera terrestre sob a forma de N2 (dinitrogênio). Apesar da
grande quantidade, o gás N2 é inerte e sua assimilação e transformação em N reativo são
realizadas por um único processo natural restrito a um pequeno grupo de micro-organismos
(CANFIELD et al., 2010, REIS et al., 2016). Dessa forma, diversos ecossistemas têm sua
produtividade limitada por N em função da grande demanda e baixa disponibilidade (ZEHR et
al., 2000). O N é um dos elementos mais importantes do planeta, visto que ele está presente
em compostos imprescindíveis para todos os organismos, como proteínas, ATP, bem como à
entrada de energia nos ecossistemas, regulando processos microbianos (ZEHR et al., 2000), e
também atuando em questões globais como efeito estufa, aquecimento global e uso excessivo
de fertilizantes na agropecuária (GALLOWAY et al., 2008).
Os processos microbianos que ocorrem em solos e realizam a ciclagem desse elemento
podem redisponibilizá-lo ou removê-lo do ambiente através da produção de compostos
nitrogenados gasosos, por exemplo (RUTTING et al., 2008). Essas emissões gasosas reduzem
o N no ecossistema e podem gerar consequências ambientais alarmantes com a produção de
óxido nitroso (N2O), um gás de efeito estufa (IPCC, 2013). Dessa forma, processos de
ciclagem do N, com destaque para os processos de mineralização da matéria orgânica
[degradação de matéria orgânica produzindo o íon amônio (NH4+)] e nitrificação [oxidação da
NH4+ ou N orgânico à nitrato (NO3
-)], regulam sua disponibilidade nos ecossistemas, se
tornando determinantes na produção primária dos ecossistemas (BOOTH et al., 2005).
Atividades antrópicas, como a utilização maciça de fertilizantes nitrogenados e a queima de
combustíveis fósseis, têm gerado intensas mudanças no ciclo global do N (REIS et al., 2016).
No caso da aplicação de fertilizantes, isso permite o aumento da produção de alimento,
necessária para sustentar o crescimento populacional. Entretanto, grande parte desses
compostos nitrogenados lábeis, como amônia/amônio (NH3/NH4+) e nitrato adicionados aos
solos são perdidos devido as transformações microbianas e movimentos que ocorrem nos
solos como lixiviação para água subterrânea, rios, lagos e mares próximos, causando
eutrofização, poluição das águas, dentre outros efeitos associados, e também emissões de
gases através das emissões de NH3, óxido nítrico e óxido nitroso (NO e N2O,
respectivamente; BOUWMAN et al., 2013; BODIRSKY et al., 2014).

19
Tais gases nitrogenados apresentam efeitos negativos para o meio ambiente como: a
interação do NO com o ozônio estratosférico, causando sua destruição catalítica e afetando a
camada de ozônio; a transformação de N2O em NO na estratosfera e este interagindo com o
ozônio estratosférico (RAVISHANKARA et al., 2009); e também o fato do N2O ser um
potente gás de efeito estufa, 310 vezes mais potente da retenção de calor do que o dióxido de
carbono (CO2; WERNER et al., 2007; BRAKER; CONRAD, 2011), com maior tempo de
residência na atmosfera (120 anos; IPCC, 2013). Atualmente, o N2O tem recebido bastante
atenção de pesquisadores devido a características citadas acima e a concentração atmosférica
que tem crescido linearmente sem perspectiva de redução (RAVISHANKARA et al., 2009).
Sua concentração atmosférica, em 2015, foi estimada em 328 ppb (NOAA, 2016), com
aumento de aproximadamente 20 % a partir de 1750 associado à Era Industrial (IPCC, 2013).
A principal fonte natural de N2O em nosso planeta é o solo (SCHLESINGER, 2013),
com uma emissão de aproximadamente 6.6 Tg N2O-N ano-1 por solos naturais. Nesse
compartimento, os principais processos biogeoquímicos responsáveis pela produção de N2O,
nitrificação e desnitrificação, fazem parte da ciclagem de nitrogênio no sistema, e estão
envolvidos na disponibilização dos compostos nitrogenados para os organismos. Esses dois
processos são os principais responsáveis pela produção de N2O em solos (BRAKER;
CONRAD, 2011). Por serem processos biológicos, fatores controladores, bióticos e abióticos,
regulam suas taxas (MAMILOV; DILLY, 2002; MA et al., 2010), influenciando a
disponibilidade de N no ecossistema, bem como a produção e emissão de N2O para a
atmosfera.
Atualmente, uma das grandes preocupações mundiais é o aquecimento global e suas
consequências para a vida na Terra. Em função disso, diversos estudos buscam diagnosticar
os fatores agravadores do aquecimento global e encontrar mecanismos que minimizem as
emissões dos gases de efeito estufa, como a preservação e regeneração de florestas, que atuam
como sumidouro de carbono atmosférico (MAY et al., 2005).
Em relação ao N, poucos micro-organismos são aptos a realizar a fixação de
nitrogênio atmosférico, o que nos leva a ter mais atenção com a perda de compostos
nitrogenados dos ecossistemas, principalmente sob a forma de N2O. Os estudos a respeito das
emissões desse gás em áreas tropicais ainda são poucos, sendo essas áreas ideais para a sua
produção e emissão em função de características como as altas temperaturas na maior parte do
ano, intensificando o metabolismo de muitos organismos (BRAKER et al., 2010), a elevada
concentração de matéria orgânica, que subsidia diversos processos microbianos (BOOTH et
al., 2005; PINA-OCHOA; ALVAREZ-COBELAS, 2006), dentre outros.

20
2.2 CICLO DO N
O ciclo do N é composto por diferentes processos biogeoquímicos, realizados por uma
variedade de micro-organismos (Figura 2). Algumas dessas transformações do N podem
conservar o N no sistema, o que ocorre quando são produzidos compostos lábeis, como NH4+
e NO3-, ou podem gerar a perda desse nutriente, como citado anteriormente. Um melhor
entendimento dessas transformações e perdas de N em solos tem se mostrado cada vez mais
importante, através de estudos dos processos biogeoquímicos e de fatores reguladores que os
influenciam (VAN GROENIGEN et al., 2015), tanto em ecossistemas naturais como em
sistemas agrícolas e similares, buscando minimizar prévios e futuros danos ambientais
(CHEN et al., 2014).
2.2.1 N2 e a Fixação Biológica de Nitrogênio (FBN)
A forma de N mais abundante em nosso planeta é o N2 que, devido a sua não
reatividade, é assimilado e biodisponibilizado nos ecossistemas por uma gama restrita de
micro-organismos (bactérias fixadoras de nitrogênio, cianobactérias e fungos) simbiontes
(principalmente com plantas leguminosas) ou de vida livre (CLEVELAND et al., 1999).
O fluxo de N2 a partir da atmosfera para ecossistemas terrestres e aquáticos se dá
através do processo natural da FBN, no qual o gás é assimilado pelo micro-organismo e
reduzido a íon amônio (NH4+), forma de N biodisponível (Figura 2; HALBLEIB; LUBBEN,
2000). A FBN é um processo de alta demanda energética, sendo mais favorável para bactérias
em simbiose com plantas, uma vez que estas liberam exsudatos orgânicos que fornecem
energia para as bactérias (OLIVARES et al., 2013).

21
Figura 2. Esquema representativo do ciclo do nitrogênio simplificado com os processos microbianos
responsáveis pela transformação do nitrogênio em solos. Siglas: NOP = nitrogênio orgânico particulado;
NOD = nitrogênio orgânico dissolvido; NOS = nitrogênio orgânico no solo.
2.2.2 Mineralização do nitrogênio orgânico no solo
A mineralização da matéria orgânica do solo (MOS) é um processo fundamental que
auxilia o ciclo do N, bem como outros ciclos, uma vez que fornece substratos de N
inorgânico, principalmente NH4+, através da decomposição da MOS, o que o torna um
processo extremamente relevante em solos.
A mineralização de MOS é o processo de degradação mais eficiente e energeticamente
favorável quando há presença de oxigênio, e ocorre, principalmente, na faixa superior do solo,
local predominantemente aeróbico e com acúmulo de MOS (AMBUS et al., 1992). Esse
processo é correlacionado positivamente com o consumo de oxigênio proveniente da
respiração aeróbica que ocorre durante a degradação (LI et al., 2012).
Existem duas formas de expressar a taxa de mineralização: Através do cálculo da
mineralização bruta, que fornece o valor total de N inorgânico que está sendo produzido no
solo por esse processo, e também da mineralização líquida, que representa o que restou do N
inorgânico após a imobilização do mesmo por plantas e micro-organismos. Por exemplo:
Mineralização líquida de N = Mineralização bruta de N - Imobilização de N inorgânico produzido (1)
Cada uma dessas taxas tem sua relevância ecossistêmica. A taxa de mineralização
líquida, por exemplo, pode indicar a disponibilidade de N inorgânico para assimilação, mas
não informa a quantidade desse N que está sendo produzida a partir da MOS. Isso é
Mineralização N
Imobilização NO3
-
Imobilização NH4
NOS
NH4+

22
demonstrado pela taxa bruta do processo, que reflete a dinâmica das transformações
microbianas do N (NEILL et al., 1999, BOOTH et al., 2005, HÖGBERG et al., 2014). Essa
mesma diferenciação entre taxa bruta e líquida pode ser usada para todos os processos
transformadores de N.
2.2.3 Nitrificação
O processo de nitrificação corresponde a oxidação de compostos nitrogenados à NO3-.
Esse processo microbiano é um dos destinos do NH4+ em solos, uma vez que esse íon pode
ser imobilizado por plantas e micro-organismos (BENGTSSON et al., 2003; BOOTH et al.,
2005), sofrer retenção abiótica em argilas e reações químicas com a matéria orgânica do solo
(JOHNSON et al., 2000), ou ainda ser volatilizado quando se encontra sob a forma de NH3.
Esse último processo é dependente do pH do solo, pois em pH alto, ou seja, alcalino, o íon
NH4+ passa para a forma de NH3, que é facilmente volatilizado (JAYAWEERA et al., 1991;
BAJWA et al., 2006; FIENCKE et al., 2006; HADEN et al., 2011). Sua assimilação, retenção
abiótica, bem como a volatilização indisponibilizam o N para o processo nitrificante,
reduzindo as taxas de desnitrificação.
Muitos organismos têm preferência por assimilar NH4+ em detrimento do NO3
-. Isso
torna a nitrificação um importante processo que atua na regulação da disponibilidade de N no
ecossistema, auxiliando no controle das formas nitrogenadas presentes e também na
quantidade das mesmas (PROSSER, 2005). A nitrificação é subdividida em dois principais
processos, que dentre outros fatores, são regulados pelo pH do solo. São eles:
2.2.3.1 Nitrificação autotrófica
Esse processo é realizado por micro-organismos quimiolitoautotróficos que obtém
energia através da oxidação de NH4+. Ele é composto por duas principais fases realizadas por
diferentes grupos de micro-organismos estritamente aeróbicos. Na primeira fase a NH4+ é
oxidada a nitrito (NO2-) pelas bactérias oxidadoras de amônia, havendo requerimento de
oxigênio. Em ausência ou redução das concentrações de oxigênio, algumas dessas bactérias
são capazes de realizar a desnitrificação do NO2- e formar gases de nitrogênio, como NO, N2O
e N2 (PROOSER, 2005). Durante a segunda fase, o NO2- é oxidado a NO3
- pelas bactérias
oxidadoras de nitrito. Em ambas as fases há liberação de energia usada na fixação de dióxido
de carbono (CO2) para o crescimento celular (DE BOER; KOWALCHUK, 2001; FIENCKE
et al., 2006; KAMPSCHREUR et al., 2009).

23
2.2.3.2 Nitrificação heterotrófica
Tanto bactérias heterotróficas quanto fungos são responsáveis pela nitrificação
heterotrófica em solos. Esse processo apresenta dois caminhos, realizados por distintos grupos
de micro-organismos, mas, diferentemente da nitrificação autotrófica, a obtenção de energia
para o crescimento celular é pouca ou nenhuma (FIENCKE et al., 2006, HAYATSU et al.,
2008).
Um dos caminhos é semelhante a oxidação autotrófica e é realizada por bactérias
nitrificantes heterotróficas que oxidam tanto NH4+ quanto compostos orgânicos de N. O outro
caminho da nitrificação heterotrófica é realizada por fungos, havendo oxidação de aminas à
NO3- (ROBERTSON; GROFFMAN, 2007).
As taxas desse tipo de nitrificação são mais baixas se comparadas com as taxas da
nitrificação autotrófica, indicando uma baixa contribuição desse processo nitrogenado
(FIENCKE et al., 2006). Entretanto, estudos em solos ácidos têm encontrado grande
contribuição desse processo na produção de NO3- e também de N2O, indicando o pH como
um poderoso fator regulador (HUYGENS et al., 2007; CHEN et al., 2014b; ZHANG et al.,
2015; FIGUEIREDO et al., 2016). Tem sido visto que a nitrificação heterotrófica pode ser
uma via predominante para a produção de nitrato (NO3-) também em solos com elevado
conteúdo de carbono orgânico recalcitrante, principalmente nos ecossistemas de pastagem e
floresta (ZHANG et al., 2014).
2.2.4 Desnitrificação
A desnitrificação é um processo microbiano anaeróbico facultativo do ciclo do N
bastante conhecido que consiste na degradação da matéria orgânica com redução do NO3-
formando o gás N2 como produto final. Os produtos intermediários são NO2-, NO e N2O,
formando N2. Diversos fatores reguladores podem alterar o processo de desnitrificação,
interrompendo-o e liberando algum dos compostos intermediários, o que faz da
desnitrificação o processo do ciclo do N que mais gera perda de N do sistema
(KAMPSCHREUR et al., 2009). O produto intermediário mais preocupante atualmente é o
N2O, devido ao seu potencial de efeito estufa altíssimo, e sua capacidade de destruição da
camada de ozônio (RAVISHANKARA et al., 2009). Entretanto, em ambientes ricos em NO3-,
a desnitrificação pode atuar como sumidouro de N, evitando a poluição de ecossistemas
aquáticos por meio da lixiviação de N (ROBERTSON; GROFFMAN, 2007).

24
Esse processo é conhecido como facultativo porque, em ausência de oxigênio, a ampla
gama de bactérias heterotróficas que tem capacidade desnitrificante, utiliza o NO3- como
receptor de elétrons; enquanto que em presença de oxigênio, esses micro-organismos são
capazes de utilizar o oxigênio e realizar a respiração aeróbica, energeticamente mais favorável
(ROBERTSON; GROFFMAN, 2007). Em função disso, solos que sofrem alagamentos
periódicos, como planícies alagadas do Pantanal e Amazônia, e sob influência da chuva,
apresentam um alto potencial desnitrificante, e podem ter uma grande perda de N na forma
gasosa (LIENGAARD et al., 2014; FIGUEIREDO, 2012; TÔSTO, 2014). Na Figura 3,
podemos ver a influência do aumento do percentual de água no solo sob o processo de
desnitrificação. Uma vez que esse percentual aumenta no solo, a disponibilidade de O2
diminui, favorecendo processos anaeróbicos como a desnitrificação.
Figura 3. Relação entre a taxa de desnitrificação e o conteúdo de água nos poros do solo (CAPS) em 15 cm
de perfil no solo de plantação de milho. A linha pontilhada representa a partir de que valor de CAPS a
taxa de desnitrificação é mais elevada. Adaptado de Ju et al., (2011).
2.2.5 Redução Dissimilatória de Nitrato à Amônio (RDNA)
A redução dissimilatória de nitrato à amônia é um processo microbiano heterotrófico
anaeróbico realizado por bactérias fermentadoras facultativas e obrigatórias. Durante a
RDNA, o NO3- é reduzido a NO2
- e finalmente a NH4+, realizando a transformação do N nos
solos, sem perdas gasosas (SILVER et al., 2001; SILVER et al., 2005; SOTTA et al., 2008).
Entretanto, há registro de produção de N2O por esse processo em solos florestais (COLE
1988; BAGGS 2011). A produção de N2O por esse processo está associada a um mecanismo
da bactéria para desintoxicar o sistema evitando altas concentrações de NO2-, composto
nitrogenado tóxico em altas concentrações (KASPAR et al., 1982). O pH é um fator
Ta
xa d
e d
esn
itri
fica
ção
(g
N h
a-1
d-1
)
CAPS (%)

25
importante na produção de N2O pela RDNA, uma vez que, em pH alto, há maior acúmulo de
NO2- (STEVENS et al., 1998).
Por usar NO3- como substrato, a RDNA compete com o processo de desnitrificação,
uma vez que ambos os processos ocorrem na faixa anóxica do solo (TIEDJE et al., 1982).
Porém esse processo é favorecido em solos com alto teor de matéria orgânica em relação ao
NO3-, já que esse processo obtém e conserva mais energia a partir de uma quantidade menor
de NO3- reduzido, se comparado com a desnitrificação (YOON et al., 2015). Fatores
ambientais como conteúdo de NO2- em relação ao NO3
- e razão carbono/nitrogênio (C/N) são
cruciais para determinar o destino do NO3- entre desnitrificação e a RDNA (KRAFT et al.,
2014). Dessa maneira, a competição entre esses processos pode variar de acordo com
características ambientais e controlar a disponibilidade do N reativo.
2.2.6 Oxidação Anaeróbica de Amônio (ANAMMOX)
O processo de oxidação anaeróbica de NH4+ ocorre em combinação com NO2
-
formando o gás N2 como produto final. Além de N2, também pode haver significativa
produção dos gases NO e N2O (JETTEN et al., 2003). Existem poucos estudos acerca da
atividade bacteriana da anammox em solos, mostrando apenas evidências da presença dessas
bactérias em diferentes ecossistemas terrestres (HUMBERT et al., 2010). Os principais
ambientes em que esse processo é avaliado são os ambientes aquáticos, principalmente
marinhos (KUYPERS et al., 2005), e também sistemas de tratamento de esgoto, uma vez que
esse processo contribui para a remoção de N do sistema (ERLER et al., 2005).
A anammox é um processo microbiano autotrófico realizado por bactérias que têm
crescimento lento (aproximadamente 11 dias; JETTEN et al., 2003), o que faz com que sua
população apresente baixa densidade e demande um ambiente estável para seu
estabelecimento. Devido a obrigatoriedade da anoxia, solos periodicamente alagados ou sob
influência da chuva são os mais suscetíveis à essa oxidação anaeróbica (ROBERSTON;
GROFFMAN, 2007).
2.3 FATORES REGULADORES
Alguns fatores bióticos e abióticos que caracterizam o ecossistema influenciam o
desempenho metabólico dos micro-organismos e alterações nas condições ótimas refletem nas
taxas dos processos biogeoquímicos.

26
Os solos são constituídos por quatro principais componentes: partículas minerais
constituídas de fragmentos de rochas e produtos de seu intemperismo químico, matéria
orgânica, água e gases (BRADY, 1989), e sua composição também influencia a ciclagem do
N. Cada tipo de solo apresenta uma composição, com diferentes quantidades de cada
componente, como, por exemplo, a textura do solo, que varia de acordo com a quantidade de
areias, siltes e argilas (BRADY, 1989). A textura dos solos é um importante regulador de
processos microbianos de ciclagem de N no solo devido a distribuição da matéria orgânica
(USSIRI; LAL, 2013). A organização dos componentes e partículas determinam a formação
dos poros no solo, e o volume desse espaço poroso é conhecido como porosidade. O tamanho
dos poros é importante na distribuição de água e gases (REINERT; REICHERT, 2006), uma
vez que espaços maiores (> 0,05 mm de diâmetro), como solos arenosos, permitem uma
maior emissão de gases e lixiviação; enquanto que solos com poros menores (< 0,05 mm de
diâmetro), geralmente argilosos, apresentam uma menor movimentação de gases e água
(BRADY, 1989). A presença de água no espaço poroso dos solos, seja periódica ou pela
influência das chuvas (JU et al., 2011; ZHU et al., 2013; MADDOCK et al., 2001; BROWN
et al., 2012), impede a oxigenação do solo, inibindo processos aeróbicos, como a
mineralização e a nitrificação (BOLLMANN; CONRAD, 1998; MORLEY et al., 2008;
MORLEY; BAGGS, 2010).
O pH é um fator regulador bastante importante na produção de enzimas metabólicas.
No caso das bactérias desnitrificantes, a produção de enzimas que realizam parte das reduções
de NO3- a N2, que se dá por etapas, pode ser inibida em pH baixo, fazendo com que o N2O
seja o produto final. O pH também pode regular a competição entre a desnitrificação e RDNA
por substrato (NO3-), pois o processo de RDNA é favorecido em pH acima de 6,5. Isso pode
ser visto no acúmulo de NO2- em pH alto devido a inibição da produção da enzima NO2
-
redutase, que reduz o NO2- à NH4
+, presente na bactéria RDNA (STEVENS et al., 1998).
Outro processo regulado pelo pH, como já mencionado anteriormente na seção 2.1.3.2, é a
nitrificação autotrófica, que é inibida em solos ácidos, favorecendo a nitrificação
heterotrófica. Essa inibição da atividade em pH baixo ocorre porque a enzima amônia mono-
oxigenase é dependente do composto NH3, menos disponível em pH baixo (SUZUKI et al.,
1974; DE BOER; KOWALCHUK, 2001).
A temperatura também atua como fator regulador dos processos do ciclo do N, uma
vez que influencia diretamente as taxas metabólicas dos micro-organismos. Ela influencia a
taxa de crescimento, bem como as reações de oxidação e redução realizados pela bactéria para
obter energia ou biomassa. A mineralização de matéria orgânica (KARHU et al., 2010),

27
nitrificação (LIU et al., 2015) e desnitrificação (BRAKER et al., 2010), bem como a
anammox, são exemplos de processos do N realizados por bactérias sensíveis a alterações de
temperatura do ambiente. Mudanças de temperatura, como previstas pelo aquecimento
global, podem causar significativas alterações na comunidade microbiana dos solos
(PETTERSSON; BAATH, 2003).
Além dos fatores citados acima, a disponibilidade de matéria orgânica, assim como
sua qualidade atrelada a composição química, tem papel regulador no ciclo do N, uma vez que
a matéria orgânica fornece substratos nitrogenados como NH4+ e NO3
-, principalmente
(BOOTH et al., 2005). Essa regulação pode ser direta, como na mineralização de MOS, que
depende do conteúdo de matéria orgânica como substrato, ou indireta como é o caso, por
exemplo, da nitrificação, que é fortemente dependente da mineralização de MOS, pela
produção de NH4+ (BOOTH et al., 2005).
Também ligado a questão de compostos orgânicos, temos a liberação de exsudatos
orgânicos pelas raízes da vegetação local. Esses exsudatos são ricos em C lábil e estimulam
processos microbianos, principalmente a mineralização de MOS (ZHU et al., 2014),
aumentando a disponibilidade de N nos solos (DIJKSTRA et al., 2013). As taxas de liberação
dos exsudatos variam com as espécies (LAMBERS et al., 2009), o que é bastante relevante
em áreas de grande biodiversidade vegetal, como florestas tropicais, gerando micro sítios de
acordo com as espécies, que regulam os processos do N de maneiras diferentes.
De maneira geral, um único fator regulador pode influenciar os micro-organismos no
solo, contudo, ao observarmos a natureza e sua complexidade em cada compartimento, como
o solo de um ecossistema, entendemos que é a interação entre os fatores reguladores, que
influencia a resposta dos processos microbianos, manifestada através da ciclagem do N, da
disponibilidade das formas lábeis de N e da produção de N2O, por exemplo (BROWN et al.,
2012).
2.4 ECOSSISTEMAS FLORESTAIS DE DIFERENTES LATITUDES
Florestas tropicais e boreais são dois biomas continentais de grande extensão no
planeta, representando, juntas, o maior reservatório continental de carbono (MALHI et al.,
1999). Na grande maioria das florestas tropicais, a produtividade primária não apresenta
limitação por N, uma vez que solos tropicais, especialmente de florestas de planície (baixa
altitude), são ricos em N (MATSON et al. 1999; HEDIN et al. 2009), o que estimula os
processos de ciclagem de N, incluindo mineralização de MOS, nitrificação e perdas via

28
lixiviação e emissões de gases, como o N2O. Isso indica que os ecossistemas de florestas
tropicais pristinas ou maduras apresentam um ciclo do N aberto (MARTINELLI et al., 1999).
Em contraste, os solos de florestas temperadas e boreais, são considerados pobres em N,
apresentando menores taxas de processos de ciclagem e perdas desse nutriente
(MARTINELLI et al., 1999; HEDIN et al. 2009). Nos tópicos seguintes, descrevemos em
mais detalhes esses ecossistemas.
2.4.1 Floresta tropical
Florestas tropicais, como Amazônia e Mata Atlântica, têm um papel crucial na questão
da conservação da biodiversidade de fauna e flora (SOS MATA ATLÂNTICA/INPE 2015), e
participam do controle climático global, sendo grandes estocadoras de C (GIBBS et al., 2007).
Essas áreas apresentam estudos relacionados a dinâmica do N, seus processos
biogeoquímicos e a emissão de N2O por solos (MADDOCK et al., 2001; WICK et al., 2005;
DAVIDSON et al., 2007; AMAZONAS et al., 2011; SOUSA NETO et al., 2011; DO
CARMO et al., 2012; FIGUEIREDO, 2012; TÔSTO, 2014; RODRIGUES; DE MELLO,
2012; LIENGAARD et al., 2014; dentre outros), devido a rápida ciclagem de nutrientes em
função de suas características básicas, como altos índices de precipitação e altas temperaturas.
Entretanto, em termos de área ocupada por florestas tropicais no Brasil, levando em conta sua
diversidade, vemos que estudos acerca de temas que envolvem o N ainda são poucos, tendo
menor enfoque em questões como balanço do N nos solos, e suas principais vias de ciclagem
e disponibilização de N para os organismos.
Além disso, uma prática ainda muito frequente em áreas de floresta tropical,
principalmente na região Amazônica, é o desmatamento florestal para mudança de uso do
solo. Essa prática é responsável por profundas alterações das características do solo, bem
como dos processos biogeoquímicos (AIDE et al., 2000; KIRBY et al. 2006; BARONA et al.,
2010).
2.4.1.1 Floresta de Mata Atlântica
Considerada um hot spot de biodiversidade (MYERS et al., 2000), a Floresta de Mata
Atlântica sofreu intenso desmatamento desde o descobrimento do Brasil, com apenas 12,5 %
remanescentes de floresta nativa nos dias atuais (SOS MATA ATLÂNTICA/INPE 2015). Ela
está localizada em quase todo o litoral brasileiro e também em áreas sem litoral Atlântico,
29
presente em 17 estados: Rio Grande do Sul, Santa Catarina, Paraná, São Paulo, Goiás, Mato
Grosso do Sul, Rio de Janeiro, Minas Gerais, Espírito Santo, Bahia, Alagoas,
Sergipe, Paraíba, Pernambuco, Rio Grande do Norte, Ceará e Piauí.
Devido a sua larga extensão no litoral Atlântico, o clima da Mata Atlântica, segundo
Köopen, varia desde equatorial ao norte do Brasil, à subtropical no sul do país, alterando de
22 °C e precipitação anual média de 2100 mm (SOS MATA ATLÂNTICA/INPE 2015).
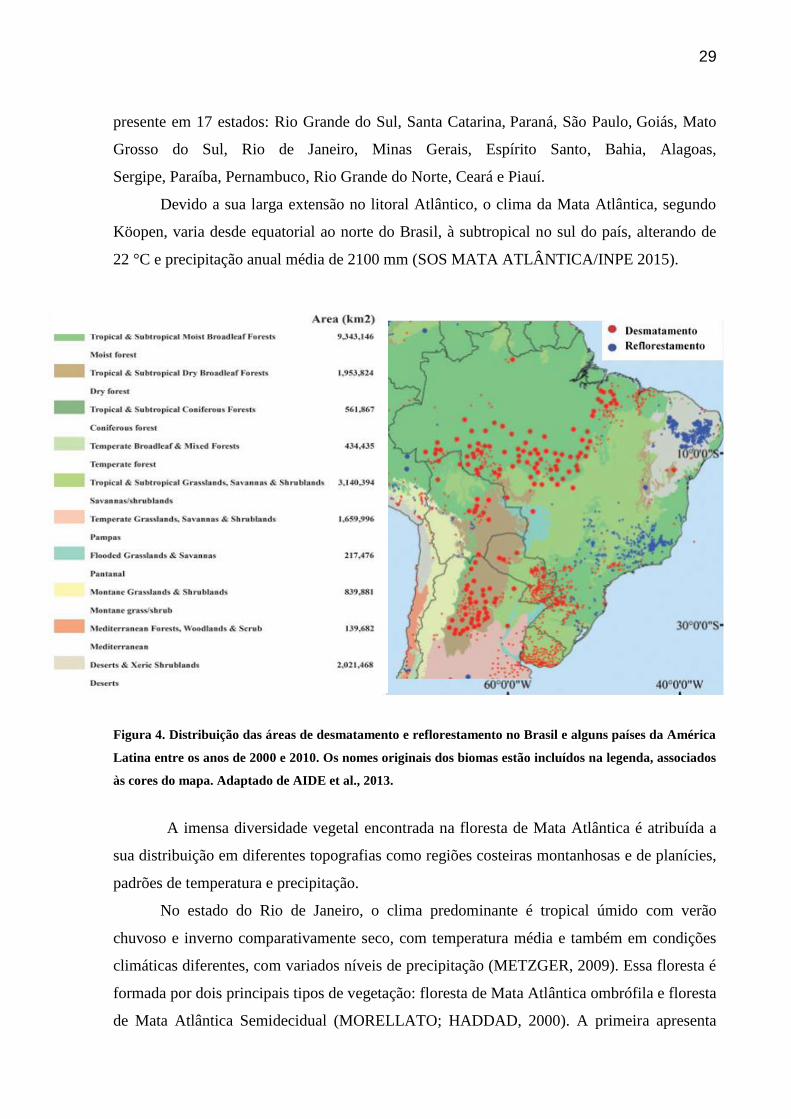
Figura 4. Distribuição das áreas de desmatamento e reflorestamento no Brasil e alguns países da América
Latina entre os anos de 2000 e 2010. Os nomes originais dos biomas estão incluídos na legenda, associados
às cores do mapa. Adaptado de AIDE et al., 2013.
A imensa diversidade vegetal encontrada na floresta de Mata Atlântica é atribuída a
sua distribuição em diferentes topografias como regiões costeiras montanhosas e de planícies,
padrões de temperatura e precipitação.
No estado do Rio de Janeiro, o clima predominante é tropical úmido com verão
chuvoso e inverno comparativamente seco, com temperatura média e também em condições
climáticas diferentes, com variados níveis de precipitação (METZGER, 2009). Essa floresta é
formada por dois principais tipos de vegetação: floresta de Mata Atlântica ombrófila e floresta
de Mata Atlântica Semidecidual (MORELLATO; HADDAD, 2000). A primeira apresenta

30
árvores maduras de até 15 m, com algumas espécies podendo chegar a 40 m, tem uma copa
bastante densa e fechada, com intensa presença de bromélias, orquídeas, cactos e samambaias.
A floresta ombrófila estende-se do Ceará ao Rio Grande do Sul, localizada principalmente nas
encostas da Serra do Mar, da Serra Geral e em ilhas situadas no litoral entre os Estados do
Paraná e do Rio de Janeiro, com clima quente e úmido na maior parte do ano. O segundo tipo
dominante apresenta árvores de 25 m a 30 m, com a presença de espécies que perdem suas as
folhas na estação do inverno, epífitas, samambaias e cipós. Ocorrem a oeste das Florestas
Ombrófilas da encosta atlântica, apresentando clima quente com seca mais pronunciada entre
os meses de abril a setembro (MORELLATO; HADDAD, 2000).
Devido ao intenso desmatamento, diversas áreas de proteção florestal surgiram nos
últimos 150 anos, buscando manter intacto o restante de floresta nativa e aumentar a área de
floresta de Mata Atlântica através da restauração (JOLY et al., 2010). Através da Figura 4,
verificamos que no período de 2000 a 2010, houve um predomínio de áreas de restauração em
regiões de Mata Atlântica e Caatinga, já desmatadas a muitas décadas, e áreas desmatadas
principalmente na região Amazônica. Questões ecológicas e biogeoquímicas relacionadas ao
N em áreas de restauração de floresta de Mata Atlântica após mudanças de uso do solo, ainda
são pouco compreendidas. Contudo, considerando sua imensa biodiversidade, influência
hidrológica e nos ciclos do C e N ligados a emissões de gases de efeito estufa, é
imprescindível o entendimento dessas questões para o melhor manejo da área em processo de
restauração (AIDE et al., 2000).
2.4.1.2 Floresta Amazônica
A floresta amazônica é a maior floresta tropical do mundo, com uma área de
aproximadamente 7.584.421 km2, incluindo países como Brasil, Bolívia Colômbia, Equador,
Peru, Venezuela, Suriname, Guiana e Guiana Francesa. Dentre eles, o Brasil é o país com
maior área de floresta amazônica, aproximadamente 5.033.072 km2, abrangendo os Estados
do Pará, Amazonas, Maranhão, Goiás, Mato Grosso, Acre, Amapá, Rondônia e Roraima.
O clima da região amazônica é equatorial quente e úmido, com pouca variação de
temperatura em grande parte da região, exceto na Amazônia meridional (Rondônia), devido
aos altos valores de radiação solar incidente ao longo do ano. As temperaturas médias anuais
oscilam entre 24 °C e 26 °C, com amplitude anual de 1° a 2 °C, enquanto que na Amazônia
meridional essa amplitude pode atingir 3° a 4 °C. A precipitação média anual da região varia
entre 1500 mm e 3600 mm. A Zona de Convergência Intertropical, um dos mais importantes

31
sistemas meteorológicos que atuam nos trópicos, em combinação com ventos alísios,
penetração de sistemas meteorológicos oriundos do sul do continente Sul Americano, e com o
vapor gerado pela floresta Amazônica, atuam na regulação do sistema de chuvas da região
amazônica, controlando seu regime hidrológico com variação do nível d’água de seus rios,
como visto na Figura 5 (NOBRE et al., 2009).
Figura 5. Precipitação mensal (a) e flutuação do nível de água (b) no rio Madeira em Porto Velho, rio
Amazonas em Manaus, e rio Negro em Barcelos, correspondendo às regiões sul, central e norte da bacia
Amazônica. (Retirado de Junk 1984b apud Junk, 1997).
A floresta amazônica é influenciada por pulsos de inundação com período de cheia,
vazante, seca e enchente, durante o ciclo de um ano (MELACK; HESS, 2010), como visto na
Figura 5. Essa variação do nível da água é responsável pela formação de diferentes tipos de
floresta como, por exemplo, a floresta de terra firme, que compõe a grande maioria da área de
floresta amazônica, é uma área de floresta localizada em regiões mais elevadas, que
permanecem o ano inteiro sem sofrer inundação, sendo composta por árvores de grande porte
(entre 30 e 60 m de altura), e muitas vezes com regiões de cerrado associadas. Em áreas de
menor altitude encontramos a floresta de várzea, que sofre inundação periódica durante o
período de águas altas, apresentando, muitas vezes, vegetação com adaptações morfológicas e
fisiológicas para lidar com o alagamento temporário. Já as florestas de igapó estão situadas
em terrenos baixos, permanentemente inundadas (JUNK; PIEDADE, 2010).
Essa variedade de habitats durante os períodos de inundação, associada aos diferentes
tipos de água dos rios (branca, clara e preta) que têm características específicas, criam um

32
cenário ideal de alta diversidade de fauna e flora na região amazônica (JUNK, 1997). Isso
também é refletido na ciclagem de N quando vemos, por exemplo, diferentes taxas de
mineralização e nitrificação associada à determinadas espécies de árvores e/ou tipos de solo
(DIJKSTRA et al., 2006).
2.4.2 Floresta Boreal
Os ecossistemas boreais ocupam aproximadamente 22 % de toda a área de floresta do
mundo e 11 % de toda a superfície terrestre, localizados exclusivamente no hemisfério Norte
entre as latitudes 45° e 70°. Os países que apresentam floresta boreal em sua vegetação são
Estados Unidos, Canadá e sul da Groenlândia; Sudeste da Noruega, Suécia, Finlândia,
Estônia, Letônia, parte da Lituânia e Bielorrússia; norte da Rússia e Japão (NILSSON;
WARDLE, 2005).
A diversidade de espécies em áreas de floresta boreal é baixa, principalmente quando
comparada com florestas tropicais. Essa floresta é dominada por poucas espécies de coníferas,
como a Norway spruce (Picea abies), em solos úmidos, e a Scots pine (Pinus sylvestris), em
solos mais secos, e outros tipos de vegetação como ciprestes, abetos e lariços (NILSSON;
WARDLE, 2005), além de turfas e musgos em áreas alagadas ou com alto conteúdo de água
no solo (TAGUE et al., 2010). A estação de crescimento da vegetação de floresta boreal é
curta, devido a baixa temperatura e irradiação solar, o que diminui as taxas de produtividade
primária (MALHI et al., 1999). Além disso, a baixa temperatura ao longo do ano também
influencia os processos microbianos no solo, como visto no tópico 2.3, reduzindo, por
exemplo, as taxas de decomposição de matéria orgânica que resulta no acúmulo de compostos
orgânicos complexos em solos mais profundos (KASISCHKE; STOCKS, 2000). Isso faz com
que regiões boreais tenham um dos maiores estoques de C terrestre do mundo, mas, devido a
baixa taxa de mineralização de MOS, há baixa disponibilidade de N, tornando-o limitante
(HARTLEY et al., 2010). Em paralelo, os valores de imobilização de N são comparáveis às
taxas de mineralização, sendo esse o principal destino do N em solos limitados (BLASKO et
al., 2013).
Uma prática antiga e bastante comum na região do norte da Escandinávia é o corte de
árvores para obtenção de madeira, com posterior replantio ou sucessão secundária natural.
Essa mudança da cobertura vegetal age diretamente na ciclagem do N, estimulando a
mineralização e diminuindo a absorção do mesmo pela ausência de plantas e serrapilheira, o
que resulta na perda de N para corpos aquáticos adjacentes e emissão de gases de N
(GUNDERSEN et al., 2006; RUCKSTUHL et al., 2008). Além disso, a zona boreal tem um

33
histórico bastante antigo de ocupação humana, desmatamentos e exploração de madeira. Na
Suécia, por exemplo, 96 % das florestas boreais nativas sofreram algum tipo de intervenção
nos últimos 200 anos (IPCC, 2013), o que mostra a importância da preservação da vegetação
boreal e do monitoramento de parâmetros e processos biogeoquímicos que auxiliam o
entendimento da dinâmica e sustentabilidade das florestas, bem como na análise de cenários
futuros de mudança climática, em que as previsões para a disponibilidade de N para plantas
em áreas boreais são críticas (SIGURDSSON et al., 2013; YUAN; CHEN, 2015).
2.5 DESMATAMENTO E MANEJO
Uma questão cada vez mais atual e que necessita de uma maior atenção dos cientistas
é a ciclagem de nutrientes em áreas de recuperação florestal que sofreram algum tipo de
mudança de uso do solo. Como vimos nos tópicos anteriores, os processos de ciclagem do N
são sensíveis a diversos fatores ambientais característicos de cada ecossistema, e alterações
naturais ou mais severa, como as de origem antrópica, podem causar efeitos drásticos nas
características pristinas do ambiente e na ciclagem do N (ROBERTSON; TIEDJE, 1988;
KELLER; REINERS, 1994). Isso é visto através da retirada da vegetação arbórea, que
contribui para o aquecimento e compactação do solo e, consequentemente, alteração da sua
oxigenação (YAN et al. 2011; HARTMANN; NIKLAUS, 2012). Além disso, há diminuição
do estoque de N devido a erosão do solo (LAL 2004). Dessa forma, ações de reflorestamento
em locais desmatados podem auxiliar no aumento do estoque de N no solo (LAL 2005), e na
diminuição de perdas por lixiviação e emissão de gases de N.
Um exemplo de mudanças do uso do solo é o desmatamento para introdução de áreas
agrícolas ou de pecuária, que por improdutividade, são abandonadas (KELLER; REINERS,
1994), ou até desapropriadas para a construção de áreas de preservação ou floresta secundária
que surgem de maneira espontânea. As áreas de proteção ambiental visam preservar o que
ainda resta e reestabelecer a vegetação nativa, buscando recuperar as características anteriores
do ecossistema, macro e microbiológicas (GANDOLFI; RODRIGUES, 2007). Entretanto, não
se tem um amplo conhecimento do manejo de áreas de restauração (MORELLATO;
HADDAD, 2000), tão pouco da ciclagem do N, o que faz com que essas áreas, assim como de
florestas secundárias em fase inicial de reestabelecimento, necessitem de avaliações e
monitoramentos para que seja alcançada a sustentabilidade do ecossistema (DAMASCENO
2012), avaliando os danos causados pelo desmatamento associado à mudança de uso do solo.
34
Dessa forma, podemos notar que muitas lacunas ainda restam sobre o que regula a
ciclagem de N e a produção e emissão de N2O (BUTTERBACH-BAHL et al. 2013) em
ecossistemas potencialmente emissores, como florestas tropicais e florestas boreais, visto que
elas apresentam diferentes características, aportes e ciclagem de N. Em um contexto de
discussão científica mundial sobre aquecimento global e demanda de alimentos para a
população mundial, se torna extremamente necessário um melhor entendimento sobre essas
florestas (AUSTIN et al., 2013), pois elas ocupam uma grande área terrestre, que para muitos
pode ser ocupada por áreas cultiváveis.
Diante disso, as três florestas avaliadas nesse estudo, floresta de Mata Atlântica,
Amazônica e boreal são extremamente representativas em suas respectivas latitudes, o que
torna esse estudo relevante para questões como: manutenção do N em solos, quais os fatores
que estão regulando os processos do ciclo do N, qual a contribuição desses solos para as
emissões de N2O, e possíveis interferências do aquecimento global. Essas questões são muito
importantes para estudos em solos pristinos, mas também são extremamente relevantes em
solos em recuperação, para qual surgem outras perguntas como: de que maneira os fatores
reguladores são alterados após a mudança do uso do solo; quanto tempo uma floresta
necessita para se regenerar; o que podemos mudar no processo de restauração para acelerá-lo,
minimizando erros, dentre outras.
2.6 OBJETIVO GERAL
O objetivo geral da presente tese foi avaliar semelhanças e diferenças na ciclagem do
N em solos de florestas de diferentes latitudes, tropicais e boreais, a partir do estudo dos
processos de disponibilização de N, como a mineralização e nitrificação, da avaliação da
relação de tais processos com a limitação e perda de N, e seus controles ambientais.
2.6.1 Objetivos específicos
Avaliar as diferenças e semelhanças da ciclagem do N, através de medidas de taxas de
mineralização e nitrificação brutas, em solos de floresta tropical e boreal.
Identificar diferenças na magnitude dos processes biogeoquímicos do N e nos fatores
reguladores do ciclo do N e da emissão de N2O em floresta tropical de Mata Atlântica
pristina e floresta com 10 anos de restauração.

35
Avaliar os processos biogeoquímicos do N responsáveis pela produção de N
inorgânico em uma floresta tropical pristina e em três florestas em cronosequência,
após mudança de uso do solo, na Amazônia, compreendendo quais fatores
controladores são alterados durante o crescimento da floresta secundária.
Compreender a regulação dos processos do N em solos de florestas boreais limitados
por N, sob diferentes níveis de influência da água no solo.
Estimar a contribuição de processos biogeoquímicos do ciclo do N (produção e
redução de NO3-) na produção de N2O em solos de floresta boreal.
2.7 HIPÓTESES
1) As taxas de mineralização e nitrificação são mais elevadas em solos de florestas
pristinas tropicais do que boreais.
2) O conteúdo de matéria orgânica lábil e o pH do solo são os principais fatores
reguladores do processo de mineralização e nitrificação, respectivamente, em solos
boreais.
3) Florestas em processo de restauração recente apresentam ciclo do N fechado, com
altas taxas de mineralização e baixas taxas de nitrificação.
4) Florestas tropicais em restauração emitem menos N2O que florestas pristinas.

36
A
3 METODOLOGIAS APLICADAS
Diferentes metodologias foram usadas nos capítulos 4, 5 e 6, que correspondem a três
diferentes áreas de estudo. A seguir serão apresentadas em mais detalhes as metodologias
usadas em cada capítulo.
3.1 EXPERIMENTO DE 15N IN SITU
O mesmo experimento metodológico com 15N foi utilizando em ambos os capítulos 4
e 5, realizados na área de amostragem da Mata Atlântica e Amazônia. Esse experimento visa
avaliar as taxas brutas de transformações de N como mineralização de N, consumo de NH4+,
nitrificação e consumo de NO3- em solos. Em cada uma das áreas de estudo selecionadas, três
subáreas foram escolhidas aleatoriamente dentro de um quadrado de 50 m x 30 m (Figura 6).
Cada subárea contém dois transectos distantes 1 m entre si, cada um com dois locais de
marcação distantes 0,3 m entre si.
Figure 6. A – Esquema do experimento de 15N in situ em cada área de estudo com três subáreas, cada uma
contendo dois transectos com dois locais de marcação. Cada transecto recebe uma espécie de 15N (15NH4+ e
15NO3-), e são distantes entre si 1 m. Os locais de marcação no mesmo transecto são separados 0,3 m entre
si. B – Esquema de cada local de marcação com 11 15N injeções de solução. Após a marcação, a amostra de
solo é retirada do círculo preto no tempo 0, imediatamente após a adição da solução, e no tempo 24, 24
horas após a adição da solução.
Em cada transecto foi aplicada uma solução contendo NH4NO3, um recebeu 15N-NH4+
e outro recebeu 15N-NO3- (Figura 6A) ambas enriquecidas com 15N 99 %, de acordo com a
metodologia chamada “virtual soil core” (Rütting et al., 2011). Essas soluções foram
7 cm
B

37
aplicadas homogeneamente em cada local de marcação, que corresponde a um círculo de 7 cm
de diâmetro. A solução foi distribuída através de 11 injeções de 1 mL dentro do solo, usando
uma seringa de 1 mL e uma agulha de 10 cm de comprimento (Figura 6B). Um dos pares dos
locais de marcação com solo já marcado foi retirado imediatamente após a adição da solução
de 15N (t0) e o outro foi retirado após 24 horas (t24). Um testemunho de solo de 4 cm de
diâmetro e 10 cm de altura foi retirado para análises do solo.
A amostra de solo intacto, logo após sua remoção, foi, no laboratório de campo,
peneirada para remoção de pedras, folhas e raízes grandes com a utilização de pinças. Após o
peneiramento, 50 gramas da amostra foram transferidos para frascos plásticos de 200 mL,
recebendo então 100 mL de KCl 1M e permanecendo por 1 hora sob agitação constante. Após
a agitação, a amostra descansou por 30 min para deposição do solo no fundo do frasco, e foi
então filtrada com filtro de papel MN 615 (Macherey-Nagel), gerando um extrato final.
A análise da abundância de 15N da NH4+ foi realizada utilizando a técnica de micro
difusão (BROOKS et al., 1989), na qual o extrato recebe 0,5 g de óxido de magnésio, fazendo
com que a NH4+ seja volatilizada e fixada em filtros de fibra de vidro acidificados com 10 µL
de H2SO4 2M. Os filtros foram analisados no analisador elementar (ANCA-GSL, PDZ
Europa, UK) acoplado ao Espectrômetro de Massas de Razão Isotópica (IRMS; 20-20, Sercon
Ltd., Cheshire, UK). Tal análise isotópica foi conduzida no Stable Isotope Facility na
Universidade da Califórnia, Davis (EUA).
Para análise da abundância de 15N do NO3-, o NO3
- foi avaliado usando o método de
medição automática SPIN acoplado a um quadrupolo comum do Espectrômetro de Massas
(GAM 400, InProcess Instruments GmbH, Bremen, Germany), chamado Sample Preparation
of Inorganic N compounds Mass Spectrometry (SPINMAS; STANGE et al., 2007).
O solo restante foi seco em estufa a 100 ºC para avaliação do conteúdo gravimétrico
de água e a densidade do solo foi medida seguindo EMBRAPA (1997). O conteúdo de
matéria orgânica foi medido por perda de massa por ignição, as concentrações de NH4+ and
NO3- nos extratos de KCl foram medidas no analisador por injeção de fluxo (FIAstar 5000,
Foss Tecator AB, Brazil), e a granulometria dos solos foi determinada usando granulômetro a
laser (Malvern Mastersizer 2000, Malvern Instruments SA, Orsay cedex, France). Todas as
análises acima foram feitas no Laboratório de Biogeoquímica, na Universidade Federal do
Rio de Janeiro (Brasil).
O pH do solo foi medido em solução de KCl (100 g de KCl 1M : 50 g de solo) com
pHmetro (pH-1500 Instrutherm, SP, Brazil). O total de C e N (TC e TN) foram medido no

38
Espectrômetro de Massas de Razão Isotópica (IRMS; 20-20, Sercon Ltd., Cheshire, UK) na
Universidade de Gotemburgo Suécia).
As taxas de mineralização bruta, e também nitrificação, podem ser calculadas através
do cálculo de KIRKHAM AND BARTHOLOMEW, (1954), usando valores de nitrogênio
isotópico, como 15NH4+ para mineralização bruta e 15NO3
- para nitrificação bruta onde N0 e Nt
são o teor de NH4+ ou NO3
- no tempo zero e t, respectivamente, e t é o tempo em dias. As a'0 e
a't são o excesso de 15N frações de NH4+ ou NO3
- no tempo zero e t, respectivamente. As taxas
brutas médias podem ser apresentadas em peso seco do solo (em inglês = soil dry weight,
SDW).
, (2)
3.2 AVALIAÇÃO DO FLUXO DE N2O
No capítulo 4, foi realizada a avaliação da emissão de N2O na interface solo-
atmosfera, medida manualmente através de câmaras estáticas de solo opacas de PVC (20 cm x
18 cm, diâmetro e altura). Em cada área de amostragem, cinco subáreas foram escolhidas
próximas as três subáreas de marcação com 15N (Figura 6A), dentro do quadrado de 50 m x
30 m pré-selecionado. Em cada uma das 5 subáreas, um arco de câmara estática de solo foi
colocado sem a tampa, e afundado 2,5 cm dentro do solo, objetivando minimizar distúrbios no
solo (DAVIDSON et al., 2002). Tais arcos foram fixados dois dias antes de iniciar a coleta
para estabilizar a comunidade de solo entorno. Durante quatro dias, no período da manhã, a
tampa da câmara foi colocada, e amostras de gás foram retiradas do interior da câmara uma
vez ao dia durante 40 minutos, a cada 10 minutos (0, 10, 20, 30 e 40 min). Através de um tubo
acoplado a uma válvula three-way localizados na tampa da câmara, a amostra era retirada com
o auxílio de uma seringa de polipropileno de 60 mL também acoplada a uma válvula three-
way, que permite o armazenamento do gás no interior da seringa, sem vazamentos. Após
coletadas, as amostras eram conduzidas para o laboratório de campo e analisadas no
equipamento analisador de N2O/CO por espectroscopia a laser (model 908-0014, Los Gatos
Research, Mountain View, CA, USA).
Os resultados foram calculados a partir de respostas de detectores a padrões de 0,35 e
1,01 ppm de N2O. Os fluxos foram calculados a partir do aumento linear da concentração do
gás dentro da câmara ao longo do tempo. A linearidade foi confirmada no início do

39
experimento através da medida de concentração do gás em 0, 5, 10, 20, 40, 60 e 80 minutos
após o fechamento da câmara.
3.3 EXPERIMENTO DE 15N EM LABORATÓRIO
A metodologia apresentada abaixo foi utilizada no capítulo 6, onde foi realizada uma
campanha em duas florestas no norte da Suécia e, em cada floresta, foram realizadas seis
coletas de solo na zona ripária, ao redor de um lago, e seis coletas de solo na zona montana.
Cada amostra de solo foi retirada dos 10 primeiros centímetros do solo, amostrando a porção
mineral após remover cuidadosamente a camada orgânica. As amostras foram retiradas com
uma pá a partir de uma área de 10 cm x 10 cm.
Após amostragem, o solo foi peneirado para retirada de pedras, raízes e folhas
grandes, e estocada a 4 ºC por quatro dias até serem feitas as análises. Com as amostras de
solo peneiradas, cada uma delas foi dividida em seis subamostras de 100 g cada, e colocadas
em frascos de vidro. Essas seis subamostras foram separadas em três tratamentos com 15N, no
qual o solo recebeu uma das soluções de 15NH4NO3, NH415NO3 ou 15NH4
15NO3 enriquecido
com 15N.
As duas subamostras de cada tratamento receberam 50 mL da respectiva solução de
15N que continha 5 µg NH4+-N ml-1 and 0.4 µg NO3
--N ml-1. Uma das subamostras (t0)
recebeu, imediatamente a seguir, 100 mL de KCl 2M, e foi colocada no shaker por 1 hora e
subsequentemente filtrada com filtro de microfibra de vidro Whatman GF/D (12,5 cm). A
outra subamostra permaneceu incubada em temperatura ambiente por 23 horas, quando foi
vedada para retirada de amostra de gás e posterior análise de N2O, logo após a vedação e 1
horas depois. As amostras de gás foram retiradas utilizando uma seringa de vidro e estocadas
em exetainers evacuados Labco® Exetainers (Lampeter, Wales, UK). Após a retirada da
segunda amostra de gás, 100 mL de KCl 2 M foram adicionados ao solo (t24), como descrito
anteriormente.
O fluxo de N2O foi calculado a partir do aumento da concentração do gás no interior
do frasco durante o período de incubação de 1 hora.
As concentrações de NH4+ e NO3
- nos extratos de KCl foram medidas no analisador
por injeção de fluxo (FIAstar 5000, Foss Tecator AB, Höganäs, Sweden). Análises de C e N
totais foram feitas no analisador elementar (ANCA-GSL, PDZ Europa, UK) acoplado ao
Espectrômetro de Massas de Razão Isotópica (IRMS; 20-20, Sercon Ltd., Cheshire, UK). Para
as análises de 15N, o NO3- contido nos extratos foi convertido a N2O (Stevens & Laughlin,
40
1994) e então analisados na unidade de preparação de gás traço (ANCA-TGII, PDZ Europa,
Crewe, UK) acoplado ao Espectrômetro de Massas de Razão Isotópica (IRMS; 20-20, Sercon
Ltd., Cheshire, UK). A análise da abundância de 15N da NH4+ é realizada utilizando a técnica
de micro difusão (BROOKS et al., 1989), na qual o extrato recebe 0,5 g de óxido de
magnésio, fazendo com que a NH4+ seja volatilizada e fixada em filtros de fibra de vidro
acidificados com 10 µL de H2SO4 2M. Os filtros são analisados usando um analisador
elementar (ANCA-GSL, PDZ Europa, UK) acoplado ao Espectrômetro de Massas de Razão
Isotópica (IRMS; 20-20, Sercon Ltd., Cheshire, UK). As amostras de gás foram analisadas
para N2O enriquecido com 15N analisados na unidade de preparação de gás traço (ANCA-
TGII, PDZ Europa, Crewe, UK) acoplado ao Espectrômetro de Massas de Razão Isotópica
(IRMS; 20-20, Sercon Ltd., Cheshire, UK). As análises de amostras isotópicas foram
realizadas no Stable Isotope Facility at the University of California, Davis, CA (EUA).

41
4 EFFECTS OF RESTORATION FOREST ON SHORT-TERM NITROGEN
TRANSFORMATIONS AND N2O FLUX IN TROPICAL ATLANTIC FOREST
ABSTRACT
We evaluated gross N processes (mineralization, nitrification, NH4+ and NO3
- consumption),
using 15N pool dilution, and N2O emissions in a pristine Atlantic forest and a 10 year old
restored Atlantic forest. Gross mineralization and NH4+ consumption were higher in pristine
(6.3 and 8.2 µg N g-1 SDW d-1, respectively) than in restored forest (3.2 and 4.0 µg N g-1
SDW d-1, respectively), while gross nitrification and NO3- consumption had the opposite
tendency, being close to zero in pristine soil, and 0.6 and 0.7 µg N g-1 SDW d-1, respectively,
in restored soil. These unexpected findings were associated to the recent disturbance in
restored forest, which depleted the soil in SOM and TN, but was also associated to the
previous rainfall, responsible to leach inorganic N. The N2O emission was higher in restored
forest, positively correlated to high soil temperature, which stimulate the metabolism of
microbial community, and the nitrification process that produce nitrification and provide
substrate for N2O production. Our findings suggest N limitation or a stabilization of the
restored system due to the similarity between restored and pristine forest. Moreover, both
forests, but mainly pristine, seems to be N limited with a very low nitrification rate in
comparison with mineralization. It shows the importance of biogeochemical studies in a long-
term scale in restored areas, to evaluate the re-establishment of the ecosystem.
4.1 INTRODUCTION
The Atlantic forest is one of the most important and unique tropical biome in the
world, considered a biodiversity hotspot of plants and animals, with high level of endemism
(MYERS et al., 2000; SILVA; CASTELETI, 2003). In Brazil, this biome covers the east coast
from 04° to 32°S, originally covering around 150 million hectares (RIBEIRO et al., 2009).
However, due to the intense deforestation in Brazil for agriculture (sugar cane, coffee, and
soya bean) and pasture, mainly for production of export articles, the Atlantic forest became
one of the most endangered biomes (TABARELLI et al., 2005). As a result, very little
remains of this biome, estimated around 12.5 % of the original vegetation distributed in
fragments above 3 hectares (SOS MATA ATLÂNTICA/INPE 2015).
42
The restoration forest is a recent practice in Brazil in terms of scientific attention and
government support (RODRIGUES et al., 2009). The number of ecological reserves has
increased the last 150 years to preserve, monitor and understand the remaining Atlantic forest,
but to replace devastated areas as well (LAMB et al., 2005; JOLY et al., 2010; CALMON et
al., 2011). One of the challenges for this biome is to increase the forested area, after intense
disturbance, through regrowth forest or plantation, and maintaining the original composition
and characteristics (JOLY et al., 2014).
The soil compartment is a very relevant part of the ecosystem involved in restructuring
and recovery vegetation (CHAZDON 2003), especially soils under land-use management
(AIDE et al., 2000). As pointed out by MORAN et al. (2000), the soil fertility is a key
parameter to evaluate the status of restoration forest, mainly under influence of land-use. The
availability of compounds such as carbon (C) and nitrogen (N) in soils is essential in the
forest restoration process (PAUL et al., 2010).
The N cycling shows different pathways in soils, which is mainly governed by
microbial community, vegetation and soil properties (TEMPLER et al., 2008). Gross N
mineralization and nitrification are considered key processes in the soil N cycle, as these
processes supply plants and microorganisms with labile N as ammonium (NH4+) and nitrate
(NO3-), while also controlling the inorganic N losses through for example volatilization of
NH3 to the atmosphere and NO3- leaching to groundwater and aquatic bodies
(BUTTERBACH-BAHL et al., 2011).
Gross nitrification can also lead to N losses via nitrous oxide (N2O) emission, either as
by-product of the nitrification process or produced by denitrification, which is an anaerobic
reduction of NO3- to N2 (PEREZ et al., 2006; FARQUHARSON; BALDOCK, 2008). The
N2O is known as a powerful greenhouse gas and ozone destroyer at stratosphere, with
constant increase in atmospheric concentration (IPCC 2013). Soils properties and climatic
factors (e.g. rainfall, temperature) are the main factors that control N2O production by
microbial processes in soils (SMITH et al., 1998; SKIBA; BALL, 2002; BUTTERBACH-
BAHL et al., 2013). As the strong differences between young restored forest soil and pristine
forest soil exist, the N2O emission will probably be affected by them, as well as the N
transformations. Therefore, it is important to evaluate the N cycle in both pristine and restored
soil to understand the recovery process in the latter one (WEN et al., 2016).
Based on that, some questions become important about Atlantic forest and restored
practice in terms of N cycling: How does reforestation influence the N cycling in tropical
Atlantic soils? What controls the gross N transformations and N2O emissions in these soils?

43
Does the control differ between the pristine and restored forests, after 10 years of restoration?
As studies about N dynamics in soils of tropical forests are scarce, especially in restored
forests, obtain explanations to these questions becomes relevant. We, therefore, investigated
the in situ gross N mineralization and nitrification and the inorganic N consumption in soils of
a pristine Atlantic forest and a 10 years old restored forest in Rio de Janeiro state, Brazil. We
hypothesized that in young restored forest, the gross N mineralization is higher compared to
pristine forest due to the ecosystem invest in plants biomass growth trought NH4+ release, but
that the gross nitrification and N2O emission are lower, to avoid losses of N, as seen in some
previous studies (DAVIDSON et al., 2007; AMAZONAS et al., 2011; MARTIN et al, 2013).
As our study area is in a tropical zone, the temperature and precipitation are probably the
major regulating factors of N transformations and N2O emissions.
4.2 MATERIAL AND METHODS
4.2.1 Study region
This research was carried out in the Ecological Reserve of Guapiaçú (REGUA;
42°43’23’’ W and 22°25’07’’ S) at Rio de Janeiro state, in southeastern Brazil (Figure 7), in
August 2013, during the dry season, which usually have a precipitation mean ± standard
deviation of 40 ± 50 mm, but during our sampling work, the precipitation mean was 101.1
mm. This reserve was created in 2001 to protect the Atlantic Forest and restoring damaged
habitats, representing one of the largest remnants of Atlantic forest in the state (60,000 ha),
with 2,558 ha of remnants undisturbed forests (ROCHA et al., 2006). The sampling area is
located within the Atlantic Forest biome, dominated by semi-deciduous seasonal forest and
ombrophilous dense forest (VELOSO et al., 1991). The climate in the region is mainly warm
and humid (Af type in Köppen) with mean annual temperature and rainfall of 22.4 °C and
2095 mm (www.cptec.inpe.br). The predominant soil type in the study area is red-yellow
latosol (EMBRAPA 2006).

44
REGUA
Figure 7. Map showing the Ecological Reserve of Guapiaçú (REGUA) localization in Rio de Janeiro state,
Brazil. The red circle represent the localization of REGUA. Adapted from DAMASCENO. (2012).
The ecological reserve studied here has several restored forest areas with different
dimensions owing to the many areas with grassland pasture activity until 2001. The seedlings
used for the restoration were mainly produced with the genetic material of the remaining
forests from the reserve, but some was bought in nurseries. Native species were planted and
distributed randomly among ecological groups of pioneers, early and late secondary and
climax, with a greater proportion of the first ecological group, trying to make a restored forest
as much similar as possible to the native forest (Nicholas Locke, the owner of REGUA,
personal communication).
4.2.2 Experimental design
4.2.2.1 15N experiment
To evaluate the gross N transformations as mineralization, NH4+ consumption,
nitrification and NO3- consumption in pristine and restored forest, each of the three plots had
two transects, distant 1 m between them, with two spots 0.3 m separated (Figure 6A).
In each transect a solution containing NH4NO3 was applied, one received 15N-NH4+
and the other one received 15N-NO3-, both enriched with 15N at 99 %, following the “virtual
soil core” approach (RÜTTING et al., 2011). These 15N solutions were applied
Damasceno (2008)

45
homogeneously in each spot in a circle of 7 cm diameter. The solutions were distributed with
eleven 1 mL injections of 15N solution into the soil using 1 mL syringe and 10 cm spinal
needle, totalizing 11 mL of 15N solution (Figure 6B). The total amount of N species that was
added corresponded to 1.25 µg N-NH4+ and 2.2 µg N-NO3
- per gram dry soil. One of the
paired labelling spots was sampled immediately after labelling (t0) and the other one was
sampled 24h (t24) after labelling. The soil cores of 4 cm diameter and 10 cm length were
taken out to the soil analyses, which guarantee that the soil sampled was labelled.
The intact soil samples were immediately gently broken by hand to remove stones,
leaves and large roots by tweezers at the field laboratory. After sieving, 50 grams of each soil
sample was added in a brown plastic bottle together with 100mL of 1M KCl, placed on a
shaker for 1 hour, and lastly filtered through MN 615 filter paper (Macherey-Nagel).
The analysis of 15N abundance of NH4+ was done using the micro-diffusion technique
(BROOKS et al., 1989), in which NH4+ is trapped in acidified glass fibre filters and analysed
using an elemental analyser (ANCA-GSL, PDZ Europa, UK) coupled to the IRMS cited
above. All isotope analyses were conducted at the Stable Isotope Facility at the University of
California, Davis. For analysis of 15N abundance, NO3- in extracts was measured using the
automatic measuring method SPIN unit to a common quadrupole Mass Spectrometer (GAM
400, InProcess Instruments GmbH, Bremen, Germany), called Sample Preparation of
Inorganic N compounds Mass Spectrometry (SPINMAS; STANGE et al., 2007).
The left soil was dried after sieving to measure gravimetric water content (GWC).
Bulk density was measured following EMBRAPA (1997). Soil organic matter content (SOM)
was measured by loss-on-ignition, the concentrations of NH4+ and NO3
- in KCl extracts were
measured on flow injection analyser (FIAstar 5000, Foss Tecator AB, Brazil), and the grain
size distribution of the soil samples was determined using a laser type granulometer (Malvern
Mastersizer 2000, Malvern Instruments SA, Orsay cedex, France). All these analyses were
done at University Federal of Rio de Janeiro (Brazil). The soil pH was measured in KCl
solution (100 g of KCl 1M : 50 g of soil) with pHmeter (pH-1500 Instrutherm, SP, Brazil).
The total C and N (TC and TN) was measured on Isotope Ratio Mass Spectrometer (IRMS;
20-20, Sercon Ltd., Cheshire, UK) at University of Gothenburg (Sweden). The physico-
chemical soil properties are showed in Table 1.
The gross N transformations rates were calculated following KIRKHAM;
BARTHOLOMEW (1954). We calculated the rates in 24 hours, using t0 and t24. Gross
nitrification and gross NO3- consumption found in pristine forest soil were very close to zero
and the uncertainties are overlapping with zero.

46
4.2.2.2 N2O flux measurement
To measure the N2O emission at the soil-atmosphere interface, manual static chambers
made of opaque PVC (20 cm x 18 cm; diameter and height, respectively) were used. In each
of the five spots mentioned before, one static chamber was placed 2.5 cm onto the soil aiming
to minimize soil disturbance (DAVIDSON et al., 2002). The chamber frames were placed
onto the soil two days before to a previous stabilization of the microbial community. During
four days, the samples were taken of the chamber headspace once a day at 5 times (0, 10, 20,
30 and 40 min) after chamber closure by connecting a polypropylene syringe of 60 mL to the
chamber sampling port fitted a three-way. The gas samples were analyzed in a laser
spectroscopy N2O/CO analyzer (model 908-0014, Los Gatos Research, Mountain View, CA,
USA). Results were calculated from detector responses to calibration mixture standards of
0.25 and 1.0 ppm N2O. Fluxes were calculated from the linear increase of gas concentrations
inside the chamber with time. The linearity was confirmed at the start of the experiment by
measuring concentrations of the gases at 0, 5, 10, 20, 40, 60 and 80 min after chamber
closure.
4.2.2.3 Statistical analyses
The Kolmogorov-Smirnov‘s test (P < 0.05) was used to examine the statistical
distribution of soil properties and N2O fluxes in both pristine and restored forests. A Student’s
T-test was carried out to examine the differences between pristine and restored forest in terms
of soil properties (soil pH, SOM, GWC, TC), gross N transformations (mineralization, NH4+
and NO3- consumptions and nitrification) and N2O fluxes. A Mann-Whitney’s test was used to
nonparametric soil properties, such as the amount of NH4+ NO3
-, TN and soil temperature
(soil T °C). Pearson correlations were done between gross N transformations and soil
properties, and N2O fluxes and soil properties. The nonparametric soil properties were
correlated using Spearman correlations between them and gross N transformations and N2O
fluxes. All statistical analyses were performed using the program GraphPad Prism 5.0
(GraphPad Software, Inc).
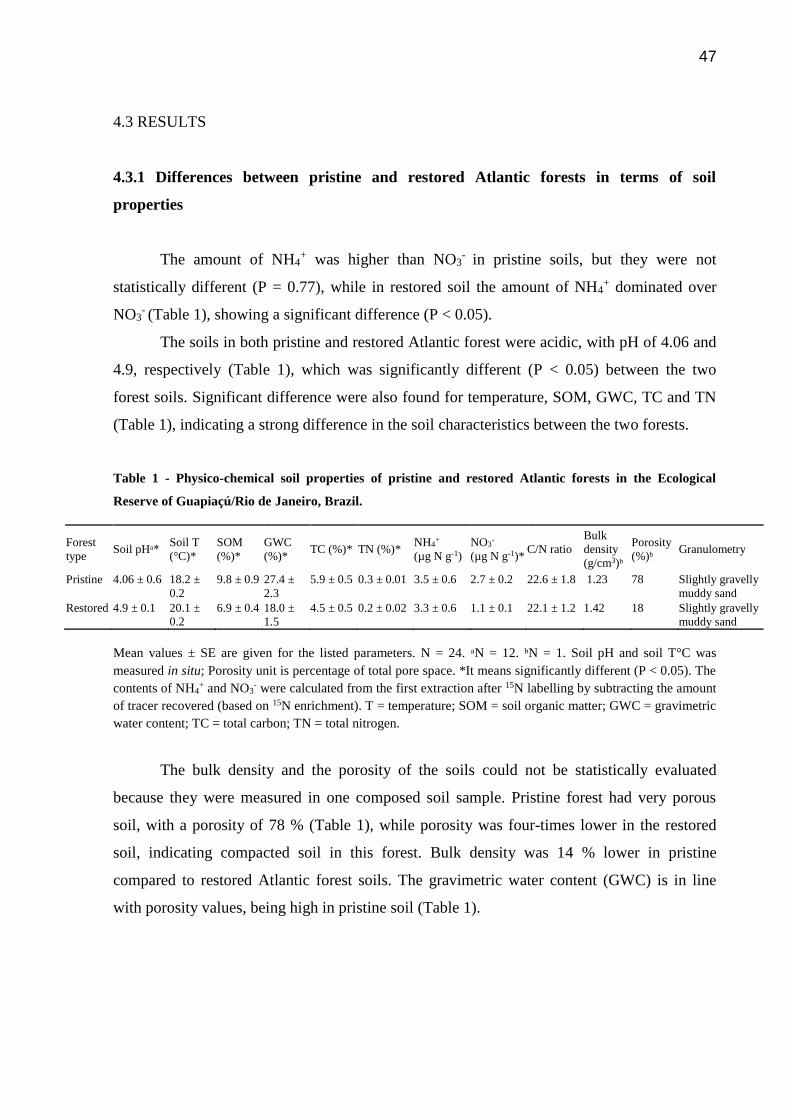
47
4.3 RESULTS
4.3.1 Differences between pristine and restored Atlantic forests in terms of soil
properties
The amount of NH4+ was higher than NO3
- in pristine soils, but they were not
statistically different (P = 0.77), while in restored soil the amount of NH4+ dominated over
NO3- (Table 1), showing a significant difference (P < 0.05).
The soils in both pristine and restored Atlantic forest were acidic, with pH of 4.06 and
4.9, respectively (Table 1), which was significantly different (P < 0.05) between the two
forest soils. Significant difference were also found for temperature, SOM, GWC, TC and TN
(Table 1), indicating a strong difference in the soil characteristics between the two forests.
Table 1 - Physico-chemical soil properties of pristine and restored Atlantic forests in the Ecological
Reserve of Guapiaçú/Rio de Janeiro, Brazil.
Mean values ± SE are given for the listed parameters. N = 24. ᵃN = 12. ᵇN = 1. Soil pH and soil T°C was
measured in situ; Porosity unit is percentage of total pore space. *It means significantly different (P < 0.05). The
contents of NH4+ and NO3
- were calculated from the first extraction after 15N labelling by subtracting the amount
of tracer recovered (based on 15N enrichment). T = temperature; SOM = soil organic matter; GWC = gravimetric
water content; TC = total carbon; TN = total nitrogen.
The bulk density and the porosity of the soils could not be statistically evaluated
because they were measured in one composed soil sample. Pristine forest had very porous
soil, with a porosity of 78 % (Table 1), while porosity was four-times lower in the restored
soil, indicating compacted soil in this forest. Bulk density was 14 % lower in pristine
compared to restored Atlantic forest soils. The gravimetric water content (GWC) is in line
with porosity values, being high in pristine soil (Table 1).
Forest
type Soil pHᵃ*
Soil T
(°C)*
SOM
(%)*
GWC
(%)* TC (%)* TN (%)*
NH4+
(µg N g-1)
NO3-
(µg N g-1)* C/N ratio
Bulk
density
(g/cm3)ᵇ
Porosity
(%)ᵇ Granulometry
Pristine 4.06 ± 0.6 18.2 ±
0.2
9.8 ± 0.9 27.4 ±
2.3
5.9 ± 0.5 0.3 ± 0.01 3.5 ± 0.6 2.7 ± 0.2 22.6 ± 1.8 1.23 78 Slightly gravelly
muddy sand
Restored 4.9 ± 0.1 20.1 ±
0.2
6.9 ± 0.4 18.0 ±
1.5
4.5 ± 0.5 0.2 ± 0.02 3.3 ± 0.6 1.1 ± 0.1 22.1 ± 1.2 1.42 18 Slightly gravelly
muddy sand

48
4.3.2 Gross N transformations in pristine and restored Atlantic forest
Gross N mineralization was higher than gross nitrification in both soils, and gross
NH4+ consumption was quite similar to gross N mineralization, indicating low net
mineralization and, consequently, low amount of NH4+ available to nitrification.
None of the investigated gross N transformations were significantly different (P <
0.05; Table 2) between soils from pristine and young restored forest soils in REGUA. Pristine
forest soils showed higher gross rates of mineralization and NH4+ consumption, while restored
soils had higher gross nitrification and NO3- consumption rates (Figure 8).
Pristine forest
0
3
6
9
12
NO3- consumption
Nitrification
Mineralization
NH4+ consumption
Gro
ss N
tra
nsfo
rmati
on
rate
s(
g N
g-1
SD
W d
-1)
Restored forest
0
3
6
9
12
Gro
ss N
tra
nsfo
rmati
on
rate
s(
g N
g-1
SD
W d
-1)
Figure 8. Gross soil N transformation rates in pristine forest soils (upper graph) and restored forest soils
(lower graph) in Ecological Reserve of Guapiaçú (REGUA) at Rio de Janeiro state, Brazil. N = 3.
Student’s T test (P < 0.05) was done between forests to test the same gross N transformation. None of them
was significantly different. Rates were calculated between hour zero and hour 24 after 15N solutions
added. Rates unit is µg N g-1 soil dry weight (SDW) d-1.
As cited before, nitrification was very low in both soils, especially in pristine soil
(Table 2), and it would be attributed to a rapidly assimilation of plants and microbes. The
close relationship between inorganic N consumptions and mineralization and nitrification is
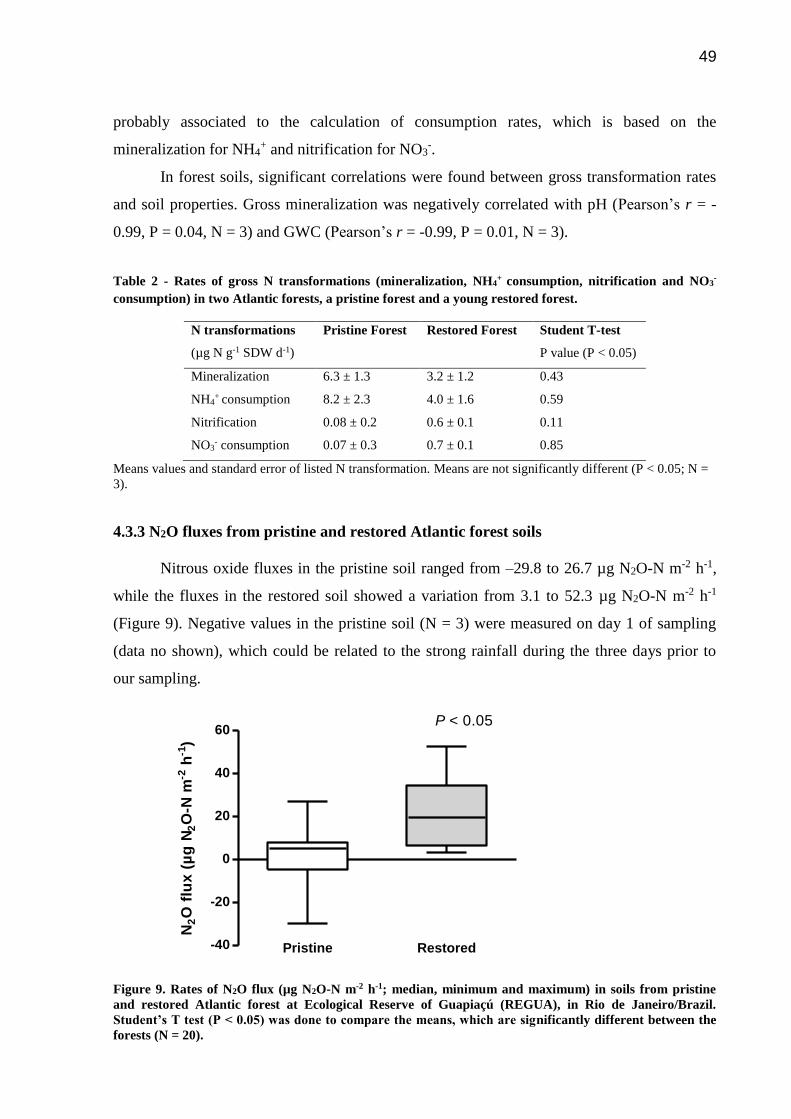
49
probably associated to the calculation of consumption rates, which is based on the
mineralization for NH4+ and nitrification for NO3
-.
In forest soils, significant correlations were found between gross transformation rates
and soil properties. Gross mineralization was negatively correlated with pH (Pearson’s r = -
0.99, P = 0.04, N = 3) and GWC (Pearson’s r = -0.99, P = 0.01, N = 3).
Table 2 - Rates of gross N transformations (mineralization, NH4+ consumption, nitrification and NO3
-
consumption) in two Atlantic forests, a pristine forest and a young restored forest.
N transformations Pristine Forest Restored Forest Student T-test
(µg N g-1 SDW d-1) P value (P < 0.05)
Mineralization 6.3 ± 1.3 3.2 ± 1.2 0.43
NH4+ consumption 8.2 ± 2.3 4.0 ± 1.6 0.59
Nitrification 0.08 ± 0.2 0.6 ± 0.1 0.11
NO3- consumption 0.07 ± 0.3 0.7 ± 0.1 0.85
Means values and standard error of listed N transformation. Means are not significantly different (P < 0.05; N =
3).
4.3.3 N2O fluxes from pristine and restored Atlantic forest soils
Nitrous oxide fluxes in the pristine soil ranged from –29.8 to 26.7 µg N2O-N m-2 h-1,
while the fluxes in the restored soil showed a variation from 3.1 to 52.3 µg N2O-N m-2 h-1
(Figure 9). Negative values in the pristine soil (N = 3) were measured on day 1 of sampling
(data no shown), which could be related to the strong rainfall during the three days prior to
our sampling.
Pristine Restored-40
-20
0
20
40
60P < 0.05
N2O
flu
x (
µg
N2O
-N m
-2 h
-1)
Figure 9. Rates of N2O flux (µg N2O-N m-2 h-1; median, minimum and maximum) in soils from pristine
and restored Atlantic forest at Ecological Reserve of Guapiaçú (REGUA), in Rio de Janeiro/Brazil.
Student’s T test (P < 0.05) was done to compare the means, which are significantly different between the
forests (N = 20).

50
A comparison of N2O flux from pristine and restored Atlantic forest soils showed a
significant difference between them (P < 0.05; Figure 9). The mean of measured N2O
emission in pristine soil was 10 times lower than in restored soil (2.5 ± 3.4 and 22.02 ± 4.1 µg
N2O-N m-2 h-1; mean ± SE). We found a significantly correlation only between N2O flux and
soil temperature (Pearson’s r = 0.79) in restored forest soils (Figure 10).
Restored forest
19.0 19.5 20.0 20.5 21.0
0
10
20
30
40
50
Soil temperature (°C)
N2O
flu
x (
µg
N2O
-N m
-2 h
-1)
Figure 10. Relationship between N2O flux (µg N-N2O m-2 h-1) and soil temperature (°C) for restored
Atlantic forest. Correlation was significant and positive (P < 0.05; Pearson’s r = 0.79).
4.4 DISCUSSION
The present study was designed to focus on the relationships between restoration
forest and N cycle in soils, covering microbial N transformations and N2O emission. To
understand the N cycling in reforestation soils and the level of ecosystem recovery, a
comparison with a pristine forest under the same abiotic influence was conducted. The
pristine forest represents the system without human interference and the natural mechanisms
that regulate the N cycle in the soil.
4.4.1 Gross N transformations and their relationship with soil properties in both pristine
and restored forests
Carbon and N content in soils are the most direct factor that influence gross N
mineralization, one of the most important mechanism to transform N in soils (BOOTH et al.,
2005). Considering an ecosystem at the beginning of a restoration process, the rapid growth of

51
biomass to establish the vegetation demands large amount of C and N, which result in high N
transformation rates (AMAZONAS et al., 2011).
Our findings point to that restoration in Atlantic forests can result in a decline in N
cycling rates, compared to pristine Atlantic forest, as has been found in other tropical forests
(SILVER et al., 2005). For pristine soil, negative correlations were found between gross N
mineralization and GWC, and pH. The water content in soil, represented by GWC, has a
strong control on the amount of oxygen available for the microbiota into the soil (RETH et al.,
2005).
As mineralization is mainly an aerobic process, the increase in water content in the
pristine soil reduces oxygen availability, limiting mineralization. The low pH is known as a
regulating factor of mineralization that has the optimum around 6 to 8 (DE BOER;
KOWALCHUK, 2001). Besides that, there are other explanations to the tendency of the low
gross N mineralization that are based on soil properties. The amount of SOM and TN are one
of them in both forests, mainly in restored. As the young restored forest was an active pasture
10 years before the sampling, the soil is still poor in nutrients and organic matter, with a rapid
nutrient cycling and storage of nutrients in plants biomass, maintaining the C and N stored
(SILVER et al., 2005; COMPTON et al., 2007). It may be one of the reasons for the low gross
N mineralization rate in the restored forest, and the similarity with pristine soil (AIDAR et al.,
2003).
Beyond the quantity of SOM, the quality is also considered an important regulating
factor. This parameter was not evaluate in our study, but has been considered important for
microbial processes (ARNOLD et al., 2009). The C/N ratio could be an indicator for SOM
quality, and we observed a larger increase of TC than TN, leading to a high C/N ratio, which
agrees with the slow gross N mineralization found in our restored soil (ABERA et al., 2012).
A similar C/N ratio was found in pristine soils; however, as the amount of SOM is higher than
in restored soils as well as the mineralization rate, the C/N ratio does not seems to controlling
the gross N mineralization.
One week before our sampling work, a strong and uncommon rainfall for August (23.7
mm in three days and 101.1 mm in July; http://www.inmet.gov.br/) occurred in our study
area. In pristine and restored forests, the amount of NH4+ (7.5 and 6.8 µg N g-1, respectively)
and NO3- (14.7 and 12.5 µg N g-1, respectively) was evaluated two weeks before sampling
work and was decreased during the 15N experiment (Table 1). We assign this to the strong
rainfall and leaching losses, which influenced the availability of N and the gross N
transformations. As suggested by DAVIDSON et al. (1990), an ecosystem with higher content

52
of NH4+ than NO3
- in soils is considered as N-limited, because of the larger losses of NO3- or
gas emission from denitrification. Owning to this, both the pristine and restored forest can be
considered N-limited, at least 15 days after the rainfall (Table 1). Here, is possible to see a
temporal dynamic of this limiting nutrient influenced by rainfall, since prior to the strong rain,
NO3- content was higher than NH4
+ and both soils were not N-limited, and after the rainfall
they became N-limited. SCOWCROFT et al. (2004) reported an N limitation in a 9-11 years
old koa plantation in Hawaii, indicated by a higher NH4+ immobilization than nitrification,
which is confirmed by our results (Table 2, Figure 8). This is suggested as a mechanism to
maintain the N in the soil system (SILVER et al., 2005).
In our two forest soils, the gross nitrification rates were very low (Table 2, Figure 8)
and it is probably being regulated by some soil properties. The low concentrations of TN and
the inorganic N (Table 1) together with a possible competition between microbes (e.g
nitrifiers) and plants, coupled to the leaching associated to the previous rainfall, making the
NO3- scarce and rapidly consumed when available in the soil. In addition, the pH in both soil
is low (Table 1) likely controlling negatively the nitrification, as suggested by PROSSER
AND NICOL, (2012). Besides that, trying to keep the N cycle tight, the majority of NH4+
produced by mineralization is immobilized (Table 2, Figure 8) by plants and microbial
biomass. Thereby, nitrification is limited in both pristine and restored soils.
Relating our gross N mineralization data with native forests and young plantation in
tropical areas, comparable rates were found. NEILL et al. (1999) found in lowland forest soil
in Southern Amazon rates around 3.7 µg N g-1 d-1 and SILVER et al. (2001) measured rates
around 4.8 µg N g-1 d-1 in lower montane wet tropical forest in Puerto Rico. Similar rates was
also found in a 10 years old plantation in Costa Rica (3.9 µg N g-1 d-1, respectively; SILVER
et al., 2005), and in a humid Amazon forest with sandy soil (5.0 µg N g-1 d-1; SOTTA et al.,
2008; Table 3).
Table 3 – Compilation of gross N transformations data in different tropical forest soils from the literature
(µg N g-1 d-1).
Reference Localization SON
mineralization Nitrification
NEILL et al 1999 Humid Amazon forest
(Rondônia/Brazil) 3.7 2.6
SILVER et al 2001 Lower montane wet tropical
forest (Puerto Rico) 4.8 0.6
SILVER et al 2005 Humid tropical forest
(Costa Rica) 7.9 5.1

53
SILVER et al 2005 1- and 10-yrs-old plantation
(Costa Rica) 3.9 3.2
BURTON et al 2007 Mixed rainforest and scrub
(native forest; Australia) 9.1 3.7
BURTON et al 2007 5-yrs-old plantation (Australia) 6.9 3.2
SOTTA et al 2008 Humid Amazon forest
(Pará/Brazil) 5.0 1.4
TEMPLER et al 2008 Humid tropical montane forest
(Puerto Rico) 2.0 5.6
Present study Tropical pristine lowland forest
(Rio de Janeiro/Brazil) 6.3 0.08
Present study Tropical restored lowland forest
(Rio de Janeiro/Brazil) 3.2 0.6
SILVER et al, (2005) and BURTON et al, (2007) measured lower gross N
mineralization in tropical young plantations than old-growth forests as in our study. They
reported that differences between soils in terms of microbial biomass, available C and N from
lysed cells in anaerobic conditions, could be influencing the processes. We did not measure
the microbial biomass, but considering the high GWC, TC and TN in pristine soils, the same
could have occurred in anaerobic microsites in this soil, which enhanced the gross N
mineralization. In terms of gross nitrification, only SILVER et al, (2001) showed similar
values in lower montane forest (Table 3). As our findings, the authors suggested soil
properties limiting the nitrifier activity. Other studies found in general higher gross
nitrification rates.
4.4.2 N2O restoration emission in restoration forest soil
Ecosystems in regeneration process have generally developed mechanisms to keep the
N and other nutrients in the system by avoiding losses, such as leaching and gas emissions
(DAVIDSON et al., 2007). Our findings showed an opposite trend, with higher N emissions
in restored forest soils compared to pristine soils (Figure 8). Positive correlation between N2O
emission and soil temperature in restored forest soil (Figure 9) is one of the possible

54
explanation for the findings since in restored soil, the in situ temperature was two degrees
higher than in pristine soil, due to the larger open area compared to the dense pristine forest,
which stimulate the metabolism of the N2O producers (RODRIGUES; DE MELLO, 2012).
Therefore, the water content was lower in restored soils, which favor the gases release.
The difference of gross nitrification in our two forests, which reflect on the N2O
emission, is probably linked to the soil pH. In the pristine soil, N2O emissions are near to
zero, which could be related to the very low nitrification rate inhibited by the low pH.
Without nitrification, no substrate for denitrification is produced, besides nitrification-related
emissions being zero in that case as well. However, because the low pH favors the
heterotrophic nitrification, which oxidize organic nitrogen to produce NO3-, the higher
production of N2O in restored soil, but not in pristine due to the low emission, could be
associated to this process (HUYGENS et al., 2007; ZHANG et al., 2015). It could be a
response to the restoration process that has different abundance of tree species influencing the
microbial community associated as well the organic compounds in the soil, stimulating the
microorganisms differentially (DIJKSTRA et al., 2006; DIJKASTRA et al., 2013; WANG et
al., 2014). Furthermore, DE SOUZA et al. (2015) found a higher deposition of organic N via
throughfall (water that passes through forest canopies; 19.7 kg N ha-1 yr-1) on the same region
studied here. It could stimulate the heterotrophic nitrification, mainly in young restored forest,
which has shorter and sparse trees, compared to pristine forest, and the rainfall and the
deposited compounds reach the soil easily.
However, comparing our data with other measurements in Atlantic forest soils, our
values are considered low, particularly in pristine forest. SOUSA NETO et al. (2011)
measured a mean of N2O emission around 26 µg N m-2 h-1 in a pristine Atlantic forest at 100
m of altitude, in the same month as our sampling. In a compilation data done by
RODRIGUES; DE MELLO (2012) different native Atlantic forests at various altitudes were
evaluated in terms of N2O emission, and a strong variation was observed, with the higher
value (48 µg N m-2 h-1) at altitudes between 170 and 300 m. Our mean N2O emission from
pristine soil was comparable only with Atlantic montane forests located at 1000-1200 m that
showed the lowest N2O emission (2.9 µg N2O-N m-2 h-1 in RODRIGUES; DE MELLO, 2012;
1.0 µg N2O-N m-2 h-1 in CARMO et al., 2012), which are N limited (PURBOPUSPITO et al.,
2006), as well as occurred in our soils due to the strong rainfall three days before sampling.
PERRY (2011) found N2O emissions in Atlantic Forest, during dry and wet seasons at 400 m
of altitude of 2.84 and 12.04 µg N m-2 h-1 and at 1200 m of altitude of 2.02 and 5.28 µg N m-2
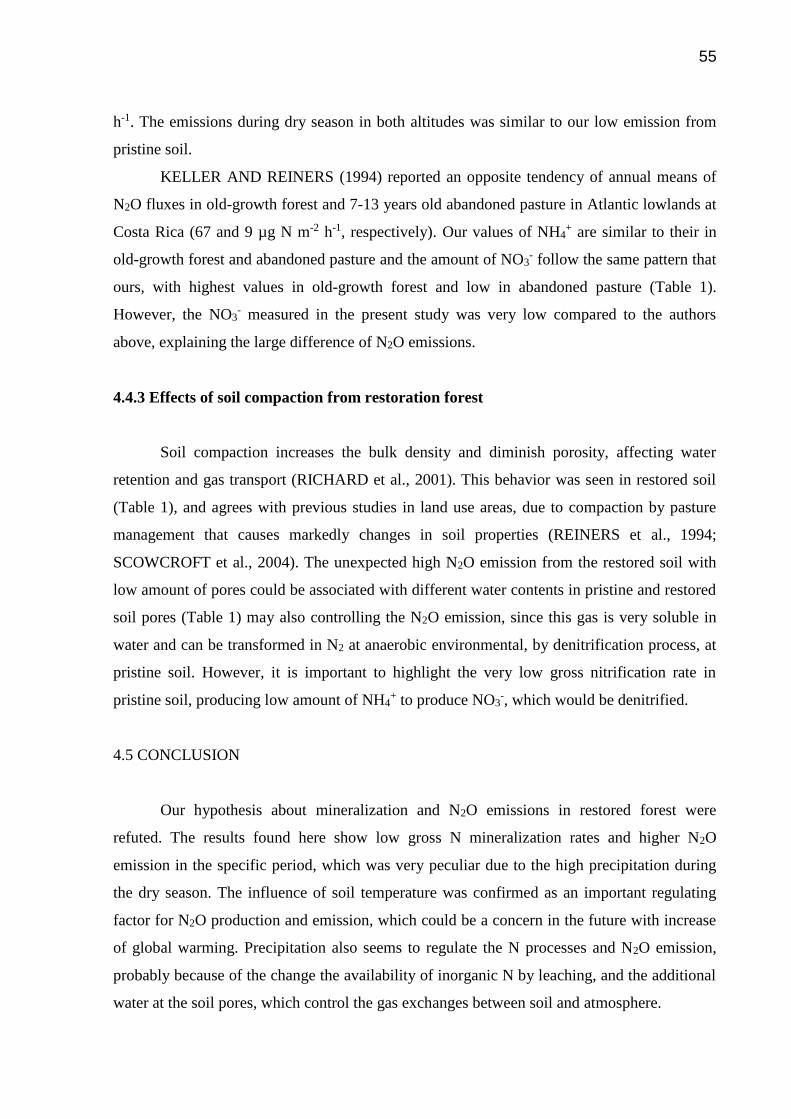
55
h-1. The emissions during dry season in both altitudes was similar to our low emission from
pristine soil.
KELLER AND REINERS (1994) reported an opposite tendency of annual means of
N2O fluxes in old-growth forest and 7-13 years old abandoned pasture in Atlantic lowlands at
Costa Rica (67 and 9 µg N m-2 h-1, respectively). Our values of NH4+ are similar to their in
old-growth forest and abandoned pasture and the amount of NO3- follow the same pattern that
ours, with highest values in old-growth forest and low in abandoned pasture (Table 1).
However, the NO3- measured in the present study was very low compared to the authors
above, explaining the large difference of N2O emissions.
4.4.3 Effects of soil compaction from restoration forest
Soil compaction increases the bulk density and diminish porosity, affecting water
retention and gas transport (RICHARD et al., 2001). This behavior was seen in restored soil
(Table 1), and agrees with previous studies in land use areas, due to compaction by pasture
management that causes markedly changes in soil properties (REINERS et al., 1994;
SCOWCROFT et al., 2004). The unexpected high N2O emission from the restored soil with
low amount of pores could be associated with different water contents in pristine and restored
soil pores (Table 1) may also controlling the N2O emission, since this gas is very soluble in
water and can be transformed in N2 at anaerobic environmental, by denitrification process, at
pristine soil. However, it is important to highlight the very low gross nitrification rate in
pristine soil, producing low amount of NH4+ to produce NO3
-, which would be denitrified.
4.5 CONCLUSION
Our hypothesis about mineralization and N2O emissions in restored forest were
refuted. The results found here show low gross N mineralization rates and higher N2O
emission in the specific period, which was very peculiar due to the high precipitation during
the dry season. The influence of soil temperature was confirmed as an important regulating
factor for N2O production and emission, which could be a concern in the future with increase
of global warming. Precipitation also seems to regulate the N processes and N2O emission,
probably because of the change the availability of inorganic N by leaching, and the additional
water at the soil pores, which control the gas exchanges between soil and atmosphere.

56
The 10 years old Atlantic Forest had slow metabolism in terms of N cycling, since we
expected high rates of gross N mineralization to release N for assimilation; however, we could
see the ecosystem being similar to the pristine Atlantic forest. It may suggests an N limitation
or, as an unexpected result, a stabilization of the system related to gross N transformations
only 10 years after reforestation started, as the values were similar to pristine forest.
Moreover, the pristine area seems to be N limited with a very low gross nitrification, or at
least N limited during the wet season with high amount and frequency of precipitation. It is
important to highlight the studied region of Atlantic Forest has strong influence of rainfall,
which could vary the N availability in soils, leaching the N in soils and/or increasing the N via
throughfall.
These results emphasize the need and importance of long-term biogeochemical studies
in restored areas, to evaluate the status of the ecosystem, comparing to a pristine area, and
suggest changes during the reforestation practice to supply the requirements of the altered
ecosystem.
4.6 REFERENCES
ABERA, G.; E. WOLDE-MESKEL; L. R. BAKKEN. Carbon and nitrogen mineralization
dynamics in different soils of the tropics amended with legume residues and contrasting soil
moisture contents. Biology and Fertility of Soils, v. 48, p. 51-66. 2012.
AIDAR, M. P. M. et al. Nitrogen Use Strategies of Neotropical Rainforest Trees in Threatend
Atlantic Forest. Plant, Cell & Environment, v. 26, p. 389–399. 2003
AIDE, T, M. et al. Forest Regeneration in a Chronosequence of Tropical Abandoned Pastures:
Implications for Restoration Ecology. Restoration Ecology, v. 8, n. 4, p. 328-338. 2000.
AMAZONAS, N. T. et al. Nitrogen Dynamics during Ecosystem Development in Tropical
Forest Restoration. Forest Ecology and Management, v. 262, n. 8, p. 1551–1557. 2011.
ARNOLD, J.; M. D. CORRE; E. VELDKAMP. Soil N cycling in old-growth forests across
an Andosol toposequence in Ecuador. Forest Ecology and Management, v. 257, p. 2079-
2087. 2009.
BROOKS, P. D. et al. Diffusion method to prepare soil extracts for automated nitrogen-15
analysis. Soil Science Society of America Journal, v. 53, p. 1707–1711. 1989.
BURTON, J. et al. Gross nitrogen transformations in adjacent native and plantation forests of
subtropical Australia. Soil Biology & Biochemistry, v. 39, p. 426-433. 2007.

57
BUTTERBACH-BAHL, K. et al. Nitrous oxide from soils: how well do we understand the
processes and their controls? Philosophical Transactions, v. 368. 2013
BUTTERBACH-BAHL, K. et al. Nitrogen turnover processes and effects in terrestrial
ecosystems. In: The European Nitrogen Assessment. ed. M.A. Sutton, C.M. Howard, J.W.
Erisman et al. Cambridge University Press. 2011.
CALMON, M. et al. Emerging threats and opportunities for large-scale ecological restoration
in the Atlantic Forest of Brazil. Restoration Ecology, v. 19, n. 2, p. 154-158. 2011.
CARMO, J. B. et al. Conversion of the coastal Atlantic forest to pasture: Consequences for
the nitrogen cycle and soil greenhouse gas emissions. Agriculture, Ecosystems and
Environmental, v. 148, p. 37-43. 2012.
CHAZDON R L. Tropical forest recovery: legacies of human impact and natural
disturbances. Perspectives in Plant Ecology, Evolution and Systematics, v. 6, n. /1,2, p. 51-
71. 2003
COMPTON, J. E.; T. D. HOOKER; S. S. PERAKIS. Ecosystem N distribution and δ15N
during a century of forest regrowth after agricultural abandonment. Ecosystems, v. 10, p.
1197-1208. 2007.
DAVIDSON, E. A.; J. M. STARK; M. K. FIRESTONE. Microbial production and
consumption of nitrate in an annual grassland. Ecology, v. 71, n. 5, p. 1968-1975. 1990.
DAVIDSON, E. A. et al. Testing a conceptual model of soil emission of nitrous and nitric
oxides. BioScience, v. 50, p. 667-680. 2000.
DAVIDSON, E. A. et al. Minimizing artifacts and biases in chamber-based measurements of
soil respiration. Agric. Forest Meteorol, v. 113, p. 21–37. 2002.
DAVIDSON, E. A. et al. Recuperation of Nitrogen Cycling in Amazonian Forests Following
Agricultural Abandonment. Nature, v. 447, n. 7147, p. 995–98. 2007.
DE BOER, W.; G. A. KOWALCHUK. Nitrification in acid soils: micro-organisms and
mechanisms. Soil Biology & Biochemistry, v. 33, n. 7–8, p. 853-866. 2001.
DIJKSTRA, F. A.; CHENG, W.; JOHNSON, D. W. Plant biomass influences rhizosphere
priming effects on soil organic matter decomposition in two differently managed soils. Soil
Biology and Biochemistry, v. 38, p. 2519–2526. 2006.
DIJKSTRA, F. A. et al. Phizosphere priming: a nutrient perspective. Frontiers in
Microbiology, v. 4, n. 216. 2013.
58
EMBRAPA - Empresa Brasileira de Pesquisa Agropecuária. Manual de métodos de análise de
solo, EMBRAPA/SNLCS. Rio de Janeiro, 1997, 212 p.
EMBRAPA - Centro Nacional de Pesquisa de Solos (Rio de Janeiro, RJ). Sistema Brasileiro
de Classificação de Solos. 2 ed.. Rio de Janeiro, 2006, 286 p.
FARQUHARSON, R.; L. BALDOCK. Concepts in modelling N2O emissions from land use.
Plant and Soil, v. 309, n. 1, p. 147-167. 2008.
HUYGENS, D. et al. Soil nitrogen conservation mechanisms in a pristine South Chilean
Nothofagus forest ecosystem. Soil Biology and Biochemistry, v. 39, p. 2448–2458. 2007.
IPCC, 2013: Climate Change 2013: The Physical Science Basis. Contribution of Working
Group I to the Fifth Assessment Report of the Intergovernmental Panel on Climate Change
[Stocker, T.F., D. Qin, G.-K. Plattner, M. Tignor, S.K. Allen, J. Boschung, A. Nauels, Y. Xia,
V. Bex and P.M. Midgley (eds.)]. Cambridge University Press, Cambridge, United Kingdom
and New York, NY, USA, 1535 pp. 2013.
JOLY, C. A. et al. Biodiversity conservation research, training and policy in São Paulo.
Science, v. 328, p. 1358-1359. 2010.
JOLY, C. A.; J. P. METZNGER; M. TABARELLI. Experiences from the Brazilian Atlantic
Forest: ecological findings and conservation initiatives. New Phytologist, v. 204, p. 459-473.
2014.
KELLER, M.; W. A. REINERS. Soil-atmosphere exchange of nitrous oxide, nitric oxide and
methane under secondary succession of pasture to forests in the Atlantic lowlands of Costa
Rica. Global Biogeochemical Cycles, v. 8, p. 399–409. 1994.
KIRKHAM, D.; W. V. BARTHOLOMEW. Equations for following nutrient transformations
in soil, utilizing tracer data. Soil Sci. Soc. Am. Proc., v. 18, p. 33-34. 1954.
LAMB, D.; P. D. ERSKINE; J. A. PARROTA. Restoration of degraded tropical forest
landscapes. Science, v. 310, p. 1628-1632. 2005.
MARTIN, P. A.; A. C. NEWTON; J. M. BULLOCK. Carbon pools recover more quickly
than plant biodiversity in tropical secondary forests. Proceedings of the Royal Society B.
2013
MORAN, E. F. et al. Effects of soil fertility and land-use on forest succession in Amazônia.
Forest Ecology and Management, v. 139, p. 93-108. 2000.
MYERS, N. et al. Biodiversity hotspots for conservation priorities. Nature, v. 403, n. 24, p.
853-858. 2000.

59
NEILL, C. et al. Nitrogen Dynamics in Amazon Forest and Pasture Soils Measured by 15N
Pool Dilution. Soil Biology and Biochemistry, v. 31, n. 4, p. 567–72. 1999.
PAUL, M. et al. Recovery of soil properties and functions in different rainforest restoration
pathways. Forest Ecology and Management, v. 259, p. 2083-2092. 2010.
PEREZ, T. et al. Nitrous oxide nitrification and denitrification N-15 enrichment factors from
Amazon forest soils. Ecological Applications, v. 16, n. 6, p. 2153-2167. 2006.
PROSSER, J. I.; G. W. NICOL. Archaeal and bacterial ammonia-oxidisers in soil: the quest
for niche specialisation and differentiation. Trends in Microbiology, v. 20, p. 523-531 2012.
PURBOPUSPITO, J. et al. Trace gas fluxes and nitrogen cycling along an elevation sequence
of tropical montane forests in Central Sulawesi, Indonesia. Global Biogeochemical Cycles, v.
20. 2006.
RETH, S. et al. DenNit - Experimental analysis and modelling of soil N2O efflux in
response on changes of soil water content, soil temperature, soil pH, nutrient availability and
the time after rain event. Plant and Soil, v. 272, p. 349-363. 2005.
REINERS, W. A. et al. Tropical rain forest conversion to pasture: Changes in vegetation and
soil properties. Ecological Applications, v. 4, p. 363-377. 1994.
RIBEIRO, M. C. et al. The Brazilian Atlantic Forest: How much is left, and how is the
remaining forest distributed? Implications for conservation. Biological Conservation.
Conservation Issues in the Brazilian Atlantic Forest, v. 142, n. 6, p. 1141–1153. 2009.
RICHARD, G. et al. Effect of compaction on the porosity of a silty soil: influence on
unsaturated hydraulic properties. European Journal of Soil Science, v. 52, p. 49-58. 2001.
ROCHA, C. F. D. et al. A survey of the leaf-litter frog assembly from an Atlantic forest area
(Reserva Ecológica de Guapiaçu) in Rio de Janeiro state, Brazil, with an estimate of frog
densities. Tropical Zoology, v. 20, p. 99-108. 2007.
RODRIGUES, R. A. R.; W. Z. DE MELLO. Fluxos de óxido nitroso em solos com cobertura
de floresta ombrófila densa montana da Serra do Órgãos, Rio de Janeiro. Química Nova, v.
35, p. 1549–1553. 2012.
RODRIGUES, R. R. et al. On the restoration of high diversity forests: 30 years of experience
in the Brazilian Atlantic Forest. Biological Conservation, v. 142, p. 1242-1251. 2009.

60
RÜTTING, T. et al. Advances in 15N-tracing experiments: new labeling and data analysis
approaches. Biochemical Society Transactions, v. 39, p. 279-283. 2011.
SCOWCROFT, P. G.; J. E. HARAGUCHI, N. V. HUE. Reforestation and topography affect
montane soil properties, nitrogen pools and nitrogen transformations in Hawaii. Soil Science
Society of America, v. 68, p. 959-968. 2004.
SILVA, J. M. C.; C. H. M. CASTELETI. Status of the biodiversity of the Atlantic Forest of
Brazil. C. Galindo-Leal, I.G. Câmara (Eds.), The Atlantic Forest of South America:
Biodiversity Status, Threats, and Outlook, CABS and Island Press, Washington. p. 43–59.
2003.
SILVER, W. L. et al. Dissimilatory Nitrate Reduction to Ammonium in Upland Tropical
Forest Soils. Ecology, v. 82, n .3, p. 2410–2416. 2001.
SILVER, W. L. et al. Nitrogen cycling in tropical plantation forests: potential controls on
nitrogen retention. Ecological Applications, v. 15, p. 1604-1614. 2005.
SKIBA, U.; B. BALL. The effect of soil texture and soil drainage on emissions of nitric oxide
and nitrous oxide. Soil Use Manage, v. 18, p. 56–60. 2002.
SMITH, K. A. et al. Effect of temperature, water content and nitrogen fertilization on
emissions of nitrous oxide by soils. Atmospheric Environmental, v. 3219, p. 3301–3309.
1998.
SOS MATA ATLÂNTICA, INSTITUTO NACIONAL DE PESQUISAS ESPACIAIS, 2015.
Atlas dos remanescentes florestais da Mata Atlântica, período de 2013 a 2014.
<http://www.sosmatatlantica.org.br>.
SOTTA, E. D.; M. D. Corre; E. Veldkamp. Differing N Status and N Retention Processes of
Soils under Old-Growth Lowland Forest in Eastern Amazonia, Caxiuanã, Brazil. Soil Biology
and Biochemistry, v. 40, n. 3, p. 740–50. 2008.
SOUSA NETO, E. et al. Soil-atmosphere exchange of nitrous oxide, methane and carbon
dioxide in a gradient of elevation in the coastal Brazilian Atlantic forest. Biogeosciences, v. 8,
p. 733-724. 2011.
STANGE, C. F. et al. Automated and rapid online determination of 15N abundance and
concentration of ammonium, nitrite, or nitrate in aqueous samples by the SPINMAS
technique. Isotopes in Environmental and Health Studies, v. 43, n. 3, p. 227-236. 2007.
TABARELLI, M. et al. Challenges and opportunities for biodiversity conservation in the
Brazilian Atlantic forest. Conservation Biology, v. 19, p. 695–700. 2005.

61
TEMPLER, P. H. et al. Plant and microbial controls on nitrogen retention and loss in a humid
tropical forest. Ecology, v. 89, n. 11, p. 3030-3040. 2008.
VELOSO, H. P. et al. Classificação da vegetação brasileira, adaptada a um sistema universal.
Rio de Janeiro IBGE, Departamento de Recursos Naturais e Estudos Ambientais, 1991. IBGE
CDDI. Dep. de Documentação e Biblioteca.
WANG, F et al. Effects of nitrogen-fixing and non-nitrogen-fixing tree species on soil
properties and nitrogen transformation during forest restoration in southern China. Soil
Science and Plant Nutrition, v. 56, n. 2, p. 297-306. 2010.
WEN, L. et al. Rapid recuperation of soil nitrogen following agricultural abandonment in a
karst area, southwest China. Biogeochemistry, v. 129, p. 341-354. 2016.
ZHANG, J.; C. MÜLLER; Z. CAI. Heterotrophic nitrification of organic N and its
contribution to nitrous oxide emissions in soils. Soil Biology & Biochemistry, v. 84, p. 199–
209. 2015.

62
5 RECOVERY OF SOIL N MECHANISMS IN REGROWING AMAZONIAN
RAINFOREST
ABSTRACT
Extensive regions of tropical forests are subjected to high rates of both deforestation and
forest regrowth on abandoned agricultural lands and grasslands, and their rates have been
unprecedented during the past few decades. The deforestation leads to a loss of soil organic
matter and soil nutrients, such as nitrogen and phosphorus. These soil pools might be build up
again upon reforestation, but the time needs to reach undisturbed forest conditions soil is
unclear. Here, we assessed mechanistic changes in the soil N cycle of tropical forests of
different ages of regrowth after one time disturbance in Brazilian Amazonian. The overall aim
of the study was to understand which N cycle pathways and their controlling factors are
altered during forest regrowth, which is still uncertain for tropical forests. We showed that
soil gross nitrification, mineralization and the nitrate-to-ammonium (NO3-:NH4
+) ratio are
decreased in regrowing forests, which is preserved even after 40 years. This indicates an
evolution of the N cycle into a more conservative status. This is a clear indication that
abandoned forests have the potential to reach natural mechanistic N balances over a period of
ca. 50 years.
5.1 INTRODUCTION
In the Amazon region of Brazil, deforestation is largely practiced for soya bean
cultivation, logging and cattle ranching, mainly for export (BARONA et al., 2010). The
deforested area in the Brazilian Amazon is around 780 thousand km2, which represents 19 %
of the entire Amazonian forest in Brazil (INPE, 2016). The high rate of tropical deforestation
led to global concern since these areas are a hot spot of biodiversity and, in terms of
Amazonian forests, has direct influence on the global climate through hydrological and
biogeochemical cycles (LAURANCE et al., 2001; MCGRATH et al., 2001; KIRBY et al.,
2006; AGUIAR et al., 2016).
Many deforested areas in tropical countries are frequently abandoned after
managements, such as clear-cutting and slash-and-burn, owing to unproductive soils
(DAVIDSON et al., 2004), and secondary forest can establish, which show modified
vegetation as well as soil properties and microbial community (MARTIN et al., 2013;
ZHANG et al., 2016). According to TerraClass system (2014), the area of secondary forest on

63
previously cleared land in Amazon region is approximately 167 thousand km2. Owing to
deforestation still occur in the region, even the rates decrease from 2004, the regrowth area is
increasing (INPE, 2016). How the regrowth of tropical secondary forest after management
affects the availability of nutrients and biogeochemical processes, and how the post-
disturbance regeneration can influence these processes are poorly understood (DAVIDSON et
al., 2007).
Generally, early secondary forests have high metabolism on disturbed soils to increase
biomass (MARTIN et al., 2013) and recover pristine conditions rapidly, even when nitrogen
(N) is limited (AMAZONAS et al., 2011). Microbial processes, such as mineralization and
nitrification, drive the soil N cycle and thereby control the amount of organic and inorganic N
forms in soil (KOWALCHUK; STEPHEN, 2001; SCHIMEL; BENNETT, 2004).
Mineralization of soil organic matter is responsible for inorganic N production in terrestrial
ecosystems, releasing ammonium (NH4+) that supports nitrification (BOOTH et al., 2005), an
oxidation of NH4+ to nitrate (NO3
-). These two inorganic N forms may have different fates in
soils, as immobilization in biomass, leaching and gas losses (TEMPLER et al., 2008), and the
occurrence and magnitude of these pathways might influence the forest growth (SCHMIDT,
2007).
In a previous study, DAVIDSON et al, (2007) investigated the N cycling recovery in a
secondary forest age chronosequence after agricultural abandonment in the Amazon region,
using indicators based on inorganic N concentrations. The authors found a conservative N-
cycling in soils of young successional tropical forests based on N and P contents in leaves,
litterfall and soils, as well as N2O emissions as indicators of the recovery of N-cycling
(DAVIDSON et al., 2007). However, their study did not directly evaluate the mechanisms of
the soil N cycle, such as gross mineralization and nitrification. The gross soil N cycle
dynamics could show clearly the dynamic of labile N in soils since they are the main control
of inorganic N availability. In this line, understanding the gross N transformations in tropical
regrowth forest soils, with focus on the mineralization and nitrification processes, determining
the availability of N, is an important step in managing and enhancing abandoned managed
areas.
Four forests, including one pristine forest and one regrowth forest (40 years old)
located inside and two regrowth forests (10 and 20 years old) near the Ecological Station of
Cuniã in the state of Rondônia, Western Amazonia, were evaluated in terms of soil N cycling
with focus on gross N mineralization and gross nitrification. The 15N pool dilution technique
using the “virtual soil core” approach (RÜTTING et al., 2011) was used to quantify in situ

64
gross N processes rates. All gross rates are presented as means and standard error.
Physicochemical soil properties which affect the soil N cycle, such as total soil N, soil organic
matter (SOM) and soil carbon (C) content, soil pH and soil moisture (Table 1) were measured.
Predominant soil type of the investigated forests is Plinthosol (IUSS Working Group WRB,
2014) and the vegetation is dominated by hardwood with abundance of palms (PANSINI et
al., 2016).
5.2 METHODS
5.2.1 Study area
The study was carried out at the Ecological Station of Cunia, Porto Velho
municipality, at Rondônia state, Brazil (08°06’23”S and 63°28’59”W; Figure 11). The
ecological station was established for conservation and scientific research in 2001 in one of
the states with highest deforestation rate in Amazonian region between 1980 and 1990.
Figure 11. Map of the Ecological Station of Cunia, Porto Velho municipality, at Rondônia state, Brazil.
The red star represent our sampling area. (Map from PPBio INPA).
The area of the station corresponds to 125,849 ha of open rainforest dominated by
hardwood with abundance of palms. The soils studied were classified as Plinthosols, iron-rich
and humus-poor and predominance of kaolinitic clay (IUSS Working Group WRB, 2014).

65
Inside the station, there is an area of 2500 ha (5 x 5 km) previously defined for sampling and
used in long-term monitoring. The mean annual precipitation in this region is 2500 mm, the
rain season occurs from October to April, and the dry season from June to August. The mean
annual temperature at the region is around 26 °C (ALVARES et al., 2013).
To investigate the gross N transformations in intact soils of pristine and regrowth
forest, one pristine forest and three regrowth forests with an age of 10, 20 and 40 years after
slash-and-burn practice were chosen. The pristine forest was inside a grid of 1 km2 and were
within the long-term monitoring site, as was the 40 years old regrowth forest (3-4 km from the
pristine plot). The other two regrowth forests (10 and 20 years old) were located in the
surrounding area, 10-12 km away.
5.2.2 In situ 15N labelling
To investigate the in situ gross N transformations in intact soil, with an intact
rhizosphere, a 15N labelling using the “virtual soil core” approach (RÜTTING et al., 2011;
Figure 6, Chapter 3) was conducted at the beginning of the dry season in April 2013.
In the pristine forest in total seven plots in two straight lines, 1 km apart, were
established with 10 m distance between plots. In the regrowing forests, three plots were
randomly chosen with a distance of 10 m either in a straight line (40 years old) or in a triangle
(10 and 20 years old), which was mainly governed by accessibility. Each plot was treated as a
replicate and in each two sets of a paired labelling spots were establish, receiving a solution
containing NH4+ and NO3
- with one of the N species enriched with 15N at 99 %. One of the
paired labelling spots was sampled immediately after labelling (t0) and the second one 24
hours (t24) after labelling. Each spot received eleven 1 mL injections of 15N solution in a
circular area of 7 cm in diameter, homogenously distributed into the soil underneath the litter
to a depth of 9 cm using a 1 mL syringe and 9 cm spinal needle (RÜTTING et al., 2011). Soil
sampling was conducted in the inner 4 cm labelling spot. The larger labelling area provides a
buffer zone around the sampling (RÜTTING et al., 2011). The total amount added
corresponded to 1.73 µg NH4+-N and 0.86 µg NO3
--N per gram dry soil.
The intact soil samples were immediately transported to the field laboratory, where
they were gently broken by hand to remove stones, leaves and large roots by tweezers. After
sieving, 50 grams of each soil sample was added to a brown plastic bottle together with 100
mL of 1M KCl, placed on a shaker for 1 hour, and lastly filtered through MN 615 filter paper
(Macherey-Nagel).
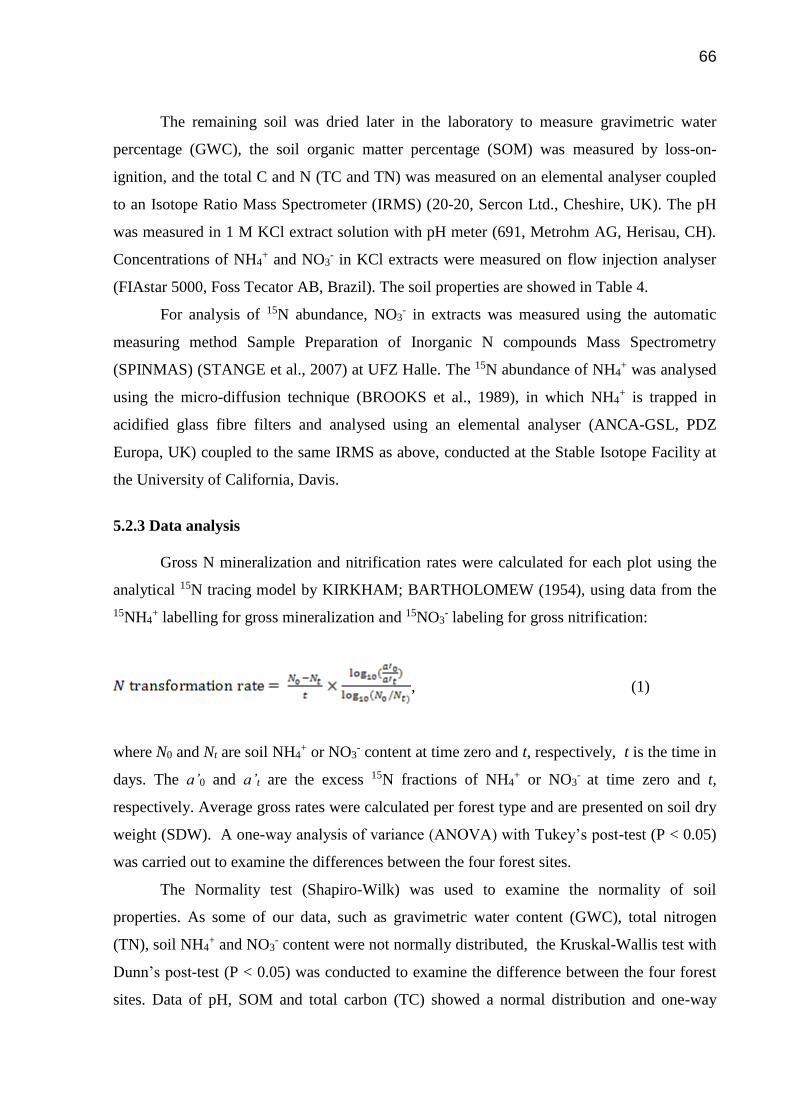
66
The remaining soil was dried later in the laboratory to measure gravimetric water
percentage (GWC), the soil organic matter percentage (SOM) was measured by loss-on-
ignition, and the total C and N (TC and TN) was measured on an elemental analyser coupled
to an Isotope Ratio Mass Spectrometer (IRMS) (20-20, Sercon Ltd., Cheshire, UK). The pH
was measured in 1 M KCl extract solution with pH meter (691, Metrohm AG, Herisau, CH).
Concentrations of NH4+ and NO3
- in KCl extracts were measured on flow injection analyser
(FIAstar 5000, Foss Tecator AB, Brazil). The soil properties are showed in Table 4.
For analysis of 15N abundance, NO3- in extracts was measured using the automatic
measuring method Sample Preparation of Inorganic N compounds Mass Spectrometry
(SPINMAS) (STANGE et al., 2007) at UFZ Halle. The 15N abundance of NH4+ was analysed
using the micro-diffusion technique (BROOKS et al., 1989), in which NH4+ is trapped in
acidified glass fibre filters and analysed using an elemental analyser (ANCA-GSL, PDZ
Europa, UK) coupled to the same IRMS as above, conducted at the Stable Isotope Facility at
the University of California, Davis.
5.2.3 Data analysis
Gross N mineralization and nitrification rates were calculated for each plot using the
analytical 15N tracing model by KIRKHAM; BARTHOLOMEW (1954), using data from the
15NH4+ labelling for gross mineralization and 15NO3
- labeling for gross nitrification:
, (1)
where N0 and Nt are soil NH4+ or NO3
- content at time zero and t, respectively, t is the time in
days. The a’0 and a’t are the excess 15N fractions of NH4+ or NO3
- at time zero and t,
respectively. Average gross rates were calculated per forest type and are presented on soil dry
weight (SDW). A one-way analysis of variance (ANOVA) with Tukey’s post-test (P < 0.05)
was carried out to examine the differences between the four forest sites.
The Normality test (Shapiro-Wilk) was used to examine the normality of soil
properties. As some of our data, such as gravimetric water content (GWC), total nitrogen
(TN), soil NH4+ and NO3
- content were not normally distributed, the Kruskal-Wallis test with
Dunn’s post-test (P < 0.05) was conducted to examine the difference between the four forest
sites. Data of pH, SOM and total carbon (TC) showed a normal distribution and one-way

67
analysis of variance (ANOVA) was conducted. All the analyses were conducted using
GraphPad Prism (Version 5.01, GraphPad Software, Inc.).
5.3 RESULTS AND DISCUSSION
Early secondary forests exhibited a more conservative N cycle compared to pristine
and older secondary forests in the Amazon region (DAVIDSON et al., 2007). This is in
agreement with our results from a chronosequence, which, moreover, provide mechanistic
insights how the soil N cycle develops during forest regrowth. The quantified gross N cycle
rates provide further evidence for a closer N cycle in regrowing (secondary) forests.
Rates of gross mineralization in the pristine forest are though within the range of gross
mineralization reported by other pristine tropical forests (e.g. BOOTH et al., 2005; SILVER et
al., 2005; ALLEN et al., 2015). In an Eastern Amazon forest during the dry season, SOTTA et
al (2008) found a gross N mineralization rate of 13.9 ± 3.8 µg N g-1 d-1 from clay soil and 7.2
± 1.8 µg N g-1 d-1 from sand soil, which is similar to the rate we found in the pristine forests at
the Ecological Station of Cuniã. Gross N mineralization measured along the chronosequence
of forest regrowth is consistent with the successional stage, where the early forest (10 years
old) had the highest rates (20.9 ± 5.3 µg N g-1 d-1), four times higher compared to the older
regrowth (5.5 ± 1.7 µg N g-1 d-1) and two times higher than pristine forests (11.1 ± 2.5 µg N g-
1 d-1; Figure 12).

68
0
5
10
15
20
25
30
Gro
ss
min
era
liza
tio
n (
g N
g-1
da
y-1
)
Pristine 10 20 40
0
3
6
9
12
15
18
21
Time of regrowth (year)
Gro
ss
nit
rifi
ca
tio
n (
g N
g-1
da
y-1
)
Figure 12. Gross N mineralization (top) and nitrification (bottom) rates (µg N g-1 SDW day-1; Mean ±
Standard Error) in five forest soils at Cuniã Ecological Station, Rondônia, with one pristine forest (set to t
= 0 years) and three regrowth forests (10 years; 20 years; and 40 years). For gross N mineralization, the
10 years old regrowth forest was statistically different from the 40 years old forest (One way ANOVA with
Tukey’s post hoc test P < 0.05). For gross nitrification, the pristine forest was significantly different from
all three regrowth forests (One way ANOVA with Tukey’s post hoc test P < 0.05).
A similar pattern was found by BURTON et al. (2007) in Australia, where gross N
mineralization was 2 to 3 times higher in early monospecific plantation (5 years old) than
pristine forest and older (53 years old) plantation. However, other studies showed a different

69
pattern of unaffected or decreased gross mineralization in early forest plantations or
successional secondary forests (ZOU et al., 1992; SCOWCROFT et al., 2004; KITA et al.,
2005; SILVER et al., 2005). These differences might be related to different responses of the
microbial biomass in early plantation (SILVER et al., 2005) and/or depending on tree species.
Across the secondary forest age chronosequence, the SOM content was significantly
higher (P < 0.05) in pristine than10 years old regrowth but they were not significantly
different from 20 and 40 years old regrowth (Table 4).
Table 4 – Soil properties of pristine forest and three regrowth forests (10, 20 and 40 year old) at Ecological
Station of Cuniã, Rondônia (Brazil). Mean ± Standard Error.
Pristine 10 yrs. 20 yrs. 40 yrs.
pH 3.7 ± 0.04a 3.4 ± 0.1b 3.9 ± 0.04c 3.8 ± 0.05a,c
GWC (%) 35.1 ± 0.1a 22.0 ± 0.9b 35.8 ± 1.5a 30.8 ± 1.2a
SOM (%) 7.5 ± 0.4a 5.1 ± 0.7b 8.0 ± 1.8a,b 6.8 ± 1.2a,b
TC (%) 4.4 ± 0.3a 2.9 ± 0.4b 4.7 ± 1.1a,b 3.9 ± 0.7a,b
TN (%) 0.19 ± 0.01a 0.17 ± 0.02a 0.20 ± 0.01a 0.17 ± 0.02a
NH4+
(µg/g SDW) 3.4 ± 0.5a 8.0 ± 1.7a 7.1 ± 1.9a 5.7 ± 0.3a
NO3-
(µg/g SDW) 9.4 ± 1.4a 3.8 ± 0.7a,b 1.7 ± 1.2b 2.2 ± 0.4b
NO3-:NH4
+ 2.9 ± 0.2a 0.6 ± 0.17b 0.4 ± 0.25b 0.4 ± 0.3b
The letters a, b and c represent the values that are statistically significantly different in the four studied sites One
way ANOVA test with Tukey’s post hoc test (P < 0.05) was used for parametric soil properties (GWC, TN,
NH4+ and NO3
-) and Kruskal-Wallis test with Dunn’s post hoc test, P < 0.05 for non-parametric (pH, SOM and
TC). GWC = gravimetric water percentage, TC = total carbon, TN = total nitrogen.
However, SOM content does not seems to be controlling the rates gross N
mineralization, because the lower SOM content was found in the forest with the highest rates.
A relevant implication of the recent management, instead of the amount of SOM, is the
organic matter quality (ZHANG et al., 2011), that is derived from different species of plants
in each investigated site. The Carbon/Nitrogen (C/N) ratio is one powerful indicator of the
organic matter quality, confirming our idea about control of mineralization, since 10 years old
regrowth had the lower C/N ratio (17) in comparison with the others (C/N in pristine, 20 and
40 years old were 23, 24 and 23 respectively). Hence, some species of plants would release
high quality organic compounds, which stimulates gross N mineralization (SOTTA et al.,
2008; WANG et al. 2015). Changes in the internal soil N cycle as consequence of
deforestation provide different responses of microbial and plant community during regrow

70
stage (GONZÁLEZ-PÉREZ et al., 2004). In general, the main pattern seen in early forests is
high rate of NH4+ released through mineralization (AIDAR et al., 2003; DAVIDSON et al.,
2007) and as the regrowing forest ages, other N cycle processes become progressively more
important, changing the dominate N form in soil (MARKEWITZ et al., 2004). This pattern is
also confirmed by our results. As shown by AIDAR et al (2003), gross mineralization in early
regrowth forests is high due to the recent disturbance that redistribute organic matter stored in
deeper soil layers to soil surface. Furthermore, the previous management, as slash-and-burn,
degraded the soil organic matter, releasing labile compounds that are easier to mineralize
(GONZÁLEZ-PÉREZ et al. 2004, STEINER et al., 2008). Subsequently, gross mineralization
decreases over time, possibly due to the low tree biomass, which reduces root exudation and
rhizosphere priming (DIJKSTRA et al., 2006; BENGTSON et al., 2012; DIJKSTRA et al.,
2013). In contrast, gross nitrification is decreased in all three stages of forest regrowth. This
could be related to the alteration of the soil microbial community, as found by PAULA et al
(2014), who showed higher abundance of nitrifiers in pristine forest soils than regrowth forest
soils after land-use changes. In addition, an enhanced plant N demand, competing with
nitrifiers for NH4+, could contribute to the decreased gross nitrification. Consequently,
regrowing forests have a tighter N cycle with less risk of N losses and enhanced N retention
(COMPTON et al., 2007).
In a global dataset, the rate of gross nitrification was best explained by gross
mineralization as this process provides the main substrate for nitrification (BOOTH et al.,
2005). However, the high nitrification rate found in the pristine forest, suggests different
sources of NH4+ in Amazonian soils supporting high gross nitrification. For instance, NH4
+
content could be increased in soils via biological nitrogen fixation (YANG et al., 2009) or
dissimilatory nitrate reduction to ammonium (SILVER et al., 2001; RÜTTING et al., 2008),
which still is unclear in tropical environments (SILVER et al., 2001; TEMPLER et al., 2008).
Another possibility for high gross nitrification is heterotrophic nitrification, in which
microorganisms use organic N to produce NO3- (DE BOER; KOWALCHUK, 2001). As
found by BURTON et al. (2007) in a subtropical forest in Australia, heterotrophic nitrification
could be responsible for the higher gross nitrification than the rate of NH4+ production by
gross N mineralization. Moreover, the investigated pristine soils have low pH, which
promotes heterotrophic nitrification (DE BOER; KOWALCHUK, 2001). Due to the higher
gross nitrification in pristine forest, this site showed the highest amount of NO3- (9.4 ± 1.4 µg
g-1 SDW; Figure 13; Table 4). This is in accordance with the general pattern of open N cycle
reported for other tropical pristine forests (DAVIDSON et al., 2007), which have a relative

71
excess in NO3- that is more mobile than NH4
+ in soils, and promotes N losses by leaching and
N gas emission (NEILL et al., 1999; SILVER et al., 2005; SOTTA et al., 2008; RÜTTING et
al., 2015). In all regrowth stages, gross nitrification rates were lower than pristine forest
(Figure 12, limiting the soil NO3- content, which confirms the idea of N retention and
conservation in early ecosystems (DAVIDSON et al. 2007). The same pattern of low gross
nitrification rates in tropical early plantations and secondary forests was found in previous
studies (ZOU et al., 1992; SCOWCROFT et al., 2004; SILVER et al., 2005). Particularly the
results by BURTON et al. (2007), investigating two forest plantations of different age, are
strikingly similar to our study. These authors found the same tendency of decreased gross
nitrification in both early and old plantations compared to the pristine forest, but this was
uncoupled from changes in gross mineralization, which was, as in our study, enhanced in the
early plantation (BURTON et al., 2007). The strategy in early regrowth forests is to promote
high rates of gross N mineralization and low rates of gross nitrification, maintaining the N as
NH4+, which is less mobile in soils than NO3
-, leading to reduced losses (SOTTA et al., 2008),
but maintaining availability of N for plant uptake. This is expressed in the lower NO3-:NH4
+
ratio (Figure 13), an indicator of a conservative N cycle (DAVIDSON et al., 2007).
Figure 13. Content of soil NH4+ and NO3
- (µg N g-1 SDW; Mean ± SE) as well as the ratio between the two
mineral N forms in pristine forests (set to t=0 years) and three regrowth forests (10, 20 and 40 years) at
the Ecological Station of Cuniã, Rondônia (Brazil). The contents were calculated from the first extraction
after 15N labelling by subtracting the amount of tracer recovered (based on 15N enrichment).

72
Our findings are in line with DAVIDSON et al. (2007), since our regrowing forests
showed a lowered NO3-:NH4
+ ratio compared to pristine forests (Figure 13). Moreover, in N-
limited ecosystems, as our regrowth forests, the NH4+ content prevails in the soil and the N
dynamics has evolved to maintain N in the system and keep concentration and N process rates
low (HUYGENS et al. 2007).
5.4 CONCLUSION
Until recently, gross N mineralization and nitrification were a good indicator of the
environmental recovery status after a disturbance; however, our findings suggest a re-
establishment of gross N mineralization process after 20 years of the disturbance, becoming
lower, but close to pristine stage, while gross nitrification in the soil forest did not recovery
even after 40 years. It indicates the gross nitrification as a more sensitive process that needs
long time to recovery the pristine conditions, and allow the N, as NO3- form, flowing through
the N cycle and the assimilations and movements in soils. Moreover, the influence of the
vegetation over nitrification is stronger than mineralization, since they compete by the same
substrate (NH4+) in early stages of regrowth forest. Meanwhile, in advanced stages of
regrowth forest, the vegetation is already established, and the demand of NH4+ declines,
leaving more NH4+ to be consumed by nitrification, as showed in pristine forest.
Thereby, the present study provide the understanding of the best mechanism to
evaluate the N-cycling recovery on degraded soils in secondary succession forests, which is
the gross nitrification. This process is a key process driving N cycle, since controls N losses
and is influenced by the regenerated vegetation. Based on that, this finding could be
implemented in models to predict the future recovery of forest regrowth after deforestation
practice.
5.5 REFERENCES
AGUIAR, A. P. D. et al. Land use change emission scenarios: anticipating a forest transition
process in the Brazilian Amazon. Global Change Biology, v. 22, p. 1821-1840. 2016.
AIDAR, M. P. M. et al. Nitrogen Use Strategies of Neotropical Rainforest Trees in Threatend
Atlantic Forest. Plant, Cell & Environment, v. 26, p. 389–399. 2003.
73
ALLEN, K. et al. Soil nitrogen-cycling responses to conversion of lowland forests to oil palm
and rubber plantations in Sumatra, Indonesia. PlosOne, v. 10, n. 7. 2015.
ALVARES, C. A. et al. Köppen’s climate classification map for Brazil. Meteorologische
Zeitschrift, v. 22, n. 6, p. 711-728, 2013
AMAZONAS, N. T. et al. Nitrogen Dynamics during Ecosystem Development in Tropical
Forest Restoration. Forest Ecology and Management, v. 262, n. 8, p. 1551–1557. 2011.
BARONA, E. et al. The role of pasture and soybean in deforestation of the Brazilian Amazon.
Environmental Research Letters, v. 5. 2010.
BENGTSON, P.; J. BRAKER; S. J. GRAYSTON. Evidence of a strong coupling between
root exudation, C and N availability, and stimulated SOM decomposition caused by
rhizosphere priming effects. Ecology and Evolution, v. 2, n. 8, p. 1843-1952. 2012.
BOOTH, M. S.; J. M. STARK; R. EDWARD. Controls on Nitrogen Cycling in Terrestrial
Ecosystems: A Synthetic Analysis of Literatura Data. Ecological Monographs, v. 75, n. 2, p.
139–57. 2005.
BROWN, J. R. et al. Effects of multiple global change treatments on soil N2O fluxes.
Biogeochemistry, v. 109, p. 85-100. 2012.
BURTON, J. et al. Gross nitrogen transformations in adjacent native and plantation forests of
subtropical Australia. Soil Biology & Biochemistry, v. 39, p. 426-433. 2007.
CHAPIN, F. S. et al. Consequences of Changing Biodiversity. Nature, v. 405, n. 6783, p,
234–242. 2000.
COMPTON, J. E.; T. D. HOOKER; S. S. PERAKIS. Ecosystem N distribution and δ15N
during a century of forest regrowth after agricultural abandonment. Ecosystems, v. 10, p.
1197-1208. 2007.
DAVIDSON, E. et al. Nitrogen and Phosphorus Limitation of Biomass Growth in a Tropical
Secondary Forest. Ecological Applications, v.14, n. 4, p. 150–163. 2004.
DAVIDSON, E. A. et al. Recuperation of Nitrogen Cycling in Amazonian Forests Following
Agricultural Abandonment. Nature, v. 447, n. 7147, p. 995–98. 2007.
DE BOER, W.; G. A. KOWALCHUK. Nitrification in acid soils: micro-organisms and
mechanisms. Soil Biology & Biochemistry, v. 33, n. 7–8, p. 853-866. 2001.

74
DIJKSTRA, F. A.; CHENG, W.; JOHNSON, D. W. Plant biomass influences rhizosphere
priming effects on soil organic matter decomposition in two differently managed soils. Soil
Biology and Biochemistry, v. 38, p. 2519–2526. 2006.
DIJKSTRA, F. A. et al. Phizosphere priming: a nutrient perspective. Frontiers in
Microbiology, v. 4, n. 216. 2013.
GONZÁLEZ-PÉREZ, J. A. et al. The effect off ire on soil organic matter – a review.
Environmental International, v. 30, p. 855-870. 2004.
HUYGENS, D. et al. Soil nitrogen conservation mechanisms in a pristine South Chilean
Nothofagus forest ecosystem. Soil Biology and Biochemistry, v. 39, p. 2448–2458. 2007.
INPE (2015) Amazon Program - Monitoring the Brazilian Amazon by satellite: The
PRODES, DETER, DEGRAD and TerraClass Systems. Available at www.inpe.br (accessed
01 February 2017).
IUSS Working Group WRB (2014) World reference base for soil resources 2015. World Soil
Resources Report No. 106. FAO, Rome. 2014.
KIRBY, K. R. et al. The Future of Deforestation in the Brazilian Amazon. Futures, v. 38, n.
4, p. 432–453. 2006.
KIRKHAM, D.; W. V. BARTHOLOMEW. Equations for following nutrient transformations
in soil, utilizing tracer data. Soil Sci. Soc. Am. Proc., v. 18, p. 33-34. 1954.
KITA, S. et al. Effects of cutting and regeneration on microbial activity of natural forest in
east Kalimantan. Journal of the Japanese Forestry Society, v. 87, p. 217-224 2005.
KOWALCHUK, G. A.; J. R. STEPHEN. Ammonia-oxidizing bacteria: a model for molecular
microbial ecology. Annual Review of Microbiology, v. 55, p. 485-529. 2001
LAURANCE, W. F. et al. The Future of the Brazilian Amazon. Ecology, v. 29, n. 5503, p.
438–439. 2001.
MARKEWITZ, D. et al. Nutrient loss and redistribution after forest clearing on a highly
weathered soil in Amazonia. Ecological Applications, v. 14, n. 4, p. S177-S199. 2004
MARTIN, P. A.; A. C. NEWTON; J. M. BULLOCK. Carbon pools recover more quickly
than plant biodiversity in tropical secondary forests. Proceedings of the Royal Society B.
2013
MCGRATH, D. A. Effects of Land-Use Change on Soil Nutrient Dynamics in Amazônia.
Ecosystems, v. 4, n. 7, p. 625–645. 2001.

75
NEILL, C. et al. Nitrogen Dynamics in Amazon Forest and Pasture Soils Measured by 15N
Pool Dilution. Soil Biology and Biochemistry, v. 31, n. 4, p. 567–72. 1999.
PANSINI, S. et al. Riqueza e seletividade de palmeiras ao longo de gradientes ambientais na
região do interflúvio Purus-Madeira em Porto Velho, RO. Biota Amazônica, v. 6, n. 2, p. 93-
100. 2016.
PAULA, F. S. et al. Land use change alters functions gene diversity, composition and
abundance in Amazon forest soil microbial communities. Molecular Ecology, v. 23, p. 2988-
2999. 2014.
RÜTTING, T. et al. Functional Role of DNRA and Nitrite Reduction in a Pristine South
Chilean Nothofagus Forest. Biogeochemistry, v. 90, n. 3, p. 243–258. 2008.
RÜTTING, T. et al. Assessment of the importance of dissimilatory nitrate reduction to
ammonium for the terrestrial nitrogen cycle. Biogeosciences, v. 8, p. 1779-1791. 2011.
RÜTTING, T. et al. Leaky nitrogen cycle in pristine African montane rainforest soil. Global
Biogeochemical Cycles, v. 29, p. 1754-1762. 2015.
SCHIMEL, J. P.; J. BENNETT. Nitrogen mineralization: challenges of a changing paradigm.
Ecology, v. 85, n. 3, p. 591-602. 2004
SCHMIDT, S. K. Biogeochemical Consequences of Rapid Microbial Turnover. Ecology, v.
88, n. 6, p. 1379–1385. 2007.
SCOWCROFT, P. G.; J. E. HARAGUCHI, N. V. HUE. Reforestation and topography affect
montane soil properties, nitrogen pools and nitrogen transformations in Hawaii. Soil Science
Society of America, v. 68, p. 959-968. 2004.
SILVER, W. L. et al. Nitrogen cycling in tropical plantation forests: potential controls on
nitrogen retention. Ecological Applications, v. 15, p. 1604-1614. 2005.
SOTTA, E. D.; M. D. Corre; E. Veldkamp. Differing N Status and N Retention Processes of
Soils under Old-Growth Lowland Forest in Eastern Amazonia, Caxiuanã, Brazil. Soil Biology
and Biochemistry, v. 40, n. 3, p. 740–50. 2008.
STANGE, C. F. et al. Automated and rapid online determination of 15N abundance and
concentration of ammonium, nitrite, or nitrate in aqueous samples by the SPINMAS
technique. Isotopes in Environmental and Health Studies, v. 43, n. 3, p. 227-236. 2007.
STEINER, C. et al. Nitrogen retention and plant uptake on a highly weathered central
Amazonian Ferralsol amended with compost and charcoal. Journal of Plant Nutrition and

76
Soil Science, v. 171, p. 893-899. 2008.
TEMPLER, P. H. et al. Plant and microbial controls on nitrogen retention and loss in a humid
tropical forest. Ecology, v. 89, n. 11, p. 3030-3040. 2008.
WANG, H. et al. Quality of Fresh Organic Matter Affects Priming of Soil Organic Matter and
Substrate Utilization Patterns of Microbes. Scientific Reports, v. 5, n. 10102 2015.
YANG, X. et al. Integration of Nitrogen Cycle Dynamics into the Integrated Science
Assessment Model for the Study of Terrestrial Ecosystem Responses to Global Change.
Global Biogeochemical Cycles, v. 23, n. 4, p. 1–18. 2009.
ZHANG, J.; Z. CAI; T. ZHU. N2O production pathways in the subtropical acid forest soils in
China. Environmental Research, v. 111, p. 643–649. 2011.
ZHANG, C. et al. Soil bacterial community dynamics reflect changes in plant community and
soil properties during the secondary succession of abandoned farmland in the Loess Plateau.
Soil Biology and Biochemistry, v. 97, p. 40-49. 2016.
ZOU, X. M. et al. Resin-core and buried-bag estimates of nitrogen transformations in Costa
Rican lowland rainforests. Plant and Soil, v. 139, p. 275-283. 1992.

77
6 SOIL ORGANIC MATTER CONTENT CONTROLS GROSS NITROGEN
DYNAMICS AND N2O PRODUCTION IN RIPARIAN AND UPLAND BOREAL
SOILi
Highlights:
Which soil properties control gross N transformations and N2O production pathways
in boreal soil?
Examined nitrogen dynamics in two boreal forest soils with 15N.
Considerable oxidation of organic N in boreal soil is the main source of N2O.
Soil organic matter is the main regulator of N transformations in boreal forest soil.
Summary
We investigated the pathways of gross soil nitrogen (N) transformations and nitrous oxide
(N2O) production with 15N enrichment techniques in a boreal forest landscape by comparing
organic (riparian) and mineral (upland) soil within two catchments in northern Sweden. The
values of all soil properties evaluated for the riparin and upland zones were statistically
different (P < 0.05). The rates of gross N transformation were larger in the riparian than in the
upland soil (P < 0.05), which can be explained by the larger soil organic matter (SOM)
content that provides energy and mineral N as a substrate for other processes. The riparian
soil at one site shows a decoupling of nitrification from mineralization; the largest gross
mineralization occurred in the soil at this site, but gross nitrification was relatively small. This
was probably because of the low pH (2.7 ± 0.1), which inhibits the activity of autotrophic
nitrifiers. Oxidation of organic N was the main source of N2O in the soil at all sites, probably
because of low soil pH and large organic carbon content, which favours heterotrophic
nitrification. The results of our study confirm that organic matter is the main regulating factor
of gross N mineralization and nitrification; the latter are markedly different in the organic rich
riparian soil from the upland soil in the boreal forest landscape.
iFIGUEIREDO, V.; ENRICH-PRAST, A.; RÜTTING, T. Soil organic matter content controls gross
nitrogen dynamics and N2O production in riparian and upland boreal soil. European Journal of Soil
Science, v. 67, p. 782-791, 2016. Doi: 10.1111/ejss.12384. Formatado segundo normas do periódico.

78
6.1 INTRODUCTION
Nitrogen (N) is the main limiting factor in primary production in most terrestrial ecosystems,
particularly at high latitudes (Vitousek & Howarth, 1991). Atmospheric deposition of N in
Europe is known to be large; it ranges from 1 to more than 75 kg N ha−1 year−1 (Corre &
Lamersdorf, 2004), but it is small in the boreal forests of northern Sweden (< 2 kg N ha-1 year-
1; IVL Svenska Miljöinstitutet, 2015). The major terrestrial reservoir of N is soil organic
matter (SOM). When this is mineralized it provides mineral N, which is readily taken up by
plants and immobilized by microorganisms (Booth et al., 2005). Moreover, autotrophic and
heterotrophic microbial processes transform forms of mineral N: autotrophic nitrification is
the oxidation of ammonium (NH4+) to nitrate (NO3
-) and denitrification, a heterotrophic
process that reduces NO3- to N2 gas (Butterbach-Bahl & Gundersen, 2011). Nitrous oxide
(N2O) is produced during both these microbial processes, which contributes to global
warming and stratospheric ozone depletion (Ravishankara et al., 2009). Nitrification releases
N2O as a by-product, whereas it is an obligate intermediate compound during denitrification
(Tiedje, 1988). In addition, microbial processes that rely on the oxidation of organic N have
been shown recently to contribute to N2O production in soil (Stange et al., 2009).
Nitrogen cycling in boreal soil varies considerably in spatial scale depending on N
availability, soil drainage, soil organic matter content (Högberg et al., 2007) and pH
(Rosenkranz et al., 2010). These edaphic factors differ between well-drained mineral soil in
the uplands and poorly-drained soil in the riparian zone (Ullah & Moore, 2009). The soil of
boreal forests stores a large amount of terrestrial carbon (C) in SOM, but the mineralization of
SOM that releases mineral N compounds is small because the microbial community is limited
by N (Hartley et al., 2010).
The boreal landscape is a mosaic of different ecosystems: forests, peatlands and lakes
(Nilsson & Wardle, 2005). Understanding the effect of biogeochemical cycles at the
landscape scale requires that this variation be considered. The typical terrestrial boreal
ecosystems of northern Sweden are dominated by forests, mainly Norway spruce (Picea abies
(L.) H. Karst.), Scots pine (Pinus sylvestris L.) and birches (Betula pubescens Ehrh. and
Betula pendula Roth) (Nilsson & Wardle, 2005; Jonsson et al., 2001). Boreal forests often
have different zones in terms of soil type, vegetation, amount of SOM and soil water content
(Högberg et al., 2006). In general, the upland zone away from the aquatic bodies has mature
trees and, compared to the riparian zone, less soil moisture and SOM content (Kurbatova et
al., 2013). The riparian zone is close to an aquatic system that is affected by changes in water

79
level, and it is vegetated mainly by mosses that often form peat. Large soil moisture content in
the riparian zone leads regularly to anoxic conditions, therefore, the N cycling dynamics can
be expected to differ from those of the upland forest zone (Tague et al., 2010).
The evaluation of gross N transformations in soil can provide important information
on the regulating mechanisms and dynamics of the soil N cycle, such as the extent of N
limitation, risks of N losses and its environmental controls. Therefore, we quantified rates of
gross N transformation (mainly mineralization and nitrification) and investigated N2O
production at two forested boreal sites in northern Sweden. We compared organic (riparian)
and mineral (upland) soil with 15N tracer techniques. The results of this study improve our
understanding of N cycling, and the sources and limitations of N in poorly- and well-drained
boreal forest soil.
6.2 MATERIAL AND METHODS
6.2.1 Study site
The study was carried out in northern Sweden at two different sites in the forest landscape.
Both sites encompassed riparian and upland zones on the west and east sides of two lakes.
Site 1, close to Lake Övre Björntjärn (64°07’N, 18°46’E), is covered mainly by coniferous
forests (65 %) and mires (27 %), whereas lakes cover 3.5 % only of the catchment (Jonsson et
al., 2001). Site 8 is around Lake Struptjärn (64°01’N, 19°29’E); it has 50 % coniferous forest,
37 % mires and 3.7 % lakes (Engström, 2013). The upland zones are vegetated by Norway
spruce and Scots pine on Podzols, whereas the riparian zones that border the lake shores are
vegetated by mosses that form peat. The climate in the region (measured at Vindeln, 64°08'N,
19°45'E; www.smhi.se) is characterized by an annual mean temperature of 1.5 °C and mean
annual precipitation of 591 mm for the period 1961–90.
At both sites, six soil samples were taken in the riparian and upland zones; three from
the western and three from the eastern sides of their corresponding lakes in August 2012.
Riparian zones were 10 m and upland zones were 110 m from the lakes on both west and east
sides. The samples were distributed approximately equally with ~30 m between them and
parallel to the shoreline of the lake. Sampling locations were chosen to be representative of
the ecosystems investigated in terms of vegetation and soil type, which prevented a strict
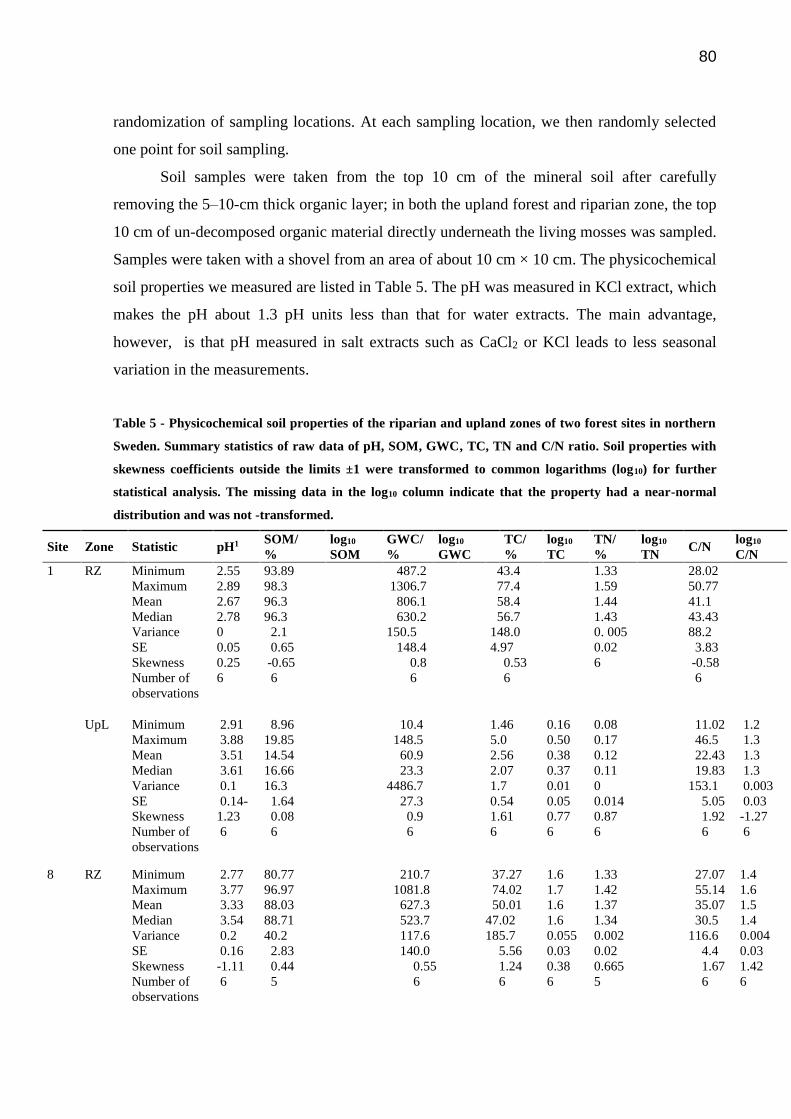
80
randomization of sampling locations. At each sampling location, we then randomly selected
one point for soil sampling.
Soil samples were taken from the top 10 cm of the mineral soil after carefully
removing the 5–10-cm thick organic layer; in both the upland forest and riparian zone, the top
10 cm of un-decomposed organic material directly underneath the living mosses was sampled.
Samples were taken with a shovel from an area of about 10 cm × 10 cm. The physicochemical
soil properties we measured are listed in Table 5. The pH was measured in KCl extract, which
makes the pH about 1.3 pH units less than that for water extracts. The main advantage,
however, is that pH measured in salt extracts such as CaCl2 or KCl leads to less seasonal
variation in the measurements.
Table 5 - Physicochemical soil properties of the riparian and upland zones of two forest sites in northern
Sweden. Summary statistics of raw data of pH, SOM, GWC, TC, TN and C/N ratio. Soil properties with
skewness coefficients outside the limits ±1 were transformed to common logarithms (log10) for further
statistical analysis. The missing data in the log10 column indicate that the property had a near-normal
distribution and was not -transformed.
Site Zone Statistic pH1 SOM/
%
log10
SOM
GWC/
%
log10
GWC
TC/
%
log10
TC
TN/
%
log10
TN C/N
log10
C/N
1 RZ Minimum
Maximum
Mean
Median
Variance
SE
Skewness
Number of
observations
2.55
2.89
2.67
2.78
0
0.05
0.25
6
93.89
98.3
96.3
96.3
2.1
0.65
-0.65
6
487.2
1306.7
806.1
630.2
150.5
148.4
0.8
6
43.4
77.4
58.4
56.7
148.0
4.97
0.53
6
1.33
1.59
1.44
1.43
0. 005
0.02
6
28.02
50.77
41.1
43.43
88.2
3.83
-0.58
6
UpL Minimum
Maximum
Mean
Median
Variance
SE
Skewness
Number of
observations
2.91
3.88
3.51
3.61
0.1
0.14-
1.23
6
8.96
19.85
14.54
16.66
16.3
1.64
0.08
6
10.4
148.5
60.9
23.3
4486.7
27.3
0.9
6
1.46
5.0
2.56
2.07
1.7
0.54
1.61
6
0.16
0.50
0.38
0.37
0.01
0.05
0.77
6
0.08
0.17
0.12
0.11
0
0.014
0.87
6
11.02
46.5
22.43
19.83
153.1
5.05
1.92
6
1.2
1.3
1.3
1.3
0.003
0.03
-1.27
6
8 RZ Minimum
Maximum
Mean
Median
Variance
SE
Skewness
Number of
observations
2.77
3.77
3.33
3.54
0.2
0.16
-1.11
6
80.77
96.97
88.03
88.71
40.2
2.83
0.44
5
210.7
1081.8
627.3
523.7
117.6
140.0
0.55
6
37.27
74.02
50.01
47.02
185.7
5.56
1.24
6
1.6
1.7
1.6
1.6
0.055
0.03
0.38
6
1.33
1.42
1.37
1.34
0.002
0.02
0.665
5
27.07
55.14
35.07
30.5
116.6
4.4
1.67
6
1.4
1.6
1.5
1.4
0.004
0.03
1.42
6
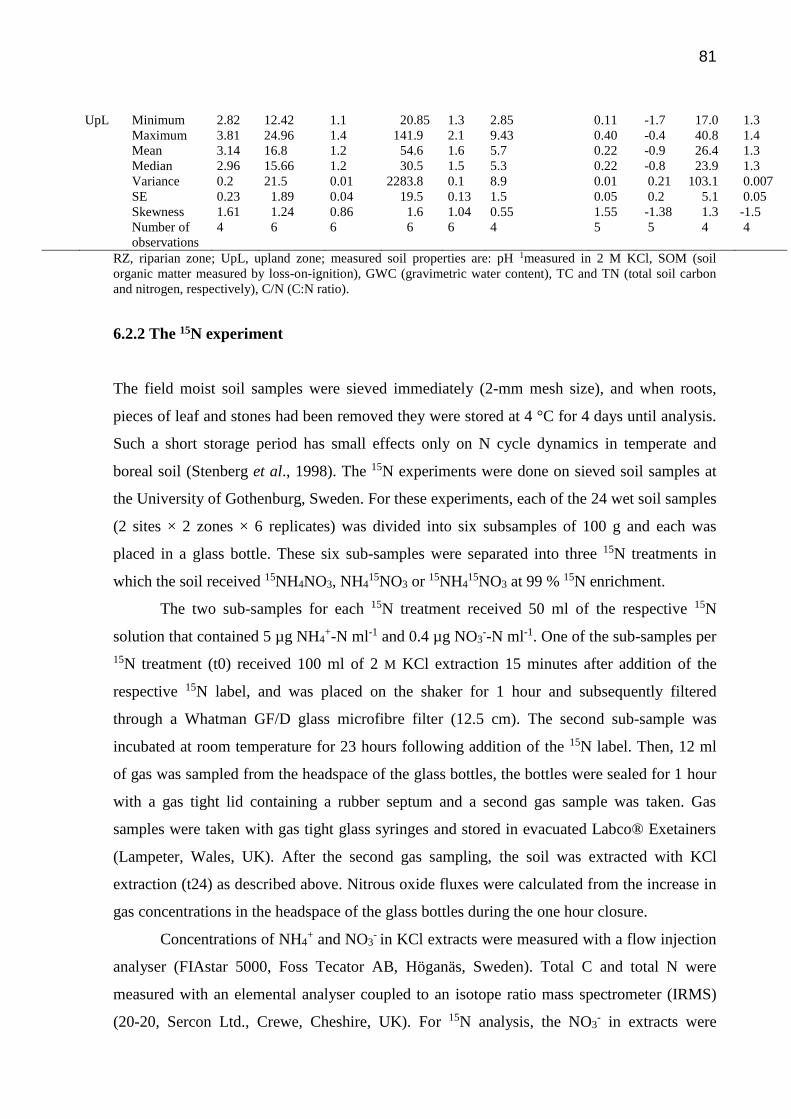
81
UpL Minimum
Maximum
Mean
Median
Variance
SE
Skewness
Number of
observations
2.82
3.81
3.14
2.96
0.2
0.23
1.61
4
12.42
24.96
16.8
15.66
21.5
1.89
1.24
6
1.1
1.4
1.2
1.2
0.01
0.04
0.86
6
20.85
141.9
54.6
30.5
2283.8
19.5
1.6
6
1.3
2.1
1.6
1.5
0.1
0.13
1.04
6
2.85
9.43
5.7
5.3
8.9
1.5
0.55
4
0.11
0.40
0.22
0.22
0.01
0.05
1.55
5
-1.7
-0.4
-0.9
-0.8
0.21
0.2
-1.38
5
17.0
40.8
26.4
23.9
103.1
5.1
1.3
4
1.3
1.4
1.3
1.3
0.007
0.05
-1.5
4
RZ, riparian zone; UpL, upland zone; measured soil properties are: pH 1measured in 2 M KCl, SOM (soil
organic matter measured by loss-on-ignition), GWC (gravimetric water content), TC and TN (total soil carbon
and nitrogen, respectively), C/N (C:N ratio).
6.2.2 The 15N experiment
The field moist soil samples were sieved immediately (2-mm mesh size), and when roots,
pieces of leaf and stones had been removed they were stored at 4 °C for 4 days until analysis.
Such a short storage period has small effects only on N cycle dynamics in temperate and
boreal soil (Stenberg et al., 1998). The 15N experiments were done on sieved soil samples at
the University of Gothenburg, Sweden. For these experiments, each of the 24 wet soil samples
(2 sites × 2 zones × 6 replicates) was divided into six subsamples of 100 g and each was
placed in a glass bottle. These six sub-samples were separated into three 15N treatments in
which the soil received 15NH4NO3, NH415NO3 or 15NH4
15NO3 at 99 % 15N enrichment.
The two sub-samples for each 15N treatment received 50 ml of the respective 15N
solution that contained 5 µg NH4+-N ml-1 and 0.4 µg NO3
--N ml-1. One of the sub-samples per
15N treatment (t0) received 100 ml of 2 M KCl extraction 15 minutes after addition of the
respective 15N label, and was placed on the shaker for 1 hour and subsequently filtered
through a Whatman GF/D glass microfibre filter (12.5 cm). The second sub-sample was
incubated at room temperature for 23 hours following addition of the 15N label. Then, 12 ml
of gas was sampled from the headspace of the glass bottles, the bottles were sealed for 1 hour
with a gas tight lid containing a rubber septum and a second gas sample was taken. Gas
samples were taken with gas tight glass syringes and stored in evacuated Labco® Exetainers
(Lampeter, Wales, UK). After the second gas sampling, the soil was extracted with KCl
extraction (t24) as described above. Nitrous oxide fluxes were calculated from the increase in
gas concentrations in the headspace of the glass bottles during the one hour closure.
Concentrations of NH4+ and NO3
- in KCl extracts were measured with a flow injection
analyser (FIAstar 5000, Foss Tecator AB, Höganäs, Sweden). Total C and total N were
measured with an elemental analyser coupled to an isotope ratio mass spectrometer (IRMS)
(20-20, Sercon Ltd., Crewe, Cheshire, UK). For 15N analysis, the NO3- in extracts were
82
converted to N2O (Stevens & Laughlin, 1994) and then analysed with a trace gas preparation
unit (ANCA-TGII, PDZ Europa, Crewe, UK) coupled to an isotope ratio mass spectrometer
(IRMS) (20-20, Sercon Ltd., Crewe, Cheshire, UK). The 15N enrichment of NH4+ was
analysed by the microdiffusion technique (Brooks et al., 1989) in which NH4+ is trapped in
acidified glass fibre filters and analysed with an elemental analyser (ANCA-GSL, PDZ
Europa, Crewe, UK) interfaced to the same type of IRMS as above. With the same EA-IRMS,
dried soil samples were analysed for total C and N content together with 15N enrichment.
Headspace samples were analysed for 15N enrichment of N2O with the same IRMS as above.
All isotope analyses were done at the Stable Isotope Facility at the University of California,
Davis, CA.
6.2.3 Calculations and statistics
Gross rates of N transformation (i.e. mineralization, nitrification and consumption of NH4+
and NO3-) were calculated with the analytical 15N tracer model of Kirkham & Bartholomew
(1954), and are presented separately on soil dry weight (SDW) and soil organic matter (SOM)
weight basis. The following equations were used to quantify gross mineralization (m) with
NH4+ as the form of N used and gross nitrification with NO3
- as the form of N:
, (1)
where N0 and Nt are soil NH4+ or NO3
- concentration at time zero and t, respectively, t is the
time in days. The APE0 and APEt are the 15N atom percent excess of NH4+ or NO3
- at time
zero and t, respectively. Separate gross rates for autotrophic and heterotrophic nitrification
were calculated based on the equations of Huygens et al. (2008) with data from the 15NH4+
labelling treatment. In that context, the autotrophic pathway is defined as NH4+ oxidation and
the heterotrophic pathway as oxidation of organic N. The following equation calculates gross
autotrophic nitrification (nA):
, (2)

83
where and are the soil NO3- concentrations at time zero and t, respectively,
is the percentage 15N at time zero, is the 15N atom percentage at time t,
corrected for NO3- consumption as described in Huygens et al. (2008) and %NH4
+av is the
average 15N atom percentage of the NH4+ pool. The heterotrophic nitrification is the
difference between total nitrification and autotrophic nitrification. There is more information
on Equation (2) in Huygens et al. (2008).
A two-way analysis of variance (ANOVA) was done to examine the effects of
different sites and zones and their interactions on soil properties. The Shapiro–Wilk’s test for
normality was used to examine the statistical distribution of soil properties and gross N
transformations. The residuals from the analysis of variance (ANOVA) were examined and
some of these were not normally distributed (skewness values were outside the limits ±1,
Table 5). Therefore, we transformed TC and C/N ratio in the upland zone at site 1, SOM, TC,
TN and C/N ratio in the riparian zone at site 8, and SOM, GWC, TN and C/N ratio in the
upland zone at site 8 to common logarithms (log10) to achieve a distribution close to normal.
We also transformed the C/N ratios so that they were additive for ANOVA. The transformed
data were then back-transformed with Equation (3) where is the mean on the log10 scale and
s2 is the variance on that scale (Table 6):
y = exp ( × ln(10) + 0.5 × s2 × ln(10)2) (3)
The two-way ANOVA was also used to examine the effect of sites and zones on gross
N transformations. Both analyses were done with SigmaPlot (Version 11, Systat Software,
Inc. San Jose, CA, USA). The replication at site level was a true replication, but that at the
zone level was considered pseudo-replication. Because of the latter we calculated the F ratio
for all of the ANOVAs and checked the significance with one degree of freedom. The
analytical solution of the inverse abundance approach (IAA) was applied to calculate the
fractions of NH4+ oxidation, NO3
- reduction and organic N oxidation that contribute to the
production of N2O. The IAA is based on a separate 15N labelling of different forms of N and
tracing the 15N label into N2O. Although NH4+ oxidation and NO3
- reduction can be estimated
by labelling the respective substrate, organic N oxidation is estimated from N2O derived from
the unlabelled substrate, which is assumed to be the organic N pool, after concomitant 15N
labelling of NH4+ and NO3
- (Stange et al., 2009).
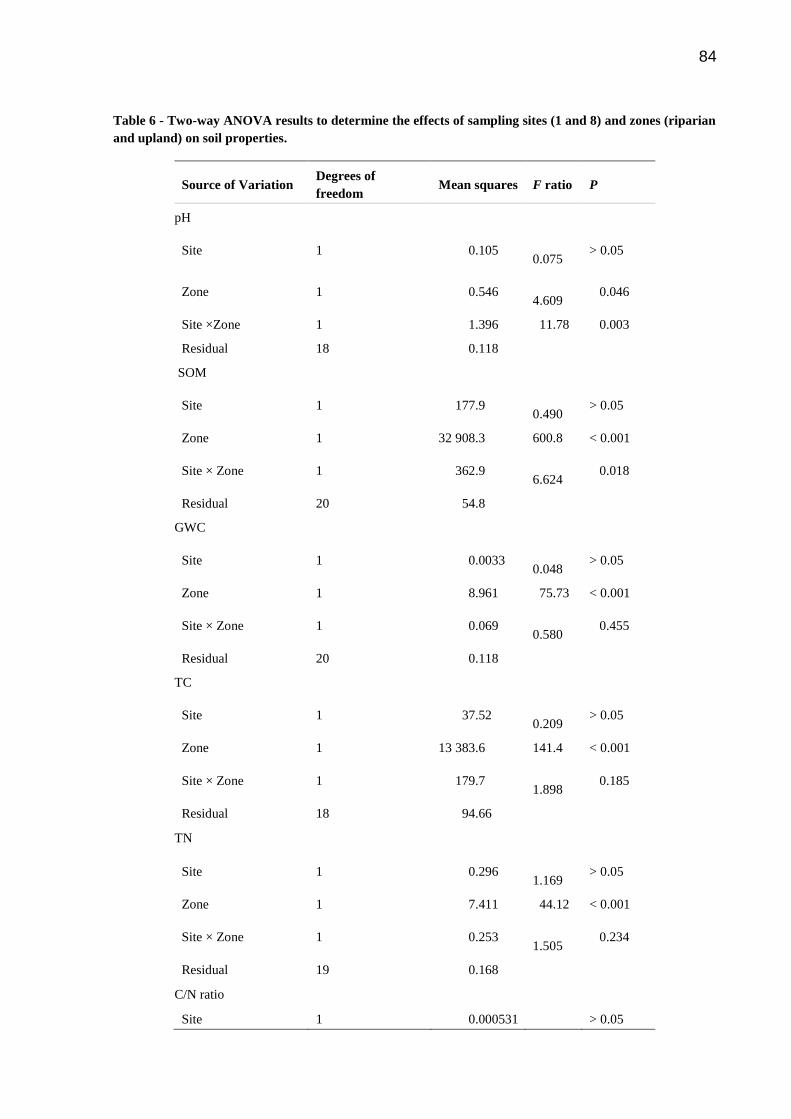
84
Table 6 - Two-way ANOVA results to determine the effects of sampling sites (1 and 8) and zones (riparian
and upland) on soil properties.
Source of Variation Degrees of
freedom Mean squares F ratio P
pH
Site 1 0.105
0.075 > 0.05
Zone 1 0.546
4.609 0.046
Site ×Zone 1 1.396 11.78 0.003
Residual 18 0.118
SOM
Site 1 177.9
0.490 > 0.05
Zone 1 32 908.3 600.8 < 0.001
Site × Zone 1 362.9
6.624 0.018
Residual 20 54.8
GWC
Site 1 0.0033
0.048 > 0.05
Zone 1 8.961 75.73 < 0.001
Site × Zone 1 0.069
0.580 0.455
Residual 20 0.118
TC
Site 1 37.52
0.209 > 0.05
Zone 1 13 383.6 141.4 < 0.001
Site × Zone 1 179.7
1.898 0.185
Residual 18 94.66
TN
Site 1 0.296
1.169 > 0.05
Zone 1 7.411 44.12 < 0.001
Site × Zone 1 0.253
1.505 0.234
Residual 19 0.168
C/N ratio
Site 1 0.000531 > 0.05

85
0.014
Zone 1 0.244 10.62 0.004
Site × Zone 1 0.0368
1.603 0.222
Residual 18 0.0230
The F ratio for sites was calculated from the mean square of site divided by the mean
square of site × zone with one degree of freedom.
6.3 RESULTS
The boreal forest soil evaluated here was acid, with a very low pH (between 2.7 and 3.5) in
both zones and sites. This is considered low even though it has been measured in KCl.
Landscape position had a significant effect on the other soil properties examined (Table 6). At
both sites, riparian soil had means of GWC, SOM content, TC and TN contents, and a C/N
ratio that were significantly larger than those of the upland soil at the same site (Table 5 and
Table 6; P < 0.05). This result indicates that the values of TC, TN and C/N ratio depend on
the amount of SOM available. However, there were no significant differences in soil
properties between sites 1 and 8 when the same zones were compared (Table 6; P > 0.05).
The results for the two-way ANOVA show an interaction between site and zone for pH and
SOM in relation to their F ratios and P values (Table 6).

86
0
5
10
15
20
25 Site 1
Site 8(e)
Min
erali
zati
on
/
ug
N g
-1 S
OM
day
-1
0
5
10
15(b)
NH
4+ C
on
sum
pti
on
/
ug
N g
-1 S
DW
day
-1
0
5
10
15
20(f)
NH
4+ C
on
sum
pti
on
/
ug N
g-1
SO
M d
ay
-1
0.0
0.5
1.0
1.5
2.0
2.5(c)
Nit
rif
icati
on
/
ug
N g
-1 S
DW
day
-1
0
1
2
3
4(g)
Nit
rif
icati
on
/
ug
N g
-1 S
OM
day
-1
0
1
2
3
4
RZ UpL
(d)
NO
3- C
on
sum
pti
on
/
ug
N g
-1 S
DW
day
-1
0
1
2
3
4
5
RZ UpL
(h)
NO
3- C
on
sum
pti
on
/
ug
N g
-1 S
OM
day
-1
0
5
10
15
20
25(a)
Min
erali
zati
on
/
ug
N g
-1 S
DW
day
-1
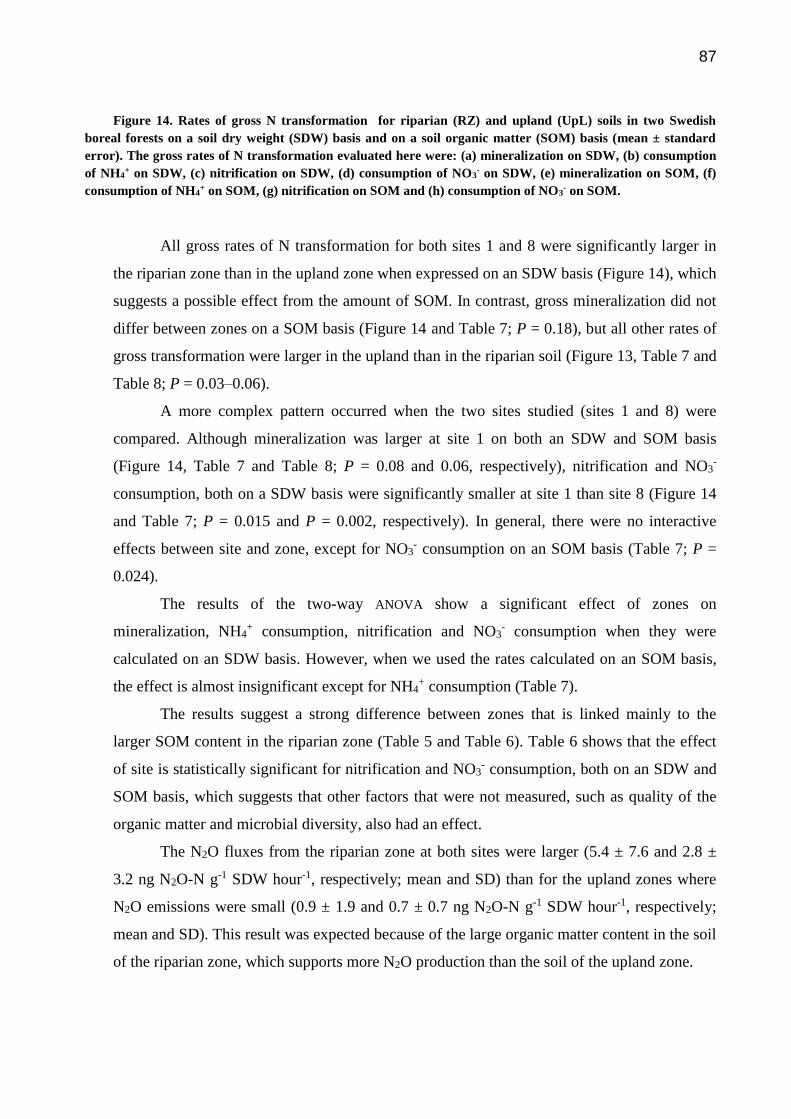
87
Figure 14. Rates of gross N transformation for riparian (RZ) and upland (UpL) soils in two Swedish
boreal forests on a soil dry weight (SDW) basis and on a soil organic matter (SOM) basis (mean ± standard
error). The gross rates of N transformation evaluated here were: (a) mineralization on SDW, (b) consumption
of NH4+ on SDW, (c) nitrification on SDW, (d) consumption of NO3
- on SDW, (e) mineralization on SOM, (f)
consumption of NH4+ on SOM, (g) nitrification on SOM and (h) consumption of NO3
- on SOM.
All gross rates of N transformation for both sites 1 and 8 were significantly larger in
the riparian zone than in the upland zone when expressed on an SDW basis (Figure 14), which
suggests a possible effect from the amount of SOM. In contrast, gross mineralization did not
differ between zones on a SOM basis (Figure 14 and Table 7; P = 0.18), but all other rates of
gross transformation were larger in the upland than in the riparian soil (Figure 13, Table 7 and
Table 8; P = 0.03–0.06).
A more complex pattern occurred when the two sites studied (sites 1 and 8) were
compared. Although mineralization was larger at site 1 on both an SDW and SOM basis
(Figure 14, Table 7 and Table 8; P = 0.08 and 0.06, respectively), nitrification and NO3-
consumption, both on a SDW basis were significantly smaller at site 1 than site 8 (Figure 14
and Table 7; P = 0.015 and P = 0.002, respectively). In general, there were no interactive
effects between site and zone, except for NO3- consumption on an SOM basis (Table 7; P =
0.024).
The results of the two-way ANOVA show a significant effect of zones on
mineralization, NH4+ consumption, nitrification and NO3
- consumption when they were
calculated on an SDW basis. However, when we used the rates calculated on an SOM basis,
the effect is almost insignificant except for NH4+ consumption (Table 7).
The results suggest a strong difference between zones that is linked mainly to the
larger SOM content in the riparian zone (Table 5 and Table 6). Table 6 shows that the effect
of site is statistically significant for nitrification and NO3- consumption, both on an SDW and
SOM basis, which suggests that other factors that were not measured, such as quality of the
organic matter and microbial diversity, also had an effect.
The N2O fluxes from the riparian zone at both sites were larger (5.4 ± 7.6 and 2.8 ±
3.2 ng N2O-N g-1 SDW hour-1, respectively; mean and SD) than for the upland zones where
N2O emissions were small (0.9 ± 1.9 and 0.7 ± 0.7 ng N2O-N g-1 SDW hour-1, respectively;
mean and SD). This result was expected because of the large organic matter content in the soil
of the riparian zone, which supports more N2O production than the soil of the upland zone.

88
Table 7 - Results of two-way ANOVA to determine the effects of sampling sites (1 and 8) and zones
(riparian and upland) on gross N transformations (mineralization, NH4+ consumption, nitrification and
NO3- consumption) on a soil dry weight basis (µg N g-1 SDW day-1) and a soil organic matter basis (µg N g-
1 SOM day-1).
Source of Variation Degrees of
freedom Mean squares F ratio P
Mineralization
Site 1 0.349 1.347 > 0.05
Zone 1 2.053 19.839 < 0.001
Site × Zone 1 0.259 2.5 0.130
Residual 19 0.104 - -
NH4+ consumption
Site 1 0.00232 0.111 > 0.05
Zone 1 1.420 15.25 < 0.001
Site × Zone 1 0.0209 0.224 0.641
Residual 19 0.145 - -
Nitrification
Site 1 0.652 5.015 > 0.05
Zone 1 1.683 18.39 < 0.001
Site × Zone 1 0.130 1.418 0.248
Residual 20 0.0915 - -
NO3- consumption
Site 1 1.366 3.415 > 0.05
Zone 1 1.225 10.95 0.004
Site × Zone 1 0.400 3.577 0.073
Residual 20 0.112 - -
Mineralization (SOM)
Site 1 0.343 2.931 > 0.05
Zone 1 0.168 1.995 0.178
Site × Zone 1 0.117 1.364 0.257
Residual 19 0.0860 - -
NH4+ consumption (SOM)
Site 1 0.00186 3.924 > 0.05
Zone 1 0.424 5.674 0.028
Site × Zone 1 0.000474
0.0063
4
0.937
Residual 19 0.0747 - -

89
Nitrification (SOM)
Site 1 0.656 2.351 > 0.05
Zone 1 0.346 3.989 0.060
Site × Zone 1 0.279 3.209 0.088
Residual 20 0.0868 - -
NO3- consumption (SOM)
Site 1 1.372 2.142 > 0.05
Zone 1 0.606 5.646 0.028
Site × Zone 1 0.641 5.963 0.024
Residual 20 0.107 - -
We applied the IAA method (Stange et al., 2009) to evaluate the contribution of NH4+
oxidation, NO3- reduction and oxidation of organic N to N2O production in the soil samples
studied. Ammonium oxidation had an insignificant effect on N2O production for both,
riparian and upland zones at sites 1 and 8, with a mean contribution between 0 and 0.6 %
(Figure 15). Reduction of NO3- contributed between 7.8 and 32.1 % to N2O production. The
largest contribution was observed in the upland soil at site 8, whereas the smallest was in the
upland soil at site 1 (Figure 15). Consequently, the contribution of NO3- reduction to the N2O
produced was greater in the upland than in the riparian soil at site 8, whereas the reverse
pattern was observed for site 1. The main source of N2O production in the soil of both zones
was the oxidation of organic N, with average contributions of between 67.7 % and 92.2 %
(Figure 15). The small contribution of NH4+ oxidation to the production of N2O at both sites
and zones was linked with the small gross rates of autotrophic nitrification that range between
0.02 and 0.03 µg N g-1 SDW day-1, whereas gross heterotrophic nitrification dominated
nitrification activity (Table 9). Moreover, neither the site nor the zone show any effect on the
type of nitrification because autotrophic nitrification was very small at all of them.

90
Table 8 - Gross rates of N transformation (mineralization, NH4+ consumption, nitrification and NO3
-
consumption) on a soil dry weight basis (µg N g-1 SDW day-1) and a soil organic matter basis (µg N g-1
SOM day-1) at sampling sites (1 and 8) and zones (riparian and upland).
Values are means and standard errors (n = 6).
IAA
RZ UpL RZ UpL
0
20
40
60
80
100
120ONH4
+
RNO3-
ONorg
Site 1 Site 8
Co
ntr
ibu
tio
n o
n
N2O
pro
du
ctio
n/
%
Figure 15. Contribution of NH4+ oxidation (white), NO3
- reduction (grey) and organic N oxidation (black)
to N2O production in riparian (RZ) and upland (UpL) soils in two Swedish boreal forests (sites 1 and 8).
Means ± standard error are shown (n = 6).
Site Zone
Mineralization/
µg N g-1
SDW day-1
NH4+
consumption/
µg N g-1
SDW day-1
Nitrification/
µg N g-1
SDW day-1
NO3-
consumption/
µg N g-1
SDW day-1
Mineralization/
µg N g-1
SOM day-1
NH4+
consumption/
µg N g-1
SOM day-1
Nitrification/
µg N g-1
SOM day-1
NO3-
consumption/
µg N g-1
SOM day-1
1
RZ 14.7 7.7 0.7 0.5 15.3 7.9 0.7 0.6
UpL 2.1 2.1 0.2 0.3 14.4 14.6 1.7 1.8
8
RZ 4.7 6.1 1.9 2.4 5.4 7.2 2.2 2.8
UpL 1.8 2.4 0.4 0.5 10.6 13.5 2.7 3.05
SE 1.95 1.14 1.19 0.23 3.21 2.42 0.46 0.5

91
Table 9 - Rates of gross autotrophic and heterotrophic nitrification (µg N g-1 SDW day-1) at sites 1 and 8,
riparian and upland zones (n = 6; mean of each process at different sites and zones and standard errors).
Nitrification rate/ µg N g-1 SDW day-1
Autotrophic Heteretrophic
Site 1 RZ 0.03 0.63
UpL 0.02 0.25
Site 8 RZ 0.03 1.83
UpL 0.03 0.40
SE 0.026 0.2
SDW, soil dry weight; RZ, riparian zone. UpL, upland zone.
6.4 . DISCUSSION
Our results for the rates of gross N transformation in boreal soil were larger in the riparian
zones than in the upland forests, as expected (Figure 14). This probably reflects the larger
SOM content (Table 5). All N transformations depend, directly or indirectly, on the
decomposition of SOM by microorganisms, which provides energy and releases mineral N as
a substrate for other processes (Booth et al., 2005). The importance of SOM for regulating
processes in the N cycle is demonstrated by the fact that most gross rates did not differ
between the riparian and upland soil when expressed on SOM content (Figure 14). Nitrogen
mineralization in poorly drained soil can be small because of the lack of oxygen availability
(Chen & Shrestha, 2012). On the other hand, organic soil provides a large amount of organic
matter that can stimulate microbial processes (Niedermeier & Robinson, 2007). In the riparian
soil at sites 1 and 8, the observed gross mineralization (14.8 and 4.7 µg N g-1 SDW day-1,
respectively) and nitrification (0.7 and 1.9 µg N g-1 SDW day-1, respectively) compare in
magnitude to those from other studies. For peatlands in boreal and cold climates, gross
mineralization of 1.1 to 16.2 µg N g-1 SDW day-1 and gross nitrification of 1.2 µg N g-1 SDW
day-1 have been reported (Marushchak et al., 2011; Wray & Bayley, 2008). For the upland
forest soil, gross N mineralization was close to rates reported for Podzols in the United
Kingdom (Cookson et al., 2007). For other mineral forest soils, others have reported rates of
gross nitrification close to those measured in the present research (Corre & Lamersdorf, 2004;
Rosenkranz et al., 2010).
Booth et al. (2005) reported a negative correlation between gross N mineralization and
C/N ratio in forest soil, which is related to the amount of N released from SOM compared to
the amount of C mineralized. Högberg et al. (2007) found a similar relation in Swedish boreal

92
forest soil. In temperate forest soil in the USA, Christenson et al. (2009) evaluated gross soil
N dynamics in the organic and mineral layers. There was a negative correlation between gross
nitrification and C/N ratio in the organic layer, and between gross mineralization, NH4+
consumption and nitrification in mineral layer. In all of the three studies cited above, the C/N
ratio was related to N transformations, which suggests that SOM composition and lability
regulate them. We found no relation between gross N transformations and the C/N ratio. This
is probably because the previous studies mentioned calculated correlations separately for
mineral and organic forest soil layers, whereas we sampled both soil layers together. The C/N
ratio in our study was larger in the riparian than in the upland soil (Table 5 and Table 7), but
the larger value in the riparian soil does not correspond to a small gross rate of N
mineralization. Our results suggest that other soil properties regulate the differences in gross
N dynamics between the riparian and upland zones, mainly the SOM content.
Table 10 - Physicochemical soil properties of the riparian and upland zones of two forest sites in northern
Sweden.
Means and standard error (SE) of raw and log10 transformed data, and the back-transformed means with
confidence limits (α = 0.05) in brackets are given after examining the skewness of the residuals from the
two-way ANOVA. When the skewness was outside the limits ±1, the data were transformed to
log10logarithms. The missing data in ‘Log10 columns’indicate that the soil property had a near-normal
distribution. The values for GWC are in the range of what is expected for (undrained) peat soil.
The gross rates of consumption of NH4+ and NO3
-, in general, follow the gross rates of
production closely (Figure14), which Banning et al. (2008) reported earlier. Gross
nitrification is usually strongly correlated with gross mineralization (e.g. Booth et al., 2005)
because mineralization produces the substrate for nitrification. Small changes in
mineralization might have a large effect on N availability for nitrification (Banning et al.,
2008). However, the riparian soil at site 1 shows a decoupling of nitrification from
Site Zone pH1 log10
SOM SOM/%
log10
GWC GWC/%
log10
TC TC/%
log10
TN TN/%
log10
C/N C/N
1 RZ 2.7 ±
0.05
96.3 ± 0.2 806 ± 64 58.4 ± 2.0 1.4 ± 0.02 41.1 ± 1.5
UpL 3.5 14.4 ± 0.7 61± 11 0.3 ±
0.05
2.1
[1.6, 2.5]
0.1 ± 0.005 1.3 ±
0.02
19.3
[21.2, 17.3]
8 RZ 3.3 88.03 ± 2.8 627 ± 57 1.6 ±
0.03
45.3
[39.1, 51.1]
0.13 ±
0.005
1.37
[1.3, 1.4]
1.5 ±
0.03
31,1
[27.2, 34.7]
UpL 3.15 1.2 ±
0.04
16.9
[13.3, 20.1]
1.6 ±
0.13
55.7
[22.8, 76.7]
5.7 ± 0.5 –0.7 ±
0.08
0.05
[0.1, 0.3]
1.3 ±
0.03
21.8
[17.5, 25.8]
SE 0.14

93
mineralization; the largest gross mineralization occurred in this soil, but gross nitrification
was relatively small (Figure 14). This is because the soil at the sites investigated showed that
heterotrophic nitrification was the main nitrification pathway (Table 9), which does not
depend on mineralization. One possible explanation for the small rates of gross nitrification in
the soil of the riparian site is the low pH (2.7 ± 0.1) of this soil, even though all the soil
samples were acidic with a pH in the range of 3.1 to 3.5 (Table 6 and Table 10). The pH
affects the equilibrium between NH3 and NH4+ and has a great effect on the availability of
substrate for nitrifiers (Suziki et al., 1974). In our acidic soil, the equilibrium will be strongly
towards NH4+, which would limit autotrophic nitrification (Prosser & Nicol, 2012). A soil pH
of less than 5 is considered to inhibit autotrophic nitrification (De Boer et al., 1991).
However, autotrophic nitrification could have occurred locally at sites with neutral pH
(Prosser & Nicol, 2012) or the autotrophic nitrifiers could be archaeal, which Gubry-Rangin
et al. (2011) have shown to be active at a pH as low as 3.5. Less is known about the effect of
pH on heterotrophic nitrifiers, but our results indicate that all nitrification activity decreased
when pH fell below 3. The subtle differences in pH and GWC (Table 5 and Table 10), which
regulate nitrification and denitrification in the soil (Szukics et al., 2010), could explain the
effect of sites and zones on nitrification and NO3- consumption (Table 7) and, consequently,
regulate these gross rates in different ways (Figure 14).
We investigated which processes contribute to N2O production in the soils studied
with the IAA (Stange et al., 2009). In all soil, heterotrophic nitrification of organic N was the
main N process that contributed to N2O production (67.7–92.2 %; Figure 15 and Table 5).
Zhang et al. (2015) showed that heterotrophic nitrification is an important or even
predominant source of N2O production in acidic subtropical (27–42 %; Zhang et al., 2011)
and temperate forests (40–80 %; Stange et al., 2013). Here we provide evidence for a similar
pattern in boreal forests. Notably, when these three different climatic zones are compared, the
contribution of heterotrophic nitrification seems to increase towards colder climates (Liu et
al., 2015).
In general, soil with a low pH, large SOM content and oxygen availability are
favourable to heterotrophic nitrification (Zhang et al., 2015). Although heterotrophic nitrifiers
are known to produce N2O (Papen et al., 1989), alternative processes exist that can explain
the large contribution of organic N as a source for N2O production. First, heterotrophic
nitrifiers might oxidize organic N to nitrite (NO2-) or NO3
-, which is subsequently reduced by
denitrifiers to produce N2O. Second, archaeal nitrifiers are known to be mixotrophic, i.e.
autotrophic and heterotrophic, and to produce N2O. Consequently, it is possible that part of

94
the N2O derived from organic N is produced by autotrophic, archaeal nitrifiers (Prosser &
Nicol, 2012).
Oxidation of NH4+ was insignificant as a source of N2O; it contributed 2 % at the most
(Figure 15 and Table 9). The third source of N2O evaluated here was NO3- reduction, which
contributed substantially to N2O production in both zones and indicated the N2O released by
denitrification. As discussed above, however, the contribution of denitrifiers to N2O
production might have been underestimated because some of the N2O derived from organic N
might ultimately be produced by denitrifiers. Therefore, heterotrophic processes have more
effect on N2O production in boreal soil and production is greater in riparian than upland zones
because of the large amount of organic matter present that maintains heterotrophic
nitrification and denitrification.
6.5 CONCLUSION
The results of our research confirm greater gross N mineralization and nitrification in organic
rich riparian soil than in the upland soil of the boreal forest landscape because of differences
in SOM content. In general, there was no difference between the soil zones when gross N
transformations are expressed on an SOM basis. Small amounts of mineralized N only were
nitrified, which indicated more heterotrophic than autotrophic microbial activity. Likewise,
N2O production was dominated by heterotrophic processes, which rely directly or indirectly
on the oxidation of organic N. Evaluation of gross N transformations and interactions with
edaphic factors are important, especially in N limited ecosystems to understand the dynamics
of N cycling and N limitation.
ACKNOWLEDGEMENTS
We thank Karina Tôsto and Leverson Chaves for assistance in the field and laboratory; Ann-
Kristin Bergström and Jan Karlsson (Umeå University) for logistic help; Alex Enrich Prast is
a research fellow from CNPq (Conselho Nacional de Desenvolvimento Científico e
Tecnológico) and Cientista do Estado from FAPERJ (Fundação de Amparo à Pesquisa do
Estado do Rio de Janeiro). Viviane Figueiredo thanks CNPq, CAPES (Coordenação de
Aperfeiçoamento de Pessoal de Nível Superior) and STINT (The Swedish Foundation for
International Cooperation in Research and Higher Education) and the Coordinate Research
Network - CRN3 - Nnet Project Interamerican Institute for Global Change Research for travel

95
support from Brazil to Sweden for field work and sample analyses. Tobias Rütting is
supported by the Swedish strategic research area “Biodiversity and Ecosystem services in a
Changing Climate – BECC” (www.becc.lu.se/).
6.6 REFERENCES
Banning, N.C., Grant, C.D., Jones, D.L. & Murphy, D.V. 2008. Recovery of soil organic
matter, organic matter turnover and nitrogen cycling in a post-mining forest rehabilitation
chronosequence. Soil Biology & Biochemistry, 40, 2021–2031.
Booth, M.S., Stark, J.M. & Rastetter, E. 2005. Controls on nitrogen cycling in terrestrial
ecosystems: a synthetic analysis of literature data. Ecological Monographs, 75, 139–157.
Brooks, P.D., Stark, J.M., McInteer, B.B. & Preston, T. 1989. Diffusion method to prepare
soil extracts for automated nitrogen-15 analysis. Soil Science Society of America Journal, 53,
1707–1711.
Butterbach-Bahl, K. & Gundersen, P. 2011. Nitrogen processes in terrestrial ecosystems. In:
The European Nitrogen Assessment: Sources, Effects, and Policy Perspectives (eds M. A.
Sutton, C. M. Howard, J. W. Erisman, G. Billen, A. Bleeker, P. Greenfelt, et al.), pp. 99-125.
Cambridge University Press, Cambridge, United Kingdom.
Chen, H.Y.H. & Shrestha, B.M. 2012. Stand age, fire and clearcutting affect soil organic
carbon and aggregation of mineral soils in boreal forests. Soil Biology & Biochemistry, 50,
149–157.
Christenson, L.M., Lovett, G.M., Weathers, K.C. & Arthur, M.A. 2009. The influence of tree
species, nitrogen fertilization, and soil C to N ratio on gross soil nitrogen transformations. Soil
Science Society of America Journal, 73, 638–646.
Cookson, W.R., Osman, M., Marschner, P., Abaye, D.A., Clark, I., Murphy, D.V., et al. 2007.
Controls on soil nitrogen cycling and microbial community composition across land use and
incubation temperature. Soil Biology & Biochemistry, 39, 744–756. Corre, M.D. &
Lamersdorf, N.P. 2004. Reversal of nitrogen saturation after long-term deposition reduction:
impact on soil nitrogen cycling. Ecology, 85, 3090–3014.
De Boer, W., Kelin Gunnewiek, P.J.A., Veenhuis, M., Bock, E. & Laanbroek, H.J. 1991.
Nitrification at low pH by aggregated chemolithotrophic bacteria. Applied and Evironmental
Microbiology, 57, 3600–3604.

96
Engström, L. 2013. Effects of Forestry on Stream Water Chemistry During Autumn. Degree
Thesis, Umea University, Umea, Sweden.
Gruby-Rangin, C., Hai, B., Quince, C., Engel, M., Thomson, B.C., James, P., et al. 2011.
Niche specialization of terrestrial archaeal ammonia oxidizers. PNAS, 108, 21206–21211.
Hartley, I.P., Hopkins, D.W., Sommerkorn, M. & Wookey, P.A. 2010. The response of
organic matter mineralisation to nutrient and substrate additions in sub-arctic soils. Soil
Biology & Biochemistry, 42, 92–100.
Högberg, M.N., Myrold, D.D., Giesler, R. & Högberg, P. 2006. Contrasting patterns of soil
N-cycling in model ecosystems of Fennoscandian boreal forests. Oecologia, 147, 96–107.
Högberg, M.N., Chen, Y. & Högberg, P. 2007. Gross nitrogen mineralisation and fungi-to-
bacteria ratios are negatively correlated in boreal forests. Biology and Fertility of Soils, 44,
363–366.
Huygens, D., Boeckx, P., Templer, P., Paulino, L., Van Cleemput, O., Oyarzún, C. et al.
2008. Mechanisms for retention of bioavailable nitrogen in volcanic rainforest soils. Nature
Geoscience, 1, 543–548.
IVL Svenska Miljöinstitutet, 2015. Krondroppsnätet 1985-2015 - tre decennier med
övervakning av luftföroreningaroch dess effekter i skogsmark. In: IVL Rapport C 127,
Göteborg, Sweden. www.krondroppsnatet.ivl.se
Jonsson, A., Meili, M., Bergström, A.K. & Jansson, M. 2001. Whole-lake mineralization of
allochthonous and autochthonous organic carbon in a large humic lake (Örträsket, N.
Sweden). Limnology and Oceanography, 46, 1691–1700.
Kirkham, D., & Bartholomew, W.V. 1954. Equations for following nutrient transformations
in soil, utilizing tracer data. Soil Science Society Proceedings, 18, 33–34.
Kurbatova, J., Tatarinov, F., Molchanov, A., Varlagin, A., Avilov, V., Kozlov, D., et al. 2013.
Partitioning of ecosystem respiration in a paludified shallow-peat spruce forest in the southern
taiga of European Russia. Environmental Research Letters, 8, 1–9.
Liu, R., Suter, H., He, J., Hayden, H. & Chen, D. 2015. Influence of temperature and moisture
on the relative contributions of heterotrophic and autotrophic nitrification to gross nitrification
in an acid cropping soil. Journal of Soils and Sediments, 15, 2304–2309.
Marushchak, M.E., Pitkämäki, A., Koponen, H., Biasi, C., Seppäla, M. & Martikainen, P.J.
2011. Hot spot for nitrous oxide emissions found in different types of permafrost peatlands.
Global Change Biology, 17, 2601–2614.

97
Niedermeier, A. & Robinson, J.S. 2007. Hydrological controls on soil redox dynamics in a
peat-based, restored wetland. Geoderma, 137, 318–326.
Nilsson, M.C. &Wardle, D.A. 2005. Understory vegetation as a forest ecosystem driver:
evidence from the northern Swedish boreal forest. Frontiers in Ecology and the Environment,
3, 421–428.
Papen, H., von Berg, R., Hinkel, I., Thoene, B., & Rennenberg, H. 1989. Heterotrophic
nitrification by Alcaligenes faecalis: NO2-, NO3
-, N2O, and NO production in exponentially
growing cultures. Applied and Environmental Microbiology, 55, 2068–2072.
Prosser, J.I. & Nicol, G.W. 2012. Archaeal and bacterial ammonia-oxidisers in soil: the quest
for niche specialisation and differentiation. Trends in Microbiology, 20, 523–531.
Ravishankara, A.R., Adniel, J.S. & Portmann, R.W. 2009. Nitrous oxide (N2O): the dominant
ozone-depleting substance emitted in the 21st century. Science, 326, 123–125.
Rosenkranz, P., Dannenmann, M., Brüggemann, N., Papen, H., Berger, U., Zumbush, E. et al.
2010. Gross rates of ammonification and nitrification at a nitrogen-saturated spruce (Picea
abies (L.) Karst.) stand in southern Germany. European Journal of Soil Science, 61, 745–758.
Stange, C.F., Spott, O. & Müller, C. 2009. An inverse abundance approach to separate soil
nitrogen pools and gaseous nitrogen fluxes into fractions related to ammonium, nitrate and
soil organic nitrogen. European Journal of Soil Science, 60, 907–915.
Stange, C.F., Spott, O., Arriaga, H., Menéndez, S., Estavillo, J.M. & Merino, P. 2013. Use of
the inverse abundance approach to identify the sources of NO and N2O release from Spanish
forest soils under oxic and hypoxic conditions. Soil Biology and Biochemistry, 57, 451–458.
Stenberg, B., Johansson, M., Pell, M., Sjödahl-Svensson, K., Stenström, J., & Torstensson, L.
1998. Microbial biomass and activities in soil as affected by frozen and cold storage. Soil
Biology & Biochemistry, 30, 393–402.
Stevens, R.J. & Laughlin, R.J. 1994. Determining nitrogen-15 in nitrite or nitrate by
producing nitrous oxide. Soil Science Society of America Journal, 58, 1108–1116.
Suzuki, I., Dular, U. & Kwok, S.C. 1974. Ammonia or ammonium ion as substrate for
oxidation by Nitrosomonas europea cells and extracts. Journal of Bacteriology, 120, 556–558.
Szukics, U., Abell, G.C.J., Höld, V., Mitter, B., Sessitsch, A., Hackl, E., et al. 2010. Nitrifiers
and denitrifiers respond rapidly to changed moisture and increasing temperature in a pristine
forest soil. Federation of European Microbiological Societies Microbial Ecology, 72, 395–
406.
Tague, C., Band, L., Kenworthy, S. & Tenebaum, D. 2010. Plot- and watershed-scale soil
moisture variability in a humid Piedmont watershed. Water Resources Research, 46, 1–13.

98
Tiedje, J.M. 1988. Ecology of denitrification and dissimilatory nitrate reduction to
ammonium. In: Environmental Microbiology of Anaerobes. (ed. A.J.B. Zehnder), pp. 179–
244. John Wiley & Sons, New York.
Ullah, S. & Moore, T.R. 2009. Soil drainage and vegetation controls of nitrogen
transformation rates in forest soils, southern Quebec. Journal of Geophysical Research, 114,
1–13.
Vitousek, P.M. & Howarth, R.W. 1991. Nitrogen limitation on land and in the sea: How can it
occur? Biogeochemistry, 13, 87–115.
Wray, H.E. & Bayley, S.E. 2008. Nitrogen dynamics in floating and non-floating peatlands in
the Western Boreal Plain. Canadian Journal of Soil Science, 88, 697–708.
Zhang J., Cai, Z. & Zhu, T. 2011. N2O production pathways in the subtropical acid forest soils
in China. Environmental Research, 111, 643–649.
Zhang, J., Müller, C. & Cai, Z. 2015. Heterotrophic nitrification of organic N and its
contribution to nitrous oxide emissions in soils. Soil Biology & Biochemistry, 84, 199–209.

99
7 VIAS DO CICLO DO NITROGÊNIO EM SOLOS DE DIFERENTES LATITUDES
Diferentes mecanismos de produção e ciclagem de N controlam a disponibilidade de N
em solos, sendo influenciados por fatores reguladores característicos de cada ecossistema
avaliado nesta tese. Em sistemas terrestres, a dinâmica do N pode ainda ser alterada por
mudanças do uso do solo, comumente encontradas em regiões tropicais e boreais.
Parâmetros físico-químicos do solo como conteúdo de matéria orgânica e água no
solo, e pH e temperatura, se mostraram os principais fatores reguladores dos processos de
produção de NH4+ e NO3
- em solos de florestas tropicais, e também boreais (DE BOER;
KOWALCHUK, 2001; BOOTH et al., 2005; BRAKER et al., 2010; LIU et al., 2015;
FIGUEIREDO et al., 2016). Isso se torna bastante interessante, uma vez que esses
ecossistemas são extremamente distintos em relação ao clima, sazonalidade, tipo de
vegetação, disponibilidade de nutrientes, dentre outros, o que mostra a intima relação entre
tais fatores reguladores e os processos avaliados. O que não exclui uma possível regulação por
outros fatores em sinergia com os parâmetros físico-químicos mencionados acima.
As hipóteses apresentadas no início desta tese foram avaliadas ao longo dos capítulos
apresentados o que nos permite chegar as seguintes conclusões:
7.1 COMPARAÇÃO ENTRE FLORESTAS PRISTINAS DE DIFERENTES LATITUDES
Diante do que foi apresentado ao longo da tese, verificamos que comparando florestas
pristinas tropicais (Capítulo 4 e 5) e boreais com solos bem drenados [zona de montana (UpL
zone), Capítulo 6], que foram mais semelhantes aos tropicais avaliados, os boreais apresentam
taxas de mineralização bruta bastante inferiores às taxas de mineralização bruta encontradas
para florestas pristinas amazônicas e de Mata Atlântica (Tabela 11). Entretanto, a nitrificação
foi bastante semelhante entre florestas boreais, com diferentes níveis de drenagem (floresta de
zona ripária e de montana) e florestas de Mata Atlântica (Tabela 12), sendo essas taxas muito
baixas, e extremamente inferiores às taxas de nitrificação bruta encontradas nas florestas
amazônicas avaliadas (Tabela 11). Dessa forma, ao dividirmos nossa primeira hipótese entre
os dois processes avaliados nos três diferentes ecossistemas, verificamos que ela foi
corroborada para a mineralização e corroborada para nitrificação quando comparamos as
taxas de florestas boreais com floresta amazônica.

100
Hipótese 1a: Taxas de mineralização bruta são mais elevadas em solos de florestas
pristinas tropicais do que boreais: CORROBORADA
Tabela 11 - Taxas brutas de mineralização nas três florestas de diferentes latitudes que foram investigadas
no presente estudo (Mata Atlântica, Amazônia e Boreal; Média ± Erro Padrão).
Ecossistema
estudado
Tipos de
floresta
Taxa de
mineralização
Mata Atlântica Pristina 6,3
Amazônia Pristina 11,1
Boreal
Zona de montana
Site 1 2,1
Site 8 1,8
Entretanto, a hipótese 1 foi refutada para a comparação com a floresta de Mata
Atlântica, visto que esta apresentou taxas de nitrificação semelhantes às boreais.
Hipótese 1b: Taxas de nitrificação bruta são mais elevada em solos de florestas
pristinas tropicais do que boreais: REFUTADA.
Tabela 12 - Taxas brutas de nitrificação nas três florestas de diferentes latitudes que foram investigadas
no presente estudo (Mata Atlântica, Amazônia e Boreal; Média ± Erro Padrão).
Ecossistema
estudado
Tipos de
floresta
Taxa de
nitrificação
Mata Atlântica Pristina 0,08
Amazônia Pristina 15,9
Boreal
Zona de montana
Site 1 0,2
Site 8 0,4
Como visto na Base Teórica, a temperatura é um fator regulador importante ao se
tratar do metabolismo de micro-organismos (PETTERSSON; BAATH, 2003). Uma vez que
florestas boreais apresentam baixas temperaturas durante a maior parte do ano, as taxas de
mineralização tendem a ser mais baixas do que florestas tropicais sob mesmas condições de
drenagem (POTTER et al., 1999). Isso também é confirmado visto que o conteúdo de matéria
101
orgânica no solo é maior nas florestas boreais estudadas, ou seja, o substrato para a ocorrência
do processo de mineralização, está presente, mas por regulação de outros fatores, não é
degradado facilmente. Um desses fatores, além da temperatura, é o conteúdo de água no solo,
pois florestas boreais de zonas ripárias (riparian zone - RZ; Capítulo 6) apresentaram taxas de
mineralização bruta semelhantes e até mesmo mais altas que algumas das florestas tropicais
avaliadas, enquanto florestas boreais de montana, com alta drenagem, apresentaram taxas
bastante inferiores (Tabela 11). Dessa forma, florestas boreais apresentam acúmulo de matéria
orgânica, sendo consideradas importantes sumidouros de carbono (MALHI et al., 1999). Em
contrapartida, as altas temperaturas dos trópicos, em sinergia com o alto índice de
precipitação, fazem com que a matéria orgânica não se acumule, e o conteúdo nos solos seja
inferior ao encontrado em florestas boreais (SANCHES et al., 2009).
A semelhança encontrada entre florestas boreais e de Mata Atlântica para o processo
de nitrificação indica uma limitação por N em ambos os ecossistemas, visto que esse processo
aumenta a perda de N e tende a ser evitado em baixo conteúdo de N. Além disso, notamos um
desacoplamento entre os dois processos avaliados, principalmente na Mata Atlântica, pois a
NH4+ necessária para a nitrificação está sendo produzida via mineralização, porém utilizada
por outras vias, que podem ser assimilação por plantas, por exemplo. Fatores reguladores
abióticos também parecem estar regulando esse processo em ambos os solos, sendo o
principal responsável o pH do solo, que inibe a nitrificação autotrófica. Mesmo com taxas
inferiores às encontradas na floresta pristina amazônica, solos de florestas secundárias
amazônicas apresentaram taxas mais altas de nitrificação do que boreais e de Mata Atlântica.
Isso indica uma ciclagem bastante diferenciada entre esses ecossistemas, com maior
disponibilidade de N em solos amazônicos. Além disso, um fator importante que atua na
regulação de nutrientes em solos é o tipo de vegetação, que assimila formas e quantidades de
N inorgânico diferenciadas, e pode estar atuando nesse sentido na disponibilidade de N para a
microbiota (DIJKSTRA et al., 2006). Assim, verificamos que nossa segunda hipótese foi
corroborada.
Hipótese 2: O conteúdo de matéria orgânica lábil e o pH do solo são os principais
fatores reguladores do processo de mineralização e nitrificação, respectivamente, em
solos boreais: CORROBORADA.
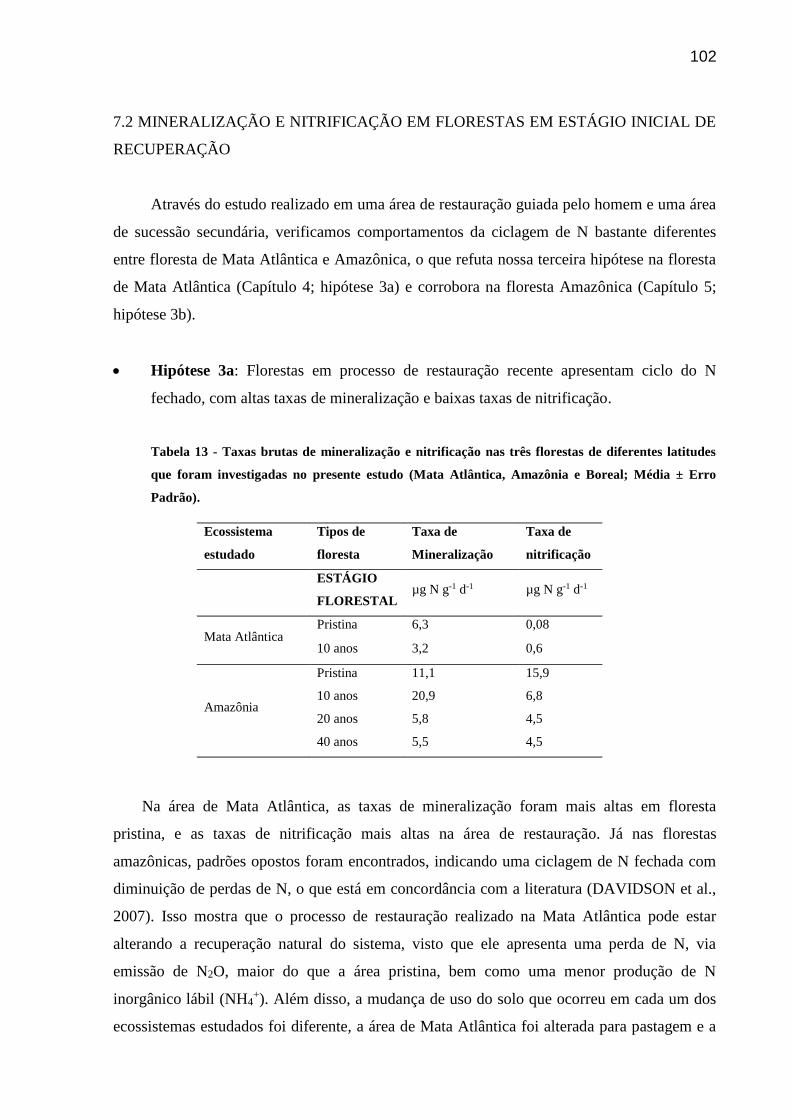
102
7.2 MINERALIZAÇÃO E NITRIFICAÇÃO EM FLORESTAS EM ESTÁGIO INICIAL DE
RECUPERAÇÃO
Através do estudo realizado em uma área de restauração guiada pelo homem e uma área
de sucessão secundária, verificamos comportamentos da ciclagem de N bastante diferentes
entre floresta de Mata Atlântica e Amazônica, o que refuta nossa terceira hipótese na floresta
de Mata Atlântica (Capítulo 4; hipótese 3a) e corrobora na floresta Amazônica (Capítulo 5;
hipótese 3b).
Hipótese 3a: Florestas em processo de restauração recente apresentam ciclo do N
fechado, com altas taxas de mineralização e baixas taxas de nitrificação.
Tabela 13 - Taxas brutas de mineralização e nitrificação nas três florestas de diferentes latitudes
que foram investigadas no presente estudo (Mata Atlântica, Amazônia e Boreal; Média ± Erro
Padrão).
Ecossistema
estudado
Tipos de
floresta
Taxa de
Mineralização
Taxa de
nitrificação
ESTÁGIO
FLORESTAL µg N g-1 d-1 µg N g-1 d-1
Mata Atlântica Pristina 6,3 0,08
10 anos 3,2 0,6
Amazônia
Pristina 11,1 15,9
10 anos 20,9 6,8
20 anos 5,8 4,5
40 anos 5,5 4,5
Na área de Mata Atlântica, as taxas de mineralização foram mais altas em floresta
pristina, e as taxas de nitrificação mais altas na área de restauração. Já nas florestas
amazônicas, padrões opostos foram encontrados, indicando uma ciclagem de N fechada com
diminuição de perdas de N, o que está em concordância com a literatura (DAVIDSON et al.,
2007). Isso mostra que o processo de restauração realizado na Mata Atlântica pode estar
alterando a recuperação natural do sistema, visto que ele apresenta uma perda de N, via
emissão de N2O, maior do que a área pristina, bem como uma menor produção de N
inorgânico lábil (NH4+). Além disso, a mudança de uso do solo que ocorreu em cada um dos
ecossistemas estudados foi diferente, a área de Mata Atlântica foi alterada para pastagem e a

103
área Amazônica para agricultura, com uso de fogo. Em geral, solos de pastagem antigas são
pobres em nutrientes e solos agrícolas com influência de fogo apresentam uma maior
quantidade de matéria orgânica em processo de decomposição mais avançada devido a
biomassa vegetal queimada (GONZÁLEZ-PÉREZ et al., 2004; WICK et al., 2005). Dessa
forma, o tipo de mudança de uso do solo também pode estar influenciando o processo de
restauração florestal e controlando a recuperação da ciclagem do N em solos.
7.3 EMISSÃO DE N2O EM SOLOS TROPICAIS
Em solos de florestas tropicais pristinas, espera-se encontrar altas emissões de N2O,
uma vez que a comunidade microbiana e a biomassa vegetal já estão estabelecidas no sistema,
permitindo uma ciclagem de N aberta, com maiores perdas por emissão de gases e lixiviação
de NO3- (DAVIDSON et al., 2007). Entretanto, em florestas de Mata Atlântica, encontramos
resultados opostos, com maiores emissões de N2O em floresta em restauração. Como as taxas
de nitrificação e a temperatura foram mais altas nesses solos durante o período de
amostragem, podemos associar a emissão de N2O a esses fatores, principalmente porque foi
vista uma correlação positiva entre o fluxo de N2O e a temperatura do solo. Logo, a menor
biomassa vegetal associada ao estágio inicial de restauração pode estar permitindo o
aquecimento do solo e, consequentemente, estimulando o metabolismo microbiano e gerando
taxas mais altas, como as verificadas para nitrificação e emissão de N2O, o que refuta nossa
quarta hipótese.
Hipótese 4: Florestas tropicais em restauração emitem menos N2O que florestas
pristinas: REFUTADA.
Vale a pena ressaltar que há variações sazonais de temperatura no solo, o que irá
influenciar, e até potencializar, as emissões de N2O, pois nossas medidas foram realizadas
durante a estação mais fria do ano, o que não pode ser extrapolado para a estação mais quente
na região.

104
8 CONCLUSÕES
Concluímos que apesar das diferenças marcantes entre solos tropicais e boreais, os
fatores reguladores dos processos de mineralização e nitrificação são bastante semelhantes,
com limitação por N na maioria dos ambientes estudados, exceto floresta pristina amazônica.
Também verificamos que o estágio de restauração florestal tem um forte controle sobre a
recuperação da ciclagem do N, uma vez que as plantas necessitam investir em biomassa para
o crescimento estrutural e são boas competidoras. Dessa forma, a nitrificação é regulada
negativamente, até que haja maior disponibilidade de N no ambiente, o que torna o ciclo do N
conservativo, como visto em florestas amazônicas. Entretanto, florestas tropicais de Mata
Atlântica, apresentaram um padrão oposto, com maior perda de N por emissão de N2O em
solos que esperávamos ser conservativo, o que parece estar atrelado ao estágio de restauração
desta floresta e a recente alteração do solo. Diante disso, concluímos que padrões de ciclagem
de nitrogênio devem ser verificados para cada tipo de ecossistema, uma vez que
características locais são de suma importância, buscando reduzir incertezas sobre a ciclagem
de N, suas perdas via lixiviação e emissão de gases, principalmente N2O, evidenciando as
consequências de alterações humanas em ecossistemas terrestres.
105
9 REFERÊNCIAS
As referências a seguir são correspondentes aos capítulos 1, 2, 3, 7 e 8.
AIDE, T. M. et al. Forest Regeneration in a Chronosequence of Tropical Abandoned Pastures:
Implications for Restoration Ecology. Restoration Ecology, v. 8, n. 4, p. 328–338, 2000.
AIDE, T. M. et al. Deforestation and Reforestation of Latin America and the Caribbean
(2001–2010). Biotropica, v. 45, n. 2, p. 262–271, 2013.
AMAZONAS, N. T. et al. Nitrogen Dynamics during Ecosystem Development in Tropical
Forest Restoration. Forest Ecology and Management, v. 262, n. 8, p. 1551–1557, 2011.
AMBUS, P.; MOSIER, A; CHRISTENSEN, S. Nitrogen turnover rates in a riparian fen
determined by 15N dilution. Biology and Fertility of Soils, v. 14, p. 230–236, 1992.
AUSTIN, A. T. et al. Latin America's Nitrogen Challenge. Science, v. 340, p. 149, 2013.
BAGGS, E. Soil microbial sources of nitrous oxide: recent advances in knowledge, emerging
challenges and future direction. Current Opinion in Environmental Sustainability, v. 3, p.
321–327, 2011.
BAJWA, K. S.; ANEJA, V. P.; ARYA, S. P. Measurement and estimation of ammonia
emissions from lagoon-atmosphere interface using a coupled mass transfer and chemical
reactions model, and an equilibrium model. Atmospheric Environment, v. 40, p. 275–286,
2006.
BARONA, E. et al. The role of pasture and soybean in deforestation of the Brazilian Amazon.
Environmental Research Letters, v. 5. 2010.
BENGTSSON, G.; P. BENGTSON; K. F. MANSSON. Gross nitrogen mineralization-,
immobilization-, and nitrification rates as a function of soil C/N ratio and microbial activity.
Soil Biology and Biochemistry, v. 35, p. 143–154, 2003.
BLASKO, B. et al. Relations among soil microbial community composition, nitrogen
turnover, and tree growth in N-loaded and previously N-loaded boreal spruce forest. Forest
Ecology and Management, v. 302, p. 319-328, 2013.
BODIRSKY, B. L. et al. Reactive nitrogen requirements to feed the world in 2050 and
potential to mitigate nitrogen pollution. Nature Communications, v. 5, n. 3858, 2014.
BOLLMANN, A.; R. CONRAD. Influence of O2 availability on NO and N2O release by
nitrification and denitrification in soils. Global Change Biology, v. 4, p. 387-396, 1998.

106
BOUWMAN, L. et al. Exploring global changes in nitrogen and phosphorus cycles in
agriculture induced by livestock production over the 1900–2050 period. PNAS, v. 110, n. 52.
p. 20882–20887, 2013.
BOOTH, M. S.; J. M. STARK; R. EDWARD. Controls on Nitrogen Cycling in Terrestrial
Ecosystems: A Synthetic Analysis of Literatura Data. Ecological Monographs, v. 75, n. 2, p.
139–57, 2005.
BRADY, N. C. Natureza e propriedades dos solos. [S. l.]: Freitas Bastos, 1989. 898 p.
BRAKER, G.; SCHWARZ, J.; CONRAD, R. Influence of temperature on the composition
and activity of denitrifying soil communities. Fems Microbiology Ecology, v. 73, n. 1, p.
134–148, 2010.
BRAKER, G.; CONRAD, R. Diversity, Structure, and Size of N2O-Producing Microbial
Communities in Soils--What Matters for Their Functioning? In: ALLEN, I. LASKIN, S. S.;
GEOFFREY, M. G. (Eds.). Advances in Applied Microbiology. [S. l.]: Academic Press,
2011. v. 75, p. 33–70.
BROWN, J. R. et al. Effects of multiple global change treatments on soil N2O fluxes.
Biogeochemistry, v. 109, p. 85-100, 2012.
BUTTERBACH-BAHL, K. et al. Nitrous oxide from soils: how well do we understand the
processes and their controls? Philosophical Transactions, v. 368, 2013.
CANFIELD, D. E.; GLAZER, A. N.; FALKOWSKI, P. G. The Evolution and Future of
Earth's Nitrogen Cycle. Science, v. 330, p. 192–196, 2010.
CARMO, J. B. et al. Conversion of the coastal Atlantic forest to pasture: Consequences for
the nitrogen cycle and soil greenhouse gas emissions. Agriculte, Ecosystems and
Environmental, v. 148, p. 37-43, 2012.
CHEN, X. P. et al. Producing more grain with lower environmental costs. Nature, v. 514, p.
486–489, 2014a.
CHEN, Z. M. et al. Nitrous oxide emissions from cultivated black soil: a case study in
Northeast China and global estimates using empirical model. Global Biogeochemical Cycles,
v. 28, p. 1311–1326, 2014b.
CLEVELAND, C. C. et al. Global patterns of terrestrial biological nitrogen (N2) fixation in
natural ecosystems. Global Biogeochemical Cycles, v. 13, n. 2, p. 623–645, 1999.

107
COLE, J. A. Assimilatory and dissimilatory reduction of nitrate to ammonia. In: COLE, J. A.;
FERGUSON, S. J. (Eds.). The Nitrogen and Sulphur Cycles. Cambridge: Cambridge
University Press, 1988. p. 281–329.
DAMASCENO, A. A. Estoque de carbono em áreas de recuperação da Mata Atlântica
com diferentes idades na Bacia do Rio Guapiaçú, Cachoeiras de Macacu, Rio de Janeiro.
Seropédica, 2012. 123 f. Dissertação (Mestrado) - Universidade Federal Rural do Rio de
Janeiro, Seropédica, 2012.
DAVIDSON, E. A. et al. Recuperation of Nitrogen Cycling in Amazonian Forests Following
Agricultural Abandonment. Nature, v. 447, n. 7147, p. 995–98, 2007.
DE BOER, W.; KOWALCHUK, G. A. Nitrification in acid soils: micro-organisms and
mechanisms. Soil Biology & Biochemistry, v. 33, n. 7–8, p. 853-866, 2001.
DIJKSTRA, F. A.; CHENG, W.; JOHNSON, D. W. Plant biomass influences rhizosphere
priming effects on soil organic matter decomposition in two differently managed soils. Soil
Biology and Biochemistry, v. 38, p. 2519–2526, 2006.
DIJKSTRA, F. A. et al. Phizosphere priming: a nutrient perspective. Frontiers in
Microbiology, v. 4, n. 216, 2013.
DRISCOLL, C. T. et al. Effects of acidic desposition on forest and aquatic ecosystems In the
New York State. Environmental Pollution, v. 123, p. 327–336, 2003.
ERLER, The contribution of anammox and denitrification to sediment N2 production in a
surface flow constructed wetland. Environmental Science & Technology, v. 42, n. 24, p.
9144-9150, 2008.
FIENCKE, C.; SPIECK, E.; BOCK, E. Nitrifying Bacteria. In: WERNER, D.; NEWTON, W.
E. (Ed.). Nitrogen Fixation in Agriculture, Forestry, Ecology and the Environment.
Amsterdam: Springer Netherlands, 2006. v. 4, p. 255–276. (Nitrogen Fixation: Origins,
Apllications, and Research Progress).
FIGUEIREDO, V. S. Influência do pulso de inundação sobre as emissões de óxido nitroso
(N2O) em áreas alagadas tropicais. Rio de Janeiro, 2012. 90 f. Dissertação (Mestrado em
Ecologia) - Instituto de Biologia, Universidade Federal do Rio de Janeiro, Rio de Janeiro,
2012.
FIGUEIREDO, V.; A. ENRICH-PRAST; T. RÜTTING. Soil organic matter content controls
gross nitrogen dynamics and N2O production in riparian and upland boreal soil. European
Journal of Soil Science, v. 67, p. 782-791, 2016.

108
GALLOWAY, J. N. et al. Transformation of the nitrogen cycle: Recent trends, questions, and
potential solutions. Science, v. 320, p. 889–892, 2008.
GANDOLFI, S.; RODRIGUES, R. R. Metodologias de restauração florestas. In: CARGILL,
F. (Ed.). Manejo ambiental e manejo de áreas degradadas. [S. l.: s. n.], 2007. p. 109-143.
GIBBS, H. K. et al. Monitoring and estimating tropical forest carbon stocks: Making REDD a
reality. Environmental Research Letters, v. 2, p. 1–13, 2007.
GONZÁLEZ-PÉREZ, J. A. et al. The effect off ire on soil organic matter – a review.
Environmental International, v. 30, p. 855-870, 2004.
GUNDERSEN, P.; SCHMIDT, I. K.; RAULUND-RASMUSSEN, K. Leaching of nitrate
from temperate forests — effects of air pollution and forest management. Environmental
Reviews, v. 14, p. 1–57, 2006.
HADEN, V. R. et al. Ammonia toxicity in aerobc rice: use of soil properties to predict
ammonia volatilization following urea application and the adverse effects on germination.
European Journal of Soil Science, v. 62, p. 551–559, 2011.
HALBLEIB, C. M.; LUDDEN, P. W. Regulation of Biological Nitrogen Fixation. Journal of
Nutrition, v. 130, n. 5, p. 1081–1084, 2000.
HARTLEY, I. P. et al. The response of organic matter mineralisation to nutrient and substrate
additions in sub-arctic soils. Soil Biology and Biochemistry, v. 42, p. 92–100, 2010.
HARTMANN, A. A.; NIKLAUS, P. A. Effects of simulated drought and nitrogen fertilizer on
plant productivity and nitrous oxide (N2O) emissions of two pastures. Plant Soil, v. 361, p.
411–426, 2012.
HAYATSU, M.; TAGO, K.; SAITO, M. Various players in the nitrogen cycle: Diversity and
functions of the microorganisms involved in nitrification and denitrification. Soil Science and
Plant Nutrition, v. 54, p. 33–45, 2008.
HEDIN, L. O. et al. The Nitrogen Paradox in Tropical Forest Ecosystems. Annual Review of
Ecology, Evolution, and Systematics, v. 40, p. 613–635, 2009.
HÖGBERG, M. N. et al. The return of an experimentally N-saturated boreal forest to an N-
limited state: observations on the soil microbial community structure, biotic N retention
capacity and gross N mineralization. Plant Soil, v. 381, p. 45–60, 2014.
HUMBERT, S. et al. Molecular detection of anammox bacteria in terrestrial ecosystems:
distribution and diversity. ISME, v. 4, n. 3, p. 450-454, 2010.

109
HUYGENS, D. et al. Soil nitrogen conservation mechanisms in a pristine South Chilean
Nothofagus forest ecosystem. Soil Biology and Biochemistry, v. 39, p. 2448–2458, 2007.
IPCC. Stocker TF, Qin D, Plattner G-K, Tignor M, Allen SK, Boschung J, Nauels A, Xia Y,
Bex V, Midgley PM, eds. Climate change 2013: the physical science basis. Contribution of
Working Group I to the fifth assessment report of the Intergovernmental Panel on Climate
Change. Cambridge, UK; New York, NY, USA: Cambridge University Press, 2013.
JAYAWEERA, G. R.; MIKKELSEN, S. Assessment of Ammonia Volatilization from
Flooded Soil Systems. Advances in Agronomy, v. 45, p. 303–356. 1991.
JETTEN, M. S. M. et al. Anaerobic ammonium oxidation by marine and freshwater
planctomycete-like bacteria. Applied Microbiology Biotechnology, v. 63, p. 107-114. 2003.
JOHNSON, D. W.; CHENG, W.; BURKE, I. C. Biotic and Abiotic Nitrogen Retention in a
Variety of Forest Soils. Soil Sci. Soc. Am. J., v. 64, p. 1503–1514, 2000.
JU, X. et al. Processes and factors controlling N(2)O production in an intensively managed
low carbon calcareous soil under sub-humid monsoon conditions. Environmental Pollution,
v. 159, n. 4, p. 1007-1016, 2011.
JUNK, W. J. (Ed.). The central Amazon floodplain – Ecology of a pulsing system.
Heidelberg, Berlin; New York, USA: Springer-Verlag, 1997. 530 p.
JUNK, W. J.; PIEDADE, M. T. F. An Introduction to South American Wetland Forests:
Distribution, Definitions and General Characterization. In: JUNK, W. J. et al. (Ed.).
Amazonian floodplain forests: ecophysiology, biodiversity and sustainable management.
New York, USA: Springer Verlag, 2010. p. 43–60.
KAMPSCHREUR, M. J. et al. Nitrous oxide emission during wastewater treatment. Water
Research, v. 43, n. 17, p. 4093-4103, 2009.
KARHU, K. et al. Temperature sensitivity of organic matter decomposition in two boreal
forest soil profiles. Soil Biology and Biochemistry, v. 42, p. 72-82, 2010.
KASISCHKE, E.S.; STOCKS, B. J. Fire, Climate Change, and Carbon Cycle in the Boreal
Forest. Ecological Studies, v. 138, 2000.
KASPAR, H. F. Nitrite reduction to nitrous oxide by propionibacteria: detoxication
mechanism. Archives of Microbiology, v. 133, p. 126–130, 1982.
KELLER, M.; REINERS, W. A. Soil-atmosphere exchange of nitrous oxide, nitric oxide and
methane under secondary succession of pasture to forests in the Atlantic lowlands of Costa
Rica. Global Biogeochemical Cycles, v.8, p.399–409, 1994.

110
KIRBY, K. R. et al. “The Future of Deforestation in the Brazilian Amazon.” Futures, v. 38,
n. 4, p. 432–53, 2006.
KRAFT, B. et al. The environmental controls that govern the end product of bacterial nitrate
respiration. Science, v. 345, n. 6197, p. 676, 2014.
KUYPERS, M. M. M. et al. Massive nitrogen loss from the Benguela upwelling system
through anaerobic ammonium oxidation. PNAS, v. 102, n. 18, p. 6478–648, 2005.
LAL, R. Forest soils and carbon sequestration. Forest Ecology and Management, v. 220, p.
242–258, 2005.
LAL, R. Soil Carbon Sequestration Impacts on Global Climate Change and Food Security.
Science, v. 304, p. 1623–1626, 2004.
LAMBERS, H. et al. Plant-microbe-soil interections in the rhizosphere: an evolutionary
perspective. Plant Soil, v. 321, p. 83-115, 2009.
LI, J. et al. Carbon mineralization and oxygen dynamics in sediments with deep oxygen
penetration, Lake Superior. Limnology and Oceanography, v. 57, n. 6, p. 1634–1650, 2012.
LIENGAARD, L. et al. Hot moments of N2O trsnformation and emission in tropical soils
from the Pantanal and the Amazon (Brazil). Soil Biology and Biochemistry, v. 75, p. 26–36,
2014.
LIU, R. et al. Influence of temperature and moisture on the relative contributions of
heterotrophic and autotrophic nitrification to gross nitrification in an acid cropping soil.
Journal of Soils and Sediments, v. 15, p. 2304–2309, 2015.
MA, W. K. et al. Relationship between nitrifier and denitrifier community composition and
abundance in predicting nitrous oxide emissions from ephemeral wetland soils. Soil Biology
& Biochemistry, v. 40, n. 5, p. 1114–1123, 2008.
MADDOCK, J. E. L.; DOS SANTOS, M. B. P.; PRATA, K. R. Nitrous oxide emission from
soil of the Mata Atlantica, Rio de Janeiro State, Brazil. Journal of Geophysical Research:
Atmospheres, v. 106, p. 23055–23060, 2001.
MALHI, Y. et al. The carbon balance of tropical, temperate, and boreal forests. Plant, Cell
and Environmental, v. 22, p. 71, 1999.
MAMILOV, A. S.; DILLY, O. M. Soil microbial eco-physiology as affected by short-term
variations in environmental conditions. Soil Biology and Biochemistry, v. 34, p. 1283–1290,
2002.

111
MARTINELLI, L. A. et al. Nitrogen stable isotopic composition of leaves and soil: Tropical
versus temperate forests. Biogeochemistry, v. 46, n., p. 45–65, 1999.
MATSON, P. A. et al. The globalization of N deposition: ecosystem consequences in tropical
environments. Biogeochemistry, v. 46, n. 1–3, p. 67–83, 1999.
MAY, P. H. et al. Sistemas agroflorestais e reflorestamento para captura de carbono e geração
de renda. In: ENCONTRO DA SOCIEDADE BRASILEIRA DE ECONOMIA ECOLÓGICA
- ECO, 6., 2005, Brasília, DF. Anais… Barsília, DF, 2005.
MELACK, J. M.; HESS, L. L. Remote sensing of the distribution and extent of wetlands in
the Amazon Basin. In: JUNK, W. J. et al. (Ed). Amazonian floodplain forests:
ecophysiology, biodiversity and sustainable management. New York, USA: Springer Verlag,
2010. p. 43–60.
METZGER, J. P. Conservation issues in the Brazilian Atlantic forest. Biological
Conservation, v. 142, p. 1138–1140, 2009.
MOREIRA-TURCQ, P. et al. Exportation of organic carbon from the Amazon River and its
main tributaries. Hydrological Processes, v. 17, p. 1329–1344, 2003.
MORELLATO, L. P. C.; HADDAD, C. F. B. Introduction: The Brazilian Atlantic Forest.
Biotropica, v. 32, n. 4b, p. 786–792, 2000.
MORLEY, N.; E. M. BAGGS. Carbon and oxygen controls on N2O and N2 production
during nitrate reduction. Soil Biology and Biochemistry, v. 42, p. 1864-1871, 2010.
MORLEY, N. et al. Production of NO, N2O and N2 by extracted soil bacteria, regulation by
NO2- and O2 concentrations. Fems Microbiology Ecology, v. 65, p. 102-112, 2008.
MYERS, N. et al. Biodiversity hotspots for conservation priorities. Nature, v. 403, n. 24, p.
853–858, 2000.
NEILL, C. et al. Nitrogen Dynamics in Amazon Forest and Pasture Soils Measured by 15N
Pool Dilution. Soil Biology and Biochemistry, v. 31, n. 4, p. 567–72, 1999.
NILSSON, M. C.; WARDLE, D. A. Understory vegetation as a forest ecosystem driver:
evidence from the northern Swedish boreal forest. Frontiers in Ecology and the
Environment, v. 3, p. 421–428, 2005.

112
NOBRE, C. et al. Understanding the Climate of Amazonia: Progress From LBA.
Washington, DC: AGU, 2009. 565 p. (Geophysical Monograph Series, 186).
NOOA. Nitrous Oxide (N2O) — Combined Data Set. In: Earth System Research Laboratory.
Global Monitoring Division. 2016. Accessed in 10 January 2017.
OLIVARES, J.; E. J. BEDMAR; J. SANJUÁN. Biological Nitrogen Fixation in the Context
of Global Change. Molecular Plant-Microbe Interactions, v. 26, n. 5, p. 486–494, 2013.
PERRY, I. G. Fluxos de óxido nitroso e potenciais fatores ambientais de controle em uma
floresta tropical pluvial atlântica na serra do mar. Niterói, 2011. 112 f. Tese (Doutorado
em Geociências – Geoquímica Ambiental) – Instituto de Química, Universidade Federal
Fluminense, Niterói, 2011.
PETTERSSON, M.; BAATH, E. Temperature-dependent changes in the soil bacterial
community in limed and unlimed soil. FEMS Microbiology Ecology, v. 45, p. 13–21, 2003.
PINA-OCHOA, E.; ALVAREZ-COBELAS, M. Denitrification in aquatic environments: A
cross-system analysis. Biogeochemistry, v. 81, n. 1, p. 111–130, 2006.
POTTER, C. et al. Ecosystem modeling and dynamic effects of deforestation on trace gas
fluxes in Amazon tropical forests. Fores Ecology and Management, v. 152, p. 97-117, 2001.
PROSSER, J. Nitrogen in Soils/Nitrification. The Encyclopedia of Soils in the
Environmental, University of Aberdeen, UK., p. 31-38, 2005.
RAVISHANKARA, A. R.; DANIEL, J. S.; PORTMANN, R. W. Nitrous Oxide (N2O): The
Dominant Ozone-Depleting Substance Emitted in the 21st Century. Science, v. 326, n. 5949,
p. 123–125, 2009.
REINERT, D. J.; REICHERT, J. M. Propriedades físicas do solo. Santa Maria: Universidade
Federal de Santa Maria, 2006. 18 p.
REIS, S. et al. Synthesis and review: Tackling the nitrogen management challenge: from
global to local scales. Environmental Research Letters, v. 11, 2016.
ROBERTSON, G. P.; TIEDJE, J. M. Deforestation alters denitrification in a lowland tropical
rain-forest. Nature, v. 336, p. 756–759, 1988.
ROBERTSON, G. P.; GROFFMAN, P. M. Nitrogen transformations. In: PAUL, E. A. (Ed.).
Soil Microbiology and Biochemistry. 3rd ed. New York: Academic Press, 2007. p. 341–364.

113
RODRIGUES, R. A. R.; W. Z. DE MELLO. Fluxos de óxido nitroso em solos com cobertura
de floresta ombrófila densa montana da Serra do Órgãos, Rio de Janeiro. Química Nova, v.
35, p. 1549–1553, 2012.
RUCKSTUHL, K. E. et al. Introduction. The boreal forest and global change. Philosophical
Transactions og Royal Society, v. 363, p. 2245- 2249, 2008.
SANCHES, L. et al. Dinâmica sazonal da produção e decomposição de serrapilheira em
floresta tropical de transição. Revista Brasileira de Engenharia Agrícola e Ambiental, v.
13, p. 183-189, 2009.
SCHLESINGER, W. H. An estimate of the global sink for nitrous oxide in soils. Global
Change Biology, v. 9, n. 10, p. 2929–2931, 2013.
SIGURDSSON, B. D. et al. Growth of mature boreal Norway spruce was not affected by
elevated [CO2] and/or air temperature unless nutrient availability was improved. Tree
Physiology, v. 33, p. 1192–1205, 2013.
SILVER, W. L. et al. Dissimilatory Nitrate Reduction to Ammonium in Upland Tropical
Forest Soils. Ecology, v. 82, n. 3, p. 2410–2416, 2001.
SILVER, W. L. et al. Nitrogen cycling in tropical plantation forests: potential controls on
nitrogen retention. Ecological Applications, v. 15, p. 1604-1614, 2005.
SOS Mata Atlântica, Instituto Nacional de Pesquisas Espaciais, 2015. Atlas dos
remanescentes florestais da Mata Atlântica, período de 2013 a 2014.
<http://www.sosmatatlantica.org.br>.
SOTTA, E. D.; CORRE, M. D.; VELDKAMP, E. Differing N Status and N Retention
Processes of Soils under Old-Growth Lowland Forest in Eastern Amazonia, Caxiuanã, Brazil.
Soil Biology and Biochemistry, v. 40, n. 3, p. 740–50, 2008.
SOUSA NETO, E. et al. Soil-atmosphere exchange of nitrous oxide, methane and carbon
dioxide in a gradient of elevation in the coastal Brazilian Atlantic forest. Biogeosciences, v. 8,
p. 733-724, 2011.
STEVENS, R. J.; LAUGHLIN, R. J.; MALONE, J. P. Soil pH affects the processes reducing
nitrate to nitrous oxide and di-nitrogen. Soil Biology and Biochemistry, v. 30, p. 1119–1126,
1998.
SUZIKI, I.; DULAR, U.; KWOK, C. Ammonia or ammonium ion as substrate for oxidation
by Nitrossomonas europea cells and extracts. Journal of Bacteriology, p. 556-558, 1974.
114
TAGUE, C. et al. Plot- and watershed-scale soil moisture variability in a humid Piedmont
watershed. Water Resources Research, v. 46, p. 1–13, 2010.
TIEDJE, J. M. Denitrification: ecological niches, competition and survival. Antonie van
Leeuwenhoek, v. 48, p. 569-583, 1982.
TÔSTO, K. L. Regulação das taxas de emissão de óxido nitroso (n2o) em solos
amazônicos pelo pulso de inundação. Rio de Janeiro, 2014. 71 f. Dissertação (Mestrado em
Ecologia) - Instituto de Biologia, Universidade Federal do Rio de Janeiro, Rio de Janeiro,
2014.
USSIRI, D.; LAL, R. Formation and release of nitrous oxide from terrestrial and aquatic
ecosystems. In: USSIRI, David; LAL, Rattan. Soil emission of nitrous oxide and its
mitigation. [S. l.]: Springer Science, 2013. p. 63–96.
VAN GROENIGEN, J. W. et al. The soil N cycle: new insights and key challenges. Soil, v. 1,
p. 235–256, 2015.
VIANELLO, R. L.; ALVES, A. R. Meteorologia Básica e Aplicações. Viçosa: UFV, 2000.
WERNER, C. et al. A global inventory of N2O emissions from tropical rainforest soils using
a detailed biogeochemical model. Global Biogeochemical Cycles, v. 21, n. 3, p. 1–18, 2007.
WICK, B. et al. Nitrous oxide fluxes and nitrogen cycling along a pasture chronosequence in
Central Amazonia, Brazil. Biogeosciences, v. 2, p. 175–187, 2005.
YAN, L. et al. Increasing water and nitrogen availability enhanced net ecosystem CO2
assimilation of a temperate semiarid steppe. Plant and Soil, v. 349, p. 227–240, 2011.
YOON, S. et al. Denitrification versus respiratory ammonification: environmental controls of
two competing dissimilatory NO3-/NO2- reduction pathways in Shewanella loihica strain
PV-4. ISME, v. 9, p. 1093-1104, 2015.
YUAN, Z. Y.; CHEN, H. Y. H. Decoupling of nitrogen and phosphorus in terrestrial plants
associated with global changes. Nature Climate Change, v. 5, p. 1–5, 2015.
ZEHR, J. P.; CARPENTER, E. J.; VILLAREAL, T. A. New perspectives on nitrogen-fixing
microorganisms in tropical and subtropical oceans. Trends in Microbiology, v. 8, p. 68–73,
2000.
ZHANG, J. B. et al. The substrate is an important factor in controlling the significance of
heterotrophic nitrification in acidic forest soils. Soil Biology and Biochemistry, v. 76, p.
143–148, 2014.

115
ZHANG, J.; MÜLLER, C.; CAI, Z. Heterotrophic nitrification of organic N and its
contribution to nitrous oxide emissions in soils. Soil Biology & Biochemistry, v. 84, p. 199–
209, 2015.
ZHU, J. et al. Spatial and temporal variability of N2O emissions in a subtropical forest
catchment in China. Biogeosciences, v. 10, p. 1309-1321, 2013.
ZHU, B. et al. Rizhospfere priming effects on soil carbon and nitrogen mineralization. Soil
Biology and Biochemistry, v. 76, p. 183-192, 2014.