institutional presentation (eng) march 2015 finalv1
TRANSCRIPT
Institutional PresentationMarch 2015
2
This information is property of Wilson Sons and can not be used or reproduced without written permission
Disclaimer
This presentation contains statements that may constitute “forward-looking statements”, based on
current opinions, expectations and projections about future events. Such statements are also based on
assumptions and analysis made by Wilson, Sons and are subject to market conditions which are
beyond the Company’s control.
Important factors which may lead to significant differences between real results and these forward-
looking statements are: national and international economic conditions; technology; financial market
conditions; uncertainties regarding results in the Company’s future operations, its plans, objectives,
expectations, intentions; and other factors described in the section entitled "Risk Factors“, available in
the Company’s Prospectus, filed with the Brazilian Securities and Exchange Commission (CVM).
The Company’s operating and financial results, as presented on the following slides, were prepared in
conformity with International Financial Reporting Standards (IFRS), except as otherwise expressly
indicated. An independent auditors’ review report is an integral part of the Company’s condensed
consolidated financial statements.
3
This information is property of Wilson Sons and can not be used or reproduced without written permission
FMM77%
Others23%
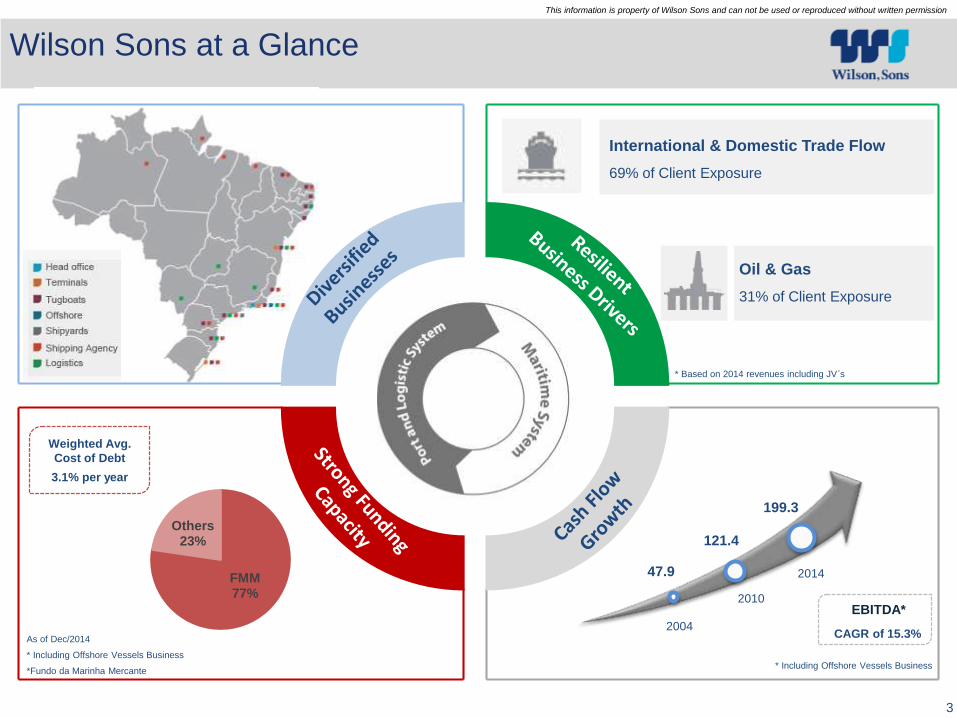
International & Domestic Trade Flow
69% of Client Exposure
Wilson Sons at a Glance
*Fundo da Marinha Mercante
Oil & Gas
31% of Client Exposure
Weighted Avg.
Cost of Debt
3.1% per year
As of Dec/2014
* Based on 2014 revenues including JV´s
199.3
47.9
2004
2014
CAGR of 15.3%
121.4
2010EBITDA*
* Including Offshore Vessels Business* Including Offshore Vessels Business
Our Growth Drivers
5
This information is property of Wilson Sons and can not be used or reproduced without written permission
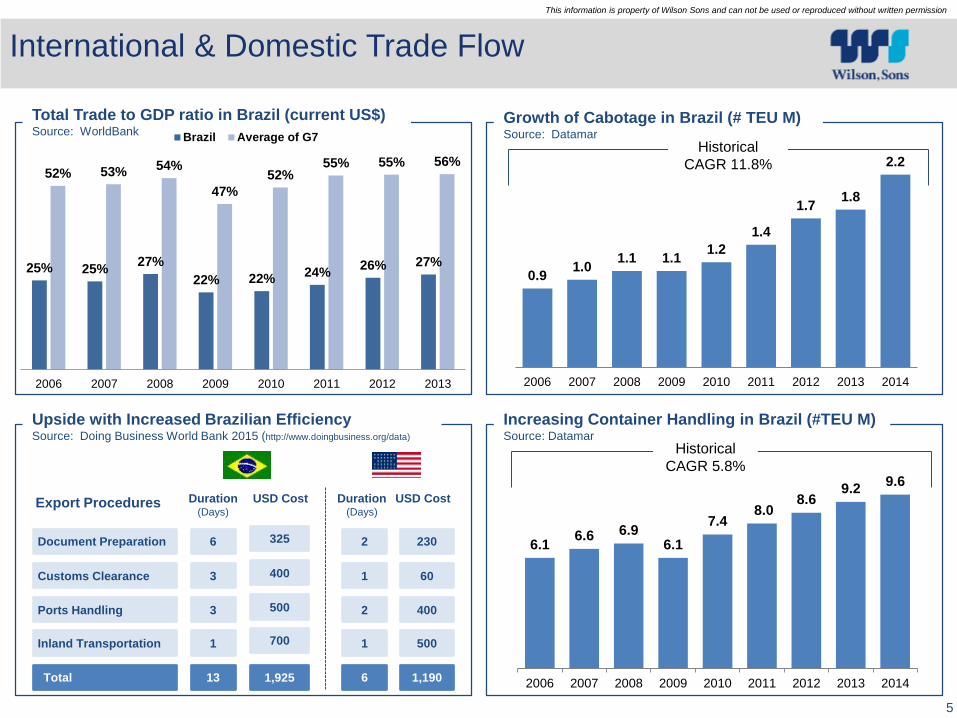
International & Domestic Trade Flow
Document Preparation
Customs Clearance
Ports Handling
Inland Transportation
Duration(Days)
USD Cost
6
3
3
1
325
400
500
700
Total 13 1,925
2
1
2
1
6
230
60
400
500
1,190
Duration(Days)
USD CostExport Procedures
Total Trade to GDP ratio in Brazil (current US$)Source: WorldBank
Growth of Cabotage in Brazil (# TEU M)Source: Datamar
Upside with Increased Brazilian EfficiencySource: Doing Business World Bank 2015 (http://www.doingbusiness.org/data)
Increasing Container Handling in Brazil (#TEU M)Source: Datamar
Historical
CAGR 5.8%
Historical
CAGR 11.8%
25% 25%27%
22% 22%24%
26% 27%
52% 53%54%
47%
52%55% 55% 56%
2006 2007 2008 2009 2010 2011 2012 2013
Brazil Average of G7
0.91.0
1.1 1.11.2
1.4
1.71.8
2.2
2006 2007 2008 2009 2010 2011 2012 2013 2014
6.16.6 6.9
6.1
7.48.0
8.69.2
9.6
2006 2007 2008 2009 2010 2011 2012 2013 2014
6
This information is property of Wilson Sons and can not be used or reproduced without written permission
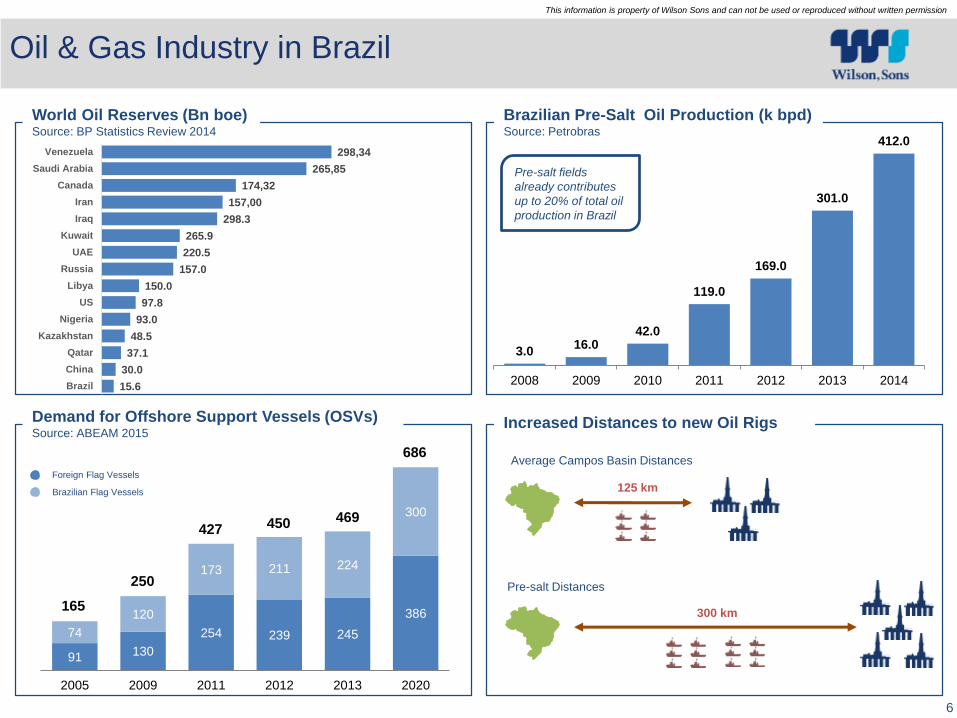
3.016.0
42.0
119.0
169.0
301.0
412.0
2008 2009 2010 2011 2012 2013 2014
Oil & Gas Industry in Brazil
World Oil Reserves (Bn boe)Source: BP Statistics Review 2014
Brazilian Pre-Salt Oil Production (k bpd)Source: Petrobras
Demand for Offshore Support Vessels (OSVs)Source: ABEAM 2015
Increased Distances to new Oil Rigs
125 km
300 km
Average Campos Basin Distances
Pre-salt Distances
Foreign Flag Vessels
Brazilian Flag Vessels
Pre-salt fields
already contributes
up to 20% of total oil
production in Brazil
91 130
254 239 245
386
74
120
173 211 224
300
2005 2009 2011 2012 2013 2020
250
427 450 469
686
165
15.6
30.0
37.1
48.5
93.0
97.8
150.0
157.0
220.5
265.9
298.3
157,00
174,32
265,85
298,34
Brazil
China
Qatar
Kazakhstan
Nigeria
US
Libya
Russia
UAE
Kuwait
Iraq
Iran
Canada
Saudi Arabia
Venezuela
Our Business
8
This information is property of Wilson Sons and can not be used or reproduced without written permission
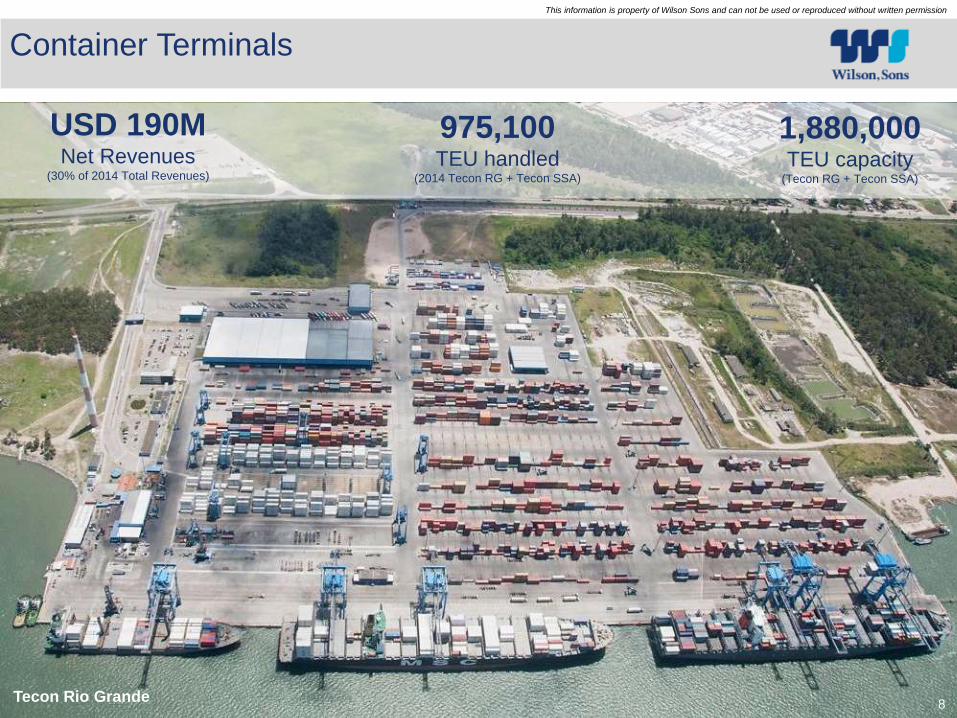
Container Terminals
Tecon Rio Grande8
975,100TEU handled
(2014 Tecon RG + Tecon SSA)
1,880,000TEU capacity
(Tecon RG + Tecon SSA)
USD 190MNet Revenues
(30% of 2014 Total Revenues)
9
This information is property of Wilson Sons and can not be used or reproduced without written permission
Container Terminals
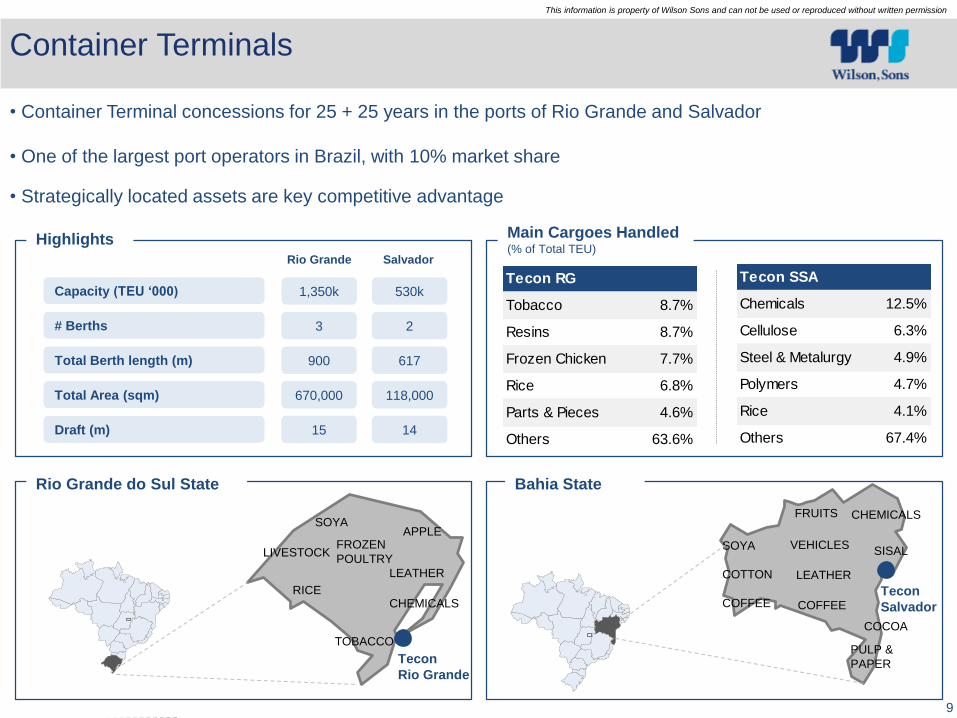
• Container Terminal concessions for 25 + 25 years in the ports of Rio Grande and Salvador
• One of the largest port operators in Brazil, with 10% market share
• Strategically located assets are key competitive advantage
Rio Grande do Sul State
Highlights Main Cargoes Handled (% of Total TEU)
Total Berth length (m)
# Berths
Total Area (sqm)
900
3
670,000
617
2
118,000
Rio Grande Salvador
Draft (m) 15 14
Capacity (TEU ‘000) 1,350k 530k
Bahia State
RICE
TOBACCO
APPLE
LIVESTOCK
SOYA
LEATHER
CHEMICALS
Tecon
Rio Grande
FROZEN
POULTRYSOYA
COTTON
COFFEE
FRUITS
COFFEE
PULP &
PAPER
COCOA
LEATHER
VEHICLES
Tecon
Salvador
CHEMICALS
SISAL
Tecon RG
Tobacco 8.7%
Resins 8.7%
Frozen Chicken 7.7%
Rice 6.8%
Parts & Pieces 4.6%
Others 63.6%
Tecon SSA
Chemicals 12.5%
Cellulose 6.3%
Steel & Metalurgy 4.9%
Polymers 4.7%
Rice 4.1%
Others 67.4%
10
This information is property of Wilson Sons and can not be used or reproduced without written permission
Container Terminals
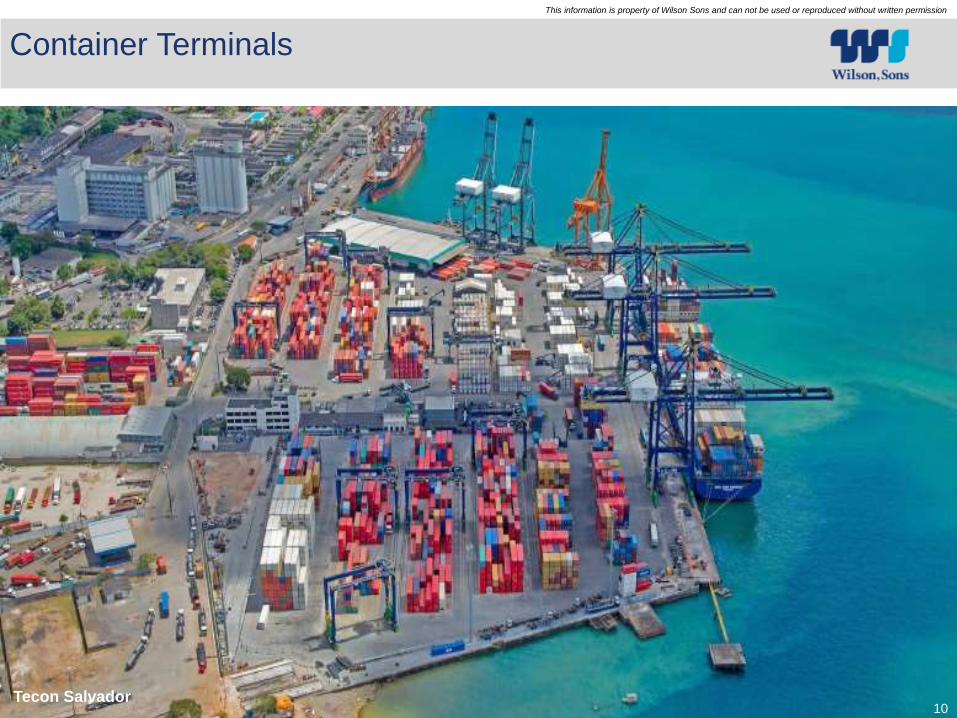
10Tecon Salvador
11
This information is property of Wilson Sons and can not be used or reproduced without written permission
Container Terminals
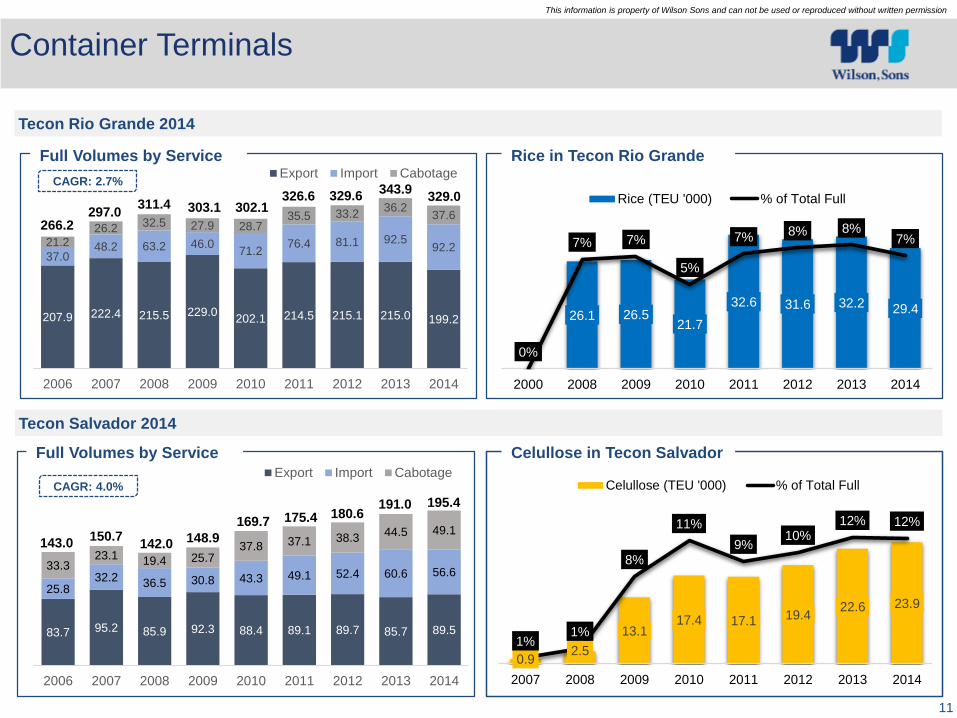
Rice in Tecon Rio GrandeFull Volumes by Service
Tecon Rio Grande 2014
Tecon Salvador 2014
Celullose in Tecon SalvadorFull Volumes by Service
83,7 95,2 86,0 92,3 88,5 89,1 89,7 85,8
25,932,3
36,6 30,8 43,3 49,1 52,5 60,733,4
23,219,4 25,7
37,9 37,1 38,444,6
2006 2007 2008 2009 2010 2011 2012 2013
Export Import Cabotage
143,0150,7
142,0148,9
169,7 175,4 180,6191,0
83,7 95,2 86,0 92,3 88,5 89,1 89,7 85,8
25,932,3
36,6 30,8 43,3 49,1 52,5 60,733,4
23,219,4 25,7
37,9 37,1 38,444,6
2006 2007 2008 2009 2010 2011 2012 2013
Export Import Cabotage
143,0150,7
142,0148,9
169,7 175,4 180,6191,0
207.9 222.4 215.5 229.0202.1 214.5 215.1 215.0 199.2
37.048.2 63.2 46.0
71.276.4 81.1 92.5
92.221.226.2 32.5 27.9 28.7
35.5 33.236.2
37.6
2006 2007 2008 2009 2010 2011 2012 2013 2014
266.2297.0
311.4 303.1 302.1326.6 329.6 329.0
343.9
83.7 95.2 85.9 92.3 88.4 89.1 89.7 85.7 89.5
25.832.2
36.5 30.8 43.3 49.1 52.4 60.6 56.633.3
23.1 19.4 25.737.8 37.1 38.3
44.5 49.1
2006 2007 2008 2009 2010 2011 2012 2013 2014
143.0150.7
142.0 148.9
169.7 175.4 180.6195.4191.0
CAGR: 4.0%
CAGR: 2.7%
26.1 26.521.7
32.6 31.6 32.2 29.4
0%
7% 7%
5%
7% 8% 8%7%
0%
1%
2%
3%
4%
5%
6%
7%
8%
9%
0.0
5.0
10.0
15.0
20.0
25.0
30.0
35.0
2000 2008 2009 2010 2011 2012 2013 2014
Rice (TEU '000) % of Total Full
0.92.5
13.117.4 17.1 19.4
22.6 23.9
1%1%
8%
11%
9%10%
12% 12%
0%
2%
4%
6%
8%
10%
12%
14%
0.0
5.0
10.0
15.0
20.0
25.0
30.0
2007 2008 2009 2010 2011 2012 2013 2014
Celullose (TEU '000) % of Total Full
12
This information is property of Wilson Sons and can not be used or reproduced without written permission
Oil & Gas Terminals
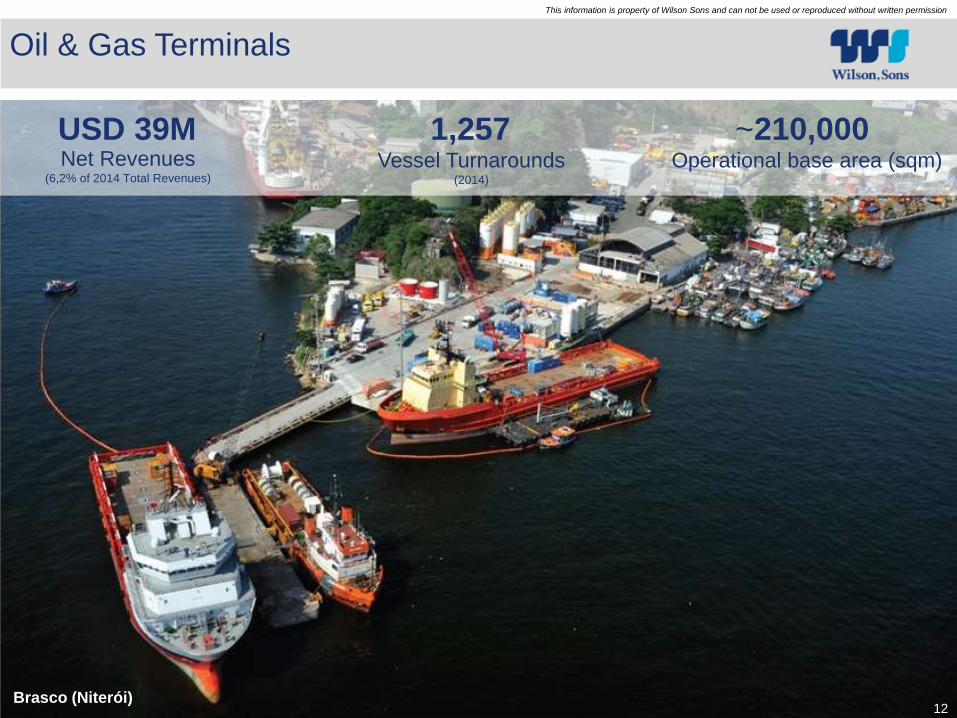
Brasco (Niterói)12
1,257Net Revenues
(6,2% of 2014 Total Revenues)
Vessel Turnarounds (2014)
~210,000Operational base area (sqm)
USD 39M
13
This information is property of Wilson Sons and can not be used or reproduced without written permission
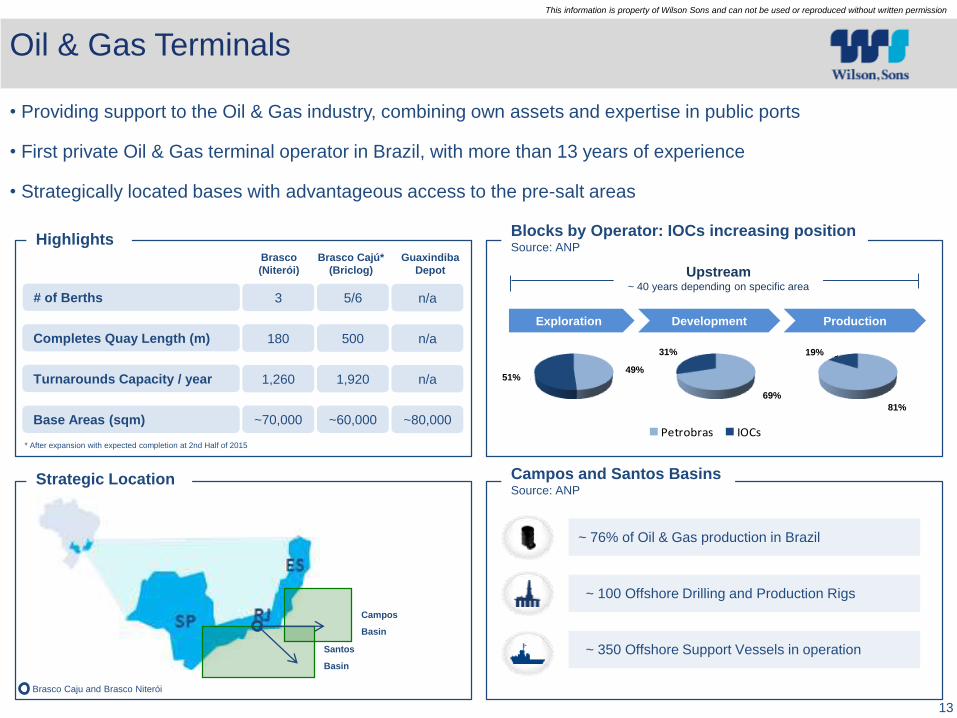
Oil & Gas Terminals
• Providing support to the Oil & Gas industry, combining own assets and expertise in public ports
• First private Oil & Gas terminal operator in Brazil, with more than 13 years of experience
• Strategically located bases with advantageous access to the pre-salt areas
Campos
Basin
Santos
Basin
Exploration Development Production
Upstream~ 40 years depending on specific area
~ 76% of Oil & Gas production in Brazil
~ 100 Offshore Drilling and Production Rigs
~ 350 Offshore Support Vessels in operation
84%
16%
70%
30%49%
51%
70%
30%
Petrobras IOCs / OGXBase Areas (sqm)
Completes Quay Length (m)
~70,000
180
~60,000
500
# of Berths 3 5/6
n/a
n/a
Brasco
(Niterói)
Brasco Cajú*
(Briclog)
Guaxindiba
Depot
Turnarounds Capacity / year 1,260 1,920 n/a
~80,000
* After expansion with expected completion at 2nd Half of 2015
69%
31%
81%
19%
Blocks by Operator: IOCs increasing positionSource: ANP
Strategic Location Campos and Santos BasinsSource: ANP
Highlights
49%51%
Brasco Caju and Brasco Niterói
14
This information is property of Wilson Sons and can not be used or reproduced without written permission
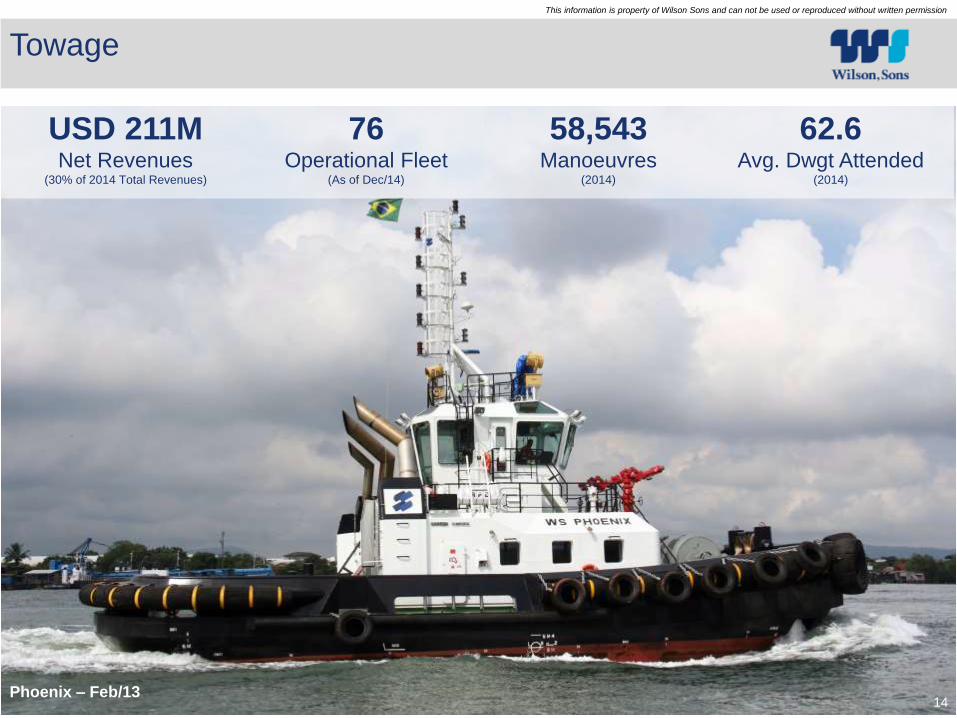
Towage
Phoenix – Feb/1314
USD 211MNet Revenues
(30% of 2014 Total Revenues)
58,543Manoeuvres
(2014)
62.6Avg. Dwgt Attended
(2014)
76Operational Fleet
(As of Dec/14)
15
This information is property of Wilson Sons and can not be used or reproduced without written permission
76
11.0
30
44
7.5
13
41
16.6
4
21
15.2
8
Fle
etA
vera
ge
Ag
eT
ota
l Po
wer
# P
ort
s A
tten
ded
WS
Competidor (1)
Competidor (2)
Competidor (3)
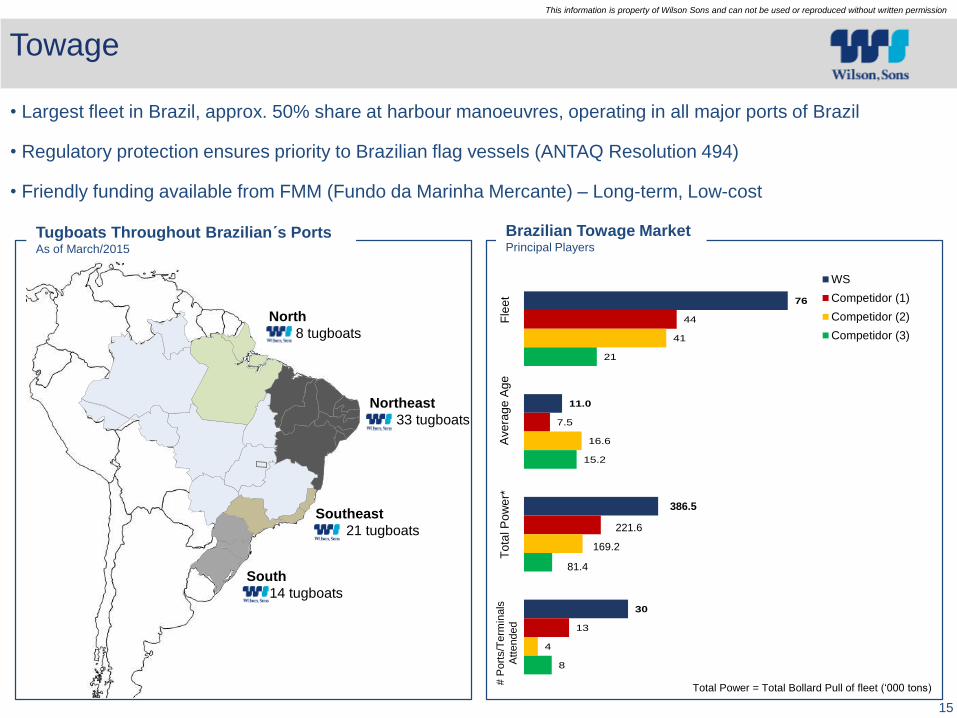
Towage
• Largest fleet in Brazil, approx. 50% share at harbour manoeuvres, operating in all major ports of Brazil
• Regulatory protection ensures priority to Brazilian flag vessels (ANTAQ Resolution 494)
• Friendly funding available from FMM (Fundo da Marinha Mercante) – Long-term, Low-cost
Tugboats Throughout Brazilian´s PortsAs of March/2015
Brazilian Towage MarketPrincipal Players
North
8 tugboats
Northeast
33 tugboats
Southeast
21 tugboats
South
14 tugboats
Fle
et
Ave
rag
eA
ge
To
tal P
ow
er*
# P
ort
s/T
erm
inals
Att
ended
73
11.0
124.4
26
44
7.5
94.7
13
40
16.6
81.2
4
21
15.2
59.8
8
Fle
et
Av
era
ge
Ag
eT
ota
l P
ow
er
# P
ort
s A
tte
nd
ed
WS
Competidor (1)
Competidor (2)
Competidor (3)
81.4
169.2
221.6
386.5
Total Power = Total Bollard Pull of fleet (‘000 tons)
16
This information is property of Wilson Sons and can not be used or reproduced without written permission
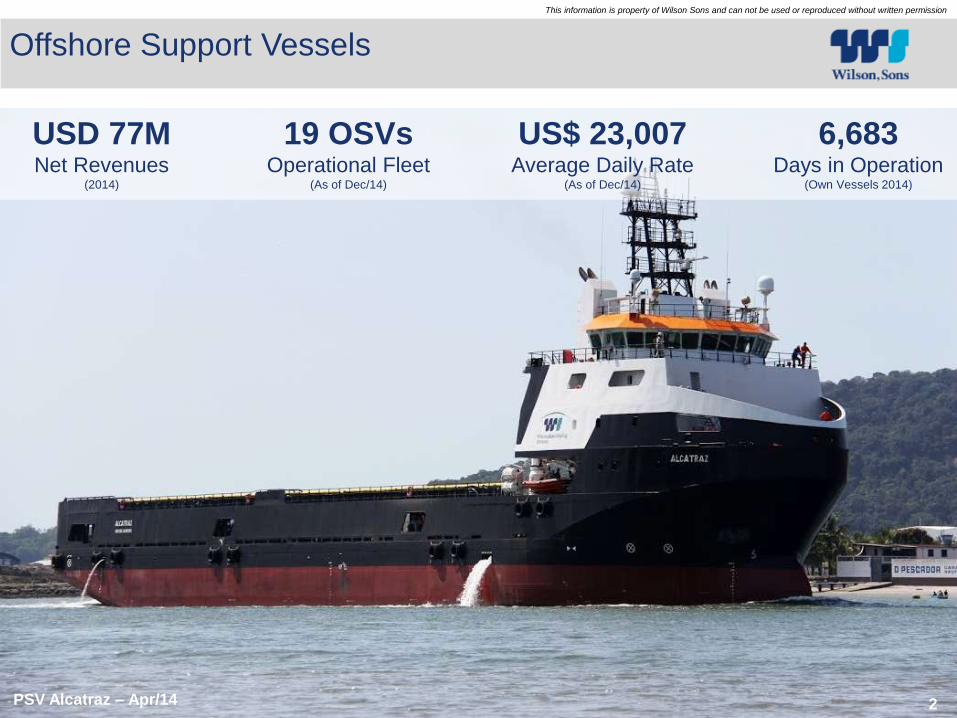
Offshore Support Vessels
PSV Alcatraz – Apr/14 2
USD 77MNet Revenues
(2014)
19 OSVsOperational Fleet
(As of Dec/14)
6,683Days in Operation
(Own Vessels 2014)
US$ 23,007Average Daily Rate
(As of Dec/14)
17
This information is property of Wilson Sons and can not be used or reproduced without written permission
PT 1607
PT 1624
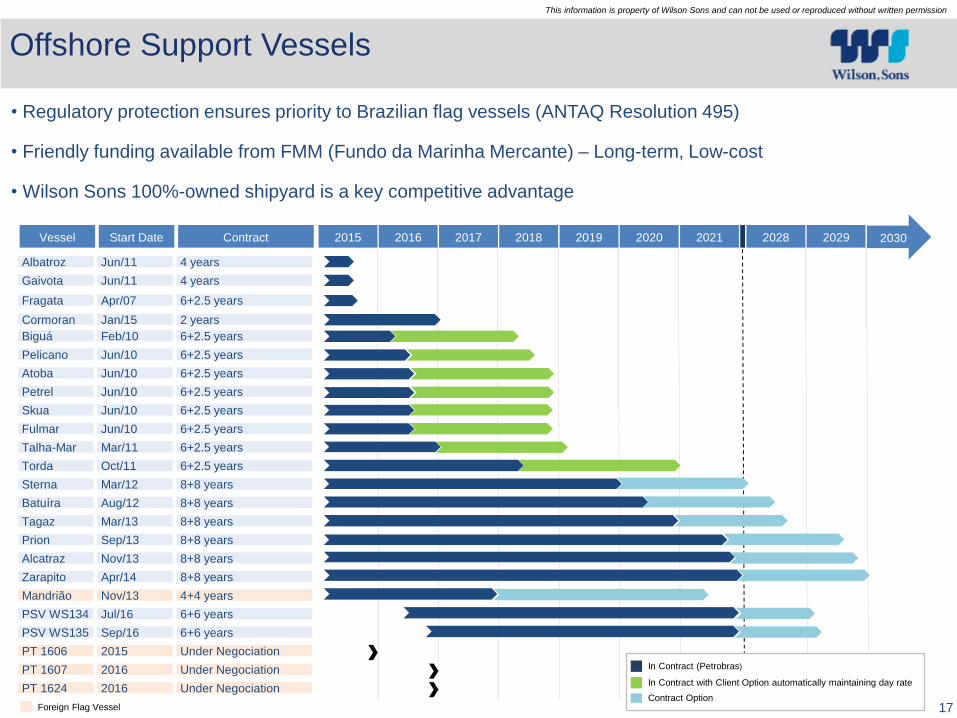
Offshore Support Vessels
• Regulatory protection ensures priority to Brazilian flag vessels (ANTAQ Resolution 495)
• Friendly funding available from FMM (Fundo da Marinha Mercante) – Long-term, Low-cost
• Wilson Sons 100%-owned shipyard is a key competitive advantage
2015 2016 2017 2018 2019 2020 2021 2028 2029 2030
Albatroz Jun/11 4 years
Gaivota Jun/11 4 years
Cormoran Jan/15 2 years
Fragata Apr/07 6+2.5 years
Biguá Feb/10 6+2.5 years
Pelicano Jun/10 6+2.5 years
Atoba Jun/10 6+2.5 years
Petrel Jun/10 6+2.5 years
Skua Jun/10 6+2.5 years
Fulmar Jun/10 6+2.5 years
Talha-Mar Mar/11 6+2.5 years
Torda Oct/11 6+2.5 years
Sterna Mar/12 8+8 years
Batuíra Aug/12 8+8 years
Tagaz Mar/13 8+8 years
Prion Sep/13 8+8 years
Alcatraz Nov/13 8+8 years
Zarapito Apr/14 8+8 years
Mandrião Nov/13 4+4 years
Vessel Start Date Contract
PT 1606 2015 Under Negociation
2016 Under Negociation
2016 Under Negociation
PSV WS134
PSV WS135
Jul/16 6+6 years
Sep/16 6+6 years
Foreign Flag Vessel
In Contract (Petrobras)
In Contract with Client Option automatically maintaining day rate
Contract Option
18
This information is property of Wilson Sons and can not be used or reproduced without written permission
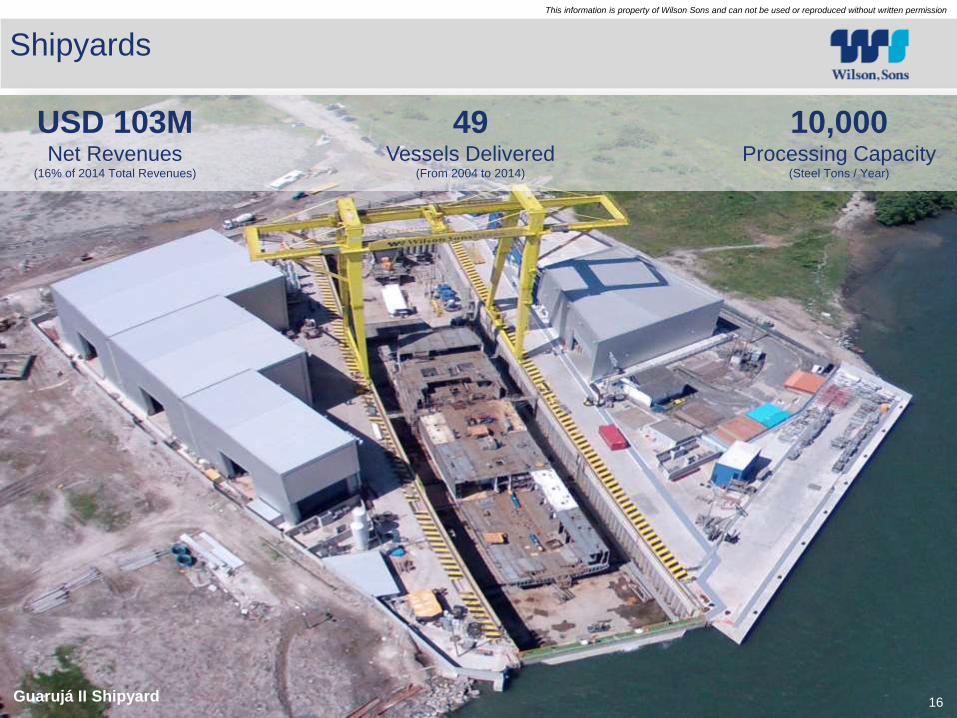
Shipyards
Guarujá II Shipyard 16Guarujá II Shipyard
49Vessels Delivered
(From 2004 to 2014)
10,000Processing Capacity
(Steel Tons / Year)
USD 103MNet Revenues
(16% of 2014 Total Revenues)
19
This information is property of Wilson Sons and can not be used or reproduced without written permission
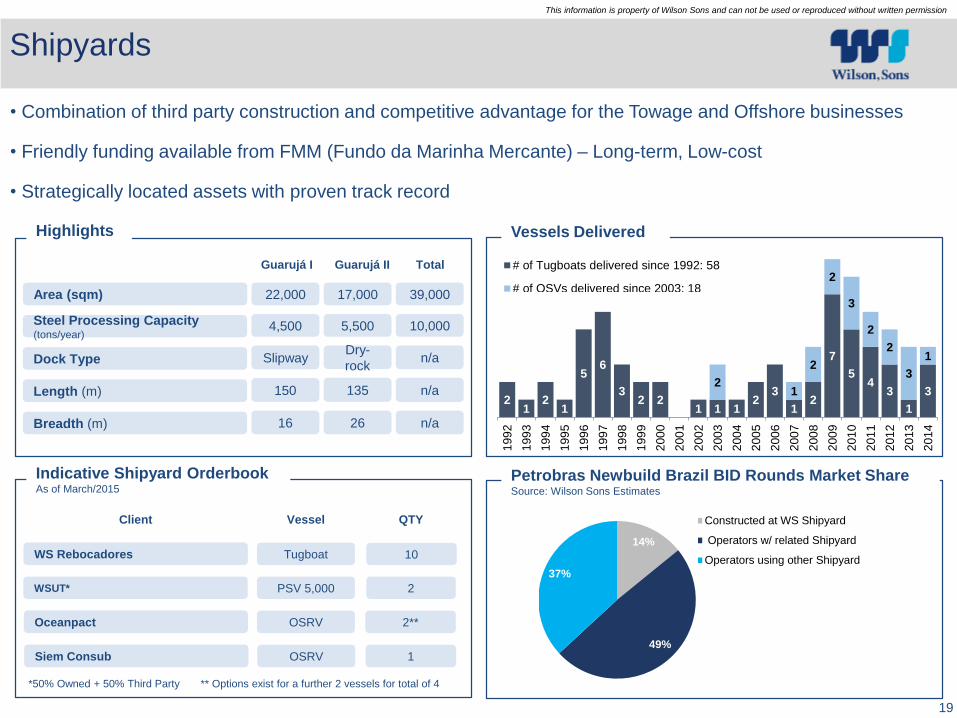
Shipyards
Length (m)
Steel Processing Capacity(tons/year)
Dock Type
Vessels Delivered
Indicative Shipyard OrderbookAs of March/2015
Petrobras Newbuild Brazil BID Rounds Market ShareSource: Wilson Sons Estimates
Highlights
Guarujá I Guarujá II
WSUT* PSV 5,000 2
WS Rebocadores Tugboat 10
Oceanpact OSRV 2**
Client Vessel QTY
*50% Owned + 50% Third Party ** Options exist for a further 2 vessels for total of 4
Area (sqm)
Total
• Combination of third party construction and competitive advantage for the Towage and Offshore businesses
• Friendly funding available from FMM (Fundo da Marinha Mercante) – Long-term, Low-cost
• Strategically located assets with proven track record
Breadth (m)
22,000 17,000 39,000
4,500 5,500 10,000
SlipwayDry-
rockn/a
150 135 n/a
16 26 n/a
Siem Consub OSRV 1
14%
49%
37%
Constructed at WS Shipyard
Operators w/ related Shipyard
Operators using other Shipyard
14%
49%
37%
Constructed at WS Shipyard
Operators w/ related Shipyard
Operators using other Shipyard
21
21
56
32 2
1 1 12
3
12
7
54
3
1
32
1
2
2
3
2
2
3
1
199
2
199
3
199
4
199
5
199
6
199
7
199
8
199
9
200
0
200
1
200
2
200
3
200
4
200
5
200
6
200
7
200
8
200
9
201
0
201
1
2012
201
3
201
4
# of Tugboats delivered since 1992: 58
# of OSVs delivered since 2003: 18
21
21
56
32 2
1 1 12
3
12
7
54
3
1
32
1
2
2
3
2
2
3
1
199
2
199
3
199
4
199
5
199
6
199
7
199
8
199
9
200
0
200
1
200
2
200
3
200
4
200
5
200
6
200
7
200
8
200
9
201
0
201
1
201
2
201
3
201
4
Financial Highlights
21
This information is property of Wilson Sons and can not be used or reproduced without written permission
43.9 45.773.0
86.9109.0 109.2 108.3
152.0 146.3
182.8160.1
4.0 3.4
3.24.5
12.9 19.2 13.1
11.3 16.0
23.139.2
2004 2005 2006 2007 2008 2009 2010 2011 2012 2013 2014
EBITDA (IFRS)
EBITDA (Offshore Vessels)
47.9 49.1
76.291.4
122.7 128.4 121.4
163.3 162.3
205.9 199.3
211.2278.0
325.7393.3
476.7 439.8
547.6
656.6610.4
660.1 633.5
6.5
7.28.4
10.7
21.6 38.1
28.0
41.447.0
54.4 76.8
2004 2005 2006 2007 2008 2009 2010 2011 2012 2013 2014
Net Revenues (IFRS)
Net Revenues (Offshore Vessels)
217.7
285.2334.1
404.0
498.3477.9
575.6
657.4698.0 714.5 710.3
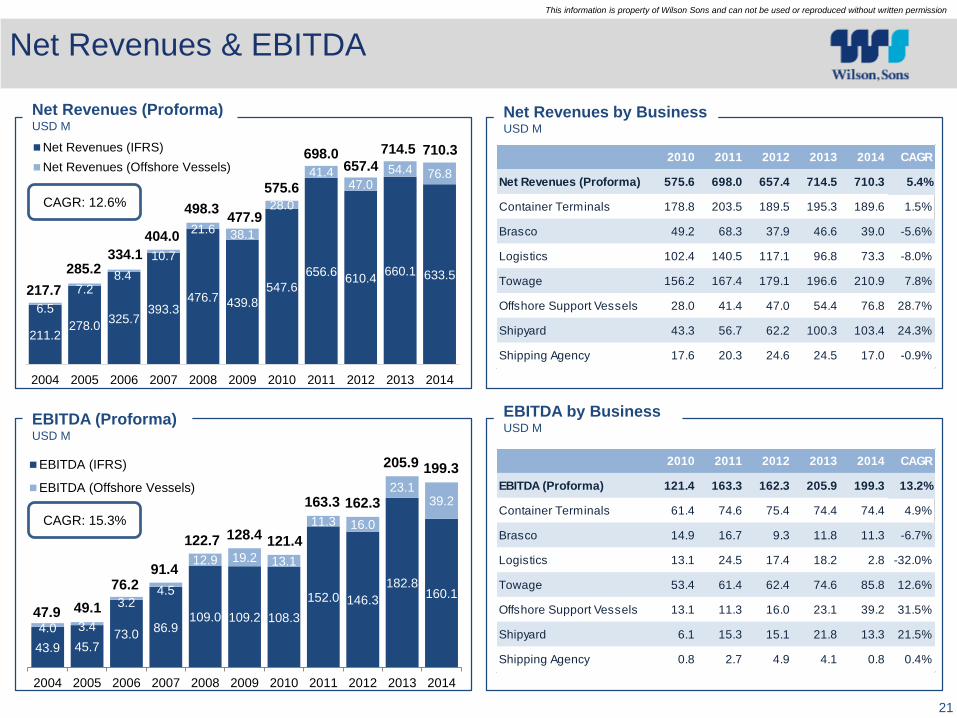
Net Revenues (Proforma)USD M
Net Revenues by BusinessUSD M
EBITDA (Proforma)USD M
EBITDA by BusinessUSD M
Net Revenues & EBITDA
CAGR: 12.6%
CAGR: 15.3%
2010 2011 2012 2013 2014 CAGR
Net Revenues (Proforma) 575.6 698.0 657.4 714.5 710.3 5.4%
Container Terminals 178.8 203.5 189.5 195.3 189.6 1.5%
Brasco 49.2 68.3 37.9 46.6 39.0 -5.6%
Logistics 102.4 140.5 117.1 96.8 73.3 -8.0%
Towage 156.2 167.4 179.1 196.6 210.9 7.8%
Offshore Support Vessels 28.0 41.4 47.0 54.4 76.8 28.7%
Shipyard 43.3 56.7 62.2 100.3 103.4 24.3%
Shipping Agency 17.6 20.3 24.6 24.5 17.0 -0.9%
2010 2011 2012 2013 2014 CAGR
EBITDA (Proforma) 121.4 163.3 162.3 205.9 199.3 13.2%
Container Terminals 61.4 74.6 75.4 74.4 74.4 4.9%
Brasco 14.9 16.7 9.3 11.8 11.3 -6.7%
Logistics 13.1 24.5 17.4 18.2 2.8 -32.0%
Towage 53.4 61.4 62.4 74.6 85.8 12.6%
Offshore Support Vessels 13.1 11.3 16.0 23.1 39.2 31.5%
Shipyard 6.1 15.3 15.1 21.8 13.3 21.5%
Shipping Agency 0.8 2.7 4.9 4.1 0.8 0.4%
22
This information is property of Wilson Sons and can not be used or reproduced without written permission
0%
5%
10%
15%
20%
25%
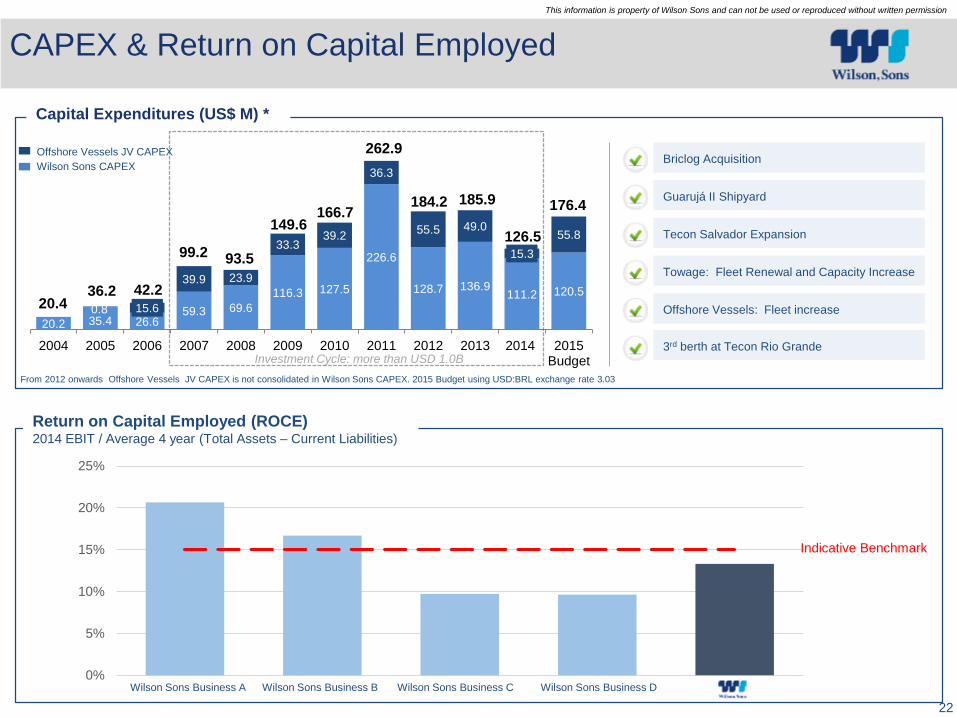
20.2 35.4 26.659.3 69.6
116.3 127.5
226.6
128.7 136.9111.2 120.5
0.8 15.6
39.9 23.9
33.339.2
36.3
55.5 49.0
15.3
55.8
2004 2005 2006 2007 2008 2009 2010 2011 2012 2013 2014 2015Budget
93.5
166.7
262.9
20.436.2 42.2
99.2
149.6
176.4
126.5
185.9184.2
Capital Expenditures (US$ M) *
CAPEX & Return on Capital Employed
Return on Capital Employed (ROCE)2014 EBIT / Average 4 year (Total Assets – Current Liabilities)
Investment Cycle: more than USD 1.0B
Guarujá II Shipyard
Tecon Salvador Expansion
Towage: Fleet Renewal and Capacity Increase
Offshore Vessels: Fleet increase
3rd berth at Tecon Rio Grande
Briclog Acquisition
From 2012 onwards Offshore Vessels JV CAPEX is not consolidated in Wilson Sons CAPEX. 2015 Budget using USD:BRL exchange rate 3.03
Indicative Benchmark
Offshore Vessels JV CAPEX
Wilson Sons CAPEX
Wilson Sons Business A Wilson Sons Business B Wilson Sons Business C Wilson Sons Business D
23
This information is property of Wilson Sons and can not be used or reproduced without written permission
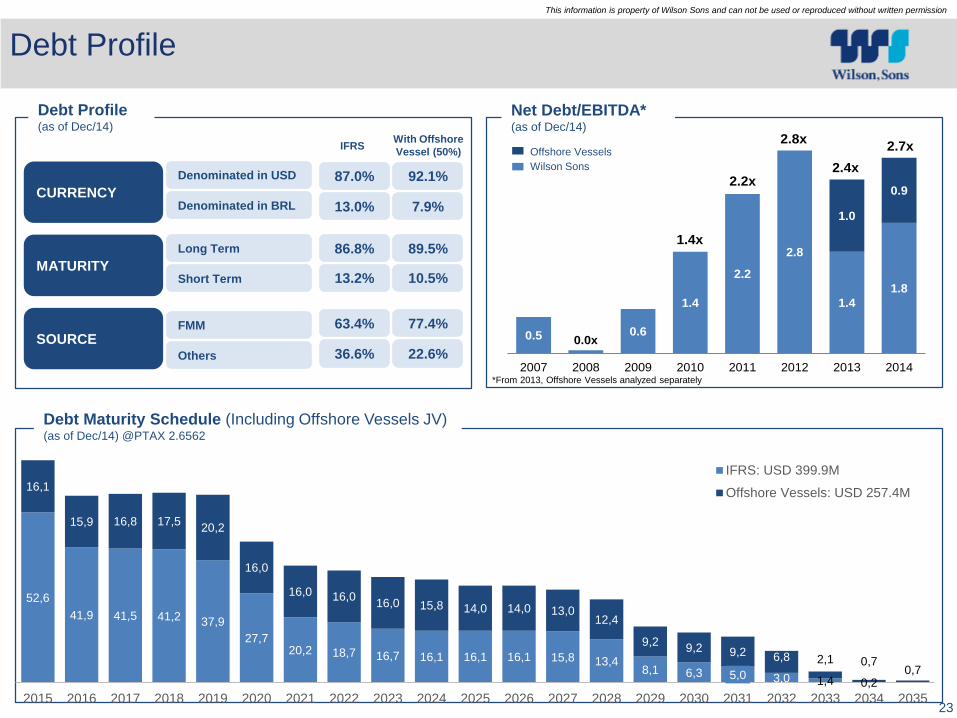
Debt Profile
0.5 0.0x0.6
1.4
2.2
2.8
1.4
1.8
1.0
0.9
2007 2008 2009 2010 2011 2012 2013 2014
1.4x
2.2x
2.8x
2.4x
2.7x
Net Debt/EBITDA*(as of Dec/14)
Debt Profile(as of Dec/14)
Debt Maturity Schedule (Including Offshore Vessels JV) (as of Dec/14) @PTAX 2.6562
*From 2013, Offshore Vessels analyzed separately
87.0%
13.0%
86.8%
13.2%
36.6%
63.4%
CURRENCY
Denominated in USD
Denominated in BRL
MATURITY
Long Term
Short Term
SOURCEOthers
FMM
92.1%
7.9%
89.5%
10.5%
22.6%
77.4%
IFRSWith Offshore
Vessel (50%) Offshore Vessels
Wilson Sons
52,6
41,9 41,5 41,2 37,9
27,720,2 18,7 16,7 16,1 16,1 16,1 15,8 13,4
8,1 6,3 5,0 3,0 1,4 0,2
16,1
15,9 16,8 17,520,2
16,0
16,0 16,016,0 15,8 14,0 14,0 13,0
12,4
9,29,2 9,2 6,8 2,1 0,7
0,7
2015 2016 2017 2018 2019 2020 2021 2022 2023 2024 2025 2026 2027 2028 2029 2030 2031 2032 2033 2034 2035
IFRS: USD 399.9M
Offshore Vessels: USD 257.4M
24
This information is property of Wilson Sons and can not be used or reproduced without written permission
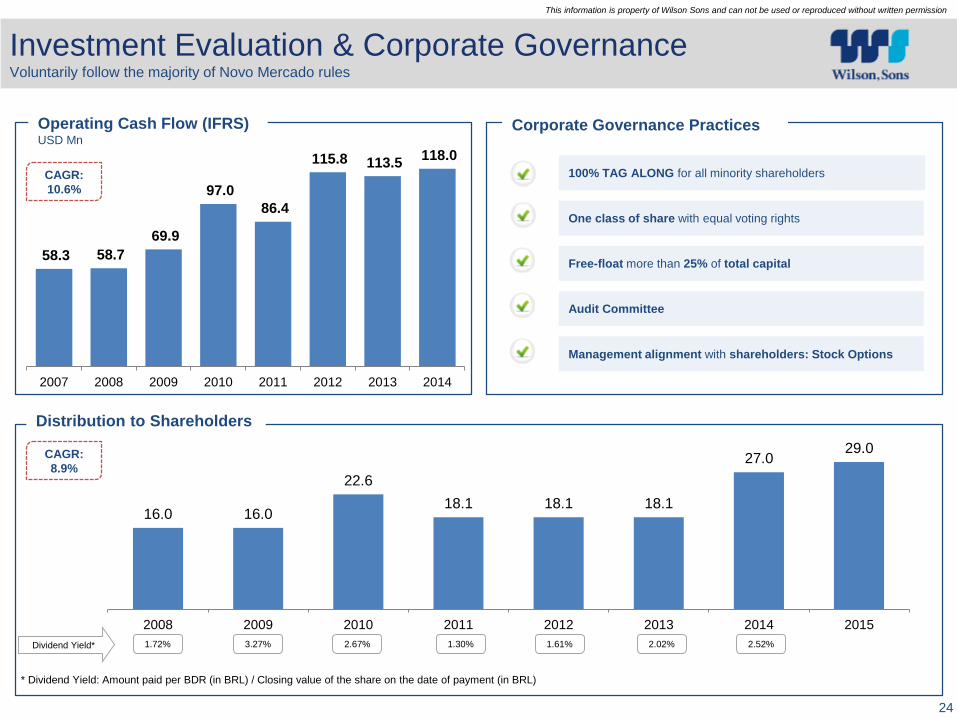
58.3 58.7
69.9
97.0
86.4
115.8 113.5 118.0
2007 2008 2009 2010 2011 2012 2013 2014
Operating Cash Flow (IFRS) USD Mn
Investment Evaluation & Corporate GovernanceVoluntarily follow the majority of Novo Mercado rules
100% TAG ALONG for all minority shareholders
One class of share with equal voting rights
Free-float more than 25% of total capital
Audit Committee
Management alignment with shareholders: Stock Options
Corporate Governance Practices
CAGR:
8.9%
1.72% 3.27% 2.67% 1.30% 1.61% 2.02%Dividend Yield*
* Dividend Yield: Amount paid per BDR (in BRL) / Closing value of the share on the date of payment (in BRL)
2.52%
Distribution to Shareholders
16.0 16.0
22.6
18.1 18.1 18.1
27.029.0
2008 2009 2010 2011 2012 2013 2014 2015
CAGR:
10.6%
Annex
26
This information is property of Wilson Sons and can not be used or reproduced without written permission
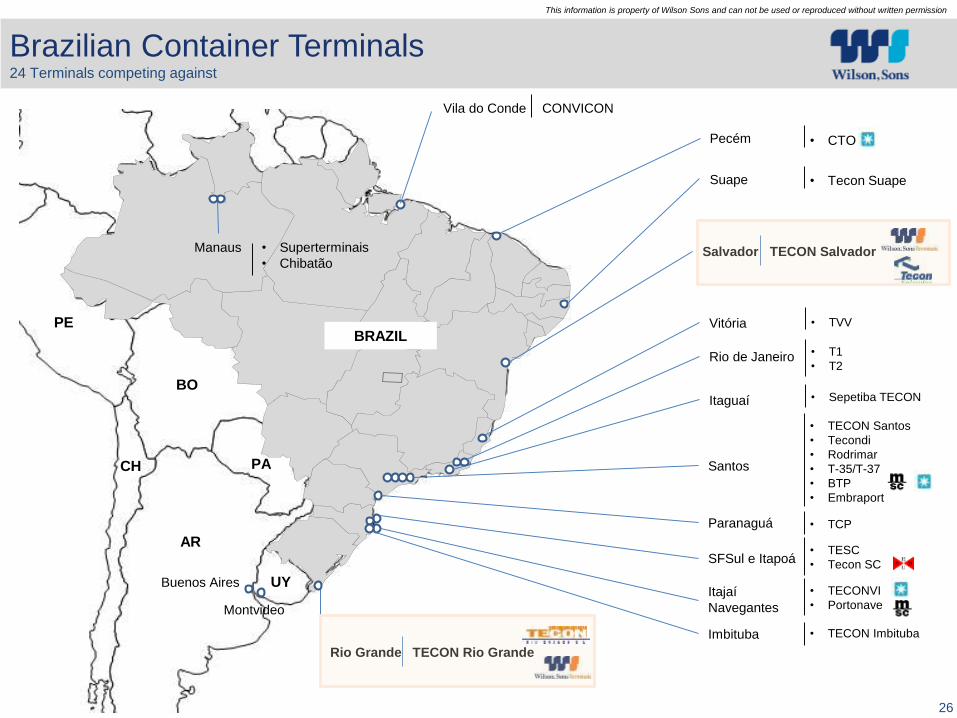
Brazilian Container Terminals24 Terminals competing against
Vila do Conde CONVICON
• CTOPecém
Suape • Tecon Suape
Salvador TECON Salvador
Rio Grande TECON Rio Grande
Vitória • TVV
Imbituba • TECON Imbituba
Rio de Janeiro • T1
• T2
Itaguaí • Sepetiba TECON
Santos
• TECON Santos
• Tecondi
• Rodrimar
• T-35/T-37
• BTP
• Embraport
Paranaguá • TCP
SFSul e Itapoá• TESC
• Tecon SC
Itajaí
Navegantes
• TECONVI
• Portonave
Manaus • Superterminais
• Chibatão
BRAZIL
AR
UY
CH
BO
PA
PE
Buenos Aires
Montvideo
27
This information is property of Wilson Sons and can not be used or reproduced without written permission
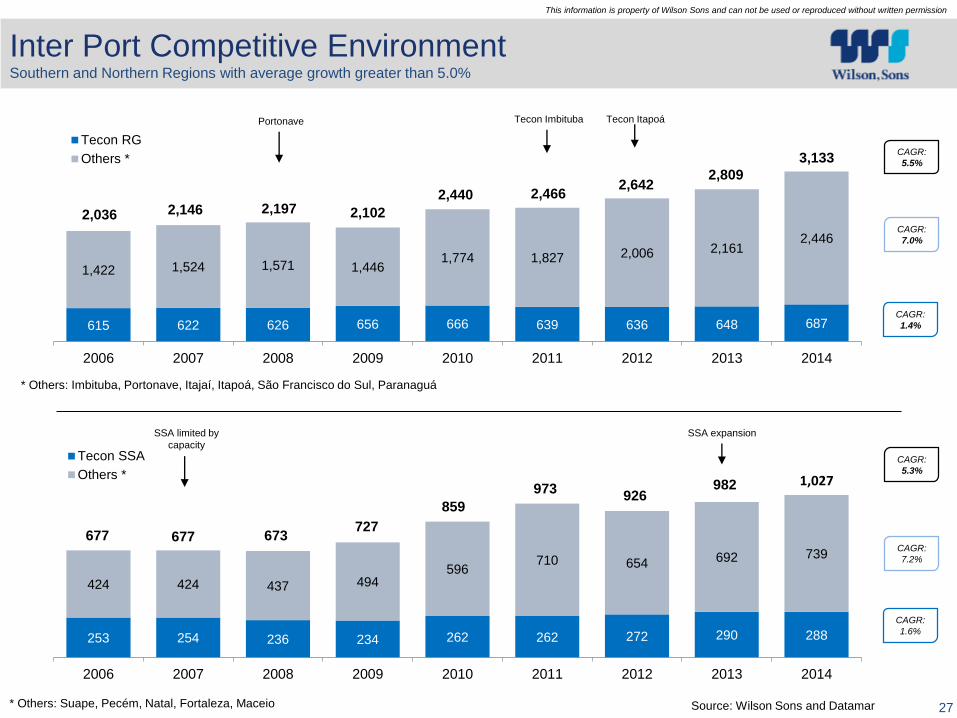
Inter Port Competitive EnvironmentSouthern and Northern Regions with average growth greater than 5.0%
Portonave Tecon Itapoá
CAGR:
1.4%
CAGR:
7.0%
CAGR:
5.5%
Tecon Imbituba
* Others: Imbituba, Portonave, Itajaí, Itapoá, São Francisco do Sul, Paranaguá
* Others: Suape, Pecém, Natal, Fortaleza, Maceio
CAGR:
1.6%
CAGR:
7.2%
CAGR:
5.3%
SSA limited by
capacity
SSA expansion
Source: Wilson Sons and Datamar
615 622 626 656 666 639 636 648 687
1,422 1,524 1,571 1,4461,774 1,827 2,006 2,161
2,446
2006 2007 2008 2009 2010 2011 2012 2013 2014
Tecon RG
Others *
2,036 2,146 2,197 2,102
2,440 2,4662,642
2,809
3,133
253 254 236 234 262 262 272 290 288
424 424 437 494596
710 654 692 739
2006 2007 2008 2009 2010 2011 2012 2013 2014
Tecon SSA
Others *
677 677 673727
859
973926
982 1,027
28
This information is property of Wilson Sons and can not be used or reproduced without written permission
Investor Relations Contact Info
BM&FBovespa: WSON33
IR website: www.wilsonsons.com/ir
Twitter: @WilsonSonsIR
Youtube Channel: WilsonSonsIR
Facebook: Wilson, Sons
Felipe Gutterres
CFO of the Brazilian Subsidiary and Investor Relations
+55 (21) 2126-4112
Michael Connell
IRO, International Finance & Finance Projects
+55 (21) 2126-4107
Kelly Calazans
Investor Relations
+55 (21) 2126-4105
Júlia Ornellas
Investor Relations
+55 (21) 2126-4293