iii simpósio internacional em formulação de dietas para ... · 15:30-17:00 ric r. grummer...
TRANSCRIPT
III Simpósio Internacional em
Formulação de Dietas para
Gado Leiteiro
Lavras, 27 e 28 de Agosto de 2014

Este evento contou com o apoio do: Programa de Apoio a Eventos no País (Paep) da Coordenação de
Aperfeiçoamento de Pessoal de Nível Superior
EDITORES
Marcos Neves Pereira e Renata Apocalypse Nogueira Pereira

Universidade Federal de Lavras
Departamento de Zootecnia
Caixa Postal 3037
Lavras, 37.200-000.
Brasil, Minas Gerais.
Grupo do Leite
www.grupodoleite.com.br
Simpósio Internacional em Formulação de Dietas para Gado
Leiteiro(3. : 2014 : Lavras, MG)
Anais [do] III Simpósio Internacional em Formulação de Dietas
para Gado Leiteiro, Lavras, MG, 27 e 28 de agosto de 2014 /
editores: Marcos Neves Pereira, Renata Apocalypse Nogueira
Pereira. – Lavras : [s.n.], 2014.
142 p. : il
Bibliografia.
ISBN 9788581790770
1. Gado de leite. 2. Amido. 3. Milho. 4. Alimentos concentrados.
5. Formulação de dietas. I. Universidade Federal de Lavras. II.
Título.
CDD – 636.20855
Ficha Catalográfica Elaborada pela Coordenadoria de Produtos e
Serviços da Biblioteca Universitária da UFLA

COMISSÃO ORGANIZADORA
Antônio Carlos Bernardes Silva
Augusto Francisco Júnior
Bruno Bella de Castro Junqueira
Bruno Monteiro da Fonseca
Cecília Donata Silva de Oliveira
Eugênio Faria Barbosa
Fabiana de Freitas Cardoso
Gilson Sebastião Dias Junior
Iago Gonçalves Santiago
Jeferson Vinicius Freitas Teixeira
Júlia Diane Lima Dias
Karina Toledo da Silva
Kesia da Silva Oliveira
Larissa Estefane Cruz das Graças
Lauro Vicente Domingos Maranha
Luan Henrique Lopes de Sousa
Lucas Carneiro de Resende
Lucas Parreira de Castro
Marcos Neves Pereira
Marcus Vinicius Corrêa
Marina Apocalypse Nogueira Pereira
Naina Magalhães Lopes
Ozana de Fátima Zacaroni
Rafael Caputo Oliveira
Rafael Carvalho Cunha
Ramon Lopes Salvatte
Rayana Brito da Silva
Renata Apocalypse Nogueira Pereira
Ricardo Peixoto de Melo
Roberto Rodrigues Vilela
Tulio Henrique Rosa Souza
Victória Rodrigues Caproni
Wesley de Rezende Silva
Willian Pereira dos Santos
AGRADECIMENTOS
A Comissão Organizadora dedicou especial atenção na elaboração da programação e do material que está sendo
agora disponibilizado.
Aos palestrantes do III Simpósio Internacional em Formulação de Dietas para Gado Leiteiro, pelo interesse em
contribuir com esse material de qualidade e disponibilidade em enviar as palestras aqui reunidas.
Ao apoio financeiro concedido pelo Conselho Regional de Medicina Veterinária de Minas Gerais, Coordenação de
Aperfeiçoamento de Pessoal de Nível Superior (CAPES), Programas de Pós Graduação da Medicina Veterinária e da
Zootecnia da UFLA, Revistas Balde de Branco e Leite Integral e pelas empresas patrocinadoras. A realização do evento só
foi possível pelo apoio recebido por eles.
E por último, mas não menos importante, nosso especial agradecimento a todos os participantes.

PROGRAMAÇÃO
27 de agosto de 2014
9:00 –10:00 Abertura
10:00-11:30 Marcos Neves Pereira (Universidade Federal de Lavras): Dureza do grão de milho: Um tópico Brasileiro
(Corn grain hardness: A Brazilian topic)
13:30-15:00 Ronaldo Braga Reis (Universidade Federal de Minas Gerais): Processamento de amido do concentrado
para vacas em pastejo (Concentrate starch processing for grazing cows)
15:30-17:00 Luiz Felipe Ferraretto (University of Wisconsin - Madison): Estratégias para obter alta digestibilidade de
amido em silagem e grão de milho (Strategies to obtain high starch digestibility in corn grain and silage)
28 de agosto de 2014
8:00 - 9:30 Shawn S. Donkin (University of Purdue): Resposta metabólica de vacas leiteiras a produtos da digestão
ruminal do amido (Metabolic response of dairy cows to products of ruminal starch digestion)
10:00-11:30 Charles G. Schwab (University of New Hampshire): Efeito do tipo de amido sobre a otimização de
aminoácidos na dieta de vacas leiteiras (Effect of starch type on optimizing amino acids in diets of dairy
cows)
13:30-15:00 John Goeser (Rock River Laboratory, Inc/3rlab): Análises laboratoriais de taxas de degradação ruminal
de carboidratos (Laboratory analysis of rates of ruminal carbohydrate degradation)
15:30-17:00 Ric R. Grummer (Balchem Corporation): Estratégias para reduzir disfunções metabólicas em torno do
parto (Strategies to reduce metabolic dysfunctions around calving)

SUMÁRIO
Introdução III Simpósio Internacional em Formulação de Dietas para Gado Leiteiro ............................... 1
Introduction III International Symposium on Feed Formulation for Dairy Cattle ...................................... 1
Dureza do grão de milho: um tópico brasileiro Marcos N. Pereira, Universidade Federal de Lavras ....................................................... 2
Processamento de amido do concentrado para vacas em pastejo Ronaldo B. Reis, Universidade Federal de Minas Gerais ............................................... 12
Strategies to obtain high starch digestibility in corn grain and silage Luiz Ferraretto, University of Wisconsin ...................................................................... 28
Metabolic response of dairy cows to ruminal starch digestion products Shawn S. Donkin, Purdue University ......................................................................... 33
Effect of Starch Type on Optimizing Amino Acids in Diets of Dairy Cows Chuck Schwab, University of New Hampshire ............................................................. 39
Accounting for Differences in Starch Digestibility Using the NRC 2001 Model Gary N. Foster, Central Valley Nutritional Associates .................................................... 46
Accurately estimating cow-level digestion: where do digestion rates fit and what do they mean? John Goeser, Rock River Laboratory ......................................................................... 50
Strategies to Reduce Metabolic Dysfunctions Around Calving Ric R. Grummer, Emeritus Professor, University of Wisconsin ........................................ 57

1
INTRODUÇÃO
III Simpósio Internacional em Formulação de Dietas para Gado Leiteiro
O investimento em alimentos concentrados é o maior item de custo da atividade leiteira. Um desafio
na produção de bovinos leiteiros no Brasil é a obtenção de alta eficiência alimentar e desempenho animal em
dietas contendo alto teor de milho com textura dura do endosperma como concentrado energético. Híbridos
duros brasileiros são menos digestíveis do que híbridos farináceos adotados em outras partes do mundo.
Algumas estratégias de manejo nutricional podem ser adotadas para melhorar o desempenho animal e a
eficiência alimentar e reduzir a perda de nutrientes em dietas baseadas em milho de baixa digestibilidade.
Este simpósio, em sua terceira versão bianual, visa ser específico no tópico formulação de dietas para
bovinos leiteiros, focando no amido do milho.
III International Symposium on Feed Formulation for Dairy Cattle
The investment in concentrate feedstuffs represents the major cost item of the dairy activity. A
challenge for the production of dairy cattle in Brazil is obtaining high feed efficiency and animal performance
with diets containing high content of corn with hard endosperm texture as an energetic concentrate. Brazilian
hard corn hybrids are less digestible than the floury hybrids adopted in other parts of the world. Some
nutritional management strategies may improve animal performance and feed efficiency, and reduce the
nutrient loss in diets based in low digestibility corn. This symposium, in its third bi-annual version, aims at
being specific on the topic diet formulation for dairy cattle, with focus on corn starch.
Marcos Neves Pereira
Renata Apocalypse Nogueira Pereira Grupo do Leite

2
Dureza do grão de milho: um tópico brasileiro
Marcos Neves Pereira
Professor Titular, Departamento de Zootecnia. Universidade Federal de Lavras
Lavras, Brasil
O milho no Brasil
O milho é provavelmente a espécie com maior variabilidade genética dentre as plantas cultivadas pelo homem. Achados arqueológicos sugerem que o milho tem sido cultivado na América Central e norte da América do Sul por cerca de 7.000 anos (Roney e Hard, 2009), existindo nas Américas do Sul e do Norte em forma semelhante ao que hoje conhecemos a mais de 5.000 anos (Brieger et al., 1958). Nas latitudes extremas, ao norte dos Estados Unidos e no Canadá e ao sul do Chile e Argentina, e na costa Atlântica desde o Canadá até a Argentina, predominou o milho de endosperma duro (Flint). A chegada do milho dentado mexicano ao sudoeste dos Estados Unidos ocorreu 300 a 400 anos atrás. Acredita-se que o México foi o centro de origem do milho dentado do Caribe, cultivares mexicanos eram majoritariamente dentados duros, com endosperma vítreo no topo e laterais da semente (Brieger et al., 1958). Estes, ao serem cruzados com o milho duro do norte dos Estados Unidos, deram origem ao milho dentado do cinturão do milho norte-americano. Cultivares dentados macios tiveram origem na América do Sul, como o Cariaco Dentado, do norte da Colômbia, e os Caingang, do sul do continente. O estudo de raças brasileiras de milho foi iniciado pela Escola Superior de Agricultura Luiz de Queiroz (Esalq) em 1937, sendo apoiado financeiramente pela Academia Nacional de Ciências dos Estados Unidos a partir de 1953. Em 1952, pesquisadores da Esalq haviam coletado mais de 3.000 amostras de variedades crioulas e indígenas do Brasil. O primeiro programa de melhoramento de milho do Brasil se iniciou em 1932, quando o Instituto Agronômico de Campinas (IAC) fez autofecundações de variedades locais. Em 1939, o primeiro híbrido simples foi obtido pelo IAC, produzindo 50% a mais que as variedades locais.
Milho do tipo pipoca é considerado a forma mais primitiva deste cereal (Brieger et al., 1958). Milho do tipo Flint (duro) representa o segundo estágio de domesticação do milho, por serem maiores que o pipoca e por possuírem algum endosperma macio. Milho tipo farináceo é considerado o terceiro estágio de domesticação e teve alto valor para as antigas
populações indígenas, por ser facilmente triturável ou de uso mais fácil na culinária. A vantagem do milho dentado, considerado o tipo de milho mais evoluído, advém do seu valor como alimento para animais, algo de utilidade mais recente e sem importância para populações indígenas. Considerando a origem, a morfologia e a dispersão geográfica, as raças de milho do Brasil foram classificadas por Paterniani e Goodman (1977) em quatro grandes grupos: Raças indígenas, raças comerciais antigas, raças comerciais recentes, e raças exóticas.
São consideradas raças indígenas aquelas que foram cultivadas e selecionadas somente pelos índios. As raças indígenas de milho se originaram de raças oriundas de outros países da América do Sul ou Central. Algumas raças de milho classificadas como indígenas tinham endosperma farináceo e branco, como a Moroti, Caingang e Entrelaçado, enquanto a Pipoca Guarani tinha endosperma duro. Grãos de endosperma duro e macio coexistiam na população de milho indígena do Brasil. Brieger et al. (1958) relata que índios da tribo Caingang, antigos habitantes de São Paulo, Paraná e Santa Catarina, cultivavam apenas um tipo de milho com endosperma macio, mas também cultivavam algum Cateto (duro), o qual não utilizavam, mas vendiam.
As raças comerciais antigas são as que existiam no período pré-colombiano e que foram adotadas pelos agricultores de origem europeia. Essas raças também eram de origem indígena, entretanto sofreram mudanças devido ao cultivo em maior escala. Os índios Guaranis cultivavam as raças Avatí e Cristal no Paraguai, em parte da Bolívia e no sudeste do Brasil. Outras etnias cultivavam milhos denominados Catetos, possivelmente as primeiras variedades de milho cultivadas extensivamente pelos imigrantes europeus (Figura 1).
Os Catetos foram a base genética para o melhoramento de genótipos do milho tropical brasileiro (Paterniani e Viégas, 1978). Catetos estavam presentes deste o Caribe, passando pelas Guianas, e atingiram o máximo desenvolvimento no sul do Brasil, Uruguai e Argentina. Catetos também originaram o milho duro e alaranjado da região mediterrânea da Europa, provavelmente levado pelos portugueses. Raças classificadas como comerciais antigas são a Cristal

3
Sulino, Cristal, Canário de Ocho, Cateto Sulino Precoce, Cateto Sulino, Cateto Sulino Grosso, Cateto e Cateto Nortista. Estas raças de milho tinham grãos com endosperma duro, de coloração branca a alaranjada.
As raças comerciais recentes só foram cultivadas no Brasil a pouco mais de 100 anos. Essas raças foram introduzidas de outras regiões ou foram obtidas pela hibridação natural de raças introduzidas com raças de origem indígena. Raças classificadas como comerciais recentes são: Dente Riograndense, Dente Paulista, Dente Branco, Semi-Dentado e Cravo. Estas raças tinham grãos com característica dentada e coloração de amarelo-alaranjado a branco, sendo originárias do cruzamento de milho dentado dos Estados Unidos, como a Gourdseed, Shoepeg, Golden Dent, Hasting’s Prolific e Golden Mine, com milhos locais do tipo Cateto. As introduções de milho dentado dos Estados Unidos provavelmente ocorreram entre 1860 e 1865, devido à guerra civil americana, quando norte-americanos emigraram para o Brasil, e entre 1910 e 1915, quando o então secretário de agricultura de Minas Gerais, Benjamin Hunnicutt, organizou “shows” de milho com variedades norte-americanas. Biriger et al. (1958) relata que em levantamento feito no estado de São Paulo na década de 1950, 60% das fazendas utilizava alguma forma de milho sintético Cateto-Dentado, resultante do cruzamento de variedades dentadas importadas com o Cateto (Figura 2).
Uma proporção razoável destes sintéticos desenvolvidos em fazendas produzia mais que os melhores híbridos duplos de Cateto disponíveis em 1954. A preferência dada a híbridos parcialmente dentados se devia ao fato destes serem mais adequados a alimentação animal do que Catetos puros com endosperma muito duro (Brieger et al., 1958. Página 190). Este conhecimento nutricional simples foi aparentemente deletado da memória da maioria dos brasileiros.
As raças exóticas de milho foram introduzidas mais recentemente a partir de outros países. Raças classificadas como exóticas são: Hickory King (grãos dentados brancos) e Tusón (grãos dentados amarelos). Entretanto, outras fontes de germoplasma exótico foram introduzidas, como as variedades Asteca e Maia, desenvolvidas pelo IAC, e Piramex, desenvolvida pela Esalq a partir de variedades de Tuxpeño. A cultivar Pérola Piracicaba, também desenvolvida pela Esalq e resultante da combinação de Cateto e de milhos duros da Colômbia, e a cultivar Centralmex, desenvolvida a partir da combinação de Piramex com milhos originários da América Central, também são introduções mais recentemente.
A introdução de cultivares exóticas permitiu aumentos substanciais na produtividade do milho no Brasil e possibilitou grandes avanços na área de melhoramento genético da cultura. A base genética do milho no Brasil é quase que exclusivamente derivada de
germoplasma exótico por introdução de populações, variedades e linhagens, principalmente dos Estados Unidos e do México.
A evolução das cultivares de milho no Brasil a partir da década de 1930 até o final do século XX foi revista por Sawazaki e Paterniani (2004), tendo como base os ensaios regionais e nacionais de cultivares. Segundo os autores, na década de 1930 as cultivares comerciais eram variedades de origem desconhecida, sendo muitas delas provenientes de introduções ou de seleções praticadas por agricultores. Já no final da década de 1940 e início dos anos 50, o IAC e a Sementes Agroceres iniciaram a obtenção dos primeiros híbridos de milho no Brasil, obtidos pelo cruzamento de linhagens extraídas da variedade Cateto e Tuxpan. Na década de
Figura 1. Cultivar Cateto Grosso oriundo de São Paulo. Os Catetos ocupavam praticamente toda a costa da Argentina às Guianas, onde se misturavam ao Flint Caribeano. Várias raças de Cateto são descritas, todas de endosperma duro (Brieger et al., 1958).
Figura 2. Cultivar Dente paulista formado pelo cruzamento de milho dentado oriundo dos EUA com Cateto (Brieger et al., 1958).

4
1950, o IAC produziu híbridos duplos semidentados provenientes de cruzamentos entre linhagens obtidas das variedades Amarelão, Tuxpan e Cateto. Concomitantemente, o IAC testou a variedade Azteca, introduzida do México. Nas décadas de 1970 e 80, o programa de melhoramento de milho da Embrapa Milho e Sorgo baseou-se em germoplasma introduzido de diversas partes do mundo, principalmente do México, e em germoplasma obtido por coleta em várias regiões brasileiras, sendo considerado no melhoramento as diferenças entre ecossistemas e a necessidade de adaptação a estresses ambientais. O desenvolvimento de cultivares de milho é um setor muito ativo no país, com presença marcante das principais empresas multinacionais. A safra comercial de milho no Brasil é dependente da utilização de sementes híbridas, em lavouras tecnificadas e situadas em ambientes favoráveis para a cultura.
Atualmente, híbridos de milho com grãos de textura dura, nos quais predomina endosperma vítreo de alta densidade, são predominantes no mercado brasileiro de sementes. Esse fato se explica pela priorização em programas de melhoramento genético em regiões tropicais de características do grão mais adequadas à manutenção da qualidade frente a adversidades climáticas, de colheita, e de armazenamento (Duarte et al., 2007). Correa et al. (2002), ao avaliar cinco híbridos brasileiros representando a amplitude de densidade de grãos disponível no mercado de sementes, observaram que nossos híbridos foram mais vítreos (73,1% do endosperma, variando de 64,2% a 80,0%) que 14 híbridos cultivados no estado de Wisconsin, EUA (48,2% do endosperma, variando de 34,9% a 62,3%). Isto evidencia a baixa oferta de sementes de híbridos de endosperma farináceo no Brasil. Dentre as 467 cultivares de milho disponibilizadas para comercialização na safra 2013/2014, apenas 6,2% possuía grãos dentados, enquanto 55,2% foi classificada como semiduro e 18,4% como Duro/Flint (Cruz et al., 2014).
Estrutura do grão de milho
Os grãos representaram cerca de 42% (37 a 47%) da matéria seca da forragem da planta de oito híbridos de milho colhidos nos estágios de maturidade metade e ¾ da linha do leite e linha negra (Pereira et al., 2012). Os componentes do grão são: Pedicelo, pericarpo, embrião e endosperma. Estas estruturas correspondem a aproximadamente 1%, 5%, 12% e 82% do peso seco de grãos maduros, respectivamente (Carvalho e Nakagawa, 2000). O pedicelo é a menor estrutura do grão e a única não coberta pelo pericarpo, sendo responsável pela conexão do grão ao sabugo. O pericarpo é a camada predominantemente fibrosa que protege o endosperma (Figura 3).
Esta estrutura se origina do crescimento das paredes do ovário. Portanto, o pericarpo é um tecido de origem materna, cuja genética independe da fertilização. O embrião da semente tem teor elevado de lipídeos (35%) e proteína (19%) e baixo teor de amido (8%). O embrião e o endosperma são produtos da fertilização, já o pedicelo e o pericarpo são tecidos maternos no milho.
O milho é uma planta monocotiledônea, cujo grão é um fruto tipo cariopse com sementes envolvidas por pericarpo (Smith et al., 2004). A formação dos grãos ocorre a partir da antese, quando os grãos de pólen são liberados pelo pendão, recaindo sobre estilos e estigmas receptivos. Na formação do grão de milho ocorre uma dupla fertilização (Ramalho et al., 2008). Um dos núcleos reprodutivos se funde à oosfera, gerando a célula ovo ou zigoto, que por meio de mitoses originará o embrião da semente. O outro núcleo reprodutivo se funde com dois núcleos polares, formando uma célula triploide (2n = 3x) que se divide mitoticamente para originar o endosperma.
O endosperma do milho é composto por amido (86%) e alguma proteína (9%). O amido do endosperma é sintetizado a partir de sacarose. A sacarose é convertida em glicose e é polimerizada em amilose (amido linear) ou amilopectina (amido ramificado), que são empacotados como grânulos cristalinos nos amiloplastos, envolvidas por uma matriz proteica (Soave e Salamini, 1984). A proporção entre amilose e amilopectina não é o determinante da textura (dureza) do endosperma do milho (Corona et al., 2006). Existe variação no formato dos grânulos de amido do endosperma, sendo estes de superfície lisa e esféricos no endosperma farináceo, e de superfície irregular e angulosos no endosperma vítreo (Figura 4).
O endosperma farináceo apresenta matriz proteica descontínua, com poucos corpos proteicos,
Figura 3. Foto de microscopia eletrônica do pericarpo do milho, mostrando a sobreposição de camadas fibrosas.

5
grânulos de amido maiores e menos agregados (Narvaez-Gonzalez et al., 2006). O endosperma vítreo possui matriz proteica contínua, grânulos de amido menores e mais agregados.
Dentre as proteínas do endosperma temos as não-zeínas albumina, globulina e glutelina, e as proteínas de reserva, as prolaminas. Prolaminas são proteínas ricas no aminoácido prolina, com características hidrofóbicas, sendo de baixa solubilidade em água ou fluído ruminal. As prolaminas estão associadas ao amido nos grãos de todos os cereais e têm nomes específicos, como a gliadina do trigo, a kafirina do sorgo e a zeína do milho, por exemplo. A zeína do milho representa de 50 a 60% da proteína no grão (Hamaker et al., 1995). As prolaminas se localizam exteriormente aos grânulos de amido no endosperma, na forma de corpos proteicos (Mu-Forster e Wasserman, 1998). As prolaminas do milho consistem de quatro subunidades: α, β, γ, δ. Com o avançar da maturidade da planta ocorre perda no teor de umidade do grão e aumento no teor de prolaminas, encapsulando o amido em uma matriz hidrofóbica de amido e proteína. A extensiva ligação entre as subclasses de zeína produz o endosperma vítreo. Em endosperma farináceo o teor de zeínas é menor que em vítreo e predominam zeínas do tipo α, enquanto zeínas γ são prevalentes no endosperma vítreo (Dombrink-Kurtzman e Bietz, 1993).
A textura do milho é definida pela proporção entre endospermas vítreo e farináceo, sendo mais facilmente quantificável em grãos no estágio maduro de maturação. Endosperma mais vítreo é encontrado predominantemente nas laterais da semente, sendo mais refratário à passagem de luz (Figura 5). A vitreosidade (% de endosperma vítreo no endosperma total) se relaciona a uma propriedade física do milho, a dureza (Figura 6).
Milho de alta vitreosidade é duro, enquanto milho de baixa vitreosidade é macio.
O escore de identação é a forma adotada pela indústria brasileira de sementes para caracterizar de forma subjetiva a dureza dos grãos de milho. Entretanto, esta caracterização visual do grão não considera que a dureza do endosperma independe do pericarpo. Existe milho com endosperma 100% farináceo que não é dentado (Figura 7), e existe milho dentado com endosperma duro. Existe uma tendência de raças de
Figura 4. Grânulos de amido em endosperma farináceo e vítreo.
Figura 5. Grãos de milho com endosperma de alta vitreosidade. Áreas vítreas se localizam majoritariamente nas laterais da semente.
Figura 6. Avaliação visual da dureza do grão em silagem de milho. A maciez do grão é maior em híbridos de baixa vitreosidade, imaturos e ensilados por mais tempo.

6
milho farináceo também serem dentados, mas isto não é uma regra.
A avaliação visual da identação pode não refletir a dureza do milho, pois se avalia o aspecto do pericarpo e não a constituição do endosperma. O pericarpo formado após a fertilização corresponde à parede do ovário. Portanto, o pericarpo não representa a constituição do endosperma, determinante da dureza. Formas mais adequadas de mensuração da vitreosidade são necessárias. A densidade do grão medida com picnômetro é uma forma simples de quantificar a vitreosidade do endosperma em grãos de milho (Correa et al., 2002), a força de compressão avaliada em texturômetro também é promissora como forma de descrição e seleção de plantas (Davide et al., 2011). A mensuração da vitreosidade e da densidade do grão por NIRS também é plausível (Ngonyamo-Majee et al., 2008). A classificação de cultivares como duro ou semiduro não descreveu a diferença em densidade e vitreosidade entre híbridos (Bordignon et al., 2007). O escore de identação não se correlacionou à degradabilidade ruminal do grão (Davide et al., 2011). A correlação entre a vitreosidade e a degradabilidade ruminal do grão de milho é linear e negativa (Philippeau e Michalet-Doureau, 1997; Correa et al., 2002). O controle genético da degradabilidade ruminal da matéria seca dos grãos e da forragem da planta de milho é predominantemente aditivo, com estimativas de herdabilidade ao redor de 46% e 80%, respectivamente, sendo portanto plausíveis de melhoramento genético (Gomes et al., 2004; Davide et al., 2011). A escolha de híbridos de milho considerando a dureza do endosperma é uma forma de atuar sobre a digestão do amido.
Dureza do endosperma e digestão
Experimentos envolvendo a dureza do milho têm sido realizados pelos departamentos de Zootecnia, de Agricultura e de Biologia da UFLA desde o final da década de 90. Inicialmente, avaliou-se a degradabilidade ruminal in situ de grãos macios (AG 1051 e AG 4051) e duros (AG 9012 e Tork) processados grosseiramente (Calestine et al., 1998; Pereira et al., 2004). Os grãos foram colhidos nas maturidades dentado inicial, metade da linha do leite e linha negra. A vitreosidade dos macios foi 38,2%, 46,9% e 47,9%, enquanto a dos duros foi 59,9%, 67,0% e 74,2%, respectivamente. No estágio de linha negra, a degradação da matéria seca em 24 horas de incubação ruminal foi 42,3% nos grãos macios e 19,0% nos duros, enquanto o resíduo após 72 horas de incubação (fração indigestível) foi 16,9% e 41,1%, respectivamente. A degradabilidade ruminal de duros e macios foi similar nos estágios dentado inicial e metade da linha do leite. O efeito negativo da maturidade sobre a degradabilidade ruminal foi mais acentuado nos híbridos duros do que nos macios. Este trabalho evidenciou que a colheita precoce pode reduzir o efeito negativo da dureza sobre a degradabilidade do grão de milho no rúmen, e que colheita tardia penaliza mais a degradabilidade ruminal de grãos duros que a de macios. O desempenho leiteiro de vacas alimentadas com silagem de milho farináceo ensilado em maturidade linha negra (41,7% de MS) foi similar ao de vacas alimentadas com silagem de milho duro no estágio metade de linha do leite (31,7% de MS) (Correa et al., 2003).
Pesquisadores franceses avaliaram o relacionamento entre a dureza do grão e a digestão do amido do milho. Philippeau e Michalet-Doureau (1997) estudaram um cultivar macio e um duro em cinco maturidades entre 22 e 78 dias após o florescimento. A vitreosidade dos grãos aumentou de forma linear com o avançar da maturidade e explicou 86% da variação em degradabilidade ruminal do amido. A degradabilidade do cultivar macio foi maior que a do duro, sendo que a diferença aumentou com o avançar da maturidade da planta. Estes autores também avaliaram a degradação ruminal de milho duro (55,4% de vitreosidade) ou macio (40,3% de vitreosidade) na maturidade metade de linha do leite, sob processamento de moagem ou ensilado, e em duas granulometrias (Philippeau e Michalet-Doureau, 1998). O milho duro foi menos degradado no rúmen que o macio, independentemente do tamanho de partícula ou do tipo do processamento. O milho finamente moído teve maior degradação ruminal, principalmente por ter maior fração instantaneamente degradada. A ensilagem aumentou a degradabilidade do grão no rúmen. Outro estudo do mesmo grupo avaliou a digestibilidade aparente do amido em milho duro (67% de vitreosidade) ou macio (51,7% de vitreosidade) grosseiramente moídos
Figura 7. Cultivar de milho com endosperma 100% farináceo e com extremidade lisa do grão (sem indentação)

7
(Philippeau et al., 1999). O estudo utilizou garrotes fistulados consumindo dietas com 48% de amido. Milho macio foi mais degradado no rúmen (60,8% vs. 34,8%), enquanto mais da metade da digestão do milho duro ocorreu no intestino. A digestibilidade do amido no trato digestivo total (84,2% vs. 81,7%, macio vs. duro) não diferiu entre cultivares, a maior digestibilidade intestinal do milho duro compensou sua menor digestibilidade ruminal. A manipulação da dureza do milho demonstrou ser uma forma de atuar sobre o local de digestão do amido no trato digestivo de bovinos.
Correa et al. (2002) avaliaram a relação entre a vitreosidade e a digestão do amido de grãos de milho brasileiros e norte-americanos no estágio maduro de maturação, usando incubações ruminais in situ. A degradabilidade do amido no rúmen foi 77,4% nos híbridos norte-americanos e 48,5% nos brasileiros. Vale ressaltar que, dentre os híbridos brasileiros avaliados, existia o material mais farináceo disponível no mercado de sementes, além de materiais de alta vitreosidade. O híbrido brasileiro mais degradado teve menor degradabilidade que o híbrido norte-americano menos degradado. O relacionamento entre a vitreosidade e a degradabilidade do amido no rúmen foi linear e negativo (r
2 = 0,75), demonstrando que quando sementes
farináceos não são amplamente disponíveis, como no Brasil, almejar menor vitreosidade do endosperma, mesmo que aquém do desejado, pode aumentar a proporção do amido sendo degradado no rúmen. A grande diferença entre o milho cultivado no Brasil e o cultivado nos Estados Unidos sugere que recomendações sobre o momento de ensilagem da forragem da planta de milho e a resposta produtiva de bovinos ao processamento deste grão (moagem, ensilagem, tratamentos por calor e vapor, etc) devem considerar a diferença na dureza do endosperma, o que limita a extrapolação direta da pesquisa internacional nestes tópicos para nossas condições.
Apesar da possibilidade de a dureza do endosperma determinar o local de digestão do amido no trato digestivo total (rumen vs. intestino), dados gerados com suínos sugerem que a textura dura do endosperma pode penalizar a digestão intestinal do amido em cultivares de milho brasileiros. Cantarelli et al. (2007) avaliaram cultivares de milho variando na vitreosidade em um ensaio de metabolismo com suínos em crescimento. Foram avaliados híbridos de alto óleo com 78,5% de vitreosidade, QPM com 71,7% de vitreosidade, dentado com 57,2% de vitreosidade, semidentado com 68,2% de vitreosidade, e dois duros com 75,9% e 82,8% de vitreosidade. O conteúdo de energia digestível (kcal/kg) dos grãos moídos foi: 3680 (a), 3426 (bc), 3597 (a), 3441 (bc), 3340 (c) e 3469 (b), respectivamente. O grão dentado teve valor energético similar ao do grão duro com alto teor de óleo (5,6% de EE na MN), e maior que o dos
grãos duros, QPM e semidentado. Piovesan et al. (2011) também observaram em ensaio de digestibilidade com leitões que os valores de energia digestível e metabolizável de milho semidentado foi superior ao de milho duro.
Taylor e Allen (2005) avaliaram a digestão de milho duro (67,2% de vitreosidade) e farináceo (3,0% de vitreosidade) em vacas leiteiras canuladas no rúmen e no duodeno, consumindo dietas com cerca de 23% de grão de milho finamente moído. A taxa de digestão ruminal do amido foi mais rápida e a taxa de passagem mais lenta para as dietas contendo milho de endosperma farináceo. A digestibilidade ruminal do amido foi 22 unidades percentuais maior no milho farináceo do que no vítreo. Apesar da digestão intestinal do amido ter reduzido a diferença na digestibilidade no trato digestivo total, o amido do milho farináceo teve maior digestão pós-ruminal que o do milho vítreo, resultando em maior digestibilidade do amido no trato digestivo total. Corona et al. (2006) avaliaram cultivares de milho com 55%, 61%, 63% e 65% de vitreosidade em dietas com 73% de milho floculado ou laminado para garrotes. Quando ofertado na forma laminada, milho de alta vitreosidade teve menor digestibilidade do amido no trato digestivo total, primariamente em decorrência de menor digestibilidade pós-ruminal do amido. A floculação eliminou o efeito da vitreosidade sobre a digestibilidade do amido. A maior vitreosidade do milho reduz a digestibilidade do amido no rúmen e no intestino, entretanto, o efeito da dureza do endosperma sobre a digestibilidade é manipulável pelo processamento do grão.
Ensilagem de grãos de milho
Como a disponibilidade de milho de endosperma farináceo é baixa no Brasil, e não existe tendência aparente de mudança nesta realidade, vários grupos de pesquisa têm se dedicado a avaliar o efeito do processamento do milho sobre o desempenho de bovinos de leite e de corte. O processamento do milho por ensilagem tem sido adotado por várias fazendas, seja na forma da silagem de grão úmido (ensilado em maturidade ao redor da linha negra) ou de milho maduro reidratado.
A silagem de milho maduro reidratado é uma forma de armazenamento do grão na fazenda e pode aumentar a digestibilidade ruminal do amido (Pereira et al., 2013). No armazenamento do milho por ensilagem ocorre proteólise crônica como resultado do processo fermentativo, reduzindo o teor de prolamina do grão. Quanto maior o tempo de armazenamento no silo, maior é o efeito da ensilagem sobre a digestibilidade do amido (Ferrareto et al., 2013). Hoffman et al. (2011) relataram que a ensilagem por 240 dias, de grãos de dois híbridos de milho colhidos com 25,7% e 29,3% de umidade, reduziu todas as subunidades de zeínas no endosperma,

8
exceto as 2α e a 1δ, e aumentou indicadores de degradabilidade proteica. A ensilagem reduziu as subunidades de zeína γ, principais responsáveis pelas ligações cruzadas na matriz amido-proteína.
O ganho em digestibilidade in vitro induzido pela ensilagem de milho maduro reidratado, proporcionalmente ao mesmo híbrido em estágio maduro finamente moído, foi maior em milho de textura dura do que em milho farináceo (Andrade Filho et al., 2010). A degradabilidade ruminal do híbrido macio moído foi 64,2%, enquanto foi 77,5% no reidratado ensilado, um ganho de 13,3 unidades percentuais. No milho duro, os mesmos valores foram 54,3% e 71,6%, respectivamente, um ganho de 17,3 unidades percentuais. Apesar de milho farináceo ter sido mais digestível no rúmen que o milho duro, a digestibilidade do duro ensilado foi maior que a do farináceo finamente moído. Este resultado enfatiza o potencial da ensilagem de grãos como forma de atuar sobre a baixa digestibilidade ruminal do amido nos híbridos de milho brasileiros.
Reis et al. (2011) avaliaram a degradabilidade ruminal in situ de milho duro (BAYER 3663) ou farináceo (AG 4051), moído maduro ou ensilado como grão úmido, e em três granulometrias. A degradabilidade efetiva do amido no rúmen foi 43,8% para o duro moído, 51,5% para o farináceo moído, 52,6% para o duro ensilado e 69,3% para o farináceo ensilado. As taxas fracionais de degradação do amido foram 3,56%/h, 3,73%/h, 5,75%/h e 6,50%/h, respectivamente. A ensilagem aumentou a fração instantaneamente degradável (Fração A) e reduziu a fração indigestível (Fração C) do grão farináceo, mas não teve efeito sobre as frações do grão duro. Milho farináceo respondeu mais em digestibilidade à ensilagem como grão úmido do que milho duro, distintamente da resposta observada por Andrade Filho et al. (2010) ao ensilar milho maduro reidratado.
A ensilagem de grãos de milho duro (IAC 8390) ou macio (AG 1051) foi avaliada por Fernandes (2014). Os grãos foram colhidos em estágios de maturação para ensilagem da planta inteira (PI), de grão úmido (GU) ou maduro para reidratação e ensilagem (GR). Para os grãos duro e macio, os teores de matéria seca do ensilado foram, respectivamente: 54,8% e 45,4% no PI (Plantas com 33,6% e 31,5% de MS); 71,1% e 67,1% no GU; e 67,9% e 68,9% no GR (Grãos colhidos com 83,0% e 79,7% de MS). Nesta mesma ordem, as vitreosidades foram 59,0% e 25,4%; 58,1%; e 57,8%, e 79,2% e 59,2%, e o teor de prolamina como % do amido 4,5% e 4,1%; 7,2% e 5,5%; e 7,8% e 6,1%. O milho foi moído em peneira com crivos de 12 mm e ensilado por 7, 21, 60 e 120 dias. O teor de prolamina foi reduzido pela ensilagem, foi similar em GR e GU a partir de 7 dias de ensilagem e estabilizou a partir de 60 dias, e foi menor na maturidade PI. O híbrido duro e o macio tiveram teor similar de prolamina em todos os períodos de ensilagem, mas o
macio colhido no estágio PI foi o único que ainda teve queda no teor de prolamina aos 120 dias de armazenamento. Houve ganho na degradabilidade do amido em 12 horas de incubação ruminal em resposta à ensilagem. Para as silagens GU e GR armazenadas por 60 dias, a degradabilidade do amido do milho macio foi cerca de 5% maior que a do milho duro. Em ensilagem curta (7 dias), o milho macio PI foi o mais degradado. O milho macio PI teve degradabilidade superior a 80% em todos os tempos de armazenamento, enquanto o duro PI só atingiu valor similar aos 60 dias de ensilagem. Aos 120 dias, a degradabilidade de todos os híbridos foi semelhante. A silagem de grão reidratado induziu ganho na degradabilidade do milho similar à silagem de grão úmido.
Grão de milho ensilado para vacas leiteiras
Costa et al. (2014) avaliaram o efeito da ensilagem como forma de contrapor o efeito negativo do endosperma vítreo sobre a digestibilidade do milho. Foi avaliado o desempenho de vacas leiteiras consumindo dietas contendo polpa cítrica e dois teores de silagem de milho úmido de textura dura (68,2% de vitreosidade) ou macia (48,5% de vitreosidade). Os tratamentos foram: milho duro ou macio ensilados no estágio de maturação de linha negra, em arranjo fatorial com 9% ou 18% de milho na dieta. O teor dietético de polpa cítrica foi 16,2% ou 25,6%, nas dietas de alto ou baixo milho, respectivamente. As dietas também continham 33,9% de silagem de milho e 15,6% de feno de Tifton. Doze vacas Holandesas receberam os quatro tratamentos em quadrados latinos 4x4. As dietas de alto milho diminuíram o teor de gordura do leite e aumentaram o teor de proteína e a relação entre a produção de leite e o consumo. Aumento na inclusão dietética de milho induziu maior queda no pH ruminal na dieta com milho macio do que na dieta com milho duro. O milho macio aumentou o consumo diário de matéria orgânica digestível de 11,7 para 12,3 kg. A resposta em parâmetros digestivos sugere que a ensilagem reduziu, mas não eliminou totalmente o efeito negativo da textura dura do endosperma sobre a digestibilidade do milho.
Em outro experimento, Bitencourt (2012) avaliou o efeito da reidratação e ensilagem de milho duro sobre o desempenho de vacas leiteiras. Quinze vacas receberam uma sequência de três tratamentos, em quadrados latinos 3x3. Os tratamentos foram: milho finamente moído, milho reidratado e ensilado, ou milho extrusado. Um híbrido de milho com textura dura foi colhido em estágio maduro, moído em peneira com crivo de 2 mm, e reidratado e ensilado. O período de ensilagem, compreendido entre o fechamento do silo e a abertura realizada no primeiro dia do experimento, foi de 327 dias. O teor de umidade na silagem foi de 43,7% da matéria natural. O mesmo híbrido

9
foi moído no mesmo moinho e peneira no tratamento milho finamente moído. A composição média das dietas foi (% da matéria seca): 41,5% de silagem de milho, 21,5% de farelo de soja, 17,5% de polpa cítrica, 17,3% de proteína bruta e 30,9% de FDN. O teor dietético de silagem de milho reidratado foi 16,7%, de milho moído foi 17,4%, e de milho extrusado foi 17,7%. A produção de leite foi 33,3 kg/d, não deferindo entre tratamentos. O milho extrusado deprimiu a secreção de energia e de gordura no leite e a ingestão de matéria seca e tendeu a aumentar o teor de proteína. Houve tendência de aumento na digestibilidade da matéria orgânica no tratamento com silagem de milho reidratado. A síntese relativa de proteína microbiana no rúmen foi maior e o teor de nitrogênio ureico no leite foi menor no tratamento com milho reidratado, sugerindo que a degradação ruminal do amido foi mais sincrônica à degradação da proteína dietética neste alimento. A ensilagem do grão aparentemente aumentou a proporção do amido dietético digerido no rúmen comparativamente ao grão finamente moído, sem afetar a digestibilidade do amido no trato digestivo total. Tanto a extrusão quanto a ensilagem tenderam a aumentar a relação entre a produção de leite e o consumo, resposta típica ao processamento de grãos em dietas para ruminantes.
Grão de milho ensilado para gado de corte
Santos et al. (2011), em revisão de literatura sobre processamento de grãos para bovinos de corte, concluíram que nos experimentos conduzidos no Brasil com milho duro, a silagem do grão úmido reduziu o consumo e aumentou o ganho diário dos animais em comparação ao milho moído fino. Segundo os autores, o aumento na eficiência alimentar relatado nos trabalhos nacionais avaliando a silagem de milho úmido em comparação ao milho moído fino é maior que a relatada nos trabalhos norte-americanos que compararam o milho ensilado úmido com o milho laminado. O ganho em eficiência alimentar induzido pela ensilagem do grão duro no Brasil foi em média de +13,7% (+5,5% a +17,24%) em quatro experimentos, enquanto o ganho médio em seis ensaios conduzidos nos Estados Unidos foi de +8,6% (+1,8% a +17,7%). A inclusão de polpa cítrica reduziu o ganho diário de peso e piorou a eficiência alimentar de garrotes consumindo dietas com milho floculado, mas aumentou o ganho e não afetou a eficiência alimentar em dietas com milho duro moído (Gouvea, 2012). Estes dados evidenciam a limitação de conteúdo energético no milho duro disponível no Brasil.
Conclusões
Existe germoplasma de milho farináceo adaptado às condições tropicais, mas a adaptabilidade nos
cultivares comerciais brasileiros foi obtida a partir de cruzamentos com milho indígena de endosperma duro.
A alta vitreosidade do endosperma em grãos maduros reduz a digestibilidade ruminal e intestinal do amido em bovinos e suínos.
Não existe tendência de mudança na dureza da semente de milho comercializada no Brasil, tornando necessária a adoção de estratégias nutricionais capazes de melhorar a digestibilidade do amido, quanto mais importante for obter redução na ingestão de milho por unidade de desempenho animal. Colheita precoce e processamento mecânico do grão na forragem da planta de milho e ensilagem ou tratamento térmico do grão podem alterar o local e a taxa de digestão do amido no trato digestivo de ruminantes. As silagens de milho maduro reidratado e de grão úmido são similares nutricionalmente.
Referências bibliográficas Andrade Filho, R., R. B. Reis, M. N. Pereira, e M. Antenor.
2010. Degradabilidade ruminal in situ de grãos de milho maduros do tipo flint ou dentado, secos ou reconstituídos e ensilados. In: Anais da Reunião Anual da Sociedade Brasileira de Zootecnia, 47. Salvador.
Bitencourt, L. L. 2012. Substituição de milho moído por milho reidratado e ensilado ou melaço de soja em vacas leiteiras. Tese de doutorado. UFLA, Lavras. 130 p.
Bordignon, L. A. F., V. Piovesan, L. C. Bertusso, J. L. Schneiders, V. Oliveira, e J. S. Araujo. 2007. Relação entre características físicas e químicas de grãos de milho. In: Anais do XVII Congresso Brasileiro de Zootecnia e IX Congresso Internacional de Zootecnia. Londrina.
Brieger, F. G., T. A. Gurgel, E. Paterniani, A. Blumenschein, e M. R. Alleoni. 1958. Races of maize in Brazil and other eastern south American countries. Publication. National Academy of Sciences – National Research Council, Washington, D.C. 593. 283 p.
Calestine, G. A., M. N. Pereira, R. G. Von Pinho, e A. H. Fonseca. 1998. Milho macio foi mais degradado no rúmen que milho duro. In: Anais do Congresso Nacional de Milho e Sorgo, 22. Embrapa Milho e Sorgo, Recife. 309 p.
Cantarelli, V. S., E. T. Fialho, R. V. Sousa, R. T. F. Freitas, e J. A .F Lima. 2007. Composição química, vitreosidade e digestibilidade de diferentes híbridos de milho para suínos. Ciência e Agrotecnologia. 31:860-864.

10
Carvalho, N. M., e J. Nakagawa. 2000. Sementes: Ciência, Tecnologia e Produção. 4.ed. FUNEP. Jaboticabal. 588 p.
Corona, L., F. N. Owens, e R. A. Zinn. 2006. Impact of corn vitreousness and processing on site and extent of digestion by feedlot cattle. J. Anim. Sci. 84:3020-3031.
Correa, C. E. S., M. N. Pereira, S. G. Oliveira, e M. H. Ramos. 2003. Performance of Holstein cows fed sugarcane or corn silages of different grain textures. Scientia Agricola. 60:621-629.
Correa, C. E. S., R. D. Shaver, M. N. Pereira, J. G. Lauer, e K. Kohn. 2002. Relationship between corn vitreousness and ruminal in situ starch degradability. J. Dairy Sci. 85:3008-3012.
Costa, F. M. J., G. S. Dias Júnior, O. F. Zacaroni, J. F. Santos, R. A. N. Pereira, e M. N. Pereira. 2014. Silagem de grãos úmidos de milho de textura dura ou macia em dietas com polpa cítrica para vacas em lactação. Arquivo Brasileiro de Medicina Veterinária e Zootecnia. 66:203-210.
Cruz, J. C., I. A. Pereira Filho, e L. R. Queiroz. 2014. Quatrocentas e sessenta e sete cultivares de milho estão disponíveis no mercado de sementes do Brasil para a safra. Acesso em 13 de Agosto, 2014. http://www.cnpms.embrapa.br/milho/cultivares/ >.
Davide, L. M. C., M. A. P. Ramalho, U. J. Figueiredo, e J. C. Souza. 2011. Assessment of genetic parameters of degradability in maize grains due to indentation scores. Scientia Agricola. 68:347-352.
Dombrink-Kurtzman, M. A., e J. A. Bietz. 1993. Zein composition in hard and soft endosperm of maize. Cereal Chemistry.70:105-108.
Duarte, A. P., D. R. Henriques, P. C. Côrrea, e M. E. A. G. Z. Paterniani. 2007. Produtividade, aparência, densidade e suscetibilidade à quebra dos grãos em híbridos de milho, na safrinha. Revista Brasileira de Milho e Sorgo. 6:174-185.
Fernandes, J. 2014. Influência de genótipo, maturidade e tempo de armazenamento na qualidade de silagens de grãos de milho com alta umidade. 97 p Tese (mestrado) Escola Superior de Agricultura “Luiz de Queiroz” - Piracicaba.
Ferraretto, L. F., R. D. Shaver, e P. C. Hoffman. 2013. Effect of time of storage on ammonia concentration and ruminal in vitro digestibility of high moisture corn: a field survey. J. Dairy Sci. 96(Suppl.1):149.
Gomes, M. S. G., R. G. Von Pinho, M. A. P. Ramalho, D. V. Ferreira, e T. G. Lima. 2004. Análise dialélica da degradabilidade in situ da matéria seca da silagem de milho. Revista Brasileira de Milho e Sorgo. 3:108-119.
Gouvea, V. N. 2012. Processamento de grãos de milho flint e sua substituição por polpa cítrica em dietas para tourinhos Nelore terminados em confinamento. 93 p Tese (mestrado) Escola Superior de Agricultura “Luiz de Queiroz” - Piracicaba.
Hamaker, B. R., A. A. Mohamed, J. E. Habben, C. P. Huang, e B. A. Larkins. 1995. Efficient procedure for extracting maize and sorghum kernel proteins reveals higher prolamin contents than the conventional method. Cereal Chemistry. 72:583-588.
Hoffman, P. C., N. M. Esser, R. D. Shaver, W. K. Coblentz, M. P. Scott, A. L. Bodnar, R. J. Schmidt, e R. C. Charley. 2011. Influence of ensiling time and inoculation on alteration of the starch-protein matrix in high-moisture corn. J. Dairy Sci. 94:2465-2474.
Mu-Forster, C., e B. P. Wasserman. 1998. Surface localization of zein storage proteins in starch granules from maize endosperm: Proteolytic removal by thermolysin and in vitro cross-linking of granule-
associated polypeptides. Plant Physiology. 116:1563–1571.
Narvaes-Gonzalez, E. D., J. D. Figueroacardenas, S. Taba, E. C. Tostado, R. A. M. Peniche, e F. R. Sanchez. 2006. Relationships between the microstructure, physical features, and chemical composition of different maize accessions from Latin America. Cereal Chemistry. 83:595-604.
Ngonyamo-Majee, D., R. D. Shaver, J. G. Coors, D. Sapienza, C. E. S. Correa, J. G. Lauer, e P. Berzagh. 2008. Relationships between kernel vitreousness and dry matter degradability for diverse corn germplasm: I. Development of near-infrared reflectance spectroscopy calibrations. Anim. Feed Sci. Technol.142:247-258.
Paterniani, E., e M. M. Goodman. 1997. Races of maize in Brazil and adjacent areas. Centro Internacional de Mejoramiento de Maiz y Trigo, México. 95 p.
Paterniani, E., e G. P. Viégas. 1978. Melhoramento e produção do milho no Brasil. Fundação Cargill, São Paulo. p. 215-274.
Pereira, J. L. A. R., R. G. Von Pinho, A. X. Souza Filho, M. N. Pereira, A. O. Santos, e I. D. Borges. 2012. Quantitative characterization of corn plant components according to planting time and grain maturity stage. Revista Brasileira de Zootecnia, 41:1110-1117.
Pereira, M. N., R. A. N. Pereira, L. L. Bitencourt, G. S. Dias Júnior, N. M. Lopes, e O. F. Zacaroni. 2013. Silagem de milho reidratado na alimentação do gado leiteiro. Informe Agropecuário. 34:7-18.
11
Pereira, M. N., R. G. Von Pinho, R. G. S. Bruno, e G. A. Calestine, 2004. Ruminal degradability of hard or soft texture corn grain at three maturity stages. Scientia Agricola. 61:358-363.
Philippeau, C., e B. Michalet-Doreau. 1997. Influence of genotype and stage of maturity of maize on rate of ruminal starch degradation. Anim. Feed Sci. Technol.68:25-35.
Philippeau, C., e B. Michalet-Doreau. 1998. Influence of genotype and ensiling of corn grain on in situ degradation of starch in the rumen. J. Dairy Sci. 81:2178-2184.
Philippeau, C., C. Martin, e B. Michalet-Doreau. 1999. Influence of grain source on ruminal characteristics and rate, site, and extent of digestion in beef steers. J. Anim. Sci. 77:1587-1596.
Piovesan, V., V. Oliveira, e C. E. Gewehr. 2011. Milhos com diferentes texturas de endosperma e adição de alfa-amilase na dieta de leitões. Ciência Rural. 41:2014-2019.
Ramalho, M. A. P., J. B. Santos, e C. B. P. Pinto. 2008. Genética na agropecuária. 4.ed. UFLA. Lavras. 464 p.
Reis, W., C. Costa, P. R. L Meirelles, M. G. B. Silva, M. A. Factori, C. M. Pariz, S. A. Mendonça, e E. A .R. Santana. 2011. Degradabilidade do amido de grãos secos e ensilados de híbridos com textura dura e dentada em função do grau de moagem. Boletim da Indústria Animal. 68:139-149.
Roney, J., e R. Hard. 2009. The beginnings of maize agriculture. Archaeology Southwest, 23:4-5.
Santos, F. A. P., R. Carareto, e R. S. Marques. 2011. Processamento de grãos para bovinos de corte. In: Anais do Simpósio sobre Nutrição de Bovinos, 9. FEALQ, Piracicaba. p 403-432.
Sawazaki, E.; E M. e A. G. Z. Paterniani. 2004. Evolução dos cultivares de milho no Brasil. In: GALVÃO, J.C.C.; MIRANDA, G.V. (Eds.). Tecnologias de Produção de Milho. UFV, Viçosa. p.55-83.
Smith, C. W., J. Betrán, e E. C. S. Runge. 2004. Corn: Origin, history, technology and production. J. Wiley, Hoboken. 968 p.
Soave, C., e F. Salamini. 1984. Organization and regulation of zein genes in maize endosperm. Philosophical Transactions of the Royal Society B. 304:341-347.
Taylor, C. C., E M. S. Allen. 2005. Corn grain endosperm type and Brown Midrib 3 corn silage: Site of digestion and ruminal digestion kinetics in lactating cows. J. Dairy Sci.88: 1413-1424.

12
Processamento de amido do concentrado para
vacas em pastejo
Ronaldo Braga Reis, André Morais Moura e Victor Marco Rocha Malacco
Departamento de Zootecnia. Universidade Federal de Minas Gerais Belo Horizonte, Brasil [email protected]
Introdução
Os sistemas de produção de leite baseados em pastejo podem apresentar alto potencial de produção de forragem de qualidade, o que melhora os índices produtivos e barateia os custos da atividade. Atualmente, tem havido crescente interesse em sistemas de produção de leite com base no uso de forrageiras tropicais manejadas intensivamente. Grande parte desse interesse deve-se ao alto potencial de produção de matéria seca (MS) por unidade de área. É provável que o número de vacas leiteiras mantidas em sistemas de pastejo total, parcial, ou simplesmente alimentadas com mais forragem, vai aumentar no futuro, dada a crescente demanda global por grãos como fonte de alimentação humana ou animal, e combustível.
Taxas de acúmulo de forragem superiores a 100 kg de MS/ha/dia têm sido relatadas para diversas espécies forrageiras tropicais (Corsi, 1990), esse grande potencial de produção possibilita a exploração intensiva dessas forrageiras, com taxas de lotação entre quatro e 10 UA/ha, durante 150 a 210 dias da estação chuvosa e quente do ano, na maior parte do Brasil central (Costa, 2007). Nesse tipo de sistema, o qual o objetivo é a produção por área, a eficiência fica condicionada à capacidade produtiva e ao valor nutricional da pastagem. Por outro lado, a produtividade e a qualidade da pastagem estão diretamente ligadas à fertilização do solo e ao seu manejo.
Visando a garantia de alta produção de forragem com elevado valor nutritivo, deve-se combinar altas doses de adubação nitrogenada, 200 a 500 kg/ha/ano, e menores intervalos entre pastejos (Da Silva e Corsi, 2003). Isso confere à forrageira, elevado teor de proteína bruta (PB), variando de 15 a 21%, e menores teores de fibra insolúvel em detergente neutro (FDN), variando de 55 a 70% (Martinez, 2008). O elevado teor de PB com alta degradabilidade ruminal da forrageira, associados a baixos teores de carboidratos não fibrosos, limita o uso eficiente do nitrogênio (N) pelos microrganismos ruminais (Reis et al., 2010). Neste contexto, a suplementação com carboidratos não fibrosos visando à correção das deficiências da forragem pastejada é estratégia interessante para elevar o consumo e digestibilidade da
MS, e aumentar a eficiência de utilização de gramíneas tropicais.
Os pastos tropicais podem, potencialmente, suportar produções diárias de leite de cerca de 8 a 10 kg/vaca, sem suplementação. Para produções superiores torna-se necessário a incorporação de suplementos concentrados, que pode constituir-se em ferramenta auxiliar para melhorar o desempenho individual dos animais, aumentar a taxa de lotação dos pastos e incrementar a produção total por unidade de área (Santos et al., 2007).
Aumentar a oferta de amido fermentável no rúmen, seja por aumentar o teor dietético de grãos ou pelo aumento de sua degradabilidade ruminal através de processamento, pode reduzir as concentrações de nitrogênio amoniacal ruminal e aumentar a produção de proteína no leite pelo aumento do crescimento microbiano (Ekinci e Broderick, 1997). Alguns trabalhos sugerem que o carboidrato suplementar deve ter taxa e extensão de degradação no rúmen semelhante ao da PB para maximizar a assimilação de N (Sinclair et al., 1995). No entanto, em vacas manejadas em pastagem se observa que o consumo de pasto como principal fonte de volumoso leva a redução na proporção de proteína do leite, que permanece menor durante toda estação de pastejo.
Normalmente, as vacas em pastejo no Brasil são suplementadas com concentrados à base de milho seco. Nas principais regiões produtoras de milho do mundo, o milho cultivado é quase em sua totalidade do tipo farináceo (Dent – Zea mays ssp) enquanto que o milho cultivado no Brasil é predominantemente do tipo duro (Flint – Zea mays ssp). O milho duro apresenta reduzida degradabilidade ruminal quando comparado ao milho farináceo (Correa et al., 2002). O processamento do milho parece ser uma estratégia plausível para aumentar a disponibilidade de amido fermentável no rúmen de vacas pastejando gramíneas tropicais. O aumento da extensão da degradação ruminal pelo processamento é vantajoso para o animal em termos de utilização total do amido e também no possível aumento de produção de proteína microbiana, o que aumenta o fluxo de aminoácidos (AA) para o intestino (Theurer, 1986).
Dentre os principais fatores que afetam a síntese de proteína do leite estão a disponibilidade e o perfil de aminoácidos que chegam à glândula mamária (NRC,

13
2001). A otimização do crescimento microbiano pode ser a mais lógica estratégia para suprir os requerimentos de aminoácidos das vacas leiteiras, já que a proteína microbiana é de alta qualidade.
Pastagens tropicais
Em sistemas de produção de leite a base de
pastagens, o pasto pode ser a única fonte de volumoso durante grande parte do ano, por isso manejar bem a pastagem é de fundamental importância para o sucesso do sistema. Manejar uma pastagem de forma adequada significa produzir alimento em quantidade, além de colher o material no máximo valor nutritivo. A produção de massa afeta de forma significativa a capacidade suporte da pastagem, enquanto que o valor nutritivo afeta a produção individual dos animais, ambos influenciados pela fertilidade do solo, manejo e condições climáticas (Drumond e Aguiar, 2005). A elevação da produtividade das forrageiras e dos indicadores do desempenho animal são conseguidos mediante o emprego de fertilizantes e corretivos, em conjunto com a utilização de técnicas disponíveis de manejo das plantas forrageiras (Monteiro e Euclides, 2005).
A elevada produção de matéria seca das plantas forrageiras tropicais e a idade cronológica semelhantes de seus perfilhos, segundo Corsi (1988) são as causas da rápida queda de seu valor nutritivo, culminando com isso também baixa relação folha/colmo. A medida que a idade fisiológica da planta avança, aumenta as porcentagens de hemicelulose, celulose e lignina, e também a lignificação da parede celular, reduzindo assim a proporção do conteúdo celular, o qual apresenta 98 a 100% de digestibilidade. O teor de proteína, lipídeos e minerais tende a reduzir, principalmente após o florescimento (Balsalobre, 2002). É fácil observar este comportamento com os dados apresentados por Gomide e Zago (1982), que constataram para o capim Colonião, coeficientes de digestibilidade da ordem de 66,1; 63,0 e 53,0% para idades de rebrote de 21, 28 e 63 dias, respectivamente. Neste contexto, o ponto ideal de colheita da forragem pelos animais seria a idade fisiológica na qual fosse possível se obter máxima produção de massa por hectare sem grandes perdas no valor nutritivo da forragem. Estudos discutidos por Sbrissia et al. (2007) indicaram a porcentagem de interceptação luminosa (IL) como ferramenta para encontrar este ponto. De acordo com vários trabalhos revisados por estes autores, o índice de 95% de IL seria o ponto ideal para a maioria das forragens, condição na qual ocorre a maior taxa de acúmulo de folhas (Bueno, 2003; Carnevalli, 2003; Sarmento, 2007; Souza-Júnior, 2007; Trindade, 2007; Zeferino, 2007).
Para Sniffen et al. (1992) e Russel et al. (1992) o valor nutritivo da planta também está relacionado à sua porção proteica, considerando seu teor e sua composição em aminoácidos. As gramíneas tropicais apresentam baixos teores de carboidratos solúveis e amido que são
raramente superiores a 20% dos carboidratos totais (CT). Assim, a hemicelulose é responsável pela maior taxa de fermentação ruminal e, portanto, é a maior fornecedora de energia para o crescimento microbiano. Desse modo, a relação lignina/FDN é um fator importante a ser analisado no que diz respeito ao valor nutritivo da planta forrageira.
Em pastagem de Panicum maximum Euclides (1995) observou que teores de fibra em detergente neutro (FDN) abaixo de 55% são raros, acima de 65% são comuns em tecidos novos e entre 75 e 80 % em matérias vegetais que atingiram a maturidade. Lopes et al. (2011) caracterizaram o teor de nutrientes e a digestibilidade da fibra das principais gramíneas tropicais produzidas sob patejo rotacionado. Foram analisadas amostras de capim-braquiária (Brachiaria brizantha), capim mulato (Brachiaria hibrida), grama bermuda (Cynodon dactylon); grama estrela africana (Cynodon nlemfuensis), capim Tanzânia (Panicum maximum) e capim-elefante (Penisetum purpureum). Foram observadas variações nos teores de PB variando de 14 a 21% e FDN variando de 60 a 63% da MS. A digestibilidade in vitro da FDN (DIVFDN) para os tempos de 24, 30 e 48 h foram de 36 ± 13, 45 ± 13 e 61 ± 13% da FDN, respectivamente, e a comparação entre as médias da DIVFDN de gramíneas tropicais com silagem de alfafa padrão indicaram maior digestibilidade da fibra para gramíneas tropicais, que apresentaram 12,2, 12,9 e 19,9 unidades de digestibilidade da fibra acima da silagem de alfafa para 24, 30 e 48h de fermentação, respectivamente. Dados de composição bromatológica, digestibilidade in vitro e fracionamento dos compostos nitrogenados de amostras de estrato pastejável de forrageiras tropicais, manejadas no conceito de 95% de IL, obtidas em trabalhos de pesquisa, podem ser observadas nas tabelas 1 e 2.
Pacheco Jr. (2009) caracterizou a composição químico-bromatológica, assim como as frações de carboidratos e de proteínas, e as taxas de degradabilidade das frações potencialmente degradáveis para PB, FDN e MS (in situ) em amostras de estrato pastejável de Panicum maximum cv Colonião, Brachiaria brizantha cv Marandu e Brachiaria hibrida cv Mulato manejados com o conceito de desfolhas a 95% de IL, e concluiu que pastagens adubadas com altas doses de N apresentam elevados teores de PB, dos quais 70% está sob a forma de proteína verdadeira e degradabilidade da PB entre 62 e 71%. Entretanto, estas forrageiras são deficientes em frações de carboidratos de alta fermentabilidade ruminal. Isto resulta em transporte de grandes quantidades de amônia pela parede do rúmen, que é convertido em ureia no fígado. As pastagens de alta qualidade possuem proporção de proteína degradável em relação carboidratos não fibrosos (CNF), superior à sugerido por Hoover e Stokes (1991).
Baseado em dados de estudos in vitro e in vivo, há consenso geral de que a velocidade de degradação dos carboidratos é o principal fator de controle da energia disponível para o crescimento microbiano, além disso, a taxa de degradação de carboidratos totais é relacionada com a proporção de amido, pectinas e açúcares (Hoover

14
e Stokes, 1991). Uma vez que a ingestão de energia é o principal fator limitante para produção de leite em pastagens de gramíneas tropicais, maior ênfase deve ser dada à suplementação energética (Verbic, 2002). Essa suplementação terá como objetivos: aumentar o consumo total de nutrientes; aumentar a produção de leite por animal; aumentar a taxa de lotação e a produção de leite por hectare; e melhorar o ganho de peso e a condição de escore corporal (Reis e Souza, 2008). Para aumentar o consumo de energia de vacas em lactação, é comum substituir forragem por alimentos ricos em amido, o que resulta em maior consumo de matéria seca (Allen, 2000). Vacas em sistema de pastejo rotativo, quando suplementadas, geralmente diminuem a ingestão de matéria seca oriunda da pastagem. Ocorre então o chamado efeito de substituição, a qual os animais diminuem o consumo de matéria seca do pasto, porém aumentam o consumo de matéria seca total (Reis e Combs, 2000; Bargo et al., 2002). O efeito de substituição é um dos vários fatores que explicam a variação observada em produção de leite quando é feita a suplementação de vacas sob pastejo (Kellaway e Porta, 1993). Bargo et al. (2003) em revisão de literatura relataram diminuição de consumo de 1,9 kg de matéria seca (CMS) de forragem, com variação de 0,1 a 4,4 kg de MS/vaca/dia. Entretanto, o CMS total de vacas suplementadas foi 24% maior comparado a vacas apenas em pasto. A taxa de substituição de vacas em pastagem de clima temperado foi de 0,4 kg de MS de pastagem para cada kg de MS do concentrado, variando entre 0,1 a 0,7 kg. Segundo o mesmo autor, a produção de leite aumentou 22% com o fornecimento do suplemento, a produção e o teor de gordura tiveram aumento de 13% e queda de 6%, respectivamente, e a produção e teor de proteína aumentaram em 30% e 4% respectivamente. As explicações para queda nos teores de gordura estão relacionadas à provável diminuição do pH ruminal, e os aumentos nos teores de proteína relaciona-se com maior crescimento microbiano ruminal e consequente aumento de aminoácidos disponíveis para glândula mamária. Danés (2010) revisou 22 trabalhos com 56 comparações e observou respostas positivas em produção de leite ao suplementar concentrado para vacas em pastejo de gramíneas tropicais, variando de 1,0 a 1,6 kg de leite/kg de concentrado. Utilizando dados de vacas Holandês x Zebu em lactação e trabalhando no desenvolvimento de equações de predição de consumo de matéria seca de capim elefante, Lopes et al. (2005) relataram redução de 0,42 kg de matéria seca de pasto por kg de concentrado consumido. Em estudo realizado com vacas da raça Holandês sob condição de pastejo em capim Coast-cross (C. dactylon cv. Coast-cross) suplementado com 2,67 ou 5,34 kg/vaca/dia de matéria seca de concentrado na estação das chuvas, Mota (2006) relatou taxa de substituição de 0,54. A suplementação energética para vacas em pastagem tem como fonte principal os carboidratos. Destacam-se os grãos ricos em amido (milho, sorgo, milheto, cevada, trigo e aveia) ou os tubérculos (mandioca e a batata doce). Havendo ainda
algumas fontes ricas em pectina e fibra de alta digestibilidade como a polpa de citros, casquinha de soja e farelo de trigo entre outros (Santos, 2007). Estudo de Hall e Herejk (2001) sugere que o amido tem maior potencial para produção de proteína microbiana quando comparado com outras fontes de carboidratos (sacarose, pectina), portanto a suplementação com fontes ricas em amido parece ser uma estratégia lógica para aumentar produção de proteína microbiana, elevando o fluxo de aminoácidos para o intestino, já que um dos principais fatores que afetam a síntese de proteína do leite é a disponibilidade e o perfil de aminoácidos que chegam à glândula mamária (NRC, 2001).
Assim como o milho, o sorgo é um cereal rico em amido (65 a 72% da MS), com teor de PB (11,6%) e de fibra (10,9%) pouco superior ao do milho. Entretanto, o NDT do sorgo é geralmente inferior ao do milho, geralmente em torno 90% do valor do milho, em função da menor digestibilidade do amido deste cereal. Em comparação ao milho, cevada, trigo e aveia, o sorgo é o cereal que apresenta o amido menos digestível. Isto se deve a uma maior presença de matrizes e corpos proteicos que revestem os grânulos de amido do sorgo em comparação aos demais cereais. Devido a esta peculiaridade, o sorgo é o cereal que apresenta maior potencial em ganho de digestibilidade ao sofrer processamentos mais intensos como a floculação. No Brasil, a principal forma de processamento é a moagem. Neste caso, a moagem fina é indicada em relação à moagem mais grosseira. Características relevantes do amido à nutrição
de ruminantes
O amido é um carboidrato de reserva das plantas,
normalmente encontrado em sementes e raízes e em menores concentrações nas folhas e nos colmos. É composto por duas grandes moléculas, amilose e amilopectina. A amilose é um polímero linear de unidades α-1-4-D glicose. A amilopectina é um polímero ramificado com cadeias lineares de α-1-4-D-glicose que têm ramificações α- 1-6 a cada 20 a 25 resíduos de glicose (Lehninger, 1998). As proporções entre estes compostos variam entre espécies e variedades de grãos, o que influencia a taxa de degradação e a digestibilidade do amido. O amido é uma estrutura altamente organizada, as moléculas de amilose e amilopectina são mantidas juntas por ligações de hidrogênio e seus grânulos são insolúveis em água fria, formam "pseudo cristais" que são resistentes a água. As proteínas do endosperma do milho podem ser separadas em quatro frações maiores, de acordo com a solubilidade. As proteínas solúveis em água são chamadas albuminas, enquanto as proteínas extraídas com soluções salinas são referidas como globulinas. Subsequente extração com álcool produz as prolaminas, e o restante, que permanece insolúvel e pode ser extraído em soluções aquosas ácidas e alcalinas, são as glutelinas. As quatro frações proteicas albuminas,

15
globulinas, zeínas (prolamina do milho) e glutelinas constituem aproximadamente 3, 3, 60 e 34%, respectivamente, do total das proteínas do endosperma (Coelho, 1997). Alguns estudos mostraram forte relação entre a concentração de prolaminas e a textura do endosperma nos grãos (Cagampang e Kirleis, 1984). Os endospermas vítreo e farináceo possuem distribuições diferente das proteínas específicas, a proporção de zeínas/proteínas solúveis em solução salina é maior no endosperma vítreo do que no endosperma farináceo (Dombrink-kurtzman e Bietz, 1993). Segundo Chandrashekar e Mazhar (1999), a γ-zeína apresenta elevada capacidade de formação de pontes de enxofre entre moléculas, contribuindo para a rigidez do endosperma vítreo. A variação na degradabilidade ruminal do amido entre milhos dentados e duros pode estar relacionada com a distribuição das proteínas nos grãos. Segundo Wolf et al. (1952), as células do endosperma farináceo são maiores e têm parede mais grossa que as células do endosperma córneo. A forma e o tamanho dos grânulos de amido também variam com sua localização no endosperma. As células do endosperma farináceo são desorganizadas e possuem grânulos grandes com superfícies lisas, indicando a ausência de pressão na região. Os grânulos são menores e bem compactados nas células do endosperma córneo (Robutti et al., 1974).
A necessidade de aumentar a eficiência de produção de ruminantes foi atingida em grande parte com o fornecimento de mais alimentos concentrados. O amido é o principal componente dos grãos de cereais que, por sua vez, constituem os principais alimentos concentrados. O amido sofre primariamente fermentação microbiana no rúmen, produzindo ácidos graxos voláteis e, secundariamente, digestão enzimática no intestino delgado onde é absorvido como glicose. A digestão relativa de amido por estas duas vias pode influenciar a eficiência de transformação da energia da alimentação em produto de origem animal, os substratos utilizados por ruminantes para formar glicose, a magnitude da fixação de nitrogênio não-proteico em proteína microbiana e a distribuição de energia nos produtos gerados (Waldo, 1973).
O amido corresponde a uma fração substancial nas dietas de gado leiteiro, que varia de menos de 20% para mais de 35%. O teor de amido dos grãos de cereais varia de 45% para a aveia e 72% para o milho. As forragens apresentam variação no teor de amido de menos de 15% da MS para alfafa e gramíneas perenes, até 35% para silagem de milho. A fermentação ruminal do amido pode variar de menos de 50% a mais de 90%, sendo função da taxa de fermentação e tempo de retenção das partículas do alimento no rúmen (Grant, 2005). Pesquisas têm tentado determinar ótimas concentrações dietéticas de amido. No entanto, a quantidade ótima de amido dietético está relacionada a vários fatores, incluindo a: degradabilidade inerente da fonte de amido; o método de processamento; a quantidade de proteína solúvel; o FDN; o método de alimentação e; o meio ambiente. Comumente, as
recomendações dietéticas de amido variam entre 23 a 30% de matéria seca (MS) que está relacionado com o conteúdo de forragem da dieta (Grant, 2005). De maneira geral, a amilose e a amilopectina representam de 98 a 99% dos grânulos de amido. As proporções entre amilose e amilopectina variam entre espécies e variedades de grãos, influenciando a taxa de degradação e a digestibilidade do amido. A amilopectina é o principal constituinte do amido do milho, cerca de 70 a 80% (Rooney e Pflugfelder, 1986). A digestibilidade do amido é inversamente proporcional ao teor de amilose. Desta forma fontes de amido com maiores teores de amilopectina, podem apresentar maiores digestibilidades (Jobim et al., 2003). Diversos tipos de processamentos são aplicados aos grãos de cereais com a finalidade de romper as pontes de hidrogênio dentro dos grânulos de amido, melhorando a sua capacidade de hidratação. Dessa forma, o amido torna-se mais susceptível à digestão enzimática (Flint e Forsberg, 1995). Quando processados, os grânulos de amido estão sujeitos a gelatinização, que é a perda irreversível de sua estrutura original em função de alguma energia aplicada, que será responsável pela quebra das pontes de hidrogênio (Nocek e Tamminga, 1991). A gelatinização provoca maior capacidade de absorção de água e perda da estrutura cristalina que expõe maior parte do amido à degradação (Rooney e Pflugfelder, 1986; Mello Jr., 1991).
Entretanto, quando a temperatura e a quantidade de água são reduzidas o amido gelatinizado tende a se reorganizar parcialmente restabelecendo as pontes de hidrogênio (Hoover, 2001). Esse processo é denominado retrogradação e tende a reduzir a digestibilidade ruminal e intestinal do amido (Asp et al., 1996). O grau de retrogradação depende de vários fatores, como a estrutura da amilopectina e da amilose, umidade do grão, temperatura, e agentes atuantes em ligações, como lipídios e a concentração de amido (Rooney e Pflugfelder, 1986). A digestibilidade do amido do grão de milho é limitada também pela matriz proteica que é uma estrutura amorfa com função estrutural no grão que encapsula os grânulos de amido. Essa matriz está presente principalmente no endosperma vítreo dos grãos, sendo que a quebra da matriz proteica pode melhorar a velocidade e a extensão da digestão do amido (Mc Allister et al., 1990 e 1993). A parte mais importante na matriz proteica são as prolaminas, que são proteínas do endosperma com alta concentração de prolina. A prolina é um aminoácido altamente hidrofóbico capaz de dobragens complexas e, portanto, as proteínas com um elevado teor de prolina desenvolvem estruturas terciárias que são altamente hidrofóbicas (Momany et al., 2006). As prolaminas encontradas no grão de milho são chamadas de zeína (Hoffman e Shaver, 2011). No milho, as prolaminas-zeína compreendem de 50 a 60% do total da proteína (Hamaker et al., 1995) e aumentam com o avanço da maturidade do grão de milho encapsulando o amido dentro de uma matriz de proteínas hidrofóbica (Mu-Forster e Wasserman, 1998; Buchanan et al., 2000). Philippeau et al. (2000) quantificaram a relação entre

16
vitreosidade e concentração de prolaminas-zeína no milho e concluíram que milhos mais vítreos contêm mais prolaminas- zeína do que milhos menos vítreo. Estes dados definem as diferenças na composição química entre o endosperma vítreo e endosperma farináceos (Hoffman e Shaver, 2011). As Prolaminas-zeínas são hidrofóbicas, portanto insolúveis em solventes normais para o ambiente ruminal (Lawton, 2002). Potencialmente, a digestão do amido requer bactérias do rúmen para degradar primeiro as prolaminas-zeína, via proteólise antes da atividade amilolítica (Cotta, 1988). A proteólise das prolaminas-zeína é, portanto, um passo limitante na taxa de digestão do amido. Mc Allister et al. (1993) estudando a influência da matriz proteica sobre a digestão do amido, observaram que o milho tratado com protease in vitro teve a digestão de amido dobrada e concluíram que a matriz proteica do milho foi fator importante na digestão ruminal do amido. Neste contexto a ensilagem de grão úmido ou re-hidratado pode ser alternativa para aumentar a digestibilidade do amido, considerando que os ácidos da fermentação ou o processo de proteólise podem degradar as prolaminas-zeína durante o processo de ensilagem (Baron et al., 1986). Jurjanz e Monteils (2005) observaram menor degradabilidade ruminal efetiva do amido em grãos de milho antes (70,2%) do que depois (92,3%) da ensilagem. Em estudo recente, Hoffman et al. (2011) acompanharam o destino da matriz proteica em silagens de grão úmido de milho armazenadas por 0, 15, 30, 60, 120, e 240 dias e observaram que a ensilagem reduziu as concentrações de prolaminas-zeína a medida que o tempo de ensilagem aumentou. Ferraretto et al. (2013) em estudo de meta- análise, encontrou digestibilidade ruminal e total de 54,1 e 92,6%, respectivamente
Processamento de grãos de cereais
De maneira geral, os fundamentos do processamento dos grãos são a melhoria da digestibilidade dos alimentos por meio da quebra das barreiras que impedem o acesso enzimático aos componentes nutricionais, conservação, o isolamento das partes específicas, a melhoria da palatabilidade ou detoxificação dos alimentos (Mc Allister et al., 1990; Pond et al., 1995). Os métodos são classificados em seco (quebra, moagem, laminação e tostagem) e úmidos (floculação, explosão, cozimento sob pressão e ensilagem) (Hale, 1973). Segundo Theurer (1986), a união dos dois processos, redução do tamanho de partícula e aplicação de vapor, melhoram ainda mais a eficiência da digestão dos grãos processados pelos ruminantes. O aumento da degradação ruminal do amido proporcionada pelo processamento aumenta a disponibilidade de energia rapidamente fermentável no rúmen, podendo aumentar a produção de proteína microbiana e de ácidos graxos voláteis totais (Nocek e Tamminga, 1991). Todavia, efeitos adversos decorrentes
da maior disponibilidade do amido podem ocorrer como, redução na digestibilidade de carboidratos fibrosos, no consumo de forragem e matéria seca e acidose ruminal (Mc Carthy et al., 1989). O processamento a ser utilizado é selecionado com base no aumento de digestibilidade, aceitabilidade pelo animal, custo e probabilidade de causar disfunções digestivas. O quanto o processamento pode interferir na digestibilidade do amido e no local de digestão depende das condições do processamento como, tamanho de partícula, tempo de fermentação e extensão da gelatinização (Owens e Zinn, 2005). Moagem
A moagem talvez seja o processamento mais utilizado em alimentos para vacas leiteiras no Brasil, por motivo de baixo custo e simplicidade. A moagem é um processo de diminuição do tamanho de partículas, gerado a partir da força do impacto, corte ou atrito, seguida de peneiramento, que auxilia na padronização do produto, podendo este apresentar aspecto fino ou grosseiro (Mourão et al., 2012). Na moagem ocorre eliminação da película externa do grão, o pericarpo, que constitui uma barreira física que dificulta o ataque microbiano e a ação das enzimas digestivas do animal (Kotarski et al., 1992). Além disso, quanto menor o tamanho das partículas maior será a superfície de contato do alimento com os microrganismos ruminais e enzimas digestivas, favorecendo a digestão. San Emeterio et al. (2000) compararam os efeitos da granulometria do milho moído (3,28 e 1,11 mm) na alimentação de vacas confinadas, e observaram aumento na digestibilidade do amido, produção de leite e proteína, e redução no nitrogênio amoniacal e nitrogênio ureico do leite para o milho moído mais fino. Principalmente, para vacas em pastagens manejadas intensivamente onde Kp para MS é de 7%/h. Ferraretto et al. (2013) encontraram digestibilidade total do amido de 93,3 a 89,6% para milho seco moído de 0,5 a 1,0 mm até 3,5 a 4,0 mm, respectivamente, (P < 0,01). Também encontraram tendência para redução do nitrogênio ureico de leite e aumento na concentração de proteína do leite. No entanto, não encontraram diferenças para grão úmido de milho ensilado e moído <2 mm ou >2 mm. Estes dados indicam que menor granulometria aumenta a eficiência de utilização do amido e possivelmente do nitrogênio, sem afetar a produção de leite e eficiência alimentar (Kg leite/Kg CMS) Laminação a seco, laminação a vapor e floculação
O processo de laminação a seco consiste na compressão do grão pelo laminador, que causa modificações apenas na estrutura física, porém, de forma mais branda. O laminador é constituído de três ou dois pares de rolos, que são sustentados em cada extremidade por rolamentos, os grãos passam entre os pares de rolos sob alta pressão rompendo a estrutura física do grão (Peres, 2011). Este procedimento permite aumento na degradabilidade ruminal em relação ao grão

17
inteiro, porém, em comparação à moagem, a degradabilidade ruminal é menor. De acordo com Mello Júnior (1991), o uso de concentrados contendo grãos submetidos a este tipo de processamento determina aumento na quantidade de amido que chega ao intestino delgado. Na laminação a vapor, além do efeito físico sobre os grãos, ocorre aumento da umidade e da temperatura dos grãos, por meio da exposição do milho ao vapor d’água, o que potencializa o efeito da gelatinização do amido. O grau de gelatinização depende da temperatura do processo e do tempo de exposição dos grãos (Mourão et al., 2012). Antes de serem submetidos à prensa pelos rolos compressores, os grãos são mantidos por 15 a 20 minutos em um condensador, onde recebem o contato do vapor, a uma temperatura de 90 a 95°C, elevando a sua umidade para concentrações entre 17 e 20%. Em seguida, o milho é direcionado por gravidade aos rolos compressores, localizados abaixo do condicionador, onde ocorre a laminação, gerando grãos de 1,5 a 2,4 mm de espessura. Posteriormente, os grãos laminados e parcialmente gelatinizados são submetidos à secagem (Pereira e Antunes, 2007). Na floculação a vapor, os grãos são mantidos no condensador por 30 a 60 minutos, a temperatura entre 90 e 105°C, o que eleva a umidade do milho para 20 a 24% e intensifica o processo de gelatinização. Além dos rolos laminadores, os grãos passam por um segundo par de rolos, ajustados de forma a comprimirem com maior intensidade os grãos, deixando-os com espessura próxima de 0,9 a 1,1 mm (Pereira e Antunes, 2007). A floculação do milho causa a gelatinização do amido, por meio da ruptura das pontes de hidrogênio, aumenta a superfície do grão sujeita ao ataque microbiano e provoca o rompimento da matriz proteica do milho, resultando em maior digestão do amido (Theurer et al., 1999). Expansão
O processamento térmico de expansão dos alimentos teve início na década de 80, no norte da Europa, a técnica foi desenvolvida como alternativa à extrusão que não se justificava na alimentação animal pelos altos custos de produção, sendo a expansão relativamente mais barata. (Fancher et al., 1996). A expansão é exposição do alimento a alta temperatura e pressão, de 90°C a 120°C e 5atm, através da transferência da energia mecânica e energia térmica em um período de 15 a 20 segundos. O processo é realizado por um equipamento denominado “expander”, que consiste em um tubo de paredes grossas com rosca sem fim e válvulas de injeção de vapor, que misturam e amassam os grãos. Os movimentos da rosca sem fim e o vapor injetado elevam a densidade, empurrando o alimento para uma válvula anular que expõem os alimentos a uma mudança brusca de pressão, aumentando a densidade e a porosidade do alimento (Peisker, 1992; Heidenreich, 1994; Fancher et al., 1996; e Borges, 2000). Sendo assim, ao final do processo os alimentos expostos à elevada temperatura e pressão são
expostos instantaneamente à pressão atmosférica, resultando no rompimento das paredes celulares dos alimentos por descompressão (Mendes, 2002; Mendes et al., 2004) O processo de expansão promove a gelatinização e a hidrólise do amido, a redução de microrganismos patogênicos, a inativação de fatores antinutricionais termolábeis, o incremento da digestibilidade, a melhoria da qualidade sensorial, o aumento da quantidade de proteína não degradável no rúmen. O uso da expansão permite uma considerável manipulação do volume, densidade e do tamanho da partícula dos alimentos (Heidenreich, 1997; Rodrigues, 2002; Viana, 2004). Silagem de grão úmido ou re-hidratado
A silagem de grão úmido de milho consiste na fermentação anaeróbica dos grãos colhidos com alta umidade, entre 28 e 35%, ou dos grãos maduros re-hidratados a fim de obter umidade entre 30 e 40%. O processo é similar ao da ensilagem de forrageiras devendo seguir os mesmos princípios e cuidados necessário em relação à colheita, ao carregamento, compactação, vedação e posterior descarregamento (Jobim et al., 2003). Kramer e Voorsluys (1991) apontaram algumas vantagens da utilização dessa técnica, entre elas, a minimização das perdas na colheita, a liberação antecipada da área para outras culturas, a redução do tempo gasto com a secagem e das perdas ocasionadas por insetos e roedores durante a armazenagem e a diminuição dos custos do alimento produzido. Quando o grão de milho é devidamente ensilado, há aumento na digestibilidade do amido do grão devido à fragilização e ao rompimento da matriz proteica que envolve os grânulos de amido no endosperma. O amido pode também sofrer o processo de gelatinização, aumentando a sua susceptibilidade ao ataque enzimático. Pereira (2012) comparou a digestibilidade in vitro da silagem de grãos de milho re-hidratados com moagem fina ou grosseira e com crescentes tempos de armazenamento, 0, 14, 28, 56, 112, 168 e 224 dias. Foi observado aumento nas degradabilidades efetivas à medida que o tempo de armazenamento aumentou e também para a moagem fina em relação à grosseira, tanto para taxas de passagem de 5% quanto para 8%. A colheita do grão para a silagem de grão úmido, em estádio de maturação com umidade entre 30 e 40% pode ser um ponto limitante no processo, pois o intervalo para colheita a fim de evitar a maturação excessiva e a consequente perda de umidade dos grãos é pequeno. Além disso, são necessários equipamentos específicos para a colheita, e grandes áreas para o plantio, o que pode não ser acessível para muitos produtores. Uma alternativa para reduzir o risco na ensilagem de grãos úmidos de milho é viabiliza-la para pequenos produtores seria a prática da re-hidratação e ensilagem do grão em estádio maduro. Já que o milho grão pode ser comprado e ensilado na própria fazenda. Em grãos maduros a moagem também pode ser mais fina que a realizada em

18
grãos colhidos com alta umidade, o que pode fisicamente aumentar a digestibilidade do amido no rúmen. Filho et al. (2010) estudaram o efeito dos teores de 20, 30, 40% de umidade, e o uso ou não de inoculante bacteriano (Lactobacillus plantarum) na reconstituição e ensilagem de grãos de milho maduros e secos. A densidade úmida aumentou e a densidade da matéria seca diminuíram linearmente com o teor de umidade. A perda de peso não foi influencia pelo teor de umidade e foi menor com o uso do inoculante. O pH diminuiu com o teor de umidade (efeito quadrático) e com o uso do inoculante. Houve interação entre o teor de umidade e o uso do inoculante sobre o pH da silagem. O nitrogênio amoniacal (N-NH3) da silagem aumentou linearmente com o nível de reconstituição e diminuiu com o uso do inoculante. Baseado nos resultados, o milho pode ser ensilado com 30 a 40% de umidade com uso de inoculante.
Amido processado na alimentação de vacas leiteiras
Existem duas revisões clássicas na literatura
sobre o efeito do processamento do milho na digestão do amido para ruminantes, Owens et al. (1986) e Huntington (1997) e ambas corroboram com o processamento dos grãos com objetivo de aumentar a digestão total do amido. O principal efeito para o aumento na digestibilidade é a mudança no sítio de digestão do amido, aumentando a porção digerida no rúmen. Owens et al. (1986) acreditava que isso poderia ser uma desvantagem, uma vez que em virtude da ausência de perdas via metano e calor, a digestão intestinal do amido seria energeticamente 42% mais eficiente que a digestão ruminal. Huntington (1997) a partir de simulações de digestão de amido e a absorção de glicose no intestino de um animal em crescimento e uma vaca lactante sugeriu que a pouca capacidade de digerir amido é o principal fator que limita a absorção da glicose no intestino delgado. Segundo este mesmo autor para uma vaca em lactação, 28% do fornecimento total de glicose vem da glicose absorvida, 67% a partir de ácidos orgânicos da fermentação do amido no rúmen, e 5% de outras fontes tais como os aminoácidos. Como regra geral, a quantidade de glicose usada pelos tecidos viscerais de ruminantes é igual ou ligeiramente maior do que a quantidade de glicose absorvida a partir do intestino delgado. Estudos de produção com grãos processados indicam, decisivamente, que o amido é melhor usado quando é extensivamente fermentado no rúmen. A capacidade digestiva limita a captura do amido que entra no intestino delgado, aproximadamente, 45% do amido que passa pelo intestino não é absorvido como glicose. Por conseguinte, qualquer melhoria energética metabólica atribuível à absorção de glicose deve considerar potenciais perdas de energia atribuíveis à fermentação do amido no ceco, intestino grosso e cólon, e não no rúmen (Huntington, 1997). Em materiais adequadamente processados cerca de 70 a 85% da digestão do amido
ocorre no rúmen. A explicação para o melhor desempenho dos animais quando alimentados com grãos processados mais intensamente é que a digestibilidade total do amido é maior, gerando mais energia, compensando as perdas por metano e calor. (Peres, 2011). Outro fator que pode contribuir para o melhor desempenho é o aumento da síntese de proteína microbiana no rúmen, e consequente aumento no fluxo de proteína para o intestino.
Segundo revisão feita pelo NRC (2001) o processamento mecânico (moagem) aumenta a digestibilidade do milho em 25% quando comparado com milho inteiro. O milho seco finamente moído é de 7 a 10% mais digestível que o milho laminado seco ou grosseiramente moído, mas parte do aumento é compensada por uma redução na digestibilidade da FDN, devido a isso e às alterações no local de digestão, as diferenças nas concentrações de energia líquida para lactação (NEL) devem ser menores do que as diferenças na digestibilidade (Moe et al., 1973; Knowlton et al., 1996; Wilkerson et al., 1997). A diferença nas concentrações de NEL entre milho seco quebrado e moído situa-se entre 0 e 4% (Moe et al., 1973; Wilkerson et al., 1997). A produção de leite aumentou de 3,5 a 6%, quando vacas de alta produção (35 kg/d) foram alimentadas com milho moído em comparação com o milho quebrado seco (Mitzner et al., 1994; Knowlton et al., 1996; Wilkerson et al., 1997). Geralmente milho floculado a vapor aumenta a digestibilidade do amido de 10 a 20%, mas a digestibilidade da FDN diminui (Plascencia e Zinn, 1996; Joy et al., 1997; Crocker et al., 1998; Yu et al., 1998; Dann et al., 1999). Digestibilidade do amido no trato total foi aumentado de forma consistente com a redução da densidade do milho floculado a vapor (Chen et al., 1994; Plascencia e Zinn, 1996; Joy et al., 1997; Yu et al., 1998). No entanto, respostas variáveis de densidade de flocos foram encontradas para digestibilidade da OM, porque a digestibilidade da FDN geralmente diminui à medida que a densidade do floco é reduzida. A densidade do floco ideal com base na produção de leite é de 360 g/L. A resposta média em produção de leite corrigido para gordura foi de 4,5%, quando milho floculado a vapor substituiu milho seco moído (Chen et al., 1994; Plascencia e Zinn, 1996; Joy et al., 1997; Yu et al., 1998; Dann et al., 1999). O percentual de gordura do leite tende a diminuir, e a porcentagem de proteína do leite tende a aumentar quando milho floculado a vapor substitui o milho laminado a seco. A silagem de grão úmido aumentou em 9% a digestibilidade do milho para vacas em lactação (Tyrrell e Varga, 1987; Wilkerson et al., 1997). Ferraretto et al. (2013) encontrou digestibilidade ruminal e total de amido de 53,5 e 92,0%; 64,1 e 94,2%; 58,5 e 93,9% para milho seco moído, ensilado e floculado, respectivamente. Também a digestibilidade total de FDN foi influenciada pelo processamento do milho com valores de 45,8; 42,2 e 44,6% para milho seco moído, ensilado e floculado, respectivamente.
Bargo et al. (2003) revisaram oito trabalhos sobre o efeito dos grãos processados, na produção e

19
composição de leite de vacas leiteiras sob pastejo de gramíneas de clima temperado (Bargo et al., 1998; Pieroni et al., 1999; Reis e Combs, 2000; Soriano et al., 2000; Alvarez et al., 2001; Wu et al., 2001; Reis et al., 2001; Delahoy et al., 2003). As formas de processamento de milho incluíram silagem de grão úmido de milho ou sorgo floculado a vapor em diferentes densidades e milho seco moído. Nenhum trabalho apresentou redução no consumo de pasto ou de MS total quando o milho seco moído foi substituído por milho mais intensamente processado. Pieroni et al. (1999) relataram maior consumo de pasto e MS total quando sorgo floculado a vapor substituiu sorgo moído seco. Exceto em Wu et al. (2001), nenhum dos estudos relataram aumento na produção de leite, quando os grãos processados foram substituídos por grãos secos moído. A suplementação com milho finamente moído e ensilado, em vez de milho seco moído aumentou a produção e reduziu o teor de gordura do leite (Wu et al., 2001). Apenas dois dos oito estudos (Alvarez et al., 2001;. Wu et al., 2001) encontraram maior porcentagem de proteína do leite com grãos úmidos de milho do que com milho seco.
Santos et al. (2001) avaliaram o efeito do milho floculado a vapor em substituição ao milho moído grosso, sendo ambos utilizados como único concentrado energético ou parcialmente substituído por polpa cítrica, em vacas lactantes alimentadas com dietas a base de silagem de milho. A floculação aumentou as digestibilidades aparentes (%) no trato total da MS, da MO, do amido e da proteína, reduziu a concentração de N-NH3 no rúmen, e proporção de acetato, porém aumentou a concentração de propionato. A floculação tendeu a aumentar eficiência alimentar (P = 0,06) percentual (P = 0,09) e produção (P = 0,11) de proteína do leite. A inclusão de polpa não afetou a ingestão de MS e aumentou digestibilidade da fibra. A produção de leite corrigida para 3,5% de gordura, a eficiência alimentar, o percentual e a produção de gordura do leite aumentaram com a inclusão de polpa.
Pires et al. (2008) avaliaram a influência das fontes e formas de processamento do amido utilizado na dieta de vacas em lactação alimentadas com cana-de-açúcar como volumoso. As fontes de amido foram milho moído grosso; milho moído fino; milho floculado a 310 g/L; milho floculado a 360 g/L ou raspa de mandioca. A taxa de hidrólise in vitro do amido da raspa de mandioca foi superior à obtida com as demais fontes de amido testadas. O amido do milho floculado apresentou maior taxa de hidrólise em comparação ao amido do milho moído. Os percentuais médios totais de amido hidrolisado foram de 93,5% para raspa de mandioca, 85,6% para milho floculado a 310 g/L, 83,7% para milho floculado a 360 g/L e 37,8% para milho moído grosso. As fontes de amido e seu tipo de processamento não influenciaram o consumo de matéria seca, os teores de gordura e proteína do leite, a síntese microbiana e a concentração plasmática de glicose. A utilização da raspa de mandioca reduziu as produções diárias de gordura e proteína e a produção de leite corrigida para 3,5% de gordura, cujos
valores médios foram de 0,40; 0,45 e 12,48 kg/dia; 0,68; 0,64 e 19,74 kg/dia; 0,57; 0,62 e 17,37 kg para raspa de mandioca, milho floculado e milho moído, respectivamente. A concentração de amônia ruminal foi menor quando fornecidas as rações contendo milho floculado ou raspa de mandioca.
Garcia et al. (2010) trabalhando com vacas da raça Holandês em pastagem de capim elefante e suplementadas com concentrados com diferentes fontes de carboidratos como milho seco moído, polpa de citros mais milho grão seco moído, polpa de citros (PC) e silagem de grão úmido de milho (MU), não encontraram diferença de produção de leite entre as dietas com milho moído, silagem de grão de milho úmido e polpa de citros, (22,4, 21,6 e 22,5 kg/dia, respectivamente). Vacas que consumiram silagem de grão úmido de milho apresentaram maior consumo de forragem (9,7 kg de MS), seguidas das vacas que consumiram milho seco mais polpa de cítrica (8,8 kg de MS), polpa de citros (8,5 kg de MS) e milho grão seco moído (7,2 kg de MS). Vacas que receberam milho seco e milho de alta umidade apresentaram maior porcentagem de proteína e sólidos totais no leite, enquanto vacas que receberam polpa de citros apresentaram maior porcentagem de gordura. Vacas que consumiram silagem de grão úmido de milho apresentaram maior concentração de propionato e menor relação acetato/propionato no rúmen.
Moura (2013) trabalhando com vacas ½ Holandês X Gir manejadas em pastejo intensivo de Panicum maximun c.v. Mombaça e suplementadas com concentrados onde o milho diferia em quatro tipos de processamento, moído (MM), extrusado (ME), floculado (MF), re-hidratado e ensilado (MU), observou que o consumo de pasto foi maior quando as vacas foram suplementadas com MF (8,02 kg de MS/dia), o que refletiu em maior consumo de MS, MO, PB, FDN para o mesmo tratamento. O aumento no consumo de pasto quando as vacas foram suplementadas com MF, pode ser um indício de que o processo de floculação foi menos intenso na disponibilização do amido quando, comparado aos outros processamentos. Segundo Mc Carthy et al. (1989) o aumento de disponibilidade de amido no rúmen pode levar a efeitos adversos como reduções na digestibilidade de carboidratos fibrosos da dieta e ingestão de forragem e MS.
Esta hipótese corrobora com os dados de digestibilidade aparente (DA), onde a DA da MS e MO foram maiores para a dieta de MF em comparação com as dietas de ME e MU, refletindo no consumo de forragem, de MS e de FDN. Foi observado também menor DA da FDN na dieta MU quando comparada com as dietas MM e MF. Segundo Mould e Orskov (1984) dietas formuladas para ruminantes com a presença de amido reduzem a digestão das fibras por vários eventos, destacando a preferência dos microrganismos ruminais por estes carboidratos, cuja degradação reduz o pH ruminal inibindo os microrganismos celulolíticos e afetando digestibilidade da fibra.

20
A produção de leite tendeu (P = 0,08) a ser maior para a dieta de ME (33,68 kg/dia),quando comparado com as dietas MM (32,76 kg/dia), MF (32,55 kg/dia), MU (32,25 kg/dia). Entretanto os diferentes processamentos não influenciaram, na produção de leite corrigida para 4%, produção de gordura, produção de proteína, e porcentagem de proteína e gordura do leite. O fato das vacas da dieta ME terem produzido 1,16 Kg a mais de leite, pode ter ocorrido devido a um melhor ajuste do consumo e disponibilidade ruminal de amido na dieta ME, proporcionando mais energia disponível quando comparado com as dietas MM e MF, e ambiente ruminal mais adequado à digestão da fibra quando comparado à dieta de MU. A quantidade ótima de amido dietético será função de vários fatores, incluindo a degradabilidade inerente da fonte de amido, o método de processamento, a quantidade de proteína solúvel e FDN, método de alimentação e meio ambiente.
Para alterar a disponibilidade de amido na dieta são necessárias mudanças nas proporções das frações dos carboidratos, sobretudo amido e FDN. Quando isso não acontece o aumento efetivo no conteúdo de energia da dieta pode ser menor do que o previsto (Weiss e Shockey, 1991), pois quando o amido substitui fibra dietética de forragem, a digestão da FDN é muitas vezes reduzida (Beckman e Weiss, 2005; Firkins et al., 2001).
Bastiel (2014) avaliou as dietas de vacas em lactação em pastagem de capim elefante, contendo milho flint processado de duas formas diferentes, moído e floculado, sobre a cinética de degradação in vitro, consumo, produção de leite, e metabolismo. Com relação a cinética de degradação das dietas (50% de concentrado e 50% de forragem), a adição de milho floculado aumentou o volume final de gás e taxa da degradação dos carboidratos não fibrosos e reduziu o lagtime em comparação ao milho moído. No entanto, o milho floculado reduziu o volume final de gás da degradação dos carboidratos fibrosos. Estes resultados indicam maior degradabilidade para o milho floculado e efeito negativo sobre a degradabilidade da fibra.
O fornecimento de milho floculado aumentou 7,7% a produção de leite, 8,3% o teor de proteína do leite, porém reduziu 3,8% o teor de gordura do leite e 25,8% do N-ureico do leite. O consumo de energia liquida foi aumentado em 4,3% na dieta com milho floculado, sem alterar os consumos e as digestibilidades de MS e FDN.
As concentrações de AGV individual e total foram maiores quando o milho floculado foi fornecido em comparação ao milho moído. Além disso, a suplementação com milho floculado reduziu a relação acetato/propionato e a concentração ruminal de N-NH3. Não houve efeito do processamento do milho sobre o pH médio, pH mínimo e máximo. No entanto, o tempo em que o pH esteve abaixo de 6,0 foi maior para o milho floculado em comparação ao milho moído. A concentração de glicose plasmática tendeu a ser maior para os tratamentos com milho floculado. Além disso, a concentração de N-ureico no plasma foi menor para as dietas com milho floculado. Dessa forma o fornecimento de milho floculado
em comparação com milho moído neste estudo melhorou os parâmetros de fermentação, permitindo melhor desempenho animal.
Conclusão
Respostas variadas são encontradas nos
trabalhos quando vacas leiteiras são alimentadas com milho processado, entretanto de uma forma geral existe tendência de aumento na degradabilidade ruminal e digestibilidade do amido, produção de leite e proteína do leite à medida que se aumenta a intensidade do processamento.
Mesmo na ausência de diferença significativa entre os diversos graus de processamento do milho, produções elevadas de leite com qualidade e eficiência alimentar podem ser obtidas com vacas em pastagem intensivamente manejada suplementadas com concentrado tendo o amido como fonte principal de energia.
Referências
Aldrich J. M., L. D. Muller, e G. A. Varga. 1993.
Nonstructural carbohydrate and protein effects on rumen fermentation, nutrient flow, and performance of dairy cows. J. Dairy Sci.76:1091-1105.
Allen, M. S. 2000. Effects of diet on short-term regulation of feed intake by lactating dairy cattle. J. Dairy Sci. 83:1598-1624.
Alvarez, H. J., F. J. Santini, D. H. Rearte, e J. C. Elizalde. 2001. Milk production and ruminal digestion in lactating dairy cows grazing temperate pastures and supplemented with dry cracked corn or high moisture corn. Anim. Feed Sci. Technol. 91:183–195
Asp, N. G., J. M. Van Melsvoort, e J. G. A. J. Hautvast. 1996. Nutrition implications of resistant starch. Nut. Res. Rev. 9:1.
Balsalobre, M. A. A. Valor alimentar do capim Tanzânia irrigado. 2002.113 p. Tese (Doutorado) – Escola Superior de Agricultura “Luiz de Queiroz”, Universidade de São Paulo.
Bargo, F., L. D. Muller, E. S. Kolver, e J. E. Delahoy. Production and digestion of supplemented dairy cows on pasture. J. Dairy Sci. 86:1-42.
Bargo, F., L. D. Muller, J. E. Delahoy, e T. W. Cassidy. 2002. Milk response to concentrate supplementation of high producing dairy cows grazing at two pasture allowances. J. Dairy Sci. 85:1777-1792.
Bargo, F., G. A. Pieroni, e D. H. Rearte. 1998. Milk production and ruminal fermentation of grazing dairy cows supplemented with dry-ground corn or steam-flaked corn. J. Dairy Sci. 81:250.

21
Baron, V. S., K. R. Stevenson, J. G. Buchanan-Smith. 1986. Proteolysis and fermentation of corn-grain ensiled at several moisture levels and under several simulated storage methods. J. Anim. Sci. 66:451-461.
Bastiel, F. 2014. Processamento do milho flint associado à suplementação de gordura sobre o desempenho e metabolismo de vacas em pastagem tropical. Dissertação (Mestrado). Escola Superior de Agricultura “Luiz de Queiroz” Universidade de São Paulo - Piracicaba.
Beckman, J. L., W. P e Weiss. 2005. Nutrient digestibility of diets with different fiber to starch ratios when fed to lactating dairy cows. J. Dairy Sci. 88:1015-1023.
Berzaghi, P., J. H. Herbein, e C. E. Polan. 1996. Intake, site, and extent of nutrient digestion of lactating cows grazing pasture. J. Dairy Sci. 79:1581–1589.
Borges, F. M. O. 2000. Processamento de alimentos (expandidos e extrusados vs farelados e peletizados). Vale Verde Comercio e Industria Limitada: Belo Horizonte, MG, p 39.
Buchanan, B. B., W. Gruissem, e R. L. Jones. 2000. Biochemistry and Molecular Biology of Plants. Am. Soc. of Plant Physiol., Rockville, MD.
Bueno, A. A. O. 2003. Características estruturais do dossel forrageiro, valor nutritivo e produção de forragem em pastos de capim Mombaça submetidos a regime de desfolhação intermitente. 124 p. Dissertação (Mestrado). Escola Superior de Agricultura “Luiz de Queiroz” - Piracicaba.
Carareto, R. 2011. Fontes de nitrogênio, níveis de forragem e métodos de processamento de milho em rações para tourinhos da raça nelore terminados em confinamento. 104 p. Tese (Doutorado Ciência Animal e Pastagens). Escola Superior de Agricultura “Luiz de Queiroz” Universidade de São Paulo - Piracicaba.
Carnevalli, R. A. 2003. Dinâmica da rebrotação de pastos de capim-Mombaça submetidos a regimes de desfolhação intermitente. 136 p. Tese (Doutorado). Escola Superior de Agricultura “Luiz de Queiroz” - Piracicaba.
Chagas, L. J. 2011.Teor de proteína no concentrado de vacas no terço inicial da lactação mantidas em pastagens de capim elefante. 79 p. Dissertação (Mestrado). Escola Superior de Agricultura “Luiz de Queiroz” Universidade de São Paulo - Piracicaba.
Chen, K. H., J. T. Huber, C. B. Theurer, R. S. Swingle, J. Simas, S. C. Chan, Z. Wu, e J. L. Sullivan. 1994. Effect of steam flaking of corn and sorghum grains on performance of lactating cows. J. Dairy Sci. 77:1038–1043.
Correa, C. E. S., R. D. Shaver, M. N. Pereira, J. G. Lauer, e K. Kohn. 2002.Relationship between corn vitreousness and ruminal in situ starch degradability. J. Dairy Sci. 85:3008-3012.
Correia, P. S. 2006. Estratégias de suplementação de bovinos de corte em pastagens durante o período das águas. 333 p. Dissertação (Doutorado). Escola Superior de Agricultura “Luiz de Queiroz”. Universidade de São Paulo - Piracicaba.
Corsi, M. 1988. Manejo de plantas forrageiras do gênero Panicum. In: Simpósio Sobre Manejo De Pastagem, 9. Piracicaba. Anais. Piracicaba: FEALQ. p 57-77.
Corsi, M. Pastagens de alta produtividade.1986. In: Simpósio Sobre Manejo De Pastagens, 8. Piracicaba. Anais.Piracicaba: FEALQ. p 499-512.
Corsi, M. 1990. Produção e qualidade de forragens tropicais. In: Sociedade Brasileira De Zootecnia. Pastagens. Piracicaba: FEALQ. p 69-88.
Costa, D. F. A. 2007. Respostas de bovinos de corte à suplementação energética em pastos de capim Marandu submetidos a intensidades de pastejo rotativo durante o verão. 98 p. Dissertação (Mestrado). Escola Superior de Agricultura “Luiz de Queiroz”. Universidade de São Paulo - Piracicaba.
Cotta, M. 1988. Amilolytic of Selected Species of Ruminal Bacteria. Applied and Environmental Microbiology. 54:772-776.
Crocker, L. M., E. J. Depeters, J. G. Fadel, H. Perez-Monti, S. J. Taylor, S. J. A. Wyckoff, e R. A. Zinn. 1998. Influence of processed corn grain in diets of dairy cows on digestion of nutrients and milk composition. J. Dairy Sci. 81:2394–2407.
Da Silva, S .C., e M. Corsi, 2003. Manejo do pastejo. In: SIMPÓSIO SOBRE MANEJO DE PASTAGENS, 20. Piracicaba. Anais. Piracicaba: FEALQ. p 155-186.
Danés, M. A. C. 2010. Teor de proteína no concentrado de vacas em lactação mantidas em pastagens de capim elefante. 117 p. Dissertação (Mestrado). Escola Superior de Agricultura “Luiz de Queiroz” Universidade de São Paulo - Piracicaba.
Dann, H. M., G. A. Varga, D. E. Putnam, e J. L. C. Griel. 1999. Improving energy supply to late gestation and early postpartum dairy cows. J. Dairy Sci. 82:1765–1778.
Delahoy, J. E., L. D. Muller, F. Bargo, T. W. Cassidy, e L. A. Holden. 2003. Supplemental carbohydrates sources for lactating dairy cows on pasture. J. Dairy Sci. 86:906-915.
Derez, F., A. C. Coser, C. E. Martins, M. A. Botrel, L. J. M. Aroeira, H. M. Vasquez, e L. L. Matos. 1994. Utilização

22
do capim-elefante (Pennisetum purpureum Schum) para produção de leite. In: Reunião Colégio Brasileiro De Nutrição Animal. Campinas. p 183-199.
Derez, F., e O. L. Mozzer. 1990. Produção de leite em pastagens de capim-elefante. In: Carvalho, L.A., Carvalho, M..M., Martins, C.E., Vilela, D. (Eds.). Simpósio Sobre Capim-Elefante. EMBRAPA-Coronel Pacheco-MG. p 155-173.
Drumond, L. C. D., e A. P. A. Aguiar. 2005. Irrigação de pastagem. 1 ed. Uberaba: Universidades Associadas de Uberaba/FAZU. 210 p.
Ekinci C., e A. G. Broderick. 1997. Effect of processing high moisture ear corn on ruminal fermentation and milk yield. J. Dairy Sci. 80:3298-3307.
Euclides, V. P. B. e S. R. Medeiros. 2005. Suplementação animal em pastagens e seu impacto na utilização da pastagem. In: Simpósio Sobre Manejo Da Pastagem: Teoria e Prática da Produçâo Animal em Pastagens, 22. Piracicaba. Anais. Piracicaba, SP: Fealq. p 33-70.
Euclides, V. P. B. 1995. Valor alimentício de espécies forrageiras do gênero Panicum. In:Simpósio sobre manejo da pastagem, 12, Piracicaba. Anais. Piracicaba. FEALQ. p 245-73.
Fancher, B. I. D. Rollins, e B. Trimbbe. 1996. Feed processing using the annular gap expanded and its impact on poultry performance. Journal Applied Poultry Research. 5:386-394.
Ferraretto, L. F., P. M. Crump, e R, D. Shaver. 2013. Effect of cereal grain type and corn grain harvesting and processing methods on intake, digestion and milk production by dairy cows through a meta-analysis. J. Dairy Sci. 96:533-550.
Firkins, J. L. M. L. Eastridge, N. R. St-Pierre, e S. M. Noftsger. 2001. Effects of grain variability and processing on starch utilization by lactating dairy cattle. J. Anim. Sci. 79:218-238.
Flint, H. J., e C. W. Forsberg. 1995. Polysaccharide degradation in the rumen: biochemistry and genetics. In: Engelhardt, W. V., et al. (Eds). Ruminant Physiology: Digestion, Metabolism, Growth and Reproduction. Proceedings of the Eighth International Symposium on Ruminant Physiology. Stuttgart: Enke. p 43-70.
García, G. A. G. 2007. Desempenho de vacas leiteiras em pastagem de capim elefante (Pennisetum purpureum) suplementado com diferentes fontes de carboidratos. p 62 Dissertação (Mestrado), Escola de Veterinária, Universidade Federal de Minas Gerais. Belo Horizonte.
García, G. A. G., R. B. Reis, A. B. D. Pereira, H. M. Saturnino, e S. G. Coelho. 2010. Produção e composição do leite de vacas em pastagem de capim-
elefante (Pennisetum purpureum) suplementado com diferentes fontes de carboidratos. Arquivo Brasileiro de Medicina Veterinária e Zootecnia. 62:875-882.
Gomide, J. A., e C. P. Zago. 1982. Valor nutritivo e produtividade de capim colonião, submetido a diferentes intervalos de corte, com e sem adubação de reposição. Revista Brasileira de Zootecnia. 11:512-528.
Gomide, J. A., I. J. Wendling, S. P. Brás, e H. B. Quadros. 2001. Consumo e produção de leite de vacas mestiças em pastagem de Brachiaria decumbens manejadas sob duas ofertas diárias de forragem. Revista Brasileira de Zootecnia. 30:1194-1200.
Grant, R. J. 2005. Optimizing starch concentrations in dairy rations. In: W. H. Miner Agricultural Research Institute Annual Tri-State Dairy Nutrition Conference, 14. Fort Wayne. Proceedings. Fort Wayne. p 73-79.
Hale, W. H. 1973. Influence of processing on the utilization of grains (starch) by ruminants. J. Anim. Sci. 37:1075.
Hall, M. B., e C. Herejk. 2001. Differences in yields of microbial crude protein from in vitro fermentation of carbohydrates. J. Dairy Sci. 84:2486-2493.
Hamaker, B. R., A. A. Mohamed, J. E. Habben, C. P. Huang, C.P, e B. A. Larkins. 1995. Efficient procedure for extracting maize and sorghum kernel proteins reveals higher prolamin contents than the conventional method. Cereal Chem. 72:583-588.
Heidenreich, E. 1997. Benefits and side effects of expanding. In: Expoviga.
Heidenreich, E. 1994. Operation strategies for expansion cooking. Feed Mix. 2:32-34.
Herlig, V. R., P. H. C. Luz, P. P. O. Anchão, W. A. Marchesin, F. B. Macedo, e A. C. Alves. 2005. Manejo do pasto com vistas a maximizar a produção de ruminantes. In: Volumosos Na Produção De Ruminantes. Jaboticabal, SP. Anais. Jaboticabal: Funep. p 125-158.
Hoffman, P. C., e R. D Shaver. 2011. The nutritional chemistry of dry and high moisture corn. In: Annual Southwest Nutrition And Management Conference, 26, 2011, Arizona. Proceedings. Arizona: The University of Arizona Department of Animal Sciences. p 12-23.
Hoffman, P. C., N. M. Esser, R. D. Shaver, W. Coblentz, M. P. Scott, A. L. Bodnar, R. Schmidt, e B. Charely. 2011. Influence of ensiling time and inoculation on alteration of the starch-protein matrix in high moisture corn. J. Dairy Sci. 94: 2465-2474.
Hoover, R. 2001. Composition, molecular structure, and physicochemical properties of tuber and root starches a review. Carbohydrate Polymers. 45:253.

23
Hoover, W. H., e S. R. Stokes. 1991. Balancing carbohydrates and proteins for optimum rumen microbial yield. J. Dairy Sci. 74:3630–3644.
Huntington B. G. 1997. Starch utilization by ruminants: from basis to de bunk. J. Anim. Sci. 75:852-867.
Jobim C. C., A. B. Branco, e G. T. Santos. 2003. Silagem de grãos úmidos na alimentação de bovinos. In: V Simpósio Goiano sobre Manejo e Nutrição de Bovinos de Corte e Leite. Goiânia. p 357-376.
Joy, M. T., E. J. Depeters, J. G. Fadel, e R. A. Zinn. 1997. Effects of corn processing on the site and extent of digestion in lactating cows. J. Dairy Sci. 80:2087–2097.
Jurjanz, S., e V. Montels. 2005. Ruminal degradability of corn forages depending on the processing method employed. Anim. Res. 3:15-23.
Kellaway, R., e S. Porta. 1993. Feeding concentrates supplements for dairy cows. In: Dairy Research and Devel-Opment Corporation. Melbourne, Australia.
Knowlton, K. F., M. S. Allen, e P. S. Erickson. 1996. Lasalocid and particle size of corn grain for dairy cows in early lactation. 1. Effect on performance, serum metabolites and nutrient digestibility. J. Dairy Sci. 79:557– 564.
Kotarski, S. F., R. D. Waniska, e K. K. Thurn. 1992. Sarch hydrolysis by the ruminal mocroflora. In: Annual Ruminant Nutrition Conference, 31. Washington, The Journal of Nutirtion, Bethesda. 122:178-190.
Kramer, J., e J. L. 1991. VOORSLUYS. Silagem de milho úmido, uma opção para gado leiteiro. In: Simpósio Sobre Nutrição de Bovinos, 4. Piracicaba. Anais. Piracicaba: Fundação de Estudos Agrários Luiz de Queiroz. p 257-262.
Lawton, J. W. 2002. Zein: A history of processing and use. Cereal Chem. 79:1-18.
Lopes, C. J. 2011. Nutrient composition and fiber digestibility measurements of tropical forages collected from intensively managed rotational grazing systems.131 p. Dissertação (Mestrado - Dairy Science) University of Wisconsin, Madison.
Lopes, F. C. F., L. J. M. Aroeira, N. M. Rodriguez, I. B. M. Sampaio, F. Deresz, I. Borges, e T. T. Berchielli. 2005. Predição do consumo de pasto de capim-elefante (Pennisetum purpureum, Schumack) por vacas mestiças Holandes x Zebu em lactação. Revista Brasileira de Zootecnia. 34:1017-1028.
Macedo, F. L. 2012. Doses de concentrado com ou sem gordura inerte na dieta de vacas em lactação mantidas em pastagens tropicais. 108 p. Dissertação (Mestrado). Escola Superior de Agricultura “Luiz de Queiroz” Universidade de São Paulo - Piracicaba.
Martinez, J. C. 2008. Avaliação de co-produtos na alimentação de vacas leiteiras mantidas em pastagens tropicais durante a estação chuvosa e alimentadas no cocho durante a estação seca do ano. 351 p. Tese (Doutorado em Ciência Animal e Pastagem). Escola Superior de Agricultura “Luiz de Queiroz” Universidade de São Paulo - Piracicaba.
Mc Allister T. A., L. M. Rode, D. J. Major, K. J. Chung, e J. G. Buchaman. 1990. Effect of ruminal microbial colonization on cereal grain digestion. J. Anim. Sci. 70:571.
Mc Allister, T. A., R. C. Phillipe, L. M. Rode, e K. J. Cheng. 1993. Effect of the protein matrix on the digestion of cereal grains by ruminal microorganisms. J. Anim. Sci. 71:205-212.
Mc Carthy, R. D., T. H. Klusmeyer, J. L. Vicini, J. H. Clark, e D. R. Nelson. 1989. Effect of source of protein and carbohydrate on ruminal fermentation and passage of nutrients to the small intestine of lactating cows. J. Dairy Sci. 72:2002-2016.
Mello Júnior, C. A. 1991. Processamento dos grãos de milho e sorgo visando aumento do valor nutritivo. In: SIMPÓSIO SOBRE NUTRIÇÃO DE BOVINOS, 4. Piracicaba, SP. Anais. Piracicaba, FEALQ. p 263-283.
Mendes, W. S. 2002. Valor nutritivo do milho, sorgo e soja submetidos ou não a diferentes processamentos térmicos para suínos em crescimento. 49 p. Tese (Mestrado). Escola de Veterinária, Universidade Federal de Minas Gerais, MG. Belo Horizonte.
Mitzner, K. C., F. G. Owen, e R. J. Grant. 1994. Comparison of sorghum and corn grains in early and midlactation diets for dairy cows. J. Dairy Sci. 77:1044–1051.
Moe, P. W., H. F. Tyrrell, e J. N. W. Hooven. 1973. Physical form and energy value of corn grain. J. Dairy Sci. 56:1298–1304.
Momany, F. A., D. J. Sessa, J. W. Lawton. G. W. Selling, S. A. Hamaker, e J. L. Willet. 2006. Structural characterization of alpha-zein. J. Agric. Food Chem. 54:543-547.
Mota, M. F. 2006. Desempenho, parâmetros ruminais e taxa de passagem em vacas da raça holandesa em pastagem de coastcross. 147 p. Tese (Doutorado) Universidade estadual de Maringá, PR. Maringá.
Moteiro, F. A., e V. P. B. Euclides. 2005. Adubação de plantas forrageiras com ênfase na produção e qualidade forrageira. In: Volumosos na Produção de Ruminantes. Jaboticabal, SP. Anais. Jaboticabal: Funep. p 159-186.
Mould, F. L., e E. R. Orskov. 1984. Manipulation of rumen pH and influence on cellulose in sacco, dry matter

24
degradation and the run microflora of sheep offered either hay or concentrate. Anim. Feed Sci. Technol. 10:1-14.
Moura, A. M. 2013. Milho diferindo no processamento para vacas leiteiras em pastejo. 2013, 80 p. Dissertação (Mestrado) Universidade Federal de Minas Gerais, MG. Belo Horizonte.
Mourão, R. C., C. G. Pancoti, A. M. Moura, A. L. Ferreira, A. L. C. C. Borges, e R. B. Silva. 2012. Processamento do milho na alimentação de ruminantes. PUBVET, Londrina, 6: Ed. 192, Art. 1292.
Mu-Forster, C., e B. P. Wasserman. 1998. Surface localization of zein storage proteins in starch granules flint maize endosperm: Proteolytic removal by thermolysin and in vitro cross-linking of granule-associated polypeptides. Plant Physiology. 116:1563-1571.
National Research Council. 2001. Nutrient Requirements of Dairy Cattle. 7th Revised ed. National Academy Press, Washington, D.C.
Nocek J. E., e S. 1991. Tamminga. Site of digestion of starch in the gastrointestinal tract of dairy cows and its effect on milk yield an composition. J. Dairy Sci. 74:3598.
Owens, F. N., R. A. Zinn, e Y. K. 1986. KIM. Limits to starch digestion in the ruminant small intestine. J. Anim. Sci. 63:1634.
Owens, F. N., e R. A. Zinn. 2005. Corn grain for cattle: influence of processing on site and extent of digestion. In: Southwest Nutrition Conference. Nebraska. Proceedings. Nebraska. p 86-112.
Pacheco Junior, A. J. D. 2009. Valor nutritivo e cinética ruminal de gramíneas tropicais manejadas intensivamente. 192p. Dissertação (Mestrado), Escola Superior de Agricultura “Luiz de Queiroz” Universidade de São Paulo - Piracicaba.
Peisker, J. C. 1992. Physical and chemical changes during the expansion. Feed International. 13:16-34.
Pereira, L. G. R.; Antunes, R. C. 2007. O milho na alimentação de gado de leite. In: IV Simpósio Mineiro de Nutrição de Gado de Leite. Belo Horizonte, MG: Escola de Veterinária, Universidade Federal de Minas Gerais. p 49-70.
Pereira, M. L. R. 2012. Degradabilidade ruminal in vitro de grãos re-hidratado e ensilado de milho e sorgo com diferentes granulometrias. 60 p. Dissertação (Mestrado). Escola de Veterinária e Zootecnia, Universidade Federal de Goiás, Goiânia.
Peres, S. M. 2011. Processamento de grãos de milho do tipo flint ou duro e adequação proteica em rações para
bovinos em terminação – desempenho animal e digestibilidade do amido. 89 p. Dissertação (Mestrado). Escola Superior de Agricultura “Luiz de Queiroz” Universidade de São Paulo - Piracicaba.
Philippeau, C., J. Landry, e B. Michalet-Doreau. 2000. Influence of the protein distribution of maize endosperm on ruminal starch degradability. J. Sci. Food and Agric. 80:404-408.
Pieroni, G. A., F. Bargo, e D. H. Rearte. 1999. Dry-ground or steam flaked sorghum supplementation to lactating dairy cows grazing pasture. J. Dairy Sci. 82:44.
Pires, A. V., I. Susin, F. A. P. Santos, C. Q. Mendes, R. C. Oliveira Jr, J. J. R. Fernandes, e J. M. C. Simas. 2008. Efeito de fontes e formas de processamento do amido sobre o desempenho e o metabolismo do nitrogênio em vacas Holandesas em lactação. Revista Brasileira de Zootecnia. 37:1456-1462.
Plascencia, A., e R. A. Zinn. 1996. Influence of flake density on the feeding value of steam-processed corn in diets for lactating cows. J. Anim. Sci. 74:310–316.
Pond, W. G., D. C. Church, e K. R. Pond. 1995. Basic Animal Nutrition and Feeding. 4ª Ed. New York: John Willey and Sons. p 353-364.
Reis, R. B., e D. K. Combs. 2000. Effects of increasing levels of grain supplementation on rumen environment and lactation performance of dairy cows grazing grass-legume pasture. J. Dairy Sci. 83:2888–2898.
Reis, R. B., F. San Emeterio, D. K. Combs, L. D. Satter, e H. N. Costa. 2001. Effects of corn particle size and source on performance of lactating cows fed direct-cut grass-legume forage. J. Dairy Sci. 84:429–441.
Reis, R.B., S. Colombini, A. Miller, D. K. Combs, G. A. Broderick. e M. Crovetto. 2010. Protein fractions and rates of degradation of tropical forages from intensively grazed pastures. In: Energy and protein metabolism and nutrition, 127. Parma, EAAP publication. Wageningen Academic Publishers. p 717-718.
Rodrigues, E. N. 2002. Digestibilidade aparente de dietas contendo feno de Tifton 85 (Cynodon spp) e níveis crescentes de milho moído e milho expandido em ovinos. 39 p. Dissertação (Mestrado em Ciência Animal), Escola de Veterinária, Universidade Federal de Minas Gerais. Belo Horizonte.
Rooney, L. W., e R. L. Pflugfelder. 1986. Factors affecting starch digestibility with special emphasis on sorghum and corn. J. Anim. Sci. 63:1607.
Russel, J. B., J. D. O’ Connor, D. G. Fox, P. J. Van Soest, e C. J. Sniffen. 1992. A net carbohydrate and protein system for evaluating cattle diets: I. Ruminal fermentation. J. Anim. Sci. 70:3551-3561.

25
San Emeterio, F., R. B. Reis, E. W. Campos, e L. D. Satter. 2000. Effect of fine grinding on utilization of dry or ensiled corn by lactating dairy cows. J. Anim. Sci. 83:2839-2848.
Santos P.F.A., J. M. P. Menezes, J. M. Corrêa, e A. V. Pires. 2001. Processamento do grão de milho e sua substituição parcial por polpa de citrus peletizada sobre o desempenho, digestibilidade de nutrientes e parâmetros sangüineos em vacas leiteiras. Acta Scientiarum. 23:923-931.
Santos, F. A. P., A. M. Pedroso, J. C. Martinez, e M. A. Penatti. 2005. Utilização da suplementação com concentrados para vacas em lactação mantidas em pastagens tropicais. In: Simpósio Sobre Bovinocultura Leiteira. Piracicaba. Anais. Piracicaba: FEALQ. p 219-294.
Santos, P. F. A., J. C. Martinez, L. F. GRECO et al. 2007. Suplementação de vacas sob pastejo: considerações técnicas e econômicas visando maior rentabilidade. Anais. INTERLEITE. p 45-62.
Sarmento, D. O. L. 2007. Produção , composição morfológica e valor nutritivo da forragem em pastos de Brachiaria brizantha (Hochst ex A.Rich) Stapf. Cv. Marandu submetidos a estratégias de pastejo rotativo por bovinos de corte. Tese (Doutorado). Escola Superior de Agricultura “Luiz de Queiroz” Universidade de São Paulo - Piracicaba.
Sbrissia, A. F., S. C. Da Silva, e Nascimento Jr. 2007. Ecofisiologia de plantas Forrageiras e o manejo do pastejo. In: Pedreira, C. G. L. S. (Ed.) Simpósio sobre Manejo da pastagem, 24, Piracicaba. Anais. Piracicaba: FEALQ. p 153-176.
Silva., D. S., J. A. Gomide, e C. A. Queiros. 1994. Pressões de pastejo em Pastagens de capim-elefante anão (Pennisetum purpureum Schum. cv. Mott). 2. Efeito sobre o consumo do pasto, valor nutritivo e produção de leite. Revista Brasileira de Zootecnia 23:453-464.
Sinclair, L. A., P. C. Garnsworthy, J. R. Newbold, e P. J. Buttery. 1995. Effects of synchronizing the rate of dietary energy and nitrogen release in diets with a similar carbohydrate composition on rumen fermentation and microbial protein synthesis in sheep. J. Agric. Sci. 124:463–472.
Sniffen, C. J., J. D. O’ Connor, P. J. Van Soest, D. G. Fox, J. B. Russell. 1992. A net carbohydrate and protein system for evaluating cattle diets: II. Carbohydrate and protein availability. J. Anim. Sci. 70:3562-3577.
Soriano F. D., C. E. Polan, e C. N. Miller. 2000. Milk prodution and composition, rumen fermentation parameters, and grazing behavior of dairy cows
supplemented with different forms and amounts of corn grain. J. Dairy Sci. 83:1520-1529.
Souza-Júnior, S. J. 2007. Estrutura do dossel, interceptação de luz e acúmulo de forragem em pastos de capim Marandu submetidos a estratégia de pastejo rotativo por bovinos de corte. Dissertação (Mestrado). Escola Superior de Agricultura “Luiz de Queiroz” Universidade de São Paulo - Piracicaba.
Theurer, C. B. 1986. Grain processing effects on starch utilization by ruminants. J. Anim. Sci. 63:1649-1662.
Theurer, C. B., A. T. J. Huber, A. Delgado-Elorduy, e R. Wanderley1999. Invited review: Summary of steamflaking corn or sorghum grain for lactating dairy cows. J. Dairy Sci. 82:1950-1959.
Trindade, J. K. 2007. Modificação na estrutura do pasto e no comportamento ingestivo de bovinos durante o rebaixamento do capim Marandu submetido à estratégia de pastejo rotativo por bovinos de corte. Dissertação (Mestrado). Escola Superior de Agricultura “Luiz de Queiroz” Universidade de São Paulo - Piracicaba.
Tyrrell, H. F., e G. A. Varga. 1987. Energy value for lactation of rations containing ground whole ear maize or maize meal both conserved dry or ensiled at high moisture. Eur. Assoc. Anim. Prod. 32:308–309.
Vagnoni, D. B., e G. A. Broderick. 1997. Effects of supplementation of energy or ruminally undegraded protein to lactating cows fed alfafa hay or silage. J. Dairy Sci. 80:1703-1712.
Verbic, J. 2002. Factor affecting microbial protein synthesis in the rumen with emphasis on diets containing forages. Viehwirtschaftliche Fachtagung, BAL Gumpenstein. 29:1-6.
Vilela, D., M. J. Alvim, O. F. De Campos, e J. C. Resende. 1996. Produção de leite de vacas Holandesas em confinamento e ou pastagem de Coastcross. Revista Brasileira de Zootecnia. 25:1228-1244.
Weiss, W. P., e W. L. Shockey. 1991. Value of orchardgrass and alfalfa silages fed with varying amounts of concentrates to dairy cows. J. Dairy Sci. 74:1933-1943.
Wilkerson, V. A., B. P. Glenn, e E K. R. Mcleod. 1997. Energy and nitrogen balance in lactating cows fed diets containing dry or high moisture corn in either rolled or ground form. J. Dairy Sci. 80:2487–2496.
Wu, Z., L. J. Massingill, R. P. Walgenbach, e L. D. Satter. 2001. Cracked dry or finely ground high moisture shelled corn as a supplement for grazing cows. J. Dairy Sci. 84:2227–2230.

26
Yu, P., J. T. Huber, F. A. P. Santos, J. M. Simas, e C. B. Theurer. 1998. Effects of ground, steam-flaked, and steam-rolled corn grains on performance of lactating cows. J. Dairy Sci. 81:777–783.
Zeferino, C. V. 2007. Morfogênese e dinâmica do acumulo de forragem em pastos de capim Marandu (Brachiaria
brizantha (Hochst ex A.Rich) Stapf. Cv. Marandu) submetidos a regime de lotação intermitente por bovinos de corte. Dissertação (Mestrado). Escola Superior de Agricultura “Luiz de Queiroz” Universidade de São Paulo - Piracicaba.
Tabela 1. Composição bromatológica e digestibilidade in vitro de Panicum maximum e Pennisetum purpureum manejados no
conceito de 95% de interceptação luminosa.
Forrageira %MS
% da matéria seca
Autor
PB FDN FDA Lig DIVMS
P. purpureum 16,4 15,50 56,76 30,84 3,06 75,90 Chagas, 2011
P. purpureum 18,6 14,70 63,85 33,54 3,20 67,40 Martinez, 2008
P. purpureum 18,6 18,50 58,70 30,80 2,63 75,90 Danés, 2010
P. purpureum 19,7 18,60 54,40 35,00 3,00 55,80 Macedo, 2012
P. maximum 26,7 16,50 71,37 37,73 3,69 - Pacheco Jr., 2009
P. maximum - 15,40 66,60 36,70 5,30 61,80 Bueno, 2003
P. maximum - 18,63 62,33 34,99 4,30 59,96 Lopes et al., 2011
P. maximum 19,0 16,0 64,9 33,90 3,60 65,70 Moura, 2013
MS = matéria seca; PB = proteína bruta; FDN = fibra insolúvel em detergente neutro; FDA = fibra insolúvel em detergente ácido; Lig = lignina; NDT = nutrientes digestíveis totais. DIVMS = digestibilidade in vitro da matéria seca (48h incubação).

27
Tabela 2. Fracionamento dos compostos nitrogenados de Panicum maximum e Pennisetum purpureum manejadas no conceito de 95% interceptação luminosa.
Forrageira N total % do N Total
Autor NNP N solúvel NIDN NIDA
P. purpureum 2,58 24,05 31,39 38,87 11,07 Chagas, 2011
P. purpureum 2,96 21,26 30,47 33,68 4,84 Danés, 2010
P. purpureum 2,78 18,90 24,39 31,70 12,80 Macedo, 2012
P. maximum 2,64 28,52 53,57 29,71 10,26 Pacheco Jr., 2009
P. maximum 2,80 19,01 36,91 43,70 5,30 Reis et al., 2010
Forrageira % da PB
Autor A B1 B2 B3 C
P. purpureum 24,05 7,33 29,74 27,80 11,07 Chagas, 2011
P. purpureum 21,26 9,21 35,85 28,84 4,84 Danés, 2010
P. purpureum 18,90 5,49 43,91 18,90 12,80 Macedo, 2012
P. maximum 28,52 25,05 16,70 19,44 10,26 Pacheco Jr., 2009
P. maximum 19,01 17,90 19,39 38,40 5,30 Reis et al., 2010
MS = matéria seca; PB = proteína bruta; NIDN = Nitrogênio ligado à fibra insolúvel em detergente neutro; NIDA = Nitrogênio ligado à fibra insolúvel em detergente ácido. A, B1, B2, B3, C = Frações de acordo com Sniffen et al. (1992); Russel et al. (1992).
Tabela 3. Consumo, digestibilidade aparente, produção e composição do leite e eficiência alimentar de vacas em pasto suplementado com milho processado de diferentes formas.
Dietas
Variáveis MM ME MF MU EPM Valor de P
kg MS
Pasto 6,85 b 6,61 b 8,02 a 6,68 b 0,13 <0,01
Concentrado 12,42 12,47 12,52 12,18 0,06 0,09
Feno 0,84 0,80 0,83 0,83 0,01 0,61
CMS 20,11 b 19,88 b 21,37 a 19,69 b 0,14 <0,01
DA MS 64,5 ab 64,3 b 66,1 a 63,7 b 0,09 <0,01
DA FDN 52,1 a 49,1 ab 51,9 a 45,0 b 0,69 0,02
Leite kg/dia 32,76 33,68 32,55 32,25 0,55 0,08
Gordura % 3,59 3,46 3,47 3,47 0,07 0,26
Proteína % 3,09 2,99 3,09 3,01 0,04 0,13
Leite/CMS 1,63 a 1,70 a 1,52 b 1,64 a 0,03 <0,01
CMS = consumo de matéria seca; DA = digestibilidade aparente; MS = matéria seca; MO = matéria orgânica, PB = proteína bruta; FDN = fibra insolúvel em detergente neutro; MM = Milho seco moído, ME = Milho Expandido, MF = Milho floculado a vapor, MU = Milho re-hidratado e ensilado, Médias seguidas por letras diferentes na mesma linha diferem entre si pelo teste de Tukey P < 0.05, EPM = erro padrão da média, P = probabilidade Fonte: Adaptado de Moura (2013

28
Strategies to obtain high starch digestibility in
corn grain and silage
Luiz Ferraretto and Randy Shaver
Department of Dairy Science. University of Wisconsin Madison, USA
Introduction
Since about half or three-fourths of the energy value of corn silage and grain, respectively, is provided by its starch content (calculated from NRC, 2001), improving starch utilization may improve lactation performance and reduce feed costs, especially during periods of high grain prices. Total tract digestibility of starch by dairy cows ranges between 70% and 100% (Firkins et al., 2001; Ferraretto et al., 2013) with a host of factors that influence starch digestibility. The purpose of this paper is to review these factors in corn grain, high-moisture corn (HMC) and whole plant corn silage (WPCS).
Corn silage and high-moisture corn harvest practices
Meta-Analysis
Ferraretto and Shaver (2012b) performed a meta-analysis to determine the impact of dry matter (DM) content, kernel processing (PROC) and theoretical length of cut (TLOC) of WPCS on intake, digestion and milk production by dairy cows. The dataset was comprised of 106 treatment means from 24 peer-reviewed journal articles from 2000 to 2011. Categories for DM content at silo removal and PROC and TLOC at harvest were: ≤ 28% (VLDM), >28% to 32% (LDM), >32% to 36% (MDM), >36% to 40% (HDM), and >40% (VHDM) DM; 1 to 3 or 4 to 8 mm roll clearance or unprocessed; 0.48 to 0.64, 0.93 to 1.11, 1.27 to 1.59, 1.90 to 1.95, 2.54 to 2.86, and ≥ 3.20 cm TLOC. Data were analyzed using Proc Mixed in SAS with WPCS treatments as Fixed effects and trial as a Random effect.
Milk yield was decreased by 2 kg/d per cow for VHDM. Fat-corrected milk (FCM) yield decreased as DM content increased. Total-tract digestibility of dietary starch (TTSD) was reduced for VHDM compared to HDM and LDM. Processing (1 to 3 mm) increased TTSD compared to 4 to 8 mm PROC and unprocessed WPCS. Milk yield tended to be 1.8 kg/cow/d greater, on average, for PROC (1 to 3 mm) and unprocessed WPCS than 4 to 8 mm PROC. The TLOC of WPCS had minimal impact
on any of the parameters evaluated. Starch digestibility and lactation performance were reduced for dairy cows fed diets containing WPCS with >40% DM or WPCS with insufficient kernel processing.
An interaction was observed between DM content and kernel processing for TTSD. Kernel processing increased TTSD for diets containing WPCS with 32% to 40% DM. Also, an interaction was observed between TLOC and kernel processing for TTSD. Kernel processing increased diet TTSD when TLOC was 0.93 to 2.86 cm. Kernel processing WPCS to improve starch digestibility was effective across a wide range of DM contents and TLOC, but did not overcome adverse effects of very high DM content on TTSD and was ineffective at very long TLOC. Shredlage™
Ferraretto and Shaver (2012a) reported on an experiment to determine the effect of feeding Corn Shredlage™ (SHRD) versus conventional-processed WPCS (KPCS) on lactation performance by dairy cows. The KPCS was harvested using conventional rolls (3-mm gap) and set at a 19-mm TLOC. The SHRD was harvested using novel cross-grooved rolls (2.5-mm gap) and set at a 30-mm TLOC.
One hundred and twelve cows stratified by DIM, milk yield, breed and parity were randomly assigned to 14 pens with 8 cows. Pens were randomly assigned to the two TMR treatments in a completely-randomized design. A 2-wk covariate period with cows fed a 50:50 mixture of treatment diets was followed by an 8-wk treatment period with cows fed their assigned treatment diet. The TMR contained (DM basis) KPCS or SHRD (50%), alfalfa silage (10%), concentrate mixture (40%). Data were analyzed using Proc Mixed in SAS with covariate, treatment, week, and treatment x week interaction as Fixed effects and pen within treatment as a Random effect. Pen was the experimental unit.
Cows fed SHRD tended to consume 0.7 kg/d more DM. Milk yield and composition was similar between treatments. Yield of 3.5% FCM tended to be 1 kg/day greater for cows fed SHRD. A treatment by week interaction was detected for 3.5% FCM yield; similar

29
during wk 2, a tendency for SHRD to be greater during wk 4 and 6, and greater by 2 kg/day for SHRD at wk 8. Ruminal in situ digestibility of starch, but not NDF, was greater for SHRD than KPCS. Total tract digestibility of dietary starch and NDF were greater for SHRD than KPCS.
More research is needed regarding fiber digestibility in corn shredlage and the relative physically-effective fiber in corn shredlage compared to hay-crop silage, whole cottonseed, and chopped hay or straw, to allow for better decisions on how best to utilize corn shredlage in dairy cattle diets. Harvest of corn shredlage may improve starch digestibility more when silage is harvested drier than normal and for hybrids with harder kernel texture, but research is needed. Also, controlled data on packing densities in bunker silos for corn shredlage is lacking. HMC field survey
Ferraretto et al. (2014c) performed a survey to determine the impact of DM content and extent of fermentation on ruminal in vitro starch digestibility (ivStarchD) using a data set comprised of 6,131 HMC samples (55 to 80% DM) obtained from a commercial feed analysis laboratory. The ivStarchD increased by 9 percentage units from October to August of the following year (harvest in the USA occurs during September/October). Similar results were observed for ammonia-N and soluble CP. The DM content of HMC at silo removal was negatively related (R
2 = 0.47) to
ivStarchD with a decrease of 1.6 percentage units in ivStarchD per 1-percentage-unit increase in DM content. The pH of HMC was also negatively (R
2 = 0.51) related
to ivStarchD. These findings highlight the importance of proper harvest maturity and ensiling practices to achieve maximum starch digestibility in HMC. Silage Fermentation
Hoffman et al. (2011) reported that ensiling HMC for 240 d reduced zein protein subunits that cross-link starch granules, and suggested that the starch-protein matrix was degraded by proteolytic activity over an extended ensiling period. The Larson and Hoffman (2008) turbidity assay did not detect a reduction in zein protein over the ensiling period for HMC as was measured by high-performance liquid chromatography (Hoffman et al., 2011).
Ammonia-N content increased, however, as HPLC zein protein subunits in HMC decreased (Hoffman et al., 2011), and ammonia-N was used in combination with mean particle size for modeling the effects of corn maturity, moisture content and extent of silage fermentation on ruminal and total-tract starch digestibilities for HMC at feed out (Hoffman et al., 2012a, b). Ferraretto et al. (2014c), using a data set comprised of 6,131 HMC samples (55 to 80% DM) obtained from a commercial feed analysis laboratory, reported that ammonia-N was positively related to ivStarchD (R
2 =
0.61) and combined, ammonia-N, DM, soluble-CP and
pH provided a good prediction of ivStarchD (adjusted R2
= 0.70). In WPCS fermented for 0, 45, 90, 180, 270, and
360 d, ammonia-N and soluble-CP contents and ivStarch increased over time and soluble CP, but not ammonia-N, was highly correlated with ivStarchD (R
2 =
0.78 versus 0.24; Der Bedrosian et al., 2012). Young et al. (2012) and Windle et al. (2014) reported that increases in WPCS ammonia-N and soluble-CP contents were accompanied by increases in ivStarchD in response to increased time of ensiling and exogenous protease addition.
Ferraretto et al. (2014b) reported on a study where 8 WPCS hybrids (4 BMR and 4 leafy) were ensiled for 0, 30, 120 and 240 d. Fermentation profile, ammonia-N and soluble-CP contents, and ivStarchD were similar for the 2 hybrid types and there was no hybrid type × time of ensiling interaction detected. Increases in WPCS ammonia-N and soluble-CP contents were accompanied by increases in ivStarchD in response to increased time of ensiling. Positive relationships between ivStarchD and ammonia-N (R
2 =
0.67) and soluble-CP (R2 = 0.55) were observed.
Ammonia-N and soluble-CP were both good indicators of ivStarchD in WPCS in this study. It appears that ammonia-N and soluble-CP can be used in models to predict starch digestibility for WPCS as has been done for HMC, however, more research is needed especially with regard to combining the particle size of the kernels in WPCS along with these N measures into predictive models. Additives
Ferraretto et al. (2014a) performed an experiment to evaluate the impact of: 1) exogenous protease addition to rehydrated unensiled and ensiled corn on ivStarchD; and 2) exogenous protease addition or microbial inoculation on fermentation profile and ivStarchD of rehydrated ensiled corn. Exogenous protease addition increased (P = 0.03) ivStarchD in either ensiled or unensiled rehydrated corn, but was more effective in ensiled than unensiled (6.4-% vs. 2.6% units increase, respectively). Inoculation with lactate-producing bacteria did not affect (P = 0.38) ivStarchD. Young et al. (2012) and Windle et al. (2014) observed increased WPCS ivStarchD in response to exogenous protease addition after 45 d of ensiling. Exogenous protease addition increased ivStarchD in HMC after 0, 70 and 140 d of ensiling (Kung et al., 2014). Similar to our results, the magnitude of the difference was greater on 70 and 140 d compared to 0 d. Hoffman et al. (2011) observed no benefits of microbial inoculation on starch digestibility.
We are currently conducting research to determine the effectiveness of exogenous protease addition under varied conditions of hybrid type, moisture content, particle size, and fermentation length as treatments in WPCS. In addition, we are also performing research to evaluate different types of microbial inoculation and its interaction with exogenous protease in HMC.

30
Corn Grain Digestibility
Meta-analysis
Ferraretto et al. (2013) performed a meta-analysis on the effects of corn grain harvest and processing methods on ruminal (RSD) and total-tract nutrient (TTSD) digestibilities, DMI and lactation performance by dairy cows. The RSD approached a trend to be greater (P = 0.12) and TTSD was greater (P = 0.001) for ensiled (ENS) and steam-processed (STM) than dry rolled or ground corn (DRY) in agreement with the previous review of Firkins et al. (2001). These results are likely related to disruption of the protein matrix surrounding starch by heat and moisture during steam treatment or proteolysis during ensiling (Hoffman et al., 2011). The DMI was 1.2 kg/d lower (P = 0.01) for ENS compared to DRY. Milk yield was unaffected by treatment (P = 0.75) and averaged 35.9 kg/d. Consequently, feed conversion (Milk/DMI) was greater (P = 0.001) for ENS than DRY. The FCM yield was greater (P = 0.05) for DRY compared to ENS which may be related to greater (P = 0.01) milk fat concentration for DRY than ENS (3.59 vs. 3.41%). However, FCM feed conversion (FCM/DMI) did not differ (P = 0.32). Milk protein concentration tended to be greater (P = 0.05) for STM than the other treatments and MUN concentration tended (P = 0.08) to be greater for DRY than STM, suggesting better ruminal nitrogen utilization (NRC, 2001) for cows fed STM than DRY. Similar results were reported by Firkins et al. (2001) with greater microbial nitrogen flow to duodenum for cows that were fed STM.
Increased mean particle size (MPS) reduced (P = 0.001) TTSD for both DRY (77.7% to 93.3%) and ENS (89.5% to 95.2%). Increased surface area for bacterial and enzymatic digestion of finer particles and increased passage rate of coarser and denser particles through the gastrointestinal tract may explain the effect of MPS on TTSD. Similar results were reported by Firkins et al. (2001), although the magnitude of the difference was less (85% to 92% TTSD). The MPS did not affect DMI (P = 0.93 and P = 0.95, respectively) or milk yield (P = 0.60 and P = 0.75, respectively) for either DRY or ENS. Similar DMI with a 1.0 kg/d on average increase in milk yield for dry ground and finely-ground corn over dry-rolled corn was reported by Firkins et al. (2001). Milk fat content did not differ (P = 0.30 and P = 0.36, respectively) among MPS treatments for either DRY or ENS. Milk fat content was greater for coarsely ground DRY and ENS in the review of Firkins et al. (2001). The FCM yield and feed conversion were similar among MPS treatments for both DRY (P = 0.67 and P = 0.86, respectively) and ENS (P = 0.70 and P = 0.60, respectively). Likewise, milk protein was unaffected by MPS (P = 0.36 and P = 0.99, respectively). Firkins et al. (2001) reported decreased milk protein concentration for cows fed finely-ground DRY- but not ENS-based diets. The MUN concentrations tended to increase with increasing MPS for DRY (P = 0.07).
Endosperm properties
Kernel vitreousness, the ratio of vitreous to floury endosperm, has been used to assess type of corn endosperm (Ngonyamo-Majee et al., 2008a, b). Increased kernel vitreousness was related to reduced ruminal in situ corn starch degradation (Correa et al., 2002; Ngonyamo-Majee et al., 2008b). Kernel vitreousness was lower and ruminal in situ starch degradation was greater for dry corn with floury or opaque endosperm compared to normal dent endosperm (Ngonyamo-Majee et al., 2008a, b). Taylor and Allen (2005) reported greater ruminal and total tract starch digestibilities in ruminally and duodenally cannulated lactating dairy cows for floury (3% vitreousness) than normal dent (67% vitreousness) endosperm dry corn.
Highly vitreous corn types contain greater concentrations of prolamin proteins than floury or opaque corn types (Larson and Hoffman, 2008). Starch granules in the corn endosperm are surrounded by hydrophobic prolamin proteins which are slowly degraded (McAllister et al., 1993). Lopes et al. (2009) conducted an experiment to evaluate the effect of type of corn endosperm on nutrient digestibility in lactating dairy cows using near-isogenic variants of a normal dent endosperm hybrid carrying floury-2 or opaque-2 alleles. The percentage vitreous endosperm was zero for floury and opaque endosperm corns and 64% for the vitreous corn. Prolamin protein content of floury and opaque endosperm corns was 30% of the content found in vitreous corn. Starch disappearance after 8-hr ruminal in situ incubation was 32%-units on average greater, respectively, for floury and opaque endosperm corns than vitreous corn. Total-tract starch digestibility was 6.3%-units, on average, greater for cows fed diets containing floury and opaque endosperm corns than vitreous corn.
Effects of wide differences in corn grain vitreousness or prolamin, i.e. flinty or vitreous corn versus floury or opaque corn, on starch digestibility have been demonstrated (Correa et al., 2002; Ngonyamo-Majee et al., 2008a, b; Lopes et al., 2009; Taylor and Allen, 2005). However, incorporation of these corn endosperm properties into corn breeding or hybrid selection programs for dairy cattle feed has been, and continues to be, slow to evolve. Until the recent extended period of high corn prices there had not been much interest in increasing starch digestibility by exploiting corn’s genetic traits. Recent interest in feeding reduced-starch diets, however, has spawned a much greater interest in this area. Furthermore, the potential for reduced vitreousness or prolamin corn to reduce the cost and management of corn processing methods and quality control and HMC maturity, moisture content and duration of fermentation is of interest to some in the industry; more research is needed, however, to better evaluate these potential interactions.
While interest has increased along with on-going research, practical challenges to pursuing reduced vitreousness or prolamin corn remain. The relative importance of kernel vitreousness or prolamin appears

31
to be as follows: dry corn > HMC > corn silage. The normal co-mingling of dry corn that occurs through grain elevators and feed industry channels makes it very difficult to alter these parameters at the feed manufacturer or farm level, and HMC and corn silage comprise more of a niche market for the seed corn industry. Incorporation of these parameters into routine corn hybrid selection programs requires NIRS calibrations, which are not available on an industry-wide basis at this point. The potential for pollen drift (Thomison, 2002) to compromise small replicated field plot hybrid evaluations for endosperm properties warrants more scrutiny. Nitrogen fertility can influence the prolamin content of corn grain (Masoero et al., 2011; Tsai et al., 1978), which could confound comparisons of field plot evaluations for this parameter across locations or companies. Important agronomic traits, such as yield and starch content, will also need to be evaluated relative to hybrid differences for vitreousness or prolamin. Much translational research is still needed for progress to be made in this area.
References
Correa, C. E. S., R. D. Shaver, M. N. Pereira, J. G.
Lauer, and K. Kohn. 2002. Relationship between corn vitreousness and ruminal in situ starch degradability. J. Dairy Sci. 85:3008-3012.
Der Bedrosian, M. C., L. Kung, Jr., and K. E. Nestor, Jr. 2012. The effects of hybrid, maturity and length of storage on the composition and nutritive value of corn silage. J. Dairy Sci. 95:5115-5126.
Ferraretto, L. F., and R. D. Shaver. 2012a. Effect of Corn Shredlage™ on lactation performance and total tract starch digestibility by dairy cows. The Prof. Anim. Sci. 28:639-647.
Ferraretto, L. F., and R. D. Shaver. 2012b. Meta-analysis: Impact of corn silage harvest practices on intake, digestion and milk production by dairy cows. The Prof. Anim. Sci. 28:141-149.
Ferraretto, L. F., P. M. Crump, and R. D. Shaver. 2013. Effect of cereal grain type and corn grain harvesting and processing methods on intake, digestion, and milk production by dairy cows through a meta-analysis. J. Dairy Sci. 96:533-550.
Ferraretto, L. F., S. M. Fredin, R. D. Shaver, and P. C. Hoffman. 2014a. Effects of ensiling, exogenous protease addition and inoculation on ruminal in vitro starch digestibility in rehydrated corn. ADSA Annual Mtg. Abstr. In press.
Ferraretto, L. F., R. D. Shaver, S. Massie, R Singo, D.M. Taysom and J.P. Brouillette. 2014b. Effect of ensiling time on fermentation profile and starch digestibility in whole plant corn silage from two different hybrid types. ADSA Annual Mtg. Abstr. In press.
Ferraretto, L. F., K. Taysom, D.M. Taysom, R.D. Shaver, and P.C. Hoffman. 2014c. Relationships between dry
matter content, ensiling, ammonia-nitrogen and ruminal in vitro starch digestibility in high-moisture corn samples. J. Dairy Sci. 97:3221-3227.
Firkins, J. L., M. L. Eastridge, N. R. St-Pierre, and S. M. Noftsger. 2001. Effects of grain variability and processing on starch utilization by lactating dairy cattle. J. Anim. Sci. 79(E. Suppl.): E218-E238.
Hoffman, P. C., N. M. Esser, R. D. Shaver, W. K. Coblentz, M. P. Scott, A. L. Bodnar, R.J. Schmidt and R.C. Charley. 2011. Influence of ensiling time and inoculation on alteration of the starch-protein matrix in high moisture corn. J. Dairy Sci. 94:2465-2474.
Hoffman, P. C., D. R. Mertens, J. Larson, W. K. Coblentz and R. D. Shaver. 2012a. A Query for Effective Mean Particle Size of Dry and High Moisture Corns. J. Dairy Sci. 95: 3467-3477.
Hoffman, P. C., R. Shaver, and D. Mertens. 2012b. Feed Grain 2.0 Evaluation System. Accessed July 12, 2012. http://www.uwex.edu/ces/dairynutrition/documents/FeedGrainV2.0b.xlsx
Kung Jr. L., M. C. Windle, and N. Walker. 2014. The effect of an exogenous protease on the fermentation and nutritive value of high-moisture corn. J. Dairy Sci. 97:1707-1712.
Larson, J., and P. C. Hoffman. 2008. Technical Note: A method to quantify prolamin proteins in corn that are negatively related to starch digestibility in ruminants. J. Dairy Sci. 91:4834-4839.
Lopes, J. C., R. D. Shaver, P. C. Hoffman, M. S. Akins, S. J. Bertics, H. Gencoglu, and J. G. Coors. 2009. Type of corn endosperm influences nutrient digestibility in lactating dairy cows. J. Dairy Sci. 92:4541–4548.
Masoero, F., A. Gallo, C. Zanfi, G. Giuberti, and M.Spanghero. 2011. Effect of nitrogen fertilization on chemical composition and rumen fermentation of different parts of plants of three corn hybrids. Anim. Feed Sci. Technol. 164:207-216.
McAllistar, T. A., R. C. Phillippe, L. M. Rode, and K. J. Cheng. 1993. Effect of the protein matrix on the digestion of cereal grains by ruminal microorganisms. J. Anim. Sci. 71:205-212.
Ngonyamo-Majee, D., R. D. Shaver, J. G. Coors, D. Sapienza, C. E. S. Correa, J. G. Lauer and P. Berzaghi. 2008a. Relationships between kernel vitreousness and dry matter degradability for diverse corn germplasm. I. Development of near-infrared reflectance spectroscopy calibrations. Anim. Feed Sci. Technol. 142:247-258.
Ngonyamo-Majee, D., R. D. Shaver, J. G. Coors, D. Sapienza and J. G. Lauer. 2008b. Relationships between kernel vitreousness and dry matter degradability for diverse corn germplasm. II. Ruminal

32
and post-ruminal degradabilities. Anim. Feed Sci. Technol. 142:259-274.
National Research Council. 2001. Nutrient Requirements of Dairy Cattle. 7th Revised ed. National Academy Press, Washington, D.C.
Taylor, C. C., and M. S. Allen. 2005. Corn grain endosperm type and brown midrib 3 corn silage: Site of digestion and ruminal digestion kinetics in lactating cows. J. Dairy Sci. 88:1413-1424.
Thomison, P. R. 2002. Managing pollen drift in seed maize production. Pages 166-171 in Proc. International Seed Seminar: Trade, Production and Technology. Santiago, Chile. Accessed April 1, 2011. http://www.seedconsortium.org/PUC/pdf%20files/27=Managing%20pollen%20drift%20in%20maize%20seed%20production.pdf
Tsai, C. Y., D. M. Huber, and H. L. Warren. 1978. Relationship of the kernel sink for N to maize productivity. Crop. Sci. 18:399-404.
Windle, M. C., N. Walker, and L. Kung Jr. 2014. Effects of an exogenous protease on the fermentation and nutritive value of corn silage harvested at different dry matter contents and ensiled for various lengths of time. J. Dairy Sci. 97:3053-3060.
Young, K. M., J. M. Lim, M. C. Der Bedrosian, and L. Kung Jr. 2012. Effect of exogenous protease enzymes on the fermentation and nutritive value of corn silage. J. Dairy Sc. 95:6687-6694.

33
Metabolic response of dairy cows to ruminal starch digestion products
Shawn S. Donkin
Department of Animal Sciences. Purdue University
West Lafayette, USA [email protected]
Introduction
Starch and other simple carbohydrates play an
important role in optimizing rumen fermentation and the provision of fermentation endproducts to the dairy cow. The energy and protein status of the cow is dependent on an efficient fermentation that yields the correct profile of endproducts to match the metabolic needs of the cow for efficient conversion to milk, tissue repair, accumulation of body reserves, and growth of the developing calf. The quantity and profile of the fermentation endproducts, their postruminal digestion and net absorption ultimately determines the profile of nutrients available to the cow. The ultimate value of dietary starch for dairy cattle is the combined impact on rumen fermentation, digestion in the small intestine, and fermentation in the cecum and colon. Many intrinsic and extrinsic factors impact the location and magnitude of starch degradation in each compartment of the ruminant gastrointestinal tract and consequently alter the profile of nutrients derived from dietary starch. Shifts in the site of digestion not only affect the efficiency are starch utilization but ultimately impacts the metabolism of the dairy cow. Grain type and processing has a profound impact in this regard. This review will integrate knowledge of the regulation of site of digestion with metabolism for the products of starch digestion and relationship to milk production, milk composition, and animal health.
Sites of starch digestion and digestion endproducts
The completeness of digestion of starch by rumen
microbes in diets fed to dairy cattle is a function of the starch content of feeds, the matrix that surrounds starch granules in grain, residence time in the rumen and several other diet and animal factors. Starch content in diets for dairy cattle range from less than 20% for dry cows to more than 35% in diets fed to lactating cow rations. Likewise starch content varies among grains commonly fed to dairy cattle. Wheat contains the highest amounts of starch (77%), sorghum and corn are intermediate (72%) and barley and oats contain the lowest quantities (57%). The content of starch within each grain source and digestibility by rumen microbes is a function of variety (or hybrid), growing season, and grain processing. These factors
affect both the rates and extent of ruminal digestibility and therefore the amount and profile of VFA produced. Starch embedded in the protein matrix of grain, as is the case for flint corn, display slower rates of starch disappearance in the rumen and lower gastrointestinal tract (Philippeau et al., 2000). Consequently the complexity of intrinsic properties of the grain itself, rumen kinetics, grain processing, intake level, and interaction with other diet ingredients all impact ruminal starch digestion and profile and yield of VFA per g of starch fermented. As a result estimates of the digestion of starch in the rumen of dairy cows varies from less than 50% to greater than 90%. Part of the challenge in precision feeding systems for dairy cattle and other ruminants is accurately and repeatably predicting the rumen (and postruminal) degradation of starch and impact on animal performance.
Much of the work on rumen fermentation end product stoichiometry has focused on predicting the substrates fermented to achieve a specific pattern of VFA and associated yield of bacteria, protozoa, accumulation of CO2, methane and losses of additional energy as heat. These stoichiometric models are determined by the effects of bacterial profile (amylolytic, fibrolytic, and cellulolytic), protozoa numbers, pH and a host of other factors that impact fermentation efficiency and end product formation. The addition of starch to diets fed to dairy cattle results in a greater proportion of propionate and butyrate in the rumen at the expense of acetate and a reduction in fiber digestion, decreased ammonia concentration, increased production of organic acids and decreased acetate to propionate ratio (Oba and Allen, 2003 a,b,c). The molar proportions of VFAs in the rumen are the balance of VFA production and absorption (Noziere et al., 2010). Despite our basic understanding of the impact of starch on rumen fermentation patterns and general knowledge of the impact of processing and intake on ruminal starch degradation there is a lack of precision in models that predict the site of starch digestion in dairy cattle diets. As will be described below the site of fermentation of starch in the gastrointestinal tract of dairy cattle and other ruminants may play a dominant role in determining overall energetic efficiency and in directing post absorptive metabolism.

34
Intestinal starch digestion and endproduct absorption
There is considerable dietary starch that can
escape rumen degradation. The level of escape depends on starch type, processing, feed intake level and associated rumen kinetics, and feed intake patterns. Estimates of ruminal starch digestibility, as a % of intake, can range from low 50’s to mid-90s for corn, sorghum, wheat, oats, and barley (Huntington, 1997; Larsen et al., 2009). Likewise postruminal digestibility can vary just as much however total tract starch digestibility is often in excess of 95% (Huntington, 1997; Larsen et al., 2009). Consequently there is considerable potential for the endproducts of starch digestion to differ and therefore alter post absorptive metabolism and response to starch in the diet.
Starch that escapes rumen fermentation can be digested in the small intestine and absorbed as glucose or escape enzymatic hydrolysis to be fermented in the cecum and colon to yield VFA, CO2, methane, heat and bacterial protein. Digestion of starch in the small intestine begins with the action of pancreatic α-amylase to initiate starch breakdown to maltose (linear chain of 2 glucose units) and α -limit dextans (branched chains of glucose units).
There has been considerable debate regarding adequate activity of pancreatic α-amylase in cattle to achieve efficient starch degradation in the small intestine. Several studies indicate that the intestinal capacity for starch digestion in dairy cattle is considerable and ranges between 40 and 85% of the starch present in the small intestine (Huntington et al., 2006; Krekemeier and Harmon, 1995). The lower estimates are determined with high starch intakes consequently the mass of starch digested to glucose in the small intestine is a function of dietary starch intake and rumen escape. The low values for starch digestion suggest a limit to total pancreatic α-amylase in cattle that can be overwhelmed with enough starch flowing to the small intestine. Increased dietary starch in rodents is accompanied by increased starch digestion however this adaptation is not observed with postruminal starch infusion in cattle.
Although there is considerable capacity for starch digestion in the small intestine of dairy cattle several lines of evidence suggest inflexibility in ruminants with regard to adaptations in pancreatic α-amylase secretion. In several cases this may limit intestinal starch degradation. Infusion of 1.5 kg/d of corn starch into the abomasum resulted in 56% digestion of starch in the small intestine (Abramson et al., 2002). When infusion of casein protein is included with starch the digestibility in the small intestine increased from 56 to 83% (Abramson et al., 2002) however this effect appears to be transient and postruminal starch appears to down regulate mRNA expression and secretion of α-amylase (Swanson et al., 2004; Harmon 2009). This suggest an adaptive response in ruminants to reduce the capacity for intestinal starch degradation and shift the site
of starch digestion to the cecum and colon with increasing starch escape from the rumen.
Maltose and α-limit dextran units that are the products of α-amylase activity in the lumen of the intestine and additional digestion to free glucose occurs in the brush border membrane of the intestinal epithelium. There is considerable maltase and isomaltase activity that act to release free glucose at the surface of the epithelium. These enzymes also do not appear to adapt to the presence of postruminal starch supply (Krekemeier et al., 1990; Russell et al., 1981). Studies comparing glucose, starch and dextrin infusion in Holstein steers indicate that the activity of alpha-1,4 glucosidase activity, a brush border associated enzyme that hydrolyses dextran to glucose molecules, poses a rate-limiting step for starch digestion in the small intestine of cattle (Krekemeier and Harmon, 1995) especially in the terminal ileum region.
The final step in starch digestion in the small intestine is transport of glucose across the intestinal epithelial cells. The primary route for glucose transport in intestinal epithelial cells is facilitated by the sodium dependent glucose transporter one (SGLUT1). This high-affinity glucose transporter protein is located on the luminal surface of the enterocyte to couple glucose transport inward and is linked to the cellular sodium gradient. The latter is maintained by sodium/potassium ATPase located in the basolateral membrane of the enterocyte (Ferraris, 2001). Transport to blood through the apical membrane is facilitated by glucose transporter 2 (GLUT2). Studies in rat intestine have shown that GLUT2 is also present at the brush-border membrane and may mediate fructose (and glucose) transport (Ferraris, 2001) but this has not been confirmed in ruminants. Although developmental adaptations have been observed for SGLT1 in ruminants (Dyer et al., 1994) and rats (Ferraris, 2001) it does not appear that ruminants respond to additional postruminal starch by upregulating SGLT1 capacity (Rodriguez et al., 2004). However the lack of adaptation may be of little consequence as 96% of the glucose infused at 40 g/h for 10 h disappeared from the intestine as net glucose absorption in 300- to 400-kg steers. Furthermore the capacity for glucose absorption in dairy cattle in early lactation may show net adaptability due to the increased length and therefore greater number of epithelium (Baldwin et al., 2004) and absorptive capacity for glucose in the small intestine of dairy cattle.
Site of digestion and impact an energetic efficiency and production
Postruminal starch digestion results in a partial
efficiency of starch utilization that is estimated to be 25% greater than efficiency of starch fermentation and absorption of resulting VFA (Armstrong et al., 1960). This difference in efficiency is due to loss of carbon as methane and CO2 during conversion of starch to VFA and in the production of microbial mass. Additional losses are due to microbial maintenance energy costs and losses due to

35
heat. While the hydrolysis of starch and absorption of glucose also incur some of these energetic costs the net gain from direct absorption of glucose is greater than observed a consequence of fermentation and absorption of VFA.
Starch sources that are processed to increase ruminal digestibility such as steam flaking (compared to dry rolling) resulted in greater milk production, greater productive efficiency partly due to greater total tract starch digestibility and enhanced microbial protein production with the same level of starch intake (Theurer et al., 1999). This would suggest that factors related to inefficient rumen fermentation may limit productive efficiency in the case of dry rolled grains.
Studies that compare the impact of ruminal and postruminal infusion of starch tend to avoid the issue of impact of processing on starch degradation and therefore permit a more direct comparison of the site of starch delivery. Incremental increases in starch infusion of 700, 1400 and 2100 g/d for at least 10 d increased milk linearly but milk fat was reduced so that the energetic efficacy of production was not different (Reynolds et al., 2001). Other studies show a similar response to postruminal starch infusion and a corresponding decrease in intake (Rigout et al., 2003). In several cases milk protein is increased with starch infusion while fat percent and yield is decreased. Similar responses are seen with postruminal glucose infusion (Rigout et al., 2003).
Abomasal infusion of starch over a 14 d period in late lactation cows increased N retention in tissue and reduced urinary N loss (Reynolds et al., 2001) so that 85% of the metabolizable energy supplied by starch could be accounted for as body tissue deposition as fat and protein (Reynolds et al., 2001). Similar increases in body tissue deposition are seen when glucose is infused in early lactation dairy cows. As outlined above, starch or glucose fermented in the rumen results in an increase in propionate production relative to acetate. Increased ruminal starch fermentation and the associated increases in propionate supply is often linked to greater milk yield. This is observed when dry rolled corn is compared with steam flaked corn which has greater rumen degradation (Theurer et al., 1999). Therefore it would appear that glucose absorbed from postruminal starch digestion has a unique impact on metabolism to promote tissue deposition. It has been suggested that omental adipose tissue is the site of this energy storage in response to increased postruminal starch and glucose supply. The significance of this shift is not apparent but is should be noted that this fat depot represents one of the most dynamic and prevalent depots in the dairy cow.
Role in glucose metabolism
The importance of hepatic gluconeogenesis in
ruminants is underscored by the lack of intestinal glucose absorption and because it is the major pathway for maintaining adequate glucose supply for the mammary
gland. Greater than 90% of whole animal glucose requirements are met through endogenous glucose production. The main substrates for glucose synthesis in fed ruminants are lactate, propionate and amino acids. Glycerol, from adipose tissue, can also contribute carbon for glucose synthesis during feed restriction and energy deficiency. Propionate contributes approximately 50% of the carbon for gluconeogenesis while lactate or amino acids contribute 10-15% each (Aschenbach et al., 2010).
Several lines of evidence indicate that there is extensive digestion of starch in the small intestine of dairy cows and therefore the potential for a positive effect on the glucose economy of the dairy cow. Numerous studies indicate that the net flux of glucose from the portal drained viscera (PDV; gut, pancreas, spleen and associated adipose tissue) is zero (Reynolds, 2006). Postruminal starch recovered as PDV glucose ranges between 15 and 67% and recovery of glucose from 56 to 76%.
Propionate is the primary precursor of glucose in ruminants and accounts for 60 to 70 % of the glucose for lactating dairy cows. The remaining 30 to 40% of the glucose needs are supplied by amino acids, lactate and glycerol mobilized by adipose tissue. The latter is likely only of significant during early lactation while adipose stores are being mobilized and provides approximately 45 g of glucose precursor for every kg of adipose tissue triglyceride mobilized.
Lactate and alanine are metabolized to pyruvate that is transported into the mitochondria and carboxylated to oxaloacetate by PC. Oxaloacetate can be metabolized to phosphoenolpyruvate (PEP) by PEPCK or metabolized in the TCA cycle. In turn, PEP carbon can be metabolized to glycerol-3 phosphate (G3P) or recycled to pyruvate via pyruvate kinase (PK). Although the pathway of propionate metabolism to glucose does not directly rely on PC, there is substantial evidence of a broader role of PC and PEPCK that links gluconeogenesis and TCA cycle activity (Burgess et al., 2004; Burgess et al., 2007).
Oxaloacetate (OAA) is the key TCA cycle intermediate responsible for facilitating efficient rates of carbon metabolism for fatty acid metabolism and gluconeogenesis. Oxaloacetate condenses with acetyl CoA, the end product of β-oxidation of fatty acids, in the first step of oxidation in the TCA cycle. And, OAA is the primary substrate for the gluconeogenic enzyme phosphoenolpyruvate carboxykinase (PEPCK). The synthesis of OAA is controlled by PC activity. Consequently, the capacity for both gluconeogenesis and fatty acid oxidation, therefore, depends on the OAA status of the cell which is ultimately determined by the relative activities of PC and PEPCK. Previous work from our laboratory demonstrated that PC activity is controlled by activation of the PC gene promoter in response to fatty acids and the transition to lactation. More recent work indicates that PEPCK is regulated by propionate at the level of control of the gene promoter. Consequently diets and grain processing that promote ruminal starch

36
digestion will favor increased gluconeogenic capacity from propionate.
We examined the expression of PC and PEPCK mRNA (Greenfield et al., 2000; Hartwell et al., 2001) and activity of these enzymes (Greenfield et al., 2000; Agca et al., 2002) in liver biopsy samples from transition cows during feed restriction (Velez and Donkin, 2005) and with bovine somatotropin (bST) administration (Velez and Donkin, 2004). We identified a 4- to 5-fold increase in PC expression in liver at calving that is mirrored by changes in enzyme activity (Greenfield et al., 2000) and reflects increased capacity for gluconeogenesis from lactate (Velez and Donkin, 2005). We have determined that PC, but not PEPCK, is elevated during feed restriction (Velez and Donkin, 2005) and that PEPCK, but not PC, is elevated with bST (Velez and Donkin, 2004).
An increase in PEPCK with increased feed intake after calving (Greenfield et al., 2000) and monensin feeding (Karcher et al., 2007) and effects of propionate to induce PEPCK in rat hepatocytes (Massillon et al., 2003) prompted us to examine the role of propionate in controlling PEPCK expression in bovine. We infused propionate to augment the estimated supply from rumen production by 25% or infused glucose on an energy equivalent basis. After 8 h of infusion liver biopsy samples were collected and analyzed for PC and PEPCK. Propionate infusion maintained PEPCK mRNA, in spite of increased insulin concentrations, whereas PEPCK mRNA was decreased by 50% with glucose infusion. These data confirm our previous observation of propionate induction of PEPCK in neonatal calves (Donkin et al., 2009). We further tested the effects of propionate using H4IIE hepatoma cells that were transfected with the bovine PEPCK promoter linked to luciferase reporter gene and determined a dominant effect of propionate on PEPCK transcription. These combined data clearly establish propionate as a dominate regulator of PEPCK expression in bovine.
The removal rate of propionate by liver appears to be directly proportional to its supply from the PDV whereas the lactate and amino acids are sensitive to the supply of other precursors and to the effects of insulin and glucagon (Donkin and Armentano, 1994). Lactate in particular can be is diverted from liver when propionate supply is enhanced. Diets that contain greater proportions of energy as starch yield additional ruminal propionate production and gluconeogenesis (Huntington et al., 2006). It is interesting to note that insulin acts reduce glucose production from all precursors except propionate and the extraction of propionate increases with insulin level (Eisemann and Huntington, 1994) so that gluconeogenesis is high despite high energy status and elevated insulin concentrations. This glucose paradox in ruminants is partially explained by the ability of propionate to regulate its own metabolism by enhancing the rate of transcription of the PEPCK gene in liver and therefore determining the metabolic fate of propionate (Zhang et al., 2013)
Impact of starch digestion on regulation of intake
The relationship between propionate and feed
intake in dairy cattle has been the subject of several reviews and recent investigations which have spawned the development of the hepatic oxidation theory (HOT theory) (Allen et al., 2009; Allen and Piantoni, 2013; Stocks and Allen, 2014). The HOT theory suggests that propionate induces accumulation of acetyl CoA in liver as part of the process to regulate feed intake when highly fermentative diets are fed. This observation is consistent with our observations regarding the impact of propionate to alter TCA cycle flux by activating of PEPCK to draw down the OAA concentration and impair the oxidative capacity of the cell. However, we propose that propionate induces PEPCK relative to PC to precipitate this OAA reduction and reduction in TCA cycle oxidative capacity thus leading to an accumulation of acetyl CoA. Simultaneous activation of PC and PEPCK may serve to avoid the reduction in intake observed in response to elevated propionate in response to feeding diets rich in starch.
Summary and implications for future work
There appears to be considerable capacity for starch digestion in the rumen, small intestine and hindgut of dairy cattle. Grain processing and grain type determine the predominate site of digestion. Energetic efficiency of dietary starch is determined by the site starch digestion and profile of absorbed nutrients. Absorption of glucose from starch digested in the small intestine increases glucose supply to the cow, but appears to be used primarily to support intestinal metabolism local and fat and protein synthesis, and not greater milk production. Greater propionate absorption from rumen and hindgut fermentation drives gluconeogenesis at the molecular level to increase glucose supply despite elevated insulin and other metabolic signals that signal a contrary outcome. Taken together the site of starch digestion results in endproduct absorption that is has markedly different impacts on whole animal energetic efficiency, intermediary metabolism and production potential. More systematic prediction of the site of starch digestion is needed to refine feeding recommendations that integrate advanced knowledge of starch digestion process in predicting animal performance and health.
References
Abramson, S. M., I. Bruckental, S. Zamwel, and A. Arieli. 2002. Effect of abomasally infused casein on post-ruminal digestibility of total non-structural carbohydrates and milk yield and composition in dairy cows. Anim. Sci. 74: 347–355.

37
Agca, C, R. B. Greenfield, J. R. Hartwell, and S. S. Donkin. 2002. Cloning and characterization of bovine cytosolic and mitochondrial PEPCK during transition to lactation. Physiol Genomics. 11:53-63.
Allen M. S, and P. Piantoni. 2013. Metabolic control of feed intake: implications for metabolic disease of fresh cows.Vet Clin North Am Food Anim Pract. 29:279-97
Allen M. S, B. J. Bradford, and M. Oba. 2009. Board Invited Review: The hepatic oxidation theory of the control of feed intake and its application to ruminants. J. Anim. Sci. 87:3317-34.
Armstrong, D. A., K. L. Blaxter., Graham, and N. McC. 1960. Fat synthesis from glucose by sheep. Proc. Nutr. Soc.19, xxxi–xxxii.
Aschenbach J. R, N. B. Kristensen, S. S. Donkin, H. M. Hammon, and G. B. Penner. 2010. Gluconeogenesis in dairy cows: the secret of making sweet milk from sour dough. IUBMB Life. 62:869-77.
Baldwin R. L., VI, K. R. McLeod, and A. V. Capuco. 2004. Visceral Tissue Growth and Proliferation During the Bovine Lactation Cycle. Dairy Sci. 87:2977–2986.
Burgess S. C, N. Hausler, M. Merritt, F. M Jeffrey, C. Storey, A. Milde, S. Koshy, J. Lindner, M. A. Magnuson, C. R. Malloy, and A. D Sherry. 2004. Impaired tricarboxylic acid cycle activity in mouse livers lacking cytosolic phosphoenolpyruvate carboxykinase. J. Biol. Chem. 279: 48941-48949.
Burgess S. C, T. He, Z. Yan, J. Lindner, A.D. Sherry, C. R Malloy, J. D. Browning, and M. A. Magnuson. 2007. Cytosolic phosphoenolpyruvate carboxykinase does not solely control the rate of hepatic gluconeogenesis in the intact mouse liver. Cell Metab. 4:313-320.
Donkin, S. S., E. Cedeño, and S. L. Koser. 2009. Effect of propionate infusion on hepatic PEPCK and glucose-6-phosphatase expression in neonatal Holstein calves. J. Dairy Sci. 92(Suppl 1):70.
Donkin, S. S. and L. E. Armentano. 1994. Regulation of gluconeogenesis by insulin and glucagon in the neonatal bovine. Am. J. Physiol. 266:1229-1237.
Dyer, J., D. Scott, R. B. Beechey, A. D. Care, S. K. Abbas, and S. P. Shirazi-Beechey. 1994. Dietary regulation of intestinal glucose transport. In Mammalian brush border membrane proteins (Lentze, M. J., R. J. Grand, and H. Y. Naim, eds.), 65-72.
Eisemann, J. H., and G. B Huntington. 1994. Metabolite flux across portal-drained viscera, liver, and hindquarters of hyperinsulinemic, euglycemic beef steers. J. Animal Sci. 72: 2919-2929.
Ferraris, R. P. 2001. Dietary and developmental regulation of intestinal sugar transport. Biochem. J. 360:265 -276.
Greenfield, R. B., M. J. Cecava, and S. S. Donkin. 2000. Changes in mRNA expression of gluconeogenic enzymes in liver of dairy cattle during the transition to lactation. J. Dairy Sci. 83:1228-1236.
Harmon, D. L. Understanding Starch Utilization in the Small Intestine of Cattle. 2009. Asian-Aust. J. Anim. Sci. 22: 915 – 922.
Hartwell, J. R., M. J. Cecava, and S. S. Donkin. 2001. Impact of rumen undegradable protein and rumen-protected choline on mRNA expression for enzymes in gluconeogenesis and ureagenesis in liver of periparturient dairy cows. J. Dairy Sci. 84:490-497.
Huntington, G. B. 1997. Starch utilization by ruminants: From basics to the bunk. J. Anim. Sci. 75:852-867.
Huntington G. B., D. L Harmon, and C. J. Richards. 2006. Sites, rates, and limits of starch digestion and glucose metabolism in growing cattle. J. Anim. Sci. 84:14-24.
Karcher, E. L., M. M. Pickett, G. A. Varga, and S. S. Donkin. 2007. Effect of dietary carbohydrate and monensin on expression of gluconeogenic enzymes in liver of transition Dairy Cows. J. Anim. Sci. 85:690-699.
Kreikemeier, K. K., D. L. Harmon, J. P. Peters, K. L. Gross, C. K. Armendariz and C. R. Krehbiel. 1990. Influence of dietary forage and feed intake on carbohydrase activities and small intestinal morphology of calves. J. Anim. Sci. 68:2916-2929.
Kreikemeier, K. K., and D. L. Harmon. 1995. Abomasal glucose, maize starch and maize dextrin infusions in cattle: Small intestinal disappearance, net portal glucose flux and ileal oligosaccharide flow. Br. J. Nutr. 73:763-772.
Larsen, M., P. Lund, M. R. Weisbjerg, and T. Hvelplund. 2009. Digestion site of starch from cereals and legumes in lactating dairy cows. Anim. Feed Sci. Technol. 153: 236-248.
Massillon, D., I. J. Arinze, C. Xu, and F. Bone. 2003. Regulation of glucose-6-phosphatase gene expression in cultured hepatocytes and H4IIE cells by short-chain fatty acids: role of hepatic nuclear factor-4alpha. J. Biol. Chem. 278:40694-40701.
Nozière, P., I. Ortigues-Marty, C. Loncke, and D. Sauvant. 2010. Carbohydrate quantitative digestion and absorption in ruminants: from feed starch and fibre to nutrients available for tissues. Animal. 4:1057-1074
Oba, M., and M. S. Allen. 2003a. Effects of corn grain conservation method on feeding behavior and productivity of lactating dairy cows at two dietary starch concentrations. J. Dairy Sci. 86:174–183.
Oba, M., and M. S. Allen. 2003b. Effects of corn grain conservation method on ruminal digestion kinetics for

38
lactating dairy cows at two dietary starch concentrations. J. Dairy Sci. 86:184–194.
Oba, M., and M. S. Allen. 2003c. Effects of diet fermentability of microbial nitrogen production in lactating dairy cows. J. Dairy Sci. 86:195–207.
Philippeau, C., J. Landry, and B. Michalet-Doreau. 2000. Influence of the protein distribution of maize endosperm on ruminal starch degradability. J. Sci. Food Agric. 80:404–408.
Reynolds, C. K., S. B. Cammell, D. J. Humphries, D. E. Beever, J. D. Sutton, and J. R. Newbold. 2001. Effects of post-rumen starch infusion on milk production and energy metabolism in dairy cows. J. Dairy Sci. 84:2250-2259.
Reynolds, C. K. 2001. Production and metabolic effects of site of starch digestion in dairy cattle. Anim. Feed Sci. Technol. 130:8–9
Rigout, S., C. Hurtaud, S. Lemosquet, A. Bach, and H. Rulquin. 2003. Lactational effect of propionic acid and duodenal glucose in cows. J. Dairy Sci. 86:243-253.
Rodriguez, S. M., K. C. Guimaraes, J. C. Matthews, K. R. McLeod, R. L. Baldwin, and D. L. Harmon. 2004. Influence of abomasal carbohydrates on small intestinal sodium-dependent glucose cotransporter activity and abundance in steers. J. Anim. Sci. 82:3015-3023.
Russell J. R, A. W. Young, N. A. Jorgensen. 1981. Effect dietary corn starch intake on pancreatic amylase and intestinal maltase and pH in cattle. J. Anim. Sci. 52:1177-1182.
Stocks S. E., and M. S Allen. 2014. Effects of lipid and propionic acid infusions on feed intake of lactating dairy cows. J. Dairy Sci. 97:2297-2304.
Swanson, K. C., J. A. Benson, J. C. Matthews and D. L. Harmon. 2004. Pancreatic exocrine secretion and plasma concentration of some gastrointestinal hormones in response to abomasal infusion of starch hydrolyzate and/or casein. J. Anim. Sci. 82:1781-1787.
Theurer, C. B. J. T. Huber, A. Delgado-Elorduy, and R. Wanderley. 1999. Invited Review: Summary of Steam-Flaking Corn or Sorghum Grain for Lactating Dairy Cows. J. Dairy Sci. 82:1950–1959.
Velez, J. C., and S. S. Donkin. 2004. Bovine Somatotropin Increases Hepatic Phosphoenolpyruvate Carboxykinase mRNA in Lactating Dairy Cows. J. Dairy Sci. 87:1325-1335.
Velez, J. C., and S. S. Donkin. 2005. Partial feed restriction induces pyruvate carboxylase RNA but not phosphoenolpyruvate carboxykinase in liver of lactating dairy cattle. J. Dairy. Sci. 88:2938-2948.
Zhang, Q., H. A. Tucker, K. E. Boesche, J. E. Sibray, S. L. Koser, S. S. Donkin. 2013. Effect of postruminal propionate infusion on expression of key genes for gluconeogenesis in the liver of lactating dairy cows. J. Dairy Sci. 96(E-Suppl. 1):48.

39
Effect of Starch Type on Optimizing Amino Acids in Diets of Dairy Cows
Chuck Schwab1, Phil Cardoso2, Gary Foster3 and Ryan Higgs4
1Schwab Consulting, LLC
Professor Emeritus of Animal Sciences. University of New Hampshire Durham, USA
[email protected] 2Department of Animal Sciences. University of Illinois
Urbana, USA 3Central Valley Nutritional Associates, LLC
Visalia, USA
4Department of Animal Sciences. Cornell University Ithaca, USA
Introduction
“Starch makes milk” is an often heard statement
from field nutritionists. This makes sense because starch (and sugar) feeding increases propionate production, propionate is the primary glucogenic volatile fatty acid, glucose is used by the mammary gland to produce lactose, and lactose is the principal determinant of milk yield. As a dense source of readily fermentable organic matter, starch is also an important energy source for rumen microbial growth and synthesis of microbial protein. Rumen microbial protein is a preferred source of absorbed AA, and both research and field experience indicate that maximizing its supply requires mixing and matching feedstuffs to achieve an optimal balance of fermentable carbohydrates (starch, sugars, pectins and digestible fiber), effective fiber, and rumen degradable protein (RDP). Fermentable carbohydrates provide the energy and RDP provides the ammonia and AA that are required for microbial growth and protein synthesis. When starch is digested in the small intestine, it’s a source of absorbed glucose. Absorbed glucose also provides benefits, including sparing the use of absorbed AA for glucose synthesis. In this case, AA are conserved for milk protein synthesis.
Less appreciated is the effect that starch can have on optimizing AA usage for milk protein production. The purpose of this paper is to review experiments that examined the effect of providing different amounts and types of starch on the AA status of lactating cows and to examine the use of two commonly used nutritional models to determine the potential impact of feeding different types of starch on optimizing AA nutrition and cow performance.
Effect of starch amount on the AA status of lactating dairy cows
In a classic study, Broderick (2003) fed three
levels of NFC (37, 41 and 46% of diet DM) and three levels of CP (15.1, 16.7 and 18.4%) to mid-lactation cows. Cows were blocked by parity and days in milk into seven groups of nine and assigned to an incomplete 9 x 9 Latin square trail with four, 4-wk periods. Diets were formulated from alfalfa and corn silages, high moisture corn, soybean meal, minerals and vitamins. Forage was 60% alfalfa and 40% corn silage on all diets; NFC contents of 37, 41 and 46% were obtained by feeding 75, 63 and 50% forage, respectively. Dietary CP contents of 15.1, 16.7 and 18.4% were obtained by replacing high-moisture corn with soybean meal. Effects of NFC were not confounded by CP. Increasing NFC resulted in linear increases in BW gain, yield of milk and milk components (except fat), milk protein percentage, milk/DM intake and milk N/N intake ratios, and linear decreases in milk fat percentage, milk urea and urinary N excretion. In contrast, increasing CP from 15.1 to 18.4% had only small positive effects on milk and milk protein yield but reduced milk N from 31 to 25% of dietary N and increased urinary N from 23 to 35% of dietary N.
Fanchone et al. (2013) examined the effects of 2 levels of dietary CP (11.0 and 14.3%) and 2 levels of starch (15.2 and 30.7%) on N partitioning, ruminal N metabolism, and digestion. Four Holstein cows, fitted with ruminal, duodenal and ileal cannula, were used in a 4 x 4 Latin square design. The cows were 71 + 10 DIM at the start of the experiment. The 2 dietary levels of CP and starch were obtained by maintaining the same amounts of corn silage (40.5%), hay (10.0%) and dehydrated alfalfa (9.0%) in all diets but varying the amounts of molasses-supplemented chopped wheat straw, cereal-based

39
concentrate (39% barley, 46% wheat, and 15% corn), soybean hulls, beet pulp, soybean meal, and urea. High starch feeding decreased rumen ammonia concentrations, tended to decrease rumen pH but only with the low CP diet (6.4 vs. 6.6), increased duodenal non-ammonia N flows, tended to increase microbial N flows to the duodenum (average increase was 55 g), decreased rumen protein balance (from an average of +7.2 to – 13.4 g CP/kg DM intake), and tended to increase efficiency of microbial protein synthesis (from 22.3 to 27.1 g N/kg OM fermented). The negative rumen protein balance indicates increased N recycling from the blood. As expected, additional starch feeding tended to increase passage of all AA to the small intestine. Milk protein concentrations were also increased with high starch (from 2.83 to 3.04%) and milk N/feed N tended to be higher (0.28 vs. 0.26). As usually observed, feeding more CP had no effect on milk protein content. The authors concluded that the high-starch diets resulted in better recycling of N and better use of rumen ammonia.
Cabrita et al. (2007) also examined the effects of 2 levels of dietary CP (14 and 16%) and 2 levels of starch (15 and 25%). Twelve Holstein cows averaging 77 DIM and 39 kg/d of milk at the start of the experiment were used. Cows were assigned to three Latin squares. Diets contained 45% corn silage, 5% chopped wheat straw and 50% concentrate. The different dietary CP and starch levels were achieved mainly by increasing soybean meal in the high-CP diets and by substituting corn grain for citrus pulp in the high-starch diets. Significant CP x starch treatment interactions resulted for DM intake, milk yield, milk protein percentage and lactose yield with the low-CP low-starch diet having the lowest reported values. The authors concluded this was probably due to a shortage of both RDP to rumen microbes and glucogenic nutrients (propionate, AA, and absorbed glucose) to the animal. The high starch diets decreased plasma urea and increased plasma glucose, insulin and total protein concentrations.
Cantalapiedra-Hijar et al. (2014) sought to determine if the increase in milk protein associated with diets rich in starch is at least partially due to changes in splanchnic (portal-drained viscera and liver) AA metabolism and if these changes depended upon dietary CP content. Four isoenergetic diets were formulated that differed in CP (12.0 and 16.5%) and starch (4.4 and 34.5%) content. Differences in CP and starch content were obtained by varying the proportional contributions of most dietary feedstuffs (grass silage, grass hay, dehydrated corn plant pellets, corn, barley, wheat, wheat bran, soybean hulls, citrus pulp, beet pulp, tannin-treated soybean meal and urea). Five mid-lactation multi-catheterized Jersey cows were used in a 4 x 4 Latin square design. Increased starch feeding: 1) increased milk protein yield (+7%), 2) increased milk N/N intake (0.322 vs. 0.298), 3) lowered net portal appearance (i.e., less available to tissues other than splanchnic tissues) of acetate, total VFA and B-hydroxybutyrate and increased net portal appearance of oxygen, glucose, butyrate, and
insulin, and 4) increased the percentage of N intake that was recovered as total AA in the portal vein (51.4 vs. 42.3%) but without greater recovery of the main AA used as energy fuels by the portal drained viscera (Glu, Gln, and Asp). While more total AA appeared in the portal vein, there were no observed differences in hepatic use, resulting in a 22% higher splanchnic release. Thus, the authors concluded that the higher transfer of N from feed to milk with diets rich in starch is not the consequence of a direct sparing AA effect of glucogenic diets but rather the result of lower energy requirements by the portal drained viscera along with a higher microbial N flow to the duodenum.
These and several other experiments indicate that feeding more starch increases microbial protein synthesis and increases the efficiency of use of dietary N. Therefore, as long as RDP is adequate, milk protein yield will continue to increase until production is suppressed by adverse ruminal effects of excessive NFC intake (Oliveira et al., 1993). It has been concluded that increasing the proportion of starch in the diet, while reducing the proportion of NDF, can lead to improvements in N utilization as great as that achieved by reducing CP to below 15% of diet DM (Sinclair et al., 2014).
Effect of starch type on the AA status of lactating dairy cows
Starch type affects the site, rate and extent of its
digestion. While the bonds between the glucose units are readily cleaved by bacterial and mammalian enzymes, the starch is packaged in granules that are embedded in a protein matrix in the seed endosperm, which varies in solubility and resistance to digestion (Kotarski et al., 1992; McAllister et al., 1993). These differences in endosperm type have great effects on rumen starch fermentability, which varies from less than 30% to more than 90% - depending on the type and physical form of the grain (Nocek and Tamminga, 1991; Firkins et al., 2001). With respect to corn, the hard-textured corn hybrids (having the most highly vitreous endosperm) are the least digestible in the rumen whereas those with a floury more “open” endosperm are the most digestible (Correa et al., 2002; Ngonyamo-Majee et al., 2008; Taylor and Allen, 2005).
In addition to endosperm type, ruminal fermentability of starch is also affected by grain processing (e.g., rolling, grinding, and steam-flaking), conservation method (dry or ensiled), ration composition, and the physiological status of the cow. Reducing the mean particle size of corn grain increases starch digestibility (Firkins et al., 2001) by increasing the surface area for bacterial attachment or enzymatic degradation (Huntington, 1997). Ensiling high-moisture corn (Hoffman et al., 2011) or steam treatment of dry corn (Rooney and Pflugfelder, 1986), breaks down the hydrophobic starch-protein matrix, allowing for a corresponding increase in starch digestibility (Owens et al., 1986; Theurer et al., 1999; Firkins et al., 2001).
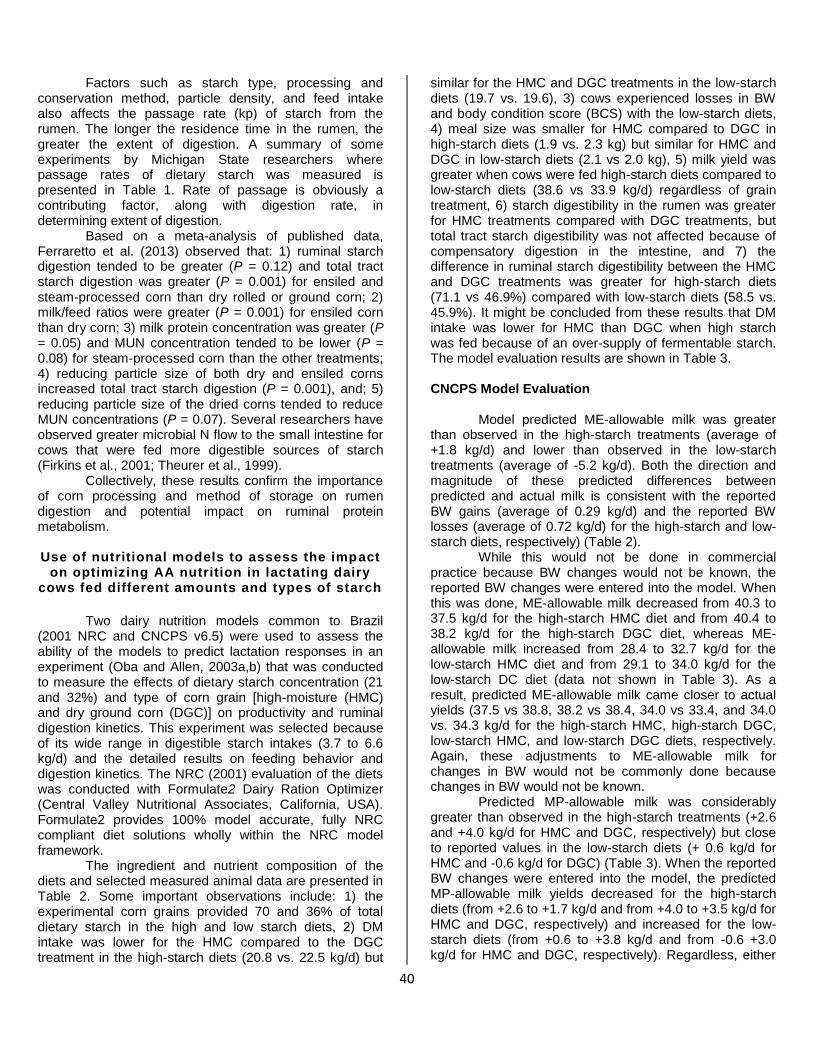
40
Factors such as starch type, processing and conservation method, particle density, and feed intake also affects the passage rate (kp) of starch from the rumen. The longer the residence time in the rumen, the greater the extent of digestion. A summary of some experiments by Michigan State researchers where passage rates of dietary starch was measured is presented in Table 1. Rate of passage is obviously a contributing factor, along with digestion rate, in determining extent of digestion.
Based on a meta-analysis of published data, Ferraretto et al. (2013) observed that: 1) ruminal starch digestion tended to be greater (P = 0.12) and total tract starch digestion was greater (P = 0.001) for ensiled and steam-processed corn than dry rolled or ground corn; 2) milk/feed ratios were greater (P = 0.001) for ensiled corn than dry corn; 3) milk protein concentration was greater (P = 0.05) and MUN concentration tended to be lower (P = 0.08) for steam-processed corn than the other treatments; 4) reducing particle size of both dry and ensiled corns increased total tract starch digestion (P = 0.001), and; 5) reducing particle size of the dried corns tended to reduce MUN concentrations (P = 0.07). Several researchers have observed greater microbial N flow to the small intestine for cows that were fed more digestible sources of starch (Firkins et al., 2001; Theurer et al., 1999).
Collectively, these results confirm the importance of corn processing and method of storage on rumen digestion and potential impact on ruminal protein metabolism. Use of nutritional models to assess the impact
on optimizing AA nutrition in lactating dairy cows fed different amounts and types of starch
Two dairy nutrition models common to Brazil
(2001 NRC and CNCPS v6.5) were used to assess the ability of the models to predict lactation responses in an experiment (Oba and Allen, 2003a,b) that was conducted to measure the effects of dietary starch concentration (21 and 32%) and type of corn grain [high-moisture (HMC) and dry ground corn (DGC)] on productivity and ruminal digestion kinetics. This experiment was selected because of its wide range in digestible starch intakes (3.7 to 6.6 kg/d) and the detailed results on feeding behavior and digestion kinetics. The NRC (2001) evaluation of the diets was conducted with Formulate2 Dairy Ration Optimizer (Central Valley Nutritional Associates, California, USA). Formulate2 provides 100% model accurate, fully NRC compliant diet solutions wholly within the NRC model framework.
The ingredient and nutrient composition of the diets and selected measured animal data are presented in Table 2. Some important observations include: 1) the experimental corn grains provided 70 and 36% of total dietary starch in the high and low starch diets, 2) DM intake was lower for the HMC compared to the DGC treatment in the high-starch diets (20.8 vs. 22.5 kg/d) but
similar for the HMC and DGC treatments in the low-starch diets (19.7 vs. 19.6), 3) cows experienced losses in BW and body condition score (BCS) with the low-starch diets, 4) meal size was smaller for HMC compared to DGC in high-starch diets (1.9 vs. 2.3 kg) but similar for HMC and DGC in low-starch diets (2.1 vs 2.0 kg), 5) milk yield was greater when cows were fed high-starch diets compared to low-starch diets (38.6 vs 33.9 kg/d) regardless of grain treatment, 6) starch digestibility in the rumen was greater for HMC treatments compared with DGC treatments, but total tract starch digestibility was not affected because of compensatory digestion in the intestine, and 7) the difference in ruminal starch digestibility between the HMC and DGC treatments was greater for high-starch diets (71.1 vs 46.9%) compared with low-starch diets (58.5 vs. 45.9%). It might be concluded from these results that DM intake was lower for HMC than DGC when high starch was fed because of an over-supply of fermentable starch. The model evaluation results are shown in Table 3. CNCPS Model Evaluation
Model predicted ME-allowable milk was greater than observed in the high-starch treatments (average of +1.8 kg/d) and lower than observed in the low-starch treatments (average of -5.2 kg/d). Both the direction and magnitude of these predicted differences between predicted and actual milk is consistent with the reported BW gains (average of 0.29 kg/d) and the reported BW losses (average of 0.72 kg/d) for the high-starch and low-starch diets, respectively) (Table 2).
While this would not be done in commercial practice because BW changes would not be known, the reported BW changes were entered into the model. When this was done, ME-allowable milk decreased from 40.3 to 37.5 kg/d for the high-starch HMC diet and from 40.4 to 38.2 kg/d for the high-starch DGC diet, whereas ME-allowable milk increased from 28.4 to 32.7 kg/d for the low-starch HMC diet and from 29.1 to 34.0 kg/d for the low-starch DC diet (data not shown in Table 3). As a result, predicted ME-allowable milk came closer to actual yields (37.5 vs 38.8, 38.2 vs 38.4, 34.0 vs 33.4, and 34.0 vs. 34.3 kg/d for the high-starch HMC, high-starch DGC, low-starch HMC, and low-starch DGC diets, respectively. Again, these adjustments to ME-allowable milk for changes in BW would not be commonly done because changes in BW would not be known.
Predicted MP-allowable milk was considerably greater than observed in the high-starch treatments (+2.6 and +4.0 kg/d for HMC and DGC, respectively) but close to reported values in the low-starch diets (+ 0.6 kg/d for HMC and -0.6 kg/d for DGC) (Table 3). When the reported BW changes were entered into the model, the predicted MP-allowable milk yields decreased for the high-starch diets (from +2.6 to +1.7 kg/d and from +4.0 to +3.5 kg/d for HMC and DGC, respectively) and increased for the low-starch diets (from +0.6 to +3.8 kg/d and from -0.6 +3.0 kg/d for HMC and DGC, respectively). Regardless, either

41
way of calculating MP-allowable milk indicated that other than for the low-starch DGC diet, ration RUP was oversupplied.
High moisture corn has a higher rate of digestion than dried ground corn in the CNCPS feed dictionary (35 vs 15%/h, respectively). This resulted in the higher predicted yield for microbial MP for HMC than for DGC in both the high-starch (1131 vs 1040 g/d) and low-starch (1018 vs 964) diets (Table 3). This was most pronounced in the high-starch treatment where corn grain had higher dietary inclusion. The predicted microbial MP/starch intake ratio was higher for the HMC treatments because of the higher levels of predicted starch digestion in the rumen (Table 3). This demonstrates the behavior of the CNCPS when different types of starch are fed.
As noted in Table 2, Oba and Allen (2003b) measured slower passage rates for starch in the HMC treatments (17 and 14%/h for the high and low starch diets) than in the DGC treatments (21 and 18%/h for the high and low starch diets). The CNCPS uses different passage rates for forages, concentrates and soluble material, but does not differentiate based on other feed characteristics such as viscosity or specific gravity. Factors such as these may well have affected the passage rates in the study by Oba and Allen (2003b). Slower passage rates for the HMC diets could be expected to have further increased the extent of starch digestion and contributed to the cows producing as much milk with the high-starch HMC diet (38.8 kg/d) as they did with the high-starch DGC diet (38.4 kg/d), even though DM intake was significantly lower (20.8 vs 22.5 kg/d). NRC (2001) (Formulate2) Model Evaluation
The default NRC processing adjustment factors (PAF) for HMC and DGC were used in the diet evaluations. Model predicted NEl-allowable milk was nearly “spot on” relative to actual milk for both high-starch diets (38.3 vs 38.8 and 38.8 vs 38.4 kg/d for HMC and DGC, respectively). However, the model under-predicted NEl-allowable milk for both of the low-starch diets (29.7 vs 33.4 and 30.4 vs 34.3 kg/d for HMC and DGC, respectively). These under-predictions of NEl-allowable milk for the low-starch diets indicates a possible BW loss, and that occurred.
Like the CNCPS model, the NRC model predicted BW gain with the high-starch diets and BW loss with the low-starch diets. Therefore, both models predicted an undersupply of fermentable carbohydrates with the low starch diets, indicating the diets needed more fermentable carbohydrates (e.g., starch) and less NDF. It is noteworthy that DM intakes were significantly lower for the two low-starch diets as compared to the high-starch DGC diet. As noted earlier, DM intake was probably lower for the high-starch HMC diet than for the high-starch DGC diet because of too much fermentable starch.
The microbial MP/starch intake ratio averaged 0.18 for the high-starch diets and 0.25 for the low-starch
diets. These predicted microbial MP/starch intake ratios are similar to those predicted by the CNCPS model; 0.17 and 0.24, respectively.
Like the CNCPS model, the NRC model also predicted an oversupply of MP for all diets. These predictions are probably accurate as all diets contained 18% CP or more (Table 2). Moreover, both models predicted an over-supply of RDP. For NRC, the average over-supplies were 247 g/d for the high-starch diets and 442 g/d for the low-starch diets. Neither plasma nor milk urea N concentrations were reported, but both were probably higher than current target values.
Even though the NRC model predicted an oversupply of MP for all diets, it was of interest to evaluate the diets for MP-Met allowable milk, adjusted for differences in milk true protein, using Formulate2. It is understood that MP is merely the sum total of predicted absorbed AA, and that in its prediction of supply (or requirements), no consideration is given to AA balance; therefore, its true adequacy for meeting the needs of the most limiting AA for protein synthesis and animal production is not known.
Researchers at the University of New Hampshire, after the release of the model, observed that the model predicted true protein yield from MP more accurately than milk yield, and that true protein yield was predicted more accurately from predicted supplies of the most limiting AA (Met or Lys) than from MP (Schwab et al., 2004). These observations resulted from entering over 300 diets published in the Journal of Dairy Science into the model. The model evaluation results were then reviewed to increase the likelihood that Met or Lys were the most limiting factors to animal productivity. Measured milk and milk protein yields from the selected experiments were then regressed on model-predicted supplies of MP-Lys and MP-Met. This exercise produced normal looking dose-response plots that showed changes in milk and milk true protein yield relative to model-predicted flows of MP, MP-Lys and MP-Met; but most importantly, it yielded equations that could be used to generate MP-Lys and MP-Met requirements for stipulated yields of milk and milk protein. These equations, therefore, provide the basis for what is called the “Amino Acid Calculator” in Formulate2. Because it is the most accurate yield prediction of the model, predicted true protein yield is used to work back to a more accurate milk yield, at any given milk true protein percentage. As one might expect, because milk protein levels vary, this approach to predicting milk yield is more accurate than predicting milk yield “directly” from MP, or from MP-Met or MP-Lys.
The model-predicted Lys/Met ratio in MP of the high starch and low starch diets averaged 3.54/1 and 3.65/1, respectively. A ratio greater than 3.0/1 indicates that Met is more limiting than Lys. Therefore, model-predicted yields of MP-“Met” allowable milk were calculated. Predicted yields were 37.5, 40.4, 32.9, and 33.6 kg/d for the high-starch HMC and DGC diets and the low-starch HMC and DGC diets, respectively. The actual

42
milk yields for the same diets were 38.8, 38.4, 33.4, and 34.3 kg/d. These MP-Met predicted milk yields are within -1.3, +2.0, -0.5, and -0.7 kg/d of actual yields and more closely align to actual yields than MP-allowable milk, indicating that MP supplies were not excessive, at least for the high-starch DGC diet and the two low-starch diets.
Field experience has shown that milk yield predictions based on MP-Met predicted true protein yield from diets that are low to mid-range in starch content generally correlate very well with actual on-farm milk yields. Because of this proven predictive reliability in the field, on those occasions where there is significant disparity between true protein predicted milk yield and actual milk yield, adjustments to the NRC predicted microbial CP yield can be made to reconcile the two and thus account for significant changes in rumen fermentation.
In summary, both models predicted the impact on milk yield and BW change of feeding high-starch vs low-starch diets to early and mid-lactation cows. Both nutritional models indicated a surplus of rumen available N for microbial cell growth and synthesis of microbial protein.
Conclusions
Increasing starch supply, either by increased
feeding or by increasing rumen and intestinal digestibility of that which is fed, can be expected to increase AA availability to the mammary gland (and other peripheral tissues) because of variable increases in intestinal AA supply (because of increased microbial protein synthesis), a reduced AA need for glucose synthesis and a reduced need for AA as energy-sources for splanchnic tissues. Both ration formulation models predicted the primary directional changes in animal performance that resulted from feeding the high and low starch diets in the experiment by Oba and Allen (2003a,b).
References
Allen, M. 2013. Adjust dietary starch throughout lactation. Feedstuffs, April 29.
Allen, M. S., R. A. Longuski and Y. Ying. 2008. Endosperm type of dry ground corn affects ruminal and total tract digestion of starch in lactating dairy cows. J. Dairy Sci. 91(E Suppl):529.
Broderick, G. A. 2003. Effects of varying dietary protein and energy levels on the production of lactating dairy cows. J. Dairy Sci. 86:1370-1381.
Cabrita, A. R. J., R. J. B. Bessa, S. P. Alves, R. J. Dewhurst, and A. J. M. Fonseca. 2007. Effects of dietary protein and starch on intake, milk production, and milk fatty acid profiles of dairy cows fed corn silage-based diets. J. Dairy Sci. 90:1429-1439.
Cantalapiedra-Hijar, G., S. Lemosquet, J. M. Rodriguez-Lopez, F. Messad, and I. Ortigues-Marty. 2014. Diets rich in starch increase the posthepatic availability of aminoacids in dairy cows fed diets at low and normal protein levels. J. Dairy Sci. 97:5151-5166.
Correa, C. E. S., R. D. Shaver, M. N. Pereira, J. G. Lauer, and K. Kohn. 2002. Relationship between corn vitreousness and ruminal in situ starch degradability. J. Dairy Sci. 85:3008-3012.
Fanchone, A., P. Noziere, J. Portelli, B. Duriot, V. Largeau, and M. Doreau. 2013. Effects of nitrogen underfeeding and energy source on nitrogen ruminal metabolism, digestion, and nitrogen partitioning in dairy cows. J. Anim. Sci. 91:895-906.
Ferraretto, L. F., P. M. Crump, and R. D. Shaver. 2013. Effect of cereal grain type and corn grain harvesting and processing methods on intake, digestion, and milk production by dairy cows through a meta-analysis. J. Dairy Sci. 96:533-550.
Firkins, J. L., M. L. Eastridge, N. R. St-Pierre, and S. M. Noftsger. 2001. Effects of grain variability and processing on starch utilization by lactating dairy cattle. J. Anim. Sci. 79(E. Suppl.): 218-238.
Hoffman, P. C., N. M. Esser, R. D. Shaver, W. K. Coblentz, M. P. Scott, A. L. Bodnar, R. J. Schmidt and R. C. Charley. 2011. Influence of ensiling time and inoculation on alteration of the starch-protein matrix in high moisture corn. J. Dairy Sci. 94:2465-2474.
Huntington, G. B. 1997. Starch utilization by ruminants: From basics to the bunk. J. Anim. Sci. 75:852-867.
Kotarski, S. F., R. D. Waniska and K. K. Thurn. 1992. Starch hydrolysis by the ruminal microflora. J. Nutr. 122:178.
McAllister, T. A., R. C. Phillippe, L. M. Rode, and K. J. Cheng. 1993. Effect of the protein matrix on the digestion of cereal grains by ruminal microorganisms. J. Anim. Sci. 71:205–212.
Ngonyamo-Majee, D., R. D. Shaver, J. G. Coors, D. Sapienza and J. G. Lauer. 2008b. Relationships between kernel vitreousness and dry matter degradability for diverse corn germplasm. II. Ruminal and post-ruminal degradabilities. Anim. Feed Sci. Technol. 142:259-274.
Nocek, J. E., and S. Tamminga. 1991. Site of digestion of starch in the gastrointestinal tract of dairy cows and its effect on milk and composition. J. Dairy Sci. 74:3598-3629.
NRC. 2001. Nutrient Requirements of Dairy Cattle. 7th rev. ed. Natl. Acad. Sci., Washington, DC.

43
Oba, M., and M. S. Allen. 2000a. Effects of brown midrib 3 mutation in corn silage on productivity of dairy cows fed two concentrations of dietary neutral detergent fiber: 3. Digestibility and microbial efficiency. J. Dairy Sci. 83:1350-1358.
Oba, M., and M. S. Allen. 2003b. Effects of corn grain conservation method on ruminal digestion kinetics for lactating dairy cows at two dietary starch concentrations. J. Dairy Sci. 86:184-194.
Oliveira, J. S., J. T. Huber, D. Ben-Ghedalia, R. S. Swingle, C. B.Theurer, and M. Pessarakali. 1993. Influence of sorghum grain processing on performance of lactating dairy cows. J. Dairy Sci. 76:575-581.
Owens, F. N., R. A. Zinn, and Y. K. Kim. 1986. Limits to starch digestion in the ruminant small intestine. J. Anim. Sci. 63:1634-1648.
Rooney, L. W., and R. L. Pflugfelder. 1986. Factors affecting starch digestibility with special emphasis on sorghum and corn. J. Anim. Sci. 63:1607-1623.
Schwab, C. G, R. S. Ordway, and N. L. Whitehouse. 2004. Amino acid balancing in the context of MP and RUP requirements. In: Proc. 15
th Annual Florida Ruminant
Nutrition Conf. p 10-25.
Sinclair, K. D. 2014. Reducing dietary protein in dairy cow diets: implications for nitrogen utilization, milk production, welfare and fertility. Animal. 8:2. p 262-274.
Taylor, C. C., and M. S. Allen. 2005b. Corn grain endosperm type and brown midrib 3 corn silage: Site of digestion and ruminal kinetics in lactating cows. J. Dairy Sci. 88:1413–1424.
Theurer, C. B., J. T. Huber, A. Delgado-Elorduy, and R. Wanderley. 1999. Invited review: Summary of steam-flaking corn or sorghum grain for lactating dairy cows. J. Dairy Sci. 82:1950-1959.
Voelker, J. A., and M. S. Allen. 2003. Pelleted beet pulp substituted for high-moisture corn: 2. Effects on digestion and ruminal digestion kinetics in lactating dairy cows. J. Dairy Sci. 86:3553-3561.
Ying, Y., and M. S. Allen. 2005. Effects of corn grain endosperm type and conservation method on site of digestion, ruminal digestion kinetics and microbial nitrogen production in lactating cows. J. Dairy Sci. 88:393.
Table 1. Effect of dietary treatment on passage rate (kp) of starch from the rumen (Allen, 2013).
Experiment Treatment Kp, %/h P-value
Oba and Allen, 2000b Bm3 corn silage 12.9 0.02
Control corn silage 10.6
29% diet NDF 14.5 <0.01
38% diet NDF 9.0
Oba and Allen, 2003 High-moisture corn 15.4 0.07
Dry ground corn 19.7
Voelker and Allen, 2003b High-moisture corn 15.9 0.01
24% beet pulp 23.5
Ying and Allen, 2005 High-moisture corn 7.1 <0.01
Dry ground corn 16.3
Vitreous endosperm 16.0 <0.01
Floury endosperm 7.5
Taylor and Allen, 2005 Vitreous endosperm 21.2 0.10
Floury endosperm 16.2
Allen et al., 2008 Vitreous endosperm 25.7 <0.01
Floury endosperm 16.0
Note: Kp were determined by dividing duodenal flux (g/h) by rumen pool size (g) and multiplying by 100.

44
Table 2. Ingredient and nutrient composition of diets and animal productivity (Oba and Allen, 2003b).
High starch Low starch P-value
Item HMC1 DGC
2 HMC DGC Starch
3 Corn
4 INT
5
Diet ingredients, %DM
HM 32.0 - 11.0 -
DG - 31.6 - 10.8
Corn silage 20.8 20.9 31.8 32.0
Alfalfa silage 22.2 22.3 34.0 34.1
Protein mix 21.4 21.5 19.5 19.5
Min and vit 3.6 3.7 3.7 3.6
Composition, %DM
DM 48.8 53.0 42.8 43.8
Starch 31.1 32.2 21.0 21.3
NDF 23.1 24.2 30.1 30.5
ADF 15.2 15.4 20.8 20.9
Lignin 2.2 2.2 3.3 3.3
CP 18.0 18.0 18.3 18.3
EE 5.2 5.5 4.8 4.9
Forage NDF 16.5 16.5 25.3 25.4
Grain starch, %total 69 70 35 36
Productivity
DM intake, kg 20.8b 22.5
a 19.7
b 19.6
b <0.001 0.12 0.07
Milk, kg/d 38.8 38.4 33.4 34.3 <0.001 0.78 0.45
Milk fat, % 3.05b 3.59
a 3.95
a 3.73
a <0.01 0.37 0.06
Milk protein, % 2.98a 3.02
a 2.94
ab 2.87
b <0.01 0.67 0.07
Milk lactose, % 4.93 4.93 4.83 4.87 <0.001 0.21 0.42
BW change, kg/d 0.36 0.21 -0.68 -0.80 <0.01 0.76 0.83
BCS change in 21 days 0.10 0.04 -0.09 -0.12 <0.01 0.76 0.83
Starch digestility
Starch intake, kg/d 6.2b 7.0
a 3.9
c 4.1
c <0.001 <0.001 <0.01
Rumen dig, % 71 47 59 46 <0.08 <0.001 0.13
Intestinal dig, % 86 90 84 87 0.13 0.06 0.99
Total tract dig, % 96 94 93 93 <0.01 0.16 0.26
Starch digestion kinetics
Ruminal kd, %/h 28 15 17 12 <0.001 <0.001 <0.01
Ruminal kp, %/h 17 21 14 18 0.20 0.07 0.95
Feeding behavior
Meal size, kg 1.9b 2.3
a 2.1
c 2.0
c 0.53 0.21 0.06
Eating time, min/d 253 260 300 287 <0.001 0.77 0.38
Chewing time, min/d 427 438 493 478 <0.001 0.87 0.31
Plasma metabolites
Glucose, mg/dl 61.0 60.7 59.6 57.8 <0.01 0.53 0.76
Insulin, uIU/ml 14.8 13.6 11.1 10.3 <0.001 0.54 0.51
Ruminal pH 6.12 6.13 6.25 6.32 <0.01 0.41 0.48
1MM =high-moisture corn.
2DG = dry ground corn.
3Starch = effect of dietary starch concentration.
4Corn = effect of conservation method of
corn. 5INT = interaction of dietary starch concentration and conservation method of corn.

45
Table 3. Model evaluation of Oba and Allen (2003) diets.
High starch Low starch
HMC DGC HMC DGC
DM intake, kg/d 20.8 22.5 19.7 19.6
CNCPS v6.5 evaluation
Actual milk, kg/d 38.8 38.4 33.4 34.3
ME milk, kg/d 40.3 40.4 28.4 29.1
MP milk, kg/d 41.4 42.4 34.0 33.7
Microbial MP, g/d 1131 1044 1018 964
RUP MP, g/d 1378 1602 1192 1199
Total MP, g/d 2509 2646 2210 2163
Actual BW change, kg/d +0.36 +0.21 -0.68 -0.80
Predicted BW change, kg/d +0.22 +0.33 -0.85 -0.88
Starch digested in rumen, % 82 71 83 79
Starch kd for treatment feed, %/h 35.0 15.0 35.0 15.0
Predicted starch kp, %/h 6.95 7.42 6.37 6.34
Microbial MP:Starch intake 0.18 0.15 0.24 0.23
Microbial MP, % total MP 45 39 46 45
NRC (2001) evaluation using Formulate21
Actual milk, kg/d 38.8 38.4 33.4 34.3
NEl milk, kg/d 38.3 38.8 29.7 30.4
MP milk, kg/d 40.4 44.3 35.1 35.9
Microbial MP, g/d 1184 1261 1072 1073
RUP MP, g/d 1129 1287 975 976
Endogenous MP, g/d 98 107 100 93
Total MP, g/d 2411 2655 2147 2142
Actual BW change, kg/d +0.36 +0.21 -0.68 -0.80
Predicted BW change, kg/d +0.30 +0.05 -0.23 -0.70
Microbial MP:Starch intake 0.18 0.18 0.26 0.25
Microbial MP, % total MP 49 48 50 50 1The PAF of corn silage for all diets was adjusted from 0.94 to 1.00.

46
Accounting for Differences in Starch Digestibility Using the NRC 2001 Model
Gary N. Foster
Central Valley Nutritional Associates, LLC
Visalia, USA [email protected]
Introduction
Within the NRC (2001) model as published, starch
is not directly considered by the model’s prediction equations. The evaluation software provided with the published model does not have a field for starch in the nutrient profiles of feeds. Rather, starch is aggregated together with other associated carbohydrate types under the designation of non-fiber carbohydrates (NFC).
For feeds that have significant starch content; starch constitutes the vast majority of truly digestible NFC (tdNFC) and therefore has substantial influence on the calculation of TDN1x. However, starch digestibility varies among starch sources due to the degree of vitreous endosperm present in different varieties of corn grain and also as a result of processing and or ensiling. Therefore, extent of digestion is not uniform across starch sources. In addition, factors that affect digestibility can also shift the site of starch digestion. It would appear then that differences in starch type and digestion site can have implications that extend beyond the intended scope TDN1x.
The equation for truly digestible NFC (tdNFC) is: tdNFC = 0.98 (100 – ((NDF – NDICP) + CP + EE
+ Ash)) x PAF The coefficient of 0.98 is based on the assumption
that expected true digestibility of NFC at 1X maintenance is about 0.98. Recognizing that the majority of NFC in cereal grains and grain silages is starch, and that physical processing (e.g., grinding) and heat and steam treatment of high starch feeds (e.g., bakery byproducts, cereal grains, and corn silage) often increases starch digestibility, an empirical approach was used to adjust the tdNFC values. Based on in vivo starch digestibility data, a processing adjustment factor (PAF) was developed (Table 1) (NRC, 2001; pg 14-15).
As the form of the tdNFC equation illustrates, though the calculation of PAF values is derived from in vivo starch digestibility, within the model, PAF is applied to total NFC rather than specifically to its starch component (NRC, 2001; pg 14)
For those feeds that have a significant NFC component, tdNFC is a primary factor in determining TDN at maintenance level intake (TDN1x). Consequently, it is
the calculation of TDN1x that is influenced by the PAF value.
As discussed in the following section of this paper, the NRC prediction of microbial crude protein yield (MCP) yield is made in two stages. The initial prediction of yield is made from total tract digestible organic matter (TTDOM) which within the NRC paradigm is discounted TDN1x. It is this initial MCP yield prediction that is influenced by the digestibility of the diet (NRC, 2001; pg 55-58)
Though total tract digestion of starch may remain relatively constant, the site of digestion may be significantly shifted to the rumen when starch containing feeds are subject to processing or conservation methods that substantially break down grain endosperm thus making starch granules more accessible to rumen microbes (Steam flaking, ensiling, grinding etc). Consequently, either increasing dietary starch content or employing starch sources with greater rumen fermentability, such as high moisture corn (HMC), has the potential to increase rumen fermentation, increase MCP yield and thus increase milk yield (Schwab et al., 2014)
Two questions then present themselves regarding how to address differences in ruminal starch digestibility within an animal model that only addresses rumen fermented organic matter (RFOM) indirectly.
1) Is the intended scope of PAF sufficient to align predicted and actual milk yields when feeding highly fermentable starch sources is accompanied with increased milk yield?
2) If the needed adjustments are beyond the scope of PAF, are other model compliant means available at formulation time to appropriately address them?
PAF, TND1x, TNDp, RDP and MCP Yield
In exploring approaches to predicted MCP yield,
the NRC committee concluded that, “Ruminally fermented organic matter (RFOM) is not practical to use as a direct index of available energy for microbial growth as there are not adequate means by which rumen fermentability of an individual feedstuff or diet can be predicted” (NRC, 2001; pg 58)

47
Note that the qualifier “not practical” is the basis for the disqualifying RFOM as a predictor of “energy for microbial growth”. This issue of practicality was illustrated by a review of experiments where dairy cows were fed diets containing as much as 7 percent added dietary fat which had the effect of reducing the rumen fermentability of the diets without affecting MCP production. (NRC, 2001; pg 58) This is a quintessential illustration of living biology dynamically adapting to changing circumstances by becoming more efficient at what needs to be done.
The committee concluded: “Because the increase in efficiency of microbial protein synthesis was due to a reduction in fermented OM (RFOM) and not an increase in microbial N synthesis, TTDOM was used as an indirect indicator of fermentable energy” (NRC, 2001; pg 58) Total tract digestible organic matter (TTDOM) is defined as discounted TDN which is compositionally determined TDN1x discounted to account for depression in digestibility at multiples of maintenance level intake (NRC, 2001; pg 58)
Consequently, the NRC prediction of microbial yield, on the energy side, is not directly driven by predicting rumen fermented organic matter (RFOM).
RDP and MCP Yield
In addition to available energy, NRC also considers the role of rumen available N in microbial protein synthesis.
During their review of the literature dataset used to develop equations for predicting MCP yield, the committee noted that, “Within the literature data set, there was a large range in measured efficiencies of microbial protein synthesis (12-54 g microbial N/kg rumen fermented OM). The wide range in measured efficiencies of microbial protein synthesis explains why fermented OM (RFOM) was a poor indicator of microbial N passage to the duodenum” (NRC, 2001; pg 56).
It was concluded that: “Because of the variability in efficiency of microbial protein synthesis systems driven by fermented energy alone or by indirect indicators of fermented energy such as TDN or NEl would not be accurate enough to predict passage of microbial N to the duodenum unless at least some of the variability was accounted for in efficiency of microbial protein synthesis. An important factor affecting efficiency of microbial protein synthesis is the relative availability of N for fermentation” (NRC, 2001; pg 56) Consequently, within the NRC paradigm, dietary RDP supply must be adequate to support TTDOM predicted MCP yield. Otherwise, MCP yield is determined by dietary RDP supply. Actual vs. Predicted Milk Yield (Oba and Allen,
2003b)
Table 2 illustrates NRC (2001) MP predicted milk
yields compared to measured results from Oba and Allen (2003b). The published NRC PAF adjustments for high
moisture (HMC) and dried ground corn (DGC) were used in the diet evaluations. As the table illustrates, NE(l) allowable milk was essentially in line with actual milk yields of the high starch diets and lower than the actual milk yield of the low starch diets. The lower NE(l) predicted milk of the low starch diets correlates with the weight loss reported for animals on these diets. While MP predicted milk was similar to actual milk yields of the low starch diets and the high starch HMC diet, milk yield of the high starch DGC diet was over predicted.
Consequently, while NRC MP predicted and actual milk yields of the low starch diets with starch from both HMC and GC are relatively well aligned, the high starch DGC diet would require a significant direct negative adjustment to the MCP yield prediction to align predicted and actual milk yields. To accomplish that with PAF would require adjustments to PAF values that would have to be extreme in order to reduce predicted MCP yield sufficient to align milk yields. Because of their extreme nature, such adjustments would significantly mischaracterize a feed with respect to TDN1x.
Using Predicted Intestinal AA Supplies to Predict Milk Yield
Fortunately, there is another approach available
for addressing changes in milk yield when significant changes in rumen fermentation occur, and it can be used most effectively when balancing diets for AA content.
Researchers at the University of New Hampshire observed that the yield most accurately predicted by the NRC model is milk true protein (TP). And, that milk TP is more precisely predicted by from predicted intestinal supplies of lysine (Lys) and methionine (Met) than by metabolizable protein (MP). (Schwab et al., 2004) These observations resulted from post NRC work where over 300 diets published in the Journal of Dairy Science were entered into the model and reviewed. Measured milk and milk protein yields from the experiments were then correlated with the model predicted supplies of MP-Lys and MP-Met that produced them. Plots of these supply-response relationships provide yield equations that can be used to generate MP-Lys and MP-Met requirements for stipulated milk and milk protein yields. Because it is the most accurate yield prediction of the model, predicted TP yield can then be used to work back to a more accurate milk yield, at any given milk TP percentage. This is more accurate than predicting milk yield directly from supplies of MP-Met or MP-Lys (Schwab et al., 2014a,b)
Both the plots of predicted versus measured supplies of MP-Lys and MP-Met in the published model and other more recent evaluations of predicted vs. measured EAA supplies indicate that on a gram basis MP-Met is more accurately predicted by NRC than gram supplies of MP-Lys (NRC, 2001; pg 17; Pacheco et al., 2012; Schwab et al., 2014b)
Field experience has shown that milk yield predictions based on MP-Met predicted TP yield from diets

48
that are low to upper mid-range in starch content generally correlate very well with actual on-farm milk yields. Because of this proven predictive reliability in the field, on those occasions where there is significant disparity between MP-Met allowable TP-adjusted milk yield and actual milk yield, adjustments to the NRC predicted MCP yield can be made to reconcile the two and thus account for significant changes in rumen fermentation. The two Oba and Allen high starch diets are cases worth considering.
Table 3 below shows the actual milk yields and the MP-Met allowable TP-adjusted milk yields calculated from the reported TP yields. The four highlighted rows indicate the adjustments required to align predicted and actual milk yields. The vertical highlighted columns show the adjustment values as a percentage of the NRC MCP yield prediction.
A review of the high starch DGC diet data in Table2 indicates that when a significant starch load was fed (32% DM) and the starch source was less fermentable than HMC, as in the high starch DGC diet, NRC over predicted MCP yield and therefore MP-Met. With respect to this diet, a 6.0% reduction in MCP yield (94.0%) would be required to align MP-Met TP predicted milk with actual milk yield.
Conversely, the data for the high starch HMC diet indicates that NRC under predicted MCP yield necessitating a positive MCP yield adjustment of 5.4% (105.4%). The magnitude of the required adjustments for these diets would seem to indicate that either scenario is outside the scope of what PAF can reasonably accommodate.
Adjust or Not Adjust
From a practical standpoint, the more
conservative approach with respect to adjusting the MCP yield of the high starch HMC diet would be to forego making the adjustment and consider the additional MCP yield as an offset to possible future changes in the HMC fed (i.e., new bag or stack). While that might create a higher cost diet because the increased MCP yield is not considered at formulation time, it does insulate against formulating the diet based on MCP yield that may be transient.
Conversely, because the high starch DGC diet requires a negative MCP yield adjustment, it is a scenario where making the adjustment is the conservative approach. In this case adjusting MCP yield is conservative because the TP based milk yield prediction has been made assuming microbial yield that isn’t evidenced by the relationship between TP predicted milk and actual milk yields.
As these evaluations indicate, cows are never under obligation to perform according to any animal model. It is theoretical biology that bears the burden of accurately describing what living biology does. Consequently, the types of adjustments discussed here
and the methods for making them must be driven by field observations. In field experience, nothing is more important than cow listening. All animal models provide a starting point. However, the true efficacy of that starting point must be, and indeed will be, verified by the absolute master of the biology - the dairy cow. Application of MCP Yield Adjustments in Field
Practice
The following exercise is based on a “typical” diet
provided from Brazil that included detailed analyses for all ingredients and local ingredient costs (Schwab et al., 2014a). The “typical” diet was formulated with a zero RDP balance and in order to maintain consistency across diets; that approach to RDP supply was maintained in the reformulated diets.
This exercise is predicated on the following assumptions and objectives.
1) A thorough evaluation of feeds, on-farm diet implementation, and producer management practices confirm that MP-Met allowable TP-adjusted milk yields is a valid prediction and is aligned well with actual on-farm milk yield.
2) As is in the case of the Oba and Allen diet high starch HMC diet, a high moisture corn starch source, rehydrated ensiled corn (REC) is included in the reformulated diets at significant levels.
3) A positive MCP yield adjustment of 5.0% (105%) accurately reflects the MCP yield increase expected from greater inclusion of REC.
4) The rumen fermentation characteristics of REC are similar to high moisture corn (HMC)
The objectives of reformulating the diets were as follows:
a) Through diet optimization without an MCP yield increase, determine if the same predicted MP-Met supply can be provided at a lower diet cost thus creating a window of economic opportunity to improve MP-Met and MP-Lys supplies.
b) Determine how a 5.0% MCP yield increase factored into the solution at formulation time will affect the cost window.
c) Factor in the increased MCP yield and take advantage of the cost window to increase predicted supplies of MP-Met and MP-Lys.
Thus, the reformulations of the Brazilian diet illustrated in Tables 4.1 and 4.2 take the implications of increased starch fermentability and increased microbial yield and apply them to a diet scenario in which REC
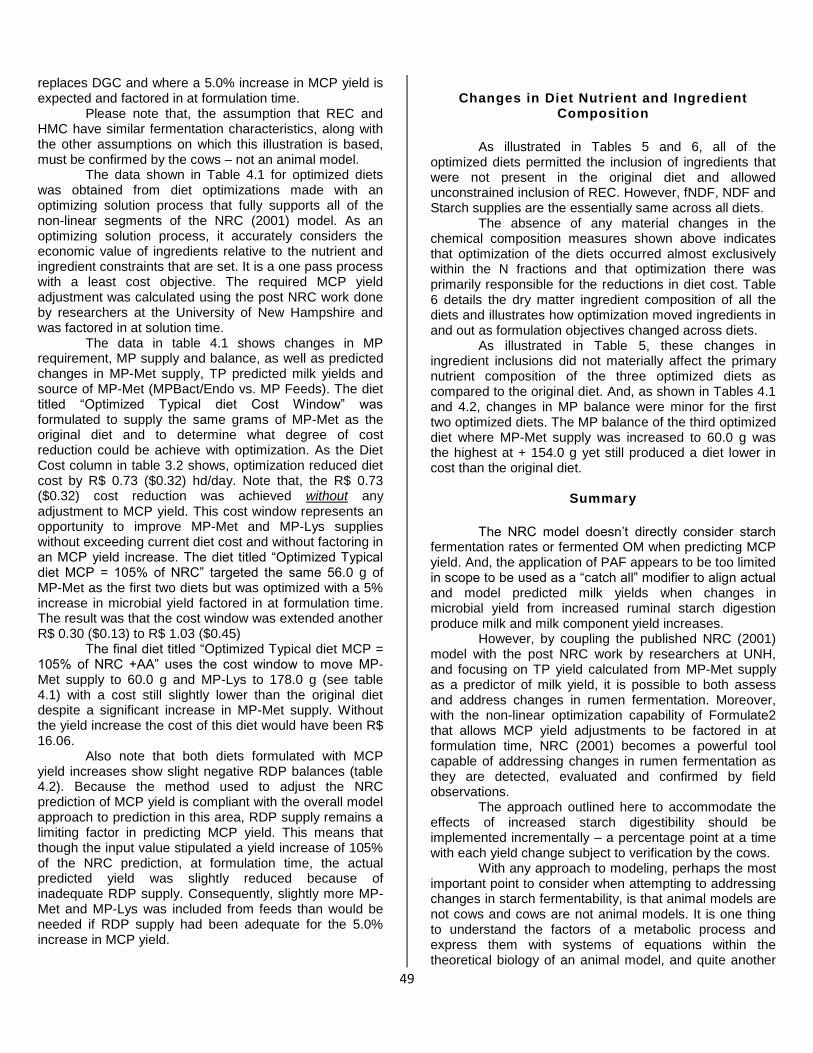
49
replaces DGC and where a 5.0% increase in MCP yield is expected and factored in at formulation time.
Please note that, the assumption that REC and HMC have similar fermentation characteristics, along with the other assumptions on which this illustration is based, must be confirmed by the cows – not an animal model.
The data shown in Table 4.1 for optimized diets was obtained from diet optimizations made with an optimizing solution process that fully supports all of the non-linear segments of the NRC (2001) model. As an optimizing solution process, it accurately considers the economic value of ingredients relative to the nutrient and ingredient constraints that are set. It is a one pass process with a least cost objective. The required MCP yield adjustment was calculated using the post NRC work done by researchers at the University of New Hampshire and was factored in at solution time.
The data in table 4.1 shows changes in MP requirement, MP supply and balance, as well as predicted changes in MP-Met supply, TP predicted milk yields and source of MP-Met (MPBact/Endo vs. MP Feeds). The diet titled “Optimized Typical diet Cost Window” was formulated to supply the same grams of MP-Met as the original diet and to determine what degree of cost reduction could be achieve with optimization. As the Diet Cost column in table 3.2 shows, optimization reduced diet cost by R$ 0.73 ($0.32) hd/day. Note that, the R$ 0.73 ($0.32) cost reduction was achieved without any adjustment to MCP yield. This cost window represents an opportunity to improve MP-Met and MP-Lys supplies without exceeding current diet cost and without factoring in an MCP yield increase. The diet titled “Optimized Typical diet MCP = 105% of NRC” targeted the same 56.0 g of MP-Met as the first two diets but was optimized with a 5% increase in microbial yield factored in at formulation time. The result was that the cost window was extended another R$ 0.30 ($0.13) to R$ 1.03 ($0.45)
The final diet titled “Optimized Typical diet MCP = 105% of NRC +AA” uses the cost window to move MP-Met supply to 60.0 g and MP-Lys to 178.0 g (see table 4.1) with a cost still slightly lower than the original diet despite a significant increase in MP-Met supply. Without the yield increase the cost of this diet would have been R$ 16.06.
Also note that both diets formulated with MCP yield increases show slight negative RDP balances (table 4.2). Because the method used to adjust the NRC prediction of MCP yield is compliant with the overall model approach to prediction in this area, RDP supply remains a limiting factor in predicting MCP yield. This means that though the input value stipulated a yield increase of 105% of the NRC prediction, at formulation time, the actual predicted yield was slightly reduced because of inadequate RDP supply. Consequently, slightly more MP-Met and MP-Lys was included from feeds than would be needed if RDP supply had been adequate for the 5.0% increase in MCP yield.
Changes in Diet Nutrient and Ingredient
Composition
As illustrated in Tables 5 and 6, all of the
optimized diets permitted the inclusion of ingredients that were not present in the original diet and allowed unconstrained inclusion of REC. However, fNDF, NDF and Starch supplies are the essentially same across all diets.
The absence of any material changes in the chemical composition measures shown above indicates that optimization of the diets occurred almost exclusively within the N fractions and that optimization there was primarily responsible for the reductions in diet cost. Table 6 details the dry matter ingredient composition of all the diets and illustrates how optimization moved ingredients in and out as formulation objectives changed across diets.
As illustrated in Table 5, these changes in ingredient inclusions did not materially affect the primary nutrient composition of the three optimized diets as compared to the original diet. And, as shown in Tables 4.1 and 4.2, changes in MP balance were minor for the first two optimized diets. The MP balance of the third optimized diet where MP-Met supply was increased to 60.0 g was the highest at + 154.0 g yet still produced a diet lower in cost than the original diet.
Summary
The NRC model doesn’t directly consider starch
fermentation rates or fermented OM when predicting MCP yield. And, the application of PAF appears to be too limited in scope to be used as a “catch all” modifier to align actual and model predicted milk yields when changes in microbial yield from increased ruminal starch digestion produce milk and milk component yield increases.
However, by coupling the published NRC (2001) model with the post NRC work by researchers at UNH, and focusing on TP yield calculated from MP-Met supply as a predictor of milk yield, it is possible to both assess and address changes in rumen fermentation. Moreover, with the non-linear optimization capability of Formulate2 that allows MCP yield adjustments to be factored in at formulation time, NRC (2001) becomes a powerful tool capable of addressing changes in rumen fermentation as they are detected, evaluated and confirmed by field observations.
The approach outlined here to accommodate the effects of increased starch digestibility should be implemented incrementally – a percentage point at a time with each yield change subject to verification by the cows.
With any approach to modeling, perhaps the most important point to consider when attempting to addressing changes in starch fermentability, is that animal models are not cows and cows are not animal models. It is one thing to understand the factors of a metabolic process and express them with systems of equations within the theoretical biology of an animal model, and quite another

50
thing all together to generate predictions from that theoretical biology that align with what actually occurs in living biology.
Consequently, regardless of how an animal model addresses starch fermentability, the outputs of that process remain theoretical predictions and as such, they are always subject to correction by the consummate expert on the biology.
The dairy cow never ceases to instruct us in that regard.
References Ji, P., C. S. Ballard, R. E. Clark, B. M. Sweeney, and C.
Kokko. 2012. Assessment of lysine released from rumen-protected lysine products exposed to high and low moisture TMR over 24 hours. The William Miner Agricultural Research Institute.
Ji, P., C. S. Ballard, R. E. Clark, B. M. Sweeney, and C. Kokko. 2012. Does mechanical mixing of TMR compromise protection efficacy of rumen-protected lysine products? The William Miner Agricultural Research Institute.
National Research Council. 2001. Nutrient Requirements of Dairy Cattle. 7th Revised ed. National Academy Press, Washington, D.C.
Oba, M., and M. S. Allen. 2003b. Effects of corn grain conservation method on ruminal digestion kinetics for lactating dairy cows at two dietary starch concentrations. J. Dairy Sci. 86:184-194.
Pacheco, D., R. A. Patton, C. Parys, and H. Lapierre. 2012. Ability of commercially available dairy ration programs to predict flows of protein and essential amino acids in dairy cows. J. Dairy Sci. 95:937-963.
Schwab, C. G., P. Cardoso, G. N. Foster, and R. Higgs., 2014a. Effect of starch type on optimizing amino acids in diets of dairy cows. In: Proc. Formuleite 2014. Brasil, Lavras.
Schwab, C. G., R. Higgs, R., and G. N. Foster. 2014b. Opportunities for the next dairy NRC committee to improve amino acid feed recommendations for cows. In: Proc. Southwest Nutrition Conference 2014.
Schwab, C. G., R. S. Ordway, and N. L. Whitehouse. 2004. Amino acid balancing in the context of MP and RUP requirements. In: Proc. 15
th Annual Florida
Ruminant Nutrition Conf.
Table 1. Processing adjustment factors (PAF) for selected feeds. From Table 2-1 in NRC (2001).
Feed Stuff PAF Value
Bakery waste 1.04
Barley grain, rolled 1.04
Corn grain, cracked dry 0.95
Corn grain, ground 1.00
Corn grain, ground high moisture 1.04
Corn grain, steam flaked 1.04
Corn silage, normal 0.94
Corn grain, mature 0.87
Molasses 1.04
Oats, grain 1.01
Sorghum grain, dry rolled 0.92
Sorghum grain, steam-flaked 1.04
Wheat grain, rolled 1.04
All other feeds 1.00

47
Table 2. NRC 2001 predictions compared to measured results from Oba and Allen (2003).
High Starch Low Starch
HMC1 DGC2 HMC1 DGC2
Starch, % DM 31.1 32.2 21.0 21.3
Actual milk, kg/d 38.2 38.4 33.4 34.3
DMI, kg/d 20.8 22.5 19.7 19.6
NE(I) Milk, kg/d 38.3 38.8 29.7 30.4
MP Milk, kg/d 40.4 44.3 35.1 35.9
MP total, g/d 2411 2655 2147 2142
RUP MP, g/d 1129 1287 975 976
Microbial MP, g/d 1184 1261 1072 1073
Starch intake, g/d 6411 7118 4195 4232
Microbial MP: Starch intake 0.18 0.18 0.26 0.25
Microbial MP, % total MP 49% 48% 50% 50%
The PAF of Corn silage for all diets was adjusted from 0.94 to 1.00. 1HMC = High moisture corn.
2DGC = Dried ground corn.
Table 3. Oba and Allen (2003). High and low starch diets.
Primary Act Milk kg
Milk Prot %
PAF Value
MCP1
adj % RDP
Req g RDP
Supp g RDP Bal
g NRC MP
Met g NRC TP Milk kg
Milk kg + or - Starch Source
High Starch Diets
High Moisture Corn 38.80 2.98 1.04 100.00 2183.07 2423.59 240.52 44.00 37.50 -1.30
High Moisture Corn adj 38.80 2.98 1.04 105.40 2300.96 2423.59 122.63 45.51 38.80 0.00
Ground Corn 38.40 3.02 1.00 100.00 2324.94 2579.94 255.00 48.10 40.40 2.00
Ground Corn adj 38.40 3.02 1.00 94.00 2185.14 2579.94 395.00 45.72 38.42 0.02
Low Starch Diets
High Moisture Corn 33.40 2.94 1.04 100.00 1989.59 2433.18 443.59 38.75 32.90 -0.50
High Moisture Corn adj 33.40 2.94 1.04 102.00 2029.38 2433.18 403.80 39.25 33.40 0.00
Ground Corn 34.30 2.87 1.00 100.00 1977.79 2418.44 440.65 38.69 33.60 -0.70
Ground Corn adj 34.30 2.87 1.00 102.80 2033.17 2418.44 385.28 39.39 34.30 0.00
Note that all positive yield adjustments are within the capacity of the predicted RDP supply.
1MCP = Microbial crude protein yield.

48
Table 4.1. Accounting for increased rumen microbial yield with an adjustment to microbial crude protein (MCP) yield - part 1.
Target MP MP MP MP MP MP Met Met MP MP MP
Milk Milk Req Supp Bal Met Met MP Bact MP Met Pred Met TP
Diet Description
kg TP% g g g Req g Supp g MPEndo
g Feeds
g Bal g Milk kg Milk kg
Typical diet 37.00 3.0 2515 2567 52 51 56 31 25 5 38.2 42.9
OTD CW1 37.00 3.0 2512 2600 88 51 56 31 25 5 39.0 42.9
OTD MCP2 37.00 3.0 2506 2540 34 51 56 33 23 5 37.8 42.9
OTD MCP3 37.00 3.0 2506 2660 154 51 60 32 28 9 40.4 44.9
1Optimized Typical Diet Cost Window.
2Optimized Typical Diet to MCP yield = 105% of NRC.
3Optimized Typical Diet to MCP yield =105% of NRC + AA.
Tabela 4.2. Accounting for increased rumen microbial yield with an adjustment to microbial crude protein (MCP) yield - part 2.
Diet Description
MP Lys MP Met Diet CP RDP RDP RDP MP Bact R$ Diet R$ Diet
Ration %MP %DM Req g Supp g Bal g Bal g Cost CW
Typical diet 3.04:1 2.18 15.3 2330 2331 0 1268 $15.71 $0.00
OTD CW1 2.98:1 2.15 15.4 2328 2328 0 1267 $14.98 $0.73
OTD MCP2 2.98:1 2.20 15.3 2446 2420 -26 1317 $14.98 $1.03
OTD MCP3 2.97:1 2.26 15.9 2447 2720 -27 1317 $15.63 $0.08
1Optimized Typical Diet Cost Window.
2Optimized Typical Diet to MCP = 105% of NRC.
3Optimized Typical Diet to MCP =105% of NRC + AA.
Tabela 5. Composition of typical and typical optimized diets.
Nutrient Original Diet Cost Window Diet MCP1=105 Diet MCP
1=105 + AA Diet
DMI, kg 24.3 24.2 24.2 24.2
Conc % 54.2 55.0 55.0 55.0
EE % 4.5 4.0 4.0 4.0
NDF % 35.5 35.5 35.5 35.5
fNDF % 25.1 24.7 24.7 24.7
CP % 15.3 15.4 15.3 15.9
Starch % 30.3 30.3 29.7 30.3
1MCP = Microbial crude protein yield.

49
Tabela 6. Dry matter ingredient composition of diets.
Typical Diet Typical Diet CW Typical Diet CW
1 Typical Diet CW
2
% DM % DM % DM % DM
Corn silage 42.01% 41.59% 41.59% 41.59%
Tifton Hay 1989 3.75% 3.41% 3.41% 3.41%
Whole cottonseed 10.30% 5.75% 6.51% 6.79%
REC 8.24% 17.40% 23.36% 24.16%
Dray ground corn 14.83% 6.59%
SBM 48% CP 14.00% 10.72% 12.38% 12.63%
Citrus pulp 3.67% 3.32% 3.32% 3.32%
Wheat midds
3.03% 5.07%
SBM, Expeller
2.52%
Soy hulls
2.31% 0.83% 2.69%
Cottonseed meal
1.42%
Ag Base 6900 0.37% 0.37% 0.37% 0.37%
Salt 0.12% 0.12% 0.12% 0.12%
Magnesium oxide 0.29% 0.29% 0.29% 0.29%
Sodium Bicarbonate 0.82% 0.82% 0.83% 0.83%
Limestone 1.28% 1.28% 1.40% 1.40%
Urea 0.14% 0.37% 0.37% 0.37%
LysiPearl 0.08% 0.01% 0.02% 0.10%
MetiPearl 0.10% 0.10% 0.09% 0.13%
Blood meal
0.02% 0.37%
100% 100% 100% 100% 1Typical Diet CW@105.
2Typical Diet CW@105 + AA.

50
Accurately estimating cow-level digestion: where do digestion rates fit and what do they mean?
John Goeser
Animal Nutrition and R&I Director, Rock River Laboratory, Inc
Watertown, USA Adjunct Asst. Professor, Dairy Science Department. University of Wisconsin
Madison, USA [email protected]
Introduction
Livestock nutrition programs began many years ago with the recognition that animal health and performance improved when livestock were fed supplemental mineral and protein to meet mineral and nutrient requirements.
All living beings have nutrient requirements. Nutrients by definition are those that furnish nourishment (Miriam-Webster, 2014 accessed online). Protein and minerals are nutrients. Fiber and starch are major sources of energy and energy can also be considered a nutrient, but determining feedstuff energetic content for ruminants is complex. One method for determining energy content of diets is to sum the energy supplied from digested fat, protein, fiber, starch and other non-fiber carbohydrates. Energy values of forages are determined in the Nutrient Requirements of Dairy Cattle: Seventh Revised Edition, 2001. The „summative‟ approach is described as TDN1x = dCP + 2.25x(dfat) + dNFC + dNDF -7, where „d‟ is the digestibility coefficient of CP, Fat, NFC or NDF, respectively.
Digested fat and protein contain more calories per gram (g), 9.4 and 5.6 calories per g, respectively, than carbohydrates at 4.2 calories per g (NRC, 2001). Both fiber (Neutral Detergent Fiber, NDF) and starch are carbohydrates yet when we need more energy in a ruminant diet we often include more starch (grain) and less fiber. Why is this? The answer is carbohydrate digestibility.
In ruminants, feedstuff energetic values are a function of both total nutrient content and digestion coefficients (Weiss, 1998). As nutritionists, we use computer ration formulation models with summative equations that incorporate nutrient level and digestibility to optimize nutrition on farm. We reasonably understand feedstuff nutrient content but have monumental opportunities to learn more about digestion. Hence, the remainder of this paper will focus on accurately describing nutrient digestion.
Digestion takes place in the rumen as well as the rest of digestive tract, with the aim in ruminant nutrition
being improving rumen digestion for optimal feed conversion efficiency. Hence, rumen digestion measures have been extensively sought out but remain difficult to predict.
The difficulty lies in the fact that digestion coefficients are not fixed measures (e.g. fiber digestibility potential at 30 h). Feedstuff digestion is dynamic and depends on upon a variety of factors including:
1) Feed genetic and chemical characteristics. Such as grain vitreousness (Correa et al., 2002) or fiber lignification (Jung and Deetz, 1993)
2) Physical properties. Example: grain particle size (Callison et al., 2001; Hoffman et al., 2012) and forage particle length (Bal et al., 2000)
3) Feed passage rate through multiple digestive chambers (Waldo and Smith, 1972).
The same feed will have different energy values when processed differently, or fed to a dry cow (longer rumen retention time) or a high producing cow (shorter rumen retention time). Increasing from an average NDF or starch digestion coefficient (estimated using an average digestion rate and pool size) to a high quality feed digestion coefficient (greater kd and pool size) can result in 5 kg milk production per day.
These digestion factors and potential milk production impact lead us to an important question: how do we best estimate in vivo (real, cow-level) digestion values for use within our computer programs? What opportunities do we have to improve model performance?
The objective of this paper is to briefly review practical approaches to feedstuff digestion, discuss digestion rate application within nutrition programs, and summarize published in vivo dairy cattle digestion data for use in evaluating ration formulation program outputs.
Evolution of assessing feedstuff digestibility
Measuring diet and feed digestion potential is not
a new concept. Bergeim (1926) first measured food

51
digestion nearly 100 years ago with an in vivo approach however this approach was not useful for individual feedstuffs in many cases and instead applied to the total diet.
During the late 1800‟s the Proximate Feed Analysis System was developed. The Proximate System evaluated individual feedstuff nutritive value by dividing animal feeds into six fractions: moisture, ether extract, protein, ash, crude fiber (CF) and nitrogen free extract (NFE). Crampton and Maynard (1932) however suggested that partitioning feedstuffs into cellulose, lignin and other carbohydrates instead of CF and NFE was a more accurate approach to determine nutritive value of feeds. Weiss et al. (1992) later developed a model for predicting total digestible nutrient content incorporating the detergent system (Goering and Van Soest, 1970) for nutrient analysis. Lignin became a focus for determining fiber and feedstuff digestibility and has been extensively studied as described by Jung (2012). However, Jung (2012) also described limitations to using lignin as a digestion indicator and our industry has moved beyond lignin based digestion estimates, although the NRC (2001) and other similar programs still have lignin based digestibility calculators built in.
Nearly 20 years after Crampton and Maynard (1932), found that lignin was related to feed nutritive value, Burroughs et al. (1950) described one of the first in vitro methods to measure digestion. In vitro rumen digestion evolved into a routinely used commercial laboratory method. However, the technique has substantial drawbacks due to being completely removed from the cow (lab bench method). In vivo and in situ digestion methods are also laboratory digestion analyses, taking place partially and completely within animals, that are now evolving as routine options for livestock nutrition measures.
Rumen and intestinal in vitro and in situ digestion techniques can be used to assess ingredient nutrient digestion characteristics, such as digestible nutrient pool size and rate. Certain animal models, based on mechanistic principles (defined later), then can incorporate pool size, digestion rate and passage rate information to estimate in vivo nutrient digestion and predict performance. The basic approach used in mechanistic models, such as Cornell Net Carbohydrate and Protein System (CNCPS, Tylutki et al., 2008), incorporate expansions on the following equation:
In vivo digestible nutrient content = digestible nutrient pool size (%) x digestion coefficient [%, predicted by kd / (kd +
kp)].
And parameter definitions are as follows:
1) Digestion coefficient (e.g. NDFD or StarchD) = % of nutrient that is digested. This is the end result value used within ration programs to calculate TDN, microbial CP and energy available for performance. This value may or may
not be directly entered into the program. There are two basic ways to determine digestion coefficients: Direct measurement (e.g. in vitro, in situ or in vivo measures) and; Calculate using pool size, digestion and passage rates.
2) k = rate coefficient. Corresponding to a nutrient or passage disappearing at a certain % per h
3) kd = digestion rate coefficient (e.g. NDF kd or Starch kd). “kd rate” is often used in the field to describe digestion rate; however this is redundant, and incorrect terminology
4) kp = passage rate coefficient (e.g. liquid or forage).
5) Pool size = nutrient amount (% total nutrient) available to the specified degradation and passage rate. Pool sizes can range from 0 to 100% available. Two levels of practically measuring nutrient digestion rates and pool sizes: simple explanations, benefits and drawbacks Lab bench: in vitro, meaning outside the body (Miriam-Webster, 2014).
Rumen and intestine in vitro digestion measures are completely removed from the animal and are meant to simulate digestion within the rumen or intestines. Rumen in vitro digestion gained popularity for routine forage analyses following developmental work by Tilley and Terry (1963) and later modified by Goering and Van Soest (1970) as published in the USDA Forage Fiber Analyses handbook. Goering and Van Soest (1970) described various forage analyses and a widely cited modified rumen in vitro digestion technique. Ruminant feedstuff protein intestinal in vitro digestion gained in popularity with the technique published by Calsamiglia and Stern (1995) and later modified by Gargallo et al. (2006) and evaluated by Boucher et al. (2009). Hundreds if not thousands of peer reviewed studies have since evaluated in vitro digestion techniques and applications.
The benefits to practical lab bench in vitro measures are:
1) Speed and flexibility. The ability to make many measurements over the course of time and the ability to analyze several feeds at one time.
2) Sample analysis is completely contained within a flask or test tube.
3) Cost-effective, relative to other digestion approaches.
4) Individual feed nutrient degradation can be assessed and isolated from other interactions. The digestion process is tightly controlled by controlling temperature, pH and maintaining an anaerobic environment to optimize bacterial digestion. Pool size of digestible feed component

52
(fiber, starch or protein) and rates of digestion (kd) values can be used to predict total tract nutrient digestion for specific ingredient or within diet formulation software.
For example, Dr. David Combs (2013) recently developed a total tract fiber digestion measure, titled Total Tract Neutral Detergent Fiber Digestibility (TTNDFD), which pairs feedstuff NDF kd, measured using standardized 24, 30 and 48 h NDFD values (Goeser and Combs, 2009), with an NDF kp adapted from Krizsan et al. (2010). Typical TTNDFD values since 2010 are presented in Table 1 for several feed and storage types (Rock River Laboratory, Inc., unpublished data). Measurements such as these can be compared to the data adapted from Goeser (2014) and presented in Table 2 for accuracy).
In vitro digestion technique drawbacks include, but are not limited to:
1) Inaccuracy due to removal from the animal. Isolation from other ingredients and rumen interactions. Digestion occurring beyond the rumen is not accounted for.
2) Consistency of rumen fluid varies between donor animals and can impact digestion results
3) Poor repeatability within and across laboratories due to rumen fluid and technique variability
4) Reducing or eliminating particle size effects because samples are ground to small particles sizes (1 to 4 mm).
Rumen or intestinal incubation: in situ, meaning in the natural or original position
(Miriam-Webster, 2014)
Simulating the rumen environment and dynamic
feedstuff interactions within digestion chambers can prove difficult (Vanzant et al., 1998). As a result, rumen and intestine in situ digestion techniques have been used in commercial laboratories to estimate nutrient digestion.
In this approach, feedstuffs are placed in small-pored bags, akin to tea bags, and incubated within the desired region of digestive tract. Feedstuff digestion potential is determined by measuring nutrient disappearance from the porous bags.
The benefits to in situ rumen or intestine measures include:
1) Feedstuffs are exposed to complex digestion and interactions occurring within the animal that are difficult to replicate in a closed in vitro flask or test tube. Multiple animals can be used to improve precision.
2) Greater sample sizes and larger particle sizes (from 4 mm to unground) can be used.
3) Flexibility. Many digestion measures in time can be made. Estimate kd and pool sizes.
4) Multiple nutrients can be assessed for digestion at the same time using the same digested sample.
5) Individual feed nutrient degradation can be assessed. Pool size and kd values can be used within diet formulation software.
Drawbacks to in situ techniques include, but are not limited to: 1) Increased cost relative to in vitro approaches. 2) Need for multiple cannulated animals in desired performance or production state.
For example, to assess digestion in context of a lactating Holstein cow complex rumen environment, feed must be digested within lactating Holstein cows‟ rumens.
3) In situ samples and nutrients are not subject to feedstuff passage rates that may occur in vivo.
For example, starch kp appears to be associated with feed type or density (published data summarized by Allen, 2012).
4) Poor repeatability across laboratories due to technique variability.
5) Sample disappearance from bags may be attributed to either loss through pores or digestion.
Considerable in situ developmental and evaluator work has been accomplished over the past 50 years. Vanzant et al. (1998) reviewed published literature and offered suggestions to standardize techniques. Rumen in situ techniques further gained in commercial popularity for assessing protein digestion partly following the techniques application within the Nutrient Requirements of Dairy Cattle: Seventh Revised Edition (NRC, 2001).
Yet, Stern et al. (1997) suggested both in vitro and in situ protein digestion estimates were challenging to relate to more accurate animal (in vivo) measures. Further, commercially available in vitro and in situ techniques, each differing in some aspect from published literature (e.g. technique or donor cattle and diet) have little to no published relationship with commercial dairy cattle performance (Schalla et al., 2012). Hence in many cases, practicing nutritionists rely on assumptions that greater digestion is positively related to performance in ratios such as the widely cited work published by Oba and

53
Allen (1999) or assume kd measures over time and pool size estimates are accurate.
How do we use digestion data within ration models? Can we improve ration program
performance? What do the cows have to say?
Having described several levels of practical
digestion measures, the livestock nutrition industry and consultants in the field are continually striving to improve accuracy and precision within animal nutrition software and feeding programs. One aim is to improve software and animal performance by implementing more accurate and precise nutrient digestion measures. Be mindful that ration models are merely a guide and many factors beyond formulation affect performance (Allen, 2012).
There are two basic approaches to estimating feed component digestion: empirical and mechanistic. Each approach requires different digestion inputs as outlined above but both approaches generate digestion coefficients that are intended to describe digestion in vivo. How do ration programs determine digestion coefficients? The kd, kp and pool size (e.g. uNDF) measures, each by themselves, are useless. Only when the three measures are used together do they have practical application as outlined above in the example equation.
Mechanistic nutrition model opportunities
Mechanistic models, such as the CNCPS model
(Tylutki et al., 2008) break the diet down further than empirical models such as NRC (2001) into core nutrients and predict how nutrients interact within the rumen and digestive tract. Both model types strive to predict future observations but mechanistic models apply theory as well as prior research and are meant to simulate true rumen and intestinal nutrient digestion.
Mechanistic models incorporate an extensive number of nutrient values and pool size estimates and pair those against rumen and hind-gut kd and kp estimates to determine animal and diet specific in vivo digestion predictions. After digestion coefficients for nutrients are determined, TDN, microbial protein, and energy available for performance are predicted similar.
Within mechanistic models, model performance at the field level can be improved by refining laboratory assessed feedstuff nutrient kd and pool size measures, using both wet chemistry and mathematical techniques.
Accurately estimating kd and pool size
In 2008, the final chapter of my doctorate thesis
(Goeser, 2008) focused on improving mathematical treatment of in vitro digestion data. Substantial work had been completed prior; Waldo et al. (1972) modeled non-linear cellulose disappearance from the rumen using logarithmic transformations, a great step forward. Later
Van Soest et al. (2000) and Van Amburgh et al. (2005) practically refined NDF kd estimates using a data transformation approach. Yet, the best standard in measuring feedstuff nutrient kd and pool size remains advanced computer program based non-linear iterative solutions (Goeser, 2008) now that computer power and statistical software has advanced.
Our industry is moving in this direction, however we are likely several years from precisely estimating these measures with advanced statistical techniques while not violating mathematical principles. To avoid violating mathematic principles, many observations in time are needed to adequately describe multiple pool sizes and kd‟s. For example, to estimate a fast pool and slow pool digestion parameters using non-linear means (e.g. lag time, fast pool size, fast pool kd, slow pool size, slow pool kd) we need, at minimum, six digestion measures reported.
As model born kp and laboratory derived nutrient pool size and kd measures continue evolving we can assess output and model accuracy by comparing model outputs against published in vivo rumen or total tract nutrient digestion means and ranges, such as that summarized by Goeser (2014) and adapted in Table 2. Regardless of approach used to assess feedstuff or diet performance potential, improving accuracy in addition to speed and precision will advance the livestock nutrition industry into the future.
The next 15 years
Violently fluctuating feed and milk or beef prices
require continued advancement to maintain or improve profit margins. Further, agriculture‟s environmental impact and carbon footprint is increasingly being scrutinized for sustainability. In both cases, improving feed conversion efficiency is key to advancing the dairy and beef industries. Accurately assessing digestion potential is critical under these efforts.
As mentioned previously, future innovations in digestion analyses, mathematic models, and ration formulation should ensure agreement with in vivo digestion coefficient results. The meta-analyses summarized by Goeser (2014) and adapted into Table 2 offer extensive published, in vivo, lactating cow rumen and total-tract NDF and starch digestion results to compare against laboratory derived estimates of fiber and starch digestion.
References
Allen, M. 2012. Adjusting the concentration and ruminal
digestibility of starch through lactation. Proc. 2012 Four-State Dairy Nutrition and Management Conf., Dubuque, IA.
Allen, M. 2012. Mind over Models. Proc. 2012 Four-State Dairy Nutrition and Management Conf., Dubuque, IA.

54
Bal, M. A., R. D. Shaver, A. G. Jirovec, K. J. Shinners, and J. G. Coors. 2000. Crop processing and chop length of corn silage: effects on intake, digestion, and milk production by dairy cows. J. Dairy Sci. 83:1264-1273.
Bergeim, O. 1926. A method for the study of food utilization or digestibility. J. Biol. Chem. 70:29-33.
Boucher, S. E., S. Calsamiglia, C. M. Parsons, M. D. Stern, M. Ruiz Moreno, M. Vázquez-Añón, and C. G. Schwab. 2009. In vitro digestibility of individual amino acids in rumen-undegraded protein: The modified three-step procedure and the immobilized digestive enzyme assay. J. Dairy Sci. 92:3939-3950.
Bourroughs, W., N. A. Frank, P. Gerlaugh, and R. M. Bethke. 1950. Preliminary observations upon factors influencing cellulose digestion by rumen microorganisms. J. Nutr. 40:9-24.
Callison, S. L., J. L. Firkins, M. L. Eastridge, and B.L. Hull. 2001. Site of nutrient digestion by dairy cows fed corn of different particle sizes or steam-rolled. J. Dairy Sci. 84:1458-1467.
Calsamiglia, S., and M. D. Stern. 1995. A three-step in vitro procedure for estimating intestinal digestion of proteins in ruminants. J. Anim. Sci. 73:1459–1465.
Combs, D. K. 2013. TTNDFD: A new approach to evaluate forages. Proc. 2013 Cornell Nutrition Conference for Feed Manufacturers. Syracuse, NY.
Correa, C. E. S., R. D. Shaver, M. N. Pereira, J.G. Lauer, and K. Kohn. 2002. Relationship between corn vitreousness and ruminal in situ starch degradability. J. Dairy Sci. 85:3008-3012.
Crampton, E. W., and L. A. Maynard. The relation of cellulose and lignin content to the nutritive value of animal feeds. J. Nutr. 14:383-395.
Ferraretto, L. F. and R. D. Shaver. 2012. Meta-analysis: effect of corn silage harvest practices on intake, digestion and milk production by dairy cows. Prof. Anim. Sci. 28:141-149.
Ferraretto, L. F., P. M. Crump, and R. D. Shaver. 2013. Effect of cereal grain type and corn grain harvesting and processing methods on intake, digestion, and milk production by dairy cows through a meta-analysis. J. Dairy Sci. 96:533-550.
Firkins, J. L., M. L. Eastridge, N. R. St-Pierre, and S.M. Noftsger. 2001. Effects of grain variability and processing on starch utilization by dairy cattle. J. Anim. Sci. 79(E-Suppl.): 218-238.
Gargallo, S., S. Calsamiglia and A. Ferret. 2006. Technical note: A modified three-step in vitro procedure to determine intestinal digestion of proteins. J. Anim. Feed Sci. 84:2163-2167.
Goering, H. K., and P. J. Van Soest. 1970. Forage fiber analyses. Apparatus, Reagents, Procedures and Some Applications. In U. S. G. P. Office Agricultural Handbook No. 379. Agricultural Research Services, U.S. Dep. Agric. Washington, DC.
Goeser, J. P. 2008. Improvement of rumen in vitro NDF digestibility techniques and data analysis. PhD thesis. University of Wisconsin – Madison, Madison, WI.
Goeser, J. P. and D. K. Combs. 2009. An alternative method to assess 24- ruminal in vitro neutral detergent fiber digestibility. J. Dairy Sci. 92:3833-3841.
Goeser, J. P. 2014. What do the cows have to say about NDF and starch digestion? Proc. 2014 Four State Dairy Nutrition and Management Conference. Dubuque, IA. p 47-55.
Hannigan, M. D., J. A. D. R. N. Appuhamy, and P. Gregorini. 2013. Revised digestion parameter estimates for the Molly cow model. J. Dairy Sci. 96:3867-3885.
Hoffman, P. C., D. R. Mertens, J. Larson, W.K. Coblentz, and R.D. Shaver. 2012. A query for effective mean particle size in dry and high-moisture corns. J. Dairy Sci. 95:3467-3477.
Jung, H. G., and D. A. Deetz. 1993. Cell wall lignification and degradability. p. 315-346, In H.G. Jung, D.R. Buxton, R.D. Hatfield, and J. Ralph, eds. Forage Cell Wall Structure and Digestibility. ASA-CSSA-SSSA, Madison, WI, USA.
Jung, H. J. 2012. Forage digestibility: the intersection of cell wall lignification and plant tissue anatomy. Proc. 2012 Florida Nutr. Conf.
Krizsan, S. J., S. Ahvenjärvi, and P. Huhtanen. 2010. A meta-analysis of passage rate estimated by rumen evacuation with cattle and evaluation of passage rate prediction models. J. Dairy Sci. 93:5890-5901.
National Research Council. 2001. Nutrient Requirements of Dairy Cattle. 7th Revised ed. National Academy Press, Washington, D.C.
Nutrient, in vitro, in situ, in vivo. 2014. In Merriam-Webster.com. Accessed April 8, 2014. http://www.merriam-webster.com/dictionary/nutrient
Oba, M. and M. S. Allen. 1999. Evaluation of the importance of the digestibility of neutral detergent fiber from forage: Effects on dry matter intake and milk yield of dairy cows. J. Dairy Sci. 82:589-596.
Schalla, A., L. Meyer, Z. Meyer, S. Onetti, A. Schultz, and J. Goeser. 2012. Hot topic: Apparent total-tract nutrient digestibilities using 120-hour in vitro indigestible neutral detergent fiber as a marker are related to commercial dairy cattle performance. J. Dairy Sci. 95:5109-5114.

55
Stern, M. D., A. Bach, and S. Calsamiglia. 1997. Alternative techniques for measuring nutrient digestion in ruminants. J. Anim. Sci. 75:2256-2276.
Tilley, J. M. A., and R. A. Terry. 1963. A two-stage technique for the in vitro digestion of forage crops. J. Br. Grassl. Soc. 18:104−109.
Tylutki, T. P., D. G. Fox, V. M. Durbal, L. O. Tedeschi, J.B. Russell, M.E. Van Amburgh, T.R. Overton, L.E. Chase and A.N. Pell. 2008. Cornell net carbohydrate and protein system: A model for precision feeding of dairy cattle. Anim. Feed Sci. Technol. 143:174-202.
Van Amburgh, M.E., P.J. Van Soest, J.B. Robertson, and W.F. Knaus. 2005. Corn silage neutral detergent fiber: refining a mathematical approach for in vitro rates of digestion. Cornell Nutrition Conference. Syracuse, NY.
Van Soest, P. J., M. E. Van Amburgh, and L. O. Tedeshi. 2000. Rumen balance and rates of fiber digestion. Cornell Nutrition Conference. Syracuse, NY.
Vanzant, E.S., Cochran, R.C., and E.C. Titgemeyer. 1998. Standardization of in situ techniques for ruminant feedstuff evaluation. J. Anim. Sci. 76:2717-2729.
Waldo, D. R. and L.W. Smith. 1972. Model of cellulose disappearance from the rumen. J. Dairy Sci. 55:125-129.
Weiss, W. P., H. R. Conrad, and N. R. St. Pierre. 1992. A theoretically based model for predicting total digestible nutrient values of forages and concentrates. Anim. Feed Sci. Technol. 39:95-110.
Weiss, W. P. 1998. Estimating the available energy content of feeds for dairy cattle. J Dairy Sci. 81:830-839.
Table 1. Total tract neutral detergent fiber digestibility (TTNDFD) values for several feed and storage types.
Feed Type Preservation TTNDFD (% of NDF)
Legume Hay 39.33
Legume Silage 41.49
Mixed Forage Hay 40.52
Mixed Forage Silage 42.99
Grass Hay 42.45
Grass Silage 45.89
Corn Silage Silage 43.62
Sorghum/Sudan Silage 48.06
Small Grains Hay 42.73
Small Grains Silage 43.34

56
Table 2. Summary of meta-analysis or review data adapted from Goeser (2014) for in vivo rumen and total-tract NDF and starch digestion coefficients (% of nutrient).
Description Nutrient AT1 DS
2 Author(s) TM
3
DC4,
% SD
Mixed TMRs NDF LDC5 Rumen Firkins et al. (2001) 121 43.5 11.3
Mixed TMRs NDF Mixed6 Rumen Hannigan et al. (2013) 152 42.8 12.8
Corn silage based TMRs NDF LDC5 Rumen Ferraretto & Shaver (2012) 39 41.9 NA
TMRs containing barley based grain NDF LDC5 Rumen Ferraretto et al. (2013) 30 39.4 NA
TMRs containing corn based grain NDF LDC5 Rumen Ferraretto et al. (2013) 82 39.3 NA
n or Weighted Means NDF Rumen 424 42.0 12.0
Alfalfa and Grass Forage based TMR NDF LDC5 Total Tract Goeser (2008) 75 47.4 8.0
Corn and Sorghum Forage based TMRs NDF LDC5 Total Tract Goeser & Combs (UN
7) 85 42.7 10.5
Mixed TMRs NDF LDC5 Total Tract Firkins et al. (2001) 75 48.0 10.9
Mixed TMRs NDF Mixed6 Total Tract Hannigan et al. (2013) 137 49.2 10.7
TMRs NDF Mixed6 Total Tract Krizsan et al. (2010) 172 59.7 12.8
Corn silage based TMRs NDF LDC5 Total Tract Ferraretto & Shaver (2012) 105 44.7 NA
TMRs containing barley based grain NDF LDC5 Total Tract Ferraretto et al. (2013) 62 47.2 NA
TMRs containing corn based grain NDF LDC5 Total Tract Ferraretto et al. (2013) 335 45.6 NA
n or Weighted Means NDF Total Tract 1046 48.5 10.7
Mixed TMRs Starch LDC5 Rumen Firkins et al. (2001) 8 57.6 15.6
Mixed TMRs Starch Mixed6 Rumen Hannigan et al. (2013) 92 59.7 15.4
Corn silage based TMRs Starch LDC5 Rumen Ferraretto & Shaver (2012) 39 60.8 NA
TMRs containing corn based grain Starch LDC5 Rumen Ferraretto et al. (2013) 82 54.1 NA
TMRs containing barley based grain Starch LDC5 Rumen Ferraretto et al. (2013) 30 70.6 NA
n or Weighted Means Starch Rumen 251 59.3 15.5
Mixed TMRs Starch LDC5 Total Tract Firkins et al. (2001) 79 90.6 7.4
Mixed TMRs Starch Mixed6 Total Tract Hannigan et al. (2013) 77 92.7 5.7
Corn silage based TMRs Starch LDC5 Total Tract Ferraretto & Shaver (2012) 105 92.7 NA
TMRs containing barley based grain Starch LDC5 Total Tract Ferraretto et al. (2013) 62 92.8 NA
TMRs containing corn based grain Starch LDC5 Total Tract Ferraretto et al. (2013) 335 92.6 NA
n or Weighted Means Starch Total Tract 658 92.4 6.5
1Animal type.
2Digestion site.
3Treatments means.
4Digestion coefficient.
5Lactating Dairy Cow.
6Mixed refers to a meta-
analysis of lactating dairy studies and minor number of non-lactating heifer study means.7Unpublished.

57
Strategies to Reduce Metabolic Dysfunctions
Around Calving
Ric R. Grummer, PhD
Ruminant Technical Director, Balchem Corp New Hampton, USA
Emeritus Professor, Department of Dairy Science. University of Wisconsin Madison, USA
Introduction
The time between 3 wk precalving to 3 wk „postcalving is often referred to as the “transition period” and the period that is most challenging for dairy cows and herd managers! It is during this period that the cow goes through tremendous changes in physiological status. Initially, the cow undergoes dramatic hormonal changes as she prepares to calve and initiate milk synthesis. This is followed by a period of nutrient deficiency because the cow can`t consume enough feed to provide the nutrients that are required for a rapidly increasing rate of milk synthesis. Consequently, the cow mobilizes nutrients from tissues in an attempt to compensate for the inability to consume sufficient feed. The incidence of metabolic disorders and other diseases peaks during this time leading to it being referred to the most challenging period. The prevailing thought is that proper nutrition and feed management during this time can have a dramatic effect on health and well-being of transition cows. This is a logical thought because of the nutritional deficiencies that occur. The purpose of this review is to examine the progress we have made in our knowledge of feeding transition cows and mitigation of metabolic disorders. The focus will be on energy metabolism because that is the area that has been most extensively studied. Likewise, fatty liver and ketosis will be highlighted because that is my area of expertise.
The Metabolic Condition
Most nutritionists believe that the greatest
challenge related to energy metabolism occurs after calving when energy balance reaches its nadir. Actually, the greatest increase in mobilized fat (nonesterified fatty acids; NEFA) and the greatest concentration of blood NEFA occurs at the time of calving and reflects a combination of hormonal changes associated with calving, a reduction of feed intake at calving, and an increase in energy requirements to support lactation. After calving, NEFA concentration will decrease, but it will not reach the
baseline achieved during the far-off dry period as long as the cow is in negative energy balance. The rate of decline in NEFA concentration after calving is dependent on the magnitude and duration of negative energy balance. Hepatic uptake of NEFA is dependent on NEFA concentration in blood and the rate of blood flow to the liver. Both increase at and shortly after calving and one-quarter of the NEFA released by adipose tissue may be taken up by the liver (Emery et al., 1992). Hepatic metabolism of NEFA is shown in Figure 1. Figure 1. Liver fatty acid metabolism during the periparturient period, negative energy balance, or both.
Fatty acids can either be oxidized or esterified to glycerol to form triglyceride (TG). Fatty acids that are oxidized may be completely oxidized to carbon dioxide (CO2) or partially oxidized to ketones. Fatty acids that are esterified can either be stored as TG or exported as a constituent of very low density lipoporotein (VLDL). Of the four metabolic fates of fatty acids, two are beneficial to the cow (complete oxidation and export as VLDL) and two are potentially detrimental (storage as TG and partial oxidation to ketones, e.g. beta-hydroxybutyrate [BHBA]). Unfortunately, flux of fatty acids through the good pathways is limited. Complete oxidation of fatty acid occurs to provide energy (in the form of ATP) to liver cells. Liver cells only need a finite amount of ATP. It was once thought that glucose status was an important determinant of how much fatty acid was completely or partially oxidized, but that has been refuted (Drackley et al., 2001).
Ketone
Adipose
Mobilized
Fat
TAG
Fatty Acid
GlycerolNEFA NEFA
VLDL
CO2TAG
Stored TAG
Oxid
AcCoA
Negative EB
Hormonal changes at calving
Liver

58
Export of VLDL from the liver is an inherently slow process in ruminant animals such as the dairy cow (Kleppe et al., 1988). Because the “good” pathways essentially become saturated when there is excessive uptake of fatty acids by the liver, TG storage (i.e., fatty liver) and increased ketone formation (i.e., ketosis) are likely. Research from our lab (Cadorniga-Valino et al., 1997) and Iowa State University (Young et al., 1990) indicates that TG storage probably precedes ketone formation as “overflow” routes during excessive NEFA uptake by hepatic tissue. Fatty liver typically develops at calving while ketosis usually occurs in the first few weeks postcalving (Grummer, 1993).
It is important to note that since all cows undergo hormonal changes associated with parturition and lactation, some degree of intake depression at calving, and inadequate energy intake postcalving, the incidence of fatty liver and ketosis is quite high in transition cows. Approximately one-half of cows have moderate to severe fatty liver immediately after calving (Grummer, 1993). Not surprisingly, ketosis prevalence (percentage of cows with ketosis at a given moment in time) or incidence (percentage of cows developing ketosis over a defined period of time) is also quite high. Ketosis is usually defined as clinical when outward symptoms are shown by the cow. Indicators may include depressed appetite, loss of milk production, and in severe cases, nervous behavior. Alternatively, ketosis can be defined as subclinical (SKC), which is determined by a cutpoint concentration of ketones in blood, urine or milk. The usefulness of measuring SKC is that it eliminates the subjectivity that accompanies determination of clinical ketosis. The prevalence of SKC in a large Canadian field trial (Duffield et al., 2009) utilizing 25 primarily component fed-tie stall herds was estimated to be 24% or 16% when serum beta-hydroxybutyrate (BHBA) cutpoints were defined at 1,200 or 1,400 umol/L at 1 to 2 wk postpartum. A lower prevalence was reported in a German study employing 77 farms (16 and 11% for the same cutpoints; Iwersen et al., 2009), but cows were sampled between calving and 42 d postpartum. Prevalence was 7.6% on two large Wisconsin freestall herds when cows were sampled from 1-15 d postpartum and 1,400 umol/L of serum was the cutpoint (Carrier et al., 2004). Using a milk BHBA cow-side assay (KetoTest; milk BHBA > 100 umol/L) on 20 Canadian dairy farms indicated a prevalence of 26% during 1 to 2 wk postpartum (Walsh et al., 2007). The incidence (affected lactations per 100 lactations at risk) of SCK on Canadian dairy farms determined by a milk BHBA test (> 100 umol/L) during week the first 2 wk postpartum was 62% (McLaren et al., 2006). The average incidence of SCK on four large freestall operations in New York and Wisconsin was 43% from 3 to 16 d in milk (McArt et al., 2012). Most research studies report prevalence data, not incidence data, because herds are usually spot-sampled. However, data from several large field trials suggest that the incidence rate of SCK determined for the lactation is 2-4 times higher than prevalence (Duffield, 2001) determined at a given time postpartum. Oetzel (2007) has suggested
that since the late 1990‟s, ketosis/SCK has surpassed ruminal acidosis and milk fever as the most important metabolic disease in US dairy herds.
Dietary Strategies to Improve Energy Status or Reduce Energy-related Metabolic Disorders
Prefresh Transition Diets
For several decades, it was recommended to increase concentrate (grain) feeding during the final 3 wk prior to calving. We often say that we are “steaming up” the cow prior to calving or that we should be feeding a “steam up” diet prior to calving. The origin of the term is attributed to Robert Boutflour who at the World Dairy Congress (1928) first proposed the “steam up” ration as a way to circumvent “the neglect of the preparation of the cows for her lactation period”. The term was meant to be an analogy to the preparation of a steam thresher. Essentially, the logic behind this feeding strategy was to adapt rumen microorganisms to higher grain diets that would be encountered by the cow following parturition. By following this practice, it was believed that cows would be less likely to go off feed or experience ruminal acidosis. Over the next decades, other reasons were put forth for steaming up cows prior to calving. These included: maximization of dry matter intake (DMI), provision of more propionate to support gluconeogenesis and decrease fat mobilization from adipose tissue, and increasing rumen papillae length to increase volatile fatty acid absorption from the rumen. However, today, many nutrition consultants and scientists are suggesting not to feed diets moderately high in grain during the prefresh transition period because practical experience and research over the past 10-15 years has not supported the concept.
A summary of 10 studies that examined decreasing the forage-concentrate ratio (increasing non-fiber carbohydrate, NFC) of prefresh transition diets is listed in Table 1. Cows went on to common diets postpartum (except Guo, 2007). In 6 of the 8 studies in which prepartum DMI was measured, there was a significant increase when NFC was increased. Surprisingly, the increase in DMI occurred for sustained periods of time (i.e. 3 wk) even if cows were in positive energy balance at the time additional concentrate was introduced. In other words, there does not seem to be a functional feedback mechanism to maintain energy balance when increasing energy density in the diet during the pre-fresh transition period. The obvious question is: does this increase in prepartum DMI provide some benefit to the cow such that her postpartum health and productivity is increased? Potential benefits include: suppression of adipose lipid mobilization as feed intake decreases at calving, stimulation of acid production and rumen papillae growth, and acclimation of rumen microbial population to high starch diets. Data in Table 1 indicate that there were no carry over effects of treatment on postpartum DMI or milk yield (measurement duration

59
varies among studies). Some studies showed a transient increase in DMI immediately postcalving; however, this did not result in beneficial effects on DMI or milk yield measured over a longer duration (i.e., data shown in Table 1). In most of these studies, energy balance was not reported. However, if postpartum DMI and milk yields were not affected, it is unlikely that energy balance would have been affected. Another interesting note is that these studies did not employ sufficient numbers of animals to adequately determine treatment effects on health disorders. Nevertheless, it is unlikely animal health would have been affected without changes in DMI, milk yield, or both.
Nordlund et al. (Univ. Wisconsin, unpublished) developed the Transition Cow Index to monitor transition cow programs on commercial dairy farms. The index uses 14 factors from historical DHIA records of individual cows to project milk yield the next lactation. These projections are then compared to her expected milk yield determined after the first milk test postpartum. Deviations from expectations are calculated for a herd to determine if progress, presumably in the transition cow program, is being made. They surveyed 32 commercial dairy herds and found no relationship between fiber in the prefresh transition diet and herd Transition Cow Index values (r
2=6
x 10-5
). Why was steaming up cows regarded so
important for success of transition cows for 8 decades and now it is viewed by many as nonessential? There may be several reasons, but as important as any is probably the advent of feeding totally mixed rations (TMR). Feeding TMR allows for small amounts of concentrate being consumed at any particular time. This, in conjunction with gradual increases in feed intake after calving probably allow adequate adaptation to the higher concentrate diets being fed postpartum.
Energy Feeding for the Entire Dry Period
With apparently no advantage to “steaming up” cows, it seems logical that one could feed low energy, high fiber “far-off” dry cow diets for the entire dry period. This strategy would save money since feeding of expensive concentrates would be reduced and diet formulation would be simplified since only one diet would need to be formulated for dry cows. It has been hypothesized that cows fed above their maintenance energy requirement during the dry period become similar to human type II diabetics: they become more insulin resistant (Drackley, 2008). Since insulin has antilipolytic effects on adipose tissue, a more insulin resistant cow will have higher rates of lipolysis. Consequently, more fat is mobilized and this causes the cow to be more susceptible to fatty liver and ketosis. There are two ways to control energy intake so that the dry cow does not consume too much energy. One approach is to limit feed a diet relatively rich in energy that would normally lead to body weight gain if fed ad libitum. The other is to include low
energy feeds such as straw so that energy requirements are met when cows are allowed ad libitum feed intake. Limit feeding is impractical unless cows are in stanchions or tie stalls.
While results are not consistent across all studies, large reductions in liver TG have been observed when feeding controlled energy diets in some studies (Janovick and Drackley, 2010, 2011; Richards et al., 2011). The same is true for plasma NEFA and BHBA (Janovick and Drackley, 2010, 2011; Richards et al., 2011). Postpartum DMI does not seem to be affected by feeding controlled energy diets except for transient increases shortly after calving. Milk yield was significantly decreased by feeding a controlled energy diet during the far-off dry period in the Silva-del-Rio et al. (2010) trial. The milk yield reduction in the Janovick and Drackley (2010, 2011) study was large (3.5 kg/day) but not statistically significant. Milk fat percentage has been consistently reduced (Figure 2) by feeding controlled energy diets and the difference was statistically significant in 2 of the 3 trials in which statistical analysis was available. Figure 2. Percentage unit change in milk fat when feeding “controlled” energy diets vs overfeeding energy (typically moderate energy diets consumed ad libitum and targeted at 150% of energy requirements). Energy intake was controlled either by feeding high fiber diets (typically rich in straw and consumed ad libitum to meet energy requirements; blue bars) or by feed restriction of moderate energy diets (typically targeted to 80% of energy requirements). NA=statistics for comparison not available, NS=nonsignificant.
Similarly, fat-corrected milk yield (FCM) has been consistently reduced (Figure 3). The reduction in milk fat percentage and fat-corrected milk yield are consistent with less fat mobilization and lower plasma NEFA, i.e., greater insulin resistance. The Janovick and Drackley study (2010, 2011) used primiparous and multiparous cows. Although they did not report treatment x parity interaction P values, there appeared to be an interaction; negative responses to controlled energy diets were only experienced by multiparous cows (-5.6 kg milk/d and -9.3 kg 3.5% FCM/d) . The studies cited above do not have sufficient replication to examine the effects of controlled energy diets on animal health or reproduction. However,
-0.8
-0.7
-0.6
-0.5
-0.4
-0.3
-0.2
-0.1
0Grum 1996 Dann 2006
Janovick 2010/11
Richards 2011
Silva-del-Rio 2010 Dann 2005
Douglas 2006
Janovick 2010/11
Fat, %
NANA
NS
P<0.05
P<0.05
NA NS
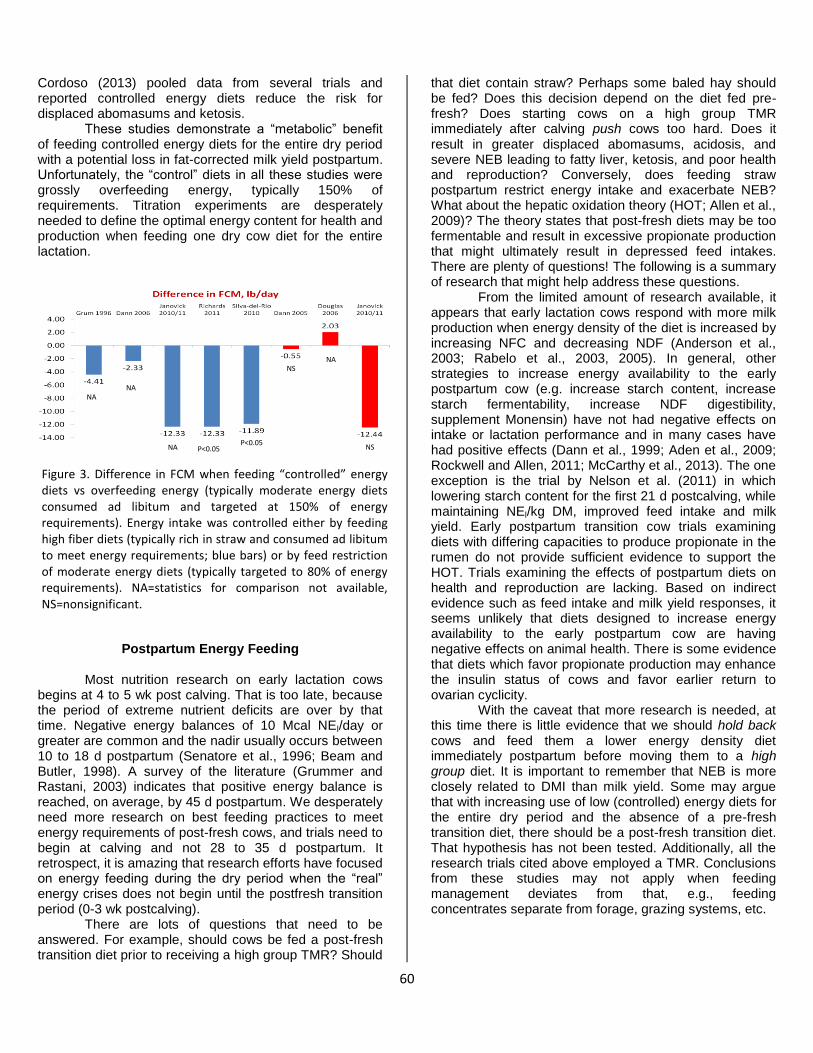
60
Cordoso (2013) pooled data from several trials and reported controlled energy diets reduce the risk for displaced abomasums and ketosis.
These studies demonstrate a “metabolic” benefit of feeding controlled energy diets for the entire dry period with a potential loss in fat-corrected milk yield postpartum. Unfortunately, the “control” diets in all these studies were grossly overfeeding energy, typically 150% of requirements. Titration experiments are desperately needed to define the optimal energy content for health and production when feeding one dry cow diet for the entire lactation.
Postpartum Energy Feeding Most nutrition research on early lactation cows
begins at 4 to 5 wk post calving. That is too late, because the period of extreme nutrient deficits are over by that time. Negative energy balances of 10 Mcal NEl/day or greater are common and the nadir usually occurs between 10 to 18 d postpartum (Senatore et al., 1996; Beam and Butler, 1998). A survey of the literature (Grummer and Rastani, 2003) indicates that positive energy balance is reached, on average, by 45 d postpartum. We desperately need more research on best feeding practices to meet energy requirements of post-fresh cows, and trials need to begin at calving and not 28 to 35 d postpartum. It retrospect, it is amazing that research efforts have focused on energy feeding during the dry period when the “real” energy crises does not begin until the postfresh transition period (0-3 wk postcalving).
There are lots of questions that need to be answered. For example, should cows be fed a post-fresh transition diet prior to receiving a high group TMR? Should
that diet contain straw? Perhaps some baled hay should be fed? Does this decision depend on the diet fed pre-fresh? Does starting cows on a high group TMR immediately after calving push cows too hard. Does it result in greater displaced abomasums, acidosis, and severe NEB leading to fatty liver, ketosis, and poor health and reproduction? Conversely, does feeding straw postpartum restrict energy intake and exacerbate NEB? What about the hepatic oxidation theory (HOT; Allen et al., 2009)? The theory states that post-fresh diets may be too fermentable and result in excessive propionate production that might ultimately result in depressed feed intakes. There are plenty of questions! The following is a summary of research that might help address these questions.
From the limited amount of research available, it appears that early lactation cows respond with more milk production when energy density of the diet is increased by increasing NFC and decreasing NDF (Anderson et al., 2003; Rabelo et al., 2003, 2005). In general, other strategies to increase energy availability to the early postpartum cow (e.g. increase starch content, increase starch fermentability, increase NDF digestibility, supplement Monensin) have not had negative effects on intake or lactation performance and in many cases have had positive effects (Dann et al., 1999; Aden et al., 2009; Rockwell and Allen, 2011; McCarthy et al., 2013). The one exception is the trial by Nelson et al. (2011) in which lowering starch content for the first 21 d postcalving, while maintaining NEl/kg DM, improved feed intake and milk yield. Early postpartum transition cow trials examining diets with differing capacities to produce propionate in the rumen do not provide sufficient evidence to support the HOT. Trials examining the effects of postpartum diets on health and reproduction are lacking. Based on indirect evidence such as feed intake and milk yield responses, it seems unlikely that diets designed to increase energy availability to the early postpartum cow are having negative effects on animal health. There is some evidence that diets which favor propionate production may enhance the insulin status of cows and favor earlier return to ovarian cyclicity.
With the caveat that more research is needed, at this time there is little evidence that we should hold back cows and feed them a lower energy density diet immediately postpartum before moving them to a high group diet. It is important to remember that NEB is more closely related to DMI than milk yield. Some may argue that with increasing use of low (controlled) energy diets for the entire dry period and the absence of a pre-fresh transition diet, there should be a post-fresh transition diet. That hypothesis has not been tested. Additionally, all the research trials cited above employed a TMR. Conclusions from these studies may not apply when feeding management deviates from that, e.g., feeding concentrates separate from forage, grazing systems, etc.
NA
NA
NA P<0.05 P<0.05
NS NA
NS
Figure 3. Difference in FCM when feeding “controlled” energy diets vs overfeeding energy (typically moderate energy diets consumed ad libitum and targeted at 150% of energy requirements). Energy intake was controlled either by feeding high fiber diets (typically rich in straw and consumed ad libitum to meet energy requirements; blue bars) or by feed restriction of moderate energy diets (typically targeted to 80% of energy requirements). NA=statistics for comparison not available, NS=nonsignificant.

61
Management of Energy Metabolism via Feed Supplements
Since the greatest rate of fat mobilization and
infiltration into the liver occurs about the time of calving, strategies for prevention of fatty liver and ketosis should commence during the prepartum period. Incorporation of feed supplements into the diet may be a useful strategy. Monensin has been reviewed by others (Duffield and Bagg, 2000; Duffield et al., 2008) and will not be covered here other than to say that supplementation has been shown to lower blood ketones (Duffield and Bagg, 2000; Duffield et al., 2008), but not liver TG (Zahra et al., 2006; Chung et al., 2008).
An additive that enhances VLDL (i.e. TG) export out of the liver is preferred to one that chemically blocks lipid mobilization because it facilitates rather than inhibits a normal physiological process that supports lactation. The mammary gland needs fatty acids for energy and for milk fat synthesis. Choline is the only feed additive with evidence that it enhances VLDL export from the liver and reduces liver TG and ketosis during the transition period.
Choline serves as a methyl donor in biochemical reactions and as a constituent of phosphatidylcholine (PC). Methionine serves as a methyl donor for choline synthesis; therefore, choline and methionine can spare the requirement of each other. Phosphatidylcholine can be synthesized from tri-methylation of phophatidylethanolamine or directly from choline. As a component of phospholipids, choline is essential for maintaining cell membrane structure and permeability, and for transport of lipid from the liver as a constituent of very low density lipoproteins (VLDL). Choline deficiency leads to fatty liver in laboratory animals.
Estimates of ruminal choline degradation are 80-98% (Atkins et al., 1988, Sharma and Erdman, 1989). Ruminal production of choline is negligible (Erdman, 1992). Protected choline supplements have been developed to decrease microbial degradation in the rumen and increase delivery of choline to the small intestine. Such products must provide for a low ruminal choline degradation rate and post ruminal release of choline from encapsulation to allow for absorption. There are several protected choline products on the market, however, very few have peer-reviewed research that documents their efficacy.
Protected choline (0, 45, 60, or 75 g Reashure/d, Balchem Corp.) was fed to transition dairy cows and a statistically non-significant reduction in liver TG was observed as level of supplementation was increased (Piepenbrink and Overton, 2004). Liver TG is a highly variable measurement in dairy cattle immediately after parturition and this study may not have had adequate animal numbers to detect statistically significant treatment differences. Therefore, our laboratory attempted to assess whether choline had a role in preventing or alleviating fatty liver using a less variable experimental model that employed energy restricted dry cows to induce fatty liver.
Feeding 15 g choline/d in a ruminally protected form (60 g Reashure; Balchem Corp.) prevented induction of fatty liver and alleviated fatty liver following induction (Cooke et al., 2007). More recently, this same dose of protected choline (60 g Reashure; Balchem Corp.) was fed to dairy cows from 21 d prepartum to 6 wk postpartum and reduced liver TG during week 1 and week 3 postpartum (Zom et al., 2011).
If choline can prevent fatty liver, it should be able to reduce the incidence of ketosis. To evaluate effects on animal health parameters such as ketosis, trials employing large animal numbers are required and need to be conducted on large commercial farms. Lima et al. (2007, 2011) conducted two experiments on separate farms. On one farm, using 363 cows, 0 or 15 g/d of choline in a protected form (60 g/d Reashure, Balchem Corp.) was fed between 25 d prior to expected calving until 80 d post calving. Postpartum, DMI tended to be greater (23.9 vs. 22.6 kg/d) and fat-corrected milk yield was greater (44.6 vs. 42.8) for cows fed choline. Feeding choline reduced the incidence of ketonuria (10.7 vs. 28.8%), clinical ketosis (4.0 vs. 11.3%), and the relapse of clinical ketosis (2.3 vs. 6.85). On the second farm, the same treatments were fed only to heifers and the duration of treatment was only from 25 d prior to expected calving until calving. DMI and fat-corrected milk were not affected by treatment and choline supplementation tended to increase milk yield (28.7 vs. 27.9 kg/d). Parameters related to ketosis were not affected by treatment. The absence of a response on the second farm may have been due to the absence of choline supplementation after calving, the use of heifers which are less susceptible to lipid-related metabolic disorders, or both.
Finally, if feeding rumen protected choline during the transition period improves liver and cow health, then one should expect to see an improvement in lactation performance. We (Grummer and Crump, unpublished) recently completed a meta-analysis for 13 studies that fed RPC to transition cows. Feed stability or evidence of bioavailability of choline source was not a criterion for study selection. Studies were not screened for “soundness” of research. Treatment means and sample size (standard error of the mean) had to be available for the analysis. Ten of the thirteen trials were published in peer-reviewed journals. For studies to be included in this analysis, RPC had to be fed prior to calving. Time when RPC supplementation was started varied between 28 to 7 d prior to expected calving. RPC supplementation was terminated anywhere from the day of calving (one study) to 120 d in milk. Response variables included DMI, milk yield, energy corrected milk yield, fat %, protein %, and fat and protein yield. Insufficient data was available for analysis of liver fat or energy-related blood parameters. Analysis revealed a significant increase of 4.9 lb milk/day and 1.6 lb of DMI/day (Table 2; Figure 4).
Milk fat and protein yield percentage were not significantly affected by treatment but yields were (Table 2). These studies were conducted in several countries

62
under a variety of management conditions and they did not target problem herds or cows. This implies that benefits to supplementing protected choline can be realized by a wide variety of herds. Alleviating a choline deficiency not only reduces liver fat but also improves parameters that are economically important to dairy producers. It has been suggested that choline be listed as a required nutrient in the next National Research Council (NRC) publication for dairy cattle (Grummer, 2012).
Chromium (Cr) is an essential nutrient for humans and animals. As a constituent of chromodulin, Cr has the potential to enhance the action of insulin. Insulin is antilipolytic, therefore, if Cr acts to potentiate its action, lipolysis should be reduced during supplementation. Therefore, Cr would act to counteract the cow‟s natural biology to become insulin resistant in an effort to support lactation. The obvious question is: why would one try to do that, particularly if protected choline is available to enhance fatty acid export out of the liver and prevent fatty liver and ketosis?
There have been numerous trials in which Cr has been fed to transition cows (Hayirli et al., 2001; Pechova et al., 2003; Smith et al., 2005, 2008; McNamara and Valdez, 2005; Sadri et al., 2009; Soltan, 2009; Rockwell and Allen, 2011). Milk production was increased in 5 of 7 studies with the increase being from 2.5 to 5.2 kg/day. Most of these studies were conducted with Cr-methionine which has not been approved for use in the United States. In the two studies employing Cr-propionate (approved for use in the US; McNamara and Valdez, 2005; Rockwell and Allen, 2011), the increase in milk yield was not significant during the time it was being supplemented (through 28 or 35 d in milk), but was significant for days 1-
84 or 90 postpartum. Post partum DMI also was increased in 4 of 7 studies; in two of the studies (McNamara and Valdez, 2005 and Soltan et al. 2009) there was evidence that the increase was not seen until after the transition period was over (> 35 d in milk). Blood NEFA has only been decreased postpartum in one of the five trials it was measured in (Soltan, 2009). Similarly, blood glucose has only been increased in one of five trials and it was decreased only at 4-5 wk postpartum (Pechova et al., 2003). Postpartum insulin sensitivity, as measured by a glucose tolerance test, was only measured in one trial (Hayirli et al., 2001) and the results were conflicting. Glucose peak was decreased following the challenge (indicating increased sensitivity), but clearance rate of glucose from blood was decreased (indicating decreased sensitivity). Cr supplementation has not decreased liver TG in the two studies it has been monitored (Hayirli et al., 2001; Smith et al., 2008). In summary, there is evidence that Cr supplementation increases DMI and milk production, but there is little evidence it is acting through modification of insulin sensitivity during the transition period.
Niacin is also an antilipolytic compound at pharmacological doses. Niacin is a generic name; two forms exist: nicotinic acid and nicotinamide. Data in nonruminants indicates that nicotinamide is not antilipolytic, but rumen microbes can convert some nicotinamide to nicotinic acid. A large meta-analysis (Schwab et al., 2005) indicated that feeding free niacin has no effect on blood NEFA. This is because up to 98% is degraded in the rumen. Therefore, supplementation must be in a form protected from ruminal degradation. Very little research has been conducted on feeding rumen-protected niacin on transition cows. Two recent studies indicated that 8 (Yuan, 2012) or 16 (Morey et al., 2011) g niacin/d (in a protected form, NiaShure, Balchem Corp.) starting at 21 d before calving can reduce peak blood NEFA on the day of calving. Liver TG immediately after calving was not significantly decreased in either study, however, in one study (Yuan, 2012) it was reduced approximately 50 %.
References
Adin, G., R. Solomon, M. Nikbachat, A. Zenou, E. Yosef,
A. Brosh, A. Shabtay, S. J. Mabjeesh. 2003. Effect of feeding cows in early lacation with diets differing in roughage-neutral detergent fiber content on intake behavior, rumination, and milk production. J. Dairy Sci. 92:3364-3373.
Allen, M. S., B. J. Bradford, and M. Oba. 2009. The hepatic oxidation theory of the control of feed intake and its application to ruminants. J. Anim. Sci. 87:3317-3334.
Anderson, J. B., N. C. Friggens, K. Sejrsen, M. T. Sorensen, L. Munksgaard, and K. L. Invartsen. 2003.
Figure 4. Individual study results from a meta-analysis of 13 transition cow trials that examined the effects of feeding rumen-protected choline (Grummer and Crump, unpublished).
63
The effects of low vs. high concentrate level in the diet on performance in cows milked two or three times daily in early lactation. Livestock Prod. Sci. 81:119-128.
Atkins, K. B., R. A. Erdman, and J. H. Vandersall. 1988. Dietary Choline effects on milk yield and duodenal choline flow in dairy cattle. J. Dairy Sci. 71:109-116.
Beam, S. W., and W. R. Butler. (1998) Energy balance, metabolic hormones, and early postpartum follicular development in dairy cows fed prilled lipid. J Dairy Sci. 81:121-131.
Cadorniga-Valino, C., R. R. Grummer, L. E. Armentano, S. S. Donkin, and Sandra J. Bertics. 1997. Effects of fatty acids and hormones on fatty acid metabolism and gluconeogenesis in bovine hepatocytes. J. Dairy Sci. 80:646-656.
Carrier, J., S. Stewert, S. Godden, J. Fetrow, and P. Rapnicki. 2004. Evaluation and use of three cowside tests for detection of subclinical ketosis in early postpartum cows. J. Dairy Sci. 87:3725-3735.
Chung, Y., M. M. Pickett, T. W. Cassidy, and G. A. Varga. 2008. Effects of prepartum dietary carbohydrate source and monensin on periparturient metabolism and lactation in multiparous cows. J. Dairy Sci. 91:2744-2758.
Cooke, R. F., N. S. Del Rio, D. Z. Caraviello, S. J. Bertics, M. H. Ramos, and R. R. Grummer. 2007. Supplemental choline for prevention and alleviation of fatty liver in dairy cattle. J. Dairy Sci. 90:2413-2418.
Cordoso, P. 2013. 3-R Transition Period: Recovery, Reproduction and Results. Of the Four State Dairy Nutrition and Management Conference. Dubuque, IA.
Dann, H. M., D. E. Morin, G. A. Bollero, M. R. Murphy, and J. K. Drackley. 2005. Prepartum intake, postpartum induction of ketosis, and periparturient disorders affect the metabolic status of dairy cows. J. Dairy Sci. 88:3249-3264.
Dann, H. M., G. A. Varga, and D. E. Putnam. 1999. Improving energy supply to late gestation and early postpartum dairy cows. J. Dairy Sci. 82:1765-1778.
Dann, H. M., N. B. Litherland, J. P. Underwood, M. Bionaz, A. D. Angelo, J. W. McFadden, and J. K. Drackley. 2006. Diets during the far-off and close-up periods affect periparturient metabolism and lactation in multiparous cows. J. Dairy Sci. 89:3563-3577.
Doepel, L., H. Lapierre, and J. J. Kennelly. 2002. Peripartum Performance and Metabolism of Dairy Cows in Response to Prepartum Energy and Protein Intake. J. Dairy Sci. 85:2315-2334.
Douglas, G. N., T. R. Overton, H. G. Bateman, H. M. Dann, and J. K. Drackley. 2006. Prepartal plane of
nutrition, regardless of dietary energy source, affects periparturient metabolism and dry matter intake in Holstein Cows. J. Dairy Sci. 89:2141-2157.
Drackley, J. K., T. R. Overton, and G. N. Douglas. 2001. Adaptations of glucose and long-chain fatty acid metabolism in liver of dairy cows during the periparturient period. J. Dairy Sci. 84(E. Suppl.):100-112.
Drackley, J. K. 2008. Steady as She Goes: Rethinking Dry Cow Nutrition. In Proceedings of the Mid-South Ruminant Nutrition Conference. Arlington, Texas.
Duffield, T. 2001. Importance of subclinical ketosis in lactating dairy cattle. Proc. Mich. Vet. Conf.
Duffield, T. F., K. D. Lissemore, B.W. McBride, and K. E. Leslie. 2009. Impact of hyperketonemia in early lactation dairy cows on health and production. J. Dairy Sci. 92:571-580.
Duffield, T., A. R. Rabiee, and I. J. Lean. 2008. A meta-analysis of the impact of monensin in lactating dairy cattle. Part 1. Metabolic effects. J. Dairy Sci. 91:1334-1346.
Duffield, T., and R. Bagg. 2000. Use of ionophores in lactating dairy cattle: A Review. Can. Vet. J. 41:388-394.
Erdman, R. A. 1992. Vitamins. Pages 297-308 in Large Dairy Herd Management. H. H. Van Horn and C. J. Wilcox, eds. American Dairy Science Association, Champaign, Il.
Grum, D. E., J. K. Drackley, R. S Younker, D. W. LaCount, and J. J. Veenhuizen. 1996. Nutrition during the dry period and hepatic lipid metabolism of periparturient dairy cows. J. Dairy Sci. 79:1850-1864.
Grummer, R. R. 1993. Etiology of lipid related metabolic disorders in periparturient dairy cattle. J. Dairy Sci. 76:3882-3896.
Grummer, R. R. 2012. Choline: A Limiting Nutrient for Transition Dairy Cows. Proc. Cornell Nutr. Conf.
Grummer, R. R., and R. R. Rastani. 2003. When should lactating dairy cows reach positive balance? Prof. Anim. Sci. 19:197-203.
Guo, J., R. R. Peters, and R. A. Kohn. 2007. Effect of a transition diet on production and performance and metabolism of periparturient dairy cows. J. Dairy Sci. 90:5247-5258.
Hayirli, A., D. R. Bremmer, M.T. Socha, and R. R. Grummer. 2001. Effect of chromium supplementation on production and metabolic parameters in periparturient dairy cows. J. Dairy Sci. 1218-1230.

64
Holcomb, C. S., H. H. Van Horn, H. H. Head, M. B. Hall, and C. J. Wilcox. 2001. Effects of Prepartum Dry Matter Intake and Forage Percentage on Postpartum Performance of Lactating Dairy Cows. J. Dairy Sci. 84:2051-2058.
Iwerson, M., U. Falkenberg, R. Voightsberger, D. Forderung, and W. Heuwieser. 2009. Evaluation of an electronic cowside test to detect subclinical ketosis in dairy cows. J. Dairy Sci. 92:2618-2624.
Janovick, N. A. and J. K. Drackley. 2010. Prepartum dietary management of energy intake affects postpartum intake and lactation performance by primiparous and multiparous Holstein cows. J. Dairy Sci. 93:3086-3102.
Janovick, N. A., Y. R. Bolsclair, and J. K. Drackley. 2011. Prepartum dietary energy intake affects metabolism and health during the periparturient period in primiparous and multiparous Holstein cows. J. Dairy Sci. 94:1385-1400.
Kamiya, Y., M. Kamiya, and M. Tanaka. 2006. Effects of forage to concentrate ratio in prepartum diet on dry matter intake and milk yield of periparturient cows during hot weather. An. Sci. J. 77:63-70.
Keady, T. W. J., C. S. Mayne, D. A. Fitzpatrick, and M. A. McCoy. 2001. Effect of Concentrate Feed Level in Late Gestation on Subsequent Milk Yield, Milk Composition, and Fertility of Dairy Cows. J. Dairy Sci. 84:1468-1479.
Kleppe, B. B., A. J. Aiello, R. R. Grummer, and L. E. Armentano. 1988. Triglyceride accumulation and very low density lipoprotein secretion by rat and goat hepatocytes in vitro. J. Dairy Sci. 71:1813.
Lima, F. S., M. F. Sá Filho, L. F. Greco, and J. E. P. Santos. 2011. Effect of feeding rumen-protected choline on performance, health, and reproduction of dairy cows. The Vet. J. 193: 140-145.
Lima, F. S., M. F. Sa Filho, L. F. Greco, F. Susca, V. J. A. Magalhaes, J. Garrett, and J. E. P. Santos. 2007. Effects of feeding rumen-protected choline (RPC) on lactation and metabolism. J. Dairy Sci. 90(Suppl. 1):174.
Mashek, D. G., and D. K. Beede. 2000. Peripartum Responses of Dairy Cows to Partial Substitution of Corn Silage with Corn Grain in Diets Fed During the Late Dry Period. J. Dairy Sci. 83:2310-2318.
McArt, J. A. A., D. V. Nydam, and G. R. Oetzel. 2012. Epidemiology of subclinical ketosis in early lactation dairy cattle. J. Dairy Sci. 95:5056-5066.
McCarthy, M.M., T Yasui, C. M. Ryan, G. D. Mechor, and T. R. Overton. 2013. Research Update: Starch Level
and Rumensin in Fresh Cow Rations. In Proceedings of the Cornell Nutr. Conf.
McLaren, C. J., K. D. Lissemore, T. F. Duffield, K. E. Leslie, D. F. Kelton, and B. Grexton. 2006. The relationship between herd level disease incidence and a return over feed index in Ontario dairy herds. Can. Vet. J. 47:767-773.
McNamara, J. P. and F. Valdez. 2005. Adipose tissue metabolism and production responses to calcium propiontate and chromium propionate. J. Dairy Sci. 88:2498-2507.
Minor, D. J., S. L. Trower, B. D. Strang, R. D. Shaver, and R. R. Grummer. 1998. Effects of nonfiber carbohydrate and niacin on periparturient metabolic status and lactation of dairy cows. J. Dairy Sci. 80:189-200.
Morey, S. D., L. K. Mamedova, D. E. Anderson, C. K. Armendariz, E. C. Titgemeyer, and B. J. Bradford. 2011. Effects of encapsulated niacin on metabolism and production of periparturient dairy cows. J. Dairy Sci. 94:5090-5104.
Nelson, B. H., K. W. Cotanch, M. P. Carter, H. M. Gauthier, R. E. Clark, P. D. Krawczel, R. J. Grant, K. Yagi, K. Fujita, and H. M. Dann. 2011. Effect of dietary starch content in early lactation on the lactational performance of dairy cows. J. Dairy Sci. 94(E-Suppl. 1):637.
Oetzel, G. R. 2007. Herd-level ketosis – diagnosis and risk factors. Preconference Seminar 7C. 40
th Annual Conf.
Amer. Asssoc. Bovine Pract. Vancouver, BC, Canada.
Pechova, A., A Podhorsky, E. Lokajova, L. Pavlata, and J. Illek. 2002. Metabolic effects of chromium supplementation in dairy cows in the peripartal period. Acta Vet. Brno 71:9-18.
Piepenbrink, M. S., and T. R. Overton. 2003. Liver metabolism and production of cows fed increasing amounts of rumen-protected choline during the periparturient period. J. Dairy Sci. 86:1722-1733.
Rabelo, E., R. L. Rezende, S. J. Bertics, and R. R. Grummer. 2003. Effects of transition diets varying in dietary energy density on lactation performance and ruminal parameters of dairy cows. J. Dairy Sci. 86:916-925.
Rabelo, E., R. L. Rezende, S. J. Bertics, and R. R. Grummer. 2005. Effects of pre- and postfresh transition diets varying in dietary energy density on metabolic status of periparturient dairy cows. J. Dairy Sci. 88:4375-4383.
Richards, B. F. 2011. Strategies to Decrease Fatty Liver in Dairy Cows. PhD Thesis. University of Illinois, Urbana-Champaign.

65
Roche, J. R., J. K. Kay, C. V. C. Phyn, S. Meier, J. M. Lee, and C. R. Burke. 2010. Dietary structural to nonfiber carbohydrate concentration during the transition period in grazing dairy cows. J. Dairy Sci. 93:3671-3683.
Rockwell, R. J. and M. S. Allen. 2011. Effects of chromium propionate fed through the periparturient period and starch source fed postpartum on productive performance and dry matter intake of Holstein cows. J. Dairy Sci. 94(E-Suppl. 1):738.
Sadri., H., G. R. Ghorbani, H. R. Rahmani, A. H. Samie, M Khorvash, and R. M. Bruckmaier. J. Dairy Sci. 92:5411-5418.
Senatore, E. M., W. R. Butler, and P. A. Oltenacu. (1996) Relationships between energy balance and post-partum ovarian activity and fertility in first lactation dairy cows. Anim. Sci. 62:17-23.
Sharma, B. K., and R. A. Erdman. 1989. Effects of dietary and abomasally infused choline on milk production responses of lactating dairy cows. J. Nutr. 119:248-254.
Silva-del-Rio, N., P. M. Fricke, and R. R. Grummer. 2010. Effects of twin pregnancy and dry period feeding strategy on milk production, energy balance, and metabolic profiles in dairy cows. J. Anim. Sci. 88:1048-1060.
Smith, K. L., M. R. Waldron, J. K. Drackley, M. T. Socha, and T. R. Overton. 2005. Performance of dairy cows as affected by prepartum dietary carbohydrate source and supplementation with chromium throughout the transition period. J. Dairy Sci. 88:255-263.
Smith, K. L., M. R. Waldron, L. C. Ruzzi, J. K. Drackley, M. T. Socha, and T. R. Overton. 2008. Metabolism of dairy
cows as affected by prepartum dietary carbohydrate source and supplementation with chromium throughout the periparturient period. J. Dairy Sci. 91:2011-2020.
Soltan, M. A. 2010. Effect of dietary chromium supplementation on productive and reproductive performance of early lactating dairy cows under heat stress. J. Anim. Phys. Anim. Nutr. 94:264-272.
Walsh, R. B., D. F. Kelton, T. F. Duffiled, K. E, Leslie, J. S. Walton, and S. J. LeBlanc. 2007. Prevalence and risk factors for postpartum anovulatory condition in dairy cows. J. Dairy Sci. 90:315-324.
Young, J. W., J. J. Veenhuizen, J. K. Drackley, and T. R. Smith. 1990. New insights into lactation ketosis and fatty liver. Page 60 in Proc. 1990 Cornell Nutr. Conf. Feed Manufact., Cornell Univ., Ithaca, NY.
Yuan, K., R. D. Shaver, S. J. Bertics, M. Espineira, and R. R. Grummer. 2012. Effect of rumen-protected niacin on lipid metabolism, oxidative stress, and performance of transition dairy cows. J. Dairy Sci. 95:2673-2679.
Zahra, L. C., T. F. Duffiled, K. E. Leslie, T. R. Overton, D. Putnam, and S. J. LeBlanc. 2006. Effects of rumen-protected choline and monensin on milk production and metabolism of periparturient cows. J. Dairy Sci. 89:4808-4818.
Zom, R. L. G, J. van Baal, R. M. A. Goselink, J. A. Bakker, M. J. de Veth, and A. M. van Vuuren. 2011. Effect of rumen-protected choline on performance, blood metabolites, and hepatic triacylglycerols of periparturient dairy cattle. J. Dairy Sci. 94:4016-4027.

66
Table 1. Effects of Increasing Prefresh Transition Diet NFC on Pre- and Postpartum DMI and Postpartum Milk Yield.
Study Low/high NFC, %
Change in prepartum DMI,
kg/d
Change in postpartum DMI,
kg/d
Change in milk yield, kg/d
Minor et al., 1998 35/44 +1.9 DNR DNR
Mashek and Beede, 2000 35/38 DNR DNR NS
Keady et al., 2001 13/28 +1.7 NS NS
Holcomb et al., 2001 25/30 +3.4 NS NS
Doepel et al., 2001 24/30 NS NS NS
Rabelo et al., 2003&2005 38/45 +1.7 NS NS
Smith et al., 2005 34/40 NS NS NS
Kamiya et al., 2006 28/33 +1.7 NS NS
Guo et al., 2007 26/39 +2.6 NA NA
Roche et al., 2010 13/32 DNR DNR NS
DNR = Did not report, NS = Non-significant difference (P ≥ 0.05), NA = Non-applicable.
Table 2. Meta-analysis of 13 transition cow trials that examined the effects of feeding rumen-protected choline (RPC) (Grummer and Crump, unpublished).
Control RPC SEd P-value
DMI, lb/d 39.98 41.60 0.460 <0.01
Milk, lb/d 70.88 77.75 0.750 <0.01
ECM, lb/d 76.87 82.78 1.330 <0.01
Fat yield, lb/d 2.79 3.04 0.086 0.02
Protein yield, lb/d 2.30 2.48 0.053 0.01