geostatistics exploratory spatial data analysis
TRANSCRIPT
11
Master of Science in Geospatial Master of Science in Geospatial TechnologiesTechnologies
GeostatisticsGeostatisticsExploratory Spatial Data Exploratory Spatial Data
AnalysisAnalysis
Instituto Superior de Estatística e Gestão de InformaçãoUniversidade Nova de Lisboa
Carlos Alberto FelgueirasCarlos Alberto [email protected]@isegi.unl.pt
Master of Science in Geoespatial Technologies
Geostatistics Geostatistics –– Exploratory Spatial Data AnalysisExploratory Spatial Data Analysis
EDA x ESDA
Exploratory Data Analysis x Exploratory Spatial Data Analysis
From Isaaks and Srivastava
• Earth Science data contains spatial position.
• Spatial Description means incorporate data location in our datadescriptions.
Spatial Features of the data set:
Location of extreme values,
Overall trend and
Degree of continuity
22
Master of Science in Geoespatial Technologies
ContentsSPATIAL DESCRIPTION
Data Posting
Contour Maps
Gray Scale Maps
Indicator Maps
Moving Window Statistics
Proportional Effect
SPATIAL CONTINUITY ANALYSIS
h-ScatterPlots
Covariance Functions
Correlation Functions
Semivariogram Functions
Semivariogram Surfaces
Unidirectional Semivariograms
Geostatistics Geostatistics –– Exploratory Spatial Data AnalysisExploratory Spatial Data Analysis
33
Exploratory Spatial Data AnalysisExploratory Spatial Data AnalysisESDA ESDA
Master of Science in Geoespatial Technologies
SpatialSpatialDescriptionDescription
44
Master of Science in Geoespatial Technologies
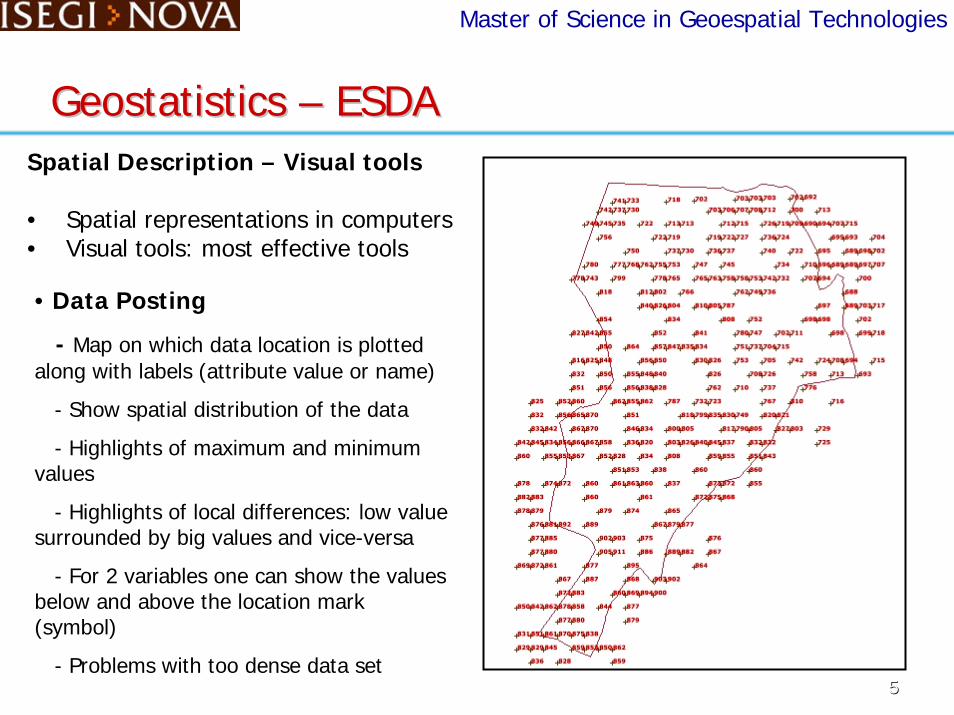
Geostatistics Geostatistics –– ESDAESDASpatial Description – Visual tools
• Spatial representations in computers• Visual tools: most effective tools
• Data Posting
- Map on which data location is plotted along with labels (attribute value or name)
- Show spatial distribution of the data
- Highlights of maximum and minimum values
- Highlights of local differences: low value surrounded by big values and vice-versa
- For 2 variables one can show the values below and above the location mark (symbol)
- Problems with too dense data set55
Master of Science in Geoespatial Technologies
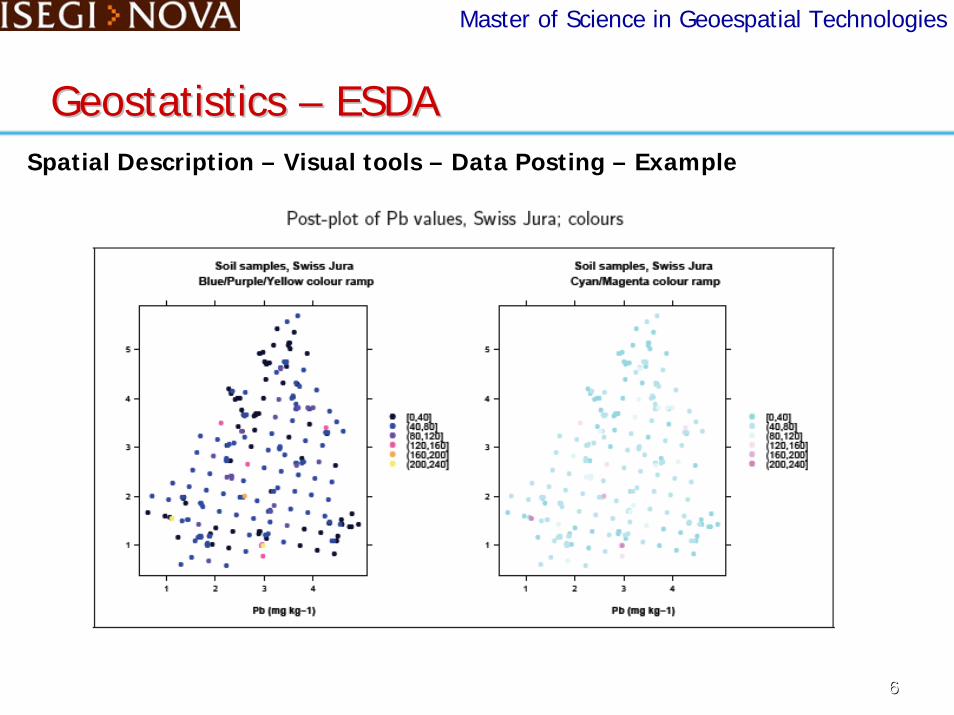
Geostatistics Geostatistics –– ESDAESDASpatial Description – Visual tools – Data Posting – Example
66
77
Master of Science in Geoespatial Technologies
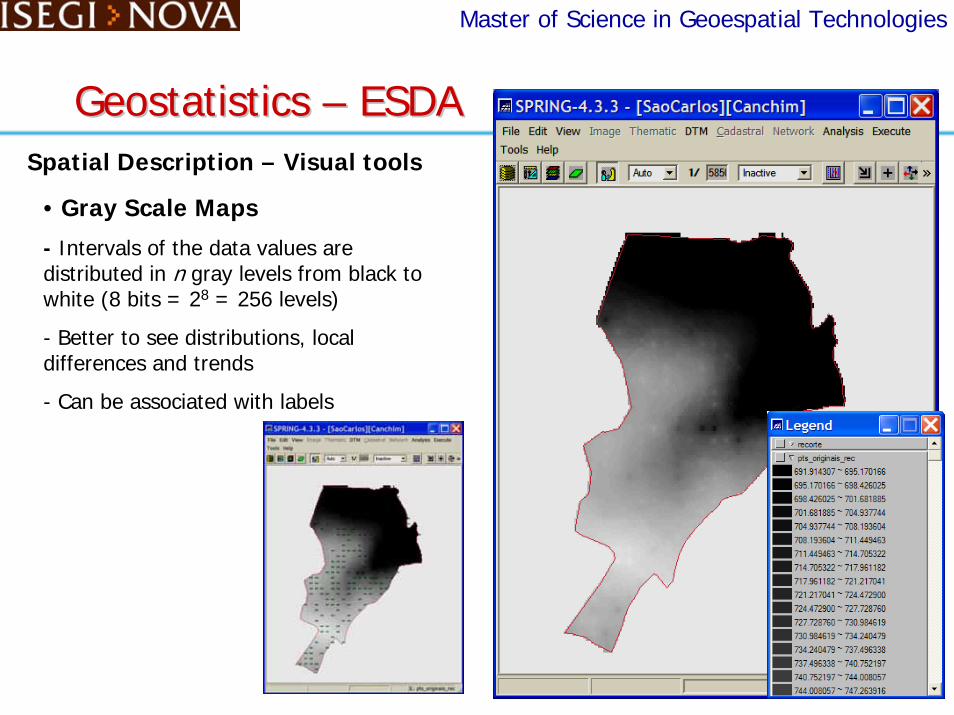
Spatial Description – Visual tools
• Gray Scale Maps
- Intervals of the data values are distributed in n gray levels from black to white (8 bits = 28 = 256 levels)
- Better to see distributions, local differences and trends
- Can be associated with labels
Geostatistics Geostatistics –– ESDAESDA
Master of Science in Geoespatial Technologies
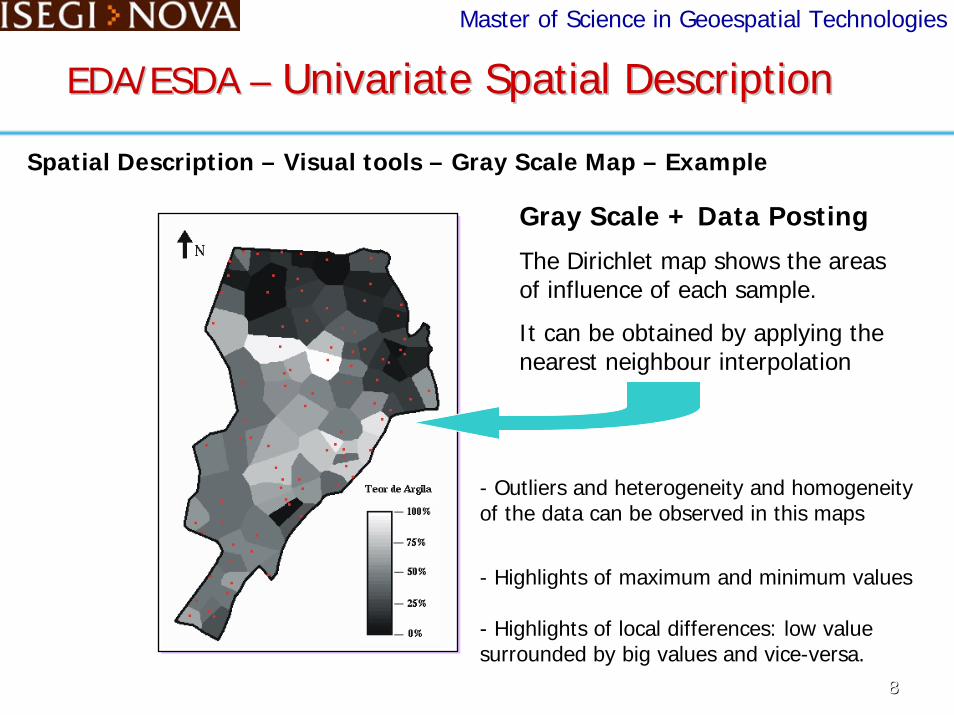
EDA/ESDA EDA/ESDA –– Univariate Spatial DescriptionUnivariate Spatial Description
Gray Scale + Data Posting
The Dirichlet map shows the areas of influence of each sample.
It can be obtained by applying the nearest neighbour interpolation
- Outliers and heterogeneity and homogeneity of the data can be observed in this maps
- Highlights of maximum and minimum values
- Highlights of local differences: low value surrounded by big values and vice-versa.
Spatial Description – Visual tools – Gray Scale Map – Example
88
99
Master of Science in Geoespatial Technologies
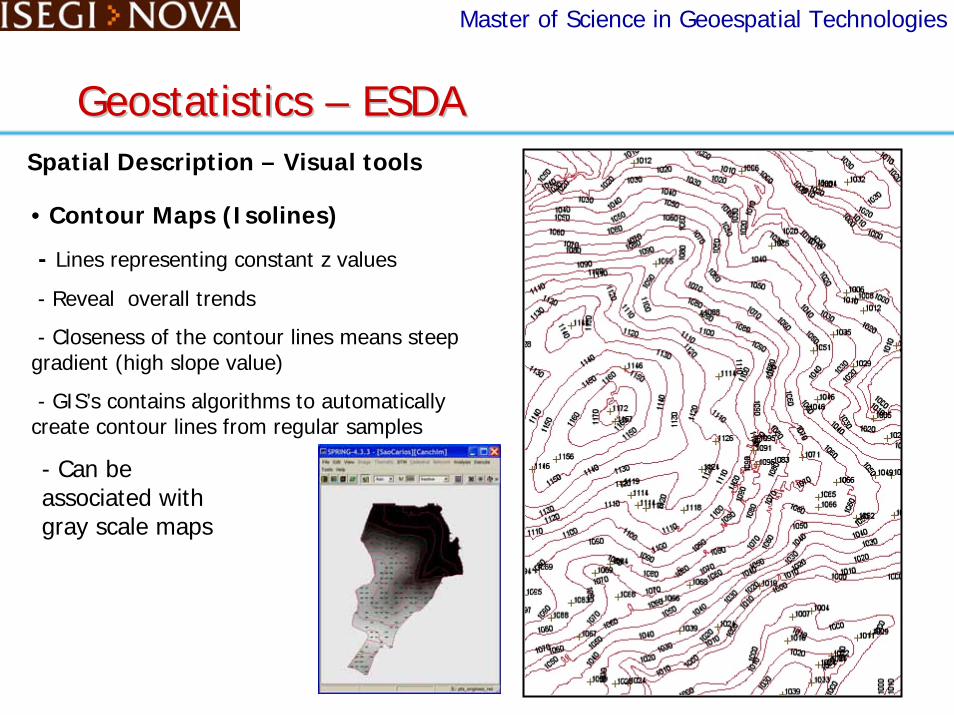
Spatial Description – Visual tools
• Contour Maps (Isolines)
- Lines representing constant z values
- Reveal overall trends
- Closeness of the contour lines means steep gradient (high slope value)
- GIS’s contains algorithms to automatically create contour lines from regular samples
Geostatistics Geostatistics –– ESDAESDA
- Can be associated with gray scale maps
Master of Science in Geoespatial Technologies
Geostatistics Geostatistics –– Exploratory Spatial Data AnalysisExploratory Spatial Data AnalysisSpatial Description – Visual tools
1010
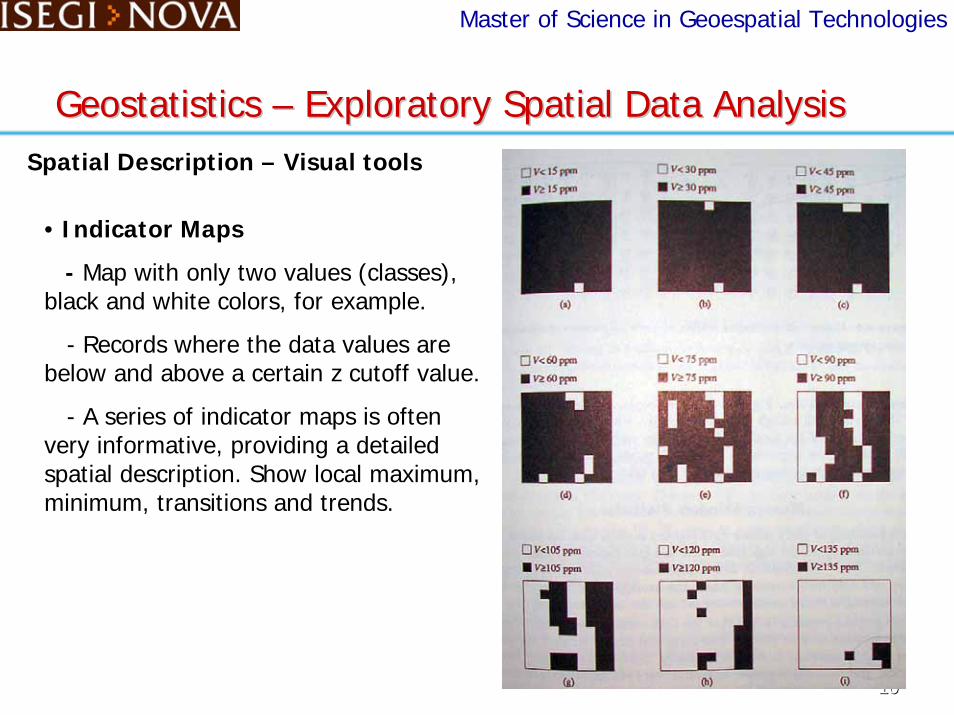
• Indicator Maps
- Map with only two values (classes), black and white colors, for example.
- Records where the data values are below and above a certain z cutoff value.
- A series of indicator maps is often very informative, providing a detailed spatial description. Show local maximum, minimum, transitions and trends.
1111
Master of Science in Geoespatial Technologies
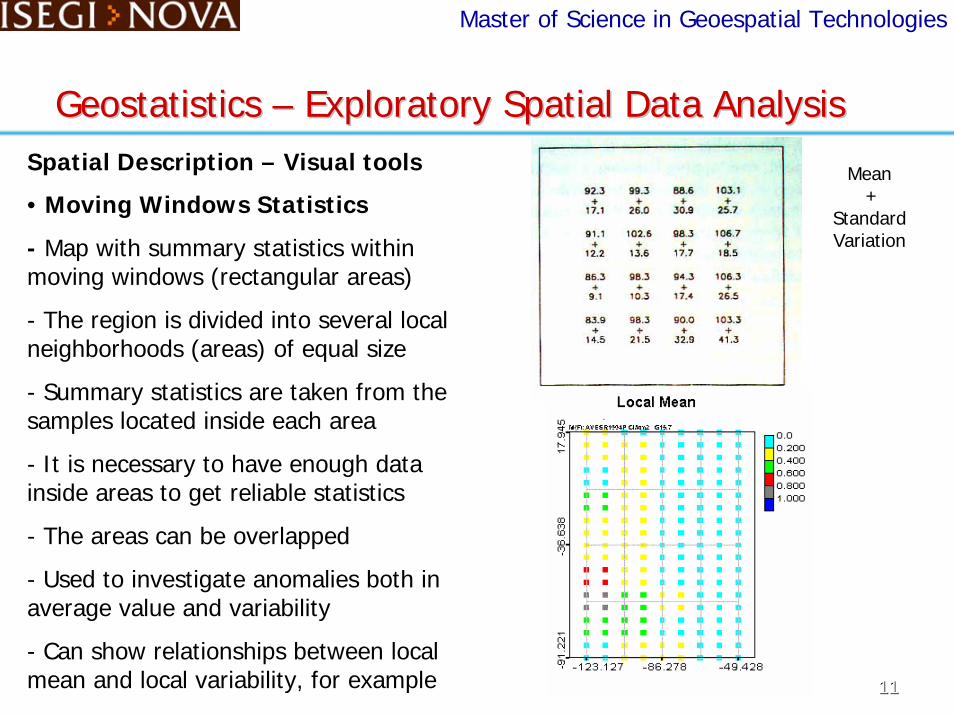
Spatial Description – Visual tools
• Moving Windows Statistics
- Map with summary statistics within moving windows (rectangular areas)
- The region is divided into several local neighborhoods (areas) of equal size
- Summary statistics are taken from the samples located inside each area
- It is necessary to have enough data inside areas to get reliable statistics
- The areas can be overlapped
- Used to investigate anomalies both in average value and variability
- Can show relationships between local mean and local variability, for example
Mean+
Standard Variation
Geostatistics Geostatistics –– Exploratory Spatial Data AnalysisExploratory Spatial Data Analysis
1212
Master of Science in Geoespatial Technologies
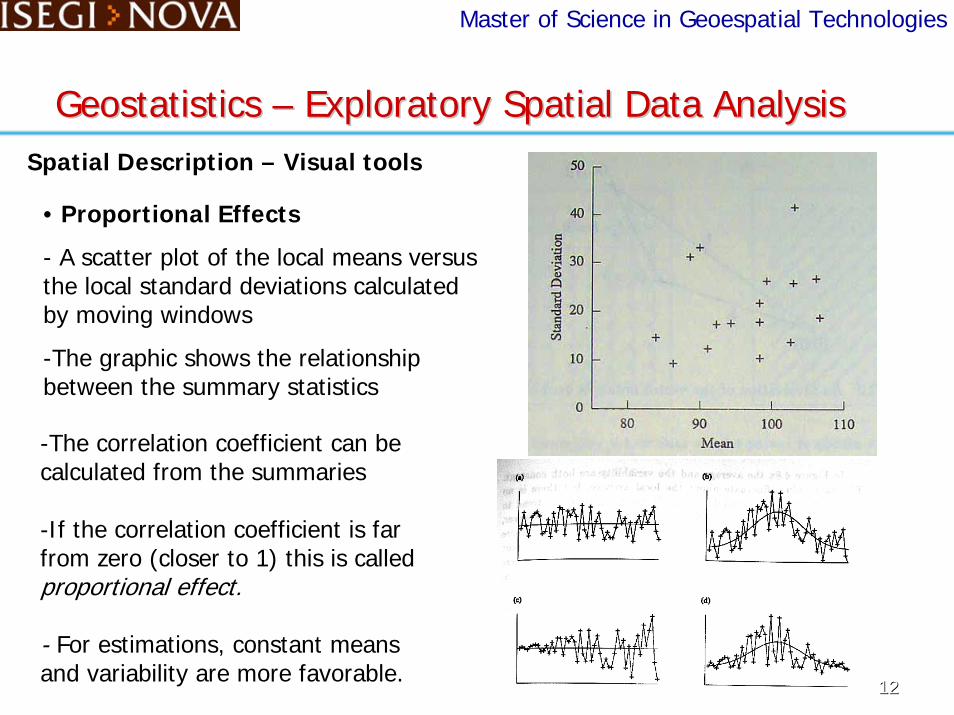
Spatial Description – Visual tools
• Proportional Effects
- A scatter plot of the local means versus the local standard deviations calculated by moving windows
-The graphic shows the relationship between the summary statistics
Geostatistics Geostatistics –– Exploratory Spatial Data AnalysisExploratory Spatial Data Analysis
-The correlation coefficient can be calculated from the summaries
-If the correlation coefficient is far from zero (closer to 1) this is called proportional effect.
- For estimations, constant means and variability are more favorable.

Exploratory Spatial Data AnalysisExploratory Spatial Data AnalysisESDA ESDA
Master of Science in Geoespatial Technologies
SpatialSpatialContinuityContinuity
1313
Master of Science in Geoespatial Technologies
Geostatistics Geostatistics –– Exploratory Spatial Data AnalysisExploratory Spatial Data AnalysisSpatial Continuity – Visual tools
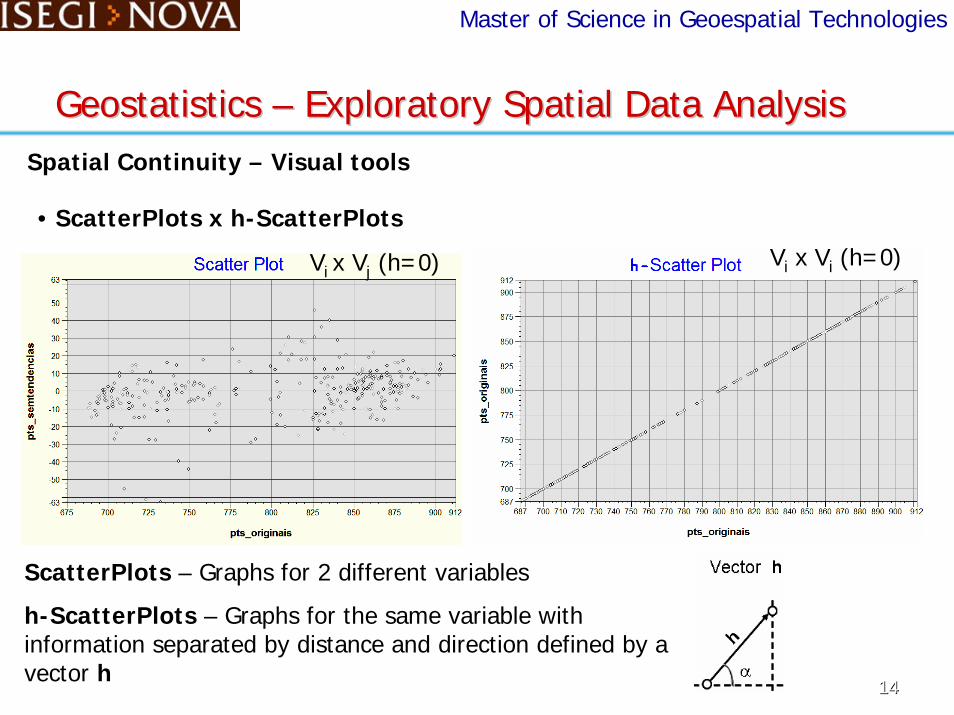
• ScatterPlots x h-ScatterPlots
Vi x Vi (h=0)Vi x Vj (h=0)
ScatterPlots – Graphs for 2 different variables
h-ScatterPlots – Graphs for the same variable with information separated by distance and direction defined by a vector h
1414
Master of Science in Geoespatial Technologies
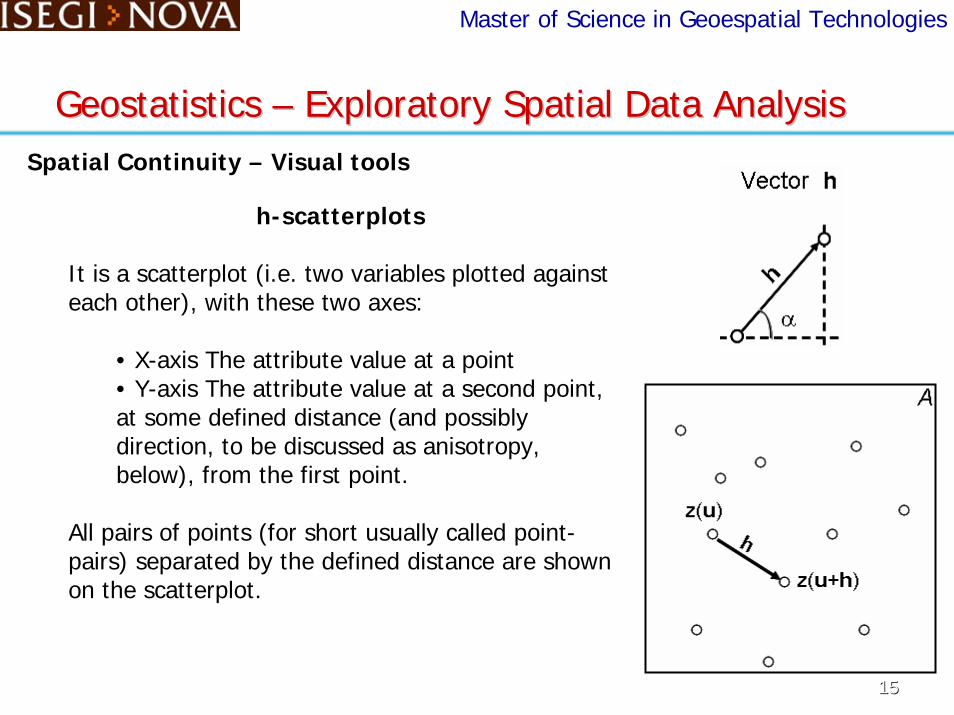
h-scatterplots
It is a scatterplot (i.e. two variables plotted against each other), with these two axes:
• X-axis The attribute value at a point• Y-axis The attribute value at a second point, at some defined distance (and possibly direction, to be discussed as anisotropy, below), from the first point.
All pairs of points (for short usually called point-pairs) separated by the defined distance are shown on the scatterplot.
Geostatistics Geostatistics –– Exploratory Spatial Data AnalysisExploratory Spatial Data AnalysisSpatial Continuity – Visual tools
1515
Master of Science in Geoespatial Technologies
Geostatistics Geostatistics –– Exploratory Spatial Data AnalysisExploratory Spatial Data AnalysisSpatial Continuity – Visual tools
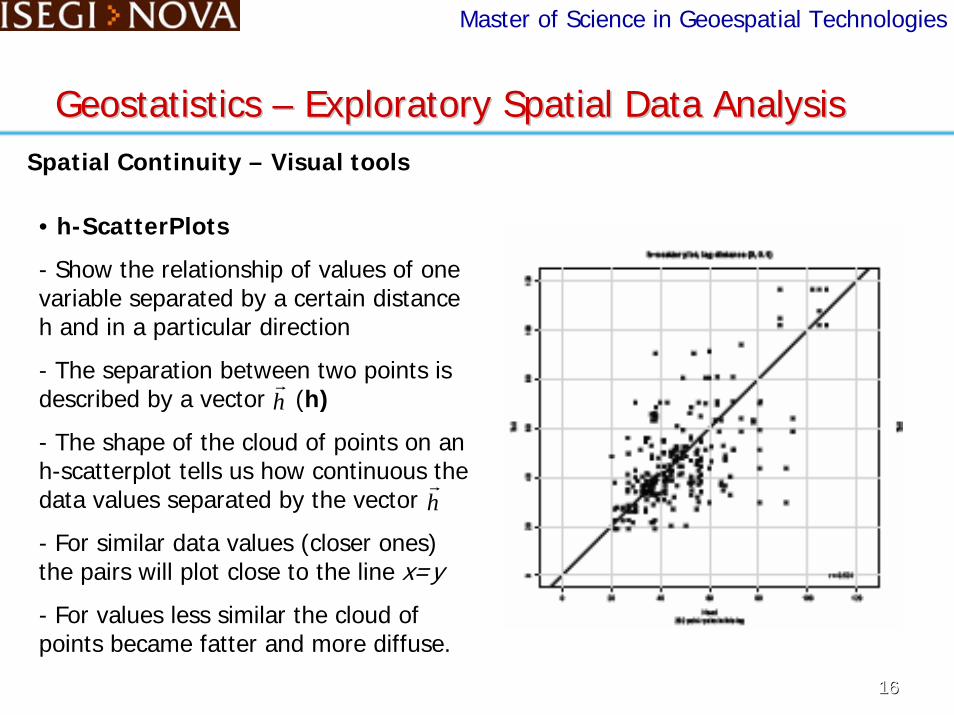
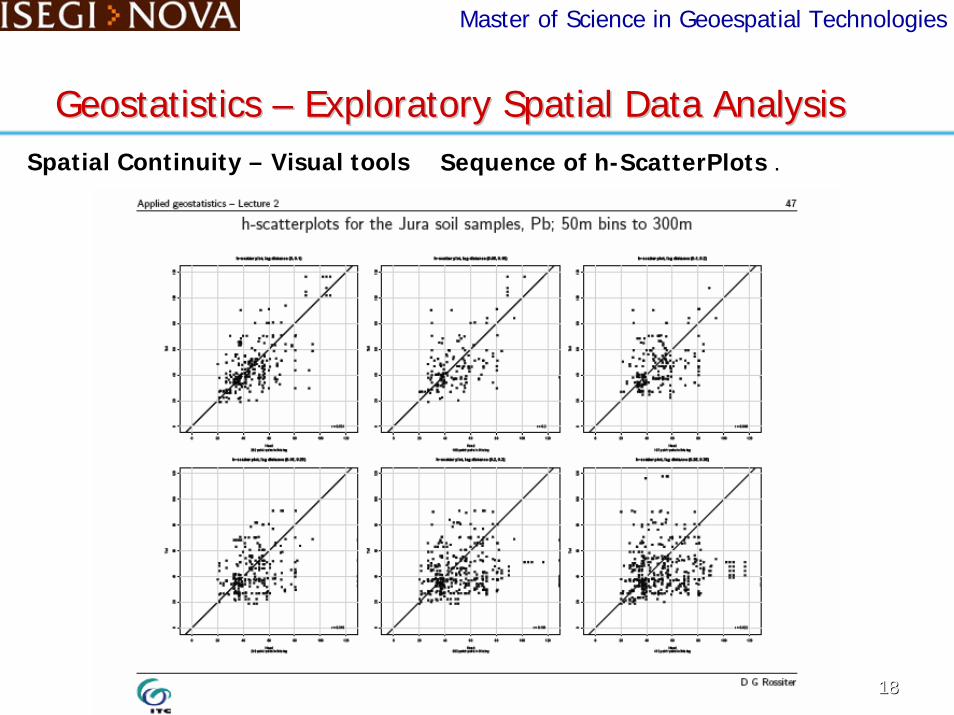
• h-ScatterPlots
- Show the relationship of values of one variable separated by a certain distance h and in a particular direction
- The separation between two points is described by a vector (h)
- The shape of the cloud of points on an h-scatterplot tells us how continuous the data values separated by the vector
- For similar data values (closer ones) the pairs will plot close to the line x=y
- For values less similar the cloud of points became fatter and more diffuse.
hr
hr
1616
Master of Science in Geoespatial Technologies
Spatial Continuity – Visual tools
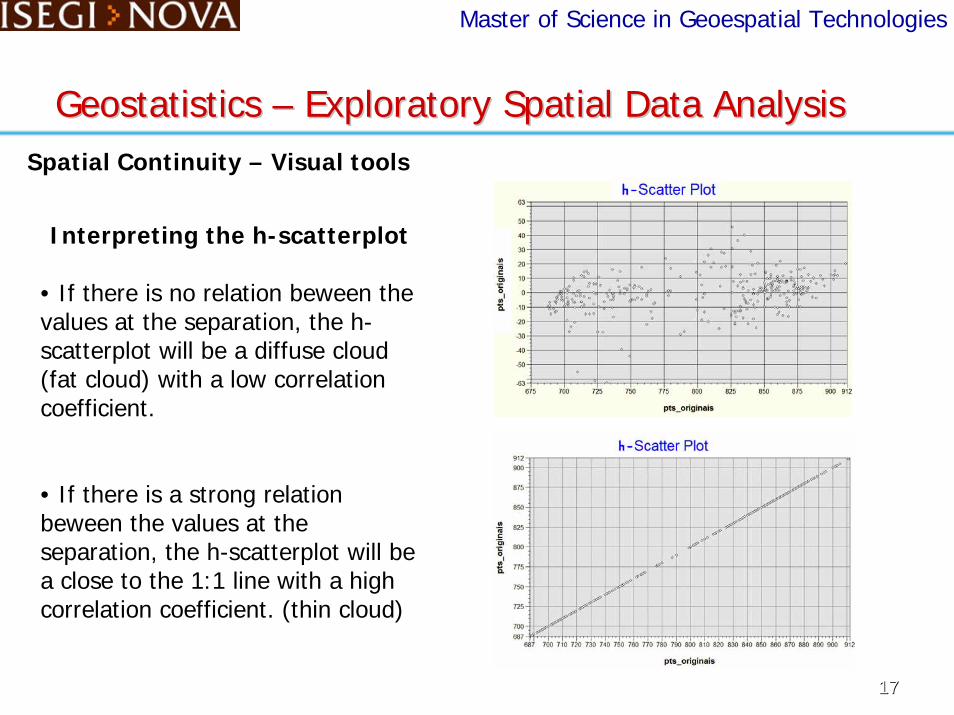
Interpreting the h-scatterplot
• If there is no relation beween the values at the separation, the h-scatterplot will be a diffuse cloud (fat cloud) with a low correlation coefficient.
• If there is a strong relation beween the values at the separation, the h-scatterplot will be a close to the 1:1 line with a high correlation coefficient. (thin cloud)
Geostatistics Geostatistics –– Exploratory Spatial Data AnalysisExploratory Spatial Data Analysis
1717
1818
Master of Science in Geoespatial Technologies
Spatial Continuity – Visual tools Sequence of h-ScatterPlots .
Geostatistics Geostatistics –– Exploratory Spatial Data AnalysisExploratory Spatial Data Analysis
Master of Science in Geoespatial Technologies
Geostatistics Geostatistics –– Exploratory Spatial Data AnalysisExploratory Spatial Data AnalysisSpatial Continuity – Measures and Visual tools
Indices of Spatial Continuity
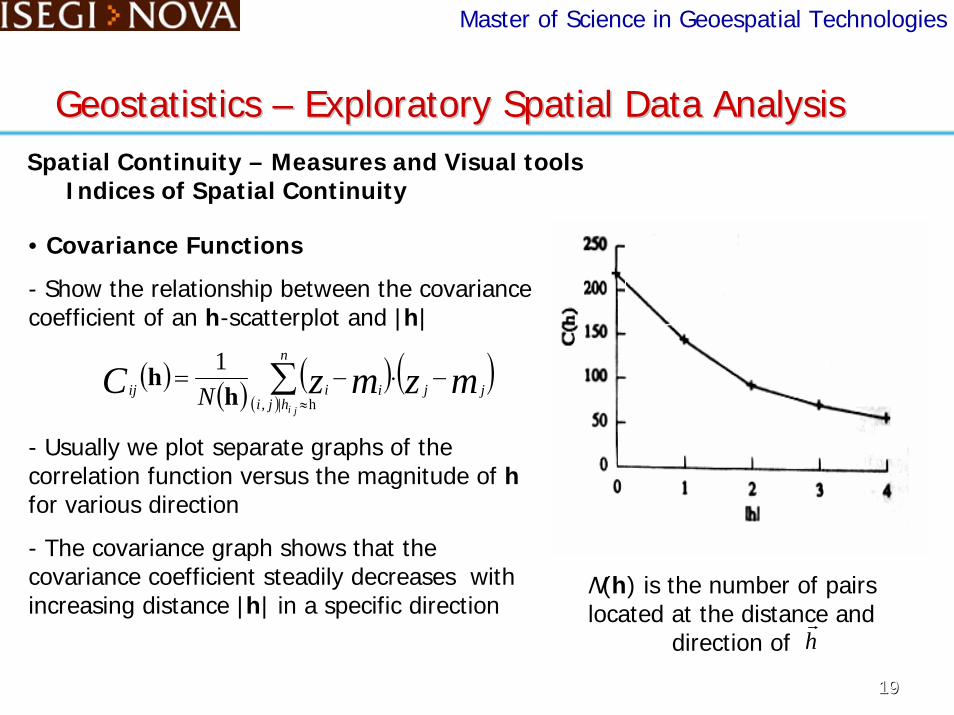
• Covariance Functions
- Show the relationship between the covariance coefficient of an h-scatterplot and |h|
- Usually we plot separate graphs of the correlation function versus the magnitude of hfor various direction
- The covariance graph shows that the covariance coefficient steadily decreases with increasing distance |h| in a specific direction
( ) ( ) ( )( )
( )mzmzC jj
n
hjiiiij
jiN
−⋅−= ∑≈h|,
1h
h
N(h) is the number of pairs located at the distance and
direction of hr
1919
Master of Science in Geoespatial Technologies
Geostatistics Geostatistics –– Exploratory Spatial Data AnalysisExploratory Spatial Data AnalysisSpatial Continuity – Measures and Visual toolsIndices of Spatial Continuity
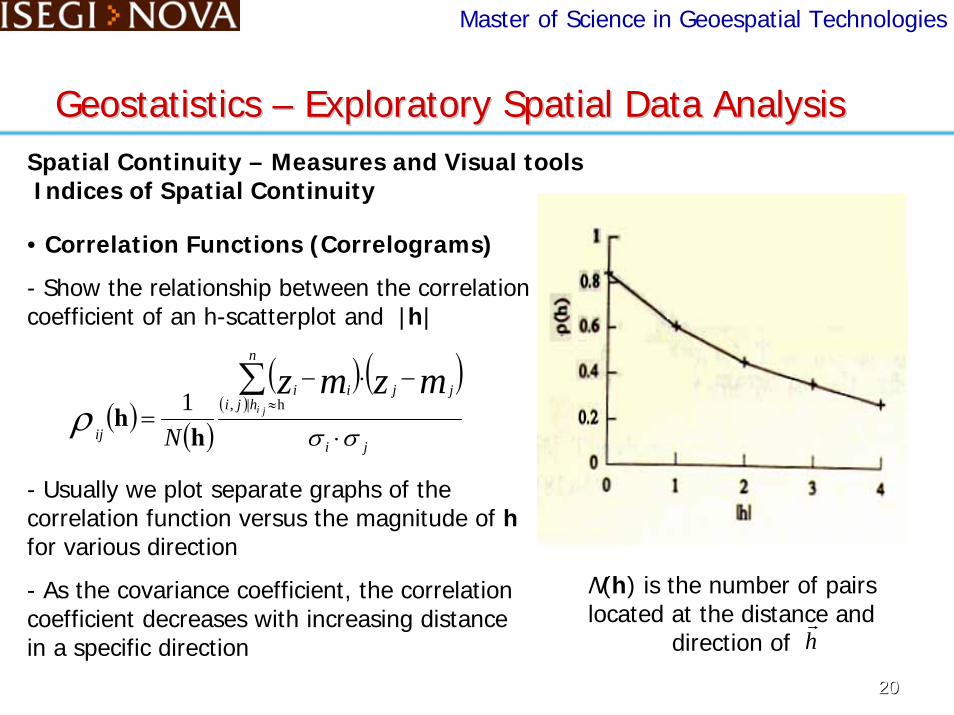
• Correlation Functions (Correlograms)
- Show the relationship between the correlation coefficient of an h-scatterplot and |h|
- Usually we plot separate graphs of the correlation function versus the magnitude of hfor various direction
- As the covariance coefficient, the correlation coefficient decreases with increasing distance in a specific direction
( ) ( )
( )( )
( )ji
jj
n
hjiii
ij
mzmzji
N σσρ ⋅
−⋅−
=∑
≈h|,1h
h
N(h) is the number of pairs located at the distance and
direction of hr
2020
Master of Science in Geoespatial Technologies
Geostatistics Geostatistics –– Exploratory Spatial Data AnalysisExploratory Spatial Data AnalysisSpatial Continuity – Measures and Visual tools
Indices of Spatial Continuity
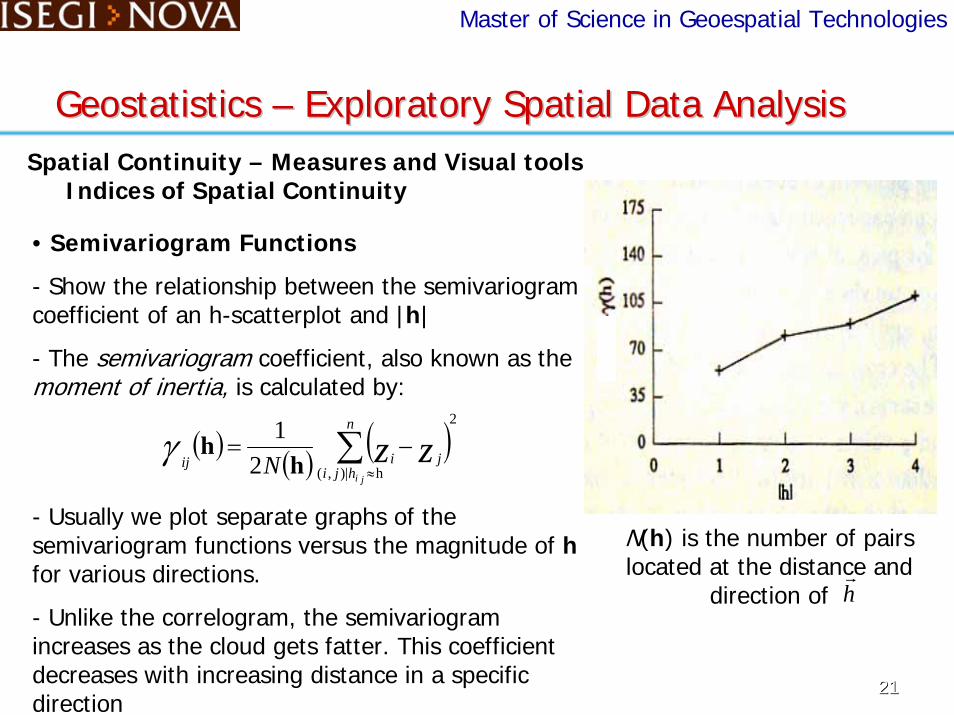
N(h) is the number of pairs located at the distance and
direction of hr
• Semivariogram Functions
- Show the relationship between the semivariogram coefficient of an h-scatterplot and |h|
- The semivariogram coefficient, also known as the moment of inertia, is calculated by:
- Usually we plot separate graphs of the semivariogram functions versus the magnitude of hfor various directions.
- Unlike the correlogram, the semivariogram increases as the cloud gets fatter. This coefficient decreases with increasing distance in a specific direction
( ) ( ) ( )2
h)|,(21 ∑
≈
−=n
hjijiij
ji
zzN hhγ
2121
Master of Science in Geoespatial Technologies
Geostatistics Geostatistics –– Exploratory Spatial Data AnalysisExploratory Spatial Data AnalysisSpatial Continuity – Measures and Visual tools
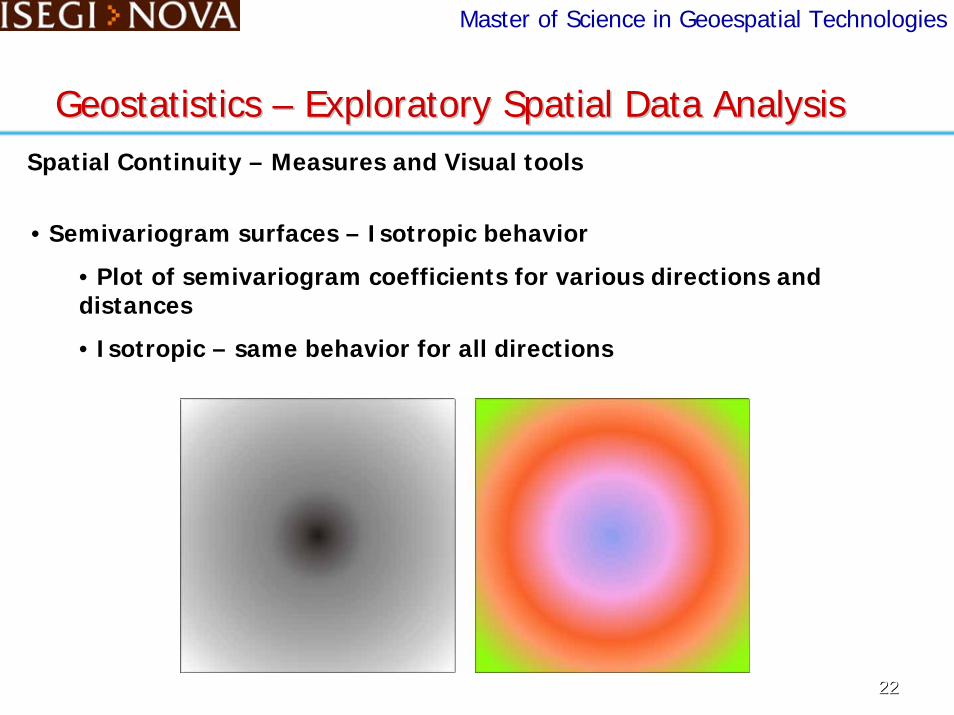
• Semivariogram surfaces – Isotropic behavior
• Plot of semivariogram coefficients for various directions and distances
• Isotropic – same behavior for all directions
2222
2323
Master of Science in Geoespatial Technologies
Spatial Continuity – Measures and Visual tools
O
N
S
L O
N
S
L
Imagem nível de cinza Composição Colorida
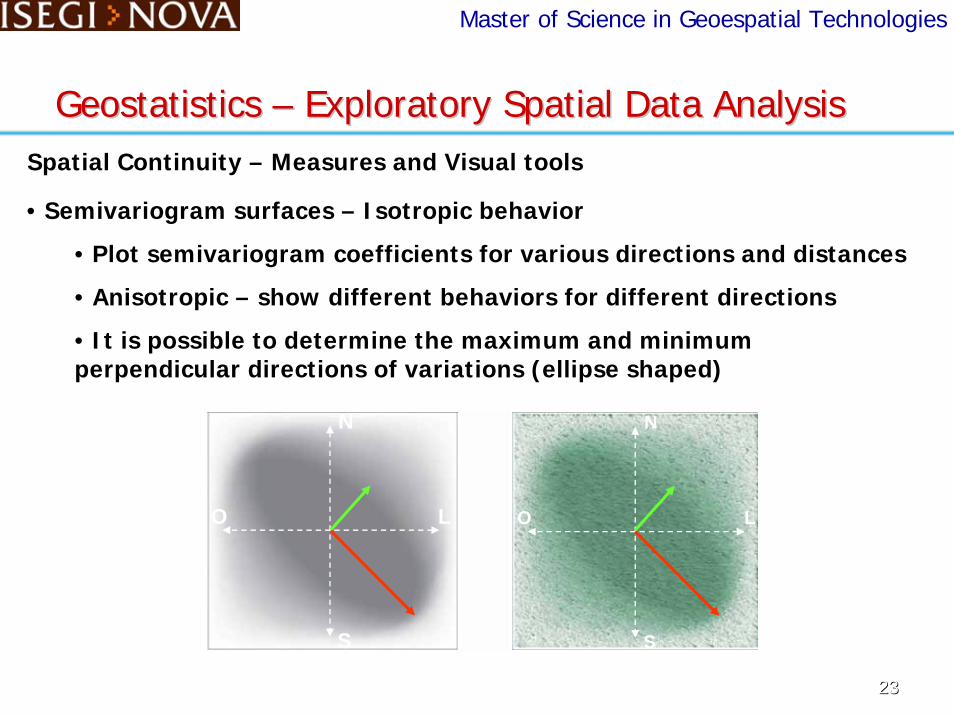
• Semivariogram surfaces – Isotropic behavior
• Plot semivariogram coefficients for various directions and distances
• Anisotropic – show different behaviors for different directions
• It is possible to determine the maximum and minimum perpendicular directions of variations (ellipse shaped)
Geostatistics Geostatistics –– Exploratory Spatial Data AnalysisExploratory Spatial Data Analysis
2424
Master of Science in Geoespatial Technologies
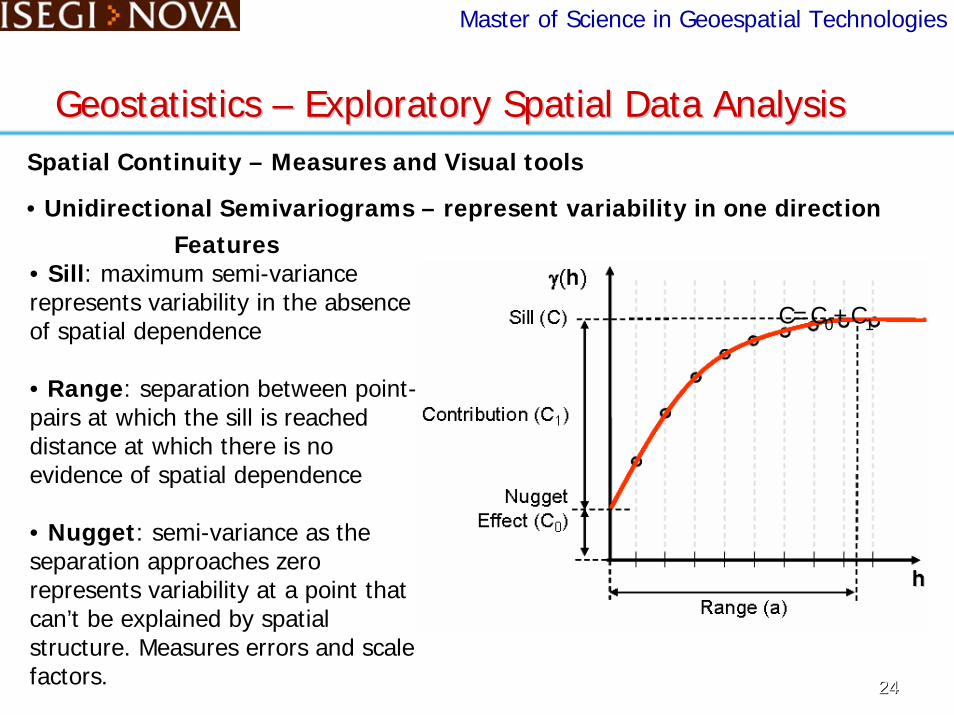
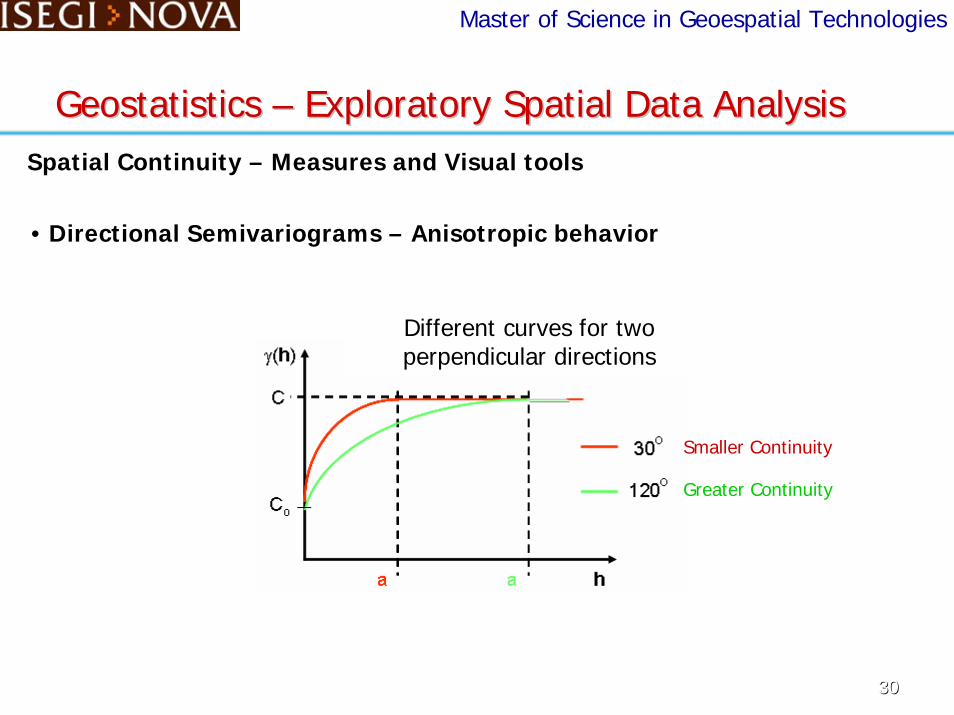
• Unidirectional Semivariograms – represent variability in one directionFeatures
• Sill: maximum semi-variance represents variability in the absence of spatial dependence
• Range: separation between point-pairs at which the sill is reached distance at which there is no evidence of spatial dependence
• Nugget: semi-variance as the separation approaches zero represents variability at a point that can’t be explained by spatial structure. Measures errors and scale factors.
C=C0+C1
Geostatistics Geostatistics –– Exploratory Spatial Data AnalysisExploratory Spatial Data AnalysisSpatial Continuity – Measures and Visual tools
Master of Science in Geoespatial Technologies
Geostatistics Geostatistics –– Exploratory Spatial Data AnalysisExploratory Spatial Data AnalysisSpatial Continuity – Measures and Visual tools
Indices of Spatial Continuity
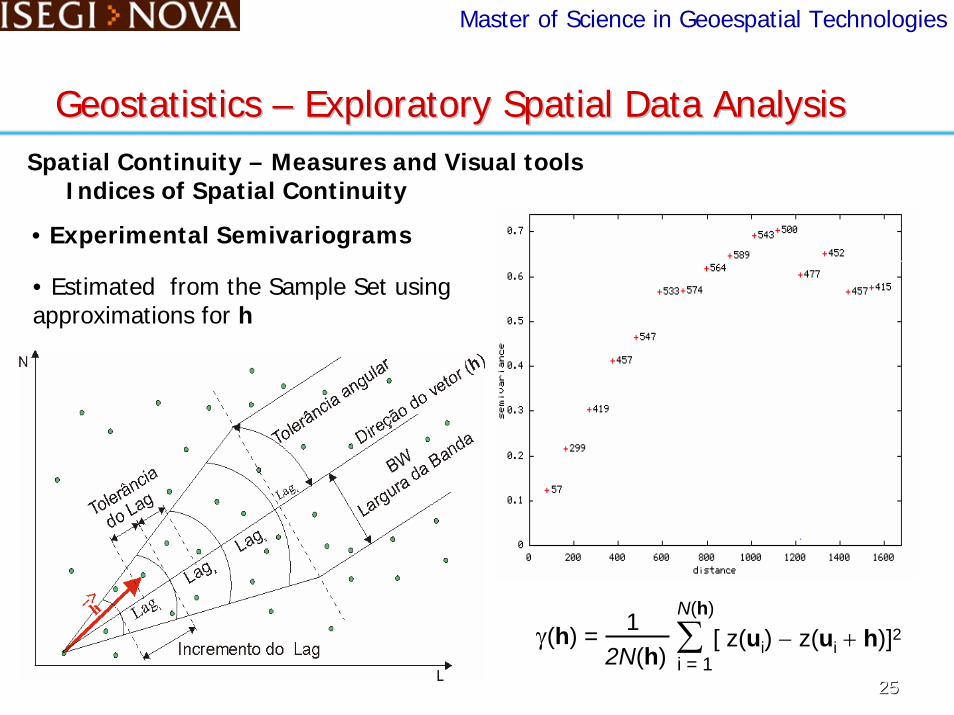
• Experimental Semivariograms
• Estimated from the Sample Set using approximations for h
[ z(ui) − z(ui + h)]22N(h)
1 ∑i = 1
N(h)γ(h) = ^
2525
Master of Science in Geoespatial Technologies
Geostatistics Geostatistics –– Exploratory Spatial Data AnalysisExploratory Spatial Data AnalysisSpatial Continuity – Measures and Visual tools
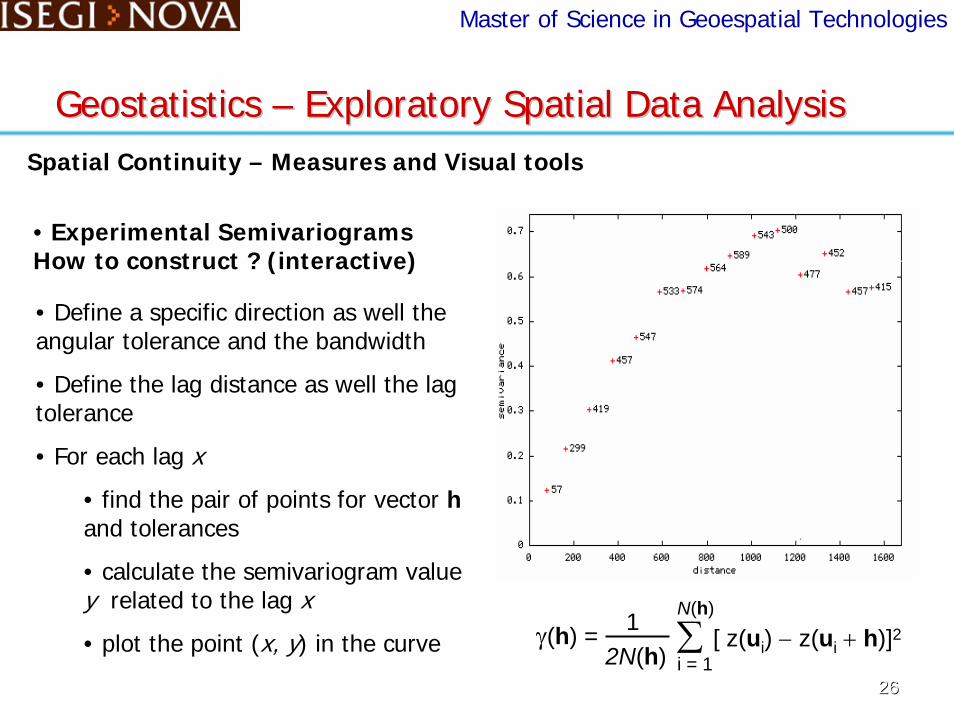
• Experimental Semivariograms How to construct ? (interactive)
• Define a specific direction as well the angular tolerance and the bandwidth
• Define the lag distance as well the lag tolerance
• For each lag x
• find the pair of points for vector hand tolerances
• calculate the semivariogram value y related to the lag x
• plot the point (x, y) in the curve [ z(ui) − z(ui + h)]22N(h)
1 ∑i = 1
N(h)γ(h) = ^
2626
Master of Science in Geoespatial Technologies
Geostatistics Geostatistics –– Exploratory Spatial Data AnalysisExploratory Spatial Data AnalysisSpatial Continuity – Measures and Visual tools
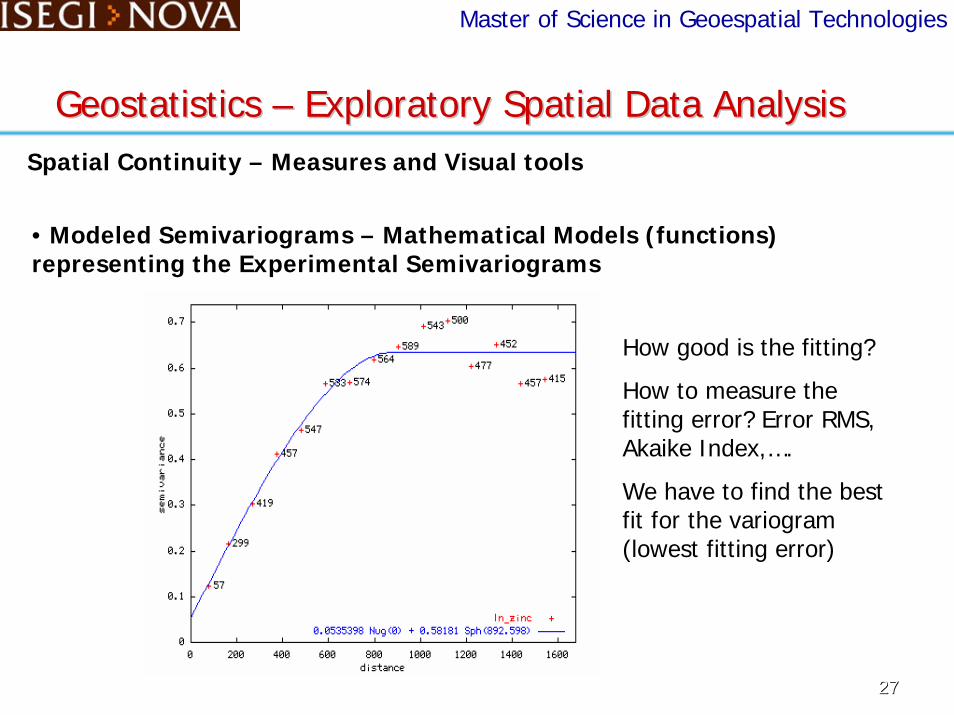
• Modeled Semivariograms – Mathematical Models (functions) representing the Experimental Semivariograms
How good is the fitting?
How to measure the fitting error? Error RMS, Akaike Index,….
We have to find the best fit for the variogram(lowest fitting error)
2727
Master of Science in Geoespatial Technologies
Geostatistics Geostatistics –– Exploratory Spatial Data AnalysisExploratory Spatial Data AnalysisSpatial Continuity – Measures and Visual tools
2828
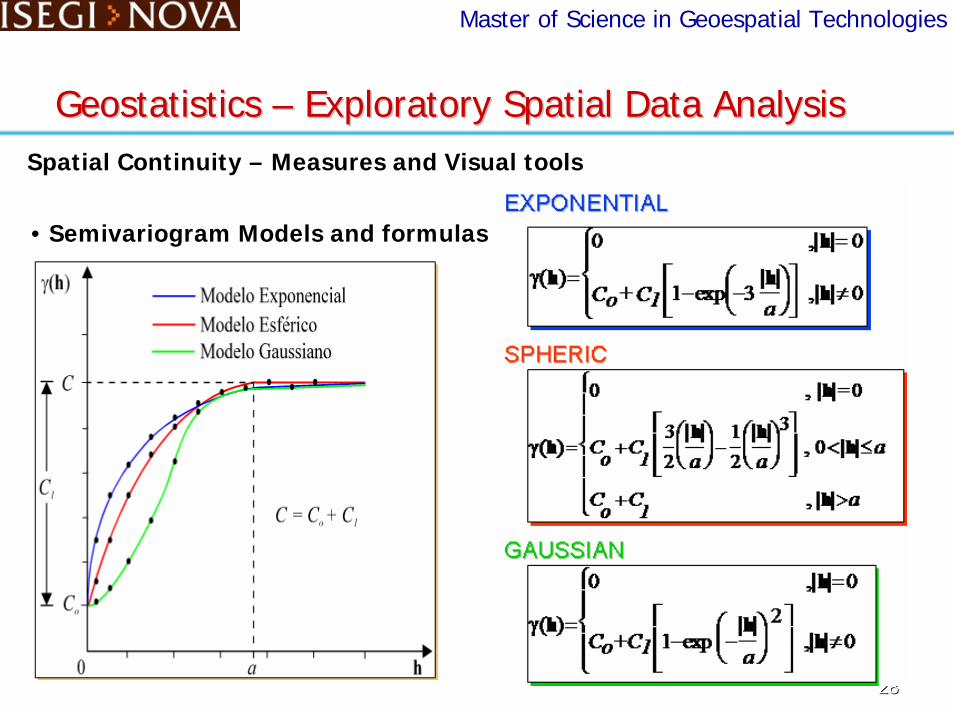
• Semivariogram Models and formulas
Master of Science in Geoespatial Technologies
Geostatistics Geostatistics –– Exploratory Spatial Data AnalysisExploratory Spatial Data AnalysisSpatial Continuity – Measures and Visual tools
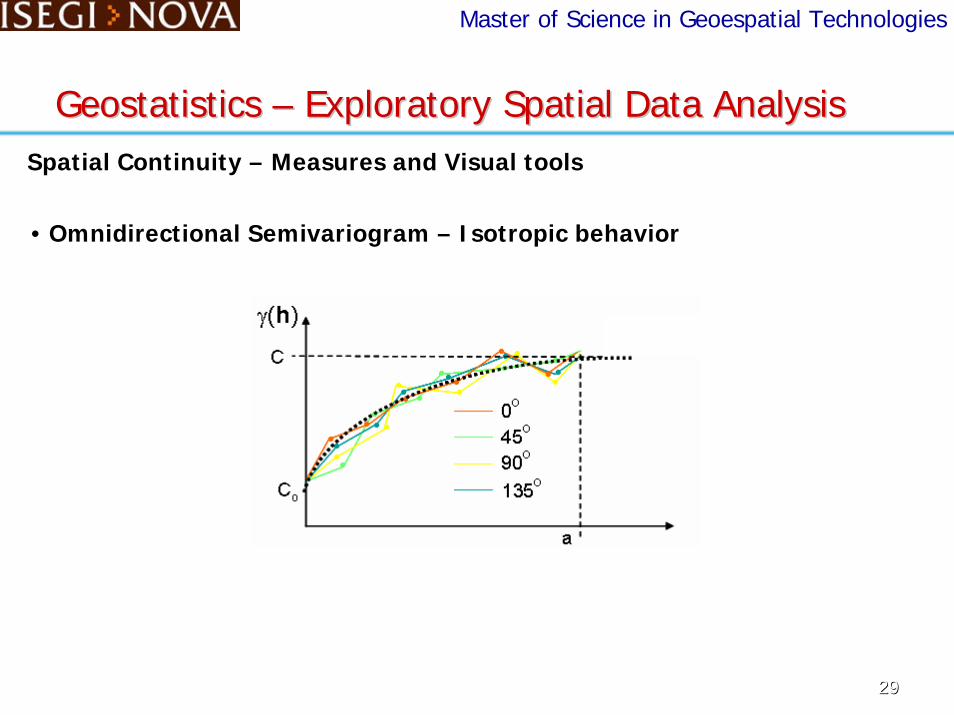
• Omnidirectional Semivariogram – Isotropic behavior
2929
Master of Science in Geoespatial Technologies
Geostatistics Geostatistics –– Exploratory Spatial Data AnalysisExploratory Spatial Data AnalysisSpatial Continuity – Measures and Visual tools
• Directional Semivariograms – Anisotropic behavior
Different curves for two perpendicular directions
Smaller Continuity
Greater Continuity
3030
Master of Science in Geoespatial Technologies
Geostatistics Geostatistics –– Exploratory Spatial Data AnalysisExploratory Spatial Data AnalysisSpatial Continuity – Measures and Visual tools
• h-CrossScattergrams, …, CrossVariograms ?
- To be continued….
• Modeling Variograms
• Isotropics – Single and Nested Models
• Anisotropics
- To be continued….
3131

Master of Science in Geoespatial Technologies
ESDA ESDA –– Summary and ConclusionsSummary and Conclusions
Summary and Conclusions
• ESDA provides a set of robust tools for exploring spatial data, which do not require a knowledge of advanced statistics for their use.
• GIS are currently only poorly equipped with many of these tools, despite containing the basic functionality to allow them to be implemented.
• The experimental and modeled variograms are the most important tools to represent the variability of an attribute in space. The modeled variograms are the bases to predictions and simulations performed by geostatistics procedures.
3232
Master of Science in Geoespatial Technologies
Geostatistics Geostatistics –– Exploratory Spatial Data AnalysisExploratory Spatial Data Analysis
Exercises
1. Try to create Experimental and Modeled OmnidirectionalSemiVariograms for the sample sets (pts_originais and pts_semtendencias) of the Canchim area.
2. Report the problems you have found on creating the experimental semivariograms and modeling them.
3. Run the Lab2 to be available soon in the geostatistics course area of ISEGI online.
3333
Master of Science in Geoespatial Technologies
Geostatistics Geostatistics –– MotivationMotivation
END of Presentation
3434