geologia e hidrogeologia del - bund
TRANSCRIPT
GEOLOGIA E HIDROGEOLOGIA DEL
VALLE CENTRAL DE COCHABAMBA
GEOLOGY AND HYDROGEOLOGY OF THE CENTRAL VALLEY OF COCHABAMBA
CONVENIO ALEMAN BOLIVIANO DE AGUAS SUBTERRANEAS (CABAS)
German Bolivian Agreement on Groundwater (CABAS)
Sven Renner & Carlos Velasco
i
GEOLOGIA E HIDROGEOLOGIA DEL
VALLE CENTRAL DE COCHABAMBA GEOLOGY AND HYDROGEOLOGY OF THE CENTRAL VALLEY
OF COCHABAMBA
CONVENIO ALEMAN BOLIVIANO DE AGUAS SUBTERRANEAS (CABAS)
German Bolivian Agreement on Groundwater (CABAS)
I N D I C E / I N D E X
Página, page
INDICE DE FIGURAS / INDEX OF FIGURES............................................................................................. v
INDICE DE MAPAS DETALLADOS / INDEX OF DETAILED MAPS .....................................................vii
ABREVIACIONES / ABBREVIATIONS .....................................................................................................viii
1 INTRODUCCION ..................................................................................................................................... 1
1 INTRODUCTION ..................................................................................................................................... 1
2 ASPECTOS GENERALES DE LA CUENCA DEL VALLE CENTRAL DE COCHABAMBA............ 4
2 GENERAL ASPECTS OF THE BASIN OF THE COCHABAMBA CENTRAL VALLEY................... 4 2.1 Descripción del área........................................................................................................................... 5
2.1 Description of the area ....................................................................................................................... 5
2.2 Clima.................................................................................................................................................. 8
2.2 Climate............................................................................................................................................... 8
2.2.1 Precipitaciones .................................................................................................................................. 9
2.2.1 Precipitation ...................................................................................................................................... 9 2.2.2 Temperatura ............................................................................................................................. 11 2.2.2 Temperature............................................................................................................................. 11 2.2.3 Evapotranspiración potencial................................................................................................... 13 2.2.3 Potential evapotranspiration ................................................................................................... 13
2.3 Vegetación ....................................................................................................................................... 13
2.3 Vegetation........................................................................................................................................ 13
2.4 Ambiente hidrográfico ..................................................................................................................... 13
2.4 Hydrographic environment .............................................................................................................. 13
2.5 Aguas superficiales .......................................................................................................................... 14
2.5 Surface waters.................................................................................................................................. 14
2.6 Población ......................................................................................................................................... 15
2.6 Population ........................................................................................................................................ 15
2.7 Demanda de agua potable ................................................................................................................ 15
ii
2.7 Drinking water demand.................................................................................................................... 15
2.8 Abastecimiento de agua ................................................................................................................... 15
2.8 Water supply .................................................................................................................................... 15
3 GEOLOGIA............................................................................................................................................. 18
GEOLOGY .................................................................................................................................................... 18 3.1 Geomorfología ................................................................................................................................. 18
3.1 Geomorphology ............................................................................................................................... 18
3.2 Estratigrafía del Paleozoico hasta el Terciario; mapa geológico / Stratigraphy of the Paleozoic to the Tertiary; geological map ............................................................................................................ 20
3.2.1 Sistema ordovícico (O) ............................................................................................................ 21 3.2.1 Ordovician (O)......................................................................................................................... 21 3.2.2 Sistema silúrico (S) .................................................................................................................. 22 3.2.2 Silurian (S) ............................................................................................................................... 22 3.2.3 Sistema devónico (D)............................................................................................................... 24 3.2.3 Devonian (D) ........................................................................................................................... 24 3.2.4 Sistema pérmico (P)................................................................................................................. 25 3.2.4 Permian (P).............................................................................................................................. 25 3.2.5 Sistema cretácico (K)............................................................................................................... 25 3.2.5 Cretaceous (K) ......................................................................................................................... 25 3.2.6 Sistema terciario (T) ................................................................................................................ 25 3.2.6 Tertiary (T) .............................................................................................................................. 25
3.3 El Cuaternario (Q) en el Valle Central............................................................................................. 26
3.3 The Quaternary (Q) in the Central Valley........................................................................................ 26 3.3.1 Sedimentos superficiales en el Valle de Cochabamba: mapeo sedimentológico ..................... 27 3.3.1 Superficial sediments in the Valley of Cochabamba: sedimentological mappin. .................... 27 3.3.2 Sedimentos superficiales en la Cordillera de Cochabamba ..................................................... 31 3.3.2 Surface sediments in the Cordillera of Cochabamba ............................................................... 31 3.3.3 Edad de los sedimentos............................................................................................................ 34 3.3.3 Age of the sediments................................................................................................................. 34 3.3.4 Interpretación cronológica de la evolución del Valle Central desde el Plioceno ..................... 35 3.3.4 Chronological interpretation of the evolution of the Central Valley since the Pliocene.......... 35
3.4 Geología estructural ......................................................................................................................... 36
3.4 Structural geology............................................................................................................................ 36
4 Investigaciones geofísicas........................................................................................................................ 39
4 GEOPHYSICAL RESEARCH .................................................................................................................. 39 4.1 Introducción ..................................................................................................................................... 39
4.1 Introduction........................................................................................................................................ 39
4.2 Investigación geofísica por el PIRHC.............................................................................................. 40
4.2 Geophysical research by PIRHC...................................................................................................... 40
4.2.1 Mapa de resistencia transversal....................................................................................................... 41
4.2.1 Map of transversal resistivity .......................................................................................................... 41 4.2.2 Profundidad del basamento...................................................................................................... 41 4.2.2 Depth of the basement.............................................................................................................. 41 4.2.3 Análisis .................................................................................................................................... 43 4.2.3 Data analysis ............................................................................................................................ 43
4.3 Investigación geofísica por el Proyecto CABAS ............................................................................. 43
iii
4.3 Geophysical research by the CABAS- Project................................................................................... 43 4.3.1 Representación de los datos en corte transversal ..................................................................... 45 4.3.1 Visualization of the data in cross-sections............................................................................... 45 4.3.2 Mapa de resistencia transversal / Map of transversal resistivity.............................................. 53 4.3.3 Profundidad del basamento...................................................................................................... 55 4.3.3 Depth of the basement ............................................................................................................... 55
4.4 Estudio mediante sondeos audiomagnetotelúricos por SEURECA–BRGM–SOGREAH–CGL..... 56
4.4 Investigations using audiomagnetotelluric soundings by SEURECA-BRGM-SOGREAH-CGL ... 56
4.4.1 Topografía y geometría del zócalo ordovícico................................................................................. 56
4.4.1 Topography and geometry of the Ordovician Basement ................................................................. 56 4.4.2 Relleno cuaternario de la cuenca ............................................................................................. 56 4.4.2 Quaternary filling of the basin ................................................................................................. 56 4.4.3 Análisis .................................................................................................................................... 58 4.4.3 Analysis ................................................................................................................................... 58
5 Pozos profundos en el valle central.......................................................................................................... 59
5 DEEP WELLS IN THE CENTRAL VALLEY ....................................................................................... 59 5.1 Pozo profundo “Noroeste El Paso 1” ............................................................................................... 60
5.1 Deep drilling "Noroeste El Paso 1".................................................................................................. 60
5.2 Pozo profundo “Tiquipaya 1” .......................................................................................................... 63
5.2 Deep well "Tiquipaya 1".................................................................................................................. 63
5.3 Pozo de investigación Cb- 308 III, Paucarpata ................................................................................ 65
Well of research Cb- 308 III, Paucarpata................................................................................................. 65
5.4 Análisis ............................................................................................................................................ 66
5.4 Analysis ........................................................................................................................................... 66
6 Hidrogeologia / HYDROGEOLOGY........................................................................................................ 67 6.1 Mapeo hidrogeológico ..................................................................................................................... 67
6.1 Hydrogeological Mapping ............................................................................................................... 67 6.1.1 Grupo I: Acuíferos en depósitos porosos no consolidados ...................................................... 68 6.1.1 Group I: Aquifers in unconsolidated porous deposits.............................................................. 68 6.1.2 Grupo II: Acuíferos en rocas fracturadas ................................................................................. 72 6.1.2 Group II: Aquifers in fractured rocks ...................................................................................... 72 6.1.3 Grupo III: Acuíferos locales (en rocas porosas o fracturadas) o regiones sin aguas
subterráneas en cantidades apreciables .................................................................................... 73 6.1.3 Group III: Local aquifers (in porous or fractured rocks) or regions without groundwaters in
noticeable quantities................................................................................................................. 73 6.2 Areas de recarga y descarga............................................................................................................. 74
6.2 Recharge and discharge areas .......................................................................................................... 74
6.3 Piezometría ...................................................................................................................................... 75
6.3 Hydraulic head ................................................................................................................................. 75
6.4 Parámetros hidráulicos y rendimiento de pozos............................................................................... 81
6.4 Hydraulic parameters and well yields .............................................................................................. 81
6.5 Balance hídrico ................................................................................................................................ 82
6.5 Water balance................................................................................................................................... 82
7 Hidroquimica ........................................................................................................................................... 87
iv
7 HYDROCHEMISTRY............................................................................................................................... 87 7.1 Composición iónica ......................................................................................................................... 87
7.1 Ionic composition............................................................................................................................. 87
7.2 Análisis bacteriológicos ................................................................................................................... 93
7.2 Bacteriological analyses................................................................................................................... 93
7.3 Aptitud del agua subterránea para consumo humano y para riego................................................... 93
7.3 Aptitude of the groundwater for human consumption and for irrigation ......................................... 93
7.4 Estudios isotópicos........................................................................................................................... 94
7.4 Isotopic studies................................................................................................................................. 94
8 manejo del recurso de aguas .................................................................................................................... 96
8 water resource management..................................................................................................................... 96 8.1 Aprovechamiento sostenible: Términos generales........................................................................... 97
8.1 Sustainable use: General terms ........................................................................................................ 97
8.2 Aprovechamiento sostenible en el Valle Central ............................................................................. 99
8.2 Sustainable use in the Central Valley............................................................................................... 99
9 Resumen y conclusiones ........................................................................................................................ 103
9 summary and conclusions ...................................................................................................................... 103
Anexo: Tabla de análisis efectuados por el Proyecto CABAS / ANNEX: TABLE OF ANALYSES CARRIED OUT BY THE CABAS PROJECT........................................................................................................... 107
REFERENCIAS / REFERENCES............................................................................................................... 109
v
INDICE DE FIGURAS / INDEX OF FIGURES
Fig. 1: Vista panorámica del Valle Central de Cochabamba / Panoramic view of the Central Valley of Cochabamba. ......................................................................................................................... 1
Fig. 2: Imagen satelital del Valle Central; Landsat TM, 08 de mayo 1985 / Satellite image of the Central Valley; Landsat TM, 08 of May 1985........................................................................... 2
Fig. 3: Mapa topográfico del Valle, Central de Cochabamba / Topographic map of the Central Valley of Cochabamba .......................................................................................................................... 4
Fig. 4: Mapa morfológico del Valle Central de Cochabamba / Morphologic map of the Cochabamba Central Valley. ........................................................................................................................... 5
Fig. 5: Datos y diagrama del promedio de la precipitación mensual. / Data and diagram of the average of monthly precipitation.. ............................................................................................. 7
Fig. 6: Ubicación de las estaciones meteorológicabs y pluviométricas y mapa de isoyetas basado en los datos de precipitación del año 1996 / Location of the climatic and pluviometric stations and map of isohyets based on the precipitation data in 1996................................................... 10
Fig. 7: Precipitación anual en el Valle Central (Fuente: Jordán, 1992) / Annual precipitation in the Central Valley (Source: Jordán, 1992)..................................................................................... 11
Fig. 8: Los sistemas de captación de aguas superficiales para el abastecimiento de agua de Cochabamba / The collecting systems of superficial waters for the watersupply of Cochabamba............................................................................................................................. 17
Fig. 9: Lagunas de origen glacial que abastecen a la ciudad de Cochabamba / Lagoons of glacial origin that supply the city of Cochabamba .............................................................................. 20
Fig. 10: Esquema geológico de la cuenca de Cochabamba propuesto por el PIRHC (GEBOL - NNUU, 1978) / Geological scheme of the basin of Cochabamba as suggested by the PIRHC (GEOBOL - UN, 1978)............................................................................................................ 28
Fig. 11: La evolución de la cuenca de Cochabamba durante el Plio- Pleistoceno / The evolution of the Cochabamba basin during the Plio- Pleistocene ...................................................................... 38
Fig. 12: Mapa de resistencia transversal elaborada por el PIRHC (GEBOL - NNUU, 1978) / Map of transversal resistivity made by PIRHC (GEOBOL - UN, 1978) ............................................. 39
Fig. 13: Mapa de la potencia del relleno plio-cuaternario elaborado por el PIRHC (GEBOL - NNUU, 1978) / Map of the thickness of the pliocene- quaternary filling, produced by the PIRHC (GEOBOL - UN, 1978)............................................................................................................ 42
Fig. 14: Ubicación de sondeos eléctricos verticales y perfiles geoeléctricos efectuados por CABAS (Fielitz et al., IT CABAS Nº8, 1992) / Location of vertical resistivity surveys and geoelectric profiles carried out by CABAS (Fielitz et al., IT CABAS Nº8, 1992) .................................... 44
Fig. 15: Corte geoeléctrico A – A’ (Fielitz et al., IT CABAS Nº8, 1992) / Geoelectric profile A - A' (Fielitz et al., IT CABAS Nº8, 1992)....................................................................................... 46
Fig. 16: Corte geoeléctrico B – B’ (Fielitz et al., IT CABAS Nº8, 1992) / Geoelectric profile B - B' (Fielitz et al., IT CABAS Nº8, 1992)....................................................................................... 47
Fig. 17: Corte geoeléctrico C – C’ (Fielitz et al., IT CABAS Nº8, 1992) / Geoelectric profile C - C' (Fielitz et al., IT CABAS Nº8, 1992)....................................................................................... 48
vi
Fig. 18: Corte geoeléctrico D – D’ (Fielitz et al., IT CABAS Nº8, 1992) / Geoelectric profile D - D' (Fielitz et al., IT CABAS Nº8, 1992)....................................................................................... 49
Fig. 19: Corte geoeléctrico G – G’ (Fielitz et al., IT CABAS Nº8, 1992) / Geoelectric profile G - G' (Fielitz et al., IT CABAS Nº8, 1992)....................................................................................... 50
Fig. 20: Corte geoeléctrico H – H’ (Fielitz et al., IT CABAS Nº8, 1992) / Geoelectric profile H - H' (Fielitz et al., IT CABAS Nº8, 1992)....................................................................................... 51
Fig. 21: Corte geoeléctrico K – K’ (Fielitz et al., IT CABAS Nº8, 1992) / Geoelectric profile K - K' (Fielitz et al., IT CABAS Nº8, 1992)....................................................................................... 52
Fig. 22: Mapa de resistencia transversal de sedimentos cuaternarios entre las profundidades de 50 y 200 m / Map of transversal resistivity of quaternary sediments between the depths of 50 and 200 m ....................................................................................................................................... 54
Fig. 23: Topografía del zócalo paleozoico en el Valle Central en base a sondeos audiomagnetotelúricos (SEURECA etc., 1994) / Topography of the Paleozoic basement in the Central Valley based on audiomagnetotelluric soundings (SEURECA etc, 1994).................. 55
Fig. 24: Zonificación de la cuenca en base al espesor de los depósitos plio-cuaternarios (SEURECA–BRGM–SOGREAH–CGL, 1994) / Zoning of the basin according to the thickness of the Pliocene- Quaternary deposits (SEURECA-BRGM-SOGREAH-CGL, 1994) ....................... 57
Fig. 25: Caudales de producción (en l/s) en el pozo El Paso 1 (SEMAPA, datos no publicados) / Flows of production (in l/s in the well El Paso 1 (SEMAPA, unpublished data...................... 60
Fig. 26: Niveles dinámicos (en mbbp) en el pozo de explotación El Paso 1 (SEMAPA, datos no publicados) / Dynamic levels (in mbbp) in the producing well El Paso 1 (SEMAPA, unpublished data) ..................................................................................................................... 60
Fig. 27: Perfil litológico y perfil de pozo de la perforación El Paso 1 / Lithological profile and profile of drilling (drilling log ?) of the perforation El Paso 1 ............................................................ 61
Fig. 28: Perfil litológico y perfil de pozo de la perforación Tiquipaya 1 / Lithological profile and profile of drilling (drilling- log ?) of the perforation "Tiquipaya 1.......................................... 62
Fig. 29: Perfil litológico y perfil de pozo de la perforación Cb-308 III, Paucarpata / Lithological profile and drilling profile of the perforation Cb-308 III, Paucarpata...................................... 62
Fig. 30: Zonas de recarga y descarga, según PIRHC, 1978 / Areas of recharge and discharge, according to PIRHC, 1978....................................................................................................... 76
Fig. 31: Red de observación de niveles piezométricos de CABAS / SERGEOMIN / Monitoring network of piezometric levels of CABAS / SERGEOMIN ..................................................... 77
Fig. 32: Mapa piezométrico del Valle Central en base a una combinación de los datos de nivel de CABAS/SERGEOMIN y SEMAPA/BRGM / Piezometric map of the Central Valley based on a combination of the data of CABAS/SERGEOMIN and SEMAPA/BRGM .................... 78
Fig. 33: Variaciones del nivel freático. Los niveles están relacionados a la profundidad bajo boca de pozo. / Variations of the groundwater level. The levels are related at the depth under mouth of well .......................................................................................................................................... 79
Fig. 34: Mapa de transmisividades del Valle Central y línea de confinamiento (basado en SEURECA–BRGM–SOGREAH–CGL, 1994) / Map of transmissivity of the Central Valley and of confinement line (based on SEURECA-BRGM-SOGREAH-CGL, 1994) ............................. 80
Fig. 35: Línea de confinamiento y pozos surgentes (basado en SEURECA–BRGM–SOGREAH–CGL, 1994) / Extension of confines Groundwater conditions and location of artesian wells (based on SEURECA–BRGM–SOGREAH–CGL, 1994)................................................................... 81
vii
Fig. 36: Mapa de ubicación de puntos de muestreo hidroquímico efectuado por el Proyecto CABAS. / Location of hydrochemical sampling points carried out by the CABAS Project..................... 88
Fig. 37: Zonas hidroquímicas del Valle Central en base a los análisis químicos efectuados por CABAS / Hydrochemical zones of the Central Valley according the chemical analyses carried out by CABAS. ........................................................................................................................ 89
Fig. 38: Diagramas PIPER de los resultados de análisis químicos de las aguas subterráneas / PIPER-diagrams representing the results of chemical groundwater analysis ...................................... 90
INDICE DE MAPAS DETALLADOS / INDEX OF DETAILED MAPS
Mapa 1: Carta Geológica del Valle Central de Cochabamba / Geologic Map of the Central Valley of Cochabamba..................................................................................................................................... 23
Mapa 2: Carta del Cuaternario del Valle Central de Cochabamba / Map of cuarternary Formations in the Central Valley of Cochabamba ........................................................................................................ 33
Mapa 3: Carta Hidrogeológica del Valle Central de Cochabamba / Hydrogeologic Map of the Central Val-ley of Cochabamba .......................................................................................................................... 70
viii
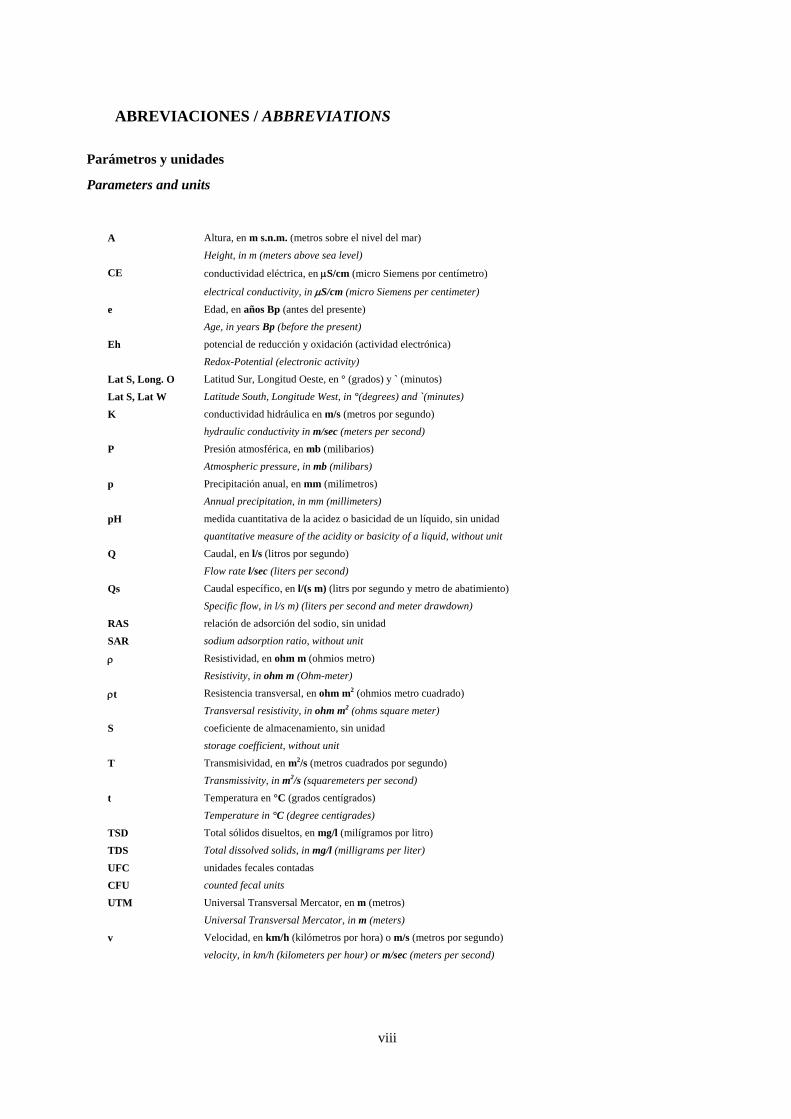
ABREVIACIONES / ABBREVIATIONS
Parámetros y unidades
Parameters and units
A Altura, en m s.n.m. (metros sobre el nivel del mar)
Height, in m (meters above sea level)
CE conductividad eléctrica, en S/cm (micro Siemens por centímetro)
electrical conductivity, in S/cm (micro Siemens per centimeter)
e Edad, en años Bp (antes del presente)
Age, in years Bp (before the present)
Eh potencial de reducción y oxidación (actividad electrónica)
Redox-Potential (electronic activity)
Lat S, Long. O
Lat S, Lat W
Latitud Sur, Longitud Oeste, en ° (grados) y ` (minutos)
Latitude South, Longitude West, in °(degrees) and `(minutes)
K conductividad hidráulica en m/s (metros por segundo)
hydraulic conductivity in m/sec (meters per second)
P Presión atmosférica, en mb (milibarios)
Atmospheric pressure, in mb (milibars)
p Precipitación anual, en mm (milímetros)
Annual precipitation, in mm (millimeters)
pH medida cuantitativa de la acidez o basicidad de un líquido, sin unidad
quantitative measure of the acidity or basicity of a liquid, without unit
Q Caudal, en l/s (litros por segundo)
Flow rate l/sec (liters per second)
Qs Caudal específico, en l/(s m) (litrs por segundo y metro de abatimiento)
Specific flow, in l/s m) (liters per second and meter drawdown)
RAS
SAR
relación de adsorción del sodio, sin unidad
sodium adsorption ratio, without unit
Resistividad, en ohm m (ohmios metro)
Resistivity, in ohm m (Ohm-meter)
t Resistencia transversal, en ohm m2 (ohmios metro cuadrado)
Transversal resistivity, in ohm m2 (ohms square meter)
S coeficiente de almacenamiento, sin unidad
storage coefficient, without unit
T Transmisividad, en m2/s (metros cuadrados por segundo)
Transmissivity, in m2/s (squaremeters per second)
t Temperatura en °C (grados centígrados)
Temperature in °C (degree centigrades)
TSD
TDS
Total sólidos disueltos, en mg/l (milígramos por litro)
Total dissolved solids, in mg/l (milligrams per liter)
UFC
CFU
unidades fecales contadas
counted fecal units
UTM Universal Transversal Mercator, en m (metros)
Universal Transversal Mercator, in m (meters)
v Velocidad, en km/h (kilómetros por hora) o m/s (metros por segundo)
velocity, in km/h (kilometers per hour) or m/sec (meters per second)
ix
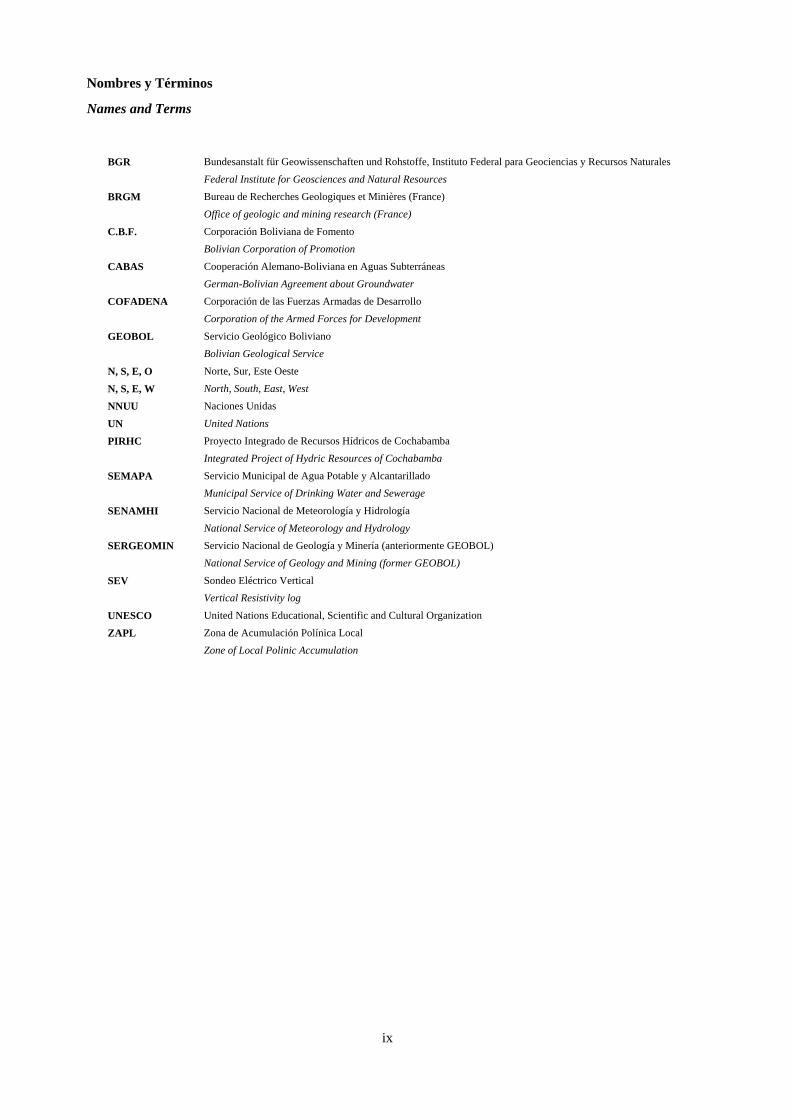
Nombres y Términos
Names and Terms
BGR Bundesanstalt für Geowissenschaften und Rohstoffe, Instituto Federal para Geociencias y Recursos Naturales
Federal Institute for Geosciences and Natural Resources
BRGM Bureau de Recherches Geologiques et Minières (France)
Office of geologic and mining research (France)
C.B.F. Corporación Boliviana de Fomento
Bolivian Corporation of Promotion
CABAS Cooperación Alemano-Boliviana en Aguas Subterráneas
German-Bolivian Agreement about Groundwater
COFADENA Corporación de las Fuerzas Armadas de Desarrollo
Corporation of the Armed Forces for Development
GEOBOL Servicio Geológico Boliviano
Bolivian Geological Service
N, S, E, O
N, S, E, W
Norte, Sur, Este Oeste
North, South, East, West
NNUU
UN
Naciones Unidas
United Nations
PIRHC Proyecto Integrado de Recursos Hídricos de Cochabamba
Integrated Project of Hydric Resources of Cochabamba
SEMAPA Servicio Municipal de Agua Potable y Alcantarillado
Municipal Service of Drinking Water and Sewerage
SENAMHI Servicio Nacional de Meteorología y Hidrología
National Service of Meteorology and Hydrology
SERGEOMIN Servicio Nacional de Geología y Minería (anteriormente GEOBOL)
National Service of Geology and Mining (former GEOBOL)
SEV Sondeo Eléctrico Vertical
Vertical Resistivity log
UNESCO United Nations Educational, Scientific and Cultural Organization
ZAPL Zona de Acumulación Polínica Local
Zone of Local Polinic Accumulation
x
Prologo / Prologue
El presente boletín es un producto del Convenio Alemán – Boliviano sobre Aguas Subterráneas (Proyecto CA-BAS), un proyecto de cooperación técnica Boliviano -Alemán, financiado por el Ministerio de Cooperación Económica y Desarrollo de Alemania (BMZ) y ejecutado por el Instituto Federal de Geociencias y Recursos Natu-rales de Alemania (BGR) y el Servicio Nacional de Ge-ología y Minería de Bolivia (SERGEOMIN) entre los años 1991 y 2000.
The present bulletin is a product of the Convenio Alemán - Boliviano en Aguas Subterráneas (German - Bolivian Agreement on Groundwaters, CABAS Project), a project funded by the German Federal Ministry of Economic Cooperation and Development and carried out by the Federal Institute of Geosciences and Natural Resources of Germany (BGR) and the National Service of Geology and Mining of Bolivia (SERGEOMIN). The project was carried out between 1991 and 2000.
En este trabajo se reúne no solamente una parte impor-tante de los trabajos realizados en el marco de CABAS, sino también la comparación de sus resultados con los trabajos pertinentes realizados anteriormente. Se reúne y resume información que se encuentra dispersa en numero-sos informes, publicaciones y archivos sobre la geología, sedimentología, hidrogeología e hidroquímica, así poni-endo a disposición gran parte del conocimiento actual sobre el tema.
This work not only comprises outcomes of the field cam-paigns of the CABAS project, but also includes a com-parison with previous works. It presents and summarizes a large number of reports on the geology, sedimentology hydrogeology and hydrochemistry of the area, thus giv-ing an overview of what is currently known about the subject.
Dr. Sven Renner Dr. Jorge Alvarado Jefe Proyecto CABAS Jefe del Departamento de Hidrogeología
SERGEOMIN
1
1 INTRODUCCION 1 INTRODUCTION
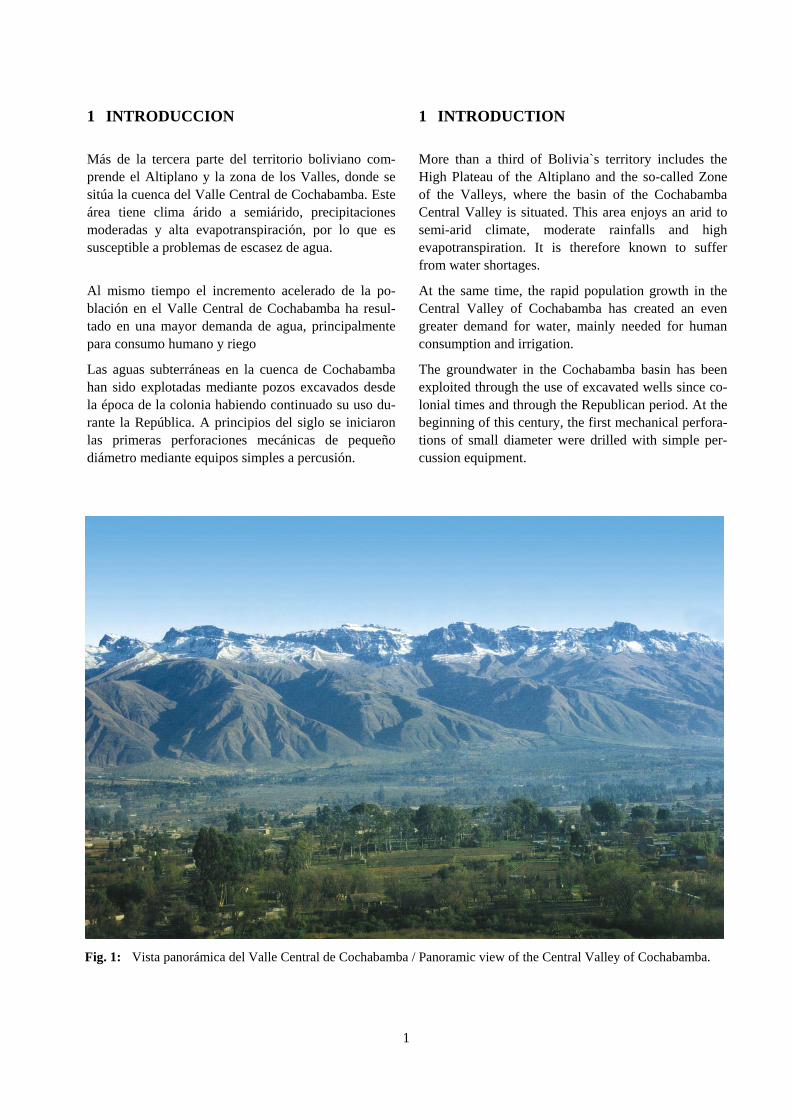
Más de la tercera parte del territorio boliviano com-prende el Altiplano y la zona de los Valles, donde se sitúa la cuenca del Valle Central de Cochabamba. Este área tiene clima árido a semiárido, precipitaciones moderadas y alta evapotranspiración, por lo que es susceptible a problemas de escasez de agua.
More than a third of Bolivia`s territory includes the High Plateau of the Altiplano and the so-called Zone of the Valleys, where the basin of the Cochabamba Central Valley is situated. This area enjoys an arid to semi-arid climate, moderate rainfalls and high evapotranspiration. It is therefore known to suffer from water shortages.
Al mismo tiempo el incremento acelerado de la po-blación en el Valle Central de Cochabamba ha resul-tado en una mayor demanda de agua, principalmente para consumo humano y riego
At the same time, the rapid population growth in the Central Valley of Cochabamba has created an even greater demand for water, mainly needed for human consumption and irrigation.
Las aguas subterráneas en la cuenca de Cochabamba han sido explotadas mediante pozos excavados desde la época de la colonia habiendo continuado su uso du-rante la República. A principios del siglo se iniciaron las primeras perforaciones mecánicas de pequeño diámetro mediante equipos simples a percusión.
The groundwater in the Cochabamba basin has been exploited through the use of excavated wells since co-lonial times and through the Republican period. At the beginning of this century, the first mechanical perfora-tions of small diameter were drilled with simple per-cussion equipment.
Fig. 1: Vista panorámica del Valle Central de Cochabamba / Panoramic view of the Central Valley of Cochabamba.
2
La existencia de pozos surgentes, perforados en la zonade descarga de la cuenca, dio lugar a una indiscrimi-nada utilización. Los pozos fluían continuamente, du-rante todo el año, produciendo un descenso del nivelfreático regional, en principio lento.
The existence of artesian wells, perforated in the ba-sin`s discharge area, gave place to an unsustainable level of exploitation. The wells flowed continuously through the year, causing a descent of the regional groundwater level - slowly in the beginning.
Las primeras instituciones que se dedicaron a la per-foración de pozos de agua, recolectando información técnica confiable, fueron las unidades de Aguas Sub-terráneas de la Corporación de las Fuerzas Armadas de Desarrollo (COFADENA) y de la Corporación Bolivi-ana de Fomento (C. B. F.)
The first institutions dedicated to the perforation of wells, who gathered reliable technical information, were the groundwater sections of the Corporation of the Armed Forces of Development (COFADENA) and of the Bolivian Corporation of Promotion (Corpo-ración Boliviana de Fomento, C.B.F.)
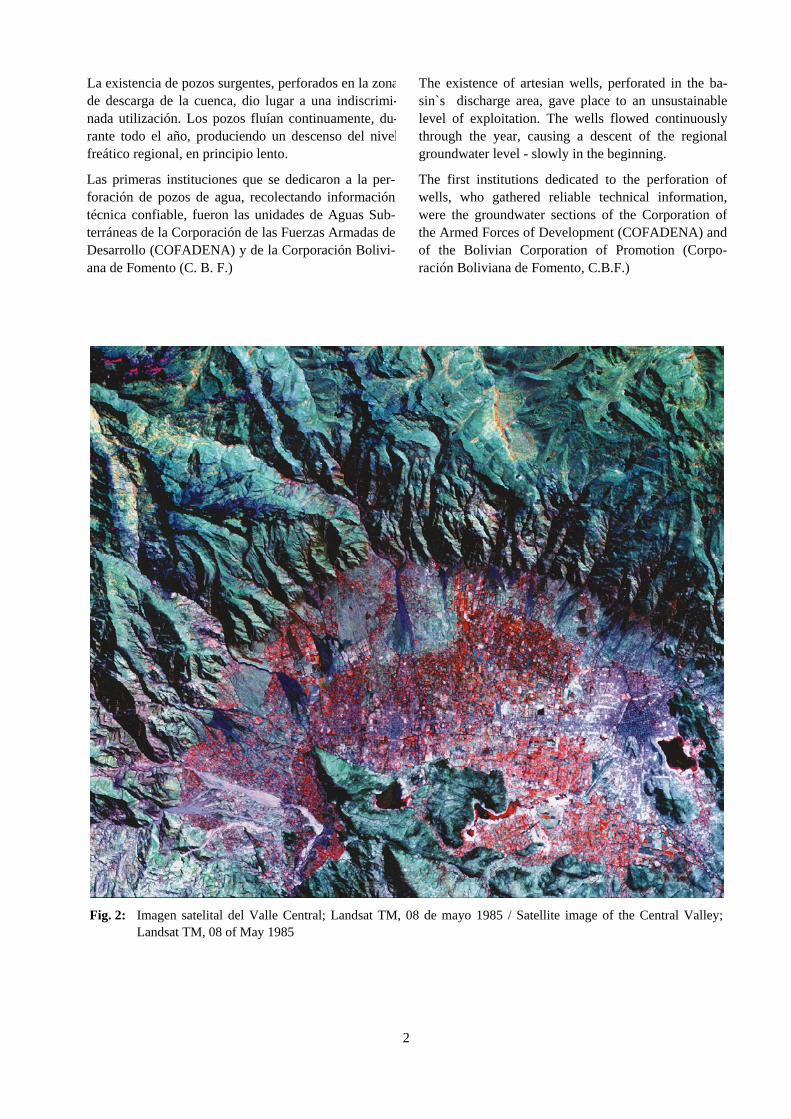
Fig. 2: Imagen satelital del Valle Central; Landsat TM, 08 de mayo 1985 / Satellite image of the Central Valley; Landsat TM, 08 of May 1985
3
Desde un principio, las perforaciones de pozos de ex-plotación se ha visto confrontada con el problema de la gran complejidad del sistema acuífero del Valle Cen-tral de Cochabamba. Se ha evidenciado una gran het-erogeneidad vertical y lateral en los sedimentos, lo que se debe a la presencia de un complicado sistema de abanicos aluviales y deltas lacustres, donde los materi-ales se depositaban en forma alternante. Las interdigi-taciones de los abanicos aluviales, como consecuencia del frecuente cambio de los cauces de los ríos y nive-les lacustres que ocurrieron en el Cuaternario, hacen que estos depósitos sean difícilmente correlacionables.
From the beginning, the perforations of pumping wells had to cope with the great complexity of the aquifer system of the Central Valley of Cochabamba. A great vertical and lateral heterogeneity in the sediments has always been evident, which is due to the presence of a complicated system of alluvial cones and lacustrine deltas, where the materials settled in an alternate form. The interfingering of the alluvial cones, a consequence of the frequent shifting of the river beds and lake lev-els which occured in the Quaternary, make these de-posits hard to correlate.
Los acuíferos del Valle Central almacenan un enorme reservorio de aguas subterráneas que seguirán siendo la fuente principal de agua hasta que se ponga en fun-cionamiento el proyecto Misicuni, que consiste en el transvase de las aguas de la vertiente norte de la Cor-dillera del Tunari (donde las precipitaciones pluviales son considerablemente mayores).
The aquifers of the Central Valley store an enormous reservoir of groundwaters that will remain the main source of water until the Misicuni-project or an alter-native large scale water supply system is put into op-eration. Misicuni consists of conveying waters from the northern slope of the Tunari mountain range where the rainfalls are considerably higher.
Para programar la explotación sostenible de las aguas subterráneas del Valle Central se requiere la evalua-ción de toda la información disponible que se refiere a la distribución areal del agua subterránea, las carac-terísticas hidráulicas del subsuelo y la calidad del agua. En base a esta información es necesario estudiar la factibilidad técnica y económica de su aprove-chamiento y su aptitud para diferentes usos.
To plan the sustainable exploitation of the Central Val-ley groundwaters it is necessary to analyse the avail-able information refering to the distribution of the sub-surface water, the hydraulic characteristics of the un-derground and the quality of the water that is required. Based on this information it is necessary to study the technical and economic feasibility of its exploitation and its suitability for different uses.
En los próximos capítulos se expondrá la información actualmente disponible sobre los recursos de aguas subterráneas del Valle Central de Cochabamba. La in-formación consiste en la descripción general del área y luego de sus características geológicas, con énfasis en las formaciones cuaternarias las cuales almacenen los recursos de agua subterráneos. Una amplia parte del informe está dedicada a los resultados de las investiga-ciones geofísicas que, conjuntamente con los cono-cimientos obtenidos através de las perforaciones pro-fundas, constituyen la información fundamental acerca de la estructura y el volumen de los recursos hídricos del valle. La parte que sigue describe las característi-cas hidráulicas y el rendimiento de los acuíferos, in-cluyendo un mapeo hidrogeológico. La última sección del presente trabajo enfoca la calidad de las aguas y su aptitud para diferentes usos.
In the following chapters, the actually available infor-mation on groundwater resources in the Central Valley of Cochabamba will be exposed. The information con-sists of general description of the area and of its geo-logical characteristics, with emphasis on the quater-nary formations that store most of the groundwater re-sources. A wide part of the report is dedicated to the results of the geophysical research that, together with the information obtained from deep perforations, make up the basic information about the structure and the volume of the hydric resources of the valley. What fol-lows is a description of the hydraulic characteristicsand the yield of the aquifers, including a hydro-geological mapping. The last section of this report fo-cuses on the quality of the waters and its suitability for different uses.
4
2 ASPECTOS GENERALES DE LA CUENCA DEL VALLE CENTRAL DE COCHABAMBA
2 GENERAL ASPECTS OF THE BASIN OF THE COCHABAMBA CENTRAL VALLEY
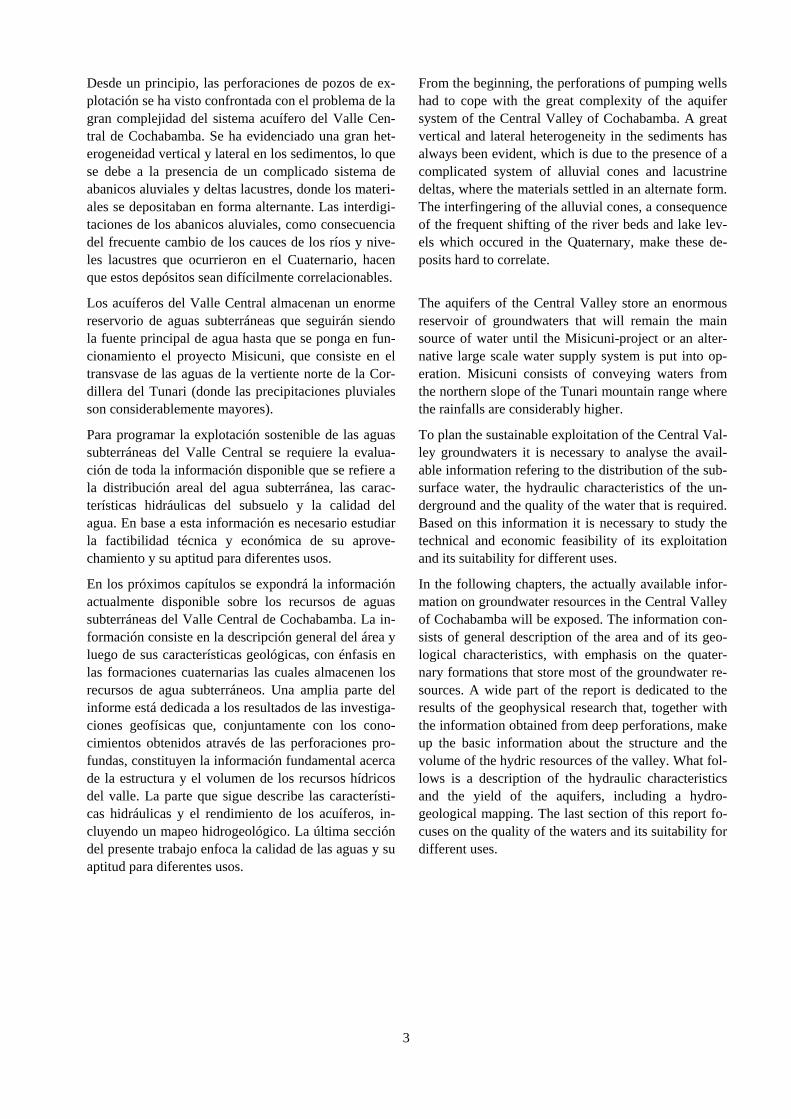
En los próximos capítulos se utilizarán mapas temáti-cos simplificados como la Fig. 3 para representar as-pectos geológicos, climáticos, topográficos, hidro-geológicos etc. La escala es aproximadamente 1 : 200.000. La cuadrícula utilizada es de 1000 metros UTM zona 19. Los mapas diferencian tres colores, los cuales corresponden a los rellenos fluviolacustres en el Valle de Cochabamba, a las rocas consolidadas del pa-leozoico y mesozoico incluyendo las formaciones gla-ciales en la cordillera, y los abanicos aluviales en el borde del valle (véase Fig. 3). En la Fig. 3 se encuentra una leyenda de elementos topográficos como carret-eras, poblaciones etc., que no es repetida en los mapas que siguen.
In the following chapters simplified thematic maps (as the Fig. 3) will be used to represent geological, cli-matic, topographical, hydrogeological aspects etc. The scale is approximately 1: 200.000. The used quadran-gle is UTM zone 19 of 1000 meters. In the maps, three colors are distinguished: they correspond to (1) the fluvio lacustral fillings in the Cochabamba Valley, (2) the consolidated Paleozoic and Mesozoic rocks includ-ing the glacial formations in the Cordillerian range and (3) the alluvial fans located along the edge of the val-ley (see Fig. 3). Fig. 3 includes a legend of topog-raphical elements such as roads, populations etc., that are not repeated in the following maps.
Fig. 3: Mapa topográfico del Valle, Central de Cochabamba / Topographic map of the Central Valley of Cochabamba
5
2.1 Descripción del área 2.1 Description of the area
La cuenca del Valle Central de Cochabamba se encuen-tra situada en el Departamento del mismo nombre y está delimitada aproximadamente por las siguientes coorde-nadas UTM (Fig. 3).
The basin of the Cochabamba Central Valley is situ-ated in the Department of the same name and is delim-ited approximately by the following UTM-coordinates (Fig. 3).
Latitud 8083000 - 8070000 N Latitude 8083000 - 8070000 N
Longitud 780000 - 800000 E Longitude 780000 - 800000 E
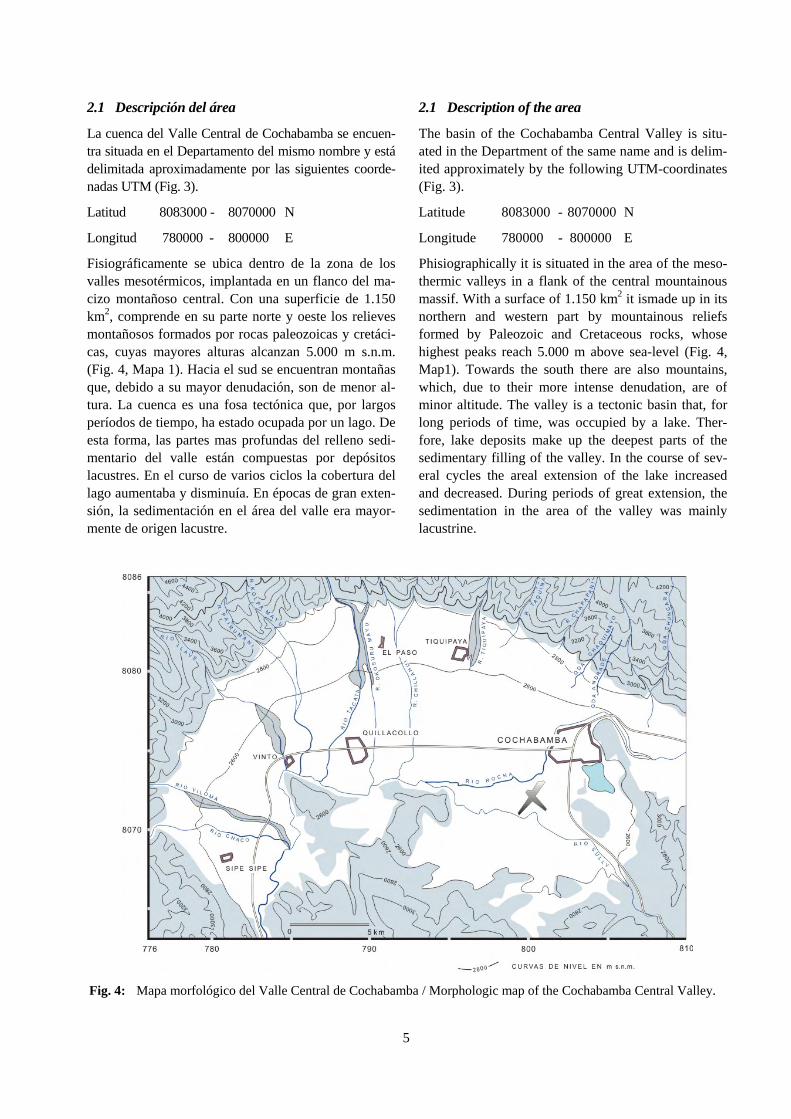
Fisiográficamente se ubica dentro de la zona de los valles mesotérmicos, implantada en un flanco del ma-cizo montañoso central. Con una superficie de 1.150 km2, comprende en su parte norte y oeste los relieves montañosos formados por rocas paleozoicas y cretáci-cas, cuyas mayores alturas alcanzan 5.000 m s.n.m. (Fig. 4, Mapa 1). Hacia el sud se encuentran montañas que, debido a su mayor denudación, son de menor al-tura. La cuenca es una fosa tectónica que, por largos períodos de tiempo, ha estado ocupada por un lago. De esta forma, las partes mas profundas del relleno sedi-mentario del valle están compuestas por depósitos lacustres. En el curso de varios ciclos la cobertura del lago aumentaba y disminuía. En épocas de gran exten-sión, la sedimentación en el área del valle era mayor-mente de origen lacustre.
Phisiographically it is situated in the area of the meso-thermic valleys in a flank of the central mountainous massif. With a surface of 1.150 km2 it ismade up in its northern and western part by mountainous reliefs formed by Paleozoic and Cretaceous rocks, whose highest peaks reach 5.000 m above sea-level (Fig. 4, Map1). Towards the south there are also mountains, which, due to their more intense denudation, are of minor altitude. The valley is a tectonic basin that, for long periods of time, was occupied by a lake. Ther-fore, lake deposits make up the deepest parts of the sedimentary filling of the valley. In the course of sev-eral cycles the areal extension of the lake increased and decreased. During periods of great extension, the sedimentation in the area of the valley was mainly lacustrine.
Fig. 4: Mapa morfológico del Valle Central de Cochabamba / Morphologic map of the Cochabamba Central Valley.
6
La disminución de la extensión del lago descubría grandes superficies de terrenos planos, característicos de las llanuras lacustres, sobre los cuales corrían ríos divagantes que depositaban en sus cauces materiales aluviales gruesos, provenientes de la cordillera que limita la parte norte y oeste de la cuenca.
The decrease in the extension of the lake exposed large flat surfaces, characteristic of the lacustrine plains, on which meandering rivers deposited thick alluvial mate-rial along their courses, flowing from the Cordilleran range that limits the northern and western part of the basin.
Posteriormente, al subir el nivel de las aguas, las planicies aluviales y rellenos de cauce eran cubiertos nuevamente por las aguas, iniciándose de esta manera una nueva deposición de sedimentos lacustres finos en las partes más profundas de la cuenca.
Later, with increasing water level, the alluvial plains and fillings of the riverbed were covered again by wa-ter, a new deposition of fine lake sediments took place in the deepest parts of the basin.
Las variaciones de altura en la cuenca del Valle Cen-tral de Cochabamba van desde los 2.470 m s.n.m. en la salida de la cuenca hasta los 5.030 m s.n.m. en el Tu-nari, que es el pico más alto de la Cordillera del mismo nombre. Hacia el oeste del Valle se tienen serranías con una altura máxima de 4.000 m s.n.m. en el Cerro Toro Huañuna. La planicie de la parte central de la cuenca tiene una elevación media de 2.600 m s.n.m. (Fig. 4).
The altitude in the basin of the Central Valley of Cochabamba varies between 2.470 m above sea level at the bottom of the basin and 5.030 m at the Tunari peak, the highest point of the range of the same name. Towards the west of the valley the mountain ranges have maximum elevation of 4.000 m in the Toto Huañuna Mountain. The plain of the central part of the basin has an average elevation of 2.600 m (Fig. 4).
Gran parte del área cordillerana está cubierta por rocas del Paleozoico (Ordovícico, Devónico y Silúrico) y en forma reducida por rocas mesozoicas (Cretácico). El Cenozoico en su mayor extensión es ocupado por depósitos cuaternarios y en un mínimo porcentaje por depósitos terciarios (Mapa 1).
Much of the area of the Cordillera is made up of Pa-leozoic rocks (Ordovician, Silurian and Devonian) and in minor extent by Mesozoic rocks (Cretaceous). The Cenozoic in its largest extension is represented by Quaternary deposits and in a minimum percentage by Tertiary sediments (Map 1).
En la cordillera, como consecuencia de la última gla-ciación, en forma local, se observan sedimentos glacia-les y gran número de pequeñas lagunas residuales.
In the Cordillera, as consequence of the most recent glaciation, locally glacial sediments and a large num-ber of small residual lagoons can be found.
En la parte norte y oeste de la cuenca, donde los ríos con fuerte pendiente depositan su carga en terrenos más bajos y de menor inclinación, se formaron depósi-tos de abanicos aluviales. La formación de los abanicos es producida principalmente por los torrentes en la época de las crecidas, cuando aumentan los volúmenes de agua y depositan sus materiales de ar-rastre al pie de las montañas. La unión de una serie de abanicos aluviales adyacentes formaron las llanuras aluviales de pie de monte o bajadas. En la imágen satelital (Fig. 2) se distinguen varios abanicos en el área septentrional de la cuenca.
In the northern and western parts of the basin, where the rivers with high gradients deposit their carried ma-terial in lower lands with less inclination, deposits of alluvial cones were formed. The formation of fans is caused mainly by torrents during the high water sea-son, when the water volume increases and deposit their dragging-materials at the foot of the mountains. Com-bined adjacent alluvial cones formed the alluvial piedmont-plains. In the satellite image (Fig. 2), several fans are distinguished in the northern area of the basin.
7
Estos abanicos constituyen las áreas más importantes para el aprovechamiento de sus aguas subterráneas. Los acuíferos reciben su recarga natural principal-mente por infiltración directa de la lluvia y por la per-colación del agua que llega de la cordillera por medio de los ríos y arroyos (Solís & Araguás, 1995) y tam-bién, aunque en una menor cantidad, por la infiltración del agua de riego.
These fans constitute the most important areas for groundwater exploitation. The aquifers obtain their natural recharge mainly from direct rain water infiltra-tion, from the percolation of surface waters descending from the range through rivers and brooks (Solís & Araguás, 1995) and, to a lesser degree, through the in-filtration of irrigation water.
En la parte central de la cuenca se encuentran depósi-tos cuaternarios de orígen mayormente lacustre y flu-vio-lacustre. Litológicamente están constituidos prin-cipalmente por arcillas y limos, cuyas características no son favorables para el aprovechamiento de sus aguas subterráneas. Sin embargo, algunos horizontes conglomeradicos y arenosos en posibles depósitos deltáicos adquieren importancia en la transmisión y el almacenamiento del agua subterránea.
In the central part of the basin quaternary deposits of mainly lacustrine and fluvio-lacustrine origin are found. Lithologically these consist basically of clays and muds, whose characteristics make them unfavor-able for groundwater exploitation. However, some conglomeratic and sandy horizons in deltaic deposits are important for the transmission and the storage of subsurface water.
Dadas las condiciones fisiográficas y climatológicas, el régimen de los ríos y arroyos provenientes de la cordillera es de tipo torrentoso. Poseen pendientes fuertes y en su recorrido originan cañadones profundos en las partes más bajas de la montaña y en los mismos abanicos aluviales.
Due to the physiographic and climatological condi-tions, the rivers and brooks flowing down from the range are of torrential type. They have steep slopes and in their course they cut steep canyons into the lowest parts of the mountain and into their own allu-vial cones.
0
5 0
10 0
15 0
20 0
25 0
O c t N o v D ic E ne F eb M ar A br M ay Jun Ju l A go S e p
t iem po t im e
pre
cip
itac
ion
(m
m)
rain
fall
(mm
)
C oc habam ba
T am borada
C uatro E s qu inas
La C um bre
Localidad
Place
Provincia
Province
Lat S Lon E Elev. m s.n.m.
Elevation
Período (años)
Period (years)
Cochabamba Cercado 17º 23’ 66º 10’ 2 570 49–92
Tamborada Cercado 17º 27’ 66º 08’ 2 600 72-92
Cuatro Esq. Quillacollo 17º 14’ 66º 18’ 3 500 67–83
La Cumbre Quillacollo 17º 19’ 66º 14’ 4 000 67–87
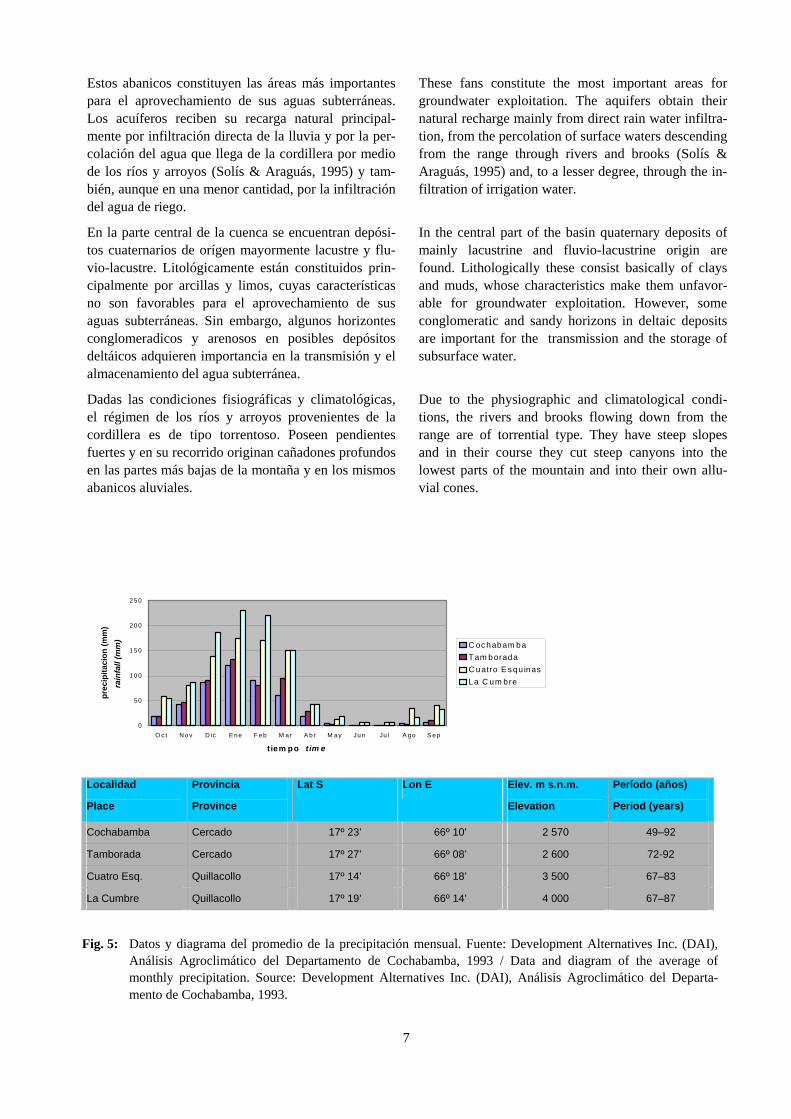
Fig. 5: Datos y diagrama del promedio de la precipitación mensual. Fuente: Development Alternatives Inc. (DAI), Análisis Agroclimático del Departamento de Cochabamba, 1993 / Data and diagram of the average of monthly precipitation. Source: Development Alternatives Inc. (DAI), Análisis Agroclimático del Departa-mento de Cochabamba, 1993.
8
2.2 Clima 2.2 Climate
El Valle de Cochabamba se encuentra en el cinturón trópico. Su clima es templado, sin destacados cambios térmicos en el curso del año, con precipitaciones plu-viales en verano, semiseco en otoño y con invierno y primavera seco.
The Cochabamba valley lies in the tropic belt. Its cli-mate is temperate and suffers no drastic thermal changes during the year, with rainfalls in summer, semiarid conditions in autumn and with dry conditions during winter and spring.
Sin embargo, debido principalmente a las diferencias de altura, varía dentro de cortas distancias. En las partes bajas entre 2.500 y 2.800 m s.n.m. es templado y semiárido. A mayor altura disminuyen las tempera-turas y aumentan las precipitaciones, presentándose consecuentemente un cambio gradual hacia un clima más frío y más húmedo.
However, mainly because of the differences in eleva-tion, the climate varies widelz over short distances. In the lower parts between 2.500 and 2.800 m above sea-level it is moderate and semi-arid. At higher altitude, the temperatures decrease and the rainfalls increase, thus presenting a gradual change towards a colder and danker climate.
Por regla general, las precipitaciones, la humedad rela-tiva del aire y la velocidad del viento se incrementan con la altitud mientras la temperatura, la presión at-mosférica, la presión de vapor y en consecuencia la evaporación y la evapotranspiración disminuyen.
Normally, the rainfalls, the relative humidity of the air and the wind speed increase with the altitude while the temperature, the atmospheric pressure, the steam pres-sure and consequently the evaporation and the evapotranspiration decrease.
PRECIPITACION ANUAL (mm) ESTACION OPERADOR COORDENADAS
N E
ALTITUD
m s.n.m. 1992 1993 1994 1995 1996
Cochabamba SENAMHI 8073193 801273 2.548 386 491 434 488 404
Cocaraya COTESU 8072510 782800 2.500 493 452 453
La Cumbre CABAS 8088248 795667 4.120 1 102 698 464
Jankho Khala SENAMHI 8088399 781688 4.200 1.070 1.409
Kapuraya CABAS 8063099 787838 2.580 562 656 406 647 351
Llave Grande CABAS 8081784 778185 3.380 632 520 506
Payrumani SENAMHI 8078151 784318 2.580 584 892 555 576 585
Sarco SENAMHI 8077070 799186 2.580 432 419 302 492 401
Sehuenkhani CABAS 8065587 796552 2.660 345 441 230
Suticollo CABAS 8066805 782783 2.470 597 677 498 851 205
Parque Tunari COTESU 8080988 801426 3.335 703 600 473 550
Uchu Uchu CABAS 8078292 768953 3.450 683 770 363
Viloma Grande COTESU 8074072 779203 2.680 447 723 421 356 549
La Violeta SENAMHI 8079420 793209 2.610 556 629 350 405 401
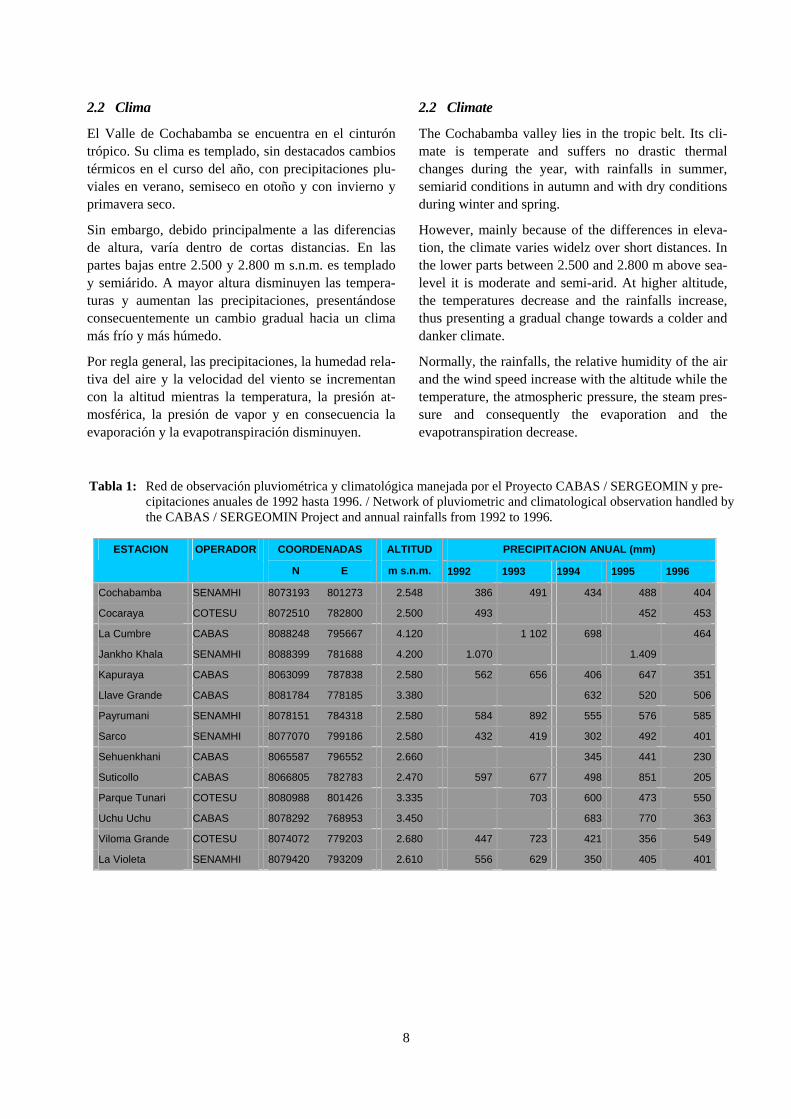
Tabla 1: Red de observación pluviométrica y climatológica manejada por el Proyecto CABAS / SERGEOMIN y pre-cipitaciones anuales de 1992 hasta 1996. / Network of pluviometric and climatological observation handled by the CABAS / SERGEOMIN Project and annual rainfalls from 1992 to 1996.
9
Datos de unos pocos años han registrado un promedio de 2.670 horas de sol anuales en los valles o un promedio de 7,3 horas/sol/día. En la Cordillera del Tunari se observa con mayor frecuencia la presencia de nubes (GEBOL - NNUU, 1978).
Observations over the last few years have registered an average of 2.670 annual hours of sun in the valleys or an average of 7,3 hours sun/day. In the Tunari- Range clouds are observed more frequently (GEOBOL - UN, 1978).
La presión barométrica fluctúa muy débilmente, mostrando un promedio anual de 750 mb, en la zona baja del área. La humedad relativa varía entre 40% hasta 65% con extremos de aproximadamente 10% y 100%, aumentando en las alturas donde decrece la humedad absoluta (GEBOL - NNUU, 1978).
The barometric pressure fluctuates very little, showing an annual average of 750 mb, in the low region of the area. The relative humidity varies between 40 % and 65 % with extreme values of approximately 10 % and 100 %, increasing in the higher regions where the ab-solute humidity is less (GEOBOL - UN, 1978).
La velocidad del viento es menor en el mes de mayo, con una media mensual de 0.8 nudos (1.5 km/h), al-canzando 3.2 nudos (5.9 km/h), en el mes de octubre, siendo la dirección predominante nornoroeste. En las alturas las velocidades deben ser mayores pero no ex-isten datos al respecto (GEBOL - NNUU, 1978).
The wind speed is low in the month of May, with a monthly average of 0.8 knots (1.5 km/h), reaching 3.2 knots (5.9 km/h), in October, NNW being the pre-dominant direction. In higher altitudes, the speeds are supposed to be higher, but there are no data available about it (GEOBOL - UN, 1978).
2.2.1 Precipitaciones 2.2.1 Precipitation
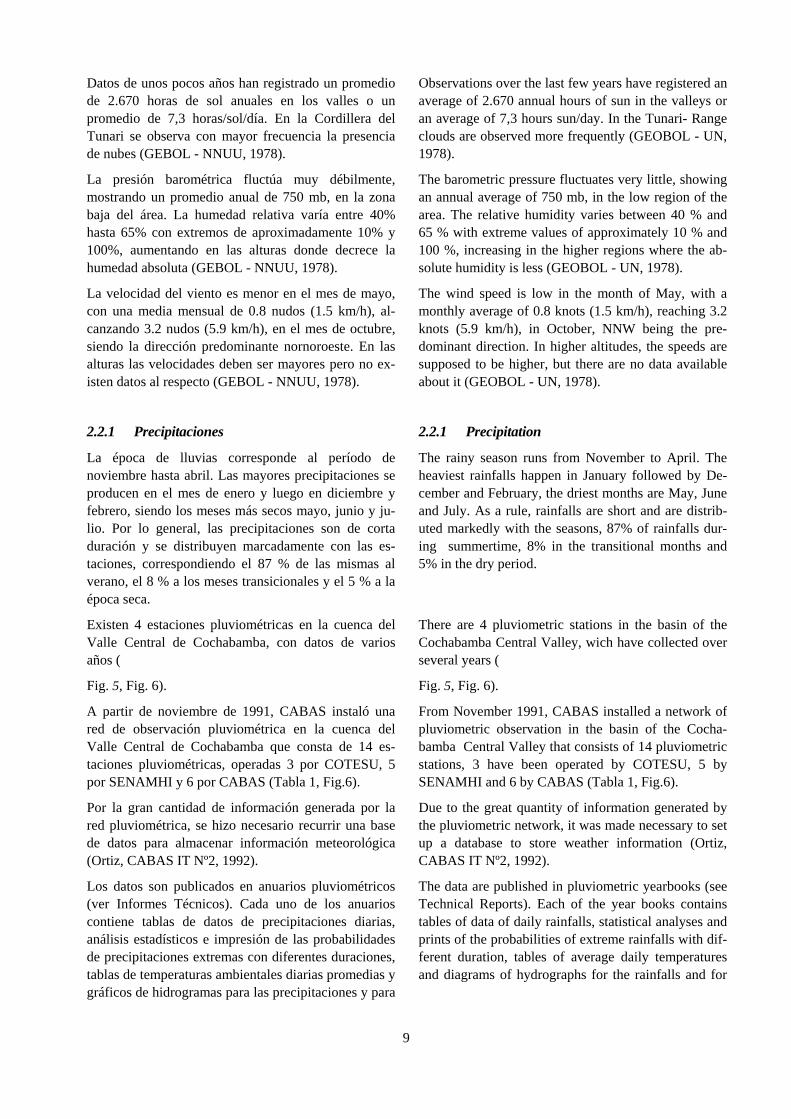
La época de lluvias corresponde al período de noviembre hasta abril. Las mayores precipitaciones se producen en el mes de enero y luego en diciembre y febrero, siendo los meses más secos mayo, junio y ju-lio. Por lo general, las precipitaciones son de corta duración y se distribuyen marcadamente con las es-taciones, correspondiendo el 87 % de las mismas al verano, el 8 % a los meses transicionales y el 5 % a la época seca.
The rainy season runs from November to April. The heaviest rainfalls happen in January followed by De-cember and February, the driest months are May, June and July. As a rule, rainfalls are short and are distrib-uted markedly with the seasons, 87% of rainfalls dur-ing summertime, 8% in the transitional months and 5% in the dry period.
Existen 4 estaciones pluviométricas en la cuenca del Valle Central de Cochabamba, con datos de varios años (
Fig. 5, Fig. 6).
There are 4 pluviometric stations in the basin of the Cochabamba Central Valley, wich have collected over several years (
Fig. 5, Fig. 6).
A partir de noviembre de 1991, CABAS instaló una red de observación pluviométrica en la cuenca del Valle Central de Cochabamba que consta de 14 es-taciones pluviométricas, operadas 3 por COTESU, 5 por SENAMHI y 6 por CABAS (Tabla 1, Fig.6).
From November 1991, CABAS installed a network of pluviometric observation in the basin of the Cocha-bamba Central Valley that consists of 14 pluviometric stations, 3 have been operated by COTESU, 5 by SENAMHI and 6 by CABAS (Tabla 1, Fig.6).
Por la gran cantidad de información generada por la red pluviométrica, se hizo necesario recurrir una base de datos para almacenar información meteorológica (Ortiz, CABAS IT Nº2, 1992).
Due to the great quantity of information generated by the pluviometric network, it was made necessary to set up a database to store weather information (Ortiz, CABAS IT Nº2, 1992).
Los datos son publicados en anuarios pluviométricos (ver Informes Técnicos). Cada uno de los anuarios contiene tablas de datos de precipitaciones diarias, análisis estadísticos e impresión de las probabilidades de precipitaciones extremas con diferentes duraciones, tablas de temperaturas ambientales diarias promedias y gráficos de hidrogramas para las precipitaciones y para
The data are published in pluviometric yearbooks (see Technical Reports). Each of the year books contains tables of data of daily rainfalls, statistical analyses and prints of the probabilities of extreme rainfalls with dif-ferent duration, tables of average daily temperatures and diagrams of hydrographs for the rainfalls and for
10
la comparación con las medidas históricas. the comparison with historical measurements.
El mapa de isoyetas (Fig. 6) está basado en los datos de precipitación del año 1996 (Tabla 2).
The map of isohyets (Fig. 6) is based on the data of precipitation of 1996 (Tabla 2).
La pluviometría está en función de la topografía y per-mite dividir la zona en tres áreas. La primera que ocupa la parte central es una llanura plana formada por depósi-tos fluvio-lacustres. La segunda, situada al pie de la Cor-dillera del Tunari entre los 2.600 a 2.750 m s.n.m., lig-eramente ondulada e inclinada, pertenece a la zona de los depósitos aluviales (abanicos o conos de deyección). El tercer relieve es montañoso y se encuentra ubicado entre los 2.750 y 5.000 m s.n.m.
The pluviometry is controlled by the topography and allows dividing the zone in three areas. The first zone covers the central part and is a flat plain formed by fluvio-lacustrine deposits. The second, situated at the foot of the Tunari- Range between 2.600 at 2.750 m above sea level, shows slightly wavy shapes and incli-nations; it is the area of the alluvial deposits (fans or cones of dejection). The third relief is mountainous and is placed between 2.750 and 5.000 m above sea level.
Fig. 6: Ubicación de las estaciones meteorológicabs y pluviométricas y mapa de isoyetas basado en los datos de precipitación del año 1996 / Location of the climatic and pluviometric stations and map of isohyets based on the precipitation data in 1996.
11
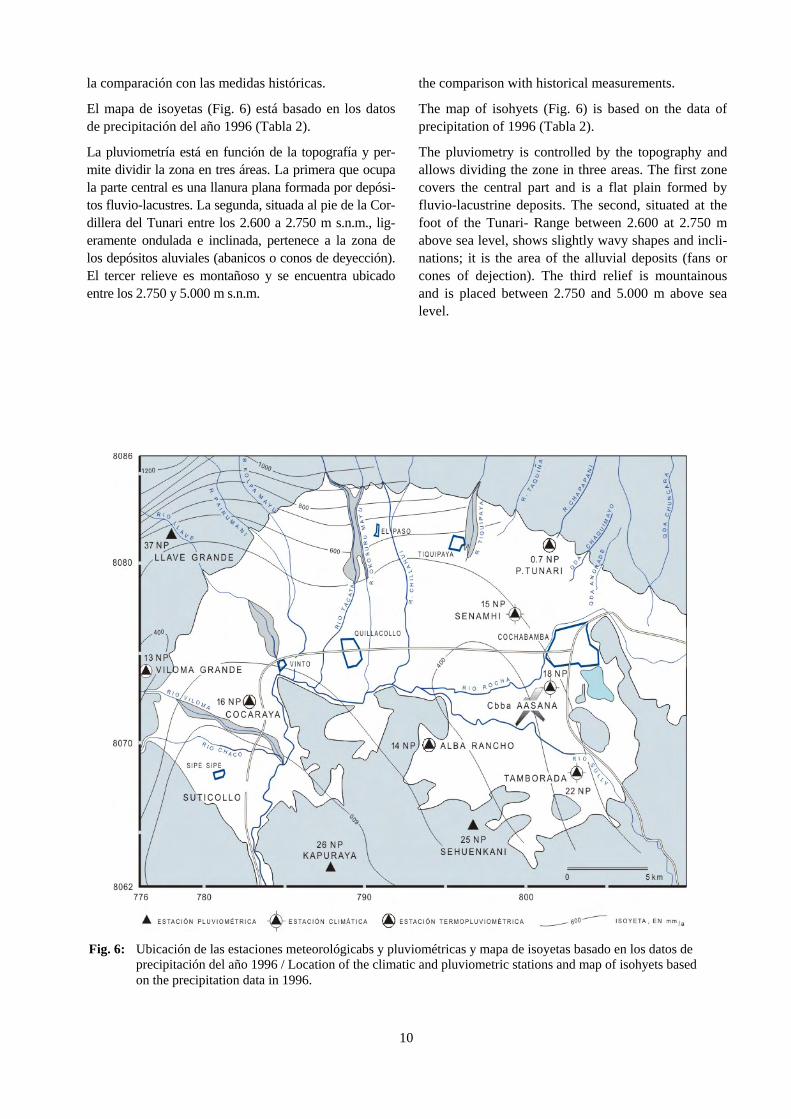
Las lluvias en la cuenca del Valle Central de Cocha-bamba no se distribuyen uniformemente sobre el área, sino que ocurren como chubascos locales. Las precipi-taciones varían con la altitud y la localización geográfica desde 800 a 1.300 mm anuales en el sector de la Cordillera del Tunari, mientras que en la llanura del Valle Central de Cochabamba, las precipitaciones anuales están comprendidas entre 400 a 500 mm. La altura de precipitación media anual en el valle regis-trada por el Proyecto CABAS durante el período de 1991 a 1994 fue de 470 mm. Este dato coincide con los registros entre 1966 y 1973 (GEBOL - NNUU, 1978) que determinan una precipitación media anual en la parte baja de la cuenca de 432 mm. Sin embargo se puede constatar, especialmente entre los años 1974 y 1991, pronunciadas variaciones pluviométricas (Fig. 7).
The rains in the basin of the Central Valley of Cocha-bamba are not distributed evenly across the area, but happen as a result of local cloudbursts. The precipita-tions vary with the altitude and the geographical loca-tion from 800 to 1.300 mm per year in sector of the Tunari- Range, whereas in the plain of the Central Valley of Cochabamba, the annual rainfalls vary be-tween 400 to 500 mm. The quantity of annual average precipitation in the valley registered by the CABAS-Project during the period from 1991 to 1994 was of 470 mm. This data matches with the records between 1966 and 1973 (GEOBOL - UN, 1978) which give an annual average precipitation in the lower part of the basin of 432 mm. However, pronounced pluviometric variations can be observed, especially during the years 1974 to 1991 (Fig. 7).
El incremento de la precipitación co la altura geográfi-case explica por la circulación del aire debido a las variaciones de temperatura entre las partes altas de las estructuras montañosas y bajas de la llanura. Las pre-cipitaciones producidas durante el invierno están rela-cionadas con el pasaje de frentes y caen casi exclu-sivamente en las alturas, a veces en forma de nieve; normalmente se trata de pequeñas cantidades.
The increasing precipitation with geographical eleva-tion is due to advective circulation of the air due to the temperature differences between the top parts of the mountains and the low-lying area of the plain. The rainfalls during winter are related to the passage of fronts and fall almost exclusively in the higher regions, sometimes as snow and normally in small quantities.
2.2.2 Temperatura 2.2.2 Temperature
En el Valle Central de Cochabamba se dispone de da-tos de temperatura de varios años en 2 estaciones (Tabla 4 y 5). La estación meteorológica Cochabamba (AASANA) se encuentra instalada en el aeropuerto, zona sud de la ciudad de Cochabamba, mientras que la estación de La Tamborada se encuentra en la Facultad de Agronomía a unos 5 km de la ciudad de Cocha-bamba, sobre el camino que conduce al Valle Alto (Fig. 6)).
In the Central Valley of Cochabamba, temperature-data of several years from 2 stations are available (Tabla 4 y 5). The meteorological station Cochabamba (AASANA) is installed at the airport, in the southern part of the city of Cochabamba, whereas La Tambo-rada station is found in the Faculty of Agronomy around 5 kms from the city of Cochabamba, on the road to Valle Alto (the High Valley) (Fig. 6).
Tabla 2: Precipitación en el año 1996 (anuario pluviométrico 1996, Informe técnico, CABAS / Precipitation in 1996 (pluvi-ometric year book 1996, Technical Report, CABAS
E F M A M J J A S O N D Tot.
Cochab. 3 93 62 112 8 90 3 0 0 10 8 15 404
Cocaraya 0 115 73 118 46 66 12 0 0 14 9 0 453
P. Tunari 6 41 95 184 74 108 7 0 0 33 548
Viloma 12 133 71 146 66 84 0 2 0 17 15 546
La Violeta 1 93 67 137 13 58 0 0 0 10 7 15 401
Payrumani 1 114 122 194 35 87 1 0 0 14 0 16 584
Sarco 2 101 69 101 11 79 8 0 0 9 10 11 401
La Tambor. 1 96 67 131 15 72 0 0 0 10 10 10 412
Fig. 7: Precipitación anual en el Valle Central (Fuente: Jordán, 1992) / Annual precipi-tation in the Central Valley (Source: Jordán, 1992)
12
La temperatura media anual del Valle Central de Cochabamba es de 17,5 ºC, con mínimas extremas de –5 ºC y máximas extremas de 34,8 ºC.
The average annual temperature in the Cochabamba valley is 17,5 °C, with a minimum of 5 °C and maxi-mum of 34,8 °C.
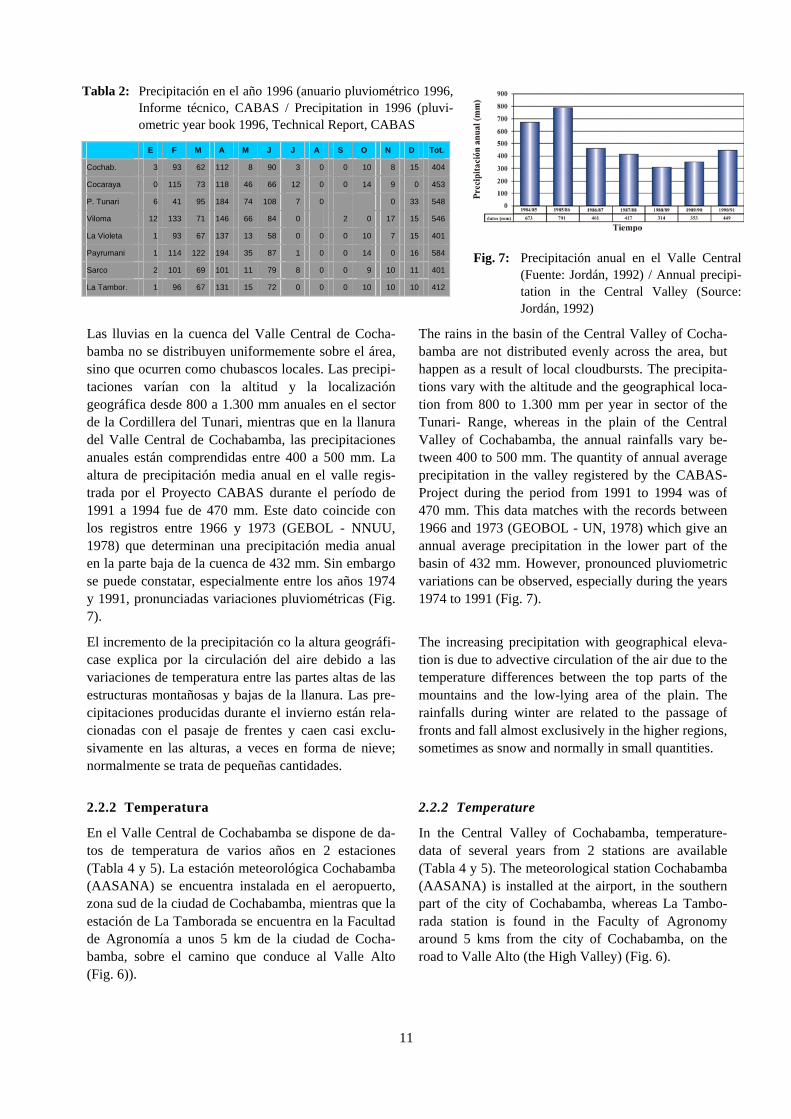
En algunas de las estaciones pluviométricas, que opera CABAS con otras instituciones, se cuentan con medi-das de temperatura media, cuyos registros para el año 1996 se exponen en la Tabla 3.
In some of the pluviometric stations, operated by CA-BAS with other institutions, the average temperature is registered. The records for 1996 are exposed in the Tabla 3.
De manera general y tal como se puede apreciar en Tabla 3, las temperaturas máximas se registran entre los meses de octubre a febrero (verano), en cambio las mínimas ocurren por lo general entre los meses de junio y julio (invierno).
In a general way and as can be seen in Tabla 3, the maximum temperatures are registered during the months of October to February (summer), however the minimums are registered, as a rule, during June and July (winter).
Existe poca variación interanual de las temperaturas medias y se puede indicar una gradiente térmica bas-
It exists little interannual variation in the average tem-peratures and high thermal gradient with respect to al-
Tabla 3: Promedio de temperaturas mensuales en las estaciones manejadas por CABAS para el año 1995. Fuente: CABAS IT Nº36, 1997 / Table 5: Monthly average temperatures at the station (ºC) operated by CABAS for 1995. Source: CABAS IT N°36, 1997
Estación Temperaturas promedio mensual (ºC)
Ene Feb Mar Abr May Jun Jul Ago Sep Oct Nov Dic media
Cochab. 18,9 19,2 18,6 18,5 16,5 13,5 13,2 15,9 17,5 20,0 19,2 19,3 17,5
Cocaraya 19,3 19,2 17,9 18,3 16,1 13,5 13,1 15,7 17,6 19,7 18,7 18,6 17,3
Parque T. 14,2 15,0 14,0 14,9 12,9 13,1 14,4 16,7 14,8 15,1 14,5
Viloma 20,0 19,9 20,1 20,8 18,7 16,2 15,4 17,7 18,8 20,9 19,9 19,6 19,0
La Violeta 18,0 17,5 17,9 17,2 15,4 13,2 12,7 15,0 16,8 18,8 18,5 18,9 16,7
Payrumani 17,8 18,7 17,3 18,4 16,9 14,6 13,9 17,1 16,9 19,8 19,0 19,0 17,5
Sarco 21,9 22,2 21,2 21,9 19,9 17,0 16,4 19,0 21,2 22,6 21,8 22,1 20,6
La Tamb. 17,2 17,8 16,5 17,4 14,8 12,4 11,6 14,5 16,1 18,0 16,9 17,5 15,9
Tabla 4 y 5: Promedio de temperaturas mensuales de los años 1980-1992, estación Cochabamba y La Tambo-rada (AASANA) / Average monthly temperatures in 1980-1992, Cochabamba and La Tamborada (AASANA) station. Source: Development Alternatives Inc. (DAI), Análisis Agro-climático del Departamento de Cochabamba (agroclimatic Analysis climatic of the Department of Cochabamba), 1993
Temperaturas promedio mensual (ºC) Est. Cochabamba
Ene Feb Mar Abr May Jun Jul Ago Sep Oct Nov Dic media
Media 13,5 15,5 17,2 19,3 19,8 20,0 19,0 18,8 18,7 17,8 15,5 13,5 17,4
Máxima 25,3 26,6 26,9 28,4 28,2 27,4 25,5 25,8 26,3 27,0 26,8 25,1 26,6
Mínima 1,6 4,4 7,4 10,2 11,5 12,5 12,4 11,9 11,3 8,7 4,3 1,9 8,2
Est. Tamborada
Ene Feb Mar Abr May Jun Jul Ago Sep Oct Nov Dic media
Media 13,4 15,5 17,2 19,1 19,5 19,1 18,4 18,5 18,4 17,6 15,4 13,5 17,1
Máxima 24,2 25,3 25,9 27,2 26,9 25,9 24,6 24,9 25,3 25,7 25,6 24,2 25,5
Mínima 2,7 5,7 8,4 11,0 12,1 12,2 12,2 12,0 11,6 9,4 5,3 2,8 8,8
13
tante alta con relación a la altura, de aproximadamente 0,85 ºC por cada 100 m de altura como promedio anual, presentándose valores algo más bajos en el período de febrero a agosto y superiores en los demás meses.
titude is evident. The gradient consists of approxi-mately 0,85 ºC for every difference 100 m (annual av-erage). this average gradient is a little lower between February and August, and slightly higher in the re-maining months.
La variación anual de las temperaturas medias es rela-tivamente pequeña en relación a las fluctuaciones diarias. La temperatura mínima media tiene una mar-cada oscilación estacional, ya que los cielos despe-jados y secos durante el invierno permiten una intensa radiación de onda larga, la cual en verano se ve dis-minuida por la nubosidad y la humedad del aire. Con-trariamente, las temperaturas máxima y media acusan poca fluctuación y presentan una alta correlación con la radiación solar que llega a la superficie. La varia-ción máxima extrema en un día llega a aproximada-mente 30C en el mes de junio.
Compared to the daily temperature fluctuations, the annual variations are relatively small. The mean minimum temperature shows marked seasonal varia-tions as a result of the clear, dry skies during the win-ter that allow an intense long wave radiation to pass through, that during summer is reduced due to clouds and humidity in the air. By contrast, the maximum and average temperatures show little fluctuation. These correlate highly with the solar radiation that reaches the surface. The most extreme daily temperature varia-tion reaches approximately 30 °C in June.
2.2.3 Evapotranspiración potencial 2.2.3 Potential evapotranspiration
Existen datos de la evapotranspiración de las es-taciones Cochabamba y La Tamborada (Fig. 6). En base a la evaluación según Turc se obtiene un prome-dio de aprox. 1400 mm/año de evapotranspiración po-tencial y aprox. 490 mm/año de evapotranspiración real.
Data are available for the evapotranspiration of the sta-tions of Cochabamba and La Tamborada (Fig. 6). An evaluation according to Turc yields an average of approx. 1,400 mm/year of potential evapotranspiration and approx. 490 mm/year of real evapotranspiration.
2.3 Vegetación 2.3 Vegetation
En zonas donde existen afloramientos rocosos y el ambi-ente es seco, la vegetación en el Valle Central es pre-dominantemente de estepa alta y pradera de alta mon-taña, es decir pastos y arbustos. En zonas topográfica-mente más bajas se desarrolla una vegetación arbórea-arbustiva semiseca poco más densa. En cambio en la parte central de la cuenca las condiciones del suelo, clima y de la humedad permiten desarrollar todo tipo de cultivos como tubérculos, cereales, hortalizas y muchas variedades de plantas frutales.
In areas with outcrops of rocks and dry atmosphere, the vegetation in the Central Valley is predominantly of high steppe and high mountain prairie (pastures and bushes). In topographically lower areas a little denser semiarid vegetation of trees and bushes is developed. However, in the central part of the basin soil condi-tions, climate and humidity allow the cultivation of all types of crops including tubers, cereals, vegetables and a wide variety of fruit.
2.4 Ambiente hidrográfico 2.4 Hydrographic environment
La hidrografía de la cuenca está formada por dos ríos principales que atraviesan la cuenca de este a oeste, los ríos Rocha y Tamborada (Fig. 3). El Río Rocha nace en la cuenca contigua de Sacaba, ingresa al Valle Central por el estrecho de Mesadilla y pasa por la zona urbani-zada de la ciudad de Cochabamba. En la parte occidental de la cuenca a la altura de la población de Vinto, el curso del río cambia de norte a sur. El Río Tamborada con-fluye al Río Rocha a al SE de Quillacollo. Otros ríos que
Two main rivers cross the basin from East to West, the Rocha and Tamborada (Fig. 3). These constitute the hydrography environments of the basin. The Rocha-River springs in the contiguous basin of Sacaba, and flows into the Central Valley through the strait of Me-sadilla and passes through the urban areas of the city of Cochabamba. In the western part of the basin, near the village of Vinto, the river changes course towards North-South direction. The Tamborada- River con-
14
echan sus aguas al Río Rocha, y que nacen en la Cordil-lera, son los ríos Payrumani, Llave y Tacata. En la parte oeste de la cuenca confluyen los ríos Chaco y Viloma.
verges into the Rocha- River SE of Quillacollo. The Payrumani, Llave and Tacat Rivers also spring from the Cordilleran mountain range and flow into the Ro-cha- River. In the western part of the basin the Chaco and Viloma rivers join the main stream.
Todos los ríos secundarios mencionados anteriormente son de carácter intermitente. Los ríos que bajan de la zona noreste de la cuenca lo hacen en forma de tor-renteras que son canalizadas en la zona urbanizada de la ciudad de Cochabamba. El Río Rocha desagua por el sudoeste de la cuenca, echando sus aguas a la cuenca vecina del Río Capinota donde al unirse con el Río Ar-que forman el Río Caine que posteriormente se convierte en el Río Grande para desembocar por último al Río Amazonas.
All secondary rivers mentioned above are intermittent in character. The rivers coming down from the north-eastern area of the basin are torrential and are canal-ized in the urbanized zone of the city of Cochabamba. The Rocha- River drains the southwest of the basin, flowing into the adjacent basin of the Capinota River. When joining the Arquer River, together they form the Caine- river that later turns into the Rio Grande and fi-nally empties its waters into the Amazon River.
2.5 Aguas superficiales 2.5 Surface waters
En la zona existe un fuerte control estructural sobre el drenaje. Los ríos principales se ubican sobre fallaslongitudinales y en las serranías; los ríos tienen un diseño dendrítico con cierta tendencia centripetal a la cuenca (SEURECA–BRGM–SOGREAH–CGL, 1994).
In the area, there is a strong structural control on the drainage system. The main rivers are placed along longitudinal faults and in the mountainous areas; the rivers have a dendritic design with a certain cen-tripetalic trend towards the basin (SEURECA-BRGM-SOGREAH-CGL, 1994).
Por lo general, los cauces de los ríos son irregulares e inestables y es durante la época de lluvias cuando transportan grandes volúmenes de materiales. Algunos ríos son intermitentes y los que tienen régimen perma-nente, durante el estiaje, transportan caudales muy ba-jos. En la actualidad, en la época seca raramente las aguas de los ríos secundarios llegan al Río Rocha, ya que las mismas son desviadas para riego o se pierden por evaporación e infiltración.
As a rule, the riverbeds are irregular and unstable car-rying large volumes of materials during the rainy sea-son. Some of the rivers are intermittent and, during the dry season those with permanent volumes experience very reduced flows. Presently, waters of the secondary rivers rarely reach the Rocha- River during the dry season. This occurs because they are diverted for irri-gation purposes or diminished by evaporation and in-filtration.
El Río Rocha atraviesa la ciudad de Cochabamba y se constituye en el principal río que drena las aguas su-perficiales del Valle Central de Cochabamba. En la ac-tualidad, por lo general, desde el puente de La Muyu-rina y aguas abajo hasta cerca de Vinto no existe flujo base en la época de estiaje. La poca agua estancada que se observa, proviene de las aguas residuales que son echadas a lo largo del curso del Río Rocha.
The Rocha- River crosses the city of Cochabamba and becomes the main river that drains the superficial wa-ters of the Central Valley of Cochabamba. Currently during the dry season there is no natural flow from La Muyurina bridge downstream until Vinto. The little existing standing water originates from the waste- wa-ters that flow into the Rocha River along its course.
Lagunas situadas sobre la Cordillera del Tunari en la parte septentrional del área de estudio, por encima de 3.500 m s.n.m., constituyen fuentes de almace-namiento, en muchos casos artificiales, de las precipi-taciones pluviales y en algunas épocas del deshielo de las masas de nieve. Otras lagunas se encuentran como relictos en las partes bajas del Valle Central de Cocha-bamba, como la Laguna de Alalay (Fig. 3).
The small lakes situated in the Tunari- Range in the northern part of the study- area (above 3.500 m) often serve as artificial reserves of rainfalls and in some pe-riods of the thawing snow. Other lagoons, like the Ala-lay- Lake, exist as relicts in the lower parts of the Cen-tral Valley of Cochabamba, (Fig. 3).
15
2.6 Población 2.6 Population
El Valle Central de Cochabamba se caracteriza por tener la densidad de población más alta del Departamento. La concentración de población más alta se encuentra en los centros urbanos de las ciudades de Cochabamba con aprox. 600.000 habitantes y Quillacollo con aprox. 50.000 habitantes.
The Central Valley of Cochabamba has the highest population density of the Department. The highest concentration of population exist in the urban centers of the cities of Cochabamba with approx. 600.000 in-habitants and, in Quillacollo with approx. 50.000 in-habitants.
2.7 Demanda de agua potable 2.7 Drinking water demand
La producción, distribución y comercialización de agua potable por parte del Servicio Municipal de Agua Pota-ble y Alcantarillado (SEMAPA) alcanza en la actualidad (06.1999) un caudal de aprox. 740 l/s, de los cuales aprox. 470 l/s provienen de los recursos subterráneos ex-traídos mediante la explotación de 22 pozos (Informa-ción no publicada, SEMAPA).
The production, distribution and commercialization of drinking water by the former Municipal Service of Po-table Water and Sewerage (SEMAPA) reaches (06.1999) a flow of approx. 740 l/sec, of which approx. 470 l/sec originate from the groundwater re-sources extracted through the exploitation of 22 wells (unpublished information, SEMAPA).
En base al crecimiento de la población se ha elaborado un balance de la oferta y demanda de agua potable con proyecciones al año 2025 (Dames & Moore, Gerencia de planificación de SEMAPA, 1997), considerando la in-corporación de nuevos pozos en las zonas de Vinto y El Paso a partir del año 1998 y la entrada en operación del proyecto Misicuni a partir del año 2001, con lo que de-jarían de funcionar los pozos de agua que actualmente son utilizados por SEMAPA. En resumen, según la proyección, en el año 1999 se habrá que contar con un déficit medio de 132 l/s en el abastecimiento de aguas, el cual a partir del 2001 por las aguas adicionales de Misicuni se convertirá en una sobreoferta de aprox. 406 l/s. Sin embargo, el crecimiento poblacional estimado producirá un nuevo déficit a partir del año 2015.
Based on projected population growth, an assessment of supply and demand of drinking water has been elaborated with projections until 2025 (Dames & Moore, Management of planning of SEMAPA, 1997). The assessment takes into consideration the instalation of new wells in 1998 in the areas of Vinto and El Paso and it also considers the start of the Misicuni- project in 2001. The Misicuni project would end operation of the actual SEMAPA wells. In summary, the projection anticipates awater supply deficit of 132 l/s for 1999 and, from 2001 on, with the additional water volumes from Misicuni, an average water surplus of 406 l/s. The estimated population growth would cause a new deficit from 2015 onwards.
2.8 Abastecimiento de agua 2.8 Water supply
De acuerdo a la información proporcionada por SEMAPA, existen tres sistemas de aguas superficiales que alimentan la red urbana de Cochabamba (Fig. 8).
According to information provided by SEMAPA, there are three systems of superficial waters supplying the urban network of Cochabamba (Fig. 8).
(1) El sistema central recoge las aguas de Monte La-guna, Victoriano, Turuni, Escalerani, El Toro y las Chankas.
(1) The central system collects the waters from Monte Laguna, Victoriano, Turuni, Escalerani, El Toro and Chankas.
En la Cordillera del Tunari existe la presa de El Toro con un embalse útil de 1,13·106 m3 de agua, que se comunica con el embalse de Escalerani mediante un torrente natural. Hacia el noroeste de Escalerani existe un canal de tierra con algunos tramos de mampostería con una longitud aproxi-mada de 12 km, denominado "Cuencas Vecinas",
The El Toro dam in the Tunari Cordillera has an available reservoir of 1,13·106 m3 of water. It connects the Escalerani reservoir via a natural tor-rent. Towards the northwest of Escalerani, there is an earthen channel with sections of masonry of approximate 12 km length called "Cuencas Veci-nas" ("Adjacent Basins"). This channel connects
16
el mismo que une Monte Laguna con Escalerani,recogiendo a lo largo de su curso parte de las aguas de escorrentía, las mismas que se depositan en las presas derivadoras de Monte Laguna, Vic-toriano y Turuni. La capacidad máxima de este canal es de 2,9 m3/s en su tramo final al llegar a Escalerani. El embalse de Escalerani tiene una capacidad útil de 5,79·106 m3.
Monte Laguna with Escalerani and, recieves run-off water from Monte Laguna, Victoriano and Tu-runi - all smaller dams. The channel reaches its maximum capacity of 2,9 m3/s in its final stretch when reaching Escalerani. The Escalerani reser-voir has a usable capacity of 5,79·106 m3.
.
De Escalerani sale un canal de aproximadamente 15 km de largo, que va al embalse regulador de La Cumbre. La capacidad del canal es de unos 600 l/s. Las lagunas de Saytu Khocha, Chankas y San Ignacio, que son de propiedad de algunas comunidades agrícolas del Valle Central, tienen comunicación con el canal que va a la Cumbre, lo que permite la compra de agua por parte de SEMAPA, para proveer de agua potable a la ciu-dad en los meses de mayor estiaje. Del embalse regulador de La Cumbre sale un canal de aproxi-madamente 1.000 m de largo que lleva un caudal de aproximadamente 300 l/s hacia el Río Tolapu-jro a una altura de 4.050 m. La toma de estas aguas se ubica a un nivel 1.100 m más abajo pro-duca grandes pérdidas.
An approx. 15 km long channel stretches out from Escalerani and La Cumbre, a regulating reservoir. The channel has a capacity of about 600 l/s and it is linked with the Saytu Khocha, Chankas and San Ignacio lakes. These links allos SEMAPA to buy drinking water from the lakes, for the city during the driest months of the year. The lakes belong to some agricultural communities of the Central Val-ley. there is another channel that collects water from superficial sources. it flows from the La Cumbre reservoir, and extends for approx. 1,000 m towards the Tolapujro River at an elevation of 4,500 m. The waters of this channel have a flow of approx. 300l/s and, they are collected at alti-tudes of 3,400 m with large losses of water
(2) Hacia el este del anterior sistema, en la misma Cordillera, se encuentran la laguna de San Pablo que se comunica con la laguna de San Juan, de donde sale un canal de tierra de aproximadamente 7 km de longitud, que comprende un tramo de unos 750 m de túnel, actualmente parcialmente derrumbado, que lleva un caudal de unos 45 l/s y lo vierte en los ríos Andrade y Chaqui Mayo, de los cuales se recupera más abajo, para consumo humano, en un caudal aproximado de 14 l/s.
(2) East of the system previously described and in the same mountain range, lies the San Pablo lake, that connects to the San Juan Lake. An earthen chan-nel of approximately 7 kms length (including a stretch with a 750 m long tunnel, at present par-tially destroyed), emerges from these lakes with a flow of about 45 l/s. The channel empties in the Andrade and Chaqui Mayo Rivers, further down-stream, an aproximate flow of 14 l/sec is recov-ered for human consumption.
(3) Hacia el este del canal que sale de la laguna San Juan, se encuentra la laguna de Wara Wara, cuya presa ha sido recientemente reconstruida, y que mediante un pequeño canal vierte sus aguas a la quebrada de Chuncara, siendo posteriormente re-cuperados entre 10 y 12 l/s mediante una galería de infiltración en la misma quebrada.
(3) East of the channel that leaves the San Juan Lake lies the Wara Wara lake, whose dam has been re-cently reconstructed. This dam pours its waters through a small channel into the valley of Chun-cara; where between 10 and 12 l/s are recovered by a gallery of infiltration further down in the val-ley.
Según cálculos estimativos el caudal de agua superfi-cial que normalmente llega al Valle Central, de los tres sistemas mencionados, es de 360 l/s de un total de 500 l/s que son producidos en la Cordillera, con un porcen-taje de pérdidas estimadas en un 30 % (SEURECA–BRGM–SOGREAH–CGL, 1994).
According to estimates, the flow rate of surface water reaching the Central Valley from the three systems de-scribed above, is about 360 l/s. The total water coming down from the Cordillera into the basin is about 500 l/s. The disparity between these figures implies losses of 30% (SEURECA - BRGM – SOGREAH - CGL, 1994).
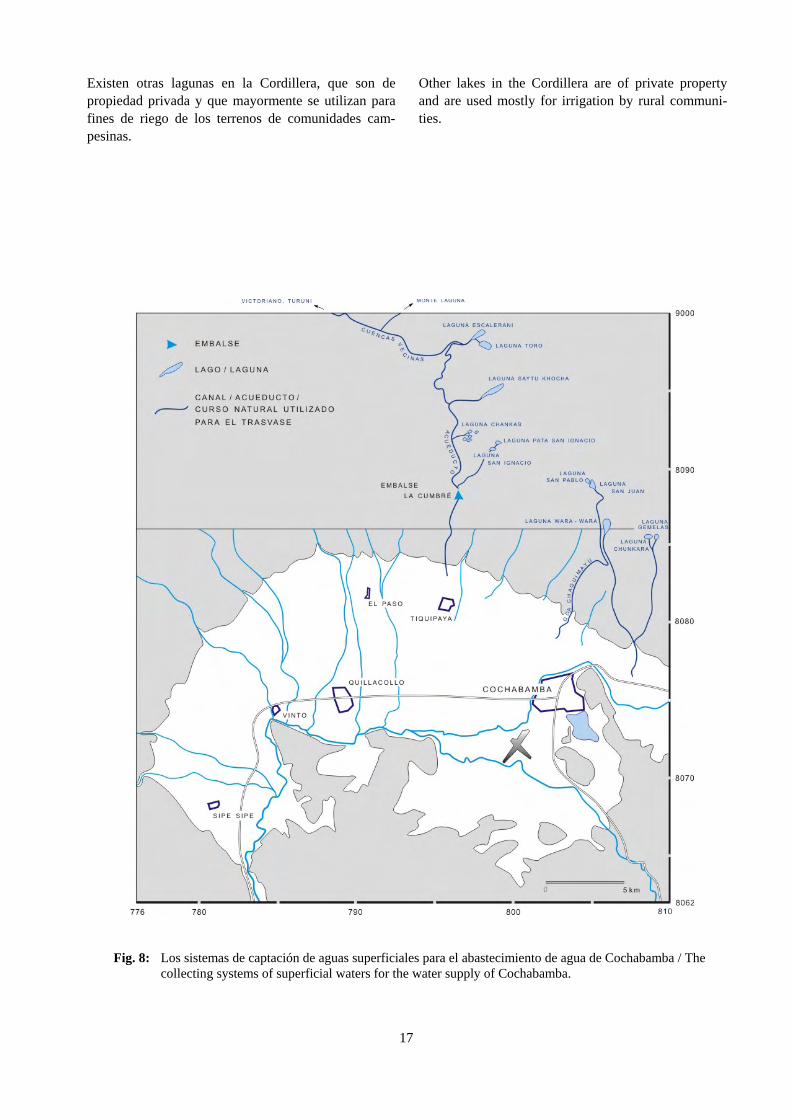
17
Existen otras lagunas en la Cordillera, que son de propiedad privada y que mayormente se utilizan para fines de riego de los terrenos de comunidades cam-pesinas.
Other lakes in the Cordillera are of private property and are used mostly for irrigation by rural communi-ties.
Fig. 8: Los sistemas de captación de aguas superficiales para el abastecimiento de agua de Cochabamba / The collecting systems of superficial waters for the water supply of Cochabamba.
18
Otro sistema, que aporta sus aguas a la cuenca del Valle Central, es el del embalse de La Angostura que represa las aguas del Valle Alto, con una capacidad de 85·106 m3 de agua y que es transportada a través de un canal y el curso del Río Tamborada, para su posterior toma y distribución, para riego, mediante dos canales que circulan uno al norte y el otro al sud de la llanura del Valle Central de Cochabamba. El caudal de las aguas que salen de la Angostura normalmente alcanza 2.000 a 3.000 l/s, durante un periodo de 9 a 10 meses por año, pero presenta un 45 % de pérdidas en su trayecto (Fig. 8).
La Angostura reservoir is another system that provides water to the basin of the Central Valley. the reservoir dams waters of the Valle Alto (High Valley) and has a capacity of 85·106 m3 of water. Its waters flow through a channel to the Tamborada river, where they are ex-tracted abd distributed for irrigation purposes via two channels. One of these circulates in the north and the other one flows in the south of the plain of the Central Valley. The flow rate of the waters at the Angostura strait normally reaches 2,000 to 3,000 l/s during a pe-riod of 9 at 10 months per year. However, these are subject to a 45 % loss along their course (Fig. 8).
3 GEOLOGIA GEOLOGY
En la Monografía del Departamento de Cochabambade Urquidi (1954) se indica que los primeros estudios geológicos y los más valiosos del Departamento de Cochabamba son los del insigne naturalista francés Alcides d’ Orbigny, cuya gran obra “Voyage dans l’ Amerique Meridionale” trata de la Geología del terri-torio boliviano en los capítulos IX, X y XI, correspon-dientes a la última parte del 3er tomo.
The Monografía del Departamento de Cochabamba (Monograph of the Department of Cochabamba) byUrquidi (1954) indicates that the first and most valu-able geological studies of the Cochabamba Depart-ment are those of the French naturalist Alcides d'Or-bigny. His most important work "Voyage dans l' Amerique Meridionale" (A Voyage through South America) treats about the Geology of the Bolivian ter-ritory in the chapters IX, X and XI, corresponding to the last part of the third volume.
La situación geológica general está descrita por Jordan (1967). Vale mencionar también los comentarios de Hoeck & Steinann (1906), Troll (1929) y Ahlfeld (1970, 1972). Estos autores llegan a la conclusión de que el Valle es un graben tectónico, limitado por fallas normales en el norte y en el sud y por fallas inversas en el oeste. El relleno sedimentario no está diferen-ciado en estos trabajos. Solamente es destacado que las generaciones de abanicos aluviales están relacionados con períodos tectónicos.
Jordan (1967) describes the general geological situa-tion. Hoeck & Steinmann (1906), Troll (1929) and Ahlfeld (1970, 1972) also make worthwile observa-tions. These authors conclude that the Valley is a tec-tonic graben, which is limited by normal faults to the north and south, and by reverse faults in the west. The sedimentary filling is not differentiated in these pa-pers. It is only emphasized that the generations of al-luvial cones are related with tectonic periods.
Dentro del programa del Proyecto CABAS se realizó el estudio geológico detallado de los sedimentos plio-cuaternarios de la cuenca de Cochabamba (Veit, 1992).
A detailed geological study of the Pliocene- Quater-nary sediments of the Cochabamba Valleys was car-ried out as part CABAS project (Veit, 1992).
3.1 Geomorfología 3.1 Geomorphology
En el Valle Central de Cochabamba se distinguen tres zonas morfológicas diferenciadas por su altura to-pográfica y su relieve:
There are three morphologically distinct zones in the Central Valley of Cochabamba. Each is distinguish-able by its particular topographical elevation and re-lief:
(1) La zona montañosa que comprende las cordilleras (1) The mountainous zone: This area includes the
19
del Tunari y Mazo Cruz que circundan la cuenca hacia el norte y oeste respectivamente, cuyas alturas llegan hasta más de los 5.000 m s.n.m.. El punto de mayor altura es el Pico Tunari con 5.030 m s.n.m.. También en esta zona se incluyen las serranías que bordean la cuenca hacia el sud y el sudeste con alturas hasta de 3.200 m s.n.m., que definen la divisoria de aguas con las cuencas vecinas de Santivañez y Sacaba (Fig. 4).
Tunari and Mazo Cruz mountain ranges which sur-round the basin in the north and west respectively. Their elevations reach heights of more than 5.000 m above sea level. The Tunari Peak is the highest eleva-tion, rising 5.030 m above sea level. Included in this area are hilly areas that surround the basin towards the south and the southeast with elevations of up to 3.200 m. These hills define the divide with the adjacent ba-sins of Santivañez and Sacaba (Fig. 4).
La zona de montaña se encuentra sujeta a procesos de meteorización y consecuente erosión por la acción de los cambios de temperatura, las precipitaciones y la glacia-ción en las partes más elevadas. Estos procesos dan lugar a la producción de detritos que por la diferencia de altura son arrastrados por los torrentes y depositados en la parte baja de la cuenca. También son frecuentes los depósitos coluvio-auviales y debido al alto radiente son comunes los derrumbes y deslizamientos.
The mountainous zone is subject to processes of weathering and erosion caused temperature fluctua-tions, rainfalls and the glaciation in the highest parts. These processes form detritus that is swept down by torrents and later deposited in the lower part of the ba-sin. Colluvio- alluvial deposits are frequent and, due to the high gradient, collapses and landslides are com-mon.
En la geomorfología de la zona montañosa resaltan las formas modeladas por las glaciaciones de alta montaña que han dejado rasgos típicos como son los valles, la-gunas y circos glaciales (Fig. 9), además de los depósitos morrénicos. A medida que se desciende a la planicie se encuentran cinturones de pedimentos desarrollados por la fuerte meteorización y erosión de las rocas paleozoi-cas.
Landforms shaped by the high mountain glaciation in-clude features as the shape of the valleys, the small lakes, glacial cirques (Fig. 9) and moraine deposits. Together, these landforms constitute the main geo-morphological features of the mounainous zone. Belts of pediments formed by strong weathering and erosion of the Paleozoic rocks can be found descending to-wards the plain.
En la zona montañosa, que circunda la cuenca fluvio-lacustre, existen varias lagunas, la mayoría de las cuales son de origen glacial (Fig. 9).
Surrounding the fluvio lacustrine basin, there are sev-eral lagoons, most of them are of glacial origin (Fig. 9).
En la misma zona, el avenamiento superficial es de diseño dendrítico y en su conjunto los ríos se disponen en forma radial hacia la parte central de la cuenca, re-flejando el control estructural y topográfico al cual están sometidos.
The superficial drainage system in this same area is of dendritic design. Its rivers, in their ensemble, flow ra-dially towards the central part of the basin, reflecting the structural and topographical control that they are submitted to.
(2) La zona de talud y de piedemonte, formada por depósitos torrentosos que forman conos y abanicos que se interconectan y constituyen la llanura aluvial que bordea la cordillera principalmente en el área septen-trional del valle (Fig. 2).
(2) The zone of slope and piedmont: This zone is formed by torrential deposits that form cones and fans. These are interconnected and form the alluvial plain that borders the range that is mostly located in the northern area of the valley (Fig. 2).
En esta zona se presentan abanicos aluviales de difer-ente edad. Los más antiguos están al borde de la cor-dillera, mayormente son de origen glacial y en algunos casos se originan en derrumbes de grandes bloques. En general son materiales gruesos de alta permeabilidad hidráulica.
In this area, there alluvial cones of different ages. The oldest are at the edge of the range and, are mostly of glacial origin. Some of these originated from collapses of big blocks. In general, they are composed of coarse-grained materials of high hydraulic permeability.
Los abanicos más recientes se extienden hacia el Río Rocha, presentan una menor pendiente y suelos poco desarrollados, siendo su origen eminentemente aluvial. Todos los abanicos presentan una gradación en el
The most recent fans extend towards the Rocha River, with smaller slopes and little developed soils, having a clearly alluvial origin. All the fans exhibit gradations in grain size following a general rule: their grains are
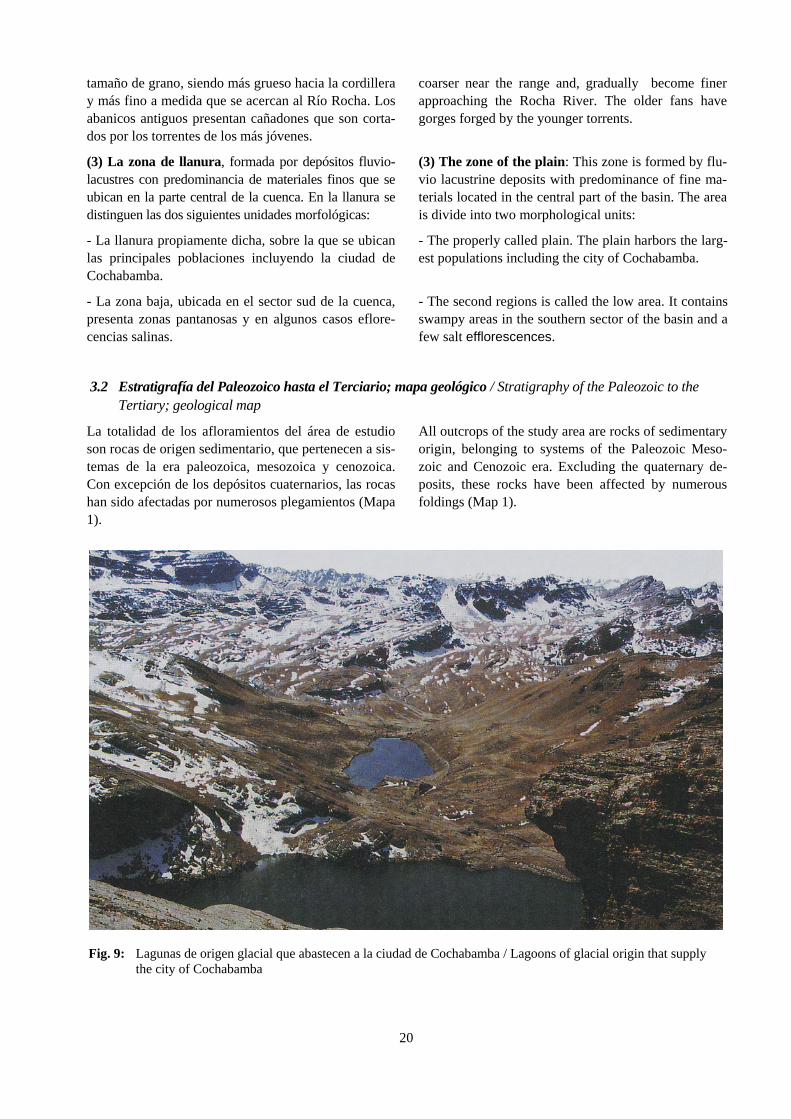
20
tamaño de grano, siendo más grueso hacia la cordillera y más fino a medida que se acercan al Río Rocha. Los abanicos antiguos presentan cañadones que son corta-dos por los torrentes de los más jóvenes.
coarser near the range and, gradually become finer approaching the Rocha River. The older fans have gorges forged by the younger torrents.
(3) La zona de llanura, formada por depósitos fluvio-lacustres con predominancia de materiales finos que se ubican en la parte central de la cuenca. En la llanura se distinguen las dos siguientes unidades morfológicas:
(3) The zone of the plain: This zone is formed by flu-vio lacustrine deposits with predominance of fine ma-terials located in the central part of the basin. The area is divide into two morphological units:
- La llanura propiamente dicha, sobre la que se ubican las principales poblaciones incluyendo la ciudad de Cochabamba.
- The properly called plain. The plain harbors the larg-est populations including the city of Cochabamba.
- La zona baja, ubicada en el sector sud de la cuenca, presenta zonas pantanosas y en algunos casos eflore-cencias salinas.
- The second regions is called the low area. It contains swampy areas in the southern sector of the basin and a few salt efflorescences.
3.2 Estratigrafía del Paleozoico hasta el Terciario; mapa geológico / Stratigraphy of the Paleozoic to the Tertiary; geological map
La totalidad de los afloramientos del área de estudio son rocas de origen sedimentario, que pertenecen a sis-temas de la era paleozoica, mesozoica y cenozoica. Con excepción de los depósitos cuaternarios, las rocas han sido afectadas por numerosos plegamientos (Mapa 1).
All outcrops of the study area are rocks of sedimentary origin, belonging to systems of the Paleozoic Meso-zoic and Cenozoic era. Excluding the quaternary de-posits, these rocks have been affected by numerous foldings (Map 1).
Fig. 9: Lagunas de origen glacial que abastecen a la ciudad de Cochabamba / Lagoons of glacial origin that supply
the city of Cochabamba
21
La cuenca hidrográfica del Valle Central se encuentra implantada en el flanco sur de la Cordillera del Tunari que es un brazo de la Cordillera Oriental de los Andes Centrales. Se caracteriza por un diastrofismo intenso relacionado especialmente al ciclo orogénico andino. Las estructuras montañosas, de dirección noroeste –sudeste, están constituidas principalmente por rocas del sistema ordovícico y silúrico (lutitas, limolitas, areniscas, cuarcitas y filitas), observándose además en la parte occidental y sur-occidental del área aflo-ramientos pérmicos y cretácicos (arcillas, areniscas, margas, calizas) y también conglomerados tercierios (Mapa 1).
The hydrographic basin of the Central Valley is em-bedde in the southern flank of the Tunari- Range, an arm of the Eastern Cordillera of the Central Andes. It is characterized by an intense diastrophism related es-pecially to the Andean orogenic cycle. The mountain-ous structures, of northwestern- southeastern direction are mostly made up by rocks of the Ordovician and Si-lurian systems (mudstones, shales, sandstones, quartz-ites and phyllites). In the western and southwestern part of the area, there are Permian and Cretaceous outcrops (clays, sandstone, marls, limestones) as well as Tertiary conglomerates (Map 1).
Las rocas paleozoicas se hallan extensamente distribui-das en el área, son de origen marino principalmente areniscas, cuarcitas limonitas y lutitas plegadas.
The Paleozoic rocks are widely distributed throughout the area; they are of marine origin and consist of mostly sandstone, quartzitic siltstones and folded shales.
El Valle Central es producto de una depresión tec-tónica donde se han depositado cantidades consider-ables de sedimentos terciarios y cuaternarios. Gran parte de estos depósitos se acumularon en un ambiente lacustre o fluviolacustre, debido a la ausencia de un drenaje permanente, formándose así la parte central plana. Al pie de las montañas y serranías se han for-mado abanicos aluviales que bordean la llanura (Fig.2, Mapa 1).
The Central Valley is the result of a tectonic depres-sion in which considerable quantities of Tertiary and Quaternary sediments have been deposited. Due to the absence of a permanent drainage system, many of these deposits were accumulated in a lacustrine or flu-violacustrine environments; the flat central part of the valley has been formed like this. Alluvial cones bor-dering the plain can be found at the foot of mountain-ous areas (Fig. 2, Map 1).
Debido a la importancia para el aprovechamiento de sus aguas subterráneas que tienen los sedimentos del sistema cuaternario del Valle de Cochabamba, el Proyecto CA-BAS realizó un estudio detallado de este sistema.
Due to their importance as a groundwater reservoir, the sediments of the quaternary system of the Valley of Cochabamba was subjected to a detailed investiga-tion, carried out by the CABAS project.
En el mapa geológico se representan los períodos geológicos, sin diferenciar las unidades sedimentarias. Para información geológica mas detallada se hace refer-encia a Ballón-Ayllón et al. (1997). En lo que sigue, solo se da una breve descripción de las unidades que afloran en el área representado por el mapa.
In the geological map the geological periods are pre-sented, without differentiation of the sedimentary units . For more detailed geological information please refer to Ballón-Ayllón et al. (1997). The following report only provides a short description of the outcropping units found in the area represented in the map.
3.2.1 Sistema ordovícico (O) 3.2.1 Ordovician (O)
La base de este sistema no aflora dentro de la zona y solo se encuentra representado por su serie superior correspondiente al Caradociano.
The base of this system does not form outcrops in the area and, is only represented by its upper series corre-sponding to the Caradocian.
Las rocas de edad ordovícica se encuentran amplia-mente desarrolladas en la parte septentrional del Valle Central (Cordillera del Tunari), así como al sud (norte de Santivañez y sudeste de la Laguna Alalay). En este sistema se encuentran fósiles como língulas, trilobites y crucianas. El Ordovícico en la hoja (Mapa 1) está representado por las siguientes formaciones:
The Ordovician rocks are widely developed in the northern part of the Central Valley (Tunari- Range), as well as south of it (north of Santivañez and southeast of the Alalay lake). This system contains fossils like lingulas, trilobites and crucianas. In the mapsheet (Map 1), the Ordovician is divided the following for-mations:
22
Formación Capinota Capinota- Formation
Se presenta en la base del Ordovícico que aflora en la zona y se compone de lutitas de color gris oscuro in-tercaladas con limolitas gris verdosas y hacia el tope con delgados bancos de areniscas que contienen geódas fosilíferas.
It represents the base of the outcropping Ordovician in the area. It is composed of dark gray shales interca-lated with greenish gray siltstones. Towards its top it has thin banks of sandstone that contains fossiliferous geodes.
Formación Anzaldo Anzaldo- Formation
Ocupa la mayor parte de la cordillera al norte, oeste y sur del valle. Está conformada por limolitas gris ver-duscas intercaladas con areniscas duras y compactas del mismo color que se alteran a marrón claro, de grano medio a grueso.
Covers most of the Cordillera to the north, west and south of the valley. It is formed by greenish- gray shales inserted with hard, compact, middle to coarse-grained sandstone of the same color altering to a light brown color
Formación San Benito San Benito- Formation
En su parte inferior se encuentran areniscas cuarcíti-cas, de grano fino a medio, bien estratificadas, blancas con tonos rojizos. Pasan hacia arriba a areniscas cuar-cíticas micáceas de color gris blanquecino con tonos oscuros.
In its lower part it consists of well stratified, white and reddish quartzitic sandstone of fine to middle-sized grains. They change upwards into mica-rich quartzitic sandstone of whitish grey color with dark overtones.
3.2.2 Sistema silúrico (S) 3.2.2 Silurian (S)
El sistema silúrico, se halla representado en la zona por afloramientos de las formaciones Cancañiri y Uncía. Esta última tiene escasa distribución en el área.
The Silurian in the area, consists of outcrops of the Cancañiri and Uncía formations. This last one has scarce distribution in the area.
Por lo general los afloramientos de este sistema se en-cuentran en el núcleo de los sinclinales, suprayacentes al Ordovícico en forma aparentemente concordante.
The outcrops of this system are usually found in the cores of the synclines, overlying the Ordovician in an apparently concordant manner.
Uno de los afloramientos (sector sudeste del área de estudio), se extiende al oeste de la Laguna Alalay pasando por Uspa Uspa hasta llegar a la Laguna An-gostura. El otro afloramiento de menor extensión, se encuentra en el sector nor-central de la cuenca (Mapa 1).
One of the outcrops (in the southeastern sector of the study- area), extends in the west of the Alalay Lake striking along Uspa Uspa to the Angostura Lake. The other outcrop of minor extension is in the north- cen-tral sector of the basin (Map 1).
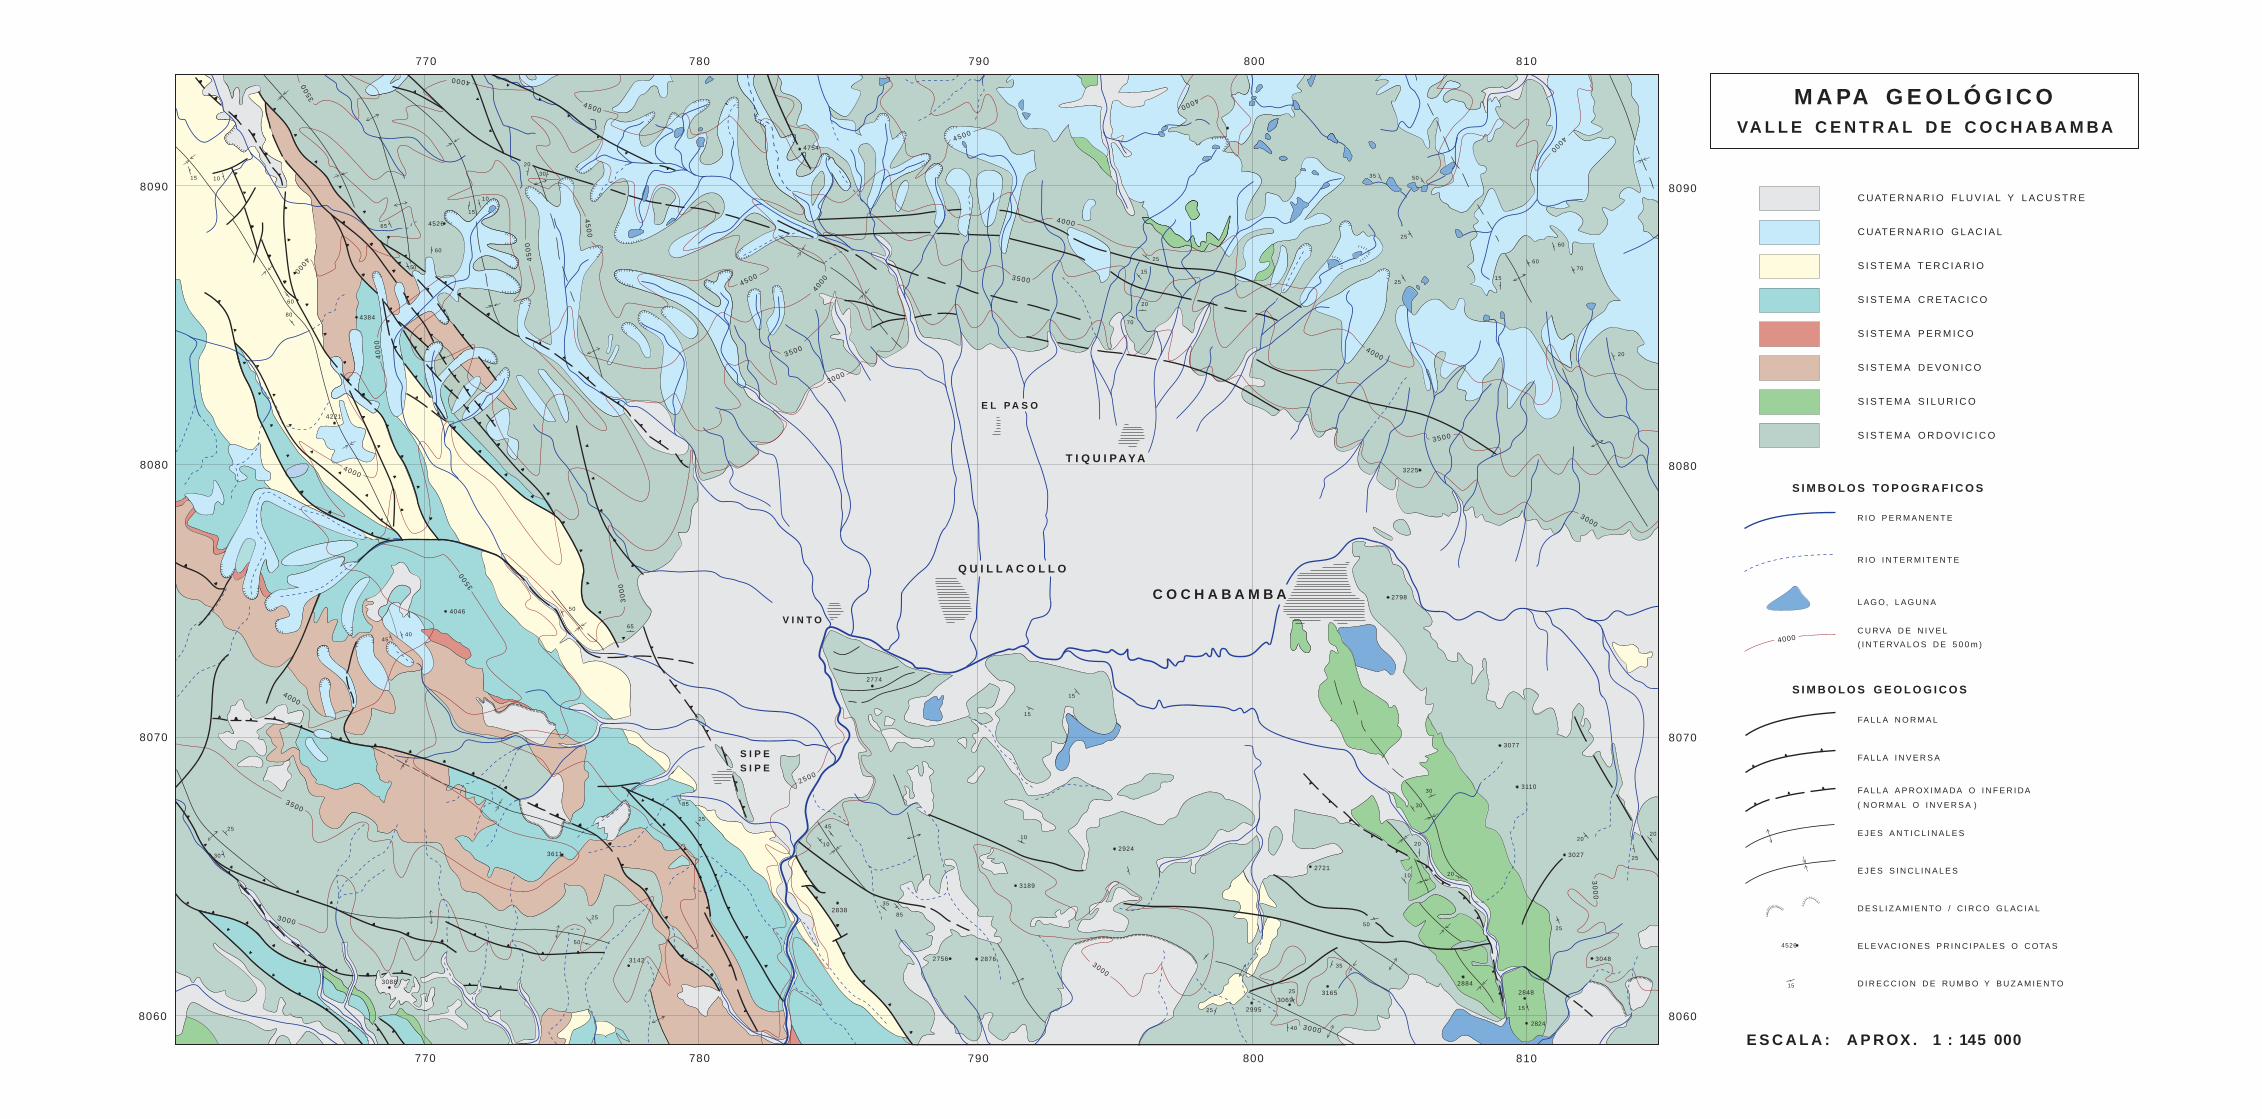
I
IIII
II
II
II
II
II
II
II
IIII
I
I
II
II
I I I II
II
IIIII
I
IIII
I
II
I
I
I
II
II
IIII
I II
I
II
IIIII
I
II
II
I
IIIIII
IIIII
II
II
I I
II
IIIIII
II
I
II
I
IIIII
III
II
I
II
I
IIII
II
II
I
I
IIIIII
II
II
II
II
I
IIIII
I
IIIIII
II
II
II
I
III
II
IIIII
II
II
IIII
II
I
I I
IIII
I
I
II
II
I I I I I
I I I I I I I
II
II
I
IIII
II
II
I I
II
I
III
II
I I I
I I I
II
IIII
I
II
II
II
II
I
I I I II
II
III
II I I
II
I
I I I I II
I
IIII
I
II
II
I
IIII
I
II
III
II
I
II
IIIIIII
IIIII
I I I I I
II
II
I
IIIIIII
II
I
II I I I I I
IIIIIIII
II
II
I
II I
II
II
II
II
I I I I I i i i i
I II
II
I
IIIIIIi
II
II
IIII
IIIII
II
II
I
IIII
II
I I I I I II
II
II
II
I
I I I
II
I
i
II
I
II
II
II
I I I II
II I
II
II
III
II
II
IIII
II
II
II
I
IIII
II
II
IIII
II
III
II
II
I
IIII
I
II I I I I I I I I I I I I I I I I I I I I I I I I I I I I I I I I I I I I I I I I I I I II I
I II I
I IIIII I I II
I
IIII
IIII
IIII
IIIIIIIIIIIIIIIIIIIIIIIIIIIIIIIIIIIIIIIIIIIIIIIIIIIIIIIIIIIIIIII
IIII
IIII
IIII
II
IIII
IIII
II
IIIIIIIIIIIIIIII I I
IIIIIIIIIIIIIIIIII
I
II
II
I
I I
II
II
II I I I
II
I
II
II
I I I I
II
II
I
III
II
II
I
II
II
IIIIII
I
I
IIII
II
IIIIIIIIIIIIIIIIIIIIIIIIIIIIIIIIIIII IIIIIII
IIII
IIIIIIII
I
I
II II
II
I
I
II
I
III
II
I
II
IIII
II
II
I II I
I I
I II I
I II I
IIII
IIII
II
IIIIIIIIIIIIIIIIIIIII
IIIIIIIIIIIIIIIIIIII
7 7 0 7 8 0 7 9 0 8 0 0 8 1 0
8 0 9 0
8 0 8 0
8 0 7 0
8 0 6 0
8 1 08 0 07 9 07 8 07 7 0
8 0 6 0
8 0 7 0
8 0 8 0
8 0 9 0
2824
2848
3048
3027
3110
3225
2798
3077
2884
2995
3069
3165
2721
2876
3189
2924
2774
2756
2838
4754
3611
3142
3088
4046
4526
4384
4221
15 10
65
25
30
60
80
4540
50
60
15
10
20
30
50
65
25
50
85
25
35
85
10
45
10
15
25
15
20
70
15
25
40
25
35
50
10
20
30
30
25
25
60
70
20
15
60
20
20
25
20
25
15
5035
I
IIII
II
II
II
II
II
II
II
IIII
I
I
II
II
I I I II
II
IIIII
I
IIII
I
II
I
I
I
II
II
IIII
I II
I
II
IIIII
I
II
II
I
IIIIII
IIIII
II
II
I I
II
IIIIII
II
I
II
I
IIIII
III
II
I
II
I
IIII
II
II
I
I
IIIIII
II
II
II
II
I
IIIII
I
IIIIII
II
II
II
I
III
II
IIIII
II
II
IIII
II
I
I I
IIII
I
I
II
II
I I I I I
I I I I I I I
II
II
I
IIII
II
II
I I
II
I
III
II
I I I
I I I
II
IIII
I
II
II
II
II
I
I I I II
II
III
II I I
II
I
I I I I II
I
IIII
I
II
II
I
IIII
I
II
III
II
I
II
IIIIIII
IIIII
I I I I I
II
II
I
IIIIIII
II
I
II I I I I I
IIIIIIII
II
II
I
II I
II
II
II
II
I I I I I i i i i
I II
II
I
IIIIIIi
II
II
IIII
IIIII
II
II
I
IIII
II
I I I I I II
II
II
II
I
I I I
II
I
i
II
I
II
II
II
I I I II
II I
II
II
III
II
II
IIII
II
II
II
I
IIII
II
II
IIII
II
III
II
II
I
IIII
I
II I I I I I I I I I I I I I I I I I I I I I I I I I I I I I I I I I I I I I I I I I I I II I
I II I
I IIIII I I II
I
IIII
IIII
IIII
IIIIIIIIIIIIIIIIIIIIIIIIIIIIIIIIIIIIIIIIIIIIIIIIIIIIIIIIIIIIIIII
IIII
IIII
IIII
II
IIII
IIII
II
IIIIIIIIIIIIIIII I I
IIIIIIIIIIIIIIIIII
I
II
II
I
I I
II
II
II I I I
II
I
II
II
I I I I
II
II
I
III
II
II
I
II
II
IIIIII
I
I
IIII
II
IIIIIIIIIIIIIIIIIIIIIIIIIIIIIIIIIIII IIIIIII
IIII
IIIIIIII
I
I
II II
II
I
I
II
I
III
II
I
II
IIII
II
II
I II I
I I
I II I
I II I
IIII
IIII
II
IIIIIIIIIIIIIIIIIIIII
IIIIIIIIIIIIIIIIIIII
4 500
3500
4000
3500
3500
3500
3500
35
00
4000
4000
4000
4000
40
00
4 500
45
00
4 500
45
00
3 000
30
00
3 000
3000
30
00
3 000
4000
4000
2500
4000
4000
3000
T I Q U I P A Y A
S I P ES I P E
V I N T O
A
A
A
A
A
A
A
A
A
A
A
A
A
A
A
A
A
A
A
A
A
A
A
A
A
A
A
A
A
A
A
A
A
A
A
A
A
A
A
A
A
A
A
A
A
A
A
A
A
A
A
A
A
A
A
A
A
A
A
A
A
A
A
A
A
A
A
A
A
A
A
A
A
A
A
A
A
A
A
A
A
A
A
A
A
A
A
A
A
A
A
A
A
A
A
A
A
A
A
A
A
A
A
A
A
A
A
A
A
A
A
A
A
A
A
A
A
A
A
A
A
A
A
A
A
A
A
A
A
A
A
A
A A
A
A
A A
A
A
A
A
A
A
A
A
A
A
A
A
A
A
A
A
A
A
A
A
A
A
A
A
A
A
A
A
A
A
A
A
A
A
A
A
A
A
A
A
A
A
A
A
A
A
A
A
A
A
A
A
A
A
A
A
A
A
A
A
A
A
A
A
A
A
A
A
A
A
A
A
A
A
A
A
A
A
A
A
A
A
A
A
A
A
A
A
A
A
A
A
A
A
A
A
A
A
A
A
A
A
A
A
A
A
A
A
A
A
A
A
A
A
A
A
A
A
A
A
A
A
A
A
A
A
A
A
A
A
A
A
A
A
AA A
A
A
A
A
A
A
A
A
A
A
A
A
A
A
A
A
A
A
A
A
A
A
A
A
A
A
A
A
A
A
A
A
A
A
A
A
A
A
A
A
A
A
A
A
A
A
A
A
A
A
A
A
A
A
A
A
A
A
A
A
A
Q U I L L A C O L L O
E L P A S O
C O C H A B A M B A
E J E S A N T I C L I N A L E S
E J E S S I N C L I N A L E S
C UAT E R N A R I O F L U V I A L Y L AC U S T R E
C UAT E R N A R I O G L AC I A L
S I S T E M A T E R C I A R I O
S I S T E M A C R E TAC I C O
S I S T E M A P E R M I C O
S I S T E M A D E VO N I C O
S I S T E M A S I L U R I C O
S I S T E M A O R D OV I C I C O
4000
R I O P E R M A N E N T E
R I O I N T E R M I T E N T E
L AG O, L AG U N A
C U RVA D E N I V E L
FA L L A N O R M A L
( I N T E RVA L O S D E 5 0 0 m )
4526
15
IIIIIIIIIIIIIIIIIIII
A
A
A
A
A
A
IIIIIIII
II
I
D E S L I Z A M I E N TO / C I R C O G L AC I A L
E L E VAC I O N E S P R I N C I PA L E S O C OTA S
D I R E C C I O N D E RU M B O Y B U Z A M I E N TO
FA L L A A P R OX I M A DA O I N F E R I DA
FA L L A I N V E R S A
S I M B O L O S TO P O G R A F I C O S
S I M B O L O S G E O L O G I C O S
( N O R M A L O I N V E R S A )
M A PA G E O L Ó G I C OVA L L E C E N T R A L D E C O C H A B A M B A
E S C A L A : A P R OX . 1 : 145 000
24
Formación Cancañiri (Scc) Cancañiri- Formation (Scc)
Esta formación se constituye en un horizonte guía para definir el límite con los estratos ordovícicos, por su carácter distinguible debido a su contenido apreciable de hierro, pudiendo encontrarse también estaño y an-timonio. Está compuesto por sedimentos glacial mari-nos "clay grits" (con clastos principalmente de cuarzo), de color gris pardusco en superficie fresca y marrón rojizo en alterada. Se intercalan esporádicamente con areniscas cuarcíticas y limolitas de color gris oscuro.
This formation forms a guide horizon to define the limit with the Ordovician strata. It has noticeable iron-contents, as well as tin and antimony. It is composed of glacial marine sediments "clay grits" (with clasts mostly of quartz), of greyish- brown color in fresh sur-face and reddish- brown on altered surfaces. They are inserted sporadically with quartzitic sandstones and shales of dark grey color.
Formación Uncía (Sun) Uncía- Formation (Sun)
Se encuentra compuesta por lutitas friables, de color gris oscuro en superficie fresca y marrón con tonos ro-jizos en alterada, exfoliación de hojas y estratificación laminar, con alto contenido de mica en los planos de estratificación, con esporádicos horizontes de arenis-cas y limolitas de color verde olivo.
It is composed by friable shales, of dark grey color in fresh surface and brown with reddish tones being al-tered. The formation also contains exfoliation and laminar stratification, with high contents of mica in the stratification planes. It has as well sporadic horizons of olive- green sandstone and shales.
Formación Catavi (Sct) Catavi- Formation (Sct)
Son areniscas micáceas de color gris verdusco inter-caladas con horizontes de lutitas.
It has mica rich greenish grey sandstones which are in-tercalated with horizons of shales.
3.2.3 Sistema devónico (D) 3.2.3 Devonian (D)
Afloramientos devónicos se encuentran en forma de un cinturón en el núcleo de algunos sinclinales. Aflora mayormente en la parte occidental de la hoja. En estos afloramientos se han reconocido las siguientes forma-ciones (Mapa 1):
Devonian outcrops can be found in the cores of some synclines, where they appear in the shape of a belt. They exist in the western part of the mapsheet. In these outcrops following formations have been recognized (Map 1):
Formación Santa Rosa Santa Rosa- Formation:
Compuesta por areniscas bien estratificadas, de color gris blanquecino, intercaladas con escasos niveles de lutitas. Son frecuentes los horizontes con marcas de oleaje y estratificación cruzada.
Composed by good stratified whitish- grey sandstone, inserted with scarce levels of shales. Horizons withswell-marks and crossbedding are frequent.
Formación Icla Icla- Formation
En la base se presentan lutitas en parte arenosas y li-molitas gris oscuras; luego siguen lutitas de color gris verdusco en superficie fresca y gris amarillento en al-terada, intercaladas por unos pocos bancos delgados de areniscas de grano fino a medio del mismo color.
At its base partially sandy and dark grey mudstones and shales are present. Followed by shales, which are greenish grey in fresh surface and yellowish grey be-ing altered, intercalated by a few thin layers of fine to middle grained sandstone of the same color.
Formación Huamampampa Huamampampa- Formation
En el núcleo de algunos sinclinales, descansando con-cordantemente sobre la formación Icla, se encuentra el Huamampampa, compuesto por areniscas blanqueci-nas, en partes con estratificación cruzada intercaladas con bancos delgados de lutitas.
In the core of some synclines, resting concordantly on the Icla- Formation, the Huamampampa-Formation is found,. It consists of whitish, partly cross-bedded sandstones and is inserted with thin banks of shales.
25
3.2.4 Sistema pérmico (P) 3.2.4 Permian (P)
El sistema pérmico no tiene mucha difusión en el área estudiada. Se conocen afloramientos pertenecientes a la formación Copacabana entre los cinturones del Devónico y Cretácico en el oeste de la hoja (Mapa 1).
The Permian system does not extent much in the stud-ied area. Outcrops of the Copacabana- Formation are known between the belts of the Devonian and Creta-ceous in the west of the mapsheet (Map 1).
Formación Copacabana Copacabacana- Formation
Esta formación está compuesta por calizas de color gris claro intercaladas con lutitas carbonosas.
Limestones of light grey color intercalated with cal-careous mudstones compose this formation.
3.2.5 Sistema cretácico (K) 3.2.5 Cretaceous (K)
Las rocas cretácicas están constituidas por arcillas, mar-gas y areniscas calcáreas. Afloramientos pertenecientes a este sistema están desarrollados en una ancha faja en el sector occidental (Mapa 1). Comprende las siguientes formaciones:
The Cretaceous rocks consist of clays, marls and cal-careous sandstone. Outcrops belonging to this system are developed in a wide band in the western sector (Map 1). The system includes the following forma-tions:
Formación Toro Toro Toro Toro- Formation
Presenta un conglomerado basal polimíctico de color pardo rojizo con matrix arcillosa, superpuesto por areniscas limosas y limolitas rojizas.
This is a reddish brown basal polymictic conglomerate with a clayey matrix. It is overlain by shaly sandstones and reddish shales.
Formación El Molino El Molino Formation
Esta formación sobreyace en forma discordante las ro-cas del sistema ordovícico. En la base presenta arenis-cas calcáreas gris amarillentas de grano medio a grueso, intercaladas con arcillas y margas multicol-ores. Luego continúan calizas oolíticas fosilíferas, du-ras, compactas, de color gris-blanquecino y calizas muy duras de color gris oscuro.
This formation overlies the rocks of the Ordovician in a discordant manner. At the base, it presents middle to coarse- grained yellowish- grey calcareous sandstones, that are intercalated with clays and multi- colored marls. Upwards the sequence continues with hard, compact, whitish grey fossiliferous oolithitic lime-stones, as well as very hard dark grey limestones.
3.2.6 Sistema terciario (T) 3.2.6 Tertiary (T)
Las rocas que pertenecen al Terciario afloran en la parte occidental del Valle de Cochabamba y su litología está constituida por conglomerados y arcillas de color rojizo de permeabilidad baja a media. Este sistema se encuen-tra representado por las siguientes formaciones, entre las cuales la formación Sta. Lucía y Morochata forman los afloramientos mas importantes.
The rocks that belong to the Tertiary crop out in the western part of the Valley of Cochabamba and their lithology consists of conglomerates and clays of red-dish color with low to middle permeability. This sys-tem is represented by the following formations, with the Sta. Lucia and Morochata formations producing the most important outcrops
Formación Santa Lucía Santa Lucía- Formation
Está conformada por arcillas rojizas y margas poco consolidadas de coloración marrón verdosa, intercala-das en su parte media con areniscas calcáreas de color amarillo rojizo y limolitas. La parte superior de esta formación, contiene arcillas y margas que presentan vetillas de yeso fibroso marrón violáceo y marrón ver-doso.
It is formed by reddish clays and little consolidated marls of greenish brown coloring, intercalated in its middle part with calcareous reddish yellow sandstone and siltstones. The top of this formation contains clays and marls that have veinlets of violet brown and green-ish- brown fibrous gypsum.
26
Formación Morochata Morochata- Formation
Está formada por un conglomerado de tipo polimíc-tico, con matrix areno-arcillosa, de coloración rojiza y areniscas arcillosas intercaladas con delgadas capas de tobas blancuzcas o rosadas en la base. En la zona se puede observar el acuñamiento debido a la falla Sipe-Sipe.
It is formed by a polymictic-type conglomerate, with a reddish sandy-clayey matrix, and clayey sandstones inserted with thin layers of whitish or whitish- pink tuffs at the base. In the area, there is a wedging due to the activity of the Sipe Sipe- fault.
Formación Parotani Parotani- Formation
Está constituida por conglomerados, arcillas rojas, margas yesíferas con intercalaciones de tobas.
It consists of conglomerates, red clays, gypsum- rich marls with intercalations of tuffs.
Formación Sacaba Sacaba- Formation
Son arenas y arcillas gris verdosas con niveles de to-bas. En forma reducida algunos afloramientos están ubicados al sur del aeropuerto de Cochabamba.
It is made up of sands and greenish grey clays with levels of tuffs. Small number outcrops are found south of the airport of Cochabamba.
3.3 El Cuaternario (Q) en el Valle Central 3.3 The Quaternary (Q) in the Central Valley
Entre las formaciones cuaternarias representadas en en el mapa geológico (Mapa 1), se diferencia únicamenteentre las formaciones glaciales ubicadas mayormente en la cordillera al norte del valle por un lado y las for-maciones fluviales, fluviolacustres y lacustres ya-cientes en el mismo valle o en los lechos de los ríos por el otro. En lo que sigue se discutirá detalladamente las formaciones cuaternarias en base a un mapa sedi-mentológico (Mapa 2):
The quaternary formations represented in the geologi-cal map (Map 1) are differentiated only into glacial formations, mainly located in the mountain range in the north of the valley, and the fluvial, fluviolacustrine and lacustrine formations in the valley itself or in the river beds. In the following the quaternary formations will be discussed in detail, based on a sedimentologi-cal map (Map 2):
En el marco del Proyecto PIRHC (GEBOL - NNUU, 1978) se efectuó un estudio geológico en la cuenca del Valle Central en el cual se analizó las edades y la dis-tribución vertical y lateral de los sedimentos del Valle Central. El esquema geológico de la cuenca de Cocha-bamba elaborado por el PIRHC (Fig. 10) resulta ser válido hasta el día de hoy.
A geological study was carried out in the basin of the Central Valley within the framework of the Project PIRHC (GEOBOL - UN, 1978), in which the ages and the vertical and lateral distribution of the sediments was analyzed. The geological scheme of the basin of Cochabamba elaborated by the PIRHC (Fig. 10) con-tinues to be valid today.
El Valle Central de Cochabamba muestra un amplio desarrollo de materiales cuaternarios. Se trata de mate-riales lacustres y fluviolacustres, que rellenaron la fosa tectónica a finales del Plioceno y durante el Pleisto-ceno.
The Central Valley of Cochabamba contains a wide development of quaternary materials. It is made up of lacustrine and fluviolacustrine materials which, filled the tectonic basin at the end of the Pliocene and during the Pleistocene.
Los sedimentos cuaternarios se hallan distribuidos en toda la parte central de la cuenca del Valle de Cocha-bamba. Su origen se debe a la deposición de los mate-riales transportados tanto por los glaciales como por los ríos que descienden de las partes altas hacia los la-gos que cubrían la cuenca del Valle de Cochabamba.
The quaternary sediments are distributed in all of cen-tral part of the basin of the Cochabamba Valley. Their origin in the deposition of the materials transported by glaciers and rivers that descended from the high parts towards the lakes which once covered the basin of the Cochabamba Valley .
El relleno cuaternario de la cuenca es complejo y está constituido por depósitos de una gran variedad li-tológica, desde bloques y pedrones a limos y arcillas,
The quaternary filling of the basin is complex. It is made up of deposits that have a large lithological vari-ety. They range from blocks and boulders to muds and
27
disminuyendo el tamaño de grano progresivamente desde la parte alta de los abanicos aluviales hasta la parte central de la depresión.
clays. The grain size progressively decreases from the higher part of the alluvial cones towards the central part of the depression.
Existen numerosos pozos que confirman la existencia de materiales heterogéneos tanto en sentido vertical como lateral, sobre todo debido a la sedimentación tumultuosa y caótica originada en las variaciones de nivel lagunar como en el frecuente cambio de cauce de los ríos.
There are numerous wells that confirm the existence of heterogeneous materials as much in vertical as lateral sense. This ois mostly due to the tumultous and cha-otic nature of sedimentation originated in the fluctua-tions in the lakes water level as well as in the frequent changes of the river beds.
El Proyecto CABAS por su parte, a través de Veit (1992), ha impulsado la investigación del origen de los sedimentos no consolidados en el valle. Mediante un estudio glaciológico en la cordillera se ha establecido una correlación entre sedimentos fluviales del valle con sedimentos glaciales de la cordillera. Para cartografiar la distribución superficial de los sedimentos cuaternarios se interpretaron imágenes de satélite Landsat, Tematic Mapper en escalas 1:250.000, 1:100.000 y 1:50.000. Los detalles menores se interpretaron en fotografías aéreas de la zona a una escala aproximada de 1:60.000. La verifi-cación e interpretación de las unidades cartografiadas y el estudio de cortes geológicos en quebradas han sido re-alizadas en el campo.
The CABAS Project for its part, with the study of Veit (1992) has thrown new light on the origin of the non-consolidated sediments in the valley. A glaciological study in the Cordillera has established a correlation be-tween fluvial sediments of the valley and glacial sedi-ments of the range. To map the superficial distribution of the quaternary sediments satellite images Landsat, Thematic Mapper in scales of 1:250.000, 1:100.000 and 1:50.000 were interpreted. The smaller details were garnered from aerial photographs of the area with an approximate scale of 1:60.000. The verification and interpretation of the mapped units and the study of geological sections along the valleys have been carried out in the field.
3.3.1 Sedimentos superficiales en el Valle de Cochabamba: mapeo sedimentológico
3.3.1 Superficial sediments in the Valley of Cochabamba: sedimentological mappin.
Los sedimentos superficiales están distribuidos de acuerdo al detalle del Mapa Geológico del Cuaternario (Mapa 2). Se caracterizan por tener diferencias en edad, composición y origen. La granulometría desde el flanco sur de la Cordillera del Tunari hacia el Río Ro-cha cambia de grueso a fino. En la cordillera existen depósitos glaciares y al borde sur abanicos y der-rumbes. El centro del valle está caracterizado por sedimentos finos de origen fluvio-lacustre.
The superficial sediments are distributed as shown on the sedimentological map (Map 2). The units are char-acterized by differences in age, composition and ori-gin. The granulometry changes from coarse to fine starting at the southern flank of the Tunari- Range and heading towards the Rocha- River. There are glacial deposits in the range and along the southern edge, there are fans and landslides. Fine sediments of fluvio-lacustrine origin characterize the center of the valley.
El texto se referirá a las unidades indicados en el Mapa 2 usando números de acuerdo al siguiente órden:
1 Morrenas (Choqueyapu II) 2 Morrenas (Choqueyapu I) 3 Abanico con bloques (Pleistoceno) 4 Abanico con bloques (Holoceno Sup.) 5 Abanico con grava y arena (Holoceno Sup.) 6 Abanico con grava, arena y limo (Holoceno inf. a
medio) 7 Abanico con arena, limo y gravas (Holoceno inf. a
medio) 8 Abanico con limo, arcilla y arena (Holoceno inf. a
medio) 9 Sedimentos del Rio Rocha (Holoceno) 10 Derrumbe
The units as shown in the map (Mapa 2 will be re-ferred to according to the following order:
1 Moraines (Choqueyapu II) 2 Moraines (Choqueyapu I) 3 Fan with blocks (Pleistocene) 4 Fan with blocks (Sup. Holocene) 5 Fan with gravel and sand (Sup. Holocene) 6 Fan with gravel, sand and silt (Lower to Middle
Holocene) 7 Fan with sand, silt and gravel (Lower to Middle
Holocene) 8 Fan with silt, clay, sand (Lower to Middle Holo-
cene) 9 Deposits of the Rocha River (Holocene) 10 Landslide
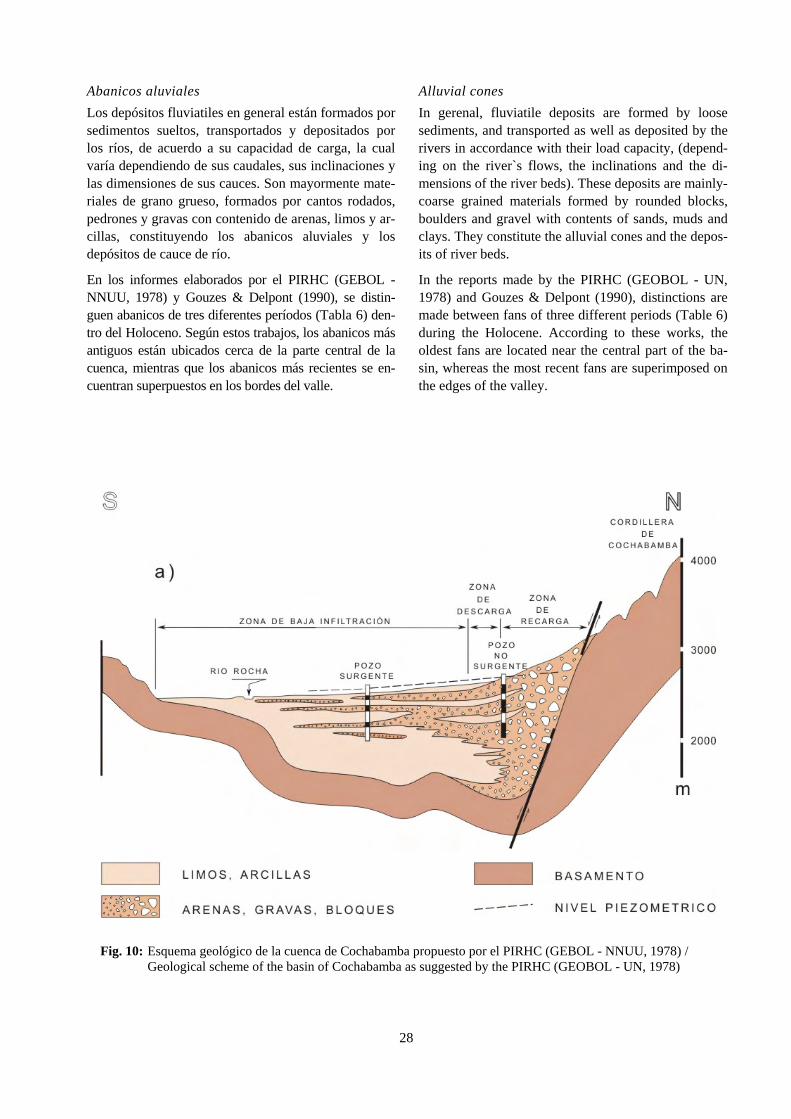
28
Abanicos aluviales Alluvial cones
Los depósitos fluviatiles en general están formados por sedimentos sueltos, transportados y depositados por los ríos, de acuerdo a su capacidad de carga, la cual varía dependiendo de sus caudales, sus inclinaciones y las dimensiones de sus cauces. Son mayormente mate-riales de grano grueso, formados por cantos rodados, pedrones y gravas con contenido de arenas, limos y ar-cillas, constituyendo los abanicos aluviales y los depósitos de cauce de río.
In gerenal, fluviatile deposits are formed by loose sediments, and transported as well as deposited by the rivers in accordance with their load capacity, (depend-ing on the river`s flows, the inclinations and the di-mensions of the river beds). These deposits are mainly-coarse grained materials formed by rounded blocks, boulders and gravel with contents of sands, muds and clays. They constitute the alluvial cones and the depos-its of river beds.
En los informes elaborados por el PIRHC (GEBOL -NNUU, 1978) y Gouzes & Delpont (1990), se distin-guen abanicos de tres diferentes períodos (Tabla 6) den-tro del Holoceno. Según estos trabajos, los abanicos más antiguos están ubicados cerca de la parte central de la cuenca, mientras que los abanicos más recientes se en-cuentran superpuestos en los bordes del valle.
In the reports made by the PIRHC (GEOBOL - UN, 1978) and Gouzes & Delpont (1990), distinctions are made between fans of three different periods (Table 6) during the Holocene. According to these works, the oldest fans are located near the central part of the ba-sin, whereas the most recent fans are superimposed on the edges of the valley.
Fig. 10: Esquema geológico de la cuenca de Cochabamba propuesto por el PIRHC (GEBOL - NNUU, 1978) /
Geological scheme of the basin of Cochabamba as suggested by the PIRHC (GEOBOL - UN, 1978)
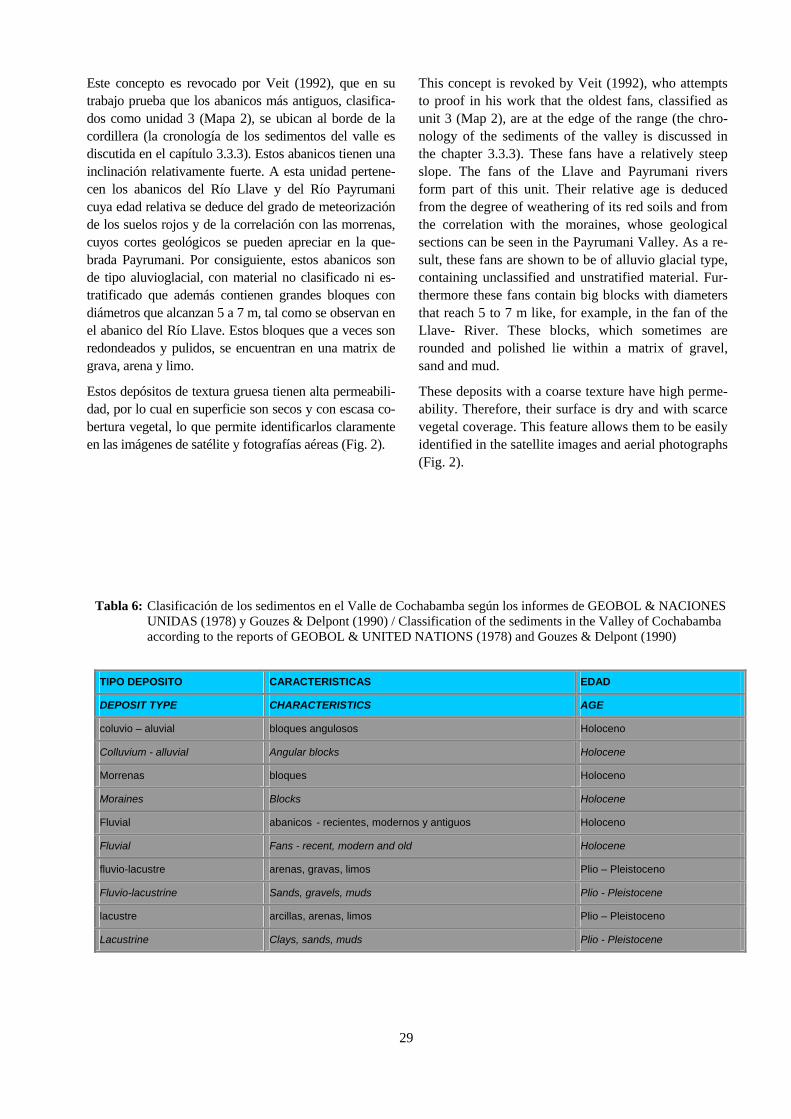
29
Este concepto es revocado por Veit (1992), que en su trabajo prueba que los abanicos más antiguos, clasifica-dos como unidad 3 (Mapa 2), se ubican al borde de la cordillera (la cronología de los sedimentos del valle es discutida en el capítulo 3.3.3). Estos abanicos tienen una inclinación relativamente fuerte. A esta unidad pertene-cen los abanicos del Río Llave y del Río Payrumani cuya edad relativa se deduce del grado de meteorización de los suelos rojos y de la correlación con las morrenas, cuyos cortes geológicos se pueden apreciar en la que-brada Payrumani. Por consiguiente, estos abanicos son de tipo aluvioglacial, con material no clasificado ni es-tratificado que además contienen grandes bloques con diámetros que alcanzan 5 a 7 m, tal como se observan en el abanico del Río Llave. Estos bloques que a veces son redondeados y pulidos, se encuentran en una matrix de grava, arena y limo.
This concept is revoked by Veit (1992), who attempts to proof in his work that the oldest fans, classified as unit 3 (Map 2), are at the edge of the range (the chro-nology of the sediments of the valley is discussed in the chapter 3.3.3). These fans have a relatively steep slope. The fans of the Llave and Payrumani rivers form part of this unit. Their relative age is deduced from the degree of weathering of its red soils and from the correlation with the moraines, whose geological sections can be seen in the Payrumani Valley. As a re-sult, these fans are shown to be of alluvio glacial type, containing unclassified and unstratified material. Fur-thermore these fans contain big blocks with diameters that reach 5 to 7 m like, for example, in the fan of the Llave- River. These blocks, which sometimes are rounded and polished lie within a matrix of gravel, sand and mud.
Estos depósitos de textura gruesa tienen alta permeabili-dad, por lo cual en superficie son secos y con escasa co-bertura vegetal, lo que permite identificarlos claramente en las imágenes de satélite y fotografías aéreas (Fig. 2).
These deposits with a coarse texture have high perme-ability. Therefore, their surface is dry and with scarce vegetal coverage. This feature allows them to be easily identified in the satellite images and aerial photographs (Fig. 2).
Tabla 6: Clasificación de los sedimentos en el Valle de Cochabamba según los informes de GEOBOL & NACIONES UNIDAS (1978) y Gouzes & Delpont (1990) / Classification of the sediments in the Valley of Cochabamba according to the reports of GEOBOL & UNITED NATIONS (1978) and Gouzes & Delpont (1990)
TIPO DEPOSITO CARACTERISTICAS EDAD
DEPOSIT TYPE CHARACTERISTICS AGE
coluvio – aluvial bloques angulosos Holoceno
Colluvium - alluvial Angular blocks Holocene
Morrenas bloques Holoceno
Moraines Blocks Holocene
Fluvial abanicos - recientes, modernos y antiguos Holoceno
Fluvial Fans - recent, modern and old Holocene
fluvio-lacustre arenas, gravas, limos Plio – Pleistoceno
Fluvio-lacustrine Sands, gravels, muds Plio - Pleistocene
lacustre arcillas, arenas, limos Plio – Pleistoceno
Lacustrine Clays, sands, muds Plio - Pleistocene
30
Los abanicos de las unidades 6, 7 y 8 (Mapa 2) se ex-tienden hacia el Río Rocha con menor pendiente, cor-tando los abanicos de la unidad 3 a los cuales se super-ponen en su parte distal, lo que significa que son más re-cientes que los de la unidad 3. En profundidad los abanicos de la unidad 3 se extienden hacia el Río Rocha (Mapa 2) lo que en superficie no es visible. Los suelos de los abanicos más recientes son del tipo cambisol, poco desarrollados. La evolución de estos abanicos no está relacionada con las glaciaciones, por lo que el mate-rial tiene una mejor clasificación y es de granulometríamás fina, predominando limos y arcillas.
The fans of the units 6, 7 and 8 (Map 2) extend to-wards the Rocha- River with minor slopes. They cut through the fans of the unit 3 on which they are super-imposed in their distal part. That means, that they are younger than those of the unit 3. The fans of the unit 3 extend towards the Rocha- River in the depth (Map 2), what is not visible on surface. The soils of the most re-cent fans are of the cambisol type and little developed. The origin of these fans is not related to glaciation which makes the material better classified and of finer granulometry with predominantly muds and clays.
Los abanicos actuales corresponden a las unidades 4 y 5 (Mapa 2), los mismos que se presentan en dos formas dependiendo del tamaño de la subcuenca. Cuando la subcuenca es más grande como las de los ríos Llave y Payrumani, los abanicos antiguos han sido disectados, en algunos casos hasta una profundidad de 80 m. Estos valles hacia el Río Rocha disminuyen progresivamente y el lecho actual se amplía en forma de cono. Cuando la subcuenca es pequeña, las quebradas no son capaces de desarrollar un desagüe permanente y menos cortar los abanicos antiguos. Por lo tanto sus materiales son de-positados superficialmente sobre los abanicos antiguoscuyo material es similar y probablemente forman el núcleo de los abanicos actuales.
The younger fans correspond to the units 4 or 5 (Map 2). Two types are identified, the nature of each de-pending on the size of the sub- basin. When the sub-basin is bigger than those of the Llave and Payrumani rivers, the old fans were dissected down to a depth of 80 m. These valleys which run towards the Rocha-River progressively shrink and the bed extends in the shape of a cone. When the sub-basin is small, gorges are not able to develop a permanent drain and, they are even less able to cut through the old fans. Therefore their materials are deposited superficially onto the old fans. The material that comprises the old fans, is simi-lar tothat of the younger fans and, probably form the center of the current fans.
Estas unidades 4 y 5 en parte son identificables en las imágenes de satélite por su coloración azul intensa que origina de la composición de la roca ordovícica. Se repite en las cumbres de la cordillera ordovícica en partes de escasa vegetación (Fig. 2).
Units 4 and 5 are easy to identify in the satellite im-ages because of their very intense blue coloring that is linked to the composition of the Ordovician rocks. This situation also occurs in the Odovician part of the mountain range, in areas where vegetation is scarce (Fig. 2).
En general todas las unidades cambian gradualmente su granulometría, de gruesa a fina, en dirección del Río Rocha.
In general, the granulometry of all the units gradually change from coarse to fine, in direction towards the Rocha- River.
Sedimentos del Río Rocha Sediments of the Rocha- River
La unidad 8 corresponde a los sedimentos del actual Río Rocha. La granulometría de los mismos varía en función al origen del aporte de sus afluentes. Por ejemplo en la zona del Río Viloma los materiales son más gruesos. Esta subcuenca aporta dichos materiales de los depósitos glaciales clasificados como unidades 1 y 2 (Mapa 2).
The unit 8 corresponds to the sediments of the current Rocha- River. Their granulometry varies according to the origin of the materials of its tributaries. For example, the materials in the area of the Viloma- River have coarser grains. This sub-basin carries these materials from the glacial deposits classified as units 1 and 2 (Map 2).
El Río Rocha en la actualidad ha cortado entre 4 a 6 m de profundidad los sedimentos de la cuenca, dejando una terraza de 2 m de altura, que contiene limo, arena e in-clusive grava al sur de Vinto, al igual que en su conflu-encia con el Río Viloma. Durante el pasado reciente los afluentes del Río Rocha han podido transportar materia-
Presently, the Rocha River has cut through about 4 to 6 m deep into the sediments of the basin, leaving a 2 m high terrace that contains mud, sands and as well gravel in the south of Vinto, and at its confluence with the Viloma River. In the recent past, the tributaries of the Rocha River have been able to transport relatively coarse
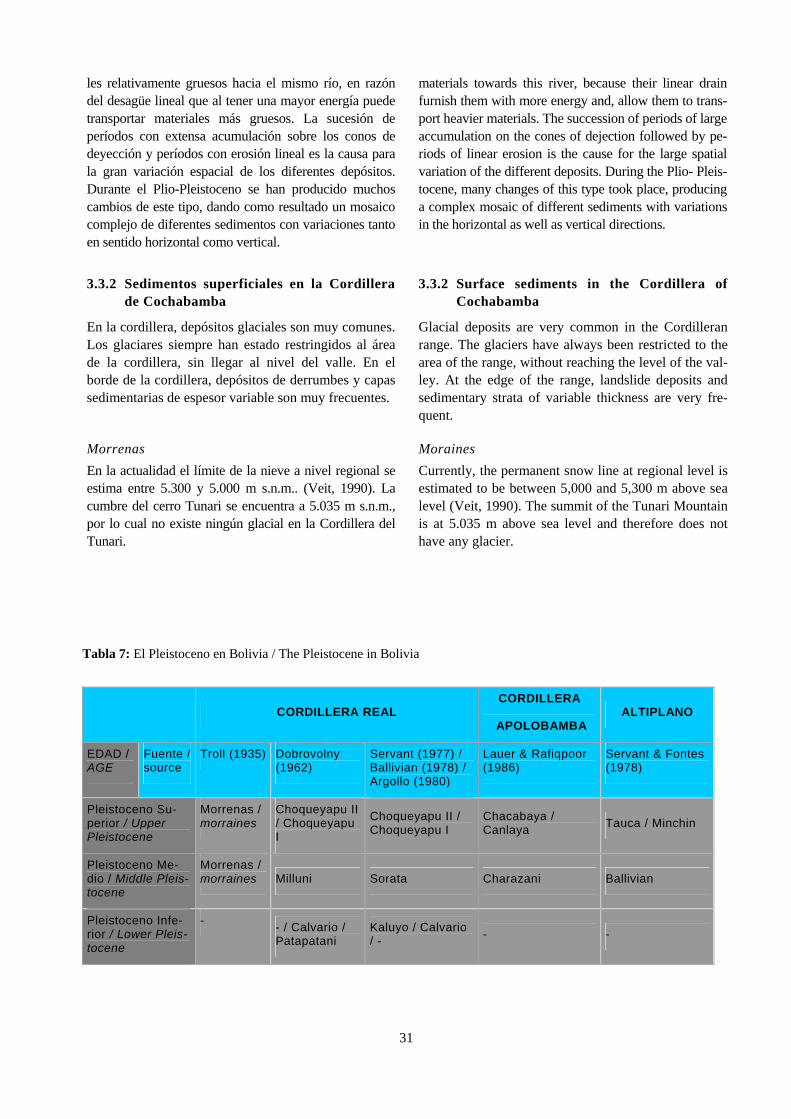
31
les relativamente gruesos hacia el mismo río, en razón del desagüe lineal que al tener una mayor energía puede transportar materiales más gruesos. La sucesión de períodos con extensa acumulación sobre los conos de deyección y períodos con erosión lineal es la causa para la gran variación espacial de los diferentes depósitos. Durante el Plio-Pleistoceno se han producido muchos cambios de este tipo, dando como resultado un mosaico complejo de diferentes sedimentos con variaciones tanto en sentido horizontal como vertical.
materials towards this river, because their linear drain furnish them with more energy and, allow them to trans-port heavier materials. The succession of periods of large accumulation on the cones of dejection followed by pe-riods of linear erosion is the cause for the large spatial variation of the different deposits. During the Plio- Pleis-tocene, many changes of this type took place, producing a complex mosaic of different sediments with variations in the horizontal as well as vertical directions.
3.3.2 Sedimentos superficiales en la Cordillera de Cochabamba
3.3.2 Surface sediments in the Cordillera of Cochabamba
En la cordillera, depósitos glaciales son muy comunes. Los glaciares siempre han estado restringidos al área de la cordillera, sin llegar al nivel del valle. En el borde de la cordillera, depósitos de derrumbes y capas sedimentarias de espesor variable son muy frecuentes.
Glacial deposits are very common in the Cordilleran range. The glaciers have always been restricted to the area of the range, without reaching the level of the val-ley. At the edge of the range, landslide deposits and sedimentary strata of variable thickness are very fre-quent.
Morrenas Moraines
En la actualidad el límite de la nieve a nivel regional se estima entre 5.300 y 5.000 m s.n.m.. (Veit, 1990). La cumbre del cerro Tunari se encuentra a 5.035 m s.n.m., por lo cual no existe ningún glacial en la Cordillera del Tunari.
Currently, the permanent snow line at regional level is estimated to be between 5,000 and 5,300 m above sea level (Veit, 1990). The summit of the Tunari Mountain is at 5.035 m above sea level and therefore does not have any glacier.
Tabla 7: El Pleistoceno en Bolivia / The Pleistocene in Bolivia
CORDILLERA REAL CORDILLERA
APOLOBAMBA ALTIPLANO
EDAD / AGE
Fuente / source
Troll (1935) Dobrovolny (1962)
Servant (1977) / Ballivian (1978) / Argollo (1980)
Lauer & Rafiqpoor (1986)
Servant & Fontes (1978)
Pleistoceno Su-perior / Upper Pleistocene
Morrenas / morraines
Choqueyapu II / Choqueyapu I
Choqueyapu II / Choqueyapu I
Chacabaya / Canlaya
Tauca / Minchin
Pleistoceno Me-dio / Middle Pleis-tocene
Morrenas / morraines Milluni Sorata Charazani Ballivian
Pleistoceno Infe-rior / Lower Pleis-tocene
- - / Calvario / Patapatani
Kaluyo / Calvario / -
- -
32
Sobre la base del estudio de morrenas y formas glacia-les como circos, valles en U, etc. se puede reconstruir la máxima extensión de los glaciales durante el Cua-ternario Superior (Mapa 2), dando como resultado que ningún glacial alcanzó la llanura del valle de Cocha-bamba durante esa época.
The maximum extension of the glaciers during the Upper Quaternary can be reconstructed on the basis of the study of moraines and glacial forms like cirques, U-shaped valleys etc. (Map 2). According to these re-sults, no glacier reached the plain of the valley of Cochabamba during that period.
Se distinguen dos generaciones de morrenas con dis-tintos relieves y diferentes alturas, con una extensión máxima que llega a los 3.400 m s.n.m.. Las morrenas de la unidad 2 (Mapa 2) alcanzan alturas mínimas en el flanco sur del cerro Tunari en los valles de los ríos Potrero, Llave y Payrumani, con espesores hasta de 100 m, donde el límite de nieve fósil se reconstruye en los 4.100 m s.n.m. y la depresión entre los 1.200 y 1.300 m.
Two generations of moraines can be identified, each of them with different reliefs and heights, but, all with maximum extensions reaching down to 3.400 m. The moraines of the unit 2 (Map 2) reach minimum heights on the southern flank of the Tunari mountain, in the valleys of the Potrero, Llave and Payrumani rivers, and have thicknesses of up to 100 m. Here, the fossil snow limit is reconstructed at about 4.100 m above sea level and the depression between 1.200 and 1.300 m.
Las morrenas de la unidad 1 son de poca extensión. Se encuentran sólo en algunas cumbres que sobrepasan los 4.600 m s.n.m., y descienden hasta los 4.000 m s.n.m. con un límite de nieve reconstruido a 4.600 m s.n.m. y una depresión de 700 a 800 m. Son de poco espesor y mal preservadas por la morfodinámica periglacial de las alturas.
The moraines of the unit 1 are of little extension. They are only found in some summits that surpass the 4.600 m, and descend to 4.000 m, where the reconstructed snow limit lies at 4.600 m and a depression is of 700 to 800 m. They are of little thickness and badly preserved due to the periglazial morphodynamic activity.
Depósitos glaciales más antiguos son difíciles de distin-guir en comparación con otras regiones de los Andes en Sudamérica.
Older glacial deposits are difficult to identify in com-parison to other regions of the Andes in South-America.
Las morrenas documentan una depresión de la tempera-tura media anual y el incremento de la precipitación (Ha-senrath & Kutzenbach, 1988). Por lo tanto la cantidad de lluvia, la poca evaporación y las extensas cubiertas de hielo influyeron en el desagüe de ríos y quebradas lo que explica la formación de los abanicos grandes y la com-posición de la unidad 3 (Mapa 2).
The moraines document a former depression of the an-nual average temperature and a higher precipitation (Hasenrath & Kutzenbach, 1988). The amount of rain, low evaporation and the large covers of ice influenced the drainage processes of rivers and gorges. These fac-tors all contributed to the formation of the big fans and, also help to explain the composition of the unit 3 (Map 2).
Todos los depósitos descritos son producto de las glacia-ciones que en América se conocen como grandes glacia-ciones, separadas por períodos interglaciales que abar-caron cerca de 2 millones de años. Las diferentes glacia-ciones se presentan en la Tabla 7.
All the deposits recently described were produced dur-ing the glaciation that in America is known as the great glaciation, separated by interglacial periods that lasted nearly 2 million years. The different glaciations are presented in the Tabla 7.
Derrumbes Landslides
Los derrumbes, que han sido clasificados como unidad 10, son un fenómeno común en la cordillera, causados por la inestabilidad de las rocas debido al relieve, fuerte pendiente y la actividad tectónica. Los más conocidos son el de Sipe Sipe, del Río Llave y del Río Chako Mapa 2). En el caso del Río Llave, el derrumbe cayó sobre el glaciar, causando la incorporación en los conos de este material que junto con el material mor-rénico forman los sedimentos fluvio-glaciales.
The landslides (classified as unit "10"), are a common phenomenon in the Cordilleran range. They are caused by the instability of the rocks due to sharp slopes and tectonic activity. The best known are those of Sipe Sipe, the Rio Llave and the Chaco River (Map 2). In the Llave River landslide, the collapse fell onto the glacier, causing the incorporation in the cones of this material that, together with the moraine- material, form the fluvio- glacial sediments.
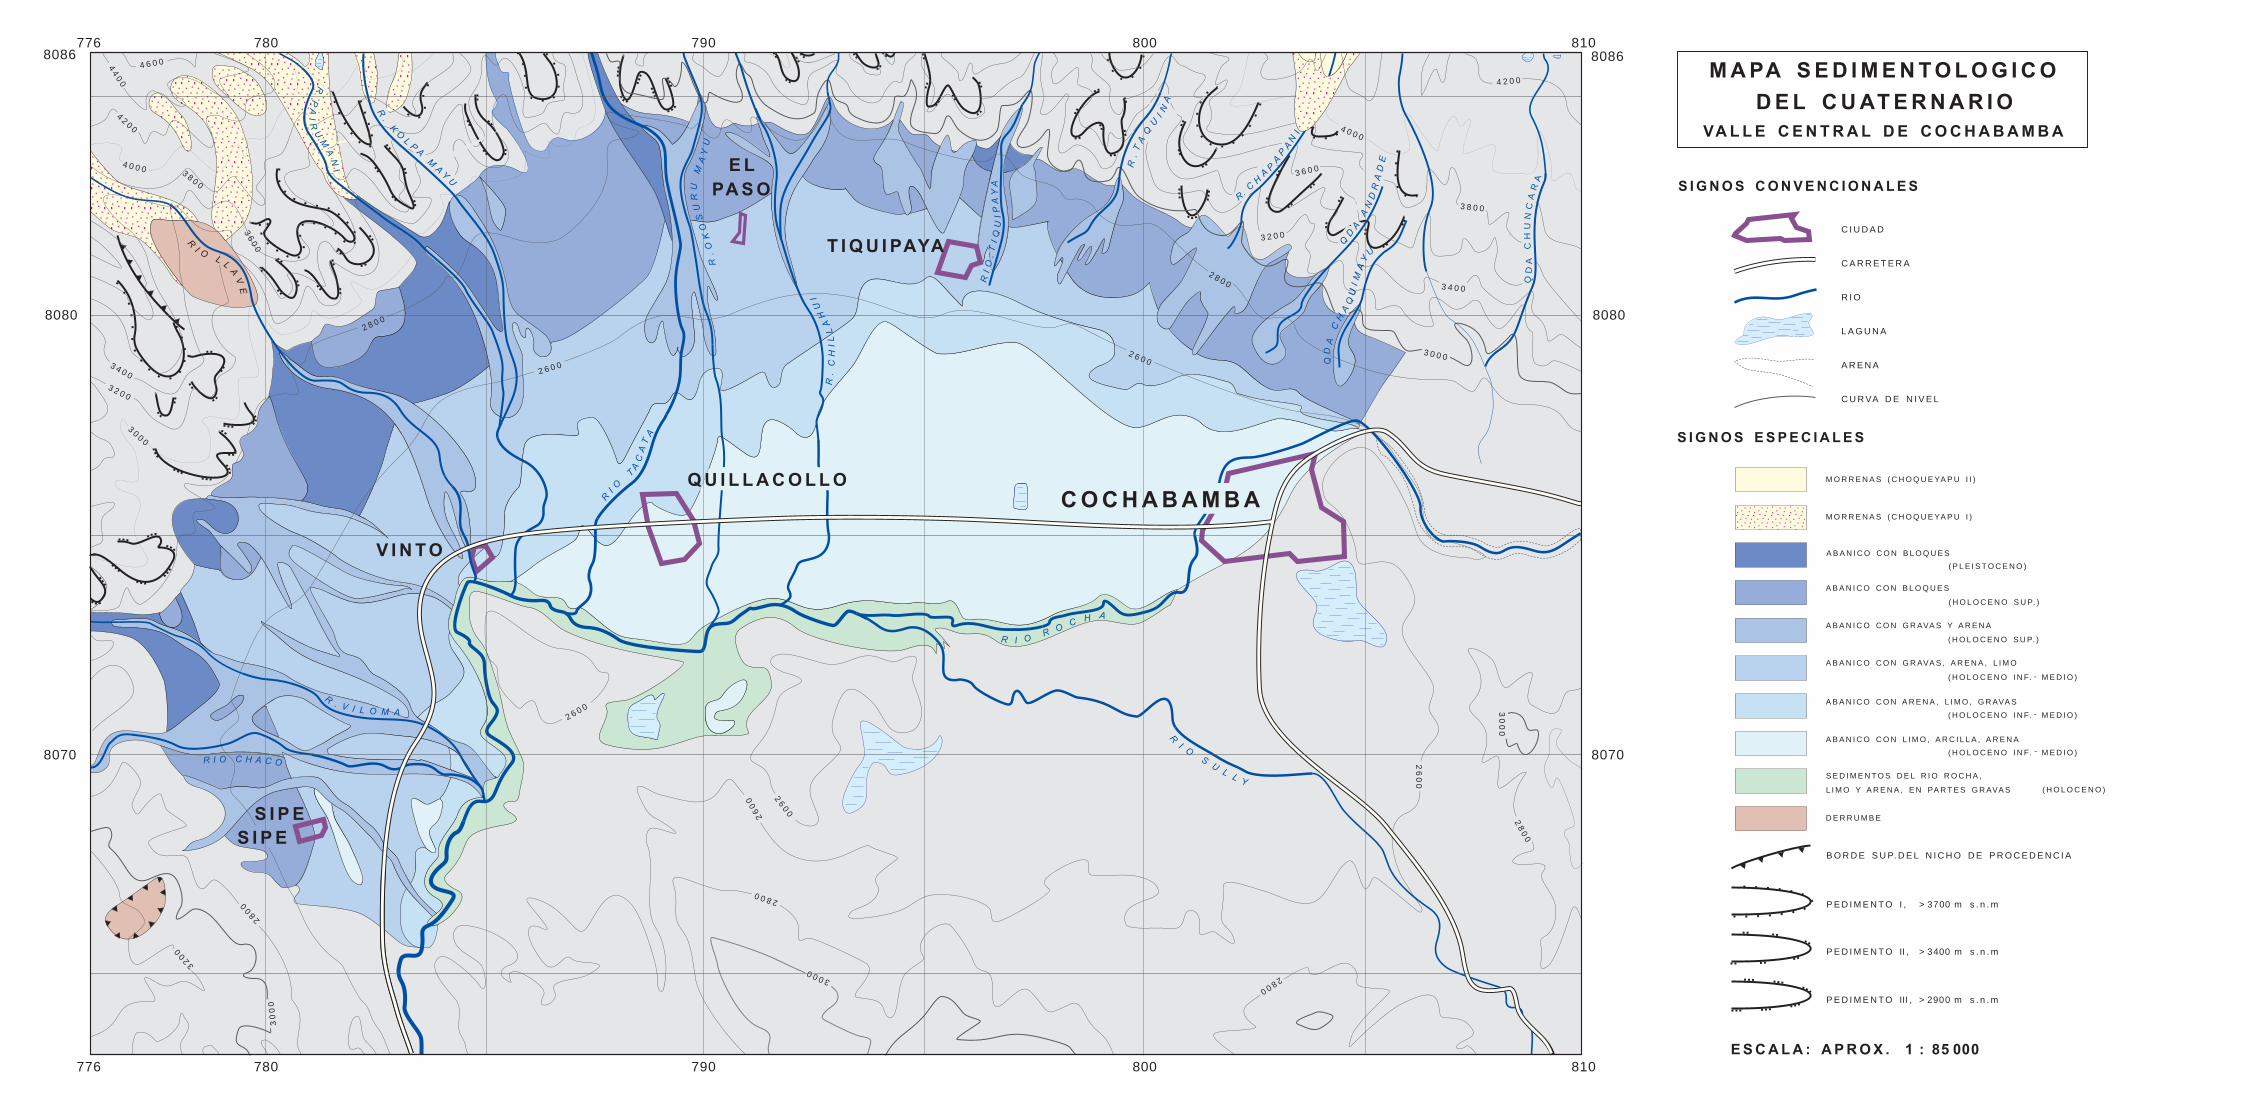
R.
PA
IR
N
UM
AI
R.
PA
IR
N
UM
AI
S I P E
S I P E
PA S O
C I U D A D
A R E N A
C U R VA D E N I V E L
S I G N O S C O N V E N C I O N A L E S
S I G N O S E S P E C I A L E S
M O R R E N A S ( C H O Q U E YA P U I I )
M O R R E N A S ( C H O Q U E YA P U I )
A B A N I C O C O N B L O Q U E S
A B A N I C O C O N B L O Q U E S
( P L E I S T O C E N O )
( H O L O C E N O S U P. )
( H O L O C E N O S U P. )
A B A N I C O C O N G R AVA S Y A R E N A
A B A N I C O C O N A R E N A , L I M O , G R AVA S
A B A N I C O C O N L I M O , A R C I L L A , A R E N A
A B A N I C O C O N G R AVA S , A R E N A , L I M O
( H O L O C E N O I N F. - M E D I O )
( H O L O C E N O I N F. - M E D I O )
( H O L O C E N O I N F. - M E D I O )
S E D I M E N T O S D E L R I O R O C H A ,
L I M O Y A R E N A , E N PA R T E S G R AVA S ( H O L O C E N O )
D E R R U M B E
B O R D E S U P. D E L N I C H O D E P R O C E D E N C I A
C A R R E T E R A
R I O
L A G U N A
P E D I M E N T O I , > 3700 m s . n . m
P E D I M E N T O III , > 2900 m s . n . m
P E D I M E N T O II , > 3400 m s . n . m
V I N T O
T I Q U I PAYA
UA
8086 8086
8070 8070
776
776
780
780
790
790
800
800
810
810
8080 8080
E L
4 2 0 0
4 0 0 0
3 8 0 0
3 6 0 0
3 4 0 0
3 2 0 0
3 0 0 02 6 0 0
30
00
28
00
26
00
28
00
2800
3000
26
00 2
60
0
4 6 0 044
00
42
00
4 0 0 0 38
00
36
00
34
00
3 2 0 0
30
00
2 6 0 0
26
00
32
00
30
00
28
00
R.
CH
IL
LA
HU
I
QD
AA
ND
RA
DE
QD
AA
ND
RA
DE
R.
CH
A
PA
PA
NI
R.
CH
A
PA
PA
NI
QD
AC
HU
NC
AR
A
QD
AC
HU
NC
AR
A
R.
TA
N
QU
IA
R.
TA
N
QU
IA
QD
AA
ND
RA
DE
R.
CH
A
PA
PA
NI
RI
O
T
AC
AT
A
QD
AC
HU
NC
AR
A
R.
TA
N
QU
IA
RI
.I
QU
IP
AY
A
R.
K
O
Y
LP
A
MA
U
R.
K
O
Y
LP
A
MA
U
R.
K
O
Y
LP
A
MA
U
R.
OK
OS
UR
UM
AY
U
R I O C H A C O
R
IO
SU
LL
Y
R I OR
OC
H A
C O C H A B A M B AQ U I L L A C O L L O
QD
AC
AQ
UI
MA
Y
U
R. V I L O M A
2 8 0 0
28
00
TO
R.
PA
IR
N
UM
AI
R
I
L
OL
AV
E
M A PA S E D I M E N T O L O G I C O
D E L C U AT E R N A R I O
VA L L E C E N T R A L D E C O C H A B A M B A
E S C A L A : A P R O X . 1 : 85 000
H
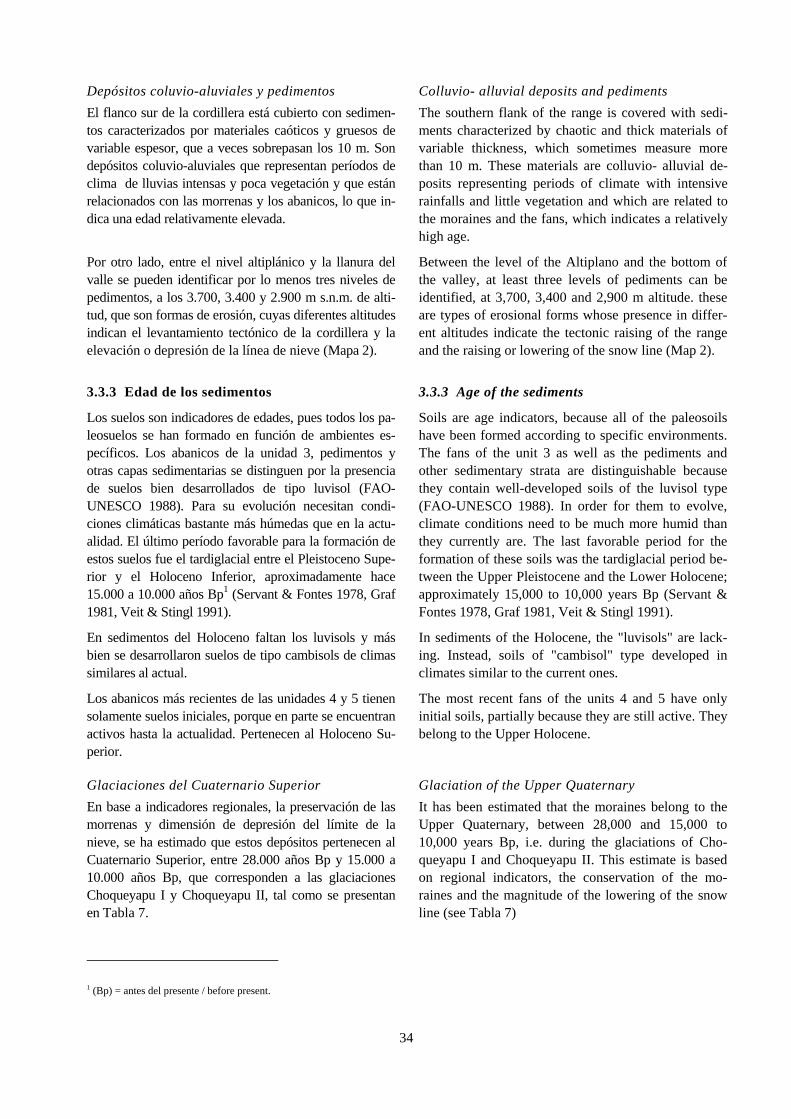
34
Depósitos coluvio-aluviales y pedimentos Colluvio- alluvial deposits and pediments
El flanco sur de la cordillera está cubierto con sedimen-tos caracterizados por materiales caóticos y gruesos de variable espesor, que a veces sobrepasan los 10 m. Son depósitos coluvio-aluviales que representan períodos de clima de lluvias intensas y poca vegetación y que están relacionados con las morrenas y los abanicos, lo que in-dica una edad relativamente elevada.
The southern flank of the range is covered with sedi-ments characterized by chaotic and thick materials of variable thickness, which sometimes measure more than 10 m. These materials are colluvio- alluvial de-posits representing periods of climate with intensive rainfalls and little vegetation and which are related to the moraines and the fans, which indicates a relatively high age.
Por otro lado, entre el nivel altiplánico y la llanura del valle se pueden identificar por lo menos tres niveles de pedimentos, a los 3.700, 3.400 y 2.900 m s.n.m. de alti-tud, que son formas de erosión, cuyas diferentes altitudes indican el levantamiento tectónico de la cordillera y la elevación o depresión de la línea de nieve (Mapa 2).
Between the level of the Altiplano and the bottom of the valley, at least three levels of pediments can be identified, at 3,700, 3,400 and 2,900 m altitude. these are types of erosional forms whose presence in differ-ent altitudes indicate the tectonic raising of the range and the raising or lowering of the snow line (Map 2).
3.3.3 Edad de los sedimentos 3.3.3 Age of the sediments
Los suelos son indicadores de edades, pues todos los pa-leosuelos se han formado en función de ambientes es-pecíficos. Los abanicos de la unidad 3, pedimentos y otras capas sedimentarias se distinguen por la presencia de suelos bien desarrollados de tipo luvisol (FAO-UNESCO 1988). Para su evolución necesitan condi-ciones climáticas bastante más húmedas que en la actu-alidad. El último período favorable para la formación de estos suelos fue el tardiglacial entre el Pleistoceno Supe-rior y el Holoceno Inferior, aproximadamente hace 15.000 a 10.000 años Bp1 (Servant & Fontes 1978, Graf 1981, Veit & Stingl 1991).
Soils are age indicators, because all of the paleosoils have been formed according to specific environments. The fans of the unit 3 as well as the pediments and other sedimentary strata are distinguishable because they contain well-developed soils of the luvisol type (FAO-UNESCO 1988). In order for them to evolve, climate conditions need to be much more humid than they currently are. The last favorable period for the formation of these soils was the tardiglacial period be-tween the Upper Pleistocene and the Lower Holocene; approximately 15,000 to 10,000 years Bp (Servant & Fontes 1978, Graf 1981, Veit & Stingl 1991).
En sedimentos del Holoceno faltan los luvisols y más bien se desarrollaron suelos de tipo cambisols de climas similares al actual.
In sediments of the Holocene, the "luvisols" are lack-ing. Instead, soils of "cambisol" type developed in climates similar to the current ones.
Los abanicos más recientes de las unidades 4 y 5 tienen solamente suelos iniciales, porque en parte se encuentran activos hasta la actualidad. Pertenecen al Holoceno Su-perior.
The most recent fans of the units 4 and 5 have only initial soils, partially because they are still active. They belong to the Upper Holocene.
Glaciaciones del Cuaternario Superior Glaciation of the Upper Quaternary
En base a indicadores regionales, la preservación de las morrenas y dimensión de depresión del límite de la nieve, se ha estimado que estos depósitos pertenecen al Cuaternario Superior, entre 28.000 años Bp y 15.000 a 10.000 años Bp, que corresponden a las glaciaciones Choqueyapu I y Choqueyapu II, tal como se presentan en Tabla 7.
It has been estimated that the moraines belong to the Upper Quaternary, between 28,000 and 15,000 to 10,000 years Bp, i.e. during the glaciations of Cho-queyapu I and Choqueyapu II. This estimate is based on regional indicators, the conservation of the mo-raines and the magnitude of the lowering of the snow line (see Tabla 7)
1 (Bp) = antes del presente / before present.
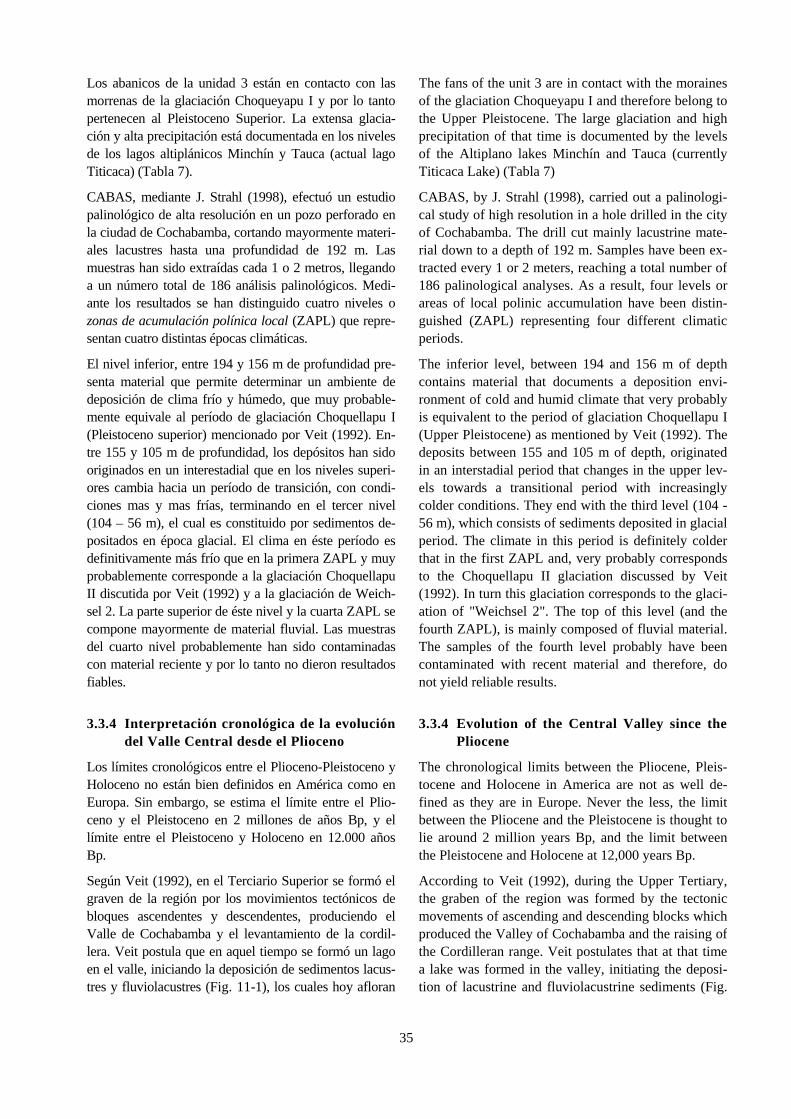
35
Los abanicos de la unidad 3 están en contacto con las morrenas de la glaciación Choqueyapu I y por lo tanto pertenecen al Pleistoceno Superior. La extensa glacia-ción y alta precipitación está documentada en los niveles de los lagos altiplánicos Minchín y Tauca (actual lago Titicaca) (Tabla 7).
The fans of the unit 3 are in contact with the moraines of the glaciation Choqueyapu I and therefore belong to the Upper Pleistocene. The large glaciation and high precipitation of that time is documented by the levels of the Altiplano lakes Minchín and Tauca (currently Titicaca Lake) (Tabla 7)
CABAS, mediante J. Strahl (1998), efectuó un estudio palinológico de alta resolución en un pozo perforado en la ciudad de Cochabamba, cortando mayormente materi-ales lacustres hasta una profundidad de 192 m. Las muestras han sido extraídas cada 1 o 2 metros, llegando a un número total de 186 análisis palinológicos. Medi-ante los resultados se han distinguido cuatro niveles o zonas de acumulación polínica local (ZAPL) que repre-sentan cuatro distintas épocas climáticas.
CABAS, by J. Strahl (1998), carried out a palinologi-cal study of high resolution in a hole drilled in the city of Cochabamba. The drill cut mainly lacustrine mate-rial down to a depth of 192 m. Samples have been ex-tracted every 1 or 2 meters, reaching a total number of 186 palinological analyses. As a result, four levels or areas of local polinic accumulation have been distin-guished (ZAPL) representing four different climaticperiods.
El nivel inferior, entre 194 y 156 m de profundidad pre-senta material que permite determinar un ambiente de deposición de clima frío y húmedo, que muy probable-mente equivale al período de glaciación Choquellapu I (Pleistoceno superior) mencionado por Veit (1992). En-tre 155 y 105 m de profundidad, los depósitos han sido originados en un interestadial que en los niveles superi-ores cambia hacia un período de transición, con condi-ciones mas y mas frías, terminando en el tercer nivel (104 – 56 m), el cual es constituido por sedimentos de-positados en época glacial. El clima en éste período es definitivamente más frío que en la primera ZAPL y muy probablemente corresponde a la glaciación Choquellapu II discutida por Veit (1992) y a la glaciación de Weich-sel 2. La parte superior de éste nivel y la cuarta ZAPL se compone mayormente de material fluvial. Las muestras del cuarto nivel probablemente han sido contaminadas con material reciente y por lo tanto no dieron resultados fiables.
The inferior level, between 194 and 156 m of depth contains material that documents a deposition envi-ronment of cold and humid climate that very probably is equivalent to the period of glaciation Choquellapu I (Upper Pleistocene) as mentioned by Veit (1992). The deposits between 155 and 105 m of depth, originated in an interstadial period that changes in the upper lev-els towards a transitional period with increasingly colder conditions. They end with the third level (104 -56 m), which consists of sediments deposited in glacial period. The climate in this period is definitely colder that in the first ZAPL and, very probably corresponds to the Choquellapu II glaciation discussed by Veit (1992). In turn this glaciation corresponds to the glaci-ation of "Weichsel 2". The top of this level (and the fourth ZAPL), is mainly composed of fluvial material. The samples of the fourth level probably have been contaminated with recent material and therefore, do not yield reliable results.
3.3.4 Interpretación cronológica de la evolución del Valle Central desde el Plioceno
3.3.4 Evolution of the Central Valley since the Pliocene
Los límites cronológicos entre el Plioceno-Pleistoceno y Holoceno no están bien definidos en América como en Europa. Sin embargo, se estima el límite entre el Plio-ceno y el Pleistoceno en 2 millones de años Bp, y el límite entre el Pleistoceno y Holoceno en 12.000 años Bp.
The chronological limits between the Pliocene, Pleis-tocene and Holocene in America are not as well de-fined as they are in Europe. Never the less, the limit between the Pliocene and the Pleistocene is thought to lie around 2 million years Bp, and the limit between the Pleistocene and Holocene at 12,000 years Bp.
Según Veit (1992), en el Terciario Superior se formó el graven de la región por los movimientos tectónicos de bloques ascendentes y descendentes, produciendo el Valle de Cochabamba y el levantamiento de la cordil-lera. Veit postula que en aquel tiempo se formó un lago en el valle, iniciando la deposición de sedimentos lacus-tres y fluviolacustres (Fig. 11-1), los cuales hoy afloran
According to Veit (1992), during the Upper Tertiary, the graben of the region was formed by the tectonic movements of ascending and descending blocks which produced the Valley of Cochabamba and the raising of the Cordilleran range. Veit postulates that at that time a lake was formed in the valley, initiating the deposi-tion of lacustrine and fluviolacustrine sediments (Fig.
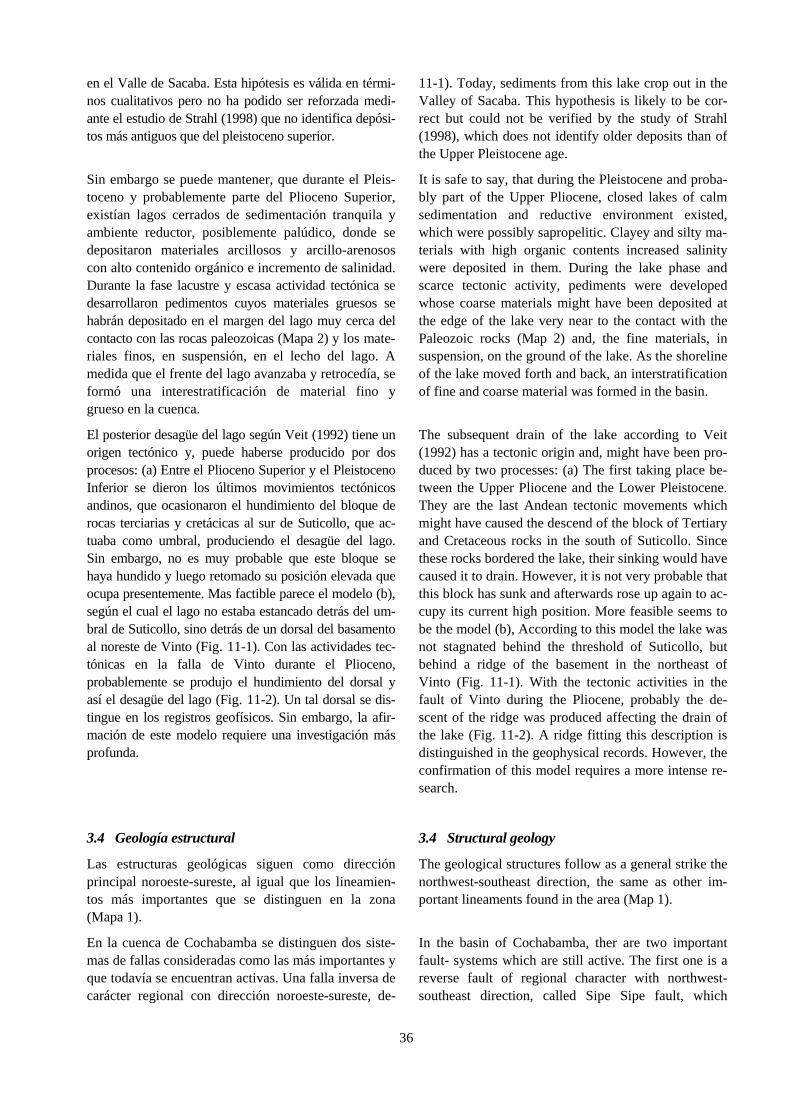
36
en el Valle de Sacaba. Esta hipótesis es válida en térmi-nos cualitativos pero no ha podido ser reforzada medi-ante el estudio de Strahl (1998) que no identifica depósi-tos más antiguos que del pleistoceno superior.
11-1). Today, sediments from this lake crop out in the Valley of Sacaba. This hypothesis is likely to be cor-rect but could not be verified by the study of Strahl (1998), which does not identify older deposits than of the Upper Pleistocene age.
Sin embargo se puede mantener, que durante el Pleis-toceno y probablemente parte del Plioceno Superior, existían lagos cerrados de sedimentación tranquila y ambiente reductor, posiblemente palúdico, donde se depositaron materiales arcillosos y arcillo-arenosos con alto contenido orgánico e incremento de salinidad. Durante la fase lacustre y escasa actividad tectónica se desarrollaron pedimentos cuyos materiales gruesos se habrán depositado en el margen del lago muy cerca del contacto con las rocas paleozoicas (Mapa 2) y los mate-riales finos, en suspensión, en el lecho del lago. A medida que el frente del lago avanzaba y retrocedía, se formó una interestratificación de material fino y grueso en la cuenca.
It is safe to say, that during the Pleistocene and proba-bly part of the Upper Pliocene, closed lakes of calm sedimentation and reductive environment existed, which were possibly sapropelitic. Clayey and silty ma-terials with high organic contents increased salinity were deposited in them. During the lake phase and scarce tectonic activity, pediments were developed whose coarse materials might have been deposited at the edge of the lake very near to the contact with the Paleozoic rocks (Map 2) and, the fine materials, in suspension, on the ground of the lake. As the shoreline of the lake moved forth and back, an interstratification of fine and coarse material was formed in the basin.
El posterior desagüe del lago según Veit (1992) tiene un origen tectónico y, puede haberse producido por dos procesos: (a) Entre el Plioceno Superior y el Pleistoceno Inferior se dieron los últimos movimientos tectónicos andinos, que ocasionaron el hundimiento del bloque de rocas terciarias y cretácicas al sur de Suticollo, que ac-tuaba como umbral, produciendo el desagüe del lago. Sin embargo, no es muy probable que este bloque se haya hundido y luego retomado su posición elevada que ocupa presentemente. Mas factible parece el modelo (b), según el cual el lago no estaba estancado detrás del um-bral de Suticollo, sino detrás de un dorsal del basamento al noreste de Vinto (Fig. 11-1). Con las actividades tec-tónicas en la falla de Vinto durante el Plioceno, probablemente se produjo el hundimiento del dorsal y así el desagüe del lago (Fig. 11-2). Un tal dorsal se dis-tingue en los registros geofísicos. Sin embargo, la afir-mación de este modelo requiere una investigación más profunda.
The subsequent drain of the lake according to Veit (1992) has a tectonic origin and, might have been pro-duced by two processes: (a) The first taking place be-tween the Upper Pliocene and the Lower Pleistocene. They are the last Andean tectonic movements which might have caused the descend of the block of Tertiary and Cretaceous rocks in the south of Suticollo. Since these rocks bordered the lake, their sinking would have caused it to drain. However, it is not very probable that this block has sunk and afterwards rose up again to ac-cupy its current high position. More feasible seems to be the model (b), According to this model the lake was not stagnated behind the threshold of Suticollo, but behind a ridge of the basement in the northeast of Vinto (Fig. 11-1). With the tectonic activities in the fault of Vinto during the Pliocene, probably the de-scent of the ridge was produced affecting the drain of the lake (Fig. 11-2). A ridge fitting this description is distinguished in the geophysical records. However, the confirmation of this model requires a more intense re-search.
3.4 Geología estructural 3.4 Structural geology
Las estructuras geológicas siguen como dirección principal noroeste-sureste, al igual que los lineamien-tos más importantes que se distinguen en la zona (Mapa 1).
The geological structures follow as a general strike the northwest-southeast direction, the same as other im-portant lineaments found in the area (Map 1).
En la cuenca de Cochabamba se distinguen dos siste-mas de fallas consideradas como las más importantes y que todavía se encuentran activas. Una falla inversa de carácter regional con dirección noroeste-sureste, de-
In the basin of Cochabamba, ther are two important fault- systems which are still active. The first one is a reverse fault of regional character with northwest-southeast direction, called Sipe Sipe fault, which
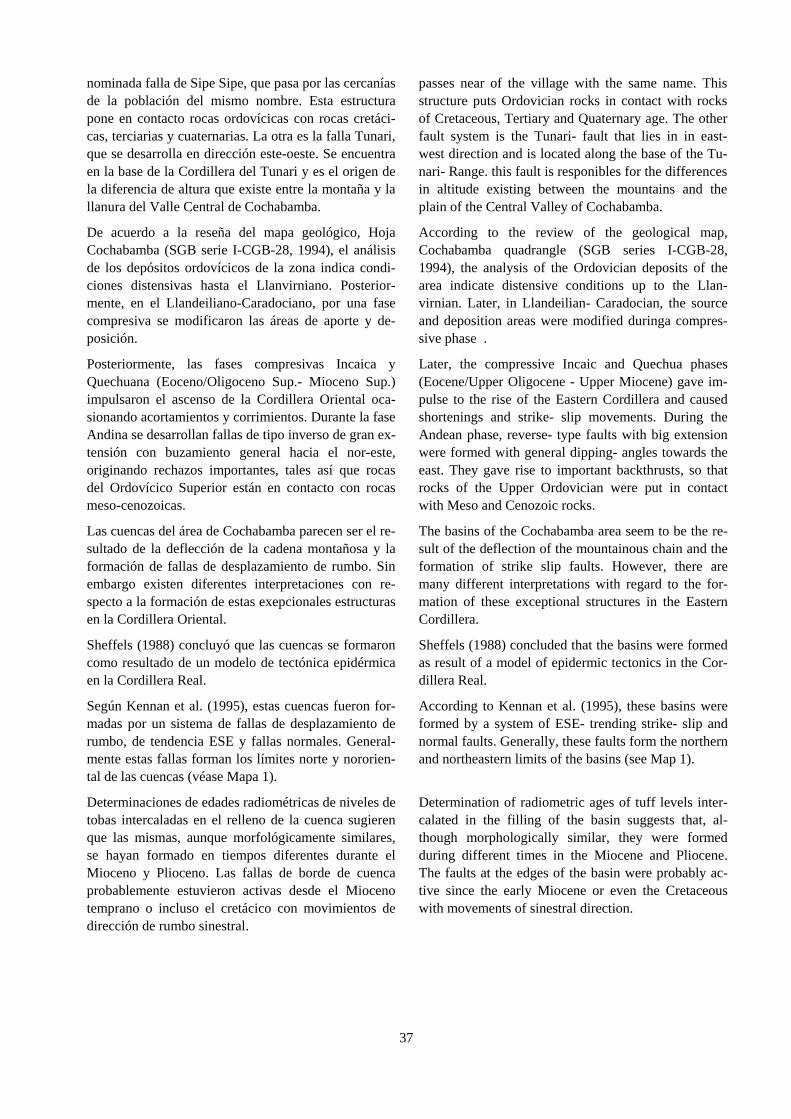
37
nominada falla de Sipe Sipe, que pasa por las cercanías de la población del mismo nombre. Esta estructura pone en contacto rocas ordovícicas con rocas cretáci-cas, terciarias y cuaternarias. La otra es la falla Tunari, que se desarrolla en dirección este-oeste. Se encuentra en la base de la Cordillera del Tunari y es el origen de la diferencia de altura que existe entre la montaña y la llanura del Valle Central de Cochabamba.
passes near of the village with the same name. This structure puts Ordovician rocks in contact with rocks of Cretaceous, Tertiary and Quaternary age. The other fault system is the Tunari- fault that lies in in east-west direction and is located along the base of the Tu-nari- Range. this fault is responibles for the differences in altitude existing between the mountains and the plain of the Central Valley of Cochabamba.
De acuerdo a la reseña del mapa geológico, Hoja Cochabamba (SGB serie I-CGB-28, 1994), el análisis de los depósitos ordovícicos de la zona indica condi-ciones distensivas hasta el Llanvirniano. Posterior-mente, en el Llandeiliano-Caradociano, por una fase compresiva se modificaron las áreas de aporte y de-posición.
According to the review of the geological map, Cochabamba quadrangle (SGB series I-CGB-28, 1994), the analysis of the Ordovician deposits of the area indicate distensive conditions up to the Llan-virnian. Later, in Llandeilian- Caradocian, the source and deposition areas were modified duringa compres-sive phase .
Posteriormente, las fases compresivas Incaica y Quechuana (Eoceno/Oligoceno Sup.- Mioceno Sup.) impulsaron el ascenso de la Cordillera Oriental oca-sionando acortamientos y corrimientos. Durante la fase Andina se desarrollan fallas de tipo inverso de gran ex-tensión con buzamiento general hacia el nor-este, originando rechazos importantes, tales así que rocas del Ordovícico Superior están en contacto con rocas meso-cenozoicas.
Later, the compressive Incaic and Quechua phases (Eocene/Upper Oligocene - Upper Miocene) gave im-pulse to the rise of the Eastern Cordillera and caused shortenings and strike- slip movements. During the Andean phase, reverse- type faults with big extension were formed with general dipping- angles towards the east. They gave rise to important backthrusts, so that rocks of the Upper Ordovician were put in contact with Meso and Cenozoic rocks.
Las cuencas del área de Cochabamba parecen ser el re-sultado de la deflección de la cadena montañosa y la formación de fallas de desplazamiento de rumbo. Sin embargo existen diferentes interpretaciones con re-specto a la formación de estas exepcionales estructuras en la Cordillera Oriental.
The basins of the Cochabamba area seem to be the re-sult of the deflection of the mountainous chain and the formation of strike slip faults. However, there are many different interpretations with regard to the for-mation of these exceptional structures in the Eastern Cordillera.
Sheffels (1988) concluyó que las cuencas se formaron como resultado de un modelo de tectónica epidérmica en la Cordillera Real.
Sheffels (1988) concluded that the basins were formed as result of a model of epidermic tectonics in the Cor-dillera Real.
Según Kennan et al. (1995), estas cuencas fueron for-madas por un sistema de fallas de desplazamiento de rumbo, de tendencia ESE y fallas normales. General-mente estas fallas forman los límites norte y nororien-tal de las cuencas (véase Mapa 1).
According to Kennan et al. (1995), these basins were formed by a system of ESE- trending strike- slip and normal faults. Generally, these faults form the northern and northeastern limits of the basins (see Map 1).
Determinaciones de edades radiométricas de niveles de tobas intercaladas en el relleno de la cuenca sugieren que las mismas, aunque morfológicamente similares, se hayan formado en tiempos diferentes durante el Mioceno y Plioceno. Las fallas de borde de cuenca probablemente estuvieron activas desde el Mioceno temprano o incluso el cretácico con movimientos de dirección de rumbo sinestral.
Determination of radiometric ages of tuff levels inter-calated in the filling of the basin suggests that, al-though morphologically similar, they were formed during different times in the Miocene and Pliocene. The faults at the edges of the basin were probably ac-tive since the early Miocene or even the Cretaceous with movements of sinestral direction.
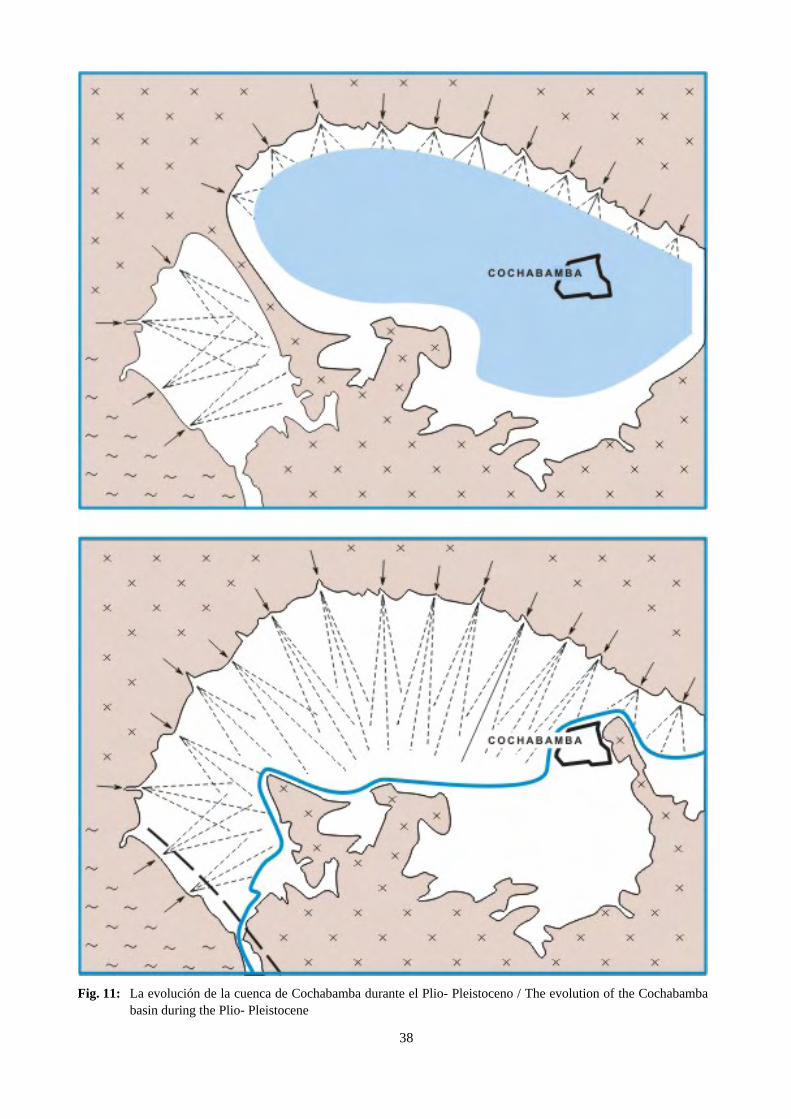
38
Fig. 11: La evolución de la cuenca de Cochabamba durante el Plio- Pleistoceno / The evolution of the Cochabamba basin during the Plio- Pleistocene
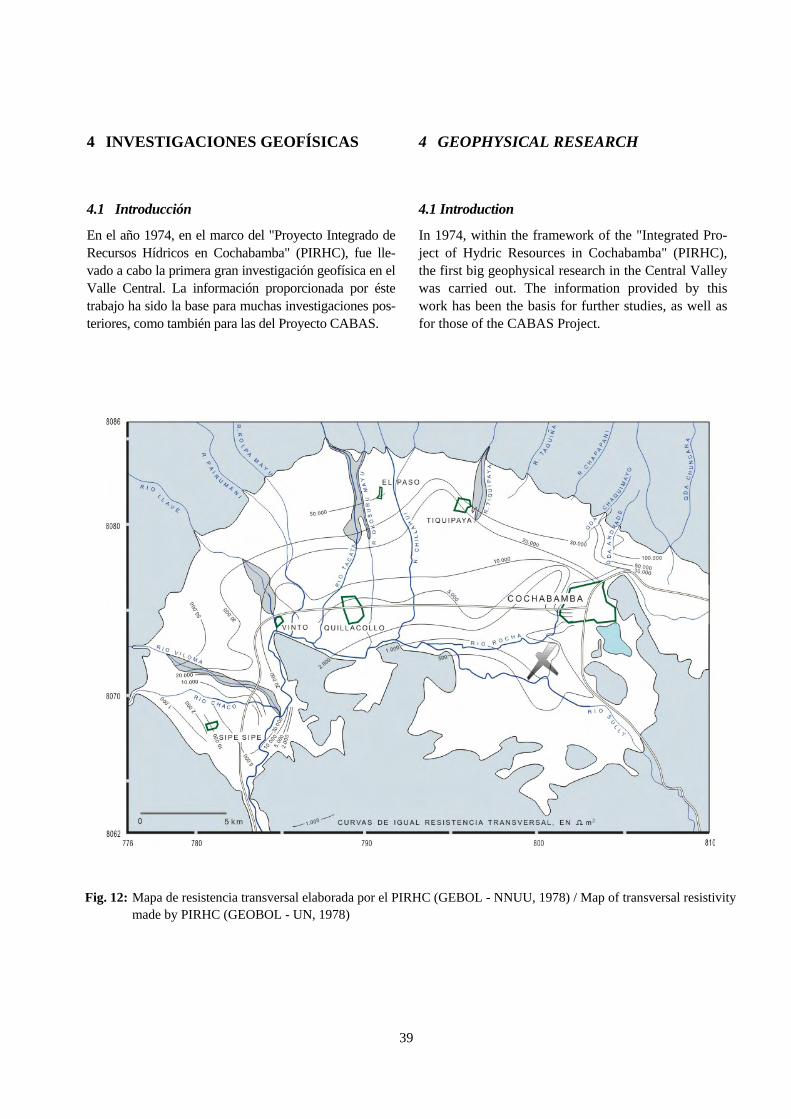
39
4 INVESTIGACIONES GEOFÍSICAS 4 GEOPHYSICAL RESEARCH
4.1 Introducción 4.1 Introduction
En el año 1974, en el marco del "Proyecto Integrado de Recursos Hídricos en Cochabamba" (PIRHC), fue lle-vado a cabo la primera gran investigación geofísica en el Valle Central. La información proporcionada por éste trabajo ha sido la base para muchas investigaciones pos-teriores, como también para las del Proyecto CABAS.
In 1974, within the framework of the "Integrated Pro-ject of Hydric Resources in Cochabamba" (PIRHC), the first big geophysical research in the Central Valley was carried out. The information provided by this work has been the basis for further studies, as well as for those of the CABAS Project.
Fig. 12: Mapa de resistencia transversal elaborada por el PIRHC (GEBOL - NNUU, 1978) / Map of transversal resistivity made by PIRHC (GEOBOL - UN, 1978)
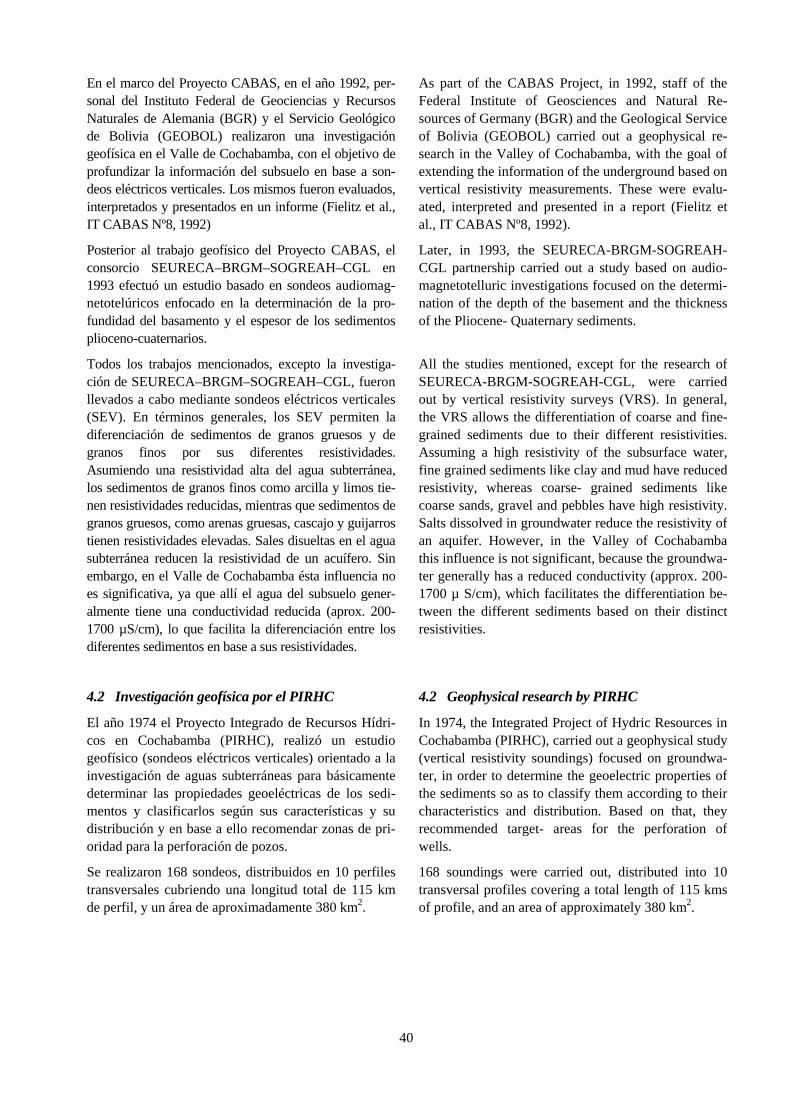
40
En el marco del Proyecto CABAS, en el año 1992, per-sonal del Instituto Federal de Geociencias y Recursos Naturales de Alemania (BGR) y el Servicio Geológico de Bolivia (GEOBOL) realizaron una investigación geofísica en el Valle de Cochabamba, con el objetivo de profundizar la información del subsuelo en base a son-deos eléctricos verticales. Los mismos fueron evaluados, interpretados y presentados en un informe (Fielitz et al., IT CABAS Nº8, 1992)
As part of the CABAS Project, in 1992, staff of the Federal Institute of Geosciences and Natural Re-sources of Germany (BGR) and the Geological Service of Bolivia (GEOBOL) carried out a geophysical re-search in the Valley of Cochabamba, with the goal of extending the information of the underground based on vertical resistivity measurements. These were evalu-ated, interpreted and presented in a report (Fielitz et al., IT CABAS Nº8, 1992).
Posterior al trabajo geofísico del Proyecto CABAS, el consorcio SEURECA–BRGM–SOGREAH–CGL en 1993 efectuó un estudio basado en sondeos audiomag-netotelúricos enfocado en la determinación de la pro-fundidad del basamento y el espesor de los sedimentos plioceno-cuaternarios.
Later, in 1993, the SEURECA-BRGM-SOGREAH-CGL partnership carried out a study based on audio-magnetotelluric investigations focused on the determi-nation of the depth of the basement and the thickness of the Pliocene- Quaternary sediments.
Todos los trabajos mencionados, excepto la investiga-ción de SEURECA–BRGM–SOGREAH–CGL, fueron llevados a cabo mediante sondeos eléctricos verticales (SEV). En términos generales, los SEV permiten la diferenciación de sedimentos de granos gruesos y de granos finos por sus diferentes resistividades. Asumiendo una resistividad alta del agua subterránea, los sedimentos de granos finos como arcilla y limos tie-nen resistividades reducidas, mientras que sedimentos de granos gruesos, como arenas gruesas, cascajo y guijarros tienen resistividades elevadas. Sales disueltas en el agua subterránea reducen la resistividad de un acuífero. Sin embargo, en el Valle de Cochabamba ésta influencia no es significativa, ya que allí el agua del subsuelo gener-almente tiene una conductividad reducida (aprox. 200-1700 µS/cm), lo que facilita la diferenciación entre los diferentes sedimentos en base a sus resistividades.
All the studies mentioned, except for the research of SEURECA-BRGM-SOGREAH-CGL, were carried out by vertical resistivity surveys (VRS). In general, the VRS allows the differentiation of coarse and fine-grained sediments due to their different resistivities. Assuming a high resistivity of the subsurface water, fine grained sediments like clay and mud have reduced resistivity, whereas coarse- grained sediments like coarse sands, gravel and pebbles have high resistivity. Salts dissolved in groundwater reduce the resistivity of an aquifer. However, in the Valley of Cochabamba this influence is not significant, because the groundwa-ter generally has a reduced conductivity (approx. 200-1700 µ S/cm), which facilitates the differentiation be-tween the different sediments based on their distinct resistivities.
4.2 Investigación geofísica por el PIRHC 4.2 Geophysical research by PIRHC
El año 1974 el Proyecto Integrado de Recursos Hídri-cos en Cochabamba (PIRHC), realizó un estudio geofísico (sondeos eléctricos verticales) orientado a la investigación de aguas subterráneas para básicamente determinar las propiedades geoeléctricas de los sedi-mentos y clasificarlos según sus características y su distribución y en base a ello recomendar zonas de pri-oridad para la perforación de pozos.
In 1974, the Integrated Project of Hydric Resources in Cochabamba (PIRHC), carried out a geophysical study (vertical resistivity soundings) focused on groundwa-ter, in order to determine the geoelectric properties of the sediments so as to classify them according to their characteristics and distribution. Based on that, they recommended target- areas for the perforation of wells.
Se realizaron 168 sondeos, distribuidos en 10 perfiles transversales cubriendo una longitud total de 115 km de perfil, y un área de aproximadamente 380 km2.
168 soundings were carried out, distributed into 10 transversal profiles covering a total length of 115 kms of profile, and an area of approximately 380 km2.
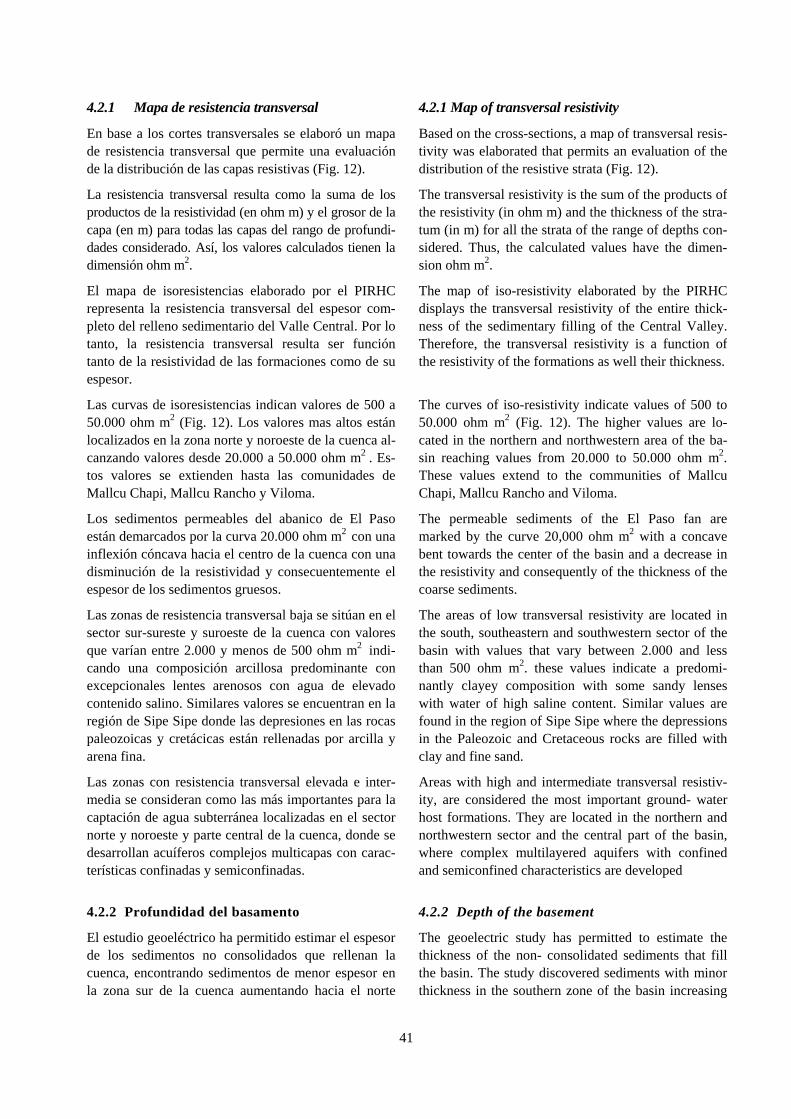
41
4.2.1 Mapa de resistencia transversal 4.2.1 Map of transversal resistivity
En base a los cortes transversales se elaboró un mapa de resistencia transversal que permite una evaluación de la distribución de las capas resistivas (Fig. 12).
Based on the cross-sections, a map of transversal resis-tivity was elaborated that permits an evaluation of the distribution of the resistive strata (Fig. 12).
La resistencia transversal resulta como la suma de los productos de la resistividad (en ohm m) y el grosor de la capa (en m) para todas las capas del rango de profundi-dades considerado. Así, los valores calculados tienen la dimensión ohm m2.
The transversal resistivity is the sum of the products of the resistivity (in ohm m) and the thickness of the stra-tum (in m) for all the strata of the range of depths con-sidered. Thus, the calculated values have the dimen-sion ohm m2.
El mapa de isoresistencias elaborado por el PIRHC representa la resistencia transversal del espesor com-pleto del relleno sedimentario del Valle Central. Por lo tanto, la resistencia transversal resulta ser función tanto de la resistividad de las formaciones como de su espesor.
The map of iso-resistivity elaborated by the PIRHC displays the transversal resistivity of the entire thick-ness of the sedimentary filling of the Central Valley. Therefore, the transversal resistivity is a function of the resistivity of the formations as well their thickness.
Las curvas de isoresistencias indican valores de 500 a 50.000 ohm m2 (Fig. 12). Los valores mas altos están localizados en la zona norte y noroeste de la cuenca al-canzando valores desde 20.000 a 50.000 ohm m2 . Es-tos valores se extienden hasta las comunidades de Mallcu Chapi, Mallcu Rancho y Viloma.
The curves of iso-resistivity indicate values of 500 to 50.000 ohm m2 (Fig. 12). The higher values are lo-cated in the northern and northwestern area of the ba-sin reaching values from 20.000 to 50.000 ohm m2. These values extend to the communities of Mallcu Chapi, Mallcu Rancho and Viloma.
Los sedimentos permeables del abanico de El Paso están demarcados por la curva 20.000 ohm m2 con una inflexión cóncava hacia el centro de la cuenca con una disminución de la resistividad y consecuentemente el espesor de los sedimentos gruesos.
The permeable sediments of the El Paso fan are marked by the curve 20,000 ohm m2 with a concave bent towards the center of the basin and a decrease in the resistivity and consequently of the thickness of the coarse sediments.
Las zonas de resistencia transversal baja se sitúan en el sector sur-sureste y suroeste de la cuenca con valores que varían entre 2.000 y menos de 500 ohm m2 indi-cando una composición arcillosa predominante con excepcionales lentes arenosos con agua de elevado contenido salino. Similares valores se encuentran en la región de Sipe Sipe donde las depresiones en las rocas paleozoicas y cretácicas están rellenadas por arcilla y arena fina.
The areas of low transversal resistivity are located in the south, southeastern and southwestern sector of the basin with values that vary between 2.000 and less than 500 ohm m2. these values indicate a predomi-nantly clayey composition with some sandy lenses with water of high saline content. Similar values are found in the region of Sipe Sipe where the depressions in the Paleozoic and Cretaceous rocks are filled with clay and fine sand.
Las zonas con resistencia transversal elevada e inter-media se consideran como las más importantes para la captación de agua subterránea localizadas en el sector norte y noroeste y parte central de la cuenca, donde se desarrollan acuíferos complejos multicapas con carac-terísticas confinadas y semiconfinadas.
Areas with high and intermediate transversal resistiv-ity, are considered the most important ground- water host formations. They are located in the northern and northwestern sector and the central part of the basin, where complex multilayered aquifers with confined and semiconfined characteristics are developed
4.2.2 Profundidad del basamento 4.2.2 Depth of the basement
El estudio geoeléctrico ha permitido estimar el espesor de los sedimentos no consolidados que rellenan la cuenca, encontrando sedimentos de menor espesor en la zona sur de la cuenca aumentando hacia el norte
The geoelectric study has permitted to estimate the thickness of the non- consolidated sediments that fill the basin. The study discovered sediments with minor thickness in the southern zone of the basin increasing
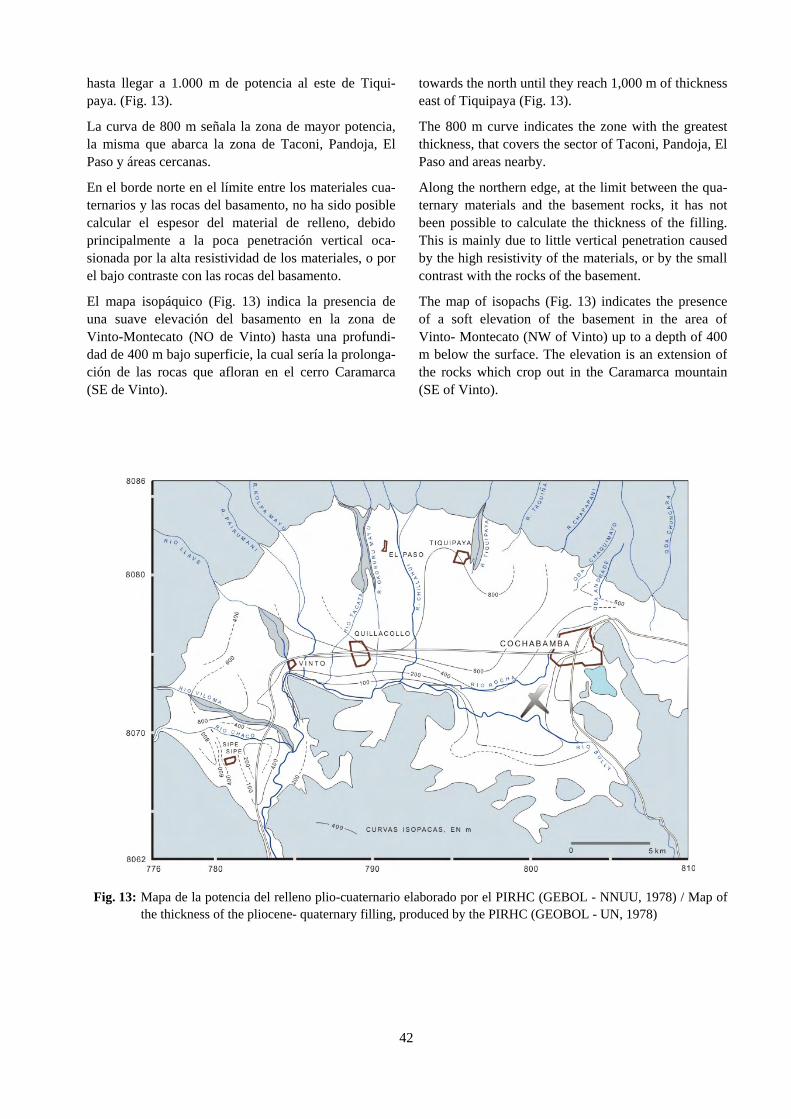
42
hasta llegar a 1.000 m de potencia al este de Tiqui-paya. (Fig. 13).
towards the north until they reach 1,000 m of thickness east of Tiquipaya (Fig. 13).
La curva de 800 m señala la zona de mayor potencia, la misma que abarca la zona de Taconi, Pandoja, El Paso y áreas cercanas.
The 800 m curve indicates the zone with the greatest thickness, that covers the sector of Taconi, Pandoja, El Paso and areas nearby.
En el borde norte en el límite entre los materiales cua-ternarios y las rocas del basamento, no ha sido posible calcular el espesor del material de relleno, debido principalmente a la poca penetración vertical oca-sionada por la alta resistividad de los materiales, o por el bajo contraste con las rocas del basamento.
Along the northern edge, at the limit between the qua-ternary materials and the basement rocks, it has not been possible to calculate the thickness of the filling. This is mainly due to little vertical penetration caused by the high resistivity of the materials, or by the small contrast with the rocks of the basement.
El mapa isopáquico (Fig. 13) indica la presencia de una suave elevación del basamento en la zona de Vinto-Montecato (NO de Vinto) hasta una profundi-dad de 400 m bajo superficie, la cual sería la prolonga-ción de las rocas que afloran en el cerro Caramarca (SE de Vinto).
The map of isopachs (Fig. 13) indicates the presence of a soft elevation of the basement in the area of Vinto- Montecato (NW of Vinto) up to a depth of 400 m below the surface. The elevation is an extension of the rocks which crop out in the Caramarca mountain (SE of Vinto).
Fig. 13: Mapa de la potencia del relleno plio-cuaternario elaborado por el PIRHC (GEBOL - NNUU, 1978) / Map of the thickness of the pliocene- quaternary filling, produced by the PIRHC (GEOBOL - UN, 1978)
43
También se puso en relieve que la superficie del basamento paleozoico presenta escalonamientos, suaves en algunos casos, que reflejan la estructura de la fosa tectónica.
The study also highlights tha fact, that the Paleozoic basement sometimes has a soft stairlike surface, which reflects the structure of the tectonic graben.
4.2.3 Análisis 4.2.3 Data analysis
Los datos de sondeos geoeléctricos obtenidos durante el Proyecto PIRHC (GEBOL - NNUU, 1978) en la cuenca de Cochabamba, dieron informaciones valiosas sobre la estructura de la cuenca, y en parte sirvieron de base para la interpretación y preparación del informe geofísico del Proyecto CABAS.
The data of the resistivity surveys obtained during the PIRHC- Project (GEOBOL - UN, 1978) in the basin of Cochabamba, provided valuable information regarding the structure of the basin. The data also served as a valubale refernce during the interpretation and prepa-ration of the geophysical report of the CABAS- Pro-ject.
Sin embargo, muchos de los datos de medición no son satisfactorios desde el punto de vista de las posibili-dades actuales de medición. En parte, la variación de los valores individuales de medición alrededor de la curva de sondeo es bastante grande, lo que causa la in-certidumbre en la determinación del modelo de capas correspondientes. En algunos casos, la evaluación de la profundidad del basamento se basa en una única medición.
However, much of the data of measurement are not satisfying from the point of view of current measure-ment technologies. Part of the problem is, that the variation of the individual values of measurement around the curve of survey is quite large which, causes uncertainty in the determination of the corresponding strata- model. In some cases, the evaluation of the depth of the basement is based on only one single measurement.
4.3 Investigación geofísica por el Proyecto CABAS 4.3 Geophysical research by the CABAS- Project
En el marco del Proyecto CABAS se llevó a cabo una serie de sondeos geoeléctricos. Estos fueron distribuidos sobre 7 perfiles de 5-10 km de longitud cada uno, per-pendiculares al eje del valle (Fig. 14).
Within the framework of the CABAS- Project, a series of geoelectric soundings was carried out. These were distributed into seven profiles, each 5-10 kms long and, each perpendicular to the axis of the valley (Fig.14).
La distancia media entre los puntos de medición es de aprox. 0,8 km. En total, se llevaron a cabo 46 medi-ciones de sondeo en la configuración Schlumberger. Para obtener una gran profundidad de detección, la me-dia distancia máxima de los electrodos de corriente (AB/2) generalmente era de 1.000 m, en algunos casos hasta 2.300 m.
The average distance between measuring points is approx. 0.8 kms. In sum, a total of 46 measurements were carried out with the Schlumberger- configuration. To obtain a great depth of detection, the average maximum distance of the electrodes (AB/2) generally was 1,000 m, in some cases it reched 2,300 m.
Los perfiles son designados por las letras A, B, C, D, G, H y K. Los sondeos son denominados como sigue: "A01", donde, A indica el perfil A y 01 el número de sondeo (Fig. 14).
The profiles are designated by the letters A, B, C, D, G, H and K. An example of a sounding designation is “A01”, where “A” stands for profile “A” and "01" for the number of sounding (Fig. 14).
Equipos Equipment
El equipo geoeléctrico utilizado para las mediciones (construido por el Instituto Federal de Geociencias y Re-cursos Naturales de Alemania, BGR) tiene una elevada potencia de transmisión (800 W), y una gran sensibilidad y exactitud del amplificador de medición. Se pueden medir voltajes hasta de pocos µV con bajo porcentaje de error. De este modo, las curvas obtenidas pueden ser
The geoelectric equipment used for the measurements (built by the Federal Institute of Geosciences and Natural Resources of Germany, BGR) has a high transmission power (800 W), and a measuring ampli-fier of fine sensitivity and accuracy. Voltages even of some few µV can be measured with a low percentage of error. This way, the obtained curves can be consid-
44
consideradas mas confiables que en las mediciones del PIRHC (GEBOL - NNUU, 1978).
ered more reliable than the measurements of the PIRHC (GEOBOL - UN, 1978).
Evaluación Evaluation
Las curvas han sido obtenidas mediante una aproxima-ción iterativa a los valores registrados. El cálculo se basa en la suposición de que se puede considerar el subsuelo en la cercanía del punto de sondeo como capas aproxi-madamente horizontales. En muchos casos, esta suposi-ción se cumple suficientemente bien en los sedimentos. Sin embargo, las inhomogeneidades en las capas superi-ores aparecen como alteraciones en las curvas.
The curves have been obtained through an iterative approximation of the registered values. The calculation is based on the assumption that the subsoil near the point of sounding has approximately horizontal strata. In many cases, this assumption is complied well enough in the sediments. However, the inhomogene-ties in the upper strata appear as alterations in the curves.
Es típico para el método de medición y evaluación del sondeo eléctrico que combine las capas individuales ex-istentes en la naturaleza (capas relativamente delgadas) en paquetes de capas más gruesas. Por ser anisótropas, el espesor calculado suele ser demasiado grande. Para compensar este error en cierta medida, las profundidades calculadas de los limites de capas en las evaluaciones presentes fueron reducidas en un 10%.
It is typical for the measuring method and the evalua-tion of the electric survey that combines the existing individual strata in nature (relatively thin strata) into thicker groups of strata. Because of the anisotropy of these groups, the calculated thickness yields a value which is too high. To compensate for this error, the calculated depths of the strata limits in the present evaluations were reduced by 10%.
Fig. 14: Ubicación de sondeos eléctricos verticales y perfiles geoeléctricos efectuados por CABAS (Fielitz et al., IT CABAS Nº8, 1992) / Location of vertical resistivity surveys and geoelectric profiles carried out by CABAS (Fielitz et al., IT CABAS Nº8, 1992)
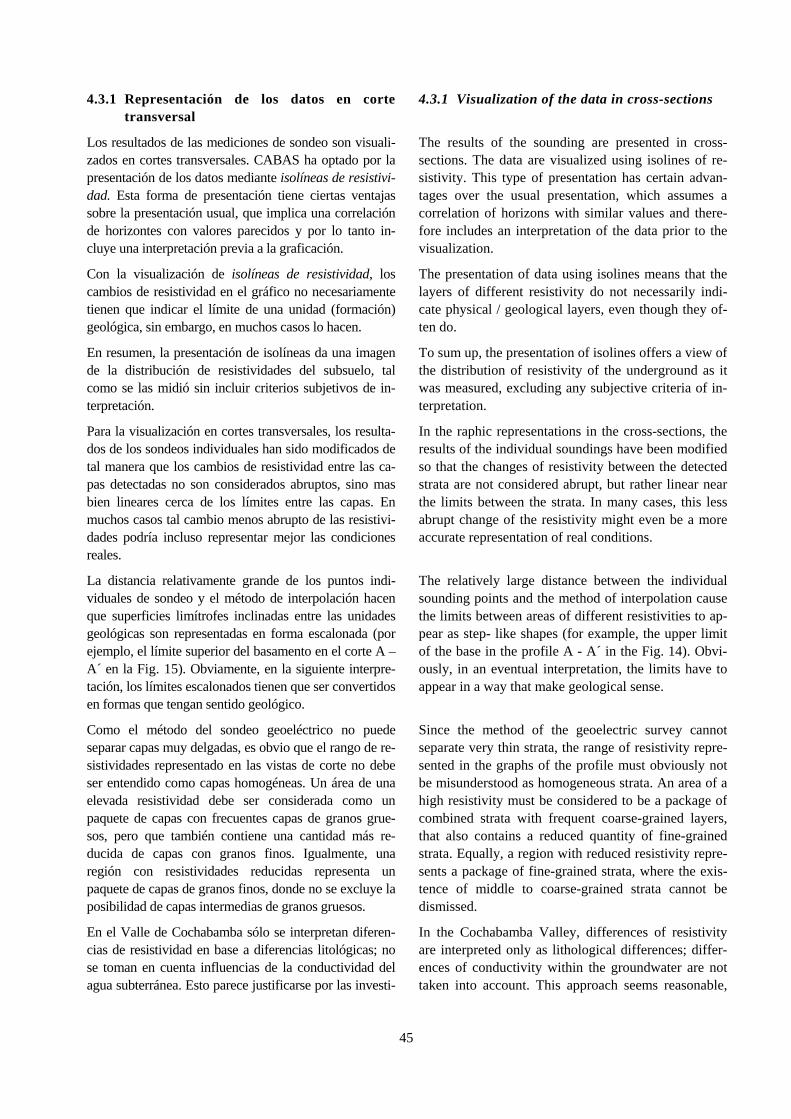
45
4.3.1 Representación de los datos en corte transversal
4.3.1 Visualization of the data in cross-sections
Los resultados de las mediciones de sondeo son visuali-zados en cortes transversales. CABAS ha optado por la presentación de los datos mediante isolíneas de resistivi-dad. Esta forma de presentación tiene ciertas ventajas sobre la presentación usual, que implica una correlación de horizontes con valores parecidos y por lo tanto in-cluye una interpretación previa a la graficación.
The results of the sounding are presented in cross-sections. The data are visualized using isolines of re-sistivity. This type of presentation has certain advan-tages over the usual presentation, which assumes a correlation of horizons with similar values and there-fore includes an interpretation of the data prior to the visualization.
Con la visualización de isolíneas de resistividad, los cambios de resistividad en el gráfico no necesariamente tienen que indicar el límite de una unidad (formación) geológica, sin embargo, en muchos casos lo hacen.
The presentation of data using isolines means that the layers of different resistivity do not necessarily indi-cate physical / geological layers, even though they of-ten do.
En resumen, la presentación de isolíneas da una imagen de la distribución de resistividades del subsuelo, tal como se las midió sin incluir criterios subjetivos de in-terpretación.
To sum up, the presentation of isolines offers a view of the distribution of resistivity of the underground as it was measured, excluding any subjective criteria of in-terpretation.
Para la visualización en cortes transversales, los resulta-dos de los sondeos individuales han sido modificados de tal manera que los cambios de resistividad entre las ca-pas detectadas no son considerados abruptos, sino mas bien lineares cerca de los límites entre las capas. En muchos casos tal cambio menos abrupto de las resistivi-dades podría incluso representar mejor las condiciones reales.
In the raphic representations in the cross-sections, the results of the individual soundings have been modified so that the changes of resistivity between the detected strata are not considered abrupt, but rather linear near the limits between the strata. In many cases, this less abrupt change of the resistivity might even be a more accurate representation of real conditions.
La distancia relativamente grande de los puntos indi-viduales de sondeo y el método de interpolación hacen que superficies limítrofes inclinadas entre las unidades geológicas son representadas en forma escalonada (por ejemplo, el límite superior del basamento en el corte A –A´ en la Fig. 15). Obviamente, en la siguiente interpre-tación, los límites escalonados tienen que ser convertidos en formas que tengan sentido geológico.
The relatively large distance between the individual sounding points and the method of interpolation cause the limits between areas of different resistivities to ap-pear as step- like shapes (for example, the upper limit of the base in the profile A - A´ in the Fig. 14). Obvi-ously, in an eventual interpretation, the limits have to appear in a way that make geological sense.
Como el método del sondeo geoeléctrico no puede separar capas muy delgadas, es obvio que el rango de re-sistividades representado en las vistas de corte no debe ser entendido como capas homogéneas. Un área de una elevada resistividad debe ser considerada como un paquete de capas con frecuentes capas de granos grue-sos, pero que también contiene una cantidad más re-ducida de capas con granos finos. Igualmente, una región con resistividades reducidas representa un paquete de capas de granos finos, donde no se excluye la posibilidad de capas intermedias de granos gruesos.
Since the method of the geoelectric survey cannot separate very thin strata, the range of resistivity repre-sented in the graphs of the profile must obviously not be misunderstood as homogeneous strata. An area of a high resistivity must be considered to be a package of combined strata with frequent coarse-grained layers, that also contains a reduced quantity of fine-grained strata. Equally, a region with reduced resistivity repre-sents a package of fine-grained strata, where the exis-tence of middle to coarse-grained strata cannot be dismissed.
En el Valle de Cochabamba sólo se interpretan diferen-cias de resistividad en base a diferencias litológicas; no se toman en cuenta influencias de la conductividad del agua subterránea. Esto parece justificarse por las investi-
In the Cochabamba Valley, differences of resistivity are interpreted only as lithological differences; differ-ences of conductivity within the groundwater are not taken into account. This approach seems reasonable,
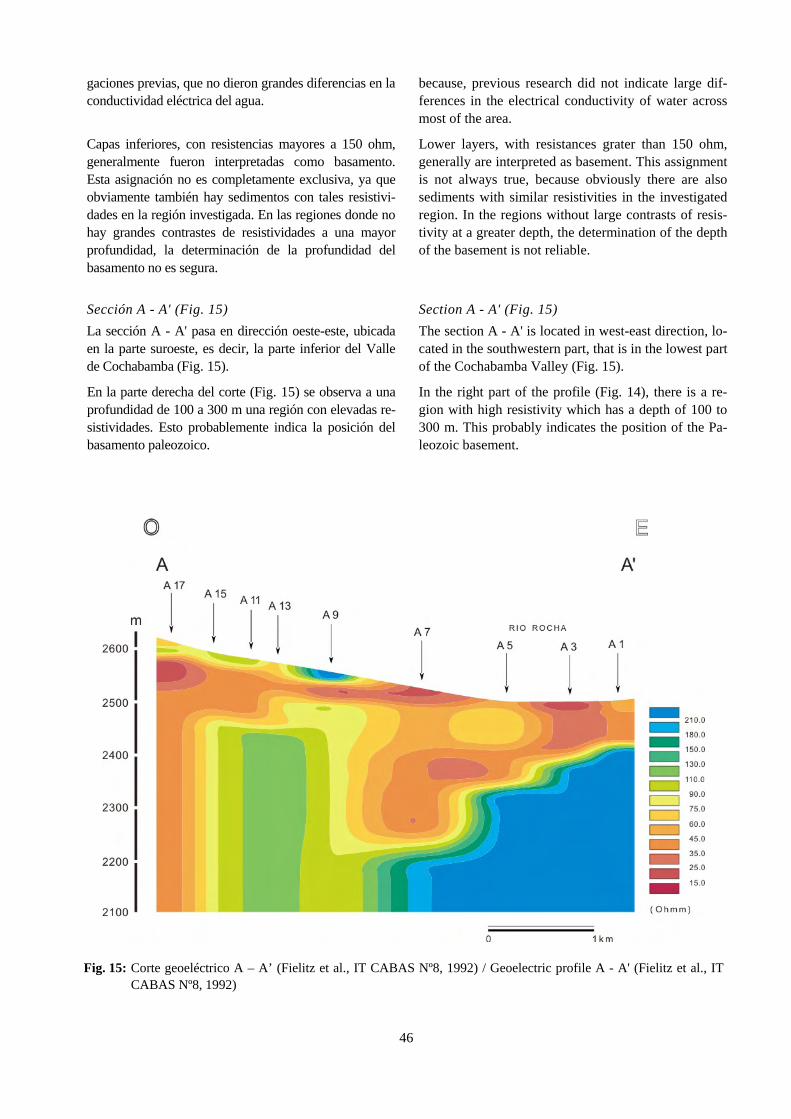
46
gaciones previas, que no dieron grandes diferencias en la conductividad eléctrica del agua.
because, previous research did not indicate large dif-ferences in the electrical conductivity of water across most of the area.
Capas inferiores, con resistencias mayores a 150 ohm, generalmente fueron interpretadas como basamento. Esta asignación no es completamente exclusiva, ya que obviamente también hay sedimentos con tales resistivi-dades en la región investigada. En las regiones donde no hay grandes contrastes de resistividades a una mayor profundidad, la determinación de la profundidad del basamento no es segura.
Lower layers, with resistances grater than 150 ohm, generally are interpreted as basement. This assignment is not always true, because obviously there are also sediments with similar resistivities in the investigated region. In the regions without large contrasts of resis-tivity at a greater depth, the determination of the depth of the basement is not reliable.
Sección A - A' (Fig. 15) Section A - A' (Fig. 15)
La sección A - A' pasa en dirección oeste-este, ubicada en la parte suroeste, es decir, la parte inferior del Valle de Cochabamba (Fig. 15).
The section A - A' is located in west-east direction, lo-cated in the southwestern part, that is in the lowest part of the Cochabamba Valley (Fig. 15).
En la parte derecha del corte (Fig. 15) se observa a una profundidad de 100 a 300 m una región con elevadas re-sistividades. Esto probablemente indica la posición del basamento paleozoico.
In the right part of the profile (Fig. 14), there is a re-gion with high resistivity which has a depth of 100 to 300 m. This probably indicates the position of the Pa-leozoic basement.
Fig. 15: Corte geoeléctrico A – A’ (Fielitz et al., IT CABAS Nº8, 1992) / Geoelectric profile A - A' (Fielitz et al., IT CABAS Nº8, 1992)
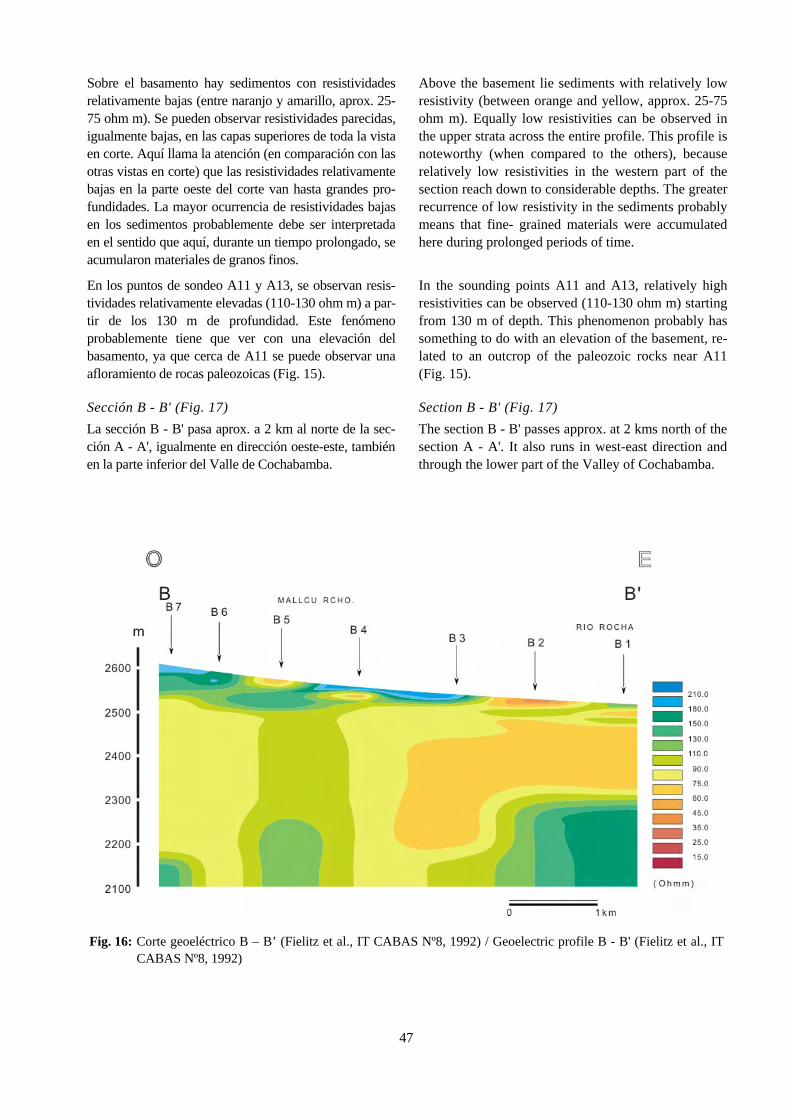
47
Sobre el basamento hay sedimentos con resistividades relativamente bajas (entre naranjo y amarillo, aprox. 25-75 ohm m). Se pueden observar resistividades parecidas, igualmente bajas, en las capas superiores de toda la vista en corte. Aquí llama la atención (en comparación con las otras vistas en corte) que las resistividades relativamente bajas en la parte oeste del corte van hasta grandes pro-fundidades. La mayor ocurrencia de resistividades bajas en los sedimentos probablemente debe ser interpretada en el sentido que aquí, durante un tiempo prolongado, se acumularon materiales de granos finos.
Above the basement lie sediments with relatively low resistivity (between orange and yellow, approx. 25-75 ohm m). Equally low resistivities can be observed in the upper strata across the entire profile. This profile is noteworthy (when compared to the others), because relatively low resistivities in the western part of the section reach down to considerable depths. The greaterrecurrence of low resistivity in the sediments probably means that fine- grained materials were accumulated here during prolonged periods of time.
En los puntos de sondeo A11 y A13, se observan resis-tividades relativamente elevadas (110-130 ohm m) a par-tir de los 130 m de profundidad. Este fenómeno probablemente tiene que ver con una elevación del basamento, ya que cerca de A11 se puede observar una afloramiento de rocas paleozoicas (Fig. 15).
In the sounding points A11 and A13, relatively high resistivities can be observed (110-130 ohm m) starting from 130 m of depth. This phenomenon probably has something to do with an elevation of the basement, re-lated to an outcrop of the paleozoic rocks near A11 (Fig. 15).
Sección B - B' (Fig. 17) Section B - B' (Fig. 17)
La sección B - B' pasa aprox. a 2 km al norte de la sec-ción A - A', igualmente en dirección oeste-este, también en la parte inferior del Valle de Cochabamba.
The section B - B' passes approx. at 2 kms north of the section A - A'. It also runs in west-east direction and through the lower part of the Valley of Cochabamba.
Fig. 16: Corte geoeléctrico B – B’ (Fielitz et al., IT CABAS Nº8, 1992) / Geoelectric profile B - B' (Fielitz et al., IT CABAS Nº8, 1992)
48
Los contrastes de las resistividades en toda la vista de corte son relativamente reducidos. Son comunes resis-tividades entre 60 y 110 ohm.
The contrasts of the resistivities in the whole profile are relatively small. They lie between 60 and 110 ohm.
En la parte oeste del perfil se observa resistividades ele-vadas hasta cerca de la superficie. Esto tiene que ver, por una parte, con el hecho que las capas arenosas encima del nivel del agua subterránea tienen resistividades ele-vadas. Por otra parte, aquí obviamente se ha depositado material de granos gruesos que proviene de las laderas del oeste con elevadas resistividades aún cuando están saturado con agua.
In the western part of the profile, high resistivities can be observed even near the surface. This is caused on the one hand, by the fact that the sandy strata lying above the groundwater level have high resistivities. On the other hand, by the fact that coarse grained materi-als coming from the slopes in the west have high resis-tivities even when saturated with water.
En la parte derecha del cuadro en profundidad nuevamente hay una región con una resistividad elevada, que debe ser interpretada como basamento. El basamento llega a la superficie aproximadamente a unos 600 m al este del punto de medición B1.
In the right part of the picture, there is another region of high resistivity in depth, which must be interpreted as basement. The basement reaches the surface ap-proximately at 600 m east of the measuring point B1.
Debajo del punto de sondeo B5, en una profundidad re-lativamente grande, se pueden observar resistividades ligeramente mayores. Sin embargo, no hay mucho con-traste con las capas superiores, de modo que aquí no se puede hacer una afirmación segura sobre la profundidad del basamento.
Under B5, in a relatively great depth, slightly higher resistivities can be observed. These, however, do not contrast with resistivities of the upper strata. A sound conclusion regarding the depth of the basement cannot be drawn as a result.
Fig. 17: Corte geoeléctrico C – C’ (Fielitz et al., IT CABAS Nº8, 1992) / Geoelectric profile C - C' (Fielitz et al., IT CABAS Nº8, 1992)
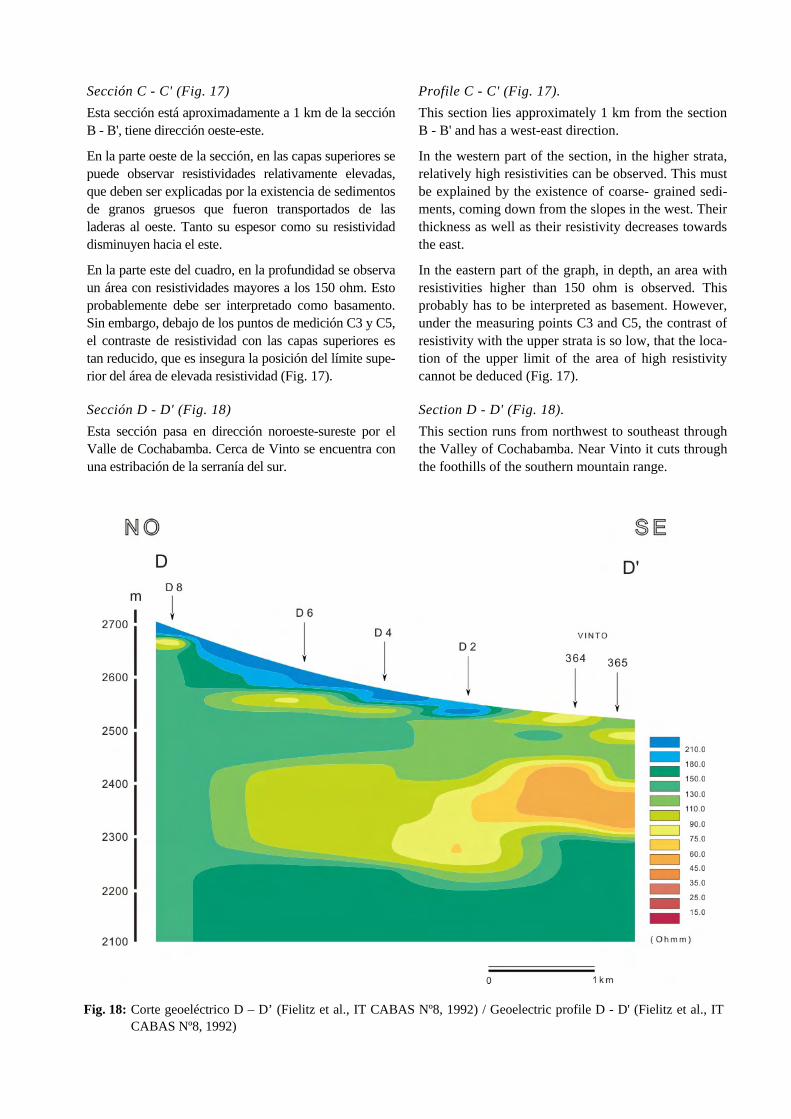
49
Sección C - C' (Fig. 17) Profile C - C' (Fig. 17).
Esta sección está aproximadamente a 1 km de la sección B - B', tiene dirección oeste-este.
This section lies approximately 1 km from the section B - B' and has a west-east direction.
En la parte oeste de la sección, en las capas superiores se puede observar resistividades relativamente elevadas, que deben ser explicadas por la existencia de sedimentos de granos gruesos que fueron transportados de las laderas al oeste. Tanto su espesor como su resistividad disminuyen hacia el este.
In the western part of the section, in the higher strata, relatively high resistivities can be observed. This must be explained by the existence of coarse- grained sedi-ments, coming down from the slopes in the west. Their thickness as well as their resistivity decreases towards the east.
En la parte este del cuadro, en la profundidad se observa un área con resistividades mayores a los 150 ohm. Esto probablemente debe ser interpretado como basamento. Sin embargo, debajo de los puntos de medición C3 y C5, el contraste de resistividad con las capas superiores es tan reducido, que es insegura la posición del límite supe-rior del área de elevada resistividad (Fig. 17).
In the eastern part of the graph, in depth, an area with resistivities higher than 150 ohm is observed. This probably has to be interpreted as basement. However, under the measuring points C3 and C5, the contrast of resistivity with the upper strata is so low, that the loca-tion of the upper limit of the area of high resistivity cannot be deduced (Fig. 17).
Sección D - D' (Fig. 18) Section D - D' (Fig. 18).
Esta sección pasa en dirección noroeste-sureste por el Valle de Cochabamba. Cerca de Vinto se encuentra con una estribación de la serranía del sur.
This section runs from northwest to southeast through the Valley of Cochabamba. Near Vinto it cuts through the foothills of the southern mountain range.
Fig. 18: Corte geoeléctrico D – D’ (Fielitz et al., IT CABAS Nº8, 1992) / Geoelectric profile D - D' (Fielitz et al., IT CABAS Nº8, 1992)
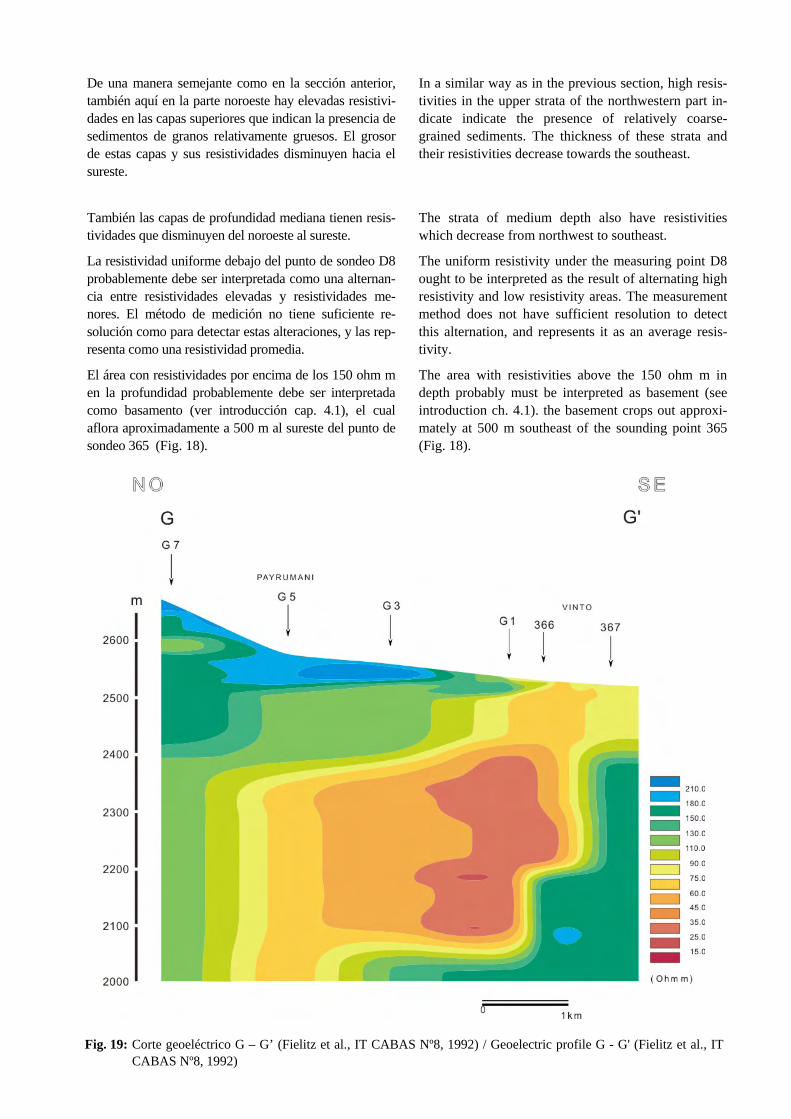
50
De una manera semejante como en la sección anterior, también aquí en la parte noroeste hay elevadas resistivi-dades en las capas superiores que indican la presencia de sedimentos de granos relativamente gruesos. El grosor de estas capas y sus resistividades disminuyen hacia el sureste.
In a similar way as in the previous section, high resis-tivities in the upper strata of the northwestern part in-dicate indicate the presence of relatively coarse-grained sediments. The thickness of these strata and their resistivities decrease towards the southeast.
También las capas de profundidad mediana tienen resis-tividades que disminuyen del noroeste al sureste.
The strata of medium depth also have resistivities which decrease from northwest to southeast.
La resistividad uniforme debajo del punto de sondeo D8 probablemente debe ser interpretada como una alternan-cia entre resistividades elevadas y resistividades me-nores. El método de medición no tiene suficiente re-solución como para detectar estas alteraciones, y las rep-resenta como una resistividad promedia.
The uniform resistivity under the measuring point D8 ought to be interpreted as the result of alternating high resistivity and low resistivity areas. The measurement method does not have sufficient resolution to detect this alternation, and represents it as an average resis-tivity.
El área con resistividades por encima de los 150 ohm m en la profundidad probablemente debe ser interpretada como basamento (ver introducción cap. 4.1), el cual aflora aproximadamente a 500 m al sureste del punto de sondeo 365 (Fig. 18).
The area with resistivities above the 150 ohm m in depth probably must be interpreted as basement (see introduction ch. 4.1). the basement crops out approxi-mately at 500 m southeast of the sounding point 365 (Fig. 18).
Fig. 19: Corte geoeléctrico G – G’ (Fielitz et al., IT CABAS Nº8, 1992) / Geoelectric profile G - G' (Fielitz et al., IT CABAS Nº8, 1992)
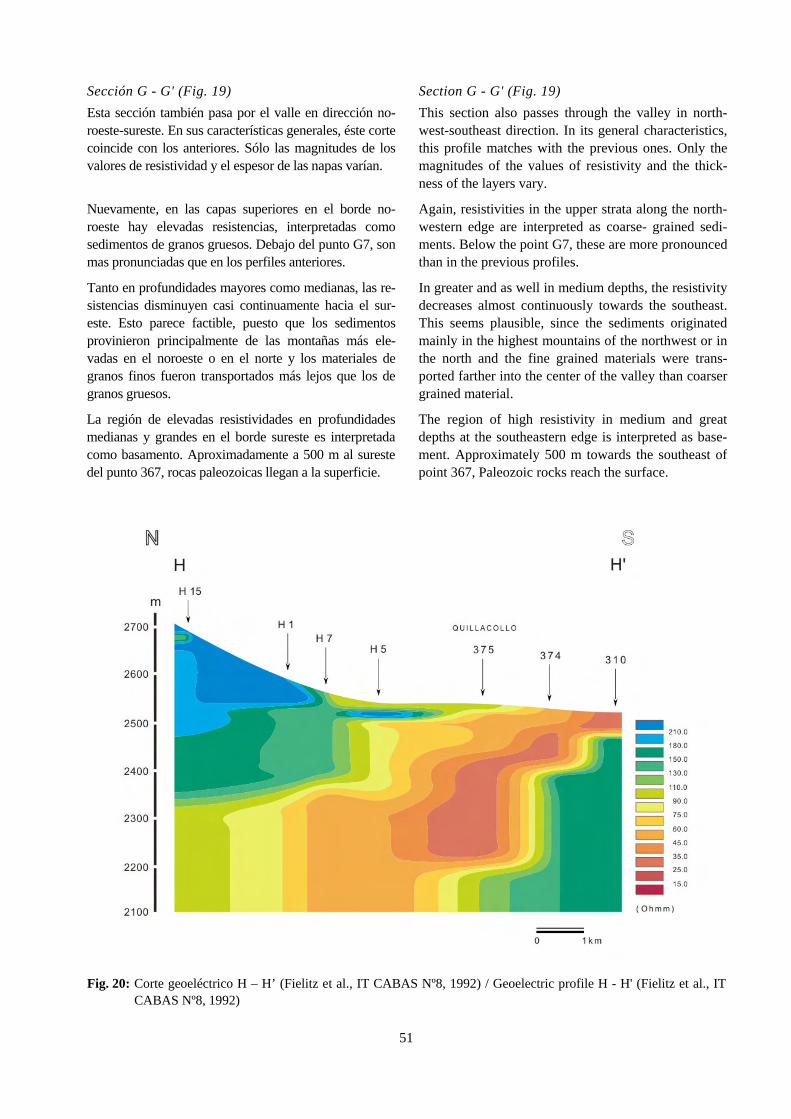
51
Sección G - G' (Fig. 19) Section G - G' (Fig. 19)
Esta sección también pasa por el valle en dirección no-roeste-sureste. En sus características generales, éste corte coincide con los anteriores. Sólo las magnitudes de los valores de resistividad y el espesor de las napas varían.
This section also passes through the valley in north-west-southeast direction. In its general characteristics, this profile matches with the previous ones. Only the magnitudes of the values of resistivity and the thick-ness of the layers vary.
Nuevamente, en las capas superiores en el borde no-roeste hay elevadas resistencias, interpretadas como sedimentos de granos gruesos. Debajo del punto G7, son mas pronunciadas que en los perfiles anteriores.
Again, resistivities in the upper strata along the north-western edge are interpreted as coarse- grained sedi-ments. Below the point G7, these are more pronounced than in the previous profiles.
Tanto en profundidades mayores como medianas, las re-sistencias disminuyen casi continuamente hacia el sur-este. Esto parece factible, puesto que los sedimentos provinieron principalmente de las montañas más ele-vadas en el noroeste o en el norte y los materiales de granos finos fueron transportados más lejos que los de granos gruesos.
In greater and as well in medium depths, the resistivity decreases almost continuously towards the southeast. This seems plausible, since the sediments originated mainly in the highest mountains of the northwest or in the north and the fine grained materials were trans-ported farther into the center of the valley than coarser grained material.
La región de elevadas resistividades en profundidades medianas y grandes en el borde sureste es interpretada como basamento. Aproximadamente a 500 m al sureste del punto 367, rocas paleozoicas llegan a la superficie.
The region of high resistivity in medium and great depths at the southeastern edge is interpreted as base-ment. Approximately 500 m towards the southeast of point 367, Paleozoic rocks reach the surface.
Fig. 20: Corte geoeléctrico H – H’ (Fielitz et al., IT CABAS Nº8, 1992) / Geoelectric profile H - H' (Fielitz et al., IT CABAS Nº8, 1992)
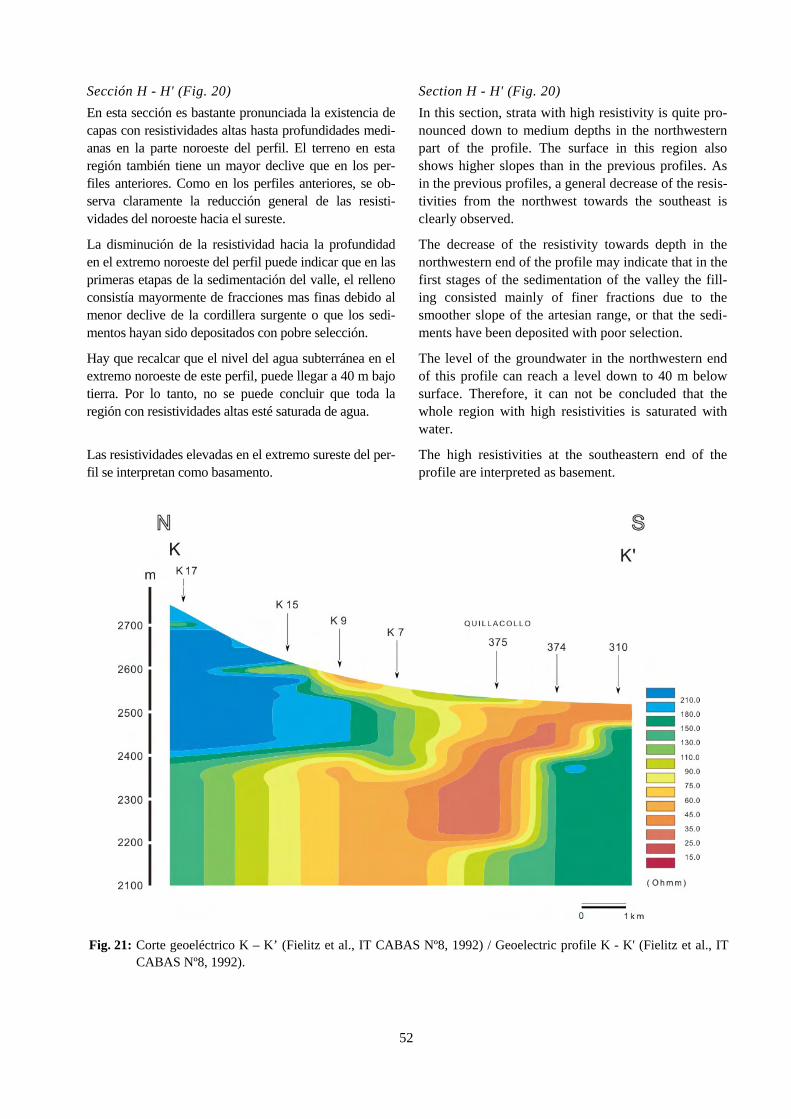
52
Sección H - H' (Fig. 20) Section H - H' (Fig. 20)
En esta sección es bastante pronunciada la existencia de capas con resistividades altas hasta profundidades medi-anas en la parte noroeste del perfil. El terreno en esta región también tiene un mayor declive que en los per-files anteriores. Como en los perfiles anteriores, se ob-serva claramente la reducción general de las resisti-vidades del noroeste hacia el sureste.
In this section, strata with high resistivity is quite pro-nounced down to medium depths in the northwestern part of the profile. The surface in this region also shows higher slopes than in the previous profiles. As in the previous profiles, a general decrease of the resis-tivities from the northwest towards the southeast is clearly observed.
La disminución de la resistividad hacia la profundidad en el extremo noroeste del perfil puede indicar que en las primeras etapas de la sedimentación del valle, el relleno consistía mayormente de fracciones mas finas debido al menor declive de la cordillera surgente o que los sedi-mentos hayan sido depositados con pobre selección.
The decrease of the resistivity towards depth in the northwestern end of the profile may indicate that in the first stages of the sedimentation of the valley the fill-ing consisted mainly of finer fractions due to the smoother slope of the artesian range, or that the sedi-ments have been deposited with poor selection.
Hay que recalcar que el nivel del agua subterránea en el extremo noroeste de este perfil, puede llegar a 40 m bajo tierra. Por lo tanto, no se puede concluir que toda la región con resistividades altas esté saturada de agua.
The level of the groundwater in the northwestern end of this profile can reach a level down to 40 m below surface. Therefore, it can not be concluded that the whole region with high resistivities is saturated with water.
Las resistividades elevadas en el extremo sureste del per-fil se interpretan como basamento.
The high resistivities at the southeastern end of the profile are interpreted as basement.
Fig. 21: Corte geoeléctrico K – K’ (Fielitz et al., IT CABAS Nº8, 1992) / Geoelectric profile K - K' (Fielitz et al., IT CABAS Nº8, 1992).
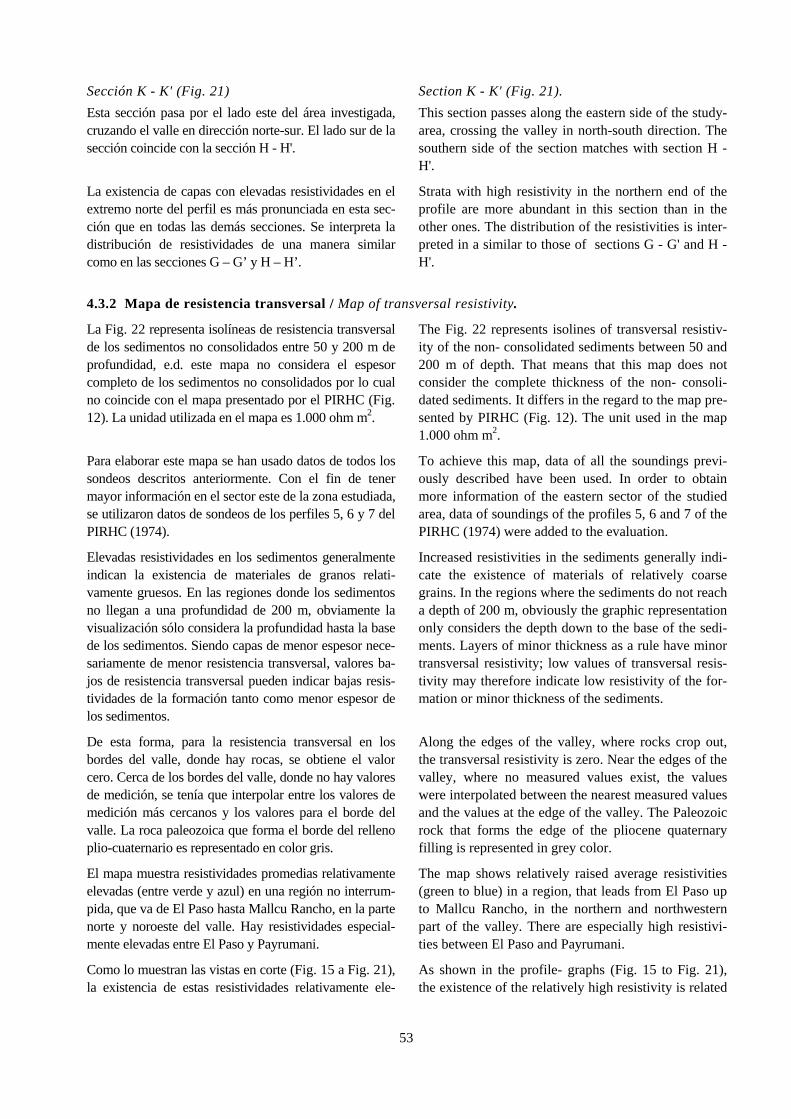
53
Sección K - K' (Fig. 21) Section K - K' (Fig. 21).
Esta sección pasa por el lado este del área investigada, cruzando el valle en dirección norte-sur. El lado sur de la sección coincide con la sección H - H'.
This section passes along the eastern side of the study-area, crossing the valley in north-south direction. The southern side of the section matches with section H -H'.
La existencia de capas con elevadas resistividades en el extremo norte del perfil es más pronunciada en esta sec-ción que en todas las demás secciones. Se interpreta la distribución de resistividades de una manera similar como en las secciones G – G’ y H – H’.
Strata with high resistivity in the northern end of the profile are more abundant in this section than in the other ones. The distribution of the resistivities is inter-preted in a similar to those of sections G - G' and H -H'.
4.3.2 Mapa de resistencia transversal / Map of transversal resistivity.
La Fig. 22 representa isolíneas de resistencia transversal de los sedimentos no consolidados entre 50 y 200 m de profundidad, e.d. este mapa no considera el espesor completo de los sedimentos no consolidados por lo cual no coincide con el mapa presentado por el PIRHC (Fig.12). La unidad utilizada en el mapa es 1.000 ohm m2.
The Fig. 22 represents isolines of transversal resistiv-ity of the non- consolidated sediments between 50 and 200 m of depth. That means that this map does not consider the complete thickness of the non- consoli-dated sediments. It differs in the regard to the map pre-sented by PIRHC (Fig. 12). The unit used in the map 1.000 ohm m2.
Para elaborar este mapa se han usado datos de todos los sondeos descritos anteriormente. Con el fin de tener mayor información en el sector este de la zona estudiada, se utilizaron datos de sondeos de los perfiles 5, 6 y 7 del PIRHC (1974).
To achieve this map, data of all the soundings previ-ously described have been used. In order to obtain more information of the eastern sector of the studied area, data of soundings of the profiles 5, 6 and 7 of the PIRHC (1974) were added to the evaluation.
Elevadas resistividades en los sedimentos generalmente indican la existencia de materiales de granos relati-vamente gruesos. En las regiones donde los sedimentos no llegan a una profundidad de 200 m, obviamente la visualización sólo considera la profundidad hasta la base de los sedimentos. Siendo capas de menor espesor nece-sariamente de menor resistencia transversal, valores ba-jos de resistencia transversal pueden indicar bajas resis-tividades de la formación tanto como menor espesor de los sedimentos.
Increased resistivities in the sediments generally indi-cate the existence of materials of relatively coarse grains. In the regions where the sediments do not reach a depth of 200 m, obviously the graphic representation only considers the depth down to the base of the sedi-ments. Layers of minor thickness as a rule have minor transversal resistivity; low values of transversal resis-tivity may therefore indicate low resistivity of the for-mation or minor thickness of the sediments.
De esta forma, para la resistencia transversal en los bordes del valle, donde hay rocas, se obtiene el valor cero. Cerca de los bordes del valle, donde no hay valores de medición, se tenía que interpolar entre los valores de medición más cercanos y los valores para el borde del valle. La roca paleozoica que forma el borde del relleno plio-cuaternario es representado en color gris.
Along the edges of the valley, where rocks crop out, the transversal resistivity is zero. Near the edges of the valley, where no measured values exist, the values were interpolated between the nearest measured values and the values at the edge of the valley. The Paleozoic rock that forms the edge of the pliocene quaternary filling is represented in grey color.
El mapa muestra resistividades promedias relativamente elevadas (entre verde y azul) en una región no interrum-pida, que va de El Paso hasta Mallcu Rancho, en la parte norte y noroeste del valle. Hay resistividades especial-mente elevadas entre El Paso y Payrumani.
The map shows relatively raised average resistivities (green to blue) in a region, that leads from El Paso up to Mallcu Rancho, in the northern and northwestern part of the valley. There are especially high resistivi-ties between El Paso and Payrumani.
Como lo muestran las vistas en corte (Fig. 15 a Fig. 21), la existencia de estas resistividades relativamente ele-
As shown in the profile- graphs (Fig. 15 to Fig. 21), the existence of the relatively high resistivity is related
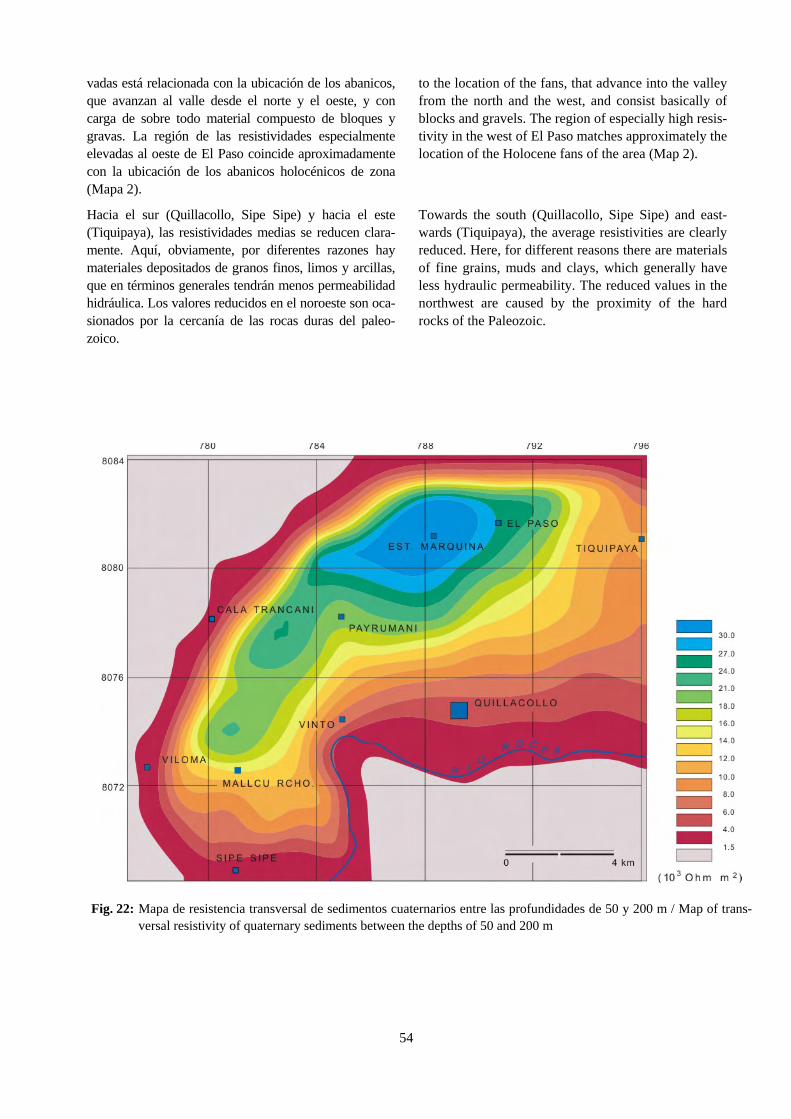
54
vadas está relacionada con la ubicación de los abanicos, que avanzan al valle desde el norte y el oeste, y con carga de sobre todo material compuesto de bloques y gravas. La región de las resistividades especialmente elevadas al oeste de El Paso coincide aproximadamente con la ubicación de los abanicos holocénicos de zona (Mapa 2).
to the location of the fans, that advance into the valley from the north and the west, and consist basically of blocks and gravels. The region of especially high resis-tivity in the west of El Paso matches approximately the location of the Holocene fans of the area (Map 2).
Hacia el sur (Quillacollo, Sipe Sipe) y hacia el este (Tiquipaya), las resistividades medias se reducen clara-mente. Aquí, obviamente, por diferentes razones hay materiales depositados de granos finos, limos y arcillas, que en términos generales tendrán menos permeabilidad hidráulica. Los valores reducidos en el noroeste son oca-sionados por la cercanía de las rocas duras del paleo-zoico.
Towards the south (Quillacollo, Sipe Sipe) and east-wards (Tiquipaya), the average resistivities are clearly reduced. Here, for different reasons there are materials of fine grains, muds and clays, which generally have less hydraulic permeability. The reduced values in the northwest are caused by the proximity of the hard rocks of the Paleozoic.
Fig. 22: Mapa de resistencia transversal de sedimentos cuaternarios entre las profundidades de 50 y 200 m / Map of trans-versal resistivity of quaternary sediments between the depths of 50 and 200 m
55
4.3.3 Profundidad del basamento 4.3.3 Depth of the basement
Con respecto a la profundidad del basamento, en general los resultados anteriores en el marco del PIRHC fueron confirmados. En la parte norte de la región investigada, todo el basamento baja de sur a norte, y finalmente llega a profundidades de mas de 600 m. Cerca de Vinto apar-entemente hay un umbral del basamento que llega a aproximadamente 2.000 m s.n.m.. En la parte sur de la región investigada hay grandes diferencias en la profun-didad hasta el basamento. Determinaciones exactas no han sido posibles por la incertidumbre en la diferencia-ción entre basamento y posibles sedimentos de resistivi-dades elevadas en mayores profundidades.
Regarding the depth of the basement, the previous re-sults within the framework of the PIRHC were gener-ally confirmed. In the northern part of the investigated region, all the basement deepens from south to north, and finally reaches depths more than 600 m. Near Vinto apparently there is a rise of the basement that reaches approximately 2,000 m above sea level. In the southern part of the investigated region, there are big differences in the depth of the basement. Exact deter-minations could not be made due to the uncertain dif-ferentiation between basement and sediments with high resistivity at greater depths.
Fig. 23: Topografía del zócalo paleozoico en el Valle Central en base a sondeos audiomagnetotelúricos (SEURECA etc., 1994) / Topography of the Paleozoic basement in the Central Valley based on audiomagnetotelluric soundings (SEURECA etc, 1994)
56
4.4 Estudio mediante sondeos audiomagnetotelúri-cos por SEURECA–BRGM–SOGREAH–CGL
4.4 Investigations using audiomagnetotelluric soundings by SEURECA-BRGM-SOGREAH-CGL
Posterior a la investigación geofísica del Proyecto CABAS en el año 1993, el departamento de geofísica del BRGM en el marco del proyecto de cooperación Boliviano-Francesa realizó un estudio geofísico en el valle de Cochabamba mediante sondeos audiomag-netotelúricos (AMT). Se realizaron 183 sondeos AMT registrados sobre 180 estaciones.
Following the geophysical research of the CABAS Project in 1993, the department of geophysics of the BRGM within the framework of the Bolivian-French cooperation- project, carried out a geophysical study in the valley of Cochabamba using audiomagnetotelluric soundings (AMT). They carried out 183 AMT sound-ings registered on 180 stations.
Entre los resultados, probablemente la contribución más importante es la determinación de las profundi-dades del basamento.
Among the results, is probably the most important contribution the relatively exact determination of the depths of the basement.
4.4.1 Topografía y geometría del zócalo or-dovícico
4.4.1 Topography and geometry of the Ordovi-cian Basement
Las resistividades del substrato varían generalmente de 100 a 1.000 ohm m. Estas variaciones se deben esen-cialmente a los cambios de facies y al estado de frac-turación de la roca base.
The resistivities of the underground vary generally from 100 to 1,000 ohm m. These variations are essen-tially due to the changes of facies and the state of frac-turing of the basement rock.
La topografía del techo del basamento está represen-tada en la Fig. 23. El techo del basamento atestigua un levantamiento de las altitudes cerca de Vinto, en el eje del cerro Caramarca, marcando probablemente la con-tinuidad de las cuarcitas del ordovícico visibles sobre el cerro. Este elemento topográfico del zócalo está ori-entado en dirección noroeste-sureste, coincidiendo con una dirección tectónica mayor de la cuenca. Este le-vantamiento divide la cuenca en dos sectores, norte y sudoeste. El sector sudoeste está sobrealzado con relación al compartimiento norte.
The topography of the basement is represented in Fig.23. The basement rises near Vinto, in the axis of the Caramarca- hill, marking probably the continuity of the Ordovician quartzites visible on the hill. This to-pographical element of the basement is oriented in northwest-southeast direction, matching a major tec-tonic direction of the basin. This ridge divides the ba-sin into two sectors, north and southwest. The south-western sector is uplifted in relation to the northern part.
El sector norte se extiende de Vinto hasta el este de Tiquipaya y esta caracterizado por un pronunciado ahondamiento del zócalo del sur hacia el norte, pro-duciendo profundidades que localmente exceden 1.000 m. En cambio, en la zona sur, se observa pendientes suaves que llevan a profundidades del substrato de max. 150 m (Fig. 24).
The northern sector extends from Vinto towards the East of Tiquipaya and is characterized by a pro-nounced deepening of the basement from south to north, representing depths that locally exceed 1,000 m. However, in the southern sector, soft gradients can be observed with depths that do not exceed 150 m (Fig.24).
4.4.2 Relleno cuaternario de la cuenca 4.4.2 Quaternary filling of the basin
El cuerpo del relleno plio-cuaternario del área de tra-bajo es subdividido en tres sectores, el sector merid-ional, el sector central y septentrional y la zona su-roeste de la cuenca (Fig. 24, véase también cap. 4).
The Pliocene- Quaternary filling of the work- area is subdivided into three sectors; the southern sector, the central and northern sector, and the southwestern zone of the basin (Fig. 24, see also ch. 4).
Sector 1: La parte meridional del valle. Al sur y al oeste del aeropuerto las resistividades medidas son
Sector 1: The southern part of the valley. South and West of the airport, measured resistivities are very
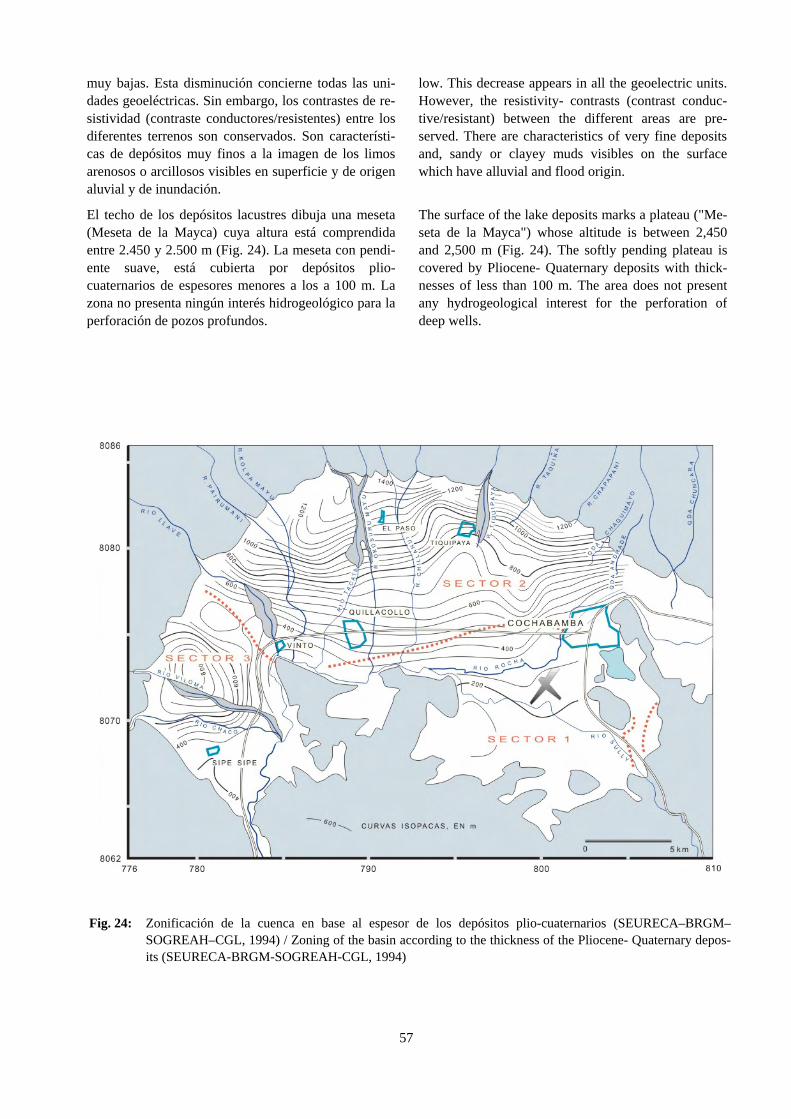
57
muy bajas. Esta disminución concierne todas las uni-dades geoeléctricas. Sin embargo, los contrastes de re-sistividad (contraste conductores/resistentes) entre los diferentes terrenos son conservados. Son característi-cas de depósitos muy finos a la imagen de los limos arenosos o arcillosos visibles en superficie y de origen aluvial y de inundación.
low. This decrease appears in all the geoelectric units. However, the resistivity- contrasts (contrast conduc-tive/resistant) between the different areas are pre-served. There are characteristics of very fine deposits and, sandy or clayey muds visibles on the surface which have alluvial and flood origin.
El techo de los depósitos lacustres dibuja una meseta (Meseta de la Mayca) cuya altura está comprendida entre 2.450 y 2.500 m (Fig. 24). La meseta con pendi-ente suave, está cubierta por depósitos plio-cuaternarios de espesores menores a los a 100 m. La zona no presenta ningún interés hidrogeológico para la perforación de pozos profundos.
The surface of the lake deposits marks a plateau ("Me-seta de la Mayca") whose altitude is between 2,450 and 2,500 m (Fig. 24). The softly pending plateau is covered by Pliocene- Quaternary deposits with thick-nesses of less than 100 m. The area does not present any hydrogeological interest for the perforation of deep wells.
Fig. 24: Zonificación de la cuenca en base al espesor de los depósitos plio-cuaternarios (SEURECA–BRGM–SOGREAH–CGL, 1994) / Zoning of the basin according to the thickness of the Pliocene- Quaternary depos-its (SEURECA-BRGM-SOGREAH-CGL, 1994)
58
Sector 2: La parte central y septentrional de la cuenca.La topografía del techo del terreno está caracterizada por una profundización entre la meseta lacustre al este y una cresta topográfica al oeste ligada al ascenso del techo de los depósitos lacustres. El espesor de los depósitos varía progresivamente a lo largo de un eje de dirección norte-sur. Es máximo al norte. Esta zona conforma todo un sistema de conos aluviales con características favorables a la explotación de aguas subterráneas, un resultado ya discutido y visualizado en la Fig. 22.
Sector 2: The central and northern part of the basin.The topography of the top of the ground is character-ized by a depression between the lake plateau in the east and a topographical crest in the west linked to the rise of the surface of the lake deposits. The thickness of the deposits varies progressively throughout an axis of north-south direction. It has its maximum in the north. This area comprises a whole system of debris cones with favorable characteristics for the exploita-tion of groundwaters, a result already visualized in Fig. 22.
Sector 3: La zona suroeste de la cuenca. Se extiende al oeste del valle, entre Vinto y Sipe Sipe. Está limitada al este por una arista noroeste-sureste, cuya altitud es de 2.400 m y que se sobrepone a una estructura de cuarcitas del sistema ordovícico que aflora al sur de Vinto (Fig. 24). En su centro se encuentra un surco de espesores de aluviones hasta 800 m que correspondería al eje de aportación del Río Llave y Viloma.
Sector 3: The southwestern part of the basin. It extends in the west of the valley, from Vinto to Sipe Sipe. It is limited in the east by a northwest- southeast ridge, whose altitude is of 2,400 m and which covers a struc-ture of Ordovician quartzites cropping out in the south of Vinto (Fig. 24). In its center, a furrow can be lo-cated with alluvial thicknesses of up to 800 m that would correspond to the contribution axis of the Llave and Viloma Rivers.
4.4.3 Análisis 4.4.3 Analysis
Sin duda hay que considerar importantes los resultados de la investigación de SEURECA–BRGM–SOGREAH–CGL (1994), especialmente la diferencia-ción de la profundidad del basamento
The results of the research of SEURECA-BRGM-SOGREAH-CGL (1994) are undoubtedly important, especially the results of the differentiation of the depth of the basement.
Sin embargo, en todos los sondeos interpretados, los datos de campo muestran una irregularidad consider-able que probablemente se debe a perturbaciones elec-tromagnéticas tales como línea eléctricas, telefónicas, vías férreas, canalizaciones, antenas de emisión de ra-dios, rejas metálicas, alambrados, etc. Por esta varia-ción de los puntos de medición, las curvas en muchos casos no han podido ser adaptadas a los valores de campo, por lo cual la fiabilidad de los datos no siem-pre resulta completa.
However, in all of the interpreted soundings, the field data show a considerable irregularity that probably is owed to electromagnetic disturbances such as powerli-nes, telephone-lines, railroads, canalizations, radio-broadcasting antennas, metallic fences, etc. Because of this variation of the measurement- points, the curves in many cases have not been able to be adapted to the field- values, therefore the reliability of the data is not always complete.
59
5 POZOS PROFUNDOS EN EL VALLE CENTRAL
5 DEEP WELLS IN THE CENTRAL VALLEY
En el informe del Plan Maestro para el Abastecimiento de Agua a la Ciudad de Cochabamba y Diseños Fina-les de Obras de Rehabilitación y Ampliación (SEURECA–BRGM–SOGREAH–CGL, 1994), se de-limitan tres sectores dentro de los sectores 2 y 3 de-scritos en el capítulo 4.4.2, que se consideran contener un gran espesor de aluviones y una fuerte potenciali-dad acuífera:
In the report of the Master Plan for the Water- Supply for the City of Cochabamba and the Final Designs of Rehabilitation and Extension Activities (SEURECA-BRGM-SOGREAH-CGL, 1994), three sectors are de-limited in the described sectors 2 and 3 referred to in chapter 4.4.2. These sectors are considered to have a big thickness of alluvions and having a high aquifer-ous potential:
(1) El cono de la Taquiña situado al noreste de Tiqui-paya (el cono aluvial del Río Tiquipaya), het-erométrico, de pequeñas gravas a bloques de varios metros.
(1) The Taquiña cone located in the northeast of Tiquipaya (the debris cone of the Tiquipaya- River), is heterometric, and made up of small gravels to blocks of several meters.
(2) El cono aluvial de gran amplitud, que corresponde a la estructura en profundidad de la cuenca vertiente del Río Jankho Khala/Tacata y Okosuru Mayu, locali-zada al oeste de El Paso (Fig. 24). Este abanico corre-sponde a un sistema aluvial evolucionado con material seleccionado.
(2) The debris cone of large extension, that corre-sponds to the structure in depth of the basin at the slope of the Jankho Khala/Tacata and the Okosuru Mayu Rivers, located in the west of El Paso (Fig. 24). This fan corresponds to an alluvial system that evolved with selected material.
(3) El relleno de los paleovalles mencionados prece-dentemente, encontrados en la línea de los ríos Llave y Viloma, entre los pueblos de Vinto y Sipe Sipe, que penetra las formaciones lacustres localmente hasta el zócalo paleozoico (Fig. 24).
(3) The filling of the paleovalleys mentioned previ-ously, found in the line of the Llave and Viloma rivers, between the villages of Vinto and Sipe Sipe, which penetrates the lacustrine formations locally even down to the Paleozoic basement (Fig. 24).
El espesor de estos diferentes cuerpos sedimentarios supera los 300 m. Los valores máximos alcanzan 450 m para el cono de la Taquiña, 660 m para el cono de los ríos Tacata y Okosuru Mayu y 580 m para el rel-leno del paleovalle del Río Llave.
The thickness of these different sedimentary bodies surpasses 300 m. The maximum values reach 450 m for the Taquiña cone, 660 m for the cone of the Tacata and Okosuru Mayu rivers and 580 m for the filling of the paleovalley of the Llave river.
En base a los resultados descritos en el anterior capítulo, SEURECA–BRGM–SOGREAH–CGL (1994) propuso seis posibles lugares para la im-plantación de pozos profundos, comprendidos en las zonas mencionadas. Los criterios de selección han sido el espesor y la extensión de las formaciones aluviales, la calidad del reservorio ligada a la presencia o ausen-cia de arcillas y a la granulometría de los depósitos y la proximidad de la zona de recarga.
Based on the results described in the previous chapter, SEURECA-BRGM-SOGREAH-CGL (1994) sug-gested six possible places for the drilling of deep wells, located in the areas mentioned. The criteria of selection has been: the thickness and the extension of the alluvial formations; the quality of the reservoir as-sociated to the presence or absence of claysas well as to the granulometry of the deposits; and the proximity of the recharge area.
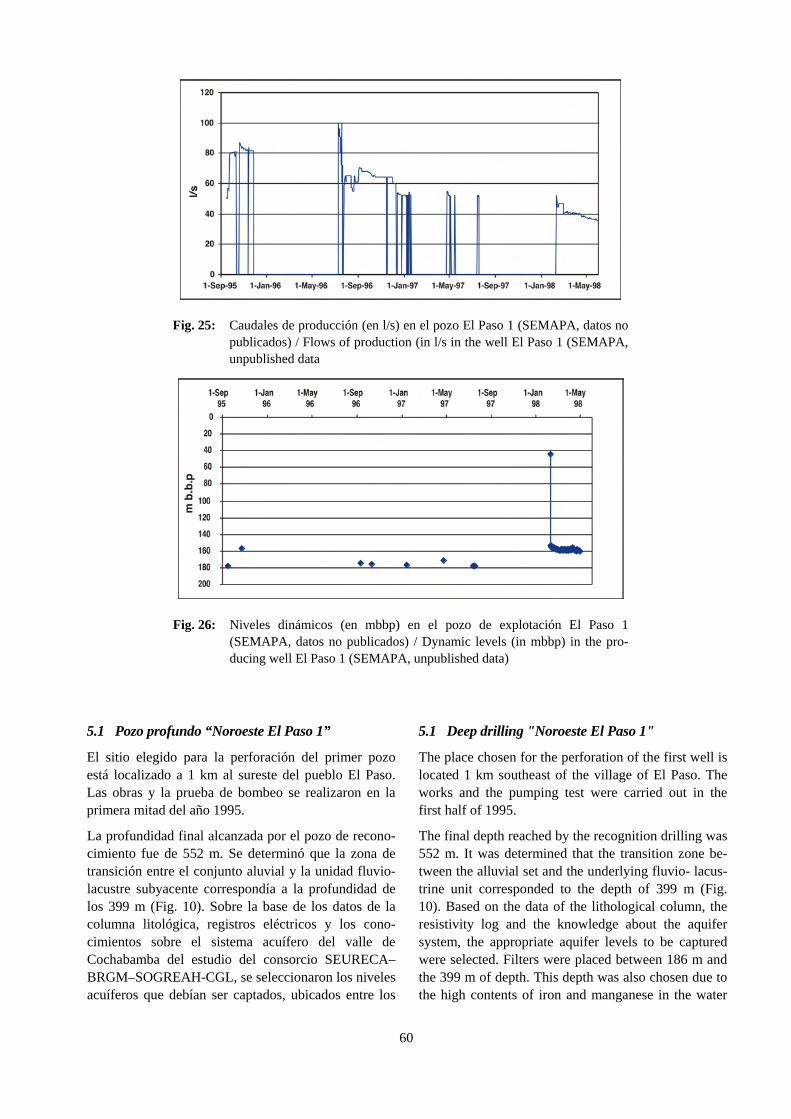
60
5.1 Pozo profundo “Noroeste El Paso 1” 5.1 Deep drilling "Noroeste El Paso 1"
El sitio elegido para la perforación del primer pozo está localizado a 1 km al sureste del pueblo El Paso. Las obras y la prueba de bombeo se realizaron en la primera mitad del año 1995.
The place chosen for the perforation of the first well is located 1 km southeast of the village of El Paso. The works and the pumping test were carried out in the first half of 1995.
La profundidad final alcanzada por el pozo de recono-cimiento fue de 552 m. Se determinó que la zona de transición entre el conjunto aluvial y la unidad fluvio-lacustre subyacente correspondía a la profundidad de los 399 m (Fig. 10). Sobre la base de los datos de la columna litológica, registros eléctricos y los cono-cimientos sobre el sistema acuífero del valle de Cochabamba del estudio del consorcio SEURECA–BRGM–SOGREAH-CGL, se seleccionaron los niveles acuíferos que debían ser captados, ubicados entre los
The final depth reached by the recognition drilling was 552 m. It was determined that the transition zone be-tween the alluvial set and the underlying fluvio- lacus-trine unit corresponded to the depth of 399 m (Fig. 10). Based on the data of the lithological column, the resistivity log and the knowledge about the aquifer system, the appropriate aquifer levels to be captured were selected. Filters were placed between 186 m and the 399 m of depth. This depth was also chosen due to the high contents of iron and manganese in the water
Fig. 25: Caudales de producción (en l/s) en el pozo El Paso 1 (SEMAPA, datos no publicados) / Flows of production (in l/s in the well El Paso 1 (SEMAPA, unpublished data
Fig. 26: Niveles dinámicos (en mbbp) en el pozo de explotación El Paso 1 (SEMAPA, datos no publicados) / Dynamic levels (in mbbp) in the pro-ducing well El Paso 1 (SEMAPA, unpublished data)
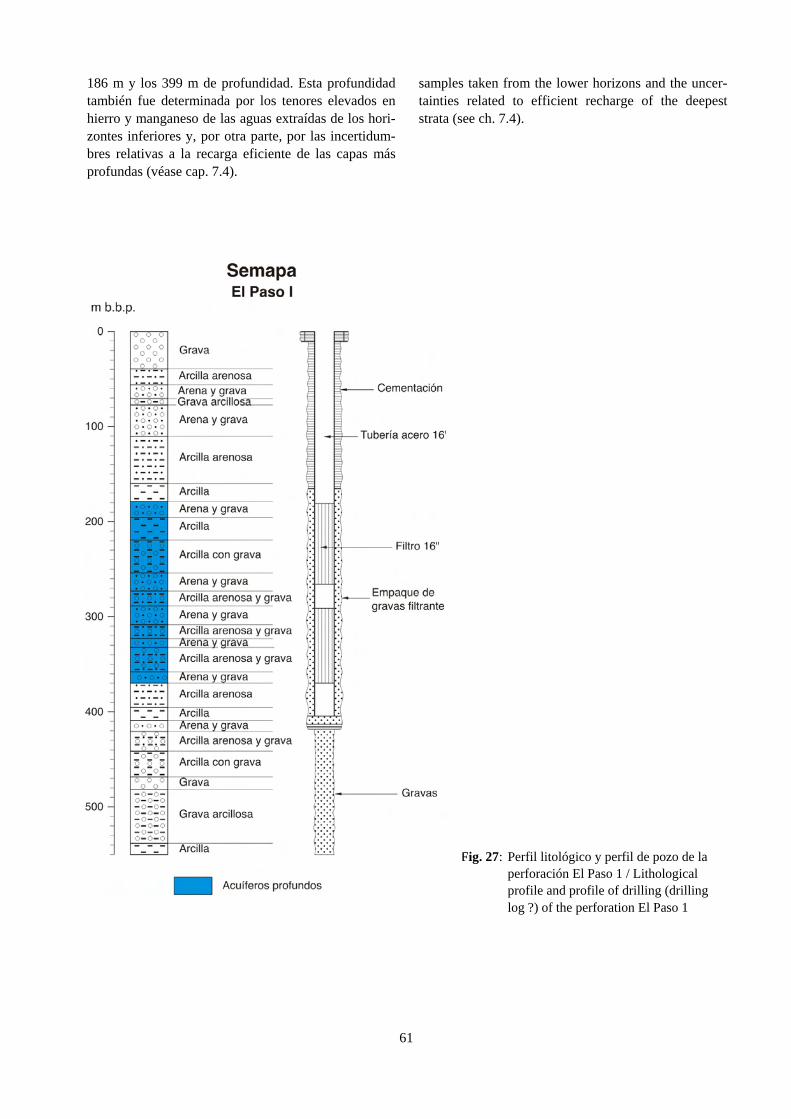
61
186 m y los 399 m de profundidad. Esta profundidad también fue determinada por los tenores elevados en hierro y manganeso de las aguas extraídas de los hori-zontes inferiores y, por otra parte, por las incertidum-bres relativas a la recarga eficiente de las capas más profundas (véase cap. 7.4).
samples taken from the lower horizons and the uncer-tainties related to efficient recharge of the deepest strata (see ch. 7.4).
Fig. 27: Perfil litológico y perfil de pozo de la perforación El Paso 1 / Lithological profile and profile of drilling (drilling log ?) of the perforation El Paso 1
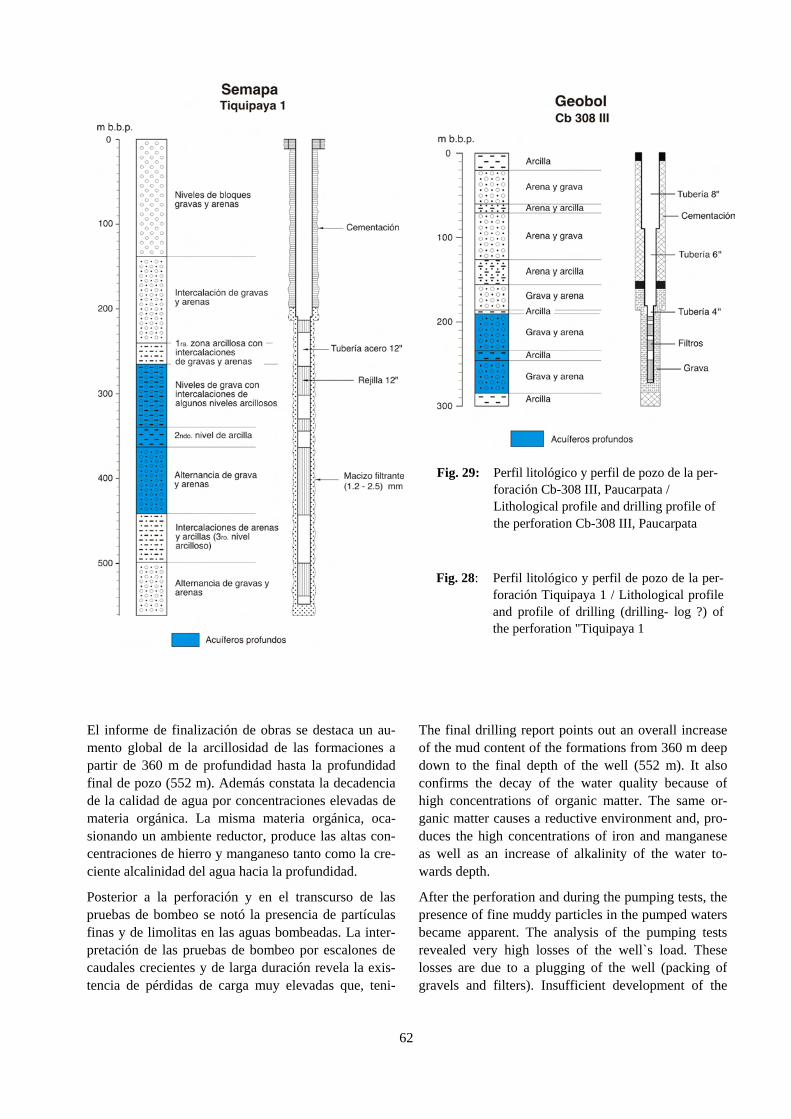
62
El informe de finalización de obras se destaca un au-mento global de la arcillosidad de las formaciones a partir de 360 m de profundidad hasta la profundidad final de pozo (552 m). Además constata la decadencia de la calidad de agua por concentraciones elevadas de materia orgánica. La misma materia orgánica, oca-sionando un ambiente reductor, produce las altas con-centraciones de hierro y manganeso tanto como la cre-ciente alcalinidad del agua hacia la profundidad.
The final drilling report points out an overall increase of the mud content of the formations from 360 m deep down to the final depth of the well (552 m). It also confirms the decay of the water quality because of high concentrations of organic matter. The same or-ganic matter causes a reductive environment and, pro-duces the high concentrations of iron and manganese as well as an increase of alkalinity of the water to-wards depth.
Posterior a la perforación y en el transcurso de las pruebas de bombeo se notó la presencia de partículas finas y de limolitas en las aguas bombeadas. La inter-pretación de las pruebas de bombeo por escalones de caudales crecientes y de larga duración revela la exis-tencia de pérdidas de carga muy elevadas que, teni-
After the perforation and during the pumping tests, the presence of fine muddy particles in the pumped waters became apparent. The analysis of the pumping tests revealed very high losses of the well`s load. These losses are due to a plugging of the well (packing of gravels and filters). Insufficient development of the
Fig. 28: Perfil litológico y perfil de pozo de la per-foración Tiquipaya 1 / Lithological profile and profile of drilling (drilling- log ?) of the perforation "Tiquipaya 1
Fig. 29: Perfil litológico y perfil de pozo de la per-foración Cb-308 III, Paucarpata / Lithological profile and drilling profile of the perforation Cb-308 III, Paucarpata
63
endo en cuenta la observación anterior, se explican por un taponaje del pozo (empaque de gravas y filtros) ocasionado por un desarrollo del pozo insuficiente.
well is ultimately responsible for the losses.
El nivel estático de agua, antes del inicio de las prue-bas de bombeo en el pozo profundo de El Paso 1, se ubicaba a aprox. 39 m bajo superficie. Los resultados de las pruebas de bombeo arrojaron valores de trans-misividad en el orden de 2,5·10-3 m2/s y para el coefi-ciente de almacenamiento aproximadamente 5·10-4.
The water level before starting the pumping tests in the deep well of El Paso 1, was around 39 m below the surface. The results of the pumping tests yielded transmissivity values in the order of 2.5·10-3 m2/s, and for the storage coefficient approximately 5·10-4.
Por los resultados obtenidos en los ensayos hidráulicos ANTEA recomendó un caudal de producción de 85 l/s, estimando un abatimiento del orden de 130 m.
Based on the results obtained by the hydraulic tests, ANTEA recommended a pumping rate of 85 l/sec at an estimated drawdown of around 130 m.
A pesar de los resultados aparentemente favorables que inicialmente tuvo el pozo profundo Noroeste El Paso 1, con el transcurso del tiempo, su caudal empezó a disminuir y por último estuvo sin funcionar por mucho tiempo, debido a un problema de la bomba (Fig. 25). Posteriormente se realizó un nuevo desar-rollo del pozo y se ha iniciado su producción con un caudal de 41 l/s el cual ha vuelto a disminuir hasta mayo del 1998. En la Fig. 25 y Fig. 26 se aprecian los caudales de producción y los respectivos niveles dinámicos en el pozo. Se distinguen las largas inter-rupciones de funcionamiento tanto como el aba-timiento que alcanza 180 m.
In spite of the apparently favorable results initially ob-tained by the deep well Northwest El Paso 1, with time its flow started to decrease (Fig. 24). Later a new de-velopment of the well was carried out. Afterwards, its production began at 41 l/s and again decreased until May 1998. In Fig 25 and GFig 26, the discharge ca-pacity and the respective dynamic levels in the well are shown. The long interruptions of the operation are apparent as well as its drawdown which reaches 180 m.
5.2 Pozo profundo “Tiquipaya 1” 5.2 Deep well "Tiquipaya 1"
Del informe de la empresa supervisora de los trabajos de perforación del pozo Tiquipaya 1 (BRGM, 1996), se se deduce la existencia de dos grandes conjuntos de estratos de características favorables para la explo-tación (Fig. 28):
From the report of the supervising company of the per-foration works of the "Tiquipaya 1" well (BRGM, 1996), the existence of two large sets of strata of fa-vorable characteristics for exploitation is deduced (Fig. 28):
El primero, hasta una profundidad próxima de los 200 m, constituido esencialmente de elementos gruesos, gravas y arenas.
The first, reaching depths close to 200 m, consist es-sentially of coarse fragments, gravels and sands.
El segundo, hasta la profundidad de 503 m, se carac-teriza por una sedimentación más fina. Se han encon-trado niveles arcillosos bien individualizados y se pueden distinguir las unidades descritas a continuación (Fig. 28):
The second, reaching the depth of 503 m is character-ized by a finer sedimentation. Well defined clayey lev-els have been found. The following units (Fig. 28) can be identified:
216–239 m primera zona arcillosa 216-239 m first clayey zone
239–305 m niveles de gravas con intercalación de pasajes arcillosos
239-305 m level of gravels with intercalation of clayey horizons
305-325 m segunda zona arcillosa 305-325 m second clayey zone
325-395 m alternancia de niveles de gravas y arenas 325-395 m alternance of levels of gravels and sands
395-447 m gravas y arenas con intercalaciones de 395-447 m gravel and sands with intercalation of
64
niveles arcillosos clayey levels
447-503 m alternancia de gravas y arenas. 447-503 m alternance of gravels and sands.
El primer conjunto litológico, siendo un conjunto de capas de interés para la explotación, fue descartado para la producción por presumidos problemas de con-taminación ubicados preferiblemente en los niveles de acuíferos superficiales y por otra parte para evitar toda interferencia con pozos de baja profundidad. 2
The first lithological set, at first a potentially good source for exploitation, was discarded as a possibility for production because of presumed problems of pollu-tion in the levels of the superficial aquifers and also because of its potential for to interference with wells of low depth. 3
El segundo grupo muestra características sedimen-tarias que permiten esperar potenciales acuíferos in-teresantes. Sin embargo, desde el comienzo de los tra-bajos de desarrollo del pozo parecía que los caudales extraídos eran mínimos, observándose que el agua en un principio contenía mucha bentonita, aclarándose progresivamente y volviéndose a enturbiar cada vez que se empezaba nuevamente el desarrollo mediante la utilización de un pistón conjuntamente con el bombeo por aire comprimido.
The second group shows sedimentary characteristics which indicate interesting aquifers. However, from the beginning of the developing works of the well, the flow rates were very low. The water at first contained much bentonite, then became progressively clear and later turned muddy again every time the well was opened using a piston and pumping via compressed air.
Mediante una prueba de bombeo se pudo determinar importantes pérdidas de carga relacionadas a deficien-cias en la construcción del pozo. Según el informe de ANTEA (1996), las pérdidas tenían tal magnitud, que una determinación de los parámetros hidráulicos del acuífero no fue posible.
During a pumping test, significant well losses were observed and attributed to deficiencies in the construc-tion of the well. According to the report by ANTEA (1996), the losses were of such magnitude, that a de-termination of the hydraulic parameters of the aquifer became impossible.
Al término de estos trabajos se instaló una bomba que en principio empezó a producir un caudal discontinuo de agua, que posteriormente se estabilizo en alrededor de 15 l/s produciendo a momentos picos un caudal de 20 l/s, con un abatimiento que se estabilizo entre 179 y 180 m. Sin embargo, durante el bombeo las aguas bombeadas continuaban turbias, lo que demostraba que todavía el pozo no estaba completamente desarrol-lado.
Folowing these efforts, a pump was installed that first produced a discontinuous flow of water, and later sta-bilized at about 15 l/sec yielding in peak moments, a flow of 20 l/sec, with a drawdown that stabilized be-tween 179 and 180 m. However, during the pumping the pumped waters continued to be turbid, which proved that the well was not completely developed.
Hasta el momento, el pozo Tiquipaya 1 no ha podido ser completamente desarrollado por los altos conteni-dos de arcilla que se presentan en los acuíferos. Su caudal de producción de agua turbia es de unos pocos litros, por lo que se encuentra fuera de servicio.
Up to now, the well "Tiquipaya 1" has not been fully developed because of the high clay contents of the aq-uifers. Since its flow rate was low and its waters were turbid, the well was shut down.
2 Vale comentar, que tarde o temprano la interferencia hubiese sido notoria, ya que todas las capas integran un sistema acuífero interconectado. Esto resulta confirmado por Stimson (1991) que en base a perfiles hidroquímicos concluye, que existe interconexión hidráulica entre las capas.
3 It should be pointed out that sooner or later the interference would have become evident, as all strata form one interconnected aquifer system. This has been confirmed by Stimson (1991), who, based on hydrochemical information, concludes that the strata are hidraulically interconnected
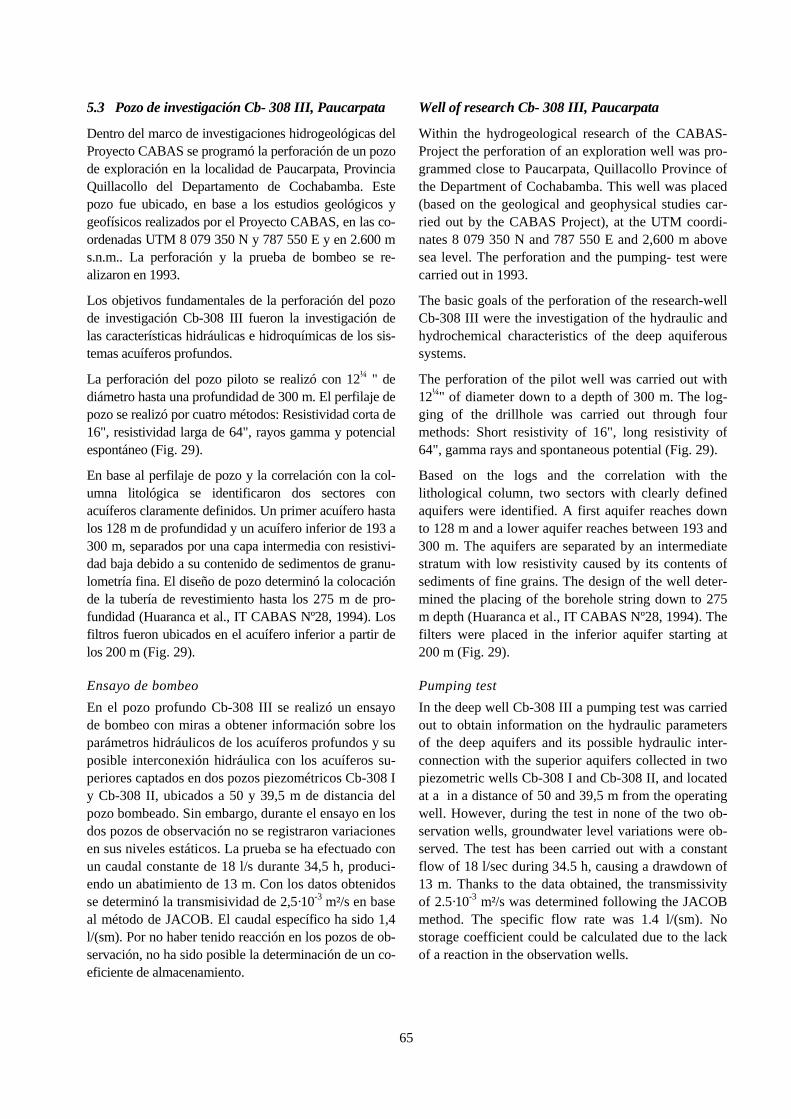
65
5.3 Pozo de investigación Cb- 308 III, Paucarpata Well of research Cb- 308 III, Paucarpata
Dentro del marco de investigaciones hidrogeológicas del Proyecto CABAS se programó la perforación de un pozo de exploración en la localidad de Paucarpata, Provincia Quillacollo del Departamento de Cochabamba. Este pozo fue ubicado, en base a los estudios geológicos y geofísicos realizados por el Proyecto CABAS, en las co-ordenadas UTM 8 079 350 N y 787 550 E y en 2.600 m s.n.m.. La perforación y la prueba de bombeo se re-alizaron en 1993.
Within the hydrogeological research of the CABAS-Project the perforation of an exploration well was pro-grammed close to Paucarpata, Quillacollo Province of the Department of Cochabamba. This well was placed (based on the geological and geophysical studies car-ried out by the CABAS Project), at the UTM coordi-nates 8 079 350 N and 787 550 E and 2,600 m above sea level. The perforation and the pumping- test were carried out in 1993.
Los objetivos fundamentales de la perforación del pozo de investigación Cb-308 III fueron la investigación de las características hidráulicas e hidroquímicas de los sis-temas acuíferos profundos.
The basic goals of the perforation of the research-well Cb-308 III were the investigation of the hydraulic and hydrochemical characteristics of the deep aquiferous systems.
La perforación del pozo piloto se realizó con 12¼ " de diámetro hasta una profundidad de 300 m. El perfilaje de pozo se realizó por cuatro métodos: Resistividad corta de 16", resistividad larga de 64", rayos gamma y potencial espontáneo (Fig. 29).
The perforation of the pilot well was carried out with 12¼" of diameter down to a depth of 300 m. The log-ging of the drillhole was carried out through four methods: Short resistivity of 16", long resistivity of 64", gamma rays and spontaneous potential (Fig. 29).
En base al perfilaje de pozo y la correlación con la col-umna litológica se identificaron dos sectores con acuíferos claramente definidos. Un primer acuífero hasta los 128 m de profundidad y un acuífero inferior de 193 a 300 m, separados por una capa intermedia con resistivi-dad baja debido a su contenido de sedimentos de granu-lometría fina. El diseño de pozo determinó la colocación de la tubería de revestimiento hasta los 275 m de pro-fundidad (Huaranca et al., IT CABAS Nº28, 1994). Los filtros fueron ubicados en el acuífero inferior a partir de los 200 m (Fig. 29).
Based on the logs and the correlation with the lithological column, two sectors with clearly defined aquifers were identified. A first aquifer reaches down to 128 m and a lower aquifer reaches between 193 and 300 m. The aquifers are separated by an intermediate stratum with low resistivity caused by its contents of sediments of fine grains. The design of the well deter-mined the placing of the borehole string down to 275 m depth (Huaranca et al., IT CABAS Nº28, 1994). The filters were placed in the inferior aquifer starting at 200 m (Fig. 29).
Ensayo de bombeo Pumping test
En el pozo profundo Cb-308 III se realizó un ensayo de bombeo con miras a obtener información sobre los parámetros hidráulicos de los acuíferos profundos y su posible interconexión hidráulica con los acuíferos su-periores captados en dos pozos piezométricos Cb-308 I y Cb-308 II, ubicados a 50 y 39,5 m de distancia del pozo bombeado. Sin embargo, durante el ensayo en los dos pozos de observación no se registraron variaciones en sus niveles estáticos. La prueba se ha efectuado con un caudal constante de 18 l/s durante 34,5 h, produci-endo un abatimiento de 13 m. Con los datos obtenidos se determinó la transmisividad de 2,5·10-3 m²/s en base al método de JACOB. El caudal específico ha sido 1,4 l/(sm). Por no haber tenido reacción en los pozos de ob-servación, no ha sido posible la determinación de un co-eficiente de almacenamiento.
In the deep well Cb-308 III a pumping test was carried out to obtain information on the hydraulic parameters of the deep aquifers and its possible hydraulic inter-connection with the superior aquifers collected in two piezometric wells Cb-308 I and Cb-308 II, and located at a in a distance of 50 and 39,5 m from the operating well. However, during the test in none of the two ob-servation wells, groundwater level variations were ob-served. The test has been carried out with a constant flow of 18 l/sec during 34.5 h, causing a drawdown of 13 m. Thanks to the data obtained, the transmissivity of 2.5·10-3 m²/s was determined following the JACOB method. The specific flow rate was 1.4 l/(sm). No storage coefficient could be calculated due to the lack of a reaction in the observation wells.
66
5.4 Análisis 5.4 Analysis
En términos generales, las perforaciones profundas llevadas a cabo en el Valle Central de Cochabamba permiten concluir que las condiciones hidrogeológicas en los niveles profundos del relleno plio-cuaternario, no son favorables para el aprovechamiento de aguas subterráneas.
In general, deep drilling carried out in the Central Val-ley of Cochabamba allow the conclusion, that the hy-drogeological conditions in the deep levels of the Plio-cene- Quaternary filling, are not favorable for the ex-ploitation of groundwaters.
En primer lugar, la conductividad hidráulica clara-mente disminuye con la profundidad por el aumento de contenidos de arcilla en los niveles gravosos y arenosos y de capas netamente arcillosas. Por esta razón, el rendimiento de los pozos resulta mas re-stringido que en los niveles acuíferos superiores.
In the first place, the hydraulic conductivity clearly decreases with depth and along with the increasing share of clay in the gravelly and sandy levels. For this reason, the yield of the wells is generally lower than in the upper water- bearing levels.
Por la misma razón, el flujo de agua subterránea que recarga a estos niveles profundos suele ser mas lento y producir acuíferos de aguas antiguas como en el caso del Pozo El Paso I (véase Cap. 7.4). El flujo re-stringido hacia los niveles profundos llevará tarde o temprano a una disminución del caudal de un pozo de explotación, si el caudal excede al volumen del flujo de recarga. Se puede insinuar que éste proceso, posiblemente entre otros, sea causa de la disminución del caudal de explotación en el Pozo El Paso I.
For the same reason, the recharge at these deep levels is usually slower. This leads to aquifers that contain old waters as it is the case of the Well El Paso I (be seen Ch. 7.4). Restricted flow towards deep levels sooner or later leads to a decrease in the pumping rate of an operating well. This, among other reasons might explain the decreasing pumping rate at “El Paso I”.
Otro aspecto que pone en duda la factibilidad de la ex-plotación de acuíferos profundos es la calidad de las aguas. Altos contenidos de hierro y manganeso por las condiciones reductoras en el medio exigen un tratamiento de las aguas o la mezcla con aguas de otras fuentes antes de ser distribuidas para el consumo hu-mano.
Another aspect that puts in doubt the feasibility of the exploitation of deep aquifers is the quality of the wa-ters. High contents of iron and manganese due to the reductive conditions in the invironment require a treatment of the waters or the mixing with waters of other sources befor distribution for human consump-tion.
Por lo tanto, en síntesis, se considera que la explo-tación de las aguas en las napas profundas no presenta ventajas que justificacen la elevada inversión de su alumbramiento.
Therefore, in synthesis, it is considered that the exploi-tation of the waters in the deep layers does not present advantages that would justify the high investment for their development.
67
6 HIDROGEOLOGIA / HYDROGEOLOGY
La información existente sobre la hidrogeología, in-cluyendo las características hidrodinámicas y los parámetros hidráulicos, ha sido generada en su may-oría por el Proyecto Integrado de Recursos Hídricos en Cochabamba, PIRHC, el consorcio SEURECA–BRGM–SOGREAH–CGL y el Proyecto CABAS. Además de la sola recopilación de datos, el Consorcio SEURECA–BRGM–SOGREAH–CGL ha utilizado los datos para el cálculo de un modelo numérico de los procesos hidráulicos en el valle. El Proyecto CABAS por su parte ha elaborado un mapa hidrogeológico.
The existing information on hydrogeology, including the hydrodynamic characteristics and the hydraulic pa-rameters has been generated mainly by the Integrated Project of Hydric Resources in Cochabamba, PIRHC, the SEURECA-BRGM-SOGREAH-CGL consortium and the CABAS Project. Along with the simple compi-lation of data, the SEURECA-BRGM-SOGREAH-CGL Consortium has used the data for the calculation of a numerical model of the hydraulic processes in the valley. The CABAS Project has elaborated a hydro-geological map.
6.1 Mapeo hidrogeológico 6.1 Hydrogeological Mapping
En base al reconocimiento del cuaternario efectuado por Veit (1992), en el el Proyecto CABAS, mediante una tesis de grado ha elaborado un primer mapa hidro-geológico del Valle Central de Cochabamba (Colque, l998).
Following the recognition of the Quaternary carried out by Veit (1992), in the CABAS Project, a first hy-drogeological map of the Central Valley of Cocha-bamba was elaborated through a thesis of degree (Colque, l998).
En razón de la variada composición de los sedimentos en la cuenca del Valle Central de Cochabamba, for-mada por rocas consolidadas que rodean el mismo valle, bloques, cantos y gravas que principalmente se presentan hacia el norte y oeste de valle, pasando gradualmente al mayor contenido de arenas y limos para encontrarse con grandes espesores de arcillas que se depositaron en la parte central, el comportamiento hidráulico de los acuíferos varía ampliamente en estre-cha relación con la litología. En el área del Valle Cen-tral se puede hacer una primera distinción principal:
Because of the different composition of the sediments in the basin of the Central Valley of Cochabamba, formed by consolidated rocks that surround the valley, blocks, boulders, and gravels that are mainly present towards the North and West of the valley, passing gradually to a major content of sands and muds to be found with great thicknesses of clays, which were de-posited in its central part, the hydraulic behavior of the aquifers varies widely in close relationship with the lithology. In the area of the Central Valley a first main distinction can be made:
Rocas consolidadas, pertenecientes al Paleozoico y Mesozoico, cuyas características hidráulicas no fa-vorecen la presencia de acuíferos importantes.
Consolidated Rocks, that belong to the Paleozoic and Mesozoic, whose hydraulic characteristics do not favor the presence of important aquifers.
Depósitos no consolidados, desarrollados durante el Cenozoico, que en gran parte presentan condiciones favorables para la existencia de reservorios de aguas subterráneas.
Unconsolidated Deposits, developed during the Ce-nozoic, that in large parts host groundwaters reser-voirs.
La caracterización hidrogeológica fue elaborada de acuerdo a normas establecidas por la UNESCO (Struckmeier et al., 1995). Estas normas para la elabo-ración de mapas hidrogeológicos plantean una clasifi-cación de las unidades según sus características como reservorio de aguas:
The hydrogeological characterization was elaborated according to norms established by UNESCO (Struck-meier et al., 1995). To develop hydrogelogical maps, these norms ask for a classification of the units accord-ing to their characteristics as water reservoirs:
68
Grupo I: En depósitos porosos no consolidados.Este grupo representa unidades litológicas de po-rosidad intergranular, e.d. acuíferos granulares compuestos de bloques, gravas, conglomerados, arenas, areniscas e limos.
Group I: In unconsolidated porous deposits. This group represents lithological units of intergranular porosity, i.e. granular aquifers composed by blocks, gravels, conglomerates, sands, sandstone and muds.
Grupo II: En rocas fisuradas: Este grupo reúne uni-dades litológicas consolidadas, permeables por la presencia de fisuras, fracturas o procesos de disolución, e.d. acuíferos fracturados que in-cluyen rocas ígneas, metamórficas o sedimen-tarias consolidadas y compactas. En la región de estudio, p. ej. en las rocas calcáreas del Cretácico y Pérmico (Mapa 3), el agua puede provocar la disolución de las rocas, dando lugar a acuíferos kársticos, clasificados como acuíferos caver-nosos.
Group II: In fissured rocks: This group brings to-gether consolidated lithological units, permeable due to fissures, fractures or processes of dissolu-tion, i.e. fractured aquifers that include igneous, metamorphic or sedimentary rocks. In the studied region, e.g. in the calcareous rocks of the Creta-ceous and Permian (Map 3), the water can lead to the dissolution of the rocks, giving rise to karstic aquifers, classified as cavernous aquifers.
Grupo III: Solo acuíferos locales (en rocas porosas o fisuradas), o regiones sin agua subterránea en cantidades apreciables: Formaciones clasificadas en este grupo no tienen importancia para el aprovechamiento de sus aguas subterráneas. Son unidades litológicas de baja permeabilidad o acuícludos formados por arcillas, arcilitas, lutitas y filitas.
Group III: Only local aquifers (in porous or fissured rocks), or regions without subsurface water in no-ticeable quantities: Formations classified in this group do not have importance for the exploitation of their groundwaters. They are lithological units of low permeability or aquicludes formed by clays, shales, mudstones and phyllites.
A continuación se describen las características hidro-geológicas más sobresalientes de algunas formaciones geológicas del área de estudio. Las nomenclaturas de las formaciones corresponden a la leyenda del mapa hidrogeológico (Mapa 3).
Next are described, the most important hydrogeologi-cal characteristics of some geological formations of the studied area. The nomenclatures of the formations correspond to the legend of the hydrogeological map (Map 3).
6.1.1 Grupo I: Acuíferos en depósitos porosos no consolidados
6.1.1 Group I: Aquifers in unconsolidated porous deposits
Depósitos no consolidados pueden constituir una im-portante fuente de agua subterránea según su extensión o interconexión hidráulica con otros cuerpos de agua. Por ello, muchos de éstos depósitos se encuentran clasificados en las subdivisiones Ia y Ib (de color azul oscuro y azul claro en el Mapa 3). Sin embargo, exis-ten depósitos no consolidados clasificados como IIIa de color café claro si constituyen una fuente de agua subterránea muy reducida, como p. ej. los depósitos glaciales (grupo IIIa).
Unconsolidated deposits can be an important source of groundwater depending on their extension or hydraulic interconnection with other bodies of water. That is why a large number of these deposits are classified in the subdivisions Ia and Ib (of dark blue and light blue color in Map 3). However, there exist unconsolidated deposits classified as IIIa of light brown color if they have only little areal extension or low hydraulic con-ductivities, as e.g. the glacial deposits (group IIIa).
Dentro del grupo I se distinguen los subgrupos Ia y Ib: In group I the subgroups Ia and Ib can be identified:
Ia: Acuíferos extensos y productivos; color azul oscuro
Ia: Large and productive aquifers; dark blue color
Abanicos aluviales (Q): En el área estudiada el sector con mayor importancia para el aprovechamiento de las aguas subterráneas corresponde a los abanicos aluvia-
Alluvial cones (Q): In the studied area the sector with major importance for the exploitation of groundwaters corresponds to the alluvial cones developed in the
69
les desarrollados en la parte suroeste y norte del Valle Central. La calidades hidroquímicas de las aguas, su fácil percolación y rápida recarga por los ríos que descienden de la cordillera, tanto como la gran con-ductividad hidráulica del acuífero atribuyen a esta uni-dad la mayor importancia para el aprovechamiento de aguas subterráneas en el Valle Central.
southwestern and northern part of the Central Valley. The hydrochemical qualities of the waters, their easy percolation and fast recharge by the rivers that come down from the Cordillera, as much as the great hy-draulic conductivity of the aquifer give this unit the biggest importance for the exploitation of groundwa-ters in the Central Valley.
Terrazas de los ríos de pendientes bajas (Q): Esta categoría comprende el Río Rocha (que atraviesa la ciudad de Cochabamba), los Ríos Tintaya, Calliri y Tapacarí (ubicados en el extremo suroeste del mapa hidrogeológico), el Río Viloma y Tacata, también son parte del grupo hidrogeológico Ia por disponer de una extensión y permeabilidad considerable (Mapa 3).
Terraces of the rivers with low gradient (Q): This category includes the Rocha River (that crosses the city of Cochabamba), the Tintaya, Calliri and Tapacarí rivers (placed in the southwestern end of the hydro-geological map). The Viloma and Tacata rivers are also part of the hydrogeological group Ia, beacuse they have a considerable extension and permeability (Map 3).
Ib: Acuíferos locales o discontinuos de produc-ción moderada; color azul claro.
Ib: Local or discontinuous aquifers of moderate production; light blue color.
Depósitos fluvio-lacustres (Q): Corresponden a este tipo de unidad los abanicos aluviales que se encuen-tran en la zona central y sur del valle. La secuencia que constituye esta unidad está caracterizada por una compleja alternancia de materiales de textura gruesa (grava y arena) interdigitada con materiales de textura fina (arcillas y limos). Esta particularidad proporciona a esta unidad acuíferos multicapa, semiconfinados y sin continuidad lateral. Son identificados en el mapa hidrogeológico con color azul claro (Mapa 3).
Fluvio- lacustrine deposits (Q): The alluvial cones lo-cated in the central southern area of the valley corre-spond to this type of unit. The sequence that consti-tutes this unit is characterized by a complex alternance of materials of coarse texture (gravel and sand) inter-fingered with materials of fine texture (clays and muds). This characteristics lead to semiconfined, mul-tilayer aquifers without lateral continuity. They are identified in the hydrogeological map with light blue color (Map 3).
Hacia el sud aumentan limos y arcillas de origen lacus-tre. En algunos casos aún existen remanentes de la-gunas (Laguna Alalay). Por su baja permeabilidad, es-tos depósitos localmente son de baja productividad. Esta unidad hidrogeológica también se desarrolla am-pliamente en el sud del valle de Sacaba, siendo pre-dominante material arcilloso a partir de los 60 m por debajo de la superficie, hecho por el cual la mayoría de los pozos perforados en el área de Sacaba no sobre-pasan dicha profundidad.
Towards the south the mud-clayey lacustrine deposits increase. In some cases, remnants of lagoons ("Laguna Alalay") still exist. Locally, for its low permeability, these deposits are of low productivity. This hydro-geological unit is also widely developed in the South of the Sacaba Valley, being predominantly of clayey material starting at 60 m below the surface; fact for which most of the perforated wells in the area of Sa-caba do not surpass this depth.
Terrazas aluviales de ríos de pendientes altas (Q): Comprenden sedimentos de textura gruesa como can-tos, grava y arena, reflejan la actividad fluvial. Esta composición litológica hace que los depósitos cuenten con valores de permeabilidad y transmisividad altos (1,5·10-4 a 6·10-4 m/s y 3,5·10-3 a 1,2·10-2 m2/s, respec-tivamente). Esta unidad tiene un comportamiento de acuífero libre, donde la superficie freática constituye el límite superior de saturación. Sin embargo, su re-stringida extensión los ubica en el grupo Ib.
Alluvial terraces of rivers with high gradient (Q):They include sediments with coarse texture as clasts, gravel and sand reflecting the fluvial activity. This lithological composition makes the deposits to have high values of permeability and transmissivity (1,5·10-
4 to 6·10-4 m/sec and 3,5·10-3 to 1,2·10-2 m2/s, respec-tively). This unit present unconfined aquifers, where the phreatic surface constitutes the upper limit of satu-ration. However, its restricted extension places them in the group Ib.
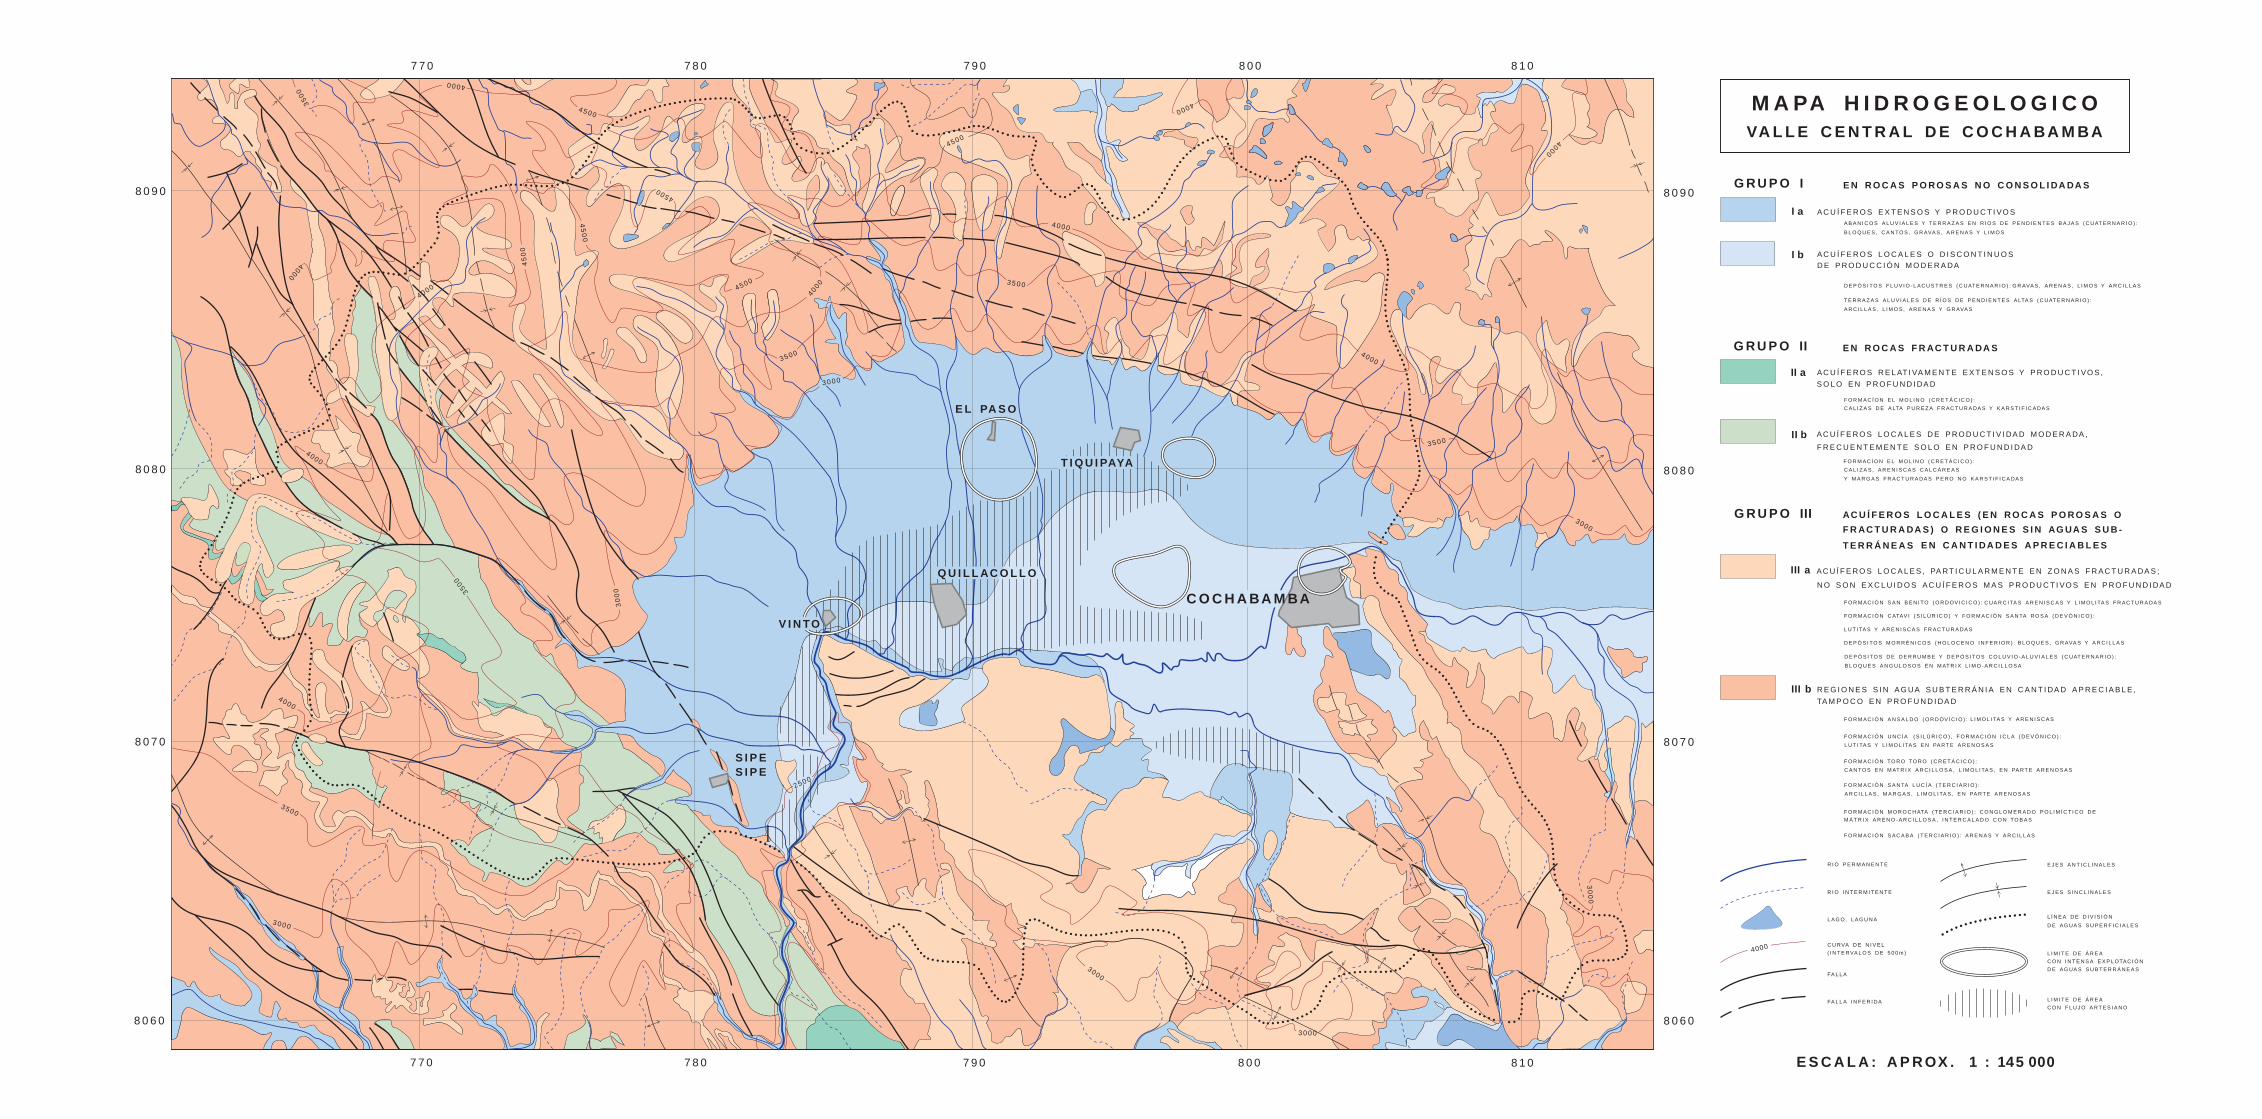
°°
°°
°°
°°
°°
°°
°°
°°
°°
°°
°°
°°
°°
°°
°°°°°
°°
°°
°°°°°°°°°°
°°
°°
°°
°°°°°°
°°
°°
°°
°°
°°
°°
°°
°
°°
°°°°°°
°°
°°
°°
°°°
°°
°°°°
°
°
°°
°°
°°
°°
°°
°°°°°°°°°°°°°°°°°°°°°°°°°°
°°
°°
°°°°
°°
°
°°
°
°
°°
°°
°°°°°°°°°
°°
°°
°°
°°°°°°°
°
°°
°°
°°°°°°°°°°°°°°°°°°°°°°°°°°
°°
°°
°°
°°
°°
°°
°°
°°°°°°°°°°°°°°°°°°°°°°°°°
°°
°°
°°
°°
°°
°°
°
°°
°°°°°°°°°
°°
°°
°°
°°
°°
°°
°°
°°
°°
°°
°°
°°
°°
°°
°°
°°
°°
°°
°°
°°
°
°°
°°
°°
°°
°°
°° ° ° ° ° ° ° ° ° ° ° ° ° ° ° ° ° ° ° ° ° ° ° ° ° ° ° ° ° °
°
°°
°°
°°
°
°°
°°
°°
°°
°°
°°
°°
°°
°° ° ° ° ° ° ° ° ° °
°°
°°
°°
°
°°
° ° ° ° ° ° ° ° ° ° ° ° °°
°°
°° ° °
°°
°°
°°
°°
°°
°°
°°
°° ° ° °
° °
°
°°
°°
°
°° ° ° ° ° ° °
°°
°°
°°
°
°° ° ° ° ° ° ° °
°°
°°
°°
°°
°°°°°°°°°
°°
°°
°°
°°
°°
°°
°°
°°
°°
°°
°°
°°
°°
°°
°°
°°
°°
°°
°°
°°°°
°
°°
°°
°°
°°
°°
°
°°
°°
°°
°°
°°
°°
°°
°°
°°
°°°°
°°
°°
°°
°°
°°
°°
°°
°°
°°
°°
°°
°°
°°
°°
°°
°°
°°
°°
°°
°°
°°
°°
°°
°°
°°
°°
°
°°°°°°°°°
°
°°
°°
°
°°°°°°°°
°°
°°
°°
°°
°°
°°
°°
°°
°°
°
°°
°°
°°
°°
°° ° ° °
°°
°°
°
°° ° ° ° ° ° ° °
°°
°°
°°
°°
°°
°°
°°
°°
°°
°°
°°
°°
°°
°°
°
°°
° ° ° ° ° ° ° °°
°°
°°
°°
°°
° ° ° ° ° ° ° °°
°°
°°
°°
°°
°°
°° ° ° ° ° ° ° ° °
°°
°°
° ° ° ° ° ° ° ° ° ° ° ° ° ° ° ° ° ° ° ° ° ° ° ° ° ° ° °°
°°
°°
° ° ° ° ° ° ° ° ° ° ° ° ° ° °
°°
°°
°
°°
°°
°°
°°
°°
°° ° ° °
°
°° °
°°
° ° °°
°°
°°
°
°° ° ° ° ° ° ° ° ° °
°°
°°
°°
°
°° ° °
°°
°°
°
7 7 0 7 8 0 7 9 0 8 0 0 8 1 0
8 0 9 0
8 0 8 0
8 0 7 0
8 0 6 0
8 1 08 0 07 9 07 8 07 7 0
8 0 6 0
8 0 7 0
8 0 8 0
8 0 9 0
3500
4000
3500
3500
3500
3500
35
00
4000
4000
4000
4000
4000
4000
4500
45
00
4 500
4500
45
00
3 000
3000
30
00
3 000
3 0 0 0
30
00
3 000
4500
4000
4000
4000
S I P ES I P E
E L PA S O
C O C H A BA M BA
T I Q U I PAYA
V I N TO
2500
Q U I L L AC O L L O
G R U P O I
G R U P O II
G R U P O III
E N R O C A S P O R O S A S N O C O N S O L I DA DA S
E N R O C A S F R AC T U R A DA S
AC U Í F E R O S L O C A L E S ( E N R O C A S P O R O S A S O
I a
II a
III a
AC U Í F E R O S E X T E N S O S Y P R O D U C T I VO S
AC U Í F E R O S R E L AT I VA M E N T E E X T E N S O S Y P R O D U C T I VO S ,
AC U Í F E R O S L O C A L E S O D I S C O N T I N U O S
AC U Í F E R O S L O C A L E S D E P R O D U C T I V I DA D M O D E R A DA ,
AC U Í F E R O S L O C A L E S , PA RT I C U L A R M E N T E E N Z O N A S F R AC T U R A DA S ;
A B A N I C O S A L U V I A L E S Y T E R R A Z A S E N R I O S D E P E N D I E N T E S B A J A S ( C UAT E R N A R I O ) :
B L O Q U E S , C A N TO S , G R AVA S , A R E N A S Y L I M O S
I b
II b
III b
D E P Ó S I TO S F L U V I O - L AC U S T R E S ( C UAT E R N A R I O ) : G R AVA S , A R E N A S , L I M O S Y A R C I L L A S
T E R R A Z A S A L U V I A L E S D E R Í O S D E P E N D I E N T E S A LTA S ( C UAT E R N A R I O ) :
A R C I L L A S , L I M O S , A R E N A S Y G R AVA S
S O L O E N P R O F U N D I DA D
F O R M AC Í O N E L M O L I N O ( C R E T Á C I C O ) :
C A L I Z A S D E A LTA P U R E Z A F R AC T U R A DA S Y K A R S T I F I C A DA S
F R E C U E N T E M E N T E S O L O E N P R O F U N D I DA D
F O R M AC Í O N E L M O L I N O ( C R E T Á C I C O ) :
C A L I Z A S , A R E N I S C A S C A L C Á R E A S
Y M A R G A S F R AC T U R A DA S P E R O N O K A R S T I F I C A DA S
F R AC T U R A DA S ) O R E G I O N E S S I N AG UA S S U B -
T E R R Á N E A S
N O S O N E X C L U I D O S AC U Í F E R O S M A S P R O D U C T I VO S E N P R O F U N D I DA D
F O R M AC I Ó N S A N B E N I TO ( O R D OV I C I C O ) : C UA R C I TA S A R E N I S C A S Y L I M O L I TA S F R AC T U R A DA S
F O R M AC I Ó N C ATAV I ( S I L Ú R I C O ) Y F O R M AC I Ó N S A N TA R O S A ( D E V Ó N I C O ) :
L U T I TA S Y A R E N I S C A S F R AC T U R A DA S
D E P Ó S I TO S M O R R É N I C O S ( H O L O C E N O I N F E R I O R ) : B L O Q U E S , G R AVA S Y A R C I L L A S
R E G I O N E S S I N AG UA S U B T E R R Á N I A E N C A N T I DA D A P R E C I A B L E ,
TA M P O C O E N P R O F U N D I DA D
F O R M AC I Ó N A N S A L D O ( O R D OV Í C I O ) : L I M O L I TA S Y A R E N I S C A S
F O R M AC I Ó N M O R O C H ATA ( T E R C I A R I O ) : C O N G L O M E R A D O P O L I M Í C T I C O D E
M Á T R I X A R E N O - A R C I L L O S A , I N T E R C A L A D O C O N TO B A S
F O R M AC I Ó N S A N TA L U C Í A ( T E R C I A R I O ) :
A R C I L L A S , M A R G A S , L I M O L I TA S , E N PA RT E A R E N O S A S
D E P R O D U C C I Ó N M O D E R A DA
E N C A N T I DA D E S A P R E C I A B L E S
4000
° ° ° ° ° ° ° ° ° ° ° ° ° ° ° ° ° °
° ° ° ° ° ° ° ° ° ° ° ° ° ° ° ° ° °
R I O P E R M A N E N T E
R I O I N T E R M I T E N T E
L AG O, L AG U N A
C U RVA D E N I V E L
FA L L A
FA L L A I N F E R I DA
E J E S A N T I C L I N A L E S
E J E S S I N C L I N A L E S
L Í N E A D E D I V I S I Ó N
D E AG UA S S U P E R F I C I A L E S
L I M I T E D E Á R E A
L I M I T E D E Á R E A
C O N F L U J O A RT E S I A N O
C O N I N T E N S A E X P L OTAC I Ó N
D E AG UA S S U B T E R R Á N E A S
( I N T E RVA L O S D E 5 0 0 m )
M A PA H I D R O G E O L O G I C OVA L L E C E N T R A L D E C O C H A BA M BA
E S C A L A : A P R OX . 1 : 145 000
F O R M AC I Ó N S AC A B A ( T E R C I A R I O ) : A R E N A S Y A R C I L L A S
D E P Ó S I TO S D E D E R RU M B E Y D E P Ó S I TO S C O L U V I O - A L U V I A L E S ( C UAT E R N A R I O ) :
B L O Q U E S A N G U L O S O S E N M AT R I X L I M O - A R C I L L O S A
F O R M AC I Ó N TO R O TO R O ( C R E T Á C I C O ) :
C A N TO S E N M AT R I X A R C I L L O S A , L I M O L I TA S , E N PA RT E A R E N O S A S
F O R M AC I Ó N U N C Í A ( S I L Ú R I C O ) , F O R M AC I Ó N I C L A ( D E V Ó N I C O ) :
L U T I TA S Y L I M O L I TA S E N PA RT E A R E N O S A S
71
6.1.2 Grupo II: Acuíferos en rocas fracturadas 6.1.2 Group II: Aquifers in fractured rocks
Parte del área de estudio está constituida por depósitos consolidados. Estos depósitos suelen tener importancia para el aprovechamiento del recurso hídrico única-mente por la presencia de fracturamiento. Esto es el caso de la formación El Molino (K), la formación San Benito (O) y la formación Santa Rosa (D) a pesar de la reducida extensión areal de esta última. Mientras las formaciones San Benito y Santa Rosa son ubicadas en el grupo IIIa, la formación El Molino resulta tener levemente mejores potenciales para el aprove-chamiento de los recursos de aguas subterráneas por estar karstificado y constituye el grupo IIa y IIb.
Part of the study area consists of consolidated deposits. These deposits usually have importance for the exploi-tation of the hydric resource only due to the presence of fracturing. This is the case of the El Molino- Forma-tion (K) and the Copacabana – Formation (P) in spite of the reduced areal extension of the latter. While the San Benito and Santa Rosa- Formations are placed in the group IIIa, the El Molino- Formation has slightly better potential resources for the exploitation of groundwaters for being karstified and is therefore placed into group IIa and IIb.
IIa: Acuíferos relativamente extensos y produc-tivos, solo en profundidad; color verde oscuro
IIa: Relatively large and productive aquifers, only in depth; dark green color.
Formación El Molino (K): La formación se desarrolla a lo largo de una faja de dirección general noroeste-sureste y se constituye de calizas de variable pureza. En la parte sur de la formación (Mapa 3), se ubican calizas de alta pureza en las cuales el proceso de kar-stificación ha llegado a mayor madurez. Presenta fallas regionales de dirección noroeste-sureste y fracturas propicias para la infiltración de agua de precipitación y la acción de procesos de karstificación. Estas partes son asignadas al grupo IIa.
El Molino- Formation (K): This formation crops out along a generally northwest-southeast striking belt and consists of limestones of variable pureness (Map 3). Carbonate rocks of high purity in which the process of karstification has reached higher maturity are located in the southern part of the area. Here, regional faults of northwest-southeast direction produce favorable con-ditions for rain-water infiltration and subsequent kar-stification. These parts are assigned to group IIa.
Formación Copacabana (P): Calizas de pureza relati-vamente alta, karstificadas y ubicadas en la parte oeste del mapa, como franja de poco espesor que bordea el flanco sur de la formación El Molino
Copacabana- Formation (P): Limestones of relatively high pureness, karstified and located in the western part of the map. They from a strip of little thickness that borders the southern flank of the El Molino- For-mation.
IIb: Acuíferos relativamente extensos y produc-tivos, solo en profundidad; color verde claro
IIb: Relatively large and productive aquifers, only in depth; light green color.
Formación El Molino (K): La mayor parte de la for-mación presente en el mapa se compone de areniscas calcáreas y margas y no constituye una formación de gran importancia para el aprovechamiento del recurso de agua y por lo tanto cae en el grupo IIb.
El Molino- Formation (K): Most of the formation pre-sented in the map is composed by calcareous sand-stone and marls and does not constitute a formation of great importance for the exploitation of the water re-source. Therefore is placed into the group IIb.
6.1.3 Grupo III: Acuíferos locales (en rocas porosas o fracturadas) o regiones sin aguas subterráneas en cantidades apreciables
6.1.3 Group III: Local aquifers (in porous or fractured rocks) or regions without groundwaters in noticeable quantities
IIIa: Acuíferos locales, particularmente en zonas fracturadas; no son excluidos acuíferos en profundidad; color café claro
IIIa: Local aquifers, particularly in fractured ar-eas; aquifers in depth are not excluded; light brown color.
Formación San Benito (O): Esta formación está com-puesta por cuarcitas, areniscas y limolitas con una
San Benito- Formation (O): This formation is com-posed of quartzite, sandstone and siltstones with a sec-
72
permeabilidad secundaria debida a la fracturación por procesos tectónicos . Ocupa gran parte del centro-sur del mapa (Mapa 3).
ondary permeability due to the fracturing by tectonic processes. It occupies most of the center-south of the map (Map 3).
Formación Catavi (S) y Santa Rosa (D): Por sus carac-terísticas litológicas, estas rocas son de permeabilidad muy baja y con escasas posibilidades para el aprove-chamiento de aguas subterráneas (PIRHC, 1976). Simi-lar a la formación San Benito, la formación Santa Rosa (D), integra el grupo IIIa de color café claro con la diferencia que sus afloramientos son reducidos y están formados por areniscas con niveles de lutitas.
Catavi- (S) and Santa Rosa- (D) Formations: Due to their lithological characteristics, these rocks are of very low permeability and with scarce possibilities for the exploitation of groundwaters (PIRHC, 1976). Similar to the San Benito- formation, the Santa Rosa formation (D), integrates the group IIIa of light brown color with the difference that their outcrops are re-duced and are composed of sandstone with levels of mudstones.
Depósitos morrénicos (Q): A ésta unidad correspon-den los depósitos de glaciación caracterizados por blo-ques y gravas en matrix arcillosa. Estos depósitos se encuentran por encima de los 4.000 m s.n.m. (Cordil-lera del Tunari) y son producto de la glaciación del Holoceno Inferior en un clima de bajas temperaturas y precipitaciones relativamente altas (Veit, 1992). En el mapa de las formaciones cuaternarias son identificadas como unidades 1 y 2 (Mapa 2).
Moraine deposits (Q): To this unit correspond the de-posits of glaciation characterized by blocks and grav-els in a clayey matrix. These deposits are found above an altitude of 4,000 m (Range of the Tunari Cordillera) and are the product of the glaciation of the Lower Holocene in a climate of low temperatures and rela-tively high rainfalls (Veit, 1992). In the map of the quaternary formations, they are identified as units 1 and 2 (Map 2).
Depósitos de derrumbe (Q): Asimismo existen aflo-ramientos puntuales de depósitos de derrumbe en los que la ocurrencia de agua es de baja a nula. Estos depósitos se producen a consecuencia de la elevada pendiente, fuertes lluvias y actividad tectónica que provocan la inestabilidad y el derrumbe de los materia-les ubicados en las faldas de serranías.
Landslide Deposits (Q): Likewise there are spots of outcrops of landslide deposits in which the occurrence of water is low to null. These deposits are produced as a result of the high slopes, heavy rains and tectonic ac-tivity that lead to the instability and the collapse of the materials placed in the skirts of mountainous areas.
Depósitos coluvio-aluviales (Q): Esta unidad se desar-rolla principalmente en el flanco sud de la Cordillera del Tunari (paralela a la falla Tunari), y en otros cerros de menor altura (véase Mapa 2). El material se carac-teriza por presentar bloques angulosos de diferente tamaño en una matrix limo-arenosa (Veit, 1992). En general, este material carece de importancia para la explotación de aguas subterráneas, pero puede pro-ducir vertientes locales.
Colluvio- alluvial deposits (Q): This unit has devel-oped mainly on the southern flank of the Range of the Tunari Cordillera (parallel to the Tunari fault), and in other mountains of minor altitude (see Map 2). The material is characterized by the presence of angular blocks of different size in a mud-sandy ground mass (Veit, 1992). In general, this material lacks importance for the exploitation of groundwaters, but it may pro-duce local springs.
IIIb: Acuíferos locales, particularmente en zonas fracturadas; no son excluidos acuíferos en profundidad; color café oscuro
IIIb: Local aquifers, particularly in fractured ar-eas; aquifers in depth are not excluded; dark brown color.
Formación Ansaldo (O): Ocupa gran parte del mapa (Mapa 3). Se compone de limolitas y niveles de areniscas y no presenta condiciones favorables a la ex-tracción de aguas subterráneas.
Ansaldo- Formation (O): It occupies most area of the map (Map 3). It is composed by mudstones and levels of sandstone and it does not present favorable condi-tions for the extraction of groundwaters.
Formación Uncía (S) y Formación Icla (D): Afloran en un cordón orientado NO-SE. Consiste de lutitas y limolitas, en parte arenosas con escasas intercalaciones de areniscas. Presenta pocas posibilidades para la ex-
Uncía- (S) and Icla-Formation (D): The formations crop out as a NW-SE oriented belt. They are com-posed of mudstones and shales, slightly sandy, with some intercalations of sandstone.
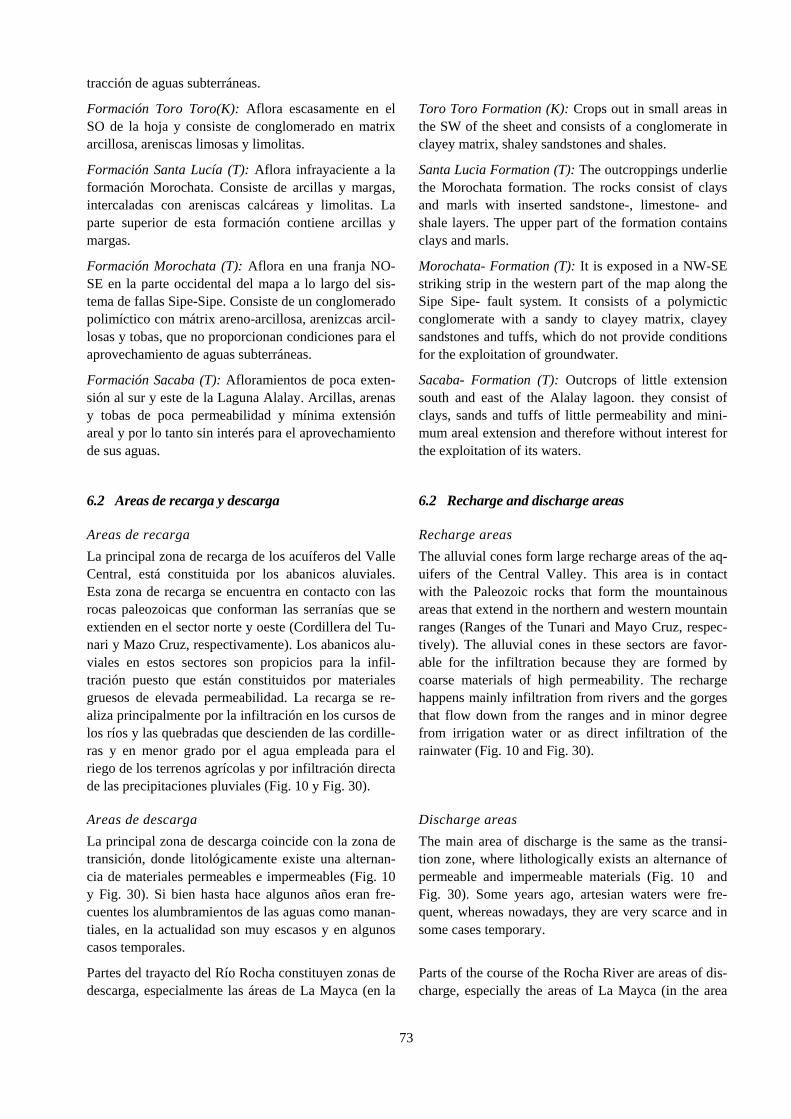
73
tracción de aguas subterráneas.
Formación Toro Toro(K): Aflora escasamente en el SO de la hoja y consiste de conglomerado en matrix arcillosa, areniscas limosas y limolitas.
Toro Toro Formation (K): Crops out in small areas in the SW of the sheet and consists of a conglomerate in clayey matrix, shaley sandstones and shales.
Formación Santa Lucía (T): Aflora infrayaciente a la formación Morochata. Consiste de arcillas y margas, intercaladas con areniscas calcáreas y limolitas. La parte superior de esta formación contiene arcillas y margas.
Santa Lucia Formation (T): The outcroppings underlie the Morochata formation. The rocks consist of clays and marls with inserted sandstone-, limestone- and shale layers. The upper part of the formation contains clays and marls.
Formación Morochata (T): Aflora en una franja NO-SE en la parte occidental del mapa a lo largo del sis-tema de fallas Sipe-Sipe. Consiste de un conglomerado polimíctico con mátrix areno-arcillosa, arenizcas arcil-losas y tobas, que no proporcionan condiciones para el aprovechamiento de aguas subterráneas.
Morochata- Formation (T): It is exposed in a NW-SE striking strip in the western part of the map along the Sipe Sipe- fault system. It consists of a polymictic conglomerate with a sandy to clayey matrix, clayey sandstones and tuffs, which do not provide conditions for the exploitation of groundwater.
Formación Sacaba (T): Afloramientos de poca exten-sión al sur y este de la Laguna Alalay. Arcillas, arenas y tobas de poca permeabilidad y mínima extensión areal y por lo tanto sin interés para el aprovechamiento de sus aguas.
Sacaba- Formation (T): Outcrops of little extension south and east of the Alalay lagoon. they consist of clays, sands and tuffs of little permeability and mini-mum areal extension and therefore without interest forthe exploitation of its waters.
6.2 Areas de recarga y descarga 6.2 Recharge and discharge areas
Areas de recarga Recharge areas
La principal zona de recarga de los acuíferos del Valle Central, está constituida por los abanicos aluviales. Esta zona de recarga se encuentra en contacto con las rocas paleozoicas que conforman las serranías que se extienden en el sector norte y oeste (Cordillera del Tu-nari y Mazo Cruz, respectivamente). Los abanicos alu-viales en estos sectores son propicios para la infil-tración puesto que están constituidos por materiales gruesos de elevada permeabilidad. La recarga se re-aliza principalmente por la infiltración en los cursos de los ríos y las quebradas que descienden de las cordille-ras y en menor grado por el agua empleada para el riego de los terrenos agrícolas y por infiltración directa de las precipitaciones pluviales (Fig. 10 y Fig. 30).
The alluvial cones form large recharge areas of the aq-uifers of the Central Valley. This area is in contact with the Paleozoic rocks that form the mountainous areas that extend in the northern and western mountain ranges (Ranges of the Tunari and Mayo Cruz, respec-tively). The alluvial cones in these sectors are favor-able for the infiltration because they are formed by coarse materials of high permeability. The recharge happens mainly infiltration from rivers and the gorges that flow down from the ranges and in minor degree from irrigation water or as direct infiltration of the rainwater (Fig. 10 and Fig. 30).
Areas de descarga Discharge areas
La principal zona de descarga coincide con la zona de transición, donde litológicamente existe una alternan-cia de materiales permeables e impermeables (Fig. 10 y Fig. 30). Si bien hasta hace algunos años eran fre-cuentes los alumbramientos de las aguas como manan-tiales, en la actualidad son muy escasos y en algunos casos temporales.
The main area of discharge is the same as the transi-tion zone, where lithologically exists an alternance of permeable and impermeable materials (Fig. 10 and Fig. 30). Some years ago, artesian waters were fre-quent, whereas nowadays, they are very scarce and in some cases temporary.
Partes del trayacto del Río Rocha constituyen zonas de descarga, especialmente las áreas de La Mayca (en la
Parts of the course of the Rocha River are areas of dis-charge, especially the areas of La Mayca (in the area
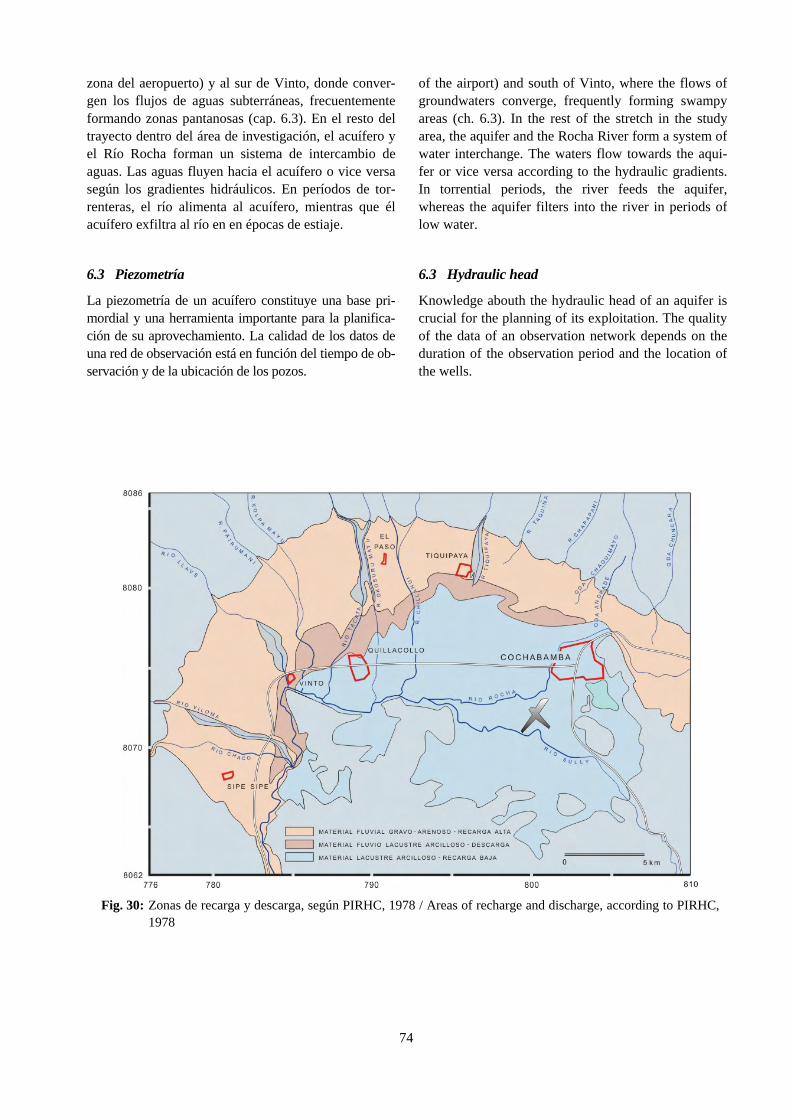
74
zona del aeropuerto) y al sur de Vinto, donde conver-gen los flujos de aguas subterráneas, frecuentemente formando zonas pantanosas (cap. 6.3). En el resto del trayecto dentro del área de investigación, el acuífero y el Río Rocha forman un sistema de intercambio de aguas. Las aguas fluyen hacia el acuífero o vice versa según los gradientes hidráulicos. En períodos de tor-renteras, el río alimenta al acuífero, mientras que él acuífero exfiltra al río en en épocas de estiaje.
of the airport) and south of Vinto, where the flows of groundwaters converge, frequently forming swampy areas (ch. 6.3). In the rest of the stretch in the study area, the aquifer and the Rocha River form a system of water interchange. The waters flow towards the aqui-fer or vice versa according to the hydraulic gradients. In torrential periods, the river feeds the aquifer, whereas the aquifer filters into the river in periods of low water.
6.3 Piezometría 6.3 Hydraulic head
La piezometría de un acuífero constituye una base pri-mordial y una herramienta importante para la planifica-ción de su aprovechamiento. La calidad de los datos de una red de observación está en función del tiempo de ob-servación y de la ubicación de los pozos.
Knowledge abouth the hydraulic head of an aquifer is crucial for the planning of its exploitation. The quality of the data of an observation network depends on the duration of the observation period and the location of the wells.
Fig. 30: Zonas de recarga y descarga, según PIRHC, 1978 / Areas of recharge and discharge, according to PIRHC, 1978

75
En el Valle Central se dispone de información pie-zométrica continua desde el año 1991 cuando se ha iniciado el muestreo de la red de observación del Proyecto CABAS. Después de una amplia evaluación de las fuentes de agua en el valle, en primera instancia se seleccionaron 39 pozos (perforados y excavados) estratégicamente ubicados (Fig. 31). En cada pozo de observación se midieron, por lo general mensualmente, niveles de agua. Paralelamente, en los pozos de la red de observación se midieron los valores de pH, conductivi-dad y temperatura. Los datos están publicados en el in-forme técnico de CABAS Nº55 (1998).
In the Central Valley data are available with continu-ous piezometric information since 1991 when the sampling of the observation network of the CABAS Project began. After a wide evaluation of the water re-sources in the valley, at first 39 wells (perforated and excavated), strategically placed (Fig. 31), were se-lected. As a rule in every well of observation, the wa-ter levels were measured monthly. In a parallel way, in the wells of the observation network the values of pH, conductivity and temperature were measured. The data is published in the technical report of CABAS Nº55 (1998).
En términos generales, la profundidad de la napa freática en relación con la topografía disminuye pro-gresivamente del área septentrional hacia el centro de la cuenca, habiéndose medido el más profundo (54 m) en la zona inferior del ápice del abanico de El Paso, situado al noroeste de la población homónima.
In general terms, the depth of the phreatic layer in rela-tion to the topography decreases progressively from the northern area towards the center of the basin, the deepest levels (54 m) has been measured in the lower zone of the apex of the El Paso fan, located in the northwest of the population with the same name.
En la zona de transición se encuentran pozos surgentes que captan acuíferos confinados con niveles pie-zométricos de varios metros sobre el nivel de la super-ficie.
In the transition zone appear artesian wells with pie-zometric levels of several meters above surface.
Fig. 31: Red de observación de niveles piezométricos de CABAS / SERGEOMIN / Monitoring network of pie-zometric levels of CABAS / SERGEOMIN
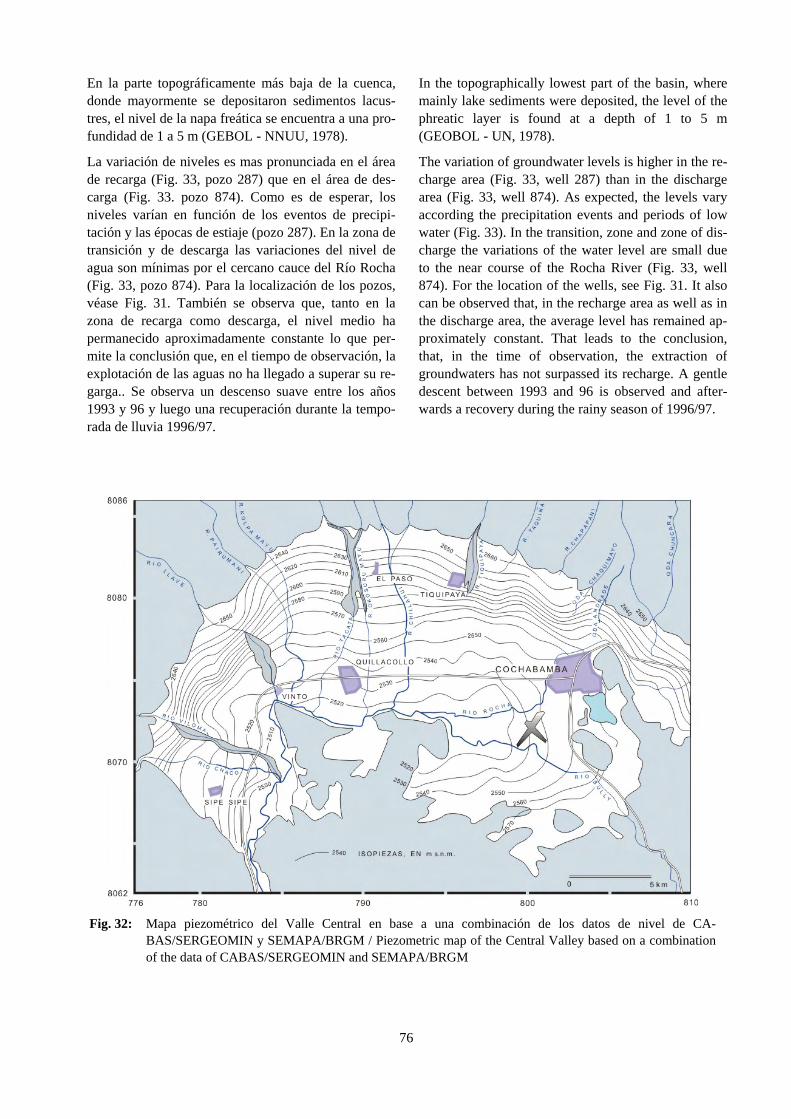
76
En la parte topográficamente más baja de la cuenca, donde mayormente se depositaron sedimentos lacus-tres, el nivel de la napa freática se encuentra a una pro-fundidad de 1 a 5 m (GEBOL - NNUU, 1978).
In the topographically lowest part of the basin, where mainly lake sediments were deposited, the level of the phreatic layer is found at a depth of 1 to 5 m (GEOBOL - UN, 1978).
La variación de niveles es mas pronunciada en el área de recarga (Fig. 33, pozo 287) que en el área de des-carga (Fig. 33. pozo 874). Como es de esperar, los niveles varían en función de los eventos de precipi-tación y las épocas de estiaje (pozo 287). En la zona de transición y de descarga las variaciones del nivel de agua son mínimas por el cercano cauce del Río Rocha (Fig. 33, pozo 874). Para la localización de los pozos, véase Fig. 31. También se observa que, tanto en la zona de recarga como descarga, el nivel medio ha permanecido aproximadamente constante lo que per-mite la conclusión que, en el tiempo de observación, la explotación de las aguas no ha llegado a superar su re-garga.. Se observa un descenso suave entre los años 1993 y 96 y luego una recuperación durante la tempo-rada de lluvia 1996/97.
The variation of groundwater levels is higher in the re-charge area (Fig. 33, well 287) than in the discharge area (Fig. 33, well 874). As expected, the levels vary according the precipitation events and periods of low water (Fig. 33). In the transition, zone and zone of dis-charge the variations of the water level are small due to the near course of the Rocha River (Fig. 33, well 874). For the location of the wells, see Fig. 31. It also can be observed that, in the recharge area as well as in the discharge area, the average level has remained ap-proximately constant. That leads to the conclusion, that, in the time of observation, the extraction of groundwaters has not surpassed its recharge. A gentle descent between 1993 and 96 is observed and after-wards a recovery during the rainy season of 1996/97.
Fig. 32: Mapa piezométrico del Valle Central en base a una combinación de los datos de nivel de CA-BAS/SERGEOMIN y SEMAPA/BRGM / Piezometric map of the Central Valley based on a combination of the data of CABAS/SERGEOMIN and SEMAPA/BRGM
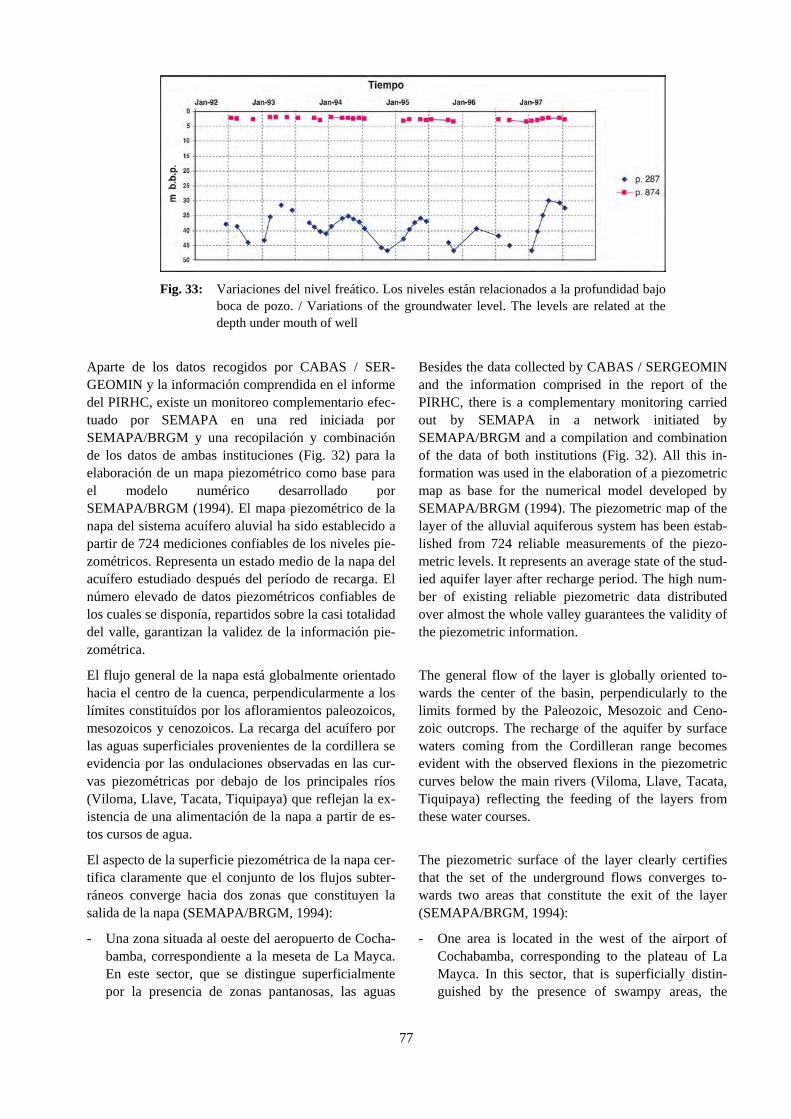
77
Aparte de los datos recogidos por CABAS / SER-GEOMIN y la información comprendida en el informe del PIRHC, existe un monitoreo complementario efec-tuado por SEMAPA en una red iniciada por SEMAPA/BRGM y una recopilación y combinación de los datos de ambas instituciones (Fig. 32) para la elaboración de un mapa piezométrico como base para el modelo numérico desarrollado por SEMAPA/BRGM (1994). El mapa piezométrico de la napa del sistema acuífero aluvial ha sido establecido a partir de 724 mediciones confiables de los niveles pie-zométricos. Representa un estado medio de la napa del acuífero estudiado después del período de recarga. El número elevado de datos piezométricos confiables de los cuales se disponía, repartidos sobre la casi totalidad del valle, garantizan la validez de la información pie-zométrica.
Besides the data collected by CABAS / SERGEOMIN and the information comprised in the report of the PIRHC, there is a complementary monitoring carried out by SEMAPA in a network initiated by SEMAPA/BRGM and a compilation and combination of the data of both institutions (Fig. 32). All this in-formation was used in the elaboration of a piezometric map as base for the numerical model developed by SEMAPA/BRGM (1994). The piezometric map of the layer of the alluvial aquiferous system has been estab-lished from 724 reliable measurements of the piezo-metric levels. It represents an average state of the stud-ied aquifer layer after recharge period. The high num-ber of existing reliable piezometric data distributed over almost the whole valley guarantees the validity of the piezometric information.
El flujo general de la napa está globalmente orientado hacia el centro de la cuenca, perpendicularmente a los límites constituídos por los afloramientos paleozoicos, mesozoicos y cenozoicos. La recarga del acuífero por las aguas superficiales provenientes de la cordillera se evidencia por las ondulaciones observadas en las cur-vas piezométricas por debajo de los principales ríos (Viloma, Llave, Tacata, Tiquipaya) que reflejan la ex-istencia de una alimentación de la napa a partir de es-tos cursos de agua.
The general flow of the layer is globally oriented to-wards the center of the basin, perpendicularly to the limits formed by the Paleozoic, Mesozoic and Ceno-zoic outcrops. The recharge of the aquifer by surface waters coming from the Cordilleran range becomes evident with the observed flexions in the piezometric curves below the main rivers (Viloma, Llave, Tacata, Tiquipaya) reflecting the feeding of the layers from these water courses.
El aspecto de la superficie piezométrica de la napa cer-tifica claramente que el conjunto de los flujos subter-ráneos converge hacia dos zonas que constituyen la salida de la napa (SEMAPA/BRGM, 1994):
The piezometric surface of the layer clearly certifies that the set of the underground flows converges to-wards two areas that constitute the exit of the layer (SEMAPA/BRGM, 1994):
- Una zona situada al oeste del aeropuerto de Cocha-bamba, correspondiente a la meseta de La Mayca. En este sector, que se distingue superficialmente por la presencia de zonas pantanosas, las aguas
- One area is located in the west of the airport of Cochabamba, corresponding to the plateau of La Mayca. In this sector, that is superficially distin-guished by the presence of swampy areas, the
Fig. 33: Variaciones del nivel freático. Los niveles están relacionados a la profundidad bajo boca de pozo. / Variations of the groundwater level. The levels are related at the depth under mouth of well
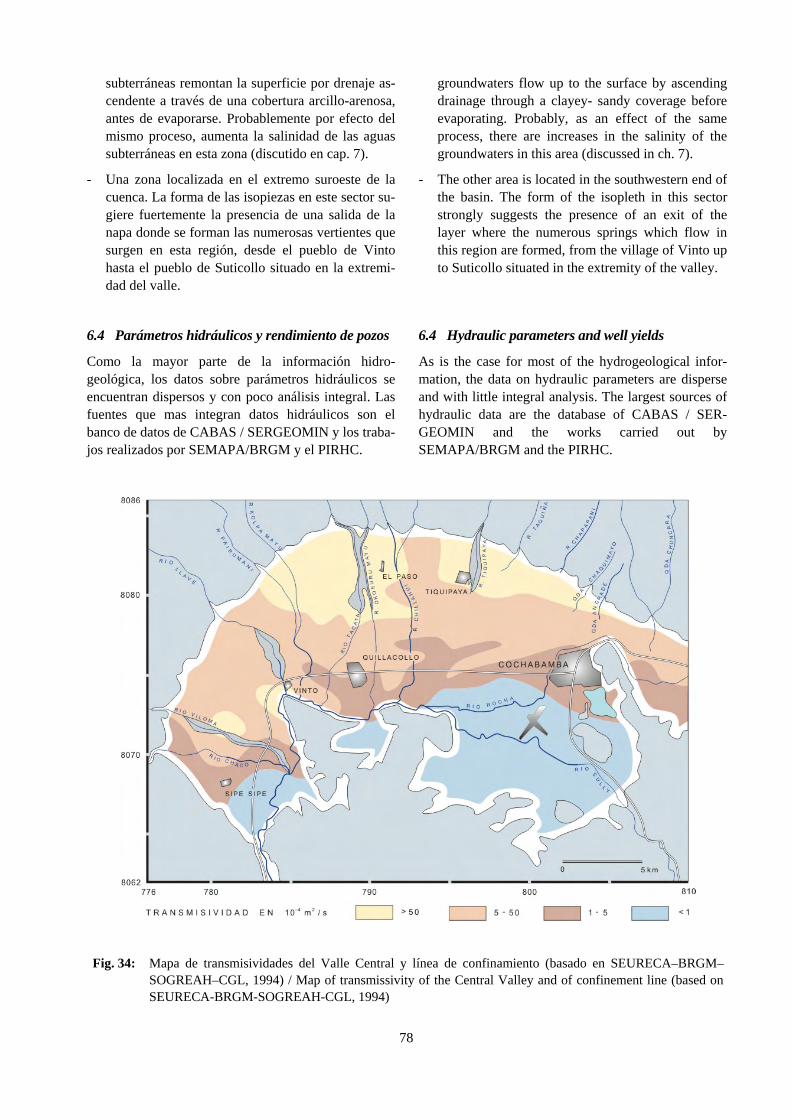
78
subterráneas remontan la superficie por drenaje as-cendente a través de una cobertura arcillo-arenosa, antes de evaporarse. Probablemente por efecto del mismo proceso, aumenta la salinidad de las aguas subterráneas en esta zona (discutido en cap. 7).
groundwaters flow up to the surface by ascending drainage through a clayey- sandy coverage before evaporating. Probably, as an effect of the same process, there are increases in the salinity of the groundwaters in this area (discussed in ch. 7).
- Una zona localizada en el extremo suroeste de la cuenca. La forma de las isopiezas en este sector su-giere fuertemente la presencia de una salida de la napa donde se forman las numerosas vertientes que surgen en esta región, desde el pueblo de Vinto hasta el pueblo de Suticollo situado en la extremi-dad del valle.
- The other area is located in the southwestern end of the basin. The form of the isopleth in this sector strongly suggests the presence of an exit of the layer where the numerous springs which flow in this region are formed, from the village of Vinto up to Suticollo situated in the extremity of the valley.
6.4 Parámetros hidráulicos y rendimiento de pozos 6.4 Hydraulic parameters and well yields
Como la mayor parte de la información hidro-geológica, los datos sobre parámetros hidráulicos se encuentran dispersos y con poco análisis integral. Las fuentes que mas integran datos hidráulicos son el banco de datos de CABAS / SERGEOMIN y los traba-jos realizados por SEMAPA/BRGM y el PIRHC.
As is the case for most of the hydrogeological infor-mation, the data on hydraulic parameters are disperse and with little integral analysis. The largest sources of hydraulic data are the database of CABAS / SER-GEOMIN and the works carried out by SEMAPA/BRGM and the PIRHC.
Fig. 34: Mapa de transmisividades del Valle Central y línea de confinamiento (basado en SEURECA–BRGM–SOGREAH–CGL, 1994) / Map of transmissivity of the Central Valley and of confinement line (based on SEURECA-BRGM-SOGREAH-CGL, 1994)
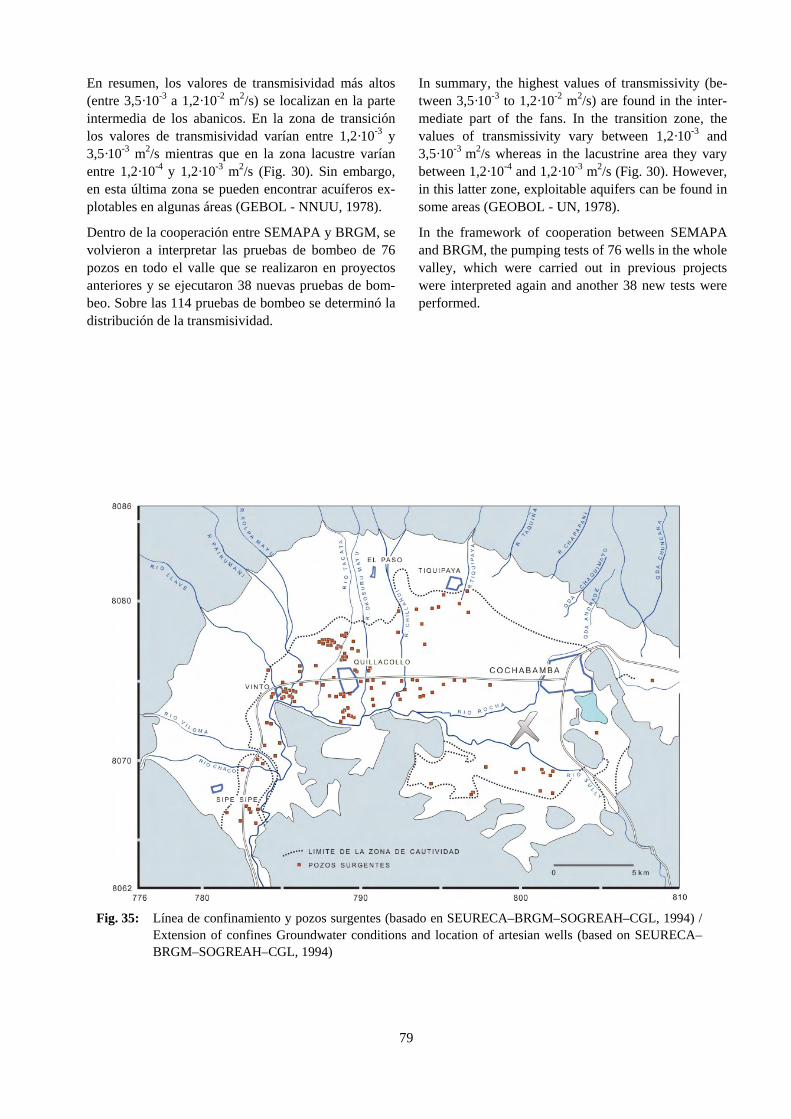
79
En resumen, los valores de transmisividad más altos (entre 3,5·10-3 a 1,2·10-2 m2/s) se localizan en la parte intermedia de los abanicos. En la zona de transición los valores de transmisividad varían entre 1,2·10-3 y 3,5·10-3 m2/s mientras que en la zona lacustre varían entre 1,2·10-4 y 1,2·10-3 m2/s (Fig. 30). Sin embargo, en esta última zona se pueden encontrar acuíferos ex-plotables en algunas áreas (GEBOL - NNUU, 1978).
In summary, the highest values of transmissivity (be-tween 3,5·10-3 to 1,2·10-2 m2/s) are found in the inter-mediate part of the fans. In the transition zone, the values of transmissivity vary between 1,2·10-3 and 3,5·10-3 m2/s whereas in the lacustrine area they vary between 1,2·10-4 and 1,2·10-3 m2/s (Fig. 30). However, in this latter zone, exploitable aquifers can be found in some areas (GEOBOL - UN, 1978).
Dentro de la cooperación entre SEMAPA y BRGM, se volvieron a interpretar las pruebas de bombeo de 76 pozos en todo el valle que se realizaron en proyectos anteriores y se ejecutaron 38 nuevas pruebas de bom-beo. Sobre las 114 pruebas de bombeo se determinó la distribución de la transmisividad.
In the framework of cooperation between SEMAPA and BRGM, the pumping tests of 76 wells in the whole valley, which were carried out in previous projects were interpreted again and another 38 new tests were performed.
Fig. 35: Línea de confinamiento y pozos surgentes (basado en SEURECA–BRGM–SOGREAH–CGL, 1994) / Extension of confines Groundwater conditions and location of artesian wells (based on SEURECA–BRGM–SOGREAH–CGL, 1994)
80
En el mapa (
Fig. 34) se muestra la distribución geográfica de la transmisividad (T). De manera general se puede indi-car que los valores más altos de T (> 5·10-3 m2/s) se sitúan en la periferia norte y oeste de la cuenca, par-ticularmente en las zonas de El Paso y Vinto oeste mientras los valores más bajos de T (< 5·10-4 m2/s) se encuentran por una parte al este de Quillacollo y por otra parte en el eje de la carretera a Cochabamba, así como al este y al sureste de la cuenca.
The results of the evaluation are shown in a map (
Fig. 34), where the geographical distribution of the transmissivity (T) is displayed. In a general way, it can be said that the highest values of T (>5·10-3 m2/s) are located in the northern and western periphery of the basin, particularly in the areas of El Paso and western Vinto while the lowest values of T (5·10-4 m2/s) are found for one part east of Quillacollo and for another part, along the road axis to Cochabamba, as well as to the east and to the southeast of the basin.
En lo que se refiere al coeficiente de almacenamiento, de forma cualitativa se puede constatar que los acuíferos son confinados a semiconfinados en los dos tercios de la cuenca en razón de la presencia de una capa de arcilla más o menos continua en superficie, de 10 a 30 m de espesor, según su localización. La sur-gencia en la zona de descarga es la mejor prueba de confinamiento (Fig. 35). El acuífero es semiconfinado a libre en el tercio norte y oeste. Esta observación co-incide con los datos de coeficiente de almacenamiento publicados por SEMAPA/BRGM que estipulan valores de S superiores a 5·10-3 al norte de la línea de confinamiento (Fig. 35) e inferiores a 1·10-3 al sud de la misma delimitación.
In reference to the storage coefficient, it can be con-firmed qualitatively that the aquifers are confined to semiconfined in the two thirds of the basin, because of the presence of a more or less continuous clayey stra-tum close to the surface, 10 to 30 m thick, depending on its location. The artesian wells in the area of dis-charge are the best proof of confinement. The aquifer is semiconfined to free in the northern and western third (Map 3). This observation matches the data of storage coefficient published by SEMAPA/BRGM that assumes values of S above 5·10-3 to the north of the line of confinement (Fig. 33), and below 1·10-3 south of this delimitation.
6.5 Balance hídrico 6.5 Water balance
El balance hídrico de un sistema acuífero reúne gran cantidad de información climatológica, orográfica, hidráulica y sobre el aprovechamiento del mismo re-curso. En parte sobre estos rubros, pero especialmente en lo que se refiere al aprovechamiento, el cual se pro-duce por un número desconocido de pozos con cau-dales difíciles de estimar, de dispone de información sumamente imprecisa. Sin embargo, siendo la dispon-ibilidad de agua, la explotación y sobreexplotación temas de interés público en Cochabamba relacionados a la hidrogeología, en lo que sigue presentamos un breve resumen de tres balances elaborados por distin-tas instituciones. Se desarrollará una comparación en-tre los conceptos de balance presentados por el PIRHC (GEBOL - NNUU, 1978), el convenio SEMAPA/BRGM (1994) y por MERCADO CON-SULTANTS (1996).
The water balance of an aquifer system brings together a large quantity of climatological, orographical and hydraulic information and data about the exploitation of this resource. This information is partly imprecise, especially concerning the exploitation, due to an un-known number of wells with unknown pumping rates. Since the availability of water, the exploitation and an eventual overexploitation of the aquifer are subjects of public interest in Cochabamba, as follows a brief summary of three balances provided by different insti-tutions is presented. A comparison will be developed between the balance concepts presented by the PIRHC (GEOBOL - UN, 1978), the SEMAPA/BRGM agree-ment (1994) and MERCADO CONSULTANTS (1996).
El PIRHC (GEBOL - NNUU, 1978), siendo el primer estudio que incluye la elaboración de un balance hídrico, contempla el siguiente concepto: La recarga ocurre durante la estación de lluvias, desde diciembre hasta marzo, por la infiltración de las aguas de los ríos torrentosos provenientes de la cordillera, a través de sus propios cauces. El volumen infiltrado es estimado
The PIRHC (GEOBOL - UN, 1978), as the first study that includes the elaboration of a hydrologic balance, takes into account the following concept: The recharge happens during the rainy season, from December until March, by the water infiltration of the torrential rivers coming down from the Cordilleran range, through their own river beds. The infiltrated volume is esti-
81
en 35 a 50·106 de m3/año en base a la escorrentía total medida en 1975/76 en Huarmi Mallcu (200·106 m3/a) y la determinación del porcentaje de infiltración (15-20%). Luego es contemplada la infiltración directa de la precipitación considerando un 15 % a 20 % de la media anual de la lluvia (650 mm) que se infiltra sobre una superficie de 150 km2, llegando así a un volumen de 15 a 20·106 de m3/año. La recarga proveniente de riego con aguas superficiales (ríos y lagunas) se estima en 3 a 5·106 m3/a.
mated to be 35 to 50·106 m3/year. To this amount, the recharge through direct infiltration is added, assuming that 15% to 20% of the annual precipitation gets into the groundwater reservoir, yielding a total volume of 15 to 20·106 m3/year. Recharge from irrigation with surface waters is estimated to range between 3 and 5·106 m3/a.
Por otro lado, la descarga incluye un volumen de agua extraído del acuífero por evapotranspiración. Consid-erando una superficie de descarga de 30 km2, el volu-men de agua evaporada llegaría a ser aproximada-mente 13 a 15·106 de m3/año. Luego se considera que el flujo base del Río Rocha que aparece a partir de la población de Vinto, proveniente del drenaje de los acuíferos y de los excedentes del agua para riego, habiéndose calculado para los años 1974/75 un valor de 15·106 m3 y para el año 1975/76 un volumen de 22·106 m3, de los cuales 3 - 5·106 m3 se utilizan para riego y no llegan a la salida de la cuenca. Calculando con estos valores, se obtiene para el flujo base, un valor de 18,5·106 m3 como promedio anual.
Also the discharge includes a volume of extracted wa-ter from the aquifer by evapotranspiration. Consider-ing a surface of discharge of 30 km2, the volume of evaporated water would lie between 13 and 15·106
m3/year. Further, the base flow of the Rocha River from Vinto on is considered as exfiltration of the aqui-fers and irrigation overheads. For the years 1974 / 1975 they are thought to have summed around 15 106
m3/a and for 1975 / 1976 about 22 106 m3/a. 3 to 5 106
m3/a of these volumina are reused for irrigation and do not exit the valley. Using these values for calculation, the average water output through base flow would yield 18,5 106 m3/a.
Entre el volumen extraído mediante pozos se considera una descarga entre 13 y 19·106 m3/a de agua. La des-carga por medio de los afloramientos de agua fue es-timada utilizando datos de 51 manantiales que fueron inventariados durante el mes de octubre de 1976. To-mando en cuenta que ese mes representa el de menor flujo de los ojos de agua y que el número de los con-siderados representa solo el 90 % de los existentes en la zona, la descarga por medio de los manantiales se ha estimado entre 4,7 y 5,5·106 m3/año de agua. Sumando los componentes, se llega a un balance ubicado entre un déficit de recarga anual de 8,5·106 m3 y un exce-dente de 29,3·106 m3.
The extracted volume through wells out of the main aquifer are thought to range between 13 and 19·106
m3/a. The discharge through artesian water was esti-mated using data of 51 springs that were inventoried during October 1976. Their discharge has been esti-mated between 4,7 and 5,5·106 m3/year. Adding up the components, the balance yields a result between a yearly recharge deficit of 8,5 106 m3/a and an excess of 29 106 m3/a.
El balance elaborado por SEMAPA/BRGM en el año 1994 dispone de un análisis mas detallado de compo-nentes de flujo. Entre las recargas son consideradas:
The balance calculated by SEMAPA/BRGM in 1994 has a more detailed analysis of flow components. Among the recharges it should be considered:
El volumen estipulado para el aporte por excedentes de riego se basa en cifras de áreas cultivadas, agua disponible para riego proporcionadas por SEURECA-BRGM-SOGREAH-CGL (1994) y la estimación que el 30 % de las aguas utilizadas para riego se infiltran al recurso, constituyendo de esta manera una recarga del acuífero de 8,4·106 m3/a (Tabla 9). La cifra para el volumen de la infiltración de aguas superficiales se apoya en los números publicados por SEURECA-BRGM-SOGREAH-CGL (1994), considerando las
The assumed recharge through irrigation is based on data of cultivated areas, available water for irrigation provided by SEURECA-BRGM-SOGREAH-CGL (1994) and the assumption that 30% of the waters used for irrigation infiltrate and reach the resource, produc-ing a recharge rate of 8,4·106 m3/a (Tabla 9). The cal-culated volume of infiltrating of surface waters is based on the numbers published by SEURECA-BRGM-SOGREAH-CGL (1994), considering the dif-ferent surfaces in the valley and their respective infil-
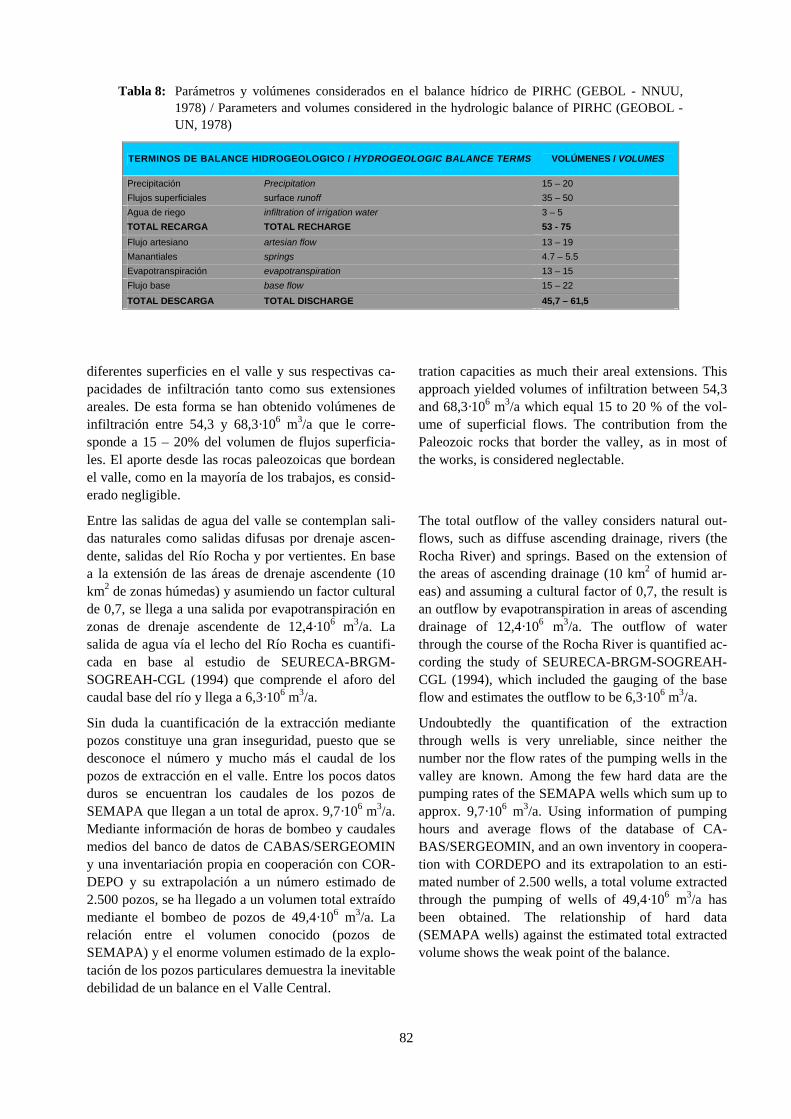
82
diferentes superficies en el valle y sus respectivas ca-pacidades de infiltración tanto como sus extensiones areales. De esta forma se han obtenido volúmenes de infiltración entre 54,3 y 68,3·106 m3/a que le corre-sponde a 15 – 20% del volumen de flujos superficia-les. El aporte desde las rocas paleozoicas que bordean el valle, como en la mayoría de los trabajos, es consid-erado negligible.
tration capacities as much their areal extensions. This approach yielded volumes of infiltration between 54,3 and 68,3·106 m3/a which equal 15 to 20 % of the vol-ume of superficial flows. The contribution from the Paleozoic rocks that border the valley, as in most of the works, is considered neglectable.
Entre las salidas de agua del valle se contemplan sali-das naturales como salidas difusas por drenaje ascen-dente, salidas del Río Rocha y por vertientes. En base a la extensión de las áreas de drenaje ascendente (10 km2 de zonas húmedas) y asumiendo un factor cultural de 0,7, se llega a una salida por evapotranspiración en zonas de drenaje ascendente de 12,4·106 m3/a. La salida de agua vía el lecho del Río Rocha es cuantifi-cada en base al estudio de SEURECA-BRGM-SOGREAH-CGL (1994) que comprende el aforo del caudal base del río y llega a 6,3·106 m3/a.
The total outflow of the valley considers natural out-flows, such as diffuse ascending drainage, rivers (the Rocha River) and springs. Based on the extension of the areas of ascending drainage (10 km2 of humid ar-eas) and assuming a cultural factor of 0,7, the result is an outflow by evapotranspiration in areas of ascending drainage of 12,4·106 m3/a. The outflow of water through the course of the Rocha River is quantified ac-cording the study of SEURECA-BRGM-SOGREAH-CGL (1994), which included the gauging of the base flow and estimates the outflow to be 6,3·106 m3/a.
Sin duda la cuantificación de la extracción mediante pozos constituye una gran inseguridad, puesto que se desconoce el número y mucho más el caudal de los pozos de extracción en el valle. Entre los pocos datos duros se encuentran los caudales de los pozos de SEMAPA que llegan a un total de aprox. 9,7·106 m3/a. Mediante información de horas de bombeo y caudales medios del banco de datos de CABAS/SERGEOMIN y una inventariación propia en cooperación con COR-DEPO y su extrapolación a un número estimado de 2.500 pozos, se ha llegado a un volumen total extraído mediante el bombeo de pozos de 49,4·106 m3/a. La relación entre el volumen conocido (pozos de SEMAPA) y el enorme volumen estimado de la explo-tación de los pozos particulares demuestra la inevitable debilidad de un balance en el Valle Central.
Undoubtedly the quantification of the extraction through wells is very unreliable, since neither the number nor the flow rates of the pumping wells in the valley are known. Among the few hard data are the pumping rates of the SEMAPA wells which sum up to approx. 9,7·106 m3/a. Using information of pumping hours and average flows of the database of CA-BAS/SERGEOMIN, and an own inventory in coopera-tion with CORDEPO and its extrapolation to an esti-mated number of 2.500 wells, a total volume extracted through the pumping of wells of 49,4·106 m3/a has been obtained. The relationship of hard data (SEMAPA wells) against the estimated total extracted volume shows the weak point of the balance.
Tabla 8: Parámetros y volúmenes considerados en el balance hídrico de PIRHC (GEBOL - NNUU, 1978) / Parameters and volumes considered in the hydrologic balance of PIRHC (GEOBOL - UN, 1978)
TERMINOS DE BALANCE HIDROGEOLOGICO / HYDROGEOLOGIC BALANCE TERMS VOLÚMENES / VOLUMES
Precipitación Precipitation 15 – 20
Flujos superficiales surface runoff 35 – 50
Agua de riego infiltration of irrigation water 3 – 5
TOTAL RECARGA TOTAL RECHARGE 53 - 75
Flujo artesiano artesian flow 13 – 19
Manantiales springs 4.7 – 5.5
Evapotranspiración evapotranspiration 13 – 15
Flujo base base flow 15 – 22
TOTAL DESCARGA TOTAL DISCHARGE 45,7 – 61,5
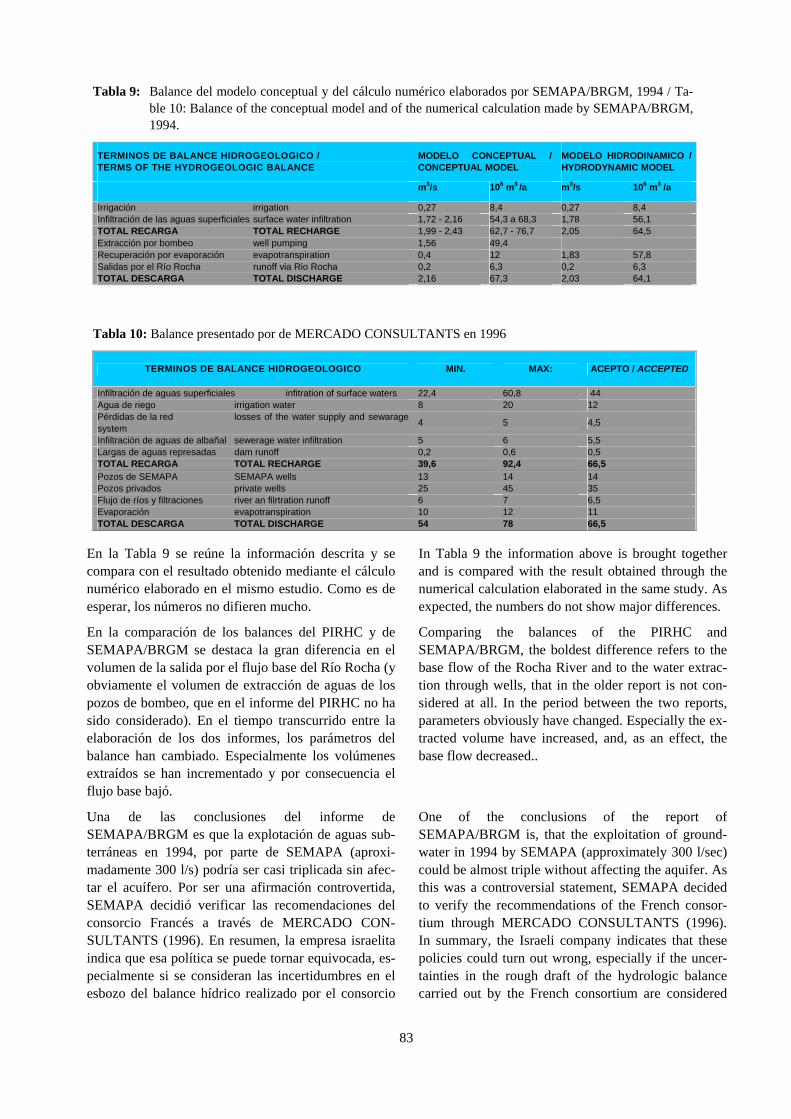
83
En la Tabla 9 se reúne la información descrita y se compara con el resultado obtenido mediante el cálculo numérico elaborado en el mismo estudio. Como es de esperar, los números no difieren mucho.
In Tabla 9 the information above is brought together and is compared with the result obtained through the numerical calculation elaborated in the same study. As expected, the numbers do not show major differences.
En la comparación de los balances del PIRHC y de SEMAPA/BRGM se destaca la gran diferencia en el volumen de la salida por el flujo base del Río Rocha (y obviamente el volumen de extracción de aguas de los pozos de bombeo, que en el informe del PIRHC no ha sido considerado). En el tiempo transcurrido entre la elaboración de los dos informes, los parámetros del balance han cambiado. Especialmente los volúmenes extraídos se han incrementado y por consecuencia el flujo base bajó.
Comparing the balances of the PIRHC and SEMAPA/BRGM, the boldest difference refers to the base flow of the Rocha River and to the water extrac-tion through wells, that in the older report is not con-sidered at all. In the period between the two reports, parameters obviously have changed. Especially the ex-tracted volume have increased, and, as an effect, the base flow decreased..
Una de las conclusiones del informe de SEMAPA/BRGM es que la explotación de aguas sub-terráneas en 1994, por parte de SEMAPA (aproxi-madamente 300 l/s) podría ser casi triplicada sin afec-tar el acuífero. Por ser una afirmación controvertida, SEMAPA decidió verificar las recomendaciones del consorcio Francés a través de MERCADO CON-SULTANTS (1996). En resumen, la empresa israelita indica que esa política se puede tornar equivocada, es-pecialmente si se consideran las incertidumbres en el esbozo del balance hídrico realizado por el consorcio
One of the conclusions of the report of SEMAPA/BRGM is, that the exploitation of ground-water in 1994 by SEMAPA (approximately 300 l/sec) could be almost triple without affecting the aquifer. As this was a controversial statement, SEMAPA decided to verify the recommendations of the French consor-tium through MERCADO CONSULTANTS (1996). In summary, the Israeli company indicates that these policies could turn out wrong, especially if the uncer-tainties in the rough draft of the hydrologic balance carried out by the French consortium are considered
Tabla 9: Balance del modelo conceptual y del cálculo numérico elaborados por SEMAPA/BRGM, 1994 / Ta-ble 10: Balance of the conceptual model and of the numerical calculation made by SEMAPA/BRGM, 1994.
TERMINOS DE BALANCE HIDROGEOLOGICO / TERMS OF THE HYDROGEOLOGIC BALANCE
MODELO CONCEPTUAL / CONCEPTUAL MODEL
MODELO HIDRODINAMICO / HYDRODYNAMIC MODEL
m3/s 106 m3 /a m3/s 106 m3 /a
Irrigación irrigation 0,27 8,4 0,27 8,4 Infiltración de las aguas superficiales surface water infiltration 1,72 - 2,16 54,3 a 68,3 1,78 56,1 TOTAL RECARGA TOTAL RECHARGE 1,99 - 2,43 62,7 - 76,7 2,05 64,5 Extracción por bombeo well pumping 1,56 49,4 Recuperación por evaporación evapotranspiration 0,4 12 1,83 57,8 Salidas por el Río Rocha runoff via Rio Rocha 0,2 6,3 0,2 6,3 TOTAL DESCARGA TOTAL DISCHARGE 2,16 67,3 2,03 64,1
Tabla 10: Balance presentado por de MERCADO CONSULTANTS en 1996
TERMINOS DE BALANCE HIDROGEOLOGICO MIN. MAX: ACEPTO / ACCEPTED
Infiltración de aguas superficiales infitration of surface waters 22,4 60,8 44 Agua de riego irrigation water 8 20 12 Pérdidas de la red losses of the water supply and sewarage system
4 5 4,5
Infiltración de aguas de albañal sewerage water infiltration 5 6 5,5 Largas de aguas represadas dam runoff 0,2 0,6 0,5 TOTAL RECARGA TOTAL RECHARGE 39,6 92,4 66,5 Pozos de SEMAPA SEMAPA wells 13 14 14 Pozos privados private wells 25 45 35 Flujo de ríos y filtraciones river an filrtration runoff 6 7 6,5 Evaporación evapotranspiration 10 12 11 TOTAL DESCARGA TOTAL DISCHARGE 54 78 66,5
84
francés y yuxtapone un balance modificado (Tabla 9). La tabla que reúne volúmenes sugeridos en varias pub-licaciones revela la magnitud del rango de inseguridad. Según MERCADO CONSULTANTS (1996) en caso de aumentar la descarga sobre la recarga, el nivel de agua descendería en 1 m de abatimiento regional por cada 5·106 m3 de agua sobreexplotada. De esta manera, el incremento de producción de agua subterránea en unos 420 l/s (13,2·106 m3/año) por SEMAPA, pro-duciría un descenso de los niveles de agua subterránea de 1,6 m/año.
and a modified balance is juxtaposed (Tabla 9). The table that brings together the volumes suggested in the mentioned publications, reveals the magnitude of the range of insecurity. According to MERCADO CON-SULTANTS (1996) in the case of increasing the dis-charge over the recharge, the water level would go down in 1 m in regional drawdown for every 5·106 m3
of overexploited water. This way, the increase of pro-duction of groundwater up to about 420 l/sec (13,2·106 m3/year) by SEMAPA would cause a drop of ground-water levels of 1,6 m/year.
85
7 HIDROQUIMICA 7 HYDROCHEMISTRY
7.1 Composición iónica 7.1 Ionic composition
El valle de Cochabamba está caracterizado por una zonificación de las aguas subterráneas en relación a su composición hidroquímica. Prácticamente todos los estudios llegan a la diferenciación de tres o cuatro áreas.
The chemistry of the groundwater in the valley of Cochabamba varies and can be categorized into differ-ent compositions, occurring in different places within the valley. Practically all the studies conclude in the differentiation of three or four areas.
De forma general y extendida a toda la cuenca, el PIRHC fue el primer proyecto en determinar la calidad de los recursos de aguas subterráneas y superficiales. Sus conclusiones se basan en 278 análisis de campo y 87 análisis físico-químicos de muestras de agua de po-zos perforados y excavados. En función a la calidad de las aguas subterráneas se han diferenciado 3 zonas, caracterizadas por valores de conductividad diferentes así como aparentemente, por facies químicas distintas. En la Fig. 38 los análisis químicos de las muestras están proyectadas en un diagrama PIPER. Las delimi-taciones de las zonas en el valle coincide aproxi-madamente con la subdivisión determinada por los posteriores estudios, representada en la Fig. 37. Sin embargo, las delimitaciones areales resultan inseguras, puesto que las composiciones químicas del agua en pozos excavados varían considerablemente en relación a las composiciones en los pozos perforados. Esto se puede atribuir a alteraciones de la composición en po-zos excavados por procesos de evaporación.
In a general way and extended to the whole basin, the PIRHC was the first project to determine the quality of ground- and surface-waters. Its conclusions are based on 278 field analyses and 87 physico-chemical analy-ses of water samples from perforated and excavated wells. According to the quality of the groundwaters, three areas have been differentiated, which are charac-terized by different values of conductivity as well as apparently by different chemical facies. In Fig. 38, the chemical analyses of the samples are projected in a PIPER diagram. The zoning of the valley is more or less the same as presented in latter studies (Fig. 37). However, the areal demarcations are insecure, because the chemical compositions of the water in excavated wells vary considerably in relation to the compositions in the perforated wells. This can be attributed to altera-tion of the composition in excavated wells by evapora-tion processes.
En 1994, el consorcio SEURECA–BRGM–SOGREAH–CGL ha utilizado datos de 107 análisis químicos básicos (pH, alcalinidad, dureza total, tur-biedad, conductividad, cloruros), realizados de las aguas subterráneas, recogidas en pozos perforados, pozos excavados y vertientes. Además han sido efec-tuados 51 análisis completos de las aguas extraídas igualmente de pozos perforados, excavados y ver-tientes. Los resultados del consorcio SEURECA–BRGM–SOGREAH–CGL coinciden básicamente en relación a la delimitación de las zonas como a la clasi-ficación de las aguas con los resultados que el Proyecto CABAS ha obtenido en sus investigaciones entre 1993 y 1995 y por lo tanto son discutidos con-juntamente. Por el contrario, las zonas y sus carac-terísticas hidroquímicas determinadas por CABAS y SEURECA–BRGM–SOGREAH–CGL en algunos as-pectos difieren de los resultados obtenidos por el
In 1994, the SEURECA-BRGM-SOGREAH-CGL consortium used data of 107 basic chemical analyses (pH, alkalinity, total hardness, turbidity, conductivity, chlorides), of groundwater collected in perforated wells, excavated wells and springs. 51 complete analy-sis of well- and spring-water were added. The results of the SEURECA-BRGM-SOGREAH-CGL consor-tium match more or less with the delimitation of the areas and the classification of the waters with the re-sults that the CABAS Project obtained in its research between 1993 and 1995 and therefore are discussed jointly. On the contrary, the areas and their hydro-chemical characteristic determined by CABAS and SEURECA-BRGM-SOGREAH-CGL, differ in some aspects from the results obtained by PIRHC discussed previously. These differences will be evaluated at the end of the chapter.
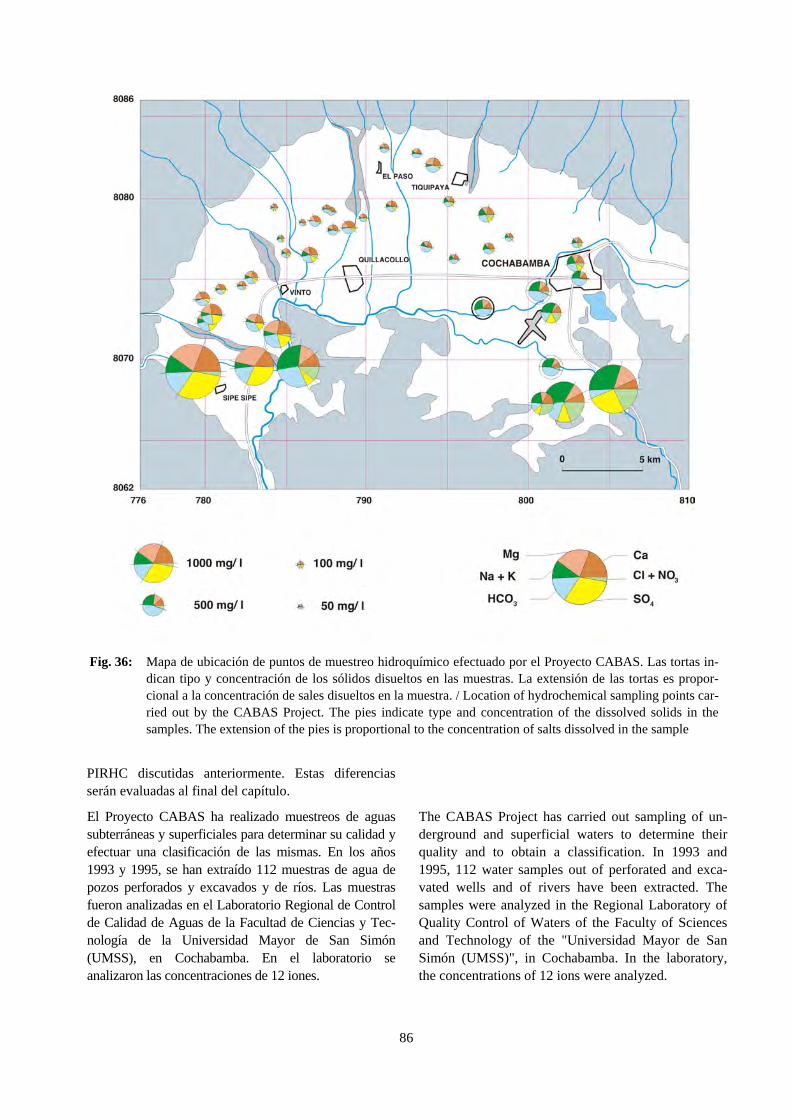
86
PIRHC discutidas anteriormente. Estas diferencias serán evaluadas al final del capítulo.
El Proyecto CABAS ha realizado muestreos de aguas subterráneas y superficiales para determinar su calidad y efectuar una clasificación de las mismas. En los años 1993 y 1995, se han extraído 112 muestras de agua de pozos perforados y excavados y de ríos. Las muestras fueron analizadas en el Laboratorio Regional de Control de Calidad de Aguas de la Facultad de Ciencias y Tec-nología de la Universidad Mayor de San Simón (UMSS), en Cochabamba. En el laboratorio se analizaron las concentraciones de 12 iones.
The CABAS Project has carried out sampling of un-derground and superficial waters to determine their quality and to obtain a classification. In 1993 and 1995, 112 water samples out of perforated and exca-vated wells and of rivers have been extracted. The samples were analyzed in the Regional Laboratory of Quality Control of Waters of the Faculty of Sciences and Technology of the "Universidad Mayor de San Simón (UMSS)", in Cochabamba. In the laboratory, the concentrations of 12 ions were analyzed.
Fig. 36: Mapa de ubicación de puntos de muestreo hidroquímico efectuado por el Proyecto CABAS. Las tortas in-dican tipo y concentración de los sólidos disueltos en las muestras. La extensión de las tortas es propor-cional a la concentración de sales disueltos en la muestra. / Location of hydrochemical sampling points car-ried out by the CABAS Project. The pies indicate type and concentration of the dissolved solids in the samples. The extension of the pies is proportional to the concentration of salts dissolved in the sample
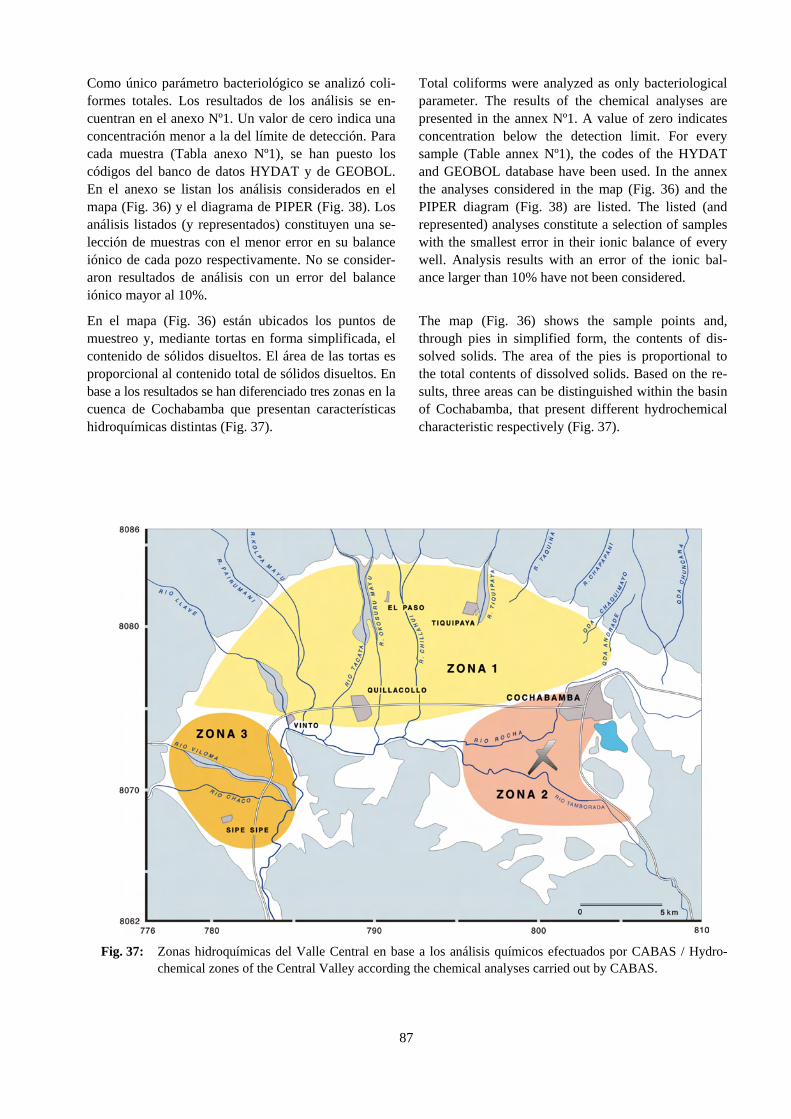
87
Como único parámetro bacteriológico se analizó coli-formes totales. Los resultados de los análisis se en-cuentran en el anexo Nº1. Un valor de cero indica una concentración menor a la del límite de detección. Para cada muestra (Tabla anexo Nº1), se han puesto los códigos del banco de datos HYDAT y de GEOBOL. En el anexo se listan los análisis considerados en el mapa (Fig. 36) y el diagrama de PIPER (Fig. 38). Los análisis listados (y representados) constituyen una se-lección de muestras con el menor error en su balance iónico de cada pozo respectivamente. No se consider-aron resultados de análisis con un error del balance iónico mayor al 10%.
Total coliforms were analyzed as only bacteriological parameter. The results of the chemical analyses are presented in the annex Nº1. A value of zero indicates concentration below the detection limit. For every sample (Table annex Nº1), the codes of the HYDAT and GEOBOL database have been used. In the annex the analyses considered in the map (Fig. 36) and the PIPER diagram (Fig. 38) are listed. The listed (and represented) analyses constitute a selection of samples with the smallest error in their ionic balance of every well. Analysis results with an error of the ionic bal-ance larger than 10% have not been considered.
En el mapa (Fig. 36) están ubicados los puntos de muestreo y, mediante tortas en forma simplificada, el contenido de sólidos disueltos. El área de las tortas es proporcional al contenido total de sólidos disueltos. En base a los resultados se han diferenciado tres zonas en la cuenca de Cochabamba que presentan características hidroquímicas distintas (Fig. 37).
The map (Fig. 36) shows the sample points and, through pies in simplified form, the contents of dis-solved solids. The area of the pies is proportional to the total contents of dissolved solids. Based on the re-sults, three areas can be distinguished within the basin of Cochabamba, that present different hydrochemical characteristic respectively (Fig. 37).
Fig. 37: Zonas hidroquímicas del Valle Central en base a los análisis químicos efectuados por CABAS / Hydro-chemical zones of the Central Valley according the chemical analyses carried out by CABAS.
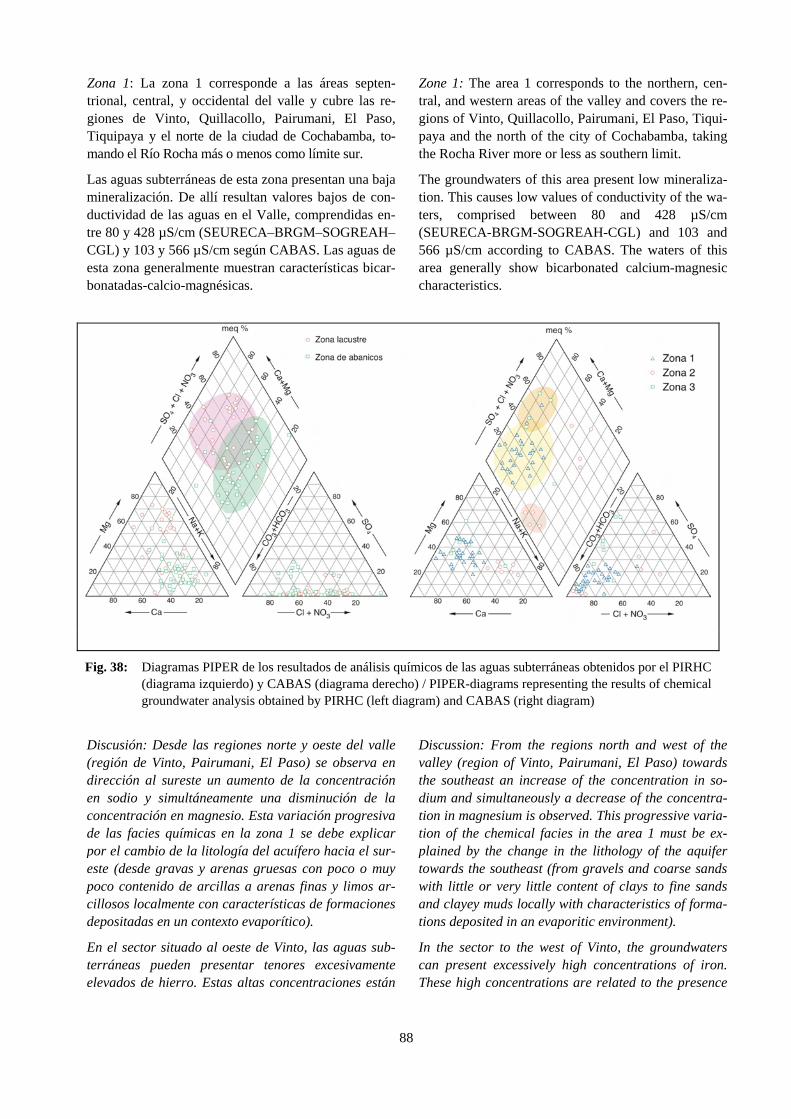
88
Zona 1: La zona 1 corresponde a las áreas septen-trional, central, y occidental del valle y cubre las re-giones de Vinto, Quillacollo, Pairumani, El Paso, Tiquipaya y el norte de la ciudad de Cochabamba, to-mando el Río Rocha más o menos como límite sur.
Zone 1: The area 1 corresponds to the northern, cen-tral, and western areas of the valley and covers the re-gions of Vinto, Quillacollo, Pairumani, El Paso, Tiqui-paya and the north of the city of Cochabamba, taking the Rocha River more or less as southern limit.
Las aguas subterráneas de esta zona presentan una baja mineralización. De allí resultan valores bajos de con-ductividad de las aguas en el Valle, comprendidas en-tre 80 y 428 µS/cm (SEURECA–BRGM–SOGREAH–CGL) y 103 y 566 µS/cm según CABAS. Las aguas de esta zona generalmente muestran características bicar-bonatadas-calcio-magnésicas.
The groundwaters of this area present low mineraliza-tion. This causes low values of conductivity of the wa-ters, comprised between 80 and 428 µS/cm (SEURECA-BRGM-SOGREAH-CGL) and 103 and 566 µS/cm according to CABAS. The waters of this area generally show bicarbonated calcium-magnesic characteristics.
Discusión: Desde las regiones norte y oeste del valle (región de Vinto, Pairumani, El Paso) se observa en dirección al sureste un aumento de la concentración en sodio y simultáneamente una disminución de la concentración en magnesio. Esta variación progresiva de las facies químicas en la zona 1 se debe explicar por el cambio de la litología del acuífero hacia el sur-este (desde gravas y arenas gruesas con poco o muy poco contenido de arcillas a arenas finas y limos ar-cillosos localmente con características de formaciones depositadas en un contexto evaporítico).
Discussion: From the regions north and west of the valley (region of Vinto, Pairumani, El Paso) towards the southeast an increase of the concentration in so-dium and simultaneously a decrease of the concentra-tion in magnesium is observed. This progressive varia-tion of the chemical facies in the area 1 must be ex-plained by the change in the lithology of the aquifer towards the southeast (from gravels and coarse sands with little or very little content of clays to fine sands and clayey muds locally with characteristics of forma-tions deposited in an evaporitic environment).
En el sector situado al oeste de Vinto, las aguas sub-terráneas pueden presentar tenores excesivamente elevados de hierro. Estas altas concentraciones están
In the sector to the west of Vinto, the groundwaters can present excessively high concentrations of iron. These high concentrations are related to the presence
Fig. 38: Diagramas PIPER de los resultados de análisis químicos de las aguas subterráneas obtenidos por el PIRHC (diagrama izquierdo) y CABAS (diagrama derecho) / PIPER-diagrams representing the results of chemical groundwater analysis obtained by PIRHC (left diagram) and CABAS (right diagram)
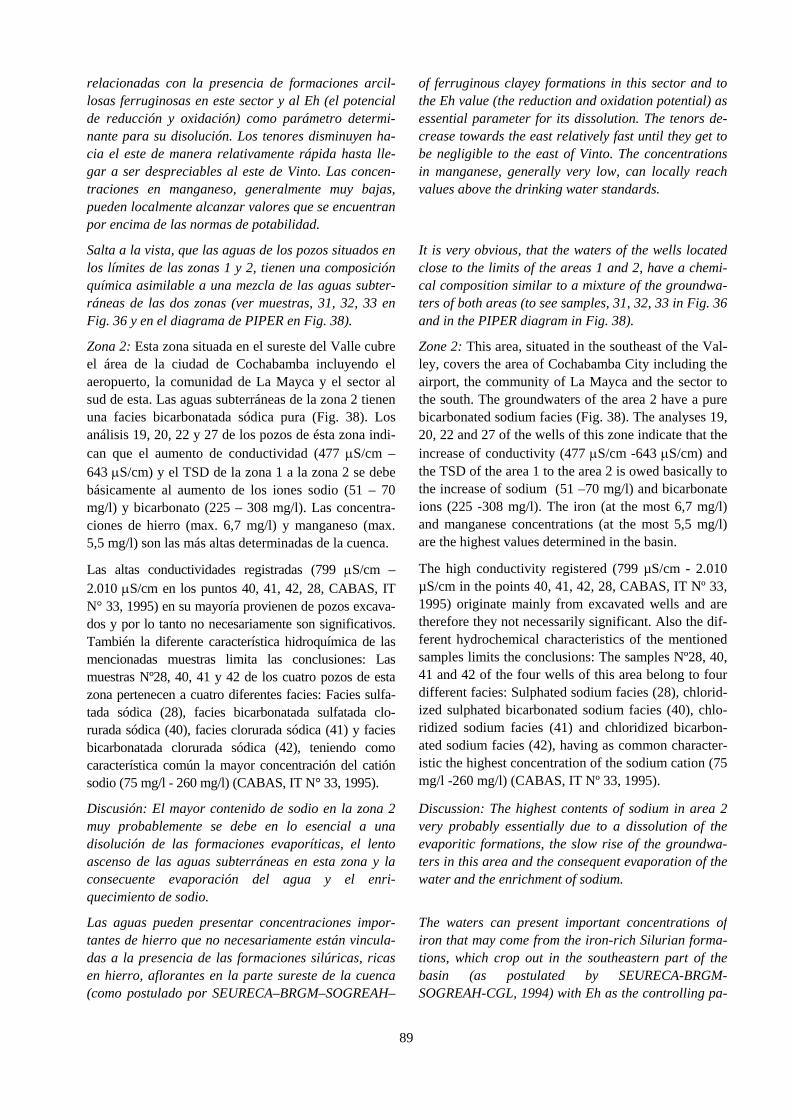
89
relacionadas con la presencia de formaciones arcil-losas ferruginosas en este sector y al Eh (el potencial de reducción y oxidación) como parámetro determi-nante para su disolución. Los tenores disminuyen ha-cia el este de manera relativamente rápida hasta lle-gar a ser despreciables al este de Vinto. Las concen-traciones en manganeso, generalmente muy bajas, pueden localmente alcanzar valores que se encuentran por encima de las normas de potabilidad.
of ferruginous clayey formations in this sector and to the Eh value (the reduction and oxidation potential) as essential parameter for its dissolution. The tenors de-crease towards the east relatively fast until they get to be negligible to the east of Vinto. The concentrations in manganese, generally very low, can locally reach values above the drinking water standards.
Salta a la vista, que las aguas de los pozos situados en los límites de las zonas 1 y 2, tienen una composición química asimilable a una mezcla de las aguas subter-ráneas de las dos zonas (ver muestras, 31, 32, 33 en Fig. 36 y en el diagrama de PIPER en Fig. 38).
It is very obvious, that the waters of the wells located close to the limits of the areas 1 and 2, have a chemi-cal composition similar to a mixture of the groundwa-ters of both areas (to see samples, 31, 32, 33 in Fig. 36and in the PIPER diagram in Fig. 38).
Zona 2: Esta zona situada en el sureste del Valle cubre el área de la ciudad de Cochabamba incluyendo el aeropuerto, la comunidad de La Mayca y el sector al sud de esta. Las aguas subterráneas de la zona 2 tienen una facies bicarbonatada sódica pura (Fig. 38). Los análisis 19, 20, 22 y 27 de los pozos de ésta zona indi-can que el aumento de conductividad (477 S/cm –643 S/cm) y el TSD de la zona 1 a la zona 2 se debe básicamente al aumento de los iones sodio (51 – 70 mg/l) y bicarbonato (225 – 308 mg/l). Las concentra-ciones de hierro (max. 6,7 mg/l) y manganeso (max. 5,5 mg/l) son las más altas determinadas de la cuenca.
Zone 2: This area, situated in the southeast of the Val-ley, covers the area of Cochabamba City including the airport, the community of La Mayca and the sector to the south. The groundwaters of the area 2 have a pure bicarbonated sodium facies (Fig. 38). The analyses 19, 20, 22 and 27 of the wells of this zone indicate that the increase of conductivity (477 S/cm -643 S/cm) and the TSD of the area 1 to the area 2 is owed basically to the increase of sodium (51 –70 mg/l) and bicarbonate ions (225 -308 mg/l). The iron (at the most 6,7 mg/l) and manganese concentrations (at the most 5,5 mg/l) are the highest values determined in the basin.
Las altas conductividades registradas (799 S/cm –2.010 S/cm en los puntos 40, 41, 42, 28, CABAS, IT N° 33, 1995) en su mayoría provienen de pozos excava-dos y por lo tanto no necesariamente son significativos. También la diferente característica hidroquímica de las mencionadas muestras limita las conclusiones: Las muestras Nº28, 40, 41 y 42 de los cuatro pozos de esta zona pertenecen a cuatro diferentes facies: Facies sulfa-tada sódica (28), facies bicarbonatada sulfatada clo-rurada sódica (40), facies clorurada sódica (41) y facies bicarbonatada clorurada sódica (42), teniendo como característica común la mayor concentración del catión sodio (75 mg/l - 260 mg/l) (CABAS, IT N° 33, 1995).
The high conductivity registered (799 µS/cm - 2.010 µS/cm in the points 40, 41, 42, 28, CABAS, IT Nº 33, 1995) originate mainly from excavated wells and are therefore they not necessarily significant. Also the dif-ferent hydrochemical characteristics of the mentioned samples limits the conclusions: The samples Nº28, 40, 41 and 42 of the four wells of this area belong to four different facies: Sulphated sodium facies (28), chlorid-ized sulphated bicarbonated sodium facies (40), chlo-ridized sodium facies (41) and chloridized bicarbon-ated sodium facies (42), having as common character-istic the highest concentration of the sodium cation (75 mg/l -260 mg/l) (CABAS, IT Nº 33, 1995).
Discusión: El mayor contenido de sodio en la zona 2 muy probablemente se debe en lo esencial a una disolución de las formaciones evaporíticas, el lento ascenso de las aguas subterráneas en esta zona y la consecuente evaporación del agua y el enri-quecimiento de sodio.
Discussion: The highest contents of sodium in area 2 very probably essentially due to a dissolution of the evaporitic formations, the slow rise of the groundwa-ters in this area and the consequent evaporation of the water and the enrichment of sodium.
Las aguas pueden presentar concentraciones impor-tantes de hierro que no necesariamente están vincula-das a la presencia de las formaciones silúricas, ricas en hierro, aflorantes en la parte sureste de la cuenca (como postulado por SEURECA–BRGM–SOGREAH–
The waters can present important concentrations of iron that may come from the iron-rich Silurian forma-tions, which crop out in the southeastern part of the basin (as postulated by SEURECA-BRGM-SOGREAH-CGL, 1994) with Eh as the controlling pa-
90
CGL, 1994) sino mas bien al Eh como parámetro de-terminante.
rameter.
Zona 3: Esta zona, situada en el suroeste de la cuenca cubre los alrededores de Mallcu Rancho, Viloma, Pay-acollo, Sipe Sipe y Suticollo. La CE relativamente ele-vada de las aguas subterráneas en esta parte situada al suroeste del valle, varía de norte a sud entre 596 µS/cm y 1.757 µS/cm.
Zone 3: This area, situated in the southwest of the ba-sin covers the surroundings of Mallcu Rancho, Viloma, Payacollo, Sipe Sipe and Suticollo. The rela-tively high EC of the groundwaters in this part situated in the southwest of the valley varies from north to south between 596 µS/cm and 1.757 µS/cm.
Discusión: En relación a las aguas de la zona 1 que están almacenadas en sedimentos cuaternarios sobre formaciones ordovícicas, constituidas por limolitas micáceas, la composición de las aguas subterráneas de la zona 3 está relacionada con los sedimentos terciarios y cretácicos, que afloran al occidente de la zona y que consisten de rocas carbonatadas y dolomitas, arcillas rojas, pelitas y de niveles evaporíticos yesíferos. Per-tenecen en la parte sud de la zona a la facies sulfatada magnésico-cálcica (muestras Nº3 y 29) mientras que las aguas en la parte norte de la zona tienen una facies bi-carbonatada sulfatada cálcico magnésica (muestras Nº1, 4, 30 y 39) (CABAS, IT N° 33, 1995).
Discussion: As compared to the waters of the area 1 that are stored in quaternary sediments on Ordovician formations (micaceous siltstones), the composition of the groundwaters of the area 3 is related to the Terti-ary and Cretaceous sediments, that crop out to the west of the area and consist of carbonated rocks and dolomites, red clays, pelites, and of evaporitic gyp-siferous levels. The waters in the southern part of the area belong to a sulphated magnesian- calcic facies (samples Nº3 and 29) whereas the waters in the north-ern part of the area have a sulphated bicarbonated magnesian- calcic facies (samples Nº1, 4, 30 and 39) (CABAS, IT Nº 33, 1995).
En lo que se refiere a la presencia de hierro en las aguas subterráneas de este sector, como en la zona 1 el elemento seguramente proviene de las rocas arcil-losas aflorantes en las proximidades, ricas en hierro, siendo el Eh el parámetro determinante.
Concerning the presence of iron in the groundwaters of this sector, as in area 1 the element probably origi-nates from the outcropping clayey rocks rich in iron in the proximity with the Eh acting as the controlling pa-rameter.
Evaluación Evaluation
Comparando los resultados de este trabajo con las inves-tigaciones hidrogeoquímicas de hace unos 20 años atrás por el proyecto PIRHC (GEOBOL – NN UU, 1978), salta a la vista que la hidroquímica de las aguas subter-ráneas del Valle Central de Cochabamba aparentemente ha cambiado (Fig. 38), siempre que no hayan existido errores sistemáticos durante el análisis.
Comparing the results of this work with the hydrogeo-chemical research of about 20 years ago carried out by the project PIRHC (GEOBOL - UN, 1978), it is appar-ent that the hydrochemistry of the groundwaters of the Central Valley of Cochabamba have changed (Fig. 35), as long as systematic errors during the analysis can be discarded.
El diagrama de PIPER (Fig. 38) insinúa que las carac-terísticas de las aguas se hayan modificado de una facies bicarbonatada y clorurada sódica magnésica a una facies bicarbonatada cálcica magnésica y sódica. Sobre todo llama la atención que la concentración del cloruro en las aguas ha disminuido como también que la concentración del bicarbonato haya subido en los últimos 20 años. Además se puede observar una disminución de las con-centraciones de magnesio y sodio y un incremento de concentración de calcio.
The PIPER diagram (Fig. 35) shows that the character-istics of the waters have changed from a bicarbonated and chloridized sodium magnesic facies to a calcic bi-carbonated magnesic and sodic facies. It is particularly remarkable that the concentration of chloride in the waters has decreased whereas the concentration of the bicarbonate seem to have risen during the last 20 years. Also, a decrease of the concentrations of mag-nesium and sodium and an increase of calcium- con-centration can be observed.
Una explicación posible sería la atribución del cambio de la química a la elevada captación de aguas subter-ráneas en las décadas pasadas. Por el aumento de la ex-plotación se ha ocasionando un descenso considerable del nivel freático, lo que ha causado una disminución del
A possible reason for these changes might be the in-creased groundwater extraction through wells. The drawdown caused by the pumping lead to a forced groundwater circulation, less surface water flow and a
91
caudal de escorrentía superficial y un aumento del flujo subterráneo, por lo que se produciría la dilución de las aguas subterráneas.
dilution of formerly mineralized groundwaters.
7.2 Análisis bacteriológicos 7.2 Bacteriological analyses
En las campañas de muestreo del año 95, también se analizaron las concentraciones de coliformes totales, habiéndose determinado que la concentración de coli-formes en las muestras de pozos excavados es mucho más alta que la de los pozos perforados. Esto puede indicar mayor contaminación por aguas residuales en los niveles someros de los acuíferos, donde la mayoría de los pozos excavados se encuentra. Sin embargo, pozos excavados en general tienden a cargar mayor contaminación que pozos perforados.
The total concentrations of coliforms, analyzed during the sampling campaigns of 1995, showed that the con-tents of coliforms in the samples of excavated wells is much higher than in the perforated wells. This may in-dicate a higher pollution due to waste waters in the shallower aquifers, where most of the excavated wells are located. However, excavated wells generally tend to show a higher contamination than perforated wells.
Las concentraciones de coliformes varían considerable-mente entre los meses de marzo y julio. En la mayoría de los casos (20 muestras de 22), la concentración en julio es mucho más baja que en marzo (Anexo 1). Así en los casos más extremos, la UFC (unidades fecales contadas) en el pozo 138 E baja de 54.000 en marzo a 2 en julio y la concentración de UFC en el pozo 150 E baja de 180.000 a 316. Estas variaciones desde el punto de vista hidrogeológico no tienen una explicación, por lo que se presume que se han cometido errores sistemáticos du-rante el muestreo o durante la determinación en el labo-ratorio. La divergencia de los resultados de análisis de la muestra doble del pozo XX 57 de marzo 95 muestra que durante el análisis de la misma en el laboratorio se pro-ducen errores notables.
The coliform concentrations vary considerably be-tween March and July. In most of the cases (20 sam-ples of 22), the concentration in July is much lower than in March (Annex 1). In the most extreme cases, the CFU (counted fecal units) in the well 138 E de-crease from 54.000 in March to 2 in July and the CFU-concentration in the well 150 E decreases from 180.000 to 316. These variations do not have an ex-planation from the hydrogeological point of view. It might indicate a systematic error during sampling or during analysis in the laboratory. The differences be-tween the results of a double-checked sample analyzed in the same lab make the results questionable. There-fore, it has not been determined, which of the two re-spective results (the high or low concentration) repro-duces the real situation concerning the bacteriological quality of the sampled water.
7.3 Aptitud del agua subterránea para consumo humano y para riego
7.3 Aptitude of the groundwater for human con-sumption and for irrigation
El dictamen sobre la aptitud de las aguas subterráneas analizadas para consumo humano se realizó en base a los valores guías y límites para agua potable de la Organi-zación Mundial de la Salud OMS (Guidelines for Drink-ing-Water Quality - WHO 1992). Según los parámetros analizados én la mayoría de las muestras de las aguas subterráneas del Valle Central de Cochabamba, el único parámetro crítico es UFC. Los otros parámetros anali-zados, con algunas excepciones, por lo general están dentro del rango de los valores límites de la OMS. Por las grandes variaciones en los datos disponibles sobre la contaminacion bacteriológica, resulta indispensable una repetición del muestreo.
The comment on the aptitude of the groundwaters for human consumption is made based on guidelines and limits for drinking water of the World Health Organi-zation WHO (Guidelines for Drinking-Water Quality -WHO 1992). According to the analyzed parameters in most of the groundwater- samples of the Central Val-ley of Cochabamba, the only critical parameter is UFC. The other parameters analyzed, with some ex-ceptions, usually are in the range of the value limits of the WHO. Because of the incertainty about the bacte-riological data, a repetition of the sampling is essen-tial.
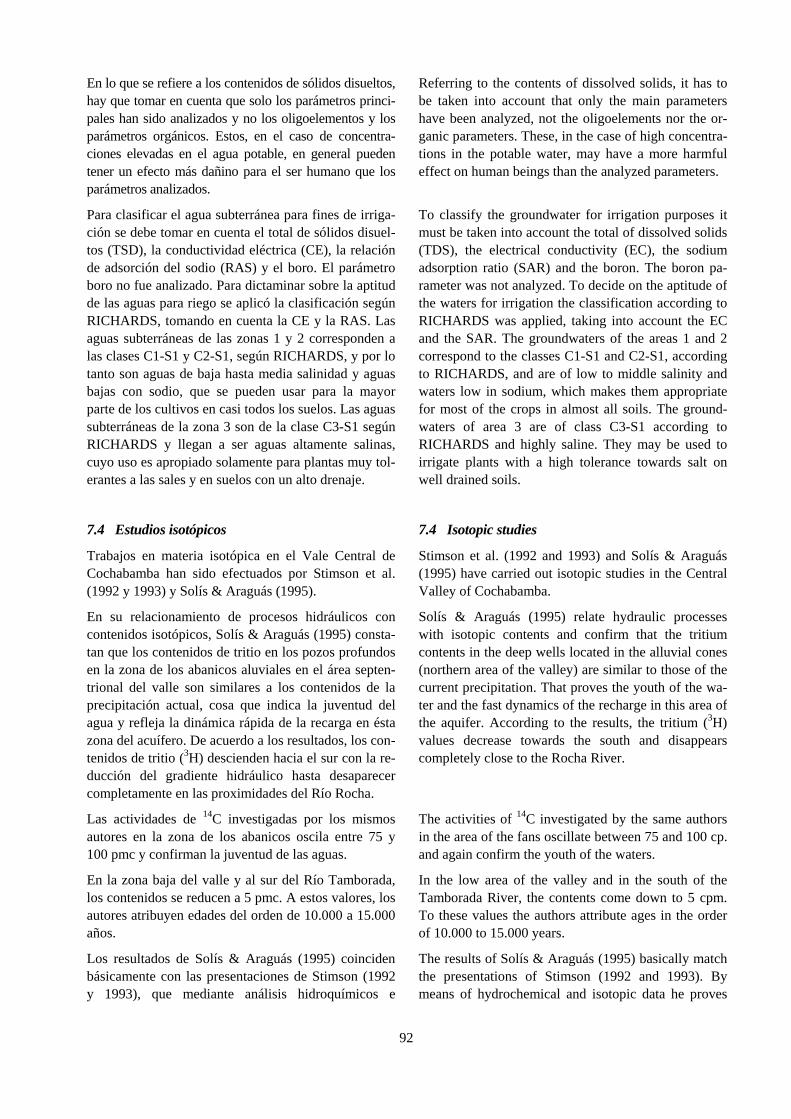
92
En lo que se refiere a los contenidos de sólidos disueltos, hay que tomar en cuenta que solo los parámetros princi-pales han sido analizados y no los oligoelementos y los parámetros orgánicos. Estos, en el caso de concentra-ciones elevadas en el agua potable, en general pueden tener un efecto más dañino para el ser humano que los parámetros analizados.
Referring to the contents of dissolved solids, it has to be taken into account that only the main parameters have been analyzed, not the oligoelements nor the or-ganic parameters. These, in the case of high concentra-tions in the potable water, may have a more harmful effect on human beings than the analyzed parameters.
Para clasificar el agua subterránea para fines de irriga-ción se debe tomar en cuenta el total de sólidos disuel-tos (TSD), la conductividad eléctrica (CE), la relación de adsorción del sodio (RAS) y el boro. El parámetro boro no fue analizado. Para dictaminar sobre la aptitud de las aguas para riego se aplicó la clasificación según RICHARDS, tomando en cuenta la CE y la RAS. Las aguas subterráneas de las zonas 1 y 2 corresponden a las clases C1-S1 y C2-S1, según RICHARDS, y por lo tanto son aguas de baja hasta media salinidad y aguas bajas con sodio, que se pueden usar para la mayor parte de los cultivos en casi todos los suelos. Las aguas subterráneas de la zona 3 son de la clase C3-S1 según RICHARDS y llegan a ser aguas altamente salinas, cuyo uso es apropiado solamente para plantas muy tol-erantes a las sales y en suelos con un alto drenaje.
To classify the groundwater for irrigation purposes it must be taken into account the total of dissolved solids (TDS), the electrical conductivity (EC), the sodium adsorption ratio (SAR) and the boron. The boron pa-rameter was not analyzed. To decide on the aptitude of the waters for irrigation the classification according to RICHARDS was applied, taking into account the EC and the SAR. The groundwaters of the areas 1 and 2 correspond to the classes C1-S1 and C2-S1, according to RICHARDS, and are of low to middle salinity and waters low in sodium, which makes them appropriate for most of the crops in almost all soils. The ground-waters of area 3 are of class C3-S1 according to RICHARDS and highly saline. They may be used to irrigate plants with a high tolerance towards salt on well drained soils.
7.4 Estudios isotópicos 7.4 Isotopic studies
Trabajos en materia isotópica en el Vale Central de Cochabamba han sido efectuados por Stimson et al. (1992 y 1993) y Solís & Araguás (1995).
Stimson et al. (1992 and 1993) and Solís & Araguás (1995) have carried out isotopic studies in the Central Valley of Cochabamba.
En su relacionamiento de procesos hidráulicos con contenidos isotópicos, Solís & Araguás (1995) consta-tan que los contenidos de tritio en los pozos profundos en la zona de los abanicos aluviales en el área septen-trional del valle son similares a los contenidos de la precipitación actual, cosa que indica la juventud del agua y refleja la dinámica rápida de la recarga en ésta zona del acuífero. De acuerdo a los resultados, los con-tenidos de tritio (3H) descienden hacia el sur con la re-ducción del gradiente hidráulico hasta desaparecer completamente en las proximidades del Río Rocha.
Solís & Araguás (1995) relate hydraulic processes with isotopic contents and confirm that the tritium contents in the deep wells located in the alluvial cones (northern area of the valley) are similar to those of the current precipitation. That proves the youth of the wa-ter and the fast dynamics of the recharge in this area of the aquifer. According to the results, the tritium (3H) values decrease towards the south and disappears completely close to the Rocha River.
Las actividades de 14C investigadas por los mismos autores en la zona de los abanicos oscila entre 75 y 100 pmc y confirman la juventud de las aguas.
The activities of 14C investigated by the same authors in the area of the fans oscillate between 75 and 100 cp. and again confirm the youth of the waters.
En la zona baja del valle y al sur del Río Tamborada, los contenidos se reducen a 5 pmc. A estos valores, los autores atribuyen edades del orden de 10.000 a 15.000 años.
In the low area of the valley and in the south of the Tamborada River, the contents come down to 5 cpm. To these values the authors attribute ages in the order of 10.000 to 15.000 years.
Los resultados de Solís & Araguás (1995) coinciden básicamente con las presentaciones de Stimson (1992 y 1993), que mediante análisis hidroquímicos e
The results of Solís & Araguás (1995) basically match the presentations of Stimson (1992 and 1993). By means of hydrochemical and isotopic data he proves
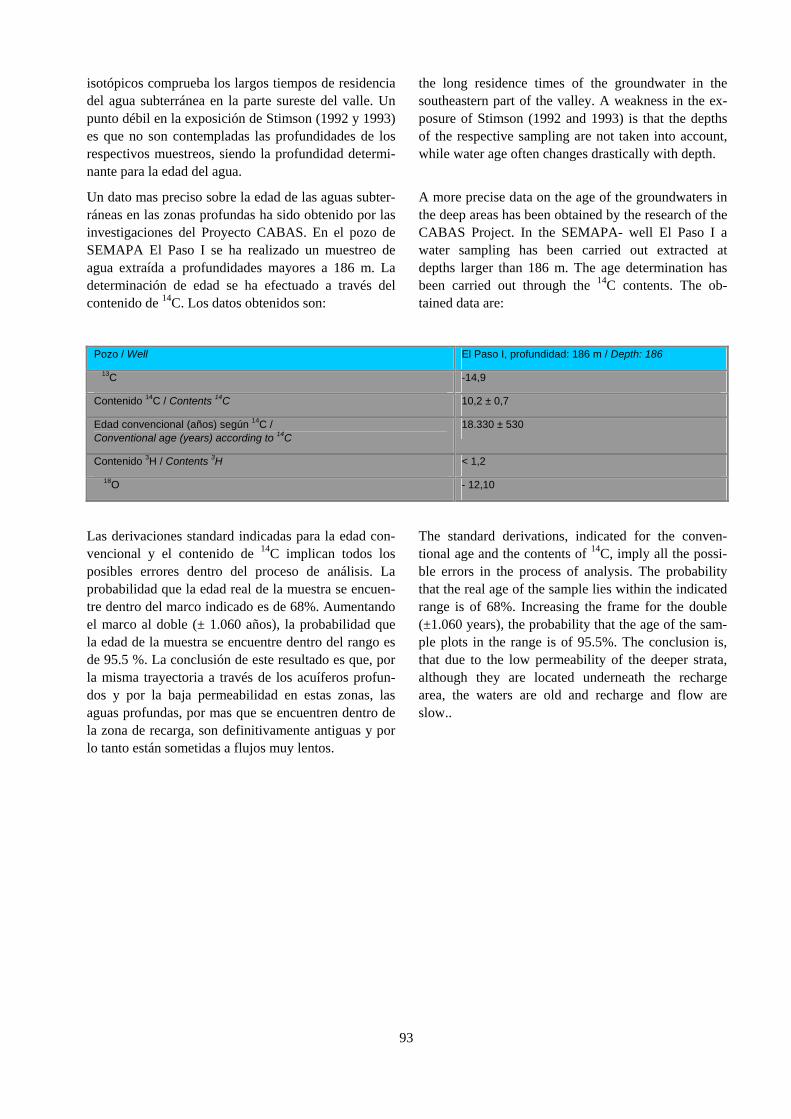
93
isotópicos comprueba los largos tiempos de residencia del agua subterránea en la parte sureste del valle. Un punto débil en la exposición de Stimson (1992 y 1993) es que no son contempladas las profundidades de los respectivos muestreos, siendo la profundidad determi-nante para la edad del agua.
the long residence times of the groundwater in the southeastern part of the valley. A weakness in the ex-posure of Stimson (1992 and 1993) is that the depths of the respective sampling are not taken into account, while water age often changes drastically with depth.
Un dato mas preciso sobre la edad de las aguas subter-ráneas en las zonas profundas ha sido obtenido por las investigaciones del Proyecto CABAS. En el pozo de SEMAPA El Paso I se ha realizado un muestreo de agua extraída a profundidades mayores a 186 m. La determinación de edad se ha efectuado a través del contenido de 14C. Los datos obtenidos son:
A more precise data on the age of the groundwaters in the deep areas has been obtained by the research of the CABAS Project. In the SEMAPA- well El Paso I a water sampling has been carried out extracted at depths larger than 186 m. The age determination has been carried out through the 14C contents. The ob-tained data are:
Pozo / Well El Paso I, profundidad: 186 m / Depth: 186
�13C -14,9
Contenido 14C / Contents 14C 10,2 ± 0,7
Edad convencional (años) según 14C / Conventional age (years) according to 14C
18.330 ± 530
Contenido 3H / Contents 3H < 1,2
� 18O - 12,10
Las derivaciones standard indicadas para la edad con-vencional y el contenido de 14C implican todos los posibles errores dentro del proceso de análisis. La probabilidad que la edad real de la muestra se encuen-tre dentro del marco indicado es de 68%. Aumentando el marco al doble (± 1.060 años), la probabilidad que la edad de la muestra se encuentre dentro del rango es de 95.5 %. La conclusión de este resultado es que, por la misma trayectoria a través de los acuíferos profun-dos y por la baja permeabilidad en estas zonas, las aguas profundas, por mas que se encuentren dentro de la zona de recarga, son definitivamente antiguas y por lo tanto están sometidas a flujos muy lentos.
The standard derivations, indicated for the conven-tional age and the contents of 14C, imply all the possi-ble errors in the process of analysis. The probability that the real age of the sample lies within the indicated range is of 68%. Increasing the frame for the double (±1.060 years), the probability that the age of the sam-ple plots in the range is of 95.5%. The conclusion is, that due to the low permeability of the deeper strata, although they are located underneath the recharge area, the waters are old and recharge and flow are slow..
94
8 MANEJO DEL RECURSO DE AGUAS 8 WATER RESOURCE MANAGEMENT
Agua subterránea actualmente es el recurso de agua de mayor importancia en el Valle de Cochabamba, y lo seguirá siendo hasta que el sistema de captación y trasvase de Misicuni u otro sistema que colecte aguas superficiales en la cordillera comience a operar. El re-curso es limitado y no puede satisfacer toda la de-manda, lo que ya en el pasado ha llevado a intereses incompatibles y conflictos violentos entre sus usuarios.
Groundwater at present is the most important water re-source within the Cochabamba Valley, and it will con-tinue so until Misicuni or another system that collects surface waters from the cordillera starts operating. The groundwater resource is limited and can not satisfy the demand, which in the past has already led to incom-patible interests and violent conflicts between its users.
Un conflicto típico se produce a raíz del descenso del nivel freático ocasionado por la explotación intensa de pozos. Este descenso lleva a la disminución del rendi-miento de pozos cercanos. Siendo pozos particulares en urbanizaciones marginales, no abastecidas por la red pública de aguas, el efecto es un agravamiento de las condiciones de vida y de salud de la población. El descenso del nivel también ha de disminuir la rentabilidad de la producción agrícola que depende de agua para riego de pozos y por lo tanto debilita la base de existencia de una población campesina, produci-endo migración y tensiones sociales. Tanto como efec-tos sociales y de salud, el descenso de niveles puede producir efectos ecológicos como cambios en la vege-tación, drenaje y secamiento de bofedales y en con-secuencia un incremento de la erosión, el deterioro del suelo y el incremento de la vulnerabilidad del recurso contra contaminación.
A typical conflict happens due to the drawdown of wa-ter levels caused by local intense exploitation of wells. This descent leads to the decrease of the yield of neighboring wells. The affected wells often lie within suburbs, low income areas, that are not covered by the public water supply system. Less well yields therefore produce an immediate worsening of living conditions and an increase of health risks of the population. The descent of the level also might lead to a decrease of in-come of the agricultural production that depends on water wells for irrigation. In this way it might weaken the living base of the farmer-population, producing migration and social conflicts. As much as social and health effects, the descent of the levels can cause eco-logical effects, such as changes in the vegetation, draining and drying out wetlands and subsequently in-creases erosion, deterioration of the soil, and an in-crease of the vulnerability of the resource itself against pollution.
Es de esperar que intereses opuestos relacionados al agua se incrementen en el futuro a raíz del incremento de la población en el valle. Para mitigar conflictos y aprovechar el recurso de la forma mas eficiente, es ne-cesario hacerlo de forma planificada, e.d. obedeciendo a un plan de aprovechamiento.
It can be expected that opposed interests related to the water will increase in the future because of the growth of the population in the valley. To mitigate conflicts and use the resource in the most efficient form, it is necessary to do it in a planned manner, i.e. according to an exploitation plan.
El objetivo del plan de aprovechamiento ha de ser el aseguramiento de la disponibilidad de agua subter-ránea en calidad adecuada para los respectivos usos, e.d. el manejo sostenible del recurso de agua.
The goal of the exploitation plan has to be to assure the availability of groundwater at an adequate quality for the respective uses, e.g. the sustainable handling of the water resource.
Un aprovechamiento planificado ha de tomar en cuenta las distintas necesidades - agua potable de mayor y para producción de menor calidad - tanto como los efectos de una explotación del recurso, sean sociales, ecológicos o económicos, ha de priorizar en-tre intereses opuestos y mitigar conflictos que podríansurgir de ellos.
A planned exploitation has to consider the different needs - drinking water of higher quality and for pro-duction of minor quality - as much as the effects of the exploitation of the resource, these being social, eco-logical or economic. Priority has to mitigate conflicts that might be unchained between opposing interests.
95
No todos intereses podrán ser satisfechos mediante una explotación planificada, por lo cual es necesario de-terminar una priorización de necesidades (p.ej. la pri-orización del abastecimiento de la población con agua potable ante la conservación de bofedales) y estrate-gias para evitar o mitigar potenciales conflictos con anticipación (p.ej. incluir las zonas sujetas al descenso de niveles freáticos a la red pública).
Not all interests will be satisfied by a planned exploita-tion. Therefore it is necessary to determine a prioritiza-tion of needs (e.g. the prioritization of the supply to the population with drinking water against the conser-vation of wetlands) and strategies to avoid or mitigate potential conflicts with anticipation (e.g. to include the areas subject to the descent of groundwater levels to the public drinking water supply).
Al mismo tiempo es necesario implementar medidas para la conservación y la protección del recurso. Estas medidas por su parte pueden estar opuestas a intereses de asentamientos industriales y producción agropec-uaria con sus efectos potencialmente contaminantes. De la misma manera, p.ej. el sellamiento de la superfi-cie por asentamientos puede significar un conflicto con la conservación del recurso por disminuir la recarga natural.
At the same time, something has to be done about the conservation and the protection of the resource. The things to be done might be opposed to industrial set-tlements or agricultural production with their poten-tially contaminating effects. Another example is the sealing of the surface by settlements which might lead to a conflict with the necessity to conserve natural re-charge of the resource.
8.1 Aprovechamiento sostenible: Términos gener-ales
8.1 Sustainable use: General terms
Un aprovechamiento sostenible del recurso en base a un plan comprende la extracción de volúmenes con-trolados de aguas del reservorio y la protección del re-curso contra la contaminación.
A sustainable exploitation of the resource according to a plan includes the extraction of controlled volumes of water of the reservoir and the protection of the re-source against pollution.
Cantidad de agua y su aprovechamiento sostenible Quantity of water and its sustainable use
En términos generales, los volúmenes extraídos del acuífero (por bombeo y descarga natural) no deberían superar los volúmenes de recarga. El balance de re-carga y descarga no necesariamente tiene que estar equilibrado en el período de un año. Si hay pronun-ciadas variaciones pluviométricas sobre un período de varios años, los volúmenes explotados pueden repon-erse en el acuífero en años de elevadas precipitaciones como se ha visto en el período representado en la Fig.33.
In general terms, the volumes extracted from the aqui-fer (by pumping and natural discharge) should not sur-pass the volumes of recharge. The balance of recharge and discharge does not necessarily has to match in a year`s period. If there are pronounced pluviometric variations during a period of several years, the ex-tracted volumes can be replaced in the aquifer in years of high rainfalls as it has been seen in the period repre-sented in Fig. 33.
Teóricamente, los regímenes adecuados de explotación pueden ser determinados en base a un balance hídrico que contempla la recarga y descarga natural y artificial en función de parámetros climáticos e hidráulicos.
Theoretically, the adequate regimes of exploitation can be determined based on a hydrologic balance that con-templates the recharge and its natural and artificial discharges taking into account all relevant climatic and hydraulic parameters.
En la práctica, la determinación de los parámetros con exactitud es muy difícil. Especialmente en regiones de fuerte relieve, los parámetros climáticos e de infil-tración pueden variar ampliamente incluso en áreas pequeñas. Así se explican las grandes diferencias entre los balances hídricos de la misma zona elaborados por distintos autores (cap. 6.5).
In reality, the exact determination of the parameters is very difficult. The climatic and infiltration parameters can vary widely even in small areas especially in re-gions with strong relief. The great differences between the hydrologic balances of the same area given by dif-ferent authors can be explained through this (ch. 6.5).
96
Por lo tanto el balance puede ser una base para la planificación. En la práctica las condiciones y los cambios hidráulicos necesitan ser observados contínuamente mediante un sistema de monitoreo que se constituye de un cierto número de pozos de obser-vación. De tal forma, si el nivel es abatido por debajo de lo deseado, los regímenes de bombeo han de ser adaptados y el plan de explotación ha de ser modifi-cado.
Therefore, the balance can be a base for planning process. In practice, the conditions and the hydraulic changes need to be observed continuously through a monitoring system that comprises a certain number of observation wells. That implies that if the level is brought down below the desired point, the pumping regimes have to be adapted and the operating plan has to be modified.
En la actualidad, en el Valle Central, el aprove-chamiento no obedece a un plan que tenga el objetivo de un manejo sostenible. A pesar de ello, el aprove-chamiento del acuífero hasta la actualidad no consti-tuye una sobreexplotación en el sentido de extraer mayores volúmenes que el volumen de recarga. De acuerdo a las mediciones de niveles freáticos efec-tuadas en el marco del Proyecto CABAS, los niveles han disminuido suavemente entre los años 1992 y 1997 y luego recuperado y superado su nivel inicial tras las fuertes precipitaciones en el verano del 96/97.
At present, in the Central Valley, the exploitation does not obey a resource management plan. Nevertheless, the extracted volumes of the aquifer, up to now, do not exceed the recharge volumes. In other words, the aqui-fer is not overexploited. According to the groundwatermonitoring done by CABAS, the levels did slightly decrease between 1992 and 1997 and afterwards re-covered completely with the strong rainfalls in 1996/97.
Calidad de agua y protección del recurso Water quality and resource protection.
La mayor amenaza para un reservorio de aguas subter-ráneas, especialmente si se trata de áreas densamente pobladas, son contaminaciones por actividades indus-triales, agropecuarias y desechos humanos.
The biggest threat for a groundwater reservoir, espe-cially in densely populated areas, is pollution by indus-trial activities, by agriculture and human waste.
Una vez contaminado, es muy difícil recuperar un re-servorio de aguas subterráneas, pues las velocidades de flujo son muy lentas y los tiempos de permanencia pueden variar entre días (sistemas kársticos) y miles de años en grandes sistemas porosos (no tomando en cuenta sistemas con aguas no renovables que pueden contener aguas de millones de años de antigüedad).
Once contaminated, it is very difficult to recover a groundwater reservoir, because the flow velocities are very slow and the times of residence in great porous systems (not taking into account systems with not re-newable waters that can contain waters of millions of years of age) can vary between days (karstic systems) and thousands of years.
Por tanto, áreas de explotación exigen ser protegidas contra la contaminación para garantizar volúmenes de agua de calidad apropiada para el abastecimiento y asegurar la inversión en la construcción del pozo me-diante áreas de protección y restricciones de activi-dades dentro de ellas. Para proteger el reservorio con-tra la contaminación por actividades humanas, es ne-cesario implementar un ordenamiento territorial. Den-tro de un ordenamiento territorial tiene que asignarse áreas apropiadas a actividades potencialmente con-taminantes tanto como áreas protegidas contra la con-taminación para pozos de explotación de aguas subter-ráneas. El área de protección ha de ser una zona en la cual se restringe el uso de la tierra a actividades que no amenazan en forma sustancial al volumen aprovechable del recurso subterráneo.
Therefore, groundwater resource areas demand to be protected against pollution to guarantee water volumes of appropriate quality for the supply and to guarantee the investment for well construction through areas of protection and restrictions of activities. To protect the reservoir against pollution, land use has to obey a regulation of land use. In such a regulation, appropri-ate areas for potentially contaminating activities have to be assigned as much as areas protected against pol-lution of groundwater wells. The protection area has to be an area in which the use of the land is restricted to activities that do not threaten in substantial form the groundwater resources.
97
Debido a la característica filtrante y purificante de los acuíferos, por lo general no se protege toda la superfi-cie del acuífero, sino un área circundante de la zona de explotación. Actividades con mayor potencial de con-taminación han de ser localizadas a mayor distancia de las áreas de explotación que actividades menos amenazantes para la calidad de agua.
Due to the filtering and purifying characteristic of the aquifers, as a rule, not the whole surface of the aquifer, but an area surrounding the exploitation area has to be protected. Activities with major potential of pollution have to be located at a greater distance of the exploita-tion areas than activities that are less threatening for the water quality.
Aparte de esta generalidad, las medidas de protección de las áreas se rigen según la vulnerabilidad del re-curso y del pozo, la cual es determinada por la presen-cia de capas sobreyacientes impermeabilizantes, ve-locidades de flujo en el acuífero y la posición entre área de recarga y área de descarga. El tamaño de las áreas de protección se rige según las velocidades de flujo en el acuífero, su orientación está en función de la dirección de flujo.
Apart from this general delineations, the measures in order to protect the resource have to depend on the vulnerability of the resource and of the well (which is in turn determined by the presence of overlying im-permeable strata), flow velocities in the aquifer and the position between area of recharge and area of dis-charge. The size of the protection area depends on the flow velocities in the aquifer, its orientation depends on the flow direction.
Las medidas de protección deben restringir actividades industriales que emiten materias nocivas (especial-mente si es en forma líquida) o agropecuarias vincula-das al uso de fertilizantes, herbicidas y pesticidas. Tiene que restringirse el transporte de sustancias no-civas en grandes cantidades a través del área de pro-tección.
The measures to protect the resource have to restrict industrial activities that emit noxious matters (espe-cially in liquid phase) or agricultural activities that ap-ply fertilizers, herbicides and pesticides. The transport of noxious substances in great quantities through the protection areas has to be restricted.
8.2 Aprovechamiento sostenible en el Valle Central 8.2 Sustainable use in the Central Valley
Actualmente, las aguas del Valle Central son aprove-chadas indiscriminadamente. Se desconoce el número de pozos de producción y más aún los volúmenes de agua extraídos del acuífero por particulares e indus-trias. Las estimaciones indican números de pozos entre 2.000 y 10.000 en el Valle Central. Es obvio, que no será posible de implementar un plan de manejo del re-curso de aguas, mientras no haya un inventario fiable de pozos y volúmenes de extracción y sobre todo la herramienta legal para fiscalizar la explotación medi-ante pozos.
At present, the waters of the Central Valley are used indiscriminately. The number of operating wells is not known, and even less known are the water volumes extracted from the aquifer by private persons and in-dustries. The estimations indicate numbers of wells be-tween 2.000 and 10.000 in the Central Valley. It is ob-vious that it will not be possible to put into practice a water resource management plan, as long as there is not a reliable inventory of wells and their pumping rates and especially the legal tool to control exploita-tion through wells.
Bolivia hace años está a la espera de una Ley de Aguas. Recién su vigencia y reglamentación ofrecerá la base para un aprovechamiento sostenible del re-curso.
For years, Bolivia is waiting for a waters law. Only an adequate legislation and its implementation will assure a sustainable exploitation of the resource.
Entre las zonas apropiadas para la explotación, la zona septentrional actualmente es la mas explotada por pre-sentar las condiciones mas favorables para la extrac-ción de aguas subterráneas mediante pozos. Almace-nan grandes volúmenes de agua, son altamente perme-ables, permiten altos caudales de explotación y dispo-nen de agua de alta calidad.
Among the appropriate areas for the exploitation, the northern area at present is the best exploited due to its favorable conditions for the extraction of groundwa-ters through wells. Large volumes of water are stored here; the rocks are highly permeable, so they allow high flow rates and have high quality water.
98
Para conservar el recurso, el área de explotación de-bería ser altamente protegida mediante restricciones hacia asentamientos industriales, la emisión de aguas servidas domésticas e industriales y la deposición de desechos domésticos o industriales. Esto es especial-mente importante por ser una zona de alta permeabili-dad vertical y lateral, resultando altamente vulnerable. Un contaminante fácilmente ingresa al acuífero y rápidamente se propaga hacia las captaciones de agua.
To preserve the resource, these areas should be strictly protected through restrictions against industrial settle-ments, the emission of domestic and industrial waste waters and the deposition of domestic or industrial wastes. This is especially important because it is an area of high vertical and lateral permeability, being highly vulnerable. A pollutant easily enters the aquifer and quickly spreads towards the water wells.
Actualmente el aprovechamiento del acuífero en el Valle Central no está acompañado por medidas de pro-tección del acuífero contra contaminación. Ya en la ac-tualidad se pueden observar actividades que tarde o temprano definitivamente llevarán a una degradación de calidad (y por lo tanto de la cantidad disponible) a raíz de actividades humanas.
At present, the exploitation of the aquifer in the Cen-tral Valley is not complemented by measures in order to protect the aquifer against pollution. Already at pre-sent, activities can be observed that sooner or later will definitely lead to a degradation of quality (and there-fore of the available quantity) as a result of human ac-tivities.
En medio pueblo se encuentran basurales, muchas ve-ces a distancias imprudentes de pozos de agua. Se vierten depósitos no seleccionados y no hay control de calidad en los pozos de aguas adyacentes.
Garbage dumps are found in the middle of villages around Cochabamba , many of them at short distance from water wells. Unselected garbage is poured into them and there is no quality control of the waters in the adjacent wells.
Gran parte de los efluvios industriales no son sujetos a control de calidad; no hay información sobre la carga de contaminantes industriales almacenada en el sub-suelo y hay información incompleta sobre los efluvios nocivos arrojados actualmente. Sobre todo las zonas con asentamientos industriales presentan síntomas de fuerte contaminación ambiental como eutrofización de las aguas superficiales en los alrededores de mataderos (p.ej. área de Colcapirhua). Otros contaminantes no producen efectos tan claramente visibles sino exigen análisis hidroquímicos
Many of the industrial effluents are not subject to qual-ity control; there is no information available on the burden of industrial pollutants stored in the under-ground and there is incomplete information on the noxious effluents at present. Especially the areas with industrial settlements show symptoms of strong envi-ronmental pollution as eutrophication of the superficial waters around slaughterhouses (e.g. area of Colcapir-hua). Other pollutants do not cause such clearly visible effects but require hydrochemical analysis.
La zona septentrional, por ofrecer fácil acceso a agua, es también zona de asentamientos industriales ag-ropecuarios como granjas avícolas e invernaderos, cuyas emisiones constituyen una amenaza para la cali-dad de las aguas subterráneas. Los asentamientos de producción industrial en el área septentrional, por ser área de recarga son especialmente críticos, pues si se contamina esta zona, el agua contaminada escurre ha-cia el cauce y la contaminación se propaga a través de todo el acuífero.
The northern area offers easy access to water and therefore became an preferential area for agricultural industry as poultry farms and greenhouses, whose emissions constitute a threat for the quality of the groundwaters. The industrial settlements in the north-ern area are especially critical. It is the recharge area, which means that, if this area is contaminated, the pol-luted water drains towards the Rocha River and the pollution spreads through the whole aquifer.
Un mejoramiento de las condiciones actuales se pro-ducirá recién cuando se implementen las pautas exis-tentes, sobre todo la Reglamentación en Materia de Contaminación Hídrica (del año 1995) de la Ley del Medio Ambiente (año 1992).
An improvement of the current conditions might al-ready be achieved if the existing guidelines, especially the regulation concerning hydric contamination (of 1995) and the environmental law (1992), were put into practice.
99
En términos de protección del recurso de agua contra la contaminación, la Ley del Medio Ambiente ofrece suficiente herramientas legales para controlar y reducir la emisión de contaminantes a los cuerpos de agua. Las competencias y responsabilidades están clara-mente distribuidas entre el Ministerio de Desarrollo Sostenible y Medio Ambiente por un lado y la Prefec-tura por el otro. Incluyen la competencia de “...identificar las fuentes de contaminación...”, “...otorgar permisos de descarga de aguas residuales crudas o tratadas...”, “...ejecutar las acciones de pre-vención de la contaminación de los cuerpos de agua, saneamiento y control de calidad hídrica...”, e incluso de “...aplicar la herramienta del ordenamiento territo-rial...”. Es sobre todo la herramienta del ordenamiento territorial que permitiría un mejoramiento eficaz para el aprovechamiento sostenible del recurso de agua. A través de un ordenamiento territorial debería separarse áreas de explotación y áreas de asentamientos peligro-sos en términos de contaminación del subsuelo.
Referring to protection of the water resource against the pollution, the Law of the Environment offers suffi-cient legal tools to control and reduce the emission of pollutants to the water bodies. The competences and responsibilities are clearly distributed between the Ministry of Sustainable Development and Environ-ment on the one hand and the Prefecture on the other one. It includes the definition of responsibilities to "...identify the pollution sources...", "...issue licenses to emanate raw or treated wastewater...", "...execute the actions of prevention of the pollution of the water bodies, recovery and control of the hydric quality...", and even to "...apply the tool of the territorial law...". Especially the tool of the territorial law would allow for an effective improvement for the sustainable ex-ploitation of the water resource. By means of a territo-rial law, agricultural industry and areas of hazardous settlements, should be separated from groundwater ex-ploiting areas.
La mayor parte de las aguas subterráneas del Valle Central es apta para el consumo humano. Unicamente en las regiones al sureste y suroeste del valle se en-cuentran aguas de salinidades por encima de los límites permisibles para consumo humano.
Most of the groundwaters of the Central Valley aresuitable for the human consumption. Only in the areas in the southeast and southwest of the valley store wa-ters of salinity above permissible limits for human consumption. However, the exploitation is mainly placed in the northern area.
En términos generales, asentamientos industriales y potenciales emisores de materia nociva al subsuelo han de ubicarse hacia el sur del valle por dos razones: (1) En ésta zona, el acuífero se encuentra cubierto y pro-tegido por espesas capas de arcilla y limo contra la rápida infiltración de contaminantes y (2) el sur del valle es la zona de descarga; una eventual contami-nación no afectaría todo el acuífero sino solamente el agua subterráneas flujo abajo hasta su punto de des-carga en el Río Rocha.
In general terms, industrial settlements and potentially hazardous activities to the resources, have to be placed towards the south of the valley for two reasons: (1) In this area, the aquifer is covered and protected by thick strata of clay and mud against the fast infiltration ofpollutants and (2) the south of the valley is the area of discharge; an eventual pollution would not affect the whole aquifer but only the groundwater flow down-wards to its discharge point in the Rocha River.
En todo caso, las aguas residuales tienen que ser sometidas a un tratamiento antes de volver al sistema natural. El tratamiento, resp. el grado de limpieza tiene que estar en función a su procedencia (industrial o doméstica), su grado de contaminación, su posterior uso o su trayecto en el sistema natural.
In any case, the wastewaters have to be submitted to a treatment before returning to the natural system. The treatment or the degree of cleaning respectively has to be according to its origin (industrial or domestic), its degree of pollution, its posterior use or its way in the natural system.

100
En este contexto tambien cae la discusión sobre el pre-cio del agua. El costo real, que contempla el agua como materia reutilizable e incluye el tratamiento del agua para su posterior uso o realimentación al acuífero sin contaminarlo. Este costo obviamente es mucho mayor que el precio actual del agua comercializada en Cochabamba y toda Bolivia, el cual resulta únicamente del costo de bombeo y del mantenimiento y la exten-sión de la infrestructura de distribución. No es muy probable, que el abastecimiento de agua en Bolivia a largo plazo pueda efectuarse sin subvenciones.
At this point, the discussion about water prices has to be raised. The real cost of drinking water, which con-siders water a recyclable substance, has to take into account costs of treatment in order to obtain water, which can be released into the natural system without contaminating it. This real cost obviously is much higher than the current price of the water marketed in Cochabamba and all Bolivia, which results only from the cost of pumping and of the maintenance and the extension of the distribution infrastructure. It is not likely, that on the long run, water suppliers in Bolivia will managed to provide water to the population with-out subventions.
101
9 RESUMEN Y CONCLUSIONES 9 SUMMARY AND CONCLUSIONS
Entre los años 1991 y 2000, los Gobiernos de la Rep-ública de Bolivia y la República Federal de Alemania mantuvieron una cooperación a nivel técnico en mate-ria de aguas subterráneas, formando el “Convenio Alemán – Boliviano de Aguas Subterráneas” (CA-BAS). Los entes ejecutores de la cooperación han sido el Departamento de Hidrogeología del Servicio Na-cional de Geología y Minería (SERGEOMIN) para Bolivia y el Instituto Federal de Geociencias y Recur-sos Naturales (BGR) para Alemania.
Between 1991 and 2000, the Governments of the Re-public of Bolivia and the Federal Republic of Ger-many maintained a technical cooperation on the sub-ject of groundwaters, establishing the "German - Bo-livian Agreement of Groundwaters (Convenio Alemán – Boliviano de Aguas Subterráneas, CABAS). The performing institutions of the cooperation were the Department of Hydrogeology of the National Service of Geology and Mining (SERGEOMIN) for Bolivia and the Federal Institute of Geosciences and Natural Resources (BGR) for Germany.
La cooperación se efectuó con el objetivo de capacitar a personal técnico en la institución boliviana en mate-ria de exploración y alumbramiento de recursos de aguas subterráneas mediante tecnología moderna a través de seminarios y la ejecución conjunta entre per-sonal alemán y boliviano. En la última etapa del proyecto, se agregaron temas relacionados al manejo y a la protección de los recursos de agua.
The cooperation was carried out with the goal of train-ing technical staff in the Bolivian institution at the ex-ploration and capturing of resources of groundwaters using modern technology through seminars and train-ing on the job with German and Bolivian staff. In the last stage of the project, subjects related resource man-agement and protection were added.
Las operaciones de exploración y alumbramiento esta-ban concentradas en el Valle Central de Cochabamba, el Chaco Boliviano, las Pampas de Lequezana al norte de Potosí, la ciudad de Tarija y en el Salar de Uyuni. Entre estas zonas, la más estudiada ha sido la del Valle Central. Mediante la aplicación de variadas tec-nologías de investigación se ha obtenido información que, junto a los trabajos hechos anteriormente por otras instituciones, ha llevado a una imagen detallada del sistema de aguas subterráneas en el Valle Central, cuyas delineaciones principales son resumidas en lo que sigue:
The project operations were concentrated in the Cen-tral Valley of Cochabamba, the Bolivian Chaco, the Pampas de Lequezana in the north of Potosí, the city of Tarija and in the Salar of Uyuni. Among these ar-eas, the most studied has been that of the Central Val-ley. Through the application of different research technologies, information has been obtained that, alongside with the works done previously by other in-stitutions, has lead to a detailed image of the system of groundwaters in the Central Valley, whose main ele-ments are summarized as follows:
El Valle Central de Cochabamba constituye una depre-sión intramontana ubicada en la Cordillera Oriental. Su base se sitúa a aproximadamente 2.500 m s.n.m. y se encuentra circundada por la cordillera, que en la parte septentrional sobrepasa los 5.000 m de altura.
The Central Valley of Cochabamba is an intramoun-tain depression placed in the Eastern Cordillera. Its base is situated at approximately 2.500 m above sea level and it is surrounded by the Cordilleran mountain range, that in the northern part surpasses 5.000 m of altitude.
Es de suponer que la formación del valle comenzó en el Terciario superior. Sin embargo, hasta la fecha no se han alumbrado sedimentos depositados en el Valle Central de esa antigüedad, sino solamente en el Valle de Sacaba, al cual es atribuido una historia compara-ble.
It can be assumed that the formation of the valley started in the Upper Tertiary. However, up to now no sediments of that age have been found deposited in the Central Valley, but only in the Valley of Sacaba, that seem to have a comparable history.
Los depósitos en el valle provienen de la cordillera The deposits in the valley originate from the surround-
102
circundante, han sido desprendidos por procesos de erosión, transportados en los ríos que confluyen hacia el valle y posteriormente depositados en forma de sedimentos fluviales de grano grueso en áreas próxi-mas a los faldeos de la cordillera, de granulometría más fina hacia el centro del valle o en un ambiente lacustre dentro de un lago ubicado en la parte inferior del valle. La extensión de los sedimentos lacustres en el valle central oscilaba de acuerdo a la extensión del lago. Aquella estaba controlada no solamente por fac-tores climáticos sino también muy probablemente por procesos tectónicos: Es de suponer que hasta el Plio-ceno superior existía un lago de gran extensión que, posteriormente, por el hundimiento de un dorsal ubi-cado al noroeste de Vinto, sufrió un desagüe.
ing Cordilleran range, have been removed by proc-esses of erosion, transported within the rivers that con-verge towards the valley and later deposited as coarse grained fluvial sediments in areas next to the slopes of the range, of finer granulometry towards the center of the valley or in an lacustrine environment in a lake lo-cated in the lower part of the valley. The extension of the lacustrine sediments in the central valley oscillated according to the extension of the lake. That was con-trolled not only by climatic factors but also probably by tectonic processes: It is supposed that up to the Up-per Pliocene existed a lake of large extension that, later, due to the collapse of a ridge placed in the northwest of Vinto, suffered a drain.
A consecuencia de la alternación de la extensión del lago, en gran parte del valle se iban depositando sedi-mentos lacustres sobre fluviales y vice versa. Hoy en día, los sedimentos depositados presentan secuencias interdigitadas de unidades lacustres y fluviales, for-mando un gran sistema de acuíferos. De acuerdo a los resultados de investigaciones geofísicas, el espesor de las capas sedimentarias en el valle en la zona septen-trional puede exceder los 1.000 m.
As a result of the alternating extension of the lake, in most of the valley lacustrine sediments were deposited on fluvial ones and vice versa. Nowadays, the depos-ited sediments present interfingering sequences of lacustrine and fluvial units, forming a big system of aquifers. According to the results of geophysical re-search, the thickness of the sedimentary strata in the northern zone of the valley can exceed 1.000 m.
Mientras la precipitación anual en el valle se ubica en-tre 400 y 500 mm, en las alturas de la cordillera suele ser significantemente mayor y llegar hasta 1.300 mm. Parte de esta agua desciende de la cordillera en los ríos que desembocan en los mencionados abanicos fluvia-les. Por su granulometría gruesa, una parte importante de los escurrimientos superficiales y de las precipi-taciones se infiltra en el área de los abanicos.
While the annual precipitation in the valley lies be-tween 400 and 500 mm, in the elevations of the Cor-dilleran range it is usually significantly higher and usually reaches up to 1.300 mm. Part of this water flows off from the range through the rivers that mound into the mentioned fluvial fans. For their coarse granu-lometry, an important part of the surface waters and of the rainfalls infiltrates in the area of the fans.
De ésta zona de recarga, el agua subterránea toma curso hacia la zona baja del valle, en la que se encuen-tra el cauce principal, el Río Rocha.
From this area of recharge, the groundwater takes course towards the low area of the valley, in which the main river bed, the River Rocha is located.
Estudios geoeléctricos efectuados mediante CABAS arrojaron luz sobre la distribución de sedimentos con diferentes características granulométricas e hidráuli-cas. En términos generales, las partes ubicadas en el norte del valle son conformadas mayormente por depósitos de grano grueso, llegando a contener blo-ques de varios metros de diámetro. Con la distancia de los faldeos de la cordillera hacia el sur disminuye el gradiente de los escurrimientos superficiales y en con-secuencia el grosor de los granos de los depósitos. Los depósitos lacustres en el centro del valle disponen de grandes fracciones de limo y arcilla.
Geoelectric studies carried out by CABAS threw light on the distribution of sediments with different granu-lometric and hydraulic characteristics. In general terms, the parts placed in the north of the valley are mainly formed by coarse grained deposits, containing blocks of several meters of diameter with intercalation of mud and sand. Towards the south the grain size of the deposits decreases. The deposits in the center of the valley are mainly lacustrine and have great frac-tions of mud and clay.
Las características granulométricas del sistema de acuíferos están estrechamente relacionadas a sus propiedades hidráulicas. Las áreas exteriores del valle
The granulometric characteristics of the strata are closely related to the hydraulic properties of their aqui-fers. The exterior areas of the valley, whose strata con-
103
disponen de una alta permeabilidad, la cual disminuye hacia el centro.
sist of mainly coarse grains, have a high transmissiv-ity.
Las mayores transmisividades hidráulicas se encuen-tran en una franja en el área septentrional desde el río Payrumani, pasando por El Paso y Tiquipaya hasta la salida del valle en su extremo oriental. La transmisivi-dad disminuye paulatinamente hacia el sur y alcanza su mínimo al sur de Sipe Sipe en el extremo occidental y en el área del aeropuerto en la parte oriental.
The highest hydraulic transmissivity is found in a strip in the northern zone from the Payrumani River, pass-ing El Paso and Tiquipaya towards the entry of the valley at its eastern end. It decreases gradually towards the south and reaches its minimum in the south of Sipe Sipe in the southwestern end and in the area of the air-port in the eastern part.
La parte central y sur del valle está cubierta por una capa arcillosa lo que lleva a un acuífero de carac-terísticas confinadas con pozos y vertientes surgientes. Gran parte de las vertientes naturales en las proximi-dades del Río Rocha han disminuido su caudal o de-jado de existir en las últimas décadas. La disminución del caudal de las fuentes naturales de agua está rela-cionada a la explotación de las aguas subterráneas.
The central and southern part of the valley is covered by a clayey layer that contains an aquifer of confined characteristics with wells and springs. Many of the natural springs in the proximity of the Rocha River have decreased their flow or dried out in the last dec-ades. The decrease of the flow rates is related to the increase of the exploitation of the groundwaters.
La explotación de las aguas subterráneas en el valle ocurre mediante pozos distribuidos sobre todo el área. Los pozos ubicados en la franja septentrional suelen tener los mejores rendimientos en términos de canti-dad.
The exploitation of the groundwaters in the valley oc-curs through wells distributed all over the area. The wells placed in the northern strip usually have the best yields in terms of quantity.
La calidad de las aguas subterráneas varía en el área del valle pero por lo general cumple con los requisitos de la aptitud para consumo humano. Se constatan diferencias de calidad entre aguas subterráneas de la zona septentrional / central / occidental, la zona en el sureste del valle y aquella en el suroeste.
The quality of the groundwaters varies in the area of the valley but normally complies with the require-ments of aptitude for human consumption. Differences can be observed as to the quality between the ground-waters of the northern / central / western zone, the area in the southeast of the valley and that in the southwest.
Las aguas de la zona septentrional / central / occidental tienen baja mineralización, lo que puede atribuirse a las altas velocidades de flujo y la poca edad de las aguas (por ser zona de recarga de alta permeabilidad). Sus características hidroquímicas varían pero por lo general muestran características bicarbonatadas-calcio-magnésicas.
The waters of the northern / central zone have low mineralization, which can be attributed to the high flow velocities and the little age of the waters (because its a zone of recharge and of high permeability). Their hydrochemical characteristics vary, but usually they show bicarbonated calcio-magnesium characteristics.
Las aguas en la zona sur-oriental tienen una facies bi-carbonatada sódica. En parte muestra conductividades altas, lo que no se considera representativo por haberse detectado en pozos excavados. El agua, tanto como en la zona norte por lo general es potable.
The waters in the south-eastern zone have a bicarbon-ated sodium facies. Partially it shows high conductiv-ity. The representativity of the samples, however, can be questioned because they originate from excavated wells. The water in the northern area is usually potable.
Por último, en la zona sur-occidental las aguas oscilan entre características sulfatada-magnésico-cálcicas y bicarbonatada-sulfatada-calcio-magnésicas. Las con-ductividades resp. las cargas iónicas son claramente mas elevadas que en la zona norte y en un punto de análisis sobrepasa los 1700 �S/cm.
In the south-western zone the waters oscillate between sulphated-magnesia-calcic and bicarbonated-sulphated-calcium-magnesia characteristics. The con-ductivities and the ionic loads are clearly higher than in the northern zone.
El sistema de aguas subterráneas en el Valle Central presenta un rico reservorio de agua dulce, que hasta el presente constituye la fuente de agua más importante
The groundwater system in the Central Valley presents a rich reservoir of fresh water, which still constitutes the most important water source for human consump-
104
para consumo humano y para riego. Por presentar las mejores propiedades hidráulicas e hidroquímicas, la zona norte del valle se ha establecido como zona pref-erencial de explotación.
tion and for irrigation. The northern area of the valley presents the best hydraulic and hydrochemical proper-ties and has been established as a preferential pumping area.
Hasta el día de hoy, el acuífero se ha aprovechado sin que muestre síntomas de deterioro a gran escala. Sin embargo es de suponer, que con el esperado cre-cimiento poblacional, la demanda aumentará sobre el rendimiento del recurso de aguas subterráneas. Para evitar el deterioro por daños que difícilmente son remediables, resulta recomendable aprovechar los re-cursos de forma ordenanda mediante un plan de explo-tación.
Until today, the aquifer has been used without showing symptoms of deterioration at a large scale. However, it has to be supposed that with the expected population growth, the demand will increase above the yield of the groundwater resource. To avoid the deterioration by damages that can hardly be remediated, it is rec-ommendable to make use of the resources in a regu-lated way using an operating plan.
En este sentido y para concluir este texto, vale reiterar la necesidad de un marco regulatorio y una entidad que fiscalize los reglamentos para llegar a un aprove-chamiento sostenible de los recursos de aguas subter-ráneas.
In this sense and in order to conclude this text, it is important to mention again the need for a regulatory framework and an entity that controls the norms to reach a sustainable exploitation of the groundwater re-sources.
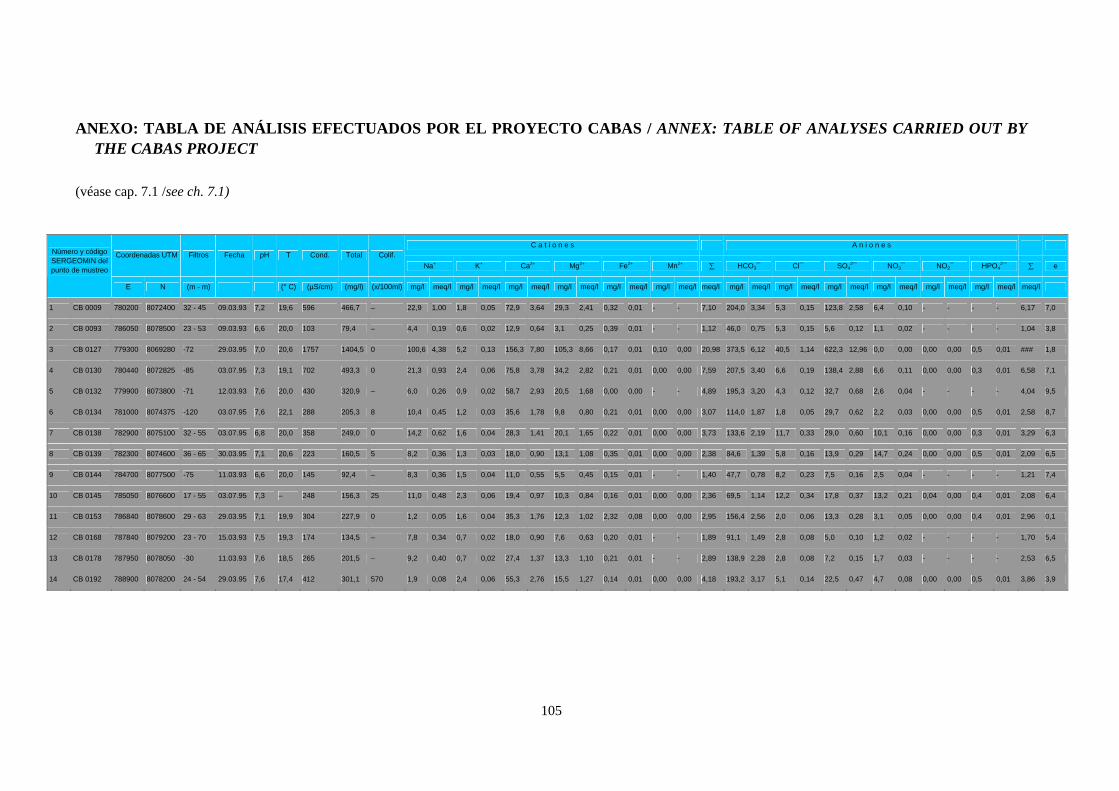
105
ANEXO: TABLA DE ANÁLISIS EFECTUADOS POR EL PROYECTO CABAS / ANNEX: TABLE OF ANALYSES CARRIED OUT BY THE CABAS PROJECT
(véase cap. 7.1 /see ch. 7.1)
C a t i o n e s A n i o n e s Coordenadas UTM Filtros Fecha pH T Cond. Total Colif.
Na+ K+ Ca2+ Mg2+ Fe2+ Mn2+ HCO3¯ Cl¯ SO42¯ NO3¯ NO2¯ HPO4
2¯ e
Número y código SERGEOMIN del punto de mustreo
E N (m - m) (° C) (µS/cm) (mg/l) (x/100ml) mg/l meq/l mg/l meq/l mg/l meq/l mg/l meq/l mg/l meq/l mg/l meq/l meq/l mg/l meq/l mg/l meq/l mg/l meq/l mg/l meq/l mg/l meq/l mg/l meq/l meq/l
1 CB 0009 780200 8072400 32 - 45 09.03.93 7,2 19,6 596 466,7 – 22,9 1,00 1,8 0,05 72,9 3,64 29,3 2,41 0,32 0,01 - - 7,10 204,0 3,34 5,3 0,15 123,8 2,58 6,4 0,10 - - - - 6,17 7,0
2 CB 0093 786050 8078500 23 - 53 09.03.93 6,6 20,0 103 79,4 – 4,4 0,19 0,6 0,02 12,9 0,64 3,1 0,25 0,39 0,01 - - 1,12 46,0 0,75 5,3 0,15 5,6 0,12 1,1 0,02 - - - - 1,04 3,8
3 CB 0127 779300 8069280 -72 29.03.95 7,0 20,6 1757 1404,5 0 100,6 4,38 5,2 0,13 156,3 7,80 105,3 8,66 0,17 0,01 0,10 0,00 20,98 373,5 6,12 40,5 1,14 622,3 12,96 0,0 0,00 0,00 0,00 0,5 0,01 ### 1,8
4 CB 0130 780440 8072825 -85 03.07.95 7,3 19,1 702 493,3 0 21,3 0,93 2,4 0,06 75,8 3,78 34,2 2,82 0,21 0,01 0,00 0,00 7,59 207,5 3,40 6,6 0,19 138,4 2,88 6,6 0,11 0,00 0,00 0,3 0,01 6,58 7,1
5 CB 0132 779900 8073800 -71 12.03.93 7,6 20,0 430 320,9 – 6,0 0,26 0,9 0,02 58,7 2,93 20,5 1,68 0,00 0,00 - - 4,89 195,3 3,20 4,3 0,12 32,7 0,68 2,6 0,04 - - - - 4,04 9,5
6 CB 0134 781000 8074375 -120 03.07.95 7,6 22,1 288 205,3 8 10,4 0,45 1,2 0,03 35,6 1,78 9,8 0,80 0,21 0,01 0,00 0,00 3,07 114,0 1,87 1,8 0,05 29,7 0,62 2,2 0,03 0,00 0,00 0,5 0,01 2,58 8,7
7 CB 0138 782900 8075100 32 - 55 03.07.95 6,8 20,0 358 249,0 0 14,2 0,62 1,6 0,04 28,3 1,41 20,1 1,65 0,22 0,01 0,00 0,00 3,73 133,6 2,19 11,7 0,33 29,0 0,60 10,1 0,16 0,00 0,00 0,3 0,01 3,29 6,3
8 CB 0139 782300 8074600 36 - 65 30.03.95 7,1 20,6 223 160,5 5 8,2 0,36 1,3 0,03 18,0 0,90 13,1 1,08 0,35 0,01 0,00 0,00 2,38 84,6 1,39 5,8 0,16 13,9 0,29 14,7 0,24 0,00 0,00 0,5 0,01 2,09 6,5
9 CB 0144 784700 8077500 -75 11.03.93 6,6 20,0 145 92,4 – 8,3 0,36 1,5 0,04 11,0 0,55 5,5 0,45 0,15 0,01 - - 1,40 47,7 0,78 8,2 0,23 7,5 0,16 2,5 0,04 - - - - 1,21 7,4
10 CB 0145 785050 8076600 17 - 55 03.07.95 7,3 – 248 156,3 25 11,0 0,48 2,3 0,06 19,4 0,97 10,3 0,84 0,16 0,01 0,00 0,00 2,36 69,5 1,14 12,2 0,34 17,8 0,37 13,2 0,21 0,04 0,00 0,4 0,01 2,08 6,4
11 CB 0153 786840 8078600 29 - 63 29.03.95 7,1 19,9 304 227,9 0 1,2 0,05 1,6 0,04 35,3 1,76 12,3 1,02 2,32 0,08 0,00 0,00 2,95 156,4 2,56 2,0 0,06 13,3 0,28 3,1 0,05 0,00 0,00 0,4 0,01 2,96 0,1
12 CB 0168 787840 8079200 23 - 70 15.03.93 7,5 19,3 174 134,5 – 7,8 0,34 0,7 0,02 18,0 0,90 7,6 0,63 0,20 0,01 - - 1,89 91,1 1,49 2,8 0,08 5,0 0,10 1,2 0,02 - - - - 1,70 5,4
13 CB 0178 787950 8078050 -30 11.03.93 7,6 18,5 265 201,5 – 9,2 0,40 0,7 0,02 27,4 1,37 13,3 1,10 0,21 0,01 - - 2,89 138,9 2,28 2,8 0,08 7,2 0,15 1,7 0,03 - - - - 2,53 6,5
14 CB 0192 788900 8078200 24 - 54 29.03.95 7,6 17,4 412 301,1 570 1,9 0,08 2,4 0,06 55,3 2,76 15,5 1,27 0,14 0,01 0,00 0,00 4,18 193,2 3,17 5,1 0,14 22,5 0,47 4,7 0,08 0,00 0,00 0,5 0,01 3,86 3,9
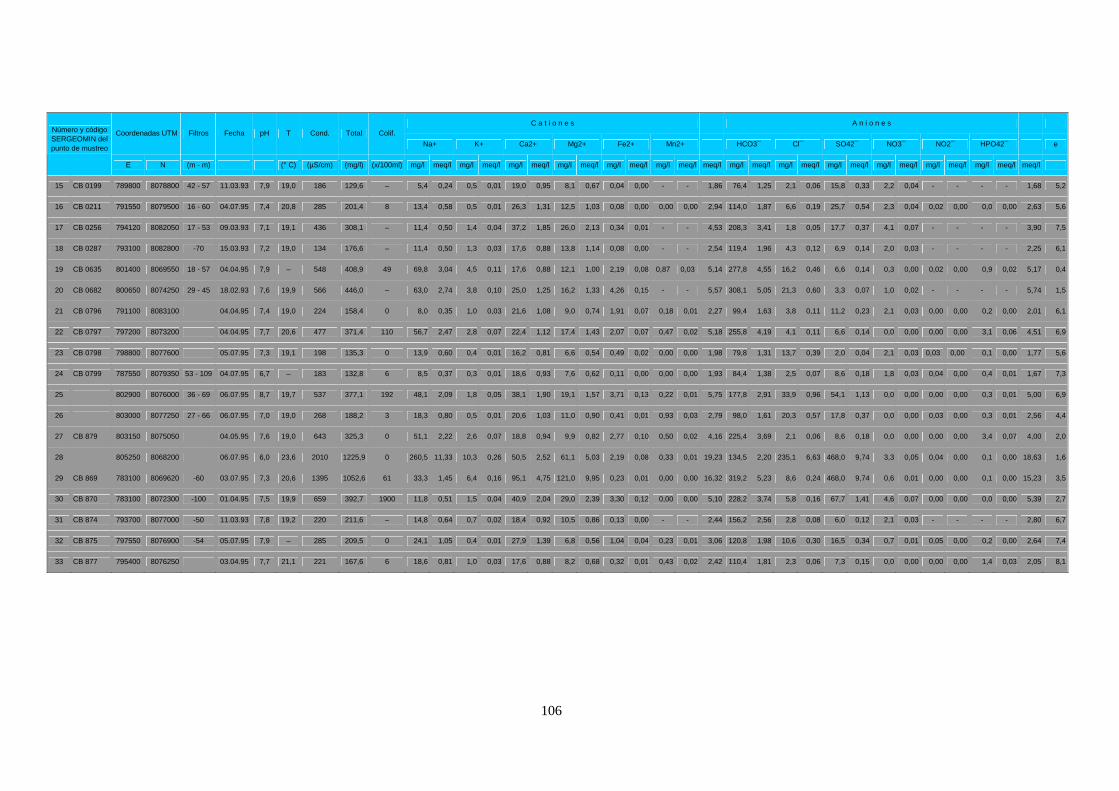
106
C a t i o n e s A n i o n e s Coordenadas UTM Filtros Fecha pH T Cond. Total Colif.
Na+ K+ Ca2+ Mg2+ Fe2+ Mn2+ � HCO3¯ Cl¯ SO42¯ NO3¯ NO2¯ HPO42¯ � e
Número y código SERGEOMIN del punto de mustreo
E N (m - m) (° C) (µS/cm) (mg/l) (x/100ml) mg/l meq/l mg/l meq/l mg/l meq/l mg/l meq/l mg/l meq/l mg/l meq/l meq/l mg/l meq/l mg/l meq/l mg/l meq/l mg/l meq/l mg/l meq/l mg/l meq/l meq/l
15 CB 0199 789800 8078800 42 - 57 11.03.93 7,9 19,0 186 129,6 – 5,4 0,24 0,5 0,01 19,0 0,95 8,1 0,67 0,04 0,00 - - 1,86 76,4 1,25 2,1 0,06 15,8 0,33 2,2 0,04 - - - - 1,68 5,2
16 CB 0211 791550 8079500 16 - 60 04.07.95 7,4 20,8 285 201,4 8 13,4 0,58 0,5 0,01 26,3 1,31 12,5 1,03 0,08 0,00 0,00 0,00 2,94 114,0 1,87 6,6 0,19 25,7 0,54 2,3 0,04 0,02 0,00 0,0 0,00 2,63 5,6
17 CB 0256 794120 8082050 17 - 53 09.03.93 7,1 19,1 436 308,1 – 11,4 0,50 1,4 0,04 37,2 1,85 26,0 2,13 0,34 0,01 - - 4,53 208,3 3,41 1,8 0,05 17,7 0,37 4,1 0,07 - - - - 3,90 7,5
18 CB 0287 793100 8082800 -70 15.03.93 7,2 19,0 134 176,6 – 11,4 0,50 1,3 0,03 17,6 0,88 13,8 1,14 0,08 0,00 - - 2,54 119,4 1,96 4,3 0,12 6,9 0,14 2,0 0,03 - - - - 2,25 6,1
19 CB 0635 801400 8069550 18 - 57 04.04.95 7,9 – 548 408,9 49 69,8 3,04 4,5 0,11 17,6 0,88 12,1 1,00 2,19 0,08 0,87 0,03 5,14 277,8 4,55 16,2 0,46 6,6 0,14 0,3 0,00 0,02 0,00 0,9 0,02 5,17 0,4
20 CB 0682 800650 8074250 29 - 45 18.02.93 7,6 19,9 566 446,0 – 63,0 2,74 3,8 0,10 25,0 1,25 16,2 1,33 4,26 0,15 - - 5,57 308,1 5,05 21,3 0,60 3,3 0,07 1,0 0,02 - - - - 5,74 1,5
21 CB 0796 791100 8083100 04.04.95 7,4 19,0 224 158,4 0 8,0 0,35 1,0 0,03 21,6 1,08 9,0 0,74 1,91 0,07 0,18 0,01 2,27 99,4 1,63 3,8 0,11 11,2 0,23 2,1 0,03 0,00 0,00 0,2 0,00 2,01 6,1
22 CB 0797 797200 8073200 04.04.95 7,7 20,6 477 371,4 110 56,7 2,47 2,8 0,07 22,4 1,12 17,4 1,43 2,07 0,07 0,47 0,02 5,18 255,8 4,19 4,1 0,11 6,6 0,14 0,0 0,00 0,00 0,00 3,1 0,06 4,51 6,9
23 CB 0798 798800 8077600 05.07.95 7,3 19,1 198 135,3 0 13,9 0,60 0,4 0,01 16,2 0,81 6,6 0,54 0,49 0,02 0,00 0,00 1,98 79,8 1,31 13,7 0,39 2,0 0,04 2,1 0,03 0,03 0,00 0,1 0,00 1,77 5,6
24 CB 0799 787550 8079350 53 - 109 04.07.95 6,7 – 183 132,8 6 8,5 0,37 0,3 0,01 18,6 0,93 7,6 0,62 0,11 0,00 0,00 0,00 1,93 84,4 1,38 2,5 0,07 8,6 0,18 1,8 0,03 0,04 0,00 0,4 0,01 1,67 7,3
25 802900 8076000 36 - 69 06.07.95 8,7 19,7 537 377,1 192 48,1 2,09 1,8 0,05 38,1 1,90 19,1 1,57 3,71 0,13 0,22 0,01 5,75 177,8 2,91 33,9 0,96 54,1 1,13 0,0 0,00 0,00 0,00 0,3 0,01 5,00 6,9
26 803000 8077250 27 - 66 06.07.95 7,0 19,0 268 188,2 3 18,3 0,80 0,5 0,01 20,6 1,03 11,0 0,90 0,41 0,01 0,93 0,03 2,79 98,0 1,61 20,3 0,57 17,8 0,37 0,0 0,00 0,03 0,00 0,3 0,01 2,56 4,4
27 CB 879 803150 8075050 04.05.95 7,6 19,0 643 325,3 0 51,1 2,22 2,6 0,07 18,8 0,94 9,9 0,82 2,77 0,10 0,50 0,02 4,16 225,4 3,69 2,1 0,06 8,6 0,18 0,0 0,00 0,00 0,00 3,4 0,07 4,00 2,0
28 805250 8068200 06.07.95 6,0 23,6 2010 1225,9 0 260,5 11,33 10,3 0,26 50,5 2,52 61,1 5,03 2,19 0,08 0,33 0,01 19,23 134,5 2,20 235,1 6,63 468,0 9,74 3,3 0,05 0,04 0,00 0,1 0,00 18,63 1,6
29 CB 869 783100 8069620 -60 03.07.95 7,3 20,6 1395 1052,6 61 33,3 1,45 6,4 0,16 95,1 4,75 121,0 9,95 0,23 0,01 0,00 0,00 16,32 319,2 5,23 8,6 0,24 468,0 9,74 0,6 0,01 0,00 0,00 0,1 0,00 15,23 3,5
30 CB 870 783100 8072300 -100 01.04.95 7,5 19,9 659 392,7 1900 11,8 0,51 1,5 0,04 40,9 2,04 29,0 2,39 3,30 0,12 0,00 0,00 5,10 228,2 3,74 5,8 0,16 67,7 1,41 4,6 0,07 0,00 0,00 0,0 0,00 5,39 2,7
31 CB 874 793700 8077000 -50 11.03.93 7,8 19,2 220 211,6 – 14,8 0,64 0,7 0,02 18,4 0,92 10,5 0,86 0,13 0,00 - - 2,44 156,2 2,56 2,8 0,08 6,0 0,12 2,1 0,03 - - - - 2,80 6,7
32 CB 875 797550 8076900 -54 05.07.95 7,9 – 285 209,5 0 24,1 1,05 0,4 0,01 27,9 1,39 6,8 0,56 1,04 0,04 0,23 0,01 3,06 120,8 1,98 10,6 0,30 16,5 0,34 0,7 0,01 0,05 0,00 0,2 0,00 2,64 7,4
33 CB 877 795400 8076250 03.04.95 7,7 21,1 221 167,6 6 18,6 0,81 1,0 0,03 17,6 0,88 8,2 0,68 0,32 0,01 0,43 0,02 2,42 110,4 1,81 2,3 0,06 7,3 0,15 0,0 0,00 0,00 0,00 1,4 0,03 2,05 8,1
107
REFERENCIAS / REFERENCES
Bibliografía / Bibliography
AHLFELD, F. (1970): Zur Tektonik des andinen Bolivien. Geol. Rdsch., 59 (3), pp. 1124-1140, Stuttgart
AHLFELD, F. (1972): Geología de Bolivia. 190 pp., Ed. Los Amigos del Libro, La Paz – Cochabamba
AHLFELD, F. (1973): Geografía Física de Bolivia. Enciclopedia Boliviana, 16, Ed. Los Amigos del Libro, La Paz – Cochabamba
ARGOLLO, J., FOURNIER, M., SERVANT, M. (1987): Dépots fluviatiles en Bolivie, variations du regime des ecoulements au cours du Quaternaire recent. - Seminario 'Paleolacs-Paleoclimats', ORSTOM, Bondy, 29-30.1.987, p.19-23
ARGOLLO, J., GOUZE, P., SALIEGE, J.F., SERVANT, M. (1987): Fluctuations des glaciers de Bolivie au Quater-naire recent. - Seminario ' Paleolacs-Paleoclimats', ORSTOM, Bondy, 29.30.1.1987, p. 15-17
BALLIVIAN, O., BLES, J.L., SERVANT, M. (1978): El Plio-Cuaternario de la región de La Paz (Andes orientales, Bolivia). Cah. O.R.S.T.O.M., sér. géol., 10 (1): 101-114
BALLON-AYLLON, R., RÖSSLING, R., AVILA-SALINAS, W. (1997): Geología de la Hoja Cochabamba 1:250.000, en: Troëng, B. and Riera-Kilibarda, C, eds.: Mapas temáticos de recursos minerales de Bolivia, Hoja Cochabamba, Memoria Explicativa, Boletín del Servicio Nacional de Geología y Minería (SERGEOMIN), Nº12, p. 27-50.
BARTH, W. (1972): Die geowissenschaftliche Literatur Boliviens in den Jahren 1960 – 1971: Ein Überblick. Zbl. Geol. Paleontol., 1(1/2): pp. 100-130, Stuttgart
BOYLE ENGINEERING: (1973): Investigaciones adicionales de aguas subterráneas para la ciudad de Cocha-bamba, segundo campo de pozos
BRGM – SEURECA (1990): Evaluación de los recursos de agua y abastecimiento de agua potable de la ciudad de Cochabamba, Bolivia – Programa del Banco Mundial PPF-444-Bo
CLAPPERTON, C.M., (1979): Glaciation in Bolivia before 3.27 Myr. Nature, 277: pp. 375-376
CLINTON BOGERT ASSOCIATES INTERNATIONAL (1976). Revisión de las condiciones hidrogeológicas del campo de pozos de Coña Coña, Cochabamba – Bolivia
CONSULTORA NACIONAL (CONNAL S.R.L.) (1990): Evaluación de los recursos hídricos subterráneos de la subcuenca de Quillacollo
CONSULTORES GALINDO LTDA, PROYECTO QUILLACOLLO (1994): Fuentes de aprovisionamiento de agua potable. Situación actual del campo de pozos diseñado por CONNAL S.R.L.
COLQUE, G. (1998): Mapa hidrogeológico del Vale Central de Cochabamba, Esc. 1:75.000. Tésis de grado, Univ. Técnica de Oruro
CPM – CONANDINA (1993): Estudio hidrogeológico de la zona de Vinto, para la determinación de fuentes de aprovisionamiento de agua potable
DELGADILLO, E., PINTO, A. (1970): Prospección geofísica de resistividad para aguas subterráneas del Valle de Cochabamba. - La Paz, 23 pp.
108
DOBROVOLNY, E. (1962): Geología del Valle de La Paz. Ministerio de Minas y Petróleo, Departamento Nacional de Geología, Boletín Nº3
DRESCH, J. (1958): Problèmes morphologiques des Andes Centrales. Annales de Géogr., 360: pp. 130-151
ELLERT, N, SANCHEZ, C., RICALDI, V., ANAYA, L. (1992): Levantamiento geofísico del abanico de El Paso. Compendio de ponencias del Primer Congreso Hidrogeológico Latinoamericano, Mérida, Venezuela.
FAO-UNESCO (1988): Soil map of the world. - Revised Legend, 119 pp., Roma
FINSTERWALDER, R., JORDAN, E. (1989): Begleitworte zur Karte Cordillera Real Nord (Illampu) 1:50000 – Ein Beitrag zur kartographischen darstellung sowie Glaziologie und Gletschergeschichte der bolivianischen Anden. Erdkunde, 43: pp. 36-50
FURRER, G., GRAF, K. (1978): Die subnivale Höhenstufe am Kilimandjaro und in den Anden Boliviens und Ecua-dors. Erdwiss. Forschung, 11: pp. 441-457
GOUZE, M.P. (1987): La cordillère orientale de Bolivie: glaciations Plio-Pleisticenes, essai de paleohydrologie (30.000 ans B.P. – actuel) d’après les oscillations des glacières et la composition isotopique des macrorestes vegetaux. Tésis de grado, Université de Paris, Centre d’Orsai, 173 pp.
GOUZE, M.P., ARGOLLO, J., SALIEGE, J.-F., SERVANT, M. (1996): Interprétacion paléoclimatique des oscilla-tions des glacières au cours des 20 derniers millénaires dans les régions tropicales: exemple des Andes bo-liviennes. C.R. Acad. Sc. Paris, Série II (3): pp. 219-223
GOUZES, R., DELPONT, G. (1990): Evaluación de los recursos de agua y abastecimiento en agua potable de la ciudad de Cochabamba, Bolivia. - BRGM/SEURECA
GRAF, K. (1981): Palynological investigations of two post-glacial peat-bogs near the boundary of Bolivia and Peru. - Journal of Biogeography, 6
GRAF, K. (1983): A quaternary pollen-profilefrom the upper valley of Cochabamba (Bolivia). In: EVENSON et al. (publ.): Tills and related deposits, Rotterdamm, pp. 365-372
GROSJEAN, M., MESSERLI, B., SCHREIER, H. (1991): Seenhochstände, Bodenbildung und Verglätscherung im Altiplano Nordchiles: Ein interdisziplinärer beitrag zur Klimageschichte der Atacama. Erste Resultate. Bamber-ger geogr. Schriften, 11, pp. 99-108
HASTENRATH, S., KUTZENBACH, J. (1985): Late Pleistocene climate and water budget of the South American Altiplano. Quat. Res., 24, pp. 249-256
HOECK, H., STEINMANN, G. (1906): Erläuterungen zur Routenkarte der Expedition Steinmann, Hoeck v. Bistram in den Anden von Bolivien 1903/04. Peterm. Geogr. Mitt., 52, pp. 1-13 y 25-32
INGENIERIA GLOBAL, DEUTSCHE PROJECT UNION (1965): Recomendaciones para una captación de agua subterránea para pozos de tubos en la región de Vinto para el abastecimiento de agua potable de la ciudad de Cochabamba, Bolivia
JORDAN, J. (1967): Estudio geológico de la región de Cochabamba, Tésis de grado, UMSA, La Paz
JORDAN, L. (1992): Sobreexplotación y procesos de contaminación en la cuenca de Cochabamba. en: Recursos hídri-cos en Bolivia y su dimensión ambiental, AGID Geoscien. Ser. 20
KENNAN, L., LAMB, S., RUNDLE, C. (1995): K-Ar datesfrom the Altiplano and the Cordillera Oriental of Bolivia: Implications for Cenozoic stratigraphy and tectonics. Journal of South American Earth Sciences, Vol. 8 (2), p. 163-186.
LAUER, W., RAFIQPOOR, M.D. (1986): Die jungpleistzäne Vergletscherung der Apolobanba-Kordillere (Bolivien). Erdkunde, 40, pp. 125-145
LAUER, W., RAFIQPOOR, M.D. (1989): Zum Stand der Pleistzänforschung in der nordöstlichen Kordillere von Bo-livien. Erdkunde, 43, pp. 228-231
109
MANSILLA L., W. (1979): Geoología del Plio-Cuaternario de la cuenca de Sacaba Cochabamba. - Tesis de Grado, UMSA, La Paz, 54 pp.
MERCADO CONSULTANTS, HYDROGEOLOGY & ENVIROMENTAL QUALITY, RISHON - LEZION, IS-RAEL (1996): Consultores Doctores Abraham Mercado & Haim Michelson, Evaluación preliminar de recur-sos de agua subterránea en el valle Alto y de estimaciones previas del potencial de agua subterránea en el valle de Cochabamba
MÜLLER, R. (1985): Zur Gletschergeschichte in der Cordillera Quimiza Cruz, Bolivien. Tésis de grado, Zürich, Suiza
MUÑOZ REYES, J. (1980): Geografía de Bolivia. La Paz, 478 pp.
NOGAMI, M. (1976): Altitude of the modern snowline and the pleistocene snowline in the Andes. Geog. Reports of Tokyo Metropolitan Univ., 11, pp. 71-86
PROYECTO INTEGRADO DE RECURSOS HÍDRICOS EN COCHABAMBA (PIRHC) (GEOBOL-NNUU) (1987): Investigaciones de aguas subterráneas en las cuencas de Cochabamba, Informe técnico
PURPER, I., PINTO, I.D. (1980): Interglacial ostracodes from Wasa-Mayu, Bolivia. Pesquisas, 13, pp. 161-184, Porto Alegre
SCHABITZ, F., STINGL, H., VEIT, H.: Jungquartäre Landschaftsentwicklung und Klimageschichte beiderseits der Ariden Diagonale Südamerikas. - Bamberger Geogr. Schriften, 11: 369-373
SELZER, G.O. (1990): Recent glacial history and paleoclimate of the Peruvian-Bolivian Andes. Quat. Science Rev., 9, pp. 137-152
SERVANT, M. (1977): El cuadro estratigráfico del Plio-Cuaternario del Altiplano de los Andes tropicales de Bo-livia. Rev. De Geoc., 9, pp. 23-29, UMSA, La Paz,
SERVANT, M., FONTES, J.C. (1978): Les lacs quaternaires des hauts plateaux des Andes boliviennes. Premières in-terprétations paléoclimatiques. Cah. O.R.S.T.O.M., sér. Géol., 10(1):9-24
SERVANT, M et al. (1981): variation du régime et de la naturedes précipitacions au cours des 15 derniers millenaires dans les Andes de Bolivie. C. R. Acad. Sc. Paris, 292(II): pp. 1209-1212
SEURECA–BRGM–SOGREAH–CGL (1994): Plan maestro para el abastecimiento de agua a la ciudad de Cocha-bamba y diseños finales de obras de rehabilitación y ampliación
SHEFFELS, B. (1988): Structural constraints on crustal shortening in the Bolivian Andes. Unpublished Ph. D. The-sis. Massachusetts Institute of Technology, 167 pp.
SOLIZ, G., ARAGUÁS, L. (1995): Estudio de las aguas subterráneas del Valle de Cochabamba (Bolivia) mediante técnicas isotópicas. En: Estudios de hidrología isotópica en América Latina 1994 – resultados obtenidos en el marco del proyecto RLA/(/014 – ARCAL XIII: Aplicación de técnicas isotópicas en hidrología, OIEA, Viena, Austria, 1995.
STIMSON, J.; FRAPPE, S.; DRIMMIE, R.; RUDOLPH, D. & FARVOLDEN, R. (1992): Evolución isotópica y geoquímica de las aguas subterráneas en el valle de Cochabamba, Bolivia. En: “Los recursos hídricos en Bo-livia y su dimensión ambiental”, pp. 197-210, Ed. Ricaldi, V.; Flores, C. y Anaya, L.
STIMSON, J.; RUDOLPH, D.; FARVOLDEN, R.; FRAPPE, S. & DRIMMIE, R. (1993): Causes of groundwater salinization in a low lying area of Cochabamba Valley, Bolivia. En: “Isotope Techniques in the study of past and current environmental changes in the hydrosphere and atmosphere”, pp. 185-198, OIEA, Viena.
STRAHL, J.: Estudio palinológico del pozo de perforación Cb 297 en el Valle Central de Cochabamba, Bolivia. Boletín del Servicio Nacional de Geología y Minería (SERGEOMIN) No. 14, 1998.
STRUCKMEIER, W., MARGAT, J. (1995): Hydrogeological Maps. A Guide and Standard Legend. – IAH, Inter-national Contributions to Hydrogeology, Vol. 17; Hannover, Alemania.
TROLL, C. (1929): Reisen in den östlichen Anden Boliviens. Pet. Geogr. Mitt., 75, pp. 181-188
110
TROLL, C. (1937): Quartäre tektonikm und Quartärklima der tropischen Anden. Frankf. Geogr. Hefte, 11(1): pp. 64-67
TROLL, C., FINSTERWALDER, R. (1935): Die Karten der Cordillera Real und des Talkessels von La Paz (Bo-livien). Pet. Geogr. Mitt., 81, pp. 393-399 y 445-455
URQUIDI, G. (1954): Monografía del Departamento de Cochabamba, Publicación de la H. Municipalidad de Cochabamba
VEIT, H. (1990): Investigaciones geomorfológicas y pedológicas sobre el Cuaternario Superior en la Cordillera del Valle de Elqui (Chile, 30ºS). XII. Conreso nacional de geografía y III. Jornadade cartografía temática, La Serena, 15.-18.11.1990, resumen de ponencia, pp. 104-106
VEIT, H. (1991): Jungquartäre Relief- und Bodenentwicklungin der Hochkordillere im Einzugsgebiet des Río Elqui (Nordchile, 30ºS), Bamberger Geogr. Schriften 11, S. 81-97
VEIT, H, STINGL, H. (1991): Landschafts- und Klimageschichte der ariden Diagonale im Bereich von 27 - 33ºS unter besonderer Berücksichtigung geomorphologischer und bodenkundlicher Befunde. In: GARLEFF, K, F. SCHABITZ, H. STINGL & H. VEIT: Jungquartäre Lanschaftsentwicklung und Klimageschichte beiderseits der ariden Diagonale Südamerkas. Bamberger Geogr. Schriften, 11, pp. 369-373
VILLAROEL, C., GRAF, K. (1979): Zur Entstehung des Talkessels von La Paz/Bolivien und Umgebung. Geogr. Helv., 1, pp. 43-49
WIRRMANN, D., DE OLIVEIRA ALMEIDA, L.F. (1987): Low Holocene level (7.700 – 3.650 years ago) of Lake Titikaka (Bolivia, South America). Paleogeogr., Paleoclimat., Paleoecol., 59, pp. 315-323
YBERT, J.P. (1981-1982): Analyse palynologique de la coupe holocène du Río Chirijahuira sur l’Altiplano bo-livien. Cah. ORSTOM, ser. Geol., XII(2), pp. 125-133
111
Informes técnicos del Proyecto CABAS / Technical reports of the CABAS Project
CORTEZ, L., SAAVEDRA, E.: Instalación de estaciones pluviométricos en el Valle de Cochabamba, IT CABAS Nº7, Febr. 1993
CORTEZ, L.: Anuario de información meteorológica para el año 1992, IT CABAS Nº9, Feb. 1993
CORTEZ, L.: Resultados preliminares de la investigación hidrogeológica del Nor-Oeste del Valle Central de Cochabamba, IT CABAS Nº10, Dic. 1992
DIAZ, J., RAMIREZ, I., ZAEPKE, M.: Hidrogeoquímica del Valle Central de Cochabamba, IT CABAS Nº33, Nov. 1995
DIAZ, J., TORREZ, J.: Anuario de información meteorológica 1995 para la cuenca de Cochabamba, IT CABAS Nº36, Dic. 1997
DIAZ, J., SAAVEDRA, E.: Anuario de información meteorológica 1993 para la cuenca de Cochabamba, IT CA-BAS Nº17, Marzo 1994
DIAZ, J.: Red de observación en el Valle Central de Cochabamba; Fluctuación de los niveles estáticos 1992 – 1997, IT CABAS Nº55, Ago. 1998
DIAZ. J., ZENTENO, J.: Anuario de información meteorológica 1995 del Chaco Tarijeño, IT CABAS Nº37
ESPINOZA, A., LOPEZ, S., SCHILDKNECHT, F.: Estudio geoélectrico área Santa Vera Cruz, IT CABAS Nº39, Sep. 1996
FERNANDEZ, A., NEUMANN-REDLIN, CH.: El sector de aguas subterráneas en Bolivia: Análisis de la organi-zación institucional y sugerencias para su mejoramiento, IT CABAS Nº21, Julio 1994
FIELITZ, K., GARABITO, E., INSINGER, J.F.: Estudio geoélectrico para la exploración de aguas subterraneas en el Valle Central de Cochabamba y en el Chaco Tarijeño, IT CABAS Nº8, Dic. 1992
FIELITZ, K., SORUCO, W., INSINGER, J.F.: Sondeos eléctricos para la exploración de aguas subterráneas en las Pampas de Lequezana (Potosí), , IT CABAS Nº23, Dic. 1994
FIELITZ, K., SORUCO, W., INSINGER, J.F.: Sondeos eléctricos y electromagnéticos para la exploración de aguas subterráneas en el Chaco Tarijeño (1994), IT CABAS Nº24, Dic. 1994
GARABITO, G., QUIROGA, J., SORUCO, W.: Investigaciones geoeléctricas en la parte norte del Chaco Tarijeño, IT CABAS Nº19, Abr. 1994
GARABITO, G.: Estudio geoeléctrico para la exploración de aguas subterráneas en el área del aeropuerto - Vinto, Oruro, IT CABAS Nº14, Ago. 1993
HUARANCA, R., GARABITO, G,., PAREDES, J.: Pozo de investigación Cb-308 I Paucarpata-Valle Central de Cochabamba, IT CABAS Nº20, Mayo 1994
HUARANCA, R., PAREDES, J., SORUCO, W.: Perforación del pozo de investigación Cb-308 III, Paucarpata-Valle Central de Cochabamba, IT CABAS Nº28, Dic. 1994
HUARANCA, R., PASIG, R.: Evaluación Hidrogeológica preliminar del sector suroeste del Departamento de Oruro (Area de las provincias Atahuallpa y Litoral), IT CABAS Nº35, Ago. 1996
KRAMPE, K.: Objetivo, uso y tipos de s hidrogeológicos (según una publicación por W.F. Struckmeier, 1989) , IT CABAS Nº42, Dic. 1996
NEUMANN-REDLIN, CH., HUARANCA, R.: Memoria explicativa del Mapa Hidrogeológico de Bolivia 1:250 000, Hoja Cochabamba , IT CABAS Nº38
112
NEUMANN-REDLIN, CH., CALLIZAYA, V., DIAZ, J., PASIG, R., RAMIREZ, I.: Mapas hidrogeológicos Chaco Tarijeño: Primeros borradores para dos mapas Hoja 6341 Cochabamba 1:250 000 y Chaco Tarijeno 1:100 000, , IT CABAS Nº22, Octubre 1994
NEUMANN-REDLIN, CH., VILLENA, H.: Aspectos adicionales sobre la geología y hidrogeología del Chaco Tari-jeño / abanico aluvial del Río Pilcomayo, IT CABAS Nº16, Dic. 1993
NEUMANN-REDLIN, CH., VILLENA, H.: Bibliografía Hidrogeológica del Chaco Sudamericano, IT CABAS Nº12, Mar. 1993
NEUMANN-REDLIN, CH., VILLENA, H: Primeros aspectos de Hidrogeología del Chaco Tarijeño, IT CABAS Nº1, Agosto 1992
NEUMANN-REDLIN, CH.: Mapa de Ocurrencia de Aguas Subterráneas de Bolivia en la escala 1:2 500 000, con-cepto de elaboración, IT CABAS Nº30, Sept. 1995
NEUMANN-REDLIN, CH.: Visita al Proyecto Irrigación en Culpina (Dpto. Chuquisaca), IT CABAS Nº 3, Agosto 1992
ORTIZ, R., ZENTENO, J.: Compendio de datos pluviométricos del Chaco Tarijeño Datos hasta 1992, IT CABAS Nº13, Mayo 1993
ORTIZ, R.: Organización computarizada de los datos Hidrogeológicos y Climáticos con Anexos 1-4, IT CABAS Nº2, Agosto 1992
ORTIZ, R.: Organización computarizada de los datos Hidrológicos y Climáticos. Ejemplo del Anuario Hidro-geológico con Anexo 5, Agosto 1992
PAREDES, J., GARABITO, G., HUARANCA, R., NEUMANN-REDLIN, CH.: Pozos Cb 297 en la propiedad de GEOBOL en Cochabamba (investigación y producción), IT CABAS Nº11, Ago. 1993
PASIG, R., VILLENA, H., CALLIZAYA, V., BUSTAMANTE, M.: Evaluación Hidrogeológica del Chaco Seco, IT CABAS Esp. Nº3, Abr. 1995
PASIG, R., VILLENA, H.: Estudio hidrogeológico del Chaco Tarijeño; Posibilidades de explotación y uso del agua subterránea en el Chaco Tarijeño, IT CABAS Nº48, Ene. 1998
RAMIREZ, I., TORREZ, J.: Evaluación del grado de contaminación de las aguas subterráneas en la ciudad de Tarija y zonas aledañas, IT CABAS Nº45, Ago. 1998
RENNER, S.: Documentación del curso Introducción a la hidráulica de aguas subeterráneas y a la simulación de flujos, IT CABAS Nº43
ROSSEL, C., ZENTENO, J.: Anuario de información pluviométrica 1993 - Chaco Tarijeño, IT CABAS Nº18, Ago. 1994
ROSSEL, C.: Instalación de Estaciones pluviométricos en el Chaco Tarijeño, IT CABAS Nº6, Febr. 1993
SAAVEDRA, E., ZENTENO, J.: Anuario de información meteorológica 1994 del Chaco Tarijeño, IT CABAS Nº32, Feb. 1996
SAAVEDRA, E.: Anuario de información meteorológica 1994 para la cuenca de Cochabamba, IT CABAS Nº31, Dic. 1995
SCHERDTFEGER, B.: Documentación del curso Contaminación de aguas subterráneas, IT CABAS Nº54, Mayo 1998
SCHILDKNECHT, F.: Manual complementario del equipo de perfilaje geofisico Century y el sistema de control digital “Compu-Log” , IT CABAS Nº40, Mar. 1997
SCHILDKNECHT, F.: Perfilaje geofísico de pozos para la medición de parámetros hidrogeológicos, IT CABAS Nº41
113
SORUCO, W., HUARANCA, R.: Estudio hidrogeológico en la cuenca de Chaquilla, Potosí, IT CABAS Nº52, Mar. 1998
SORUCO, W.: Estudio geoeléctrico area Cienega Pampa, Potosí, IT CABAS Esp. Nº6, Jun. 1995
SORUCO, W.: Estudio geoeléctrico en el abanoco de San Martín de Colcha K, Nor Lípez, Potosí, IT CABAS Nº50, Mar. 1998
SORUCO, W.: Estudio geoeléctrico en el área de Capinota, Cochabamba, IT CABAS Nº49, Ene. 1998
SORUCO, W.: Estudio geoeléctrico en el área de Tolata, Cochabamba, IT CABAS Nº51, Ene, 1998
SORUCO, W.: Estudio geoeléctrico en el sector norte del Chaco Tarijeño. Perfil N (Suplemento), IT CABAS Nº24, Dic. 1994
TERRAZAS, E.: Instalación de las Estaciones Hidrométricas (área Yacuiba) , IT CABAS Nº26, Dic. 1994
TORREZ, J.: Ensayo de bombeo, Pozo Cb-308 III, Paucarpata- Valle Central de Cochabamba, IT CABAS Nº29, Abr. 1995
TORREZ, J.: Perforación del Pozo Cb-308 II, Paucarpata - Valle-Central de Cochabamba, IT CABAS Nº27, Jul. 1994
VEIT, H.: Estudio geológico de los sedimentos plio-cuaternarios de la cuenca de Cochabamba, IT CABAS Nº4, Agosto 1992
WEILAND, L., TORREZ, J., KOENIG, W.: Instalación de la parte gráfica, Banco de datos hidrogeológico Pro-grama Computacional Hygraf, IT CABAS Nº15, Sept. 1993
WEILAND, L., TORREZ, J.: Instalación del Banco de Datos Hidrogeológico; Programa Computacional HYDAT, IT CABAS Nº5, Sept. 1992
WEILAND, L., KOENIG, W.: Instalación de HYMAP-Una parte del programa computacional de HYDAT para crear mapas topográficos y temáticos, IT CABAS Nº34, Nov. 1995
WEILAND, L., KOENIG, W.: Instalación de una red de computación, IT CABAS Nº25, Dic. 1995
ZAEPKE, M., FLORES, R.: Hidrogeología de las Pampas de Lequezana, IT CABAS Nº56, Jul. 1998
Mapas elaborados por el Proyecto CABAS / Maps elaborated by the CABAS Project
Mapa Hidrogeológico de Bolivia 1:2 500 000 por J. Lizarazu, A. Soria, L. Cortez R., Chr. Neumann-Redlin, pub-licado por BGR – SERGEOMIN, Cochabamba, 1997
Posibilidades de Explotación y uso del agua subterránea en el Chaco Tarijeño: Mapa 1:250 000 y memorias explicativas Estudio hidrogeológico del Chaco Tarijeño, por R. Pasig, Boletín del Servicio Nacional de Geología y Minería (SERGEOMIN), Nº15, 1998
Mapa Hidrogeológico de Bolivia 1:250 000, Hoja Cochabamba y memorias explicativas, por R. Huaranca & Ch. Neumann-Redlin, Boletín del Servicio Nacional de Geología y Minería (SERGEOMIN), Nº16, 1998
Mapa Hidrogeológico de Bolivia 1:250 000, Hoja Uncía y memorias explicativas, por R. Huaranca & Ch. Neu-mann-Redlin, Boletín del Servicio Nacional de Geología y Minería (SERGEOMIN), 2000, en prep.
Mapa Hidrogeológico del Valle Central de Cochabamba 1: 50 000, por G. Colque, tésis de grado, 1998