federal public debt monthly report march / 2012federal public debt monthly report march / 2012...
TRANSCRIPT
1
Federal Public Debt Monthly Report
March / 2012
Brasília
Relatório Mensal da Dívida Pública Federal
2
MINISTER OF FINANCE Guido Mantega EXECUTIVE SECRETARY Nelson Henrique Barbosa Filho NATIONAL TREASURY SECRETARY Arno Hugo Augustin Filho NATIONAL TREASURY SUBSECRETARIES Cleber Ubiratan de Oliveira Eduardo Coutinho Guerra Gilvan da Silva Dantas Líscio Fábio de Brasil Camargo Marcus Pereira Aucélio Paulo Fontoura Valle TECHNICAL TEAM Public Debt Subsecretary Paulo Fontoura Valle Coordinator: Public Debt Operations Fernando Eurico de Paiva Garrido Coordinator: Public Debt Strategic Planning Otavio Ladeira de Medeiros Coordinator: Public Debt Control Antônio de Pádua Ferreira Passos Information: Gerência de Relacionamento Institucional - GERIN Tel: (61) 3412-3188; Fax: (61) 3412-1565 Secretaria do Tesouro Nacional (National Treasury Secretariat) Edifício Sede do Ministério da Fazenda, Esplanada dos Ministérios, Bloco P, 2° andar 70048-900 - Brasília – DF Correio Eletrônico: [email protected] Home Page: http://www.tesouro.fazenda.gov.br The Federal Public Debt Monthly Report is published by the National Treasury Secretariat. Total or partial reproduction is permitted, mentioned its source.
3
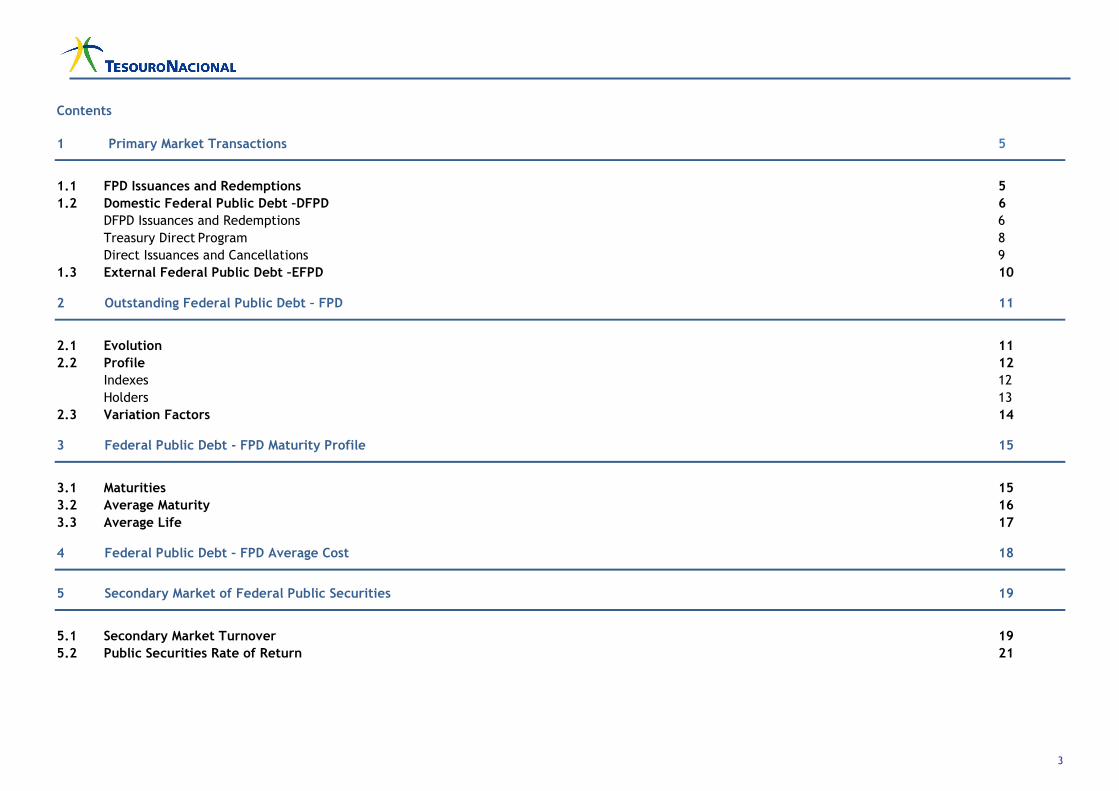
Contents
1 Primary Market Transactions 5
1.1 FPD Issuances and Redemptions 5
1.2 Domestic Federal Public Debt –DFPD 6
DFPD Issuances and Redemptions 6
Treasury Direct Program 8
Direct Issuances and Cancellations 9
1.3 External Federal Public Debt –EFPD 10 2 Outstanding Federal Public Debt – FPD 11
2.1 Evolution 11
2.2 Profile 12
Indexes 12
Holders 13
2.3 Variation Factors 14 3 Federal Public Debt - FPD Maturity Profile 15
3.1 Maturities 15
3.2 Average Maturity 16
3.3 Average Life 17 4 Federal Public Debt – FPD Average Cost 18
5 Secondary Market of Federal Public Securities 19
5.1 Secondary Market Turnover 19
5.2 Public Securities Rate of Return 21
4
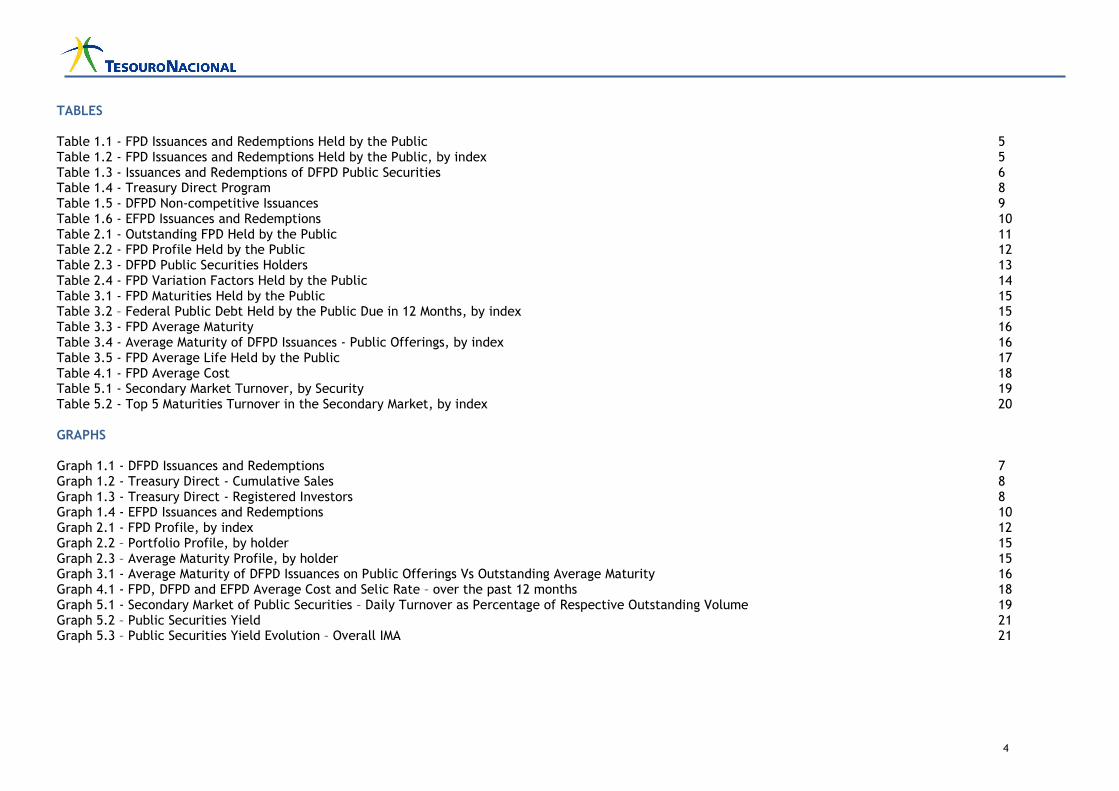
TABLES Table 1.1 - FPD Issuances and Redemptions Held by the Public 5 Table 1.2 - FPD Issuances and Redemptions Held by the Public, by index 5 Table 1.3 - Issuances and Redemptions of DFPD Public Securities 6 Table 1.4 - Treasury Direct Program 8 Table 1.5 - DFPD Non-competitive Issuances 9 Table 1.6 - EFPD Issuances and Redemptions 10 Table 2.1 - Outstanding FPD Held by the Public 11 Table 2.2 - FPD Profile Held by the Public 12 Table 2.3 - DFPD Public Securities Holders 13 Table 2.4 - FPD Variation Factors Held by the Public 14 Table 3.1 - FPD Maturities Held by the Public 15 Table 3.2 – Federal Public Debt Held by the Public Due in 12 Months, by index 15 Table 3.3 - FPD Average Maturity 16 Table 3.4 - Average Maturity of DFPD Issuances - Public Offerings, by index 16 Table 3.5 - FPD Average Life Held by the Public 17 Table 4.1 - FPD Average Cost 18 Table 5.1 - Secondary Market Turnover, by Security 19 Table 5.2 - Top 5 Maturities Turnover in the Secondary Market, by index 20 GRAPHS Graph 1.1 - DFPD Issuances and Redemptions 7 Graph 1.2 - Treasury Direct - Cumulative Sales 8 Graph 1.3 - Treasury Direct - Registered Investors 8 Graph 1.4 - EFPD Issuances and Redemptions 10 Graph 2.1 - FPD Profile, by index 12 Graph 2.2 – Portfolio Profile, by holder 15 Graph 2.3 – Average Maturity Profile, by holder 15 Graph 3.1 - Average Maturity of DFPD Issuances on Public Offerings Vs Outstanding Average Maturity 16 Graph 4.1 - FPD, DFPD and EFPD Average Cost and Selic Rate – over the past 12 months 18 Graph 5.1 - Secondary Market of Public Securities – Daily Turnover as Percentage of Respective Outstanding Volume 19 Graph 5.2 – Public Securities Yield 21 Graph 5.3 – Public Securities Yield Evolution – Overall IMA 21
5
1. Primary Market Transactions
1.1. FPD Issuances and Redemptions
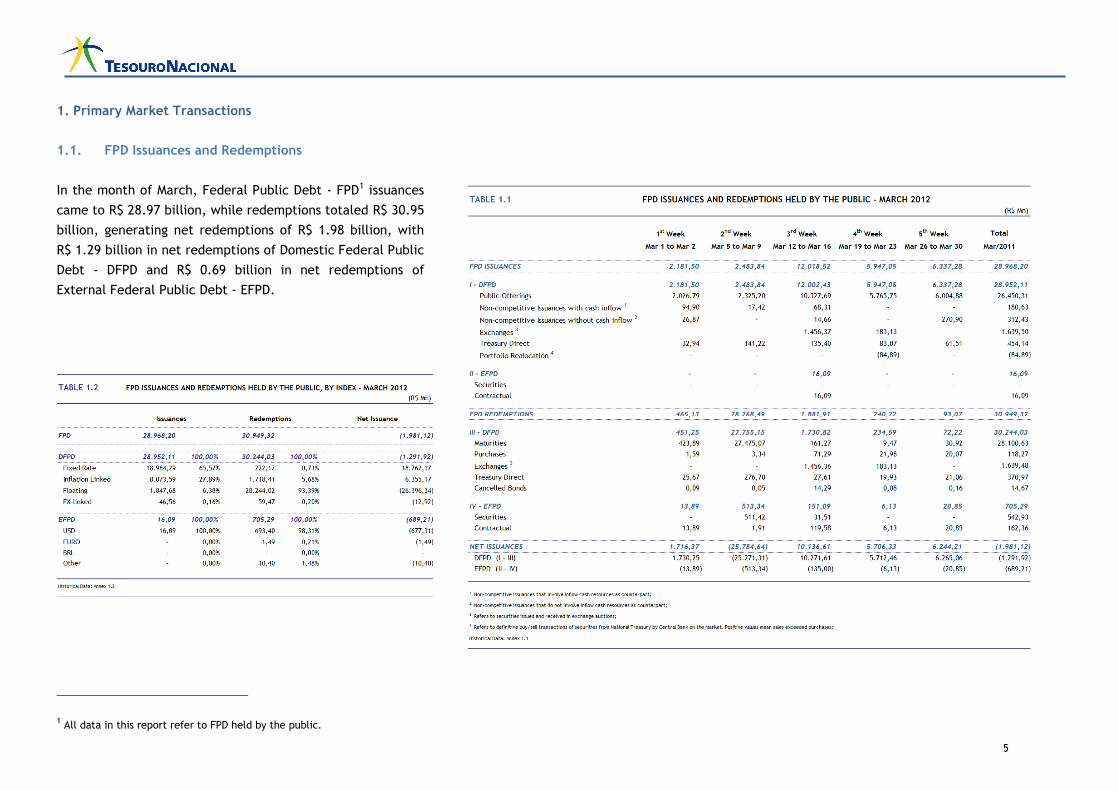
In the month of March, Federal Public Debt - FPD1 issuances
came to R$ 28.97 billion, while redemptions totaled R$ 30.95
billion, generating net redemptions of R$ 1.98 billion, with
R$ 1.29 billion in net redemptions of Domestic Federal Public
Debt - DFPD and R$ 0.69 billion in net redemptions of
External Federal Public Debt - EFPD.
1 All data in this report refer to FPD held by the public.
6
1.2. Domestic Federal Public Debt – DFPD DFPD Issuances and Redemptions
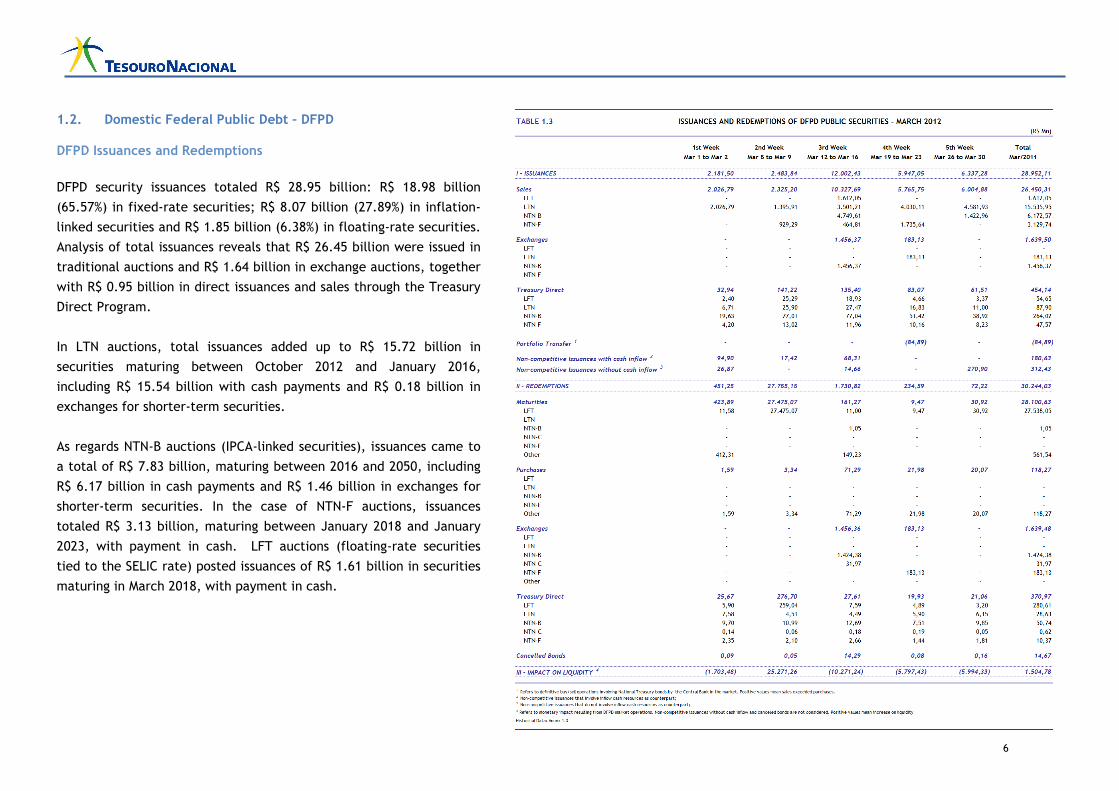
DFPD security issuances totaled R$ 28.95 billion: R$ 18.98 billion
(65.57%) in fixed-rate securities; R$ 8.07 billion (27.89%) in inflation-
linked securities and R$ 1.85 billion (6.38%) in floating-rate securities.
Analysis of total issuances reveals that R$ 26.45 billion were issued in
traditional auctions and R$ 1.64 billion in exchange auctions, together
with R$ 0.95 billion in direct issuances and sales through the Treasury
Direct Program.
In LTN auctions, total issuances added up to R$ 15.72 billion in
securities maturing between October 2012 and January 2016,
including R$ 15.54 billion with cash payments and R$ 0.18 billion in
exchanges for shorter-term securities.
As regards NTN-B auctions (IPCA-linked securities), issuances came to
a total of R$ 7.83 billion, maturing between 2016 and 2050, including
R$ 6.17 billion in cash payments and R$ 1.46 billion in exchanges for
shorter-term securities. In the case of NTN-F auctions, issuances
totaled R$ 3.13 billion, maturing between January 2018 and January
2023, with payment in cash. LFT auctions (floating-rate securities
tied to the SELIC rate) posted issuances of R$ 1.61 billion in securities
maturing in March 2018, with payment in cash.
7
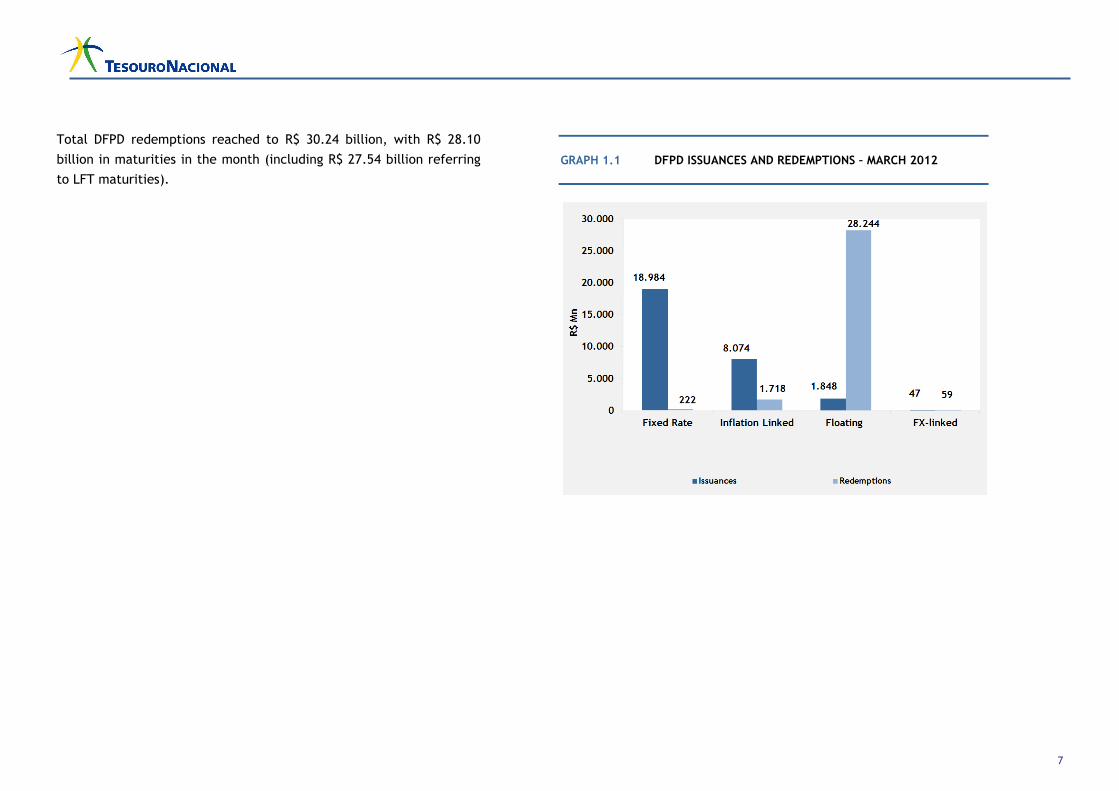
Total DFPD redemptions reached to R$ 30.24 billion, with R$ 28.10
billion in maturities in the month (including R$ 27.54 billion referring
to LFT maturities).
GRAPH 1.1 DFPD ISSUANCES AND REDEMPTIONS – MARCH 2012
8
Treasury Direct Program
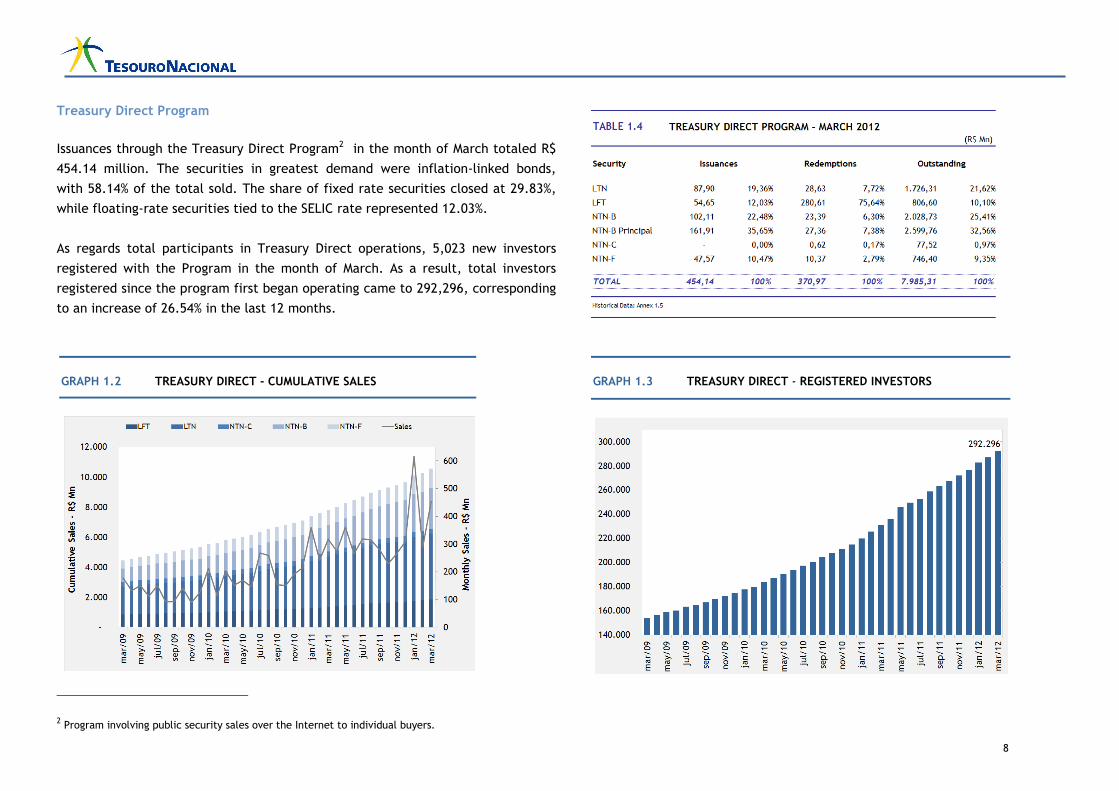
Issuances through the Treasury Direct Program2 in the month of March totaled R$
454.14 million. The securities in greatest demand were inflation-linked bonds,
with 58.14% of the total sold. The share of fixed rate securities closed at 29.83%,
while floating-rate securities tied to the SELIC rate represented 12.03%.
As regards total participants in Treasury Direct operations, 5,023 new investors
registered with the Program in the month of March. As a result, total investors
registered since the program first began operating came to 292,296, corresponding
to an increase of 26.54% in the last 12 months.
2 Program involving public security sales over the Internet to individual buyers.
GRAPH 1.2 TREASURY DIRECT - CUMULATIVE SALES
GRAPH 1.3 TREASURY DIRECT - REGISTERED INVESTORS
9
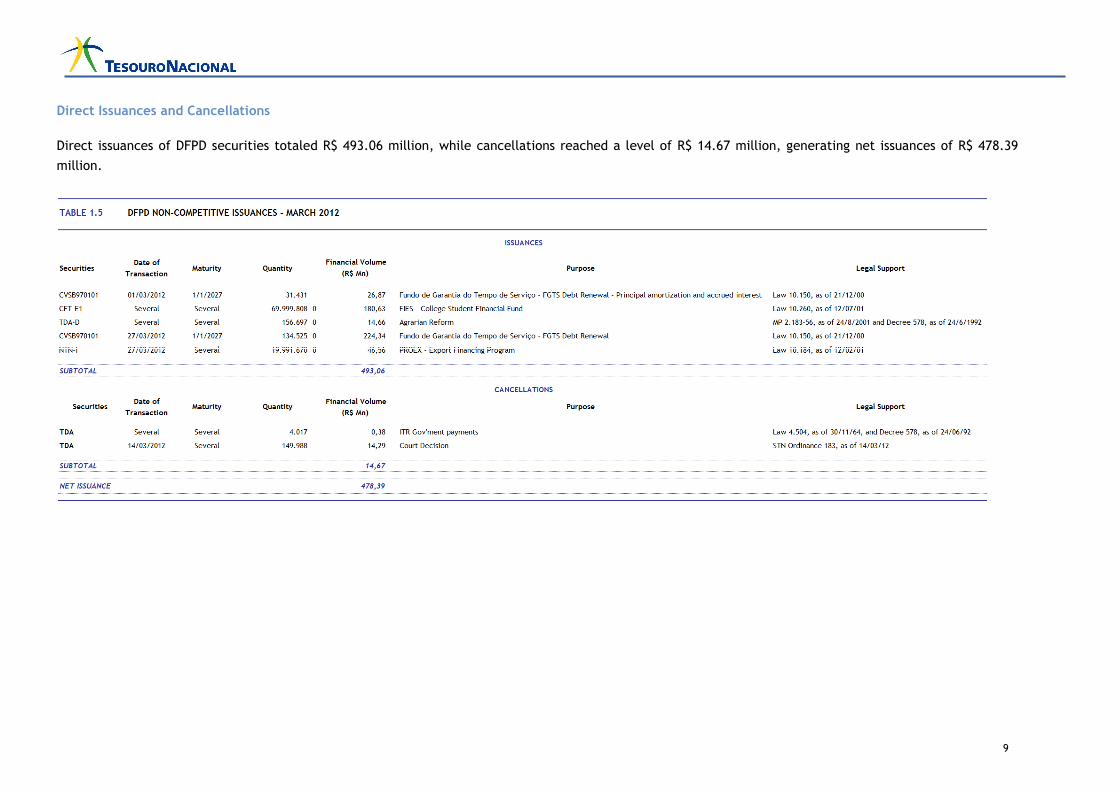
Direct Issuances and Cancellations
Direct issuances of DFPD securities totaled R$ 493.06 million, while cancellations reached a level of R$ 14.67 million, generating net issuances of R$ 478.39
million.
10
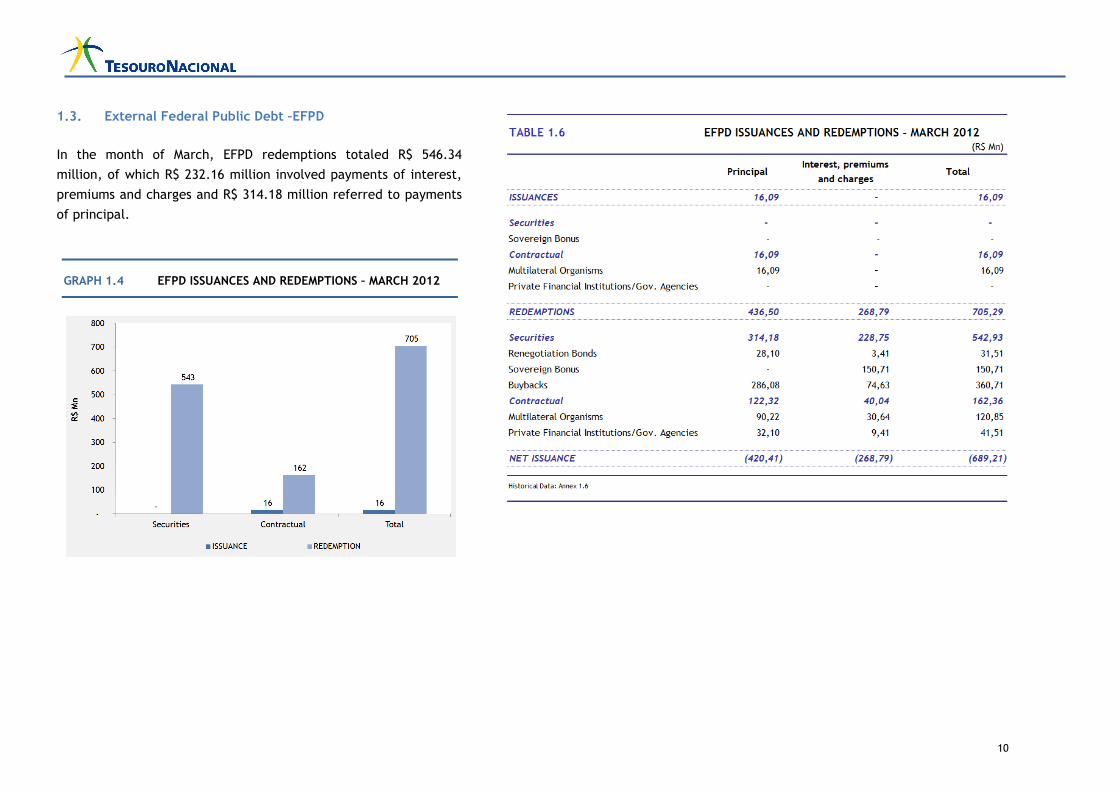
1.3. External Federal Public Debt –EFPD
In the month of March, EFPD redemptions totaled R$ 546.34
million, of which R$ 232.16 million involved payments of interest,
premiums and charges and R$ 314.18 million referred to payments
of principal.
GRAPH 1.4 EFPD ISSUANCES AND REDEMPTIONS – MARCH 2012
11
2. Outstanding Federal Public Debt – FPD
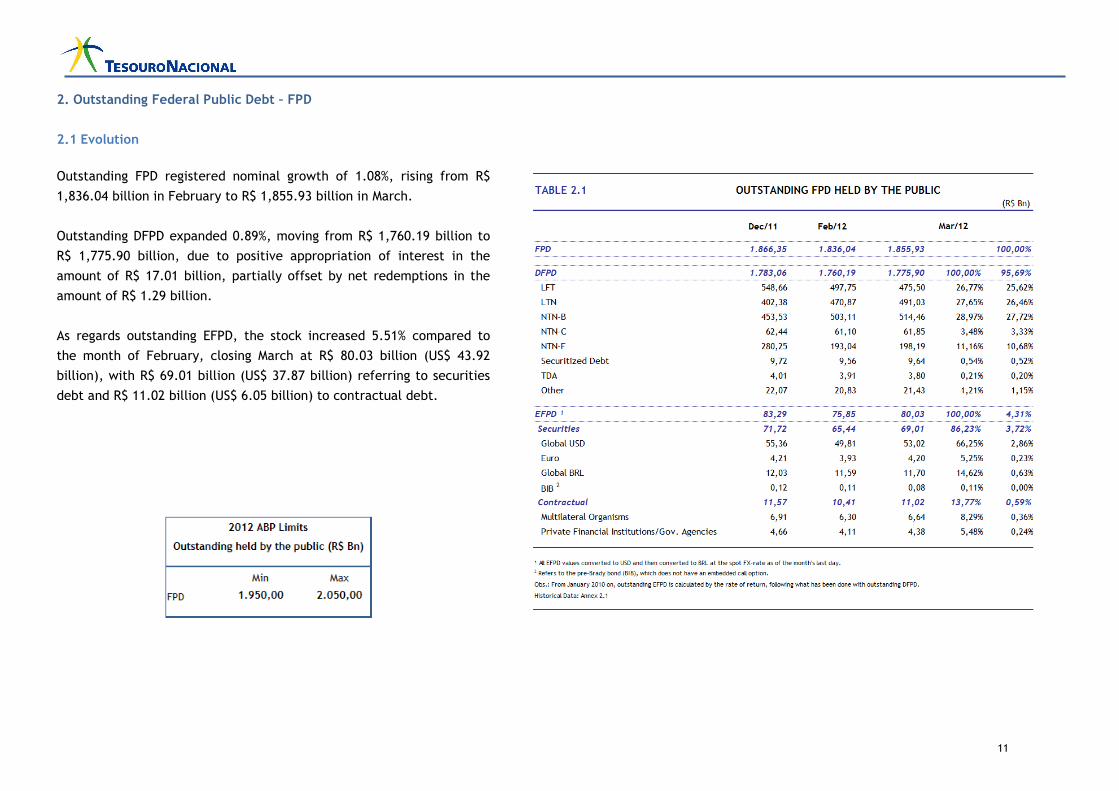
2.1 Evolution
Outstanding FPD registered nominal growth of 1.08%, rising from R$
1,836.04 billion in February to R$ 1,855.93 billion in March.
Outstanding DFPD expanded 0.89%, moving from R$ 1,760.19 billion to
R$ 1,775.90 billion, due to positive appropriation of interest in the
amount of R$ 17.01 billion, partially offset by net redemptions in the
amount of R$ 1.29 billion.
As regards outstanding EFPD, the stock increased 5.51% compared to
the month of February, closing March at R$ 80.03 billion (US$ 43.92
billion), with R$ 69.01 billion (US$ 37.87 billion) referring to securities
debt and R$ 11.02 billion (US$ 6.05 billion) to contractual debt.
12
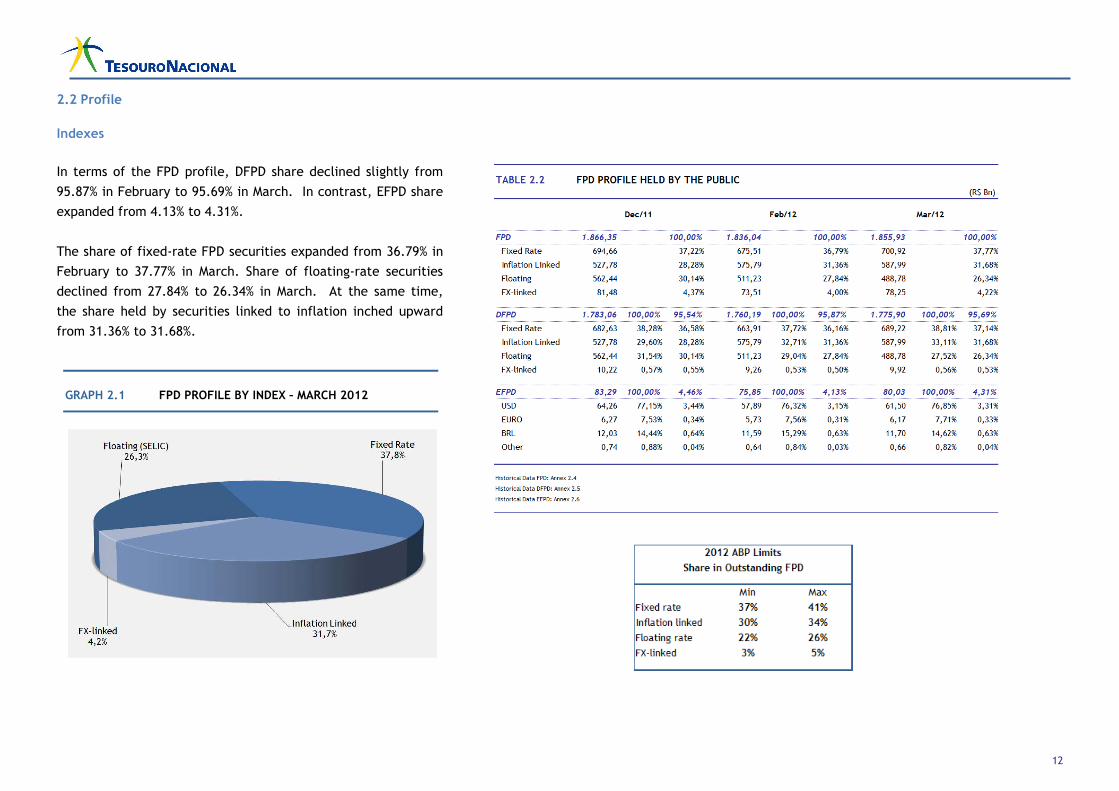
2.2 Profile
Indexes
In terms of the FPD profile, DFPD share declined slightly from
95.87% in February to 95.69% in March. In contrast, EFPD share
expanded from 4.13% to 4.31%.
The share of fixed-rate FPD securities expanded from 36.79% in
February to 37.77% in March. Share of floating-rate securities
declined from 27.84% to 26.34% in March. At the same time,
the share held by securities linked to inflation inched upward
from 31.36% to 31.68%.
GRAPH 2.1 FPD PROFILE BY INDEX – MARCH 2012
13
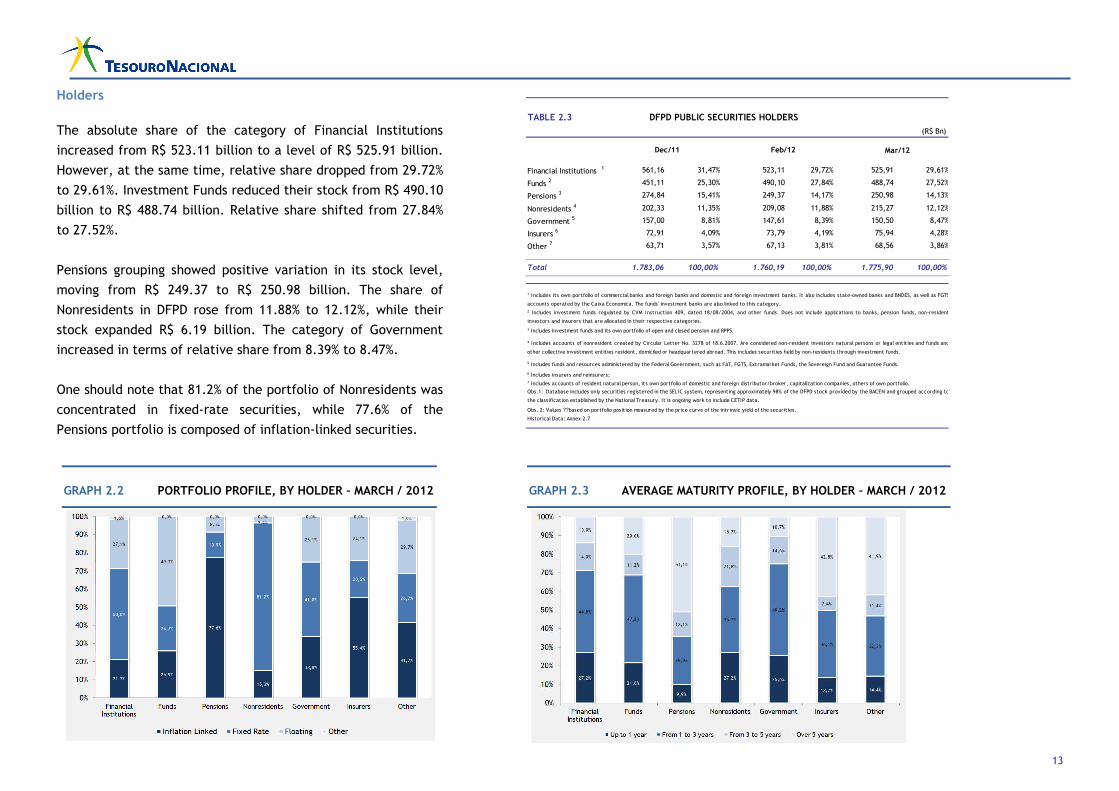
Holders
The absolute share of the category of Financial Institutions
increased from R$ 523.11 billion to a level of R$ 525.91 billion.
However, at the same time, relative share dropped from 29.72%
to 29.61%. Investment Funds reduced their stock from R$ 490.10
billion to R$ 488.74 billion. Relative share shifted from 27.84%
to 27.52%.
Pensions grouping showed positive variation in its stock level,
moving from R$ 249.37 to R$ 250.98 billion. The share of
Nonresidents in DFPD rose from 11.88% to 12.12%, while their
stock expanded R$ 6.19 billion. The category of Government
increased in terms of relative share from 8.39% to 8.47%.
One should note that 81.2% of the portfolio of Nonresidents was
concentrated in fixed-rate securities, while 77.6% of the
Pensions portfolio is composed of inflation-linked securities.
Financial Institutions 1 561,16 31,47% 523,11 29,72% 525,91 29,61%
Funds 2 451,11 25,30% 490,10 27,84% 488,74 27,52%
Pensions 3 274,84 15,41% 249,37 14,17% 250,98 14,13%
Nonresidents 4 202,33 11,35% 209,08 11,88% 215,27 12,12%
Government 5 157,00 8,81% 147,61 8,39% 150,50 8,47%
Insurers 6 72,91 4,09% 73,79 4,19% 75,94 4,28%
Other 7 63,71 3,57% 67,13 3,81% 68,56 3,86%
Total 1.783,06 100,00% 1.760,19 100,00% 1.775,90 100,00%
6 Includes insurers and reinsurers;
TABLE 2.3
Dec/11 Feb/12 Mar/12
5 Includes funds and resources administered by the Federal Government, such as FAT, FGTS, Extramarket Funds, the Sovereign Fund and Guarantee Funds.
Historical Data: Annex 2.7
(R$ Bn)
DFPD PUBLIC SECURITIES HOLDERS
2 Includes investment funds regulated by CVM Instruction 409, dated 18/08/2004, and other funds. Does not include applications to banks, pension funds, non-resident
investors and insurers that are allocated in their respective categories.
3 Includes investment funds and its own portfolio of open and closed pension and RPPS.
7 Includes accounts of resident natural person, its own portfolio of domestic and foreign distributor/broker, capitalization companies, others of own portfolio.
Obs.1: Database includes only securities registered in the SELIC system, representing approximately 98% of the DFPD stock provided by the BACEN and grouped according to
the classification established by the National Treasury. It is ongoing work to include CETIP data.
Obs. 2: Values ??based on portfolio position measured by the price curve of the intrinsic yield of the securities.
4 Includes accounts of nonresident created by Circular Letter No. 3278 of 18.6.2007. Are considered non-resident investors natural persons or legal entities and funds and
other collective investment entities resident, domiciled or headquartered abroad. This includes securities held by non-residents through investment funds.
1 Includes its own portfolio of commercial banks and foreign banks and domestic and foreign investment banks. It also includes state-owned banks and BNDES, as well as FGTS
accounts operated by the Caixa Economica. The funds' investment banks are also linked to this category.
GRAPH 2.2 PORTFOLIO PROFILE, BY HOLDER – MARCH / 2012
GRAPH 2.3 AVERAGE MATURITY PROFILE, BY HOLDER – MARCH / 2012
14
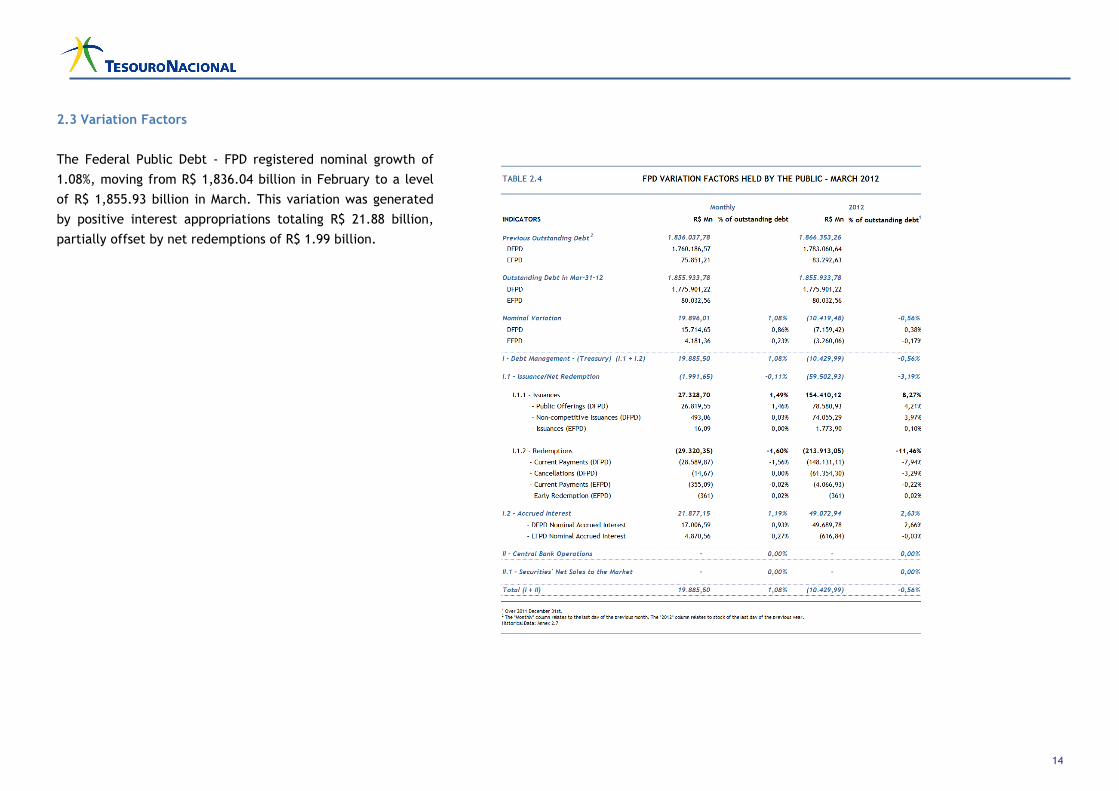
2.3 Variation Factors
The Federal Public Debt - FPD registered nominal growth of
1.08%, moving from R$ 1,836.04 billion in February to a level
of R$ 1,855.93 billion in March. This variation was generated
by positive interest appropriations totaling R$ 21.88 billion,
partially offset by net redemptions of R$ 1.99 billion.
15
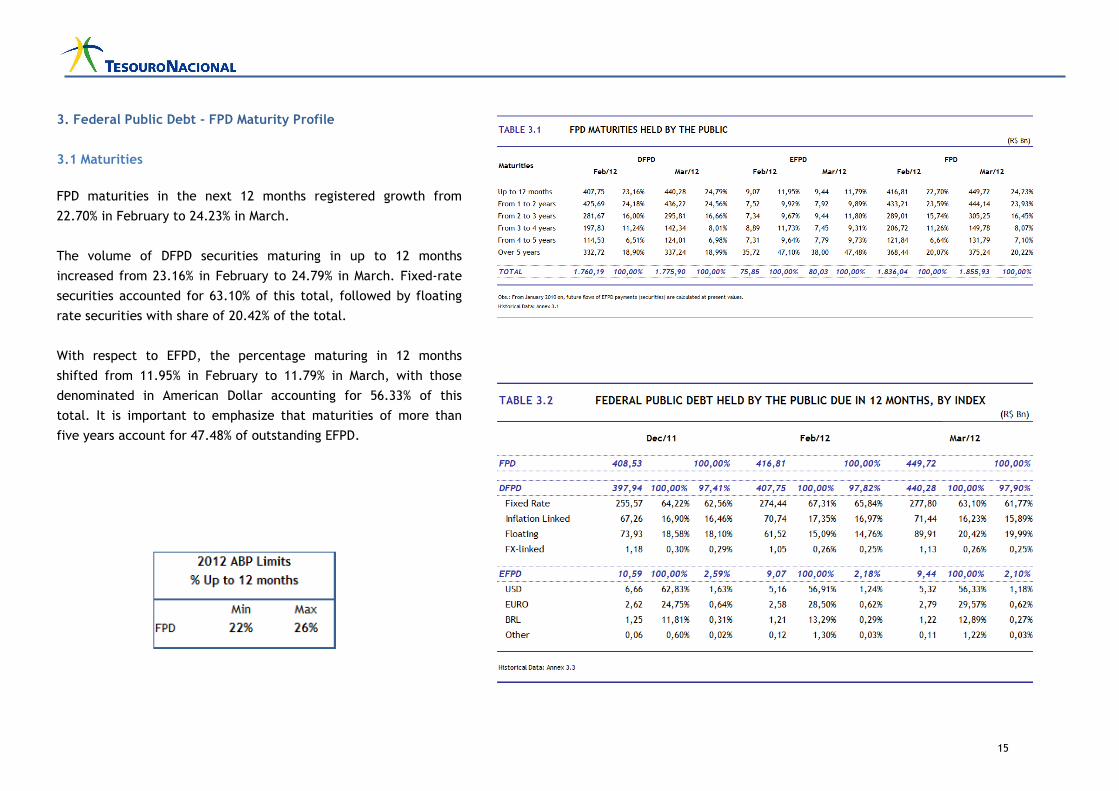
3. Federal Public Debt - FPD Maturity Profile
3.1 Maturities
FPD maturities in the next 12 months registered growth from
22.70% in February to 24.23% in March.
The volume of DFPD securities maturing in up to 12 months
increased from 23.16% in February to 24.79% in March. Fixed-rate
securities accounted for 63.10% of this total, followed by floating
rate securities with share of 20.42% of the total.
With respect to EFPD, the percentage maturing in 12 months
shifted from 11.95% in February to 11.79% in March, with those
denominated in American Dollar accounting for 56.33% of this
total. It is important to emphasize that maturities of more than
five years account for 47.48% of outstanding EFPD.
16
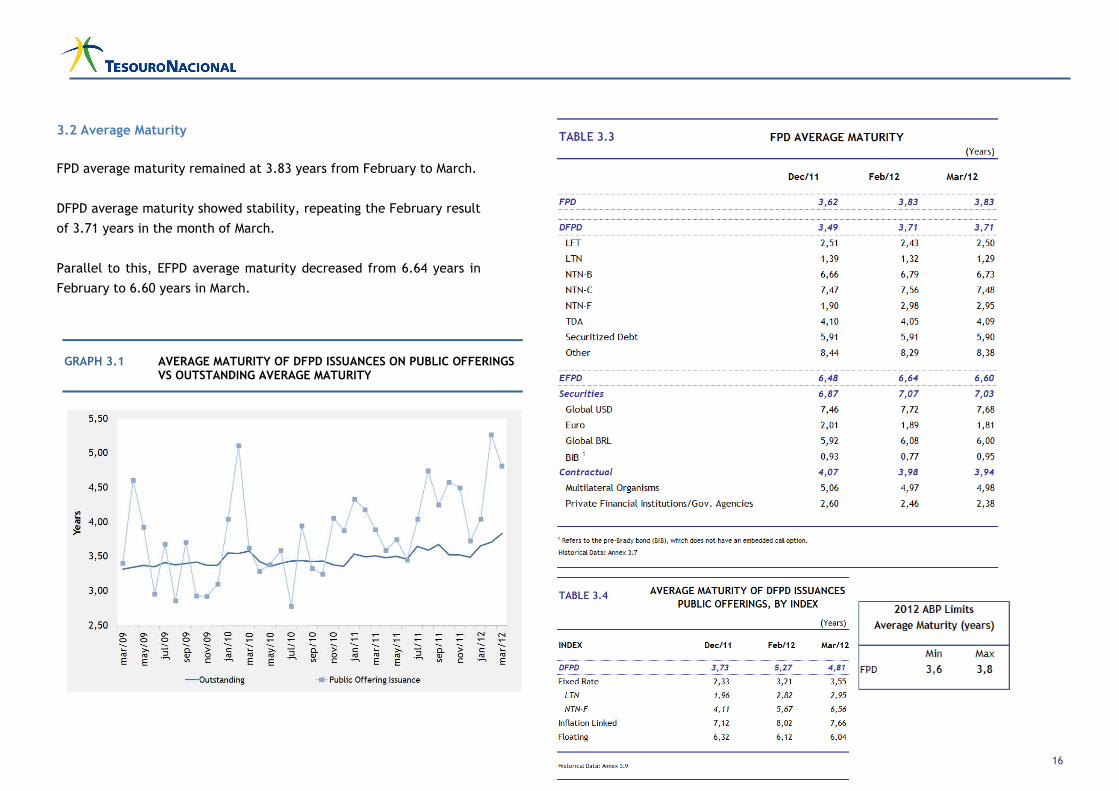
3.2 Average Maturity
FPD average maturity remained at 3.83 years from February to March.
DFPD average maturity showed stability, repeating the February result
of 3.71 years in the month of March.
Parallel to this, EFPD average maturity decreased from 6.64 years in
February to 6.60 years in March.
.
GRAPH 3.1 AVERAGE MATURITY OF DFPD ISSUANCES ON PUBLIC OFFERINGS VS OUTSTANDING AVERAGE MATURITY
17
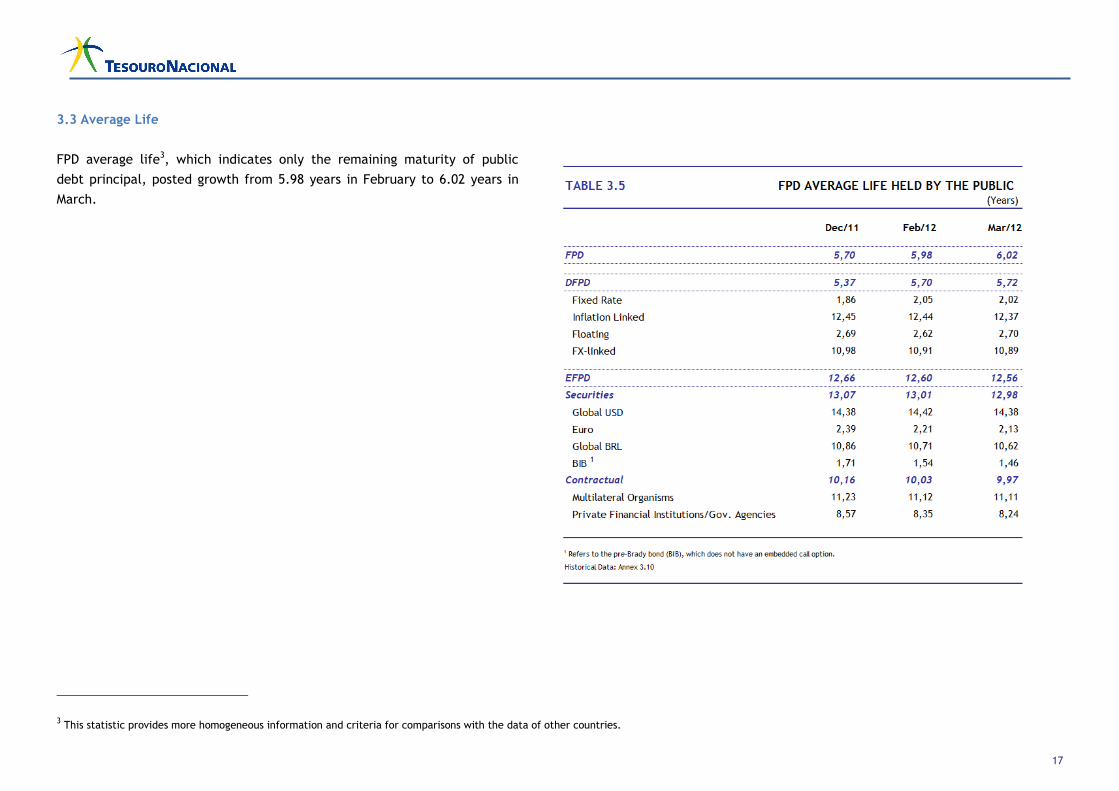
3.3 Average Life
FPD average life3, which indicates only the remaining maturity of public
debt principal, posted growth from 5.98 years in February to 6.02 years in
March.
3 This statistic provides more homogeneous information and criteria for comparisons with the data of other countries.
18
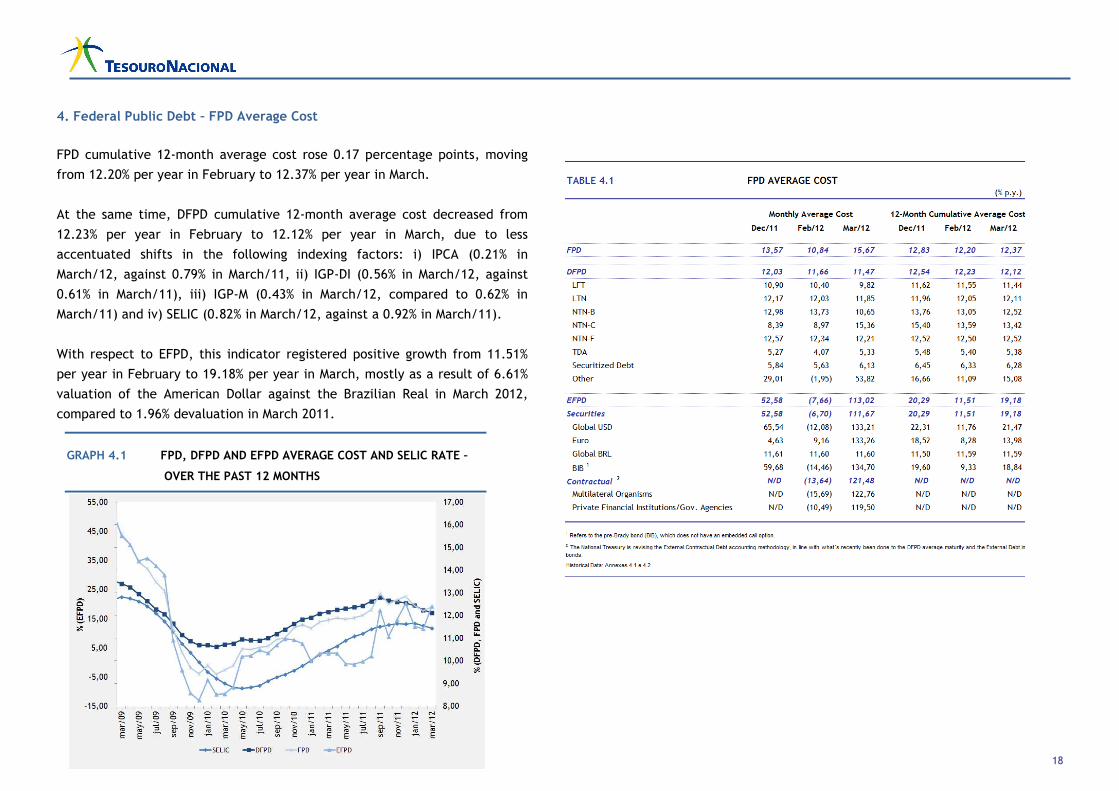
4. Federal Public Debt – FPD Average Cost FPD cumulative 12-month average cost rose 0.17 percentage points, moving
from 12.20% per year in February to 12.37% per year in March.
At the same time, DFPD cumulative 12-month average cost decreased from
12.23% per year in February to 12.12% per year in March, due to less
accentuated shifts in the following indexing factors: i) IPCA (0.21% in
March/12, against 0.79% in March/11, ii) IGP-DI (0.56% in March/12, against
0.61% in March/11), iii) IGP-M (0.43% in March/12, compared to 0.62% in
March/11) and iv) SELIC (0.82% in March/12, against a 0.92% in March/11).
With respect to EFPD, this indicator registered positive growth from 11.51%
per year in February to 19.18% per year in March, mostly as a result of 6.61%
valuation of the American Dollar against the Brazilian Real in March 2012,
compared to 1.96% devaluation in March 2011.
GRAPH 4.1 FPD, DFPD AND EFPD AVERAGE COST AND SELIC RATE –
OVER THE PAST 12 MONTHS
19
5. Secondary Market of Federal Public Securities
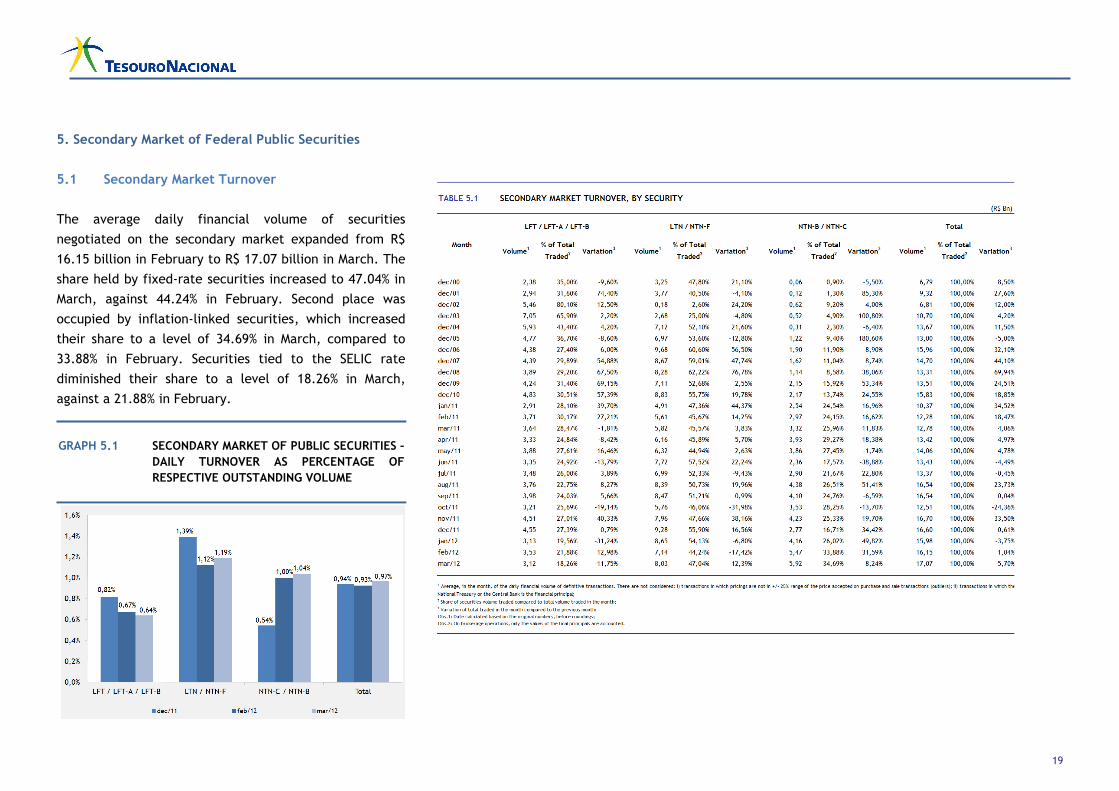
5.1 Secondary Market Turnover
The average daily financial volume of securities
negotiated on the secondary market expanded from R$
16.15 billion in February to R$ 17.07 billion in March. The
share held by fixed-rate securities increased to 47.04% in
March, against 44.24% in February. Second place was
occupied by inflation-linked securities, which increased
their share to a level of 34.69% in March, compared to
33.88% in February. Securities tied to the SELIC rate
diminished their share to a level of 18.26% in March,
against a 21.88% in February.
GRAPH 5.1 SECONDARY MARKET OF PUBLIC SECURITIES –
DAILY TURNOVER AS PERCENTAGE OF
RESPECTIVE OUTSTANDING VOLUME
20
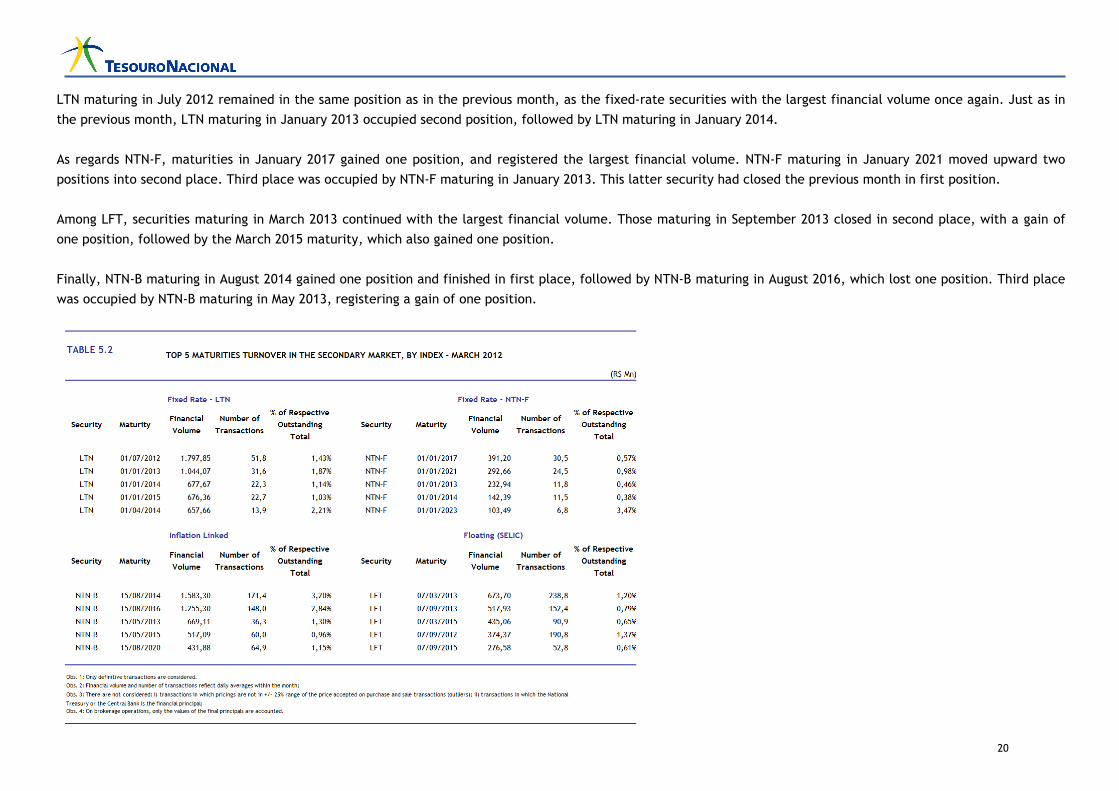
LTN maturing in July 2012 remained in the same position as in the previous month, as the fixed-rate securities with the largest financial volume once again. Just as in
the previous month, LTN maturing in January 2013 occupied second position, followed by LTN maturing in January 2014.
As regards NTN-F, maturities in January 2017 gained one position, and registered the largest financial volume. NTN-F maturing in January 2021 moved upward two
positions into second place. Third place was occupied by NTN-F maturing in January 2013. This latter security had closed the previous month in first position.
Among LFT, securities maturing in March 2013 continued with the largest financial volume. Those maturing in September 2013 closed in second place, with a gain of
one position, followed by the March 2015 maturity, which also gained one position.
Finally, NTN-B maturing in August 2014 gained one position and finished in first place, followed by NTN-B maturing in August 2016, which lost one position. Third place
was occupied by NTN-B maturing in May 2013, registering a gain of one position.
21
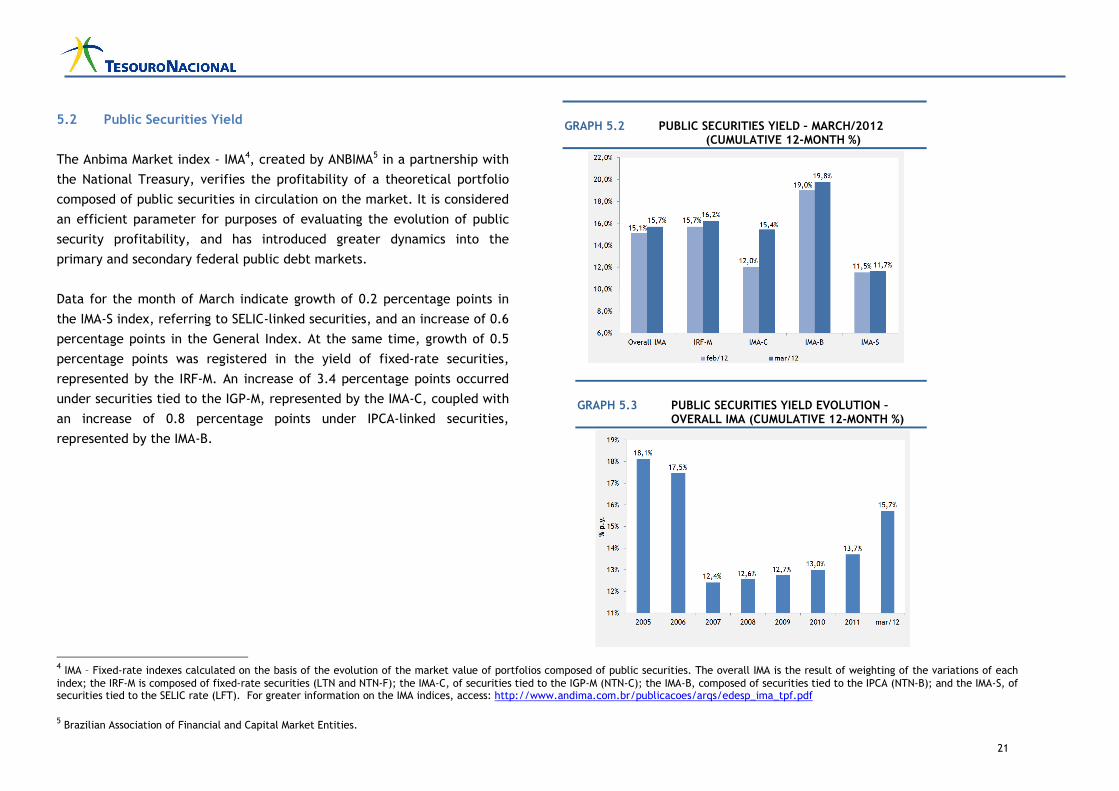
5.2 Public Securities Yield
The Anbima Market index - IMA4, created by ANBIMA5 in a partnership with
the National Treasury, verifies the profitability of a theoretical portfolio
composed of public securities in circulation on the market. It is considered
an efficient parameter for purposes of evaluating the evolution of public
security profitability, and has introduced greater dynamics into the
primary and secondary federal public debt markets.
Data for the month of March indicate growth of 0.2 percentage points in
the IMA-S index, referring to SELIC-linked securities, and an increase of 0.6
percentage points in the General Index. At the same time, growth of 0.5
percentage points was registered in the yield of fixed-rate securities,
represented by the IRF-M. An increase of 3.4 percentage points occurred
under securities tied to the IGP-M, represented by the IMA-C, coupled with
an increase of 0.8 percentage points under IPCA-linked securities,
represented by the IMA-B.
4 IMA – Fixed-rate indexes calculated on the basis of the evolution of the market value of portfolios composed of public securities. The overall IMA is the result of weighting of the variations of each index; the IRF-M is composed of fixed-rate securities (LTN and NTN-F); the IMA-C, of securities tied to the IGP-M (NTN-C); the IMA-B, composed of securities tied to the IPCA (NTN-B); and the IMA-S, of securities tied to the SELIC rate (LFT). For greater information on the IMA indices, access: http://www.andima.com.br/publicacoes/arqs/edesp_ima_tpf.pdf
5 Brazilian Association of Financial and Capital Market Entities.
GRAPH 5.3 PUBLIC SECURITIES YIELD EVOLUTION –
OVERALL IMA (CUMULATIVE 12-MONTH %)
GRAPH 5.2 PUBLIC SECURITIES YIELD – MARCH/2012
(CUMULATIVE 12-MONTH %)