faculdade de ciÊncias da universidade do porto · full professor of departamento de física e...
TRANSCRIPT
FACULDADE DE CIÊNCIAS DA UNIVERSIDADE DO PORTO
FIBER OPTIC STRUCTURES FOR REFRACTIVE INDEX
Susana Ferreira de Oliveira Silva
Departamento de Física e
FACULDADE DE CIÊNCIAS DA UNIVERSIDADE DO PORTO
IBER OPTIC STRUCTURES FOR REFRACTIVE INDEX
AND GAS SENSING
Susana Ferreira de Oliveira Silva
epartamento de Física e Astronomia da Faculdade de Ciências da
Universidade do Porto
Porto 2013
FACULDADE DE CIÊNCIAS DA UNIVERSIDADE DO PORTO
IBER OPTIC STRUCTURES FOR REFRACTIVE INDEX
Astronomia da Faculdade de Ciências da

FACULDADE DE CIÊNCIAS DA UNIVERSIDADE DO PORTO
FIBER OPTIC STRUCTURES FOR REFRACTIVE INDEX
Susana Ferreira de Oliveira Silva
Thesis submitted to Faculdade de Ciências da Universidade do Porto
partial fulfillment of the requirements for
This thesis was co
Prof. Dr. Francisco Xavier
Full Professor of Departamento de Engenharia Química
Engenharia da Universidade do Porto
Prof. Dr.
Full Professor of Departamento de Física e Astronomia da Faculdade de
FACULDADE DE CIÊNCIAS DA UNIVERSIDADE DO PORTO
IBER OPTIC STRUCTURES FOR REFRACTIVE INDEX
AND GAS SENSING
Susana Ferreira de Oliveira Silva
submitted to Faculdade de Ciências da Universidade do Porto
partial fulfillment of the requirements for the degree of Ph.D. in Physics
thesis was conducted under the supervision of
Francisco Xavier Delgado Domingos Antunes Malcata
Departamento de Engenharia Química da Faculdade de
Engenharia da Universidade do Porto
and
Prof. Dr. José Luís Campos de Oliveira Santos
Departamento de Física e Astronomia da Faculdade de
Ciências da Universidade do Porto
FACULDADE DE CIÊNCIAS DA UNIVERSIDADE DO PORTO
IBER OPTIC STRUCTURES FOR REFRACTIVE INDEX
submitted to Faculdade de Ciências da Universidade do Porto in
the degree of Ph.D. in Physics
Malcata
da Faculdade de
Departamento de Física e Astronomia da Faculdade de


Bolsa de investigação da Fundação para a Ciência e a Tecnologia com a referência
SFRH/BD/47799/2008, financiada pelo POPH – QREN – Tipologia 4.1 – Formação Avançada,
comparticipada pelo Fundo Social Europeu e por fundos nacionais do MCTES.


“Nothing in life is to be feared, it is only to be understood.
Now is the time to understand more, so that we may fear less.”
Marie Curie

- ix -
Acknowledgements
Firstly, I would like to thank Professor Francisco Xavier Malcata. It was his insight and
enthusiasm the source of my motivation to proceed to my PhD studies in fiber sensing oriented
to the measurement of physical and chemical parameters important for biological environments.
His supervision permitted to enlarge my view of the relevance of the fiber optic technology in
domains outside the traditional physical area. I also deeply thank his inspiring rigor on the
revision of scientific documents derived from this PhD research.
I would like to express my profound gratitude to Professor José Luís Santos for guiding me
throughout the last few years and for being a cornerstone of my personal and academic
formation. Thank you for sharing scientific knowledge, for teaching, and most of all, for your
friendship.
I also would like to extend my sincere gratitude to Dr. Orlando Frazão for kindly sharing his
insight about scientific matters that greatly contributed for the research work here presented,
for all the helpful discussions and unremitting support over the last few years.
A heartfelt thanks to my dearest friend Luísa Mendonça, to whom words will never be enough to
express how greatness is her presence in my life. Thank you for all your kind words, your
precious advices and invaluable friendship.
To all my colleagues and friends from UOSE, namely, Raquel Queirós, Joel Carvalho, Pedro Jorge,
Ricardo André, Rita Ribeiro, Hugo Martins, Ivo Nascimento, Marta Ferreira, Carlos Gouveia,
Hamed Moayyed, Hamid Hosseiny, Patrícia Limede, Ivo Leite - and also to the ones that already
followed a different path, Paula Tafulo, Ricardo Silva, Jaime Viegas, Diana Viegas and Dionísio
Pereira, that somehow contributed for the great experience and my profound joy that it is
working in this group. A special thanks to Paulo Caldas and Luís Coelho for helping me in
experimental work, for their many valuable discussions, constant caring and support.
To INESC Porto for providing the facilities without which my research work would not be
possible. A word of recognition to Dr. Paulo Marques and Dr. Ireneu Dias for their support
whenever it was needed.
To Dr. Manuel Joaquim Marques for all the scientific discussions that greatly contributed to my
work.
To Dr. Cristiano Cordeiro from Instituto de Física Gleb Wataghin, UNICAMP, for providing the
necessary means to develop my work, all the scientific discussions and valuable contributions to
the continuing of my research.

- x -
To Dr. Martin Becker from IPHT, Jena, for his availability in the fabrication of sensors for my
research work. This collaboration was also possible due to the support provided by COST Action
TD1001 (OFSeSa).
I also would like to acknowledge FCT - Fundação para a Ciência e a Tecnologia for the Ph.D. grant
SFRH/BD/47799/2008.
A final word goes to my family for their valuable support; especially to my Parents, without
whom I would not have gotten here, to my husband Paulo for his endless patience and constant
support, and to my beloved son André, who not always understood the reasons for my absence
or even for my lack of time to play with him. Despite my toughest days, he always blessed me
with his beautiful smile.
- xi -
Sumário
O trabalho apresentado nesta dissertação abrange a investigação e desenvolvimento de sensores
em fibra ótica para deteção “in situ” de parâmetros físico-químicos em ambientes líquidos e
gasosos. Foram objeto de estudo as configurações em fibra baseadas em tapers combinados com
redes de Bragg, interferência multimodal e interferometria com cavidades Fabry-Perot.
A familiarização com os métodos de fabricação de tapers em fibra ótica, assim como técnicas de
inscrição de redes de Bragg, permitiu reconhecer o potencial dessas ferramentas para o
desenvolvimento de novos dispositivos em fibra ótica. Diversas redes de Bragg foram inscritas
em tapers com diferentes diâmetros usando a técnica do laser de femtosegundo. Estas estruturas
em fibra foram estudadas para monitorização e deteção de hidrogénio em estado gasoso (H2).
O estudo e desenvolvimento de dispositivos de fibra baseados em interferência multimodal foi
um dos pontos principais neste programa de doutoramento. Topologias distintas com base neste
conceito foram desenvolvidas especificamente com o principal objetivo de deteção de índice de
refração de líquidos. A partir do conjunto de configurações propostas, é de salientar duas
topologias distintas: uma baseada em fibras microestruturadas e outra em fibra multimodo sem
bainha. O potencial das fibras microestruturadas foi explorado para a medição da variação do
índice de refração da água, induzida por alterações de temperatura. Por outro lado, a utilização
de uma fibra multimodo sem bainha, fundida entre duas fibras monomodo, foi uma forma
simples de obter elevada sensibilidade ao índice de refração, quando comparado com as
configurações em fibra já existentes baseadas em interferência multimodal. Com a escolha
adequada do diâmetro da fibra multimodo foi possível desenvolver um sensor de temperatura
altamente sensível na gama de índices de refração próxima da sílica pura.
Os sensores em fibra ótica baseados em revestimentos de filmes finos de paládio, e que visam a
deteção de H2, também foram tema de pesquisa neste programa de doutoramento. Portanto, as
diferentes configurações disponíveis na literatura, nomeadamente, os sensores em fibra
baseados em interferometria, intensidade e redes de Bragg e redes de período longo, foram
analisados em detalhe. No seguimento, uma rede de Bragg inscrita num taper em fibra e
revestida com filme fino de paládio foi especificamente desenvolvida e validada
experimentalmente para deteção de H2.
O programa de doutoramento contemplou também a conceção de novos dispositivos
interferométricos em fibra ótica para aplicações refratométricas. Comprovou-se a flexibilidade
de usar a propagação caótica obtida de uma fibra de sílica pura com uma geometria do tipo-D
para a medição simultânea de parâmetros, tais como, índice de refração, temperatura e
- xii -
deformação. Um interferómetro de duas ondas foi também desenvolvido, destinado à deteção de
diferentes ambientes gasosos, nomeadamente, nitrogénio (N2), dióxido de carbono (CO2) e
oxigénio (O2), por meio da variação de pressão do gás em estudo. Esta configuração baseou-se
em fundir uma pequena secção de uma haste de sílica pura (< 1 mm), com um forte
desalinhamento entre duas fibras monomodo, formando assim uma cavidade Fabry-Perot no ar.
Utilizando uma haste de sílica com um comprimento entre 1 a 5 mm, foi possível obter uma
cavidade Fabry-Perot no interior da fibra. Controlando a posição de desalinhamento da haste de
sílica, foram desenvolvidos dois dispositivos com configurações distintas: um filtro rejeita-banda
e um filtro passa-banda. A capacidade de usar este sensor como Fabry-Perot em fibra para
deteção refratométrica em meio gasoso foi estudada e caracterizada em detalhe.
O trabalho de investigação apresentado nessa dissertação foi apoiado em conceitos físicos e
validação experimental, e novos tópicos de pesquisas foram identificados para futura
investigação.

- xiii -
Abstract
The work presented in this Thesis encompasses the research and development of optical fiber
sensors for local assessment of physical and chemical parameters in liquid and gaseous
environments. Configurations based on tapered-fiber Bragg gratings, multimode interference
and Fabry-Perot interferometry were subject of research.
The familiarization with tapering methods and fiber Bragg grating inscription techniques
allowed visioning the potential of such tools for the developments of new optical fiber devices.
Several fiber Bragg gratings were inscribed in tapered fiber sections with different waist
diameters by means of femtosecond laser technique. These fiber structures were later on used
for H2 sensing purposes.
The study and development of multimode interference-based fiber devices was one of the
milestones of the PhD programme. Distinct topologies based on this concept were specifically
developed with the main goal of refractive index sensing in liquid medium. From the set of
configurations proposed, it can be mentioned here two distinct topologies: one based on
microstructured fibers and other based on coreless-multimode fibers. The potential of
microstructured optical fibers for sensing was explored for the measurement of refractive index
variation of water induced by changes in temperature. On the other hand, the use of a coreless-
multimode fiber spliced between two singlemode fibers was a simple means to obtain high
sensitivity to refractive index when compared with already existing multimode interference-
based fiber configurations. With proper choice of the multimode fiber diameter, a highly
sensitive temperature sensor in the refractive index range over 1.42 was developed.
Palladium-based optical fiber sensors aimed at H2 detection were also a research topic in the
PhD programme. Therefore, the different configurations available in the literature, namely,
interferometric-, intensity- and grating-based fiber sensors were reviewed in detail. Following
this path, a palladium-coated tapered-fiber Bragg grating structure was specifically developed
and experimentally validated for H2 detection.
The PhD programme included as well the conception of new interferometric fiber devices for
refractometric sensing. It was proved the flexibility of using chaotic propagation of a D-shaped
fiber for simultaneous measurement of parameters such as refractive index, temperature and
strain. A two-wave interferometer was also developed and aimed at the detection of different
gaseous environments, namely N2, CO2 and O2, by means of gas pressure variation. Such simple
configuration relied on splicing a small section of silica rod (< 1 mm) with a strong misalignment
in between two singlemode fibers, thus forming a Fabry-Perot cavity in air. When a section of

- xiv -
silica rod with length between 1 to 5 mm was used, a Fabry-Perot cavity inside this fiber was
obtained instead. By controlling the misalignment position of the silica rod, two distinct devices
were developed: a band-rejection and a bandpass filter. The ability to use this exquisite fiber
Fabry-Perot sensor for refractometric gas sensing was studied and characterized in detail.
The research work presented in this Thesis was performed with the support of physical
concepts and its experimental validation, and new research topics were aimed for future
investigation.

- xv -
Table of Contents
Acknowledgements ........................................................................................................................................ ix
Sumário .............................................................................................................................................................. xi
Abstract ........................................................................................................................................................... xiii
Table of Contents ........................................................................................................................................... xv
Table of Figures ............................................................................................................................................. xix
Introduction ....................................................................................................................................................... 1
1.1 Framework ........................................................................................................................................................ 1
1.2 Motivation and Objectives .......................................................................................................................... 2
1.3 Structure of Thesis ......................................................................................................................................... 2
1.4 Contributions .................................................................................................................................................... 3
1.5 List of Publications ......................................................................................................................................... 4
1.5.1 Publications in Scientific Journals ......................................................................................................... 4
1.5.2 Communications in National/International Conferences ........................................................... 5
Fiber Optic Tapers and Sensing .................................................................................................................. 7
2.1 Introduction ...................................................................................................................................................... 7
2.2 Fiber Tapers – A Tool for Sensing ............................................................................................................ 8
2.3 Fabrication Techniques ............................................................................................................................. 10
2.3.1 Electric arc discharge technique .......................................................................................................... 11
2.3.2 CO2 laser beam technique ....................................................................................................................... 13
2.3.3 VYTRAN-glass processing workstation ............................................................................................. 19
2.4 Fiber Bragg Gratings with Taper Structures .................................................................................... 22
2.4.1 FBGs inscription with interferometric KrF excimer laser technique ................................... 22
2.4.2 FBGs inscription with DUV femtosecond laser technique ......................................................... 25
2.5 Strain Sensing with Tapered-FBG Structures .................................................................................. 29
2.6 Conclusions .................................................................................................................................................... 37
Fiber Optic Sensing Based on Multimode Interference .................................................................. 39
- xvi -
3.1 Introduction ................................................................................................................................................... 39
3.2 Historic Overview of MMI-based Fiber Sensing .............................................................................. 40
3.3 Operating Principle of Singlemode-Multimode-Singlemode Fiber Structures .................. 45
3.3.1 Self-imaging concept ................................................................................................................................. 50
3.4 An Optical Fiber Refractometer based on Multimode Interference in a Reflective
Configuration ............................................................................................................................................................... 52
3.4.1 Introduction .................................................................................................................................................. 52
3.4.2 Sensing concept ........................................................................................................................................... 53
3.4.3 Experimental configuration and results ........................................................................................... 54
3.4.4 FBG-based interrogation system and experimental results ..................................................... 59
3.5 Refractometric Structure based on Large-Core Air-Clad Photonic Crystal Fibers ........... 63
3.5.1 Introduction .................................................................................................................................................. 63
3.5.2 Sensing concept and experimental configuration ........................................................................ 64
3.5.3 Experimental results ................................................................................................................................. 65
3.6 Ultra High-Sensitive Temperature Fiber Sensor based on Multimode Interference ....... 69
3.6.1 Introduction .................................................................................................................................................. 69
3.6.2 Working principle and numerical results ........................................................................................ 69
3.6.3 Experimental results ................................................................................................................................. 71
3.7 Curvature Sensing using SMS Structures ........................................................................................... 77
3.7.1 Introduction .................................................................................................................................................. 77
3.7.2 Temperature and strain independent curvature SMS-based sensor .................................... 78
3.7.3 Curvature and temperature discrimination using a multimode interference fiber optic
structure – A proof of concept ......................................................................................................................... 82
3.8 Conclusions .................................................................................................................................................... 91
Palladium-Based Fiber Optic Sensors for Hydrogen Detection ................................................... 95
4.1 Introduction ................................................................................................................................................... 95
4.2 Concept of Palladium-based Hydrogen Sensing ............................................................................. 96
4.3 Palladium-based Optical Fiber Sensors for H2 Detection ............................................................ 97
4.3.1 Interferometric-based sensors ............................................................................................................ 99

- xvii -
4.3.2 Intensity-based sensors ........................................................................................................................ 102
4.3.3 Grating-based sensors ........................................................................................................................... 109
4.3.4 Comparison between different sensing approaches ................................................................ 112
4.4 Hydrogen Sensing based on Pd-coated Tapered-FBG Fabricated by DUV Femtosecond
Laser Technique ....................................................................................................................................................... 114
4.4.1 Introduction .............................................................................................................................................. 114
4.4.2 Hydrogen sensing.................................................................................................................................... 115
4.4.3 Temperature Effect ................................................................................................................................ 117
4.1 Conclusions .................................................................................................................................................. 118
New Advances in Fiber Refractometric Sensors .............................................................................. 121
5.1 Introduction ................................................................................................................................................. 121
5.2 Recent Developments on Optical Fiber-based Refractometers .............................................. 121
5.3 Sensing with a D-shaped Optical Fiber with Chaotic Propagation ........................................ 124
5.3.1 Introduction ................................................................................................................................................ 124
5.3.2 Working principle and sensing configuration .............................................................................. 125
5.3.3 Sensing characteristics ........................................................................................................................... 127
5.4 Pressure Sensing based on an All-Fiber Fabry-Pérot Interferometer ................................. 130
5.4.1 Introduction ................................................................................................................................................ 130
5.4.2 Experimental setup and results ......................................................................................................... 132
5.5 Gas Refractometry based on an All-Fiber Spatial Optical Filter ............................................. 137
5.5.1 Experimental Results .............................................................................................................................. 137
5.6 Conclusions .................................................................................................................................................. 144
Conclusions and Future Work ................................................................................................................ 145
6.1 Conclusions .................................................................................................................................................. 145
6.2 Future Work ................................................................................................................................................. 146
Appendixes .................................................................................................................................................... 149
Appendix A – Temperature Dependence of Refractive Index of Water ............................................. 149
Appendix B – Fabry-Perot Interferometer .................................................................................................... 150
References ..................................................................................................................................................... 157

- xviii -
- xix -
List of Figures
Figure 2.1 Schematic representation of the optical fiber bi-taper, a common configuration for a modal Mach-Zehnder
interferometer. ....................................................................................................................................................................................................................... 8
Figure 2.2 Schematic of an optical fiber taper. ................................................................................................................................................... 11
Figure 2.3 Microscope image on an optical fiber taper made by electric arc discharge. ............................................................... 12
Figure 2.4 Taper waist diameter with number of arc discharges. ............................................................................................................ 12
Figure 2.5 Losses introduced in the taper fabrication process. ................................................................................................................. 13
Figure 2.6 Experimental setup of a CO2-based bidirectional indirect laser heating process used for taper fabrication:
a) front view and b) top view. ...................................................................................................................................................................................... 14
Figure 2.7 Profile of 30 µm-diameter tapers fabricated with a heating length of a) 12 mm and b) 10 mm. ....................... 16
Figure 2.8 Profile of 40 µm-diameter tapers fabricated with a heating length of 13 mm, and laser scanning velocities
of a) 0.01 mm/s and b) 0.009 mm/s. ........................................................................................................................................................................ 17
Figure 2.9 Profile of 50 µm-diameter tapers fabricated with the following parameters: a) α = 0, Lo = 14 mm and
v = 0.01 mm/s; b) α = 0, Lo = 15 mm and v = 0.015 mm/s. ............................................................................................................................ 17
Figure 2.10 Profile of 50 µm-diameter tapers fabricated with the parameters α = -0.25 and v = 0.01 mm/s. .................. 18
Figure 2.11 a) VYTRAN (GPX-3400) glass processing platform and b) detail of the filament heater. .................................... 19
Figure 2.12 Graphic interface to control taper properties. .......................................................................................................................... 20
Figure 2.13 Profile of tapers with a) 30 µm, b) 40 µm and c) 50 µm in diameter. ........................................................................... 21
Figure 2.14 Interferometric KrF excimer laser setup for FBG inscription. .......................................................................................... 23
Figure 2.15 Schematic of the TFBG+FBG pair based sensing head. ......................................................................................................... 24
Figure 2.16 Optical spectrum of TFBG+FBG pair inscribed on photosensitive fiber. The FBG at the short wavelength
side is positioned in the 40 µm-diameter taper waist section. .................................................................................................................... 24
Figure 2.17 Talbot interferometric inscription setup with deep ultraviolet femtosecond laser source. .............................. 25
Figure 2.18 Optical spectra of the TFBG+FBG pairs inscribed on standard SMF. The FBG at the short wavelength side
is positioned in the taper waist section with a) 30, b) 40 and c) 50 µm-diameter (TFBG1, TFBG2 and TFBG3,
respectively). ........................................................................................................................................................................................................................ 26
Figure 2.19 Optical spectrum of the tapered-FBG with 10 µm in diameter, inscribed by DUV femtosecond laser
technique. ............................................................................................................................................................................................................................... 28
Figure 2.20 Optical spectrum of FBG array inscribed on standard SMF................................................................................................ 28
Figure 2.21 Schematic of the sensing head based on a FBG in series with a TFBG. ......................................................................... 30
Figure 2.22 Wavelength shift versus strain variation for the a) FBGs and b) TBGs. ........................................................................ 33
Figure 2.23 Schematic of the sensing head fiber tip based on a TFBG+FBG pair. ............................................................................. 34
- xx -
Figure 2.24 Relationship between the strain sensitivity of both a) FBG and b) TFBG with taper waist diameter, for the
two sensing heads studied and with distinct total lengths. ........................................................................................................................... 36
Figure 3.1 Schematic of the SMF-MMF tip + mirror configuration [63]. ................................................................................................ 40
Figure 3.2 Schematic of the SMF-MMF tip sensor [65]. .................................................................................................................................. 41
Figure 3.3 Schematic of the SMS structure based on an MMF core section [66]. .............................................................................. 41
Figure 3.4 Generic scheme of the SMS fiber structure. ................................................................................................................................... 46
Figure 3.5 a) Intensity distribution of electric field on the xz plane; b) coupling overlap integral between the
calculated field at a given MMF length and the input field (SMF fundamental mode); c) computed transverse field
profile of light for MMF lengths of Z1 = 43.1, Z2 = 32.8 and Z3 = 11.1 mm, corresponding to self-imaging, maximum
coupling efficiency and no coupling of light to the output SMF, respectively. ...................................................................................... 49
Figure 3.6 Experimental setup, with detail of the MMI fiber tip structure. .......................................................................................... 54
Figure 3.7 Spectral response of a) MMI1 and b) MMI2 to refractive index variation. ...................................................................... 55
Figure 3.8 Variation of optical power, P, with refractive index, for MMI1 ( • ) and MMI2 ( o ). .................................................... 56
Figure 3.9 Spectral response of a) MMI1 and b) MMI2 to temperature variation, T, and detail of optical spectrum
variation with temperature. .......................................................................................................................................................................................... 57
Figure 3.10 Shift of wavelength with temperature variation for MMI1 ( • ) and MMI2 ( o ). ......................................................... 58
Figure 3.11 Variation of optical power with temperature, for MMI1 ( • ) and MMI2 ( o ). .............................................................. 58
Figure 3.12 Experimental setup of the interrogation system and detail of the sensing head. .................................................... 60
Figure 3.13 Spectral response of the MMI-based fiber tip structure in reflection............................................................................ 60
Figure 3.14 The two discrete narrow sources based on fiber Bragg gratings. ................................................................................... 61
Figure 3.15 Refractive index measurement using the setup of Figure 3.12. ....................................................................................... 62
Figure 3.16 Determination of the refractive index resolution obtained with the setup of Figure 3.12. ................................ 62
Figure 3.17 Experimental setup of the SMS structure and detail of each PCF implemented. ..................................................... 64
Figure 3.18 Optical spectra of a) air-clad PCF1, b) air-clad PCF2 and c) air-clad PCF-based sensing structure. ................ 65
Figure 3.19 a) Temperature response in air of the two loss bands centered at λ1 and λ2, for the air-clad PCF-based
sensing structure; b) wavelength shift of the sensing head to temperature variations of water. .............................................. 66
Figure 3.20 Refractive index response of the sensing head to temperature variations of water. Inset, numerical
analysis of the refractive index response of water to temperature variations. ................................................................................... 67
Figure 3.21 Wavelength variation of the resonance peak λ2 induced by a step change of the temperature of water. ... 68
Figure 3.22 Experimental setup utilized, and detail of the coreless-MMF based-SMS structure. ............................................. 70
Figure 3.23 Intensity distribution on the xz plane of electric field at 1550 nm-wavelength, for the SMS fiber structure
with a coreless-MMF diameter of 55 µm, when exposed to external RI of (a) 1.0, (b) 1.3, (c) 1.36 and (d) 1.42. .............. 71
Figure 3.24 Experimental spectral response of SMS1, SMS2 and SMS3 to distinct RI, viz. 1, 1.33 and 1.4. ............................ 72

- xxi -
Figure 3.25 Wavelength shift of fiber structures SMS1, SMS2 and SMS3 in response to RI variations as a) numerical
data and b) experimental results. ............................................................................................................................................................................... 73
Figure 3.26 Wavelength shift of sensing structure SMS1 to temperature variation, in the high sensitivity RI range
(1.42-1.43) using a liquid RI with a nominal value of 1.44 (20 °C), as numerical data and experimental results. ............. 75
Figure 3.27 a) Intensity variation of SMS structure with coreless-MMF diameter of 125 µm, and coated with 0.5, 0.75,
1 and 1.5 µm-thick polymer layers, when submitted to external RI in the range 1.42-1.48; b) spectral changes of SMS
structure with coreless-MMF diameter of 125 µm coated with a 0.75 µm-thick polymer layer, when submitted to
external RI in the range 1.44-1.47. ............................................................................................................................................................................. 76
Figure 3.28 Experimental setup with the sensing head detail. .................................................................................................................. 79
Figure 3.29 Optical spectrum of the SMS structure when MMF length is 40 mm. ............................................................................ 79
Figure 3.30 Curvature response for: a) the two loss bands centered at λ1 and λ2; and b) the measurement parameter,
∆(λ2–λ1)................................................................................................................................................................................................................................... 80
Figure 3.31 Temperature response for: a) the two loss bands centered at λ1 and λ2, and b) the measurement
parameter, ∆(λ2–λ1). ......................................................................................................................................................................................................... 81
Figure 3.32 Strain response for: a) the two loss bands centered at λ1 and λ2, and b) the measurement parameter, ∆
(λ2–λ1). ..................................................................................................................................................................................................................................... 81
Figure 3.33 Experimental setup and detail of the coreless-MMF based-SMS fiber structure. .................................................... 82
Figure 3.34 Intensity distribution of the electric field on the xz plane at 1550 nm-wavelength, for the bandpass filters
with a) 125 µm and b) 55 µm coreless-MMF diameters. ................................................................................................................................ 84
Figure 3.35 Spectral responses of the bandpass filters with coreless-MMF diameters of a) 125 and b) 55 µm
(BP-SMS125 and BP-SMS55, respectively)................................................................................................................................................................. 85
Figure 3.36 Curvature response of the bandpass filters, ( o ) BP-SMS125 and ( • ) BP-SMS55. ...................................................... 85
Figure 3.37 Intensity distribution of the BP-SMS125 electric field on the xz plane at 1550 nm-wavelength, and for
different curvatures applied: a) straight fiber, b) R = 50 cm and c) R = 30 cm. ................................................................................... 86
Figure 3.38 Spectral responses of the band-rejection filters with coreless-MMF diameters of a) 125 and b) 55 µm
(BR-SMS125 and BR-SMS55, respectively). ............................................................................................................................................................... 87
Figure 3.39 Curvature response of the band-rejection filters, ( o ) BR-SMS125 and ( • ) BR-SMS55. .......................................... 87
Figure 3.40 Wavelength shift versus temperature variation for the bandpass filters. ................................................................... 88
Figure 3.41 Wavelength shift versus temperature variation for the band-rejection filters......................................................... 89
Figure 4.1 Graphical representation of typical complex refractive index of palladium variations [132].............................. 97
Figure 4.2 Generic form of optical-based H2-sensors, and underlying operating principles: a) interferometric-based,
b) intensity-based and c) fiber grating-based sensors. .................................................................................................................................... 98
Figure 4.3 Schematic of fiber optic hydrogen sensor based on the Mach-Zehnder interferometer [133]. ........................... 99
Figure 4.4 Schematic of fiber optic hydrogen sensor based on the Fabry-Perot interferometer [136]. ............................. 100
Figure 4.5 Schematic of fiber optic hydrogen sensor based on two fiber optic LPGs [139]. ..................................................... 101

- xxii -
Figure 4.6 Schematic of fiber optic hydrogen sensor based on micromirror [143]. ..................................................................... 103
Figure 4.7 Schematic of fiber optic hydrogen sensor based on evanescent field [145]. ............................................................. 103
Figure 4.8 Schematic of fiber optic hydrogen sensor based on Pd-coated tapered SMF [150]. ............................................. 104
Figure 4.9 Schematic of fiber optic hydrogen sensor based on Pd-coated side-polished fiber [158]. ................................. 106
Figure 4.10 Schematic of fiber optic hydrogen sensor based on Pd-coated FBG [167]. ............................................................. 109
Figure 4.11 Schematic of fiber optic hydrogen sensor based on Pd-coated LPG [172]............................................................... 110
Figure 4.12 Schematic representation of sensitivity versus response time of the various types of Pd-based, fiber optic
hydrogen sensors. ........................................................................................................................................................................................................... 113
Figure 4.13 Optical spectrum of TFBG (λH) and standard (λT) FBG inscribed by DUV femtosecond laser technique. 115
Figure 4.14 Experimental setup and detail of the FBG-based sensing head. .................................................................................... 116
Figure 4.15 Wavelength shift of the sensing head for increasing H2 concentration in N2 environment and atmospheric
pressure: a) 50 µm-TFBG with 150 nm-Pd coating (λH), b) uncoated standard FBG (λT) and c) temperature
compensation (λH − λT)................................................................................................................................................................................................. 117
Figure 4.16 Temperature sensitivity of uncoated standard FBG (λT1), standard FBG with 150 nm-Pd coating (λT2) and
50 µm-TFBG with 150 nm-Pd coating (λT3). ...................................................................................................................................................... 118
Figure 5.1 a) Schematic of the sensing head structure and detail of the D-shape fiber illuminated by the
supercontinuum broadband source; b) Cross section of the D-shape fiber with observed asymmetry of the structure.
.................................................................................................................................................................................................................................................. 125
Figure 5.2 a) Optical spectrum of the D-shape fiber-based sensing head and b) detail of the wavelength peaks used for
parameter measurement. ............................................................................................................................................................................................ 126
Figure 5.3 Refractive index response of the sensing head for the loss bands centered at λ1, λ2 and λ3. ............................. 127
Figure 5.4 Temperature response of the sensing head for the loss bands centered at λ1, λ2 and λ3. .................................... 128
Figure 5.5 Strain response of the sensing head for the loss bands centered at λ1, λ2 and λ3. ................................................... 129
Figure 5.6 Experimental setup of the interrogation system, detail of the sensing head and its microscope image. .... 132
Figure 5.7 Schematic of the fiber geometry for the proposed FFPI with an air-cavity. The center-to-center offset
between the silica rod and the SMFs is about 50 µm. X and Y view parameters are the offset between both fibers set in
each axis. .............................................................................................................................................................................................................................. 133
Figure 5.8 Spectral response of the FFPI structure in transmission. .................................................................................................... 134
Figure 5.9 Wavelength shift versus pressure variation when FFPI is submitted to CO2, N2 and O2 gaseous
environments. ................................................................................................................................................................................................................... 134
Figure 5.10 Refractive index change of the FFPI cavity versus pressure variation when submitted to CO2, N2 and O2
gaseous environments. ................................................................................................................................................................................................. 135
Figure 5.11 Experimental setup and detail of each sensing head used, namely, the bandpass and band-rejection
filters. .................................................................................................................................................................................................................................... 137

- xxiii -
Figure 5.12 Schematic of the fiber geometry for the proposed FFPI where the silica rod is the FP cavity. The center-to-
center offset between is 37 µm. ............................................................................................................................................................................... 138
Figure 5.13 a) Schematic and b) microscope image of the sensing head; c) optical spectrum of the band-rejection
filter. ....................................................................................................................................................................................................................................... 139
Figure 5.14 a) Schematic and b) microscope image of the sensing head; c) optical spectrum of the bandpass filter. 140
Figure 5.15 Intensity distribution of electric field on the (a) xz plane and (b)-(e) xy plane at different fiber lengths. 142
Figure 5.16 Wavelength shift versus refractive index variation of nitrogen for the ( o ) bandpass and ( • ) band-
rejection optical filters. ................................................................................................................................................................................................. 143
Figure 7.1 a) Refractive index of water as function of wavelength. b) Temperature dependence of the refractive index
of water. ............................................................................................................................................................................................................................... 149
Figure 7.2 Fabry-Perot cavity with multiple reflected and transmitted beams. ............................................................................. 150
Figure 7.3 Transmissivity of a Fabry-Perot cavity, for different values of the finesse coefficient, and considering θi = 0,
n = 1.444 and L = 50 µm. .............................................................................................................................................................................................. 153
Figure 7.4 Reflectivity function of a Fabry-Perot cavity, for different values of the finesse coefficient, and considering
θi = 0, n = 1.444 and L = 50 µm.................................................................................................................................................................................. 154

- xxiv -
- 1 -
1
Introduction
1.1 Framework
Nowadays, the main drive of research in optical fiber sensing has been to produce optical
fiber-based techniques which can be used for a variety of different sensor purposes, providing a
foundation for an effective measurement technology, competitive with conventional methods
already established in the market. Therein lays the recipe for the success of optical fiber sensors
— in tackling difficult measurement situations where conventional sensors are not well suited to
use in a particular environment.
Optical fiber sensors have indeed earned a strong interest due to their ability to monitor several
physical and chemical parameters at specific spatial points, either as a sensing tip device or in
large areas via multiple sensing regions distributed along the optical fiber. Its immunity to
electromagnetic interference has been an attractive feature that enabled the use of optical fiber
sensors in harsh environments. In the case of biological processes, the optical fiber sensor is
minimally invasive and can be placed in direct contact with the culture medium, providing real-
time monitoring, being no longer necessary to sample the culture medium for posterior
laboratory analysis.
Following this path, the work developed in this PhD programme encompasses the research and
development of optical fiber sensors for local assessment of physical and chemical parameters in
liquid and gaseous environments, and that may provide in-situ and real time detection,
multiplexing capabilities and high resolution of signal detection – which has been a demand in
environmental and biochemical processes where often sensor solutions are far from
accomplishing these tasks.

Introduction
- 2 -
1.2 Motivation and Objectives
The primary motivation of this PhD program relies in the research and development of optical
fiber sensors with specialty fibers and configurations for the detection of refractive index in
liquid and gaseous environments. It was also motivation to acquire further knowledge in the
study of physics concepts and fabrication techniques that underlined the development of the
optical fiber sensors presented in this thesis.
The objectives looked for this PhD programme were:
• Study and development of optical fiber structures based on microstructured fibers for
sensing applications;
• Fabrication and characterization of FBGs in tapered-fiber structures using femtosecond
laser technology;
• Study and development of multimode interference-based fiber devices for refractometric
applications;
• Study of the sensing mechanism, fabrication and experimental evaluation of Pd-based
optical fiber configurations for point measurement of gaseous H2;
• Study and development of interferometric fiber structures for detections of gaseous
environments.
1.3 Structure of Thesis
Chapter 1 provides the framework, motivation and objectives of the PhD programme as well as
the structure of the thesis. It also describes the main contributions resultant from the work
developed during the PhD programme and lists the scientific publications achieved during the
PhD period of time.
Chapter 2 discusses three fusing-and-pulling fabrication methods of optical fiber tapers, namely,
electric arc discharge, CO2 laser beam and VYTRAN glass processing workstation. The first
technique was used to study the adiabatic criteria in the fabrication process of microtapers (or
abrupt tapers); the latter two provided the fabrication of several tapers with different waist
diameters and lengths – detailed comparison between these two fabrication techniques is
performed. The main focus of this chapter is on the fabrication of FBGs in tapered fibers using
methods based on the excimer laser and femtosecond laser techniques. These devices are later
on used for H2 sensing purposes, as addressed in chapter 5.

Introduction
- 3 -
Chapter 3 presents the study and development of multimode interference-based fiber devices.
Distinct topologies based on this type of fiber structure are proposed with the main goal of
measuring refractive index. The concept was applied in the development of SMF-MMF tips, SMS
with large-core air-clad PCFs and SMS with coreless-MMFs. The influence of curvature, strain
and temperature in SMS structures is also studied. Furthermore, it is shown the flexibility of
these devices in performing curvature measurement with negligible sensitivity to temperature
and strain, and discrimination of curvature and temperature using the matrix method.
Chapter 4 focuses on Pd-based optical fiber sensors for H2 detection. Here, the various types of
Pd-based optical fiber sensors available for H2 sensing are reviewed in detail. The working
principle and main reported configurations of interferometric-, intensity- and grating-based
fiber sensors are outlined. Due to the potential of grating-based sensors, a Pd-coated tapered-
fiber Bragg grating structure was specifically developed and its experimental validation to H2
detection is presented.
Chapter 5 presents the development of refractometer sensors based on interferometric
configurations. Two distinct topologies are presented for refractometric sensing, namely with
chaotic propagation by means of a D-shaped fiber and high-finesse FP interferometry. The
ability to use the FP sensor for gas sensing is also presented.
Chapter 6 summarizes the main results achieved in this PhD programme and addresses the
guidelines for future research work.
1.4 Contributions
The main contributions attained with the work developed during this PhD programme are
summarized as follows:
• The research on a multimode interference-based PCF structure provided de possibility of
detecting refractive index changes induced by temperature variations in water. The use
of a large-core air-clad PCF sensor combined the high potential of PCFs in optical sensing
with the simplicity of the proposed configuration – thus avoiding the use of etching or
tapering techniques to increase sensitivity of the sensor to the surrounding medium.
• The development of a Pd-coated tapered-FBG was specifically developed for the
detection of H2 in gaseous environment. A detailed study on the characteristics and
performances of the various types of Pd-coated fiber sensors allowed envisioning the
potentiality of grating-based sensors for detection of H2.
Introduction
- 4 -
• A proof of concept was performed with multimode interference-based fiber devices
(bandpass and band-rejection filters). The possibility of achieving curvature and
temperature discrimination with two in-line bandpass filters by means of the matrix
method was successfully demonstrated.
• The pursuit of novel configurations for refractometric applications conducted to the
development of an FP sensor with an unusual mechanism of guidance of light that
enables the interferometric behavior along the said fiber sensor. The fiber FP
interferometer presented unique spectral characteristics that provided high sensitivity
in the detection of different gaseous environments, by means of refractive index
variations.
1.5 List of Publications
Several works were published during the PhD period of time; 11 publications in scientific
journals as first author, 11 communications in national/international conferences, two of which
were invited talks. Other contributions in the area of research during the PhD gave rise to 11
publications in scientific journals and 11 communications in national/international conferences
as co-author. The following list refers only the publications as first author.
1.5.1 Publications in Scientific Journals
1. S. Silva, L. Coelho, J. M. Almeida, O. Frazão, J. L. Santos, F. X. Malcata, M. Becker, M. Rothhardt, and H. Bartelt, “H2 Sensing
Based on a Pd-Coated Tapered-FBG Fabricated by DUV Femtosecond Laser Technique,” IEEE Photon. Technol. Lett., 25 (4),
401-403 (2013).
2. S. Silva, Edwin G. P. Pachon, M. A. R. Franco, P. Jorge, J. L. Santos, F. Xavier Malcata, C. M. B. Cordeiro, and O. Frazão,
“Curvature and Temperature Discrimination Using Multimode Interference Fiber Optic Structures– A Proof of Concept,” J.
Lightwave Technology, 30 (23), 3569-3575 (2012).
3. S. Silva, L. Coelho, P. Roy, and O. Frazão, “Interferometer Based on a D-shape Chaotic Optical Fiber for Measurement of
Multiparameters,” Photonic Sensors, DOI: 10.1007/s13320-012-0078-z (2012).
4. S. Silva, L. Coelho, R. M. André, and O. Frazão, “Gas refractometry based on an all-fiber spatial optical filter,” Opt. Lett., 37
(16), 3450-3452 (2012).
5. S. Silva, Edwin G. P. Pachon, Marcos A. R. Franco, Juliano G. Hayashi, F. Xavier Malcata, O. Frazão, P. Jorge, and Cristiano M.
B. Cordeiro, “Ultra-High Sensitivity-Temperature Fiber Sensor Based on Multimode Interference,” Appl. Optics, 51 (14),
2542-2548 (2012).
6. S. Silva, O. Frazão, J. L. Santos, and F. X. Malcata, “A Reflective Optical Fiber Refractometer Based on Multimode
Interference,” Sensor Actuat. B, 161, 88-92 (2012).
7. S. F. Silva, L. Coelho, O. Frazão, J. L. Santos and F. X. Malcata, “A review of palladium-based fiber optic sensors for molecular
hydrogen detection,” IEEE Sensors J., 12 (1), 93-102 (2012).
8. S. Silva, O. Frazão, J. Viegas, L. A. Ferreira, F. M. Araújo, F. X. Malcata, and J. L. Santos, “Temperature and strain-independent
curvature sensor based on a singlemode/multimode fiber optic structure,” Meas. Sci. Technol., 22, 085201 (2011).
9. S. F. O. Silva, J. L. Santos, J. Kobelke, K. Schuster, O. Frazão, “Simultaneous measurement of three parameters using an all
fibre Mach-Zehnder interferometer based on suspended twin-core fibre,” Opt. Eng., 50, 030501 (2011).
Introduction
- 5 -
10. S. Silva, J. L. Santos, F. Xavier Malcata, J. Kobelke, K. Schuster, and O. Frazão, “Optical refractometer based on large-core,
air-clad photonic crystal fibers,” Opt. Lett., 36, 852-854 (2011).
11. S. F. O. Silva, L. A. Ferreira, F. M. Araújo, J. L. Santos, O. Frazão, “Fibre Bragg grating structures with fused tapers,” Fiber
Integrated Opt., 30, 9-28 (2011).
1.5.2 Communications in National/International Conferences
1. S. Silva, L. Coelho, and O. Frazão, “Gas pressure sensing with an all fiber Fabry-Pérot interferometer,” RIAO/OPTILAS 2013
- VIII Iberoamerican Conference on Optics and XI Latinoamerican meeting on Optics, Lasers and Applications, Porto,
Portugal, 22-26th July, 2013.
2. S. Silva, L. Coelho, and O. Frazão, “Pressure Sensor based on an all-fiber Fabry-Pérot interferometer for different gaseous
environments,” EWOFS 2013 - Fifth European Workshop on Optical Fibre Sensors 2013, Kraków, Poland, 19-22th May,
2013.
3. S. Silva, L. Coelho, R. M. André, and O. Frazão, “New Spatial Optical Filters for Gas Refractometry,” OFS - 22th International
Conference on Optical Fiber Sensors, Beijing, China, 15-19th October, 2012.
4. S. Silva, L. Coelho, J. L. Santos, F. X. Malcata, M. Becker, M. Rothhardt, H. Bartelt, and O. Frazão, “Hydrogen pressure sensor
based on a tapered-FBG written by DUV femtosecond laser technique,” BGPP Conference, Colorado, United States, 17-21th
June, 2012.
5. S. Silva, O. Frazão, L. A. Ferreira, F. M. Araújo, and J. L. Santos, “Multimode Interference as a Tool for Fiber Sensing” –
Invited talk, Conference on Fiber Optic Sensors and Applications IX, Baltimore, United States, 23-27th April, 2012.
6. S. Silva, J. L. Santos, F. X. Malcata, J. Kobelke, K. Schuster, and O. Frazão, “Multimodal Interference Based on Large-Core Air-
Clad Photonic Crystal fibres for Simultaneous Measurement of Multiparameters,” OFS - 21th International Conference on
Optical Fiber Sensors, Ottawa, Canada, 15-19th May, 2011.
7. S. Silva, O. Frazão, J. L. Santos, and F. X. Malcata, “A Simple Interrogation Technique for Refractive Index Measurement
using Multimode Interference Structure,” AOP 2011 - International Conference on Applications of Optics and Photonics,
Braga, Portugal, 3-7th May, 2011.
8. S. Silva, J. Viegas, J. L. Santos, L. A. Ferreira, F. M. Araújo, and O. Frazão, “Fiber Optic Sensors based on Multimode
Interference” – Invited talk, Photonics 2010 - The International Conference on Fiber Optics and Photonics, Guwahati,
India, 11-15th December, 2010.
9. S. Silva, O. Frazão, L. A. Ferreira, F. Araújo, F. X. Malcata, and J. L. Santos, “Temperature and Strain Independent Curvature
Sensor based on Multimode Interference,” EWOFS 2010 - Fourth European Workshop on Optical Fibre Sensors 2010,
Porto, Portugal, 8-10th September, 2010.
10. S. Silva, O. Frazão, L. A. Ferreira, F. M. Araújo, F. X. Malcata, and J. L. Santos, “Refractive Index Fiber Optic Sensor Based on
Multimode Interference,” SEON 2010 – VIII Symposium on Enabling Optical Networks and Sensors, Porto, Portugal, 25th
July, 2010.
11. S. F. O. Silva, O. Frazão, J. L. Santos, L. A. Ferreira, and F. M. Araújo, “Strain Characterization of Fibre Bragg Grating
Structures with Fused Tapers,” IRF – 3rd International Conference on Integrity, Reliability & Failure, Porto, Portugal, 20-
24th July, 2009.

- 6 -
- 7 -
2
Fiber Optic Tapers and Sensing
2.1 Introduction
The singlemode fiber taper is a simple structure and the basis of many optical fiber devices
which have been used in several contexts, such as in fiber lasers [1], biosensors [2] and
interferometry [3]. An optical fiber taper presents, as its fundamental characteristic, the
interaction of the evanescent field of the guided mode with the surrounding medium. This
property enables the use of these structures as an alternative to core-exposed fibers, commonly
used in sensing. In 1981, Kawasaki et al. [4] demonstrated for the first time the importance of
tapers in the fabrication of singlemode fiber (SMF) couplers. These devices have been also very
important in the conception of beam expanders [5] and for the measurement of physical
parameters such as curvature [6]. Kumar et al. [7] presented in turn the first refractometer
based on a tapered multimode fiber. The combination of long period gratings (LPGs) [8] or fiber
Bragg gratings (FBGs) [9] with tapers has also been explored to increase the sensitivity of these
structures to certain physical parameters such as refractive index (RI) and strain. The
interferometric configurations based on tapers also allowed new sensing possibilities and
several optical devices have already been reported. The taper-based Mach-Zehnder
interferometer (MZI) is the most common configuration and in its basic form relies on the
fabrication of two tapers in series (bi-taper) along the optical fiber [10]. Michelson and modal
interferometers have also been subject of study either to measure curvature [11], flow rates [12]
or RI, temperature and strain [13].
This Chapter focuses on optical fiber tapers and within the frame of the PhD programme several
tapered structures were made with distinct fabrication methods for sensing applications. Firstly,
an overview is presented of the most common topologies based on optical fiber tapers that are
used for RI sensing. Afterwards, three fusing-and-pulling fabrication methods are discussed:
electric arc discharge, CO2 laser beam and VYTRAN glass processing workstation. The first one
was used to study the adiabatic criteria in the fabrication process of microtapers (or abrupt
Fiber Optic Tapers and Sensing
- 8 -
tapers); the latter two provided the fabrication of several tapers with different waist diameters
and lengths – comparison between the fabrication techniques was preformed. Following, the
fabrication of FBGs in tapered fibers is presented – methods based on the excimer laser or
femtosecond laser technique are briefly discussed. Lastly, sensitivity results of tapered-FBG
structures to strain are also presented.
2.2 Fiber Tapers – A Tool for Sensing
In the last 30 years, tapers have played an important role in fiber sensing. With the development
of new fabrication techniques and new types of fiber, taper technology has renewed its presence
in the field. In the past couple of years, the development of these simple structures has been
mainly focused on the enhancement of sensitivities and optimization of configurations. The
small size provides flexibility for a wide range of configurations and the intrinsic high sensitivity
to the external medium makes taper-based fiber devices an attractive technology for RI sensing.
Taper-based MZI has been the most successful configuration developed for refractometry due to
the ease of fabrication. Sensitivities to RI can be found in a wide range, scaling from 20 to
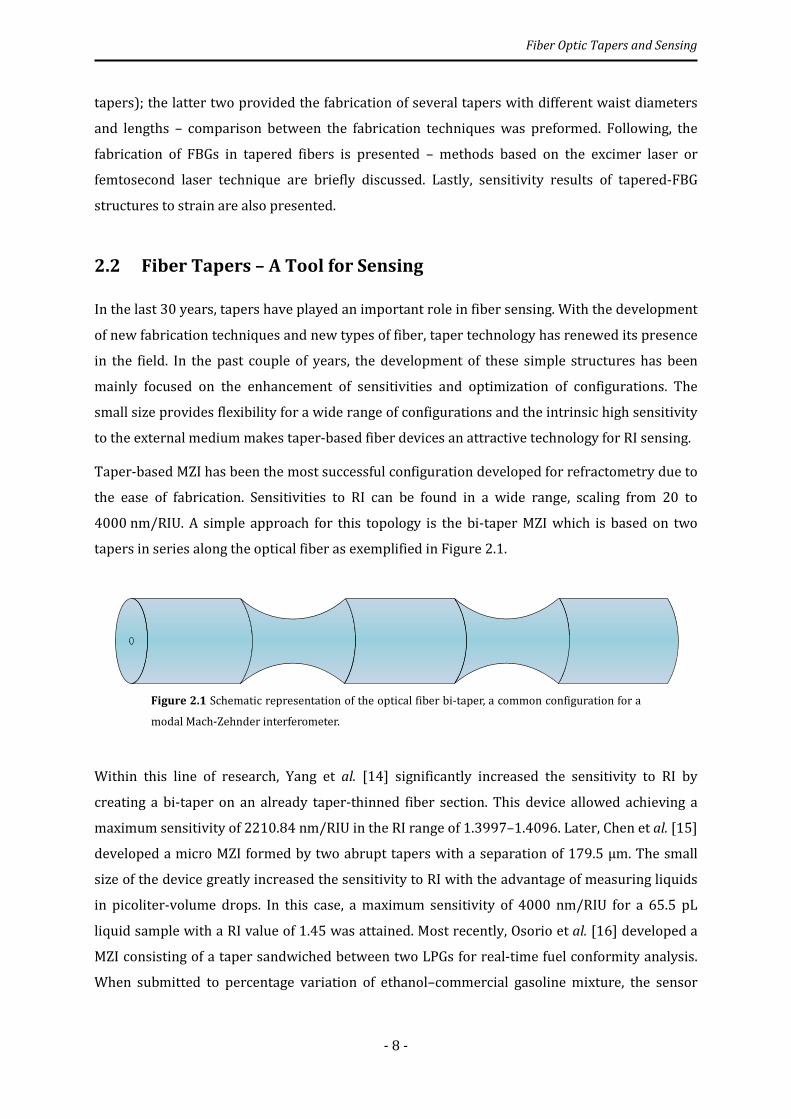
4000 nm/RIU. A simple approach for this topology is the bi-taper MZI which is based on two
tapers in series along the optical fiber as exemplified in Figure 2.1.
Figure 2.1 Schematic representation of the optical fiber bi-taper, a common configuration for a
modal Mach-Zehnder interferometer.
Within this line of research, Yang et al. [14] significantly increased the sensitivity to RI by
creating a bi-taper on an already taper-thinned fiber section. This device allowed achieving a
maximum sensitivity of 2210.84 nm/RIU in the RI range of 1.3997–1.4096. Later, Chen et al. [15]
developed a micro MZI formed by two abrupt tapers with a separation of 179.5 μm. The small
size of the device greatly increased the sensitivity to RI with the advantage of measuring liquids
in picoliter-volume drops. In this case, a maximum sensitivity of 4000 nm/RIU for a 65.5 pL
liquid sample with a RI value of 1.45 was attained. Most recently, Osorio et al. [16] developed a
MZI consisting of a taper sandwiched between two LPGs for real-time fuel conformity analysis.
When submitted to percentage variation of ethanol–commercial gasoline mixture, the sensor

Fiber Optic Tapers and Sensing
- 9 -
showed an average sensitivity of 930 nm/RIU in the RI range 1.426-1.429; the tapered-sensor
was enhanced by more than 18-fold when compared to the non-tapered version.
FBGs have been one of the most successful technologies implemented so far in optical fiber
sensing. Tapered-FBG structures present low sensitivity to RI, typically within the range of
10-200 nm/RIU. However, the appearance of new fabrication methods such as the femtosecond
laser enabled the development of new FBG-based devices. Fang et al. [17] inscribed an FBG by
femtosecond laser technique in a tapered fiber with 2 μm-diameter for RI sensing. This method
allowed the FBG exposure to the surrounding medium without any etching process common in
other configurations. This fiber device presented a maximum sensitivity of 231.4 nm/RIU at the
RI value of 1.44. The sensitivity of the tapered-FBG to RI could be greatly improved when using
fabrication techniques such as the metal lift-off technology or the focused ion beam (FIB)-milling
process. Ding et al. [18] combined metal lift-off technology with lithography to produce metallic
surface gratings in tapered fibers with 10 µm-diameter, which provided a maximum sensitivity
of 511 nm/RIU at the RI value of 1.41. In a different approach, Liu et al [19] used a FIB-milled
FBG in a tapered fiber with 1.8 μm-diameter; a sensitivity to RI of 660 nm/RIU at 1.39 was
achieved.
Tapering microstructured optical fibers (MOF) is not straightforward as tapering standard
singlemode or multimode fibers. Guiding conditions may change with hole collapsing and cross-
section deformation, which can be undesirable; however, this is the objective of tapering. Once
again, RI sensing is the main application of tapers in MOF. A tapered standard Photonic Crystal
Fiber (PCF) was demonstrated by Qiu et al. [20] for RI sensing. The PCF was spliced between
two standard SMFs and chemically etched with acid microdroplets until reaching 60 µm in
diameter. The sensor presented a sensitivity of 750 nm/RIU in the RI range 1.3577-1.3739.
Later, Li et al. [21] used a 30 µm-diameter tapered PCF by flame-brushing and doubled the
sensitivity to 1600 nm/RIU in the RI range of 1.3333-1.3577. On the other hand, Ni et al. [22]
showed that decreasing significantly the length of the PCF section (4 mm), a larger diameter, ca.
72 µm, could be used without compromising the sensor response to RI – a sensitivity of
1529 nm/RIU in the RI range of 1.3355-1.413 was attained.
In recent years, tapers with unconventional shapes have started to appear, whether along the
length of the taper or changing its cross-section. A simple approach relying on an S-shaped SMF
taper MZI was developed by Yang et al. [23]. This unique configuration was fabricated by
applying non-axial strain while pulling the fiber at the same time with a commercial fusion
splicer. The MZI was tested as a refractometer and for strain sensing. Maximum sensitivities of
2066 nm/RIU in the RI range of 1.407-1.421 and 183.4 pm/με, respectively, were achieved [24].
Luo et al. [25] used the flame-brushing technique instead to create a C-shaped SMF taper for RI

Fiber Optic Tapers and Sensing
- 10 -
sensing. This modal interferometer presented a sensitivity of 658 nm/RIU in the RI range from
1.333 to 1.353.
Surface plasmon resonance (SPR) based sensors have acquired particular importance in optical
sensing due to the ability to combine miniaturization with high sensitivity to RI. Recently, an SPR
sensor based on a gold coated multitapered fiber was developed by Srivastava et al. [26].
Sensitivities ranging from 2000 nm/RIU up to 3500 nm/RIU in the RI range 1.33-1.38 were
obtained.
In the past few years, dozens of taper-based configurations were developed; either simply using
tapers in-series or combining them with other fiber devices, making use of different types of
fibers or even new taper geometries, this device has become one of the first choices to RI
sensing. Despite the ability of performing high sensitivity measurements to RI, fiber taper-based
configurations are also attractive to the measurement of other physical parameters such as
temperature [27], strain [28], bending [29] and acoustic vibration [30]. Nevertheless, the
fabrication techniques available for tapering are of upmost importance for the miniaturization of
this type of sensors which is of great importance in biochemical field.
2.3 Fabrication Techniques
Optical fiber tapers have been modeled by assuming exponential, parabolic, sinusoidal,
polynomial or other taper profiles [31]. In practice, the shape of the taper is strongly dependent
of the fabrication method used. Tapers in optical fibers essentially have been made in two ways:
by etching the fiber cladding or by lengthening the fiber by fusion. Methods based on fusion
range from translating the fiber into a CO2 laser beam [32], heading a fiber horizontally over a
travelling gas burner [33] or by using a fusing-and-pulling treatment with a fiber fusion splicer
[34].
The work developed on fiber tapers and presented in this Chapter relies solely on the ones
fabricated by lengthening the fiber by fusion. The following sections exhibit the results of taper
fabrication with three distinct techniques based on fusing-and-pulling treatment: electric arc
discharge, CO2 laser beam and the VYTRAN (GPX-3000 series)-glass processing workstation. The
goal of this work was to combine the developed tapers with FBGs for biochemical sensing
applications as it will be discussed in section 2.5.

Fiber Optic Tapers and Sensing
- 11 -
2.3.1 Electric arc discharge technique
The fusing-and-pulling method relies on the fiber being placed under tension into a particular
heat source; the length of the heated region is maintained constant as tapering proceeds, thus
forming a taper. Therefore, the taper is a structure comprising a narrow stretched filament – the
taper waist – between conical tapered sections – the down/up taper transitions – which are
linked to the unstretched fiber. Figure 2.2 shows the general structure of an optical fiber taper.
Figure 2.2 Schematic of an optical fiber taper.
Optically, at the beginning of the taper, the fundamental mode propagates as a core mode. As the
fundamental mode enters the taper transition section and assuming it is thin enough, it begins to
spread out into the cladding region until the core-cladding waveguiding structure cannot
support the mode in the situation the taper is thin enough. From this point, the mode enters the
taper waist as a cladding mode. Here, the cladding and the surrounding medium act as the
waveguiding structure. Intuitively, the most sensitive region is the taper waist where the overall
device diameter is at a minimum and hence the evanescent field intensity is most pronounced.
Figure 2.3 shows the microscope image of an optical fiber microtaper. This device was fabricated
by fusion with an electric arc discharge technique. The setup, available at INESC Porto, was
specifically developed for the fabrication of long period gratings [35]; however, it is a flexible
system that allows the fabrication of tapered fiber structures as well. The procedure is simple:
an SMF (8.2 µm and 125 µm core and cladding diameters, respectively) was fixed at one end
with a holding block and placed under tension at the other end with a small mass. The fiber is
submitted to several arc discharges (electric current of 9 mA and arc duration of 1 s) until
reaches the desired shape, which is monitored in real time with a magnifying lens.
The microtaper shown in Figure 2.3 has a waist diameter (φw) of ca. 75 μm, a waist length (Lw) of
ca. 70 μm and a total length (LT) of ca. 400 μm, that corresponds to six arc discharges. The

number of these discharges affects the taper diameter at waist, as depicted in
the fiber is held under tension and is locally heated, the increase of
the strength of the fiber leading rapidly to its break. However, this non
depend on the intensity of the arc, the alignment of the fiber and the tension applied.
Figure 2.3 Microscope image on an optical fiber taper made by electric arc discharge.
Figure 2.4
The losses introduced by the fabrication process are negligible since the tapered fiber
transitions approximately satisfy the adiabatic criteria
results. One can observe that, between the fourth and the seventh arc discharge, there is a
decrease of optical loss. This might be due to the re
0 1
0
15
30
45
60
75
90
105
120
135
Fib
er d
iam
eter
(µ
m)
Fiber Optic Tapers and Sensing
- 12 -
discharges affects the taper diameter at waist, as depicted in
the fiber is held under tension and is locally heated, the increase of arc discharges will decrease
the strength of the fiber leading rapidly to its break. However, this non-linear behavior will
depend on the intensity of the arc, the alignment of the fiber and the tension applied.
icroscope image on an optical fiber taper made by electric arc discharge.
4 Taper waist diameter with number of arc discharges.
The losses introduced by the fabrication process are negligible since the tapered fiber
transitions approximately satisfy the adiabatic criteria [36]. Figure 2.5 shows the obtained
results. One can observe that, between the fourth and the seventh arc discharge, there is a
decrease of optical loss. This might be due to the re-coupling of light from the
1 2 3 4 5 6 7 8 9
nº arc discharges
Fiber Optic Tapers and Sensing
discharges affects the taper diameter at waist, as depicted in Figure 2.4. Since
arc discharges will decrease
linear behavior will
depend on the intensity of the arc, the alignment of the fiber and the tension applied.
icroscope image on an optical fiber taper made by electric arc discharge.
The losses introduced by the fabrication process are negligible since the tapered fiber
shows the obtained
results. One can observe that, between the fourth and the seventh arc discharge, there is a
coupling of light from the external
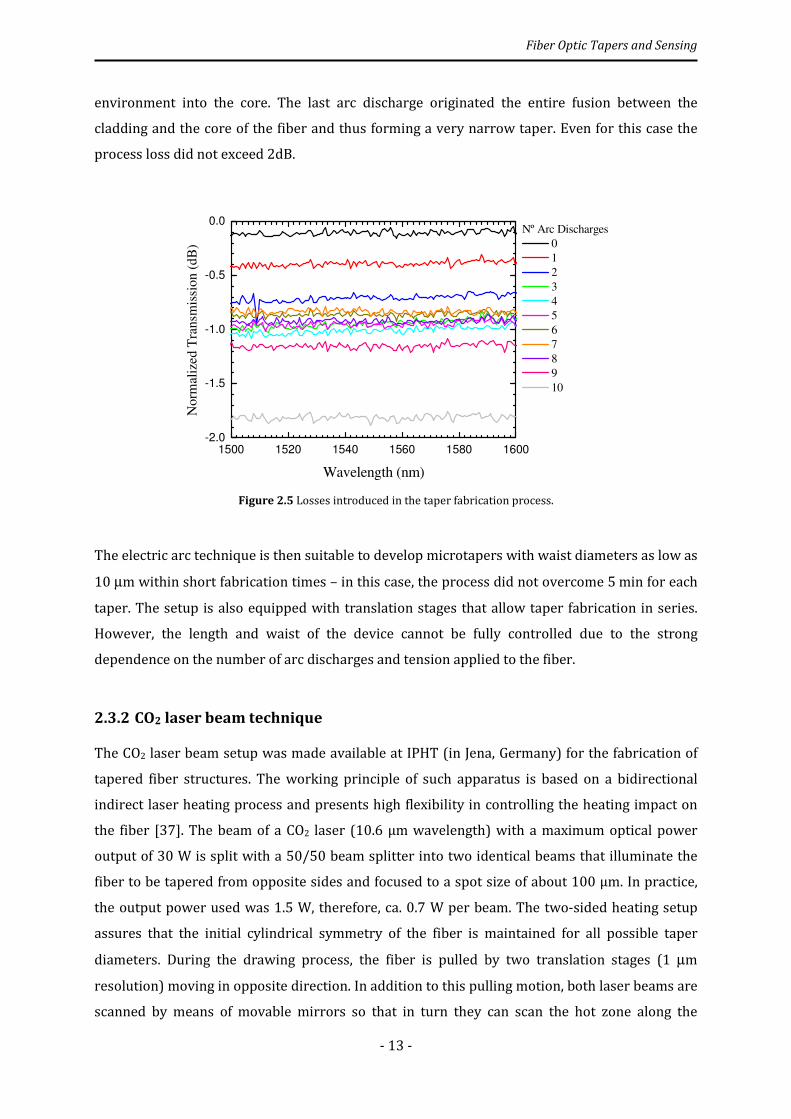
Fiber Optic Tapers and Sensing
- 13 -
environment into the core. The last arc discharge originated the entire fusion between the
cladding and the core of the fiber and thus forming a very narrow taper. Even for this case the
process loss did not exceed 2dB.
Figure 2.5 Losses introduced in the taper fabrication process.
The electric arc technique is then suitable to develop microtapers with waist diameters as low as
10 µm within short fabrication times – in this case, the process did not overcome 5 min for each
taper. The setup is also equipped with translation stages that allow taper fabrication in series.
However, the length and waist of the device cannot be fully controlled due to the strong
dependence on the number of arc discharges and tension applied to the fiber.
2.3.2 CO2 laser beam technique
The CO2 laser beam setup was made available at IPHT (in Jena, Germany) for the fabrication of
tapered fiber structures. The working principle of such apparatus is based on a bidirectional
indirect laser heating process and presents high flexibility in controlling the heating impact on
the fiber [37]. The beam of a CO2 laser (10.6 μm wavelength) with a maximum optical power
output of 30 W is split with a 50/50 beam splitter into two identical beams that illuminate the
fiber to be tapered from opposite sides and focused to a spot size of about 100 μm. In practice,
the output power used was 1.5 W, therefore, ca. 0.7 W per beam. The two-sided heating setup
assures that the initial cylindrical symmetry of the fiber is maintained for all possible taper
diameters. During the drawing process, the fiber is pulled by two translation stages (1 µm
resolution) moving in opposite direction. In addition to this pulling motion, both laser beams are
scanned by means of movable mirrors so that in turn they can scan the hot zone along the
1500 1520 1540 1560 1580 1600
-2.0
-1.5
-1.0
-0.5
0.0Nº Arc Discharges
0
1
2
3
4
5
6
7
8
9
10
N
orm
aliz
ed T
ransm
issi
on (
dB
)
Wavelength (nm)
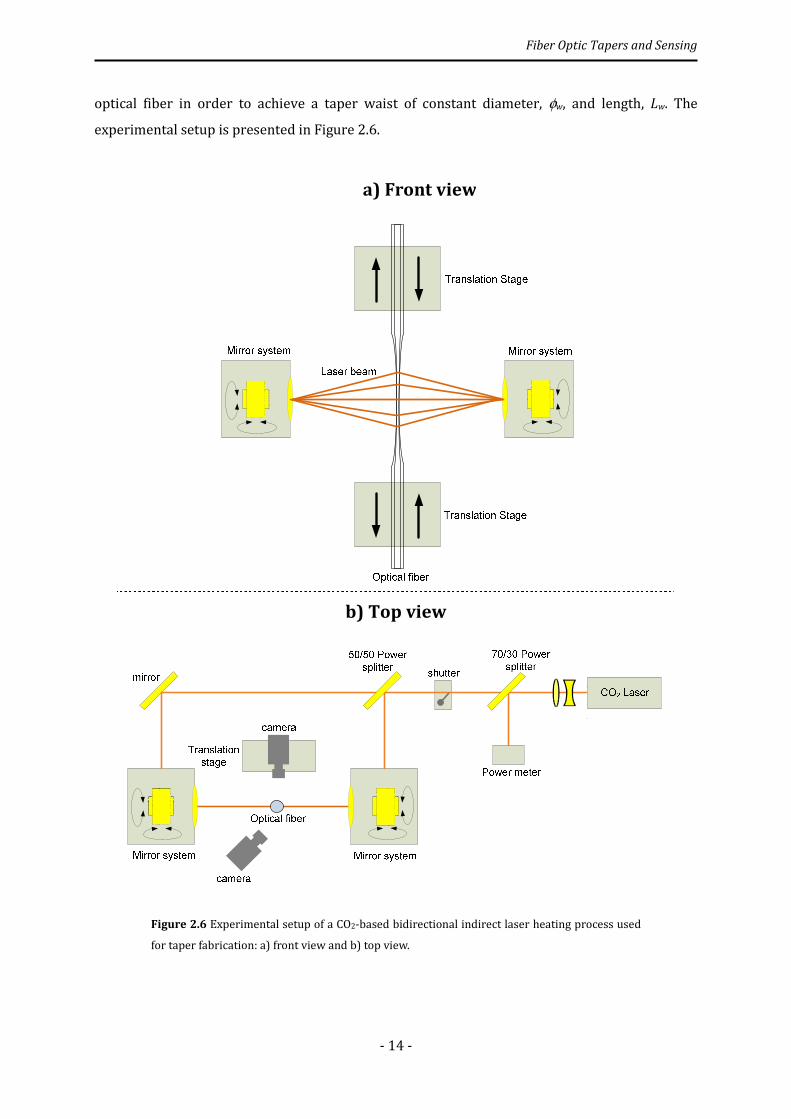
Fiber Optic Tapers and Sensing
- 14 -
optical fiber in order to achieve a taper waist of constant diameter, φw, and length, Lw. The
experimental setup is presented in Figure 2.6.
a) Front view
b) Top view
Figure 2.6 Experimental setup of a CO2-based bidirectional indirect laser heating process used
for taper fabrication: a) front view and b) top view.
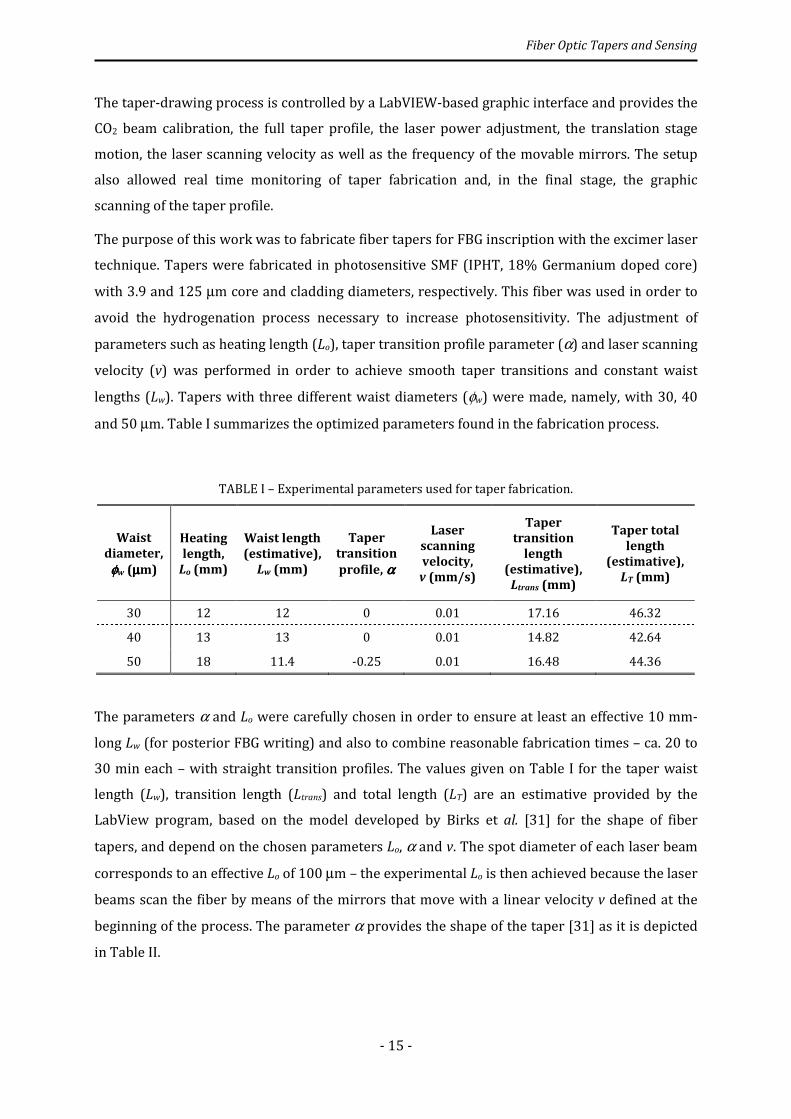
Fiber Optic Tapers and Sensing
- 15 -
The taper-drawing process is controlled by a LabVIEW-based graphic interface and provides the
CO2 beam calibration, the full taper profile, the laser power adjustment, the translation stage
motion, the laser scanning velocity as well as the frequency of the movable mirrors. The setup
also allowed real time monitoring of taper fabrication and, in the final stage, the graphic
scanning of the taper profile.
The purpose of this work was to fabricate fiber tapers for FBG inscription with the excimer laser
technique. Tapers were fabricated in photosensitive SMF (IPHT, 18% Germanium doped core)
with 3.9 and 125 µm core and cladding diameters, respectively. This fiber was used in order to
avoid the hydrogenation process necessary to increase photosensitivity. The adjustment of
parameters such as heating length (Lo), taper transition profile parameter (α) and laser scanning
velocity (v) was performed in order to achieve smooth taper transitions and constant waist
lengths (Lw). Tapers with three different waist diameters (φw) were made, namely, with 30, 40
and 50 µm. Table I summarizes the optimized parameters found in the fabrication process.
TABLE I – Experimental parameters used for taper fabrication.
Waist
diameter,
φφφφw (µµµµm)
Heating
length,
Lo (mm)
Waist length
(estimative),
Lw (mm)
Taper
transition
profile, αααα
Laser
scanning
velocity, v (mm/s)
Taper transition
length
(estimative), Ltrans (mm)
Taper total
length
(estimative), LT (mm)
30 12 12 0 0.01 17.16 46.32
40 13 13 0 0.01 14.82 42.64
50 18 11.4 -0.25 0.01 16.48 44.36
The parameters α and Lo were carefully chosen in order to ensure at least an effective 10 mm-
long Lw (for posterior FBG writing) and also to combine reasonable fabrication times – ca. 20 to
30 min each – with straight transition profiles. The values given on Table I for the taper waist
length (Lw), transition length (Ltrans) and total length (LT) are an estimative provided by the
LabView program, based on the model developed by Birks et al. [31] for the shape of fiber
tapers, and depend on the chosen parameters Lo, α and v. The spot diameter of each laser beam
corresponds to an effective Lo of 100 µm – the experimental Lo is then achieved because the laser
beams scan the fiber by means of the mirrors that move with a linear velocity v defined at the
beginning of the process. The parameter α provides the shape of the taper [31] as it is depicted
in Table II.
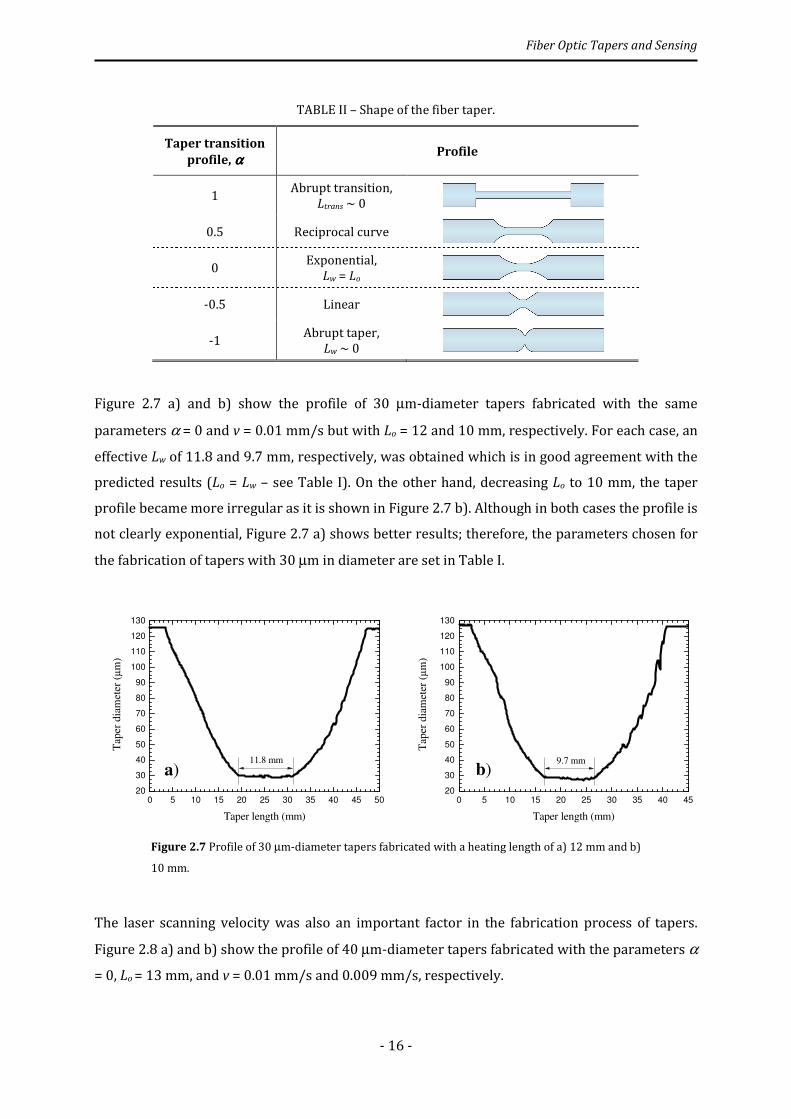
Fiber Optic Tapers and Sensing
- 16 -
TABLE II – Shape of the fiber taper.
Taper transition
profile, αααα Profile
1 Abrupt transition,
Ltrans ~ 0
0.5 Reciprocal curve
0 Exponential,
Lw = Lo
-0.5 Linear
-1 Abrupt taper,
Lw ~ 0
Figure 2.7 a) and b) show the profile of 30 µm-diameter tapers fabricated with the same
parameters α = 0 and v = 0.01 mm/s but with Lo = 12 and 10 mm, respectively. For each case, an
effective Lw of 11.8 and 9.7 mm, respectively, was obtained which is in good agreement with the
predicted results (Lo = Lw – see Table I). On the other hand, decreasing Lo to 10 mm, the taper
profile became more irregular as it is shown in Figure 2.7 b). Although in both cases the profile is
not clearly exponential, Figure 2.7 a) shows better results; therefore, the parameters chosen for
the fabrication of tapers with 30 µm in diameter are set in Table I.
Figure 2.7 Profile of 30 µm-diameter tapers fabricated with a heating length of a) 12 mm and b)
10 mm.
The laser scanning velocity was also an important factor in the fabrication process of tapers.
Figure 2.8 a) and b) show the profile of 40 µm-diameter tapers fabricated with the parameters α
= 0, Lo = 13 mm, and v = 0.01 mm/s and 0.009 mm/s, respectively.
0 5 10 15 20 25 30 35 40 45 50
20
30
40
50
60
70
80
90
100
110
120
130
Tap
er d
iam
eter
(µ
m)
Taper length (mm)
11.8 mm
a)
0 5 10 15 20 25 30 35 40 45
20
30
40
50
60
70
80
90
100
110
120
130
b)
Tap
er d
iam
eter
(µ
m)
Taper length (mm)
9.7 mm
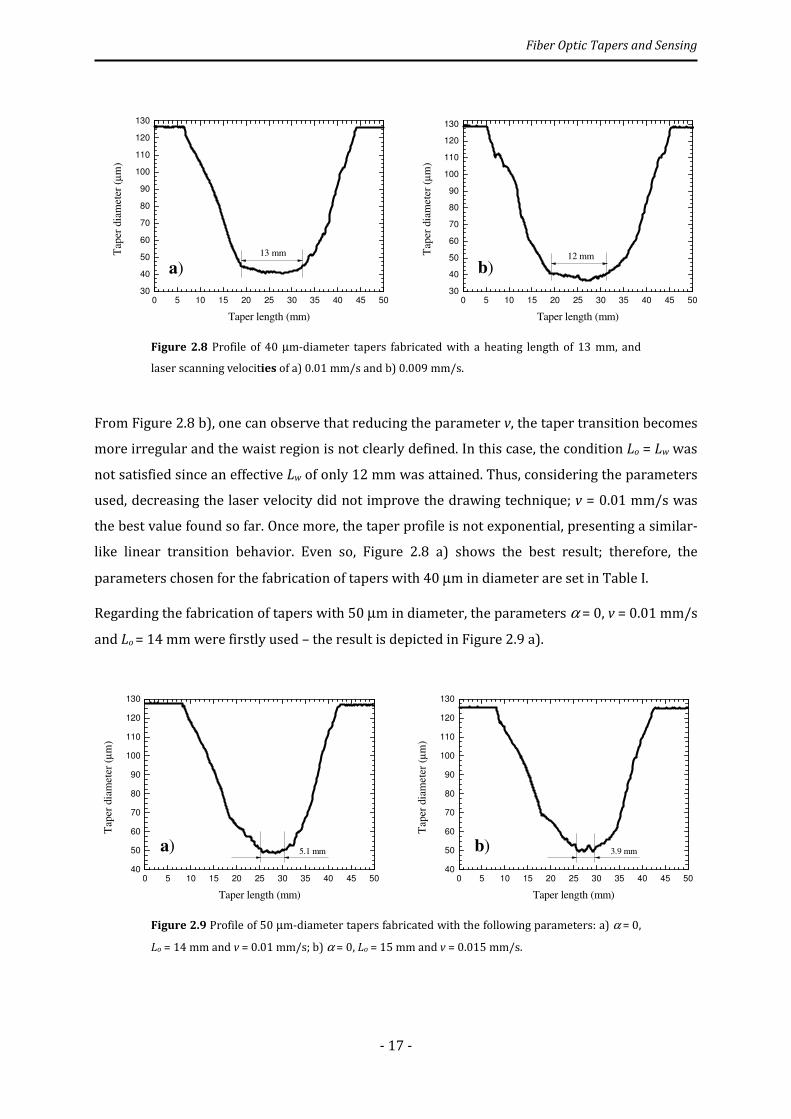
Fiber Optic Tapers and Sensing
- 17 -
Figure 2.8 Profile of 40 µm-diameter tapers fabricated with a heating length of 13 mm, and
laser scanning velocities of a) 0.01 mm/s and b) 0.009 mm/s.
From Figure 2.8 b), one can observe that reducing the parameter v, the taper transition becomes
more irregular and the waist region is not clearly defined. In this case, the condition Lo = Lw was
not satisfied since an effective Lw of only 12 mm was attained. Thus, considering the parameters
used, decreasing the laser velocity did not improve the drawing technique; v = 0.01 mm/s was
the best value found so far. Once more, the taper profile is not exponential, presenting a similar-
like linear transition behavior. Even so, Figure 2.8 a) shows the best result; therefore, the
parameters chosen for the fabrication of tapers with 40 µm in diameter are set in Table I.
Regarding the fabrication of tapers with 50 µm in diameter, the parameters α = 0, v = 0.01 mm/s
and Lo = 14 mm were firstly used – the result is depicted in Figure 2.9 a).
Figure 2.9 Profile of 50 µm-diameter tapers fabricated with the following parameters: a) α = 0,
Lo = 14 mm and v = 0.01 mm/s; b) α = 0, Lo = 15 mm and v = 0.015 mm/s.
0 5 10 15 20 25 30 35 40 45 50
30
40
50
60
70
80
90
100
110
120
130
a)
T
aper
dia
mete
r (µ
m)
Taper length (mm)
13 mm
0 5 10 15 20 25 30 35 40 45 50
30
40
50
60
70
80
90
100
110
120
130
b)
Tap
er d
iam
ete
r (µ
m)
Taper length (mm)
12 mm
0 5 10 15 20 25 30 35 40 45 50
40
50
60
70
80
90
100
110
120
130
5.1 mma)
Tap
er d
iam
ete
r (µ
m)
Taper length (mm)
0 5 10 15 20 25 30 35 40 45 50
40
50
60
70
80
90
100
110
120
130
b)
Tap
er d
iam
ete
r (µ
m)
Taper length (mm)
3.9 mm
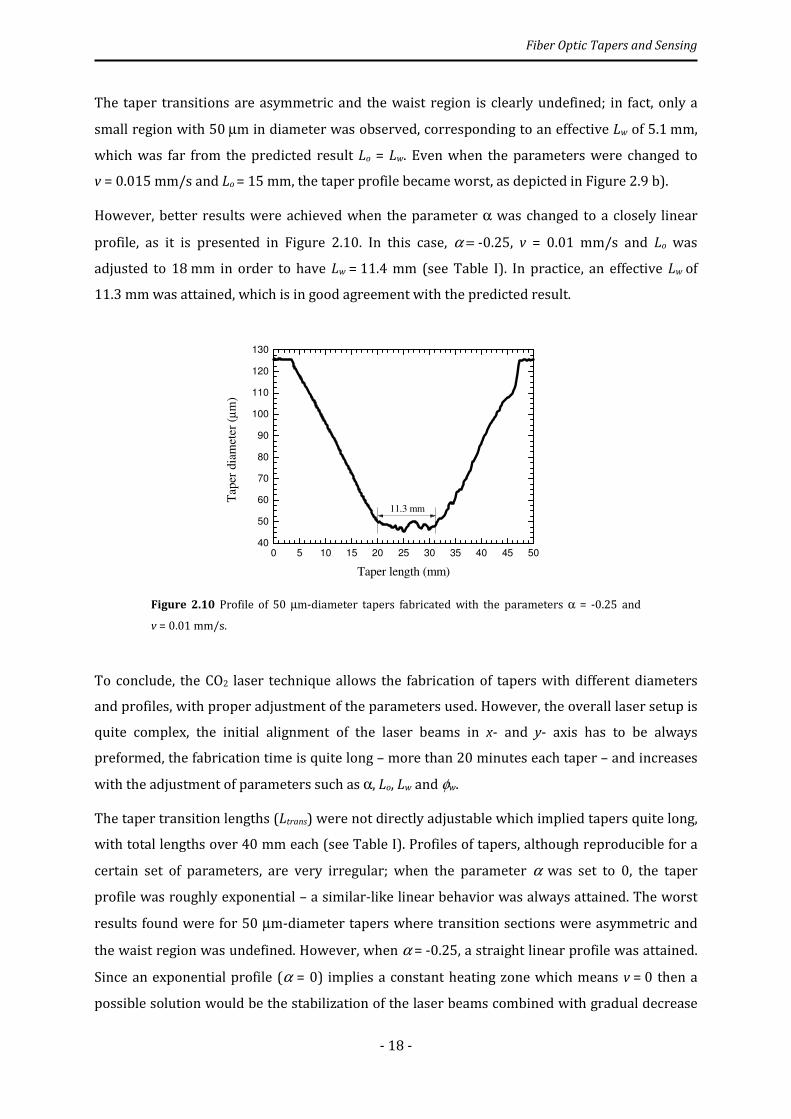
Fiber Optic Tapers and Sensing
- 18 -
The taper transitions are asymmetric and the waist region is clearly undefined; in fact, only a
small region with 50 µm in diameter was observed, corresponding to an effective Lw of 5.1 mm,
which was far from the predicted result Lo = Lw. Even when the parameters were changed to
v = 0.015 mm/s and Lo = 15 mm, the taper profile became worst, as depicted in Figure 2.9 b).
However, better results were achieved when the parameter α was changed to a closely linear
profile, as it is presented in Figure 2.10. In this case, α = -0.25, v = 0.01 mm/s and Lo was
adjusted to 18 mm in order to have Lw = 11.4 mm (see Table I). In practice, an effective Lw of
11.3 mm was attained, which is in good agreement with the predicted result.
Figure 2.10 Profile of 50 µm-diameter tapers fabricated with the parameters α = -0.25 and
v = 0.01 mm/s.
To conclude, the CO2 laser technique allows the fabrication of tapers with different diameters
and profiles, with proper adjustment of the parameters used. However, the overall laser setup is
quite complex, the initial alignment of the laser beams in x- and y- axis has to be always
preformed, the fabrication time is quite long – more than 20 minutes each taper – and increases
with the adjustment of parameters such as α, Lo, Lw and φw.
The taper transition lengths (Ltrans) were not directly adjustable which implied tapers quite long,
with total lengths over 40 mm each (see Table I). Profiles of tapers, although reproducible for a
certain set of parameters, are very irregular; when the parameter α was set to 0, the taper
profile was roughly exponential – a similar-like linear behavior was always attained. The worst
results found were for 50 µm-diameter tapers where transition sections were asymmetric and
the waist region was undefined. However, when α = -0.25, a straight linear profile was attained.
Since an exponential profile (α = 0) implies a constant heating zone which means v = 0 then a
possible solution would be the stabilization of the laser beams combined with gradual decrease
0 5 10 15 20 25 30 35 40 45 50
40
50
60
70
80
90
100
110
120
130
Taper
dia
met
er
(µm
)
Taper length (mm)
11.3 mm
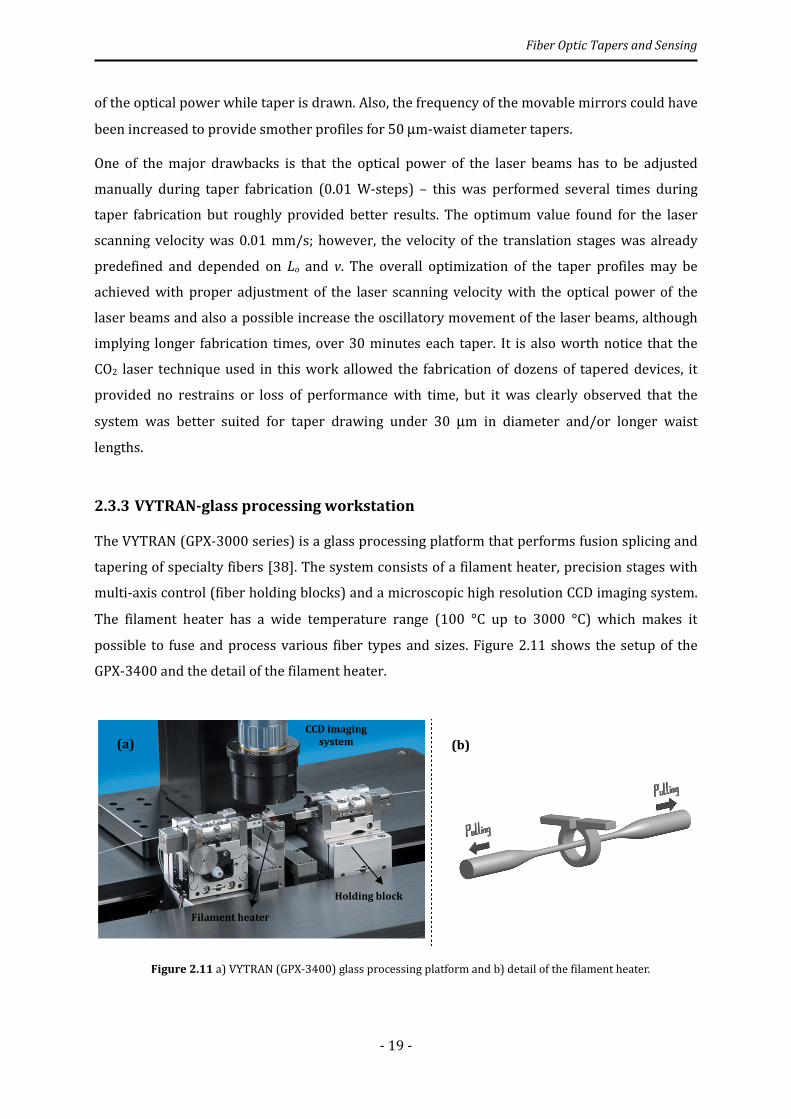
Fiber Optic Tapers and Sensing
- 19 -
of the optical power while taper is drawn. Also, the frequency of the movable mirrors could have
been increased to provide smother profiles for 50 µm-waist diameter tapers.
One of the major drawbacks is that the optical power of the laser beams has to be adjusted
manually during taper fabrication (0.01 W-steps) – this was performed several times during
taper fabrication but roughly provided better results. The optimum value found for the laser
scanning velocity was 0.01 mm/s; however, the velocity of the translation stages was already
predefined and depended on Lo and v. The overall optimization of the taper profiles may be
achieved with proper adjustment of the laser scanning velocity with the optical power of the
laser beams and also a possible increase the oscillatory movement of the laser beams, although
implying longer fabrication times, over 30 minutes each taper. It is also worth notice that the
CO2 laser technique used in this work allowed the fabrication of dozens of tapered devices, it
provided no restrains or loss of performance with time, but it was clearly observed that the
system was better suited for taper drawing under 30 µm in diameter and/or longer waist
lengths.
2.3.3 VYTRAN-glass processing workstation
The VYTRAN (GPX-3000 series) is a glass processing platform that performs fusion splicing and
tapering of specialty fibers [38]. The system consists of a filament heater, precision stages with
multi-axis control (fiber holding blocks) and a microscopic high resolution CCD imaging system.
The filament heater has a wide temperature range (100 °C up to 3000 °C) which makes it
possible to fuse and process various fiber types and sizes. Figure 2.11 shows the setup of the
GPX-3400 and the detail of the filament heater.
Figure 2.11 a) VYTRAN (GPX-3400) glass processing platform and b) detail of the filament heater.
CCD imaging
system
Holding block
Filament heater
(a) (b)
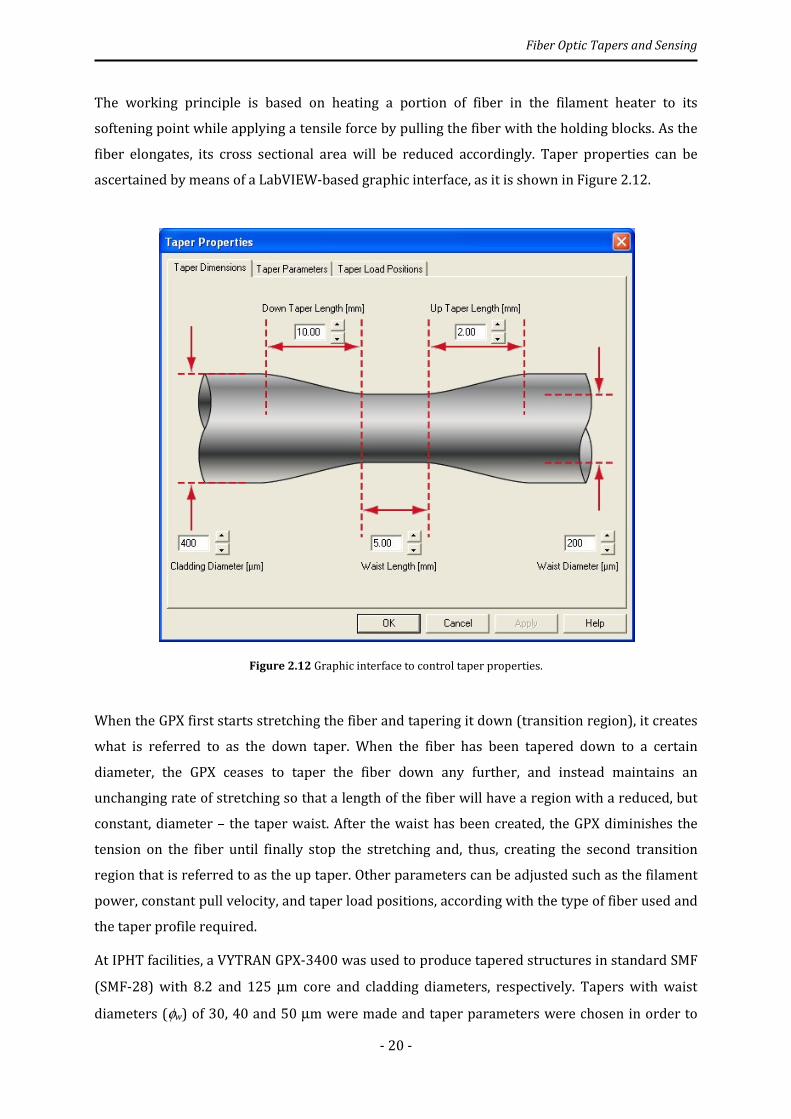
Fiber Optic Tapers and Sensing
- 20 -
The working principle is based on heating a portion of fiber in the filament heater to its
softening point while applying a tensile force by pulling the fiber with the holding blocks. As the
fiber elongates, its cross sectional area will be reduced accordingly. Taper properties can be
ascertained by means of a LabVIEW-based graphic interface, as it is shown in Figure 2.12.
Figure 2.12 Graphic interface to control taper properties.
When the GPX first starts stretching the fiber and tapering it down (transition region), it creates
what is referred to as the down taper. When the fiber has been tapered down to a certain
diameter, the GPX ceases to taper the fiber down any further, and instead maintains an
unchanging rate of stretching so that a length of the fiber will have a region with a reduced, but
constant, diameter – the taper waist. After the waist has been created, the GPX diminishes the
tension on the fiber until finally stop the stretching and, thus, creating the second transition
region that is referred to as the up taper. Other parameters can be adjusted such as the filament
power, constant pull velocity, and taper load positions, according with the type of fiber used and
the taper profile required.
At IPHT facilities, a VYTRAN GPX-3400 was used to produce tapered structures in standard SMF
(SMF-28) with 8.2 and 125 µm core and cladding diameters, respectively. Tapers with waist
diameters (φw) of 30, 40 and 50 µm were made and taper parameters were chosen in order to
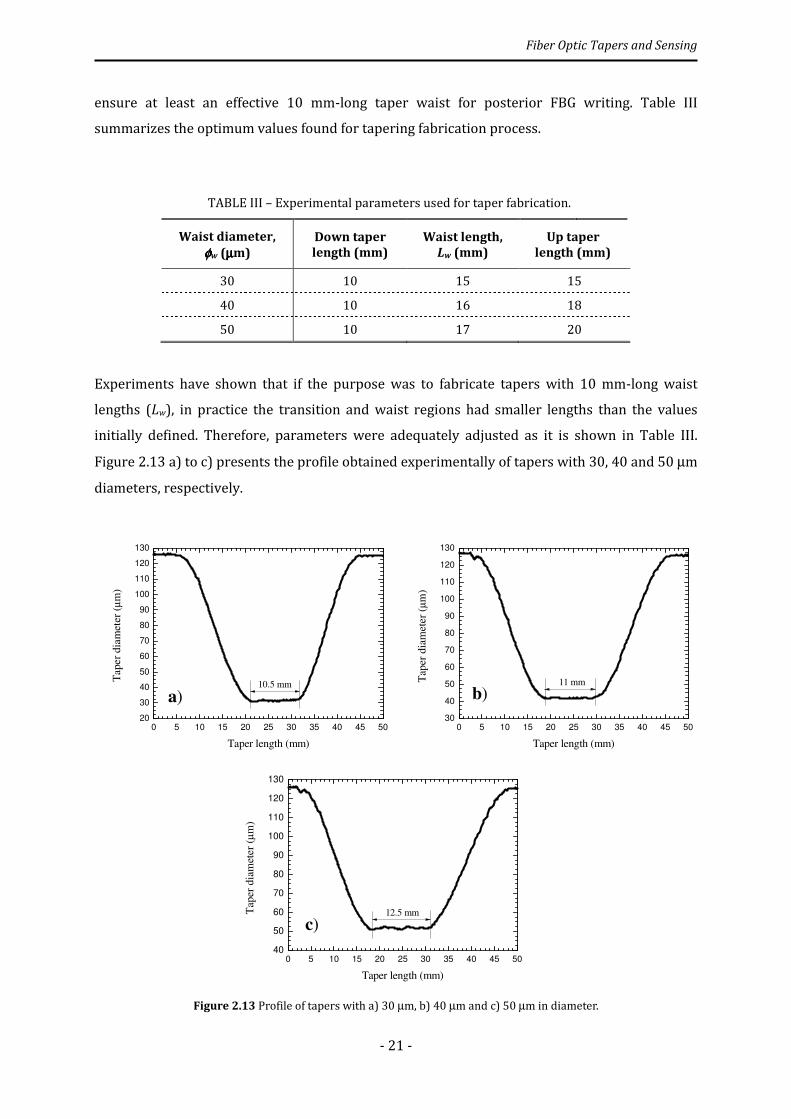
Fiber Optic Tapers and Sensing
- 21 -
ensure at least an effective 10 mm-long taper waist for posterior FBG writing. Table III
summarizes the optimum values found for tapering fabrication process.
TABLE III – Experimental parameters used for taper fabrication.
Waist diameter,
φφφφw (µµµµm)
Down taper
length (mm)
Waist length,
Lw (mm)
Up taper
length (mm)
30 10 15 15
40 10 16 18
50 10 17 20
Experiments have shown that if the purpose was to fabricate tapers with 10 mm-long waist
lengths (Lw), in practice the transition and waist regions had smaller lengths than the values
initially defined. Therefore, parameters were adequately adjusted as it is shown in Table III.
Figure 2.13 a) to c) presents the profile obtained experimentally of tapers with 30, 40 and 50 µm
diameters, respectively.
Figure 2.13 Profile of tapers with a) 30 µm, b) 40 µm and c) 50 µm in diameter.
0 5 10 15 20 25 30 35 40 45 50
20
30
40
50
60
70
80
90
100
110
120
130
a)
Taper
dia
met
er (
µm
)
Taper length (mm)
10.5 mm
0 5 10 15 20 25 30 35 40 45 50
30
40
50
60
70
80
90
100
110
120
130
b)
Tap
er d
iam
eter
(µm
)
Taper length (mm)
11 mm
0 5 10 15 20 25 30 35 40 45 50
40
50
60
70
80
90
100
110
120
130
c)
Tap
er d
iam
eter
(µm
)
Taper length (mm)
12.5 mm
Fiber Optic Tapers and Sensing
- 22 -
One can observe that the VYTRAN GPX-3400 performs high-quality tapers with smooth profiles
and symmetric transition regions. In practice, an effective Lw of 10.5, 11 and 12.5 mm for tapers
with 30, 40 and 50 µm diameters, respectively, was achieved. The overall fabrication time for
each taper was less than 5 minutes (∼ 2 minutes for effective tapering fabrication) which is an
improvement when compared with the CO2 laser technique. Also, the fabrication apparatus is
simpler and better taper profiles may be achieved.
Within the frame of this work, tapers with different waist diameters were also fabricated in
microstructured fiber (MSF) by means of VYTRAN glass processing machine. Since it was not the
purpose of this work to inscribe FBGs in MSFs, taper fabrication and characterization of
tapered-MSF devices will be discussed in section 2.5.
2.4 Fiber Bragg Gratings with Taper Structures
The combination of fiber Bragg gratings with tapers has been widely studied and many tapered
structures have been developed for sensing applications. Etched fibers have a uniform core and
thus a constant propagation coefficient that can be modified along the fiber by applying some
mechanical stress – this technique is often used to create chirped gratings [39]. However, in
tapers made by fusion the fiber core is tapered as well, and therefore they have non-uniform
propagating properties capable to originate non-uniform gratings. In particular, the combination
of two FBGs separated by an abrupt tapered region permit to form Fabry-Perot interferometers
or phase-shifted gratings [40].
In this section it is presented the results of FBG inscription in tapered fibers made by CO2 laser
technique and VYTRAM GPX-3400. Tapers made in photosensitive SMF by CO2 laser technique
were used to write FBGs with an interferometric KrF excimer laser setup; while tapers made in
standard SMF by the GPX-3400 were used to write FBGs by means of femtosecond laser
technique. The purpose was to develop several sensing heads based on a pair of untapered- and
tapered-FBGs for prior sensing applications (see section 2.5).
2.4.1 FBGs inscription with interferometric KrF excimer laser technique
In this study, a 248 nm KrF laser and a Talbot interferometer arrangement [41] was used for the
fabrication of the FBGs – these were written on tapers made in photosensitive SMF (IPHT, 18%
Germanium doped core) and with different waist diameters. This fiber was used in order to
avoid hydrogen loading process usually needed to increase photosensitivity in standard SMFs.
The experimental setup is presented in Figure 2.14.
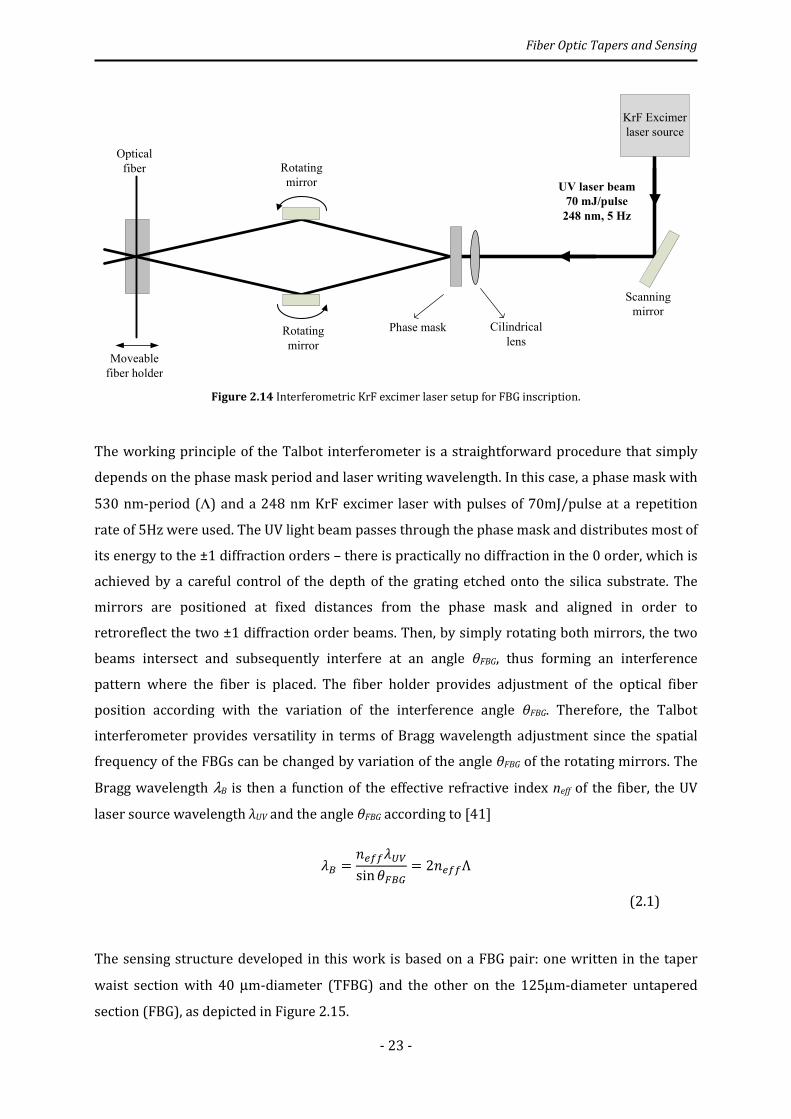
Fiber Optic Tapers and Sensing
- 23 -
Figure 2.14 Interferometric KrF excimer laser setup for FBG inscription.
The working principle of the Talbot interferometer is a straightforward procedure that simply
depends on the phase mask period and laser writing wavelength. In this case, a phase mask with
530 nm-period (Λ) and a 248 nm KrF excimer laser with pulses of 70mJ/pulse at a repetition
rate of 5Hz were used. The UV light beam passes through the phase mask and distributes most of
its energy to the ±1 diffraction orders – there is practically no diffraction in the 0 order, which is
achieved by a careful control of the depth of the grating etched onto the silica substrate. The
mirrors are positioned at fixed distances from the phase mask and aligned in order to
retroreflect the two ±1 diffraction order beams. Then, by simply rotating both mirrors, the two
beams intersect and subsequently interfere at an angle θFBG, thus forming an interference
pattern where the fiber is placed. The fiber holder provides adjustment of the optical fiber
position according with the variation of the interference angle θFBG. Therefore, the Talbot
interferometer provides versatility in terms of Bragg wavelength adjustment since the spatial
frequency of the FBGs can be changed by variation of the angle θFBG of the rotating mirrors. The
Bragg wavelength λB is then a function of the effective refractive index neff of the fiber, the UV
laser source wavelength λUV and the angle θFBG according to [41]
�� = �������sin � �� = 2����Λ
(2.1)
The sensing structure developed in this work is based on a FBG pair: one written in the taper
waist section with 40 µm-diameter (TFBG) and the other on the 125µm-diameter untapered
section (FBG), as depicted in Figure 2.15.
Rotating
mirror
Rotating
mirror
Scanning
mirror
UV laser beam
70 mJ/pulse
248 nm, 5 Hz
Optical
fiber
Moveable
fiber holder
KrF Excimer
laser source
Phase mask Cilindrical
lens
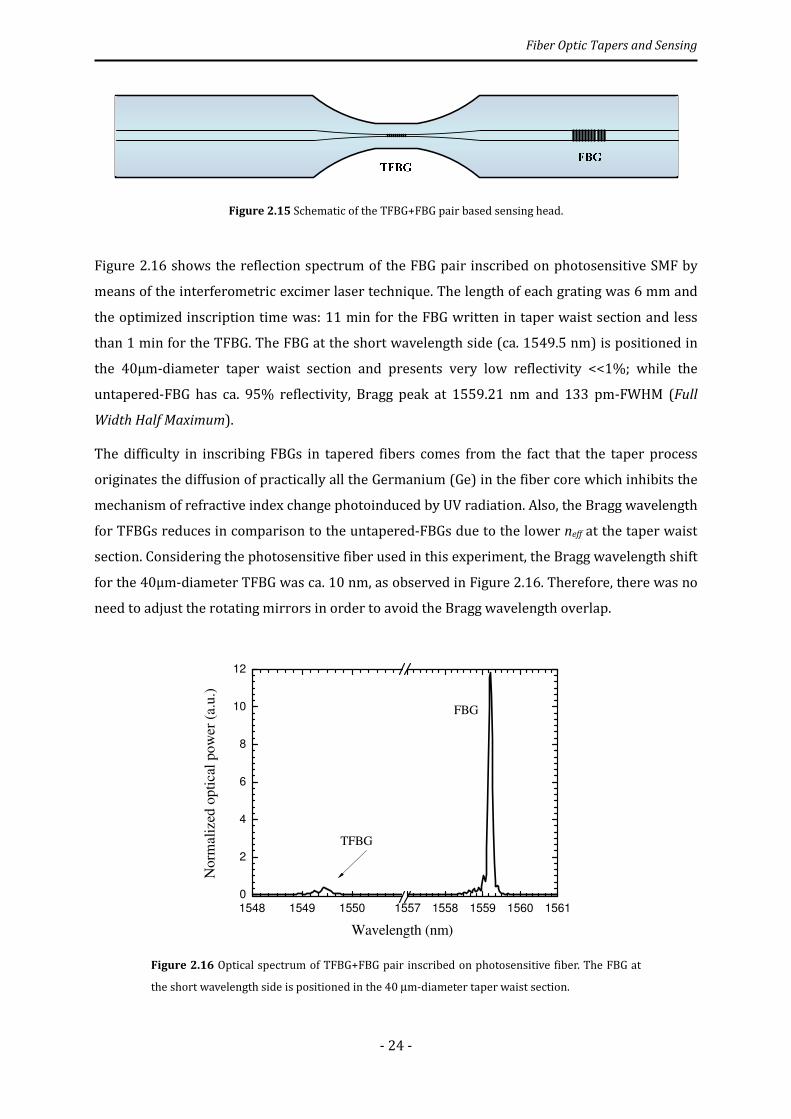
Fiber Optic Tapers and Sensing
- 24 -
Figure 2.15 Schematic of the TFBG+FBG pair based sensing head.
Figure 2.16 shows the reflection spectrum of the FBG pair inscribed on photosensitive SMF by
means of the interferometric excimer laser technique. The length of each grating was 6 mm and
the optimized inscription time was: 11 min for the FBG written in taper waist section and less
than 1 min for the TFBG. The FBG at the short wavelength side (ca. 1549.5 nm) is positioned in
the 40µm-diameter taper waist section and presents very low reflectivity <<1%; while the
untapered-FBG has ca. 95% reflectivity, Bragg peak at 1559.21 nm and 133 pm-FWHM (Full
Width Half Maximum).
The difficulty in inscribing FBGs in tapered fibers comes from the fact that the taper process
originates the diffusion of practically all the Germanium (Ge) in the fiber core which inhibits the
mechanism of refractive index change photoinduced by UV radiation. Also, the Bragg wavelength
for TFBGs reduces in comparison to the untapered-FBGs due to the lower neff at the taper waist
section. Considering the photosensitive fiber used in this experiment, the Bragg wavelength shift
for the 40µm-diameter TFBG was ca. 10 nm, as observed in Figure 2.16. Therefore, there was no
need to adjust the rotating mirrors in order to avoid the Bragg wavelength overlap.
Figure 2.16 Optical spectrum of TFBG+FBG pair inscribed on photosensitive fiber. The FBG at
the short wavelength side is positioned in the 40 µm-diameter taper waist section.
1548 1549 1550 1557 1558 1559 1560 1561
0
2
4
6
8
10
12
Norm
aliz
ed o
pti
cal
po
wer
(a.
u.)
Wavelength (nm)
TFBG
FBG

Fiber Optic Tapers and Sensing
- 25 -
Summarizing, the interferometric excimer laser technique easily writes FBGs having more than
40% reflectivity with a single pulse. It provides high flexibility in terms of Bragg wavelength
selection as well as the fabrication of excellent spectral-quality FBGs within various lengths.
Even more, this technique provides high stability in FBG inscription and it allows using high
energy densities without causing dielectrical breakdown of the optical components. However,
the initial alignment of the interferometric system is always required which is quite difficult to
perform and time consuming. Although this is a well known and established technology, it is
limited to the use of hydrogen-loaded or photosensitive fibers in order to perform FBG
fabrication. Furthermore, inscribing FBGs in tapered-fiber sections is not a viable option since
the photoinduced refractive index change is inhibited due to the diffusion of Ge in the fiber core
(resultant from taper drawing process). These drawbacks are overcome when deep ultraviolet
femtosecond laser source is used instead, as described in the following section.
2.4.2 FBGs inscription with DUV femtosecond laser technique
In this research, FBGs were inscribed in the waist region of tapers made in standard SMFs by
means of deep ultraviolet (DUV) femtosecond laser source and Talbot interferometry [42],[43].
The experimental setup is presented in Figure 2.17.
Figure 2.17 Talbot interferometric inscription setup with deep ultraviolet femtosecond laser
source.

Fiber Optic Tapers and Sensing
- 26 -
The experimental setup is similar to the one presented in Figure 2.14 but, in this case, a
femtosecond laser source is used instead. The driving laser system comprises a Ti:sapphire
master oscillator (Coherent Mantis) and a femtosecond amplifier (Coherent Legend Elite). The
infrared (IR) beam (3.5 W at 800 nm, 130 fs, 1 kHz) passes a frequency tripler (SHG/THG,
700 mW at 266.7 nm), and is focused onto the fiber by means of a silica cylindrical lens; this
component is placed close to the phase mask which has a 537.5 nm-period. The sensing head
developed using the DUV femtosecond laser technique was also based on the TFBG+FBG pair as
presented in Figure 2.15. The length of each grating was 6 mm and the inscription time was:
10 min for the TFBG and 4 min for the FBG. Figure 2.18 presents the optical spectra of the
TFBG+FBG pairs where TFBGs were inscribed in taper waist sections with 30, 40 and 50 µm in
diameter (TFBG1, TFBG2 and TFBG3, respectively).
Figure 2.18 Optical spectra of the TFBG+FBG pairs inscribed on standard SMF. The FBG at the
short wavelength side is positioned in the taper waist section with a) 30, b) 40 and c) 50 µm-
diameter (TFBG1, TFBG2 and TFBG3, respectively).
In this experiment, TFBGs with a reflectivity higher than 65% could be achieved within a short
inscription time (ca. 10 min); while the reflectivity range of untapered-FBGs is from 70% to
1548 1549 1550 1551 1557 1558 1559 1560
0
5
10
15
20
25
a)FBG
1
Norm
ali
zed
op
tica
l po
wer
(a.u
.)
Wavelength (nm)
TFBG1
1548 1549 1550 1556 1557 1558 1559
0
5
10
15
20
25
b)FBG
2
TFBG2
Norm
ali
zed
op
tica
l po
wer
(a.u
.)
Wavelength (nm)
1548 1549 1550 1551 1556 1557 1558 1559 1560
0
5
10
15
20
25
30
c)FBG
3
TFBG3
No
rmal
ized
op
tical
po
wer
(a.
u.)
Wavelength (nm)

Fiber Optic Tapers and Sensing
- 27 -
ca. 95%. Because of the high-intensity DUV laser beam across a small spatial region with
ultrashort interaction time, the neff change (10-3 or even more) induced by the femtosecond laser
pulses is highly localized which results in increased reflectivity of TFBGs, as it is depicted in
Figure 2.18. Table IV enumerates the FWHM and Bragg wavelength peak (λB) for the inscribed
TFBG+FBG pairs.
TABLE IV – FHWM and Bragg wavelength peak of the inscribed TFBG+FBG pairs.
Waist diameter,
φφφφw (µµµµm)
FWHM (pm) λλλλB (nm)
TFBG FBG TFBG FBG
30 (TFBG1+FBG1) 376 448 1549.25 1558.66
40 (TFBG2+FBG2) 381 414 1549.04 1557.74
50 (TFBG3+FBG3) 530 619 1549.65 1558.07
It should be noticed that the FWHM of TFBGs increase with waist diameter; also, the FWHM of
the FBGs is larger than the one inscribed by excimer laser technique (133 pm-FWHM). This was
somehow expected because (i) the neff modulation increases with the increase of taper waist
diameter, thus providing a small increase of the FWHM; when using a high-intensity ultrashort
laser pulse, (ii) the overlap factor is not fully confined to the core, thus providing wider FBGs.
One can observe that the sensing head with 50 µm-diameter TFBG (Figure 2.18 c)) presents
higher FWHM when compared with the remaining fiber structures. In fact, in this case, the
sensing head was fabricated after a realignment of the experimental setup which allowed
inscribing FBGs within inscription times of 6 and 2 min for the 50 µm-diameter TFBG and FBG,
respectively. When changing the fabrication conditions to enhance inscription time, the neff
modulation will increase but the overlap factor decreases as well – the result is wider TFBG and
FBG, as it is shown in Figure 2.18 c).
Figure 2.19 shows the spectral behavior of a FBG inscribed in a tapered-fiber with 10 µm in
diameter (taper drawing performed by CO2 laser technique). The inscription time was ca. 30 min
to attain a TFBG with ca. 1% reflectivity. The FWHM largely increased to 1.76 nm which is
somehow expected since the neff of the tapered fiber is low. Therefore, FBG inscription with a
high-intensity DUV laser irradiation relies on strong neff modulation by means of two-photon
absorption process (regardless the Ge concentration in the fiber core). One can observe the
appearance of strong side lobes whose behavior results from the excitation of high order modes
during FBG inscription. In this case, the FBG is inscribed not only in the core but in the cladding
region as well.
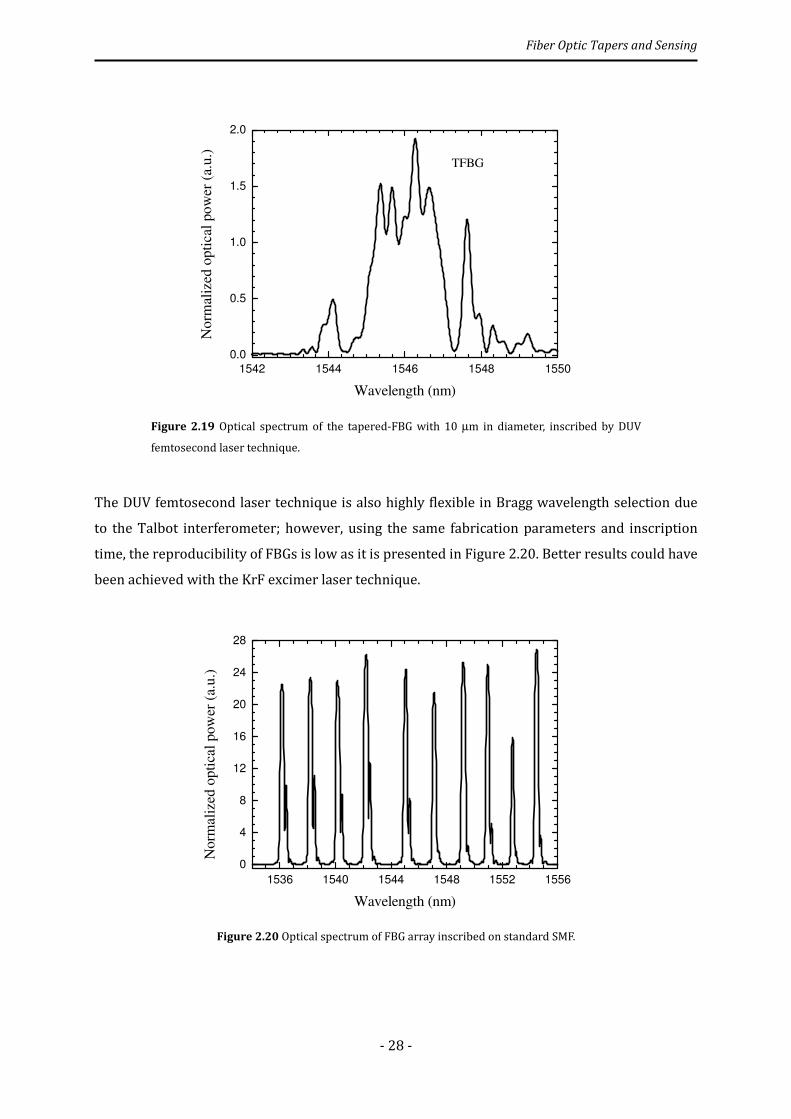
Fiber Optic Tapers and Sensing
- 28 -
Figure 2.19 Optical spectrum of the tapered-FBG with 10 µm in diameter, inscribed by DUV
femtosecond laser technique.
The DUV femtosecond laser technique is also highly flexible in Bragg wavelength selection due
to the Talbot interferometer; however, using the same fabrication parameters and inscription
time, the reproducibility of FBGs is low as it is presented in Figure 2.20. Better results could have
been achieved with the KrF excimer laser technique.
Figure 2.20 Optical spectrum of FBG array inscribed on standard SMF.
1542 1544 1546 1548 1550
0.0
0.5
1.0
1.5
2.0
No
rmal
ized
op
tica
l po
wer
(a.
u.)
Wavelength (nm)
TFBG
1536 1540 1544 1548 1552 1556
0
4
8
12
16
20
24
28
Norm
aliz
ed o
pti
cal
pow
er (
a.u
.)
Wavelength (nm)
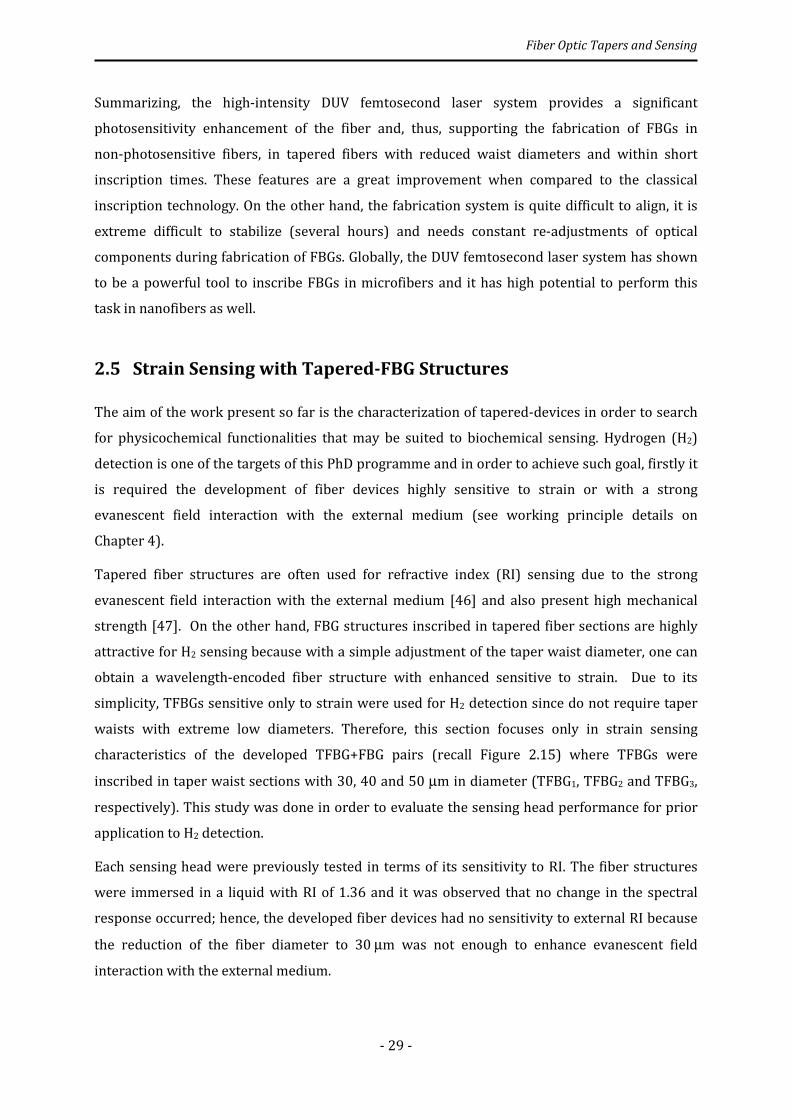
Fiber Optic Tapers and Sensing
- 29 -
Summarizing, the high-intensity DUV femtosecond laser system provides a significant
photosensitivity enhancement of the fiber and, thus, supporting the fabrication of FBGs in
non-photosensitive fibers, in tapered fibers with reduced waist diameters and within short
inscription times. These features are a great improvement when compared to the classical
inscription technology. On the other hand, the fabrication system is quite difficult to align, it is
extreme difficult to stabilize (several hours) and needs constant re-adjustments of optical
components during fabrication of FBGs. Globally, the DUV femtosecond laser system has shown
to be a powerful tool to inscribe FBGs in microfibers and it has high potential to perform this
task in nanofibers as well.
2.5 Strain Sensing with Tapered-FBG Structures
The aim of the work present so far is the characterization of tapered-devices in order to search
for physicochemical functionalities that may be suited to biochemical sensing. Hydrogen (H2)
detection is one of the targets of this PhD programme and in order to achieve such goal, firstly it
is required the development of fiber devices highly sensitive to strain or with a strong
evanescent field interaction with the external medium (see working principle details on
Chapter 4).
Tapered fiber structures are often used for refractive index (RI) sensing due to the strong
evanescent field interaction with the external medium [46] and also present high mechanical
strength [47]. On the other hand, FBG structures inscribed in tapered fiber sections are highly
attractive for H2 sensing because with a simple adjustment of the taper waist diameter, one can
obtain a wavelength-encoded fiber structure with enhanced sensitive to strain. Due to its
simplicity, TFBGs sensitive only to strain were used for H2 detection since do not require taper
waists with extreme low diameters. Therefore, this section focuses only in strain sensing
characteristics of the developed TFBG+FBG pairs (recall Figure 2.15) where TFBGs were
inscribed in taper waist sections with 30, 40 and 50 µm in diameter (TFBG1, TFBG2 and TFBG3,
respectively). This study was done in order to evaluate the sensing head performance for prior
application to H2 detection.
Each sensing head were previously tested in terms of its sensitivity to RI. The fiber structures
were immersed in a liquid with RI of 1.36 and it was observed that no change in the spectral
response occurred; hence, the developed fiber devices had no sensitivity to external RI because
the reduction of the fiber diameter to 30 µm was not enough to enhance evanescent field
interaction with the external medium.

Fiber Optic Tapers and Sensing
- 30 -
For strain characterization, each sensing head was fixed at two points distanced from a length
LTOTAL and subjected to control stretching by means of a micrometric translation stage. Firstly,
the numerical analysis of the strain applied to both TFBG and FBG was performed [48]. Figure
2.21 shows a schematic of the sensor element.
Figure 2.21 Schematic of the sensing head based on a FBG in series with a TFBG.
The optical fiber structure is formed by a FBG in series with a TFBG as explained in the previous
section (recall Figure 2.15). Here, the fiber structure is defined by four sensor sections, namely,
the FBG, TFBG, two taper transitions and the free fiber region; each one with a defined length
LFBG, LTFBG, LTr and TFiber, respectively. Therefore, the strain gauge of the sensing head has a total
length of:
������ = � �� + 2��� + �� �� + � ����. (2.2)
The TFBG is defined by the two taper transitions with lengths, LTr, and the waist section, LTFBG. If
strain is applied at a constant temperature to both FBG and TFBG, each Bragg wavelength will be
shifted by ∆λFBG and ∆λTFBG, respectively, and according to
∆� �� = κ�� ��
(2.3)
∆�� �� = κ��� �� , (2.4)
where κ� (i = 0,1) is the constant characteristic of the fiber diameter and material, and �!
(j = FBG and TFBG) is the strain applied to each sensor. However, when strain is applied to the
TFBGFBG
LFBG LTFBGLTr LTr LFiber
LTotal
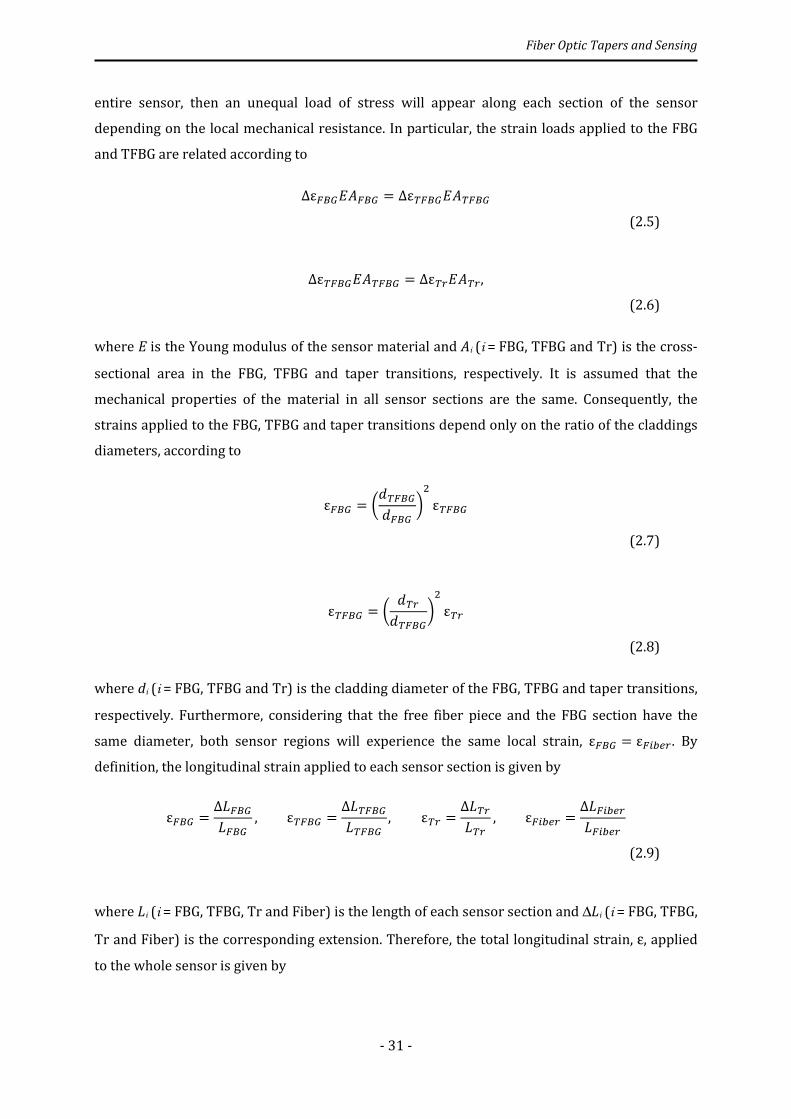
Fiber Optic Tapers and Sensing
- 31 -
entire sensor, then an unequal load of stress will appear along each section of the sensor
depending on the local mechanical resistance. In particular, the strain loads applied to the FBG
and TFBG are related according to
Δε ��$% �� = Δε� ��$%� ��
(2.5)
Δε� ��$%� �� = Δε��$%��, (2.6)
where E is the Young modulus of the sensor material and Ai (i = FBG, TFBG and Tr) is the cross-
sectional area in the FBG, TFBG and taper transitions, respectively. It is assumed that the
mechanical properties of the material in all sensor sections are the same. Consequently, the
strains applied to the FBG, TFBG and taper transitions depend only on the ratio of the claddings
diameters, according to
ε �� = &'� ��' �� () ε� ��
(2.7)
ε� �� = & '��'� ��() ε��
(2.8)
where di (i = FBG, TFBG and Tr) is the cladding diameter of the FBG, TFBG and taper transitions,
respectively. Furthermore, considering that the free fiber piece and the FBG section have the
same diameter, both sensor regions will experience the same local strain, ε �� = ε ����. By
definition, the longitudinal strain applied to each sensor section is given by
ε �� = ∆� ��� �� , ε� �� = ∆�� ���� �� ,ε�� = ∆������ , ε ���� = ∆� ����� ����
(2.9)
where Li (i = FBG, TFBG, Tr and Fiber) is the length of each sensor section and ∆Li (i = FBG, TFBG,
Tr and Fiber) is the corresponding extension. Therefore, the total longitudinal strain, ε, applied
to the whole sensor is given by

Fiber Optic Tapers and Sensing
- 32 -
� = ∆� �� + ∆�� �� + 2∆��� + ∆� ����� �� + �� �� + 2��� + � ���� . (2.10)
Combining (2.7)-(2.10), it is possible to derive the relationship between the strain applied to the
entire sensor and the strain experienced by both FBG and TFBG as
� �� = � �� + �� �� + 2��� + � ����� �� + � ���� + & ' ��'� ��() �� �� + 2 &' ��'�� () ���
�
(2.11)
�� �� = & ' ��'� ��() � �� + �� �� + 2��� + � ����� �� + � ���� + & ' ��'� ��() �� �� + 2 &' ��'�� () ���
�. (2.12)
Substituting (2.11)-(2.12) into (2.3)-(2.4), the wavelength shift can be rewritten as
∆� �� = κ� � �� + �� �� + 2��� + � ����� �� + � ���� + & ' ��'� ��() �� �� + 2 &' ��'�� () ���
�
(2.13)
∆�� �� = κ� & ' ��'� ��() � �� + �� �� + 2��� + � ����� �� + � ���� + & ' ��'� ��() �� �� + 2 &' ��'�� () ���
�. (2.14)
For a FBG in a standard untapered fiber ∆� �� = κ�� where κ� = 1.1,-//� [49]. Therefore,
from (2.13) and (2.14) the strain sensitivity of the FBG combined with the TFBG, κ �� ,and the
strain sensitivity of the TFBG, κ� �� , are given by
0 �� = κ� � �� + �� �� + 2��� + � ����� �� + � ���� + & ' ��'� ��() �� �� + 2 &' ��'�� () ���
(2.15)
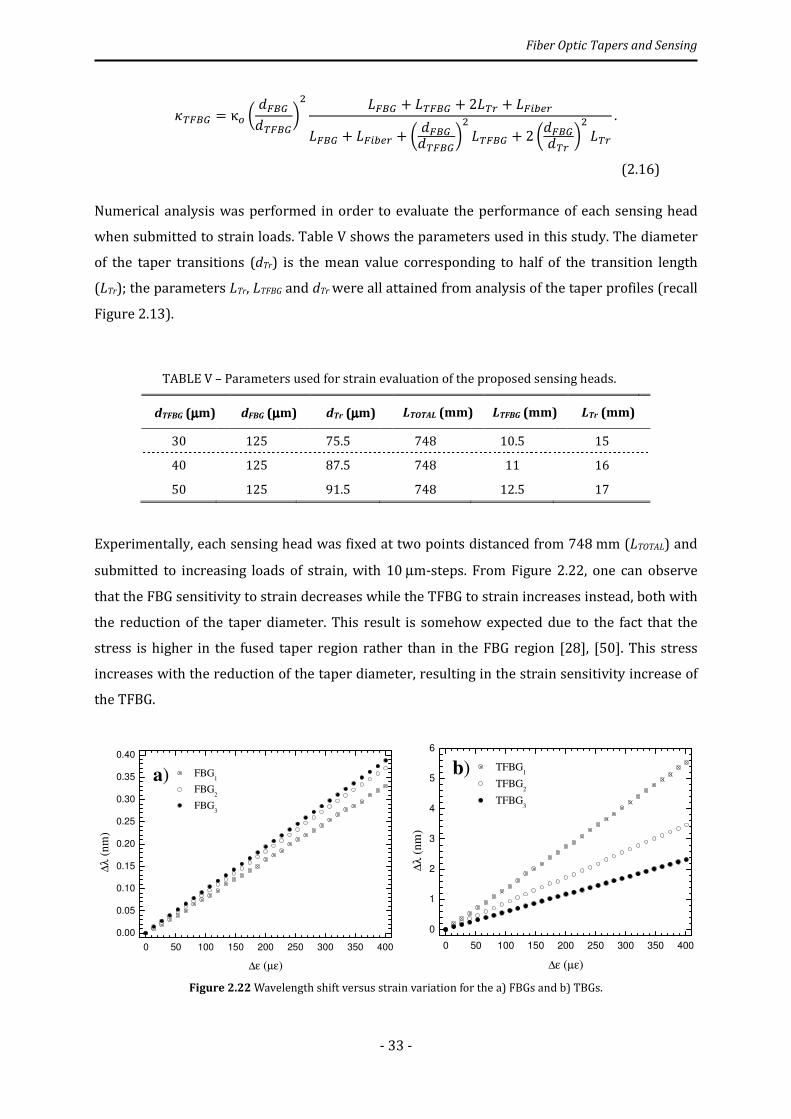
Fiber Optic Tapers and Sensing
- 33 -
0� �� = κ� & ' ��'� ��() � �� + �� �� + 2��� + � ����� �� + � ���� + & ' ��'� ��() �� �� + 2 &' ��'�� () ���
. (2.16)
Numerical analysis was performed in order to evaluate the performance of each sensing head
when submitted to strain loads. Table V shows the parameters used in this study. The diameter
of the taper transitions (dTr) is the mean value corresponding to half of the transition length
(LTr); the parameters LTr, LTFBG and dTr were all attained from analysis of the taper profiles (recall
Figure 2.13).
TABLE V – Parameters used for strain evaluation of the proposed sensing heads.
dTFBG (µµµµm) dFBG (µµµµm) dTr (µµµµm) LTOTAL (mm) LTFBG (mm) LTr (mm)
30 125 75.5 748 10.5 15
40 125 87.5 748 11 16
50 125 91.5 748 12.5 17
Experimentally, each sensing head was fixed at two points distanced from 748 mm (LTOTAL) and
submitted to increasing loads of strain, with 10 µm-steps. From Figure 2.22, one can observe
that the FBG sensitivity to strain decreases while the TFBG to strain increases instead, both with
the reduction of the taper diameter. This result is somehow expected due to the fact that the
stress is higher in the fused taper region rather than in the FBG region [28], [50]. This stress
increases with the reduction of the taper diameter, resulting in the strain sensitivity increase of
the TFBG.
Figure 2.22 Wavelength shift versus strain variation for the a) FBGs and b) TBGs.
0 50 100 150 200 250 300 350 400
0.00
0.05
0.10
0.15
0.20
0.25
0.30
0.35
0.40
a)
FBG1
FBG2
FBG3
∆λ
(n
m)
∆ε (µε)
0 50 100 150 200 250 300 350 400
0
1
2
3
4
5
6
b) TFBG1
TFBG2
TFBG3
∆λ (
nm
)
∆ε (µε)
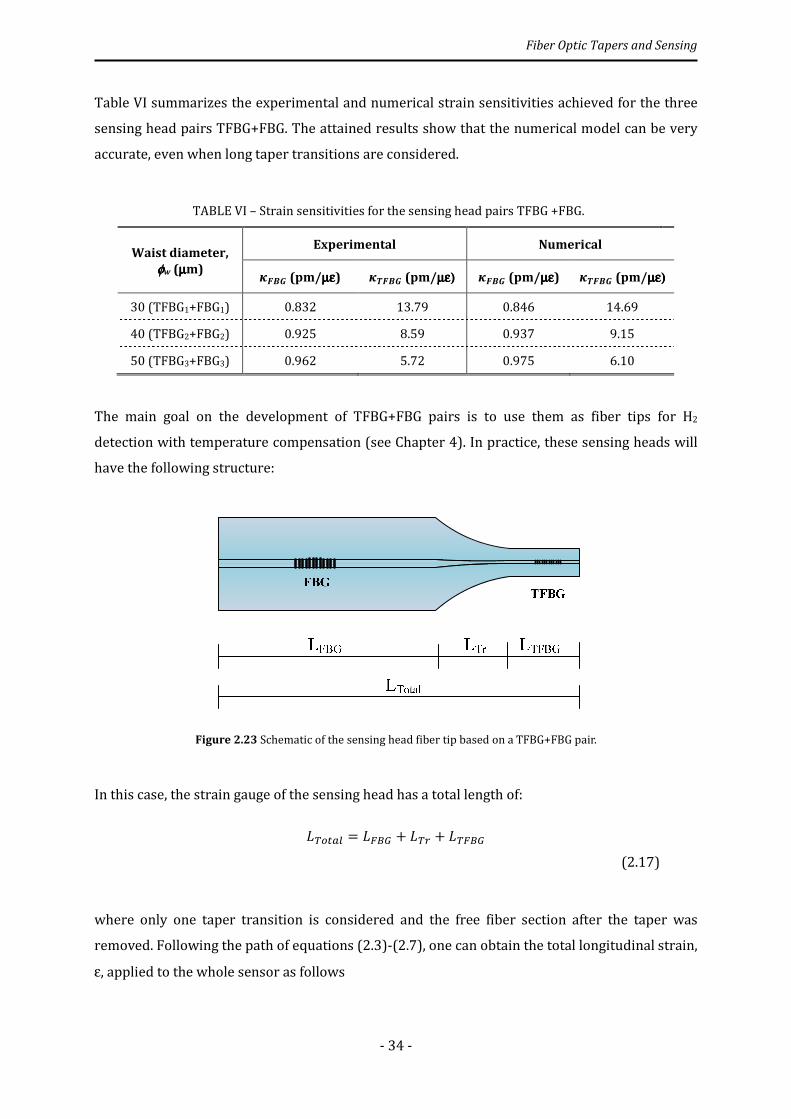
Fiber Optic Tapers and Sensing
- 34 -
Table VI summarizes the experimental and numerical strain sensitivities achieved for the three
sensing head pairs TFBG+FBG. The attained results show that the numerical model can be very
accurate, even when long taper transitions are considered.
TABLE VI – Strain sensitivities for the sensing head pairs TFBG +FBG.
Waist diameter,
φφφφw (µµµµm)
Experimental Numerical
1234 (pm/µεµεµεµε) 15234 (pm/µε)µε)µε)µε) 1234 (pm/µεµεµεµε) 15234 (pm/µε)µε)µε)µε)
30 (TFBG1+FBG1) 0.832 13.79 0.846 14.69
40 (TFBG2+FBG2) 0.925 8.59 0.937 9.15
50 (TFBG3+FBG3) 0.962 5.72 0.975 6.10
The main goal on the development of TFBG+FBG pairs is to use them as fiber tips for H2
detection with temperature compensation (see Chapter 4). In practice, these sensing heads will
have the following structure:
Figure 2.23 Schematic of the sensing head fiber tip based on a TFBG+FBG pair.
In this case, the strain gauge of the sensing head has a total length of:
������ = � �� + ��� + �� ��
(2.17)
where only one taper transition is considered and the free fiber section after the taper was
removed. Following the path of equations (2.3)-(2.7), one can obtain the total longitudinal strain,
ε, applied to the whole sensor as follows
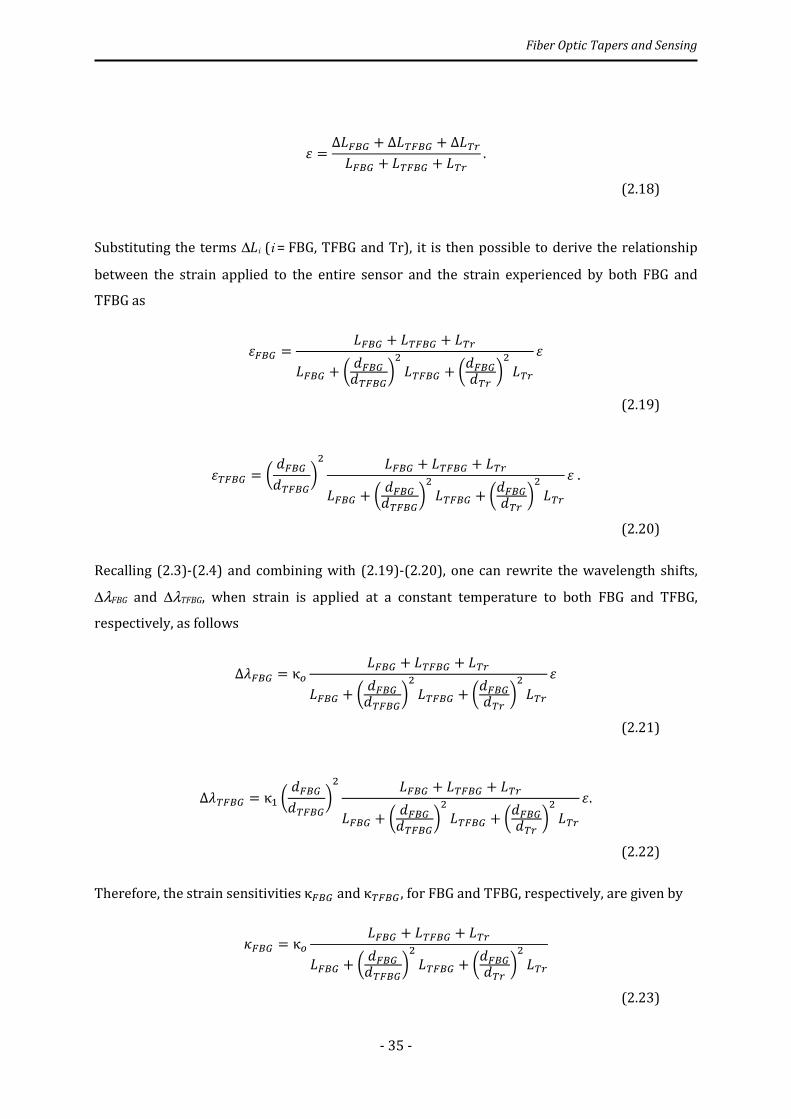
Fiber Optic Tapers and Sensing
- 35 -
� = ∆� �� + ∆�� �� + ∆���� �� + �� �� + ��� . (2.18)
Substituting the terms ∆Li (i = FBG, TFBG and Tr), it is then possible to derive the relationship
between the strain applied to the entire sensor and the strain experienced by both FBG and
TFBG as
� �� = � �� + �� �� + ���� �� + & ' ��'� ��() �� �� + &' ��'�� () ���
�
(2.19)
�� �� = & ' ��'� ��() � �� + �� �� + ���� �� + & ' ��'� ��() �� �� + &' ��'�� () ���
�. (2.20)
Recalling (2.3)-(2.4) and combining with (2.19)-(2.20), one can rewrite the wavelength shifts,
∆λFBG and ∆λTFBG, when strain is applied at a constant temperature to both FBG and TFBG,
respectively, as follows
∆� �� = κ� � �� + �� �� + ���� �� + & ' ��'� ��() �� �� + &' ��'�� () ���
�
(2.21)
∆�� �� = κ� & ' ��'� ��() � �� + �� �� + ���� �� + & ' ��'� ��() �� �� + &' ��'�� () ���
�. (2.22)
Therefore, the strain sensitivitiesκ �� and κ� �� , for FBG and TFBG, respectively, are given by
0 �� = κ� � �� + �� �� + ���� �� + & ' ��'� ��() �� �� + &' ��'�� () ���
(2.23)
Fiber Optic Tapers and Sensing
- 36 -
0� �� = κ� & ' ��'� ��() � �� + �� �� + ���� �� + & ' ��'� ��() �� �� + &' ��'�� () ���
. (2.24)
Assuming that, in practice, the fiber probe has a total length of 100 mm, and using the values
considered in Table IV for LTFBG, LTr, dFBG, dTFBG and dTr, one can numerically estimate the strain
sensitivity of each sensor element (FBG and TFBG) for different taper waist diameters. Figure
2.24 a) and b) present the strain sensitivity of the FBG and TFBG, respectively, for the two
sensing heads considered (recall Figure 2.21 and Figure 2.23).
Figure 2.24 Relationship between the strain sensitivity of both a) FBG and b) TFBG with taper
waist diameter, for the two sensing heads studied and with distinct total lengths.
Although the results are not directly comparable because the sensing heads are different, it was
somehow expected that the strain sensitivity for each sensor element would decrease with the
reduction of LTotal [50]. On the other hand, strain sensitivity of both FBG and TFBG lean to κ�
because of the increase of taper waist diameter to the 125 µm-standard diameter of the
untapered FBG. Also, it was estimated that the strain sensitivity of both sensing heads is similar
when the same LTotal of 100 mm is considered. The full FBG-TFBG pair is more suitable for
multiplexing and therefore one can take advantage of its higher sensitivity to strain. However,
the tapered-FBG sensor tip has the advantage of enabling single-point measurements although
presenting lower sensitivity to strain. The fiber tip sensor is also highly attractive for the
development of functionalized sensing platforms, i.e., combined with a specific transducer that
will be sensitive to a certain biochemical parameter of the external medium.
28 30 32 34 36 38 40 42 44 46 48 50 52
0.3
0.4
0.5
0.6
0.7
0.8
0.9
1.0
1.1
a)
FBG
LTotal
= 100 mm
LTotal
= 748 mm
Str
ain s
ensi
tivit
y (
pm
/µε)
Taper waist diameter (µm)
28 30 32 34 36 38 40 42 44 46 48 50 52
2
4
6
8
10
12
14
16
b)
TFBG
LTotal
= 100 mm
LTotal
= 748 mm
Str
ain s
ensi
tiv
ity
(pm
/µε)
Taper waist diameter (µm)
Fiber Optic Tapers and Sensing
- 37 -
2.6 Conclusions
Concluding, the work developed at IPHT in Jena was extremely useful in a way that I was able to
acquire knowledge in tapering techniques such as the CO2 laser setup and the VYTRAN glass
processing machine. Also, the advanced experimental facilities of IPHT gave me the opportunity
to deal with FBG inscription technologies, namely, the DUV femtosecond laser setup in a
two-beam interferometric configuration and the excimer laser technique. Several tapers in
photosensitive and standard SMFs were fabricated with waist diameters of 30, 40 and 50 µm.
The VYTRAN machine has shown to be an excellent option for tapering fabrication with which
excellent taper profiles could be achieved in short fabrication times (effective fabrication
process was less than 2 minutes). Several FBGs in tapered fibers were successfully fabricated.
The DUV femtosecond laser technique has shown to be versatile in inscribing FBGs, especially in
non-photosensitive fibers and also providing high reflectivity FBGs when inscribing them in
tapered fibers within short fabrication times (6−10 minutes). The excimer laser technique is still
a powerful tool for FBG inscription with high spectral quality, reproducibility and within short
inscription times (∼ 1 minute).
The study on strain sensitivity of the developed FBG-based sensing heads has shown that
tapered-FBGs have excellent performance when submitted to strain. The tapered-FBG with
30 µm-diameter presented a maximum sensitivity of 13.8 pm/µε which is more than 10-fold
when compared to the one obtained for a standard FBG. The development of the tapered
FBG-based sensor tip provides the possibility of engaging sensing platforms that will transduce
the presence of a certain biochemical parameter of the external medium, into variations of
strain. The goal is to use palladium coating as the transducer element for H2 detection, as it will
be discussed later in Chapter 4.

- 38 -
- 39 -
3
Fiber Optic Sensing Based on Multimode
Interference
3.1 Introduction
The appearance of the multimode fiber, in the early 1970’s [51], was a major breakthrough for
the achievement of high-speed telecommunications and quickly gave rise to the development of
several optical fiber sensors. The multimode interference (MMI) effects in multimode fibers
rapidly earned the attention of researchers due to the high potential in integrated optics and, in
fact, led to the production of new optical devices [52].
In the past, multimode fiber-based structures were extensively studied for the development of
microbend sensors since the intensity modulation induced by microbend loss in such fibers
could provide a simple transduction mechanism to detect environmental changes such as
pressure, temperature, acceleration, and electromagnetic fields [53]. In 1997, Donlagic et al. [54]
presented the first microbend sensor configuration based on a multimode fiber section with
gradient index profile (GI-MMF) spliced between two singlemode fibers (SMFs) thus forming a
SMF–GI-MMF–SMF, that was defined by the authors as an SMS structure. In this case, the
GI-MMF provided no MMI effects to form the microbend sensor. In a different perspective,
multimode fibers with step-index profile (SI-MMF) make use of interference between high order
modes along its length [55]. Only in recent years, the research on this topic became more
attractive due to the possibility of creating new MMI-based fiber devices.
Nowadays, the typical MMI-based fiber device relies on a SI-MMF (or, for sake of simplicity,
MMF), which is the basis of the SMS structure; it can also be the combination of an MMF section
spliced at the end of an SMF (SMF-MMF tip) in order to act as a wavelength-tunable fiber lens
[55] or a fiber tip structure [56]. Regardless the type of configuration used, the MMI-based fiber
structure can act as a bandpass or band-rejection filter depending on the length of the MMF used
[57],[58]. Bandpass filters have unique spectral characteristics that make them highly attractive

Fiber Optic Sensing Based on Multimode Interference
- 40 -
for applications such as wavelength-tunable filtering [59],[60] and high-power lasers and
amplifiers [61]; while band-rejection filters are often used for the measurement of physical
parameters such as temperature, strain and refractive index (RI) [62].
In overall, MMI-based fiber devices are simple structures that have been increasingly used for
sensing applications due to the performances possible to be achieved, namely, in the
measurement of RI. This Chapter addresses this topic, starting by an historical overview of fiber
optic sensors based on MMI concept with focus on the measurement of RI. Afterwards, the
theoretical modeling of light propagation in the typical SMS structure is presented. Following,
distinct topologies based on MMI structures are proposed for the measurement of RI. The
concept was applied in the development of an SMF-MMF tip, a SMS with large-core air-clad PCF
and a SMS with a coreless-MMF. Lastly, the influence of curvature in SMS structures is also
studied.
3.2 Historic Overview of MMI-based Fiber Sensing
The first sensor based on MMI concept that used a step-index MMF was studied in 2003 by
Mehta et al. [63], which developed the theoretical model and experimental setup of a
displacement sensor. The structure consisted of an SMF-MMF tip combined with a planar mirror,
as depicted in Figure 3.1.
Figure 3.1 Schematic of the SMF-MMF tip + mirror configuration [63].
This structure makes use of the self-imaging concept; the planar mirror reflects the light in the
self-imaging point back to the MMF and thus forming the displacement sensor.
In 2006, Li et al. [56] developed a temperature sensor by means of the fiber tip concept, as
shown in Figure 3.2. The structure consisted of an SMF-MMF tip which is interrogated in
reflection. This sensor relied on the interference between different modes at the MMF end facet,
which are wavelength-sensitive to temperature variation.
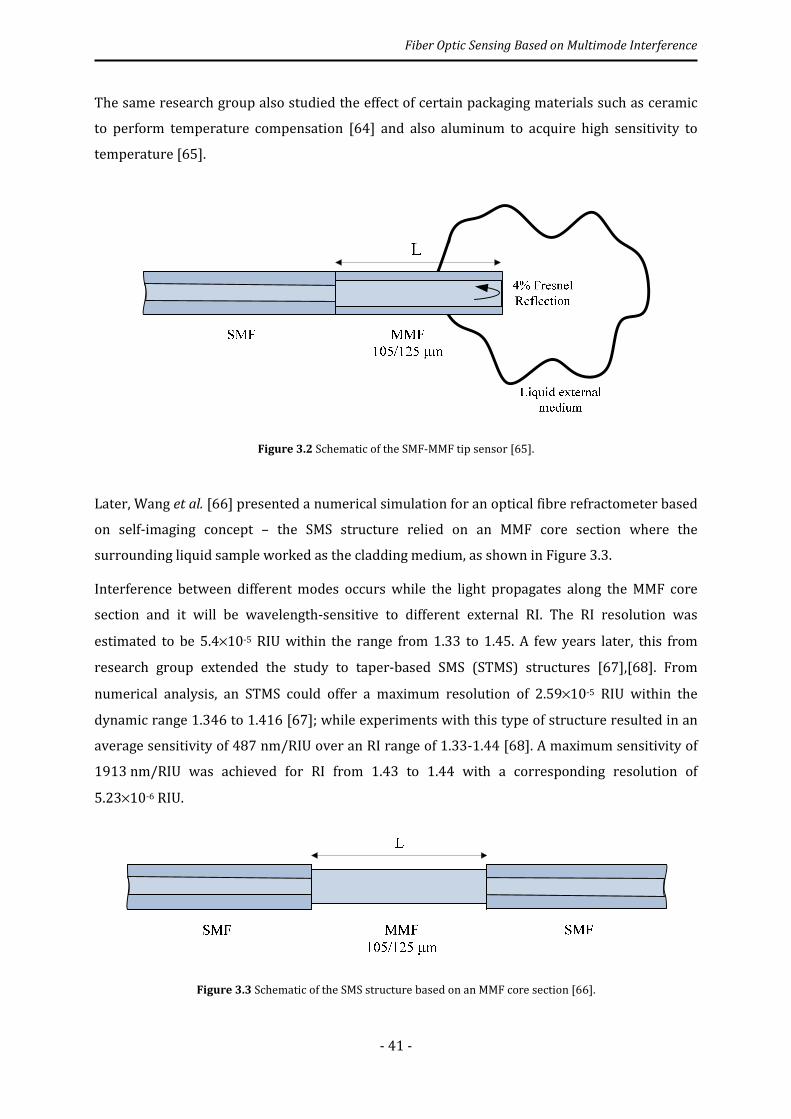
Fiber Optic Sensing Based on Multimode Interference
- 41 -
The same research group also studied the effect of certain packaging materials such as ceramic
to perform temperature compensation [64] and also aluminum to acquire high sensitivity to
temperature [65].
Figure 3.2 Schematic of the SMF-MMF tip sensor [65].
Later, Wang et al. [66] presented a numerical simulation for an optical fibre refractometer based
on self-imaging concept – the SMS structure relied on an MMF core section where the
surrounding liquid sample worked as the cladding medium, as shown in Figure 3.3.
Interference between different modes occurs while the light propagates along the MMF core
section and it will be wavelength-sensitive to different external RI. The RI resolution was
estimated to be 5.4×10⁻⁵ RIU within the range from 1.33 to 1.45. A few years later, this from
research group extended the study to taper-based SMS (STMS) structures [67],[68]. From
numerical analysis, an STMS could offer a maximum resolution of 2.59×10⁻⁵ RIU within the
dynamic range 1.346 to 1.416 [67]; while experiments with this type of structure resulted in an
average sensitivity of 487 nm/RIU over an RI range of 1.33-1.44 [68]. A maximum sensitivity of
1913 nm/RIU was achieved for RI from 1.43 to 1.44 with a corresponding resolution of
5.23×10⁻⁶ RIU.
Figure 3.3 Schematic of the SMS structure based on an MMF core section [66].

Fiber Optic Sensing Based on Multimode Interference
- 42 -
In 2010, Gao et al. [69] developed a temperature sensor based on a SMS structure with an etched
MMF. In a different perspective, Hatta et al. [70] proposed a ratiometric power measurement
scheme based on two SMS fiber structures for the measurement of strain with temperature
compensation. The research group also demonstrated that attaching a piezoelectric to the SMS
structure a voltage sensor could be attained by induced strain variations [71]. Zhang et al. [72]
reported instead the feasibility of a SMS fibre structure as a refractometer sensor where an MMF
section with different HF-corroded cladding diameters was used. Results showed that the
resolution could be improved by using an MMF core with full HF-corroded cladding. The RI
resolution achieved for this sensor was 7.9×10⁻⁵ RIU for RI range from 1.33 to 1.38.
In 2011, an SMF-MMF tip sensor for liquid level measurement was reported by Antonio-Lopez et
al. [73]. The sensing structure was based on a pure silica rod (coreless-MMF) spliced to an SMF
to form a bandpass filter. The MMF tip was coated with a thin layer of gold to act as mirror, so
that the self-image was back-reflected and coupled into the SMF. Therefore, when the
coreless-MMF was immersed in a liquid and its level was changed, a correlated shift of the
wavelength peak was found. In a different perspective, Gong et al. [74] developed an SMS fiber
structure for curvature sensing. The transmitted optical spectrum had several loss bands that
presented different sensitivities to curvature. Using that ability, Silva et al. [75] proposed a
temperature and strain independent curvature sensor by means of a similar SMS configuration.
Wu et al. [76] produced, in turn, a displacement sensor based on a bent SMS structure. Later, the
research group used this concept to create a single-side bent SMS structure to measure both
displacement and temperature simultaneously and independently [77]. A simple scheme based
on two SMS fiber structures in series was also developed by Wu et al. [78] for simultaneous
measurement of strain and temperature. In a different line of research, Silva et al. [79]
characterized a SMS structure based on a large-core, air-clad photonic crystal fiber (PCF) as a
refractometer sensor. Using two distinct large-core air-clad PCF geometries, one for RI
measurement and other for temperature compensation, it was possible to implement a sensing
head that was sensitive to RI changes induced by temperature variations in water. The system
presented a resolution of 3.4×10⁻⁵ RIU for a variation of 1 °C and maximum sensitivity of
880 nm/RIU was attained in the RI range from 1.3196 to 1.3171. On the other hand, Coelho et al.
[62] used the outer cladding of a large-core air-clad PCF as an optical waveguide, which in turn
acts as an MMF section in the SMS structure. The fiber device allowed simultaneous
measurement of temperature and strain. A maximum sensitivity of 322.08 nm/RIU was also
attained for the measurement of RI in the range 1.338-1.403. Wu et al. [80] investigated the
influence of different etched MMF core diameters and lengths on the sensitivity of an SMS fiber
based refractometer. Numerical analysis has shown that the sensitivity to external RI increased
when the etched MMF core diameter decreased. Experimental results have shown that using an

Fiber Optic Sensing Based on Multimode Interference
- 43 -
MMF core with 80 μm-diameter, a maximum sensitivity of 1815 nm/RIU for a RI range from
1.342 to 1.437 could be achieved.
In 2012, Gao et al. [81] developed an SMS structure based on an etched MMF for the
measurement of RI via intensity variations of the bandpass spectral filter. A resolution of
4.6×10⁻⁶ RIU in the RI range from 1.34 to 1.43 was attained. An SMF-MMF tip configuration was
reported by Silva et al. [82] for the measurement of different RI liquids by means of the
measurand-induced intensity variation of the reflected band-rejection spectral filter. A
maximum resolution of 3.8×10⁻⁴ RIU in the RI range from 1.30 to 1.38 was achieved. Later, Silva
et al. [83] improved the SMS configuration proposed by Wu et al. [80] by using a coreless-MMF
with 55 µm-diameter, which could allow obtaining a maximum sensitivity of 2800 nm/RIU in
the RI range from 1.42-1.43. This sensor proved to have an ultrahigh sensitivity to temperature
variations in the liquid RI of 1.43 – a maximum sensitivity of −1880 pm/°C was attained. In a
different line of research, the research group proposed a MMI sensor for curvature and
temperature discrimination based on the combination of SMS bandpass and band-rejection
filters [84]. On the other hand, Biazoli et al. [85] presented instead the real-time monitoring of
the fabrication process of tapering down a SMS structure based on a coreless-MMF. The
bandpass filter was used for the measurement of RI variations of the external liquid medium – a
maximum sensitivity of 2946 nm/RIU in the RI range of 1.42-1.43 was obtained. Xue et al. [86]
studied the sensitivity enhancement of an SMS fiber structure in the measurement of
surrounding RI, by coating the MMF core section with a high RI overlay of 1.578. Numerical
analysis shown that, for RI ranges from 1.31 to 1.35 and 1.0 to 1.03, average sensitivities of
900 and 206 nm/RIU could be achieved with overlay thicknesses of 340 and 470 nm,
respectively. Recently, a micro-displacement sensor based on a SMS bandpass filter was
developed by Antonio-Lopez et al. [87]. The fiber structure was placed inside a ferrule with
index matching liquid in order to increase the effective length of the coreless-MMF. A
wavelength variation could be achieved with the change of the MMF length.
The MMI-based device has often been used as an optical power splitter either, where the
purpose is to combine that ability with other fiber devices such as fiber Bragg gratings (FBGs) or
even to create new optical devices such as Mach–Zehnder interferometers (MZIs). In 2007,
Li et al. [88] proposed the combination of a SMS structure with a FBG in order to perform
temperature and strain discrimination. Frazão et al. [89] demonstrated an all fiber MZI based on
a SMS structure combined with a long-period grating (LPG) for the measurement of curvature. In
this line of research, Nguyen et al. [90] combined two SMS structures in line to form a MZI. This
sensor has shown to be highly sensitive to temperature variations.
Fiber Optic Sensing Based on Multimode Interference
- 44 -
Later, Zhou et al. [91] presented a FBG followed by an SMS structure for simultaneous
measurement of temperature and strain. In the same line of research, Zhang et al. [92] studied a
sensing scheme based on the combination of an SMF-MMF tip with a Fizeau etalon to measure
temperature and strain simultaneously. In 2010, Jin et al. [93] developed a fiber tip-based
refractometer that relied on a SMS bandpass filter followed by a tilted FBG. This configuration
presented a sensitivity of 28.5 µW/RIU in the RI range from 1.37 to 1.43. Recently, Wu et al. [94]
reported instead a refractometer sensor based on the combination of a SMS bandpass filter
followed by an FBG. Experimentally, a maximum sensitivity of 7.33nm/RIU in the RI range from
1.324 to 1.439 was achieved.
The MMI device has also been used as a tool for the development of interrogation techniques.
Wu et al. [95] proposed an SMS band-rejection filter as the interrogating system for dynamic
temperature compensation of an FBG strain sensor. On the other hand, Frazão et al. [96]
combined an SMF-MMF tip with a simple interrogation method that used two FBGs as discrete
optical sources, in order to measure RI variations of liquids. In this case, the measurand
information was encoded in the relative intensity variation of the reflected signals. A resolution
of 1.75 × 10⁻³ RIU was achieved with this technique.
This Chapter focuses on the development of MMI-based fiber optic sensors for refractometric
applications. Due to the significance of the subject into the context of the PhD programme, only
the configurations developed for RI sensing, and described in this historical overview, were
considered in detail. Table I summarizes the various types of MMI-based fiber optic structures
that already been developed for RI sensing.

Fiber Optic Sensing Based on Multimode Interference
- 45 -
TABLE I – MMI-based fiber refractometric sensors.
RI range Sensing head
Sensitivity
(nm/RIU)/ Resolution (RIU)
Ref
1.33 – 1.45 SMF-100 µm-diameter MMF-SMF 5.4×10⁻⁵ RIU [66]
1.346 – 1.416 SMF-40 µm-diameter tapered MMF-SMF
2.59×10⁻⁵ RIU [67]
1.33 – 1.44 SMF-30 µm-diameter tapered
MMF-SMF
487 nm/RIU
[68] 1.43 – 1.44
1913 nm/RIU, 5.23×10⁻⁶ RIU
1.33 – 1.38 SMF-105 µm-diameter etched MMF-SMF
7.9×10⁻⁵ RIU [72]
1.3196 – 1.3171 SMF- Large Core Air Clad PCF-
SMF 880 nm/RIU, 3.4×10⁻⁵
RIU [79]
1.338 – 1.403 SMF- outer cladding, large core air
clad PCF-SMF 322.08 nm/RIU,
7.2×10⁻⁴ RIU [62]
1.342 – 1.437 SMF-80 µm-diameter etched
MMF-SMF 1815 nm/RIU [80]
1.34 – 1.43 SMF-81.5 µm-diameter etched MMF-SMF
4.6×10⁻⁶ RIU [81]
1.30 – 1.38 SMF-MMF tip 3.8×10⁻⁴ RIU [82]
1.42 – 1.43 SMF-55 µm-diameter coreless-MMF-SMF
2800 nm/RIU [83]
1.42 – 1.43 SMF-55 µm-diameter tapered coreless-MMF-SMF
2946 nm/RIU [85]
1.31 – 1.35 SMF- MMF with high RI overlay coating -SMF
900 nm/RIU [86]
1.0 – 1.03 206 nm/RIU
1.37 – 1.43 SMS-tilted FBG tip 28.5 µW/RIU [93]
1.324 – 1.439 SMS-FBG 7.33 nm/RIU [94]
1.3 – 1.38 SMF-MMF tip + FBGs -5.87/RIU, 1.75×10⁻³ RIU
[96]
3.3 Operating Principle of Singlemode-Multimode-Singlemode Fiber
Structures
The singlemode-step-index multimode-singlemode fiber structure, or most commonly known as
SMS, is formed by a section of MMF with length L spliced between two SMFs and interrogated in
transmission. The SMFs and MMF are assumed to be aligned along the same axis; they also have
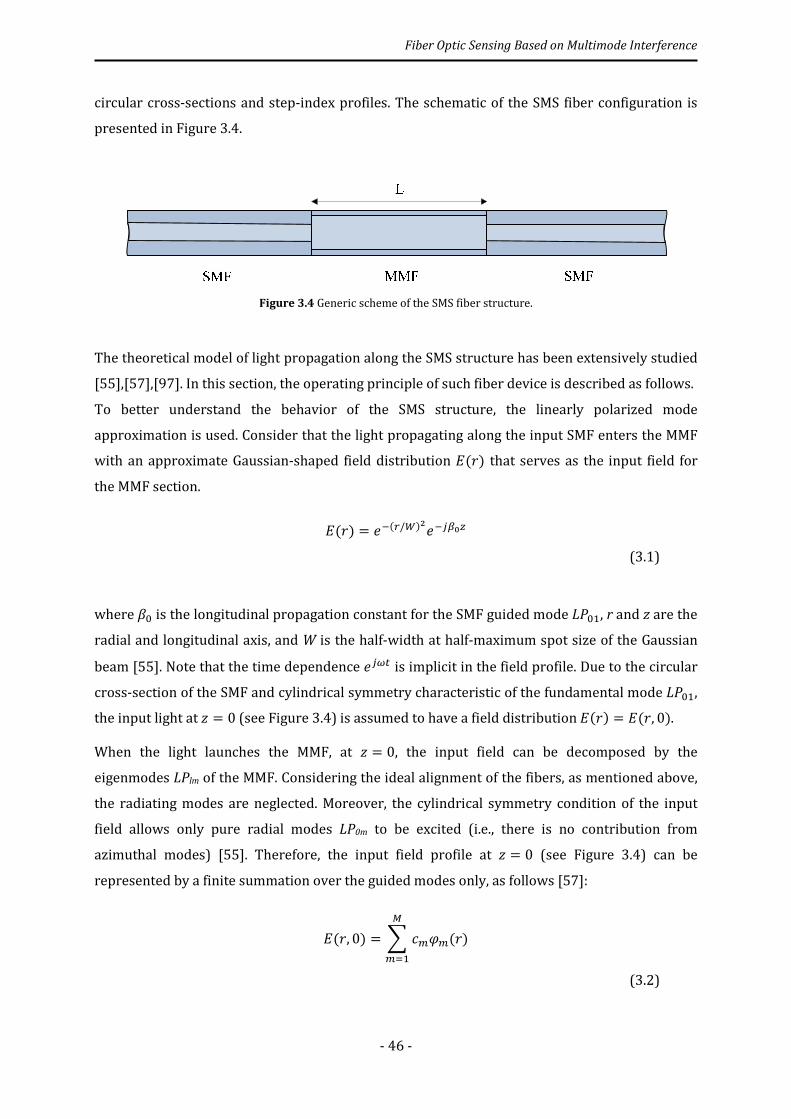
Fiber Optic Sensing Based on Multimode Interference
- 46 -
circular cross-sections and step-index profiles. The schematic of the SMS fiber configuration is
presented in Figure 3.4.
Figure 3.4 Generic scheme of the SMS fiber structure.
The theoretical model of light propagation along the SMS structure has been extensively studied
[55],[57],[97]. In this section, the operating principle of such fiber device is described as follows.
To better understand the behavior of the SMS structure, the linearly polarized mode
approximation is used. Consider that the light propagating along the input SMF enters the MMF
with an approximate Gaussian-shaped field distribution $(7) that serves as the input field for
the MMF section.
$(7) = 9:(�/;)<9:!=>?
(3.1)
where @A is the longitudinal propagation constant for the SMF guided mode �BA�, r and z are the
radial and longitudinal axis, and W is the half-width at half-maximum spot size of the Gaussian
beam [55]. Note that the time dependence 9!C� is implicit in the field profile. Due to the circular
cross-section of the SMF and cylindrical symmetry characteristic of the fundamental mode �BA�,
the input light at D = 0 (see Figure 3.4) is assumed to have a field distribution $(7) = $(7, 0).
When the light launches the MMF, at D = 0, the input field can be decomposed by the
eigenmodes LPlm of the MMF. Considering the ideal alignment of the fibers, as mentioned above,
the radiating modes are neglected. Moreover, the cylindrical symmetry condition of the input
field allows only pure radial modes LP0m to be excited (i.e., there is no contribution from
azimuthal modes) [55]. Therefore, the input field profile at D = 0 (see Figure 3.4) can be
represented by a finite summation over the guided modes only, as follows [57]:
$(7, 0) = F GHIH(7)JHK�
(3.2)
Fiber Optic Sensing Based on Multimode Interference
- 47 -
where GHis the field expansion coefficient of the -�L mode of the MMF, M is the total number of
radial modes, and IH(7) is the field profile of LP0m.
The input field excites a specific number of guided modes LP0m inside the MMF. As the light
propagates along the MMF section with length L, the field distribution at a distance z can be
written as [57]:
$(7, D) = F GHIH(7)9!=M?JHK�
(3.3)
where @H is the longitudinal propagation constant of the -�L mode of the MMF. The field
expansion coefficient GH can be calculated by the following cross-correlation expression [97]:
GH = N $(7, 0)IH(7)7'7OA BH
(3.4)
where Pm is the power of each guided mode and is given by:
BH = P |IH(7)|)7'7.OA
(3.5)
The power coupling efficiency R determines the amount of the input field power that couples to
each specific mode in the MMF. The field excitation coefficient GHis related to the power
coupling efficiency R through GHS = TR, where the modified field excitation coefficient GHS is
defined as [97]:
GHS = GHUBH BVW
(3.6)
where Ps is the power of the source and is given by:
BV = P |$(7, 0)|)7'7.OA
(3.7)
Fiber Optic Sensing Based on Multimode Interference
- 48 -
Therefore, power coupling efficiency R can be determined by the overlap integral between $(7, 0) and IH(7) as follows [97]:
R = XN $(7, 0)IH(7)7'7OA X)N |$(7, 0)|)7'7OA N |IH(7)|)7'7OA
(3.8)
The coupling efficiency will reach a peak when the length of the MMF section is selected so that
the field distribution at the end of said fiber is an image of the input field. That length is referred
to as the self-imaging distance [52], as it will be discussed in the following section. Deviation
from this condition causes the coupling efficiency to drop. This parameter will depend not only
on the MMF dimensions but it is also strongly wavelength dependent.
To better understand this behavior, light propagation in the MMF section of an SMS structure in
transmission was investigated by means of 3D simulation based on the beam propagation
method (BPM) [98].
In this analysis it was considered a step-index MMF with numerical aperture of 0.22, and
105/125 µm for core and cladding diameters, respectively. SMFs with 8.2/125 µm core and
cladding diameters, respectively, were used for both light input and output of the MMF section.
All fibers were aligned along the same axis and possessed a circular cross-section. For the
operational center wavelength of 1500 nm, the refractive indices of the core and cladding were
1.4446 and 1.4277, respectively. The modeling of light propagation was done for a total MMF
section of 50 mm.
The intensity distribution of the electric field at the simulated MMF length of 50 mm is plotted in
Figure 3.5 a) for an xz-cut, where x is a radial coordinate and z is the axial one (the input SMF is
not plotted for clarity). Simulation results clearly show that the global field profile changes along
the MMF section but remains symmetrically distributed along the direction of propagation [55].
Therefore, distinct propagation distances correspond to different field profiles at the exit end of
an MMF with a given length L. As a result, coupling efficiency between the calculated field at the
simulated MMF section and the input field given by the fundamental mode of the SMF (i.e. the
transmission of the SMS structure) will depend on the MMF length, as illustrated in Figure 3.5 b).
In this result, it is possible to observe that are several locations corresponding to no coupling of
light from MMF to the output SMF, for example, at approximately 11.1, 22.1 and 32.4 mm. There
are also other locations that correspond to high coupling, such as 5.6, 32.8 and 43.1 mm.
However, only z = 43.1 mm corresponds to the self-imaging distance, as it will be discussed
ahead (see equation 3.14). The remaining locations match to local maxima where only field
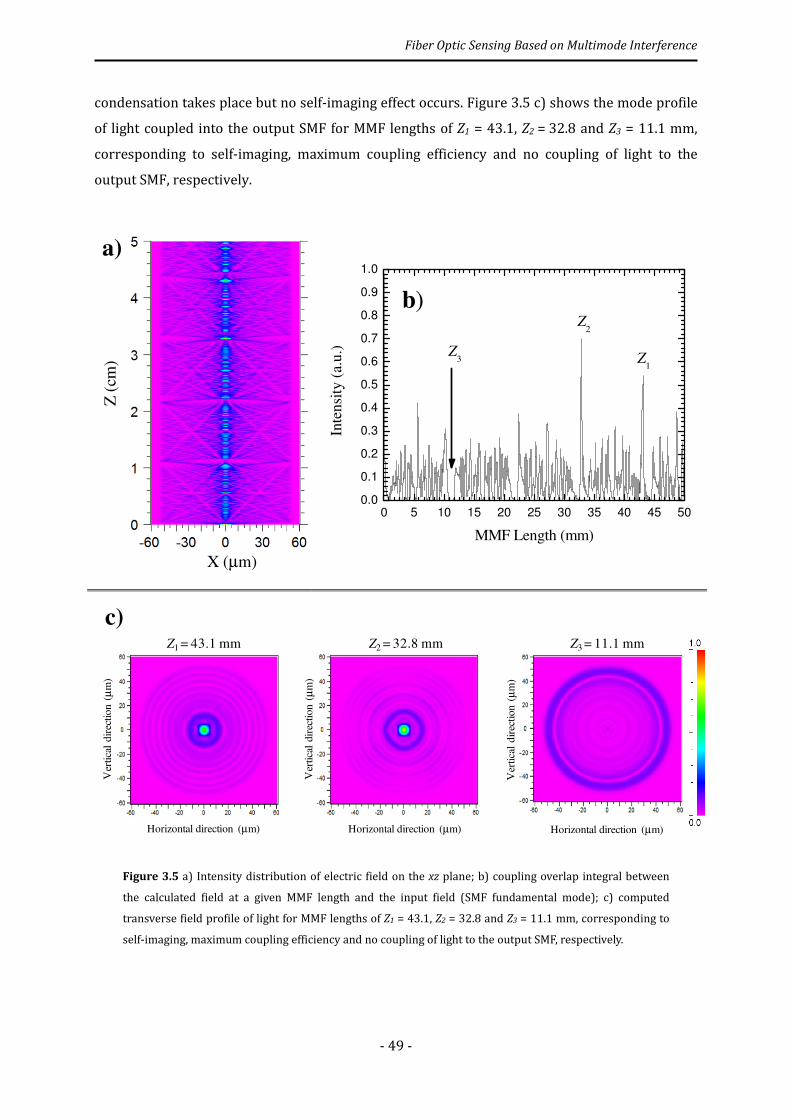
Fiber Optic Sensing Based on Multimode Interference
- 49 -
condensation takes place but no self-imaging effect occurs. Figure 3.5 c) shows the mode profile
of light coupled into the output SMF for MMF lengths of Z1 = 43.1, Z2 = 32.8 and Z3 = 11.1 mm,
corresponding to self-imaging, maximum coupling efficiency and no coupling of light to the
output SMF, respectively.
Figure 3.5 a) Intensity distribution of electric field on the xz plane; b) coupling overlap integral between
the calculated field at a given MMF length and the input field (SMF fundamental mode); c) computed
transverse field profile of light for MMF lengths of Z1 = 43.1, Z2 = 32.8 and Z3 = 11.1 mm, corresponding to
self-imaging, maximum coupling efficiency and no coupling of light to the output SMF, respectively.
Z (
cm)
X (µm)
0 5 10 15 20 25 30 35 40 45 50
0.0
0.1
0.2
0.3
0.4
0.5
0.6
0.7
0.8
0.9
1.0
Z1
Z3
Inte
nsi
ty (
a.u
.)
MMF Length (mm)
Z2
b)
Z2 = 32.8 mm Z3 = 11.1 mmZ1 = 43.1 mm
Horizontal direction (µm)
Ver
tica
l d
irec
tion
(µ
m)
Horizontal direction (µm)
Ver
tica
l dir
ecti
on
(µ
m)
Horizontal direction (µm)
Ver
tica
l d
irec
tion
(µ
m)
c)
a)
Fiber Optic Sensing Based on Multimode Interference
- 50 -
3.3.1 Self-imaging concept
The principle of self-imaging in multimode waveguides was stated by Soldano et al. [52] as
follows: “Self-imaging is a property of multimode waveguides by which an input field profile is
reproduced in single or multiple images at periodic intervals along the propagation direction of the
guide.”
When the light field propagating along the input SMF enters the MMF section, several modes of
MMF are excited with different propagation constants, @H. Hence, interference between
different modes occurs, while the light beam propagates along the remainder of the MMF
section.
At the exit end of the MMF section, the phase difference between two consecutive modes, LP0m
and LP0n, is determined by the MMF length and the difference between the longitudinal
propagation constants of the two modes, @H − @Z, which can be expressed as [55]:
@H − @Z = [H) − [Z)2\])�^� - > �
(3.9)
where [H = `(- − 1/4) and [Z = `(� − 1/4) are the roots of the Bessel function of zero order,
a is the MMF core radius, \ = 2`/� is the free space wave number, and nco is the refractive index
of the fiber core.
The condition for constructive interference between LP0m and LP0n is [55]:
(@H − @Z)D = 2`b
(3.10)
where N is an integer. This means that are several locations zN, corresponding to local maxima
along the MMF, where field condensation occurs. The self-image condition should be a specific
case of constructive interference, i.e. a specific integer N multiple of the location zN characteristic
of this effect. From equation (4.10), one can obtain Dc as follows:
Dc = 8\])�^�`(- − �)e2(- + �) − 1f b. (3.11)
Since two consecutive modes are considered, � = - − 1 and equation (3.11) is simplified
according to:
Fiber Optic Sensing Based on Multimode Interference
- 51 -
Dc = 8\])�^�`(4- − 3) b. (3.12)
Moreover, there is a specific location zp where the phase difference between the two excited
modes equals 2π (i.e., b = 1). This is the so called beat length and is given by:
Dh = 8\])�^�`(4- − 3)
(3.13)
One can conclude that Dc = bDh. From this expression it is possible to obtain the self-imaging
distance zi as follows [55]:
D� = 16])�^��
(3.14)
where λ is the operational wavelength. Thus, the self-imaging distance zi pertains to where the
light field at the input of the MMF section is replicated, in both amplitude and phase, on the
output of the MMF for a specific wavelength. In this specific case, only the first self-image (and
multiples) will exhibit minimum losses – the self-imaging effect provides an optical spectrum in
the form of a bandpass filter, as it will be discussed later in section 3.6. Assuming the parameters
used for the simulation presented in Figure 3.5, one obtains from equation 3.14 that the first
self-image is located at zi = 42.5 mm, which is in good agreement with attained numerical result
(z3 = 43.1 mm from Figure 3.5).
In the case of the fractional planes where the coupling coefficient exhibit minimum losses, one
can obtain band-rejection filtering. The optical spectrum presents loss peaks that are produced
by destructive interference between a set of specific higher-order modes at the exit end of the
MMF.
The following sections present several sensing heads based on MMI concept; according with the
characteristics of the MMF used, most specifically, its length, it was possible to take advantage of
bandpass filtering (high coupling efficiency) and band-rejection filtering (low coupling
efficiency) for the measurement of RI, temperature, strain and curvature.

Fiber Optic Sensing Based on Multimode Interference
- 52 -
3.4 An Optical Fiber Refractometer based on Multimode
Interference in a Reflective Configuration
3.4.1 Introduction
Measurement of RI is of great importance whenever characterization of the optical properties of
many specimens is at stake. Over the past decades, various RI sensors have accordingly been
proposed for applications in several areas – spanning from engineering to science. The Abbe
refractometer is a well-known standard apparatus to measure RI in the visible and near-IR
spectrum [99],[100]; however, such limitations of traditional bulk refractometers as size and
weight have urged development of alternative sensors. An active field of research has nowadays
focused on optical fibers as an alternative device for RI measurement.
Optical fiber-based RI sensors have found numerous applications in environmental, chemical
and biological sensing; they may indeed be rather compact in size, and can also be made suitable
for remote sensing. Several schemes for RI sensing based on optical fibers have meanwhile been
described. For instance, Asseh et al. [101] developed an evanescent field RI sensor based on a
5 mm-long FBG with etched cladding, interrogated by a tunable DBR laser. This type of RI sensor
relies on the evanescent tail of the core modes under fiber etching conditions – and, when in
contact with the surrounding medium, is sensitive to RI variations. This sensor presented a
maximum resolution of 7.5 × 10⁻⁵ RIU, for an RI range of 1.33-1.42 and operation wavelength of
1550 nm.
An LPG-based RI sensor was produced by Bhatia et al. [102] – the sensitivity of which to external
perturbations came from cladding-mode interactions with the surrounding medium. For the LPG
sixth-order resonance band at 1573 nm, the resolution was found to be 7.69 × 10⁻⁵ RIU, within
an RI range covering from 1.404 to 1.452.
As previously discussed, Wang et al. [66] presented a different approach based on numerical
analysis of MMI effects in a SMS structure where the surrounding liquid sample worked as the
cladding medium. For operation at a wavelength of 1550 nm and an MMF length of 9.4 mm, the
RI resolution was estimated to be 5.4 × 10⁻⁵ RIU, when the RI measurement spanned 1.38-1.45.
Jorgenson et al. [103] presented, in turn, an optical fiber sensor that utilized surface plasmon
resonance (SPR) excitation. The sensing element was in this case a section of the fiber from
which the cladding was removed – and a thin layer of highly reflecting metal was symmetrically
deposited onto the fiber core. The fiber optic SPR sensor presented a resolution of 2.5 × 10⁻⁴ RIU
Fiber Optic Sensing Based on Multimode Interference
- 53 -
and 7.5 × 10⁻⁵ RIU, at wavelengths of 500 nm and 900 nm, respectively, for RI in the range
1.351-1.404.
The feasibility of a simple fiber optic technique, based on Fresnel reflection from the fiber tip,
was demonstrated by Meyer et al. [104] – by measuring retroreflection from the interface
between the core of a single-mode fiber and the liquid sample, for various RI. For an RI
measurement range of 1.33-1.48, at an operation wavelength of 630 nm, the sensor presented an
average accuracy of ±0.2%. Later, Kim et al. [105] demonstrated the concept with an optical
fiber coupler – in which one of the fiber arms was used as probe, and the other as reference. The
RI of a few liquids was then successfully measured, by determining the ratio of reflected signals
from the fiber-air and fiber-liquids interfaces. At the wavelengths of 1310 and 1551 nm, this
technique produced a resolution of 2.5 × 10⁻⁵ RIU.
A solution for RI measurement based on a fiber Fabry-Perot interferometer was reported more
recently [106]; this sensor relied on the combination of a short FBG (750 µm long) with Fresnel
reflection at the fiber tip, and the RI information was derived from the fringe visibility variation
of the interferometer. A resolution of ca. 10-3 RIU was attained for an RI measurement range of
1.33-1.41, and an operation wavelength of 1550 nm.
This work conveys experimental results based on the fiber tip-interaction concept – which is
intended to measure RI variations of a surrounding liquid. The operating mechanism of the fiber
probe relies on the measurand-induced intensity variation of a region of the channeled
spectrum, which results from MMI occurring in a section of MMF spliced to a standard SMF
(SMF 28, 8.2 µm core and 125 µm cladding diameters). Two MMFs with different core diameters
(50 and 105 µm) were thus used to measure RI variations. Both sensing MMI fiber tips
presented optical spectra that are sensitive to RI – and their temperature-dependence was also
ascertained.
3.4.2 Sensing concept
The sensing head used in this experiment takes advantage of amplitude variations of the MMI in
an MMF spliced to a SMF, thus forming an SMF-MMF tip, and interrogated in reflection. The
working principle of the sensing head is the fiber tip-interaction concept. In this case, the field
profile at the exit end of the MMF, and resultant from MMI along said fiber section, will be back-
reflected to the input/output SMF due to Fresnel reflection – the measurement of RI variations is
then performed by means of intensity variation of the MMI-based signal at the fiber tip. Also, the
coupling efficiency between the back-reflected field at the MMF section and the fundamental
mode field of the SMF will depend on the wavelength, MMF length and other fiber parameters,

Fiber Optic Sensing Based on Multimode Interference
- 54 -
i.e. the reflection spectrum from the sensing structure is sensitive to their variation. Additionally,
adequate tailoring of the MMF characteristics including length allows one to get a reflection
spectrum with specific features that may facilitate implementation of a particular sensing head
interrogation approach for RI measurement.
In the present case, the goal was to fabricate an MMI-based structure with an optical spectrum
showing a wide bandpass delimited by well-defined loss peaks – with the intensity of the Fresnel
reflection at the fiber-to-liquid interface monitored at a selected spectral window; hence, a
simple RI fiber optic sensor was implemented that exhibits a performance compatible with a
large range of applications.
3.4.3 Experimental configuration and results
The sensing head structure is shown in Figure 3.6; it was built on purpose and experimentally
tested. It consists of an MMF section with length L, spliced at the end of a SMF (SMF 28) and
interrogated in reflection. A broadband source (BBS) in the 1550 nm-spectral range was
employed – with a bandwidth of 100 nm, an optical circulator to obtain the reflected spectrum of
the sensing head, and an optical spectrum analyzer (OSA) as interrogation unit.
Figure 3.6 Experimental setup, with detail of the MMI fiber tip structure.
Two MMFs with different core diameters were used, viz. 50 and 105 µm; the numerical aperture
was 0.22, and the cladding diameter was 125 µm. The end of each MMF was then cleaved, in
order to obtain Fresnel reflection at the fiber tip. The length of each MMF section was set so as to
provide well defined loss peaks in the operation wavelength range of 1500-1600 nm. The
optimized length found, for each MMF section, was: 14 mm for the MMI fiber tip with 50 µm core
(MMI1); and 33 mm for the MMI fiber tip with 105 µm core (MMI2). The optical spectra of both
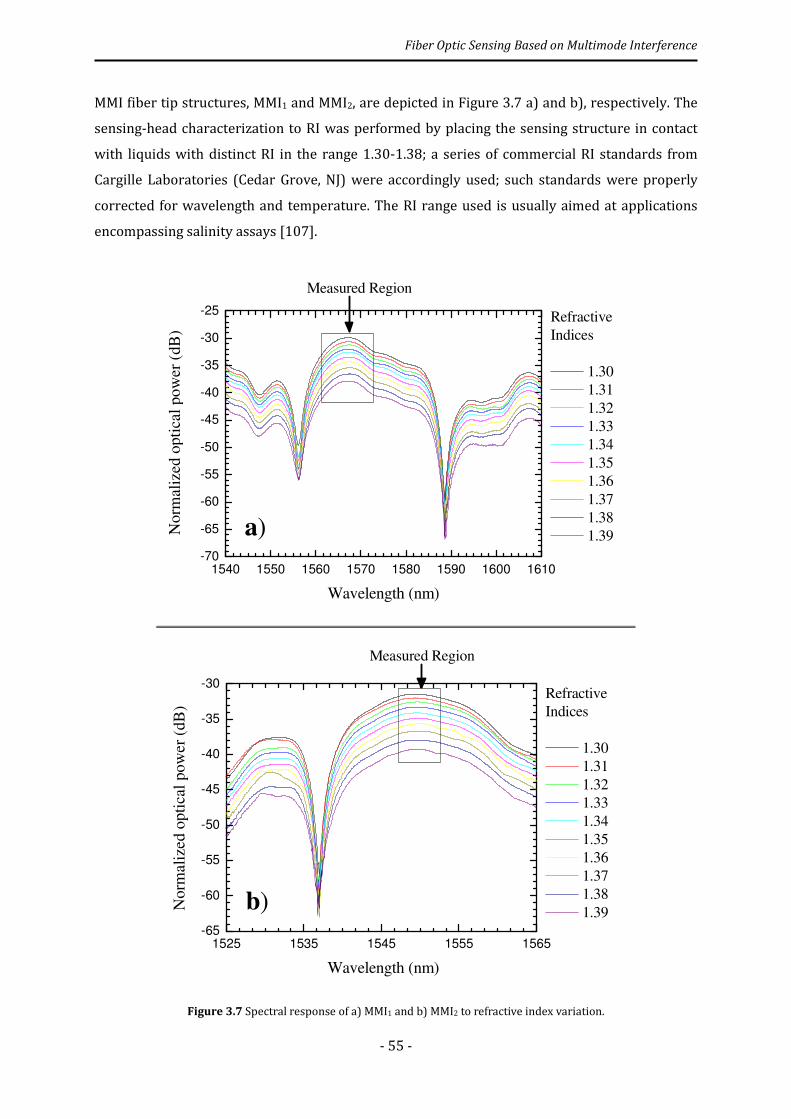
Fiber Optic Sensing Based on Multimode Interference
- 55 -
MMI fiber tip structures, MMI1 and MMI2, are depicted in Figure 3.7 a) and b), respectively. The
sensing-head characterization to RI was performed by placing the sensing structure in contact
with liquids with distinct RI in the range 1.30-1.38; a series of commercial RI standards from
Cargille Laboratories (Cedar Grove, NJ) were accordingly used; such standards were properly
corrected for wavelength and temperature. The RI range used is usually aimed at applications
encompassing salinity assays [107].
Figure 3.7 Spectral response of a) MMI1 and b) MMI2 to refractive index variation.
1540 1550 1560 1570 1580 1590 1600 1610
-70
-65
-60
-55
-50
-45
-40
-35
-30
-25 Refractive
Indices
1.30
1.31
1.32
1.33
1.34
1.35
1.36
1.37
1.38
1.39
Norm
aliz
ed o
pti
cal
pow
er (
dB
)
Wavelength (nm)
Measured Region
a)
1525 1535 1545 1555 1565
-65
-60
-55
-50
-45
-40
-35
-30
b)
Refractive
Indices
1.30
1.31
1.32
1.33
1.34
1.35
1.36
1.37
1.38
1.39
Norm
aliz
ed o
pti
cal
pow
er (
dB
)
Wavelength (nm)
Measured Region
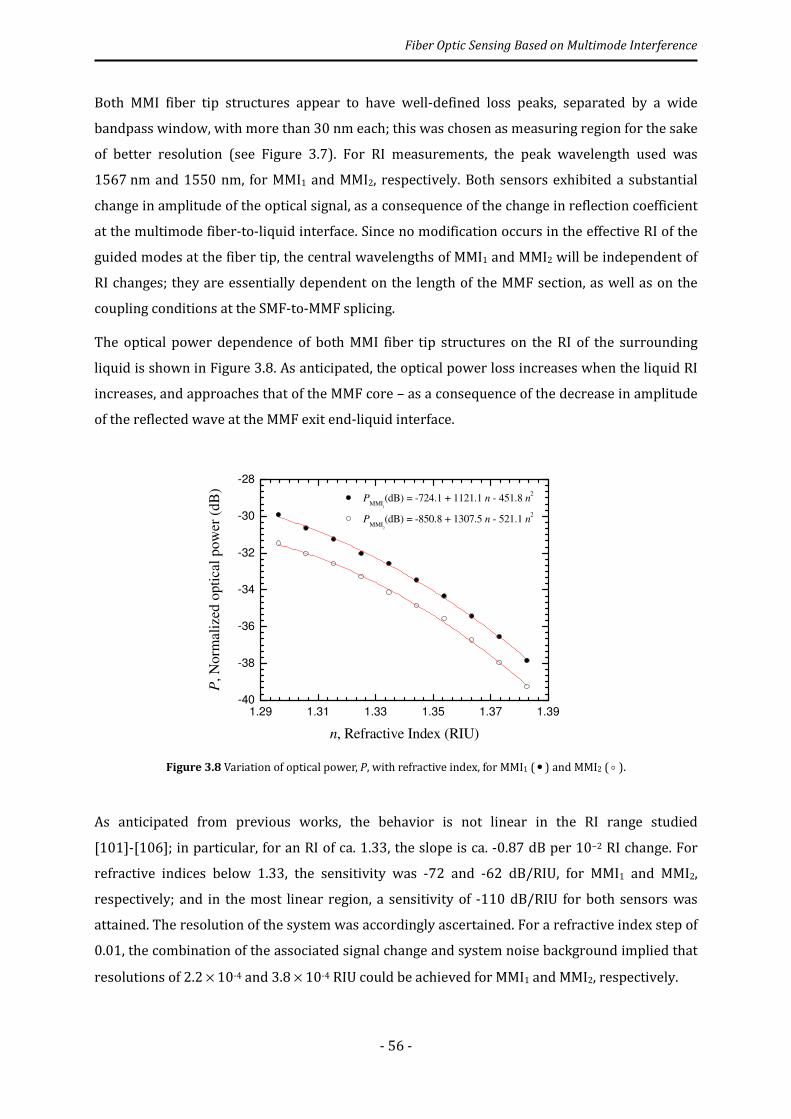
Fiber Optic Sensing Based on Multimode Interference
- 56 -
Both MMI fiber tip structures appear to have well-defined loss peaks, separated by a wide
bandpass window, with more than 30 nm each; this was chosen as measuring region for the sake
of better resolution (see Figure 3.7). For RI measurements, the peak wavelength used was
1567 nm and 1550 nm, for MMI1 and MMI2, respectively. Both sensors exhibited a substantial
change in amplitude of the optical signal, as a consequence of the change in reflection coefficient
at the multimode fiber-to-liquid interface. Since no modification occurs in the effective RI of the
guided modes at the fiber tip, the central wavelengths of MMI1 and MMI2 will be independent of
RI changes; they are essentially dependent on the length of the MMF section, as well as on the
coupling conditions at the SMF-to-MMF splicing.
The optical power dependence of both MMI fiber tip structures on the RI of the surrounding
liquid is shown in Figure 3.8. As anticipated, the optical power loss increases when the liquid RI
increases, and approaches that of the MMF core – as a consequence of the decrease in amplitude
of the reflected wave at the MMF exit end-liquid interface.
Figure 3.8 Variation of optical power, P, with refractive index, for MMI1 ( • ) and MMI2 ( o ).
As anticipated from previous works, the behavior is not linear in the RI range studied
[101]-[106]; in particular, for an RI of ca. 1.33, the slope is ca. -0.87 dB per 10−2 RI change. For
refractive indices below 1.33, the sensitivity was -72 and -62 dB/RIU, for MMI1 and MMI2,
respectively; and in the most linear region, a sensitivity of -110 dB/RIU for both sensors was
attained. The resolution of the system was accordingly ascertained. For a refractive index step of
0.01, the combination of the associated signal change and system noise background implied that
resolutions of 2.2 × 10⁻⁴ and 3.8 × 10⁻⁴ RIU could be achieved for MMI1 and MMI2, respectively.
1.29 1.31 1.33 1.35 1.37 1.39
-40
-38
-36
-34
-32
-30
-28
PMMI
1
(dB) = -724.1 + 1121.1 n - 451.8 n2
PMMI
2
(dB) = -850.8 + 1307.5 n - 521.1 n2
P, N
orm
aliz
ed o
pti
cal
pow
er (
dB
)
n, Refractive Index (RIU)
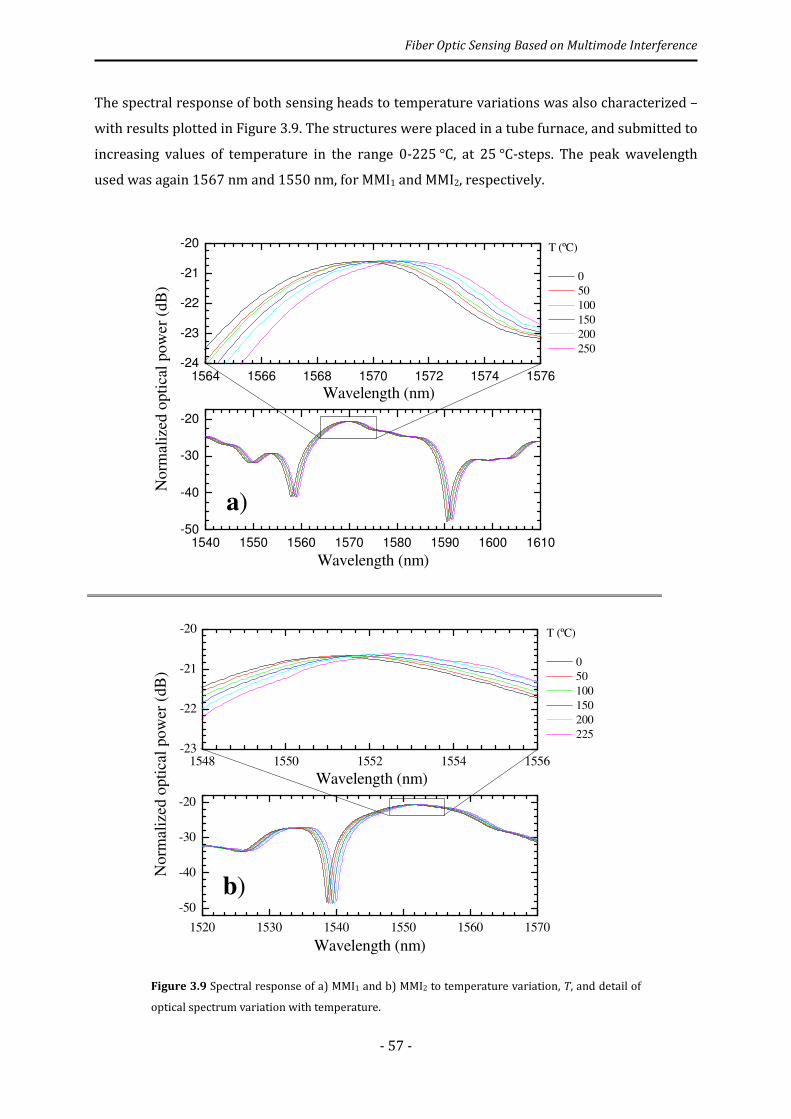
Fiber Optic Sensing Based on Multimode Interference
- 57 -
The spectral response of both sensing heads to temperature variations was also characterized –
with results plotted in Figure 3.9. The structures were placed in a tube furnace, and submitted to
increasing values of temperature in the range 0-225 °C, at 25 °C-steps. The peak wavelength
used was again 1567 nm and 1550 nm, for MMI1 and MMI2, respectively.
Figure 3.9 Spectral response of a) MMI1 and b) MMI2 to temperature variation, T, and detail of
optical spectrum variation with temperature.
1564 1566 1568 1570 1572 1574 1576
-24
-23
-22
-21
-20
1540 1550 1560 1570 1580 1590 1600 1610
-50
-40
-30
-20
T (ºC)
0
50
100
150
200
250
Wavelength (nm)
Norm
aliz
ed o
pti
cal
pow
er (
dB
)
Wavelength (nm)
a)
1548 1550 1552 1554 1556-23
-22
-21
-20
1520 1530 1540 1550 1560 1570
-50
-40
-30
-20
Wavelength (nm)
T (ºC)
0
50
100
150
200
225
b)
Norm
aliz
ed o
pti
cal
pow
er (
dB
)
Wavelength (nm)

Fiber Optic Sensing Based on Multimode Interference
- 58 -
In this case, both MMI fiber tip structures were wavelength-dependent on temperature (Figure
3.10), but with negligible optical power variation (Figure 3.11).
Figure 3.10 Shift of wavelength with temperature variation for MMI1 ( • ) and MMI2 ( o ).
Figure 3.11 Variation of optical power with temperature, for MMI1 ( • ) and MMI2 ( o ).
Inspection of Figure 3.10 indicates that bandpass of each sensing head exhibit linear responses
to temperature variations – characterized by sensitivities of (14.8 ± 0.2) and (10.8 ± 0.2) pm/°C,
for MMI1 and MMI2, respectively. This was somewhat expected [56] since the temperature
variation induces MMF length variation (due to thermal expansion – dominant effect) and RI
variation of the MMF core (due to silica thermo-optic effect); hence, an optical path length
0 25 50 75 100 125 150 175 200 225 250
0.0
0.5
1.0
1.5
2.0
2.5
3.0
3.5
4.0
∆λ/∆TMMI
1
= (14.8 ± 0.2) pm/ºC
∆λ/∆TMMI
2
= (10.8 ± 0.2) pm/ºC
∆λ (
nm
)
∆T (ºC)
0 20 40 60 80 100 120 140 160
-3
-2
-1
0
1
2
3
∆P/∆T(MMI
1) = (0.1 ± 0.1) x10
-3 dB/ºC
∆P/∆T(MMI
2) = (0.7 ± 0.1) x10
-3 dB/ºC
∆P
(dB
)
∆T (ºC)
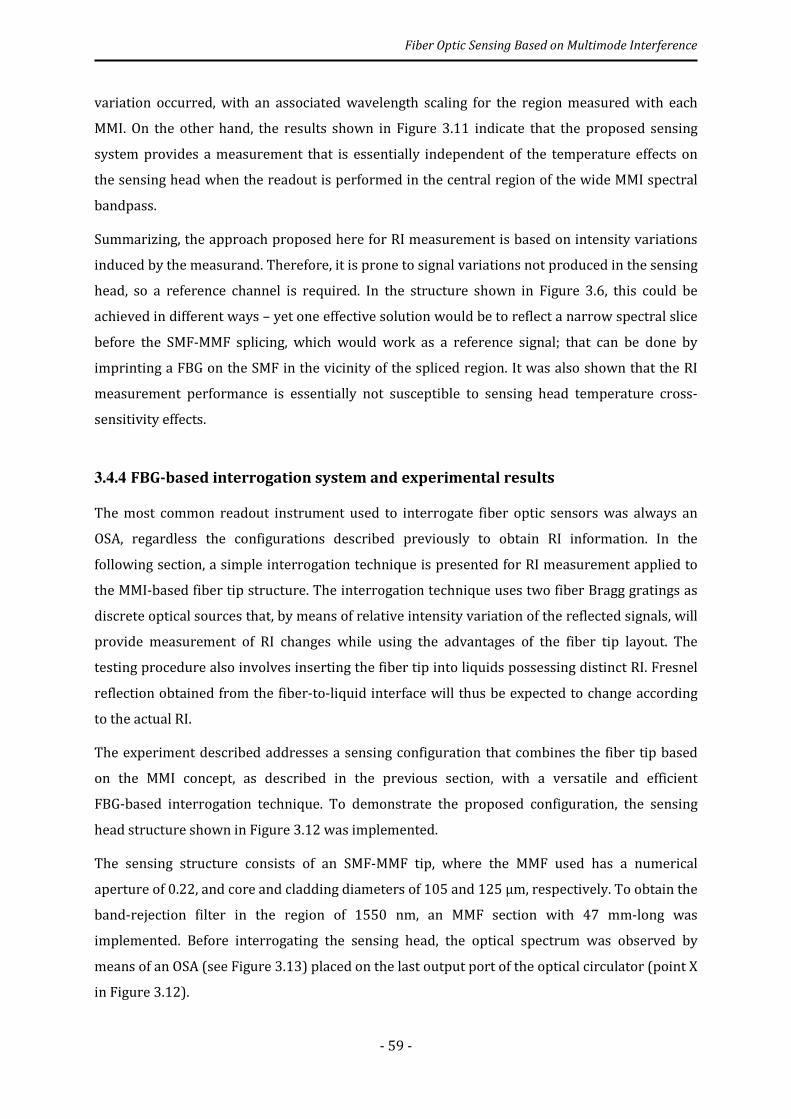
Fiber Optic Sensing Based on Multimode Interference
- 59 -
variation occurred, with an associated wavelength scaling for the region measured with each
MMI. On the other hand, the results shown in Figure 3.11 indicate that the proposed sensing
system provides a measurement that is essentially independent of the temperature effects on
the sensing head when the readout is performed in the central region of the wide MMI spectral
bandpass.
Summarizing, the approach proposed here for RI measurement is based on intensity variations
induced by the measurand. Therefore, it is prone to signal variations not produced in the sensing
head, so a reference channel is required. In the structure shown in Figure 3.6, this could be
achieved in different ways – yet one effective solution would be to reflect a narrow spectral slice
before the SMF-MMF splicing, which would work as a reference signal; that can be done by
imprinting a FBG on the SMF in the vicinity of the spliced region. It was also shown that the RI
measurement performance is essentially not susceptible to sensing head temperature cross-
sensitivity effects.
3.4.4 FBG-based interrogation system and experimental results
The most common readout instrument used to interrogate fiber optic sensors was always an
OSA, regardless the configurations described previously to obtain RI information. In the
following section, a simple interrogation technique is presented for RI measurement applied to
the MMI-based fiber tip structure. The interrogation technique uses two fiber Bragg gratings as
discrete optical sources that, by means of relative intensity variation of the reflected signals, will
provide measurement of RI changes while using the advantages of the fiber tip layout. The
testing procedure also involves inserting the fiber tip into liquids possessing distinct RI. Fresnel
reflection obtained from the fiber-to-liquid interface will thus be expected to change according
to the actual RI.
The experiment described addresses a sensing configuration that combines the fiber tip based
on the MMI concept, as described in the previous section, with a versatile and efficient
FBG-based interrogation technique. To demonstrate the proposed configuration, the sensing
head structure shown in Figure 3.12 was implemented.
The sensing structure consists of an SMF-MMF tip, where the MMF used has a numerical
aperture of 0.22, and core and cladding diameters of 105 and 125 µm, respectively. To obtain the
band-rejection filter in the region of 1550 nm, an MMF section with 47 mm-long was
implemented. Before interrogating the sensing head, the optical spectrum was observed by
means of an OSA (see Figure 3.13) placed on the last output port of the optical circulator (point X
in Figure 3.12).
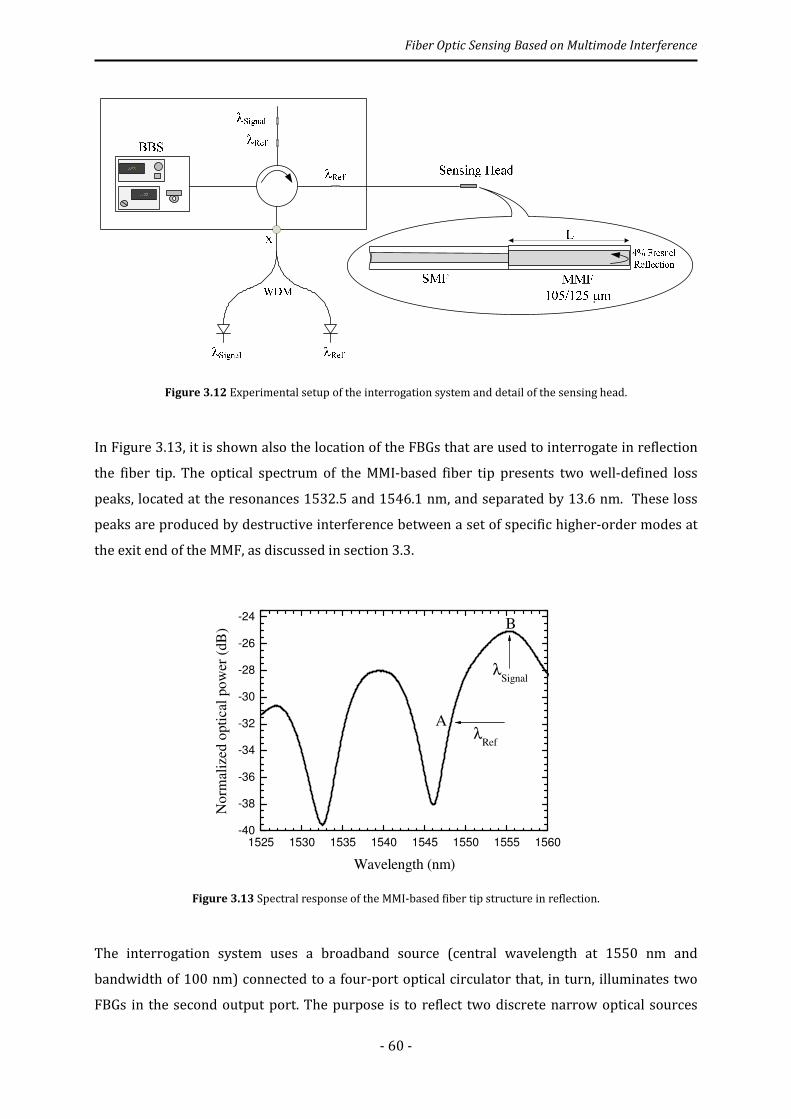
Fiber Optic Sensing Based on Multimode Interference
- 60 -
Figure 3.12 Experimental setup of the interrogation system and detail of the sensing head.
In Figure 3.13, it is shown also the location of the FBGs that are used to interrogate in reflection
the fiber tip. The optical spectrum of the MMI-based fiber tip presents two well-defined loss
peaks, located at the resonances 1532.5 and 1546.1 nm, and separated by 13.6 nm. These loss
peaks are produced by destructive interference between a set of specific higher-order modes at
the exit end of the MMF, as discussed in section 3.3.
Figure 3.13 Spectral response of the MMI-based fiber tip structure in reflection.
The interrogation system uses a broadband source (central wavelength at 1550 nm and
bandwidth of 100 nm) connected to a four-port optical circulator that, in turn, illuminates two
FBGs in the second output port. The purpose is to reflect two discrete narrow optical sources
1525 1530 1535 1540 1545 1550 1555 1560
-40
-38
-36
-34
-32
-30
-28
-26
-24B
No
rmal
ized
opti
cal
po
wer
(dB
)
Wavelength (nm)
λSignal
λRef
A

Fiber Optic Sensing Based on Multimode Interference
- 61 -
with different wavelength resonances: one is then used as reference and the other as signal (see
Figure 3.14). In output port three it is placed the MMI-based fiber tip structure, together with a
third FBG with the same wavelength of the reference signal, in order to eliminate broadband
source fluctuations and losses along the fiber. On the last output port of the optical circulator it
was placed a WDM device – with the purpose of separating both FBG wavelengths – and two
photodetectors to read the optical power of each FBG signal.
To perform the experiment, two FBGs with distinct resonance wavelengths were used, as
depicted in Figure 3.14. One FBG is used as reference (λRef) and the other as signal (λSignal), with
resonances at 1548.9 and 1554.54 nm, respectively. The FBGs were specifically designed to be
spectrally located at points of the fiber tip optical spectrum with different RI sensitivities – as
marked by A and B on Figure 3.13. If the optical power of λRef and λSignal that photodetectors
detect is PRef and PSignal, respectively, then processing of the type (PSignal - PRef)/( PSignal + PRef) gives
a signal proportional to the measurand induced visibility changes of the MMI interferometer, i.e.,
independent of the optical power fluctuations along the system.
Figure 3.14 The two discrete narrow sources based on fiber Bragg gratings.
The sensing-head beahviour to RI variations in the range 1.30-1.38 was performed with the
proposed interrogation technique. From the registered PRef and PSignal values the data shown in
Figure 3.15 was obtained, indicating a refractive-index sensitivity of -5.87/RIU. To ascertain the
system resolution to refractive index variations, the signal change associated with a step change
of 0.01 RIU was measured; the results obtained are shown in Figure 3.16. Based on the step
changes and rms fluctuations, one could calculate a refractive index resolution of 1.75 × 10⁻³ RIU.
This value can be improved by selecting a pair of FBGs with an optimum spectral position
1546 1548 1550 1552 1554 1556 1558
0
20
40
60
80
100
120
Norm
aliz
ed o
pti
cal
pow
er (
pW
)
Wavelength (nm)
λRef
λSignal
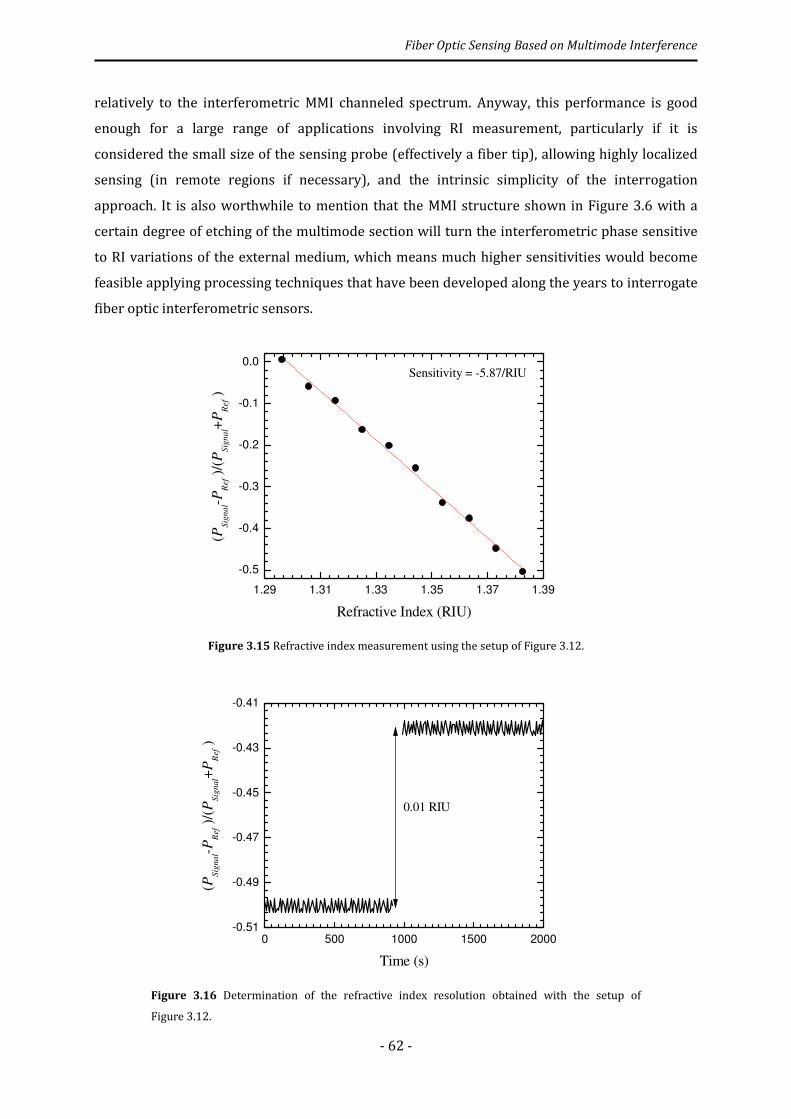
Fiber Optic Sensing Based on Multimode Interference
- 62 -
relatively to the interferometric MMI channeled spectrum. Anyway, this performance is good
enough for a large range of applications involving RI measurement, particularly if it is
considered the small size of the sensing probe (effectively a fiber tip), allowing highly localized
sensing (in remote regions if necessary), and the intrinsic simplicity of the interrogation
approach. It is also worthwhile to mention that the MMI structure shown in Figure 3.6 with a
certain degree of etching of the multimode section will turn the interferometric phase sensitive
to RI variations of the external medium, which means much higher sensitivities would become
feasible applying processing techniques that have been developed along the years to interrogate
fiber optic interferometric sensors.
Figure 3.15 Refractive index measurement using the setup of Figure 3.12.
Figure 3.16 Determination of the refractive index resolution obtained with the setup of
Figure 3.12.
1.29 1.31 1.33 1.35 1.37 1.39
-0.5
-0.4
-0.3
-0.2
-0.1
0.0
Sensitivity = -5.87/RIU
(PS
ign
al-P
Ref )
/(P
Sig
na
l+P
Ref )
Refractive Index (RIU)
0 500 1000 1500 2000
-0.51
-0.49
-0.47
-0.45
-0.43
-0.41
(PS
ign
al-P
Ref )
/(P
Sig
nal+
PR
ef )
Time (s)
0.01 RIU

Fiber Optic Sensing Based on Multimode Interference
- 63 -
Summarizing, it was realized that invariably an OSA has been used to read out the sensing signal,
which turns out to be a serious limitation for the application of fiber optic sensing structures
based on this principle. In view of this it was demonstrated the feasibility of a simple
interrogation technique relying on the utilization of FBGs, being reported results that indicate a
performance compatible with a large range of applications. A simple interrogation technique
based on FBGs was presented, compatible with readout RI resolutions adequate for
environmental and biochemical applications.
3.5 Refractometric Structure based on Large-Core Air-Clad Photonic
Crystal Fibers
3.5.1 Introduction
The use of air-silica microstructured optical fibers (MOFs) for singlemode operation has earned
a considerable attention owing to their novel waveguide properties – which make them suitable
for a large range of applications, from non-linear effects to optical sensing [108]. Nowadays,
research interests have expanded into large-core, air-clad PCFs due to their multimode
propagation characteristics and their promising potential for laser applications [109]. In sensing
applications, a FBG written in the MOF Ge-doped core has been proposed for RI measurement
[110]. Using a two-ring triangular and a six-hole MOF, resolutions of 7×10⁻⁴ RIU and 4×10⁻³ RIU,
respectively, were achieved, for a RI close to 1.33. Recently, it was reported a highly sensitive
refractometer based on a LPG written in a large-mode-area PCF [111]. A maximum sensitivity of
1500 nm/RIU, at the RI of 1.33, was achieved with a minimum detectable RI change of 2×10⁻⁵.
PCFs are generally pure silica fibers in which the refractive index contrast required to ensure
guidance of light arises from the presence of air holes, with a specific geometric size and
arrangement – rather than from using doped glasses with different refractive indices. This is an
important feature, especially for large-core PCFs that are supposed to have a small index step
that can be controlled only by the configuration of the air holes.
In this work, experimental results are presented pertaining to a PCF-based sensing structure.
The proposed device relies on two distinct in-line large-core, air-clad PCFs placed in a
SMS-based configuration. One of the fibers, due to its large dimensions, has a ring of air holes in
contact with the external medium, so it is used for refractive index measurement; the other is
used as temperature-compensation element, since the air holes are obstructed in the splice zone.
A sensing head was then implemented to measure the RI changes in water that were induced by
changes in temperature.
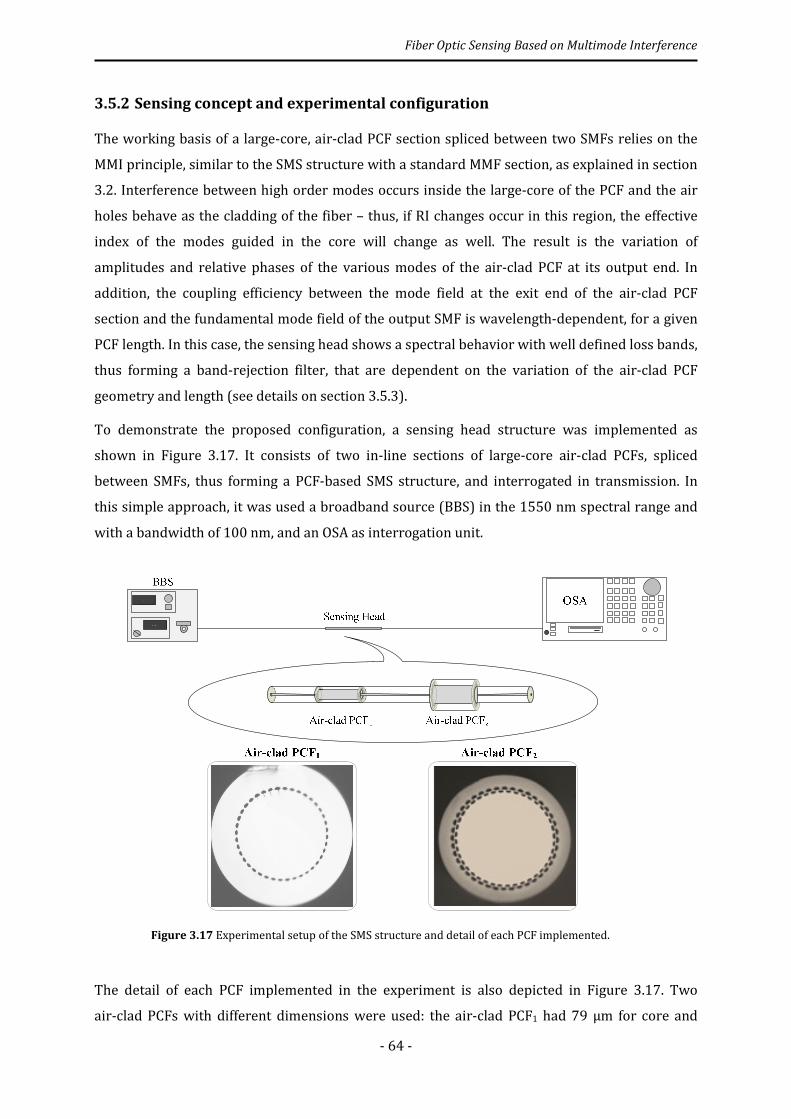
Fiber Optic Sensing Based on Multimode Interference
- 64 -
3.5.2 Sensing concept and experimental configuration
The working basis of a large-core, air-clad PCF section spliced between two SMFs relies on the
MMI principle, similar to the SMS structure with a standard MMF section, as explained in section
3.2. Interference between high order modes occurs inside the large-core of the PCF and the air
holes behave as the cladding of the fiber – thus, if RI changes occur in this region, the effective
index of the modes guided in the core will change as well. The result is the variation of
amplitudes and relative phases of the various modes of the air-clad PCF at its output end. In
addition, the coupling efficiency between the mode field at the exit end of the air-clad PCF
section and the fundamental mode field of the output SMF is wavelength-dependent, for a given
PCF length. In this case, the sensing head shows a spectral behavior with well defined loss bands,
thus forming a band-rejection filter, that are dependent on the variation of the air-clad PCF
geometry and length (see details on section 3.5.3).
To demonstrate the proposed configuration, a sensing head structure was implemented as
shown in Figure 3.17. It consists of two in-line sections of large-core air-clad PCFs, spliced
between SMFs, thus forming a PCF-based SMS structure, and interrogated in transmission. In
this simple approach, it was used a broadband source (BBS) in the 1550 nm spectral range and
with a bandwidth of 100 nm, and an OSA as interrogation unit.
Figure 3.17 Experimental setup of the SMS structure and detail of each PCF implemented.
The detail of each PCF implemented in the experiment is also depicted in Figure 3.17. Two
air-clad PCFs with different dimensions were used: the air-clad PCF1 had 79 µm for core and
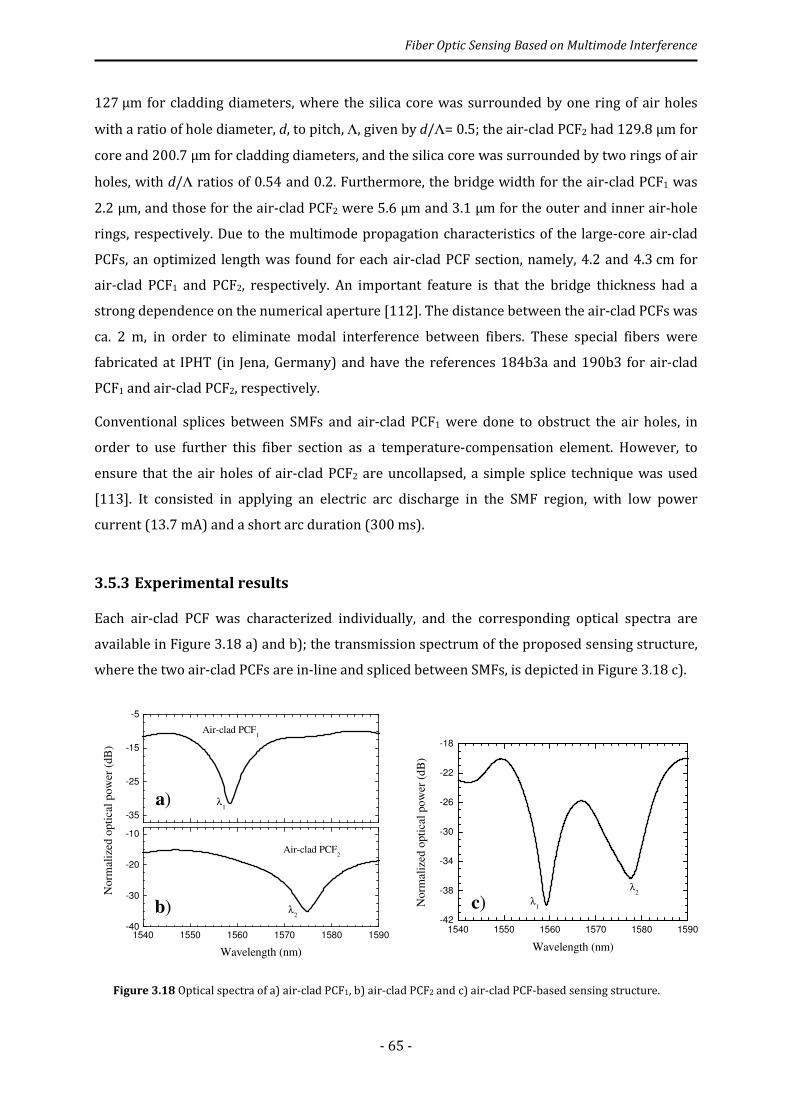
Fiber Optic Sensing Based on Multimode Interference
- 65 -
127 µm for cladding diameters, where the silica core was surrounded by one ring of air holes
with a ratio of hole diameter, d, to pitch, Λ, given by d/Λ= 0.5; the air-clad PCF2 had 129.8 µm for
core and 200.7 µm for cladding diameters, and the silica core was surrounded by two rings of air
holes, with d/Λ ratios of 0.54 and 0.2. Furthermore, the bridge width for the air-clad PCF1 was
2.2 µm, and those for the air-clad PCF2 were 5.6 µm and 3.1 µm for the outer and inner air-hole
rings, respectively. Due to the multimode propagation characteristics of the large-core air-clad
PCFs, an optimized length was found for each air-clad PCF section, namely, 4.2 and 4.3 cm for
air-clad PCF1 and PCF2, respectively. An important feature is that the bridge thickness had a
strong dependence on the numerical aperture [112]. The distance between the air-clad PCFs was
ca. 2 m, in order to eliminate modal interference between fibers. These special fibers were
fabricated at IPHT (in Jena, Germany) and have the references 184b3a and 190b3 for air-clad
PCF1 and air-clad PCF2, respectively.
Conventional splices between SMFs and air-clad PCF1 were done to obstruct the air holes, in
order to use further this fiber section as a temperature-compensation element. However, to
ensure that the air holes of air-clad PCF2 are uncollapsed, a simple splice technique was used
[113]. It consisted in applying an electric arc discharge in the SMF region, with low power
current (13.7 mA) and a short arc duration (300 ms).
3.5.3 Experimental results
Each air-clad PCF was characterized individually, and the corresponding optical spectra are
available in Figure 3.18 a) and b); the transmission spectrum of the proposed sensing structure,
where the two air-clad PCFs are in-line and spliced between SMFs, is depicted in Figure 3.18 c).
Figure 3.18 Optical spectra of a) air-clad PCF1, b) air-clad PCF2 and c) air-clad PCF-based sensing structure.
-35
-25
-15
-5
1540 1550 1560 1570 1580 1590-40
-30
-20
-10
a) λ1
Norm
aliz
ed o
pti
cal
pow
er (
dB
)
Air-clad PCF1
Air-clad PCF2
λ2
Wavelength (nm)
b)1540 1550 1560 1570 1580 1590
-42
-38
-34
-30
-26
-22
-18
c)λ
2
Norm
ali
zed o
pti
cal
pow
er (
dB
)
Wavelength (nm)
λ1
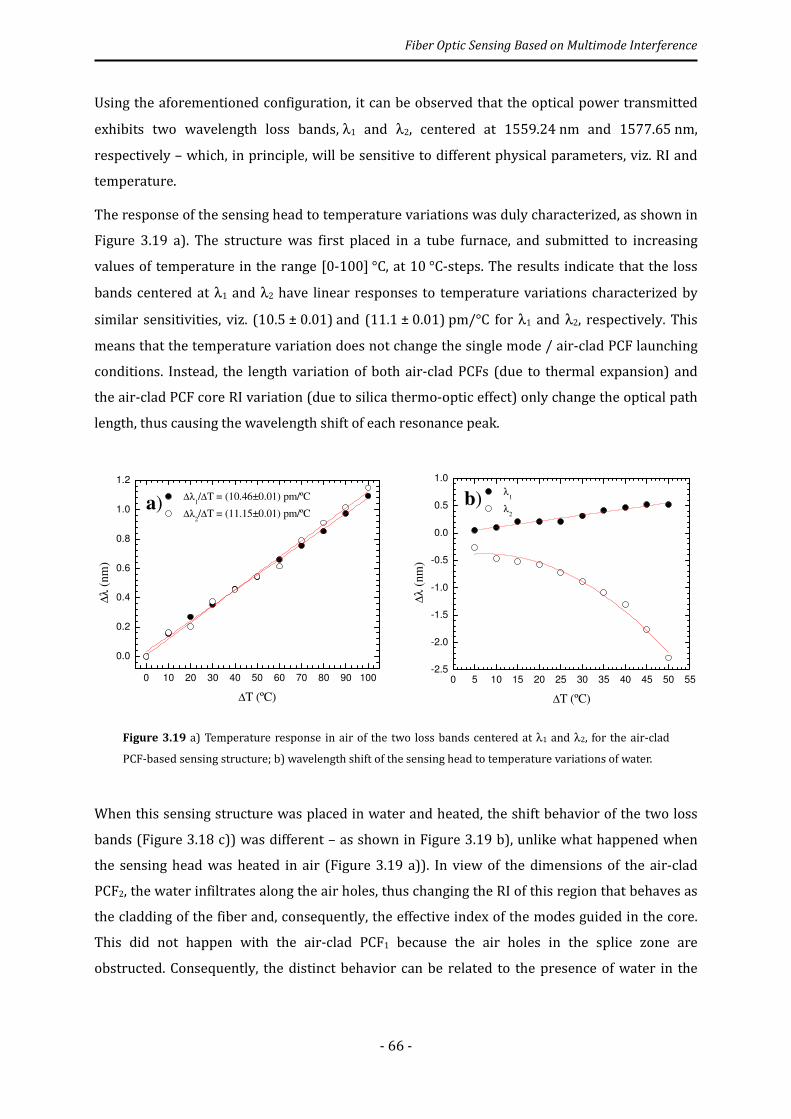
Fiber Optic Sensing Based on Multimode Interference
- 66 -
Using the aforementioned configuration, it can be observed that the optical power transmitted
exhibits two wavelength loss bands, λ1 and λ2, centered at 1559.24 nm and 1577.65 nm,
respectively – which, in principle, will be sensitive to different physical parameters, viz. RI and
temperature.
The response of the sensing head to temperature variations was duly characterized, as shown in
Figure 3.19 a). The structure was first placed in a tube furnace, and submitted to increasing
values of temperature in the range [0-100] °C, at 10 °C-steps. The results indicate that the loss
bands centered at λ1 and λ2 have linear responses to temperature variations characterized by
similar sensitivities, viz. (10.5 ± 0.01) and (11.1 ± 0.01) pm/°C for λ1 and λ2, respectively. This
means that the temperature variation does not change the single mode / air-clad PCF launching
conditions. Instead, the length variation of both air-clad PCFs (due to thermal expansion) and
the air-clad PCF core RI variation (due to silica thermo-optic effect) only change the optical path
length, thus causing the wavelength shift of each resonance peak.
Figure 3.19 a) Temperature response in air of the two loss bands centered at λ1 and λ2, for the air-clad
PCF-based sensing structure; b) wavelength shift of the sensing head to temperature variations of water.
When this sensing structure was placed in water and heated, the shift behavior of the two loss
bands (Figure 3.18 c)) was different – as shown in Figure 3.19 b), unlike what happened when
the sensing head was heated in air (Figure 3.19 a)). In view of the dimensions of the air-clad
PCF2, the water infiltrates along the air holes, thus changing the RI of this region that behaves as
the cladding of the fiber and, consequently, the effective index of the modes guided in the core.
This did not happen with the air-clad PCF1 because the air holes in the splice zone are
obstructed. Consequently, the distinct behavior can be related to the presence of water in the
0 10 20 30 40 50 60 70 80 90 100
0.0
0.2
0.4
0.6
0.8
1.0
1.2
a)
∆λ1/∆T = (10.46±0.01) pm/ºC
∆λ2/∆T = (11.15±0.01) pm/ºC
∆λ
(nm
)
∆T (ºC)
0 5 10 15 20 25 30 35 40 45 50 55
-2.5
-2.0
-1.5
-1.0
-0.5
0.0
0.5
1.0
b)
λ1
λ2
∆λ (
nm
)
∆T (ºC)
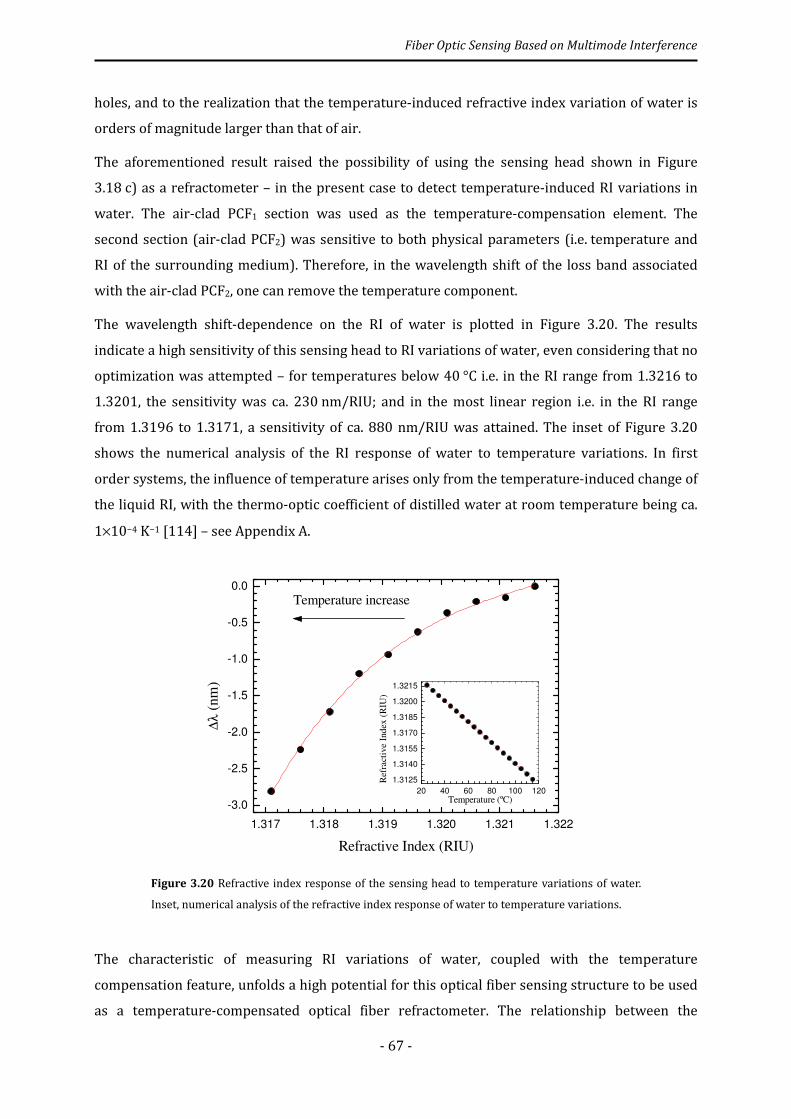
Fiber Optic Sensing Based on Multimode Interference
- 67 -
holes, and to the realization that the temperature-induced refractive index variation of water is
orders of magnitude larger than that of air.
The aforementioned result raised the possibility of using the sensing head shown in Figure
3.18 c) as a refractometer – in the present case to detect temperature-induced RI variations in
water. The air-clad PCF1 section was used as the temperature-compensation element. The
second section (air-clad PCF2) was sensitive to both physical parameters (i.e. temperature and
RI of the surrounding medium). Therefore, in the wavelength shift of the loss band associated
with the air-clad PCF2, one can remove the temperature component.
The wavelength shift-dependence on the RI of water is plotted in Figure 3.20. The results
indicate a high sensitivity of this sensing head to RI variations of water, even considering that no
optimization was attempted – for temperatures below 40 °C i.e. in the RI range from 1.3216 to
1.3201, the sensitivity was ca. 230 nm/RIU; and in the most linear region i.e. in the RI range
from 1.3196 to 1.3171, a sensitivity of ca. 880 nm/RIU was attained. The inset of Figure 3.20
shows the numerical analysis of the RI response of water to temperature variations. In first
order systems, the influence of temperature arises only from the temperature-induced change of
the liquid RI, with the thermo-optic coefficient of distilled water at room temperature being ca.
1×10⁻⁴ K−1 [114] – see Appendix A.
Figure 3.20 Refractive index response of the sensing head to temperature variations of water.
Inset, numerical analysis of the refractive index response of water to temperature variations.
The characteristic of measuring RI variations of water, coupled with the temperature
compensation feature, unfolds a high potential for this optical fiber sensing structure to be used
as a temperature-compensated optical fiber refractometer. The relationship between the
1.317 1.318 1.319 1.320 1.321 1.322
-3.0
-2.5
-2.0
-1.5
-1.0
-0.5
0.0
20 40 60 80 100 120
1.3125
1.3140
1.3155
1.3170
1.3185
1.3200
1.3215
∆λ
(nm
)
Refractive Index (RIU)
Temperature increase
Ref
ract
ive I
nd
ex (
RIU
)
Temperature (ºC)

Fiber Optic Sensing Based on Multimode Interference
- 68 -
wavelength shifts ∆λ1 (air-clad PCF1) and ∆λ2 (air-clad PCF2), as induced by changes in
temperature (∆T) and refractive index (∆n), can be written as
∆�� = j�kΔl + jZkΔ�
(3.15)
where i = 1, 2 addresses the two wavelength peaks considered. The parameters j�kand
jZk denote temperature and RI sensitivities, respectively. Equation 3.1 can be expressed in
matrix form as
m∆��∆�)n = mj�o jZoj�< jZ<n pΔlΔ�q
(3.16)
Considering that jZo = 0 and j�o ≈ j�< = j�, the values for the measurands can then be
obtained via inversion of the matrix as follows
pΔlΔ�q = 1s m jZ< 0−j� j�n m∆��∆�)n
(3.17)
where s = j�jZ< . One may thus obtain ∆l = ∆��/j� , which confirms that temperature
measurements are dependent only on the air-clad PCF1, and ∆� = (∆�) − ∆��)/jZ< , which
implies that RI measurements are dependent on both sensing fibers. To ascertain the system
sensitivity to refractive index variations, the change in wavelength (λ2) associated with a step
change of 1 °C was measured in water; the results obtained are shown in Figure 3.21.
Figure 3.21 Wavelength variation of the resonance peak λ2 induced by a step change of the
temperature of water.
0 500 1000 1500 2000
1578.30
1578.32
1578.34
1578.36
1578.38
1578.40
1578.42
1578.44
Resolution: 3.4x10⁻⁵ RIU
Wav
elen
gth
(nm
)
Time (sec)

Fiber Optic Sensing Based on Multimode Interference
- 69 -
Based on the step changes and rms fluctuations, one could calculate a refractive index resolution
of 3.4×10⁻⁵ RIU. Note that this is just an average performance; it is believed that it can be further
improved by using other interrogation techniques not based on the use of the OSA.
Further studies are warranted to address issues such as enhancing the performance of the
sensor by using different interrogation techniques and the estimation of the response time of the
sensor (directly associated with the diffusion rate of the liquids into the PCF2 holes, as well as
with the time period required to reach homogeneity inside the holes).
3.6 Ultra High-Sensitive Temperature Fiber Sensor based on
Multimode Interference
3.6.1 Introduction
The self-imaging phenomenon in waveguide devices is a well-known concept [52]; in recent
years, many efforts have been made to develop MMI based-fiber devices based on such a
concept. SMS and SMF-MMF tip configurations has been largely used self-imaging effect in a
variety of applications ranging from wavelength-tunable condensing lens and filtering
[55],[59],[60], high-power lasers and amplifiers [61], measurement of displacement
[63],[76],[77],[87], temperature [69], liquid level [73], simultaneous measurement of strain and
temperature [78], and RI measurement [68],[80],[81],[83],[85], as the most successful
application.
This work conveys experimental results based on the self-imaging concept – which was intended
here to measure RI variations of the surrounding medium, in order to ascertain the
temperature-dependence in a high sensitivity RI range. The proposed sensing device is based on
an SMS structure in which a section of coreless-MMF was used. Three MMFs with different
diameters were tested, viz. 55, 78 and 125 µm; and the influence of diameter upon the
sensitivity to RI variations was ascertained. The SMS device has shown to be highly sensitive to
temperature variations for a high liquid RI of 1.43. The BPM was employed in modeling light
propagation along the proposed fiber structure – and a comparison between experimental data
and numerical simulations is presented.
3.6.2 Working principle and numerical results
The proposed sensing head consists of a coreless-MMF section, spliced between two SMFs and
interrogated in transmission; this is schematically shown in Figure 3.22. The coreless-MMF is a
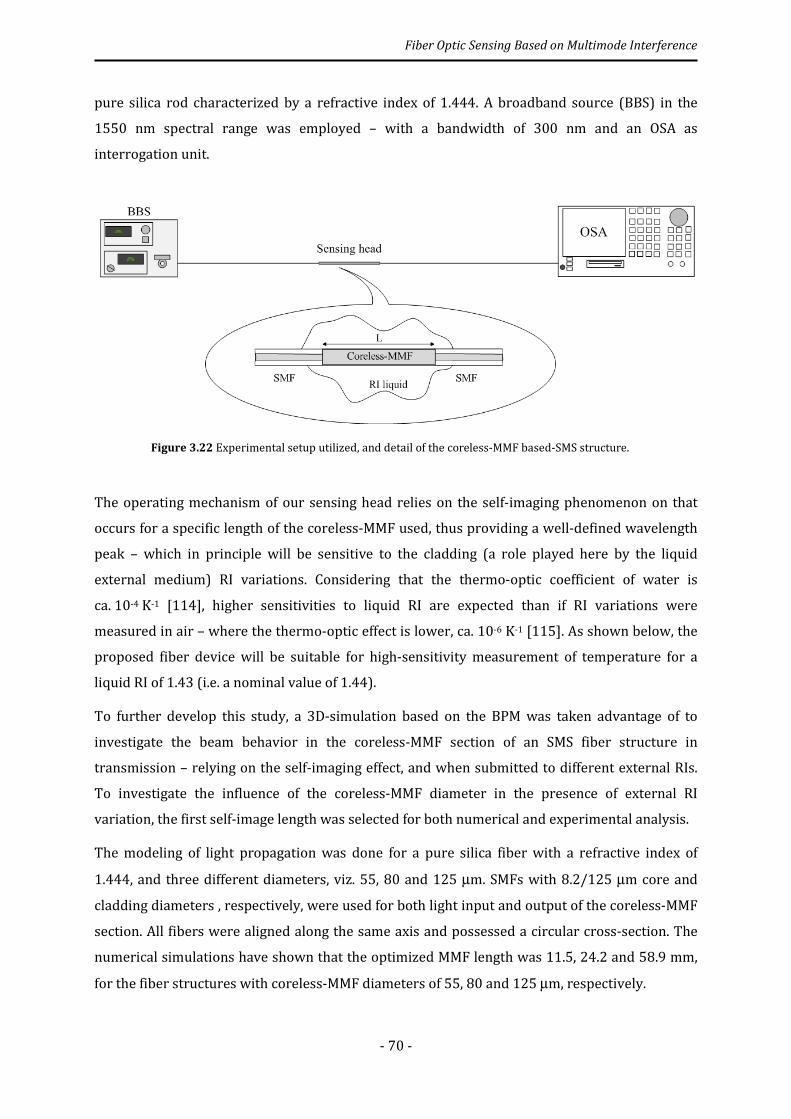
Fiber Optic Sensing Based on Multimode Interference
- 70 -
pure silica rod characterized by a refractive index of 1.444. A broadband source (BBS) in the
1550 nm spectral range was employed – with a bandwidth of 300 nm and an OSA as
interrogation unit.
Figure 3.22 Experimental setup utilized, and detail of the coreless-MMF based-SMS structure.
The operating mechanism of our sensing head relies on the self-imaging phenomenon on that
occurs for a specific length of the coreless-MMF used, thus providing a well-defined wavelength
peak – which in principle will be sensitive to the cladding (a role played here by the liquid
external medium) RI variations. Considering that the thermo-optic coefficient of water is
ca. 10-4 K-1 [114], higher sensitivities to liquid RI are expected than if RI variations were
measured in air – where the thermo-optic effect is lower, ca. 10-6 K-1 [115]. As shown below, the
proposed fiber device will be suitable for high-sensitivity measurement of temperature for a
liquid RI of 1.43 (i.e. a nominal value of 1.44).
To further develop this study, a 3D-simulation based on the BPM was taken advantage of to
investigate the beam behavior in the coreless-MMF section of an SMS fiber structure in
transmission – relying on the self-imaging effect, and when submitted to different external RIs.
To investigate the influence of the coreless-MMF diameter in the presence of external RI
variation, the first self-image length was selected for both numerical and experimental analysis.
The modeling of light propagation was done for a pure silica fiber with a refractive index of
1.444, and three different diameters, viz. 55, 80 and 125 µm. SMFs with 8.2/125 µm core and
cladding diameters , respectively, were used for both light input and output of the coreless-MMF
section. All fibers were aligned along the same axis and possessed a circular cross-section. The
numerical simulations have shown that the optimized MMF length was 11.5, 24.2 and 58.9 mm,
for the fiber structures with coreless-MMF diameters of 55, 80 and 125 µm, respectively.
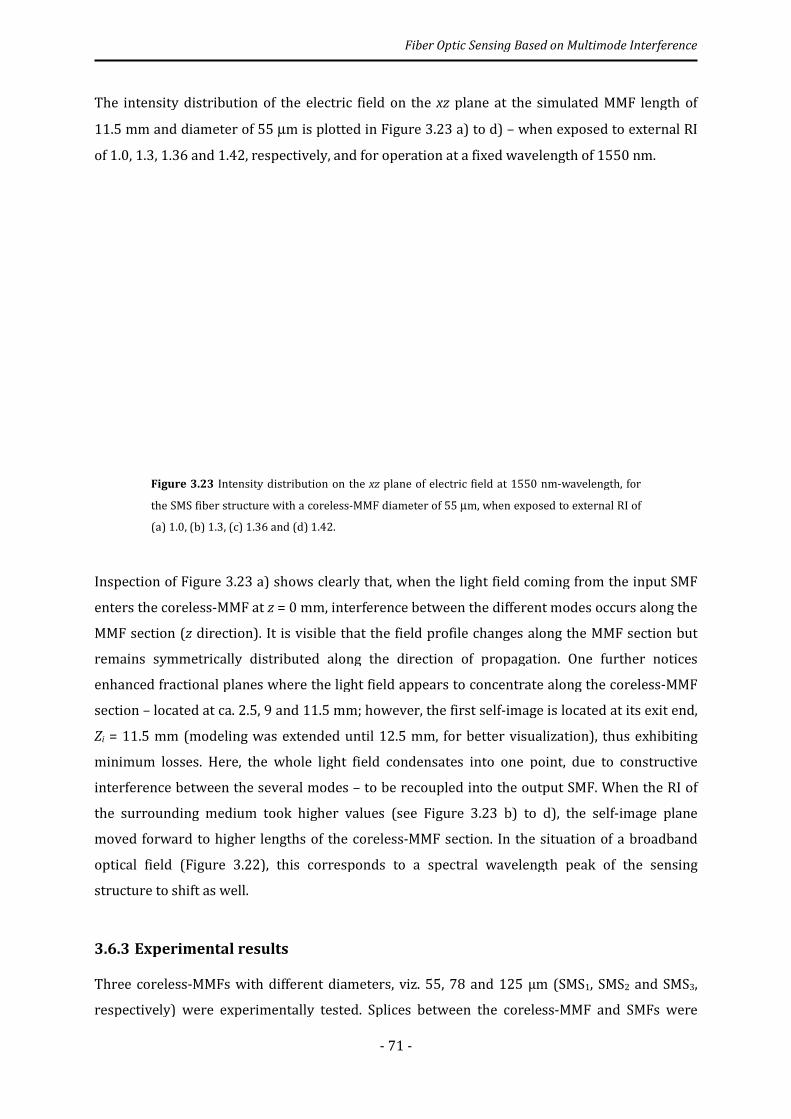
The intensity distribution of the electri
11.5 mm and diameter of 55 µm is plotted in
of 1.0, 1.3, 1.36 and 1.42, respectively, and for operation at a fixed wavelength of 1550 nm.
Figure 3.23 Intensity distribution on the
the SMS fiber structure with a corel
(a) 1.0, (b) 1.3, (c) 1.36 and (d) 1.42.
Inspection of Figure 3.23 a) shows clearly that, wh
enters the coreless-MMF at z = 0 mm, interference between the different modes occurs along the
MMF section (z direction). It is visible that the field profile changes along the MMF section but
remains symmetrically distributed along the direction of propagation. One further notices
enhanced fractional planes where the light field appears to concentrate along the coreless
section – located at ca. 2.5, 9 and 11.5 mm; however, the first self
Zi = 11.5 mm (modeling was extended until 12.5 mm, for better visualization), thus exhibiting
minimum losses. Here, the whole light field condensates into one point, due to constructive
interference between the several modes
the surrounding medium took higher values (see
moved forward to higher lengths of the coreless
optical field (Figure 3.22), this corresponds to a spectral wavelength peak of the
structure to shift as well.
3.6.3 Experimental results
Three coreless-MMFs with different diameters, viz. 55, 78 and 125 µm (SMS
respectively) were experimentally tested. Splices between the coreless
Fiber Optic Sensing Based on Multimode Interference
- 71 -
The intensity distribution of the electric field on the xz plane at the simulated MMF length of
m is plotted in Figure 3.23 a) to d) – when exposed to external RI
of 1.0, 1.3, 1.36 and 1.42, respectively, and for operation at a fixed wavelength of 1550 nm.
Intensity distribution on the xz plane of electric field at 1550 nm-wavelength, for
the SMS fiber structure with a coreless-MMF diameter of 55 µm, when exposed to external RI of
(a) 1.0, (b) 1.3, (c) 1.36 and (d) 1.42.
a) shows clearly that, when the light field coming from the input SMF
= 0 mm, interference between the different modes occurs along the
direction). It is visible that the field profile changes along the MMF section but
lly distributed along the direction of propagation. One further notices
enhanced fractional planes where the light field appears to concentrate along the coreless
located at ca. 2.5, 9 and 11.5 mm; however, the first self-image is located at
= 11.5 mm (modeling was extended until 12.5 mm, for better visualization), thus exhibiting
minimum losses. Here, the whole light field condensates into one point, due to constructive
interference between the several modes – to be recoupled into the output SMF. When the RI of
the surrounding medium took higher values (see Figure 3.23 b) to d), the self
lengths of the coreless-MMF section. In the situation of a broadband
), this corresponds to a spectral wavelength peak of the
Experimental results
MMFs with different diameters, viz. 55, 78 and 125 µm (SMS
respectively) were experimentally tested. Splices between the coreless-MMF and SMFs were
Fiber Optic Sensing Based on Multimode Interference
plane at the simulated MMF length of
when exposed to external RI
of 1.0, 1.3, 1.36 and 1.42, respectively, and for operation at a fixed wavelength of 1550 nm.
wavelength, for
m, when exposed to external RI of
en the light field coming from the input SMF
= 0 mm, interference between the different modes occurs along the
direction). It is visible that the field profile changes along the MMF section but
lly distributed along the direction of propagation. One further notices
enhanced fractional planes where the light field appears to concentrate along the coreless-MMF
image is located at its exit end,
= 11.5 mm (modeling was extended until 12.5 mm, for better visualization), thus exhibiting
minimum losses. Here, the whole light field condensates into one point, due to constructive
into the output SMF. When the RI of
b) to d), the self-image plane
MMF section. In the situation of a broadband
), this corresponds to a spectral wavelength peak of the sensing
MMFs with different diameters, viz. 55, 78 and 125 µm (SMS1, SMS2 and SMS3,
MMF and SMFs were
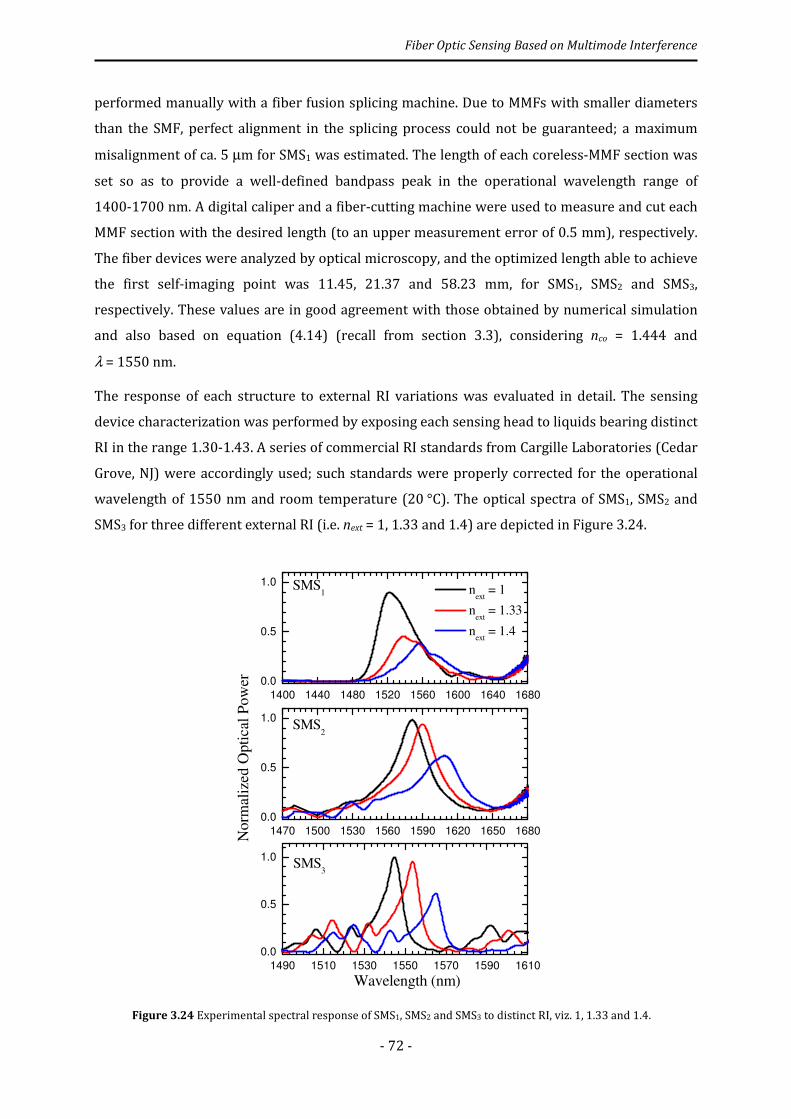
Fiber Optic Sensing Based on Multimode Interference
- 72 -
performed manually with a fiber fusion splicing machine. Due to MMFs with smaller diameters
than the SMF, perfect alignment in the splicing process could not be guaranteed; a maximum
misalignment of ca. 5 µm for SMS1 was estimated. The length of each coreless-MMF section was
set so as to provide a well-defined bandpass peak in the operational wavelength range of
1400-1700 nm. A digital caliper and a fiber-cutting machine were used to measure and cut each
MMF section with the desired length (to an upper measurement error of 0.5 mm), respectively.
The fiber devices were analyzed by optical microscopy, and the optimized length able to achieve
the first self-imaging point was 11.45, 21.37 and 58.23 mm, for SMS1, SMS2 and SMS3,
respectively. These values are in good agreement with those obtained by numerical simulation
and also based on equation (4.14) (recall from section 3.3), considering nco = 1.444 and
λ = 1550 nm.
The response of each structure to external RI variations was evaluated in detail. The sensing
device characterization was performed by exposing each sensing head to liquids bearing distinct
RI in the range 1.30-1.43. A series of commercial RI standards from Cargille Laboratories (Cedar
Grove, NJ) were accordingly used; such standards were properly corrected for the operational
wavelength of 1550 nm and room temperature (20 °C). The optical spectra of SMS1, SMS2 and
SMS3 for three different external RI (i.e. next = 1, 1.33 and 1.4) are depicted in Figure 3.24.
Figure 3.24 Experimental spectral response of SMS1, SMS2 and SMS3 to distinct RI, viz. 1, 1.33 and 1.4.
1400 1440 1480 1520 1560 1600 1640 1680
0.0
0.5
1.0
1470 1500 1530 1560 1590 1620 1650 1680
0.0
0.5
1.0
1490 1510 1530 1550 1570 1590 1610
0.0
0.5
1.0
SMS1
SMS2
No
rmal
ized
Opti
cal
Po
wer
SMS3
Wavelength (nm)
next
= 1
next
= 1.33
next
= 1.4
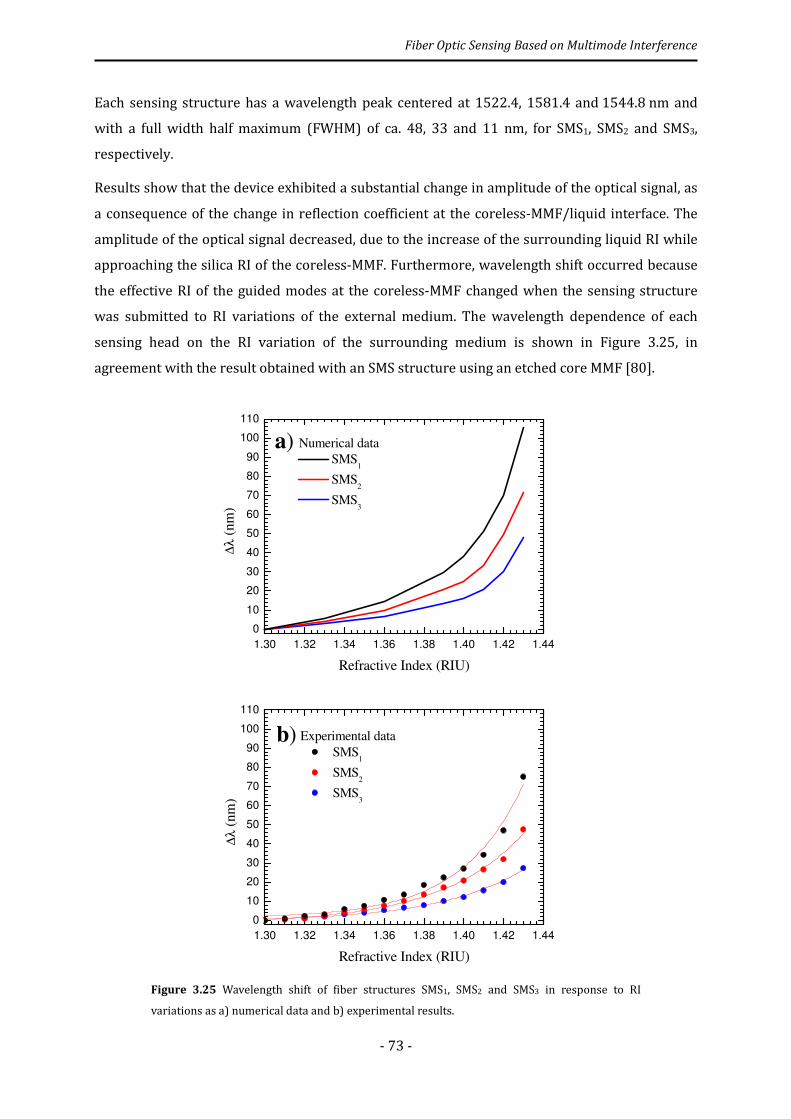
Fiber Optic Sensing Based on Multimode Interference
- 73 -
Each sensing structure has a wavelength peak centered at 1522.4, 1581.4 and 1544.8 nm and
with a full width half maximum (FWHM) of ca. 48, 33 and 11 nm, for SMS1, SMS2 and SMS3,
respectively.
Results show that the device exhibited a substantial change in amplitude of the optical signal, as
a consequence of the change in reflection coefficient at the coreless-MMF/liquid interface. The
amplitude of the optical signal decreased, due to the increase of the surrounding liquid RI while
approaching the silica RI of the coreless-MMF. Furthermore, wavelength shift occurred because
the effective RI of the guided modes at the coreless-MMF changed when the sensing structure
was submitted to RI variations of the external medium. The wavelength dependence of each
sensing head on the RI variation of the surrounding medium is shown in Figure 3.25, in
agreement with the result obtained with an SMS structure using an etched core MMF [80].
Figure 3.25 Wavelength shift of fiber structures SMS1, SMS2 and SMS3 in response to RI
variations as a) numerical data and b) experimental results.
1.30 1.32 1.34 1.36 1.38 1.40 1.42 1.44
0
10
20
30
40
50
60
70
80
90
100
110
a)
∆λ (
nm
)
Refractive Index (RIU)
Numerical data
SMS1
SMS2
SMS3
1.30 1.32 1.34 1.36 1.38 1.40 1.42 1.44
0
10
20
30
40
50
60
70
80
90
100
110
b)
∆λ (
nm
)
Refractive Index (RIU)
Experimental data
SMS1
SMS2
SMS3
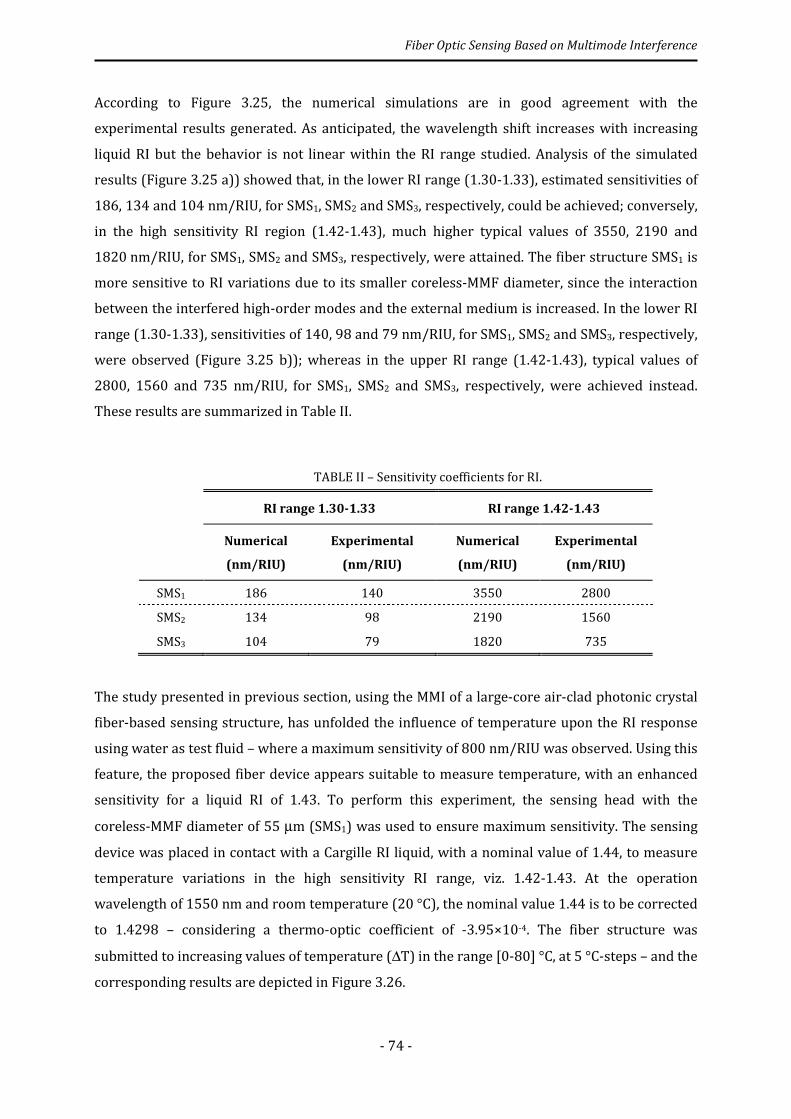
Fiber Optic Sensing Based on Multimode Interference
- 74 -
According to Figure 3.25, the numerical simulations are in good agreement with the
experimental results generated. As anticipated, the wavelength shift increases with increasing
liquid RI but the behavior is not linear within the RI range studied. Analysis of the simulated
results (Figure 3.25 a)) showed that, in the lower RI range (1.30-1.33), estimated sensitivities of
186, 134 and 104 nm/RIU, for SMS1, SMS2 and SMS3, respectively, could be achieved; conversely,
in the high sensitivity RI region (1.42-1.43), much higher typical values of 3550, 2190 and
1820 nm/RIU, for SMS1, SMS2 and SMS3, respectively, were attained. The fiber structure SMS1 is
more sensitive to RI variations due to its smaller coreless-MMF diameter, since the interaction
between the interfered high-order modes and the external medium is increased. In the lower RI
range (1.30-1.33), sensitivities of 140, 98 and 79 nm/RIU, for SMS1, SMS2 and SMS3, respectively,
were observed (Figure 3.25 b)); whereas in the upper RI range (1.42-1.43), typical values of
2800, 1560 and 735 nm/RIU, for SMS1, SMS2 and SMS3, respectively, were achieved instead.
These results are summarized in Table II.
TABLE II – Sensitivity coefficients for RI.
RI range 1.30-1.33 RI range 1.42-1.43
Numerical
(nm/RIU)
Experimental
(nm/RIU)
Numerical
(nm/RIU)
Experimental
(nm/RIU)
SMS1 186 140 3550 2800
SMS2 134 98 2190 1560
SMS3 104 79 1820 735
The study presented in previous section, using the MMI of a large-core air-clad photonic crystal
fiber-based sensing structure, has unfolded the influence of temperature upon the RI response
using water as test fluid – where a maximum sensitivity of 800 nm/RIU was observed. Using this
feature, the proposed fiber device appears suitable to measure temperature, with an enhanced
sensitivity for a liquid RI of 1.43. To perform this experiment, the sensing head with the
coreless-MMF diameter of 55 µm (SMS1) was used to ensure maximum sensitivity. The sensing
device was placed in contact with a Cargille RI liquid, with a nominal value of 1.44, to measure
temperature variations in the high sensitivity RI range, viz. 1.42-1.43. At the operation
wavelength of 1550 nm and room temperature (20 °C), the nominal value 1.44 is to be corrected
to 1.4298 – considering a thermo-optic coefficient of -3.95×10⁻⁴. The fiber structure was
submitted to increasing values of temperature (∆T) in the range [0-80] °C, at 5 °C-steps – and the
corresponding results are depicted in Figure 3.26.
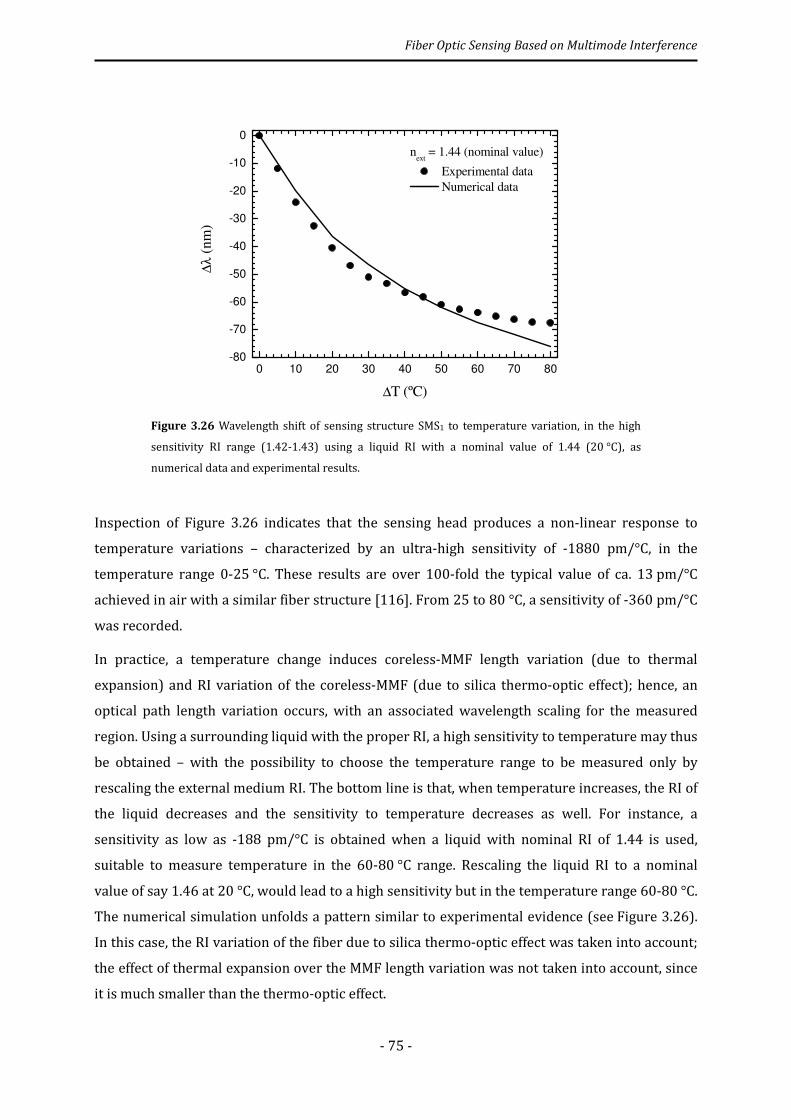
Fiber Optic Sensing Based on Multimode Interference
- 75 -
Figure 3.26 Wavelength shift of sensing structure SMS1 to temperature variation, in the high
sensitivity RI range (1.42-1.43) using a liquid RI with a nominal value of 1.44 (20 °C), as
numerical data and experimental results.
Inspection of Figure 3.26 indicates that the sensing head produces a non-linear response to
temperature variations – characterized by an ultra-high sensitivity of -1880 pm/°C, in the
temperature range 0-25 °C. These results are over 100-fold the typical value of ca. 13 pm/°C
achieved in air with a similar fiber structure [116]. From 25 to 80 °C, a sensitivity of -360 pm/°C
was recorded.
In practice, a temperature change induces coreless-MMF length variation (due to thermal
expansion) and RI variation of the coreless-MMF (due to silica thermo-optic effect); hence, an
optical path length variation occurs, with an associated wavelength scaling for the measured
region. Using a surrounding liquid with the proper RI, a high sensitivity to temperature may thus
be obtained – with the possibility to choose the temperature range to be measured only by
rescaling the external medium RI. The bottom line is that, when temperature increases, the RI of
the liquid decreases and the sensitivity to temperature decreases as well. For instance, a
sensitivity as low as -188 pm/°C is obtained when a liquid with nominal RI of 1.44 is used,
suitable to measure temperature in the 60-80 °C range. Rescaling the liquid RI to a nominal
value of say 1.46 at 20 °C, would lead to a high sensitivity but in the temperature range 60-80 °C.
The numerical simulation unfolds a pattern similar to experimental evidence (see Figure 3.26).
In this case, the RI variation of the fiber due to silica thermo-optic effect was taken into account;
the effect of thermal expansion over the MMF length variation was not taken into account, since
it is much smaller than the thermo-optic effect.
0 10 20 30 40 50 60 70 80
-80
-70
-60
-50
-40
-30
-20
-10
0
∆λ
(n
m)
∆T (ºC)
next
= 1.44 (nominal value)
Experimental data
Numerical data
Fiber Optic Sensing Based on Multimode Interference
- 76 -
Although showing a high sensitivity to RI variations, the proposed SMS structure is always
restricted to external RI values below the effective RI of the guided modes. Numerical analysis of
an evanescent wave absorption sensor was performed in attempts to overcome this limitation.
The suggested model is an SMS device where a polymer coating, with an RI as low as 1.3, is
deposited over the coreless-MMF section – aimed at extending the range of possible liquid RI
values around the MMF to above 1.43. Note that the proposed sensing concept for the
measurement of external RI changes is based on evanescent wave absorption induced by the
measurand. Numerical simulations were then performed for the sensing head characterized by a
coreless-MMF diameter of 125 µm and coated with a polymer layer of varying thickness, viz. 0.5,
0.75, 1.0 and 1.5 µm. The results obtained are available as Figure 3.27 a).
Figure 3.27 a) Intensity variation of SMS structure with coreless-MMF diameter of 125 µm, and
coated with 0.5, 0.75, 1 and 1.5 µm-thick polymer layers, when submitted to external RI in the
range 1.42-1.48; b) spectral changes of SMS structure with coreless-MMF diameter of 125 µm
coated with a 0.75 µm-thick polymer layer, when submitted to external RI in the range 1.44-1.47.
1.42 1.43 1.44 1.45 1.46 1.47 1.48
0.0
0.1
0.2
0.3
0.4
0.5
0.6
0.7
Polymer thickness
0.5 µm
0.75 µm
1.0 µm
1.5 µm
No
rmal
ized
opti
cal
po
wer
Refractive Index (RIU)
a)
1500 1520 1540 1560 1580 1600
0.0
0.1
0.2
0.3
0.4
0.5
0.6
External RI
1.44
1.45
1.46
1.47
Norm
aliz
ed o
pti
cal
pow
er
Wavelength (nm)
b)
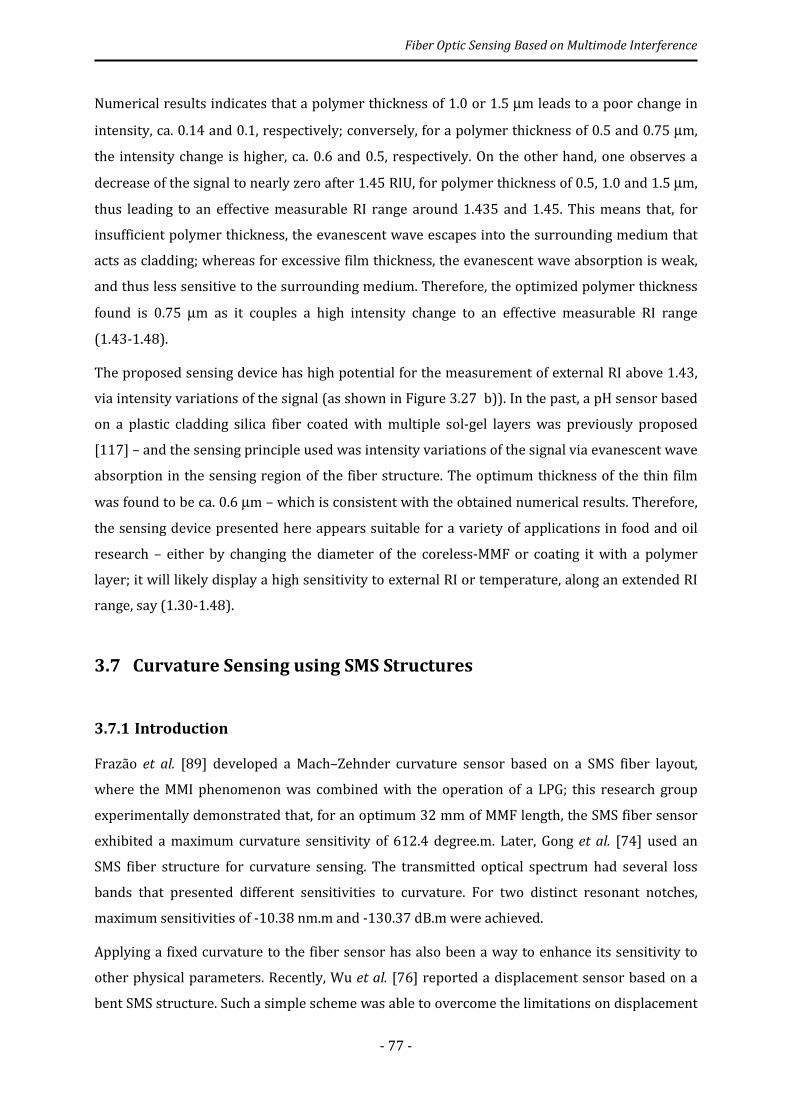
Fiber Optic Sensing Based on Multimode Interference
- 77 -
Numerical results indicates that a polymer thickness of 1.0 or 1.5 µm leads to a poor change in
intensity, ca. 0.14 and 0.1, respectively; conversely, for a polymer thickness of 0.5 and 0.75 µm,
the intensity change is higher, ca. 0.6 and 0.5, respectively. On the other hand, one observes a
decrease of the signal to nearly zero after 1.45 RIU, for polymer thickness of 0.5, 1.0 and 1.5 µm,
thus leading to an effective measurable RI range around 1.435 and 1.45. This means that, for
insufficient polymer thickness, the evanescent wave escapes into the surrounding medium that
acts as cladding; whereas for excessive film thickness, the evanescent wave absorption is weak,
and thus less sensitive to the surrounding medium. Therefore, the optimized polymer thickness
found is 0.75 µm as it couples a high intensity change to an effective measurable RI range
(1.43-1.48).
The proposed sensing device has high potential for the measurement of external RI above 1.43,
via intensity variations of the signal (as shown in Figure 3.27 b)). In the past, a pH sensor based
on a plastic cladding silica fiber coated with multiple sol-gel layers was previously proposed
[117] – and the sensing principle used was intensity variations of the signal via evanescent wave
absorption in the sensing region of the fiber structure. The optimum thickness of the thin film
was found to be ca. 0.6 µm – which is consistent with the obtained numerical results. Therefore,
the sensing device presented here appears suitable for a variety of applications in food and oil
research – either by changing the diameter of the coreless-MMF or coating it with a polymer
layer; it will likely display a high sensitivity to external RI or temperature, along an extended RI
range, say (1.30-1.48).
3.7 Curvature Sensing using SMS Structures
3.7.1 Introduction
Frazão et al. [89] developed a Mach–Zehnder curvature sensor based on a SMS fiber layout,
where the MMI phenomenon was combined with the operation of a LPG; this research group
experimentally demonstrated that, for an optimum 32 mm of MMF length, the SMS fiber sensor
exhibited a maximum curvature sensitivity of 612.4 degree.m. Later, Gong et al. [74] used an
SMS fiber structure for curvature sensing. The transmitted optical spectrum had several loss
bands that presented different sensitivities to curvature. For two distinct resonant notches,
maximum sensitivities of -10.38 nm.m and -130.37 dB.m were achieved.
Applying a fixed curvature to the fiber sensor has also been a way to enhance its sensitivity to
other physical parameters. Recently, Wu et al. [76] reported a displacement sensor based on a
bent SMS structure. Such a simple scheme was able to overcome the limitations on displacement
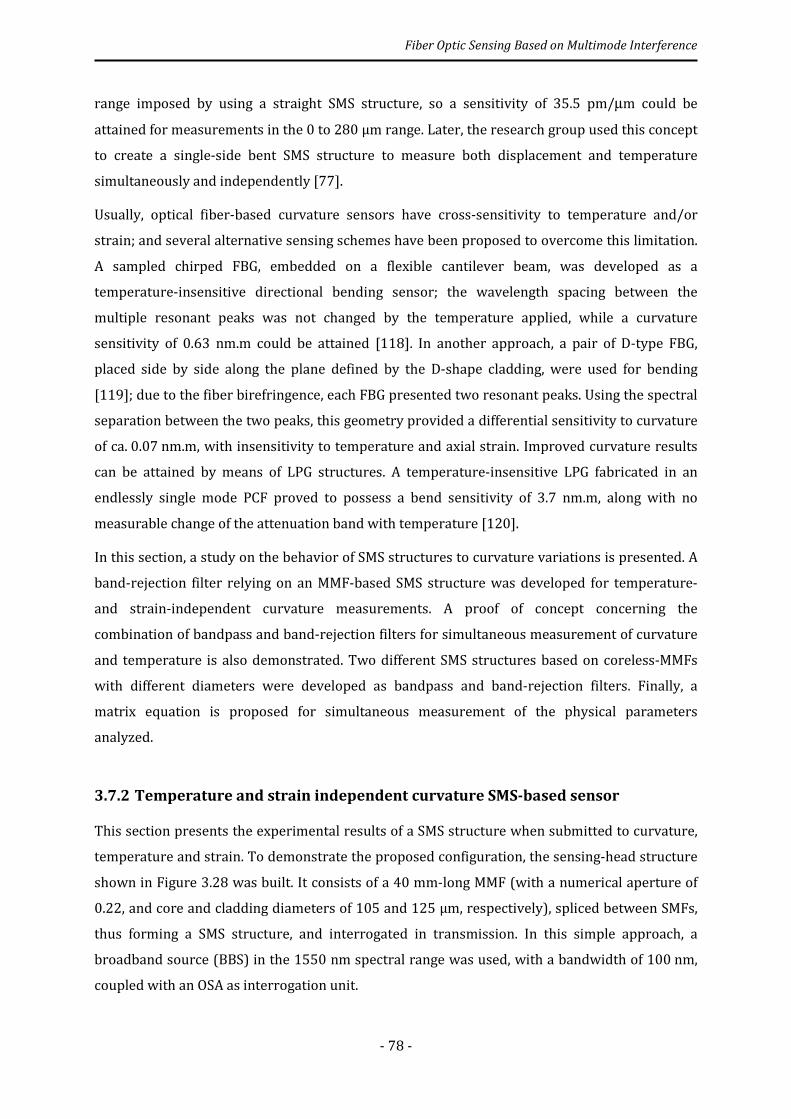
Fiber Optic Sensing Based on Multimode Interference
- 78 -
range imposed by using a straight SMS structure, so a sensitivity of 35.5 pm/µm could be
attained for measurements in the 0 to 280 μm range. Later, the research group used this concept
to create a single-side bent SMS structure to measure both displacement and temperature
simultaneously and independently [77].
Usually, optical fiber-based curvature sensors have cross-sensitivity to temperature and/or
strain; and several alternative sensing schemes have been proposed to overcome this limitation.
A sampled chirped FBG, embedded on a flexible cantilever beam, was developed as a
temperature-insensitive directional bending sensor; the wavelength spacing between the
multiple resonant peaks was not changed by the temperature applied, while a curvature
sensitivity of 0.63 nm.m could be attained [118]. In another approach, a pair of D-type FBG,
placed side by side along the plane defined by the D-shape cladding, were used for bending
[119]; due to the fiber birefringence, each FBG presented two resonant peaks. Using the spectral
separation between the two peaks, this geometry provided a differential sensitivity to curvature
of ca. 0.07 nm.m, with insensitivity to temperature and axial strain. Improved curvature results
can be attained by means of LPG structures. A temperature-insensitive LPG fabricated in an
endlessly single mode PCF proved to possess a bend sensitivity of 3.7 nm.m, along with no
measurable change of the attenuation band with temperature [120].
In this section, a study on the behavior of SMS structures to curvature variations is presented. A
band-rejection filter relying on an MMF-based SMS structure was developed for temperature-
and strain-independent curvature measurements. A proof of concept concerning the
combination of bandpass and band-rejection filters for simultaneous measurement of curvature
and temperature is also demonstrated. Two different SMS structures based on coreless-MMFs
with different diameters were developed as bandpass and band-rejection filters. Finally, a
matrix equation is proposed for simultaneous measurement of the physical parameters
analyzed.
3.7.2 Temperature and strain independent curvature SMS-based sensor
This section presents the experimental results of a SMS structure when submitted to curvature,
temperature and strain. To demonstrate the proposed configuration, the sensing-head structure
shown in Figure 3.28 was built. It consists of a 40 mm-long MMF (with a numerical aperture of
0.22, and core and cladding diameters of 105 and 125 µm, respectively), spliced between SMFs,
thus forming a SMS structure, and interrogated in transmission. In this simple approach, a
broadband source (BBS) in the 1550 nm spectral range was used, with a bandwidth of 100 nm,
coupled with an OSA as interrogation unit.
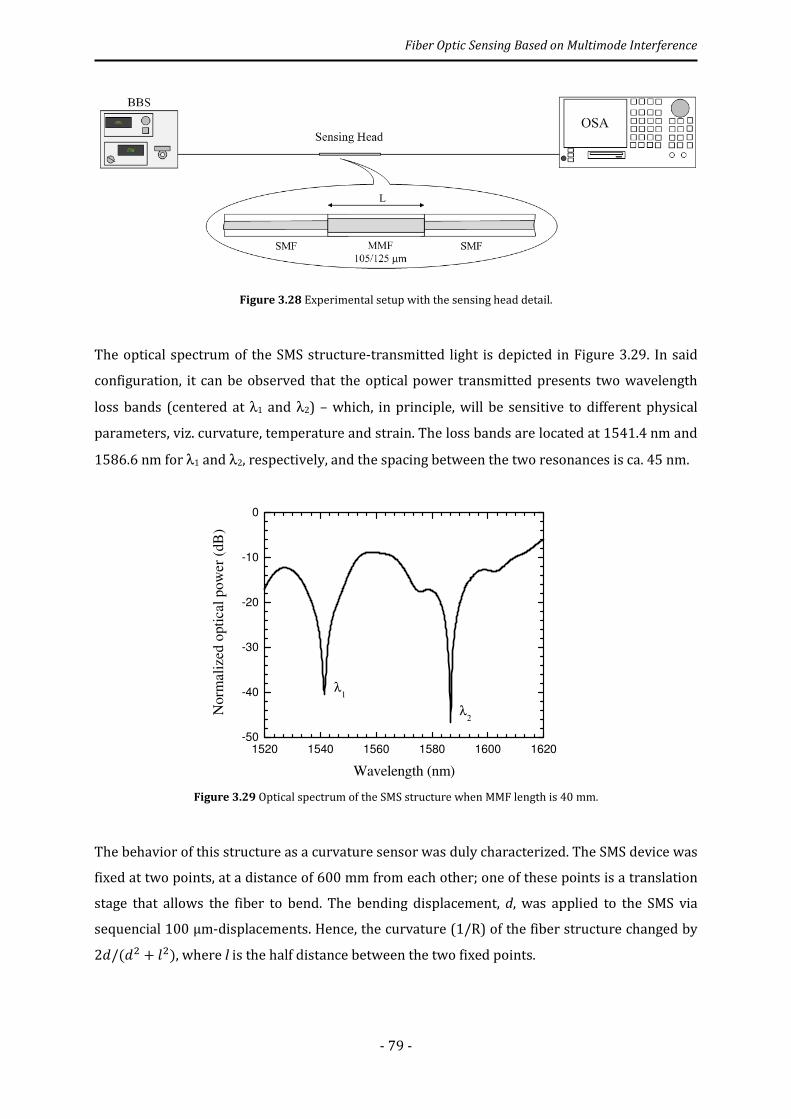
Fiber Optic Sensing Based on Multimode Interference
- 79 -
Figure 3.28 Experimental setup with the sensing head detail.
The optical spectrum of the SMS structure-transmitted light is depicted in Figure 3.29. In said
configuration, it can be observed that the optical power transmitted presents two wavelength
loss bands (centered at λ1 and λ2) – which, in principle, will be sensitive to different physical
parameters, viz. curvature, temperature and strain. The loss bands are located at 1541.4 nm and
1586.6 nm for λ1 and λ2, respectively, and the spacing between the two resonances is ca. 45 nm.
Figure 3.29 Optical spectrum of the SMS structure when MMF length is 40 mm.
The behavior of this structure as a curvature sensor was duly characterized. The SMS device was
fixed at two points, at a distance of 600 mm from each other; one of these points is a translation
stage that allows the fiber to bend. The bending displacement, d, was applied to the SMS via
sequencial 100 μm-displacements. Hence, the curvature (1/R) of the fiber structure changed by 2'/(') + t)), where l is the half distance between the two fixed points.
1520 1540 1560 1580 1600 1620
-50
-40
-30
-20
-10
0
λ2
Norm
aliz
ed o
pti
cal
pow
er (
dB
)
Wavelength (nm)
λ1
Fiber Optic Sensing Based on Multimode Interference
- 80 -
The spectral position of the resonant loss bands have different and linear responses to curvature
variations, as shown in Figure 3.30 a) – with a sensitivity of (7.3 ± 0.1) and (-1.4 ± 0.1) nm.m, for
the bands centered at λ1 and λ2, respectively.
Figure 3.30 Curvature response for: a) the two loss bands centered at λ1 and λ2; and b) the
measurement parameter, ∆(λ2–λ1).
If the field profile were symmetrically distributed along the direction of propagation of a straight
SMS structure, one should notice symmetry breaking upon application of curvature. The result
would be that interference between higher-order modes is more affected by bending of the MMF
section, while lower-order modes are focused within a smaller area near the fiber core and are
consequently less affected by the bending disturbance. Therefore, distinct MMF modes are
excited by the light exiting the input SMF, thus originating different curvature sensitivities for
the resonant loss bands centered at λ1 and λ2. Irrespective of its origin, however, such a result
indicates that the wavelength difference between these two resonances, ∆(λ2–λ1), can be an
effective curvature measurement parameter, providing a readout sensitivity of (8.7 ± 0.1) nm.m
as shown in Figure 3.30 b).
The response of the sensing head to temperature variations was also characterized, as shown in
Figure 3.31. The structure was placed in a tube furnace, and submitted to increasing values of
temperature in the range 0-200 °C, with 25 °C-steps. The results depicted in Figure 3.31 a)
indicate that the loss bands centered at λ1 and λ2 exhibit linear responses to temperature
variations, characterized by similar sensitivities: (11.72 ± 0.01) and (12.03 ± 0.01) pm/°C for λ1
and λ2, respectively. This was somewhat expected, since the temperature variation does not
change the singlemode – multimode launching conditions; and the MMF length variation (due to
thermal expansion) and MMF core refractive index variation (due to silica thermo-optic effect)
only change the optical path length, with the associated wavelength scaling for the resonances.
1.10 1.15 1.20 1.25 1.30 1.35 1.40 1.45
-0.5
0.0
0.5
1.0
1.5
2.0
2.5
a) ∆λ1/(1/R) = (7.3 ± 0.1) nm.m
∆λ2/(1/R) = (-1.4 ± 0.1) nm.m
∆λ
(n
m)
1/R (m-1)
1.10 1.15 1.20 1.25 1.30 1.35 1.40 1.45
0.0
0.5
1.0
1.5
2.0
2.5
3.0
(λ2−λ
1)/(1/R) = (8.7 ± 0.1) nm.m
∆(λ
2−
λ1)
(nm
)
1/R (m-1)
b)
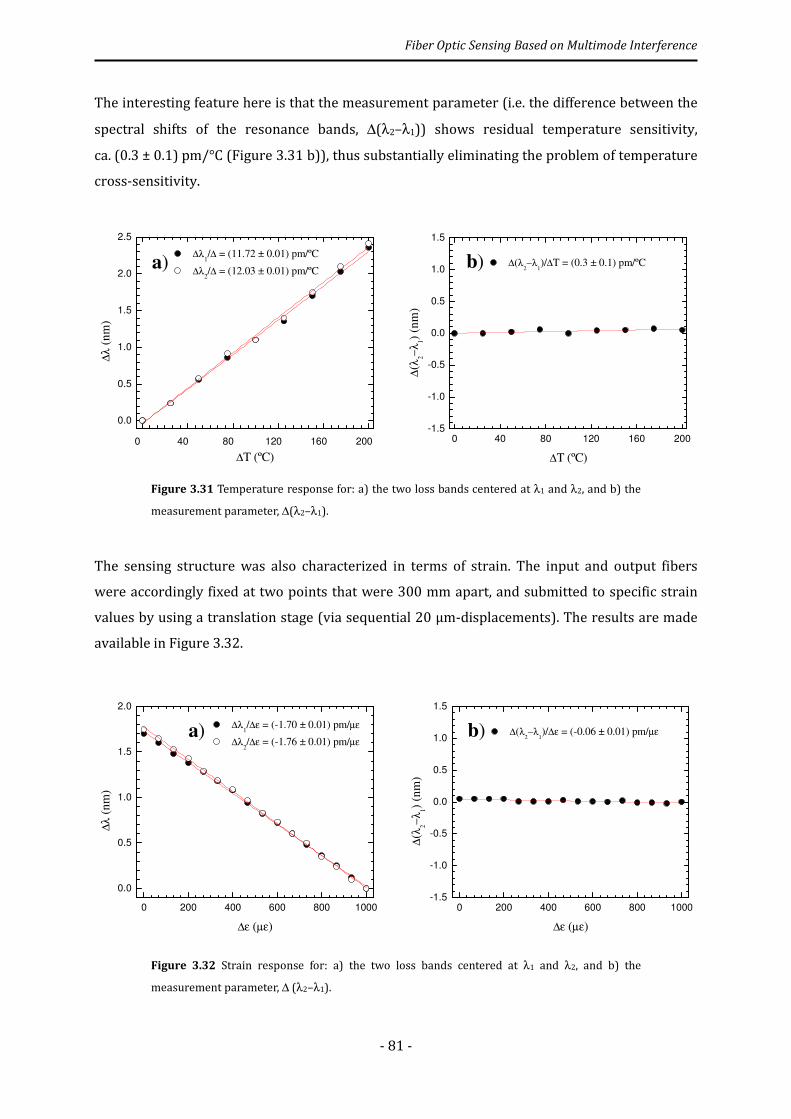
Fiber Optic Sensing Based on Multimode Interference
- 81 -
The interesting feature here is that the measurement parameter (i.e. the difference between the
spectral shifts of the resonance bands, ∆(λ2–λ1)) shows residual temperature sensitivity,
ca. (0.3 ± 0.1) pm/°C (Figure 3.31 b)), thus substantially eliminating the problem of temperature
cross-sensitivity.
Figure 3.31 Temperature response for: a) the two loss bands centered at λ1 and λ2, and b) the
measurement parameter, ∆(λ2–λ1).
The sensing structure was also characterized in terms of strain. The input and output fibers
were accordingly fixed at two points that were 300 mm apart, and submitted to specific strain
values by using a translation stage (via sequential 20 μm-displacements). The results are made
available in Figure 3.32.
Figure 3.32 Strain response for: a) the two loss bands centered at λ1 and λ2, and b) the
measurement parameter, ∆ (λ2–λ1).
0 40 80 120 160 200
0.0
0.5
1.0
1.5
2.0
2.5
a) ∆λ
1/∆ = (11.72 ± 0.01) pm/ºC
∆λ2/∆ = (12.03 ± 0.01) pm/ºC
∆λ
(n
m)
∆T (ºC)
0 40 80 120 160 200
-1.5
-1.0
-0.5
0.0
0.5
1.0
1.5
b) ∆(λ2−λ
1)/∆T = (0.3 ± 0.1) pm/ºC
∆(λ
2−
λ1)
(nm
)
∆T (ºC)
0 200 400 600 800 1000
0.0
0.5
1.0
1.5
2.0
a) ∆λ1/∆ε = (-1.70 ± 0.01) pm/µε
∆λ2/∆ε = (-1.76 ± 0.01) pm/µε
∆λ
(n
m)
∆ε (µε)
0 200 400 600 800 1000
-1.5
-1.0
-0.5
0.0
0.5
1.0
1.5
∆(λ2−λ
1)/∆ε = (-0.06 ± 0.01) pm/µε
∆(λ
2−
λ1)
(nm
)
∆ε (µε)
b)

Fiber Optic Sensing Based on Multimode Interference
- 82 -
Once again, the resonances have linear responses to strain variations, with similar sensitivities:
(-1.70 ± 0.01) and (1.76 ± 0.01) pm/µε, for λ1 and λ2, respectively; the rationale here is
somewhat similar to that considered for the case of temperature. When the dependence with
strain of the measurement parameter ∆(λ2–λ1) was evaluated, it turned out that the strain
sensitivity was close to zero, ca. (-0.06 ± 0.01) pm/µε as shown in Figure 3.32 b). Therefore, the
SMS structure described, under the proposed interrogation approach, can work out as a highly
sensitive curvature sensor, with residual cross-sensitivity to temperature and strain.
3.7.3 Curvature and temperature discrimination using a multimode interference
fiber optic structure – A proof of concept
This work presents a detailed study of SMS structures based on a coreless-MMF for
simultaneous measurement of curvature and temperature. The sensing head consists of a SMS
structure, i.e., a coreless-MMF section (pure silica rod) spliced between two SMFs and
interrogated in transmission, as it is schematically shown in Figure 3.33. A broadband source
(BBS) in the 1550 nm spectral range and 300 nm bandwidth was used, and an OSA as the
interrogation unit.
Figure 3.33 Experimental setup and detail of the coreless-MMF based-SMS fiber structure.
In this work, the operating mechanism of the sensing head relies on either constructive or
destructive interference at the output end of the coreless-MMF section, which occurs for a
specific length of the MMF used. The result is a bandpass (BP) or a band-rejection (BR) filter
with unique spectral characteristics that, in principle, will have different sensitivities to
curvature. For each sensing device, two coreless-MMFs with different diameters were used,
namely 125 and 55 µm (SMS125 and SMS55, respectively). Splices between the SMF and the
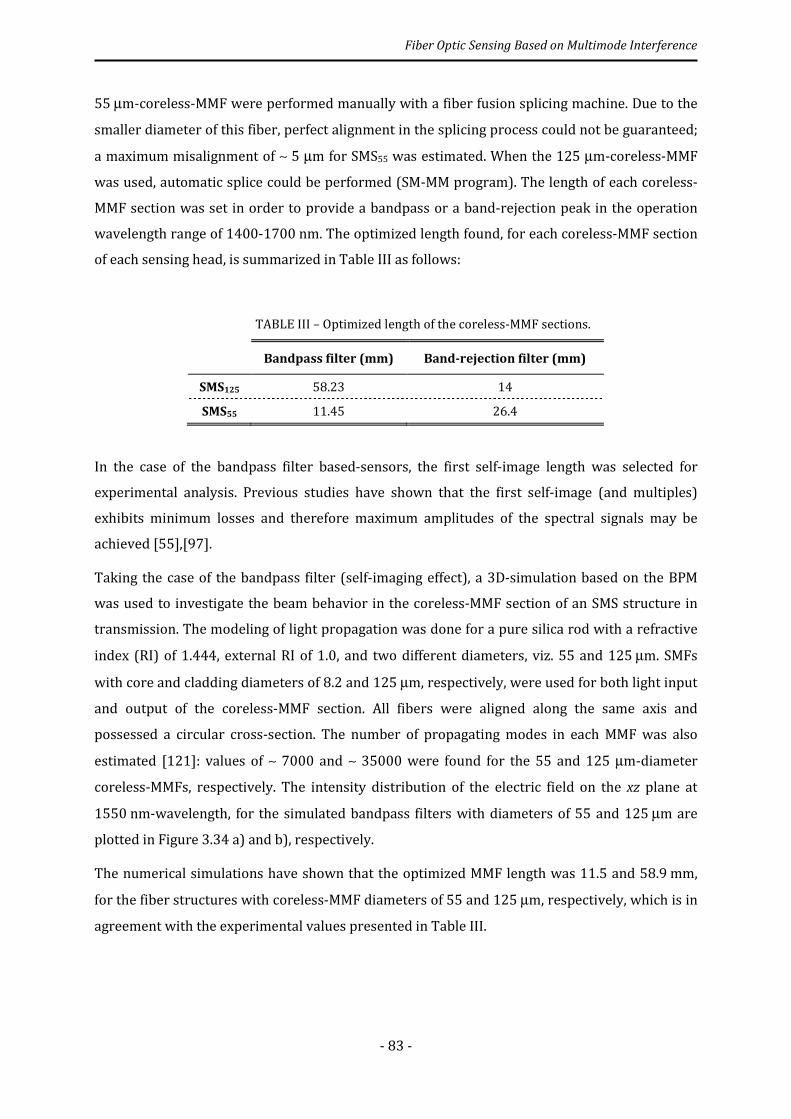
Fiber Optic Sensing Based on Multimode Interference
- 83 -
55 µm-coreless-MMF were performed manually with a fiber fusion splicing machine. Due to the
smaller diameter of this fiber, perfect alignment in the splicing process could not be guaranteed;
a maximum misalignment of ∼ 5 µm for SMS55 was estimated. When the 125 µm-coreless-MMF
was used, automatic splice could be performed (SM-MM program). The length of each coreless-
MMF section was set in order to provide a bandpass or a band-rejection peak in the operation
wavelength range of 1400-1700 nm. The optimized length found, for each coreless-MMF section
of each sensing head, is summarized in Table III as follows:
TABLE III – Optimized length of the coreless-MMF sections.
Bandpass filter (mm) Band-rejection filter (mm)
SMS125 58.23 14
SMS55 11.45 26.4
In the case of the bandpass filter based-sensors, the first self-image length was selected for
experimental analysis. Previous studies have shown that the first self-image (and multiples)
exhibits minimum losses and therefore maximum amplitudes of the spectral signals may be
achieved [55],[97].
Taking the case of the bandpass filter (self-imaging effect), a 3D-simulation based on the BPM
was used to investigate the beam behavior in the coreless-MMF section of an SMS structure in
transmission. The modeling of light propagation was done for a pure silica rod with a refractive
index (RI) of 1.444, external RI of 1.0, and two different diameters, viz. 55 and 125 µm. SMFs
with core and cladding diameters of 8.2 and 125 µm, respectively, were used for both light input
and output of the coreless-MMF section. All fibers were aligned along the same axis and
possessed a circular cross-section. The number of propagating modes in each MMF was also
estimated [121]: values of ∼ 7000 and ∼ 35000 were found for the 55 and 125 µm-diameter
coreless-MMFs, respectively. The intensity distribution of the electric field on the xz plane at
1550 nm-wavelength, for the simulated bandpass filters with diameters of 55 and 125 µm are
plotted in Figure 3.34 a) and b), respectively.
The numerical simulations have shown that the optimized MMF length was 11.5 and 58.9 mm,
for the fiber structures with coreless-MMF diameters of 55 and 125 µm, respectively, which is in
agreement with the experimental values presented in Table III.
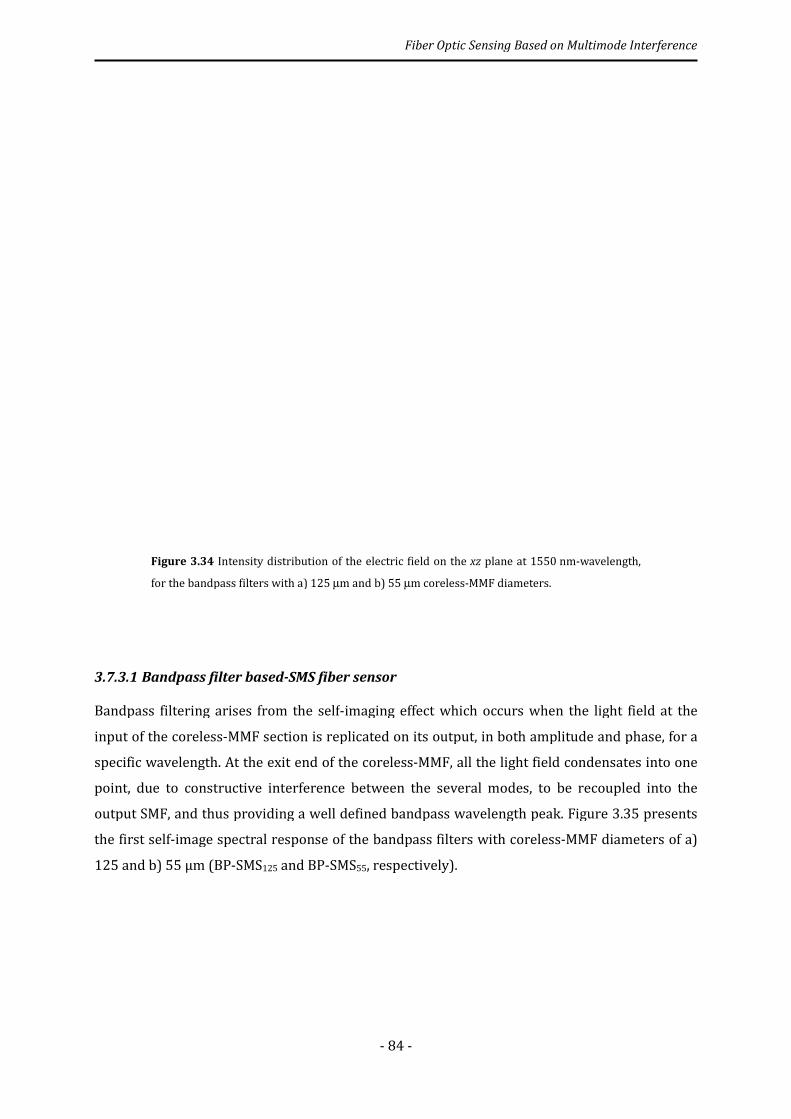
Figure 3.34 Intensity distribution of the electric field on the
for the bandpass filters with a) 12
3.7.3.1 Bandpass filter based-
Bandpass filtering arises from the self
input of the coreless-MMF section is replicated on its output, in both amplitude and phase, for a
specific wavelength. At the exit end of the coreless
point, due to constructive interference between the several modes, to be recoupled into the
output SMF, and thus providing a well defined bandpass wavelength peak.
the first self-image spectral response of the bandpass filters with coreless
125 and b) 55 µm (BP-SMS125 and BP
Fiber Optic Sensing Based on Multimode Interference
- 84 -
Intensity distribution of the electric field on the xz plane at 1550 nm
for the bandpass filters with a) 125 µm and b) 55 µm coreless-MMF diameters.
-SMS fiber sensor
Bandpass filtering arises from the self-imaging effect which occurs when the light field at the
MMF section is replicated on its output, in both amplitude and phase, for a
specific wavelength. At the exit end of the coreless-MMF, all the light field condensates into one
point, due to constructive interference between the several modes, to be recoupled into the
output SMF, and thus providing a well defined bandpass wavelength peak. Figure 3.
image spectral response of the bandpass filters with coreless-MMF diameters of a)
and BP-SMS55, respectively).
Fiber Optic Sensing Based on Multimode Interference
nm-wavelength,
imaging effect which occurs when the light field at the
MMF section is replicated on its output, in both amplitude and phase, for a
the light field condensates into one
point, due to constructive interference between the several modes, to be recoupled into the
Figure 3.35 presents
MMF diameters of a)

Fiber Optic Sensing Based on Multimode Interference
- 85 -
Figure 3.35 Spectral responses of the bandpass filters with coreless-MMF diameters of a) 125
and b) 55 µm (BP-SMS125 and BP-SMS55, respectively).
The sensing structures, BP-SMS125 and BP-SMS55, have a wavelength peak centered at 1544.8 and
1522.4 nm, respectively. The behavior of each resonance when subjected to curvature was
characterized by fixing each SMS structure at two points, 250 mm distanced from each other;
one of these points is a translation stage that allows the fiber to bend (see Figure 3.33). The
bending displacement, d, was applied to each SMS via sequential 40 μm-displacements. Hence,
the curvature (1/R) of the fiber structure changed by 2d/(d2+l2), where l is the half distance
between the two fixed points. The obtained results are depicted in Figure 3.36.
Figure 3.36 Curvature response of the bandpass filters, ( o ) BP-SMS125 and ( • ) BP-SMS55.
1480 1500 1520 1540 1560 1580 1600
0.0
0.2
0.4
0.6
0.8
1.0
1400 1440 1480 1520 1560 1600 1640 1680
0.0
0.2
0.4
0.6
0.8
1.0
a) BP-SMS125
No
rmal
ized
op
tica
l p
ow
er
b) BP-SMS
55
Wavelength (nm)
1.28 1.32 1.36 1.40 1.44 1.48 1.52
0
1
2
3
4
5
6
7
8
BP-SMS125
BP-SMS55
∆λ (
nm
)
1/R (m-1)
Figure 3.37 Intensity distribution of the BP
wavelength, and for different curvatures applied: a) straight fiber, b) R
Results show that both sensors have linear responses in the curvature range studied (1.28
m-1. Also, sensitivities to curvature of (11.3
and BP-SMS55, respectively, could be achieved. Typically, the field profile of an SMS fiber
structure is symmetrically distributed along the direction of propagation of th
Although, when curvature is applied, this symmetry is broken.
the loss of symmetry when curvature is ap
3.7.3.2 Band-rejection filter based
Multimode interference characterizes by the field profile variation along the MMF section,
although remaining symmetrically distributed along the direction of propagation. The band
rejection filter appears in a specific operation wavelength when interference between specific
modes is destructive in the core region. This effect may be observed with different lengths of the
coreless-MMF. The result is the amplitude decrease of the spectral signa
band-rejection based-spectral response is observed.
Fiber Optic Sensing Based on Multimode Interference
- 86 -
Intensity distribution of the BP-SMS125 electric field on the xz plane at 1550
wavelength, and for different curvatures applied: a) straight fiber, b) R = 50 cm and c) R
Results show that both sensors have linear responses in the curvature range studied (1.28
sensitivities to curvature of (11.3 ± 0.2) nm.m and (38.1 ± 0.8) nm.m, for BP
, respectively, could be achieved. Typically, the field profile of an SMS fiber
structure is symmetrically distributed along the direction of propagation of th
Although, when curvature is applied, this symmetry is broken. Figure 3.37 shows an example of
the loss of symmetry when curvature is applied to BP-SMS125.
rejection filter based-SMS fiber sensor
Multimode interference characterizes by the field profile variation along the MMF section,
although remaining symmetrically distributed along the direction of propagation. The band
filter appears in a specific operation wavelength when interference between specific
modes is destructive in the core region. This effect may be observed with different lengths of the
MMF. The result is the amplitude decrease of the spectral signal in such way that a
spectral response is observed. Figure 3.38 shows the optical spectra of the
Fiber Optic Sensing Based on Multimode Interference
plane at 1550 nm-
cm and c) R = 30 cm.
Results show that both sensors have linear responses in the curvature range studied (1.28-1.52)
nm.m, for BP-SMS125
, respectively, could be achieved. Typically, the field profile of an SMS fiber
structure is symmetrically distributed along the direction of propagation of the coreless-MMF.
shows an example of
Multimode interference characterizes by the field profile variation along the MMF section,
although remaining symmetrically distributed along the direction of propagation. The band-
filter appears in a specific operation wavelength when interference between specific
modes is destructive in the core region. This effect may be observed with different lengths of the
l in such way that a
shows the optical spectra of the
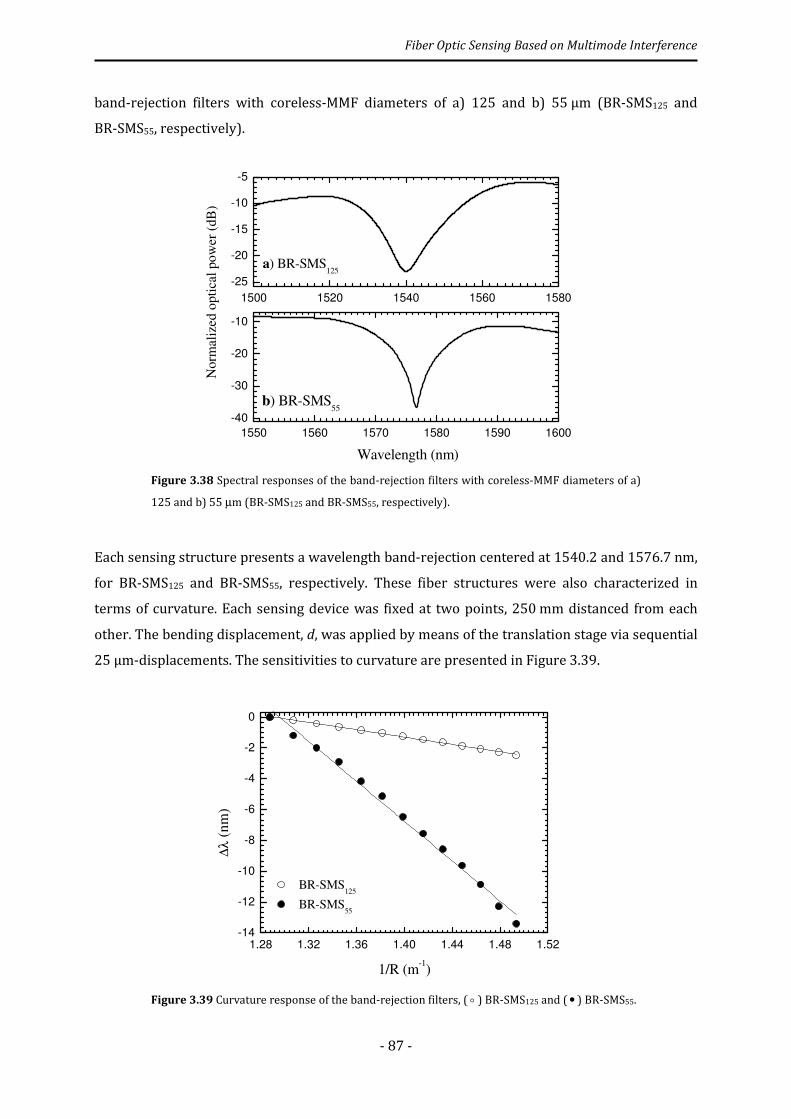
Fiber Optic Sensing Based on Multimode Interference
- 87 -
band-rejection filters with coreless-MMF diameters of a) 125 and b) 55 µm (BR-SMS125 and
BR-SMS55, respectively).
Figure 3.38 Spectral responses of the band-rejection filters with coreless-MMF diameters of a)
125 and b) 55 µm (BR-SMS125 and BR-SMS55, respectively).
Each sensing structure presents a wavelength band-rejection centered at 1540.2 and 1576.7 nm,
for BR-SMS125 and BR-SMS55, respectively. These fiber structures were also characterized in
terms of curvature. Each sensing device was fixed at two points, 250 mm distanced from each
other. The bending displacement, d, was applied by means of the translation stage via sequential
25 μm-displacements. The sensitivities to curvature are presented in Figure 3.39.
Figure 3.39 Curvature response of the band-rejection filters, ( o ) BR-SMS125 and ( • ) BR-SMS55.
1500 1520 1540 1560 1580
-25
-20
-15
-10
-5
1550 1560 1570 1580 1590 1600
-40
-30
-20
-10
a) BR-SMS125
Norm
aliz
ed o
pti
cal
po
wer
(dB
)
b) BR-SMS55
Wavelength (nm)
1.28 1.32 1.36 1.40 1.44 1.48 1.52
-14
-12
-10
-8
-6
-4
-2
0
BR-SMS125
BR-SMS55
∆λ
(n
m)
1/R (m-1)
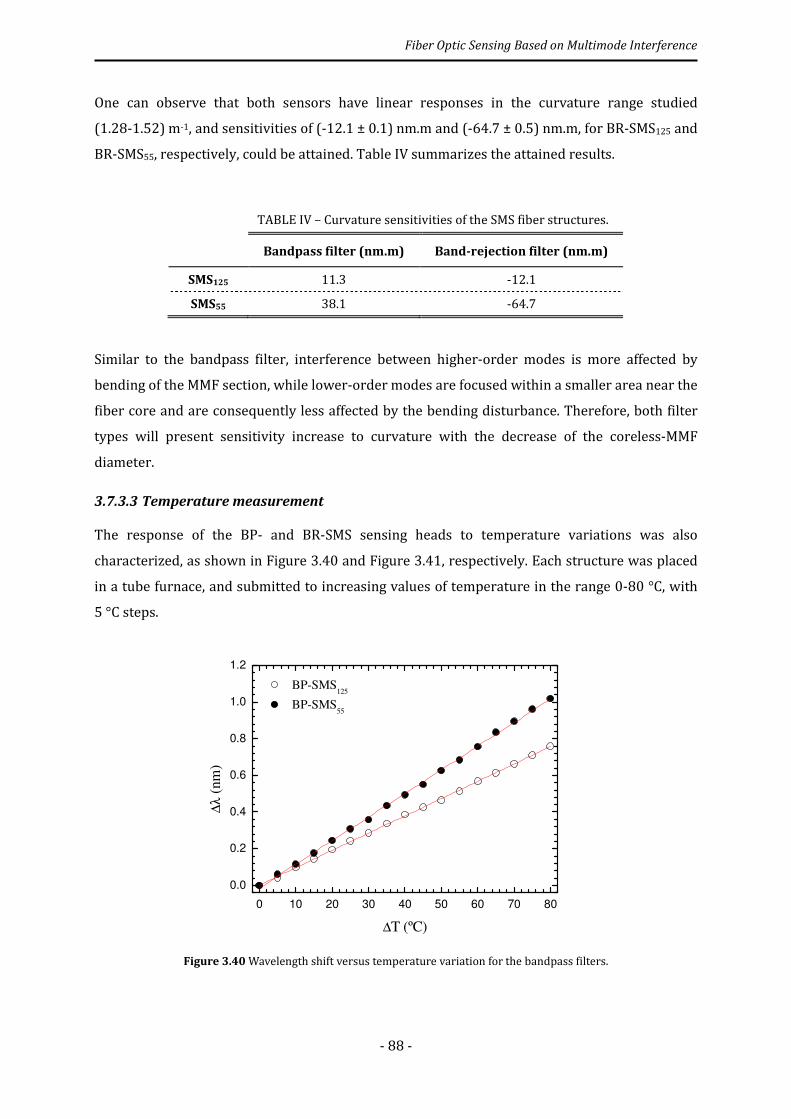
Fiber Optic Sensing Based on Multimode Interference
- 88 -
One can observe that both sensors have linear responses in the curvature range studied
(1.28-1.52) m-1, and sensitivities of (-12.1 ± 0.1) nm.m and (-64.7 ± 0.5) nm.m, for BR-SMS125 and
BR-SMS55, respectively, could be attained. Table IV summarizes the attained results.
TABLE IV – Curvature sensitivities of the SMS fiber structures.
Bandpass filter (nm.m) Band-rejection filter (nm.m)
SMS125 11.3 -12.1
SMS55 38.1 -64.7
Similar to the bandpass filter, interference between higher-order modes is more affected by
bending of the MMF section, while lower-order modes are focused within a smaller area near the
fiber core and are consequently less affected by the bending disturbance. Therefore, both filter
types will present sensitivity increase to curvature with the decrease of the coreless-MMF
diameter.
3.7.3.3 Temperature measurement
The response of the BP- and BR-SMS sensing heads to temperature variations was also
characterized, as shown in Figure 3.40 and Figure 3.41, respectively. Each structure was placed
in a tube furnace, and submitted to increasing values of temperature in the range 0-80 °C, with
5 °C steps.
Figure 3.40 Wavelength shift versus temperature variation for the bandpass filters.
0 10 20 30 40 50 60 70 80
0.0
0.2
0.4
0.6
0.8
1.0
1.2
BP-SMS125
BP-SMS55
∆λ (
nm
)
∆T (ºC)

Fiber Optic Sensing Based on Multimode Interference
- 89 -
Figure 3.41 Wavelength shift versus temperature variation for the band-rejection filters.
The sensing heads studied present linear responses in the temperature range studied;
sensitivities of (9.44 ± 0.04) and (12.88 ± 0.08) pm/°C, for BP-SMS125 and BP-SMS55 were
obtained; while sensitivities of (9.38 ± 0.05) and (13.08 ± 0.06) pm/°C, for BR-SMS125 and
BR-SMS55 were achieved.
The SMS fiber-based filters with the same diameter have similar sensitivities to temperature.
This was somewhat expected since the temperature variation does not change the SMF-silica rod
launching conditions; the results are determined by the temperature dependence of the
refractive index and the thermal expansion of the silica fiber material.
In both cases, one can observe that the sensing structures with a 55 µm-coreless-MMF are more
sensitive to temperature; this happens because the multimode interference is more affected by
the thermal expansion in the MMF with a smaller diameter. Table V summarizes the
temperature sensitivity values attained for the SMS fiber structures.
TABLE V – Temperature sensitivities of the SMS fiber structures.
Bandpass filter (pm/°C) Band-rejection filter (pm/°C)
SMS125 9.44 9.38
SMS55 12.88 13.08
0 10 20 30 40 50 60 70 80
0.0
0.2
0.4
0.6
0.8
1.0
1.2
BR-SMS125
BR-SMS55
∆λ (
nm
)
∆T (ºC)
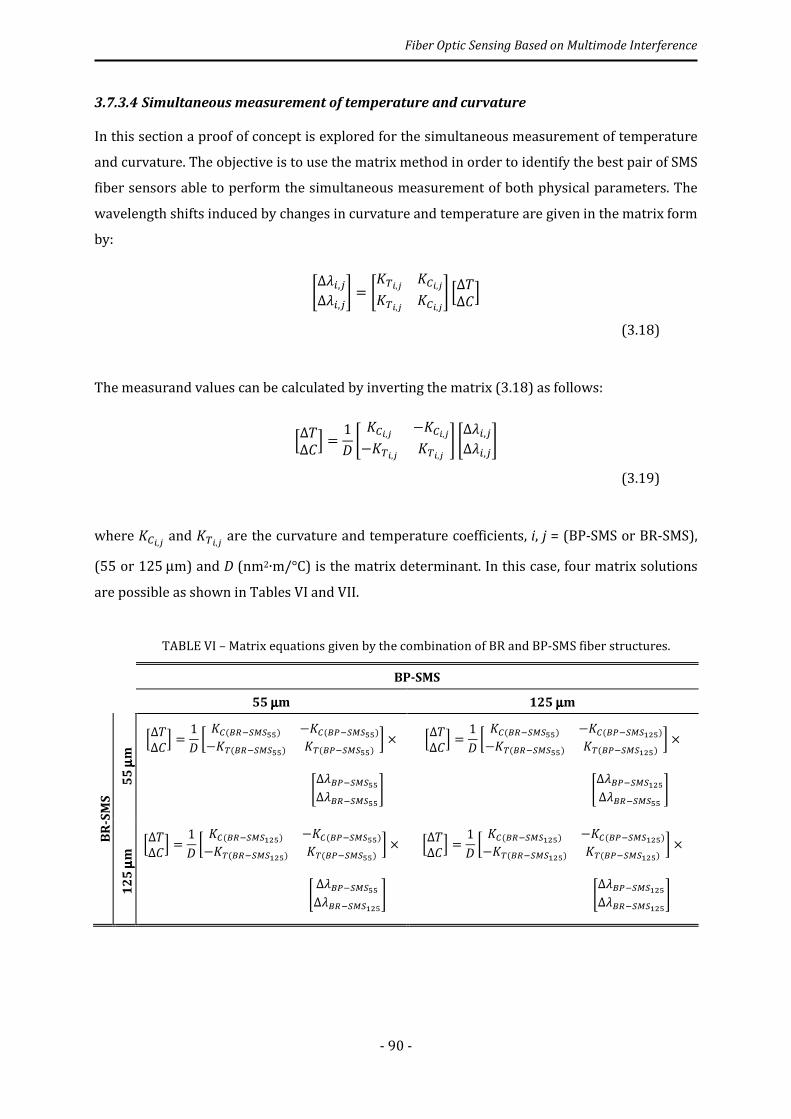
Fiber Optic Sensing Based on Multimode Interference
- 90 -
3.7.3.4 Simultaneous measurement of temperature and curvature
In this section a proof of concept is explored for the simultaneous measurement of temperature
and curvature. The objective is to use the matrix method in order to identify the best pair of SMS
fiber sensors able to perform the simultaneous measurement of both physical parameters. The
wavelength shifts induced by changes in curvature and temperature are given in the matrix form
by:
u∆��,!∆��,!v = uj�k,w jxk,wj�k,w jxk,wv pΔlΔyq
(3.18)
The measurand values can be calculated by inverting the matrix (3.18) as follows:
pΔlΔyq = 1s u jxk,w −jxk,w−j�k,w j�k,w v u∆��,!∆��,!v
(3.19)
where jxk,w and j�k,w are the curvature and temperature coefficients, i, j = (BP-SMS or BR-SMS),
(55 or 125 µm) and D (nm2∙m/°C) is the matrix determinant. In this case, four matrix solutions
are possible as shown in Tables VI and VII.
TABLE VI – Matrix equations given by the combination of BR and BP-SMS fiber structures.
BP-SMS
55 µµµµm 125 µµµµm
BR
-SM
S
55
µµ µµm
pΔlΔyq = 1s m jx(�z:{J{||) −jx(�}:{J{||)−j�(�z:{J{||) j�(�}:{J{||) n ×
u∆��}:{J{||∆��z:{J{|| v
pΔlΔyq = 1s m jx(�z:{J{||) −jx(�}:{J{o<|)−j�(�z:{J{||) j�(�}:{J{o<|) n ×
u∆��}:{J{o<|∆��z:{J{|| v
12
5 µµ µµ
m pΔlΔyq = 1s m jx(�z:{J{o<|) −jx(�}:{J{||)−j�(�z:{J{o<|) j�(�}:{J{||) n ×
u ∆��}:{J{||∆��z:{J{o<|v
pΔlΔyq = 1s m jx(�z:{J{o<|) −jx(�}:{J{o<|)−j�(�z:{J{o<|) j�(�}:{J{o<|) n ×
u∆��}:{J{o<|∆��z:{J{o<|v
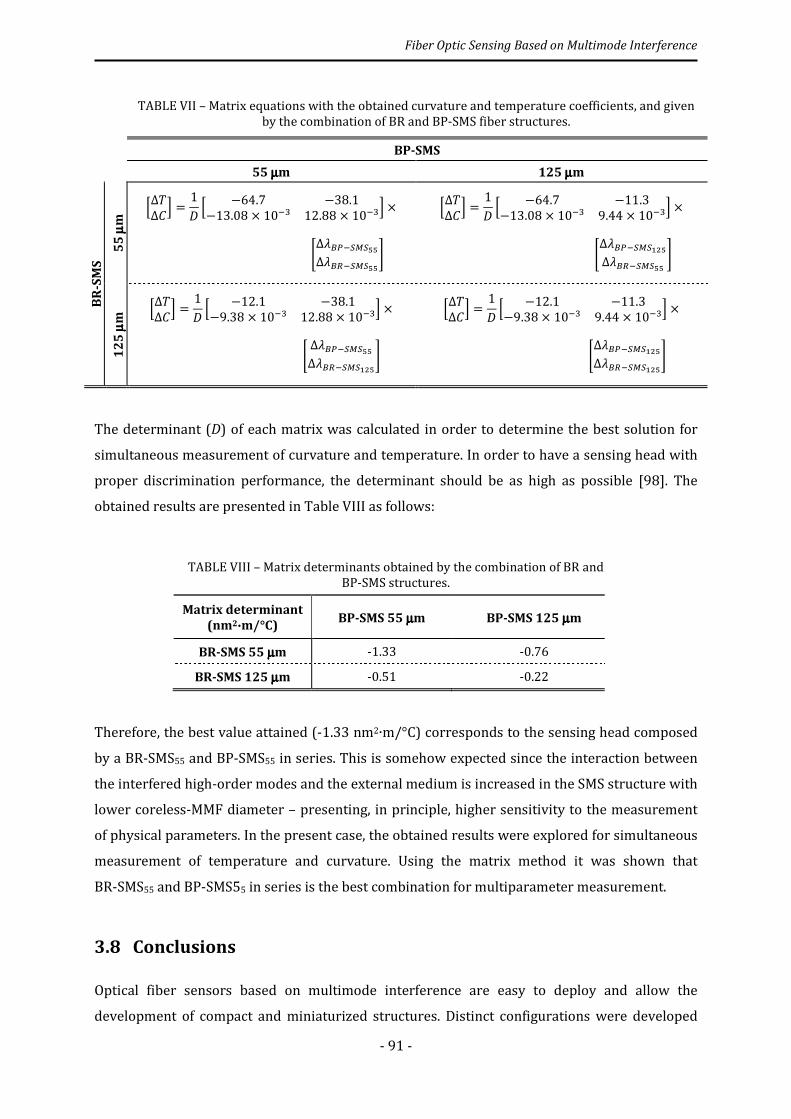
Fiber Optic Sensing Based on Multimode Interference
- 91 -
TABLE VII – Matrix equations with the obtained curvature and temperature coefficients, and given by the combination of BR and BP-SMS fiber structures.
BP-SMS
55 µµµµm 125 µµµµm
BR
-SM
S
55
µµ µµm
pΔlΔyq = 1s p −64.7 −38.1−13.08 × 10:� 12.88 × 10:�q ×
u∆��}:{J{||∆��z:{J{||v
pΔlΔyq = 1s p −64.7 −11.3−13.08 × 10:� 9.44 × 10:�q ×
u∆��}:{J{o<|∆��z:{J{|| v
12
5 µµ µµ
m pΔlΔyq = 1s p −12.1 −38.1−9.38 × 10:� 12.88 × 10:�q ×
u ∆��}:{J{||∆��z:{J{o<|v
pΔlΔyq = 1s p −12.1 −11.3−9.38 × 10:� 9.44 × 10:�q ×
u∆��}:{J{o<|∆��z:{J{o<|v
The determinant (D) of each matrix was calculated in order to determine the best solution for
simultaneous measurement of curvature and temperature. In order to have a sensing head with
proper discrimination performance, the determinant should be as high as possible [98]. The
obtained results are presented in Table VIII as follows:
TABLE VIII – Matrix determinants obtained by the combination of BR and BP-SMS structures.
Matrix determinant
(nm2∙m/°C) BP-SMS 55 µµµµm BP-SMS 125 µµµµm
BR-SMS 55 µµµµm -1.33 -0.76
BR-SMS 125 µµµµm -0.51 -0.22
Therefore, the best value attained (-1.33 nm2∙m/°C) corresponds to the sensing head composed
by a BR-SMS55 and BP-SMS55 in series. This is somehow expected since the interaction between
the interfered high-order modes and the external medium is increased in the SMS structure with
lower coreless-MMF diameter – presenting, in principle, higher sensitivity to the measurement
of physical parameters. In the present case, the obtained results were explored for simultaneous
measurement of temperature and curvature. Using the matrix method it was shown that
BR-SMS55 and BP-SMS55 in series is the best combination for multiparameter measurement.
3.8 Conclusions
Optical fiber sensors based on multimode interference are easy to deploy and allow the
development of compact and miniaturized structures. Distinct configurations were developed

Fiber Optic Sensing Based on Multimode Interference
- 92 -
for the measurement of RI. The SMF-MMF tip is very attractive due to the simple fiber probe
configuration, particularly if it is considered its small size, allowing localized sensing. It was
shown that the sensor tip is based on intensity variations induced by the measurand, in this case
RI, and its performance is essentially not susceptible to sensing head temperature cross-
sensitivity effects. It was also demonstrated the feasibility of a simple interrogation technique
relying on the utilization of FBGs, as an alternative method for the optical spectrum analyzer.
The obtained resolution of 1.75 × 10⁻³ RIU indicated a performance compatible with readout RI
resolutions adequate for environmental and biochemical applications.
The SMS with a large-core air-clad PCF used the air holes of the said fiber to measure RI changes
of water induced by temperature variations. Such simple configuration retrieved a high
resolution of 3.4×10⁻⁵ RIU for a temperature step of 1 °C. A maximum sensitivity of 880 nm/RIU
was obtained for a RI variation of 0.002. The refractive index variation inside the air holes of the
PCF along with the thermo-optic effect provided high wavelength sensitivity is such a small RI
range. Making use of the air holes, this sensing configuration appears suitable for the
measurement of RI in gaseous environments.
It seems clear that SMS structures with reduced MMF cores, either by tapering or etching
processes, have enhanced sensitivities to RI. The use of a coreless-MMF reduces the fragility of
the SMS structure when tapered or etched MMFs are used, while maintaining along its length the
intrinsic sensitivity to the external medium. The SMS with a coreless-MMF proved that
decreasing the MMF diameter could increase the sensitivity to RI. The coreless-MMF with 55
mm in diameter could provide a maximum sensitivity of 2800 nm/RIU within the RI range of
1.42-1.43. The SMS device has also shown to be highly sensitive to temperature variations for a
high liquid RI of 1.43. An ultra-high sensitivity of -1880 pm/°C was indeed attained in the
temperature range of 0-25°C. Numerical simulations successfully proved that is possible to
measure an external RI above 1.43 if the coreless-MMF is coated with a polymer having a RI as
low as 1.3. In this case, the intensity variation of the signal is obtained via evanescent wave
absorption induced by the measurand.
The experimental works presented here demonstrated the versatility of using MMI-based
devices for the measurement of RI in a variety of applications ranging from environmental (1.0-
1.03) and biochemical (1.31-1.35), to food and oil research (1.35-1.45). On the other hand, it is
important to know the influence of other physical parameters such as temperature, strain and
curvature. The SMS based on a MMF with 105/125 µm, for core and cladding diameters, was
tested in terms of the aforementioned parameters. The band-rejection composed by two loss
peaks allowed differential measurements of curvature with residual cross-sensitivity to
temperature and strain.

Fiber Optic Sensing Based on Multimode Interference
- 93 -
The SMS structure is also flexible in spectral selection according with the length and
characteristics of the MMF used. Bandpass and band-rejection filters are well suited for the
discrimination of physical parameters such as temperature and curvature. A study over the
influence of said parameters with bandpass and band-rejection filters was also performed. The
possibility of achieving curvature and temperature discrimination with two in-line bandpass
filters was successfully demonstrated. This is an important feature when the purpose is to adapt
the sensing head to real-case scenarios where, for example, curvature of the fiber sensor may
not be avoided or, in the case of biological environments, where cross-sensitivity to temperature
is a drawback in the monitoring process of such systems.

- 94 -

- 95 -
4
Palladium-Based Fiber Optic Sensors for
Hydrogen Detection
4.1 Introduction
Hydrogen is one of the cleanest energy sources: it can easily be obtained from water via
electrolysis or photolysis (as happens with photosynthesis); and upon plain burning it turns into
water, so it does not contribute to global warming via production of CO2. Therefore, it has been
used in many chemical processes in various fields, e.g. propellant in aerospace rockets, and fuel
for fuel cells and explosion engines in automotive devices. However, liquid hydrogen is
extremely volatile and flammable, and can even be explosive: at room conditions of temperature
and pressure, hydrogen exhibits in fact a wide explosion range, from 4 %(v/v) H2 (i.e. lower
explosive limit, LEL) up to 75 %(v/v) (i.e. upper explosive limit, UEL), coupled with a low
ignition energy (0.02 mJ) and a large flame propagation velocity. In addition, it diffuses very fast
and easily, so it may eventually leak out of its container owing to a reduced molecular size.
Therefore, control of H2 concentration is of the utmost importance, which implies development
of accurate and robust sensors – with sensitivity to H2 at as low as ppb levels.
To date, several hydrogen sensors have been described, based on distinct physicochemical
principles: metal oxide semiconductor sensors [122], electrochemical sensors [123],
thermoelectric sensors [124], surface acoustic wave sensors [125] and optical sensors [126],
among others. The latter usually resort to optical fibers as a basis, and may in turn be classified
according to their working principle [127]: (a) interferometric-based, (b) intensity-based or (c)
fiber grating-based sensors.
Interferometric sensors were the first type of hydrogen sensors reported in the literature, yet
intensity-based sensors have been the most common as practical applications; in particular,
evanescent wave absorption-based intensity sensors, relying on Pd-coated, etched or tapered
optical fibers, have been the most usual configurations, owing to their good performance in
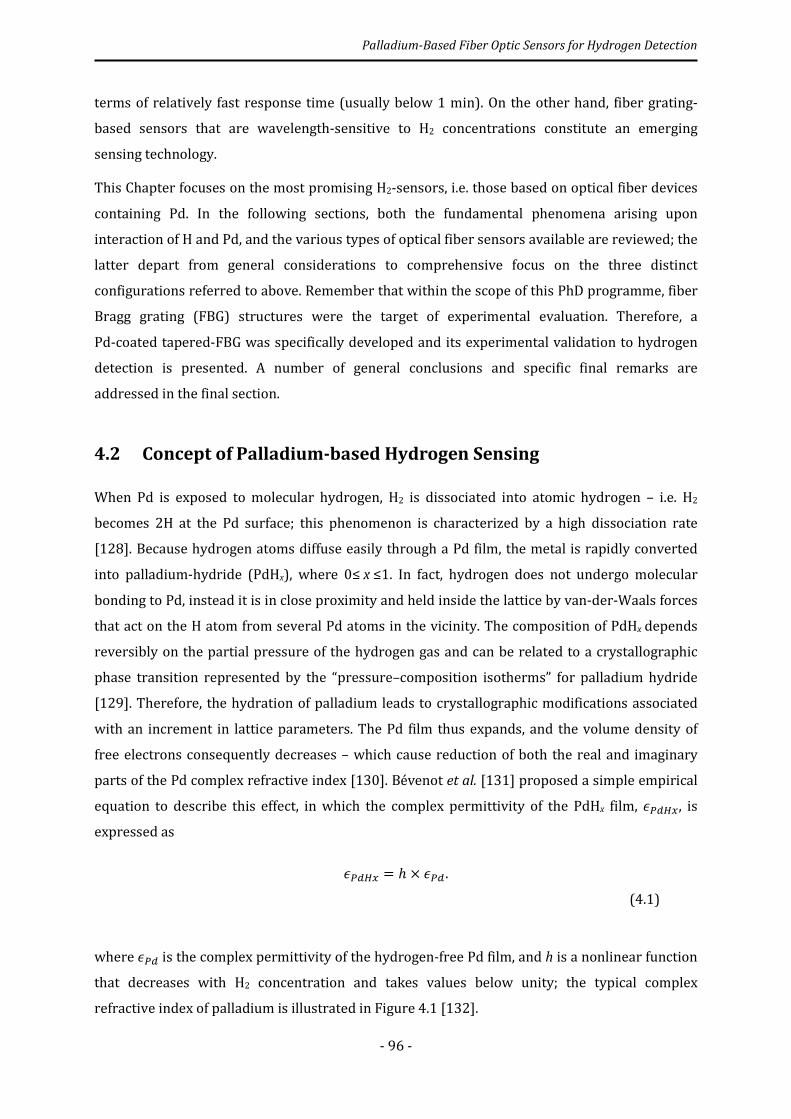
Palladium-Based Fiber Optic Sensors for Hydrogen Detection
- 96 -
terms of relatively fast response time (usually below 1 min). On the other hand, fiber grating-
based sensors that are wavelength-sensitive to H2 concentrations constitute an emerging
sensing technology.
This Chapter focuses on the most promising H2-sensors, i.e. those based on optical fiber devices
containing Pd. In the following sections, both the fundamental phenomena arising upon
interaction of H and Pd, and the various types of optical fiber sensors available are reviewed; the
latter depart from general considerations to comprehensive focus on the three distinct
configurations referred to above. Remember that within the scope of this PhD programme, fiber
Bragg grating (FBG) structures were the target of experimental evaluation. Therefore, a
Pd-coated tapered-FBG was specifically developed and its experimental validation to hydrogen
detection is presented. A number of general conclusions and specific final remarks are
addressed in the final section.
4.2 Concept of Palladium-based Hydrogen Sensing
When Pd is exposed to molecular hydrogen, H2 is dissociated into atomic hydrogen – i.e. H2
becomes 2H at the Pd surface; this phenomenon is characterized by a high dissociation rate
[128]. Because hydrogen atoms diffuse easily through a Pd film, the metal is rapidly converted
into palladium-hydride (PdHx), where 0≤ x ≤1. In fact, hydrogen does not undergo molecular
bonding to Pd, instead it is in close proximity and held inside the lattice by van-der-Waals forces
that act on the H atom from several Pd atoms in the vicinity. The composition of PdHx depends
reversibly on the partial pressure of the hydrogen gas and can be related to a crystallographic
phase transition represented by the “pressure–composition isotherms” for palladium hydride
[129]. Therefore, the hydration of palladium leads to crystallographic modifications associated
with an increment in lattice parameters. The Pd film thus expands, and the volume density of
free electrons consequently decreases – which cause reduction of both the real and imaginary
parts of the Pd complex refractive index [130]. Bévenot et al. [131] proposed a simple empirical
equation to describe this effect, in which the complex permittivity of the PdHx film, �}���, is
expressed as
�}��� = ℎ × �}� . (4.1)
where �}� is the complex permittivity of the hydrogen-free Pd film, and h is a nonlinear function
that decreases with H2 concentration and takes values below unity; the typical complex
refractive index of palladium is illustrated in Figure 4.1 [132].
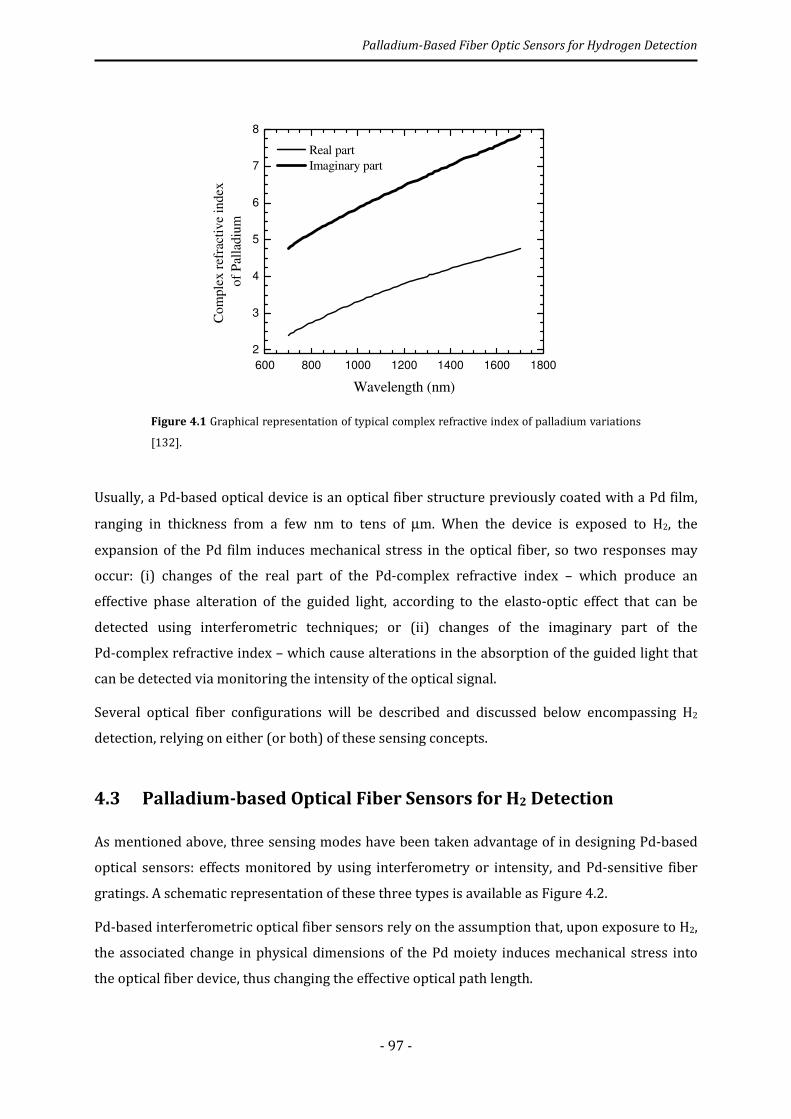
Palladium-Based Fiber Optic Sensors for Hydrogen Detection
- 97 -
Figure 4.1 Graphical representation of typical complex refractive index of palladium variations
[132].
Usually, a Pd-based optical device is an optical fiber structure previously coated with a Pd film,
ranging in thickness from a few nm to tens of µm. When the device is exposed to H2, the
expansion of the Pd film induces mechanical stress in the optical fiber, so two responses may
occur: (i) changes of the real part of the Pd-complex refractive index – which produce an
effective phase alteration of the guided light, according to the elasto-optic effect that can be
detected using interferometric techniques; or (ii) changes of the imaginary part of the
Pd-complex refractive index – which cause alterations in the absorption of the guided light that
can be detected via monitoring the intensity of the optical signal.
Several optical fiber configurations will be described and discussed below encompassing H2
detection, relying on either (or both) of these sensing concepts.
4.3 Palladium-based Optical Fiber Sensors for H2 Detection
As mentioned above, three sensing modes have been taken advantage of in designing Pd-based
optical sensors: effects monitored by using interferometry or intensity, and Pd-sensitive fiber
gratings. A schematic representation of these three types is available as Figure 4.2.
Pd-based interferometric optical fiber sensors rely on the assumption that, upon exposure to H2,
the associated change in physical dimensions of the Pd moiety induces mechanical stress into
the optical fiber device, thus changing the effective optical path length.
600 800 1000 1200 1400 1600 1800
2
3
4
5
6
7
8
Real part
Imaginary part
Com
ple
x r
efra
ctiv
e in
dex
of
Pal
ladiu
m
Wavelength (nm)
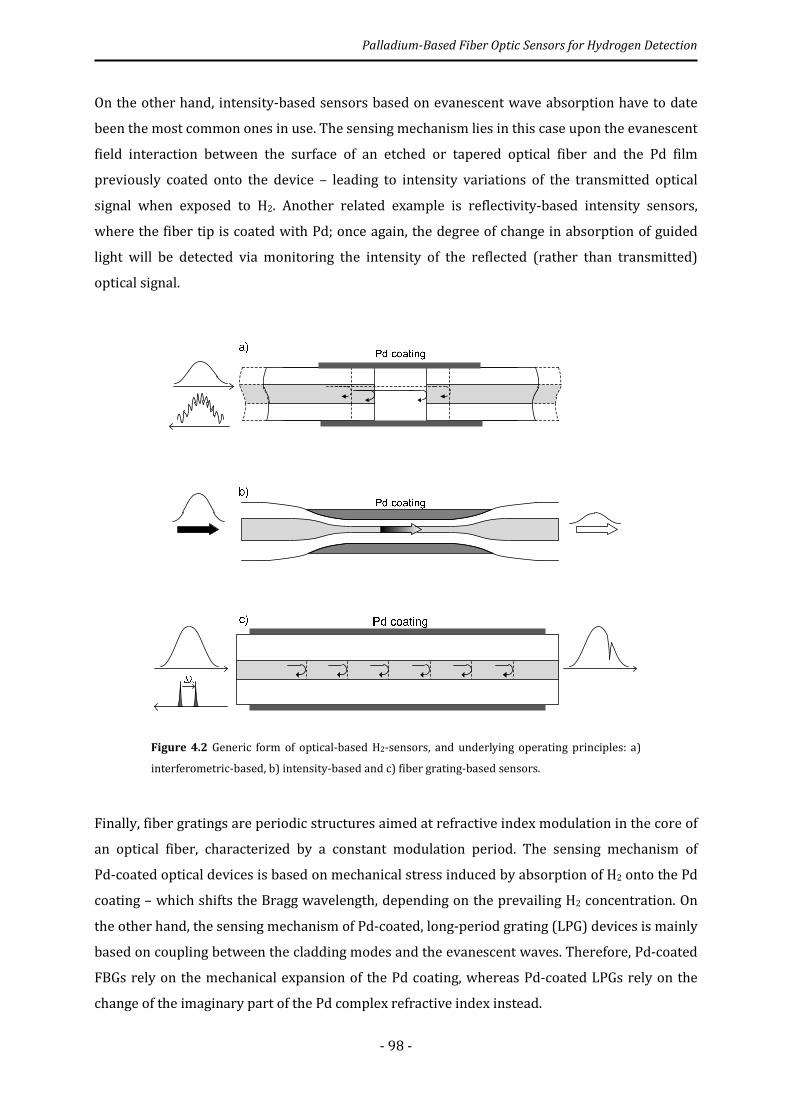
Palladium-Based Fiber Optic Sensors for Hydrogen Detection
- 98 -
On the other hand, intensity-based sensors based on evanescent wave absorption have to date
been the most common ones in use. The sensing mechanism lies in this case upon the evanescent
field interaction between the surface of an etched or tapered optical fiber and the Pd film
previously coated onto the device – leading to intensity variations of the transmitted optical
signal when exposed to H2. Another related example is reflectivity-based intensity sensors,
where the fiber tip is coated with Pd; once again, the degree of change in absorption of guided
light will be detected via monitoring the intensity of the reflected (rather than transmitted)
optical signal.
Figure 4.2 Generic form of optical-based H2-sensors, and underlying operating principles: a)
interferometric-based, b) intensity-based and c) fiber grating-based sensors.
Finally, fiber gratings are periodic structures aimed at refractive index modulation in the core of
an optical fiber, characterized by a constant modulation period. The sensing mechanism of
Pd-coated optical devices is based on mechanical stress induced by absorption of H2 onto the Pd
coating – which shifts the Bragg wavelength, depending on the prevailing H2 concentration. On
the other hand, the sensing mechanism of Pd-coated, long-period grating (LPG) devices is mainly
based on coupling between the cladding modes and the evanescent waves. Therefore, Pd-coated
FBGs rely on the mechanical expansion of the Pd coating, whereas Pd-coated LPGs rely on the
change of the imaginary part of the Pd complex refractive index instead.
Palladium-Based Fiber Optic Sensors for Hydrogen Detection
- 99 -
4.3.1 Interferometric-based sensors
Butler [133] presented the first optical fiber sensor designed specifically for H2 assay. The
sensing element was a 3 cm-long singlemode fiber (SMF), on the surface of which a 10 µm-thick
Pd layer was deposited: a 100 Å-thick titanium (Ti) layer had also been deposited between the
Pd layer and the surface of the optical fiber to enhance adhesion. This sensing fiber was one of
the arms of a Mach-Zehnder interferometer: when the coated fiber was exposed to H2, the Pd
film expanded, and the induced mechanical stress caused its effective optical path length to
change. This experimental configuration is depicted in Figure 4.3.
Figure 4.3 Schematic of fiber optic hydrogen sensor based on the Mach-Zehnder interferometer [133].
This sensor was able to detect a minimum of 0.6 %(v/v) H2 in nitrogen atmosphere, with a
response period below 3 min at room temperature. Subsequent improvements of this technique
[134] encompassed a 28 cm-long SMF coated with a 100 Å-thick Ti layer, followed as well by a
1 µm-thick Pd layer. This thinner sensing head permitted the sensitivity of H2 in N2 to be as low
as 2 ppb (with an upper limit of 2 %(v/v)), and with a response time of only ca. 30 s.
Farahi et al. [135] proposed an optical fiber sensor for measurement of H2 partial pressures in a
gaseous environment, in which the primary sensing element was a 0.06 m-long Pd wire with
0.5 mm-diameter attached to an SMF using a quick-setting epoxy resin. Said sensing fiber was
the arm of an (all-fiber) Michelson interferometer. This sensor would detect variations in H2
pressure as part of nitrogen atmosphere, covering the range from 0.54 to 100 Pa – with response
times not above 8 min, at room temperature.
Zeakes et al. [136] inserted an SMF in a glass alignment tube opposite to a large diameter
multimode fiber (MMF) reflector, so as to form a low-finesse Fabry-Perot sensing cavity
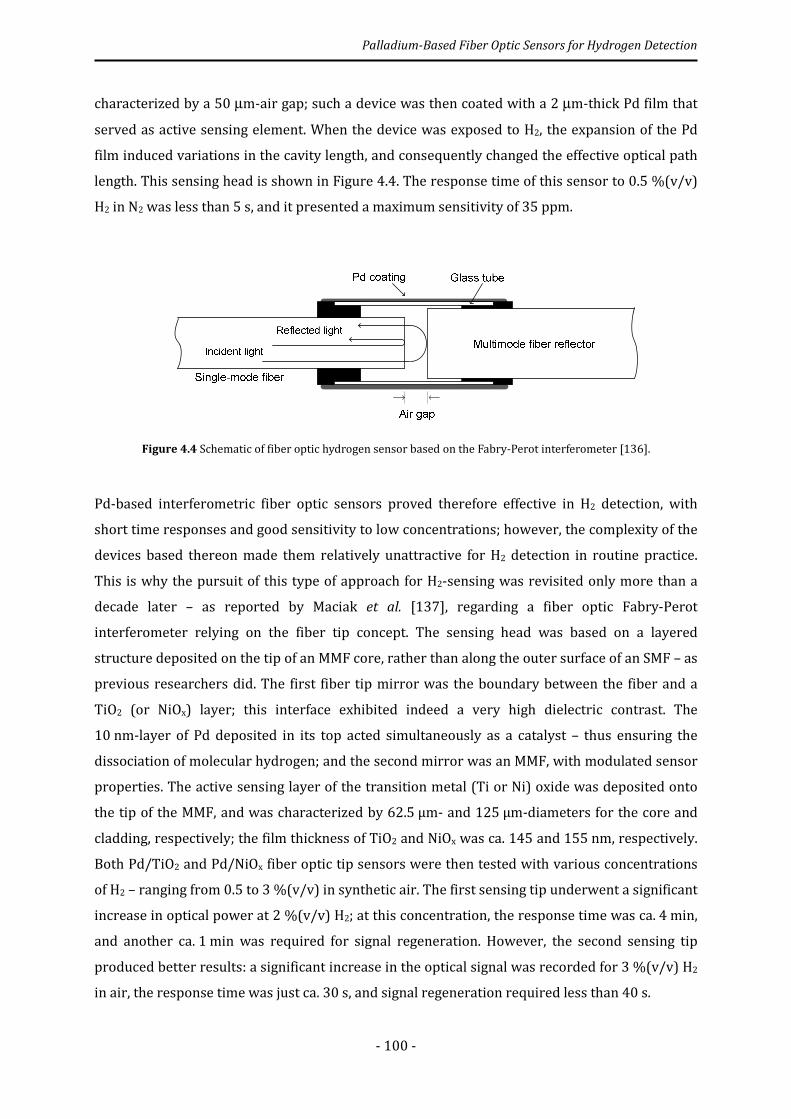
Palladium-Based Fiber Optic Sensors for Hydrogen Detection
- 100 -
characterized by a 50 µm-air gap; such a device was then coated with a 2 µm-thick Pd film that
served as active sensing element. When the device was exposed to H2, the expansion of the Pd
film induced variations in the cavity length, and consequently changed the effective optical path
length. This sensing head is shown in Figure 4.4. The response time of this sensor to 0.5 %(v/v)
H2 in N2 was less than 5 s, and it presented a maximum sensitivity of 35 ppm.
Figure 4.4 Schematic of fiber optic hydrogen sensor based on the Fabry-Perot interferometer [136].
Pd-based interferometric fiber optic sensors proved therefore effective in H2 detection, with
short time responses and good sensitivity to low concentrations; however, the complexity of the
devices based thereon made them relatively unattractive for H2 detection in routine practice.
This is why the pursuit of this type of approach for H2-sensing was revisited only more than a
decade later – as reported by Maciak et al. [137], regarding a fiber optic Fabry-Perot
interferometer relying on the fiber tip concept. The sensing head was based on a layered
structure deposited on the tip of an MMF core, rather than along the outer surface of an SMF – as
previous researchers did. The first fiber tip mirror was the boundary between the fiber and a
TiO2 (or NiOx) layer; this interface exhibited indeed a very high dielectric contrast. The
10 nm-layer of Pd deposited in its top acted simultaneously as a catalyst – thus ensuring the
dissociation of molecular hydrogen; and the second mirror was an MMF, with modulated sensor
properties. The active sensing layer of the transition metal (Ti or Ni) oxide was deposited onto
the tip of the MMF, and was characterized by 62.5 µm- and 125 µm-diameters for the core and
cladding, respectively; the film thickness of TiO2 and NiOx was ca. 145 and 155 nm, respectively.
Both Pd/TiO2 and Pd/NiOx fiber optic tip sensors were then tested with various concentrations
of H2 – ranging from 0.5 to 3 %(v/v) in synthetic air. The first sensing tip underwent a significant
increase in optical power at 2 %(v/v) H2; at this concentration, the response time was ca. 4 min,
and another ca. 1 min was required for signal regeneration. However, the second sensing tip
produced better results: a significant increase in the optical signal was recorded for 3 %(v/v) H2
in air, the response time was just ca. 30 s, and signal regeneration required less than 40 s.

Palladium-Based Fiber Optic Sensors for Hydrogen Detection
- 101 -
In the same year, Ianuzzi et al. [138] developed a Fabry-Perot sensor based on a 150 nm-thick
Pd-coated cantilever, carved out of the cleaved edge of an SMF; upon expansion of the Pd film in
the presence of H2, the cantilever suffered displacement that caused a change in the effective
optical path length owing to the air cavity variation. The optical signal exhibited a significant
change by 240 s, when submitted to 5 %(v/v) H2 in Ar.
Kim et al. [139] proposed, on the following year, a hydrogen sensor based on Mach-Zehnder
fiber optics, which was formed by two identical Pd-coated LPGs; each had a 500 μm-period, and
was characterized by a length of 20 mm and a centre-to-centre distance of 50 mm. A 50 nm-thick
Pd film was uniformly deposited over the cladding of an SMF; the total Pd-coated sensing length
was 70 mm. This sensing head is shown in Figure 4.5.
Figure 4.5 Schematic of fiber optic hydrogen sensor based on two fiber optic LPGs [139].
When Pd was exposed to H2, a change in the boundary condition was induced between the
cladding surface and the Pd layer, as well as in the effective index difference between the core
and the cladding modes; as a consequence, the effective optical path length of the interferometer
varied. When submitted in particular to 4 %(v/v) H2 in N2, the interference peak shifted 2.3 nm
within an 8 min-time, followed by signal saturation.
Later, Ma et al. [140] described a Fabry-Perot device based on a fiber tip hetero-structure. The
sensing head was in this case an SMF spliced to a 30 µm-long MMF section; a resonator layout
was implemented at the tip, including vibration arms and a chromium/gold-coated centre
reflector. A submicrometer layer of Pt was then coated on the vibration arms of the resonator,
thus serving as catalytic heater upon H2 exposure: the heat generated locally raised the
resonator temperature, thus leading to an acoustic resonance frequency shift. When the sensing
tip was exposed to 1 %(v/v) H2, the resonance frequency at 1.7 MHz shifted 1.17 kHz; the
associated sensitivity was estimated to be better than 0.1 %(v/v).
More recently, Yang et al. [141] proposed an extrinsic Fabry-Perot interferometer coated with a
Pd-Ag film. The sensing head relied on a silica tube with an inner diameter of 130 µm, coated
with a 100 nm Pd-Ag film; the lead-in and reflective SMFs were placed inside the tube, separated
by an air gap that formed the FP cavity. When the sensing head was exposed to increasing H2
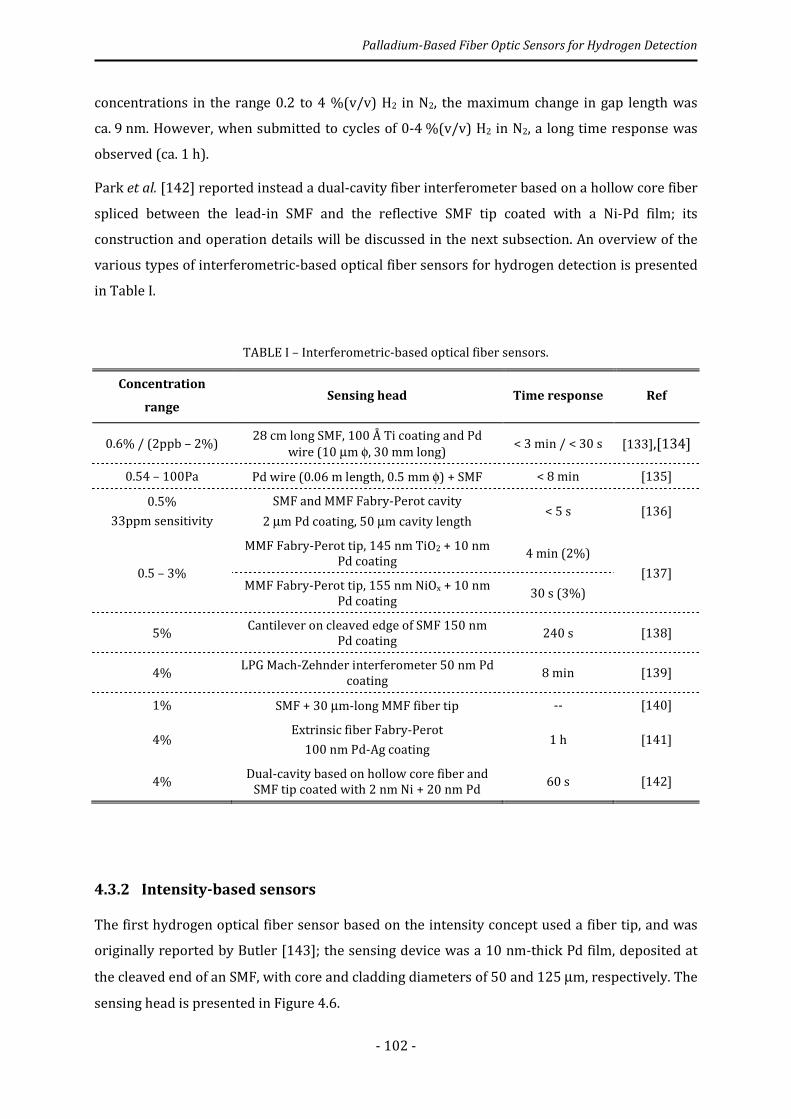
Palladium-Based Fiber Optic Sensors for Hydrogen Detection
- 102 -
concentrations in the range 0.2 to 4 %(v/v) H2 in N2, the maximum change in gap length was
ca. 9 nm. However, when submitted to cycles of 0-4 %(v/v) H2 in N2, a long time response was
observed (ca. 1 h).
Park et al. [142] reported instead a dual-cavity fiber interferometer based on a hollow core fiber
spliced between the lead-in SMF and the reflective SMF tip coated with a Ni-Pd film; its
construction and operation details will be discussed in the next subsection. An overview of the
various types of interferometric-based optical fiber sensors for hydrogen detection is presented
in Table I.
TABLE I – Interferometric-based optical fiber sensors.
Concentration
range Sensing head Time response Ref
0.6% / (2ppb – 2%) 28 cm long SMF, 100 Å Ti coating and Pd
wire (10 µm φ, 30 mm long) < 3 min / < 30 s [133],[134]
0.54 – 100Pa Pd wire (0.06 m length, 0.5 mm φ) + SMF < 8 min [135]
0.5%
33ppm sensitivity
SMF and MMF Fabry-Perot cavity
2 µm Pd coating, 50 µm cavity length < 5 s [136]
0.5 – 3%
MMF Fabry-Perot tip, 145 nm TiO2 + 10 nm Pd coating
4 min (2%)
[137] MMF Fabry-Perot tip, 155 nm NiOx + 10 nm
Pd coating 30 s (3%)
5% Cantilever on cleaved edge of SMF 150 nm
Pd coating 240 s [138]
4% LPG Mach-Zehnder interferometer 50 nm Pd
coating 8 min [139]
1% SMF + 30 µm-long MMF fiber tip -- [140]
4% Extrinsic fiber Fabry-Perot
100 nm Pd-Ag coating 1 h [141]
4% Dual-cavity based on hollow core fiber and
SMF tip coated with 2 nm Ni + 20 nm Pd 60 s [142]
4.3.2 Intensity-based sensors
The first hydrogen optical fiber sensor based on the intensity concept used a fiber tip, and was
originally reported by Butler [143]; the sensing device was a 10 nm-thick Pd film, deposited at
the cleaved end of an SMF, with core and cladding diameters of 50 and 125 µm, respectively. The
sensing head is presented in Figure 4.6.
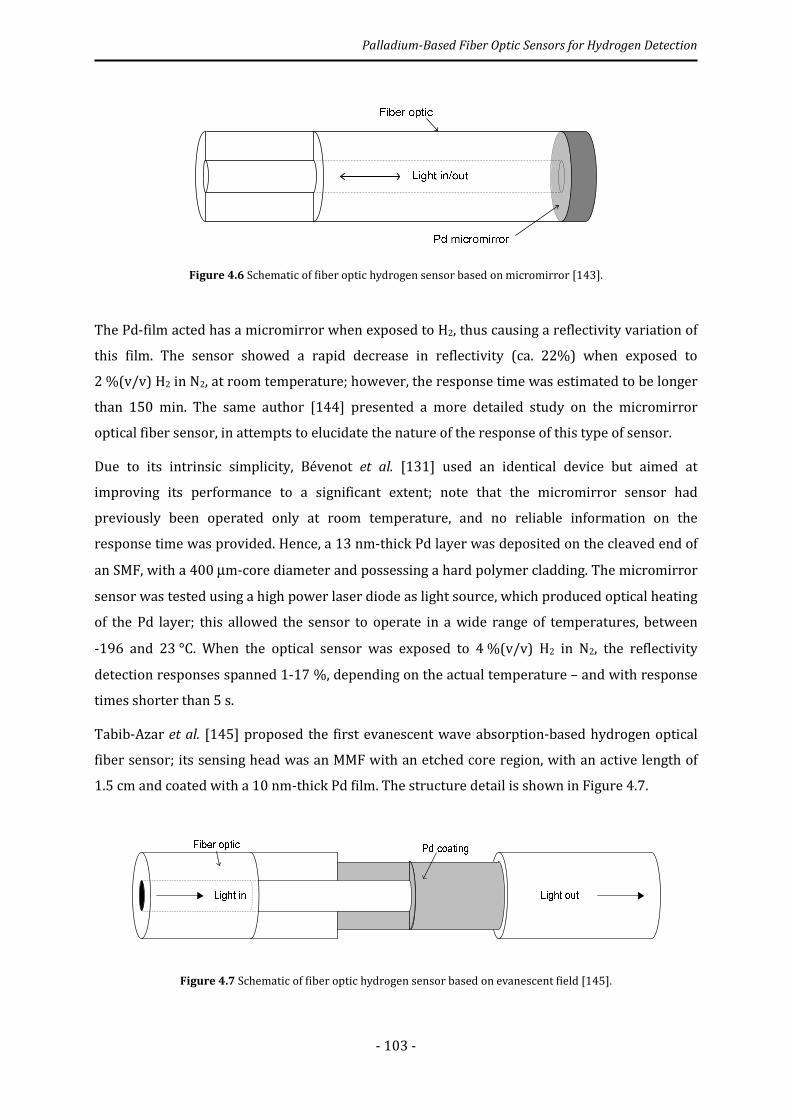
Palladium-Based Fiber Optic Sensors for Hydrogen Detection
- 103 -
Figure 4.6 Schematic of fiber optic hydrogen sensor based on micromirror [143].
The Pd-film acted has a micromirror when exposed to H2, thus causing a reflectivity variation of
this film. The sensor showed a rapid decrease in reflectivity (ca. 22%) when exposed to
2 %(v/v) H2 in N2, at room temperature; however, the response time was estimated to be longer
than 150 min. The same author [144] presented a more detailed study on the micromirror
optical fiber sensor, in attempts to elucidate the nature of the response of this type of sensor.
Due to its intrinsic simplicity, Bévenot et al. [131] used an identical device but aimed at
improving its performance to a significant extent; note that the micromirror sensor had
previously been operated only at room temperature, and no reliable information on the
response time was provided. Hence, a 13 nm-thick Pd layer was deposited on the cleaved end of
an SMF, with a 400 µm-core diameter and possessing a hard polymer cladding. The micromirror
sensor was tested using a high power laser diode as light source, which produced optical heating
of the Pd layer; this allowed the sensor to operate in a wide range of temperatures, between
-196 and 23 °C. When the optical sensor was exposed to 4 %(v/v) H2 in N2, the reflectivity
detection responses spanned 1-17 %, depending on the actual temperature – and with response
times shorter than 5 s.
Tabib-Azar et al. [145] proposed the first evanescent wave absorption-based hydrogen optical
fiber sensor; its sensing head was an MMF with an etched core region, with an active length of
1.5 cm and coated with a 10 nm-thick Pd film. The structure detail is shown in Figure 4.7.
Figure 4.7 Schematic of fiber optic hydrogen sensor based on evanescent field [145].

Palladium-Based Fiber Optic Sensors for Hydrogen Detection
- 104 -
This sensor was able to detect low concentrations of H2 in N2, at room temperature; for 0.2 and
0.6 %(v/v) H2, response times of 20 and 30 s, respectively, were attained.
A similar physical concept, but resorting instead to a Pd-supported tungsten oxide (WO3) layer
as sensing cladding media, was described by Sekimoto et al. [146]. These authors adopted two
different approaches for fiber fabrication: one used a dip-coated, ca. 3 µm-Pd/WO3 film
containing silicone resin; and the other took advantage of the sol-gel process to form a
ca. 1 µm-thick film of Pt/WO3 cladding; both were characterized by a 7.5 cm-sensing length. In
the presence of H2, strong evanescent-wave absorption was observed as a result of formation of
tungsten bronze. Both types of sensors were submitted to a plain H2 atmosphere: the
Pd/WO3-based MMF sensor exhibited a response time of ca. 1 h; the result was greatly improved
in the case of the Pt/WO3-based sensor, for which a response time of a mere 7 min was obtained.
Okazaki et al. [147] used the latter sensor, with a 15 cm-sensing length; it could operate also
within a wide temperature range (-30 to 45 °C) with response times above 250 s, for 1 %(v/v)
H2 in N2.
Likewise, Sumida et al. [148] characterized a device possessing an optical time domain
reflectometer. When their sensor was exposed to 1 %(v/v) H2 in N2 at room temperature, it
presented a response time of ca. 5 min for a 5 dB-increase in the propagation loss. This
technique indicated that the Pt/WO3-based MMF sensor had the potential to detect the location
of H2 leakage points along the path of an optical fiber. Recently, Watanabe et al. [149] used
electron beam deposition as fabrication technique – in view of its versatility in adjusting the
deposition parameters. The sensing device thus developed was a 15 cm-length MMF with a two-
layered thin film, composed by 50 nm-thick WO3 and 5 nm-thick Pt layers. When the sensor was
exposed to plain H2, the response time observed was 3 s, and the recovery time was ca. 1 min –
hence showing a better performance than previous sensors.
Villatoro et al. [150] described an optical fiber hydrogen sensor based on the absorption change
of the evanescent field in a Pd-coated tapered SMF; the taper was 25 µm in diameter, 15 mm in
interaction length and 12 nm in thickness of Pd coating. The sensing head is shown in Figure 4.8.
Figure 4.8 Schematic of fiber optic hydrogen sensor based on Pd-coated tapered SMF [150].
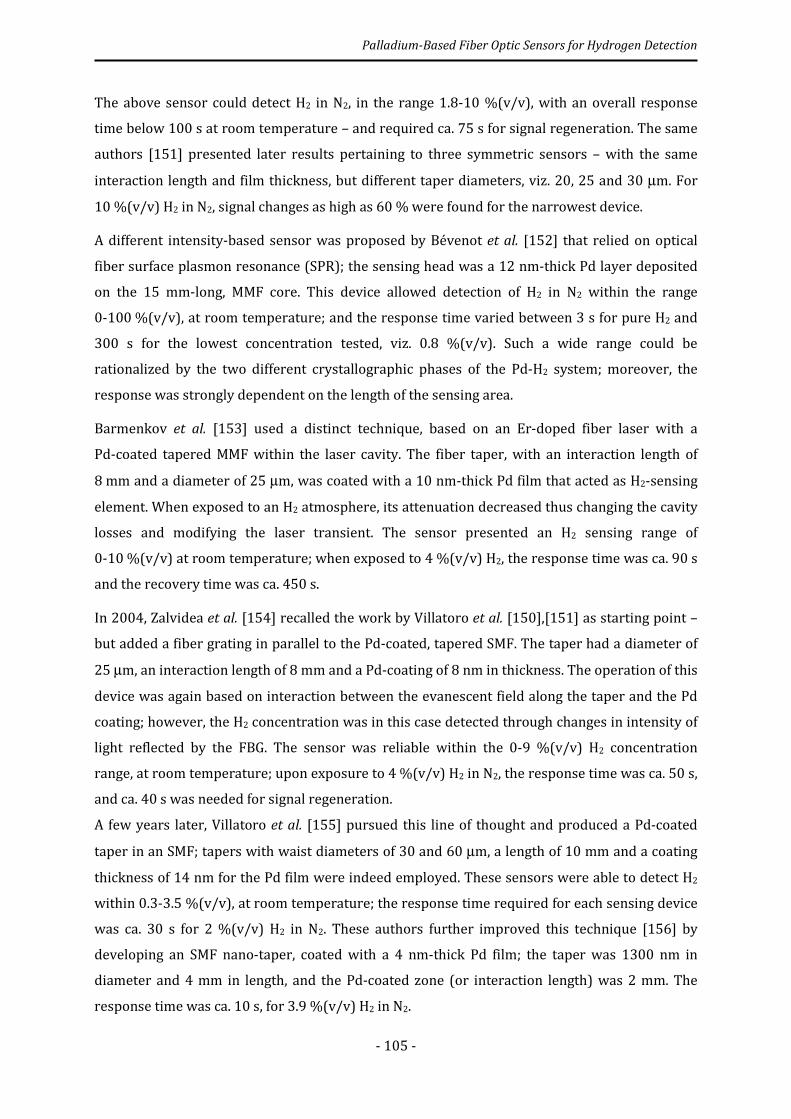
Palladium-Based Fiber Optic Sensors for Hydrogen Detection
- 105 -
The above sensor could detect H2 in N2, in the range 1.8-10 %(v/v), with an overall response
time below 100 s at room temperature – and required ca. 75 s for signal regeneration. The same
authors [151] presented later results pertaining to three symmetric sensors – with the same
interaction length and film thickness, but different taper diameters, viz. 20, 25 and 30 µm. For
10 %(v/v) H2 in N2, signal changes as high as 60 % were found for the narrowest device.
A different intensity-based sensor was proposed by Bévenot et al. [152] that relied on optical
fiber surface plasmon resonance (SPR); the sensing head was a 12 nm-thick Pd layer deposited
on the 15 mm-long, MMF core. This device allowed detection of H2 in N2 within the range
0-100 %(v/v), at room temperature; and the response time varied between 3 s for pure H2 and
300 s for the lowest concentration tested, viz. 0.8 %(v/v). Such a wide range could be
rationalized by the two different crystallographic phases of the Pd-H2 system; moreover, the
response was strongly dependent on the length of the sensing area.
Barmenkov et al. [153] used a distinct technique, based on an Er-doped fiber laser with a
Pd-coated tapered MMF within the laser cavity. The fiber taper, with an interaction length of
8 mm and a diameter of 25 µm, was coated with a 10 nm-thick Pd film that acted as H2-sensing
element. When exposed to an H2 atmosphere, its attenuation decreased thus changing the cavity
losses and modifying the laser transient. The sensor presented an H2 sensing range of
0-10 %(v/v) at room temperature; when exposed to 4 %(v/v) H2, the response time was ca. 90 s
and the recovery time was ca. 450 s.
In 2004, Zalvidea et al. [154] recalled the work by Villatoro et al. [150],[151] as starting point –
but added a fiber grating in parallel to the Pd-coated, tapered SMF. The taper had a diameter of
25 µm, an interaction length of 8 mm and a Pd-coating of 8 nm in thickness. The operation of this
device was again based on interaction between the evanescent field along the taper and the Pd
coating; however, the H2 concentration was in this case detected through changes in intensity of
light reflected by the FBG. The sensor was reliable within the 0-9 %(v/v) H2 concentration
range, at room temperature; upon exposure to 4 %(v/v) H2 in N2, the response time was ca. 50 s,
and ca. 40 s was needed for signal regeneration.
A few years later, Villatoro et al. [155] pursued this line of thought and produced a Pd-coated
taper in an SMF; tapers with waist diameters of 30 and 60 µm, a length of 10 mm and a coating
thickness of 14 nm for the Pd film were indeed employed. These sensors were able to detect H2
within 0.3-3.5 %(v/v), at room temperature; the response time required for each sensing device
was ca. 30 s for 2 %(v/v) H2 in N2. These authors further improved this technique [156] by
developing an SMF nano-taper, coated with a 4 nm-thick Pd film; the taper was 1300 nm in
diameter and 4 mm in length, and the Pd-coated zone (or interaction length) was 2 mm. The
response time was ca. 10 s, for 3.9 %(v/v) H2 in N2.
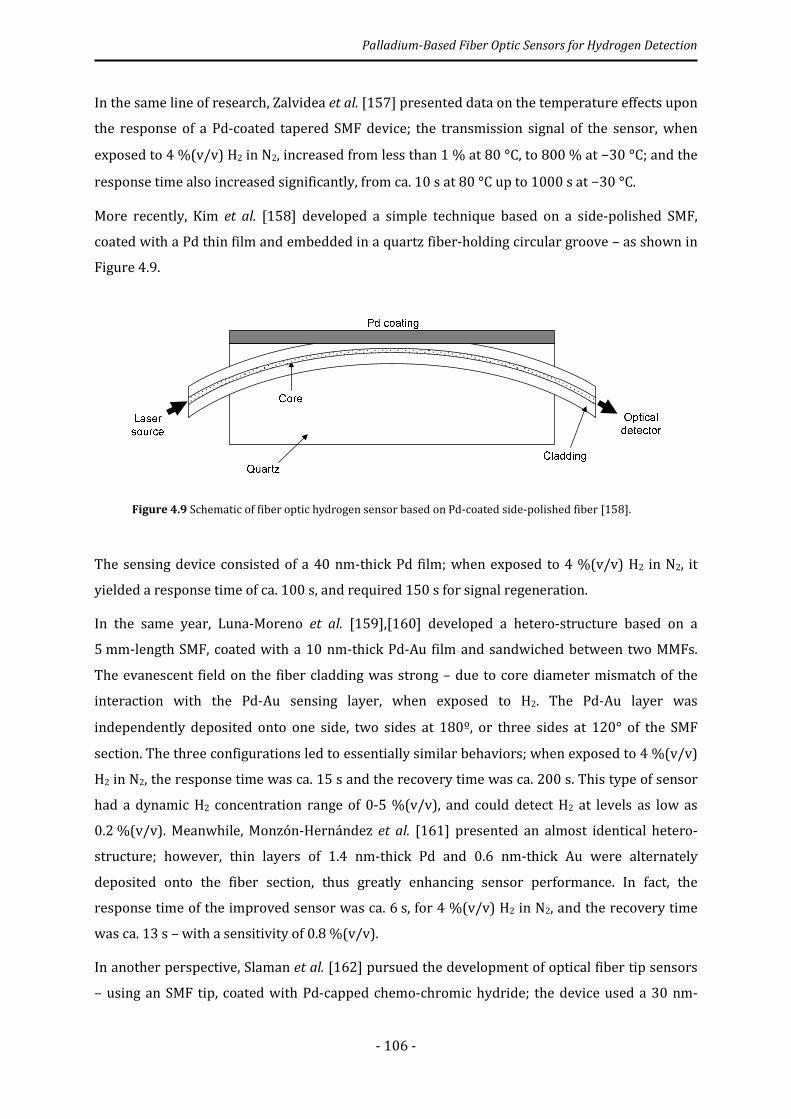
Palladium-Based Fiber Optic Sensors for Hydrogen Detection
- 106 -
In the same line of research, Zalvidea et al. [157] presented data on the temperature effects upon
the response of a Pd-coated tapered SMF device; the transmission signal of the sensor, when
exposed to 4 %(v/v) H2 in N2, increased from less than 1 % at 80 °C, to 800 % at −30 °C; and the
response time also increased significantly, from ca. 10 s at 80 °C up to 1000 s at −30 °C.
More recently, Kim et al. [158] developed a simple technique based on a side-polished SMF,
coated with a Pd thin film and embedded in a quartz fiber-holding circular groove – as shown in
Figure 4.9.
Figure 4.9 Schematic of fiber optic hydrogen sensor based on Pd-coated side-polished fiber [158].
The sensing device consisted of a 40 nm-thick Pd film; when exposed to 4 %(v/v) H2 in N2, it
yielded a response time of ca. 100 s, and required 150 s for signal regeneration.
In the same year, Luna-Moreno et al. [159],[160] developed a hetero-structure based on a
5 mm-length SMF, coated with a 10 nm-thick Pd-Au film and sandwiched between two MMFs.
The evanescent field on the fiber cladding was strong – due to core diameter mismatch of the
interaction with the Pd-Au sensing layer, when exposed to H2. The Pd-Au layer was
independently deposited onto one side, two sides at 180º, or three sides at 120° of the SMF
section. The three configurations led to essentially similar behaviors; when exposed to 4 %(v/v)
H2 in N2, the response time was ca. 15 s and the recovery time was ca. 200 s. This type of sensor
had a dynamic H2 concentration range of 0-5 %(v/v), and could detect H2 at levels as low as
0.2 %(v/v). Meanwhile, Monzón-Hernández et al. [161] presented an almost identical hetero-
structure; however, thin layers of 1.4 nm-thick Pd and 0.6 nm-thick Au were alternately
deposited onto the fiber section, thus greatly enhancing sensor performance. In fact, the
response time of the improved sensor was ca. 6 s, for 4 %(v/v) H2 in N2, and the recovery time
was ca. 13 s – with a sensitivity of 0.8 %(v/v).
In another perspective, Slaman et al. [162] pursued the development of optical fiber tip sensors
– using an SMF tip, coated with Pd-capped chemo-chromic hydride; the device used a 30 nm-
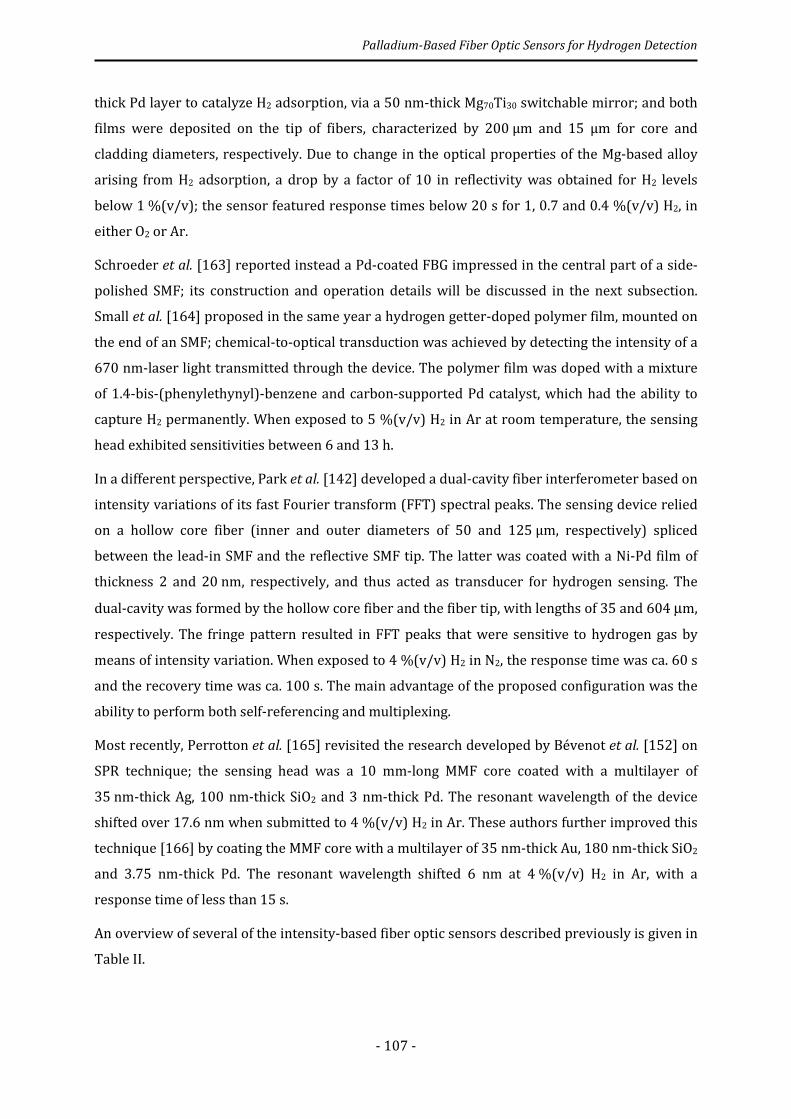
Palladium-Based Fiber Optic Sensors for Hydrogen Detection
- 107 -
thick Pd layer to catalyze H2 adsorption, via a 50 nm-thick Mg70Ti30 switchable mirror; and both
films were deposited on the tip of fibers, characterized by 200 µm and 15 µm for core and
cladding diameters, respectively. Due to change in the optical properties of the Mg-based alloy
arising from H2 adsorption, a drop by a factor of 10 in reflectivity was obtained for H2 levels
below 1 %(v/v); the sensor featured response times below 20 s for 1, 0.7 and 0.4 %(v/v) H2, in
either O2 or Ar.
Schroeder et al. [163] reported instead a Pd-coated FBG impressed in the central part of a side-
polished SMF; its construction and operation details will be discussed in the next subsection.
Small et al. [164] proposed in the same year a hydrogen getter-doped polymer film, mounted on
the end of an SMF; chemical-to-optical transduction was achieved by detecting the intensity of a
670 nm-laser light transmitted through the device. The polymer film was doped with a mixture
of 1.4-bis-(phenylethynyl)-benzene and carbon-supported Pd catalyst, which had the ability to
capture H2 permanently. When exposed to 5 %(v/v) H2 in Ar at room temperature, the sensing
head exhibited sensitivities between 6 and 13 h.
In a different perspective, Park et al. [142] developed a dual-cavity fiber interferometer based on
intensity variations of its fast Fourier transform (FFT) spectral peaks. The sensing device relied
on a hollow core fiber (inner and outer diameters of 50 and 125 μm, respectively) spliced
between the lead-in SMF and the reflective SMF tip. The latter was coated with a Ni-Pd film of
thickness 2 and 20 nm, respectively, and thus acted as transducer for hydrogen sensing. The
dual-cavity was formed by the hollow core fiber and the fiber tip, with lengths of 35 and 604 µm,
respectively. The fringe pattern resulted in FFT peaks that were sensitive to hydrogen gas by
means of intensity variation. When exposed to 4 %(v/v) H2 in N2, the response time was ca. 60 s
and the recovery time was ca. 100 s. The main advantage of the proposed configuration was the
ability to perform both self-referencing and multiplexing.
Most recently, Perrotton et al. [165] revisited the research developed by Bévenot et al. [152] on
SPR technique; the sensing head was a 10 mm-long MMF core coated with a multilayer of
35 nm-thick Ag, 100 nm-thick SiO2 and 3 nm-thick Pd. The resonant wavelength of the device
shifted over 17.6 nm when submitted to 4 %(v/v) H2 in Ar. These authors further improved this
technique [166] by coating the MMF core with a multilayer of 35 nm-thick Au, 180 nm-thick SiO2
and 3.75 nm-thick Pd. The resonant wavelength shifted 6 nm at 4 %(v/v) H2 in Ar, with a
response time of less than 15 s.
An overview of several of the intensity-based fiber optic sensors described previously is given in
Table II.
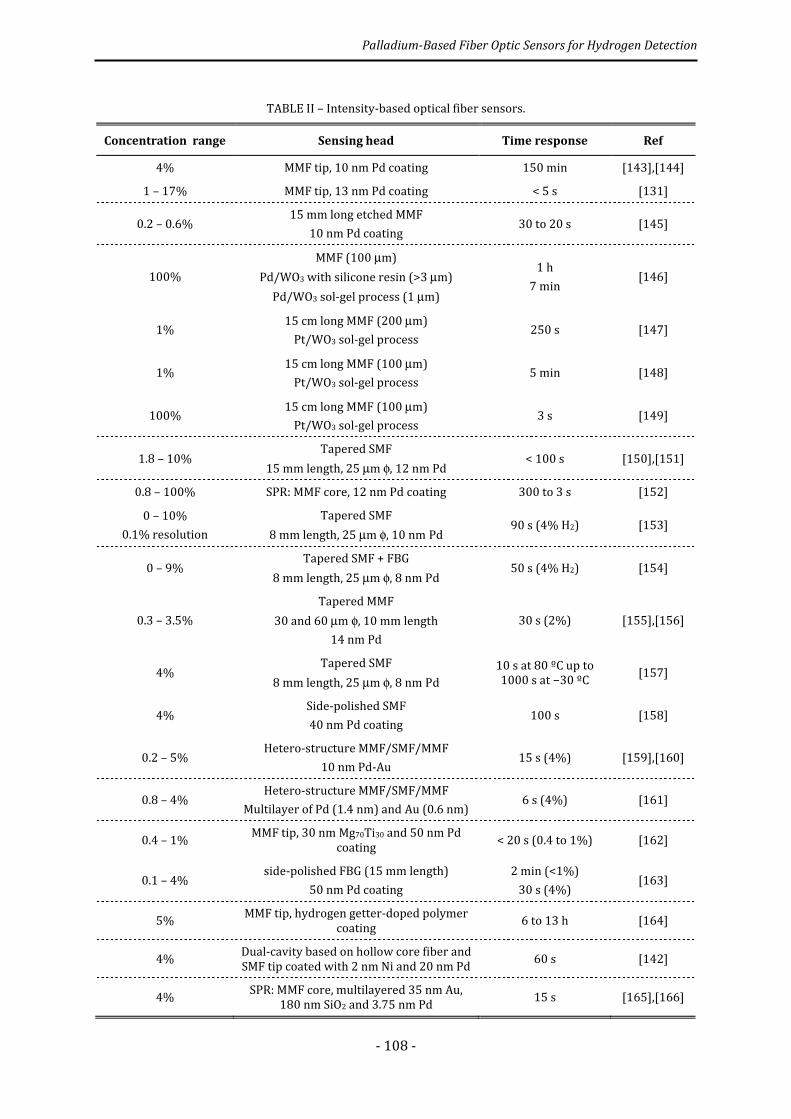
Palladium-Based Fiber Optic Sensors for Hydrogen Detection
- 108 -
TABLE II – Intensity-based optical fiber sensors.
Concentration range Sensing head Time response Ref
4% MMF tip, 10 nm Pd coating 150 min [143],[144]
1 – 17% MMF tip, 13 nm Pd coating < 5 s [131]
0.2 – 0.6% 15 mm long etched MMF
10 nm Pd coating 30 to 20 s [145]
100%
MMF (100 µm)
Pd/WO3 with silicone resin (>3 µm)
Pd/WO3 sol-gel process (1 µm)
1 h
7 min [146]
1% 15 cm long MMF (200 µm)
Pt/WO3 sol-gel process 250 s [147]
1% 15 cm long MMF (100 µm)
Pt/WO3 sol-gel process 5 min [148]
100% 15 cm long MMF (100 µm)
Pt/WO3 sol-gel process 3 s [149]
1.8 – 10% Tapered SMF
15 mm length, 25 µm φ, 12 nm Pd < 100 s [150],[151]
0.8 – 100% SPR: MMF core, 12 nm Pd coating 300 to 3 s [152]
0 – 10%
0.1% resolution
Tapered SMF
8 mm length, 25 µm φ, 10 nm Pd 90 s (4% H2) [153]
0 – 9% Tapered SMF + FBG
8 mm length, 25 µm φ, 8 nm Pd 50 s (4% H2) [154]
0.3 – 3.5%
Tapered MMF
30 and 60 µm φ, 10 mm length
14 nm Pd
30 s (2%) [155],[156]
4% Tapered SMF
8 mm length, 25 µm φ, 8 nm Pd 10 s at 80 ºC up to 1000 s at −30 ºC
[157]
4% Side-polished SMF
40 nm Pd coating 100 s [158]
0.2 – 5% Hetero-structure MMF/SMF/MMF
10 nm Pd-Au 15 s (4%) [159],[160]
0.8 – 4% Hetero-structure MMF/SMF/MMF
Multilayer of Pd (1.4 nm) and Au (0.6 nm) 6 s (4%) [161]
0.4 – 1% MMF tip, 30 nm Mg70Ti30 and 50 nm Pd
coating < 20 s (0.4 to 1%) [162]
0.1 – 4% side-polished FBG (15 mm length)
50 nm Pd coating
2 min (<1%)
30 s (4%) [163]
5% MMF tip, hydrogen getter-doped polymer
coating 6 to 13 h [164]
4% Dual-cavity based on hollow core fiber and SMF tip coated with 2 nm Ni and 20 nm Pd
60 s [142]
4% SPR: MMF core, multilayered 35 nm Au,
180 nm SiO2 and 3.75 nm Pd 15 s [165],[166]
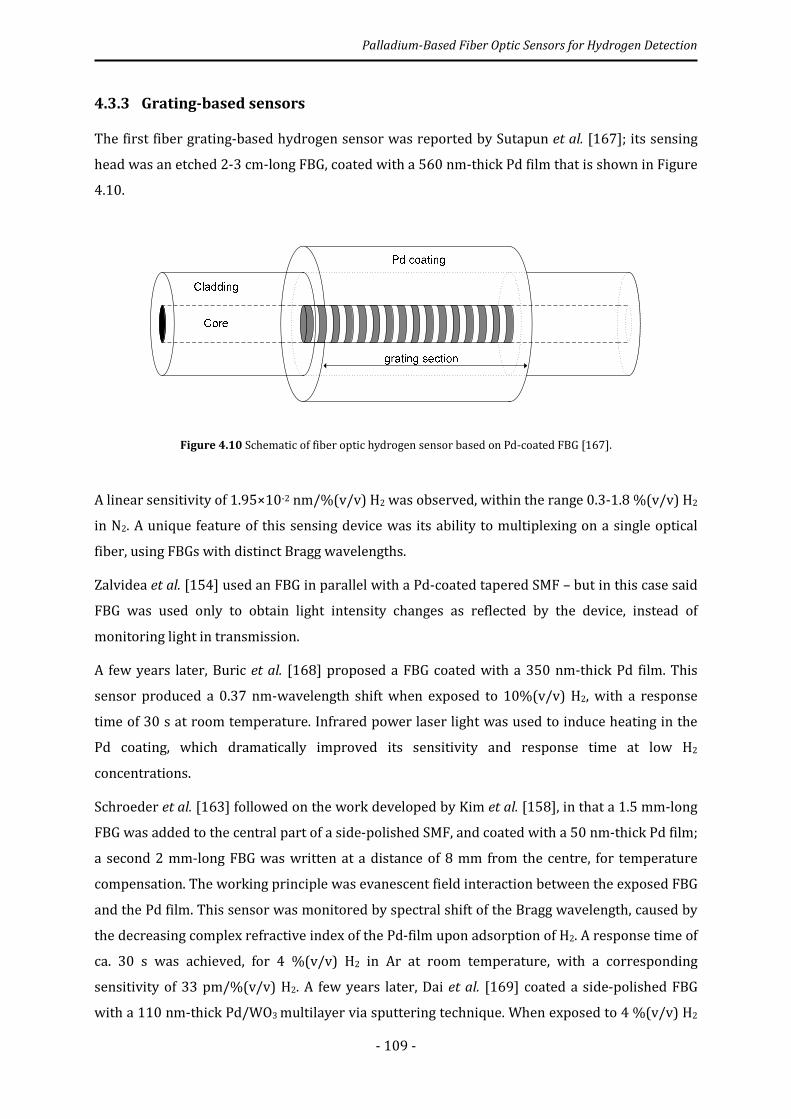
Palladium-Based Fiber Optic Sensors for Hydrogen Detection
- 109 -
4.3.3 Grating-based sensors
The first fiber grating-based hydrogen sensor was reported by Sutapun et al. [167]; its sensing
head was an etched 2-3 cm-long FBG, coated with a 560 nm-thick Pd film that is shown in Figure
4.10.
Figure 4.10 Schematic of fiber optic hydrogen sensor based on Pd-coated FBG [167].
A linear sensitivity of 1.95×10⁻² nm/%(v/v) H2 was observed, within the range 0.3-1.8 %(v/v) H2
in N2. A unique feature of this sensing device was its ability to multiplexing on a single optical
fiber, using FBGs with distinct Bragg wavelengths.
Zalvidea et al. [154] used an FBG in parallel with a Pd-coated tapered SMF – but in this case said
FBG was used only to obtain light intensity changes as reflected by the device, instead of
monitoring light in transmission.
A few years later, Buric et al. [168] proposed a FBG coated with a 350 nm-thick Pd film. This
sensor produced a 0.37 nm-wavelength shift when exposed to 10%(v/v) H2, with a response
time of 30 s at room temperature. Infrared power laser light was used to induce heating in the
Pd coating, which dramatically improved its sensitivity and response time at low H2
concentrations.
Schroeder et al. [163] followed on the work developed by Kim et al. [158], in that a 1.5 mm-long
FBG was added to the central part of a side-polished SMF, and coated with a 50 nm-thick Pd film;
a second 2 mm-long FBG was written at a distance of 8 mm from the centre, for temperature
compensation. The working principle was evanescent field interaction between the exposed FBG
and the Pd film. This sensor was monitored by spectral shift of the Bragg wavelength, caused by
the decreasing complex refractive index of the Pd-film upon adsorption of H2. A response time of
ca. 30 s was achieved, for 4 %(v/v) H2 in Ar at room temperature, with a corresponding
sensitivity of 33 pm/%(v/v) H2. A few years later, Dai et al. [169] coated a side-polished FBG
with a 110 nm-thick Pd/WO3 multilayer via sputtering technique. When exposed to 4 %(v/v) H2
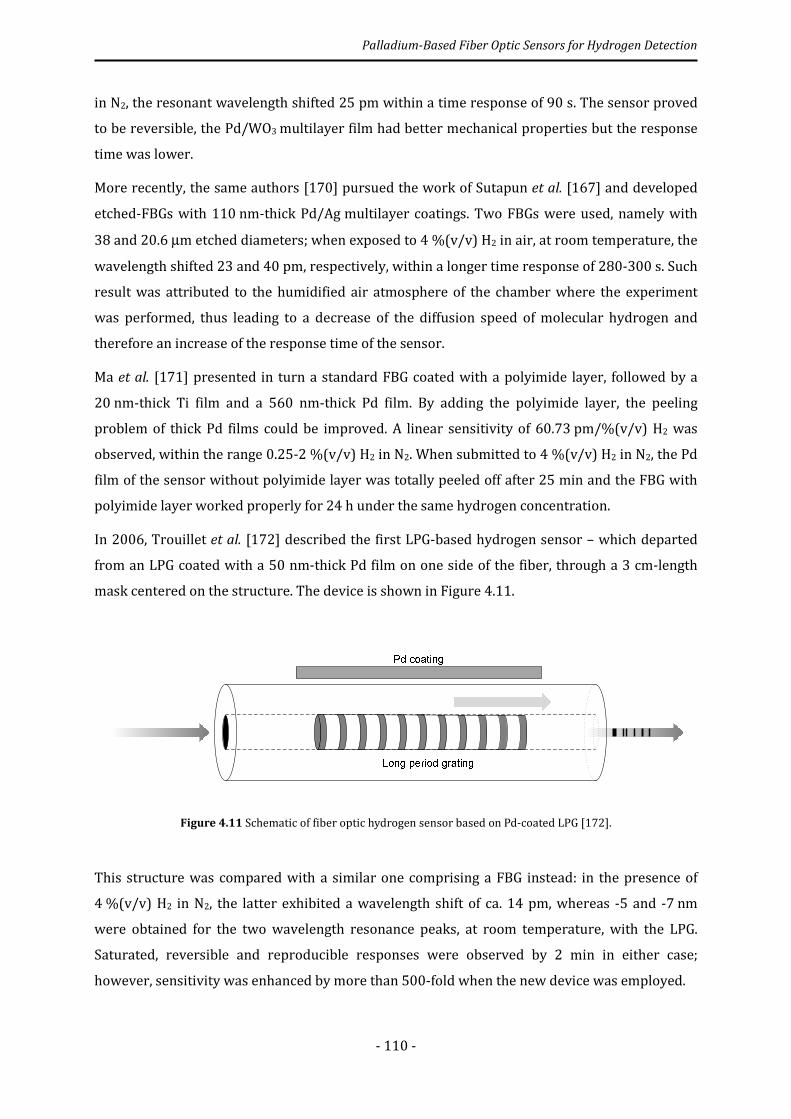
Palladium-Based Fiber Optic Sensors for Hydrogen Detection
- 110 -
in N2, the resonant wavelength shifted 25 pm within a time response of 90 s. The sensor proved
to be reversible, the Pd/WO3 multilayer film had better mechanical properties but the response
time was lower.
More recently, the same authors [170] pursued the work of Sutapun et al. [167] and developed
etched-FBGs with 110 nm-thick Pd/Ag multilayer coatings. Two FBGs were used, namely with
38 and 20.6 µm etched diameters; when exposed to 4 %(v/v) H2 in air, at room temperature, the
wavelength shifted 23 and 40 pm, respectively, within a longer time response of 280-300 s. Such
result was attributed to the humidified air atmosphere of the chamber where the experiment
was performed, thus leading to a decrease of the diffusion speed of molecular hydrogen and
therefore an increase of the response time of the sensor.
Ma et al. [171] presented in turn a standard FBG coated with a polyimide layer, followed by a
20 nm-thick Ti film and a 560 nm-thick Pd film. By adding the polyimide layer, the peeling
problem of thick Pd films could be improved. A linear sensitivity of 60.73 pm/%(v/v) H2 was
observed, within the range 0.25-2 %(v/v) H2 in N2. When submitted to 4 %(v/v) H2 in N2, the Pd
film of the sensor without polyimide layer was totally peeled off after 25 min and the FBG with
polyimide layer worked properly for 24 h under the same hydrogen concentration.
In 2006, Trouillet et al. [172] described the first LPG-based hydrogen sensor – which departed
from an LPG coated with a 50 nm-thick Pd film on one side of the fiber, through a 3 cm-length
mask centered on the structure. The device is shown in Figure 4.11.
Figure 4.11 Schematic of fiber optic hydrogen sensor based on Pd-coated LPG [172].
This structure was compared with a similar one comprising a FBG instead: in the presence of
4 %(v/v) H2 in N2, the latter exhibited a wavelength shift of ca. 14 pm, whereas -5 and -7 nm
were obtained for the two wavelength resonance peaks, at room temperature, with the LPG.
Saturated, reversible and reproducible responses were observed by 2 min in either case;
however, sensitivity was enhanced by more than 500-fold when the new device was employed.
Palladium-Based Fiber Optic Sensors for Hydrogen Detection
- 111 -
As already reported in interferometric-based optical fiber sensors, Kim et al. [139] used an
LPG-based Mach-Zehnder interferometer – in which a 2.3 nm-shift of the interference peak was
observed within 8 min, followed by signal saturation, in the presence of 4 %(v/v) H2 in N2.
Wei et al. [173] presented an LPG coated with a 70 nm-thick Pd film – which exhibited an
enhanced performance: when the sensor was exposed to 4 %(v/v) H2 in He, the response time
did not exceeded 70 s, at both 30 and 100 °C, with corresponding wavelength shifts of ca. -4 and
-0.7 nm.
Later, Tang et al. [174] developed an H2 sensor based on an LPG coated with a proton-
conducting perovskite oxide thin film – designed for high-temperature, in situ measurement of
bulk hydrogen in fossil- and biomass-derived syngas. In this case, the long period grating was
coated with a 500 nm-thick perovskite oxide film. The sensing mechanism was based on
monitoring of the resonant wavelength, which was a function of the refractive index of said film.
All tests were performed at 500 °C, under atmospheric pressure; and the aforementioned sensor
was exposed to H2 concentrations ranging from 0 to 80 %(v/v), thus showing a maximum
wavelength variation of 14 nm.
More recently, research on Pd-coated LPGs was also pursued by Kim et al. [175]; an LPG sensor
was developed with 400 µm of grating period and 40 mm in length and coated over one side of
the cladding surface with a Pd layer (30, 50, and 70 nm). When exposed to 4 %(v/v) H2 in N2, at
room temperature, the sensor with 70 nm-thick Pd coating presented a maximum wavelength
shift of 7.5 nm within a response time of 176 s.
An overview of the several types of fiber grating-based optical fiber sensors for hydrogen
detection is depicted in Table III.

Palladium-Based Fiber Optic Sensors for Hydrogen Detection
- 112 -
TABLE III – Grating-based optical fiber sensors.
Concentration range Sensing head Time response Ref
0.3 – 1.8% 20 mm long etched FBG
560 nm Pd coating -- [167]
0 – 9% Tapered SMF + FBG
8 mm length, 25 µm φ, 8 nm Pd 50 s (4% H2) [154]
0.5% FBG, 350 nm Pd coating < 10 s [168]
0.1 – 4% Side-polished FBG (15 mm length)
50 nm Pd coating
2 min (<1%)
30 s (4%) [163]
4% Side-polished FBG
110 nm-thick Pd/WO3 multilayer 90 s [169]
4% Etched FBGs, 38 and 20.6 µm φ
110 nm-thick Pd/Ag multilayer 280-300 s [170]
0.25 – 2% FBG, polyimide layer + 20 nm Ti +
560 nm Pd coating -- [171]
4% FBG and LPG
50 nm Pd coating 2 min [172]
4% LPG Mach-Zehnder interferometer
50 nm Pd coating 8 min [139]
0 – 16% LPG, 70 nm Pd coating < 70 s (4%) [173]
0 – 80% LPG, SCZY (500 nm) coating -- [174]
4% LPG, 70 nm Pd coating 176 s [175]
4.3.4 Comparison between different sensing approaches
Other works aimed at comparing different Pd-coated sensing devices have been reported; e.g.
differences in performance between a bulk Pd-film, a Pd-coated FBG and a long length SMF, for
testing nuclear waste repositories, were studied by Aleixandre et al. [176]; the FBG device
exhibited the best sensing performance. Three distinct structures, viz. a semicircular cross-
section Pd-tube with two FBGs, an optical fiber Fabry-Perot interferometer and a Pd-coated LPG,
were also studied by Maier et al. [177],[178] – with the latter leading to the best sensing
response.
Finally, it is instructive to overview all sensors described to date in the literature – as pooled
together in Figure 4.12 to aid in comparison of the two most meaningful performance indicators,
viz. solute sensitivity and response time.
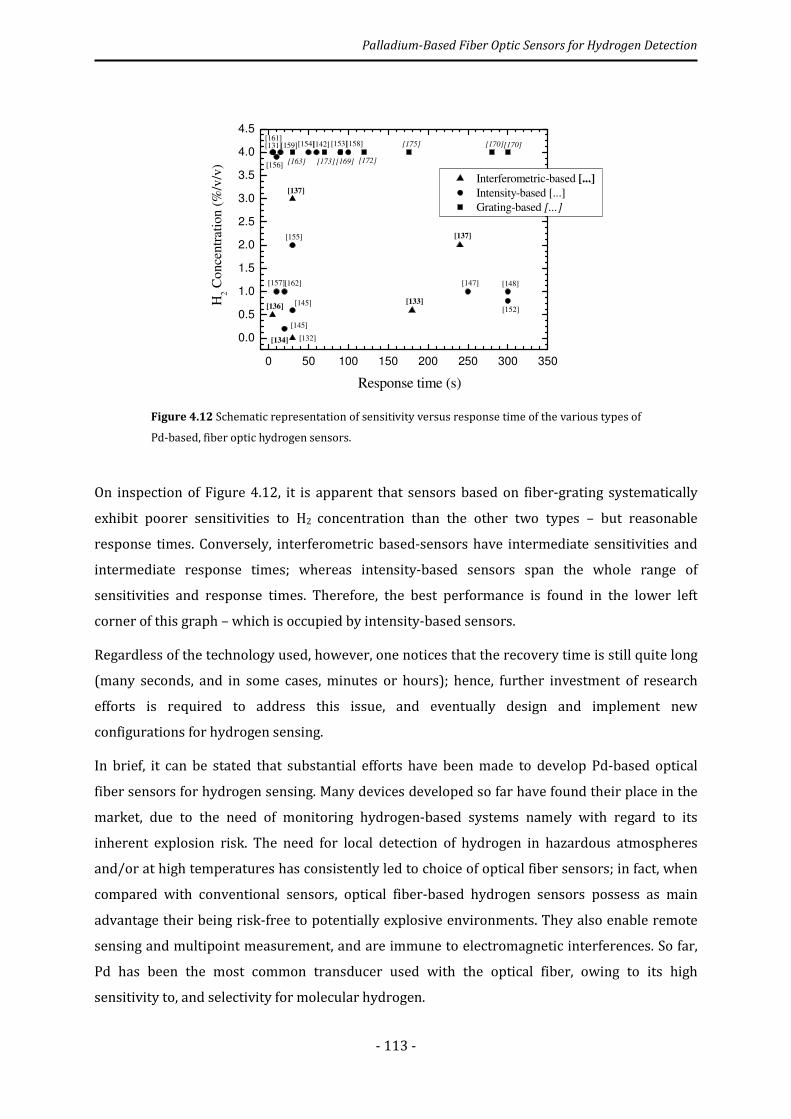
Palladium-Based Fiber Optic Sensors for Hydrogen Detection
- 113 -
Figure 4.12 Schematic representation of sensitivity versus response time of the various types of
Pd-based, fiber optic hydrogen sensors.
On inspection of Figure 4.12, it is apparent that sensors based on fiber-grating systematically
exhibit poorer sensitivities to H2 concentration than the other two types – but reasonable
response times. Conversely, interferometric based-sensors have intermediate sensitivities and
intermediate response times; whereas intensity-based sensors span the whole range of
sensitivities and response times. Therefore, the best performance is found in the lower left
corner of this graph – which is occupied by intensity-based sensors.
Regardless of the technology used, however, one notices that the recovery time is still quite long
(many seconds, and in some cases, minutes or hours); hence, further investment of research
efforts is required to address this issue, and eventually design and implement new
configurations for hydrogen sensing.
In brief, it can be stated that substantial efforts have been made to develop Pd-based optical
fiber sensors for hydrogen sensing. Many devices developed so far have found their place in the
market, due to the need of monitoring hydrogen-based systems namely with regard to its
inherent explosion risk. The need for local detection of hydrogen in hazardous atmospheres
and/or at high temperatures has consistently led to choice of optical fiber sensors; in fact, when
compared with conventional sensors, optical fiber-based hydrogen sensors possess as main
advantage their being risk-free to potentially explosive environments. They also enable remote
sensing and multipoint measurement, and are immune to electromagnetic interferences. So far,
Pd has been the most common transducer used with the optical fiber, owing to its high
sensitivity to, and selectivity for molecular hydrogen.
0 50 100 150 200 250 300 350
0.0
0.5
1.0
1.5
2.0
2.5
3.0
3.5
4.0
4.5[161]
[169]
[142] [170][170][175]
Interferometric-based [...]
Intensity-based [...]
Grating-based [...]
[172][173][163]
[162]
[159] [158]
[157]
[156]
[155]
[148]
[154] [153]
[152]
[131]
[145]
[145]
[132]
[137]
[147]
[137]
[134]
[133]
H2 C
once
ntr
atio
n (
%/v
/v)
Response time (s)
[136]
Palladium-Based Fiber Optic Sensors for Hydrogen Detection
- 114 -
Pd-based optical fiber sensors have been specifically aimed at H2 detection below LEL; however,
this type of sensors has been targeted for other applications, e.g. monitoring H2 leaks in fuel cells
in cars and aerospace applications, measuring H2 in harsh environments where concentrations
are of the order of ppm, or controlling H2 under extreme temperatures ranging from -100 to
500 °C.
Meanwhile, other fiber optic-based sensors have been developed, either using different metals
or alloys as transducers, or resorting to distinct deposition techniques (viz. sol-gel process), and
regarding the type of sensing head used; some have met with reasonable good performances. Pd
alloys using Ti and Au were developed toward reduction in response time, and increasing the
stability and durability of the hydrogen sensor. Also, transition metal oxides such as TiO2, NiOx
and WO3 were used to provide good repeatability of cyclic hydrogen changes and to enhance the
stability of the sensor. Optical fiber sensors using such novel materials as Perovskite-Type Oxide
thin films has also been subject of investigation, for detection of hydrogen in high temperature
environments.
4.4 Hydrogen Sensing based on Pd-coated Tapered-FBG Fabricated
by DUV Femtosecond Laser Technique
4.4.1 Introduction
The FBG is a well-known successful technology bearing a wide range of applications. An
attracting focus of research has been on FBG inscription on fiber tapers due to the high
sensitivity to the surrounding medium. Several techniques have been used to fabricate these
devices, based on the utilization of optical sources such as femtosecond laser, [17],[179] 248 nm
KrF excimer laser [180], 193 nm ArF excimer laser [181] among others [182].
As referred to previously, the appearance of the FBG structure gave rise to a new series of
Pd-based optical fiber devices for H2 sensing [183]. Following this path, an optical fiber sensor
based on a tapered-FBG coated with a thin layer of Pd was developed in this PhD programme.
The FBG was written in a tapered optical fiber by means of deep ultraviolet (DUV) femtosecond
laser technology. The sensing head was tested for hydrogen concentration, and temperature
compensation was performed. The influence of the Pd-coating on tapered and standard FBGs,
when submitted to temperature changes, was also studied.
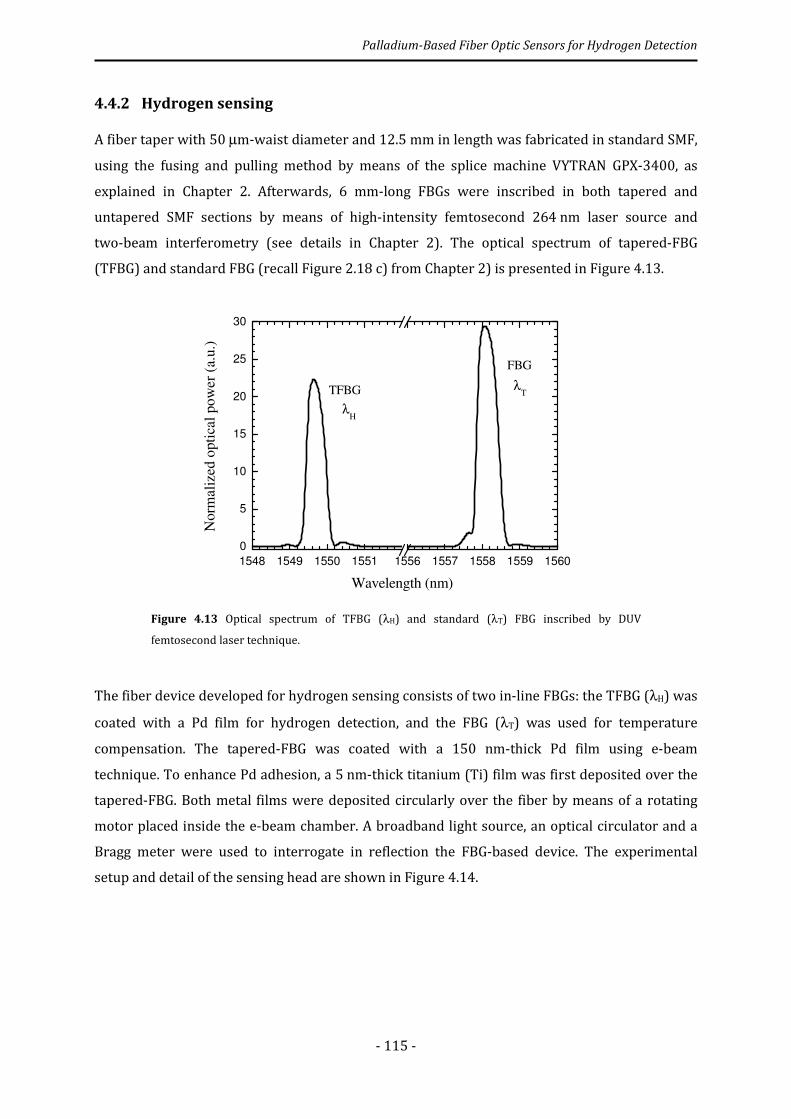
Palladium-Based Fiber Optic Sensors for Hydrogen Detection
- 115 -
4.4.2 Hydrogen sensing
A fiber taper with 50 µm-waist diameter and 12.5 mm in length was fabricated in standard SMF,
using the fusing and pulling method by means of the splice machine VYTRAN GPX-3400, as
explained in Chapter 2. Afterwards, 6 mm-long FBGs were inscribed in both tapered and
untapered SMF sections by means of high-intensity femtosecond 264 nm laser source and
two-beam interferometry (see details in Chapter 2). The optical spectrum of tapered-FBG
(TFBG) and standard FBG (recall Figure 2.18 c) from Chapter 2) is presented in Figure 4.13.
Figure 4.13 Optical spectrum of TFBG (λH) and standard (λT) FBG inscribed by DUV
femtosecond laser technique.
The fiber device developed for hydrogen sensing consists of two in-line FBGs: the TFBG (λH) was
coated with a Pd film for hydrogen detection, and the FBG (λT) was used for temperature
compensation. The tapered-FBG was coated with a 150 nm-thick Pd film using e-beam
technique. To enhance Pd adhesion, a 5 nm-thick titanium (Ti) film was first deposited over the
tapered-FBG. Both metal films were deposited circularly over the fiber by means of a rotating
motor placed inside the e-beam chamber. A broadband light source, an optical circulator and a
Bragg meter were used to interrogate in reflection the FBG-based device. The experimental
setup and detail of the sensing head are shown in Figure 4.14.
1548 1549 1550 1551 1556 1557 1558 1559 1560
0
5
10
15
20
25
30
λT
FBG
TFBG
Norm
aliz
ed o
pti
cal
po
wer
(a.
u.)
Wavelength (nm)
λH
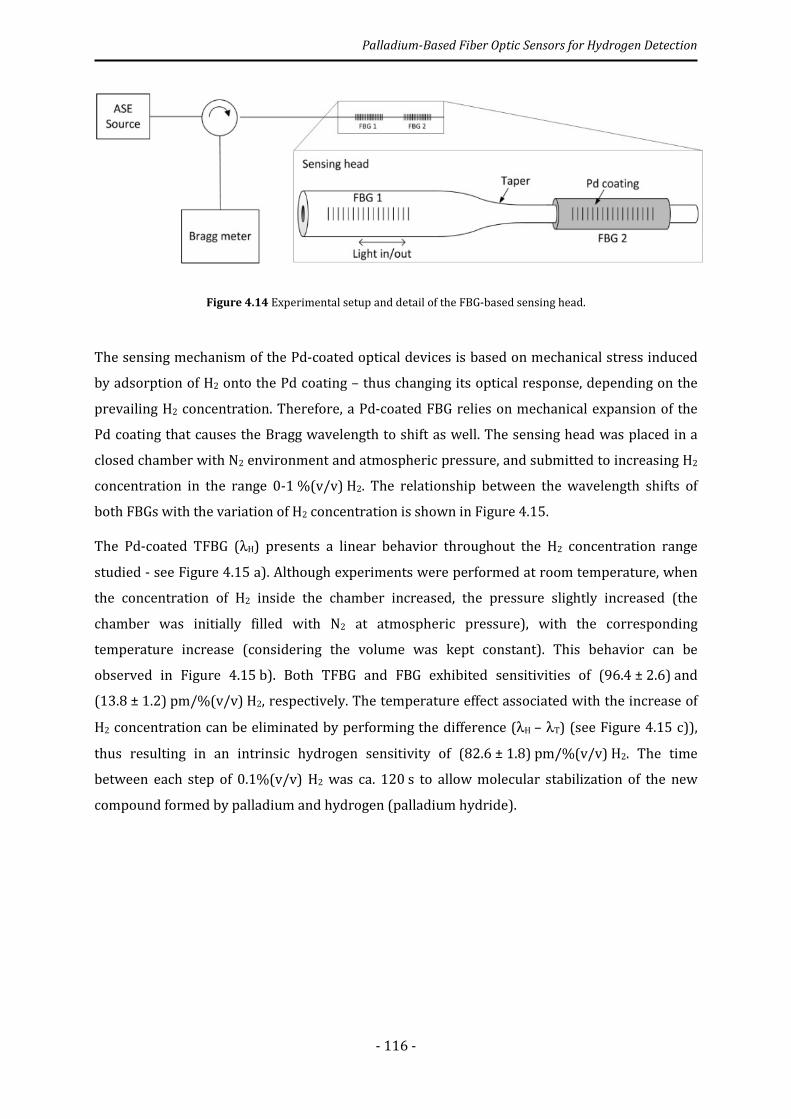
Palladium-Based Fiber Optic Sensors for Hydrogen Detection
- 116 -
Figure 4.14 Experimental setup and detail of the FBG-based sensing head.
The sensing mechanism of the Pd-coated optical devices is based on mechanical stress induced
by adsorption of H2 onto the Pd coating – thus changing its optical response, depending on the
prevailing H2 concentration. Therefore, a Pd-coated FBG relies on mechanical expansion of the
Pd coating that causes the Bragg wavelength to shift as well. The sensing head was placed in a
closed chamber with N2 environment and atmospheric pressure, and submitted to increasing H2
concentration in the range 0-1 %(v/v) H2. The relationship between the wavelength shifts of
both FBGs with the variation of H2 concentration is shown in Figure 4.15.
The Pd-coated TFBG (λH) presents a linear behavior throughout the H2 concentration range
studied - see Figure 4.15 a). Although experiments were performed at room temperature, when
the concentration of H2 inside the chamber increased, the pressure slightly increased (the
chamber was initially filled with N2 at atmospheric pressure), with the corresponding
temperature increase (considering the volume was kept constant). This behavior can be
observed in Figure 4.15 b). Both TFBG and FBG exhibited sensitivities of (96.4 ± 2.6) and
(13.8 ± 1.2) pm/%(v/v) H2, respectively. The temperature effect associated with the increase of
H2 concentration can be eliminated by performing the difference (λH – λT) (see Figure 4.15 c)),
thus resulting in an intrinsic hydrogen sensitivity of (82.6 ± 1.8) pm/%(v/v) H2. The time
between each step of 0.1%(v/v) H2 was ca. 120 s to allow molecular stabilization of the new
compound formed by palladium and hydrogen (palladium hydride).
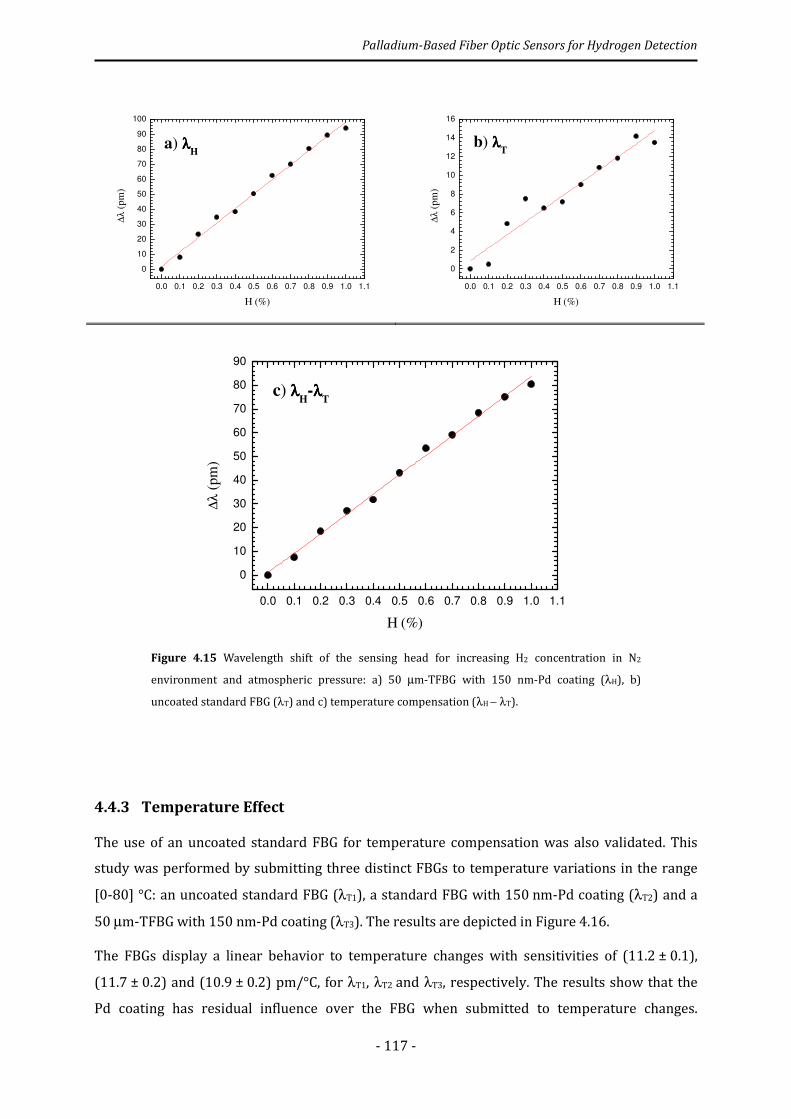
Palladium-Based Fiber Optic Sensors for Hydrogen Detection
- 117 -
Figure 4.15 Wavelength shift of the sensing head for increasing H2 concentration in N2
environment and atmospheric pressure: a) 50 µm-TFBG with 150 nm-Pd coating (λH), b)
uncoated standard FBG (λT) and c) temperature compensation (λH − λT).
4.4.3 Temperature Effect
The use of an uncoated standard FBG for temperature compensation was also validated. This
study was performed by submitting three distinct FBGs to temperature variations in the range
[0-80] °C: an uncoated standard FBG (λT1), a standard FBG with 150 nm-Pd coating (λT2) and a
50 µm-TFBG with 150 nm-Pd coating (λT3). The results are depicted in Figure 4.16.
The FBGs display a linear behavior to temperature changes with sensitivities of (11.2 ± 0.1),
(11.7 ± 0.2) and (10.9 ± 0.2) pm/°C, for λT1, λT2 and λT3, respectively. The results show that the
Pd coating has residual influence over the FBG when submitted to temperature changes.
0.0 0.1 0.2 0.3 0.4 0.5 0.6 0.7 0.8 0.9 1.0 1.1
0
10
20
30
40
50
60
70
80
90
100
a) λλλλH
∆λ (
pm
)
H (%)
0.0 0.1 0.2 0.3 0.4 0.5 0.6 0.7 0.8 0.9 1.0 1.1
0
2
4
6
8
10
12
14
16
b) λλλλT
∆λ (
pm
)
H (%)
0.0 0.1 0.2 0.3 0.4 0.5 0.6 0.7 0.8 0.9 1.0 1.1
0
10
20
30
40
50
60
70
80
90
c) λλλλH-λλλλ
T
∆λ (
pm
)
H (%)

Palladium-Based Fiber Optic Sensors for Hydrogen Detection
- 118 -
Therefore, in the proposed sensing head, the uncoated standard FBG used for temperature
compensation does not need the Pd coating to compensate for the thermal expansion of the Pd
film coated over the TFBG. In fact, the dominant thermal expansion comes from the silica of the
optical fiber. This is somehow expected because the thickness of the Pd coating is much smaller
than the optical fiber dimensions. Further enhancement of the proposed sensing head can be
obtained via reduction of the fiber cross-section by means of taper technology – or by increasing
the thickness of the Pd film.
Figure 4.16 Temperature sensitivity of uncoated standard FBG (λT1), standard FBG with 150
nm-Pd coating (λT2) and 50 µm-TFBG with 150 nm-Pd coating (λT3).
4.1 Conclusions
Over the latest 30 years, a variety of configurations for hydrogen sensing have been tested and
successfully demonstrated. As shown in this chapter, the different types of Pd-based optical
fiber sensors can be divided into three main groups: interferometric-based, intensity-based and
fiber grating-based fiber optic sensors. Intensity-based devices in general have shown better
time responses. Several sensing structures were developed, ranging from fiber tip to in-line fiber
devices, either for single-point or multipoint hydrogen monitoring. In particular, MMF-based
configurations have proven attractive sensing devices, owing to their good performance and
simplicity, associated with a low cost fabrication. Tapered/etched fiber structures tend to be
more fragile due to their reduced sensing area while fiber tip-based sensors possess long-term
stability. Nevertheless, intensity-based sensors for hydrogen detection have shown overall an
0 10 20 30 40 50 60 70 80
1550.7
1551.0
1551.3
1551.6
1551.9
1552.2
1552.5
1552.8
1553.1
λT1
: FBG (no Pd coating)
λT2
: FBG (150 nm Pd coating)
λT3
: 50µm-TFBG (150 nm Pd coating)
Wav
elen
gth
(nm
)
∆T (ºC)

Palladium-Based Fiber Optic Sensors for Hydrogen Detection
- 119 -
excellent repeatability. On the other hand, interferometric-based sensors are potentially more
sensitive – fiber Fabry-Perot devices have indeed shown short time responses, with the
possibility of use as single-point sensors because of their small dimensions. However, these
sensors are more complex structures, and often require thermal isolation and high stability to
ensure good sensing performance. Fiber grating-based sensors are robust structures and quite
reproducible, and exhibit the unique advantage that they can be multiplexed. In particular, FBGs
usually require etching to enhance sensitivity, which in turn may reduce mechanical strength.
On the other hand, LPGs have a high stability for hydrogen detection, but with the disadvantage
of having long response times.
Due to the high potential of grating-based sensors for hydrogen detection, an optical fiber probe
sensor relying on a TFBG was developed within the scope of this PhD programme. The FBG was
written in a 50 µm-diameter tapered optical fiber by means of DUV femtosecond laser
technology, and coated with a 150 nm-thick Pd film. A second FBG was written in the
125 µm-fiber region for temperature compensation. Hydrogen concentration was detected in
the range 0-1 %(v/v) H2 at room temperature, and a maximum sensitivity of 82.6 pm/%(v/v) H2
was attained. Experiments have proven reproducibility of the sensor, but with the drawback of
needing a Ti coating to provide Pd adhesion to the fiber. The Pd coating often peels and the
durability of Pd-based sensors is often weak. In this case, the FBG sensor has shown good
repeatability of results, and a maximum response time was estimated as ca. 2 min. Other
features of the developed sensing head are the fiber probe configuration and temperature
compensation – which can be taken advantage of in specific applications, such as biochemical
processes where H2 concentration is to be measured.

- 120 -

- 121 -
5
New Advances in Fiber Refractometric Sensors
5.1 Introduction
Optical fiber based-refractometric sensors have been extensively studied due to the capability of
offering miniaturization, high degree of integration, and remote sensing. Over the years, novel
fibers and configurations have allowed the development of new refractometric sensors. Those
include Bragg grating structures and long period gratings, biconical tapered-fibers, surface
plasmon resonance (SPR), multimode interference and in a large spectrum of standard and
microstructured optical fiber-based configurations [184]. The low performance or the
complexity of sensor configurations gave rise to a new series of optical fiber-based structures for
refractive index sensing. Several distinct layouts have been proposed in recent years, either
relying on not conventional configurations and/or novel concepts, which opened new paths to
refractometric sensors.
In this Chapter areview on optical fiber refractometers is firstly presented, relying only in the
most recent and significant results provided by SPR-sensors, microfiber ring resonators,
whispering gallery modes, techniques based on cavity ringdown, and Fabry-Perot (FP)
interferometric configurations. Following, two distinct structures are presented for
refractometric sensing, namely with chaotic propagation by means of a D-shaped fiber and high-
finesse FP interferometry. The ability to use the FP sensor for gas sensing is also discussed.
5.2 Recent Developments on Optical Fiber-based Refractometers
Since its discovery, SPR has been a standard technique used for a huge variety of chemical
sensors and biosensors [185]. Plasmon excitation strongly depends on the refractive index (RI)
of the surrounding medium, and, in that sense, all these sensors can be considered to be
refractometers. Optical fiber based-SPR sensors have been extensively studied due to the high
potential of offering high performance and sensitivity to the surrounding medium at stake. In
New Advances in Fiber Refractometric Sensors
- 122 -
fact, numerical studies have given quite generous results; so far, simulation results over a small
solid core Bragg fiber-based SPR sensor reported the highest sensitivity to RI, ca. 12000 nm/RIU
[186]. In practice, many efforts have been made to reach high sensitivity results. In 2008, Kanso
et al. [187] developed a tapered multimode fiber (MMF) coated with a thin film of gold (Au); the
sensor provided a maximum RI sensitivity of ca. 3000 nm/RIU in the range 1.3335-1.4018.
Later, a D-shaped singlemode fiber (SMF) coated with Au in the flat top was presented [188]; in
the RI range of 1.3481-1.42 a sensitivity of 1938 nm/RIU was achieved. Cennamo et al. [189]
used a D-shaped plastic optical fiber coated with Au that provided a maximum RI sensitivity of
2533 nm/RIU in the range of 1.332-1.418. Recently, Srivastava et al. [26] developed a
taper-based Mach-Zehnder interferometer (MZI) coated with Au which provided the highest
sensitivity achieved so far, over 3500 nm/RIU in the RI range of 1.335-1.38. The SPR technique
also offers a large dispersion of the detection limit, ranging from 10-3 to 10-7 RIU, depending on
the geometries and configurations chosen.
Optical ring resonators have emerged as a new sensing technology for highly sensitive detection
of analytes in liquid or gas. One distinction of this technique is that the resonant light detects RI
changes with the analyte near the resonator surface, which is not necessarily the case with other
means of RI detection. Despite the small physical size, the ring resonator has an effective
interaction length of a few tens of centimeters or even longer while using less analyte. Although
numerical studies indicate the potential of said type of sensor, most of the proposed
configurations are complex and far from achieving the predicted results. For instance, a fiber coil
resonator may achieve an RI sensitivity as high as 1000 nm/RIU if a nano-fiber with 600 nm in
diameter is used [190]. While experimentally, Xu et al. [191] developed a fiber coil resonator
with a 2.5 µm-diameter microfiber and a sensitivity of 40 nm/RIU in the RI range of 1.345-1.349
was indeed attained. Simulations over a nanowire loop resonator embedded in a low-index
polymer resulted in a maximum sensitivity to RI of 700 nm/RIU [192]. In practice, Guo et al.
[193] reported a copper-rod supported microfiber loop resonator which provided a resolution
of 1.8 µ 10−5 RIU and a maximum sensitivity of ca. 110 nm/RIU in the RI range of 1.32-1.42 was
achieved. In a different perspective, Sumetsky et al. [194] presented results of a liquid-core
optical ring resonator to measure RI in the high range of 1.390-1.606; a sensitivity of
800 nm/RIU was attained. Recently, Oates et al. [195] used a liquid-core ring resonator with two
tapered fiber tips placed on opposite sides of the capillary to measure RI; in the RI range of
1.3432-1.3439, a maximum sensitivity of ca. 616 nm/RIU was obtained.
Optical resonators based on a fused silica microsphere rely on whispering gallery modes (WGM)
and possess a strong light-matter interaction that makes said technique a very promising
candidate for the development of highly sensitive miniaturized label-free bio/chemical sensors.
New Advances in Fiber Refractometric Sensors
- 123 -
However, coupling light to the microsphere is difficult to achieve and usually is associated to
large losses. Even so, some experiments have been performed. In 2005, Hanumegowda et al.
[196] developed a fused silica microsphere coupled to an angle-polished fiber prism which
presented a sensitivity of ca. 30 nm/RIU and a detection limit of 3 µ 10−7 RIU. A few years later,
Wang et al. [197] successfully demonstrated chemical vapor detection with a porous-wall hollow
glass microsphere, either using different vapor concentrations or different chemical vapors.
Most recently, Zhi et al. [198] reported the use of microspheres coated with silicon quantum
dots for RI sensing. A microsphere was made by melting the end tip of an SMF and coated with
quantum dots. A maximum sensitivity of 50 nm/RIU and resolution in the order of 10-4 RIU was
achieved for a double quantum dot coating.
Cavity ringdown spectroscopy (CRDS) is a well-known technology, commonly applied to real-
time chemical analysis. The evolution of the cavity ringdown (CRD) technique led to greatly
diversified configurations, all of which relying on high-reflectivity mirror resonant cavity in bulk
optics. On the other hand, the optical fiber CRD using a fiber loop as the ringdown cavity has
emerged as a successful replacement technology of the high-reflectivity cavity-based CRDS
techniques. Only in the past few years, fiber loop CRD has been used for RI sensing [199]. In
2008, Ni et al. [200] used an LPG as the cavity resonator in the fiber loop and studied the
ringdown time of the CRD and LPG transmission loss with RI changes of the external medium.
Results indicated a linear response in the RI range of 1.35–1.43 where a decay of -7.16 dB was
observed, corresponding to a sensitivity of -89 dB/RIU. Later, a tilted FBG was used instead of
the LPG as an RI sensing element, as shown by Zhou et al. [201]. Maximum sensitivity and
resolution of 154 μs/RIU and 6.5 µ 10-6 RIU, respectively, could be achieved in the high RI range.
The same research group also developed a microchannel, with ca. 4.5 µm in diameter, in the
fiber loop by femtosecond laser [202]. The CRD was then used to measure RI of gels infused into
the microchannel. The ring down time disclosed an RI sensitivity up to 300 µs/RIU in the range
1.37-1.448 and a resolution of 1.4 µ 10-4 RIU was obtained. Recently, Wong et al. [203]
demonstrated a CRD-based refractometer by integrating a photonic crystal fiber (PCF) MZI into
a cavity ringdown fiber loop. A maximum resolution of 7.8 µ 10-5 RIU was obtained.
Fiber Fabry-Pérot interferometers (FFPIs) have been widely used in a large range of applications
as they offer a number of desirable advantages such as high sensitivity, rapid response, large
measurement range, ability for multi-parameters measurement, among others. FFPIs are
commonly made with a sealed cavity and, as a result, their applications have been mainly limited
to the measurement of physical parameters. When the cavity is exposed to the external
environment, the FFPI can be used to measure RI changes that occur in said medium. However,
the FFPI is sensitive to environmental temperature change, leading to temperature cross-
New Advances in Fiber Refractometric Sensors
- 124 -
sensitivity for absolute measurement of RI. When used as a refractometer, the FFPI has the
unique advantage of constant sensitivity over a large dynamic range. In 2008, Rao et al. [204]
proposed an FFPI tip formed by a section of endlessly singlemode photonic crystal fiber and a
conventional SMF. The visibility variation with RI changes of the external medium in the range
1.33-1.45 provided a sensitivity of 4.59/RIU and a resolution of ca. 2 µ 10−5 RIU. Wei et al. [205]
produced in turn an FFPI based on a SMF with an open micro-notch cavity fabricated by
femtosecond laser micromachining. This sensor was able to detect RI variations of water with
increasing temperature; a sensitivity of 1163 nm/RIU was achieved. Ran et al. [206] used
instead an SMF with a circular hole at its center to determine RI variations; a maximum
resolution of 4 µ 10−5 RIU was attained. In a different perspective, a micrometric FFPI
refractometer based on an end-of-fiber polymer tip was reported in 2009 [207]. The RI
sensitivity was approximately 4650 deg/RIU in the range 1.333-1.405 and a resolution of
7.5 µ 10−4 RIU was obtained. Frazão et al. [208] also proposed an RI sensor for liquids by splicing
SMF to each end of a fragment of a suspended core fiber. A resolution of 7 µ 10−4 RIU was
obtained by monitoring the fringe visibility. Later, Gong et al. [209] developed a hybrid FFPI
based on the self-focusing effect of a graded-index MMF to measure RI; a maximum sensitivity of
160 dB/RIU was obtained. Kou et al. [210] produced in turn an FFPI based on ion beam
micromachined microcavity at the end of a tapered fiber. A sensitivity of 110 nm/RIU in liquid
was achieved. In 2011, Zhou et al. [211] developed an FFPI based on a microchannel inscribed
between two FBGs. For different microchannel widths, the device exhibited RI sensitivities of
9 nm/RIU and 1.1 nm/RIU in the range 1.43-1.49 and 1.3-1.7, respectively. Research has also
been focused in gas sensing due to successful performance of FFPI sensors to measure RI. These
works will be addressed in the last section of this Chapter has it is focused in that area of
research.
5.3 Sensing with a D-shaped Optical Fiber with Chaotic Propagation
5.3.1 Introduction
Chaotic systems are unpredictable, highly dependent on the initial conditions, but its output is
far from being random [212]. This characteristic states that extremely small changes in the
initial conditions of the system can result in significant variations of its output. This can be
regarded as good premise for sensing applications, since it may be the result of high sensitivity
to a certain parameter. However, little work has been carried out using chaos for sensing
purposes. So far, temperature and pressure sensing based on periodic chaos synchronization in
optical fiber ring resonator systems has been proposed [213]; numerical analysis over a chaotic
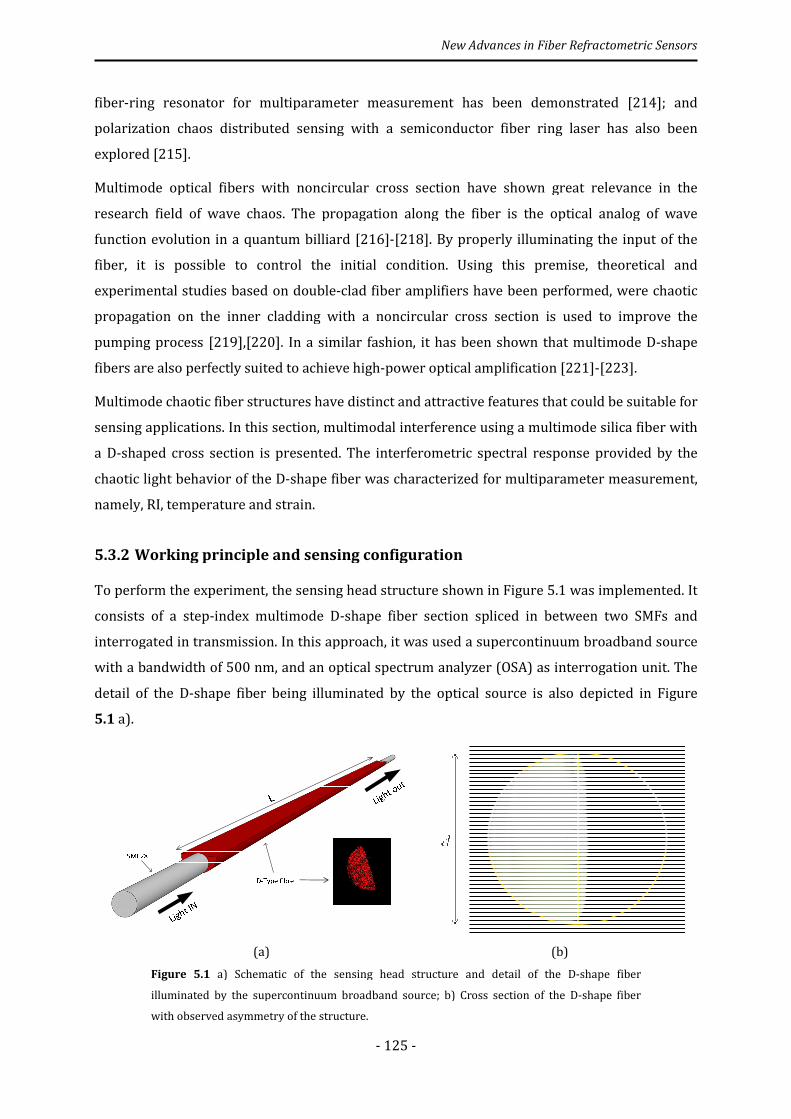
fiber-ring resonator for multiparameter measurement has been demonstrate
polarization chaos distributed sensing with a semiconductor fiber ring laser has also been
explored [215].
Multimode optical fibers with noncircular cross section have shown great relevance in the
research field of wave chaos. The propagation along the fiber is the optical analog of wave
function evolution in a quantum billiard
fiber, it is possible to control the initial condition. Using this premise, theoretical and
experimental studies based on double
propagation on the inner cladding with a noncircular cross section is used to improve the
pumping process [219],[220]. In a similar fashion, it has been shown that multimode D
fibers are also perfectly suited to achieve high
Multimode chaotic fiber structures have distinct and attractive features that could be sui
sensing applications. In this section, multimodal interference using a multimode silica fiber with
a D-shaped cross section is presented. The interferometric spectral response provided by the
chaotic light behavior of the D-
namely, RI, temperature and strain.
5.3.2 Working principle and sensing configuration
To perform the experiment, the sensing head structure shown in
consists of a step-index multimode D
interrogated in transmission. In this approach, it was used a supercontinuum broad
with a bandwidth of 500 nm, and an optical spectrum analyzer (OSA) as interrogation unit. The
detail of the D-shape fiber being illuminated by the optical source is also depicted in
5.1 a).
(a)
Figure 5.1 a) Schematic of the sensing head structure and detail of the D
illuminated by the supercontinuum broadband source; b) Cross section of the D
with observed asymmetry of the structure.
New Advances in Fiber Refractometric Sen
- 125 -
multiparameter measurement has been demonstrate
polarization chaos distributed sensing with a semiconductor fiber ring laser has also been
Multimode optical fibers with noncircular cross section have shown great relevance in the
research field of wave chaos. The propagation along the fiber is the optical analog of wave
quantum billiard [216]-[218]. By properly illuminating the input of the
fiber, it is possible to control the initial condition. Using this premise, theoretical and
experimental studies based on double-clad fiber amplifiers have been performed, were chaotic
propagation on the inner cladding with a noncircular cross section is used to improve the
. In a similar fashion, it has been shown that multimode D
fibers are also perfectly suited to achieve high-power optical amplification [221]
Multimode chaotic fiber structures have distinct and attractive features that could be sui
sensing applications. In this section, multimodal interference using a multimode silica fiber with
shaped cross section is presented. The interferometric spectral response provided by the
-shape fiber was characterized for multiparameter measurement,
namely, RI, temperature and strain.
Working principle and sensing configuration
To perform the experiment, the sensing head structure shown in Figure 5.1 was implemented. It
index multimode D-shape fiber section spliced in between two SMFs and
interrogated in transmission. In this approach, it was used a supercontinuum broad
with a bandwidth of 500 nm, and an optical spectrum analyzer (OSA) as interrogation unit. The
shape fiber being illuminated by the optical source is also depicted in
(b)
a) Schematic of the sensing head structure and detail of the D
illuminated by the supercontinuum broadband source; b) Cross section of the D
with observed asymmetry of the structure.
New Advances in Fiber Refractometric Sensors
multiparameter measurement has been demonstrated [214]; and
polarization chaos distributed sensing with a semiconductor fiber ring laser has also been
Multimode optical fibers with noncircular cross section have shown great relevance in the
research field of wave chaos. The propagation along the fiber is the optical analog of wave
. By properly illuminating the input of the
fiber, it is possible to control the initial condition. Using this premise, theoretical and
rs have been performed, were chaotic
propagation on the inner cladding with a noncircular cross section is used to improve the
. In a similar fashion, it has been shown that multimode D-shape
[221]-[223].
Multimode chaotic fiber structures have distinct and attractive features that could be suitable for
sensing applications. In this section, multimodal interference using a multimode silica fiber with
shaped cross section is presented. The interferometric spectral response provided by the
terized for multiparameter measurement,
was implemented. It
shape fiber section spliced in between two SMFs and
interrogated in transmission. In this approach, it was used a supercontinuum broadband source
with a bandwidth of 500 nm, and an optical spectrum analyzer (OSA) as interrogation unit. The
shape fiber being illuminated by the optical source is also depicted in Figure
a) Schematic of the sensing head structure and detail of the D-shape fiber
illuminated by the supercontinuum broadband source; b) Cross section of the D-shape fiber

New Advances in Fiber Refractometric Sensors
- 126 -
The multimode D-shape fiber is made of pure silica, with a refractive index of 1.4435, an
estimated diameter d of ca. 195 µm and a length L of 90 mm. Figure 5.1 b) shows the
cross-section of the fiber used where one can observe the asymmetry of the structure. It has
been proven that the transverse motion of rays is chaotic for a multimode optical fiber with a
noncircular cross section [216]. Therefore, the interference spectrum of the proposed sensing
structure would be the result of multiple wave interferences (between a large number of
different modes) as it is observed in Figure 5.2. Although chaotic systems are unpredictable, its
output behavior is not random, as it is governed by deterministic mathematical equations [216].
The chaotic system will be strongly dependent on the geometry of the fiber used, and any
external parameter that may affect the system will be reflected in its chaotic behavior.
Figure 5.2 a) Optical spectrum of the D-shape fiber-based sensing head and b) detail of the
wavelength peaks used for parameter measurement.
1300 1400 1500 1600 1700
-75
-70
-65
-60
-55
-50
No
rmal
ized
op
tica
l p
ow
er (
dB
)
Wavelength (nm)
1490 1500 1510 1520 1530 1540
-74
-72
-70
-68
-66
-64
-62
-60
-58
λ3
λ2
No
rmal
ized
op
tica
l p
ow
er (
dB
)
Wavelength (nm)
λ1
a)
b)
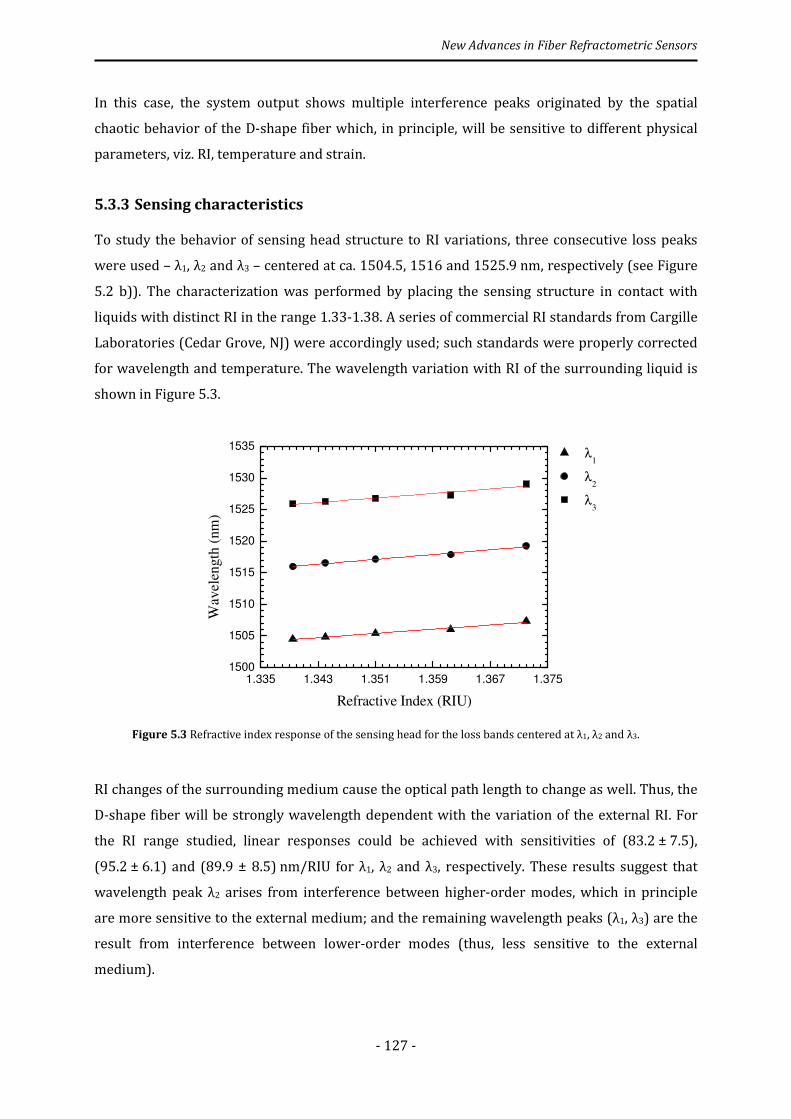
New Advances in Fiber Refractometric Sensors
- 127 -
In this case, the system output shows multiple interference peaks originated by the spatial
chaotic behavior of the D-shape fiber which, in principle, will be sensitive to different physical
parameters, viz. RI, temperature and strain.
5.3.3 Sensing characteristics
To study the behavior of sensing head structure to RI variations, three consecutive loss peaks
were used – λ1, λ2 and λ3 – centered at ca. 1504.5, 1516 and 1525.9 nm, respectively (see Figure
5.2 b)). The characterization was performed by placing the sensing structure in contact with
liquids with distinct RI in the range 1.33-1.38. A series of commercial RI standards from Cargille
Laboratories (Cedar Grove, NJ) were accordingly used; such standards were properly corrected
for wavelength and temperature. The wavelength variation with RI of the surrounding liquid is
shown in Figure 5.3.
Figure 5.3 Refractive index response of the sensing head for the loss bands centered at λ1, λ2 and λ3.
RI changes of the surrounding medium cause the optical path length to change as well. Thus, the
D-shape fiber will be strongly wavelength dependent with the variation of the external RI. For
the RI range studied, linear responses could be achieved with sensitivities of (83.2 ± 7.5),
(95.2 ± 6.1) and (89.9 ± 8.5) nm/RIU for λ1, λ2 and λ3, respectively. These results suggest that
wavelength peak λ2 arises from interference between higher-order modes, which in principle
are more sensitive to the external medium; and the remaining wavelength peaks (λ1, λ3) are the
result from interference between lower-order modes (thus, less sensitive to the external
medium).
1.335 1.343 1.351 1.359 1.367 1.375
1500
1505
1510
1515
1520
1525
1530
1535 λ
1
λ2
λ3
Wav
elen
gth
(nm
)
Refractive Index (RIU)

New Advances in Fiber Refractometric Sensors
- 128 -
The behavior of sensing head structure to temperature and strain was accordingly characterized
and, in this case, three consecutive loss peaks were used – λ1, λ2 and λ3 – centered at ca. 1504,
1516 and 1527 nm, respectively. The response of the sensing head to temperature variations
was attained, as shown in Figure 5.4.
Figure 5.4 Temperature response of the sensing head for the loss bands centered at λ1, λ2 and λ3.
The structure was placed in a tube furnace, and submitted to increasing values of temperature in
the range 0-350 °C, with 50 °C-steps. The loss peaks have similar and linear responses to
temperature variations, as shown in Figure 5.4, with sensitivity coefficients of (10.5 ± 0.6),
(10.3 ± 0.4) and (9.6 ± 0.4) pm/°C for λ1, λ2 and λ3, respectively. This was somewhat expected,
since the temperature variation does not change the launching conditions between the input
SMF and the step-index multimode D-shape fiber. The observed behavior of the sensing head to
temperature arises mainly from the optical path length variation as a consequence of the
D-shape fiber thermal expansion; and the slight decrease of sensitivities comes from the
refractive index dependence of the D-shape fiber with wavelength, due to silica thermo-optic
effect.
The sensing structure was also characterized in terms of strain. The input and output fibers
were accordingly fixed at two points that were 330 mm apart, and submitted to specific strain
values by using a translation stage (via sequential 50 μm-displacements). The results are made
available in Figure 5.5.
0 50 100 150 200 250 300 350
1500
1505
1510
1515
1520
1525
1530
1535 λ
1
λ2
λ3
W
avel
eng
th (
nm
)
Temperature (ºC)

New Advances in Fiber Refractometric Sensors
- 129 -
Figure 5.5 Strain response of the sensing head for the loss bands centered at λ1, λ2 and λ3.
The resonances have linear responses to strain variations, with different sensitivities:
(-1.02 ± 0.04), (-3.51 ± 0.01) and (-0.82 ± 0.01) pm/µε, for λ1, λ2 and λ3, respectively. In this case,
the fiber dimension decreases with increasing tensile stress thus changing the launching
conditions between the input SMF and the step-index multimode D-shape fiber. Therefore the
Poisson coefficient is the dominant factor for the spectral deviation to shorter wavelengths. The
different sensitivities result from (i) the lack of symmetry of the D-shape fiber and (ii) the
refractive index change (due to the variation of the fiber dimension) being strongly wavelength
dependent. Also, in this case, it is clear that the wavelength peak λ2 arises from interference
between high-order modes, following λ1 and λ3, thus presenting more sensitivity to the
measured parameter. This tendency is not observed in the case of temperature because the
variation of the optical path length due to thermal effects in silica is negligible.
Due to the different dependences of the resonant wavelength peaks on RI, temperature and
strain it is feasible the simultaneous measurements of these physical parameters. The
wavelength shifts induced by changes by the measured parameters are given in the matrix form
by:
�∆��∆�)∆��� = �jz�o j�o j�ojz�< j�< j�<jz�� j�� j��
� uΔ��Δl∆� v
(5.1)
0 100 200 300 400 500 600 700
1500
1505
1510
1515
1520
1525
1530
λ1
λ2
λ3
Wav
elen
gth
(n
m)
Strain (µε)
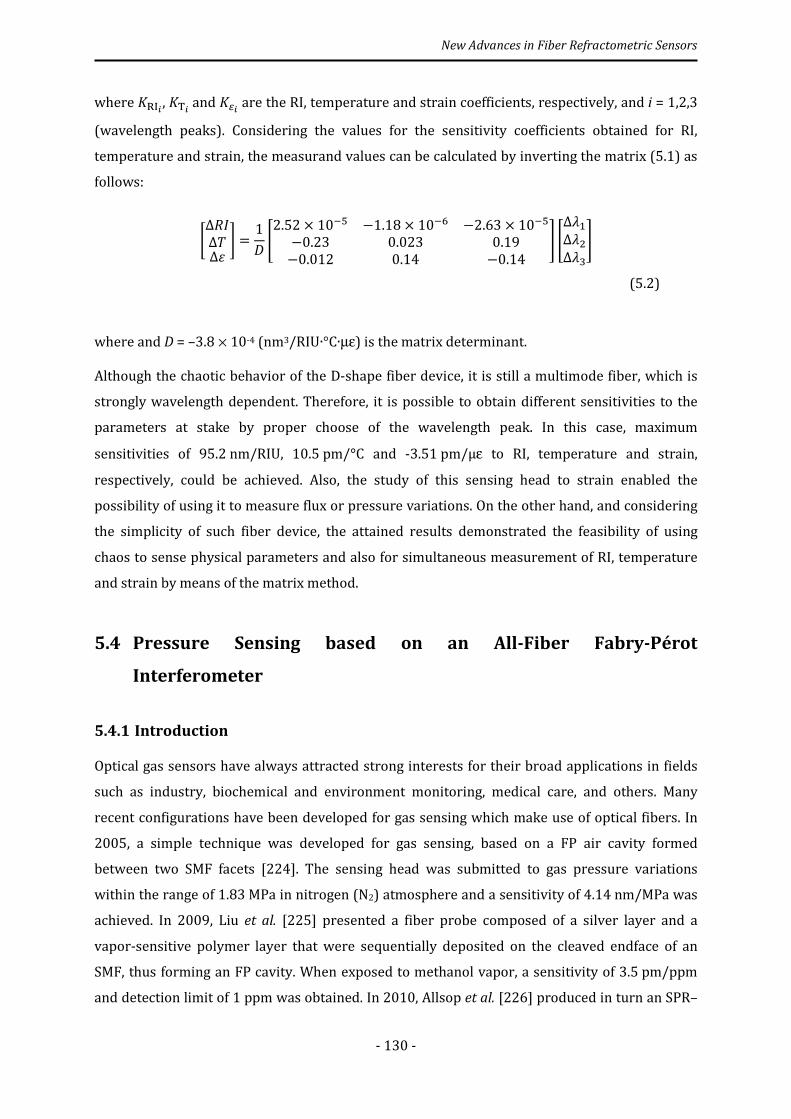
New Advances in Fiber Refractometric Sensors
- 130 -
where j��k , j�k and j�k are the RI, temperature and strain coefficients, respectively, and i = 1,2,3
(wavelength peaks). Considering the values for the sensitivity coefficients obtained for RI,
temperature and strain, the measurand values can be calculated by inverting the matrix (5.1) as
follows:
uΔ��Δl∆� v = 1s �2.52 × 10:� −1.18 × 10:� −2.63 × 10:�−0.23 0.023 0.19−0.012 0.14 −0.14 � �∆��∆�)∆���
(5.2)
where and D = –3.8 µ 10-4 (nm3/RIU∙°C∙µε) is the matrix determinant.
Although the chaotic behavior of the D-shape fiber device, it is still a multimode fiber, which is
strongly wavelength dependent. Therefore, it is possible to obtain different sensitivities to the
parameters at stake by proper choose of the wavelength peak. In this case, maximum
sensitivities of 95.2 nm/RIU, 10.5 pm/°C and -3.51 pm/µε to RI, temperature and strain,
respectively, could be achieved. Also, the study of this sensing head to strain enabled the
possibility of using it to measure flux or pressure variations. On the other hand, and considering
the simplicity of such fiber device, the attained results demonstrated the feasibility of using
chaos to sense physical parameters and also for simultaneous measurement of RI, temperature
and strain by means of the matrix method.
5.4 Pressure Sensing based on an All-Fiber Fabry-Pérot
Interferometer
5.4.1 Introduction
Optical gas sensors have always attracted strong interests for their broad applications in fields
such as industry, biochemical and environment monitoring, medical care, and others. Many
recent configurations have been developed for gas sensing which make use of optical fibers. In
2005, a simple technique was developed for gas sensing, based on a FP air cavity formed
between two SMF facets [224]. The sensing head was submitted to gas pressure variations
within the range of 1.83 MPa in nitrogen (N2) atmosphere and a sensitivity of 4.14 nm/MPa was
achieved. In 2009, Liu et al. [225] presented a fiber probe composed of a silver layer and a
vapor-sensitive polymer layer that were sequentially deposited on the cleaved endface of an
SMF, thus forming an FP cavity. When exposed to methanol vapor, a sensitivity of 3.5 pm/ppm
and detection limit of 1 ppm was obtained. In 2010, Allsop et al. [226] produced in turn an SPR–
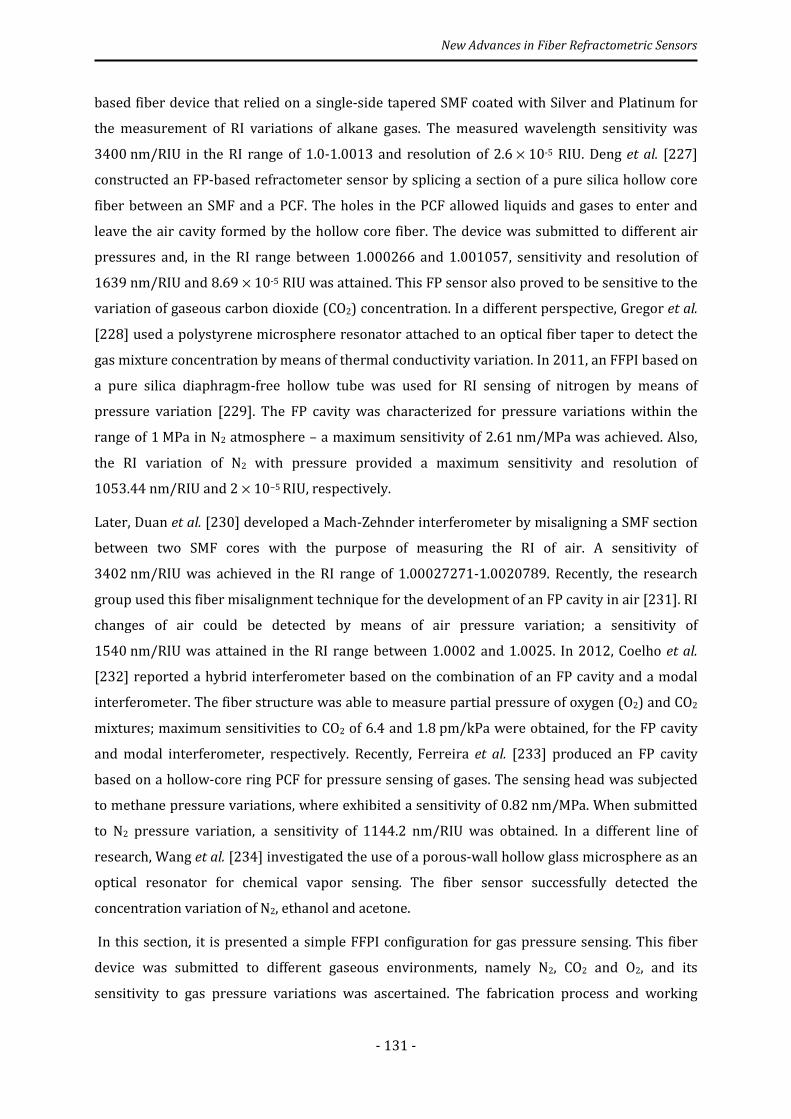
New Advances in Fiber Refractometric Sensors
- 131 -
based fiber device that relied on a single-side tapered SMF coated with Silver and Platinum for
the measurement of RI variations of alkane gases. The measured wavelength sensitivity was
3400 nm/RIU in the RI range of 1.0-1.0013 and resolution of 2.6 µ 10-5 RIU. Deng et al. [227]
constructed an FP-based refractometer sensor by splicing a section of a pure silica hollow core
fiber between an SMF and a PCF. The holes in the PCF allowed liquids and gases to enter and
leave the air cavity formed by the hollow core fiber. The device was submitted to different air
pressures and, in the RI range between 1.000266 and 1.001057, sensitivity and resolution of
1639 nm/RIU and 8.69 µ 10-5 RIU was attained. This FP sensor also proved to be sensitive to the
variation of gaseous carbon dioxide (CO2) concentration. In a different perspective, Gregor et al.
[228] used a polystyrene microsphere resonator attached to an optical fiber taper to detect the
gas mixture concentration by means of thermal conductivity variation. In 2011, an FFPI based on
a pure silica diaphragm-free hollow tube was used for RI sensing of nitrogen by means of
pressure variation [229]. The FP cavity was characterized for pressure variations within the
range of 1 MPa in N2 atmosphere – a maximum sensitivity of 2.61 nm/MPa was achieved. Also,
the RI variation of N2 with pressure provided a maximum sensitivity and resolution of
1053.44 nm/RIU and 2 µ 10−5 RIU, respectively.
Later, Duan et al. [230] developed a Mach-Zehnder interferometer by misaligning a SMF section
between two SMF cores with the purpose of measuring the RI of air. A sensitivity of
3402 nm/RIU was achieved in the RI range of 1.00027271-1.0020789. Recently, the research
group used this fiber misalignment technique for the development of an FP cavity in air [231]. RI
changes of air could be detected by means of air pressure variation; a sensitivity of
1540 nm/RIU was attained in the RI range between 1.0002 and 1.0025. In 2012, Coelho et al.
[232] reported a hybrid interferometer based on the combination of an FP cavity and a modal
interferometer. The fiber structure was able to measure partial pressure of oxygen (O2) and CO2
mixtures; maximum sensitivities to CO2 of 6.4 and 1.8 pm/kPa were obtained, for the FP cavity
and modal interferometer, respectively. Recently, Ferreira et al. [233] produced an FP cavity
based on a hollow-core ring PCF for pressure sensing of gases. The sensing head was subjected
to methane pressure variations, where exhibited a sensitivity of 0.82 nm/MPa. When submitted
to N2 pressure variation, a sensitivity of 1144.2 nm/RIU was obtained. In a different line of
research, Wang et al. [234] investigated the use of a porous-wall hollow glass microsphere as an
optical resonator for chemical vapor sensing. The fiber sensor successfully detected the
concentration variation of N2, ethanol and acetone.
In this section, it is presented a simple FFPI configuration for gas pressure sensing. This fiber
device was submitted to different gaseous environments, namely N2, CO2 and O2, and its
sensitivity to gas pressure variations was ascertained. The fabrication process and working

New Advances in Fiber Refractometric Sensors
- 132 -
principle of this device is studied in detail. The temperature sensitivity of the sensing device is
also analyzed.
5.4.2 Experimental setup and results
To demonstrate the proposed configuration, the sensing-head structure shown in Figure 5.6 was
implemented. It consists of a small section (L) of a silica rod with 50 µm diameter spliced
between two standard SMFs (SMF28, 8.2 and 125 µm of core and cladding diameters,
respectively) where a strong misalignment was imposed so that the silica rod could not touch
the core of both SMFs. Using manual splicing technique, an FP cavity in air was formed between
the two SMFs that in turn acted as mirrors. Therefore, the silica rod serves as mechanical
support of the FFPI and limits the cavity length. The fiber device was then used as an FP
interferometer in transmission in order to detect gas pressure variations in the open-cavity. In
this simple approach, it was used a broadband source in the 1550 nm spectral range with a
bandwidth of 100 nm, and an optical spectrum analyzer (OSA) with 5 pm resolution to
interrogate the sensing structure in transmission. The experimental setup of the interrogation
system and the optical spectrum of the FFPI sensing head are depicted in Figure 5.6.
Figure 5.6 Experimental setup of the interrogation system, detail of the sensing head and its
microscope image.
Figure 5.7 shows the schematic of the fiber geometry used to develop the proposed FFPI. In the
fabrication process of the proposed sensing head it was used a fusion splicing machine in
manual operation with the following parameters: electric arc of 70 mA, duration time of 400 ms
and an offset of ca. 35.7 µm (X and Y view from Figure 5.7). The center-to-center offset between
the silica rod and the SMFs is about 50 µm. X and Y views are provided by the splice machine and
enable the offset between both fibers and in each axis.
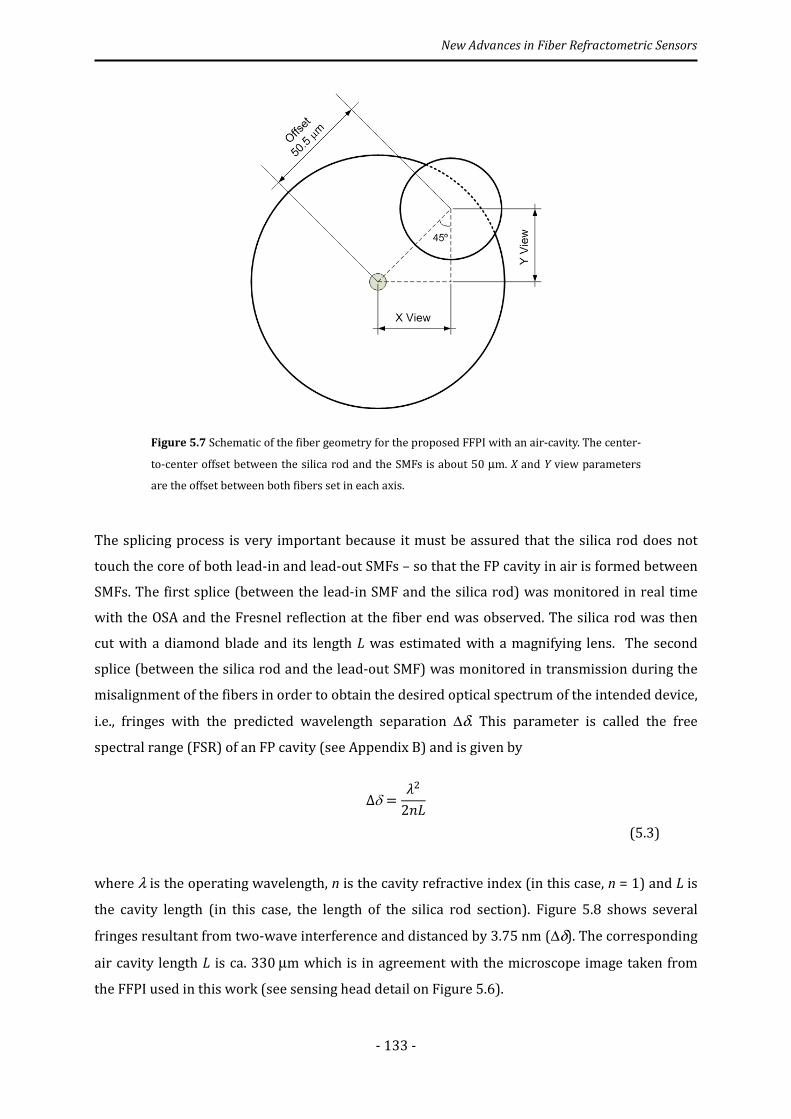
New Advances in Fiber Refractometric Sensors
- 133 -
Figure 5.7 Schematic of the fiber geometry for the proposed FFPI with an air-cavity. The center-
to-center offset between the silica rod and the SMFs is about 50 µm. X and Y view parameters
are the offset between both fibers set in each axis.
The splicing process is very important because it must be assured that the silica rod does not
touch the core of both lead-in and lead-out SMFs – so that the FP cavity in air is formed between
SMFs. The first splice (between the lead-in SMF and the silica rod) was monitored in real time
with the OSA and the Fresnel reflection at the fiber end was observed. The silica rod was then
cut with a diamond blade and its length L was estimated with a magnifying lens. The second
splice (between the silica rod and the lead-out SMF) was monitored in transmission during the
misalignment of the fibers in order to obtain the desired optical spectrum of the intended device,
i.e., fringes with the predicted wavelength separation ∆δ. This parameter is called the free
spectral range (FSR) of an FP cavity (see Appendix B) and is given by
Δδ = �)2�� (5.3)
where λ is the operating wavelength, n is the cavity refractive index (in this case, n = 1) and L is
the cavity length (in this case, the length of the silica rod section). Figure 5.8 shows several
fringes resultant from two-wave interference and distanced by 3.75 nm (∆δ). The corresponding
air cavity length L is ca. 330 µm which is in agreement with the microscope image taken from
the FFPI used in this work (see sensing head detail on Figure 5.6).
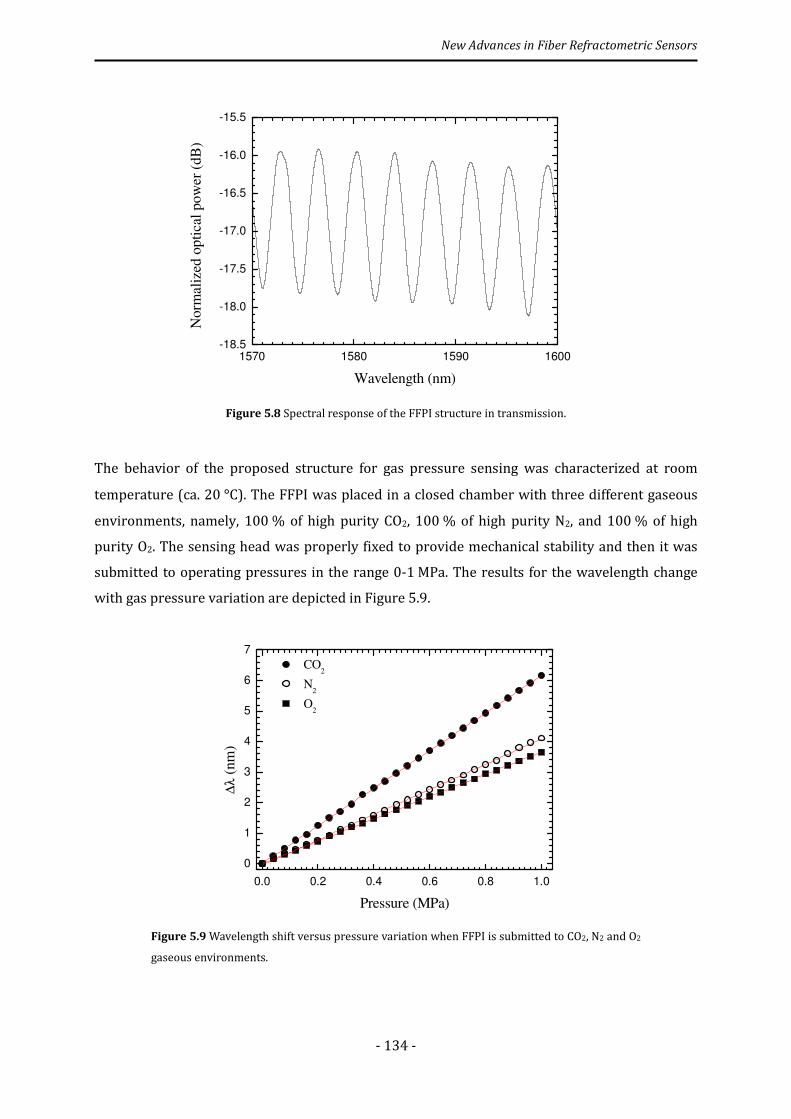
New Advances in Fiber Refractometric Sensors
- 134 -
Figure 5.8 Spectral response of the FFPI structure in transmission.
The behavior of the proposed structure for gas pressure sensing was characterized at room
temperature (ca. 20 °C). The FFPI was placed in a closed chamber with three different gaseous
environments, namely, 100 % of high purity CO2, 100 % of high purity N2, and 100 % of high
purity O2. The sensing head was properly fixed to provide mechanical stability and then it was
submitted to operating pressures in the range 0-1 MPa. The results for the wavelength change
with gas pressure variation are depicted in Figure 5.9.
Figure 5.9 Wavelength shift versus pressure variation when FFPI is submitted to CO2, N2 and O2
gaseous environments.
1570 1580 1590 1600
-18.5
-18.0
-17.5
-17.0
-16.5
-16.0
-15.5
Norm
aliz
ed o
pti
cal
po
wer
(d
B)
Wavelength (nm)
0.0 0.2 0.4 0.6 0.8 1.0
0
1
2
3
4
5
6
7
CO2
N2
O2
∆λ
(nm
)
Pressure (MPa)

New Advances in Fiber Refractometric Sensors
- 135 -
Linear sensitivities of (6.26 ± 0.01), (4.13 ± 0.01) and (3.65 ± 0.01) nm/MPa, for CO2, N2 and O2
pressure variations, respectively, were achieved. This result was obtained due to the RI
difference between measured gases [235]. In order to evaluate the RI change of each gas (∆n)
caused by pressure variation, the following equation was used (see Appendix B)
Δ� = Δ�H�H �A (5.4)
where ∆n is the RI change of the cavity, λm is initial wavelength corresponding to the mth fringe
maximum and ∆λm is the wavelength shift when the initial refractive index of the FFPI cavity (in
this case, n0 = 1) changes to n0 + ∆n. Figure 5.10 shows the relationship between the RI change as
the result of gas pressure variation, for CO2, N2 and O2 and, as expected, a linear behavior was
attained.
Figure 5.10 Refractive index change of the FFPI cavity versus pressure variation when
submitted to CO2, N2 and O2 gaseous environments.
Results show that increasing the pressure of the gas conducts to the increase of its RI [236]. In
this case, linear sensitivities of (3.97 ± 0.01) µ 10-3, (2.66 ± 0.01) µ 10-3 and (2.35 ± 0.01) µ 10-3
RIU/MPa, for CO2, N2 and O2 pressure variations, respectively, were obtained. Therefore, it may
be considered that, at low pressure range, Δ� ∝ (���V − 1)ΔB, where ���V is the RI of each gas
and ΔB is the pressure variation.
0.0 0.2 0.4 0.6 0.8 1.0
0
1
2
3
4
CO2
N2
O2
∆n x
10
-3 (
nm
)
Pressure (MPa)

New Advances in Fiber Refractometric Sensors
- 136 -
TABLE I – Refractive index of CO2, N2 and O2 gases at 293 K and atmospheric pressure [235].
CO2 N2 O2
Numerical 1.000417 1.000278 1.000251
Considering the RI values from Table I, it is possible to evaluate (���V − 1) with proper
temperature correction ('�/'l) for each gas, at 293 K and atmospheric pressure [235]; these
values become 4.17 µ 10-4, 2.78 µ 10-4 and 2.51 µ 10-4 RIU, for CO2, N2 and O2, respectively,
which apart from a proportionality constant, are in good agreement with the experimental
values obtained. Table II summarizes the results achieved with the developed FFPI device.
TABLE II – Sensitivities to wavelength and refractive index versus pressure variation.
∆∆∆∆λλλλ/∆∆∆∆P
(nm/MPa)
(∆∆∆∆n/∆∆∆∆P) ¥ 10-3
(RIU/MPa)
(ngas - 1) ¥ 10-4
(RIU)
(∆∆∆∆n/∆∆∆∆P)/(ngas - 1)
proportionality constant (MPa-1)
CO2 6.26 3.97 4.17 9.5
N2 4.13 2.66 2.78 9.6
O2 3.65 2.35 2.51 9.4
The FFPI response to temperature variations was also characterized. The structure was placed
in a tube furnace, and submitted to increasing values of temperature in the range [0-300] °C. The
results indicated that the FFPI sensor has a linear response to temperature variations,
characterized by a sensitivity of (-13.8 ± 0.1) pm/°C. Analysis of fringe spacing during
temperature variation showed that the FP cavity varied ∼ 18 µm. The increase of temperature
may have caused the silica spacer to bend, thus leading to the negative wavelength shift.
Therefore, in this case, the silica spacer contributed for the obtained result.
The FFPI was developed intentionally to present an air-cavity between the lead-in and lead-out
SMFs. However, in the following section, it will be shown that using a similar misalignment
configuration it is possible to obtain a unique FP behavior with filtering properties.
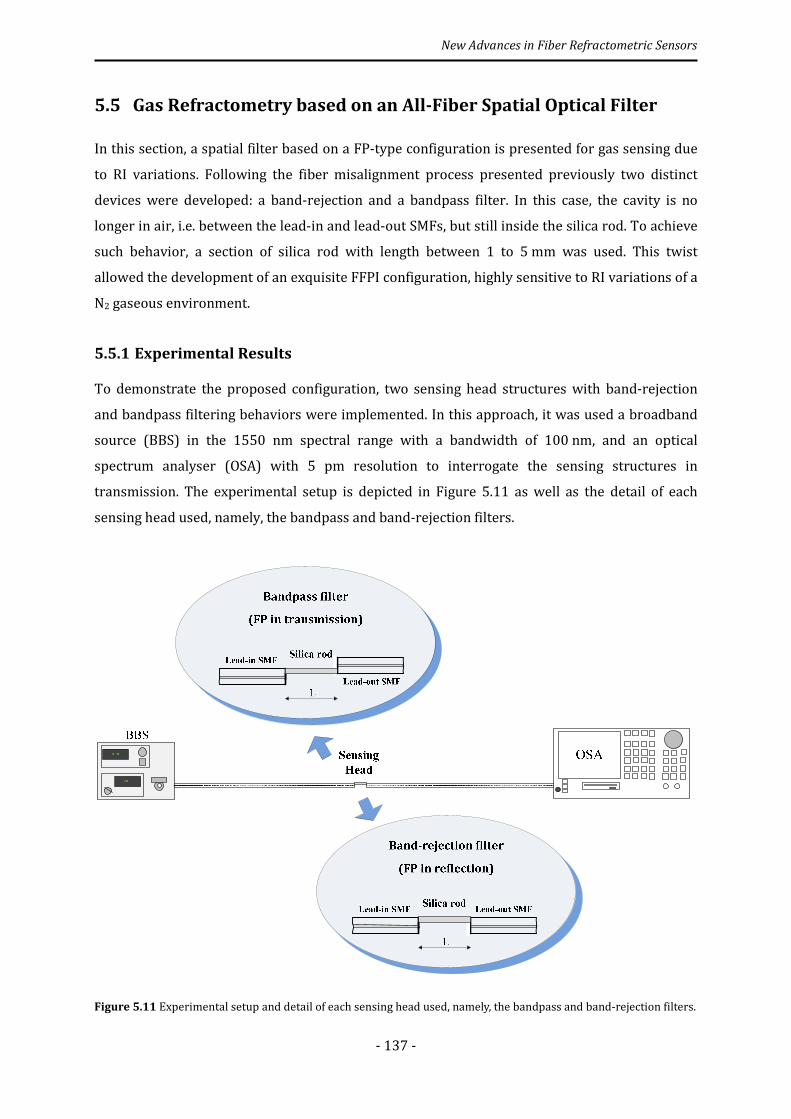
New Advances in Fiber Refractometric Sensors
- 137 -
5.5 Gas Refractometry based on an All-Fiber Spatial Optical Filter
In this section, a spatial filter based on a FP-type configuration is presented for gas sensing due
to RI variations. Following the fiber misalignment process presented previously two distinct
devices were developed: a band-rejection and a bandpass filter. In this case, the cavity is no
longer in air, i.e. between the lead-in and lead-out SMFs, but still inside the silica rod. To achieve
such behavior, a section of silica rod with length between 1 to 5 mm was used. This twist
allowed the development of an exquisite FFPI configuration, highly sensitive to RI variations of a
N2 gaseous environment.
5.5.1 Experimental Results
To demonstrate the proposed configuration, two sensing head structures with band-rejection
and bandpass filtering behaviors were implemented. In this approach, it was used a broadband
source (BBS) in the 1550 nm spectral range with a bandwidth of 100 nm, and an optical
spectrum analyser (OSA) with 5 pm resolution to interrogate the sensing structures in
transmission. The experimental setup is depicted in Figure 5.11 as well as the detail of each
sensing head used, namely, the bandpass and band-rejection filters.
Figure 5.11 Experimental setup and detail of each sensing head used, namely, the bandpass and band-rejection filters.
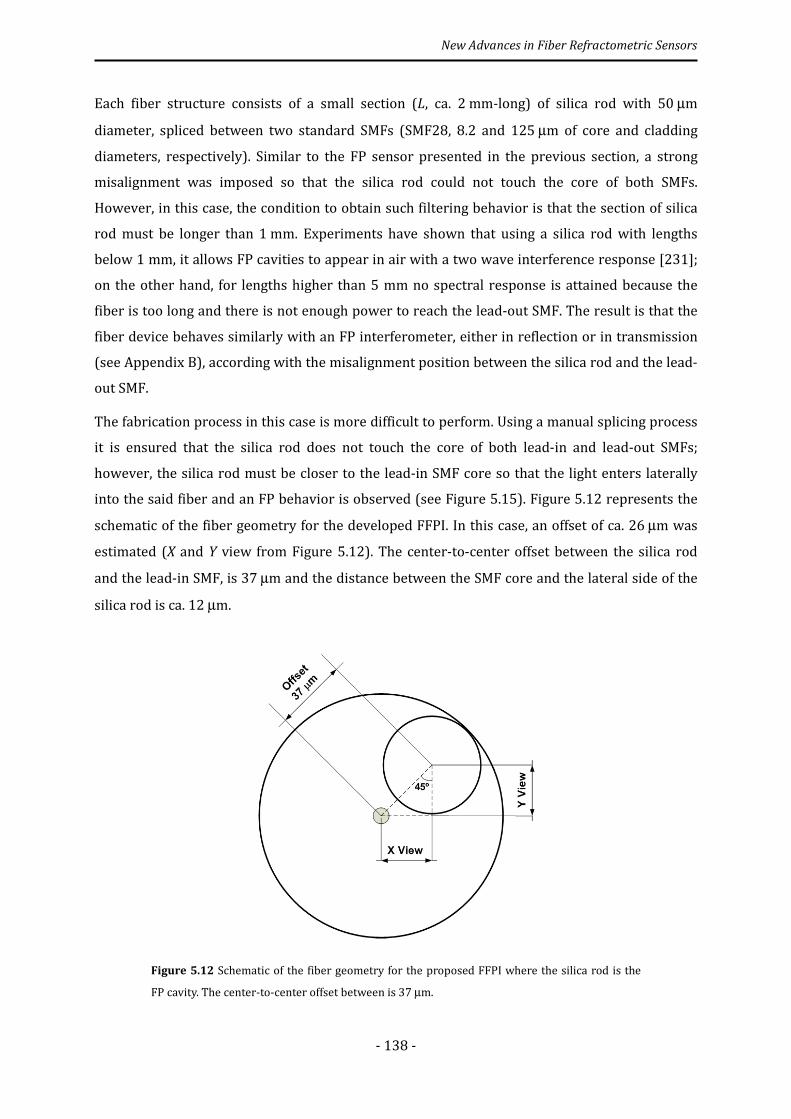
New Advances in Fiber Refractometric Sensors
- 138 -
Each fiber structure consists of a small section (L, ca. 2 mm-long) of silica rod with 50 µm
diameter, spliced between two standard SMFs (SMF28, 8.2 and 125 µm of core and cladding
diameters, respectively). Similar to the FP sensor presented in the previous section, a strong
misalignment was imposed so that the silica rod could not touch the core of both SMFs.
However, in this case, the condition to obtain such filtering behavior is that the section of silica
rod must be longer than 1 mm. Experiments have shown that using a silica rod with lengths
below 1 mm, it allows FP cavities to appear in air with a two wave interference response [231];
on the other hand, for lengths higher than 5 mm no spectral response is attained because the
fiber is too long and there is not enough power to reach the lead-out SMF. The result is that the
fiber device behaves similarly with an FP interferometer, either in reflection or in transmission
(see Appendix B), according with the misalignment position between the silica rod and the lead-
out SMF.
The fabrication process in this case is more difficult to perform. Using a manual splicing process
it is ensured that the silica rod does not touch the core of both lead-in and lead-out SMFs;
however, the silica rod must be closer to the lead-in SMF core so that the light enters laterally
into the said fiber and an FP behavior is observed (see Figure 5.15). Figure 5.12 represents the
schematic of the fiber geometry for the developed FFPI. In this case, an offset of ca. 26 µm was
estimated (X and Y view from Figure 5.12). The center-to-center offset between the silica rod
and the lead-in SMF, is 37 µm and the distance between the SMF core and the lateral side of the
silica rod is ca. 12 µm.
Figure 5.12 Schematic of the fiber geometry for the proposed FFPI where the silica rod is the
FP cavity. The center-to-center offset between is 37 µm.
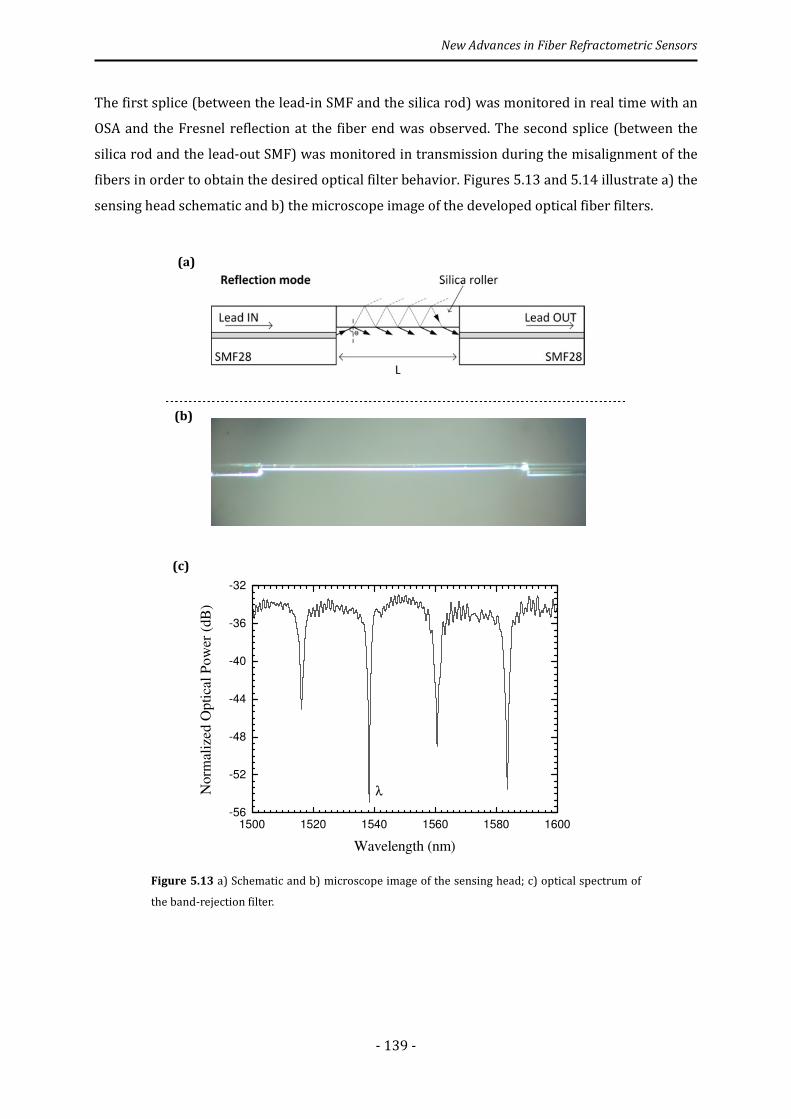
New Advances in Fiber Refractometric Sensors
- 139 -
The first splice (between the lead-in SMF and the silica rod) was monitored in real time with an
OSA and the Fresnel reflection at the fiber end was observed. The second splice (between the
silica rod and the lead-out SMF) was monitored in transmission during the misalignment of the
fibers in order to obtain the desired optical filter behavior. Figures 5.13 and 5.14 illustrate a) the
sensing head schematic and b) the microscope image of the developed optical fiber filters.
Figure 5.13 a) Schematic and b) microscope image of the sensing head; c) optical spectrum of
the band-rejection filter.
1500 1520 1540 1560 1580 1600
-56
-52
-48
-44
-40
-36
-32
λ
Norm
aliz
ed O
pti
cal
Po
wer
(dB
)
Wavelength (nm)
(a)
(b)
(c)

New Advances in Fiber Refractometric Sensors
- 140 -
Figure 5.14 a) Schematic and b) microscope image of the sensing head; c) optical spectrum of
the bandpass filter.
The results show that according with the misalignment between the silica rod and the two SMFs,
a filtering spectral behavior can be attained. The band-rejection filter (Figure 5.13 c)) presents
four well defined notch resonances distanced by 22.4 nm (∆δ), and a FWHM of ca. 0.5 nm; while
the bandpass filter (Figure 5.14 c)) contains five resonances distanced by 21 nm (∆δ), each one
with a FWHM of ca. 3 nm. For the same wavelength range [1500-1600] nm, the sensing heads
present a different number of resonances due to the difference in cavity length – in this case,
38.5 µm and 39.9 µm, for band-rejection and bandpass filters, respectively.
1500 1520 1540 1560 1580 1600
-48
-44
-40
-36
-32
-28
-24
No
rmal
ized
Op
tica
l P
ow
er (
dB
)
Wavelength (nm)
(a)
(b)
(c)
New Advances in Fiber Refractometric Sensors
- 141 -
The wavelength spacing ∆δ is related to the FWHM of any fringe by a quantity known as finesse
(see Appendix B),
ℱ = Δ����� .
(5.5)
In the present case, a finesse of 44.8 was achieved for the band-rejection filter (reflection mode);
while a much lower finesse of 7 was obtained for the bandpass filter (transmission
mode). Equation 5.5 clearly shows that the larger the FWHM of the fringes, the lower is the
finesse. When compared with each other (44.8 for the band-rejection filter and 7 for the
bandpass filter), the difference is significant because the light coupling into the lead-out SMF is
highly dependent on the SMF core position relative to the silica rod.
Recalling that the SMF core does not touch the silica rod, the light that comes from the lead-in
SMF enters laterally into the fiber with an incidence angle θ. However, the input light field will
not be enough to excite the longitudinal modes along the silica rod; instead, some beams are
coupled into the silica rod and travel with multiple internal reflections (see Figure 5.13 a) and
Figure 5.14 a)). The set of waves that leave the silica rod, either by reflection or transmission,
are parallel with each other and only a few beams are coupled into the lead-out SMF due to
numerical aperture of the SMF. Therefore, an SMF longitudinal core-to-core alignment (with
large lateral offset of the silica rod) originates a spectral behavior similar to an FP in reflection –
i.e., band-rejection filter (Figure 5.13); while the opposite longitudinal misalignment of the two
SMF causes an FP-like optical spectrum in transmission – i.e., bandpass filter (Figure 5.14).
A 3D-simulation based on the BPM method was used to investigate the beam behavior inside of
the 50 µm fiber of the proposed fiber structure in transmission. The modeling of light
propagation was done for a pure silica fiber section with 50 µm diameter, a refractive index of
1.444 and a total length of 2 mm; however, here it is presented only a 650 µm long section for
better visualization of the light propagation along the silica rod. Also, SMFs with core and
cladding diameters of 8.2 and 125 µm, respectively, were used for both light input and output, all
having a circular cross-section. The lead-in SMF core was assumed to have a large lateral offset
relatively to the silica rod, i.e., distanced ca. 8 µm (center of the SMF core) with respect to the
lateral side of the silica rod, as shown in Figure 5.15 a). This result clearly shows that the light
field leaving the lead-in SMF enters laterally into the silica rod, causing multiple internal
reflections along the direction of propagation, similar with an FP behavior. Figure 5.15 from b)
to e) shows the intensity distribution of electric field on the xy plane at different fiber lengths,
namely, 60, 84, 230 and 620 µm (also marked in Figure 5.15 a)). One can notice a series of
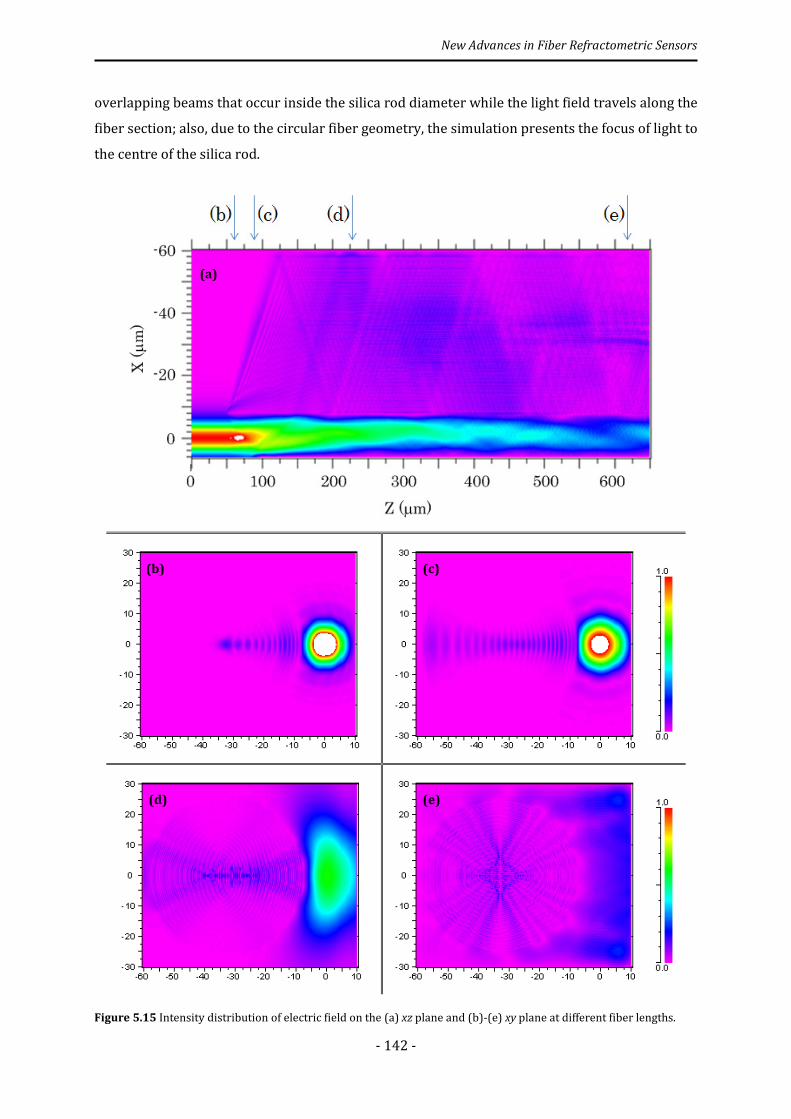
New Advances in Fiber Refractometric Sensors
- 142 -
overlapping beams that occur inside the silica rod diameter while the light field travels along the
fiber section; also, due to the circular fiber geometry, the simulation presents the focus of light to
the centre of the silica rod.
Figure 5.15 Intensity distribution of electric field on the (a) xz plane and (b)-(e) xy plane at different fiber lengths.
(a)
(b) (c)
(d) (e)
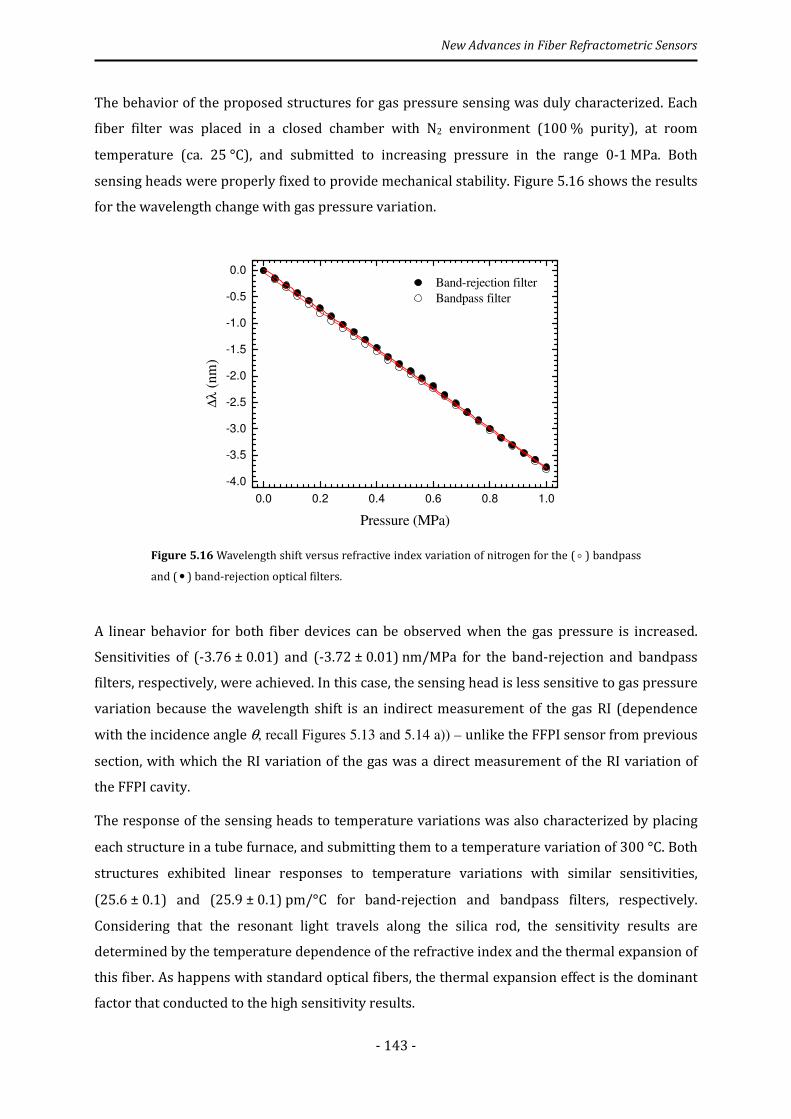
New Advances in Fiber Refractometric Sensors
- 143 -
The behavior of the proposed structures for gas pressure sensing was duly characterized. Each
fiber filter was placed in a closed chamber with N2 environment (100 % purity), at room
temperature (ca. 25 °C), and submitted to increasing pressure in the range 0-1 MPa. Both
sensing heads were properly fixed to provide mechanical stability. Figure 5.16 shows the results
for the wavelength change with gas pressure variation.
Figure 5.16 Wavelength shift versus refractive index variation of nitrogen for the ( o ) bandpass
and ( • ) band-rejection optical filters.
A linear behavior for both fiber devices can be observed when the gas pressure is increased.
Sensitivities of (-3.76 ± 0.01) and (-3.72 ± 0.01) nm/MPa for the band-rejection and bandpass
filters, respectively, were achieved. In this case, the sensing head is less sensitive to gas pressure
variation because the wavelength shift is an indirect measurement of the gas RI (dependence
with the incidence angle θ, recall Figures 5.13 and 5.14 a)) – unlike the FFPI sensor from previous
section, with which the RI variation of the gas was a direct measurement of the RI variation of
the FFPI cavity.
The response of the sensing heads to temperature variations was also characterized by placing
each structure in a tube furnace, and submitting them to a temperature variation of 300 °C. Both
structures exhibited linear responses to temperature variations with similar sensitivities,
(25.6 ± 0.1) and (25.9 ± 0.1) pm/°C for band-rejection and bandpass filters, respectively.
Considering that the resonant light travels along the silica rod, the sensitivity results are
determined by the temperature dependence of the refractive index and the thermal expansion of
this fiber. As happens with standard optical fibers, the thermal expansion effect is the dominant
factor that conducted to the high sensitivity results.
0.0 0.2 0.4 0.6 0.8 1.0
-4.0
-3.5
-3.0
-2.5
-2.0
-1.5
-1.0
-0.5
0.0
Band-rejection filter
Bandpass filter
∆λ
(nm
)
Pressure (MPa)
New Advances in Fiber Refractometric Sensors
- 144 -
5.6 Conclusions
The chaotic behavior obtained with the D-shape fiber device has shown to be suitable for
refractometric applications. It was also demonstrated the feasibility of using chaos to sense
other physical parameters such as temperature and strain. The simultaneous measurement of
multiparameters by means of the matrix method was successfully demonstrated.
It was also developed an FFPI sensor with an unusual mechanism of guidance of light that made
possible interferometric behavior. This fiber device presented unique spectral characteristics
and high spectral stability that provided high sensitivity in the detection of different gaseous
environments, by means of RI variations. Furthermore, the ability of interrogating the FPPI
device in transmission allows multiplexing capabilities as well as strain measurements which is
usually a limitation in most of the developed FFPI configurations. The flexibility of the sensor to
detect several gases with temperature control may also be suitable for environmental
monitoring and biological sensing.
- 145 -
6
Conclusions and Future Work
6.1 Conclusions
The work developed during this PhD programme has allowed the acquisition of knowledge on
the fabrication optical sensing devices for RI sensing purposes. The following paragraphs
summarize these achievements.
In Chapter 2 it was shown that the DUV femtosecond laser technology is versatile and highly
flexible in inscribing FBGs, especially in non-photosensitive fibers, and also providing high
reflectivity FBGs when inscribing them in tapered fibers within short fabrication times
(∼ 4 minutes). Several FBGs in tapered fibers with different wais diameters were successfully
fabricated. On the other hand, tapering process has is counter-part in the success of FBG writing
in tapered fibers. Therefore, the VYTRAN machine has shown to be an excellent option for
tapering and with which excellent taper profiles may be achieved in short fabrication times
(∼ 2 minutes).
In Chapter 3 it was demonstrated that optical fiber sensors based on multimode interference are
highly attractive for RI sensing. The MMI-based devices are easy to deploy and allow the
development of compact and miniaturized structures. The flexibility of this type of sensors
allows its fabrication using standard MMFs, coreless pure silica fibers or even microstructured
fibers. The MMI structure is also flexible in spectral selection according with the length and
characteristics of the MMF used; therefore, different optical spectra may be achieved: bandpass
and band-rejection filters. Using this feature, distinct configurations were developed for the
measurement of curvature, temperature, strain and RI. It was also observed that regardless the
type of configuration used is it feasible to achieve simultaneous measurement of physical
parameters, such as curvature and temperature discrimination with two in-line bandpass filters;
or even measurements of curvature with residual cross-sensitivity to temperature and strain by
means of a simple band-rejection filter with two wavelength loss peaks. Within the variety of
MMI structures developed in this work, two configurations have shown to be most attractive for
Conclusions and Future Work
- 146 -
RI sensing: (i) the PCF-based SMS device (band-rejection filter) where the use of air holes
allowed detecting small RI changes in water (10-3) by means of temperature variations, and a
maximum sensitivity of 880 nm/RIU was attained in the range 1.3196 to 1.3171; (ii) the SMS
structure based on a coreless-MMF with 55 µm in diameter (bandpass filter) could provide a
maximum sensitivity of 2800 nm/RIU within the RI range of 1.42-1.43. It was proved that
decreasing the MMF diameter could increase the sensitivity to RI.
In Chapter 4, it was presented the results obtained with an optical fiber probe sensor relying on
a tapered-FBG for hydrogen detection. The FBG sensors tested for this purpose have shown
reliability of results, and it was estimated a maximum response time of ca. 2 min between each
step of 0.1%(v/v) H2. This sensor presented features such as the fiber probe configuration and
ability to perform temperature compensation. However, the main problem so far is to obtain
long-term repeatability of results since this feature is highly dependent of the Pd film coating
lifetime. Experimental results have shown that the FBG sensor may be exposed to few cycles of
H2 (less than 5) until the Pd coating breaks – this is a drawback that has been extensively studied
in the literature and it is one of the greatest challenges in the development of Pd-based fiber
optic sensors, together with the achievement of short response and recovery times.
In Chapter 5, it was proven that the use of a D-shape fiber spliced between two SMFs originates
an interferometric but chaotic behavior that allowed the measurement of physical parameters,
namely, RI, temperature and strain. The optical spectrum had several interferometric peaks that
presented different sensitivities to the aforementioned physical parameters; although it had low
sensitivity to RI, it showed to be a good solution for simultaneous measurement of temperature
and strain. In this Chapter, it was also presented the development of a novel FFPI geometry, i.e.,
a small section of a MMF pure silica rod with a large lateral misalignment and spliced between
two SMFs. For a small MMF length – below 1 mm – an FP in air appeared with a two wave
interference response; while for lengths higher than 1 mm (and less than 5 mm), the silica rod
behaved as an FP cavity, with an output signal similar to a high finesse FP interferometer either
in reflection or in transmission, according with the misalignment position between the silica rod
and the lead-out SMF. Also, this structure presented a unique spectral behavior that showed to
be sensitive to RI variations of a N2 gaseous environment due to pressure variation.
6.2 Future Work
The work developed in this PhD programme addressed the study and development of optical
fiber sensors for RI sensing and detection of gaseous environments. Some research topics that
emerged within the developed work and require further investigation are listed as follows:
Conclusions and Future Work
- 147 -
• Fabrication of optical fiber tapers with sub-micron dimensions, FBG inscription and Pd
coating – testing of new devices to H2 detection.
• Study and utilization of different coatings as alternative to Pd for H2 detection, for
example Pt/WO3, in order to overcome the usual but unwanted Pd film cracking.
• Study and development of novel MMI structures based on optical fibers with non-
cylindrical geometries.
• Study and development of new FFPI geometries, for example, a D-shape fiber spliced
with strong misalignment between two SMFs in order to overcome the fragility of the
FFPI sensor originally developed with a silica rod in between two SMFs.
• Implementation and testing of optical fiber sensing systems in bioreactors for in situ
monitoring of H2 produced by microalgae cultures.
• Implementation of plastic-based optical fiber systems aimed at illumination of
microalgae in bioreactors, in order to evaluate the production enhancement of such
microorganisms and compare it with traditional illumination systems.

- 148 -
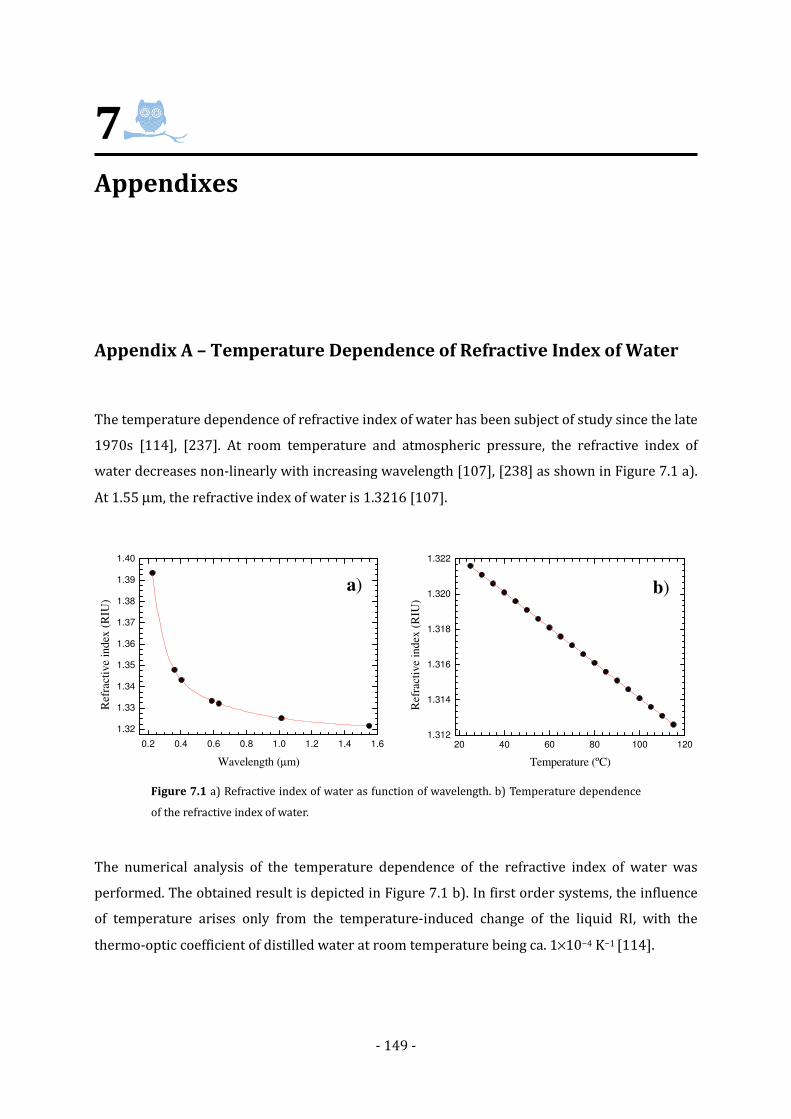
- 149 -
7
Appendixes
Appendix A – Temperature Dependence of Refractive Index of Water
The temperature dependence of refractive index of water has been subject of study since the late
1970s [114], [237]. At room temperature and atmospheric pressure, the refractive index of
water decreases non-linearly with increasing wavelength [107], [238] as shown in Figure 7.1 a).
At 1.55 µm, the refractive index of water is 1.3216 [107].
Figure 7.1 a) Refractive index of water as function of wavelength. b) Temperature dependence
of the refractive index of water.
The numerical analysis of the temperature dependence of the refractive index of water was
performed. The obtained result is depicted in Figure 7.1 b). In first order systems, the influence
of temperature arises only from the temperature-induced change of the liquid RI, with the
thermo-optic coefficient of distilled water at room temperature being ca. 1×10⁻⁴ K−1 [114].
0.2 0.4 0.6 0.8 1.0 1.2 1.4 1.6
1.32
1.33
1.34
1.35
1.36
1.37
1.38
1.39
1.40
Ref
ract
ive
index
(R
IU)
Wavelength (µm)
a)
20 40 60 80 100 120
1.312
1.314
1.316
1.318
1.320
1.322
Refr
act
ive
index
(R
IU)
Temperature (ºC)
b)
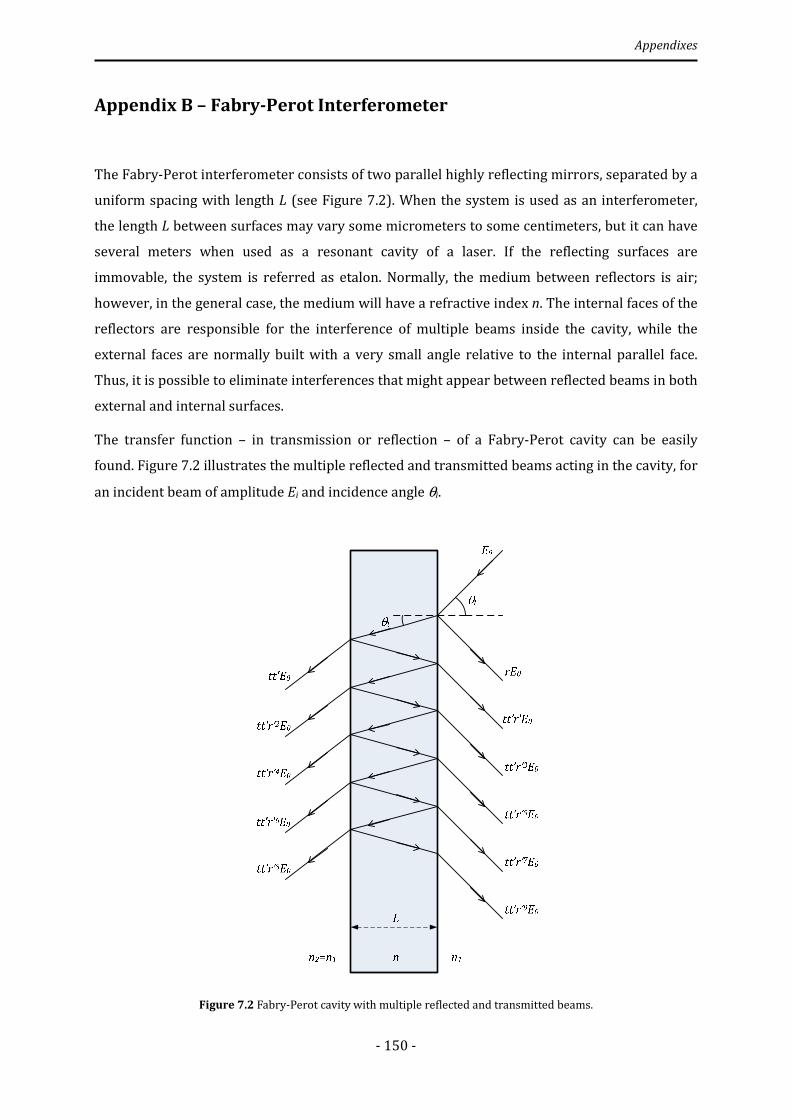
Appendixes
- 150 -
Appendix B – Fabry-Perot Interferometer
The Fabry-Perot interferometer consists of two parallel highly reflecting mirrors, separated by a
uniform spacing with length L (see Figure 7.2). When the system is used as an interferometer,
the length L between surfaces may vary some micrometers to some centimeters, but it can have
several meters when used as a resonant cavity of a laser. If the reflecting surfaces are
immovable, the system is referred as etalon. Normally, the medium between reflectors is air;
however, in the general case, the medium will have a refractive index n. The internal faces of the
reflectors are responsible for the interference of multiple beams inside the cavity, while the
external faces are normally built with a very small angle relative to the internal parallel face.
Thus, it is possible to eliminate interferences that might appear between reflected beams in both
external and internal surfaces.
The transfer function – in transmission or reflection – of a Fabry-Perot cavity can be easily
found. Figure 7.2 illustrates the multiple reflected and transmitted beams acting in the cavity, for
an incident beam of amplitude Ei and incidence angle θi.
Figure 7.2 Fabry-Perot cavity with multiple reflected and transmitted beams.

Appendixes
- 151 -
The reflection and transmission coefficients, r and t respectively, in the first interface are related
with the corresponding coefficients, r’ and t’, in the second interface, as follows:
��� = 1 − 7)
r = −r′ = ℯ¢£r′
(B.1)
These equations are valid when the external refractive index is �) = ��, as it is illustrated in
Figure 7.2.
The optical path difference between adjacent beams is given by
Λ = 2�� cos ��
(B.2)
and the corresponding phase difference is
¦ = kAΛ = 4`�� cos ���
(B.3)
where λ is the central wavelength of the incident radiation, L is the length between reflection
surfaces and n is the refractive index of the cavity. The total transmitted wave will be the sum of
all amplitude components of the transmitted waves and is given by
$� = $�� + $)� + $�� + ⋯ + $c� = $�ℯ¢©ª u tt′
1 − r)ℯ:¢¬v (B.4)
The intensity of this wave is proportional to the square of the (complex) amplitude Et. Thus,
multiplying both terms of the expression by its complex conjugated, results
�� = (��′))(1 + 7) − 27) cos ¦ �� (B.5)
Using the trigonometric relation cos ¦ = 1 − 2 sin) ®¦ 2W ¯, the previous expression becomes

Appendixes
- 152 -
�� = ��1 + � sin) ®¦ 2W ¯
(B.6)
where the finesse coefficient � is defined by the formula
� = 47)(1 − r))) = 4ℛ
(1 − ℛ)) (B.7)
and ℛ is the reflectivity of the Fabry-Perot cavity (ideally, both surfaces have the same
reflectivity).
The finesse ℱ is also an important parameter that is defined by the ratio between the wavelength
spacing ∆δ and the FWHM of any fringe and is given by [239]
ℱ = Δ����� .
(B.8)
The transmissivity ± of the cavity is defined as the (normalized) transmission transfer function
and is given by
± = ���� = 11 + � sin) ®¦ 2W ¯
(B.9)
The transmissivity of the Fabry-Perot cavity is illustrated in Figure 7.3, where it was considered
normal incidence (�� = 0), n = 1.444 and L = 50 µm. The values of maximum transmission occur
when ¦ = 2-` (m is an integer) which corresponds to the situation where the multiple waves
are in phase. These maximum values are independent of the reflectivity in both surfaces, which
means that, for surfaces with high reflectivity, it is fairly possible to have high transmission
(even for ℛ > 99%).
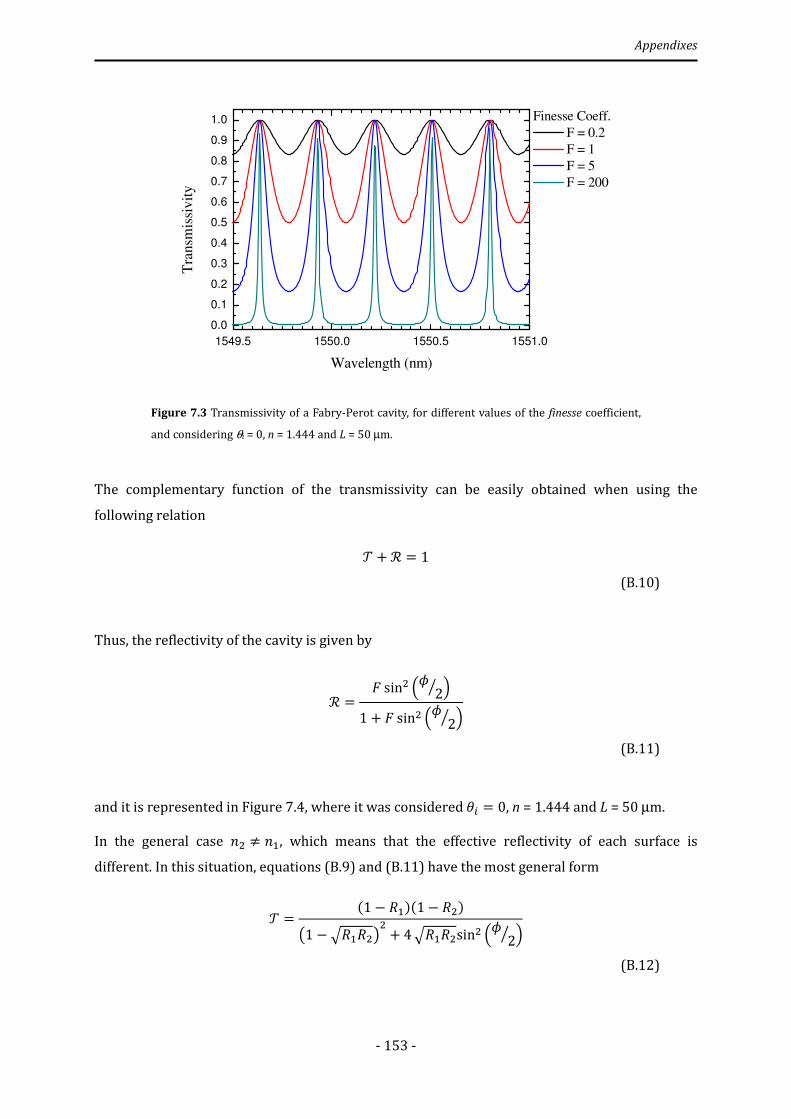
Appendixes
- 153 -
Figure 7.3 Transmissivity of a Fabry-Perot cavity, for different values of the finesse coefficient,
and considering θi = 0, n = 1.444 and L = 50 µm.
The complementary function of the transmissivity can be easily obtained when using the
following relation
± + ℛ = 1 (B.10)
Thus, the reflectivity of the cavity is given by
ℛ = � sin) ®¦ 2W ¯1 + � sin) ®¦ 2W ¯
(B.11)
and it is represented in Figure 7.4, where it was considered �� = 0,n = 1.444 and L = 50 µm.
In the general case �) ≠ ��, which means that the effective reflectivity of each surface is
different. In this situation, equations (B.9) and (B.11) have the most general form
± = (1 − ��)(1 − �))´1 − T���)µ) + 4 T���)sin) ®¦ 2W ¯
(B.12)
1549.5 1550.0 1550.5 1551.0
0.0
0.1
0.2
0.3
0.4
0.5
0.6
0.7
0.8
0.9
1.0
Finesse Coeff.
F = 0.2
F = 1
F = 5
F = 200T
ransm
issi
vit
y
Wavelength (nm)
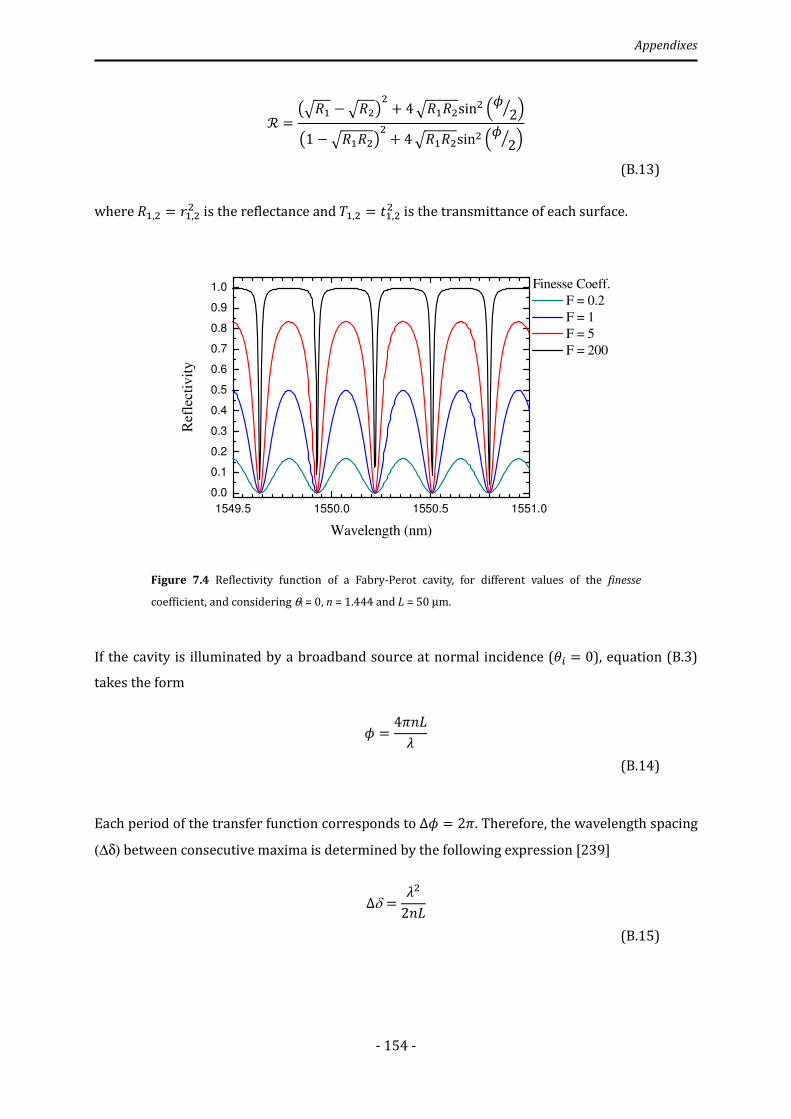
Appendixes
- 154 -
ℛ = ´T�� − T�)µ) + 4 T���)sin) ®¦ 2W ¯´1 − T���)µ) + 4 T���)sin) ®¦ 2W ¯
(B.13)
where ��,) = 7�,)) is the reflectance and l�,) = ��,)) is the transmittance of each surface.
Figure 7.4 Reflectivity function of a Fabry-Perot cavity, for different values of the finesse
coefficient, and considering θi = 0, n = 1.444 and L = 50 µm.
If the cavity is illuminated by a broadband source at normal incidence (�� = 0), equation (B.3)
takes the form
¦ = 4`���
(B.14)
Each period of the transfer function corresponds to Δ¦ = 2`. Therefore, the wavelength spacing
(∆δ) between consecutive maxima is determined by the following expression [239]
Δδ = �)2��
(B.15)
1549.5 1550.0 1550.5 1551.0
0.0
0.1
0.2
0.3
0.4
0.5
0.6
0.7
0.8
0.9
1.0
Finesse Coeff.
F = 0.2
F = 1
F = 5
F = 200
Ref
lect
ivit
y
Wavelength (nm)
Appendixes
- 155 -
In the case of maximum transmission, ¦ = 2-` (m is an integer), equation (B.14) becomes
� = -�H2� - = ¶��9·97
(B.16)
where n is the refractive index of the Fabry-Perot cavity, L is the cavity length and λm is the
wavelength corresponding to the mth fringe maximum. Since m and L are constants, one can
determine the refractive index change (∆n) of the cavity with the following equation [240]
Δ� = Δ�H�H �A (B.17)
where ∆λm is the wavelength shift when the initial refractive index of the Fabry-Perot cavity (n0)
changes to n0 + ∆n. This equation is helpful in the case of measuring refractive index variations
of a certain gas inside the Fabry-Perot cavity, as is was shown in Chapter 5, section 5.4.

- 156 -

- 157 -
References
[1] G. J. Pendock, H. S. MacKenzie, and F. P. Payne, “Dye lasers using tapered optical fibers,” Appl. Opt., vol. 32, no. 27, pp. 5236-5242, 1993.
[2] A. J. C. Tub, F. P. Payne, R. B. Millington, and C. R. Lowe, “Single-mode optical fibre surface plasma wave chemical sensor,” Sens. Actuators B, vol. 41, no. 1-3, pp. 71-79, 1997.
[3] F. Gonthier, S. Lacroix, X. Daxhelet, R. J. Black, and J. Bures, “Broadband all-fiber filters for wavelength-division-multiplexing application,” Appl. Phys. Lett., vol. 54, no. 14, pp. 1290-1292, 1989.
[4] B. S. Kawasaki, K. O. Hill, and R. G. Lamont, “Biconical-taper single mode fiber coupler,” Opt. Lett., vol. 6, no. 7, pp. 327-328, 1981.
[5] K. P. Jedrzejewski, F. Martinez, J. D. Minelly, C. D. Hussey, and F. P. Payne, “Tapered beam expander for single-mode optical-fibre gap devices,” Electron. Lett., vol. 22, no. 2, pp. 105-106, 1986.
[6] L. C. Bobb, P. M. Shankar, and H. D. Krumboltz, “Bending effects in biconically tapered single-mode fibers,” J. Lightwave Technol., vol. 8, no. 7, pp. 1084-1090, 1990.
[7] A. Kumar, T. V. B. Subrahmanyam, A. D. Sharma, K. Thyagarajan, B. P. Pal, and I. C. Goyal, “Novel refractometer using a tapered optical fibre,” Electron. Lett., vol. 20, no. 13, pp. 534-535, 1984.
[8] J.-F. Ding, A. P. Zhang, L.-Y. Shao, J.-H. Yan, and S. He, “Fiber-taper seeded long-period grating pair as a highly sensitive refractive-index sensor,” IEEE Photon. Technol. Lett., vol. 17, no. 6, pp. 1247-1249, 2005.
[9] M. G. Xu, L. Dong, L. Reekie, J. A. Tucknott, and J. L. Cruz, “Temperature-independent strain sensor using a chirped Bragg grating in a tapered optical fibre,” Electron. Lett., vol. 31, no. 10, pp. 823-825, 1995.
[10] T. J. Brophy, L. C. Bobb, and P. M. Shankar, “In-line singlemode fibre interferometer via concatenated biconical tapers,” Electron. Lett., vol. 29, no. 14, pp. 1276-1277, 1993.
[11] L. Yuan, J. Yang, Z. Liu, and J. Sun, “In-fiber integrated Michelson interferometer,” Opt. Lett., vol. 31, no. 18, pp. 2692-2694, 2006.
[12] O. Frazão, P. Caldas, F. M. Araújo, L. A. Ferreira, and J. L. Santos, “Optical flowmeter using a modal interferometer based on a single nonadiabatic fiber taper,” Opt. Lett., vol. 32, no. 14, pp. 1974-1976, 2007.
[13] K. Q. Kieu and M. Mansuripur, ”Biconical Fiber Taper Sensors,” IEEE Photon. Technol. Lett., vol. 18, no. 21, pp. 2239-2241, 2006.
[14] J. Yang, L. Jiang, S. Wang, B. Li, M. Wang, H. Xiao, Y. Lu, and H. Tsai, “High sensitivity of taper-based Mach–Zehnder interferometer embedded in a thinned optical fiber for refractive index sensing,” Appl. Opt., vol. 50, no. 28, pp. 5503-5507, 2011.
[15] N.-K. Chen, T.-H. Yang, Z.-Z. Feng, Y.-N. Chen, and C. Lin, “Cellular-dimension picoliter-volume index microsensing using micro-abrupt-tapered fiber Mach-Zehnder interferometers,” IEEE Photon. Technol. Lett., vol. 24, no. 10, pp. 842-844, 2012.
[16] J. H. Osório, L. Mosquera, C. J. Gouveia, C. R. Biazoli, J. G. Hayashi, P. A. S. Jorge, and C. M. B. Cordeiro, “High sensitivity LPG Mach-Zehnder sensor for real-time fuel conformity analysis,” Meas. Sci. Technol., vol. 24, 015102, 2013.
[17] X. Fang, C. R. Liao, and D. N. Wang, “Femtosecond laser fabricated fiber Bragg grating in microfiber for refractive index sensing,” Opt. Lett., vol. 35, no. 7, pp. 1007-1009, 2010.
[18] W. Ding, S. R. Andrews, T. A. Birks, and S. A. Maier, “Modal coupling in fiber tapers decorated with metallic surface gratings,” Opt. Lett., vol. 31, no. 17, pp. 2556-2558, 2006.
References
- 158 -
[19] Y. Liu, C. Meng, A. P. Zhang, Y. Xiao, H. Yu, and L. Tong, “Compact microfiber Bragg gratings with high-index contrast,” Opt. Lett., vol. 36, no. 16, pp. 3115–3117, 2011.
[20] S. Qiu, Y. Chen, J. Kou, F. Xu, and Y. Lu, “Miniature tapered photonic crystal fiber interferometer with enhanced sensitivity by acid microdroplets etching,” Appl. Opt., vol. 50, no. 22, pp. 4328-4332, 2011.
[21] C. Li, S.-J. Qiu, Y. Chen, F. Xu, and Y.-Q. Lu, “Ultra-Sensitive Refractive Index Sensor With Slightly Tapered Photonic Crystal Fiber,” IEEE Photon. Technol. Lett., vol. 24, no. 19, pp. 1771-1774, 2012.
[22] K. Ni, C. C. Chan, X. Dong, C. L. Poh, and T. Li, “Temperature-independent refractometer based on a tapered photonic crystal fiber interferometer,” Opt. Commun., vol. 291, pp. 238-241, 2013.
[23] R. Yang, Y.-S. Yu, Y. Xue, C. Chen, Q.-D. Chen, and H.-B. Sun, “Single S-tapered fiber Mach–Zehnder interferometers,” Opt. Lett., vol. 36, no. 23, pp. 4482-4484, 2011.
[24] R. Yang, Y.-S. Yu, C. Chen, Y. Xue, X.-L. Zhang, J.-C. Guo, C. Wang, F. Zhu, B.-L. Zhang, Q.-D. Chen, and H.-B. Sun, “S-Tapered Fiber Sensors for Highly Sensitive Measurement of Refractive Index and Axial Strain,” J. Lightwave Technol., vol. 30, no. 19, pp. 3126-3132, 2012.
[25] H. Luo, X. Li, W. Zou, W. Jiang, and J. Chen, “Modal Interferometer Based on a C-Shaped Ultrathin Fiber Taper for High-Sensitivity Refractive Index Measurement,” Appl. Phys. Express, vol. 5, 012502, 2012.
[26] S. K. Srivastava and B. D. Gupta, “A Multitapered Fiber-Optic SPR Sensor With Enhanced Sensitivity,” IEEE Photon. Technol. Lett., vol. 23, no. 13, pp. 923-825, 2011.
[27] Y. Geng, X. Li, X. Tan, Y. Deng, and Y. Yu, “High-Sensitivity Mach–Zehnder Interferometric Temperature Fiber Sensor Based on a Waist-Enlarged Fusion Bitaper,” IEEE Sens. J., vol. 11, no. 11, pp. 2891-2894, 2011.
[28] R. M. André, S. O. Silva, M. Becker, K. Schuster, M. Rothardt, H. Bartelt, M. B. Marques, and O. Frazão, “Strain sensitivity enhancement in suspended core fiber tapers,” Photonic Sensors, vol. 1, 2012.
[29] L. M. N. Amaral, O. Frazao, J. L. Santos, and A. B. Lobo Ribeiro, “Fiber-Optic Inclinometer Based on Taper Michelson Interferometer,” IEEE Sens. J., vol. 11, no. 9, pp. 1811-1814, 2011.
[30] B. Xu, Y. Li, M. Sun, Z.-W. Zhang, X.-Y. Dong, Z.-X. Zhang, and S.-Z. Jin, “Acoustic vibration sensor based on nonadiabatic tapered fibers,” Opt. Lett., vol. 37, no. 22, pp. 4768-4770, 2012.
[31] T. A. Birks, and Y. W. Li, “The shape of fiber tapers,” J. Lightwave Technol., vol. 10, no. 4, pp. 432-438, 1992.
[32] T. E. Dimmick, G. Kakarantzas, T. A. Birks, and P. J. Russell, “Carbon dioxide laser fabrication of fused-fiber couplers and tapers,” Appl. Opt., vol. 38, no. 33, pp. 6845-6848, 1999.
[33] R. P. Kenny, T. A. Birks, and K. P. Pakley, “Control of optical fibre taper shape,” Electron. Lett., vol. 27, no. 18, pp. 1654–1656, 1991.
[34] W. Du, X. Tao, and H. Tam, “Temperature independent strain measurement with a fiber grating tapered cavity sensor,” IEEE Photon. Technol. Lett., vol. 11, no. 5, pp. 596-598, 1999.
[35] P. Caldas, “Fiber optic sensing by evanescent field interaction,” Ph.D. Dissertation, University of Porto, Porto, 2011.
[36] J. D. Love, W. M. Henry, W. J. Stewart, R. J. Black, S. Lacroix, and F. Gonthier, “Tapered single-mode fibres and devices. Part 1: Adiabaticity criteria,” Optoelectronics, IEE Proceedings J., vol. 138, no. 5, pp. 343-354, 1991.
[37] A. Hartung, S. Brueckner, and H. Bartelt, “Limits of light guidance in optical nanofibers”, Opt. Express, vol. 18, no. 4, pp. 3754-3761, 2010.
[38] B. Wang and E. Mies, “Review of fabrication techniques for fused fiber components for fiber lasers”, SPIE Photonic West ’09, Fiber Lasers VI: Technology, Systems, and Applications, Proc. 7195, 2009.
[39] J. Mora, J. Villatoro, A. Dı́ez, J.L. Cruz, and M.V. Andrés, “Tunable chirp in Bragg gratings written in tapered core fibers,” Opt. Commun., vol. 210, no. 1-2, pp. 51-55, 2002.
References
- 159 -
[40] S. F. O. Silva, L. A. Ferreira, F. M. Araújo, J. L. Santos, and O. Frazão, “Fiber Bragg grating structures with fused tapers,” Fiber Integrated Opt., vol. 30, pp. 9–28, 2011.
[41] T.Wieduwilt, S. Bruckner, and H. Bartelt, “High force measurement sensitivity with fiber Bragg gratings fabricated in uniform-waist fiber tapers,” Meas. Sci. Technol., vol. 22, 075201, 2011.
[42] M. Becker, J. Bergmann, S. Bruckner, M. Franke, E. Lindner, M. W. Rothhardt, and H. Bartelt, “Fiber Bragg grating inscription combining DUV sub-picosecond laser pulses and two-beam interferometry”, Opt. Express, vol. 16, no. 23, pp. 19169–19178, 2008.
[43] M. Becker, L. Fernandes, M. Rothhardt, S. Bruckner, K. Scuster, J. Kobelke, O. Frazão, H. Bartelt, and Paulo. V. S. Marques, “Inscription of fiber Bragg grating arrays in pure silica suspended core fibers”, IEEE Photon. Technol. Lett., vol. 21, no. 19, pp. 1453–1455, 2009.
[44] S. A. Slattery, and D. N. Nikogosyan, “Fiber Bragg grating inscription by high-intensity femtosecond UV laser light comparison with other existing methods of fabrication,” J. Opt. Soc. Am. B, vol. 22, no. 2, pp. 354-361, 2005.
[45] D. N. Nikogosyan, “Multi-photon high-excitation-energy approach to fibre grating inscription,” Meas. Sci. Technol., vol. 18, R1–R29, 2007.
[46] G. Brambilla, V. Finazzi, and D. J. Richardson, “Ultra-low-loss optical fiber nanotapers,” Opt. Express, vol. 12, no. 10, pp. 2258–2263, 2004.
[47] R. M. André, C. R. Biazoli, S. O. Silva, M. B. Marques, C. M. B. Cordeiro, and O. Frazão, “Strain-Temperature Discrimination Using Multimode Interference in Tapered Fiber,” IEEE Photon. Technol. Lett., vol. 25, no. 2, pp. 155-158, 2013.
[48] O. Frazão, “Sensores em fibra óptica baseados em interferometria e efeitos não-lineares,” Ph.D. Dissertation, University of Porto, Porto, 2009.
[49] A. Kersey, M. A. Davis, H. J. Patrick, M. Leblanc, K. P. Koo, C. G. Askins, M. A. Putnam, and E. J. Friebele, “Fiber grating sensors,” J. Lightwave Technol., vol. 15, no. 8, pp. 1442-1463, 1997.
[50] O. Frazão, S. F. O. Silva, A. Guerreiro, J. L. Santos, L. A. Ferreira, and F. M. Araújo, “Applied Optics_Strain sensitivity control of fiber Bragg grating structures with fused tapers,” Appl. Optics, vol. 46, no. 36, pp. 8578-8582, 2007.
[51] D. Gloge, “Bending loss in multimode fibers with graded and ungraded core index,” Appl. Opt., vol. 11, no. 11, pp. 2506-2518, 1972.
[52] L. B. Soldano, and E. C. M. Pennings, “Optical multi-mode interference devices based on self-imaging: principles and applications,” J. Lightwave Technol., vol. 13, no. 4, pp. 615–627, 1995.
[53] N. Lagakos, J. H. Cole, and J. A. Bucaro, “Microbend fiber-optic sensor,” Appl. Opt., vol. 26, no. 11, pp. 2171-2180, 1987.
[54] D. Donlagic, and M. Zavrsnik, “Fiber-optic microbend sensor structure,” Opt. Lett., vol. 22, no. 11, pp. 837-839, 1997.
[55] W. S. Mohammed, A. Mehta, and E. G. Johnson, “Wavelength tunable fiber lens based on multimode interference,” J. Lightwave Technol., vol. 22, no. 2, pp. 469-477, 2004.
[56] E. Li, X. Wang, and C. Zhang, “Fiber-optic temperature sensor based on interference of selective higher-order modes,” Appl. Phys. Lett., vol. 89, 091119, 2006.
[57] Q. Wang, G. Farrell, and W. Yan, “Investigation on single mode-multimode-single mode fiber structure,” J. Lightwave Technol., vol. 26, no. 5, 512-519, 2008.
[58] Q. Wang, and G. Farrell, “Multimode fiber based edge filter for optical wavelength measurement: application and its design,” Microw. Opt. Technol. Lett., vol. 48, no. 5, pp. 900-902, 2006.
[59] A. Castillo-Guzman, J. E. Antonio-Lopez, R. Selvas-Aguilar, D. A. May-Arrioja, J. Estudillo-Ayala, and P. LiKamWa, “Widely tunable erbium-doped fiber laser based on multimode interference effect,” Opt. Express, vol. 18, no. 2, pp. 591-597, 2010.
[60] J. E. Antonio-Lopez, A. Castillo-Guzman, D. A. May-Arrioja, R. Selvas-Aguilar, and P. LiKamWa, “Tunable multimode-interference bandpass fiber filter,” Opt. Lett., vol. 35, no. 3, pp. 324-326, 2010.

References
- 160 -
[61] X. Zhu, A. Schulzgen, H. Li, L. Li, V. L. Temyanko, J. V. Moloney, and N. Peyghambarian, “High-power fiber lasers and amplifiers based on multimode interference,” IEEE J. Sel. Top. Quant. Electr., vol. 15, no. 1, pp. 71-78, 2009.
[62] L. Coelho, J. Kobelke, K. Schuster, and O. Frazão, “Multimode interference in outer cladding large-core air-clad photonic crystal fiber,” Microw. Opt. Technol. Lett., vol. 54, no. 4, pp. 1009-1011, 2012.
[63] A. Mehta, W. S. Mohammed, and E. G. Johnson, “Multimode interference-based fiber-optic displacement sensor,” J. Lightwave Technol., vol. 22, no. 8, pp. 1129-1131, 2003.
[64] E. Li, “Temperature compensation of multimode-interference-based fiber devices,” Opt. Lett., vol. 32, no. 14, pp. 2064-2066, 2007.
[65] E. Li, and G.-D. Peng, “Wavelength encoded fiber optic temperature sensor with ultra high sensitivity,” Opt. Commun., vol. 281, pp. 5768-5770, 2008.
[66] Q. Wang, and G. Farrell, “All-fiber multimode-interference based refractometer sensor: proposal and design,” Opt. Lett., vol. 31, no. 3, pp. 317-319, 2006.
[67] P. Wang, G. Brambilla, M. Ding, Y. Semenova, Q. Wu, and G. Farrell, “Investigation of single-mode-multimode-single-mode and single-mode-tapered-multimode-single-mode fiber structures and their application for refractive index sensing,” J. Opt. Soc. Am. B, vol. 28, no. 5, pp. 1180-1186, 2011.
[68] P. Wang, G. Brambilla, M. Ding, Y. Semenova, Q. Wu, and G. Farrell, “High-sensitivity, evanescent field refractometric sensor based on a tapered, multimode fiber interference,” Opt. Lett., vol. 36, no. 12, pp. 2233-2235, 2011.
[69] R. X. Gao, Q. Wang, F. Zhao, B. Meng, and S. L. Qu, “Optimal design and fabrication of SMS fiber temperature sensor for liquid,” Opt. Commun., vol. 283, pp. 3149-3152, 2010.
[70] A. M. Hatta, Y. Semenova, Q. Wu, and G. Farrell, “Strain sensor based on a pair of single-mode-multimode-single-mode fiber structures in a ratiometric power measurement scheme,” Appl. Opt., vol. 49, no. 3, pp. 536-541, 2010.
[71] A. M. Hatta, Y. Semenova, G. Rajan, and G. Farrell, “A voltage sensor based on a singlemode-multimode-singlemode fiber structure,” Microw. Opt. Technol. Lett., vol. 52, no. 8, pp. 1887-1890, 2010.
[72] J. Zhang, and S. Peng, “A Compact SMS refractometer based on HF corrosion scheme,” Symposium on Photonics and Optoelectronic (SOPO), pp. 1-4, 2010.
[73] J. E. Antonio-Lopez, J. J. Sanchez-Mondragon, P. L. Wa, and D. A. May-Arrioja, “Fiber-optic sensor for liquid level measurement,” Opt. Lett., vol. 36, no. 17, pp. 3425-3427, 2011.
[74] Y. Gong, T. Zhao, Y.-J. Rao, and Y. Wu, “All-fiber curvature sensor based on multimode Interference,” IEEE Photon. Technol. Lett., vol. 23, no. 11, pp. 679-681, 2011.
[75] S. Silva, O. Frazão, J. Viegas, L. A. Ferreira, F. M. Araújo, F. X. Malcata, and J. L. Santos, “Temperature and strain-independent curvature sensor based on a singlemode/multimode fiber optic structure,” Meas. Sci. Technol., vol. 22, 085201, 2011.
[76] Q. Wu, Y. Semenova, P. Wang, A. M. Hatta, and G. Farrell, “Experimental demonstration of a simple displacement sensor based on a bent single mode-multimode-single mode fiber structure,” Meas. Sci. Technol., vol. 22, 025203, 2011.
[77] Q. Wu, A. M. Hatta, P. Wang, Y. Semenova, and G. Farrell, “Use of a bent SMS structure for simultaneous measurement of displacement and temperature sensing,” IEEE Photon. Technol. Lett., vol. 23, no. 2, pp. 130-132, 2011.
[78] Q. Wu, Y. Semenova, A. M. Hatta, P. Wang, and G. Farrell, “Singlemode-multimode-singlemode fiber structures for simultaneous measurement of strain and temperature,” Microw. Opt. Technol. Lett., vol. 53, no. 9, pp. 2181-2185, 2011.
[79] S. Silva, J. L. Santos, F. X. Malcata, J. Kobelke, K. Schuster, and O. Frazão, “Optical refractometer based on large-core air-clad photonic crystal fibers,” Opt. Lett., vol. 36, no. 6, pp. 852-854, 2011.
[80] Q. Wu, Y. Semenova, P. Wang, and G. Farrell, High sensitivity SMS fiber structure based refractometer – analysis and experiment”, Opt. Express, vol. 19, no. 9, pp. 7937-7944, 2011.
References
- 161 -
[81] R. X. Gao, W. J. Liu, Y. Y. Wang, Q. Wang, F. Zhao, and S. L. Qu, “Design and fabrication of SMS fiber refractometer for liquid,” Sensor. Actuat. A-Phys., vol. 179, pp. 5-9, 2012.
[82] S. Silva, O. Frazão, J. L. Santos, and F. X. Malcata, “A reflective optical fiber refractometer based on multimode interference,” Sensor. Actuat. B-Chem., vol. 161, pp. 88-92, 2012.
[83] S. Silva, E. G. P. Pachon, M. A. R. Franco, J. G. Hayashi, F. X. Malcata, O. Frazão, P. Jorge, and C. M. B. Cordeiro, “Ultrahigh-sensitivity temperature fiber sensor based on multimode interference,” Appl. Opt., vol. 51, no. 16, pp. 3236-3242, 2012.
[84] S. Silva, E. G. P. Pachon, M. A. R. Franco, P. Jorge, J. L. Santos, F. X. Malcata, C. M. B. Cordeiro, and O. Frazão, “Curvature and temperature discrimination using multimode interference fiber optic structures – A proof of concept,” J. Lightwave Technol., vol. 30, no. 23, pp. 3569-3575, 2012.
[85] C. R. Biazoli, S. Silva, M. A. R. Franco, O. Frazão, and C. M. B. Cordeiro, “Multimode interference tapered fiber refractive index sensors,” Appl. Opt., vol. 51, no. 24, pp. 5941-5945, 2012.
[86] L.-L. Xue, and L. Yang, “Sensitivity enhancement of RI sensor based on SMS fiber structure with high refractive index overlay,” J. Lightwave Technol., vol. 30, no. 10, pp. 1463-1469, 2012.
[87] J. E. Antonio-Lopez, P. LiKamWa, J. J. Sanchez-Mondragon, and D. A. May-Arrioja, “All-fiber multimode interference micro-displacement sensor,” Meas. Sci. Technol., vol. 24, 055104, 2013.
[88] E. Li, “Sensitivity-enhanced fiber-optic strain sensor based on interference of higher order modes in circular fibers,” IEEE Photon. Technol. Lett., vol. 19, no. 16, pp. 1266-1268, 2007.
[89] O. Frazão, J. Viegas, P. Caldas, J. L. Santos, Araújo F. M., L. A. Ferreira, and F. Farahi, “All-fiber Mach-Zehnder curvature sensor based on multimode interference combined with a long-period grating,” Opt. Lett, vol. 32, no. 21, pp. 3074-3076, 2007.
[90] L. V. Nguyen, D. Hwang, S. Moon, D. S. Moon, and Y. Chung, “High temperature fiber sensor with high sensitivity based on core diameter mismatch,” Opt. Express, vol. 16, no. 15, pp. 11369-11375, 2008.
[91] D.-P. Zhou, L. Wei, W.-K Liu, Y. Liu, and J. W. Y. Lit, “Simultaneous measurement for strain and temperature using fiber Bragg gratings and multimode fibers,” Appl. Opt., vol. 47, no. 10, pp. 1668-1672, 2008.
[92] J. Zhang, Y. Zhang, W. Sun, and L. Yuan, “Multiplexing multimode fiber and Fizeau etalon a simultaneous measurement scheme of temperature and strain,” Meas. Sci. Technol., vol. 20, 065206, 2009.
[93] Y. Jin, X. Dong, H. Gong, and C. Shen, “Refractive Index Sensor Based On Tilted Fiber Bragg Gratting Interacting With Multimode Fiber,” Microw. Opt. Technol. Lett., vol. 52, no. 6, pp. 1375-1377, 2010.
[94] Q. Wu., S., B. Yan, Y. Ma, P. Wang, C. Yu, and G. Farrell, Fiber refractometer based on a fiber Bragg grating and single-mode–multimode–single-mode fiber structure,” Opt. Lett., vol. 36, no. 12, pp. 2197-2199, 2011.
[95] Q. Wu, A. M. Hatta, Y. Semenova, and G. Farrell, “Use of a single-multiple-single-mode fiber filter for interrogating fiber Bragg grating strain sensors with dynamic temperature compensation,” Appl. Opt., vol. 48, no. 29, pp. 5451-5458, 2009.
[96] O. Frazão, S. O. Silva, J. Viegas, L. A. Ferreira, F. M. Araújo, and J. L. Santos, “Optical fiber refractometry based on multimode interference,” Appl. Opt., vol. 50, no. 25, pp. E184-188, 2011.
[97] W. S. Mohammed, P. W. E. Smith, and X. Gu, “All-fiber multimode interference bandpass filter,” Opt. Lett., vol. 31, no. 17, pp. 2547-2549, 2006.
[98] K. Kawano, and T. Kitoh, “Introduction to optical waveguide analysis,” Chap. 5, Wiley, pp. 165–230, 2001.
[99] G. H. Meeten, and A. N. North, “Refractive index measurement of turbid colloidal fluids by transmission near the critical angle,” Meas. Sci. Technol., vol. 2, pp. 441-447, 1991.
[100] J. Rheims, J. Koser, and T. Wriedt, “Refractive-index measurements in the near-IR using an Abbe refractometer,” Meas. Sci. Technol., vol. 8, pp. 601-605, 1997.
[101] A. Asseh, S. Sandgren, H. Ahlfeldt, B. Sahlgren, and G. Edwall, “Fiber optical Bragg refractometer,” Fiber Integr. Opt., vol. 17, pp. 51-62, 1998.
References
- 162 -
[102] V. Bhatia, and A. M. Vengsarkar, “Optical fiber long-period grating sensors,” Opt. Lett., vol. 21, no. 9, pp. 692-694, 1996.
[103] R. C. Jorgenson, and S. S. Yee, “A fiber-optic chemical sensor based on surface plasmon resonance,” Sens. Actuat. B, vol. 12, no. 3, pp. 213-220, 1993.
[104] M. S. Meyer, and G. L. Eesley, “Optical fiber refractometer,” Rev. Sci. Instrum., vol. 58, pp. 2047-2048, 1987.
[105] C.-B. Kim, and C. B. Su, “Measurement of the refractive index of liquids at 1.3 and 1.5 micron using a fiber optic Fresnel ratio meter,” Meas. Sci. Technol., vol. 15, 1683-1686, 2004.
[106] S. F. O. Silva, O. Frazão, P. Caldas, J. L. Santos, F. M. Araújo, and L. A. Ferreira, “Optical fibre refractometer based on a Fabry-Pérot interferometer,” Opt. Eng., vol. 47, no. 5, 054403, 2008.
[107] D. A. Pereira, O. Frazão, and J. L. Santos, “Fibre Bragg grating sensing system for simultaneous measurement of salinity and temperature,” Opt. Eng., vol. 43, no. 2, pp. 299-304, 2004.
[108] O. Frazão, J. L. Santos, F. M. Araújo, L. A. Ferreira, “Optical sensing with photonic crystal fibers,” Laser Photon. Rev., vol. 2, no. 6, pp. 449-459, 2008.
[109] J. Kobelke, S. Unger, K. Schuster, A. Schwuchow, and J. Kirchhof, “Recent developments of microstructured fibers for active and passive applications,” PHOTONICS-2008: International Conference on Fiber Optics and Photonics, New Delhi, India, 14-17th December, 2008.
[110] M. C. Phan Huy, G. Laffont, Y. Frignac, V. Dewynter-Marty, P. Ferdinand, P. Roy, J-M. Blondy, D. Pagnoux, W. Blanc, and B. Dussardier, “Fibre Bragg grating photowriting in microstructured optical fibres for refractive index measurement,” Meas. Sci. Technol., vol. 17, pp. 992–997, 2006.
[111] L. Rindorf, and O. Bang, “Highly sensitive refractometer with a photonic-crystal-fiber long-period grating,” Opt. Lett., vol. 33, no. 6, pp. 563–565, 2008.
[112] N. A. Issa, “High numerical aperture in multimode microstructured optical fibers,” Appl. Opt., vol. 43, no. 33, pp. 6191-6197, 2004.
[113] O. Frazão, J. P. Carvalho, H. M. Salgado, “Low-loss splice in a microstructured fibre using a conventional fusion splicer,” Microwave Opt. Technol. Lett., vol. 46, no. 2, pp. 172-174, 2005.
[114] G. Abbate, U. Bernini, E. Ragozzino, F. Somma, “The temperature dependence of the refractive index of water,” J. Phys. D: Appl. Phys., vol. 11, pp. 1167-1172, 1978.
[115] J. C. Owens, “Optical refractive index of air: dependence on pressure, temperature and composition,” Appl. Opt., vol. 6, no. 1, pp. 51–59, 1967.
[116] J. G. Aguilar-Soto, J. E. Antonio-Lopez, J. J. Sanchez-Mondragon, and D. A. May-Arrioja, “Fiber optic temperature sensor based on multimode interference effects,” J. Phys. Conf. Ser. 274, 012011, 2011.
[117] S. T. Lee, J. Gin, V. P. N. Nampoori, C. P. G. Vallabhan, N. V. Unnikrishnan, and P. Radhakrishnan, “A sensitive fibre optic pH sensor using multiple sol-gel coatings”, J. Opt. A: Pure Appl. Opt., vol. 3, pp. 355–359, 2001.
[118] Y. Han, “Directional bending sensor with temperature insensitivity using a sampled chirped fiber Bragg grating”, J. Appl. Phys, vol. 105, no. 6, 063103, 2009.
[119] F. M. Araújo, L. A. Ferreira, J. L. Santos, and F. Farahi, “Temperature and strain insensitive bending measurements with D-type fibre Bragg gratings”, Meas. Sci. Technol., vol. 12, no. 7, pp. 829-833, 2001.
[120] H. Dobb, K. Kalli, and D. J. Webb, “Temperature-insensitive long period grating sensors in photonic crystal fibre”, Electron. Lett., vol. 40, no. 11, pp. 657-658, 2004.
[121] K. Okamoto, Fundamentals of optical waveguides. Elsevier, 2006.
[122] K. Skucha, Z. Fan, K. Jeon, A. Javey, and B. Boser, “Palladium/silicon nanowire Schottky barrier-based hydrogen sensors,” Sens. Actuators B, vol. 145, no. 1, pp. 232–238, 2010.
[123] G. Korotcenkov, S. D. Han, and J. R. Stetter, “Review of electrochemical hydrogen sensors,” Chem. Rev., vol. 109, no. 3, pp. 1402–1433, 2009.
References
- 163 -
[124] M. Nishibori, W. Shin, N. Izua, T. Itoh, I. Matsubara, S. Yasuda, and S. Ohtani, “Robust hydrogen detection system with a thermoelectric hydrogen sensor for hydrogen station application,” Int. J. Hydrogen Energy, vol. 34, no. 6, pp. 2834-2841, 2009.
[125] Y. Huang, Y. Chen, and T. Wu, “A passive wireless hydrogen surface acoustic wave sensor based on Pt-coated ZnO nanorods,” Nanotechnology J., vol. 21, no. 9, 095503, 2010.
[126] K. Lin, Y. Lu, J. Chen, R. Zheng, P. Wang, and H. Ming, “Surface plasmon resonance hydrogen sensor based on metallic grating with high sensitivity,” Opt. Express, vol. 16, no. 23, pp. 18599-18604, 2008.
[127] S. F. Silva, L. Coelho, O. Frazão, J. L. Santos, and F. X. Malcata, “A review of palladium-based fiber optic sensors for molecular hydrogen detection,” IEEE Sensors J., vol. 12, no. 1, pp. 93¬-102, 2012.
[128] K. Wyrzykowski, A. Rodzik, and B. Baranowski, “Optical transmission and reflection of PdHx thin films,” J. Phys. Condens. Matter, vol. 1, no. 12, pp. 2269–2277, 1989.
[129] F. A. Lewis, “The Palladium Hydrogen System”, Academic Press, London, 1967.
[130] J. I. Avila, R. J. Matelon, R. Trabol, M. Favre, D. Lederman, U. G. Volkmann, and A. L. Cabrera, “Optical properties of Pd thin films exposed to hydrogen studied by transmittance and reflectance spectroscopy,” J. Appl. Phys., vol. 107, 023504, 2010.
[131] X. Bévenot, A. Trouillet, C. Veillas, H. Gagnaire, and M. Clément, “Hydrogen leak detection using an optical fibre sensor for aerospace applications,” Sens. Actuators B, vol. 67, no. 1-2, pp. 57-67, 2000.
[132] L. Goddard, K. Y. Wong, A. Garg, E. Behymer, G. Cole, and T. Bond, “Measurements of the complex refractive index of Pd and Pt films in air and upon adsorption of H2 gas,” LEOS 2008 – Conference Proceedings (IEEE), pp. 569–570, 2008.
[133] M. A. Butler, “Optical fiber hydrogen sensor,” Appl. Phys. Lett., vol. 45, no. 10, pp. 2736-2740, 1984.
[134] M. A. Butler, and D. S. Ginley, “Hydrogen sensing with palladium-coated optical fibers,” J. Appl. Phys., vol. 64, no. 7, 1988.
[135] F. Farahi, P. A. Leilabady, J. D. C. Jones, and D. A. Jackson, “Interferometric fibre-optic hydrogen sensor,” J. Phys. E: Sci. Instrum., vol. 20, no. 4, 1987.
[136] J. S. Zeakes, K. A. Murphy, A. Elshabini-Raid, and R. U. Claus, “Modified extrinsic Fabry-Perot interferometric hydrogen gas sensor,” LEOS 1994 – Conference Proceedings (IEEE), vol. 2, pp. 235–236, 1994.
[137] E. Maciak, and Z. Opilski, “Transition metal oxides covered Pd film for optical H2 gas detection,” Thin Solid Films, vol. 515, no. 23, pp. 8351–8355, 2007.
[138] D. Iannuzzi, M. Slaman, J. H. Rector, H. Schreuders, S. Deladi, and M. C. Elwenspoek, “Fibre optic cantilever for hydrogen detection,” Sens. Actuators B, vol. 121, no. 2, pp. 706–708, 2007.
[139] Y. H. Kim, M. J. Kim, M. Park, J. Jang, and B. H. Lee, “Hydrogen sensor based on a palladium-coated long-period fiber grating pair,” J. Opt. Soc. Korea, vol. 12, no. 4, pp. 221-225, 2008.
[140] C. Ma, and A. Wang, “Optical fiber tip acoustic resonator for hydrogen sensing,” Opt. Lett., vol. 35, no. 12, pp. 2043-2045, 2010.
[141] Z. Yang, M. Zhang, Y. Liao, and Q. Tian, “Extrinsic Fabry–Perot interferometric optical fiber hydrogen detection system,” Appl. Opt., vol. 49, no. 15, pp. 2736-2740, 2010.
[142] K. S. Park, Y. H. Kim, J. B. Eom, S. J. Park, M.-S. Park, J.-H. Jang, and B. H. Lee, “Compact and multiplexible hydrogen gas sensor assisted by self-referencing technique,” Opt. Express, vol. 19, no. 19, pp. 18190-18198, 2011.
[143] M. A. Butler, “Fiber optic sensor for hydrogen concentration near the explosive limit,” J. Electrochem. Soc., vol. 138, no. 9, pp. 46-47, 1991.
[144] M. A. Butler, “Micromirror optical-fiber hydrogen sensor,” Sens. Actuators B, vol. 22, no. 2, pp. 155-163, 1994.

References
- 164 -
[145] M. Tabib-Azar, B. Sutapun, R. Petrick, and A. Kazemi, “Highly sensitive hydrogen sensors using palladium coated fiber optics with exposed cores and evanescent field interactions,” Sens. Actuators B, vol. 56, no. 1-2, pp. 158-163, 1999.
[146] S. Sekimoto, H. Nakagawa, S. Okazaki, K. Fukuda, S. Asakura, T Shigemori, and S. Takahashi, “A fiber-optic evanescent-wave hydrogen gas sensor using palladium-supported tungsten oxide,” Sens. Actuators B, vol. 66, no. 1-3, pp. 142-145, 2000.
[147] S. Okazaki, H. Nakagawa, S. Asakura, Y. Tomiuchi, N. Tsuji, H. Murayama, and M. Washiya, “Sensing characteristics of an optical fibre sensor for hydrogen leak,” Sens. Actuators B, vol. 93, no. 1-3, pp. 142-147, 2003.
[148] S. Sumida, S. Okazaki, S. Asakura, H. Nakagawa, H. Murayama, and T. Hasegawa, “Distributed hydrogen determination with fibre-optic sensor,” Sens. Actuators B, vol. 108, no. 1-2, pp. 508-514, 2005.
[149] T. Watanabe, S. Okazaki, H. Nakagawa, K. Murata, and K. Fukuda, “A fiber-optic hydrogen gas sensor with low propagation loss,” Sens. Actuators B, vol. 145, no. 2, pp. 781-787, 2010.
[150] J. Villatoro, A. Díez, J. L. Cruz, and M. V. Andrés, “Highly sensitive optical hydrogen sensor using circular Pd-coated singlemode tapered fiber,” Electron. Lett., vol. 37, no. 16, pp. 1011-1012, 2001.
[151] J. Villatoro, A. Díez, J. L. Cruz, and M. V. Andrés, “In-line highly sensitive hydrogen sensor based on palladium-coated singlemode taper fibers,” IEEE Sensors J., vol. 3, no. 4, pp. 533-537, 2003.
[152] X. Bévenot, A. Trouillet, C. Veillas, H. Gagnaire, and M. Clément, “Surface plasmon resonance hydrogen sensor using an optical fibre,” Meas. Sci. Technol., vol. 13, no. 1, pp. 118–124, 2002.
[153] Y. O. Barmenkov, A. Ortigosa-Blanch, A. Diez, J. L. Cruz, and M. V. Andrés, “Time-domain fibre laser hydrogen sensor,” Opt. Lett., vol. 29, no. 21, pp. 2461-2463, 2004.
[154] D. Zalvidea, A. Díez, J. L. Cruz, and M.V. Andrés, “Wavelength multiplexed hydrogen sensor based on palladium-coated fibre-taper and Bragg grating,” Electron. Lett., vol. 40, no. 5, pp. 301–302, 2004.
[155] J. Villatoro, D. Luna-Moreno, and D. Monzón-Hernández, “Optical fibre hydrogen sensor for concentrations below the lower explosive limit,” Sens. Actuators B, vol. 110, no. 1, pp. 23–27, 2005.
[156] J. Villatoro, and D. Monzón-Hernández, “Fast detection of hydrogen with nanofiber tapers coated with ultra thin palladium layers,” Opt. Express, vol. 13, no. 13, pp. 5087-5092, 2005.
[157] D. Zalvidea, A. Díez, J. L. Cruz, and M.V. Andrés, “Hydrogen sensor based on a palladium-coated fibre-taper with improved time response,” Sens. Actuators B, vol. 114, no. 1, pp. 268–274, 2006.
[158] K. T. Kim, H. S. Song, J. P. Mah, K. B. Hong, K. Im, S. Baik, and Y. Yoon, “Hydrogen sensor based on palladium coated side-polished singlemode fiber,” IEEE Sensors J., vol. 7, no. 12, pp. 1767-1770, 2007.
[159] D. Luna-Moreno, D. Monzón-Hernández, J. Villatoro, and G. Badenes, “Optical fiber hydrogen sensor based on core diameter mismatch and annealed Pd-Au thin films,” Sens. Actuators B, vol. 125, no. 1, pp. 66–71, 2007.
[160] D. Luna-Moreno, and D. Monzón-Hernández, “Effect of the Pd–Au thin film thickness uniformity on the performance of an optical fibre hydrogen sensor,” Appl. Surface Sci., vol. 253, no. 21, pp. 8615–8619, 2007.
[161] D. Monzón-Hernández, D. Luna-Moreno, and D. Martínez-Escobar, “Fast response fibre optic hydrogen sensor based on palladium and gold nano-layers,” Sens. Actuators B, vol. 136, no. 2, pp. 562–566, 2009.
[162] M. Slaman, B. Dam, M. Pasturel, D. M. Borsa, H. Schreuders, J. H. Rector, and R. Griessen, “Fiber optic hydrogen detectors containing Mg-based metal hydrides,” Sens. Actuators B, vol. 123, no. 1, pp. 538–545, 2007.
[163] K. Schroeder, W. Ecke, and R. Willsch, “Optical fibre Bragg grating hydrogen sensor based on evanescent-field interaction with palladium thin-film transducer,” Optics Lasers Eng., vol. 47, no. 10, pp. 1018-1022, 2009.

References
- 165 -
[164] W. Small, D. J. Maitland, T. S. Wilson, J. P. Bearinger, S. A. Letts, and J. E. Trebes, “Development of a prototype optical hydrogen gas sensor using a getter-doped polymer transducer for monitoring cumulative exposure – preliminary results,” Sens. Actuators B, vol. 139, no. 2, pp. 375–379, 2009.
[165] C. Perrotton, N. Javahiraly, M. Slaman, B. Dam, and P. Meyrueis, “Fiber optic Surface Plasmon Resonance sensor based on wavelength modulation for hydrogen sensing,” Opt. Express, vol. 19, no. S6, pp. A1175-A1183, 2011.
[166] C. Perrotton, R. J. Westerwaal, N. Javahiraly, M. Slaman, H. Schreuders, B. Dam, and P. Meyrueis, “A reliable sensitive and fast optical fiber hydrogen sensor based on surface plasmon resonance,” Opt. Express, vol. 21, no. 1, pp. 382-390, 2013.
[167] B. Sutapun, M. Tabib-Azar, and A. Kazemi, “Pd-coated elastooptic fibre optic Bragg grating sensors for multiplexed hydrogen sensing,” Sens. Actuators B, vol. 60, no. 1, pp. 27–34, 1999.
[168] M. Buric, K. P. Chen, M. Bhattarai, P. R. Swinehart, and M. Maklad, “Active fibre Bragg grating hydrogen sensors for all-temperature operation,” IEEE Photon. Technol. Lett., vol. 19, no. 5, pp. 255-257, 2007.
[169] J. Dai, M. Yang, Y. Chen, K. Cao, H. Liao, and P. Zhang, “Side-polished fiber Bragg grating hydrogen sensor with WO3-Pd composite film as sensing materials,” Opt. Express, vol. 19, no. 7, pp. 6141-6148, 2011.
[170] J. Dai, M. Yang, X. Yu, and H. Lu, “Optical hydrogen sensor based on etched fiber Bragg grating sputtered with PdAg composite film,” Opt. Fiber Technol., vol. 19, pp. 26-30, 2013.
[171] G.-M. Ma, C.-R. Li, Y.-T. Luo, R.-D. Mu, and L. Wang, “High sensitive and reliable fiber Bragg grating hydrogen sensor for fault detection of power transformer,” Sens. Actuators B, vol. 169, pp. 195–198, 2013.
[172] A. Trouillet, E. Marin, and C. Veillas, “Fibre gratings for hydrogen sensing,” Meas. Sci. Technol., vol. 17, no. 5, pp. 1124–1128, 2006.
[173] X. Wei, T. Wei, H. Xiao, and Y.S. Lin, “Nano-structured Pd-long period fibre gratings integrated optical sensor for hydrogen detection,” Sens. Actuators B, vol. 134, no. 2, pp. 687–693, 2008.
[174] X. Tang, K. Remmel, X. Lan, J. Deng, H. Xiao, and J. Dong, “Perovskite-type oxide thin film integrated fiber optic sensor for high-temperature hydrogen measurement,” Anal. Chem., vol. 81, no. 18, pp. 7844–7848, 2009.
[175] Y. H. Kim, M. J. Kim, B. S. Rho, M.-S. Park, J.-H. Jang, and B. H. Lee, “Ultra Sensitive Fiber-Optic Hydrogen Sensor Based on High Order Cladding Mode,” IEEE Sensors J., vol. 11, no. 6, pp. 1423-1426, 2011.
[176] M. Aleixandre, P. Corredera, M. L. Hernanz, and J. Gutierrez-Monreal, “Development of fibre optic hydrogen sensors for testing nuclear waste repositories,” Sens. Actuators B, vol. 107, no. 1, pp. 113-120, 2005.
[177] R. R. J. Maier, J. S. Barton, J. D. C. Jones, S. McCulloch, B. J. S. Jones, and G. Burnell, “Palladium-based hydrogen sensing for monitoring of ageing materials,” Meas. Sci. Technol., vol. 17, no. 5, pp. 1118-1123, 2006.
[178] R. R. J. Maier, J. D. C. Jones, J. S. Barton, S. McCulloch, T. Allsop, B. J. S. Jones, and I. Bennion, “Fibre optics in palladium-based hydrogen sensing,” J. Opt. A: Pure Appl. Opt., vol. 9, no. 6, pp. S45-S59, 2007.
[179] K. M. Chung, Z. Liu, C. Lu, and H.-Y. Tam, “Single reflective mode fiber Bragg grating in multimode microfiber,” IEEE Photon. J., vol. 4, no. 2, pp. 437-442, 2012.
[180] Y. Zhang, B. Lin, S.C Tjin, H. Zhang, G. Wang, P. Shum, and X. Zhang, “Refractive index sensing based on higher-order mode reflection of a microfiber Bragg grating,” Opt. Express, vol. 18, 26345-26350, 2010.
[181] Y. Ran, Y.-N. Tan, L. Jin, L.-P. Sun, J. Li, and B.-O. Guan, “High-efficiency ultraviolet inscription of Bragg gratings in microfibers,” IEEE Photon. J., vol. 4, no. 1, pp. 181¬-186, 2012.
[182] J.-L. Kou, M. Ding, J. Feng, Y.-Q. Lu, F. Xu. and G. Brambilla, “Microfiber-based Bragg gratings for sensing applications: A review,” Sensors, vol. 12, pp. 8861-8876, 2012.
References
- 166 -
[183] S. Silva, L. Coelho, J. M. Almeida, O. Frazão, J. L. Santos, F. X. Malcata, M. Becker, M. Rothhardt, and H. Bartelt, “H2 Sensing Based on a Pd-Coated Tapered-FBG Fabricated by DUV Femtosecond Laser Technique,” IEEE Photon. Technol. Lett., vol. 25, no. 4, pp.401-403, 2013.
[184] P. A. S. Jorge, S. O. Silva, C. Gouveia, P. Tafulo, L. Coelho, P. Caldas, D. Viegas, G. Rego, J. M. Baptista, J. L. Santos, and O. Frazão, “Fiber Optic-Based Refractive Index Sensing at INESC Porto,” Sensors, vol. 12, pp. 8371-8389, 2012.
[185] E. Kretschmann, H. Raether, “Radiative decay of non radiative surface plasmons excited by light,” Z. Naturforsch. A, vol. 23, pp. 2135-2136, 1968.
[186] A. Hassani, B. Gauvreau, M. Fehri, A. Kabashin, M. Skorobogatiy, “Photonic crystal fiber and waveguide-based surface plasmon resonance sensors for application in the visible and near-IR,” Electromagnetics, vol. 28, pp. 198-213, 2008.
[187] M. Kanso, S. Cuenot, and G. Louarn “Sensitivity of Optical Fiber Sensor Based on Surface Plasmon Resonance: Modeling and Experiments,” Plasmonics, vol. 3, pp. 49-57, 2008.
[188] M.-H. Chiu, “Single-mode D-type Surface Plasmon Resonance Optical Fiber sensors: Review,” Sens. Transducers. J., Vol. 111, no. 12, pp. 106-124, 2009.
[189] N. Cennamo, D, Massarotti, L. Conte, and L. Zeni, “Low Cost Sensors Based on SPR in a Plastic Optical Fiber for Biosensor Implementation,” Sensors, vol. 11, pp. 11752-11760, 2011.
[190] F. Xu, P. Horak, and G. Brambilla, “Optical microfiber coil resonator refractometric sensor,” Opt. Express, vol. 15, no. 12, pp. 7888–7893, 2007.
[191] F. Xu, and G. Brambilla, “Demonstration of a refractometric sensor based on optical microfiber coil resonator,” Appl. Phys. Lett., vol. 92, 101126, 2008.
[192] F. Xu, V. Pruneri, V. Fibazzi, and G. Brambilla, “An embedded optical nanowire loop resonator refractometric sensor,” Opt. Express, vol. 16, no. 2, pp. 1062-1067, 2008.
[193] X. Guo, and L. Tong, “Supported microfiber loops for optical sensing,” Opt. Express, vol. 16, no. 19, pp. 14429-14434, 2008.
[194] M. Sumetsky, R. S. Windeler, Y. Dulashko, and X. Fan, “Optical liquid ring resonator sensor,” Opt. Express, vol. 15, no. 22, pp. 14376-14381, 2007.
[195] T. C. Oates, and L. W. Burgess, “Sensitive Refractive Index Detection Using a Broad-Band Optical Ring Resonator,” Anal. Chem., vol. 84, pp. 7713−7720, 2012.
[196] N. M. Hanumegowda, C. J. Stica, B. C. Patel, I. White, and X. Fan, “Refractometric sensors based on microsphere resonators,” Appl. Phys. Lett., vol. 87, 201107, 2005.
[197] H. Wang, L. Yuan, C.-W. Kim, Q. Han, T. Wei, X. Lan, and H. Xiao, “Optical microresonator based on hollow sphere with porous wall for chemical sensing,” Opt. Lett., vol. 37, no. 1, pp. 94-96, 2012.
[198] Y. Zhi, T. Thiessen, and A. Meldrum, “Silicon quantum dot coated microspheres for microfluidic refractive index sensing,” J. Opt. Soc. Am. B, vol. 30, no. 1, pp. 51-56, 2013.
[199] H. Waechter, J. Litman, A. H. Cheung, J. A. Barnes, and H.-P. Loock, “Chemical Sensing Using Fiber Cavity Ring-Down Spectroscopy,” Sensors, vol. 10, pp. 1716-1742, 2010.
[200] N. Ni, C. Chan, L. Xia, and P. Shum, “Fiber cavity ring-down refractive index sensor,” IEEE Photon. Technol. Lett., vol. 20, no. 16, pp. 1351-1353, 2008.
[201] K. M. Zhou, D. Webb, M. Farries, N. Hayes, L. Zhang, and I. Bennion, “Biochemical sensor based on a novel all-fibre cavity ring down spectroscopy technique incorporating a tilted fibre Bragg grating,” Opt. Lasers Eng., vol. 47, pp. 1023-1027, 2009.
[202] K. M. Zhou, D. J. Webb, C. B. Mou, M. Farries, N. Hayes, and I. Bennion, “Optical fiber cavity ring down measurement of refractive index with a microchannel drilled by femtosecond laser,” IEEE Photonics Technol. Lett., vol. 21, no. 22, pp. 1653-1655, 2009.
[203] W. C. Wong, W. Zhou, C. C. Chan, X. Dong, and K. C. Leong, “Cavity ringdown refractive index sensor using photonic crystal fiber interferometer,” Sens. Actuat. B, vol. 161, pp. 108-113, 2012.

References
- 167 -
[204] Y.-J. Rao, M. Deng, D.-W. Duan, and T. Zhu, “In-line fiber Fabry-Perot refractive-index tip sensor based on endlessly photonic crystal fiber,” Sens. Actuat. A, vol. 148, pp. 33-38, 2008.
[205] T. Wei, Y. Han, Y. Li, H.-L. Tsai, and H. Xiao, “Temperature-insensitive miniaturized fiber inline Fabry-Perot interferometer for highly sensitive refractive index measurement,” Opt. Express, vol. 16, no. 8, pp. 5764-5769, 2008.
[206] Z.L. Ran, Y. J. Rao, W. J. Liu, X. Liao, and K. S. Chiang, “Laser-micromachined Fabry-Perot optical fiber tip sensor for high-resolution temperature-independent measurement of refractive index,” Opt. Express, vol. 16, no. 3, pp. 2252-2263, 2008.
[207] O. Frazão, P. Caldas, J. L. Santos, P. V. S. Marques, C. Turck, D. J. Lougnot, and O. Soppera, “Fabry–Perot refractometer based on an end-of-fiber polymer tip,” Opt. Lett., vol. 34, no. 16, pp. 2474-2476, 2009.
[208] O. Frazão, J. M. Baptista, J. L. Santos, J. Kobelke, and K. Schuster, “ Refractive index tip sensor based on Fabry-Perot cavities formed by a suspended core fibre,” J. Eur. Opti. Soc.-Rapid Publ., vol. 4, 09041, 2009.
[209] Y. Gong, T. Zhao, Y.-J. Rao, Y. Wu, and Y. Guo, “A ray-transfer-matrix model for hybrid fiber Fabry-Perot sensor based on graded-index multimode fiber,” Opt. Express, vol. 18, no. 15, pp.15844-15852, 2010.
[210] J.-I. Kou, J. Feng, Q.-L. Wang, F. Xu, and Y.-Q. Lu, “Microfiber-probe-based ultrasmall interferometric sensor,” Opt. Lett., vol. 35, no. 13, pp. 2308-2310, 2010.
[211] K. M. Zhou, Z. J. Yan, L. Zhang, and I. Bennion, “Refractometer based on fiber Bragg grating Fabry-Perot cavity embedded with a narrow microchannel,” Opt. Express, vol. 19, no. 12, pp. 11769-11779, 2011.
[212] M. V. Berry, “Regular and irregular semiclassical wavefunctions,” J. Phys. A, vol. 10, no. 2, pp. 2083-2091, 1977.
[213] K. Suzuki, Y. Imai, and F. Okumura, “Proposal for temperature and pressure sensing based on periodic chaos synchronization in optical fiber ring resonator systems,” Digests 16th International Conf. Optical Fiber Sensors Japan, pp. 204-207, 2003.
[214] C. Jáuregui, J. M. López-Higuera, A. Cobo, and O. M. Conde, and J. Zubía, “Multiparameter sensor based on a chaotic fiber-ring resonator,” J. Opt. Soc. Am. B, vol. 23, no. 10, pp. 2024-2031, 2006.
[215] N. Fang, C. Shan, L. Wang, and Z. Huang, “Polarization chaos distributed sensing with a semiconductor fiber ring laser,” Conference on Lasers & Electro Optics & The Pacific Rim Conference on Lasers and Electro-Optics, 2009.
[216] V. Doya, O. Legrand, F. Mortessagne, and C. Miniatura, “Light scarring in an optical fiber,” Phys. Rev. Lett., vol. 88, 014102, 2002.
[217] V. Doya, O. Legrand, F. Mortessagne, and C. Miniatura, “Speckle Statistics in a Chaotic Multimode Fiber,” Phys. Rev. E, vol. 65, 056223, 2002.
[218] V. Doya, O. Legrand, C. Michel, and F. Mortessagne, “Optical scar in a chaotic fiber,” Eur. Phys. J. Special Topics, vol. 145, pp. 49-61, 2007.
[219] P. Leproux, S. Février, V. Doya, P. Roy, and D. Pagnoux, “Modeling and optimization of double-clad fiber amplifiers using chaotic propagation of the pump,” Opt. Fiber Technol., vol. 6, pp. 324-339, 2001.
[220] P. Leproux, V. Doya, P. Roy, D. Pagnoux, F. Mortessagne, and O. Legrand, “Experimental study of pump power absorption along rare-earth-doped double clad optical fibres,” Opt. Commun., vol. 218, pp. 249-254, 2003.
[221] V. Doya, O. Legrand, and F. Mortessagne, “Optimized absorption in a chaotic double-clad fiber amplifier,” Opt. Lett., vol. 26, no. 12, pp. 872-874, 2001.
[222] C. Michel, V. Doya, O. Legrand, and F. Mortessagne, “Selective amplification of scars in a chaotic optical fiber,” Phys. Rev. Lett., vol. 99, 224101, 2007.
References
- 168 -
[223] C. Michel, S. Tascu, V. Doya, O. Legrand, and F. Mortessagne, “Gain- controlled wave chaos in a chaotic optical fibre,” J. European Opt. Soc. - Rapid publications, vol. 4, 09020, 2009.
[224] G. Z. Xiao, A. Adnet, Z. Zhang, F. G. Sun, and C. P. Grover, “Temperature-independent refractive index measurement based on Fabry–Perot fiber tip sensor modulated by Fresnel reflection,” Sens. Actuat. A, vol. 118, no. 2, pp. 177-182, 2005.
[225] J. Liu, Y.Z. Sun, and X.D. Fan, “Highly versatile fiber-based optical Fabry-Perot gas sensor,” Opt. Express, vol. 17, no. 4, 2731-2738, 2009.
[226] T. Allsop, R. Neal, E. M. Davies, C. Mou, P. Bond, S. Rehman, K. Kalli, D. J. Webb, P. Calverhouse, and I. Bennion, “Low refractive index gas sensing using a surface plasmon resonance fibre device,” Meas. Sci. Technol., vol. 21, 094029, 2010.
[227] M. Deng, C.-P. Tang, T. Zhu, Y.-J. Rao, L.-C. Xu, and M. Han, “Refractive index measurement using photonic crystal fiber-based Fabry–Perot interferometer,”Appl. Opt., vol. 49, no. 9, pp. 1593-1598, 2010.
[228] M. Gregor, C. Pyrlik, R Henze, A. Wicht, A. Peters, and O. Benson, “An alignment-free fiber-coupled microsphere resonator for gas sensing applications,” Appl. Phys. Lett., vol. 96, 231102, 2010.
[229] M. S. Ferreira, L. Coelho, K. Schuster, J. Kobelke, J. L. Santos, and O. Frazao, “Fabry-Perot cavity based on a diaphragm-free hollow-core silica tube,” Opt. Lett., vol. 36, no. 20, pp. 4029-4031, 2011.
[230] D. W. Duan, Y. J. Rao, L. C. Xu, T. Zhu, D. Wu, and J. Yao, “In-fiber Mach-Zehnder interferometer formed by large lateral offset fusion splicing for gases refractive index measurement with high sensitivity,” Sensor. Actuat. B, vol. 160, pp. 1198-1202, 2011.
[231] W. Duan, Y. Rao, and T. Zhu, “High sensitivity gas refractometer based on all-fiber open-cavity Fabry-Perot interferometer formed by large lateral offset splicing,” JOSA B, vol. 29, no. 5, pp. 912-915, 2012.
[232] L. Coelho, P. A. R. Tafulo, P. A. S. Jorge, J. L. Santos, D. Viegas, K. Schuster, J. Kobelke, and O. Frazão, “Simultaneous measurement of partial pressure of O2 and CO2 with a hybrid interferometer,” Opt. Lett., vol. 37, no. 15, pp. 3063-3065, 2012.
[233] M.S. Ferreira, J. Bierlich, H. Lehmann, K. Schuster, J. Kobelke, J.L. Santos, and O. Frazao, “Fabry-Perot Cavity Based on Hollow-Core Ring Photonic Crystal Fiber for Pressure Sensing,” IEEE Photon. Technol. Lett., vol. 24, no. 23, pp. 2122-2124, 2012.
[234] H. Wang, L. Yuan, C.-W. Kim, Q. Han, T. Wei, X. Lan, and H. Xiao, “Optical microresonator based on hollow sphere with porous wall for chemical sensing,” Opt. Lett., vol. 37, no. 1, pp. 94-96, 2012.
[235] M. J. Weber, “Handbook of Optical Materials,” CRC Press, 2003.
[236] Y. Clergent, C. Durou, and M. Laurens, “Refractive index variations for Argon, Nitrogen, and Carbon Dioxide at λ = 632.8 nm (He-Ne Laser Light) in the range 288.15 K § T § 323.15 K, 0 < p < 110 kPa,” J. Chem. Eng. Data, vol. 44, pp. 197-199, 1999.
[237] G. Abbate, A. Attanasio, U. Bernini, E. Ragozzino, and F. Somma, “The direct determination of the temperature dependence of the refractive index of liquids and solids,” J. Phys. D: Appl. Phys., vol. 9, pp. 1945-1951, 1976.
[238] P. Schiebener, J. Straub, J. M. Levelt, and J. S. Gallagher, “Refractive index of water and steam as function of wavelength, temperature and density,” J. Phys. Chem. Ref. Data, vol. 19, no. 3, pp. 677-717, 1990.
[239] E. Hecht, “Óptica,” Fundação Calouste Gulbenkian, 1991.
[240] G. Z. Xiao, A. Adnet, Z. Zhang, F. G. Sun, C. P. Grover, “Monitoring changes in the refractive index of gases by means of a fiber optic Fabry-Perot interferometer sensor,” Sensor. Actuat. A, vol. 118, no. 2, pp. 177-182, 2005.