empresa de electricidade da madeira · empresa de electricidade da madeira 1 index board of...
TRANSCRIPT
Empresa de Electricidade da Madeira
1
Index
Board of Directors 3
Organigram 4
Characteristic Data 5 Transmission Network 6 Summary 9
Technical Information 11 I. Production 13 II. Transmission 21 III. Distribution 25 IV. Commercialisation 27 V. Service Quality 32 VI. Unspecified Investments 33 VII. Human Resources 34
Economic and Financial Information 35
Consolidated and Individual Financial Statements 65
Statutory Auditor’s Report Consolidated Financial Statements 121
Extract of the Minute of the General Assembly Meeting 127
Note to reader:
This document is a translation of a Portuguese version. In case of doubt arising from the text here presented, the Portuguese version prevails.

Empresa de Electricidade da Madeira
3
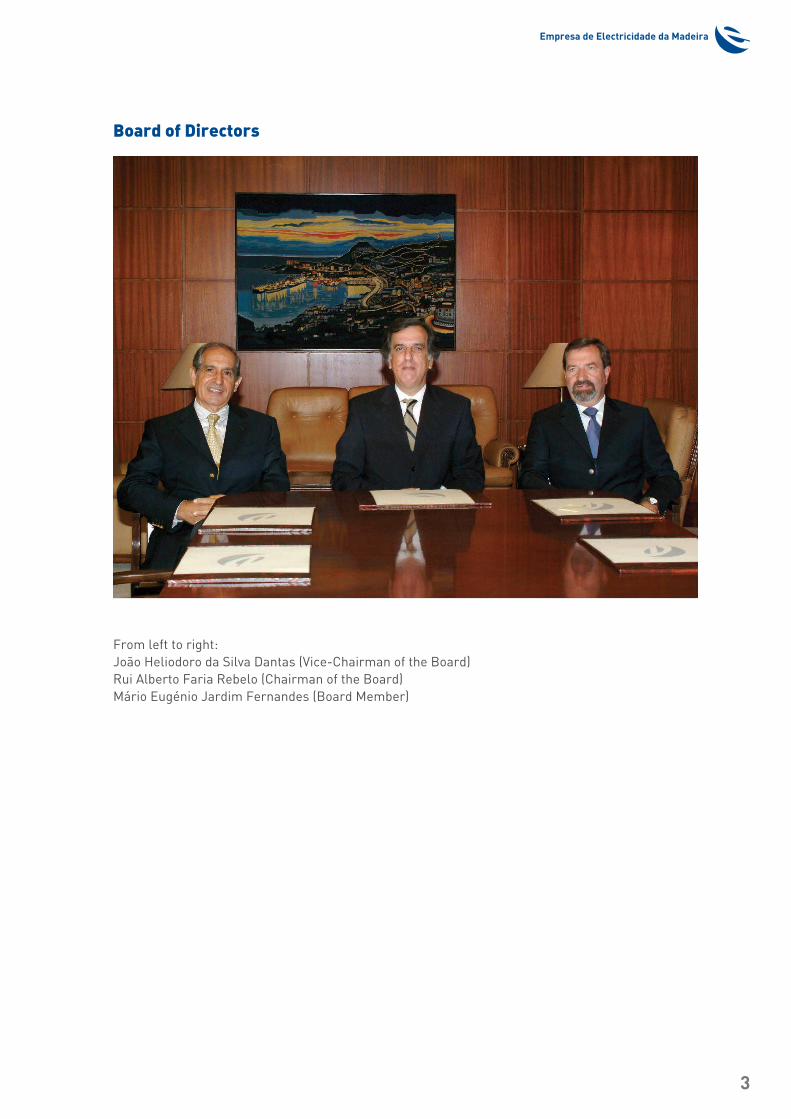
Board of Directors
From left to right:João Heliodoro da Silva Dantas (Vice-Chairman of the Board)Rui Alberto Faria Rebelo (Chairman of the Board)Mário Eugénio Jardim Fernandes (Board Member)
4
Annual Report 2013Organigram
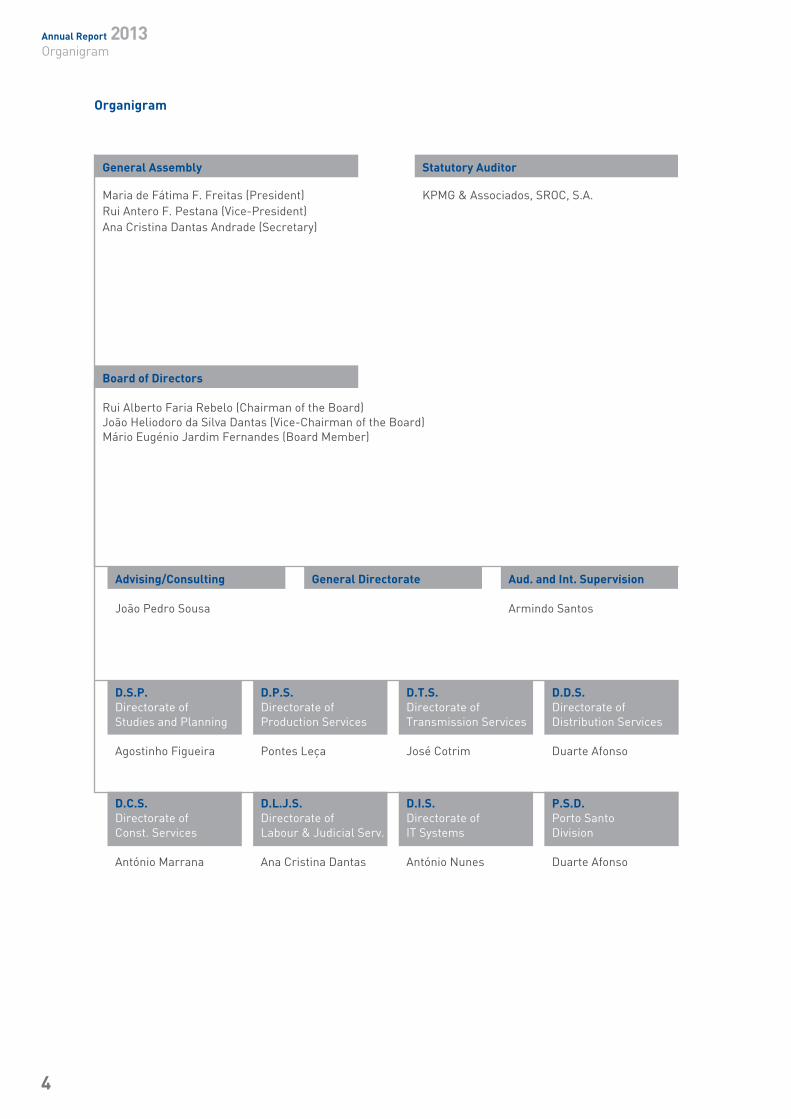
Organigram
CharacteristicData
Annual Report 2013Characteristic Data
6
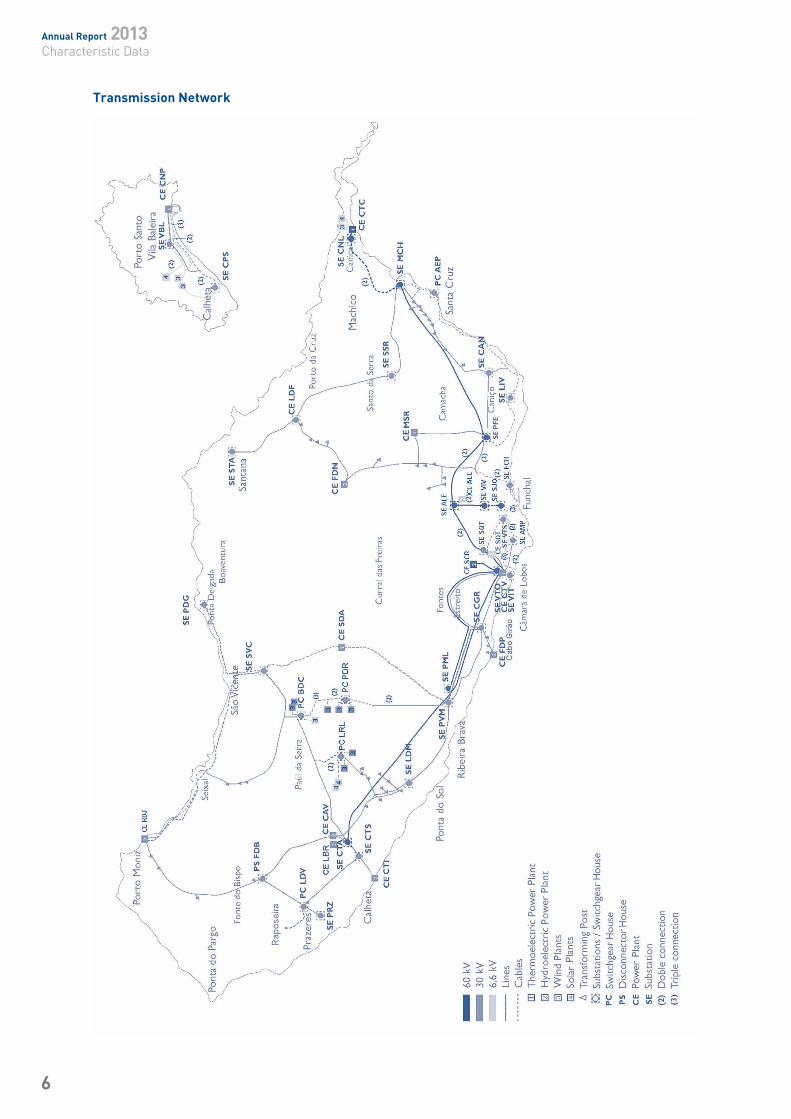
Transmission Network
Empresa de Electricidade da Madeira
7
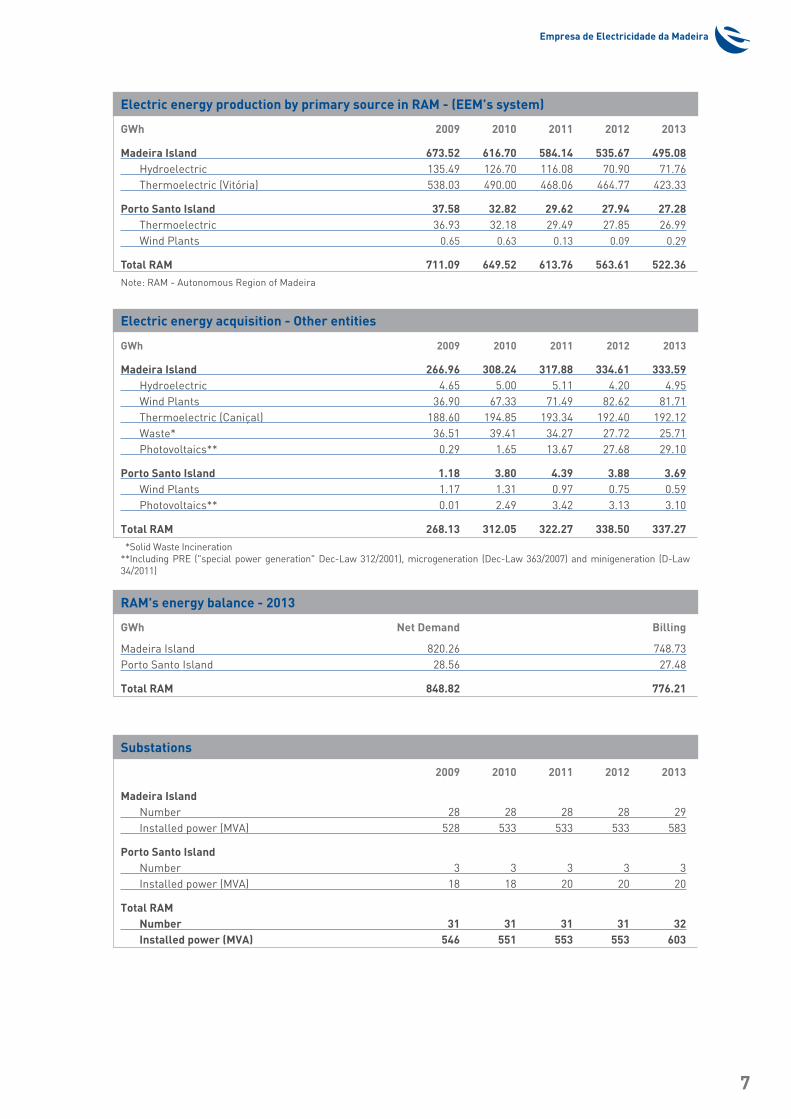
Electric energy production by primary source in RAM - (EEM’s system)
GWh 2009 2010 2011 2012 2013
Madeira Island 673.52 616.70 584.14 535.67 495.08 Hydroelectric 135.49 126.70 116.08 70.90 71.76 Thermoelectric (Vitória) 538.03 490.00 468.06 464.77 423.33
Porto Santo Island 37.58 32.82 29.62 27.94 27.28 Thermoelectric 36.93 32.18 29.49 27.85 26.99 Wind Plants 0.65 0.63 0.13 0.09 0.29
Total RAM 711.09 649.52 613.76 563.61 522.36
Note: RAM - Autonomous Region of Madeira
Substations
2009 2010 2011 2012 2013
Madeira Island Number 28 28 28 28 29 Installed power (MVA) 528 533 533 533 583
Porto Santo Island Number 3 3 3 3 3 Installed power (MVA) 18 18 20 20 20
Total RAM Number 31 31 31 31 32 Installed power (MVA) 546 551 553 553 603
Electric energy acquisition - Other entities
GWh 2009 2010 2011 2012 2013
Madeira Island 266.96 308.24 317.88 334.61 333.59 Hydroelectric 4.65 5.00 5.11 4.20 4.95 Wind Plants 36.90 67.33 71.49 82.62 81.71 Thermoelectric (Caniçal) 188.60 194.85 193.34 192.40 192.12 Waste* 36.51 39.41 34.27 27.72 25.71 Photovoltaics** 0.29 1.65 13.67 27.68 29.10
Porto Santo Island 1.18 3.80 4.39 3.88 3.69 Wind Plants 1.17 1.31 0.97 0.75 0.59 Photovoltaics** 0.01 2.49 3.42 3.13 3.10
Total RAM 268.13 312.05 322.27 338.50 337.27
*Solid Waste Incineration**Including PRE ("special power generation" Dec-Law 312/2001), microgeneration (Dec-Law 363/2007) and minigeneration (D-Law 34/2011)
RAM's energy balance - 2013
GWh Net Demand Billing
Madeira Island 820.26 748.73Porto Santo Island 28.56 27.48
Total RAM 848.82 776.21
Annual Report 2013Characteristic Data
8
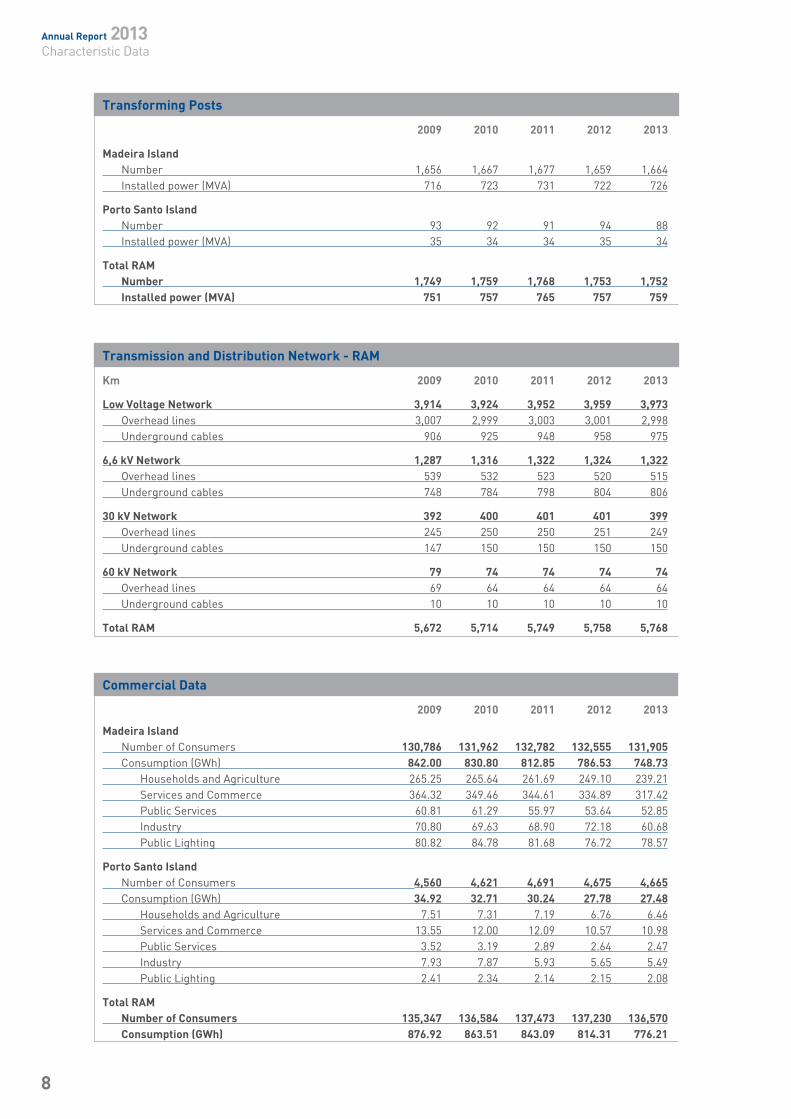
Transforming Posts
2009 2010 2011 2012 2013
Madeira Island Number 1,656 1,667 1,677 1,659 1,664 Installed power (MVA) 716 723 731 722 726
Porto Santo Island Number 93 92 91 94 88 Installed power (MVA) 35 34 34 35 34
Total RAM Number 1,749 1,759 1,768 1,753 1,752 Installed power (MVA) 751 757 765 757 759
Transmission and Distribution Network - RAM
Km 2009 2010 2011 2012 2013
Low Voltage Network 3,914 3,924 3,952 3,959 3,973 Overhead lines 3,007 2,999 3,003 3,001 2,998 Underground cables 906 925 948 958 975
6,6 kV Network 1,287 1,316 1,322 1,324 1,322 Overhead lines 539 532 523 520 515 Underground cables 748 784 798 804 806
30 kV Network 392 400 401 401 399 Overhead lines 245 250 250 251 249 Underground cables 147 150 150 150 150
60 kV Network 79 74 74 74 74 Overhead lines 69 64 64 64 64 Underground cables 10 10 10 10 10
Total RAM 5,672 5,714 5,749 5,758 5,768
Commercial Data
2009 2010 2011 2012 2013
Madeira Island Number of Consumers 130,786 131,962 132,782 132,555 131,905 Consumption (GWh) 842.00 830.80 812.85 786.53 748.73 Households and Agriculture 265.25 265.64 261.69 249.10 239.21 Services and Commerce 364.32 349.46 344.61 334.89 317.42 Public Services 60.81 61.29 55.97 53.64 52.85 Industry 70.80 69.63 68.90 72.18 60.68 Public Lighting 80.82 84.78 81.68 76.72 78.57
Porto Santo Island Number of Consumers 4,560 4,621 4,691 4,675 4,665 Consumption (GWh) 34.92 32.71 30.24 27.78 27.48 Households and Agriculture 7.51 7.31 7.19 6.76 6.46 Services and Commerce 13.55 12.00 12.09 10.57 10.98 Public Services 3.52 3.19 2.89 2.64 2.47 Industry 7.93 7.87 5.93 5.65 5.49 Public Lighting 2.41 2.34 2.14 2.15 2.08
Total RAM Number of Consumers 135,347 136,584 137,473 137,230 136,570 Consumption (GWh) 876.92 863.51 843.09 814.31 776.21
Empresa de Electricidade da Madeira
9
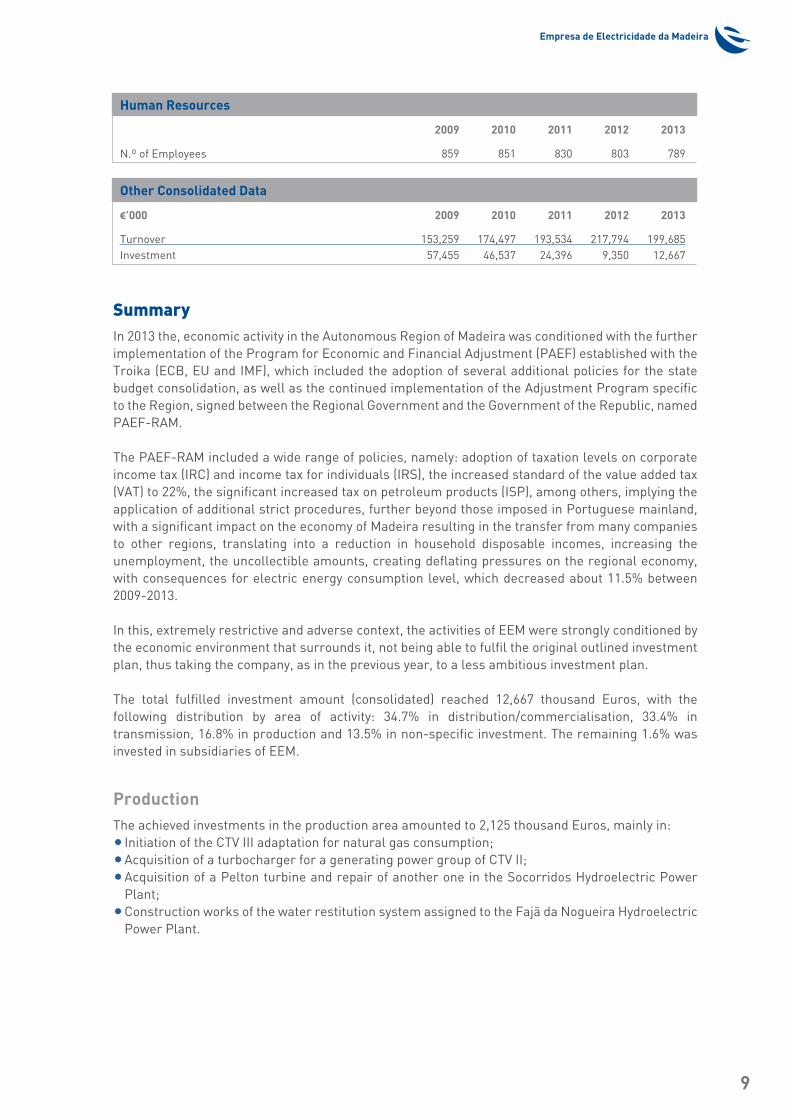
Human Resources
2009 2010 2011 2012 2013
N.º of Employees 859 851 830 803 789
Other Consolidated Data
€’000 2009 2010 2011 2012 2013
Turnover 153,259 174,497 193,534 217,794 199,685Investment 57,455 46,537 24,396 9,350 12,667
SummaryIn 2013 the, economic activity in the Autonomous Region of Madeira was conditioned with the further implementation of the Program for Economic and Financial Adjustment (PAEF) established with the Troika (ECB, EU and IMF), which included the adoption of several additional policies for the state budget consolidation, as well as the continued implementation of the Adjustment Program specific to the Region, signed between the Regional Government and the Government of the Republic, named PAEF-RAM.
The PAEF-RAM included a wide range of policies, namely: adoption of taxation levels on corporate income tax (IRC) and income tax for individuals (IRS), the increased standard of the value added tax (VAT) to 22%, the significant increased tax on petroleum products (ISP), among others, implying the application of additional strict procedures, further beyond those imposed in Portuguese mainland, with a significant impact on the economy of Madeira resulting in the transfer from many companies to other regions, translating into a reduction in household disposable incomes, increasing the unemployment, the uncollectible amounts, creating deflating pressures on the regional economy, with consequences for electric energy consumption level, which decreased about 11.5% between 2009-2013.
In this, extremely restrictive and adverse context, the activities of EEM were strongly conditioned by the economic environment that surrounds it, not being able to fulfil the original outlined investment plan, thus taking the company, as in the previous year, to a less ambitious investment plan.
The total fulfilled investment amount (consolidated) reached 12,667 thousand Euros, with the following distribution by area of activity: 34.7% in distribution/commercialisation, 33.4% in transmission, 16.8% in production and 13.5% in non-specific investment. The remaining 1.6% was invested in subsidiaries of EEM.
ProductionThe achieved investments in the production area amounted to 2,125 thousand Euros, mainly in:• Initiation of the CTV III adaptation for natural gas consumption;• Acquisition of a turbocharger for a generating power group of CTV II;• Acquisition of a Pelton turbine and repair of another one in the Socorridos Hydroelectric Power
Plant;• Construction works of the water restitution system assigned to the Fajã da Nogueira Hydroelectric
Power Plant.
Annual Report 2013Characteristic Data
10
TransmissionThe accomplished investments in the transmission area amounted to 4,231 thousand Euros, essentially in the reinforcement of the transmission network and in substations/switchgear houses remodelling.
The main investments realised in substations, can be presented as follows:• Conclusion of the construction works on Pedra Mole Substation;• Conclusion of the remodelling in the Loiral Switchgear Post;• Completion of the safety protections in Palheiro Ferreiro Substation;• Conclusion of the 30 kV cells remodelling in Vila Baleira Substation.
In the transmission network, the main investments are as follow:• Conclusion of the construction works along the section between the Porto Santo Thermoelectric
Power Plant and Calheta Substation;• Completion of the first remodelling interconnection network phase of the Funchal Substation in
30 kV, motivated by public construction works at the mouth of the Santa Luzia and João Gomes riversides.
Regarding the dispatch centre, it should be noted the SCADA migration project to Network Manager and the remote control of the new Pedra Mole Substation.
Distribution/CommercialisationThe achieved investments in the distribution/commercialisation sector reached the amount of 4,395 thousand Euros, being detailed as follows:• Connection of 10 new transforming posts for public service;• Connection of 5 new private transforming posts to network;• Construction of 7.84 km of medium voltage network;• Removal of 10.09 km of medium voltage network;• Remodelling of 8.04 km of medium voltage network;• Construction of 17.60 km of low voltage network;• Removal of 6.64 km of low voltage network;• Remodelling of 68.40 of km low voltage network;• Installation of 62 new public lighting luminaries;• Replacement of 935 public lighting luminaries;• The electric energy sales reached 748.73 GWh in Madeira Island and 27.48 GWh in Porto Santo
Island, totalising 776.21 GWh in RAM;• The average number of clients connected to the network, in 31st December 2013, reached 131,905
and 4,665 in Madeira and Porto Santo islands, respectively.
Other accomplishmentsThe fulfilled investments regarding unspecified areas, in a transversal way to the Company, were as follows: general installations, equipment’s, tools and information systems, reaching the amount of 1,711 thousand Euros. In this area, it is important to highlight the facilities and information systems, with particular emphasis on the following projects:• Acquisition of land for the implementation of warehouses to support public lighting;• Improvement interventions of the east and north facades of the Headquarters building;• Acquisition of new equipment for Wave Power Quality;• Implementation of various improvements in the SAP system;• The taking into operation of the project WFM - Work Force Management (SGE - Management Team
System);• Changes in BI - Business Intelligence – System (Reporting Tools)..

TechnicalInformation

Empresa de Electricidade da Madeira
13
I. ProductionIn 2013, the investments in the production area amounted to 2,125 thousand Euros, highlighted by: the start of the CTV III adaptation works for natural gas consumption and interventions in hydraulic infrastructures of the hydroelectric power plants systems.
A. Madeira Island
Hydroelectric utilitiesAmong all the investments carried out during 2013, regarding the hydroelectric power plants, were highlighted the following actions:• Acquisition of a Pelton turbine and repair of another one in the Socorridos Hydroelectric Power
Plant;• Construction works of the water restitution system to the Fajã da Nogueira Hydroelectric Power
Plant;• Repair of the water canals sections assigned to the Fajã da Nogueira Hydroelectric Power Plant;• Repair of the water canals assigned to the Ribeira da Janela Hydroelectric Power Plant, in Lajes
and Galhano streams;• Repair of the diversion system of the Rabaças water canals, including the decanting system and
aqueduct in the Laje da Madeira location, serving the Serra de Água hydroelectric system;• Partial repair of the water caption system in the Fajã Escura location and installation of a discharge
regulation system allocated to the Socorridos Hydroelectric Power Plant.
Thermoelectric utilities
Vitória Thermoelectric Power Plant
In Vitória Thermoelectric Power Plant are reported the following actions:• Initiation of the CTV III adaptation for natural gas consumption;• Acquisition of a turbocharger for a generating power group of CTV II.
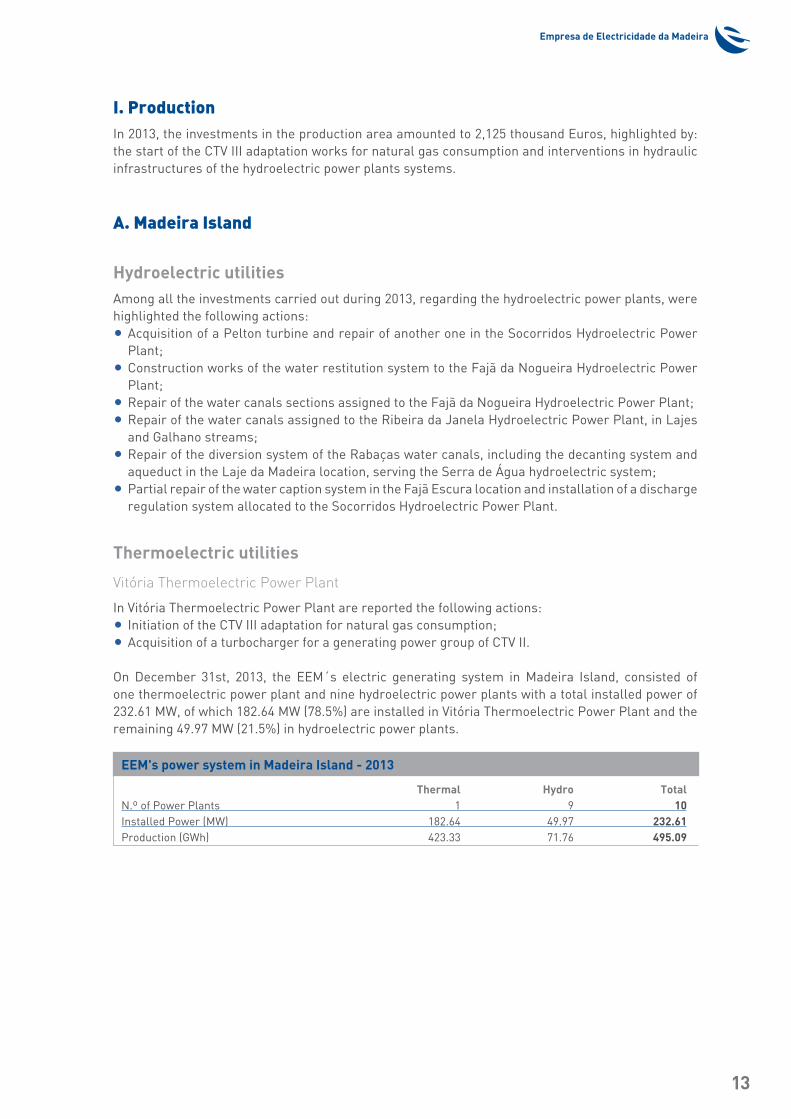
On December 31st, 2013, the EEM´s electric generating system in Madeira Island, consisted of one thermoelectric power plant and nine hydroelectric power plants with a total installed power of 232.61 MW, of which 182.64 MW (78.5%) are installed in Vitória Thermoelectric Power Plant and the remaining 49.97 MW (21.5%) in hydroelectric power plants.
EEM's power system in Madeira Island - 2013
Thermal Hydro TotalN.º of Power Plants 1 9 10Installed Power (MW) 182.64 49.97 232.61Production (GWh) 423.33 71.76 495.09
Annual Report 2013Technical Information
14
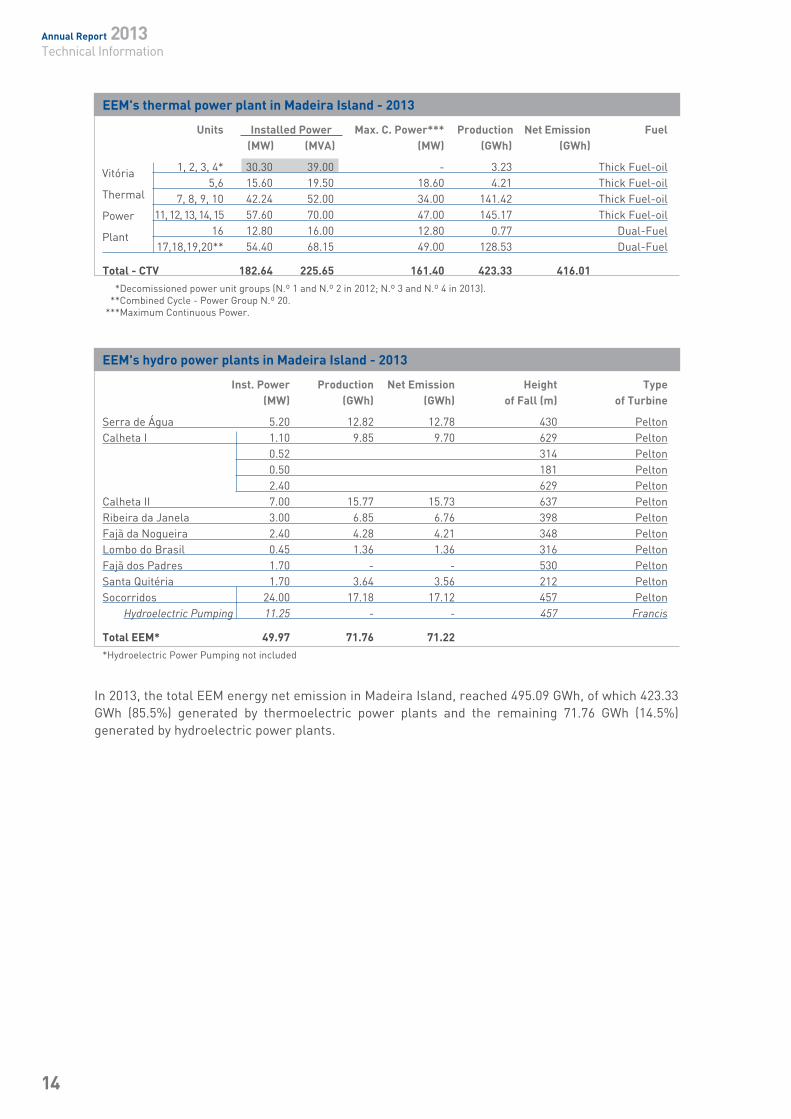
EEM's thermal power plant in Madeira Island - 2013
Units Installed Power Max. C. Power*** Production Net Emission Fuel (MW) (MVA) (MW) (GWh) (GWh)
1, 2, 3, 4* 30.30 39.00 - 3.23 Thick Fuel-oil 5,6 15.60 19.50 18.60 4.21 Thick Fuel-oil 7, 8, 9, 10 42.24 52.00 34.00 141.42 Thick Fuel-oil 11, 12, 13, 14, 15 57.60 70.00 47.00 145.17 Thick Fuel-oil 16 12.80 16.00 12.80 0.77 Dual-Fuel 17,18,19,20** 54.40 68.15 49.00 128.53 Dual-Fuel
Total - CTV 182.64 225.65 161.40 423.33 416.01
* Decomissioned power unit groups (N.º 1 and N.º 2 in 2012; N.º 3 and N.º 4 in 2013). ** Combined Cycle - Power Group N.º 20. *** Maximum Continuous Power.
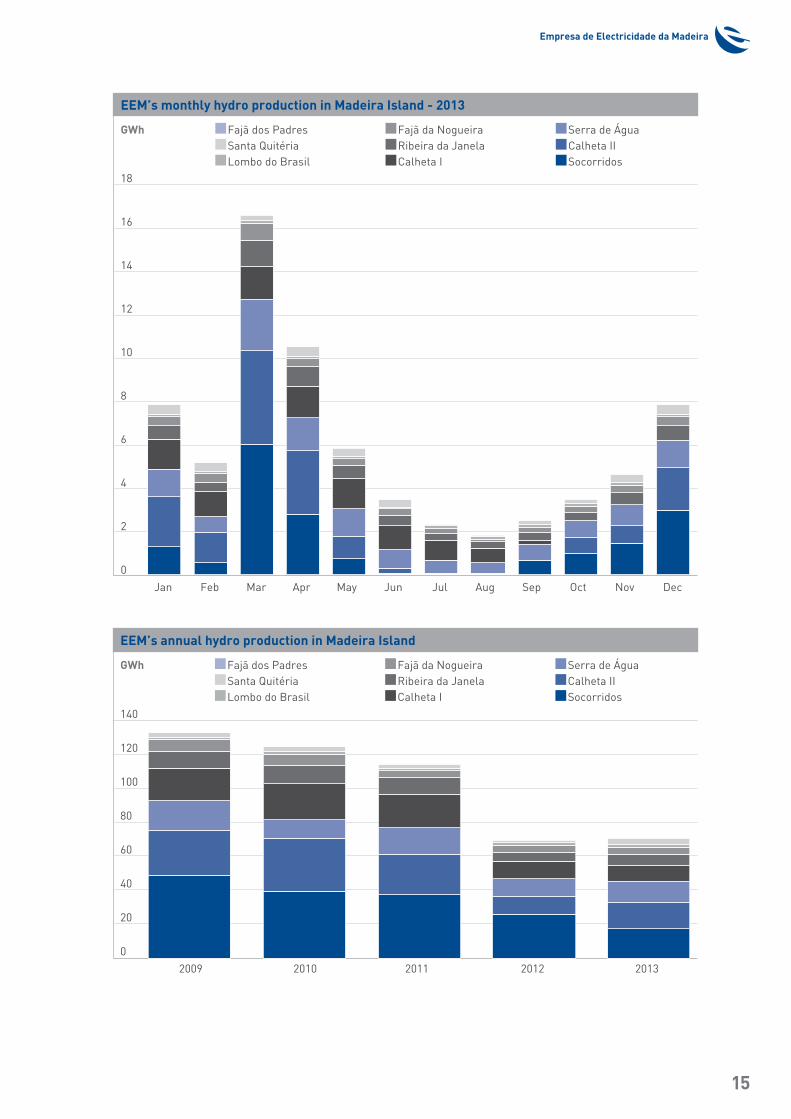
EEM's hydro power plants in Madeira Island - 2013
Inst. Power Production Net Emission Height Type (MW) (GWh) (GWh) of Fall (m) of Turbine
Serra de Água 5.20 12.82 12.78 430 PeltonCalheta I 1.10 9.85 9.70 629 Pelton 0.52 314 Pelton 0.50 181 Pelton 2.40 629 PeltonCalheta II 7.00 15.77 15.73 637 PeltonRibeira da Janela 3.00 6.85 6.76 398 PeltonFajã da Nogueira 2.40 4.28 4.21 348 PeltonLombo do Brasil 0.45 1.36 1.36 316 PeltonFajã dos Padres 1.70 - - 530 PeltonSanta Quitéria 1.70 3.64 3.56 212 PeltonSocorridos 24.00 17.18 17.12 457 Pelton Hydroelectric Pumping 11.25 - - 457 Francis
Total EEM* 49.97 71.76 71.22
*Hydroelectric Power Pumping not included
In 2013, the total EEM energy net emission in Madeira Island, reached 495.09 GWh, of which 423.33 GWh (85.5%) generated by thermoelectric power plants and the remaining 71.76 GWh (14.5%) generated by hydroelectric power plants.
Vitória
Thermal
Power
Plant
Empresa de Electricidade da Madeira
15
EEM’s monthly hydro production in Madeira Island - 2013
GWh Fajã dos Padres Fajã da Nogueira Serra de Água Santa Quitéria Ribeira da Janela Calheta II Lombo do Brasil Calheta I Socorridos18
16
14
12
10
8
6
4
2
0
Jan Feb Mar Apr May Jun Jul Aug Sep Oct Nov Dec
EEM’s annual hydro production in Madeira Island
GWh Fajã dos Padres Fajã da Nogueira Serra de Água Santa Quitéria Ribeira da Janela Calheta II Lombo do Brasil Calheta I Socorridos140
120
100
80
60
40
20
0
2009 2010 2011 2012 2013
Annual Report 2013Technical Information
16
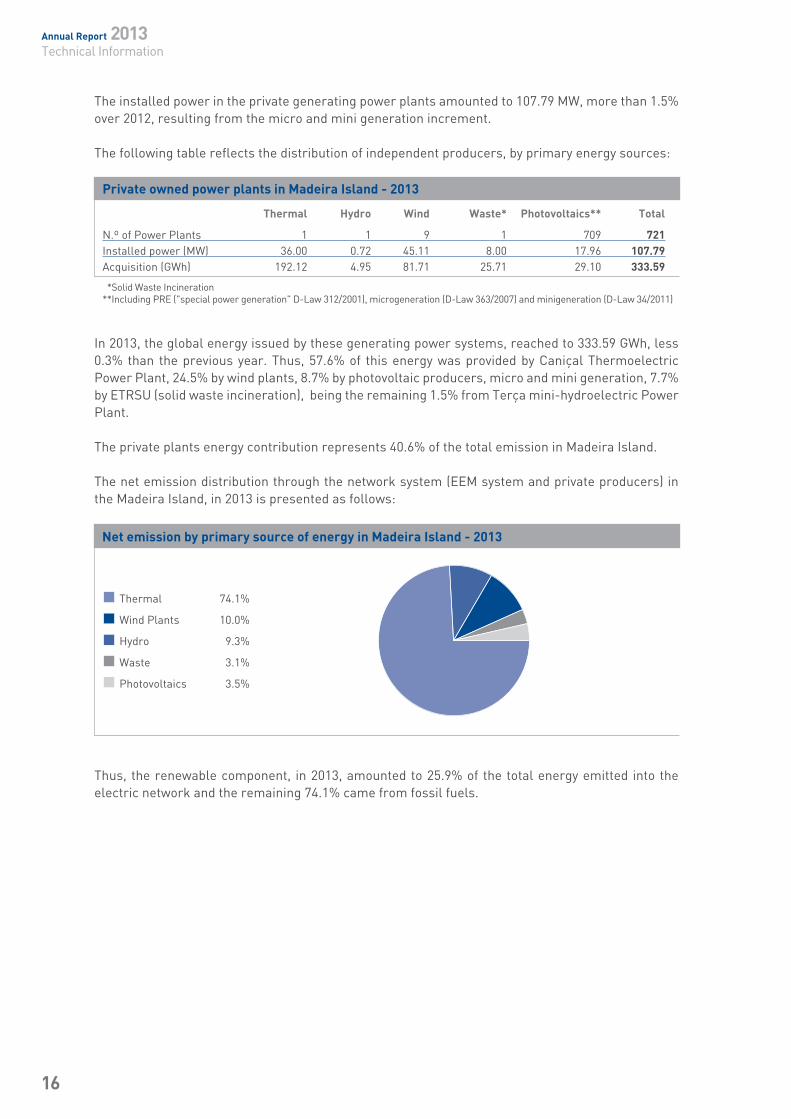
The installed power in the private generating power plants amounted to 107.79 MW, more than 1.5% over 2012, resulting from the micro and mini generation increment.
The following table reflects the distribution of independent producers, by primary energy sources:
In 2013, the global energy issued by these generating power systems, reached to 333.59 GWh, less 0.3% than the previous year. Thus, 57.6% of this energy was provided by Caniçal Thermoelectric Power Plant, 24.5% by wind plants, 8.7% by photovoltaic producers, micro and mini generation, 7.7% by ETRSU (solid waste incineration), being the remaining 1.5% from Terça mini-hydroelectric Power Plant.
The private plants energy contribution represents 40.6% of the total emission in Madeira Island.
The net emission distribution through the network system (EEM system and private producers) in the Madeira Island, in 2013 is presented as follows:
Thus, the renewable component, in 2013, amounted to 25.9% of the total energy emitted into the electric network and the remaining 74.1% came from fossil fuels.
Private owned power plants in Madeira Island - 2013
Thermal Hydro Wind Waste* Photovoltaics** Total
N.º of Power Plants 1 1 9 1 709 721Installed power (MW) 36.00 0.72 45.11 8.00 17.96 107.79Acquisition (GWh) 192.12 4.95 81.71 25.71 29.10 333.59
*Solid Waste Incineration**Including PRE ("special power generation" D-Law 312/2001), microgeneration (D-Law 363/2007) and minigeneration (D-Law 34/2011)
Net emission by primary source of energy in Madeira Island - 2013
Thermal 74.1%
Wind Plants 10.0%
Hydro 9.3%
Waste 3.1%
Photovoltaics 3.5%
Empresa de Electricidade da Madeira
17
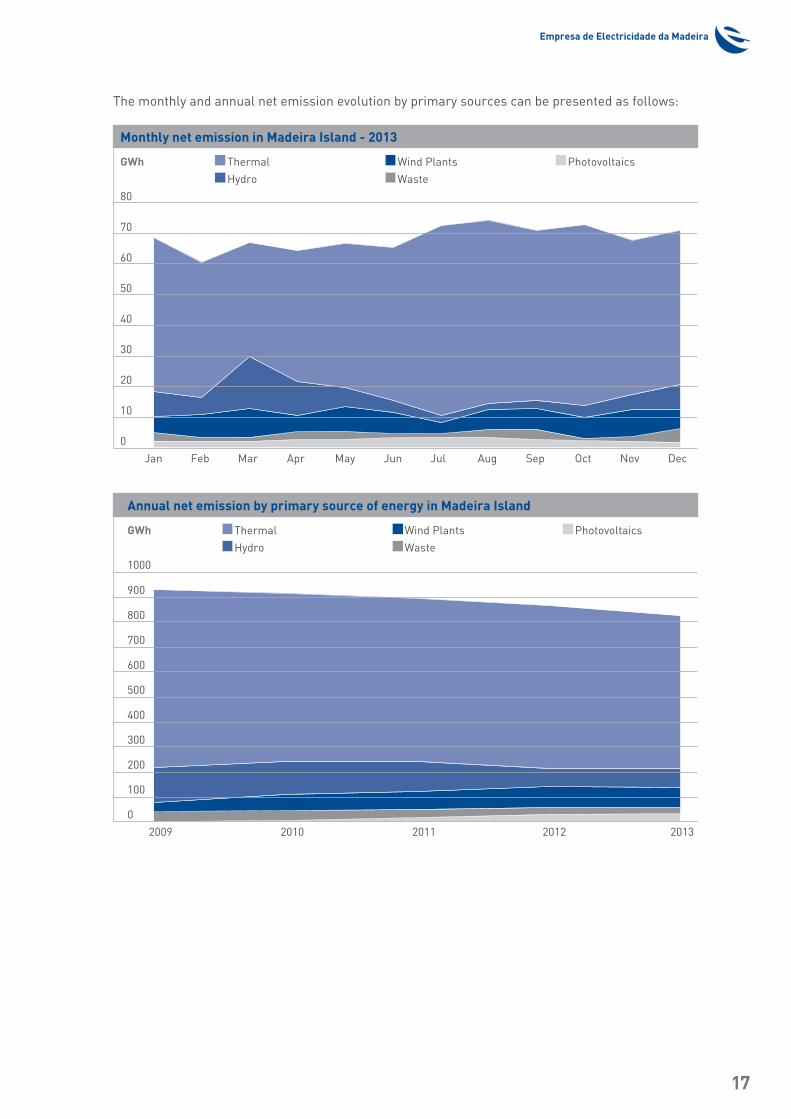
The monthly and annual net emission evolution by primary sources can be presented as follows:
Annual net emission by primary source of energy in Madeira Island
GWh Thermal Wind Plants Photovoltaics
Hydro Waste
1000
900
800
700
600
500
400
300
200
100
0
2009 2010 2011 2012 2013
Monthly net emission in Madeira Island - 2013
GWh Thermal Wind Plants Photovoltaics
Hydro Waste
80
70
60
50
40
30
20
10
0
Jan Feb Mar Apr May Jun Jul Aug Sep Oct Nov Dec
Annual Report 2013Technical Information
18
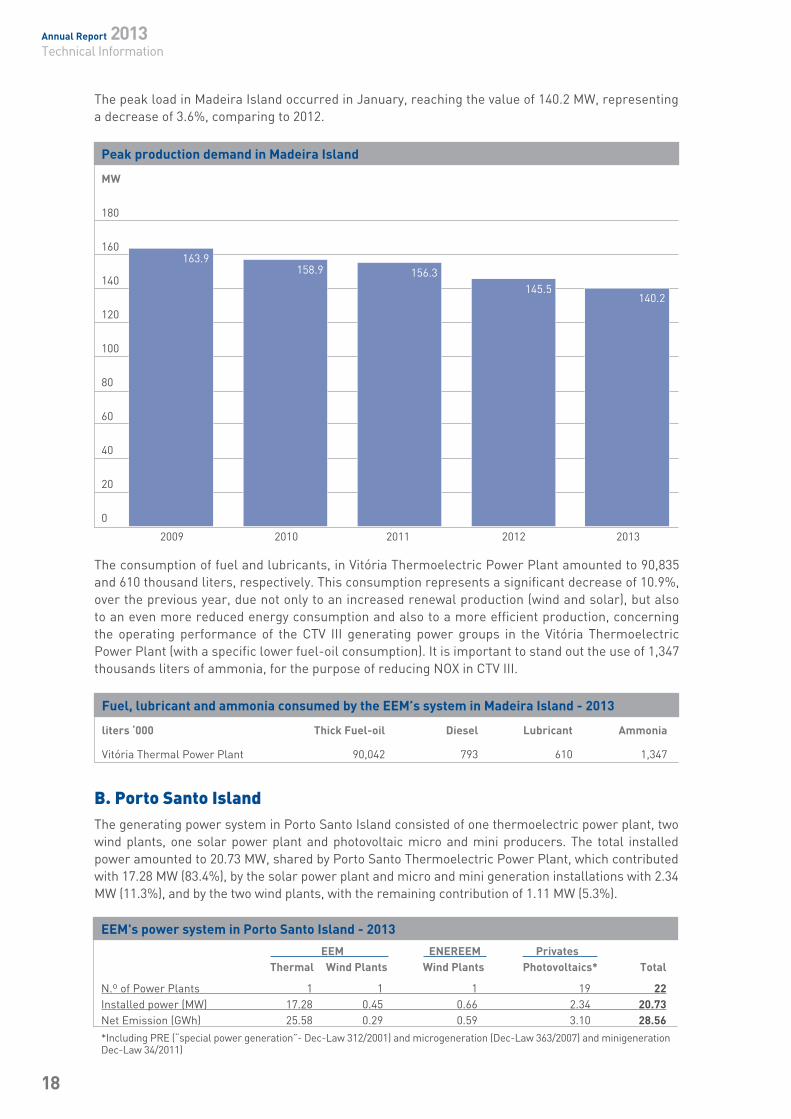
The peak load in Madeira Island occurred in January, reaching the value of 140.2 MW, representing a decrease of 3.6%, comparing to 2012.
Fuel, lubricant and ammonia consumed by the EEM’s system in Madeira Island - 2013
liters ‘000 Thick Fuel-oil Diesel Lubricant Ammonia
Vitória Thermal Power Plant 90,042 793 610 1,347
The consumption of fuel and lubricants, in Vitória Thermoelectric Power Plant amounted to 90,835 and 610 thousand liters, respectively. This consumption represents a significant decrease of 10.9%, over the previous year, due not only to an increased renewal production (wind and solar), but also to an even more reduced energy consumption and also to a more efficient production, concerning the operating performance of the CTV III generating power groups in the Vitória Thermoelectric Power Plant (with a specific lower fuel-oil consumption). It is important to stand out the use of 1,347 thousands liters of ammonia, for the purpose of reducing NOX in CTV III.
B. Porto Santo IslandThe generating power system in Porto Santo Island consisted of one thermoelectric power plant, two wind plants, one solar power plant and photovoltaic micro and mini producers. The total installed power amounted to 20.73 MW, shared by Porto Santo Thermoelectric Power Plant, which contributed with 17.28 MW (83.4%), by the solar power plant and micro and mini generation installations with 2.34 MW (11.3%), and by the two wind plants, with the remaining contribution of 1.11 MW (5.3%).
Peak production demand in Madeira Island
MW
180
160
140
120
100
80
60
40
20
0
2009 2010 2011 2012 2013
140.2
163.9158.9 156.3
145.5
EEM's power system in Porto Santo Island - 2013
EEM ENEREEM Privates Thermal Wind Plants Wind Plants Photovoltaics* Total
N.º of Power Plants 1 1 1 19 22Installed power (MW) 17.28 0.45 0.66 2.34 20.73Net Emission (GWh) 25.58 0.29 0.59 3.10 28.56
*Including PRE (“special power generation”- Dec-Law 312/2001) and microgeneration (Dec-Law 363/2007) and minigeneration Dec-Law 34/2011)
Empresa de Electricidade da Madeira
19
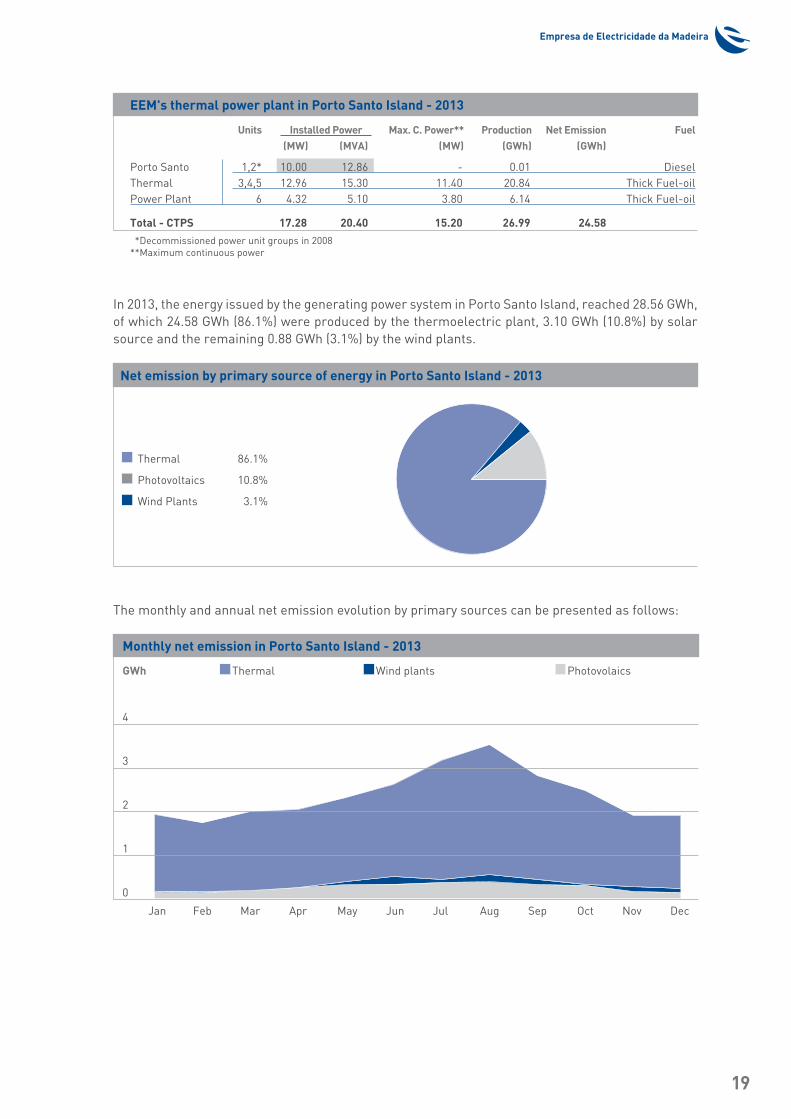
In 2013, the energy issued by the generating power system in Porto Santo Island, reached 28.56 GWh, of which 24.58 GWh (86.1%) were produced by the thermoelectric plant, 3.10 GWh (10.8%) by solar source and the remaining 0.88 GWh (3.1%) by the wind plants.
The monthly and annual net emission evolution by primary sources can be presented as follows:
EEM's thermal power plant in Porto Santo Island - 2013
Units Installed Power Max. C. Power** Production Net Emission Fuel (MW) (MVA) (MW) (GWh) (GWh)
Porto Santo 1,2* 10.00 12.86 - 0.01 DieselThermal 3,4,5 12.96 15.30 11.40 20.84 Thick Fuel-oilPower Plant 6 4.32 5.10 3.80 6.14 Thick Fuel-oil
Total - CTPS 17.28 20.40 15.20 26.99 24.58
*Decommissioned power unit groups in 2008**Maximum continuous power
Monthly net emission in Porto Santo Island - 2013
GWh Thermal Wind plants Photovolaics
Jan Feb Mar Apr May Jun Jul Aug Sep Oct Nov Dec
4
3
2
1
0
Net emission by primary source of energy in Porto Santo Island - 2013
Thermal 86.1%
Photovoltaics 10.8%
Wind Plants 3.1%
Annual Report 2013Technical Information
20
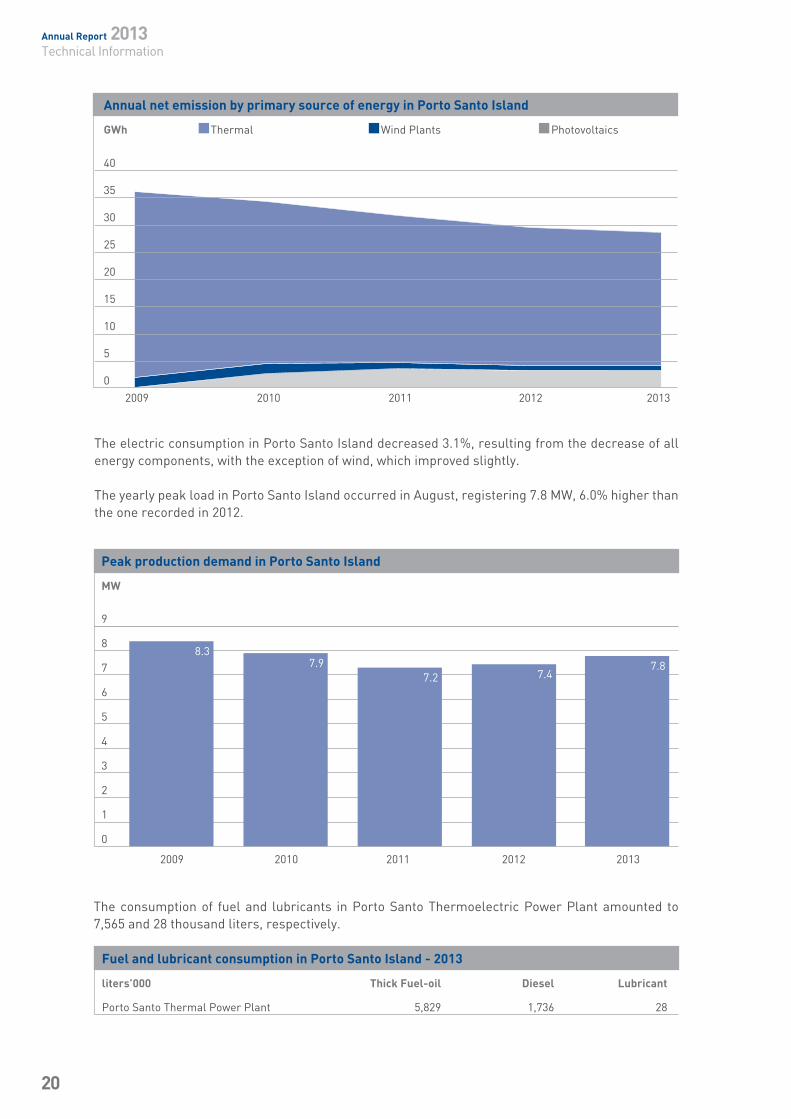
The electric consumption in Porto Santo Island decreased 3.1%, resulting from the decrease of all energy components, with the exception of wind, which improved slightly.
The yearly peak load in Porto Santo Island occurred in August, registering 7.8 MW, 6.0% higher than the one recorded in 2012.
The consumption of fuel and lubricants in Porto Santo Thermoelectric Power Plant amounted to 7,565 and 28 thousand liters, respectively.
Annual net emission by primary source of energy in Porto Santo Island
GWh Thermal Wind Plants Photovoltaics
40
35
30
25
20
15
10
5
0
2009 2010 2011 2012 2013
Fuel and lubricant consumption in Porto Santo Island - 2013
liters’000 Thick Fuel-oil Diesel Lubricant
Porto Santo Thermal Power Plant 5,829 1,736 28
Peak production demand in Porto Santo Island
MW 9
8
7
6
5
4
3
2
1
0
2009 2010 2011 2012 2013
8.37.9
7.2 7.47.8
Empresa de Electricidade da Madeira
21
There was an increase in fuel consumption of around 2.1% over the previous year.
II. TransmissionIn transmission, the most significant accomplished investments were substations/switchgear houses and transmission lines, totalling 4,231 thousand Euros.
Substations/Switchgear HousesIn the substation/switchgear houses area the main investments, are presented as follows:• Conclusion of the construction works on Pedra Mole Substation;• Conclusion of the remodelling in the Loiral Switchgear Post;• Completion of the safety protections in Palheiro Ferreiro Substation;• Conclusion of the 30 kV cells remodelling in Vila Baleira Substation;• Continuation of the execution projects and tendering procedures for the construction of new
substations, namely: Prazeres, Lombo do Meio and Amparo. These interventions will be considered as total remodelling.
Beyond the already refereed investments, the following actions should be highlighted:• Carrying out general maintenance works, in particular on the power transformers;• Development of thermograph inspection works.
Annual Report 2013Technical Information
22
Transmission networkIn the transmission network, the main undertaken investments are as follows:• Conclusion of the works for the underground section between Porto Santo Thermoelectric Power
Plant and Calheta Substation;• Conclusion of the first phase of the remodelling works of the 30 KV interconnection grid for the
Funchal Substation. Following the “Storm”, on 20th February 2010, the Regional Government promoted a strategic plan to change the courses of the Santa Luzia and João Gomes riversides, in downtown Funchal. The subsequent project alters substantially the architecture in the surrounding area to the EEM´s Headquarters, where it´s located the Funchal Substation, of 30 MVA-30/6.6 which intervention area is coincident with the main connection of underground cables to this substation.
Other interventions took place, including the replacement of suspension isolators, terminal boxes, support displacement requested by clients, as well as the deforesting of line corridors and cleaning the bases of overhead lines support.
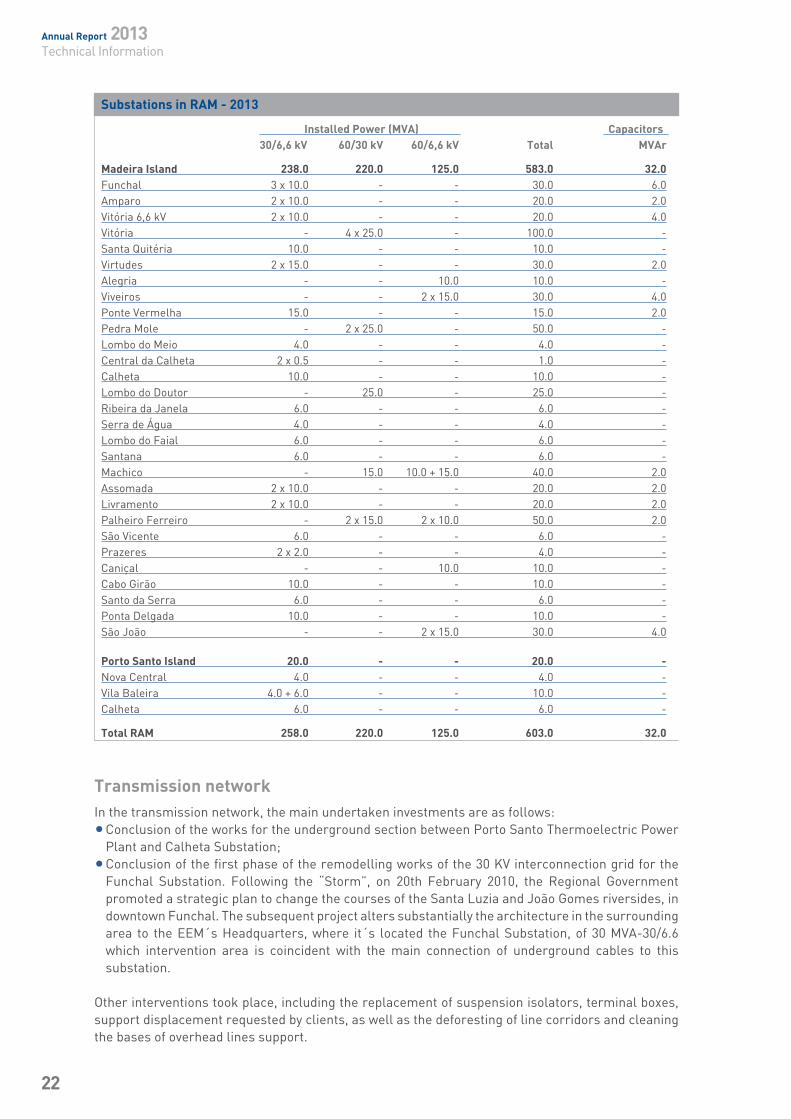
Substations in RAM - 2013
Installed Power (MVA) Capacitors 30/6,6 kV 60/30 kV 60/6,6 kV Total MVAr
Madeira Island 238.0 220.0 125.0 583.0 32.0Funchal 3 x 10.0 - - 30.0 6.0Amparo 2 x 10.0 - - 20.0 2.0Vitória 6,6 kV 2 x 10.0 - - 20.0 4.0Vitória - 4 x 25.0 - 100.0 -Santa Quitéria 10.0 - - 10.0 -Virtudes 2 x 15.0 - - 30.0 2.0Alegria - - 10.0 10.0 -Viveiros - - 2 x 15.0 30.0 4.0Ponte Vermelha 15.0 - - 15.0 2.0Pedra Mole - 2 x 25.0 - 50.0 -Lombo do Meio 4.0 - - 4.0 -Central da Calheta 2 x 0.5 - - 1.0 -Calheta 10.0 - - 10.0 -Lombo do Doutor - 25.0 - 25.0 -Ribeira da Janela 6.0 - - 6.0 -Serra de Água 4.0 - - 4.0 -Lombo do Faial 6.0 - - 6.0 -Santana 6.0 - - 6.0 -Machico - 15.0 10.0 + 15.0 40.0 2.0Assomada 2 x 10.0 - - 20.0 2.0Livramento 2 x 10.0 - - 20.0 2.0Palheiro Ferreiro - 2 x 15.0 2 x 10.0 50.0 2.0São Vicente 6.0 - - 6.0 -Prazeres 2 x 2.0 - - 4.0 -Caniçal - - 10.0 10.0 -Cabo Girão 10.0 - - 10.0 -Santo da Serra 6.0 - - 6.0 -Ponta Delgada 10.0 - - 10.0 -São João - - 2 x 15.0 30.0 4.0
Porto Santo Island 20.0 - - 20.0 -Nova Central 4.0 - - 4.0 -Vila Baleira 4.0 + 6.0 - - 10.0 -Calheta 6.0 - - 6.0 -
Total RAM 258.0 220.0 125.0 603.0 32.0
Empresa de Electricidade da Madeira
23
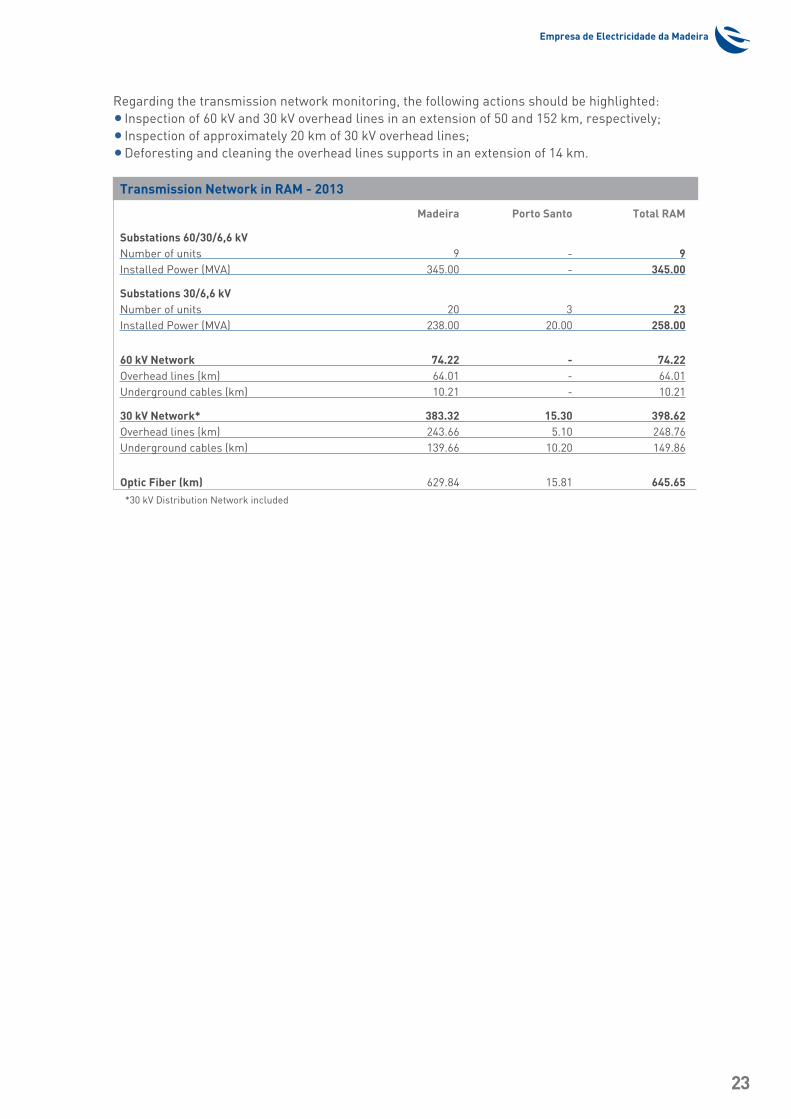
Regarding the transmission network monitoring, the following actions should be highlighted:• Inspection of 60 kV and 30 kV overhead lines in an extension of 50 and 152 km, respectively;• Inspection of approximately 20 km of 30 kV overhead lines;• Deforesting and cleaning the overhead lines supports in an extension of 14 km.
Transmission Network in RAM - 2013
Madeira Porto Santo Total RAM
Substations 60/30/6,6 kV Number of units 9 - 9Installed Power (MVA) 345.00 - 345.00
Substations 30/6,6 kV Number of units 20 3 23Installed Power (MVA) 238.00 20.00 258.00
60 kV Network 74.22 - 74.22Overhead lines (km) 64.01 - 64.01Underground cables (km) 10.21 - 10.21
30 kV Network* 383.32 15.30 398.62Overhead lines (km) 243.66 5.10 248.76Underground cables (km) 139.66 10.20 149.86
Optic Fiber (km) 629.84 15.81 645.65 *30 kV Distribution Network included
24
Annual Report 2013Technical Information
TelecommunicationsIn the telecommunication area, it is relevant to point out:• Expansion of the optic fiber cable network:
o Continuation of the expansion plan for the optic fiber network, in Madeira Island, increasing its extension in 30.0 km;
o Expansion of the optic fiber network in 6.7 km, in Porto Santo Island, for remote support of the photovoltaic park, as well as seven transforming posts.
• Expansion / Renovation of telecommunications technical rooms:o Expansion of the SDH network to the Pedra Mole Substation;o Accomplishment of the remodelling work in the EEM´s telecommunication network, especially:
in Socorridos Hydroelectric Power Plant and Funchal Substation.
• Additionally was also performed:o Installation of air conditioning systems in the Virtudes and Viveiros technical rooms;o Acquisition of measuring equipment for OTDR and Power Meter.
Dispatch CentreThe dispatch centre, the main performed investments, can be presented as follows:• Development of the new SCADA Migration Project for Network Manager;• Installation of a remote control in the Pedra Mole Substation;• Acquisition of an emergency generator for the dispatch centre;• Continuation of the supervision and remote control project of Porto Santo Thermoelectric Power
Plant;• Beginning of the upgrade project for Remote Terminal Units ED1000;• Implementation of a global risk calculation methodology for the system covering the risks of
production, network and external events;• Maintenance and publication of contents on the intranet site (http://despacho).
Empresa de Electricidade da Madeira
25
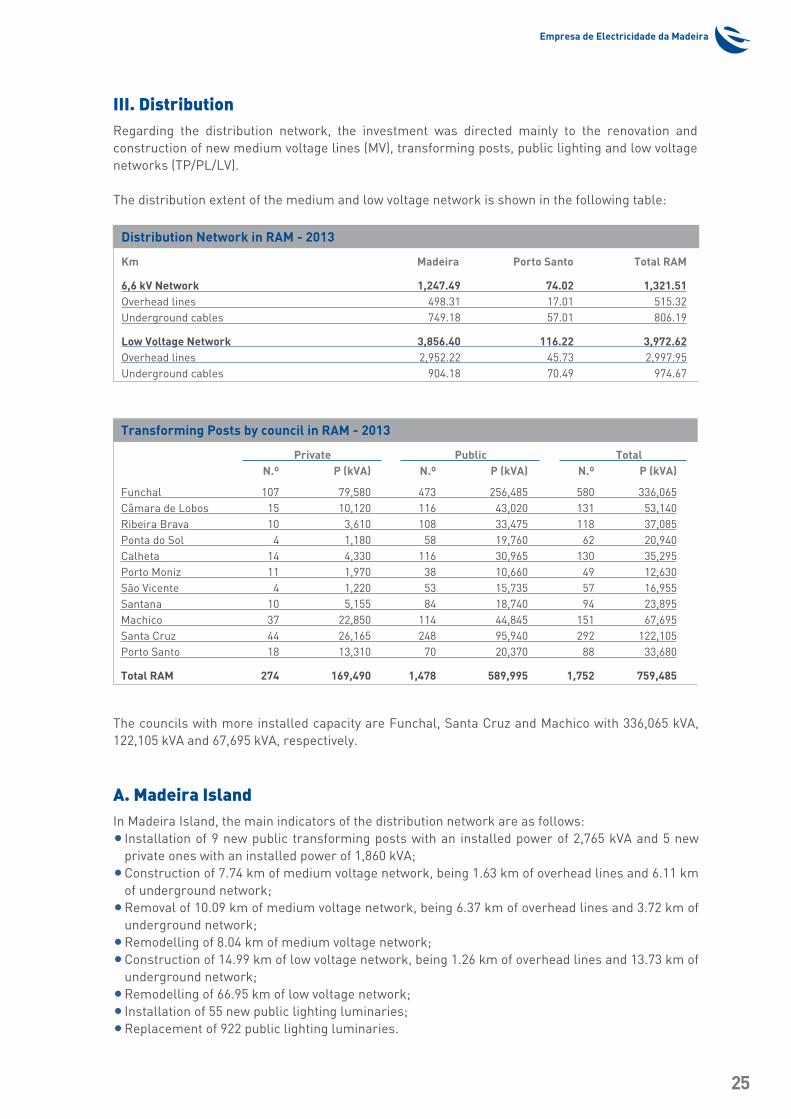
III. DistributionRegarding the distribution network, the investment was directed mainly to the renovation and construction of new medium voltage lines (MV), transforming posts, public lighting and low voltage networks (TP/PL/LV).
The distribution extent of the medium and low voltage network is shown in the following table:
The councils with more installed capacity are Funchal, Santa Cruz and Machico with 336,065 kVA, 122,105 kVA and 67,695 kVA, respectively.
A. Madeira IslandIn Madeira Island, the main indicators of the distribution network are as follows:• Installation of 9 new public transforming posts with an installed power of 2,765 kVA and 5 new
private ones with an installed power of 1,860 kVA;• Construction of 7.74 km of medium voltage network, being 1.63 km of overhead lines and 6.11 km
of underground network;• Removal of 10.09 km of medium voltage network, being 6.37 km of overhead lines and 3.72 km of
underground network;• Remodelling of 8.04 km of medium voltage network;• Construction of 14.99 km of low voltage network, being 1.26 km of overhead lines and 13.73 km of
underground network;• Remodelling of 66.95 km of low voltage network;• Installation of 55 new public lighting luminaries;• Replacement of 922 public lighting luminaries.
Transforming Posts by council in RAM - 2013
Private Public Total N.º P (kVA) N.º P (kVA) N.º P (kVA)
Funchal 107 79,580 473 256,485 580 336,065Câmara de Lobos 15 10,120 116 43,020 131 53,140Ribeira Brava 10 3,610 108 33,475 118 37,085Ponta do Sol 4 1,180 58 19,760 62 20,940Calheta 14 4,330 116 30,965 130 35,295Porto Moniz 11 1,970 38 10,660 49 12,630São Vicente 4 1,220 53 15,735 57 16,955Santana 10 5,155 84 18,740 94 23,895Machico 37 22,850 114 44,845 151 67,695Santa Cruz 44 26,165 248 95,940 292 122,105Porto Santo 18 13,310 70 20,370 88 33,680
Total RAM 274 169,490 1,478 589,995 1,752 759,485
Distribution Network in RAM - 2013
Km Madeira Porto Santo Total RAM
6,6 kV Network 1,247.49 74.02 1,321.51Overhead lines 498.31 17.01 515.32Underground cables 749.18 57.01 806.19
Low Voltage Network 3,856.40 116.22 3,972.62Overhead lines 2,952.22 45.73 2,997.95Underground cables 904.18 70.49 974.67
26
Annual Report 2013Technical Information
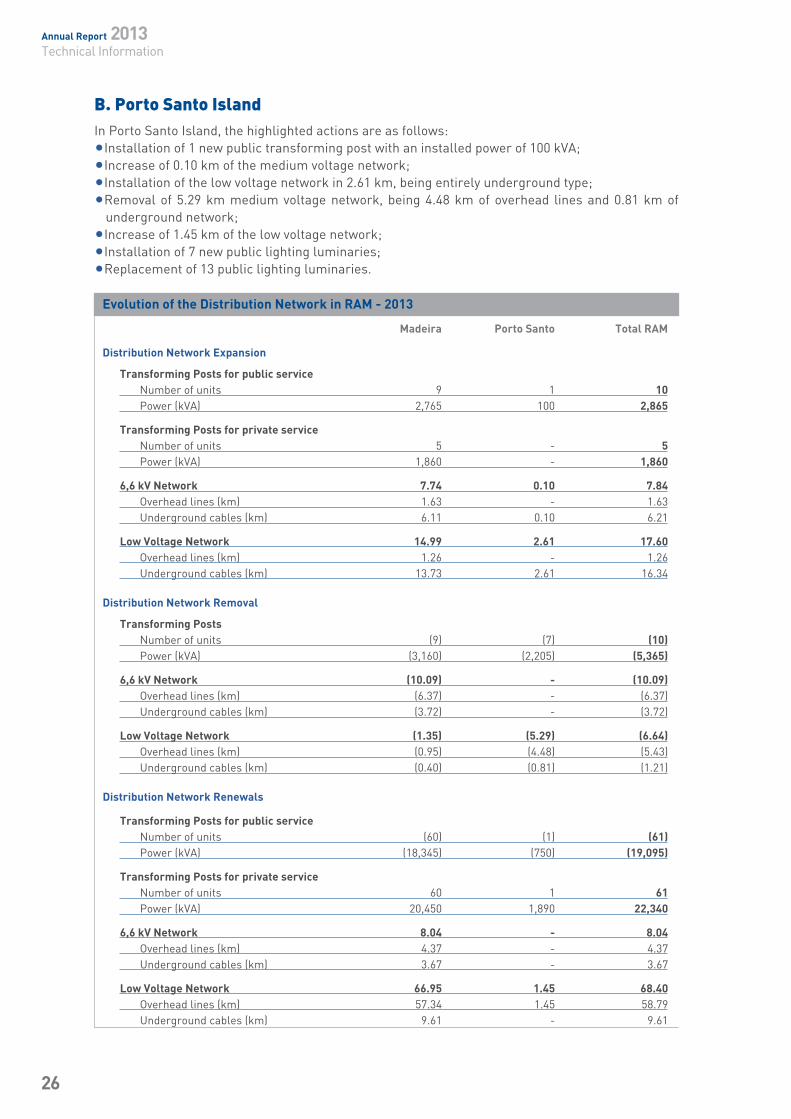
B. Porto Santo IslandIn Porto Santo Island, the highlighted actions are as follows:•Installation of 1 new public transforming post with an installed power of 100 kVA;•Increase of 0.10 km of the medium voltage network;•Installation of the low voltage network in 2.61 km, being entirely underground type;•Removal of 5.29 km medium voltage network, being 4.48 km of overhead lines and 0.81 km of
underground network;•Increase of 1.45 km of the low voltage network;•Installation of 7 new public lighting luminaries;•Replacement of 13 public lighting luminaries.
Evolution of the Distribution Network in RAM - 2013
Madeira Porto Santo Total RAM
Distribution Network Expansion
Transforming Posts for public service Number of units 9 1 10 Power (kVA) 2,765 100 2,865
Transforming Posts for private service Number of units 5 - 5 Power (kVA) 1,860 - 1,860
6,6 kV Network 7.74 0.10 7.84 Overhead lines (km) 1.63 - 1.63 Underground cables (km) 6.11 0.10 6.21
Low Voltage Network 14.99 2.61 17.60 Overhead lines (km) 1.26 - 1.26 Underground cables (km) 13.73 2.61 16.34
Distribution Network Removal
Transforming Posts Number of units (9) (7) (10) Power (kVA) (3,160) (2,205) (5,365)
6,6 kV Network (10.09) - (10.09) Overhead lines (km) (6.37) - (6.37) Underground cables (km) (3.72) - (3.72)
Low Voltage Network (1.35) (5.29) (6.64) Overhead lines (km) (0.95) (4.48) (5.43) Underground cables (km) (0.40) (0.81) (1.21)
Distribution Network Renewals
Transforming Posts for public service Number of units (60) (1) (61) Power (kVA) (18,345) (750) (19,095)
Transforming Posts for private service Number of units 60 1 61 Power (kVA) 20,450 1,890 22,340
6,6 kV Network 8.04 - 8.04 Overhead lines (km) 4.37 - 4.37 Underground cables (km) 3.67 - 3.67
Low Voltage Network 66.95 1.45 68.40 Overhead lines (km) 57.34 1.45 58.79 Underground cables (km) 9.61 - 9.61
Empresa de Electricidade da Madeira
27
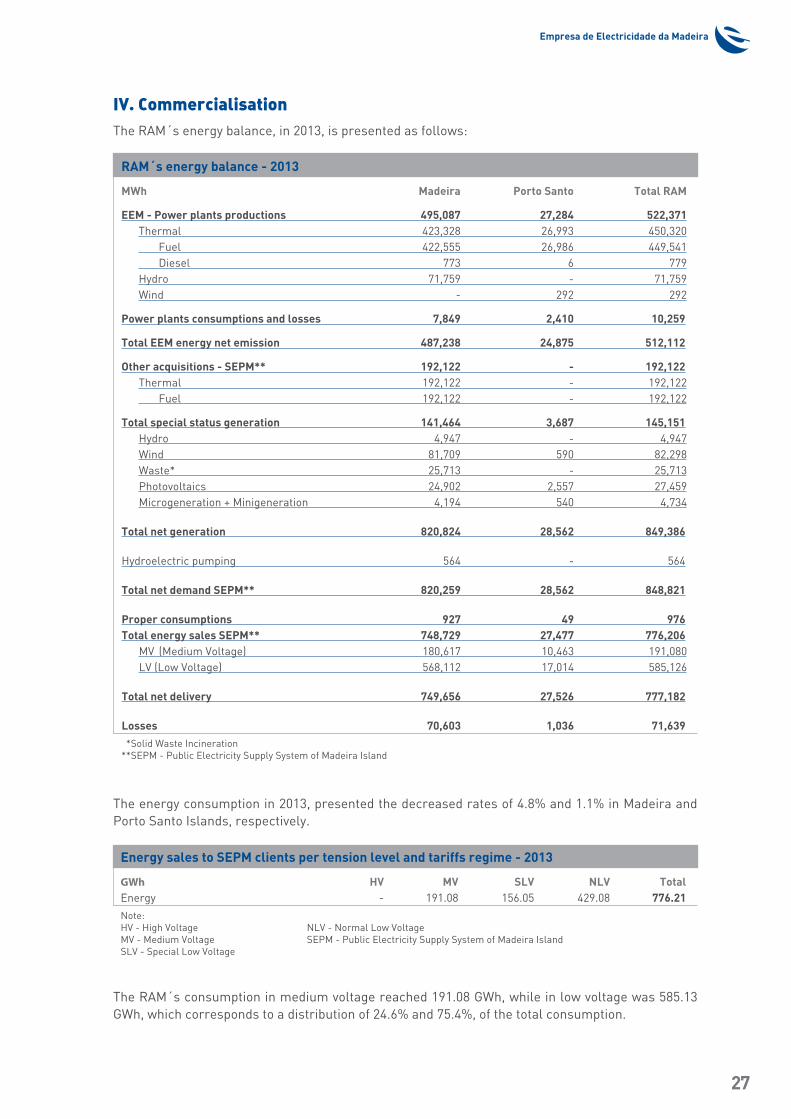
IV. CommercialisationThe RAM´s energy balance, in 2013, is presented as follows:
The energy consumption in 2013, presented the decreased rates of 4.8% and 1.1% in Madeira and Porto Santo Islands, respectively.
The RAM´s consumption in medium voltage reached 191.08 GWh, while in low voltage was 585.13 GWh, which corresponds to a distribution of 24.6% and 75.4%, of the total consumption.
RAM´s energy balance - 2013
MWh Madeira Porto Santo Total RAM
EEM - Power plants productions 495,087 27,284 522,371Thermal 423,328 26,993 450,320 Fuel 422,555 26,986 449,541 Diesel 773 6 779Hydro 71,759 - 71,759Wind - 292 292
Power plants consumptions and losses 7,849 2,410 10,259
Total EEM energy net emission 487,238 24,875 512,112
Other acquisitions - SEPM** 192,122 - 192,122Thermal 192,122 - 192,122 Fuel 192,122 - 192,122
Total special status generation 141,464 3,687 145,151Hydro 4,947 - 4,947Wind 81,709 590 82,298Waste* 25,713 - 25,713Photovoltaics 24,902 2,557 27,459Microgeneration + Minigeneration 4,194 540 4,734
Total net generation 820,824 28,562 849,386
Hydroelectric pumping 564 - 564
Total net demand SEPM** 820,259 28,562 848,821
Proper consumptions 927 49 976Total energy sales SEPM** 748,729 27,477 776,206
MV (Medium Voltage) 180,617 10,463 191,080LV (Low Voltage) 568,112 17,014 585,126
Total net delivery 749,656 27,526 777,182
Losses 70,603 1,036 71,639*Solid Waste Incineration
**SEPM - Public Electricity Supply System of Madeira Island
Energy sales to SEPM clients per tension level and tariffs regime - 2013
GWh HV MV SLV NLV TotalEnergy - 191.08 156.05 429.08 776.21
Note:HV - High Voltage NLV - Normal Low VoltageMV - Medium Voltage SEPM - Public Electricity Supply System of Madeira IslandSLV - Special Low Voltage
Annual Report 2013Technical Information
28
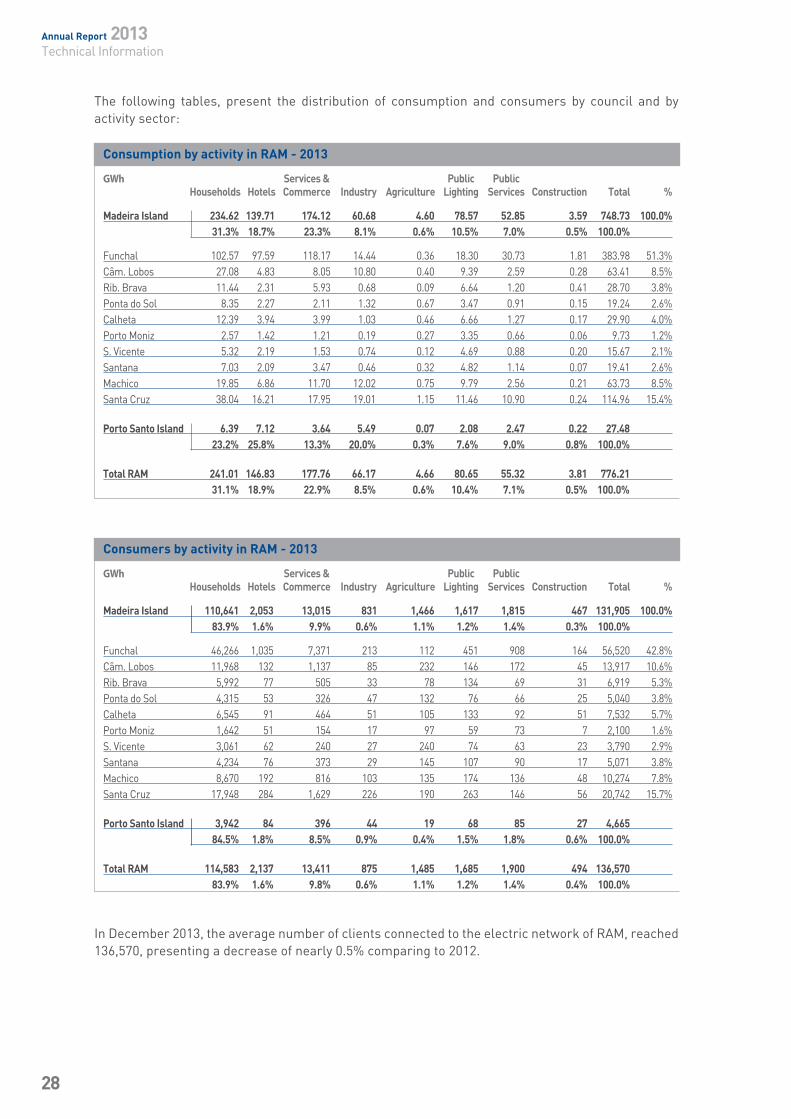
The following tables, present the distribution of consumption and consumers by council and by activity sector:
In December 2013, the average number of clients connected to the electric network of RAM, reached 136,570, presenting a decrease of nearly 0.5% comparing to 2012.
Consumption by activity in RAM - 2013
GWh Services & Public Public Households Hotels Commerce Industry Agriculture Lighting Services Construction Total %
Madeira Island 234.62 139.71 174.12 60.68 4.60 78.57 52.85 3.59 748.73 100.0% 31.3% 18.7% 23.3% 8.1% 0.6% 10.5% 7.0% 0.5% 100.0%
Funchal 102.57 97.59 118.17 14.44 0.36 18.30 30.73 1.81 383.98 51.3%Câm. Lobos 27.08 4.83 8.05 10.80 0.40 9.39 2.59 0.28 63.41 8.5%Rib. Brava 11.44 2.31 5.93 0.68 0.09 6.64 1.20 0.41 28.70 3.8%Ponta do Sol 8.35 2.27 2.11 1.32 0.67 3.47 0.91 0.15 19.24 2.6%Calheta 12.39 3.94 3.99 1.03 0.46 6.66 1.27 0.17 29.90 4.0%Porto Moniz 2.57 1.42 1.21 0.19 0.27 3.35 0.66 0.06 9.73 1.2%S. Vicente 5.32 2.19 1.53 0.74 0.12 4.69 0.88 0.20 15.67 2.1%Santana 7.03 2.09 3.47 0.46 0.32 4.82 1.14 0.07 19.41 2.6%Machico 19.85 6.86 11.70 12.02 0.75 9.79 2.56 0.21 63.73 8.5%Santa Cruz 38.04 16.21 17.95 19.01 1.15 11.46 10.90 0.24 114.96 15.4%
Porto Santo Island 6.39 7.12 3.64 5.49 0.07 2.08 2.47 0.22 27.48 23.2% 25.8% 13.3% 20.0% 0.3% 7.6% 9.0% 0.8% 100.0%
Total RAM 241.01 146.83 177.76 66.17 4.66 80.65 55.32 3.81 776.21 31.1% 18.9% 22.9% 8.5% 0.6% 10.4% 7.1% 0.5% 100.0%
Consumers by activity in RAM - 2013
GWh Services & Public Public Households Hotels Commerce Industry Agriculture Lighting Services Construction Total %
Madeira Island 110,641 2,053 13,015 831 1,466 1,617 1,815 467 131,905 100.0% 83.9% 1.6% 9.9% 0.6% 1.1% 1.2% 1.4% 0.3% 100.0%
Funchal 46,266 1,035 7,371 213 112 451 908 164 56,520 42.8%Câm. Lobos 11,968 132 1,137 85 232 146 172 45 13,917 10.6%Rib. Brava 5,992 77 505 33 78 134 69 31 6,919 5.3%Ponta do Sol 4,315 53 326 47 132 76 66 25 5,040 3.8%Calheta 6,545 91 464 51 105 133 92 51 7,532 5.7%Porto Moniz 1,642 51 154 17 97 59 73 7 2,100 1.6%S. Vicente 3,061 62 240 27 240 74 63 23 3,790 2.9%Santana 4,234 76 373 29 145 107 90 17 5,071 3.8%Machico 8,670 192 816 103 135 174 136 48 10,274 7.8%Santa Cruz 17,948 284 1,629 226 190 263 146 56 20,742 15.7%
Porto Santo Island 3,942 84 396 44 19 68 85 27 4,665 84.5% 1.8% 8.5% 0.9% 0.4% 1.5% 1.8% 0.6% 100.0%
Total RAM 114,583 2,137 13,411 875 1,485 1,685 1,900 494 136,570 83.9% 1.6% 9.8% 0.6% 1.1% 1.2% 1.4% 0.4% 100.0%
Empresa de Electricidade da Madeira
29
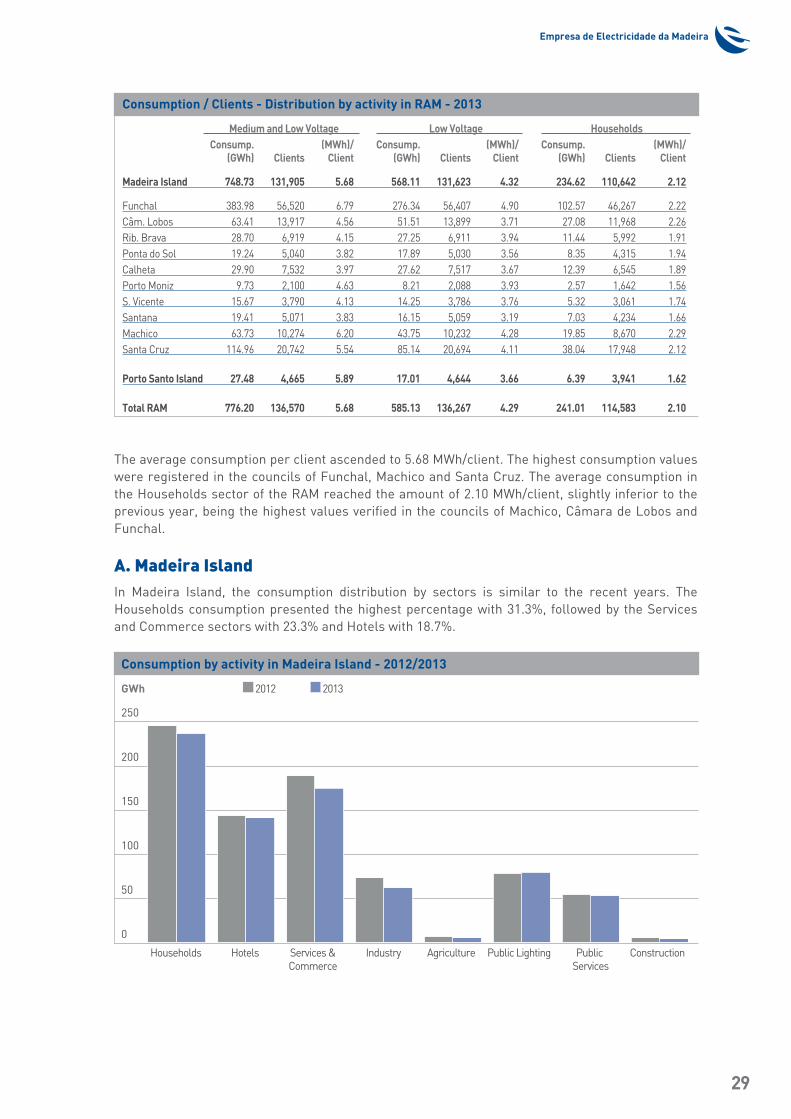
The average consumption per client ascended to 5.68 MWh/client. The highest consumption values were registered in the councils of Funchal, Machico and Santa Cruz. The average consumption in the Households sector of the RAM reached the amount of 2.10 MWh/client, slightly inferior to the previous year, being the highest values verified in the councils of Machico, Câmara de Lobos and Funchal.
A. Madeira IslandIn Madeira Island, the consumption distribution by sectors is similar to the recent years. The Households consumption presented the highest percentage with 31.3%, followed by the Services and Commerce sectors with 23.3% and Hotels with 18.7%.
Consumption / Clients - Distribution by activity in RAM - 2013
Medium and Low Voltage 000 000 Low Voltage00 0 000 00 000Households00 0 00 Consump. (MWh)/ Consump. (MWh)/ Consump. (MWh)/ (GWh) Clients Client (GWh) Clients Client (GWh) Clients Client
Madeira Island 748.73 131,905 5.68 568.11 131,623 4.32 234.62 110,642 2.12
Funchal 383.98 56,520 6.79 276.34 56,407 4.90 102.57 46,267 2.22Câm. Lobos 63.41 13,917 4.56 51.51 13,899 3.71 27.08 11,968 2.26Rib. Brava 28.70 6,919 4.15 27.25 6,911 3.94 11.44 5,992 1.91Ponta do Sol 19.24 5,040 3.82 17.89 5,030 3.56 8.35 4,315 1.94Calheta 29.90 7,532 3.97 27.62 7,517 3.67 12.39 6,545 1.89Porto Moniz 9.73 2,100 4.63 8.21 2,088 3.93 2.57 1,642 1.56S. Vicente 15.67 3,790 4.13 14.25 3,786 3.76 5.32 3,061 1.74Santana 19.41 5,071 3.83 16.15 5,059 3.19 7.03 4,234 1.66Machico 63.73 10,274 6.20 43.75 10,232 4.28 19.85 8,670 2.29Santa Cruz 114.96 20,742 5.54 85.14 20,694 4.11 38.04 17,948 2.12
Porto Santo Island 27.48 4,665 5.89 17.01 4,644 3.66 6.39 3,941 1.62
Total RAM 776.20 136,570 5.68 585.13 136,267 4.29 241.01 114,583 2.10
Consumption by activity in Madeira Island - 2012/2013
GWh 2012 2013
250
200
150
100
50
0
Households Hotels Services & Industry Agriculture Public Lighting Public Construction Commerce Services
Annual Report 2013Technical Information
30
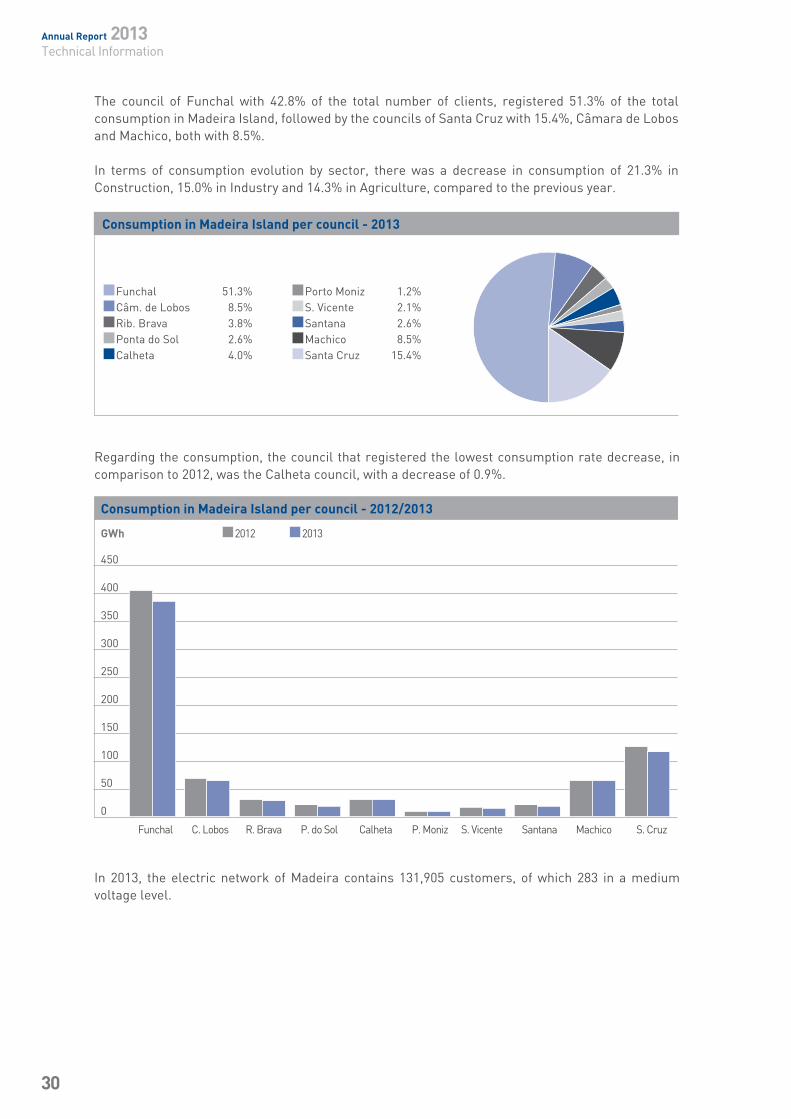
The council of Funchal with 42.8% of the total number of clients, registered 51.3% of the total consumption in Madeira Island, followed by the councils of Santa Cruz with 15.4%, Câmara de Lobos and Machico, both with 8.5%.
In terms of consumption evolution by sector, there was a decrease in consumption of 21.3% in Construction, 15.0% in Industry and 14.3% in Agriculture, compared to the previous year.
Regarding the consumption, the council that registered the lowest consumption rate decrease, in comparison to 2012, was the Calheta council, with a decrease of 0.9%.
In 2013, the electric network of Madeira contains 131,905 customers, of which 283 in a medium voltage level.
Consumption in Madeira Island per council - 2013
Funchal 51.3% Porto Moniz 1.2%
Câm. de Lobos 8.5% S. Vicente 2.1%
Rib. Brava 3.8% Santana 2.6%
Ponta do Sol 2.6% Machico 8.5%
Calheta 4.0% Santa Cruz 15.4%
Consumption in Madeira Island per council - 2012/2013
GWh 2012 2013 450
400
350
300
250
200
150
100
50
0
Funchal C. Lobos R. Brava P. do Sol Calheta P. Moniz S. Vicente Santana Machico S. Cruz
Empresa de Electricidade da Madeira
31
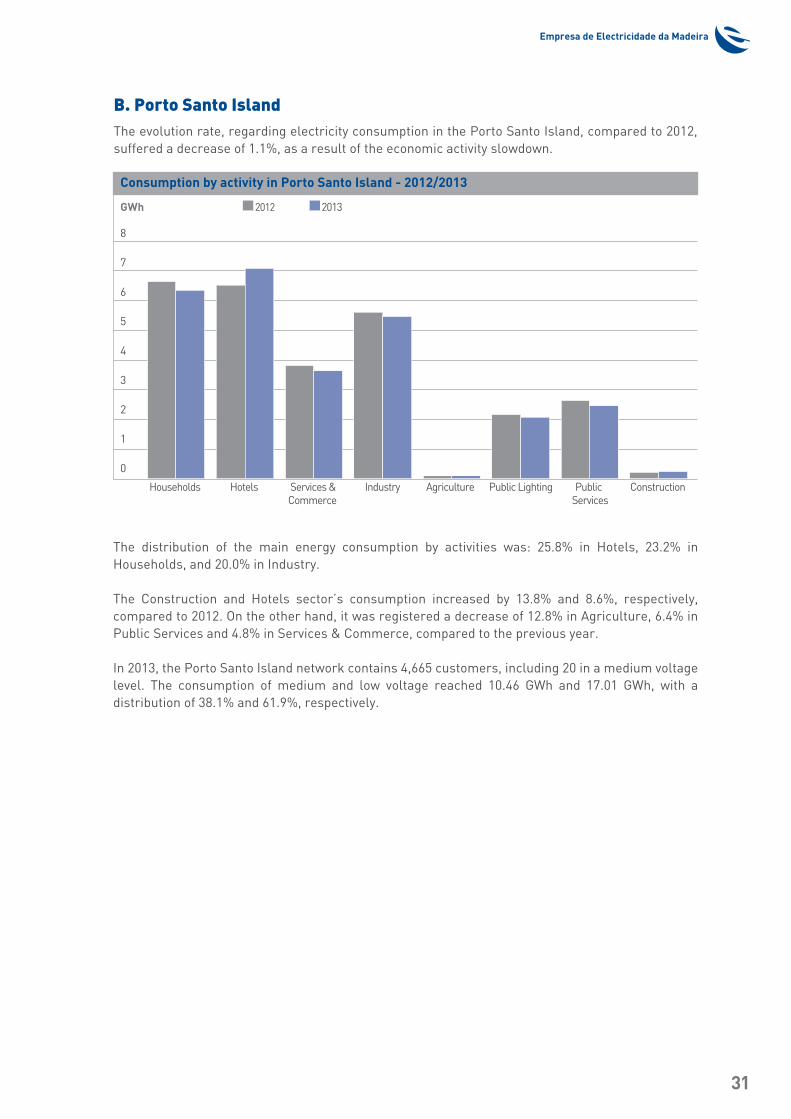
B. Porto Santo IslandThe evolution rate, regarding electricity consumption in the Porto Santo Island, compared to 2012, suffered a decrease of 1.1%, as a result of the economic activity slowdown.
The distribution of the main energy consumption by activities was: 25.8% in Hotels, 23.2% in Households, and 20.0% in Industry.
The Construction and Hotels sector’s consumption increased by 13.8% and 8.6%, respectively, compared to 2012. On the other hand, it was registered a decrease of 12.8% in Agriculture, 6.4% in Public Services and 4.8% in Services & Commerce, compared to the previous year.
In 2013, the Porto Santo Island network contains 4,665 customers, including 20 in a medium voltage level. The consumption of medium and low voltage reached 10.46 GWh and 17.01 GWh, with a distribution of 38.1% and 61.9%, respectively.
Consumption by activity in Porto Santo Island - 2012/2013
GWh 2012 2013 8
7
6
5
4
3
2
1
0
Households Hotels Services & Industry Agriculture Public Lighting Public Construction Commerce Services
Annual Report 2013Technical Information
32
V. Service QualityThe characterisation of the Quality Service in RAM, is supported by the Regulation of the Quality Service (RQS), and it comprises essentially, the following areas:• Service Continuity;• Voltage Wave Quality;• Commercial Quality.
In this context, EEM has armed itself of the necessary resources to fulfil the regulation framework, being distinguished, the following initiatives, in 2013:• Installation and commissioning of a new equipment of Voltage Wave Quality System, in the new
Pedra Mole Substation, with capacity for monitoring two voltage levels (60 and 30 kV);• Installation of the new equipment in Vitória 30 kV Switchgear House, enabling the record of
readings in both 30 kV buses;• Commissioning of a new measuring point of the 60 kV bus, in the Vitória Switchgear House, with
the equipment removed from the Vitória 30 kV Switchgear House;• Improvements in the existent Voltage Wave System through: updating the software for
communication management and database; acquiring software to verify the recorded data assessment, in order to improve the communication and recording process, enabling not only the new equipment connection, but also to adapt, more easily, to the regulatory requirements and specifications;
• Accomplishment of Customers satisfaction inquiries, aiming the general indicators of Customers evaluation and satisfaction.
The Quality Service has a specific report, published annually in April and available in EEM web site.
The Service Continuity Indicators of transmission and distribution area, in 2013, are within the usual limits, meaning a suitable level of the service continuity. In this context, EEM continues to develop measures to minimize the number and duration of interruptions, through the introduction of technical improvements and remodelling of sections traditionally most affected. Outlining also the measures contemplated in the investment plan, which will allow a faster diagnosis of the cause of outages and respective location.
The Voltage Wave Quality measurements results fulfilled the conditions stipulated by the RQS. In this aspect, we highlight the introduction of new measurement points in all new substations or future renovations, enabling to monitor and control any signs of this nature.
Regarding the Commercial Quality the fulfilled indicators, in 2013, reveal that commercial activity has an equivalent performance to the previous year, which, in general are under the conditions stipulated in Service Quality Regulation (RQS). It should be noted that the EEM remains committed to the improvement of technology and human resources processes. It is worth noting the entry into productive the Work Force Management in order to automate the control of processes associated to services that require visits to customers, allowing the audit on times specified in RQS.
Empresa de Electricidade da Madeira
33
VI. Unspecified InvestmentsThe investments realised in unspecified areas by EEM in 2013, amounted to 1,711 thousand Euros, comprising the accomplishment of support infrastructures and initiatives in information area systems.
VI.I - Support InfrastructuresSome investments in the support infrastructures area were also undertaken, being highlighted:• Acquisition of plots for the implementation of a warehouse, as well as the acquisition of land,
near the João Gomes riverside, in Funchal, which will serve for the storage of larger materials to logistical support of the Public Lighting;
• Interventions of east and north facades of the Headquarters building;• Other small interventions.
VI.II - Information SystemsEEM continued to develop several initiatives to restructure and modernise the commercial and technical systems area, to improve the service to Customers as well as implementing changes in processes resulting from regulatory and legal charges. The main developments were as follows:
• SAP Developments
The upgrade of SAP platforms was mainly due to the initiation works for implementing the new SEPA direct debit systems.
• WFM – Work Force Management
In 2013, we accomplished the operationalisation of the EEM´s work force management teams.
• Changes in Business Intelligence – reporting tools
During 2013, EEM has implemented a wide range of business reports, particularly in the financial component of the commercial area.
• Specialised Business Consulting
In continuity with the previous years, EEM developed a set of business activities included in the Specialised Business Consulting project.
• Data Center update (support to application platforms)
This update was due to the need to acquire more storage capacity for holding SAP copies machines during the implementation of the support package and SAP notes associated with the implementation of SEPA. This increase storage platform utilised by SAP will be reused by the virtualisation area projects, having a wide range of applications.
• Other projects
EEM developed during 2013 a number of projects, although in a structural scope, were confined in a small level, not presenting a high investment individually, namely: changes on the SGI and SIT technical platforms, aiming an improved integration, as well as to assure the loading of some unpredicted electric components, implementation of interactive tools concerning the new assiduity management system and the changing of some customer service processes such as improvements to the EEM site, updating the IT users support area, structure licenses (Office, SW servers, Exchange, etc. ...), among others procedures.
Annual Report 2013Technical Information
34
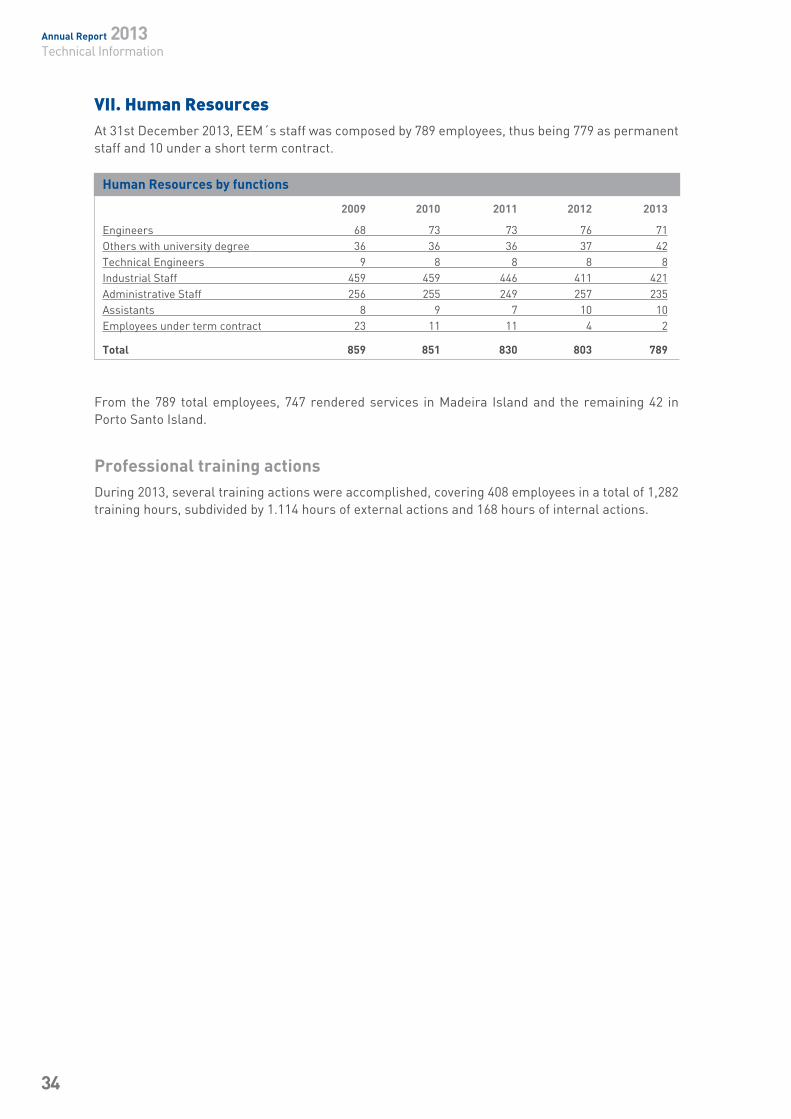
VII. Human ResourcesAt 31st December 2013, EEM´s staff was composed by 789 employees, thus being 779 as permanent staff and 10 under a short term contract.
From the 789 total employees, 747 rendered services in Madeira Island and the remaining 42 in Porto Santo Island.
Professional training actionsDuring 2013, several training actions were accomplished, covering 408 employees in a total of 1,282 training hours, subdivided by 1.114 hours of external actions and 168 hours of internal actions.
Human Resources by functions
2009 2010 2011 2012 2013
Engineers 68 73 73 76 71Others with university degree 36 36 36 37 42Technical Engineers 9 8 8 8 8Industrial Staff 459 459 446 411 421Administrative Staff 256 255 249 257 235Assistants 8 9 7 10 10Employees under term contract 23 11 11 4 2
Total 859 851 830 803 789

Economic and FinancialInformation

Empresa de Electricidade da Madeira
37
1 - Economic and Financial Information
ContextIn 2013, the global economic growth was situated at around 3%, which shows a slight slow down in global economic activity when compared to 3.1%, registered in the year 2012, and compared with the performance of the world economic activity in 2011 and 2010 showed a more significant decrease, around 4.5%. The mitigation in growth seen in the past two years, was in its essence, caused by private sector deleveraging in developed economies, by restrictive fiscal policies, for the deadlock in resolving the sovereign debt crisis in the Eurozone, uncertainty regarding negotiations in the U.S. Congress for limits on state debt and also by the decelerating growth of some of the major emerging economies.
The effects of the financial crisis, which began nearly five years ago, are still clearly visible in the markets and in the real economy, the global economic growth remains weak and there is still a degree of uncertainty and confidence in international financial markets.
After a recession period, the Eurozone began to improve in 2013, at a very slow and faint pace. In reality, there are still extremely high levels of unemployment, with special emphasis in youth unemployment, which associated with the decrease in available income has led to a general deterioration of living conditions of the population, causing social and political tensions witch are not contributing positively to the required implementation of structural reforms.
Following the sovereign debt crisis that hit Europe, which determined that several Member States Governments of the European Union had to assume policies for fiscal consolidation, particularly in larger countries such as Italy and Spain, but also extensible to other peripheral countries such as Portugal, Ireland and Cyprus, the imbalances and the asymmetries between the center of Europe (balanced) and the periphery (unbalanced) became more visible and accentuated. In conclusion, the Eurozone GDP is expected to drop 0.4% in 2013, which represents a weak trend due to the contraction of 0.6% recorded in 2012. Though the Eurozone begins to show some signs of recovery, significant obstacles remain, most notably: a weak level of investment, difficult conditions of access to credit and a depressed job market, naturally delaying/conditioning the investment needed for a sustained economic recovery in terms of growth and employment.
In 2013, Portugal continued to implement the “Programa de Assistência Económica e Financeira” (PAEF) established with the Troika (ECB, EU and IMF), which included the adoption of a set of additional fiscal consolidation measures in the State Budget for 2013, which represented an increased tax burden, particularly in IRS; to which adds additional public spending cuts and reform measures of the State, with particular focus on the benefits and income of public staff and pensioners. The Portuguese economy began the year continuing the recession that drags on since 2010, showing, however, mostly from the 2nd half of 2013, an encouraging growth, although mild as already mentioned.
The impact that this new set of adjustment measures had in the Portuguese economy, given the necessary and insurmountable correction of macroeconomic imbalances existing until then (excess debt, budget and financial deficit), and that somehow, were cut across the various agents, namely: state, corporate and private, adding the spread of the crisis caused by sovereign debt in some of our major trading partners including Spain and Italy. It should be noted, however, that despite the expected contraction of the Portuguese economy arising from the application of a demanding program of adjustment it is notorious a progressive correction of imbalances, especially the reduction of the trade deficit and a more favourable than foreseen exports performance.
Regarding the implementation of the PAEF, the results of the 10th Troika Review indicates that the program continues to be globally performed in line with expectations, sorting the results obtained so far as positive, with the Entities acknowledging that it starts to emerge some signs of economic
Annual Report 2013Economic and Financial Information
38
recovery even though considered “fragile”. It is also noteworthy that the sense and confidence of the markets on the Portuguese sovereign debt has improved, recognised in the most recent debt issuance to 10 years, with interest rates of 3.6% and with a demand 3.5 times higher than supply.
The difficult and restrictive financing conditions of the Portuguese Republic in recent years have extended to the banking sector, resulting in an increase in household savings. In fact the “Ricardiana” economic theory developed by David Ricardo, one of the founders of the English classical school of political economy, argues that in times of greater austerity there is a greater propensity to save, which came to be confirmed in Portugal, with the rate of savings arising from 9.7% in 2011 to 12.0% in 2012 and 13.0% over 2013.
In this particularly adverse environment and in continuity with what has happened in the year 2012, it’s no surprise that 2013 was confirmed as another difficult year for Portuguese companies, because despite national banks have given some signs of some liquidity to finance the economy, the available financial resources are rare and expensive.
In the specific case of the Autonomous Region of Madeira, the year 2013 was marked by a continuation of the implementation of the adjustment program specific to the region, signed between the Regional Government and the Government of the Republic, named PAEF-RAM. This program includes a comprehensive set of measures to address the following objectives: to allow fiscal consolidation of the Autonomous Region of Madeira in order to restore the sustainability of public finances and restore the financing capacity of autonomous region. This path has been strictly enforced by the Regional Government of Madeira, as presented in the positive reviews on a quarterly basis, conducted by the Ministry of Finance of Portugal, which are crucial for achieving the disbursements necessary to meet the financing requirements of the region.
In this extraordinarily restrictive and adverse context, the EEM activities were strongly conditioned by the economic environment that surrounds it, therefore it was not possible to comply with the outlined investment plan for tariffs purpose, registering a decline of -82.3%, thus taking the company in line with the previous year, a contingency investment plan.
After the balance sheet date, more precisely in January 2014, and with no effect in the year 2013 were received amounts owed relating to tariff Convergence Agreement of electricity covering the years 1998-2002 in the amount of 18,622,560 Euros and the Tariff Compensation for 2009 in the amount of 25,612,181 Euros. The failure to comply with the settlement of these amounts, until January 2014, brought negative consequences for the company, and to its financial stability.
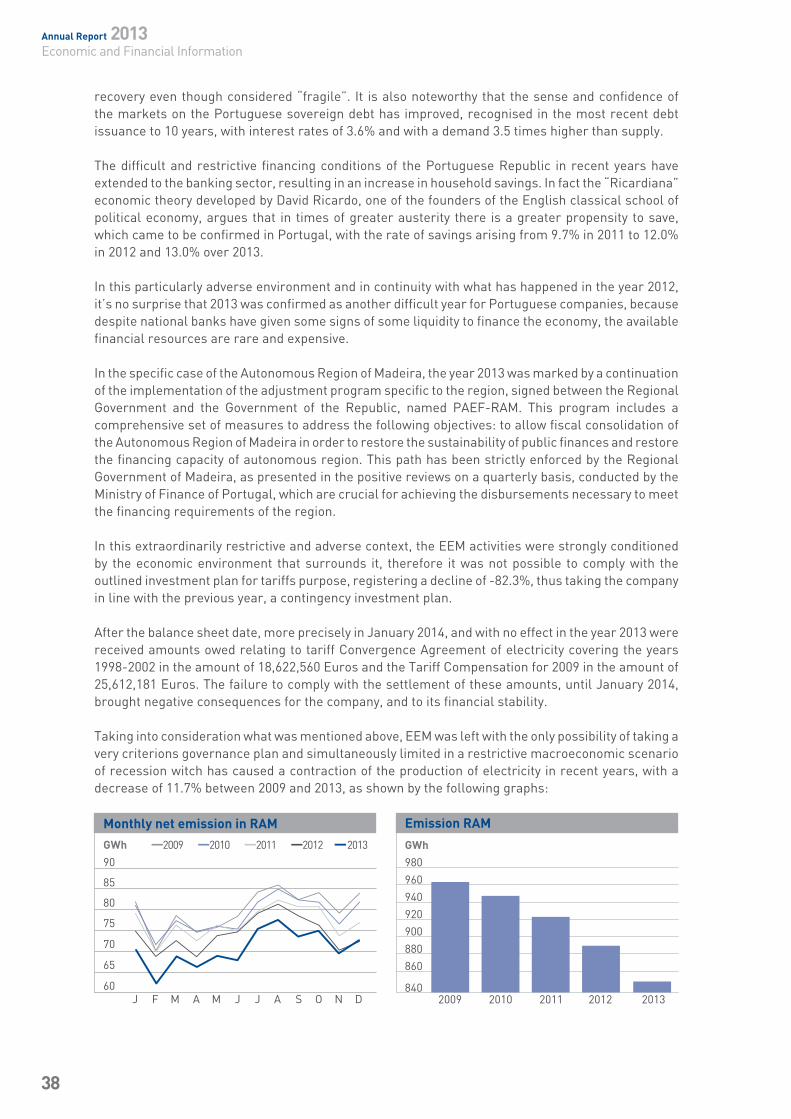
Taking into consideration what was mentioned above, EEM was left with the only possibility of taking a very criterions governance plan and simultaneously limited in a restrictive macroeconomic scenario of recession witch has caused a contraction of the production of electricity in recent years, with a decrease of 11.7% between 2009 and 2013, as shown by the following graphs:
Monthly net emission in RAM
GWh _2009 _2010 _2011 _2012 _2013
90
85
80
75
70
65
60 J F M A M J J A S O N D
Emission RAM
GWh
980
960
940
920
900
880
860
840 2009 2010 2011 2012 2013
Empresa de Electricidade da Madeira
39
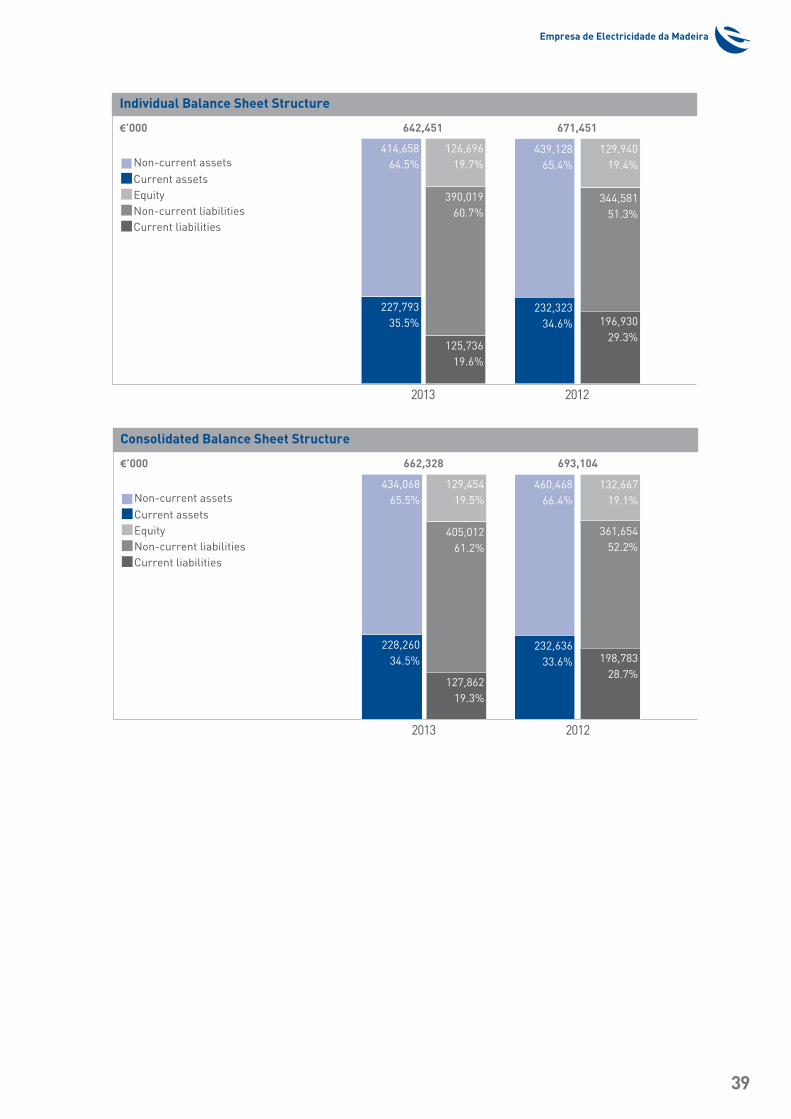
Individual Balance Sheet Structure
€’000 642,451 671,451
Non-current assets
Current assets
Equity
Non-current liabilities
Current liabilities
2013 2012
439,12865.4%
232,32334.6%
129,94019.4%
344,58151.3%
196,93029.3%
414,65864.5%
227,79335.5%
126,69619.7%
390,01960.7%
125,73619.6%
Consolidated Balance Sheet Structure
€’000 662,328 693,104
Non-current assets
Current assets
Equity
Non-current liabilities
Current liabilities
2013 2012
460,46866.4%
232,63633.6%
132,66719.1%
361,65452.2%
198,78328.7%
434,06865.5%
228,26034.5%
129,45419.5%
405,01261.2%
127,86219.3%
Annual Report 2013Economic and Financial Information
40
BalanceThe total value of EEM balance in 2013 amounted to 642,451 thousand Euros (consolidated: 662,328 thousand Euros), decreasing 4.3% compared to 2012 (consolidated: 4.4%). Also the total net tangible assets and intangible assets, which represents 53.5% of the total assets of EEM (consolidated: 55.8%) reached 343,984 thousand Euros (consolidated: 369,770 thousand Euros), with a decrease of 5.4% compared to 2012 (consolidated: 5.5%).
Taking in consideration the economic and financial scenario of recent years, EEM, and in line with, what happened in 2011, adopted a very selective and quite moderate plan of investments. Nevertheless, in 2013 the total investment amounted to 12,462 thousand Euros (consolidated: 12,667 thousand Euros), an increase of 34.9% (consolidated: 35.5%) compared to the value of 9,239 thousand of Euros carried out in 2012 (consolidated 9,350 thousand Euros).
This increase was due to the fact that there was a need to initiate a series of works that were deferred by virtue of the financial environment in 2011 and 2012.
The investment is divided by the main activities of the EEM, as follows:
• Production: 2,125 thousand Euros;• Transmission: 4,231 thousand Euros;• Distribution/Commercialisation: 4,395 thousand Euros;• Other activities: 1,711 thousand Euros;• Subsidiary companies: 205 thousand Euros.
In the Production area, the investment in hydroelectric power plants amounted to 1,255 thousand Euros, including 431 thousand Euros related to remodelling of the hydroelectric system of Calheta and 463 thousand Euros spent on the reconstruction of various canals.
In the Transmission area, several interventions were performed at substations (3,069 thousand Euros) and dispatch/control monitoring centers (959 thousand Euros), being highlighted the investment in Pedra Mole Substation, amounting to 2,771 thousand Euros).
In the areas of Distribution/Commercialisation the most significant investments were made in low voltage networks (2,476 thousand Euros), medium voltage networks (868 thousand Euros), counting and measuring equipment’s (564 thousand Euros) and transformation posts (329 thousand Euros).
In Other activities the investment regards essentially the information and communication systems which amounted to 812 thousand Euros. In the acquisition/remodelling of land and buildings were spent 803 thousand Euros.
Regarding the Subsidiary companies, no significant investment was made during the year 2013, reaching a total of 205 thousand Euros.
The balance Other investments presented a decrease of 967 thousand Euros worth of shares on an individual basis, was due mainly to the reduction of 1,213 thousand Euros in the fair value of listed shares on the stock exchange, combining with the increase in 326 thousand Euros of investments recorded by the equity method (MEP). During 2013, the company settled the “Sociedade Comboio do Monte”, whose participation was recorded for 16 thousand Euros. On a consolidated basis, through the annulment of shares in Group companies, the financial investments, as a whole, devalued 1,292 thousand Euros.
Empresa de Electricidade da Madeira
41
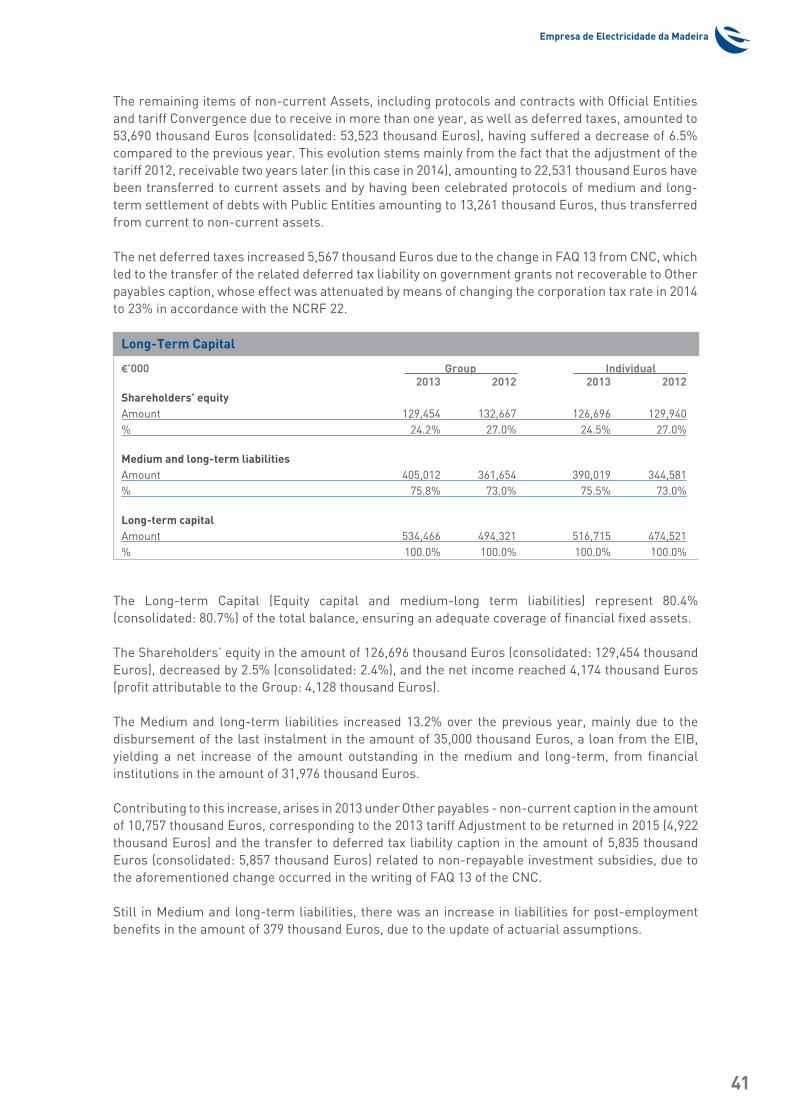
The remaining items of non-current Assets, including protocols and contracts with Official Entities and tariff Convergence due to receive in more than one year, as well as deferred taxes, amounted to 53,690 thousand Euros (consolidated: 53,523 thousand Euros), having suffered a decrease of 6.5% compared to the previous year. This evolution stems mainly from the fact that the adjustment of the tariff 2012, receivable two years later (in this case in 2014), amounting to 22,531 thousand Euros have been transferred to current assets and by having been celebrated protocols of medium and long-term settlement of debts with Public Entities amounting to 13,261 thousand Euros, thus transferred from current to non-current assets.
The net deferred taxes increased 5,567 thousand Euros due to the change in FAQ 13 from CNC, which led to the transfer of the related deferred tax liability on government grants not recoverable to Other payables caption, whose effect was attenuated by means of changing the corporation tax rate in 2014 to 23% in accordance with the NCRF 22.
The Long-term Capital (Equity capital and medium-long term liabilities) represent 80.4% (consolidated: 80.7%) of the total balance, ensuring an adequate coverage of financial fixed assets.
The Shareholders’ equity in the amount of 126,696 thousand Euros (consolidated: 129,454 thousand Euros), decreased by 2.5% (consolidated: 2.4%), and the net income reached 4,174 thousand Euros (profit attributable to the Group: 4,128 thousand Euros).
The Medium and long-term liabilities increased 13.2% over the previous year, mainly due to the disbursement of the last instalment in the amount of 35,000 thousand Euros, a loan from the EIB, yielding a net increase of the amount outstanding in the medium and long-term, from financial institutions in the amount of 31,976 thousand Euros.
Contributing to this increase, arises in 2013 under Other payables - non-current caption in the amount of 10,757 thousand Euros, corresponding to the 2013 tariff Adjustment to be returned in 2015 (4,922 thousand Euros) and the transfer to deferred tax liability caption in the amount of 5,835 thousand Euros (consolidated: 5,857 thousand Euros) related to non-repayable investment subsidies, due to the aforementioned change occurred in the writing of FAQ 13 of the CNC.
Still in Medium and long-term liabilities, there was an increase in liabilities for post-employment benefits in the amount of 379 thousand Euros, due to the update of actuarial assumptions.
Long-Term Capital
€’000 Group Individual 2013 2012 2013 2012Shareholders’ equityAmount 129,454 132,667 126,696 129,940 % 24.2% 27.0% 24.5% 27.0%
Medium and long-term liabilitiesAmount 405,012 361,654 390,019 344,581 % 75.8% 73.0% 75.5% 73.0%
Long-term capitalAmount 534,466 494,321 516,715 474,521 % 100.0% 100.0% 100.0% 100.0%
Annual Report 2013Economic and Financial Information
42
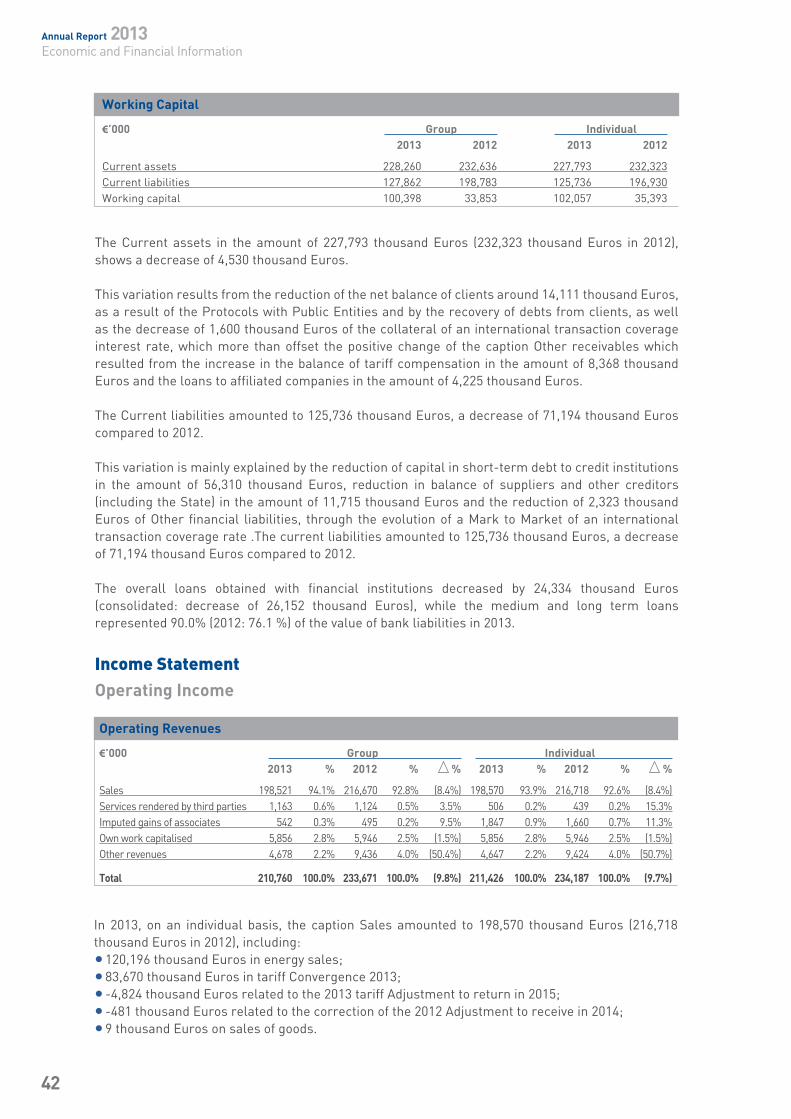
In 2013, on an individual basis, the caption Sales amounted to 198,570 thousand Euros (216,718 thousand Euros in 2012), including:• 120,196 thousand Euros in energy sales;• 83,670 thousand Euros in tariff Convergence 2013;• -4,824 thousand Euros related to the 2013 tariff Adjustment to return in 2015;• -481 thousand Euros related to the correction of the 2012 Adjustment to receive in 2014;• 9 thousand Euros on sales of goods.
The Current assets in the amount of 227,793 thousand Euros (232,323 thousand Euros in 2012), shows a decrease of 4,530 thousand Euros.
This variation results from the reduction of the net balance of clients around 14,111 thousand Euros, as a result of the Protocols with Public Entities and by the recovery of debts from clients, as well as the decrease of 1,600 thousand Euros of the collateral of an international transaction coverage interest rate, which more than offset the positive change of the caption Other receivables which resulted from the increase in the balance of tariff compensation in the amount of 8,368 thousand Euros and the loans to affiliated companies in the amount of 4,225 thousand Euros.
The Current liabilities amounted to 125,736 thousand Euros, a decrease of 71,194 thousand Euros compared to 2012.
This variation is mainly explained by the reduction of capital in short-term debt to credit institutions in the amount of 56,310 thousand Euros, reduction in balance of suppliers and other creditors (including the State) in the amount of 11,715 thousand Euros and the reduction of 2,323 thousand Euros of Other financial liabilities, through the evolution of a Mark to Market of an international transaction coverage rate .The current liabilities amounted to 125,736 thousand Euros, a decrease of 71,194 thousand Euros compared to 2012.
The overall loans obtained with financial institutions decreased by 24,334 thousand Euros (consolidated: decrease of 26,152 thousand Euros), while the medium and long term loans represented 90.0% (2012: 76.1 %) of the value of bank liabilities in 2013.
Income StatementOperating Income
Working Capital
€’000 Group Individual 2013 2012 2013 2012
Current assets 228,260 232,636 227,793 232,323 Current liabilities 127,862 198,783 125,736 196,930 Working capital 100,398 33,853 102,057 35,393
Operating Revenues
€’000 Group Individual 2013 % 2012 % % 2013 % 2012 % %
Sales 198,521 94.1% 216,670 92.8% (8.4%) 198,570 93.9% 216,718 92.6% (8.4%)Services rendered by third parties 1,163 0.6% 1,124 0.5% 3.5% 506 0.2% 439 0.2% 15.3%Imputed gains of associates 542 0.3% 495 0.2% 9.5% 1,847 0.9% 1,660 0.7% 11.3%Own work capitalised 5,856 2.8% 5,946 2.5% (1.5%) 5,856 2.8% 5,946 2.5% (1.5%)Other revenues 4,678 2.2% 9,436 4.0% (50.4%) 4,647 2.2% 9,424 4.0% (50.7%)
Total 210,760 100.0% 233,671 100.0% (9.8%) 211,426 100.0% 234,187 100.0% (9.7%)
Empresa de Electricidade da Madeira
43
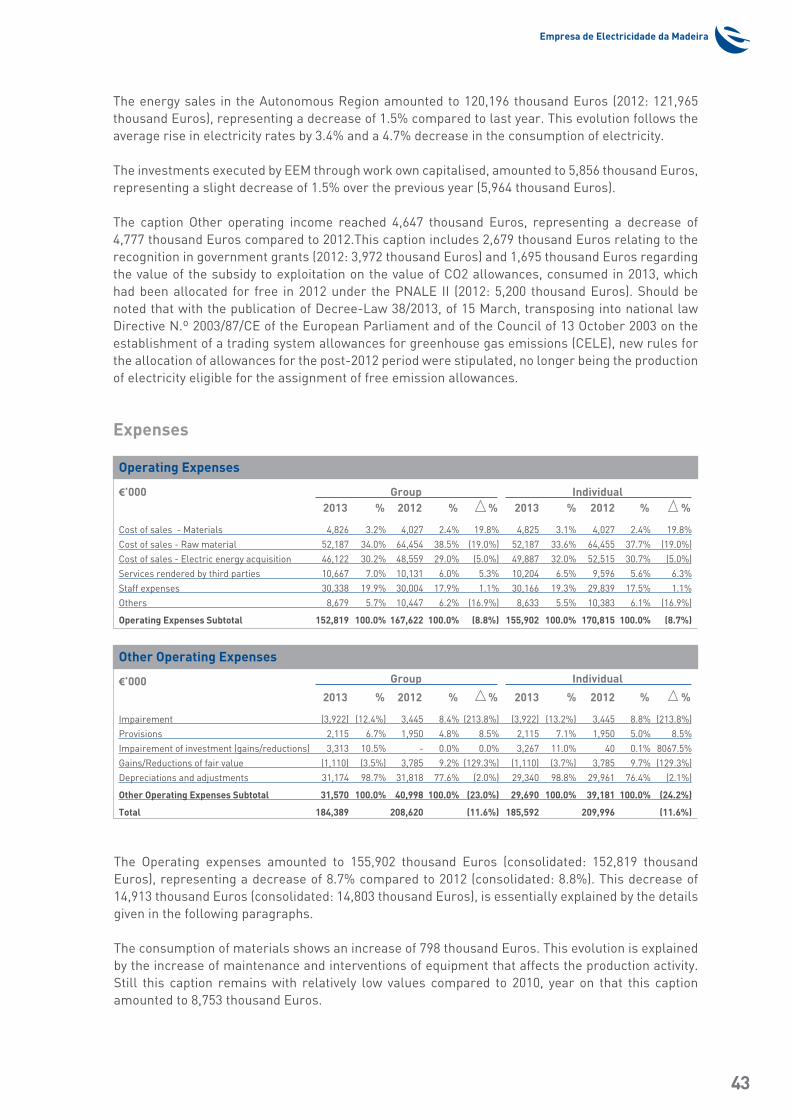
The energy sales in the Autonomous Region amounted to 120,196 thousand Euros (2012: 121,965 thousand Euros), representing a decrease of 1.5% compared to last year. This evolution follows the average rise in electricity rates by 3.4% and a 4.7% decrease in the consumption of electricity.
The investments executed by EEM through work own capitalised, amounted to 5,856 thousand Euros, representing a slight decrease of 1.5% over the previous year (5,964 thousand Euros).
The caption Other operating income reached 4,647 thousand Euros, representing a decrease of 4,777 thousand Euros compared to 2012.This caption includes 2,679 thousand Euros relating to the recognition in government grants (2012: 3,972 thousand Euros) and 1,695 thousand Euros regarding the value of the subsidy to exploitation on the value of CO2 allowances, consumed in 2013, which had been allocated for free in 2012 under the PNALE II (2012: 5,200 thousand Euros). Should be noted that with the publication of Decree-Law 38/2013, of 15 March, transposing into national law Directive N.º 2003/87/CE of the European Parliament and of the Council of 13 October 2003 on the establishment of a trading system allowances for greenhouse gas emissions (CELE), new rules for the allocation of allowances for the post-2012 period were stipulated, no longer being the production of electricity eligible for the assignment of free emission allowances.
Expenses
The Operating expenses amounted to 155,902 thousand Euros (consolidated: 152,819 thousand Euros), representing a decrease of 8.7% compared to 2012 (consolidated: 8.8%). This decrease of 14,913 thousand Euros (consolidated: 14,803 thousand Euros), is essentially explained by the details given in the following paragraphs.
The consumption of materials shows an increase of 798 thousand Euros. This evolution is explained by the increase of maintenance and interventions of equipment that affects the production activity. Still this caption remains with relatively low values compared to 2010, year on that this caption amounted to 8,753 thousand Euros.
Operating Expenses
€’000 Group Individual 2013 % 2012 % % 2013 % 2012 % %
Cost of sales - Materials 4,826 3.2% 4,027 2.4% 19.8% 4,825 3.1% 4,027 2.4% 19.8%Cost of sales - Raw material 52,187 34.0% 64,454 38.5% (19.0%) 52,187 33.6% 64,455 37.7% (19.0%)Cost of sales - Electric energy acquisition 46,122 30.2% 48,559 29.0% (5.0%) 49,887 32.0% 52,515 30.7% (5.0%)Services rendered by third parties 10,667 7.0% 10,131 6.0% 5.3% 10,204 6.5% 9,596 5.6% 6.3%Staff expenses 30,338 19.9% 30,004 17.9% 1.1% 30,166 19.3% 29,839 17.5% 1.1%Others 8,679 5.7% 10,447 6.2% (16.9%) 8,633 5.5% 10,383 6.1% (16.9%)
Operating Expenses Subtotal 152,819 100.0% 167,622 100.0% (8.8%) 155,902 100.0% 170,815 100.0% (8.7%)
Other Operating Expenses
€’000 Group Individual
2013 % 2012 % % 2013 % 2012 % %
Impairement (3,922) (12.4%) 3,445 8.4% (213.8%) (3,922) (13.2%) 3,445 8.8% (213.8%)Provisions 2,115 6.7% 1,950 4.8% 8.5% 2,115 7.1% 1,950 5.0% 8.5%Impairement of investment (gains/reductions) 3,313 10.5% - 0.0% 0.0% 3,267 11.0% 40 0.1% 8067.5%Gains/Reductions of fair value (1,110) (3.5%) 3,785 9.2% (129.3%) (1,110) (3.7%) 3,785 9.7% (129.3%)Depreciations and adjustments 31,174 98.7% 31,818 77.6% (2.0%) 29,340 98.8% 29,961 76.4% (2.1%)
Other Operating Expenses Subtotal 31,570 100.0% 40,998 100.0% (23.0%) 29,690 100.0% 39,181 100.0% (24.2%)
Total 184,389 208,620 (11.6%) 185,592 209,996 (11.6%)
Annual Report 2013Economic and Financial Information
44
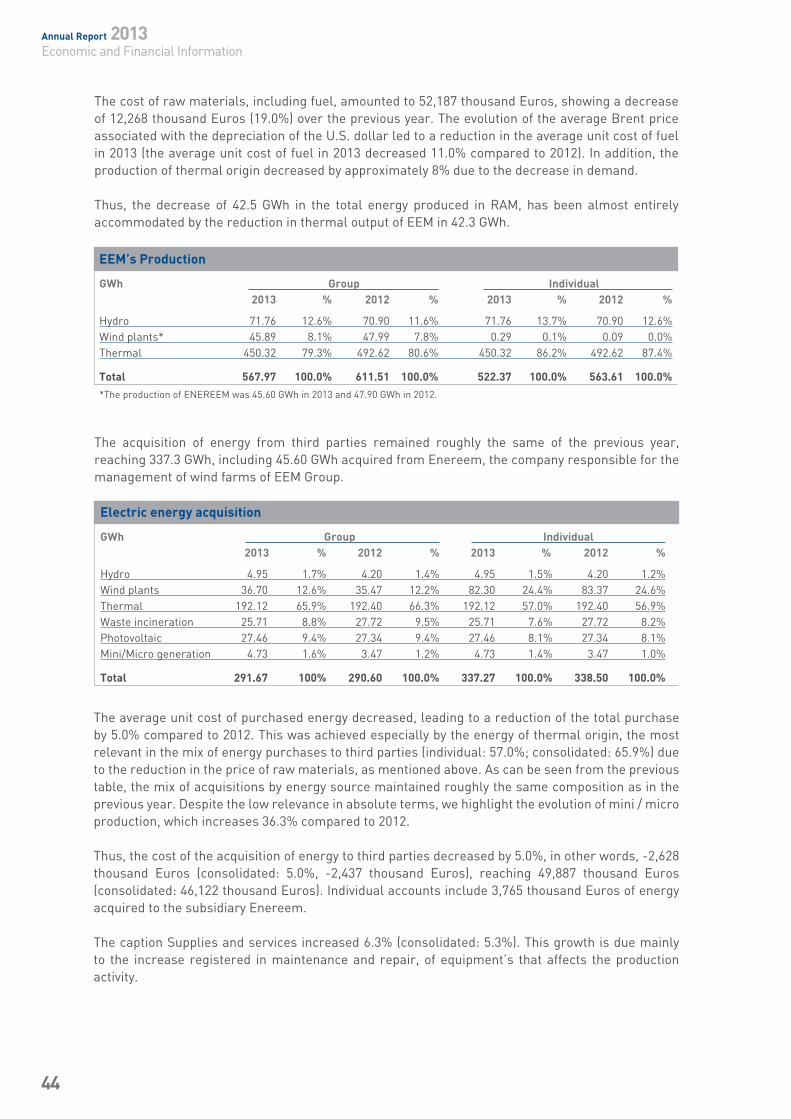
The cost of raw materials, including fuel, amounted to 52,187 thousand Euros, showing a decrease of 12,268 thousand Euros (19.0%) over the previous year. The evolution of the average Brent price associated with the depreciation of the U.S. dollar led to a reduction in the average unit cost of fuel in 2013 (the average unit cost of fuel in 2013 decreased 11.0% compared to 2012). In addition, the production of thermal origin decreased by approximately 8% due to the decrease in demand. Thus, the decrease of 42.5 GWh in the total energy produced in RAM, has been almost entirely accommodated by the reduction in thermal output of EEM in 42.3 GWh.
The acquisition of energy from third parties remained roughly the same of the previous year, reaching 337.3 GWh, including 45.60 GWh acquired from Enereem, the company responsible for the management of wind farms of EEM Group.
EEM’s Production
GWh Group Individual 2013 % 2012 % 2013 % 2012 %
Hydro 71.76 12.6% 70.90 11.6% 71.76 13.7% 70.90 12.6%Wind plants* 45.89 8.1% 47.99 7.8% 0.29 0.1% 0.09 0.0%Thermal 450.32 79.3% 492.62 80.6% 450.32 86.2% 492.62 87.4%
Total 567.97 100.0% 611.51 100.0% 522.37 100.0% 563.61 100.0%
*The production of ENEREEM was 45.60 GWh in 2013 and 47.90 GWh in 2012.
Electric energy acquisition
GWh Group Individual 2013 % 2012 % 2013 % 2012 %
Hydro 4.95 1.7% 4.20 1.4% 4.95 1.5% 4.20 1.2% Wind plants 36.70 12.6% 35.47 12.2% 82.30 24.4% 83.37 24.6% Thermal 192.12 65.9% 192.40 66.3% 192.12 57.0% 192.40 56.9% Waste incineration 25.71 8.8% 27.72 9.5% 25.71 7.6% 27.72 8.2% Photovoltaic 27.46 9.4% 27.34 9.4% 27.46 8.1% 27.34 8.1% Mini/Micro generation 4.73 1.6% 3.47 1.2% 4.73 1.4% 3.47 1.0%
Total 291.67 100% 290.60 100.0% 337.27 100.0% 338.50 100.0%
The average unit cost of purchased energy decreased, leading to a reduction of the total purchase by 5.0% compared to 2012. This was achieved especially by the energy of thermal origin, the most relevant in the mix of energy purchases to third parties (individual: 57.0%; consolidated: 65.9%) due to the reduction in the price of raw materials, as mentioned above. As can be seen from the previous table, the mix of acquisitions by energy source maintained roughly the same composition as in the previous year. Despite the low relevance in absolute terms, we highlight the evolution of mini / micro production, which increases 36.3% compared to 2012.
Thus, the cost of the acquisition of energy to third parties decreased by 5.0%, in other words, -2,628 thousand Euros (consolidated: 5.0%, -2,437 thousand Euros), reaching 49,887 thousand Euros (consolidated: 46,122 thousand Euros). Individual accounts include 3,765 thousand Euros of energy acquired to the subsidiary Enereem.
The caption Supplies and services increased 6.3% (consolidated: 5.3%). This growth is due mainly to the increase registered in maintenance and repair, of equipment’s that affects the production activity.
Empresa de Electricidade da Madeira
45
The total Staff expenses caption amounted to 30,166 thousand Euros, showing an increase of 1.1% compared to the amount of this caption in 2012 (29,839 thousand Euros). This variation is in essence due to the following factors:
• in 2013, and as in previous years, the EEM and its subsidiaries have fully implemented the application of the salary reduction measures included in the State Budget for 2013, aiming to reduce the salaries applicable to sovereign bodies and Public Administration including public institutes, regulatory authorities and public companies. EEM being a public company held exclusively by public capital (Regional Legislative Decree n. º 14/94/M, of 3 June) and since the Madeira Regional Government undertook a rigorous implementation of measures to reduce remuneration (included in State budgets), covering public managers and employees of Public Enterprises of exclusive or majority public capital and public regional business entities (42/2012/M regional Legislative Decree of 31 December), EEM proceeded to apply a progressive reduction rates system, covering the monthly remunerations exceeding 1,500 Euros.
Moreover, in 2012, the full suspension of holiday pay and Christmas was in force for workers in the
public sector, with salaries above 1,100 Euros, and partially for workers with wages between 600 and 1,100 Euros. Thus, in 2012, the EEM has not registered the charge relating to the Christmas year subsidy, considering only 13 months’ salary, following the declaration of unconstitutionality of the norm of the state budget for 2013 which provided for the suspension of holiday pay.
In the accounts for 2013, according to the law, personnel expenses shall include the identical
salary reductions to 2012, but considering the Christmas subsidy burden by mirroring 14 months of pay, resulting in an increase in spending with staff caption of 5.8% over the previous year;
• EEM has been implementing a rigorous workers admissions policy. The continuity of this policy, together with the constant demand for ever greater efficiency in resources in general, and human resources in particular, as well as setting limits for the reduction in the number of workers, due to the adjustment program, which allowed in 2013 a reduction of 14 active employees, which means a reduction of 803 to 789 active workers, corresponding to -1.7% compared to 2012. Compared to 2010 there is a decrease of 7.3%;
• In accordance with market and sector best practices there were reviewed some of the basic assumptions of the actuarial study on the post-employment benefit liabilities, including the discount rate and the mortality table. Thus, pension spending recorded in 2013 amounted to 2,397 thousand Euros.
Thus, although overall staff costs present a growth of 1.1%, excluding the gain corresponding to the fees paid with the Christmas subsidy in 2013 and suspended in 2012, personnel costs decreased by 4.8% over the year above.
The amount recorded in Other expenses and losses caption amounted to 8,633 thousand Euros, decreasing by 16.9% over the previous year. This caption recorded 7,540 thousand Euros (7,601 thousand Euros in 2012) relating to municipal occupancy rate of the public domain for electrical infrastructure, by applying the rate of 7.5% on sales of electric energy at low tension in each municipality in the Autonomous Region of Madeira. The remaining amount of other expenses and losses caption correspond essentially to direct and indirect (Imposto Selo) taxes, expenses related to easements (surface rights) and indemnities paid to customers for damages caused by network disruption. These expenses have decreased by 251 thousand Euros compared to the previous year. However, much of the variation in this caption derives from the accounting capital loss, recorded in 2012, amounting to 1,438 thousand Euros, resulting from the difference between the total value of sales of CO2 allowances and its book value (see note “European Emission Trading System” in Section 3), which in 2013 has not occurred because no allowances sales were made.
Annual Report 2013Economic and Financial Information
46
The impairment of receivables shows in 2013 a reversal of 3,922 thousand Euros, reflecting a shift in capacity and efficiency of collecting debts from customers. As previously mentioned, protocols were celebrated throughout 2013, with Public Entities, with the objective of defining plans for the recovery of outstanding amounts from previous years. There was also a decrease of 6,395 thousand Euros of the total outstanding amount by way of recovery of debts which had significant amount overdue, as well as greater efficiency in collecting current debt, especially from public entities.
The amount recorded in Provisions reached 2,115 thousand Euros, refers to the strengthening of the provision to meet the contingencies arising from EEM’s activity.
The Impairment of non-depreciable investments recorded in 2013, amounting to 3,313 thousand Euros, is related to the uncertainty about the future development of the work currently in progress for the construction of a terminal for unloading liquefied natural gas (LNG). Given the changes in the economic and financial environment, since the beginning of the preparatory work on this project, which brought restrictions on the ability to obtain bank financing as conducted to a review of the assumptions that were based on the evaluation of the viability of this project, namely, regarding the outlook for economic growth with direct influence on estimates of consumption of this product, EEM considered suspending the activities related to it but has not, however, abandoned the goal of building an LNG terminal in Madeira.
As mentioned above, and understanding how fundamental the use of LNG in the production of electricity, either for reasons of diversification of energy sources used or for environmental reasons, such as reducing the emission of harmful gases, EEM decided for a mid-term and flexible solution, based on the installation of a natural gas unit for reception, storage and regasification of natural gas to supply only the three dual-fuel groups that are located on “Nave III” of CTV. The EEM launched in due course, an international public tender for the supply of LNG to this “Nave” aiming to replace the fuel-oil currently consumed by these three groups, with the beginning of the use of this raw material in the month of March 2014.
The positive change in fair value in the amount of 1,110 thousand Euros, arises from the net effect of the resulting increase of 2,323 thousand Euros in financial derivative instruments, at fair value through profit or loss, and the devaluations recorded on quoted investments, amounting of 1,213 thousand Euros.
In 2013, the value of the Depreciation and amortisation from EEM amounted to 29,340 thousand Euros (consolidated: 31,174 thousand Euros), 2.1% less than in 2012. This caption includes amortisation expenses relating to the consumption of CO2 allowances of the year, which amounted to 1,986 thousand Euros (2,295 thousand Euros in 2012) (see note “European Emission Trading System” in Section 3). Thus, the remaining amount referring to the depreciation and amortisation expenses relating to fixed tangible and intangible assets in 27,354 thousand Euros (consolidated: 29,188 thousand Euros), representing a decrease of 1.1% from 2012.
The caption Interest and similar income in the amount of 2,860 thousand Euros, increased by 38.9% over the previous year. This increase was due primarily to the recognition of interest relating to tariff convergence of 2009, received at the beginning of 2014, amounting to 1,439 thousand Euros. The interest charged for late payment of energy remained at the same level as the previous year, amounting to 707 thousand Euros.
The Interest and similar expenses, reached 22,437 thousand Euros (consolidated: 22,586 thousand Euros), representing a decrease of 3.1% compared to 2012. It should be noted that the amount of interest and similar expenses is net of capitalised financing charges, the amount of which in 2013 was 303 thousand Euros (277 thousand Euros in 2012). For this positive development, contributed the reduction in capital owed to financial institutions in 24,334 thousand Euros, and the average decrease of the reference rates over the previous year. Throughout 2013, and unlike last year, there was no worsening of spreads and commissions associated with the financing liabilities.
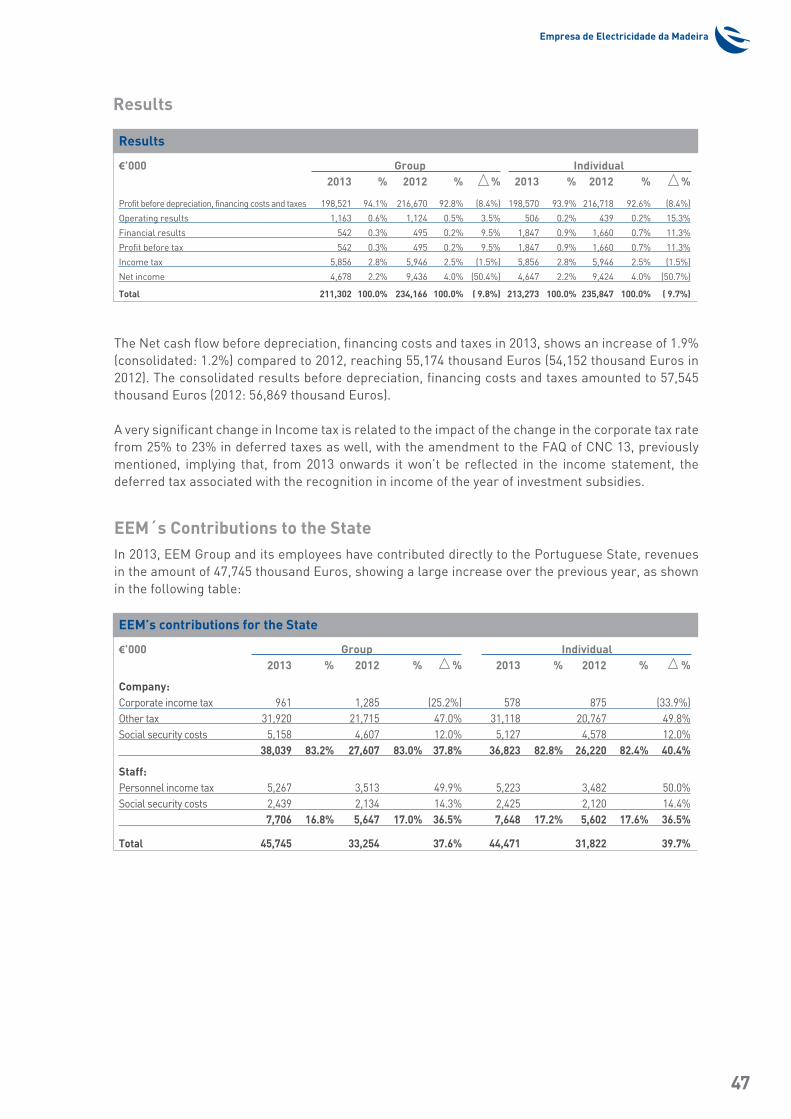
Empresa de Electricidade da Madeira
47
Results
The Net cash flow before depreciation, financing costs and taxes in 2013, shows an increase of 1.9% (consolidated: 1.2%) compared to 2012, reaching 55,174 thousand Euros (54,152 thousand Euros in 2012). The consolidated results before depreciation, financing costs and taxes amounted to 57,545 thousand Euros (2012: 56,869 thousand Euros).
A very significant change in Income tax is related to the impact of the change in the corporate tax rate from 25% to 23% in deferred taxes as well, with the amendment to the FAQ of CNC 13, previously mentioned, implying that, from 2013 onwards it won’t be reflected in the income statement, the deferred tax associated with the recognition in income of the year of investment subsidies.
EEM´s Contributions to the StateIn 2013, EEM Group and its employees have contributed directly to the Portuguese State, revenues in the amount of 47,745 thousand Euros, showing a large increase over the previous year, as shown in the following table:
EEM’s contributions for the State
€’000 Group Individual 2013 % 2012 % % 2013 % 2012 % %
Company:Corporate income tax 961 1,285 (25.2%) 578 875 (33.9%)Other tax 31,920 21,715 47.0% 31,118 20,767 49.8%Social security costs 5,158 4,607 12.0% 5,127 4,578 12.0% 38,039 83.2% 27,607 83.0% 37.8% 36,823 82.8% 26,220 82.4% 40.4%
Staff:Personnel income tax 5,267 3,513 49.9% 5,223 3,482 50.0%Social security costs 2,439 2,134 14.3% 2,425 2,120 14.4% 7,706 16.8% 5,647 17.0% 36.5% 7,648 17.2% 5,602 17.6% 36.5%
Total 45,745 33,254 37.6% 44,471 31,822 39.7%
Results
€’000 Group Individual 2013 % 2012 % % 2013 % 2012 % %
Profit before depreciation, financing costs and taxes 198,521 94.1% 216,670 92.8% (8.4%) 198,570 93.9% 216,718 92.6% (8.4%)
Operating results 1,163 0.6% 1,124 0.5% 3.5% 506 0.2% 439 0.2% 15.3%
Financial results 542 0.3% 495 0.2% 9.5% 1,847 0.9% 1,660 0.7% 11.3%
Profit before tax 542 0.3% 495 0.2% 9.5% 1,847 0.9% 1,660 0.7% 11.3%
Income tax 5,856 2.8% 5,946 2.5% (1.5%) 5,856 2.8% 5,946 2.5% (1.5%)
Net income 4,678 2.2% 9,436 4.0% (50.4%) 4,647 2.2% 9,424 4.0% (50.7%)
Total 211,302 100.0% 234,166 100.0% ( 9.8%) 213,273 100.0% 235,847 100.0% ( 9.7%)
Annual Report 2013Economic and Financial Information
48
This growth is largely explained by the fact that the VAT rate of 22% has been applied to sales of energy, throughout the year 2013 (in April 2012, the rate of VAT on energy sales rose 16% to 22%).
The increase in the income tax is related to differences between book and tax results, resulting mainly from the application of the equity method, spending on post-employment benefits and provisions with no tax relevance.
The increase in social charges and items of IRS is directly associated with the evolution of personnel expenses as well as higher taxes on the income of singular individuals, occurred in 2013.
Gross Added ValueThe gross added value reached the amount of 83,843 thousand Euros (consolidated: 87,738 thousand Euros), representing a decrease of 8.4% (consolidated: 8.2%) compared to 2012.
Companies included in consolidation methodThe subsidiaries included in the consolidation by the integral consolidation method, as at 31 December 2013 are presented as follows:
Enereem - Energias Renováveis, Lda. (Enereem), whose main activity is the production of energy from renewable sources, with the main focus on wind component. Being the Company with the largest installed wind capacity in RAM, it has added responsibilities on the balance of the regional power system, looking to contribute so that they can safely reach levels of integration of wind power without parallel in isolated and small scale networks so it should not be reductively perceived as a mere instrument of EEM Group for the production of energy.
Emacom, Telecomunicações da Madeira, Unipessoal, Lda. (Emacom), is the entity responsible for the EEM Group Contact Center, fulfilling a vital role in managing the associated telecommunications, transport and distribution activities of electric energy.
Casa da Luz - Empreendimentos Turísticos, Similares Unipessoal, Lda. (Museu Casa da Luz), whose main activity is the exploration of the museum. Apart from reflecting the history of electricity in Madeira from 1897 to date, from the simple knowledge of electricity to its widespread use in multiple applications, also intends to be a place of knowledge transmission, which projects the role that electricity is expected to play and discuss the importance of renewable energy and rational use of energy. Thus characterised as something intrinsic to EEM, the memory and heritage of its history and culture, as well as a good that transcends when considered in its size and significance to the regional heritage.
Designation€’000 Share Total Total Total Sales Net Profit % Group Capital Assets Liabilities Equity and services for the Rendered Period
Casa da Luz - Empreend. Turísticos Similares, Unip., Lda. 99,760 2,324,255 1,907,552 416,703 30,976 8,836 100.00%
Enereem - Energias Renováveis, Lda. 49,880 23,910,340 17,894,859 6,015,481 3,765,167 1,021,636 92.50%
Emacom - Telecomunicações da Madeira, Unip., Lda. 49,880 1,347,168 859,473 487,695 898,197 427,815 100.00%
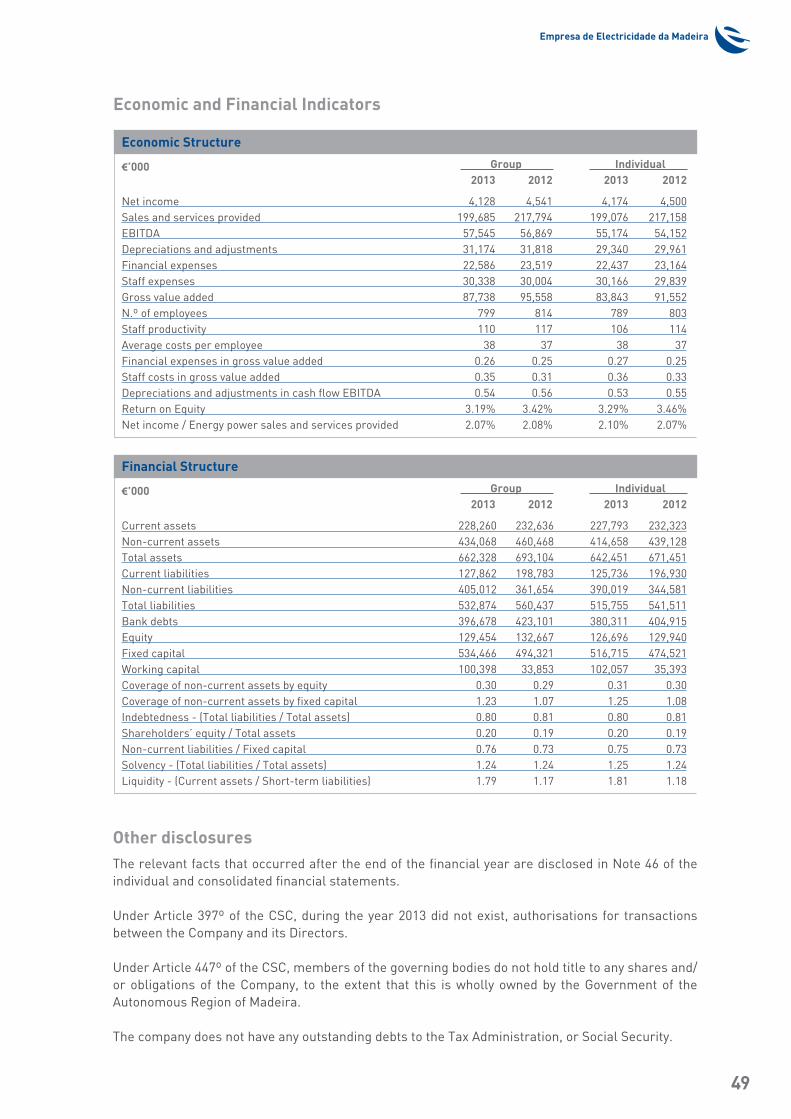
Empresa de Electricidade da Madeira
49
Other disclosuresThe relevant facts that occurred after the end of the financial year are disclosed in Note 46 of the individual and consolidated financial statements.
Under Article 397º of the CSC, during the year 2013 did not exist, authorisations for transactions between the Company and its Directors.
Under Article 447º of the CSC, members of the governing bodies do not hold title to any shares and/or obligations of the Company, to the extent that this is wholly owned by the Government of the Autonomous Region of Madeira.
The company does not have any outstanding debts to the Tax Administration, or Social Security.
Economic and Financial Indicators
Economic Structure
€’000 Group Individual 2013 2012 2013 2012
Net income 4,128 4,541 4,174 4,500Sales and services provided 199,685 217,794 199,076 217,158EBITDA 57,545 56,869 55,174 54,152Depreciations and adjustments 31,174 31,818 29,340 29,961Financial expenses 22,586 23,519 22,437 23,164Staff expenses 30,338 30,004 30,166 29,839Gross value added 87,738 95,558 83,843 91,552N.º of employees 799 814 789 803Staff productivity 110 117 106 114Average costs per employee 38 37 38 37Financial expenses in gross value added 0.26 0.25 0.27 0.25Staff costs in gross value added 0.35 0.31 0.36 0.33Depreciations and adjustments in cash flow EBITDA 0.54 0.56 0.53 0.55Return on Equity 3.19% 3.42% 3.29% 3.46%Net income / Energy power sales and services provided 2.07% 2.08% 2.10% 2.07%
Financial Structure
€’000 Group Individual 2013 2012 2013 2012
Current assets 228,260 232,636 227,793 232,323Non-current assets 434,068 460,468 414,658 439,128Total assets 662,328 693,104 642,451 671,451Current liabilities 127,862 198,783 125,736 196,930Non-current liabilities 405,012 361,654 390,019 344,581Total liabilities 532,874 560,437 515,755 541,511Bank debts 396,678 423,101 380,311 404,915Equity 129,454 132,667 126,696 129,940Fixed capital 534,466 494,321 516,715 474,521Working capital 100,398 33,853 102,057 35,393Coverage of non-current assets by equity 0.30 0.29 0.31 0.30Coverage of non-current assets by fixed capital 1.23 1.07 1.25 1.08Indebtedness - (Total liabilities / Total assets) 0.80 0.81 0.80 0.81Shareholders’ equity / Total assets 0.20 0.19 0.20 0.19Non-current liabilities / Fixed capital 0.76 0.73 0.75 0.73Solvency - (Total liabilities / Total assets) 1.24 1.24 1.25 1.24Liquidity - (Current assets / Short-term liabilities) 1.79 1.17 1.81 1.18
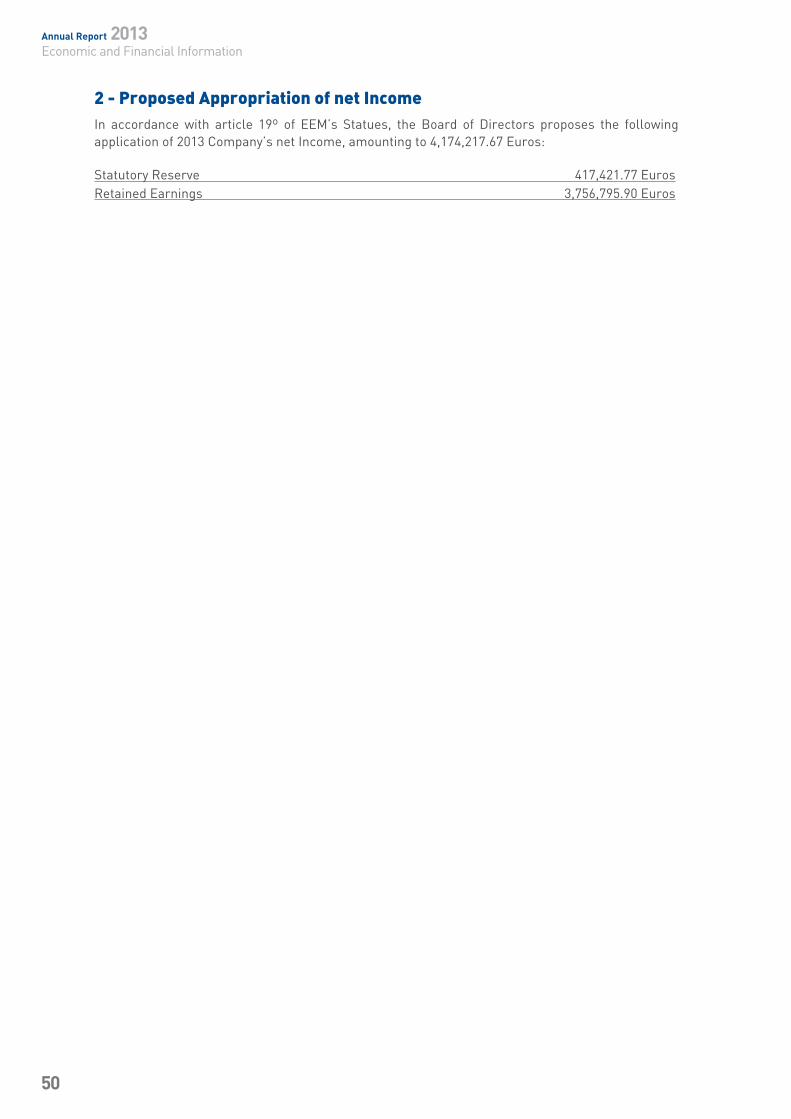
Annual Report 2013Economic and Financial Information
50
2 - Proposed Appropriation of net IncomeIn accordance with article 19º of EEM’s Statues, the Board of Directors proposes the following application of 2013 Company’s net Income, amounting to 4,174,217.67 Euros:
Statutory Reserve 417,421.77 EurosRetained Earnings 3,756,795.90 Euros
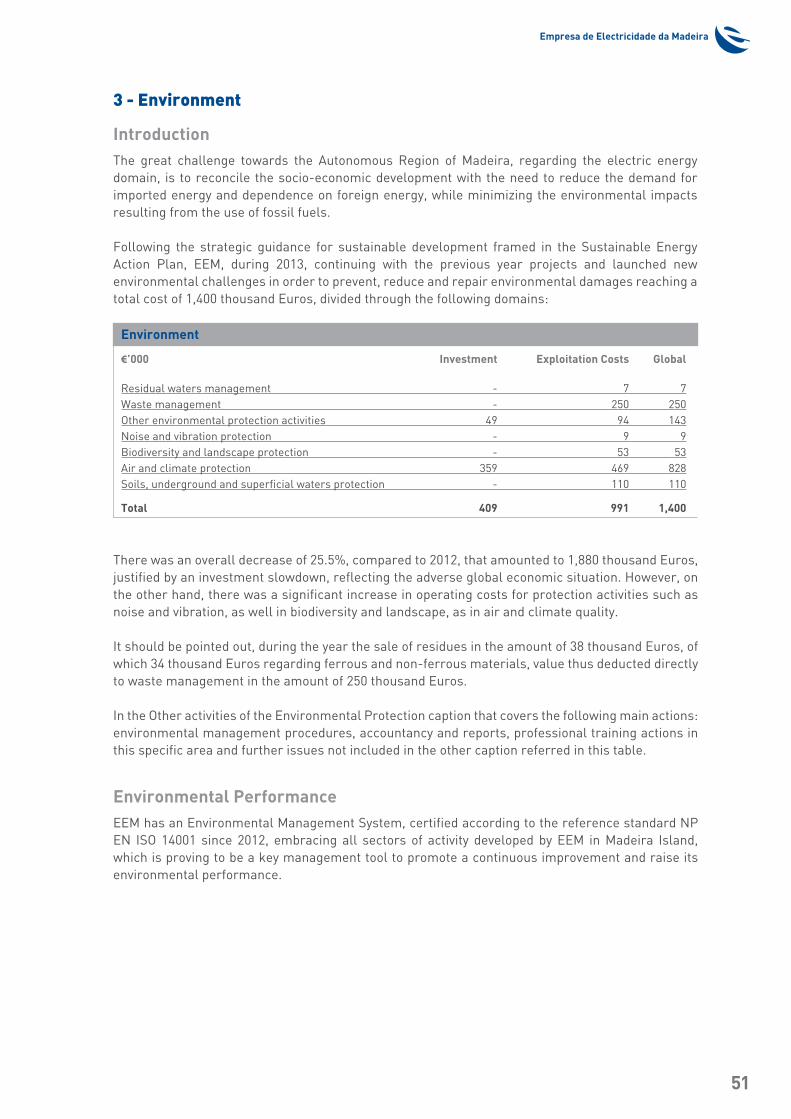
Empresa de Electricidade da Madeira
51
3 - Environment
IntroductionThe great challenge towards the Autonomous Region of Madeira, regarding the electric energy domain, is to reconcile the socio-economic development with the need to reduce the demand for imported energy and dependence on foreign energy, while minimizing the environmental impacts resulting from the use of fossil fuels.
Following the strategic guidance for sustainable development framed in the Sustainable Energy Action Plan, EEM, during 2013, continuing with the previous year projects and launched new environmental challenges in order to prevent, reduce and repair environmental damages reaching a total cost of 1,400 thousand Euros, divided through the following domains:
There was an overall decrease of 25.5%, compared to 2012, that amounted to 1,880 thousand Euros, justified by an investment slowdown, reflecting the adverse global economic situation. However, on the other hand, there was a significant increase in operating costs for protection activities such as noise and vibration, as well in biodiversity and landscape, as in air and climate quality.
It should be pointed out, during the year the sale of residues in the amount of 38 thousand Euros, of which 34 thousand Euros regarding ferrous and non-ferrous materials, value thus deducted directly to waste management in the amount of 250 thousand Euros.
In the Other activities of the Environmental Protection caption that covers the following main actions: environmental management procedures, accountancy and reports, professional training actions in this specific area and further issues not included in the other caption referred in this table.
Environmental PerformanceEEM has an Environmental Management System, certified according to the reference standard NP EN ISO 14001 since 2012, embracing all sectors of activity developed by EEM in Madeira Island, which is proving to be a key management tool to promote a continuous improvement and raise its environmental performance.
Environment
€’000 Investment Exploitation Costs Global
Residual waters management - 7 7Waste management - 250 250Other environmental protection activities 49 94 143Noise and vibration protection - 9 9Biodiversity and landscape protection - 53 53Air and climate protection 359 469 828Soils, underground and superficial waters protection - 110 110
Total 409 991 1,400
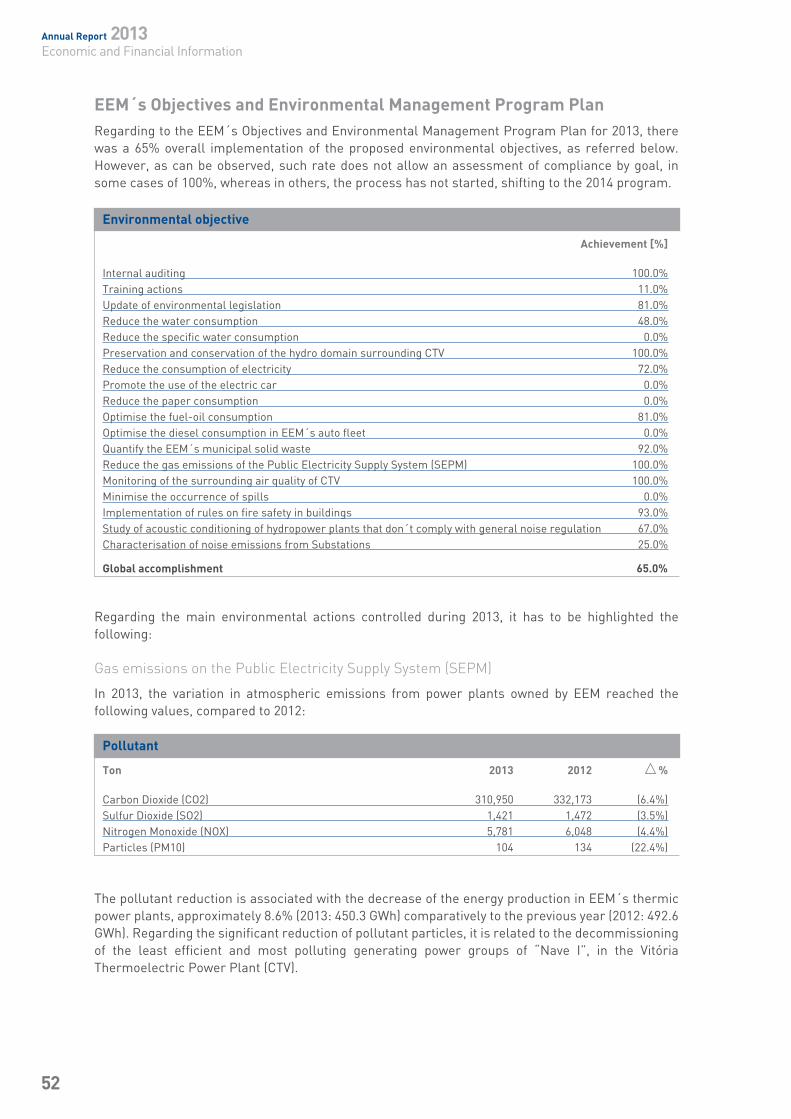
Annual Report 2013Economic and Financial Information
52
Regarding the main environmental actions controlled during 2013, it has to be highlighted the following:
Gas emissions on the Public Electricity Supply System (SEPM)
In 2013, the variation in atmospheric emissions from power plants owned by EEM reached the following values, compared to 2012:
EEM´s Objectives and Environmental Management Program Plan Regarding to the EEM´s Objectives and Environmental Management Program Plan for 2013, there was a 65% overall implementation of the proposed environmental objectives, as referred below. However, as can be observed, such rate does not allow an assessment of compliance by goal, in some cases of 100%, whereas in others, the process has not started, shifting to the 2014 program.
The pollutant reduction is associated with the decrease of the energy production in EEM´s thermic power plants, approximately 8.6% (2013: 450.3 GWh) comparatively to the previous year (2012: 492.6 GWh). Regarding the significant reduction of pollutant particles, it is related to the decommissioning of the least efficient and most polluting generating power groups of “Nave I”, in the Vitória Thermoelectric Power Plant (CTV).
Environmental objective
Achievement [%]
Internal auditing 100.0%Training actions 11.0%Update of environmental legislation 81.0%Reduce the water consumption 48.0%Reduce the specific water consumption 0.0%Preservation and conservation of the hydro domain surrounding CTV 100.0%Reduce the consumption of electricity 72.0%Promote the use of the electric car 0.0%Reduce the paper consumption 0.0%Optimise the fuel-oil consumption 81.0%Optimise the diesel consumption in EEM´s auto fleet 0.0%Quantify the EEM´s municipal solid waste 92.0%Reduce the gas emissions of the Public Electricity Supply System (SEPM) 100.0%Monitoring of the surrounding air quality of CTV 100.0%Minimise the occurrence of spills 0.0%Implementation of rules on fire safety in buildings 93.0%Study of acoustic conditioning of hydropower plants that don´t comply with general noise regulation 67.0%Characterisation of noise emissions from Substations 25.0%
Global accomplishment 65.0%
Pollutant
Ton 2013 2012 %
Carbon Dioxide (CO2) 310,950 332,173 (6.4%)Sulfur Dioxide (SO2) 1,421 1,472 (3.5%)Nitrogen Monoxide (NOX) 5,781 6,048 (4.4%)Particles (PM10) 104 134 (22.4%)
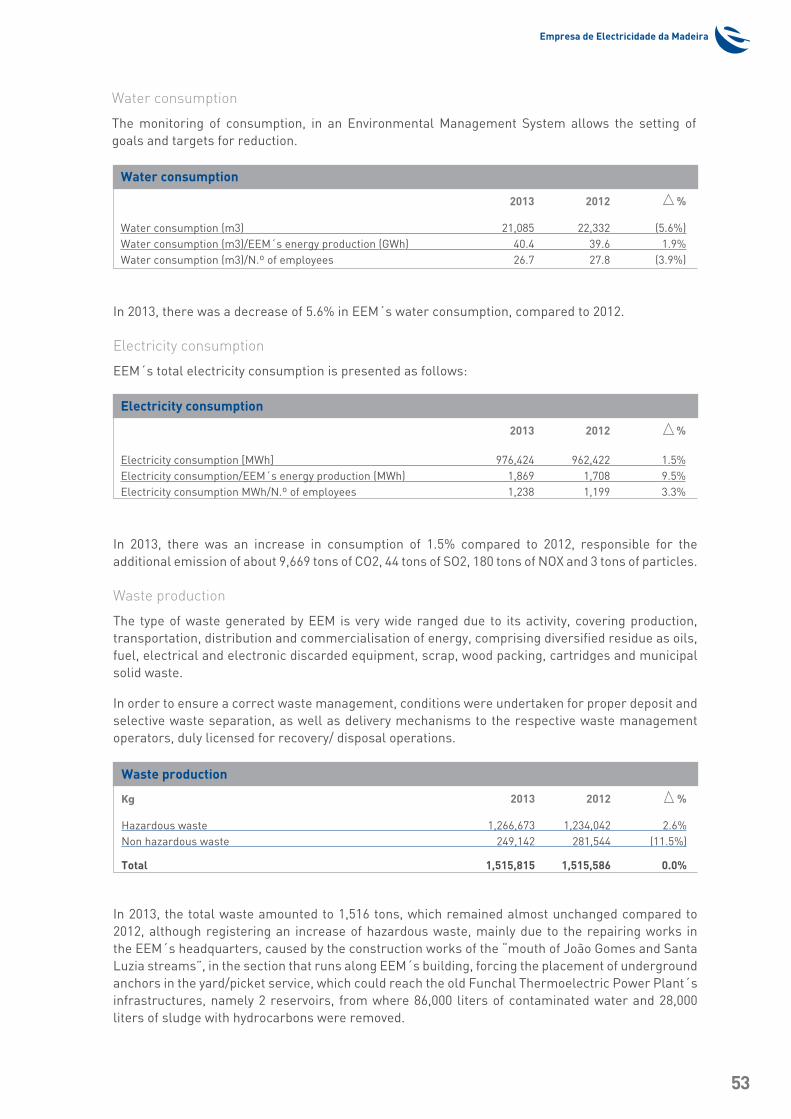
Empresa de Electricidade da Madeira
53
Water consumption
The monitoring of consumption, in an Environmental Management System allows the setting of goals and targets for reduction.
In 2013, there was a decrease of 5.6% in EEM´s water consumption, compared to 2012.
Electricity consumption
EEM´s total electricity consumption is presented as follows:
In 2013, there was an increase in consumption of 1.5% compared to 2012, responsible for the additional emission of about 9,669 tons of CO2, 44 tons of SO2, 180 tons of NOX and 3 tons of particles.
Waste production
The type of waste generated by EEM is very wide ranged due to its activity, covering production, transportation, distribution and commercialisation of energy, comprising diversified residue as oils, fuel, electrical and electronic discarded equipment, scrap, wood packing, cartridges and municipal solid waste.
In order to ensure a correct waste management, conditions were undertaken for proper deposit and selective waste separation, as well as delivery mechanisms to the respective waste management operators, duly licensed for recovery/ disposal operations.
In 2013, the total waste amounted to 1,516 tons, which remained almost unchanged compared to 2012, although registering an increase of hazardous waste, mainly due to the repairing works in the EEM´s headquarters, caused by the construction works of the “mouth of João Gomes and Santa Luzia streams”, in the section that runs along EEM´s building, forcing the placement of underground anchors in the yard/picket service, which could reach the old Funchal Thermoelectric Power Plant´s infrastructures, namely 2 reservoirs, from where 86,000 liters of contaminated water and 28,000 liters of sludge with hydrocarbons were removed.
Water consumption
2013 2012 %
Water consumption (m3) 21,085 22,332 (5.6%)Water consumption (m3)/EEM´s energy production (GWh) 40.4 39.6 1.9%Water consumption (m3)/N.º of employees 26.7 27.8 (3.9%)
Electricity consumption
2013 2012 %
Electricity consumption [MWh] 976,424 962,422 1.5%Electricity consumption/EEM´s energy production (MWh) 1,869 1,708 9.5%Electricity consumption MWh/N.º of employees 1,238 1,199 3.3%
Waste production
Kg 2013 2012 %
Hazardous waste 1,266,673 1,234,042 2.6%Non hazardous waste 249,142 281,544 (11.5%)
Total 1,515,815 1,515,586 0.0%
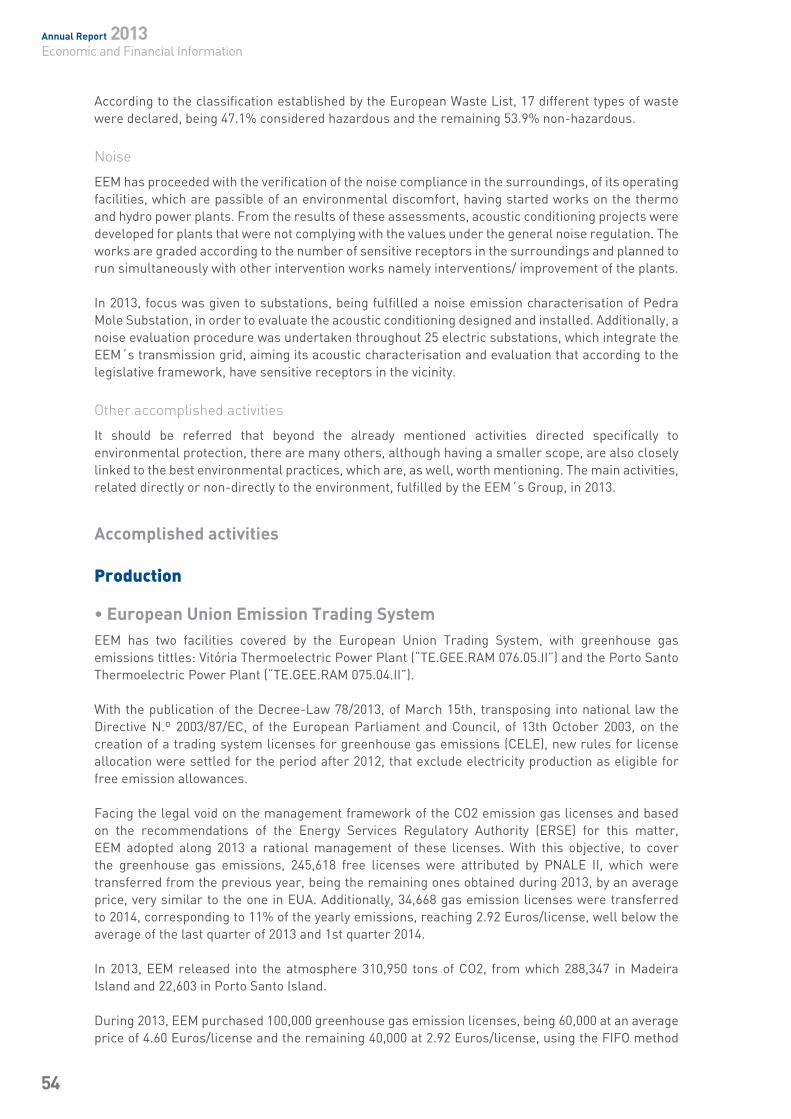
Annual Report 2013Economic and Financial Information
54
According to the classification established by the European Waste List, 17 different types of waste were declared, being 47.1% considered hazardous and the remaining 53.9% non-hazardous.
Noise
EEM has proceeded with the verification of the noise compliance in the surroundings, of its operating facilities, which are passible of an environmental discomfort, having started works on the thermo and hydro power plants. From the results of these assessments, acoustic conditioning projects were developed for plants that were not complying with the values under the general noise regulation. The works are graded according to the number of sensitive receptors in the surroundings and planned to run simultaneously with other intervention works namely interventions/ improvement of the plants.
In 2013, focus was given to substations, being fulfilled a noise emission characterisation of Pedra Mole Substation, in order to evaluate the acoustic conditioning designed and installed. Additionally, a noise evaluation procedure was undertaken throughout 25 electric substations, which integrate the EEM´s transmission grid, aiming its acoustic characterisation and evaluation that according to the legislative framework, have sensitive receptors in the vicinity.
Other accomplished activities
It should be referred that beyond the already mentioned activities directed specifically to environmental protection, there are many others, although having a smaller scope, are also closely linked to the best environmental practices, which are, as well, worth mentioning. The main activities, related directly or non-directly to the environment, fulfilled by the EEM´s Group, in 2013.
Accomplished activities
Production
• European Union Emission Trading SystemEEM has two facilities covered by the European Union Trading System, with greenhouse gas emissions tittles: Vitória Thermoelectric Power Plant (“TE.GEE.RAM 076.05.II”) and the Porto Santo Thermoelectric Power Plant (“TE.GEE.RAM 075.04.II”).
With the publication of the Decree-Law 78/2013, of March 15th, transposing into national law the Directive N.º 2003/87/EC, of the European Parliament and Council, of 13th October 2003, on the creation of a trading system licenses for greenhouse gas emissions (CELE), new rules for license allocation were settled for the period after 2012, that exclude electricity production as eligible for free emission allowances.
Facing the legal void on the management framework of the CO2 emission gas licenses and based on the recommendations of the Energy Services Regulatory Authority (ERSE) for this matter, EEM adopted along 2013 a rational management of these licenses. With this objective, to cover the greenhouse gas emissions, 245,618 free licenses were attributed by PNALE II, which were transferred from the previous year, being the remaining ones obtained during 2013, by an average price, very similar to the one in EUA. Additionally, 34,668 gas emission licenses were transferred to 2014, corresponding to 11% of the yearly emissions, reaching 2.92 Euros/license, well below the average of the last quarter of 2013 and 1st quarter 2014.
In 2013, EEM released into the atmosphere 310,950 tons of CO2, from which 288,347 in Madeira Island and 22,603 in Porto Santo Island.
During 2013, EEM purchased 100,000 greenhouse gas emission licenses, being 60,000 at an average price of 4.60 Euros/license and the remaining 40,000 at 2.92 Euros/license, using the FIFO method
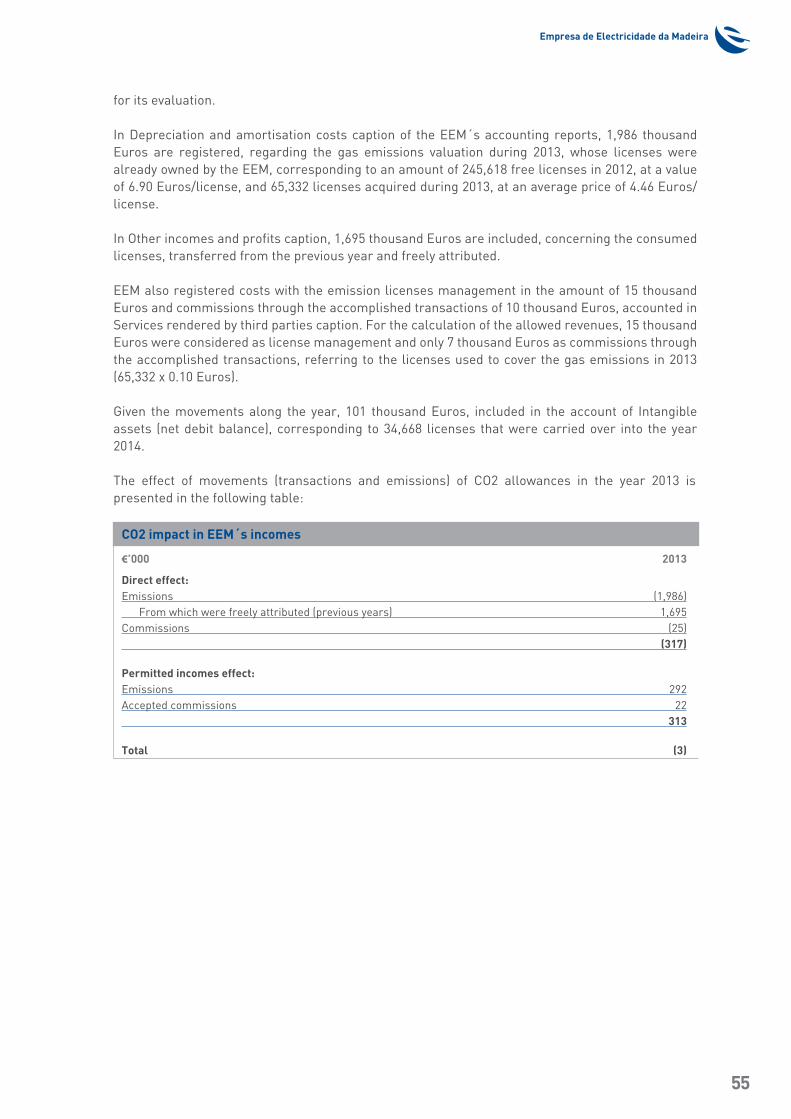
Empresa de Electricidade da Madeira
55
for its evaluation.
In Depreciation and amortisation costs caption of the EEM´s accounting reports, 1,986 thousand Euros are registered, regarding the gas emissions valuation during 2013, whose licenses were already owned by the EEM, corresponding to an amount of 245,618 free licenses in 2012, at a value of 6.90 Euros/license, and 65,332 licenses acquired during 2013, at an average price of 4.46 Euros/license.
In Other incomes and profits caption, 1,695 thousand Euros are included, concerning the consumed licenses, transferred from the previous year and freely attributed.
EEM also registered costs with the emission licenses management in the amount of 15 thousand Euros and commissions through the accomplished transactions of 10 thousand Euros, accounted in Services rendered by third parties caption. For the calculation of the allowed revenues, 15 thousand Euros were considered as license management and only 7 thousand Euros as commissions through the accomplished transactions, referring to the licenses used to cover the gas emissions in 2013 (65,332 x 0.10 Euros).
Given the movements along the year, 101 thousand Euros, included in the account of Intangible assets (net debit balance), corresponding to 34,668 licenses that were carried over into the year 2014.
The effect of movements (transactions and emissions) of CO2 allowances in the year 2013 is presented in the following table:
CO2 impact in EEM´s incomes
€’000 2013
Direct effect:Emissions (1,986) From which were freely attributed (previous years) 1,695Commissions (25) (317)
Permitted incomes effect:Emissions 292Accepted commissions 22 313
Total (3)
Annual Report 2013Economic and Financial Information
56
• Action Plan to minimize the environmental damages, regarding the Prevention and Integrated Control of Environmental Pollution
In 2013, monitoring actions were undertaken and the respective Annual Environmental Report was delivered to the Regional Environmental Authority, according to the Decree-Law N.º 02/2009, of 28 February, 2011, amending and replacing the previous Environmental License, N.º 02/2009, of 28 December, 2009, settled by the Decree-Law N.º 173/2008, of 26 August, referred to the Integrated Pollution Prevention and Control for Vitória Thermoelectric Power Plant (CTV).
Consumption Efficiency Promotion Plan in electric energy consumptionThe Consumption Efficiency Promotion Plan (PPEC) is settled by the Energy Services Regulatory Authority (ERSE), and aims to implement measures to promote rational electric consumption habits and the use of more efficient equipment by consumers.
As part of its duties, EEM has been proposing and implementing measures to promote an efficient consumption, being approved policies within the PPEC 2007-2008 and PPEC 2009-2010. In 2013, the application for “Regulation systems of luminous flux, LED street lighting on roads and monuments in RAM” was submitted and approved by ERSE.
The present measure falls within the Ep1m4 – Efficient Street Lighting of the National Action Plan for Energetic Efficient Program (PNAEE), and in the action of “3.13 Energetic Efficiency Program in Public Services – replacement of the existent low efficiency lamps and luminaires, and the installation of control and management systems” of the Sustainable Energy Action Plans in Madeira and Porto Santo islands, which were approved through the Resolution N.º 244/2012, of the Madeira Autonomous Region Government and developed under the Islands Pact, an initiative from the European Commission.
Investments with environmental benefitsAs result of the efforts on maximizing the use of renewable energies in 2013, EEM´s Group gave its contribution so that 27% of the total production was provided by renewable sources and aims to achieve together with other producers of this sector, about 50% in 2020.
As a result of the fulfilled infrastructures in renewable energies, largely carried out by EEM´s Group, in 2013, an amount of 216.7 GWh of green energy was emitted into the network, avoiding the annual emissions of 148,202 tons of CO2, 695 tons of SO2, 2,816 tons of NOX and 48 tons of particles, also avoiding the consumption of 46,770 tons of fuel-oil.
In addition to the impact that renewable energies have on the environment, it´s important to highlight the large scope that these investments have in the macro economy of regions, like ours, heavily dependent on imported petroleum products.
• Hydroelectric energy - Expansion of the Calheta Hydroelectric Exploitation System
In this context, the “Expansion of the Calheta Hydroelectric Exploitation System” (AAHC), assumes a prominent role, concerning the direct and indirect impact that will have in the exploitation of the endogenous renewable resources. This project concerns the expansion of hydroelectric production capacity, as well as its transformation into a reversible system, through a storage reservoir and water pumping system, enabling the accommodation of additional wind power, integrating the following main interventions: • Construction of the Pico da Urze storage reservoir (1,000,000 m3);• Construction of the Calheta restoring reservoir (73,500 m3);• Construction of the Calheta III Hydroelectric Power Plant (2x15 MW);• Construction of the Calheta Power Pumping System (3x5.9 MW);
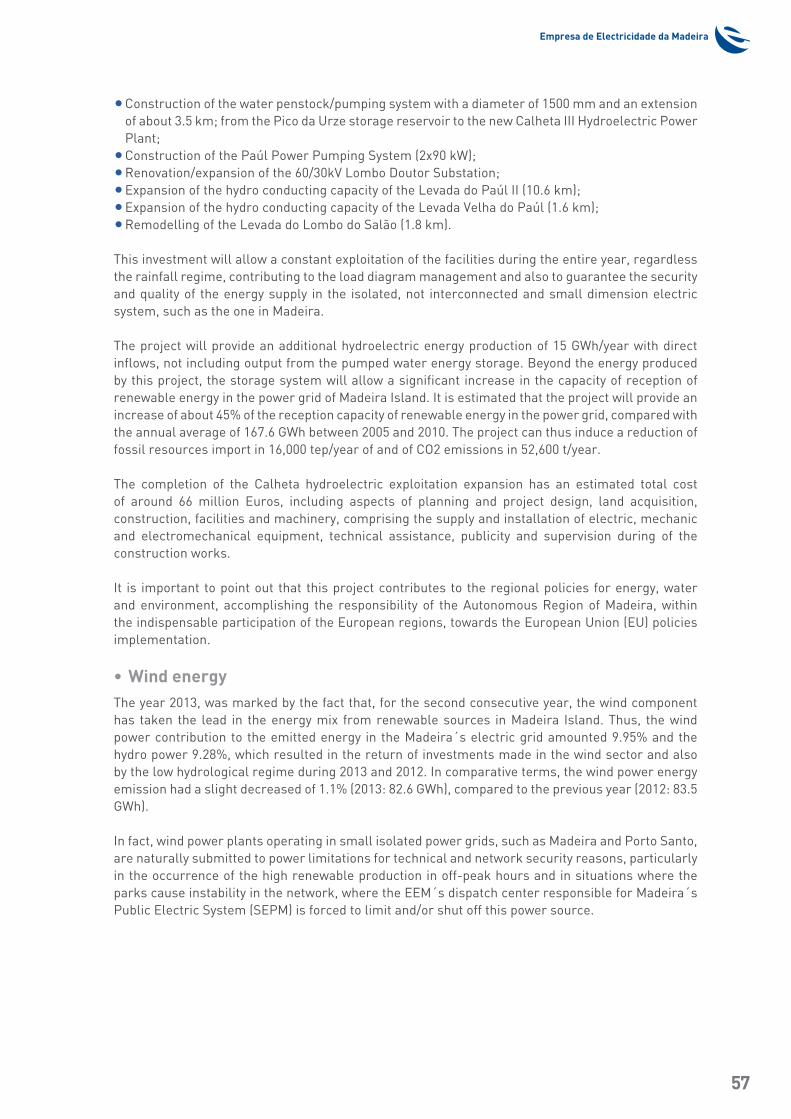
Empresa de Electricidade da Madeira
57
• Construction of the water penstock/pumping system with a diameter of 1500 mm and an extension of about 3.5 km; from the Pico da Urze storage reservoir to the new Calheta III Hydroelectric Power Plant;
• Construction of the Paúl Power Pumping System (2x90 kW);• Renovation/expansion of the 60/30kV Lombo Doutor Substation;• Expansion of the hydro conducting capacity of the Levada do Paúl II (10.6 km);• Expansion of the hydro conducting capacity of the Levada Velha do Paúl (1.6 km);• Remodelling of the Levada do Lombo do Salão (1.8 km).
This investment will allow a constant exploitation of the facilities during the entire year, regardless the rainfall regime, contributing to the load diagram management and also to guarantee the security and quality of the energy supply in the isolated, not interconnected and small dimension electric system, such as the one in Madeira.
The project will provide an additional hydroelectric energy production of 15 GWh/year with direct inflows, not including output from the pumped water energy storage. Beyond the energy produced by this project, the storage system will allow a significant increase in the capacity of reception of renewable energy in the power grid of Madeira Island. It is estimated that the project will provide an increase of about 45% of the reception capacity of renewable energy in the power grid, compared with the annual average of 167.6 GWh between 2005 and 2010. The project can thus induce a reduction of fossil resources import in 16,000 tep/year of and of CO2 emissions in 52,600 t/year.
The completion of the Calheta hydroelectric exploitation expansion has an estimated total cost of around 66 million Euros, including aspects of planning and project design, land acquisition, construction, facilities and machinery, comprising the supply and installation of electric, mechanic and electromechanical equipment, technical assistance, publicity and supervision during of the construction works.
It is important to point out that this project contributes to the regional policies for energy, water and environment, accomplishing the responsibility of the Autonomous Region of Madeira, within the indispensable participation of the European regions, towards the European Union (EU) policies implementation.
• Wind energyThe year 2013, was marked by the fact that, for the second consecutive year, the wind component has taken the lead in the energy mix from renewable sources in Madeira Island. Thus, the wind power contribution to the emitted energy in the Madeira´s electric grid amounted 9.95% and the hydro power 9.28%, which resulted in the return of investments made in the wind sector and also by the low hydrological regime during 2013 and 2012. In comparative terms, the wind power energy emission had a slight decreased of 1.1% (2013: 82.6 GWh), compared to the previous year (2012: 83.5 GWh).
In fact, wind power plants operating in small isolated power grids, such as Madeira and Porto Santo, are naturally submitted to power limitations for technical and network security reasons, particularly in the occurrence of the high renewable production in off-peak hours and in situations where the parks cause instability in the network, where the EEM´s dispatch center responsible for Madeira´s Public Electric System (SEPM) is forced to limit and/or shut off this power source.
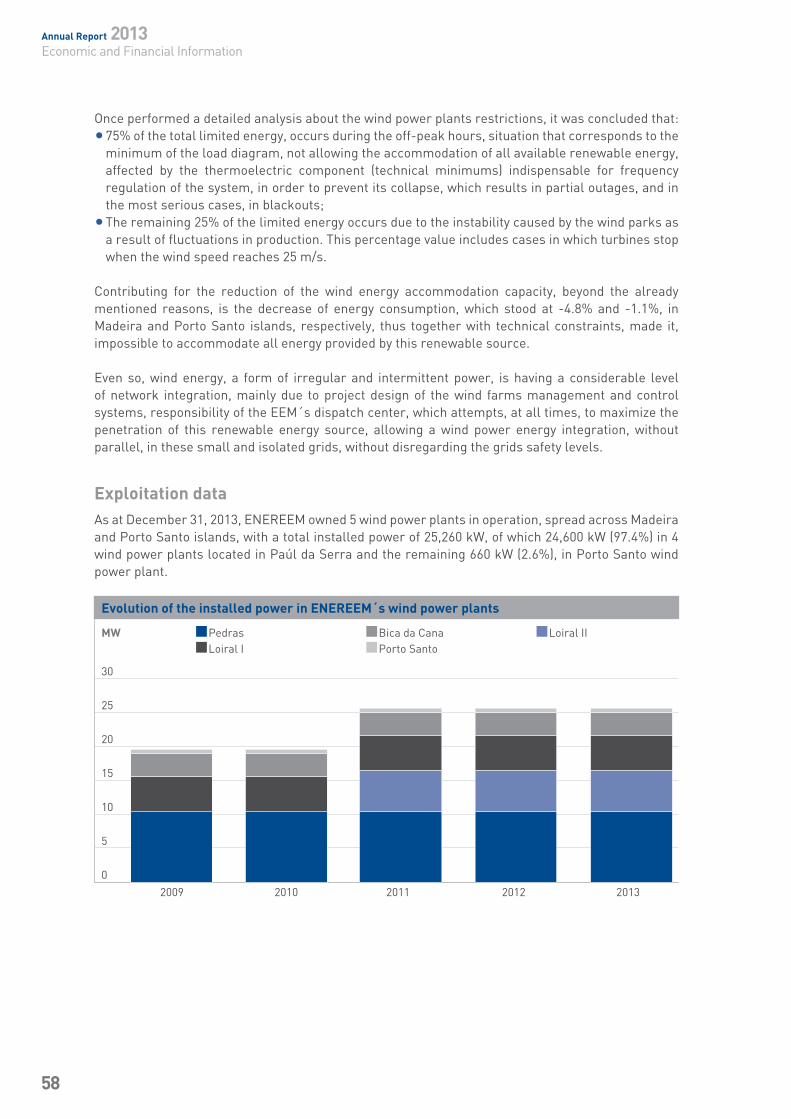
Annual Report 2013Economic and Financial Information
58
Once performed a detailed analysis about the wind power plants restrictions, it was concluded that:• 75% of the total limited energy, occurs during the off-peak hours, situation that corresponds to the
minimum of the load diagram, not allowing the accommodation of all available renewable energy, affected by the thermoelectric component (technical minimums) indispensable for frequency regulation of the system, in order to prevent its collapse, which results in partial outages, and in the most serious cases, in blackouts;
•The remaining 25% of the limited energy occurs due to the instability caused by the wind parks as a result of fluctuations in production. This percentage value includes cases in which turbines stop when the wind speed reaches 25 m/s.
Contributing for the reduction of the wind energy accommodation capacity, beyond the already mentioned reasons, is the decrease of energy consumption, which stood at -4.8% and -1.1%, in Madeira and Porto Santo islands, respectively, thus together with technical constraints, made it, impossible to accommodate all energy provided by this renewable source.
Even so, wind energy, a form of irregular and intermittent power, is having a considerable level of network integration, mainly due to project design of the wind farms management and control systems, responsibility of the EEM´s dispatch center, which attempts, at all times, to maximize the penetration of this renewable energy source, allowing a wind power energy integration, without parallel, in these small and isolated grids, without disregarding the grids safety levels.
Exploitation dataAs at December 31, 2013, ENEREEM owned 5 wind power plants in operation, spread across Madeira and Porto Santo islands, with a total installed power of 25,260 kW, of which 24,600 kW (97.4%) in 4 wind power plants located in Paúl da Serra and the remaining 660 kW (2.6%), in Porto Santo wind power plant.
Evolution of the installed power in ENEREEM´s wind power plants
MW Pedras Bica da Cana Loiral II Loiral I Porto Santo
30
25
20
15
10
5
0
2009 2010 2011 2012 2013
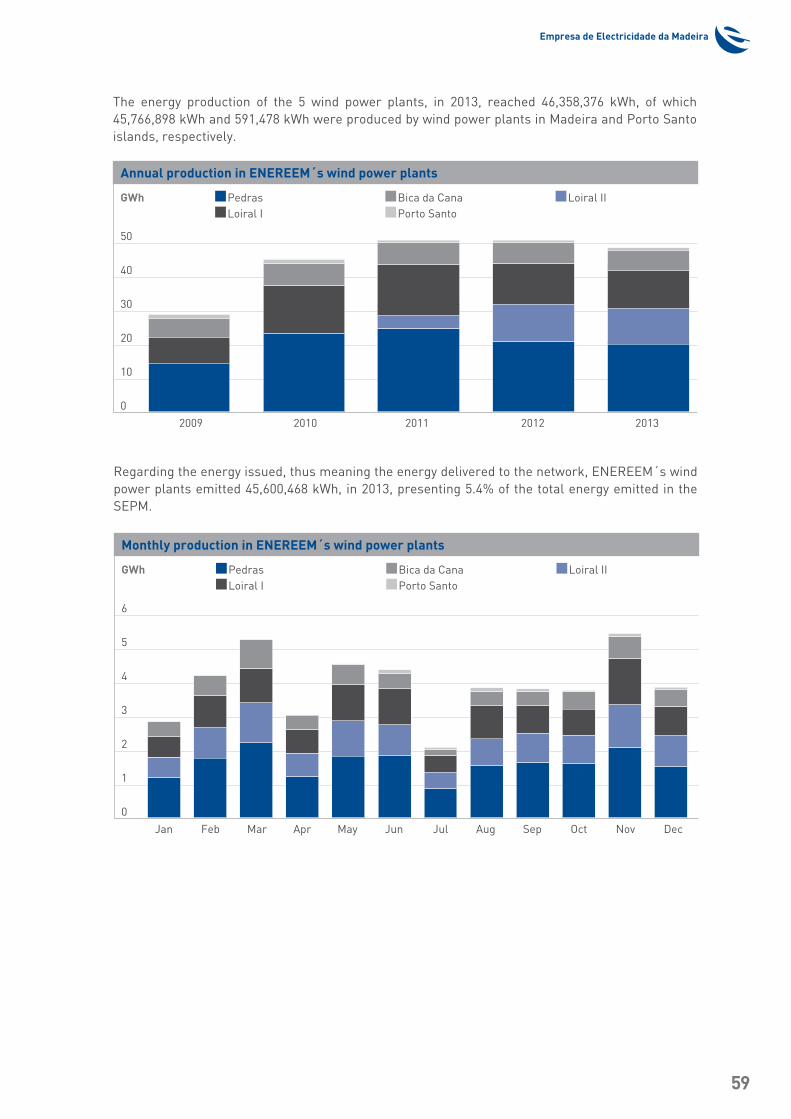
Empresa de Electricidade da Madeira
59
The energy production of the 5 wind power plants, in 2013, reached 46,358,376 kWh, of which 45,766,898 kWh and 591,478 kWh were produced by wind power plants in Madeira and Porto Santo islands, respectively.
Regarding the energy issued, thus meaning the energy delivered to the network, ENEREEM´s wind power plants emitted 45,600,468 kWh, in 2013, presenting 5.4% of the total energy emitted in the SEPM.
Annual production in ENEREEM´s wind power plants
GWh Pedras Bica da Cana Loiral II Loiral I Porto Santo
50
40
30
20
10
0
2009 2010 2011 2012 2013
Monthly production in ENEREEM´s wind power plants
GWh Pedras Bica da Cana Loiral II Loiral I Porto Santo
6
5
4
3
2
1
0
Jan Feb Mar Apr May Jun Jul Aug Sep Oct Nov Dec
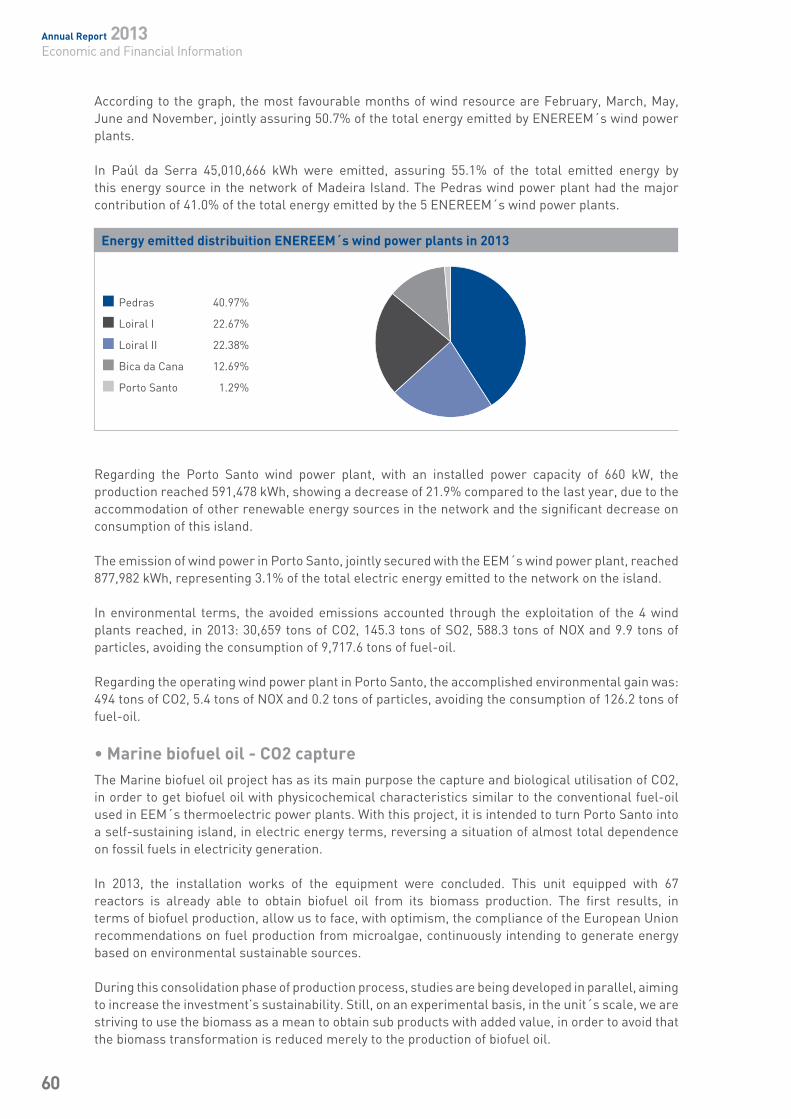
Annual Report 2013Economic and Financial Information
60
According to the graph, the most favourable months of wind resource are February, March, May, June and November, jointly assuring 50.7% of the total energy emitted by ENEREEM´s wind power plants.
In Paúl da Serra 45,010,666 kWh were emitted, assuring 55.1% of the total emitted energy by this energy source in the network of Madeira Island. The Pedras wind power plant had the major contribution of 41.0% of the total energy emitted by the 5 ENEREEM´s wind power plants.
Energy emitted distribuition ENEREEM´s wind power plants in 2013
Pedras 40.97%
Loiral I 22.67%
Loiral II 22.38%
Bica da Cana 12.69%
Porto Santo 1.29%
Regarding the Porto Santo wind power plant, with an installed power capacity of 660 kW, the production reached 591,478 kWh, showing a decrease of 21.9% compared to the last year, due to the accommodation of other renewable energy sources in the network and the significant decrease on consumption of this island.
The emission of wind power in Porto Santo, jointly secured with the EEM´s wind power plant, reached 877,982 kWh, representing 3.1% of the total electric energy emitted to the network on the island.
In environmental terms, the avoided emissions accounted through the exploitation of the 4 wind plants reached, in 2013: 30,659 tons of CO2, 145.3 tons of SO2, 588.3 tons of NOX and 9.9 tons of particles, avoiding the consumption of 9,717.6 tons of fuel-oil.
Regarding the operating wind power plant in Porto Santo, the accomplished environmental gain was: 494 tons of CO2, 5.4 tons of NOX and 0.2 tons of particles, avoiding the consumption of 126.2 tons of fuel-oil.
• Marine biofuel oil - CO2 captureThe Marine biofuel oil project has as its main purpose the capture and biological utilisation of CO2, in order to get biofuel oil with physicochemical characteristics similar to the conventional fuel-oil used in EEM´s thermoelectric power plants. With this project, it is intended to turn Porto Santo into a self-sustaining island, in electric energy terms, reversing a situation of almost total dependence on fossil fuels in electricity generation.
In 2013, the installation works of the equipment were concluded. This unit equipped with 67 reactors is already able to obtain biofuel oil from its biomass production. The first results, in terms of biofuel production, allow us to face, with optimism, the compliance of the European Union recommendations on fuel production from microalgae, continuously intending to generate energy based on environmental sustainable sources.
During this consolidation phase of production process, studies are being developed in parallel, aiming to increase the investment’s sustainability. Still, on an experimental basis, in the unit´s scale, we are striving to use the biomass as a mean to obtain sub products with added value, in order to avoid that the biomass transformation is reduced merely to the production of biofuel oil.
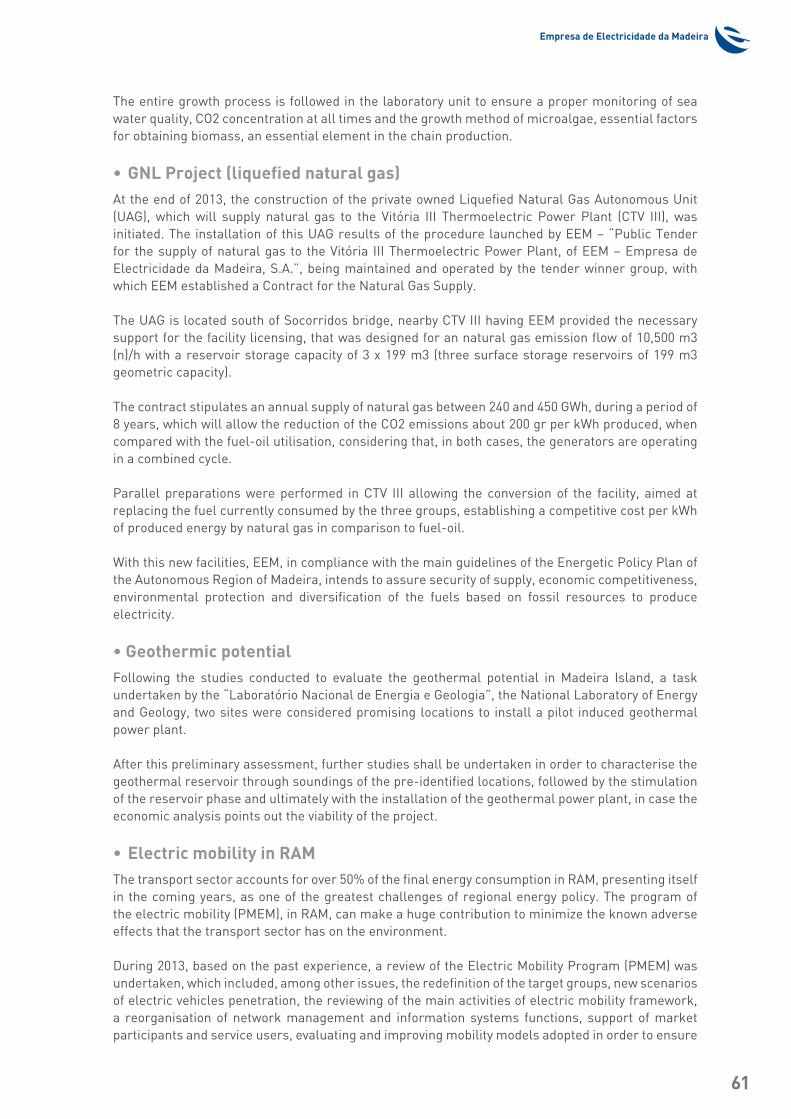
Empresa de Electricidade da Madeira
61
The entire growth process is followed in the laboratory unit to ensure a proper monitoring of sea water quality, CO2 concentration at all times and the growth method of microalgae, essential factors for obtaining biomass, an essential element in the chain production.
• GNL Project (liquefied natural gas)At the end of 2013, the construction of the private owned Liquefied Natural Gas Autonomous Unit (UAG), which will supply natural gas to the Vitória III Thermoelectric Power Plant (CTV III), was initiated. The installation of this UAG results of the procedure launched by EEM – “Public Tender for the supply of natural gas to the Vitória III Thermoelectric Power Plant, of EEM – Empresa de Electricidade da Madeira, S.A.”, being maintained and operated by the tender winner group, with which EEM established a Contract for the Natural Gas Supply.
The UAG is located south of Socorridos bridge, nearby CTV III having EEM provided the necessary support for the facility licensing, that was designed for an natural gas emission flow of 10,500 m3 (n)/h with a reservoir storage capacity of 3 x 199 m3 (three surface storage reservoirs of 199 m3 geometric capacity).
The contract stipulates an annual supply of natural gas between 240 and 450 GWh, during a period of 8 years, which will allow the reduction of the CO2 emissions about 200 gr per kWh produced, when compared with the fuel-oil utilisation, considering that, in both cases, the generators are operating in a combined cycle.
Parallel preparations were performed in CTV III allowing the conversion of the facility, aimed at replacing the fuel currently consumed by the three groups, establishing a competitive cost per kWh of produced energy by natural gas in comparison to fuel-oil.
With this new facilities, EEM, in compliance with the main guidelines of the Energetic Policy Plan of the Autonomous Region of Madeira, intends to assure security of supply, economic competitiveness, environmental protection and diversification of the fuels based on fossil resources to produce electricity.
• Geothermic potentialFollowing the studies conducted to evaluate the geothermal potential in Madeira Island, a task undertaken by the “Laboratório Nacional de Energia e Geologia”, the National Laboratory of Energy and Geology, two sites were considered promising locations to install a pilot induced geothermal power plant.
After this preliminary assessment, further studies shall be undertaken in order to characterise the geothermal reservoir through soundings of the pre-identified locations, followed by the stimulation of the reservoir phase and ultimately with the installation of the geothermal power plant, in case the economic analysis points out the viability of the project.
• Electric mobility in RAMThe transport sector accounts for over 50% of the final energy consumption in RAM, presenting itself in the coming years, as one of the greatest challenges of regional energy policy. The program of the electric mobility (PMEM), in RAM, can make a huge contribution to minimize the known adverse effects that the transport sector has on the environment.
During 2013, based on the past experience, a review of the Electric Mobility Program (PMEM) was undertaken, which included, among other issues, the redefinition of the target groups, new scenarios of electric vehicles penetration, the reviewing of the main activities of electric mobility framework, a reorganisation of network management and information systems functions, support of market participants and service users, evaluating and improving mobility models adopted in order to ensure
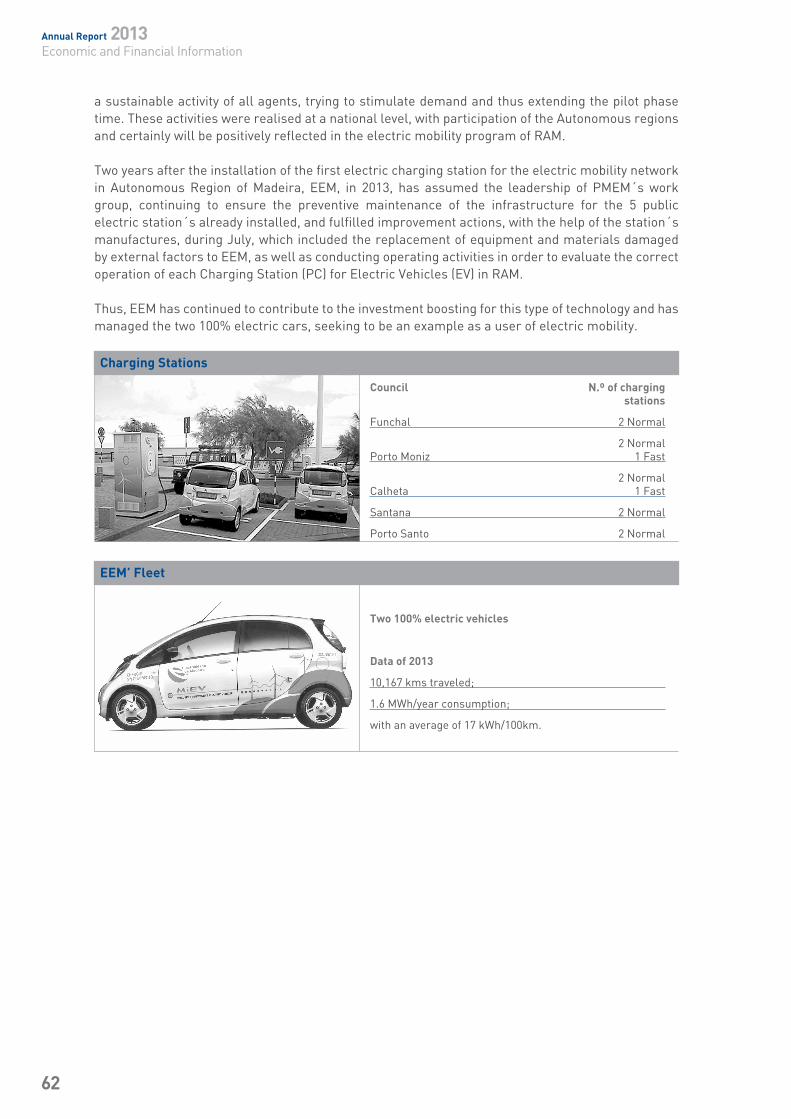
Annual Report 2013Economic and Financial Information
62
a sustainable activity of all agents, trying to stimulate demand and thus extending the pilot phase time. These activities were realised at a national level, with participation of the Autonomous regions and certainly will be positively reflected in the electric mobility program of RAM.
Two years after the installation of the first electric charging station for the electric mobility network in Autonomous Region of Madeira, EEM, in 2013, has assumed the leadership of PMEM´s work group, continuing to ensure the preventive maintenance of the infrastructure for the 5 public electric station´s already installed, and fulfilled improvement actions, with the help of the station´s manufactures, during July, which included the replacement of equipment and materials damaged by external factors to EEM, as well as conducting operating activities in order to evaluate the correct operation of each Charging Station (PC) for Electric Vehicles (EV) in RAM.
Thus, EEM has continued to contribute to the investment boosting for this type of technology and has managed the two 100% electric cars, seeking to be an example as a user of electric mobility.
Charging Stations
Council N.º of charging stations
Funchal 2 Normal
2 Normal Porto Moniz 1 Fast
2 Normal Calheta 1 Fast
Santana 2 Normal
Porto Santo 2 Normal
EEM’ Fleet
Two 100% electric vehicles
Data of 2013
10,167 kms traveled;
1.6 MWh/year consumption;
with an average of 17 kWh/100km.
Empresa de Electricidade da Madeira
63
4 - Final Remarks
As conclusion of the Annual Report of the activities developed by Empresa de Electricidade da Madeira, S.A., over the year of 2013, the Board of Directors wishes to express a word of gratitude for the support received from all the different entities with whom we have cooperated over the year, particularly our shareholder, the Regional Government of Madeira, represented by its Vice-President, responsible for the leadership of the energy sector in Madeira.
The Board of Directors also expresses its appreciation to the General Assembly and to the Statutory Auditor for their cooperation, permanent availability and for their positive contribution for the development and control of EEM´s activities.
A special reference to our staff for the dedication, competence and professionalism, they have continuously expressed in its functions and to the development of our Company.
And finally to our customers, to thank the confidence expressed in us and reaffirm our unmistakable commitment in upgrade the services provided.
The Board of Directors:
Rui Alberto Faria Rebelo (Chairman of the Board)João Heliodoro da Silva Dantas (Vice-Chairman of the Board)Mário Eugénio Jardim Fernandes (Board Member)


Consolidatedand IndividualFinancial Statements
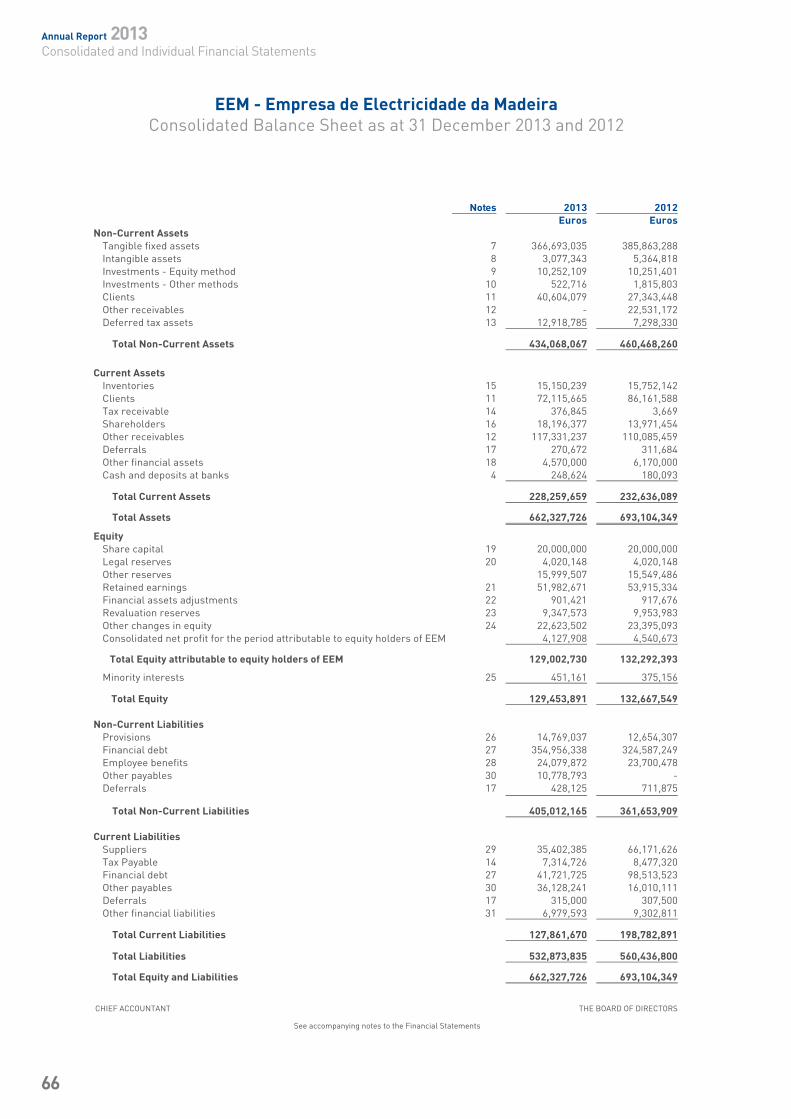
Annual Report 2013Consolidated and Individual Financial Statements
66
EEM - Empresa de Electricidade da MadeiraConsolidated Balance Sheet as at 31 December 2013 and 2012
CHIEF ACCOUNTANT THE BOARD OF DIRECTORS
See accompanying notes to the Financial Statements
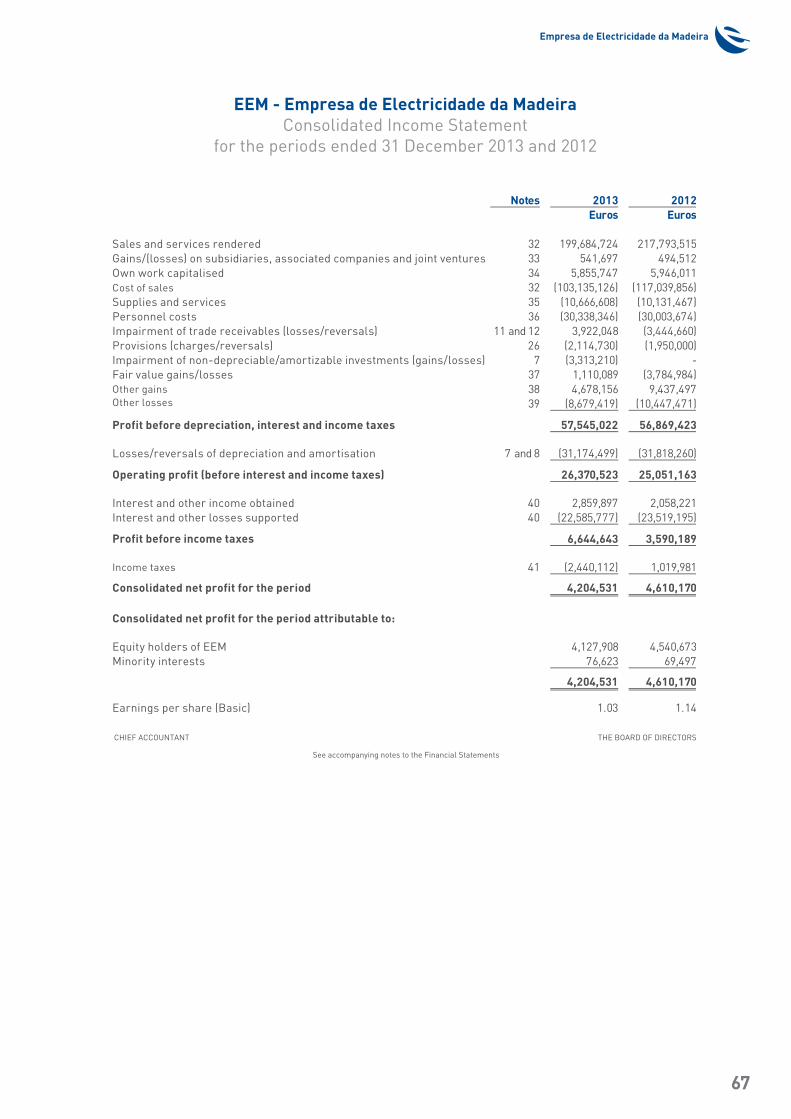
Empresa de Electricidade da Madeira
67
EEM - Empresa de Electricidade da MadeiraConsolidated Income Statement
for the periods ended 31 December 2013 and 2012
CHIEF ACCOUNTANT THE BOARD OF DIRECTORS
See accompanying notes to the Financial Statements
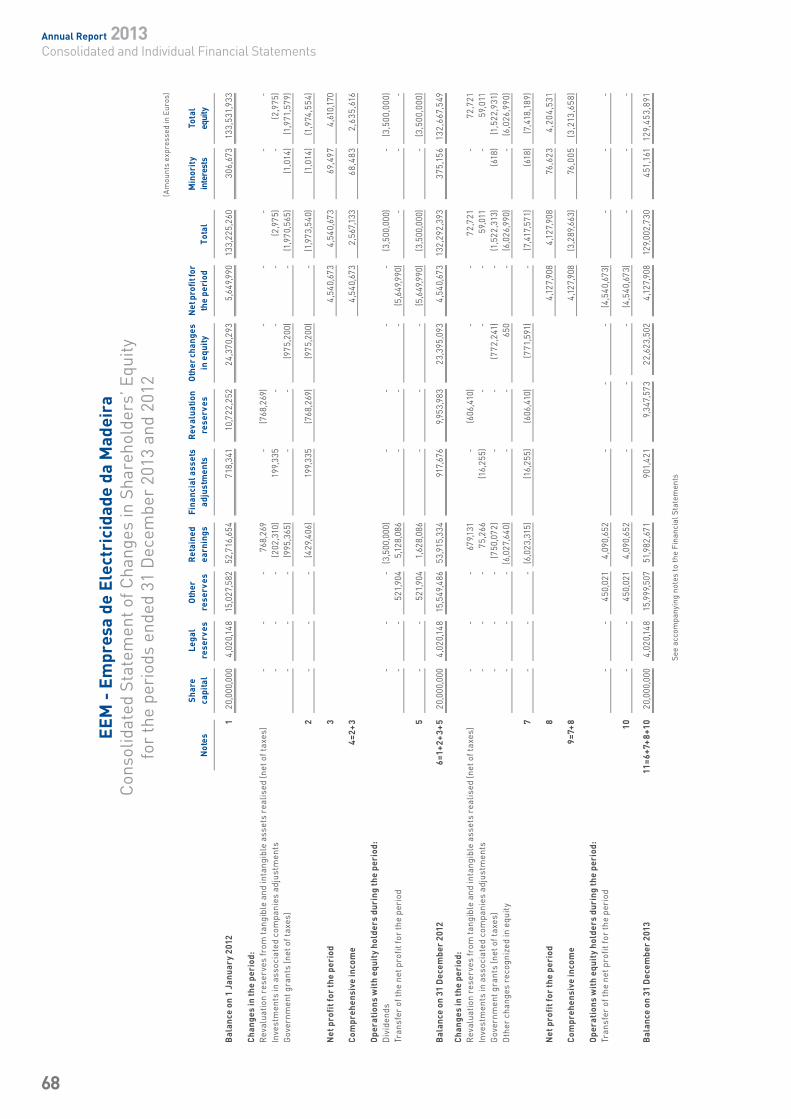
Annual Report 2013Consolidated and Individual Financial Statements
68
EEM
- E
mpr
esa
de E
lect
rici
dade
da
Mad
eira
Con
solid
ated
Sta
tem
ent o
f Cha
nges
in S
hare
hold
ers’
Equ
ityfo
r th
e pe
riod
s en
ded
31 D
ecem
ber
2013
and
201
2
See
acco
mpa
nyin
g no
tes
to th
e Fi
nanc
ial S
tate
men
ts
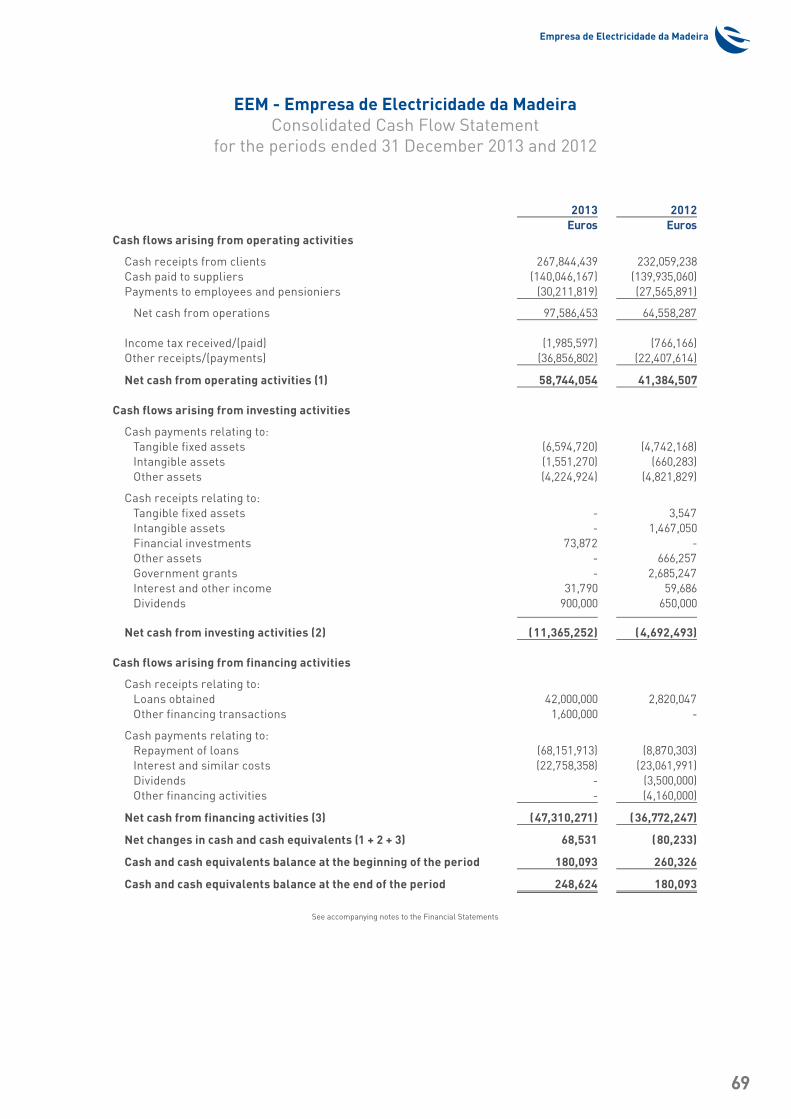
Empresa de Electricidade da Madeira
69
See accompanying notes to the Financial Statements
EEM - Empresa de Electricidade da MadeiraConsolidated Cash Flow Statement
for the periods ended 31 December 2013 and 2012
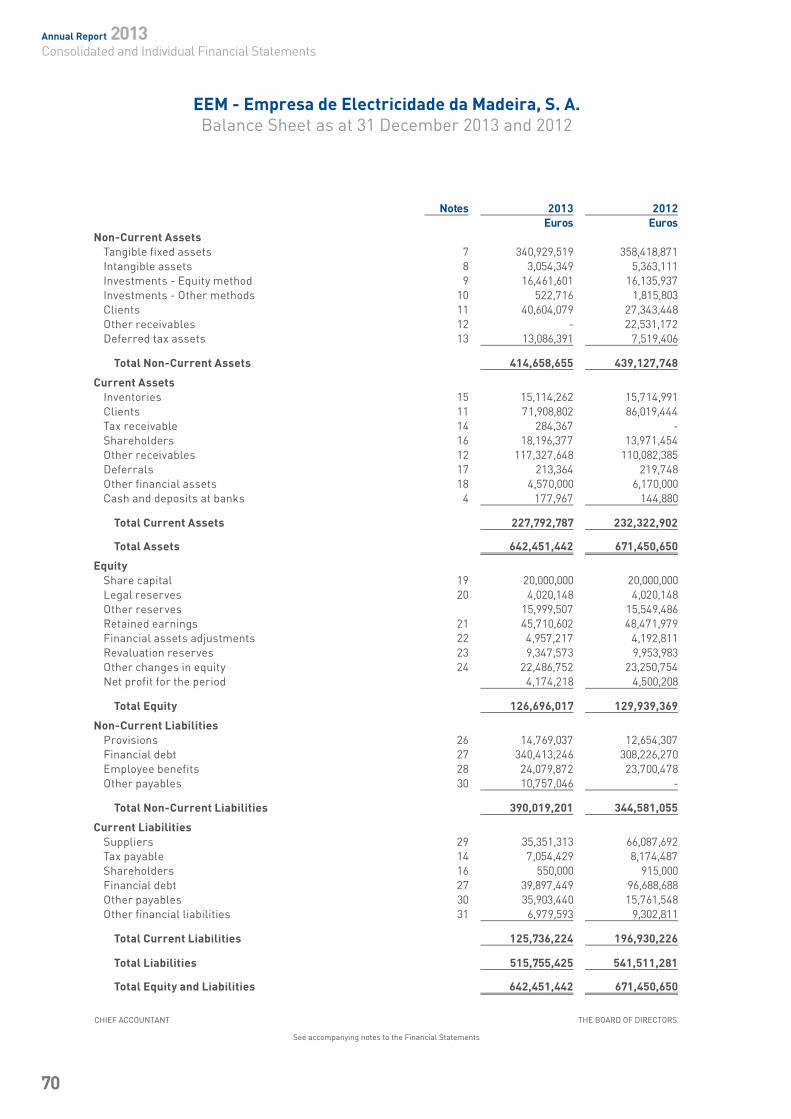
Annual Report 2013Consolidated and Individual Financial Statements
70
EEM - Empresa de Electricidade da Madeira, S. A.Balance Sheet as at 31 December 2013 and 2012
CHIEF ACCOUNTANT THE BOARD OF DIRECTORS
See accompanying notes to the Financial Statements
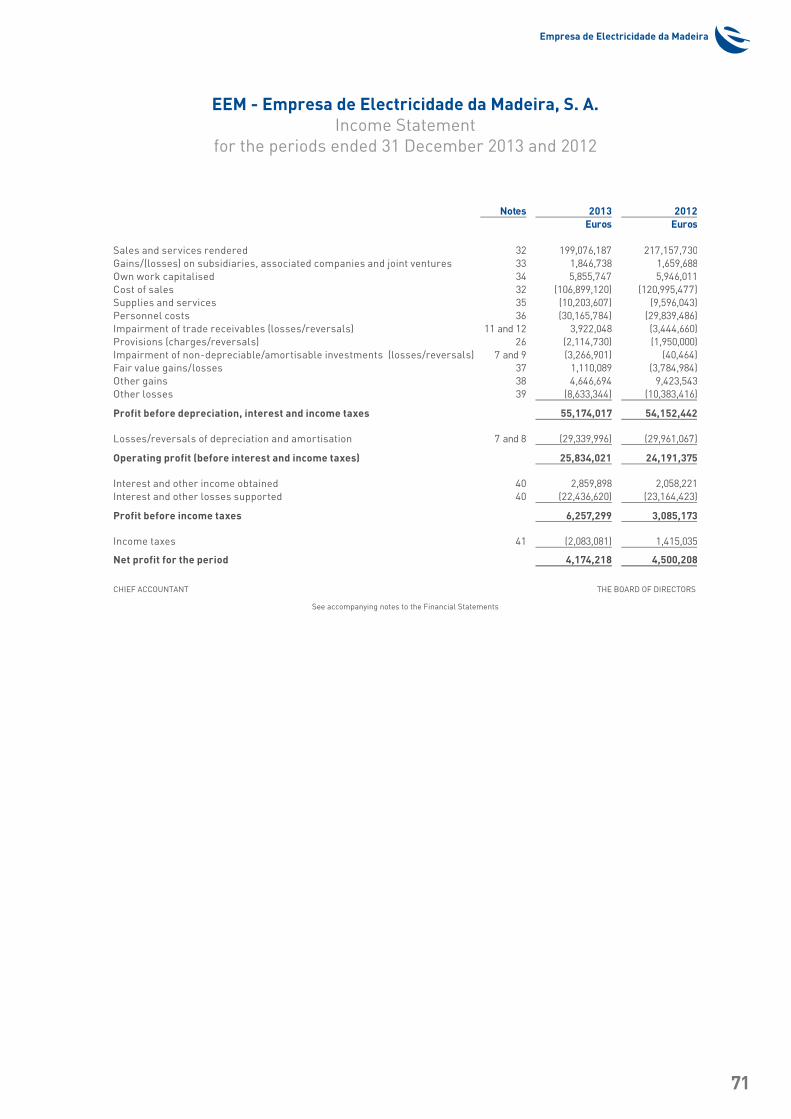
Empresa de Electricidade da Madeira
71
EEM - Empresa de Electricidade da Madeira, S. A.Income Statement
for the periods ended 31 December 2013 and 2012
CHIEF ACCOUNTANT THE BOARD OF DIRECTORS
See accompanying notes to the Financial Statements
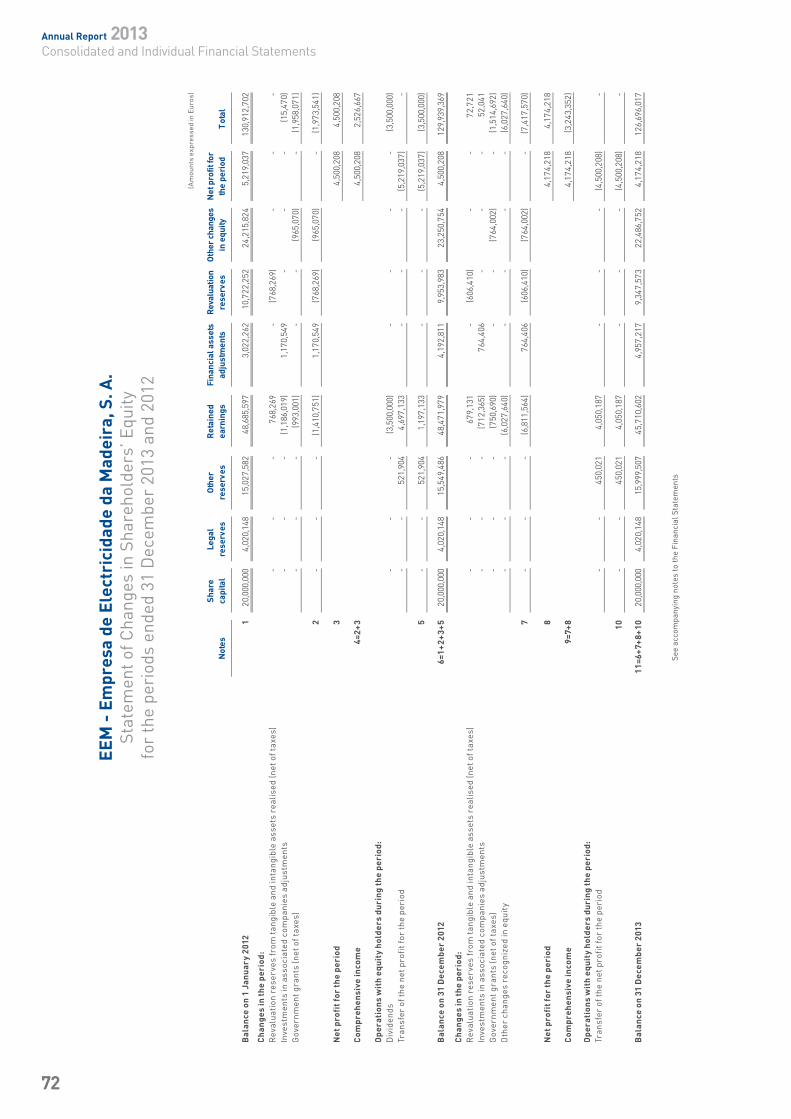
Annual Report 2013Consolidated and Individual Financial Statements
72
EEM
- E
mpr
esa
de E
lect
rici
dade
da
Mad
eira
, S. A
.St
atem
ent o
f Cha
nges
in S
hare
hold
ers’
Equ
ityfo
r th
e pe
riod
s en
ded
31 D
ecem
ber
2013
and
201
2
See
acco
mpa
nyin
g no
tes
to th
e Fi
nanc
ial S
tate
men
ts
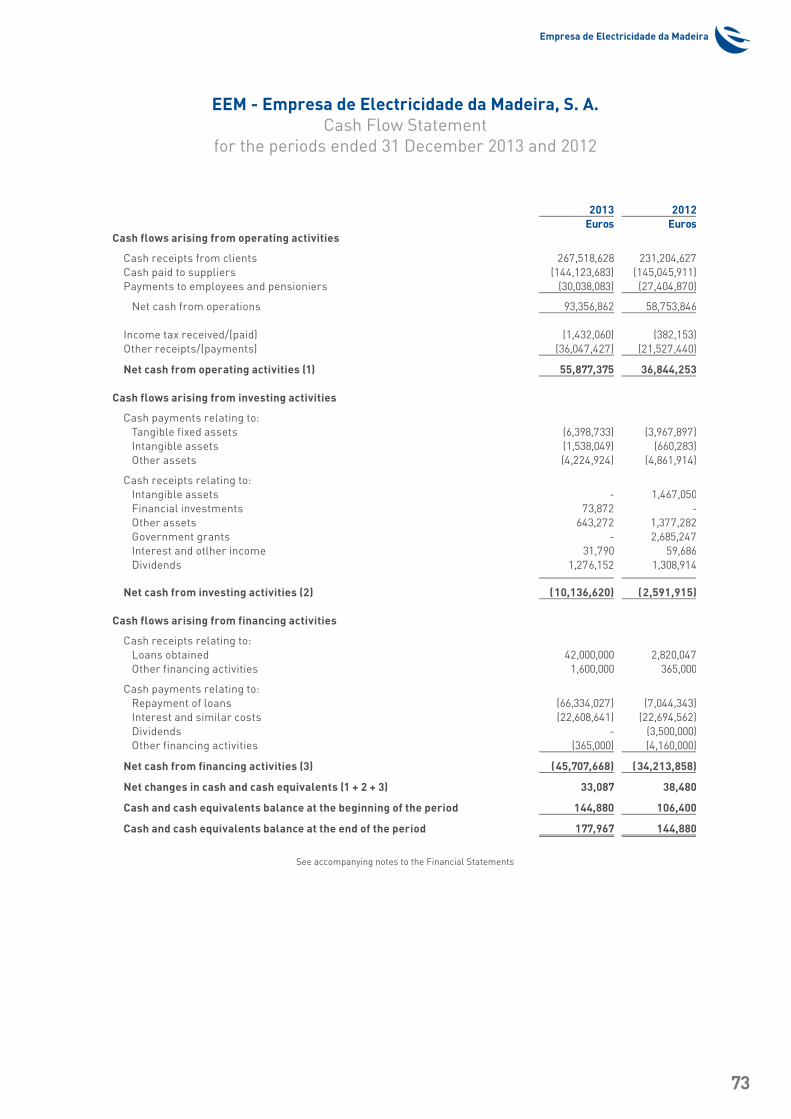
Empresa de Electricidade da Madeira
73
EEM - Empresa de Electricidade da Madeira, S. A.Cash Flow Statement
for the periods ended 31 December 2013 and 2012
See accompanying notes to the Financial Statements
Annual Report 2013Consolidated and Individual Financial Statements
74
EEM - Empresa de Electricidade da Madeira
Notes to the Financial Statements31 December 2013 and 2012
Annex to the Financial Statements
1. Entity identification
EEM - Empresa de Electricidade da Madeira, S.A. (EEM) was established as a state owned company (E.P.) by the Decree-Law no. 12/74, of 17 January, being its main objective the generation, transport, distribution and commercialisation of electric energy in the Autonomous Region of Madeira. The company head office is located in Funchal at Avenida do Mar e das Comunidades Madeirenses, no. 32.
In accordance with the Regional Legislative Decree no. 14/94/M, published in “Diário da República” as at 3 June 1994, the legal status of EEM was changed to a private company (S.A.), entirely held by a public shareholder. Its name was also changed to EEM - Empresa de Electricidade da Madeira, S.A..
EEM is ruled by the above mentioned regulation, by its internal by-laws, by the regulations applied to private companies and by special rules applied to similar companies operating in the same business.
As at 25 March 2002, was published the Decree-Law no. 69/2002, which extended to the Autonomous Regions of Azores and Madeira the regulation, by the Regulatory Agency for Energy Services (ERSE), for the activities of generation, transport, distribution and commercialisation of electric energy. During 2002, ERSE adjusted the regulatory framework for the electric sector, namely the Tariff Regulation, in order to extend its application to the Autonomous Regions, seeking a progressive standardisation of tariffs in Portugal starting 1 January 2003, under the principles of tariff convergence and electric companies financial stability. Therefore, the tariffs applied by EEM since 1 January 2003 are established by ERSE, being its responsibility the calculation of the compensation amount to be paid to EEM from that date resulting from tariffs reduction (see Note 3.2 k)).
The subsidiaries owned by EEM are presented in Note 6 to the financial statements.
Empresa de Electricidade da Madeira
75
2. Accounting standards applied in the financial statements
2.1 EEM’s financial statements were prepared according with the Portuguese accounting standards “Sistema de Normalização Contabilística” (SNC), as required by Decree-Law no. 158/2009, of 13 July. SNC is composed by “Financial Statement Presentation Basis” (BADF), “Financial Statement Templates” (MDF), “Accounts Code” (CC), “Accounting and Financial Reports Standards” (NCRF), “Interpretative Standards” (NI) and “Conceptual Framework”.
The financial statements which include the balance sheet, the income statement by nature, the statement of changes in shareholder’s equity, the cash flow statement and the notes to the financial statements, were approved by the Board of Directors as at 25 March 2014. These financial statements are presented in Euros and prepared on a continuity and accrual basis, under which items are recognised as assets, liabilities, equity, income and expenses when they meet the definitions and recognition criteria for those elements establish in the conceptual framework, in accordance with the qualitative features of comprehensibility, relevance, materiality, reliability, faithful representation, substance over form, neutrality, prudence, completeness and comparability.
The accounting policies, presented in Note 3, were used in the preparation of the financial statements for the period ended 31 December 2013 and for the comparative financial information presented in these financial statements for the period ended 31 December 2012.
2.2 There were no exceptions to SNC disposals.
2.3 However, we draw attention to the fact that on April 9, 2013, the Accounting Standards Committee (ASC) through FAQ no. 13 published on its online website, has revised its initial understanding regarding the impact of the accounting framework taxation of non-refundable grants related to depreciable fixed tangible and intangible assets with finite useful lives. The ASC considers that there is no taxable temporary difference associated with non-repayable government grants related to depreciable tangible fixed assets and intangible assets with finite useful lives in accordance with NCRF 25.5. Consequently, ASC understands that there is no deferred tax liability to be recorded and the tax component associated with these tax grants has to be presented under Other liabilities. Additionally, the reversal of the tax period recorded in Other payables has been recorded since 2013 under the caption Other changes recognisedin equity.
As at December 31, 2013, the tax component associated with non-repayable government grants related to depreciable tangible assets, which has been presented under Other payables caption, amounts to 5,834,965 Euros (2012: 6,999,562 Euros recorded under deferred tax) on an individual basis and 5,856,712 Euros (2012: 7,026,576 Euros recorded under deferred tax) on a consolidated basis. Additionally, the reversal of the tax component recorded during the year 2013 against Other changes recognised in equity amounts to 657,208 Euros (2012: 980,388 Euros recorded under Income taxes) on an individual basis and 660,585 Euros (2012: 983,765 Euros recorded under Income taxes) on a consolidated basis. Thus, the comparability of the aforementioned items in the financial statements is influenced by these changes.
Annual Report 2013Consolidated and Individual Financial Statements
76
3. Accounting policies
The main accounting policies applied in the preparation of the financial statements are presented as follows:
3.1 Measurement basis used in the preparation of the financial statements
The consolidated financial statements as at 31 December 2013 and 2012 reflect the assets, liabilities and results of EEM and its subsidiaries, namely, Casa da Luz, Emacom and Enereem (see Note 6), and the results attributable to EEM from its associated companies. These accounting policies were consistently applied in all companies. The financial statements were prepared under the historical cost principle.
The preparation of the financial statements in accordance with NCRF requires the Board of Directors to make judgments, estimates and assumptions that affect the application of the accounting policies and the reported amounts of assets, liabilities, income and expenses. The estimates and related assumptions are based on historical experience and other factors that are believed to be reasonable under the circumstances, the results of which form the basis for making judgments regarding the carrying values of assets and liabilities that are not readily apparent from other sources. Actual results may differ from these estimates. The issues involving a higher degree of judgment or complexity, or where assumptions and estimates are considered to be significant, are presented in Note 3.3. Critical accounting estimates and judgments in preparing the financial statements.
3.2 Other significant accounting policies
a) Basis of consolidation
Investments in subsidiaries
Investments in subsidiaries where EEM has control are fully consolidated from the date EEM assumes control over their financial and operating activities until the moment that control ceases to exist. Control is presumed to exist when EEM owns more than half of the voting rights. Control also exists when EEM has the power, directly or indirectly, to manage the financial and operating policies of the entity to obtain benefits from its activities, even if the percentage of shareholding is less than 50%.
In an individual basis, the investments in subsidiaries where EEM has direct or indirect control are accounted under the equity method from the date EEM assumes control over their financial and operating policies until the moment that control ceases to exist.
Investments on associated companies
Investments in associated companies are accounted for by the equity method from the date the EEM acquires significant influence, directly or indirectly, to the date it ceases. Associated companies are entities over which EEM has significant influence, but not control, over its financial and operating policies. When EEM holds more than 20% of the voting rights of the investee it is presumed to have significant influence. If EEM holds less than 20% of the voting rights of the investee, it is presumed not to have significant influence, unless such influence can be clearly demonstrated.
Balances and transactions eliminated on consolidation
Inter-company balances and transactions, including any unrealised gains and losses, are eliminated in preparing the consolidated financial statements. Unrealised gains and losses arising on transactions with associated companies are eliminated to the extent of the Group’s interest in those entities.
Empresa de Electricidade da Madeira
77
Other investments
The investments in which the EEM Group holds less than 20% of the voting rights and over which have no significant influence on the financial and operating policies are accounted at fair value through profit or loss.
The fair value of listed investments in active markets is based on current bid price. The Group determines the fair value of unlisted securities through (i) valuation methodologies, such as the price of similar recent arm’s length transactions and discounted cash flow techniques; and (ii) valuation assumptions based on market information. Financial assets whose fair value cannot be reliably measured are stated at cost, being any impairment loss booked against the income statement.
b) Tangible fixed assets
Tangible fixed assets are accounted at cost plus all expenditure directly attributable to bring the asset to the location and working condition for its intended use, less accumulated depreciation and impairment losses.
On transition to NCRF, EEM decided to consider as deemed cost the revalued amount of the tangible fixed assets (determined under the legal revaluations realised in previous periods), in accordance with the previous accounting policy.
Subsequent costs are recognised as Tangible fixed assets only when it is probable that future economic benefits associated with the item will flow to EEM. Repair and maintenance costs are charged to the income statement as incurred, in an accrual basis.
EEM carries out impairment tests whenever events or circumstances may indicate that the book value of an asset exceeds its recoverable amount, being any impairment recognised in the income statement. The recoverable amount is the higher of net selling price and value in use, the latter being calculated by the present value of the estimated future cash flows obtained from continued use of the asset and its sale at the end of its useful life.
Land is not depreciated. Depreciation of the other tangible fixed assets is calculated on a straight-line basis over their estimated useful lives, after deducting the residual value, as follows:
N.º of years Buildings 10 to 50 Basic equipment 3 to 33 Transport equipment 4 to 5 Office equipment 4 to 16 Other 4 to 20
The useful lives, the depreciation method and the residual value are revised annually. The effect of changes in these estimates is recognised prospectively in the income statement.
Any gains or losses resulting from assets disposals are calculated by the difference between the receivable amount and the book value, being recognised as income or cost in the period. In disposals of revaluated assets the amount included in the revaluation reserves is transferred to retained earnings.
Annual Report 2013Consolidated and Individual Financial Statements
78
c) Intangible assets
EEM recognises an intangible asset if identifiable, if assumes control over it, and is expected to provide future economic benefits to the entity and its cost can be reliably measurable.
Intangibleassetswithdefinedusefullife
The intangible assets with defined useful life are registered at acquisition cost net of accumulated depreciations and impairment losses.
EEM assesses for impairment whenever events or circumstances may indicate that the book value of the asset exceeds its recoverable amount, any impairment being recognised in the income statement. The recoverable amount is the higher of net selling price and value in use, the latter being calculated by the present value of the estimated future cash flows obtained from continued use of the asset and its sale at the end of its useful life.
Internally generated intangible assets
Research expenditures are recorded as cost when incurred. EEM recognises internally generated intangible assets when it is possible to demonstrate:
• Its technical feasibility to complete the intangible asset so that it will be available for use or sale;
• Its intention to complete the intangible asset and to use or sell it;• Its ability to use or sell the intangible asset;• How the intangible asset will generate probable future economic benefits;• The availability of adequate technical, financial and other resources to complete the
development and to use or sell the intangible asset; and• Its ability to measure reliably the expenditure attributable to the intangible asset during its
development. The cost of internally generated intangible asset comprises all directly attributable costs
necessary to create, produce and prepare the asset to be capable of operating in the manner intended by Management.
Acquisitionanddevelopmentofsoftware
The costs of purchasing software and the costs incurred by EEM to implement it are capitalised. These costs are amortised on a straight-line basis over the expected useful life of the software.
Costs incurred by EEM directly related to the development of software that are expected to generate economic benefits beyond one year are recognised as intangible assets. Such costs include employee costs directly associated to the project and are amortised on a straight-line basis over the estimated useful life of the software.
Software maintenance costs are charged to the income statement when incurred.
Empresa de Electricidade da Madeira
79
Industrial property and other rights
Industrial property and other rights are depreciated on a straight-line basis over the estimated useful life.
The estimated useful lives are as follows:
PaymentsbyextensionofthetariffperiodinaccordancewithDecree-Law35/2013
Payments made in order to comply with the Decree-Law 35/2013 are recorded as intangible assets in progress being amortised based on the straight line method over a period of seven years from the date of termination of the regulatory period of 15 years applicable to each park.
d) Borrowing costs capitalised
Borrowing costs that are directly attributable to the acquisition or construction of assets are capitalised as part of the cost of the assets.
A qualifying asset is an asset that needs a substantial period of time to be ready for its intended use or sale. The amount of borrowing costs eligible for capitalisation is determined by applying a capitalisation rate to the expenditures on those assets, net of investment government grants. The capitalisation rate corresponds to the weighted average of the borrowing costs applicable to the outstanding borrowings during the period.
The capitalisation of borrowing costs begins when expenditures for the assets are being incurred, borrowing costs have been incurred and activities necessary to prepare all or part of the assets for their intended use or sale are in progress.
Capitalisation ceases when substantially all the activities necessary to prepare the qualifying assets for their intended use or sale are completed.
e) Leases
Leases are classified as finance leases or operating leases taking into consideration the substance of the transaction rather than its legal form. A lease is classified as a finance lease if it transfers substantially all the risks and rewards incidental to ownership to the lessee. A lease is classified as an operating lease if it does not transfers substantially all the risks and rewards incidental to ownership to the lessee.
Operating leases
Payments made under operating leases are charged to the income statement in the period to which they relate.
Finance leases
Finance leases are recorded at inception date, both under assets and liabilities, at the cost of the leased asset, which is equivalent to the present value of outstanding lease instalments.
Instalments comprise: (i) an interest charge which is recognised in the income statement; (ii) the amortisation of the principal which is deducted from liabilities. Financial charges are recognised in the income statement over the lease period, in order to reflect a constant periodic rate of interest on the remaining balance of the liability for each period.
No. of years Software 6 Industrial property and other rights 10 to 33
Annual Report 2013Consolidated and Individual Financial Statements
80
f) Inventories
Inventories are stated at the lower of the acquisition cost and net realisable value. The cost of inventories comprises costs of purchase, costs of conversion and other costs incurred in bringing the inventories to their present location and condition. The net realisable value is the estimated selling price in the ordinary course of business less the estimated selling costs.
Inventories usage (consumption) is valued at the weighted average cost.
Inventories costs are reduced to its net realisable value every time these assets are booked at a higher amount than the expected amount to be obtained through its usage or sale.
g) Accounts receivable Accounts receivable are initially recognised at fair value, being subsequently measured at
amortised cost based on the effective interest rate method, less impairment losses.
Impairment losses are recorded based on the regular evaluation of objective evidence of impairment losses related to doubtful debts as at the balance sheet date. Identified impairment losses are recognised in the income statement and can be reversed if the estimated losses decrease, in a subsequent period.
h) Cash and cash equivalents For the purposes of the cash flows statement, cash and cash equivalents comprise balances with
less than three months’ maturity from the balance sheet date, including cash and deposits at banks.
i) Income tax EEM and its subsidiaries are subject to the tax legislation considered in “Código do IRC – Imposto
sobre o Rendimento das Pessoas Colectivas”. In accordance with Portuguese tax legislation, tax returns can be reviewed and adjusted by the tax authorities for a period of four years for tax years beginning after 2012 (Social Security: 5 years).
If there are tax losses, this period is 5 years for tax years beginning after 2012, 4 years for the years 2011 and 2010 and 6 years for the previous years.
Income tax corresponds to current and deferred tax. Income tax is recognised in the income statement, except when it relates to items that are directly registered against shareholders’ equity, in which case it is also recognised against shareholders’ equity.
Current tax is the tax expected to be paid based on the taxable profit for the period, calculated considering the tax rules in place and using tax rates enacted or substantively enacted in each jurisdiction as at the balance sheet date.
Deferred tax is determined using the balance sheet liability method, for temporary differences between the carrying amounts of assets and liabilities for financial reporting purposes and their respective tax basis, being calculated using the tax rates enacted or substantively enacted in each jurisdiction as at the balance sheet date and expected to be applied when the temporary differences will revert.
Deferred tax liabilities are recognised for all taxable temporary differences. Deferred tax assets are recognised to the extent it is probable that future taxable profits will be available against which deductible temporary differences can be utilised. At each balance sheet date, all temporary differences resulting from deferred tax assets are reviewed in order to recognise or adjust it, depending on the current expectations of future recovery.
Empresa de Electricidade da Madeira
81
As established in paragraph 68 of NCRF 25, EEM compensates the deferred tax assets and liabilities whenever (i) it has a legally enforceable right to offset current tax assets against current tax liabilities; and (ii) the deferred tax assets and the deferred tax liabilities relate to income taxes levied by the same taxation authority on the same taxable entity.
Law no. 2/2014, of January 16, 2014, which approved the Reform of the IRC (income tax), introduced a series of new tax measures. The main measures are related to the reduction of the corporate income tax rate and the increase of the period for reporting tax losses:
• The corporate tax rate is reduced from 25% to 23% in 2014, to which is added the municipal and state tax. Additionally a new tier of state was established for the surcharge that covers the portion of taxable income that exceeds 35 million Euros, which is subject to a rate of 7%. This rate change was held in RAM via the Regional Legislative Decree no. 31-A/2013/M of December 31, 2013. Since they had already been enacted at the balance sheet date, these tax rates were considered in the calculation of deferred tax assets and liabilities as at December 31, 2013;
• The period to report the tax losses carried forward from previous years was extended from 5 to 12 years (for losses incurred on or after January 1, 2014 only). Additionally, the deduction limit is reduced from the current 75% to 70% of taxable income for the year in which they are reported.
j) Foreign exchange transactions Foreign exchange transactions are translated into the functional currency using the exchange
rate prevailing at the transaction date. Monetary assets and liabilities expressed in foreign currencies are translated to Euros at the foreign exchange rates ruling as at the balance sheet date. Foreign exchange differences arising on translation are recognised in the income statement. Non-monetary assets and liabilities that are measured at historical cost in a foreign currency are translated using the exchange rate as at the transaction date. Non-monetary assets and liabilities that are measured at fair value in a foreign currency are translated using the exchange rate as at the date the fair value was determined.
k) Government grants Non-refundable government grants and other similar grants related to tangible and intangible
assets are initially recognised in equity and subsequently, for those that relate to depreciable fixed tangible and intangible assets with finite useful lives, allocated on a systematic basis as income over the periods necessary to match them with the related costs which they are intended to compensate. As for those respecting non-depreciable fixed tangible and intangible assets with indefinite useful lives, they are kept in equity, unless the respective amount is needed to compensate for any impairment loss.
Refundable government grants and other similar grants are booked as liabilities.
Compensationregardingthetariffconvergence
The subsidies granted by governmental entities, in order to compensate the reduction of the electricity tariffs, were accounted under the protocol established in 1998 between the Regional and Central Governments. This protocol was established for the three years period from 1998 to 2000, then being subsequently extended for the years 2001 and 2002.
During April 2003, was signed the contract related with the Tariffs Convergence for Electric Energy between EEM, the Regional Government and the Central Government. This contract establishes the criteria for the compensation payments due to EEM, as a result of the tariffs reduction from 1998 to 2002, revoking the previous protocol. However, the calculation methodology for the compensation amount is mainly the same.
Annual Report 2013Consolidated and Individual Financial Statements
82
In accordance with the above mentioned contract, the compensation attributable to EEM until 2002 is calculated by the difference between the receipts at standard cost (receipts that EEM would obtain if the tariffs were defined to cover the standard costs) and the receipts with the current tariffs (receipts obtained by the application, in each year, of the current tariffs). The standard costs include the activities of generation, transport, distribution and commercialisation of electric energy and are determined by the application of the rules defined in the tariff convergence process.
In accordance with Tariff Regulation, the subsidies granted to EEM under the tariff convergence process for the years after 2002 are recognised in the income statement in period to which the convergence refers, based on the equity principle of tariffs between the Continent and Autonomous Region of Madeira consumers.
Transfersofassetsfromcustomers
The works carried out in the distribution network at customer request and invoiced to them are recorded as tangible fixed assets as long as they meet the capitalisation requirements. The received amounts are recorded in the income statement.
Promotionplanforefficientconsumptionofenergy
The subsidies granted by ERSE to finance the Promotion Plan for Efficient Consumption of Energy (PPEC) are recognised in income statement when there is reasonable assurance that the amounts will be received.
l) Provisions
Provisions are recognised when:
• EEM has a present, legal or constructive obligation as result of a past event;• It is probable that settlement will be required in the future;• A reliable estimate of the obligation can be made.
On an annual basis, provisions are subject to review, according with the expectation of their future liabilities.
m) Employee benefits
Pensions
Following the Company Agreement, EEM assumed the liabilities related to retirement and pre-retirement pensions for the employees that were included in the Social Security (“Caixa Nacional de Pensões”) as at the date of the above mentioned Agreement. The retirement pension complements correspond to the difference between the pension granted by the Social Security (limit of age or disability) and the last salary received by the employee.
The above mentioned pension plan consists in a defined benefit retirement plan, whose liabilities are assessed by an independent actuarial valuation following the projected unit credit method, with the purpose of determining the present value of projected benefits and the corresponding current services costs. The discount rate used is determined based on market rates associated with corporate bonds with high rating, denominated in the currency in which benefits will be paid and with a similar maturity to the maturity date of the liability.
Actuarial gains and losses resulting from (i) differences between financial and actuarial assumptions used and actual amounts; and (ii) changes in the actuarial assumptions, are recognised in the income statement in accordance with IAS 19 – Employee Benefits, as adopted by the original text of Regulation no. 1126/2008, of 3 November.
Empresa de Electricidade da Madeira
83
EEM recognises as cost in the income statement a total net amount that includes (i) current service cost; (ii) interest cost; (iii) estimated return of the fund assets; (iv) the effect of early retirements; and (v) the effect of curtailments.
n) Recognition of income and expenses
Income and expenses are recorded in the period to which they refer regardless of when paid or received, in accordance with the accrual concept. Differences between amounts received and paid and the corresponding revenues and charges are recorded under other assets or liabilities depending on whether they are receivable or payable amounts.
Revenue is measured at fair value of the received or receivable retribution. Revenue comprise the amounts of electricity sales invoiced and related services rendered, net of value added taxes, rebates and discounts and the elimination of sales between Group companies.
Energy sales are considered as income in the period in which the consumption occurs, independently of the invoicing date. The invoicing of electricity sales is undertaken on a monthly basis, considering the electricity tariffs established by ERSE. Revenues regarding the electric energy to be invoiced, corresponding to the actual consumption not metered as at the balance sheet value, are accrued based on real consumptions.
o) CO2 Licenses
EEM owns CO2 licenses in order to face the emissions that result from its operational activity. CO2 licenses owned for own consumption and freely attributed are recognised as an intangible asset against equity as at the attribution date and are valued based on the market price as at that date. The licenses acquired in the market in order to settle the liability arising from the consumption are recognised as an intangible asset at its acquisition cost.
The licenses usage is valued at historical cost considering the emissions occurred during the period (FIFO). These emissions are registered as depreciation expenses in the period they take place. When the emissions for the period exceeds the licenses held, is charged a provision for the amount necessary to acquire the licenses in the market, as at the balance sheet date.
The subsidies initially recorded against equity are subsequently amortised over the period in which they are attributed, on the same proportion as the consumptions, against the income statement. In accordance with the regulation disposals defined by ERSE, the amount recognisedin equity arising from the licenses freely attributed and not consumed is reclassified to the balance Other payables, considering the existence of a liability with the Electric System, which will be settled during the “Plano Nacional de Atribuição de Licenças de Emissão II (2008-2012)” period.
Under Decree-Law 38/2013, of 15 March, transposing into national law Directive no. 2003/87/CE of the European Parliament and of the Council of 13 October 2003 on the establishment of a trading regime for emission allowances for greenhouse gas emissions (CELE), EEM stopped receiving freely attributed emission allowances, resorting to the market to acquire all the necessary licenses for its operating activities.
p) Tariff adjustments
Annual Report 2013Consolidated and Individual Financial Statements
84
In activities subject to regulation, the Regulator establishes through the tariff adjustment mechanism, the criteria to recognise gains or losses of one period in future periods. The tariff adjustments accounted for in EEM’s financial statements represent the difference between the amounts invoiced by EEM (based on the applicable tariffs published by ERSE in December of the previous year) and the regulated revenue calculated based on real costs. The assets or liabilities resulting from the tariff adjustments are recovered or returned through the electricity tariffs charged to customers in subsequent periods.
Decree-Law no. 165/2008, of 21 August, recognised the unconditional right of the regulated operators to recover the tariff adjustments under a regime identical to the one used for the tariff deficits. Consequently, EEM books in the income statement the effects resulting from the recognition of tariff adjustments. According to the referred Decree-Law, the tariff adjustments determined annually will be recovered by the regulated operators even in case of insolvency or cease of operations. ERSE is the entity responsible to establish the method to ensure that the entity entitled to these rights continues to recover the tariff adjustments until its complete payment. The Decree-Law also allows the transfer of the right to receive the tariff adjustment to third parties, in whole or in part, through future electricity tariffs.
q) Financial instruments
EEM recognises a financial asset, a financial liability or an equity instrument only when it becomes part of the financial instrument contract dispositions.
EEM measures the financial instruments at their amortised cost, net of impairment losses, when they fulfil the following conditions:
• Are repayable on demand or have a defined maturity;• The returns for its holder are (i) a fixed amount; (ii) determined based on a fixed interest rate
over the instrument life or based on a variable rate that is a typical market index for financing transactions or that includes a spread over the same index; and
• Do not contain any contractual clause that may result in the loss of the nominal value and accumulated interest (excluding the typical credit risks cases).
The remaining financial instruments are recognised at fair value or at acquisition cost, net of impairment, when it is not possible to reliably measure the fair value.
Clients and other receivables
Clients and other receivables are recognised, at each balance sheet date, at cost or amortised cost net of impairment losses. These assets are initially recognised at their fair value plus transactions costs.
Financial liabilities
An instrument is classified as a financial liability when it contains a contractual obligation to liquidate capital and/or interest, through delivering cash or other financial asset, independently of its legal form. Financial liabilities are recognised (i) initially at fair value less transaction costs and (ii) subsequently at amortised cost, using the effective interest rate method.
Derivativefinancialinstruments
EEM contracts derivative financial instruments to hedge the interest rate risk arising from its financial debt portfolio (Management perspective), in order to reduce the variability in the related financial charges.
Derivative financial instruments are recognised on the trade date at fair value. Subsequently, the fair value of derivative financial instruments is re-measured on a regular basis, being the gains or losses on re-measurement recognised directly in the income statement, except for derivatives
Empresa de Electricidade da Madeira
85
designated as cash flow hedging instruments.
Changes in the fair value of derivatives qualified as cash flow hedges are recognised in reserves. The cumulative gains or losses recognised in reserves are reclassified to the income statement when the hedged item affects the income statement.
Impairment
At each balance sheet date an assessment is performed as to whether there is objective evidence of impairment, namely those resulting in an adverse effect on estimated future cash flows of the financial asset or group of financial assets, and every time it can be reliably measured. If there is objective evidence of impairment, the recoverable amount of the financial asset is determined, and the impairment loss is recognised in the income statement.
A financial asset or a group of financial assets is impaired if there is objective evidence of impairment as a result of one or more events that occurred after their initial recognition.
r) Contingent assets and liabilities
The Company does not recognise contingent assets and liabilities.
Contingent liabilities are disclosed unless the possibility of an outflow of resources embodying economic benefits. Assets are disclosed when an inflow of economic benefits is remote.
Assets and contingent liabilities are assessed continually to ensure that developments are appropriately reflected in the financial statements.
If it becomes probable that an outflow of economic benefits will be required for an item previously dealt with as a contingent liability, a provision is recognised in the financial statements of the period in which the change in probability occurs.
If it has become virtually certain that an inflow of economic benefits, the asset and related income are recognised in the financial statements of the period in which the change occurs.
Environmental contingent liabilities are not recognised in the balance sheet. If there is a possibility, less likely, that environmental damage should be rectified in the future, but the obligation is still dependent on the occurrence of an uncertain event, the Company discloses the respective contingent liability.
s) Expenses / Income from financing
The expenses / income from financing include the interest paid by borrowing, interest received from such investments and income and expenses obtained and supported.
Interest is recognised according to the accrual basis.
t) Events occurred after the balance sheet date
The presented financial statements reflect subsequent events occurred until 31 March 2014, date in which the Board of Directors approved them, as mentioned in Note 46. Events occurring after the balance sheet date about conditions that existed at the balance date are considered in the preparation of financial statements.
The material events occurred after the balance sheet date which do not result in adjustments are disclosed in Note 46.
3.3 Critical accounting estimates and judgments used in preparing the financial statements
Annual Report 2013Consolidated and Individual Financial Statements
86
NCRF require the use of judgment and estimates in the decision process about certain accounting treatments, with impact in total assets, liabilities, equity, costs and income. The actual effects may differ from these estimates and judgments, namely in relation to the effect of actual costs and income.
The main accounting estimates and judgments used in applying the accounting policies are discussed in this note in order to improve the understanding of how their application affects the EEM’s reported results and disclosures. A broader description of the accounting policies employed by EEM is disclosed in Note 3.2.
Considering that in many cases there are alternatives to the accounting treatment adopted by EEM, the reported results could differ if a different treatment was chosen. The Board of Directors believes that the choices made are appropriate and that the financial statements present fairly, in all material respects, EEM’s financial position and results. The alternative outcomes discussed below are presented solely to assist the reader in understanding the financial statements and are not intended to suggest that other alternatives or estimates would be more appropriate.
Impairmentsofclientsandotherdebtors
Impairment losses related to clients and other debtors are determined by EEM based on the estimated recoverable amounts, the date of default, debt write offs and other factors. Certain circumstances and facts may change the estimated impairment losses of clients and other debtors, namely changes in the economic environment, economic sector trends, client’s credit risk and increases in the rate of defaults. The evaluation process is subject to numerous estimates and judgment. Changes in the estimates and judgment could change the impairment test results which could affect the reported results.
Tariffadjustments
Tariff adjustments represent the difference between costs and income of the National Electricity System (SEN), estimated at the beginning of each period for purposes of calculating the tariff, and the actual costs and income of the Electricity System established at the end of each period. The tariff adjustments assets or liabilities are recovered or returned through electricity tariffs for customers in subsequent periods. Considering the current legislation which establishes an unconditional right of the regulated operators to recover or return the tariff adjustments, EEM registered the income of the period, the effects of the recognition of the tariff adjustment. Under the current legislation, regulated companies can also sell to a third party, in whole or in part, the right to receive the tariff adjustments through the electricity tariffs.
Impairmentofnon-currentassets
Impairment tests are performed, whenever there is a trigger that the recoverable amount of tangible and intangible assets is less than the corresponding carrying amount. Considering the uncertainties regarding the recoverable amount of tangible and intangible assets as they are based on the best information available, changes in the assumptions can result in changes in the determination of the amount of impairment and, consequently, on the EEM’s results.
Assetsusefullife
The assets for production, transmission and distribution of energy are amortised over their estimated period of useful life, considering the facts and circumstances existing on the date of preparation of financial statements that include, among others, the best estimates of EEM on the life of the respective assets.
In 2012, EEM Group, through its subsidiary Enereem, redefined the useful lives of the wind farms of Porto Santo and the Bica da Cana from 16 to 20 years and therefore prospectively changed the amount of the respective amortisation.
The estimated lifetime of the plants was based on technical specifications of the suppliers of assets installed in these parks certified by an external entity. Based on this information, the
Empresa de Electricidade da Madeira
87
remaining useful life of each asset was identified. This analysis included assumptions that require judgments and estimates used in the determination of the useful lives of the assets considered, as well as the expectation of the Management that the licenses to use the public domain of the Autonomous Region of Madeira for the production of electricity from renewable sources, shall continue until the expiration of their useful lives.
Pensionsandotheremployeebenefits
Determining pension and other employee benefits liabilities requires the use of assumptions and estimates, including actuarial projections, estimated rates of return on investments, discount rates and pension and salary growth and other factors that can impact the cost and the liability. Changes in the assumptions can materially affect the amounts determined.
Provisions
The amount recognised as a provision is the best estimate of the expense required to settle the present obligation at the balance sheet date. The use of different assumptions in the estimates and judgments from those referred to can lead to different results of those considered.
In the normal course of its activities, the EEM Group’s subsidiaries have several lawsuits and contingencies (possible risk) of administrative nature, civil nature, tax and other. These lawsuits, arbitration or other involve third parties, administrative Authorities, tax Authorities and other.
These processes in witch estimate losses are unlikely do not require provisioning and are periodically reassessed.
Fairvalueoffinancialinstruments
Fair values are based on listed market prices, if available, otherwise fair value is determined either by the price of similar recent transactions under market conditions or determined by external entities, or by pricing models based on net present value of estimated future cash flows techniques considering market conditions, time value, yield curves and volatility factors. These methodologies may require the use of assumptions or judgments in estimating fair values. Consequently, the use of different methodologies or different assumptions or judgments in applying a particular model, could have produced different financial results from those reported.
Income tax
There are several transactions and calculations for which the ultimate tax determination is uncertain during the ordinary course of business. Different interpretations and estimates would result in a different level of income taxes, current and deferred, recognised in the period.
In Portugal, the Tax Authorities are entitled to review EEM determination of its annual taxable earnings, and its subsidiaries, for a period of four years and for tax years beginning after 2012. If there are tax losses this period is five years for tax years beginning after 2012, four years for the years 2011 and 2010 and six years for the previous years. As a result, it is possible that some additional taxes may be assessed, mainly as a result of differences in interpretation of the tax law. However, EEM believe that there will be no material tax assessments within the context of the financial statements.
Recognition of deferred tax assets related to tax losses carried forward is based on EEM’s Board of Directors expectation that future taxable income will exist.
3.4 Main assumptions concerning the future
There were no situations identified by EEM’s Board of Directors threatening the continuity of EEM.
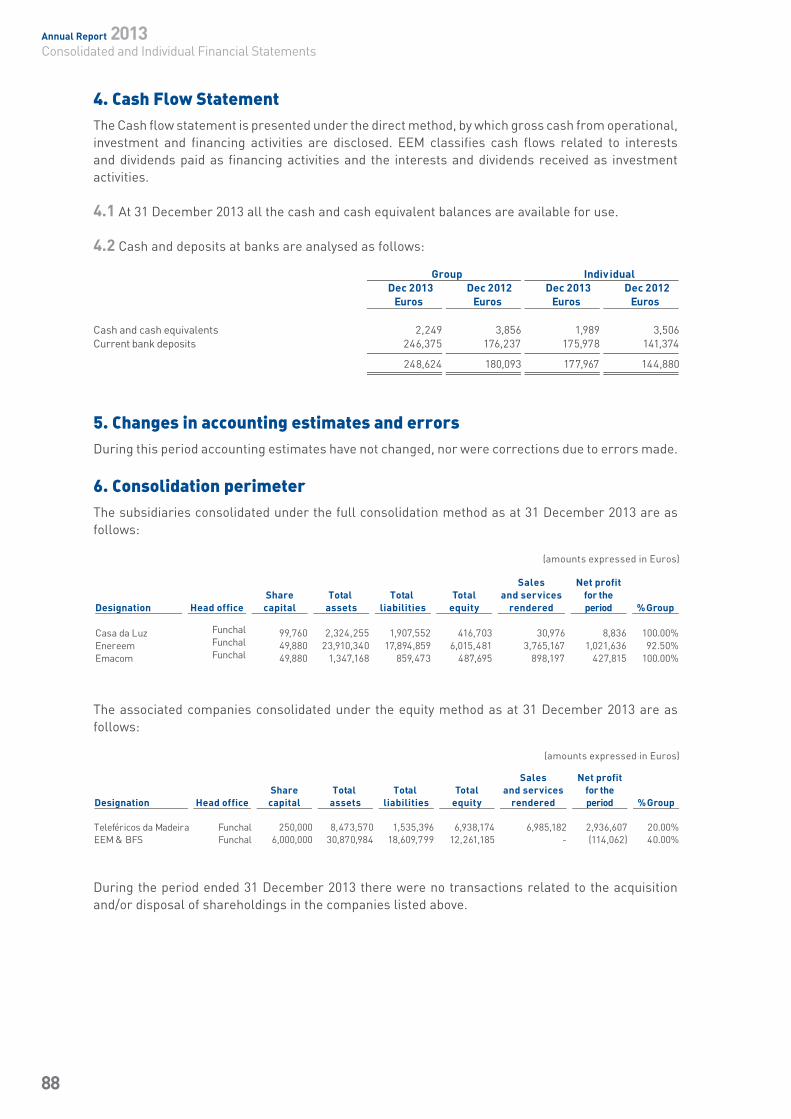
Annual Report 2013Consolidated and Individual Financial Statements
88
During the period ended 31 December 2013 there were no transactions related to the acquisition and/or disposal of shareholdings in the companies listed above.
4. Cash Flow StatementThe Cash flow statement is presented under the direct method, by which gross cash from operational,investment and financing activities are disclosed. EEM classifies cash flows related to interests and dividends paid as financing activities and the interests and dividends received as investment activities.
4.1 At 31 December 2013 all the cash and cash equivalent balances are available for use.
4.2 Cash and deposits at banks are analysed as follows:
5. Changes in accounting estimates and errorsDuring this period accounting estimates have not changed, nor were corrections due to errors made.
6. Consolidation perimeterThe subsidiaries consolidated under the full consolidation method as at 31 December 2013 are as follows:
The associated companies consolidated under the equity method as at 31 December 2013 are as follows:
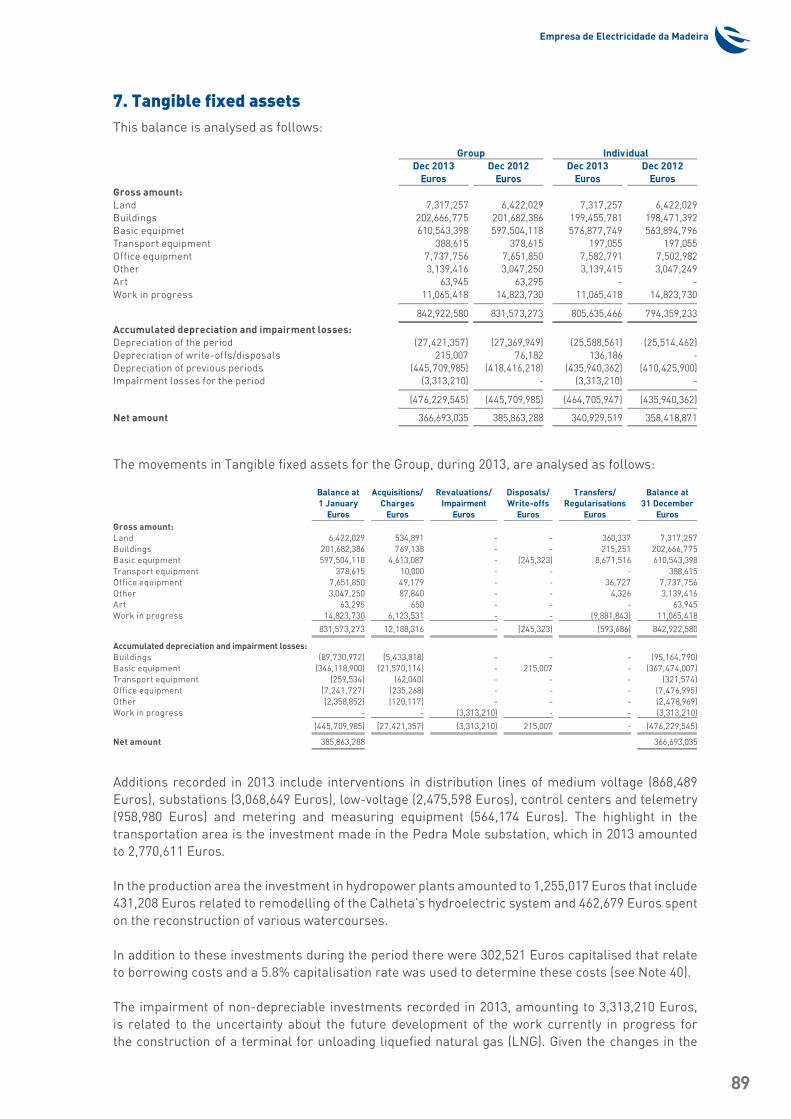
Empresa de Electricidade da Madeira
89
7. Tangible fixed assetsThis balance is analysed as follows:
The movements in Tangible fixed assets for the Group, during 2013, are analysed as follows:
Additions recorded in 2013 include interventions in distribution lines of medium voltage (868,489 Euros), substations (3,068,649 Euros), low-voltage (2,475,598 Euros), control centers and telemetry (958,980 Euros) and metering and measuring equipment (564,174 Euros). The highlight in the transportation area is the investment made in the Pedra Mole substation, which in 2013 amounted to 2,770,611 Euros.
In the production area the investment in hydropower plants amounted to 1,255,017 Euros that include 431,208 Euros related to remodelling of the Calheta’s hydroelectric system and 462,679 Euros spent on the reconstruction of various watercourses.
In addition to these investments during the period there were 302,521 Euros capitalised that relate to borrowing costs and a 5.8% capitalisation rate was used to determine these costs (see Note 40).
The impairment of non-depreciable investments recorded in 2013, amounting to 3,313,210 Euros, is related to the uncertainty about the future development of the work currently in progress for the construction of a terminal for unloading liquefied natural gas (LNG). Given the changes in the
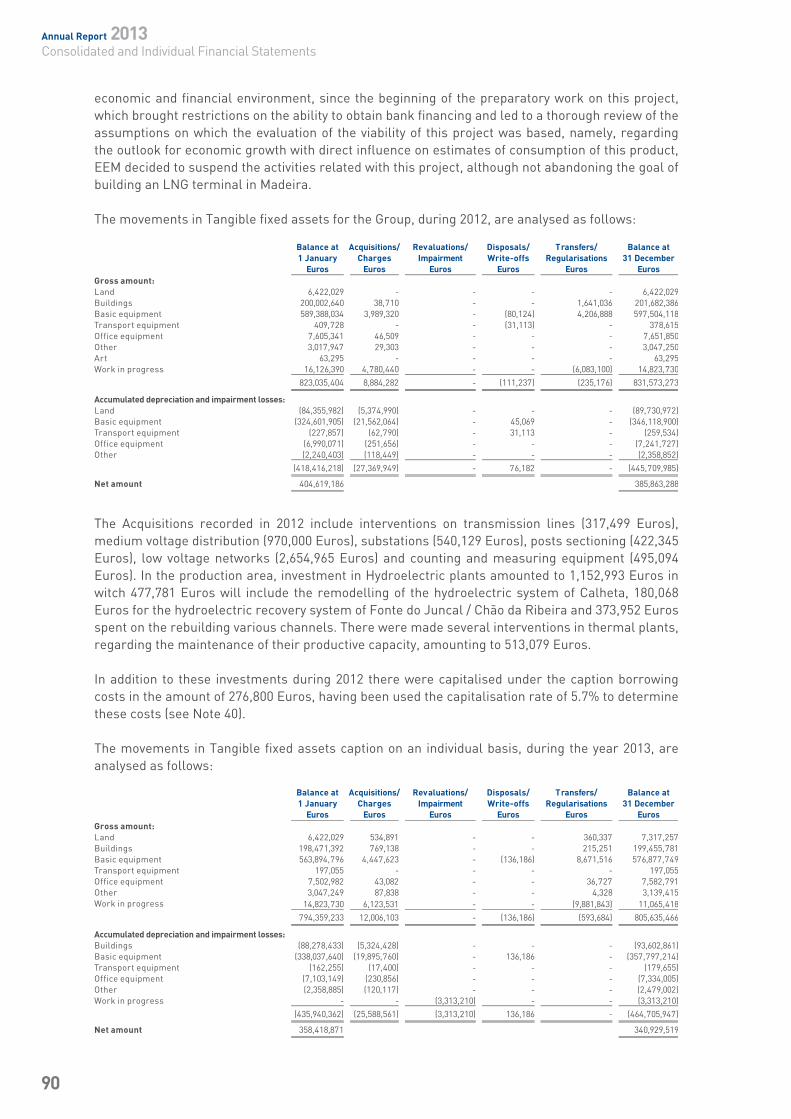
Annual Report 2013Consolidated and Individual Financial Statements
90
economic and financial environment, since the beginning of the preparatory work on this project, which brought restrictions on the ability to obtain bank financing and led to a thorough review of the assumptions on which the evaluation of the viability of this project was based, namely, regarding the outlook for economic growth with direct influence on estimates of consumption of this product, EEM decided to suspend the activities related with this project, although not abandoning the goal of building an LNG terminal in Madeira. The movements in Tangible fixed assets for the Group, during 2012, are analysed as follows:
The Acquisitions recorded in 2012 include interventions on transmission lines (317,499 Euros), medium voltage distribution (970,000 Euros), substations (540,129 Euros), posts sectioning (422,345 Euros), low voltage networks (2,654,965 Euros) and counting and measuring equipment (495,094 Euros). In the production area, investment in Hydroelectric plants amounted to 1,152,993 Euros in witch 477,781 Euros will include the remodelling of the hydroelectric system of Calheta, 180,068 Euros for the hydroelectric recovery system of Fonte do Juncal / Chão da Ribeira and 373,952 Euros spent on the rebuilding various channels. There were made several interventions in thermal plants, regarding the maintenance of their productive capacity, amounting to 513,079 Euros.
In addition to these investments during 2012 there were capitalised under the caption borrowing costs in the amount of 276,800 Euros, having been used the capitalisation rate of 5.7% to determine these costs (see Note 40).
The movements in Tangible fixed assets caption on an individual basis, during the year 2013, are analysed as follows:
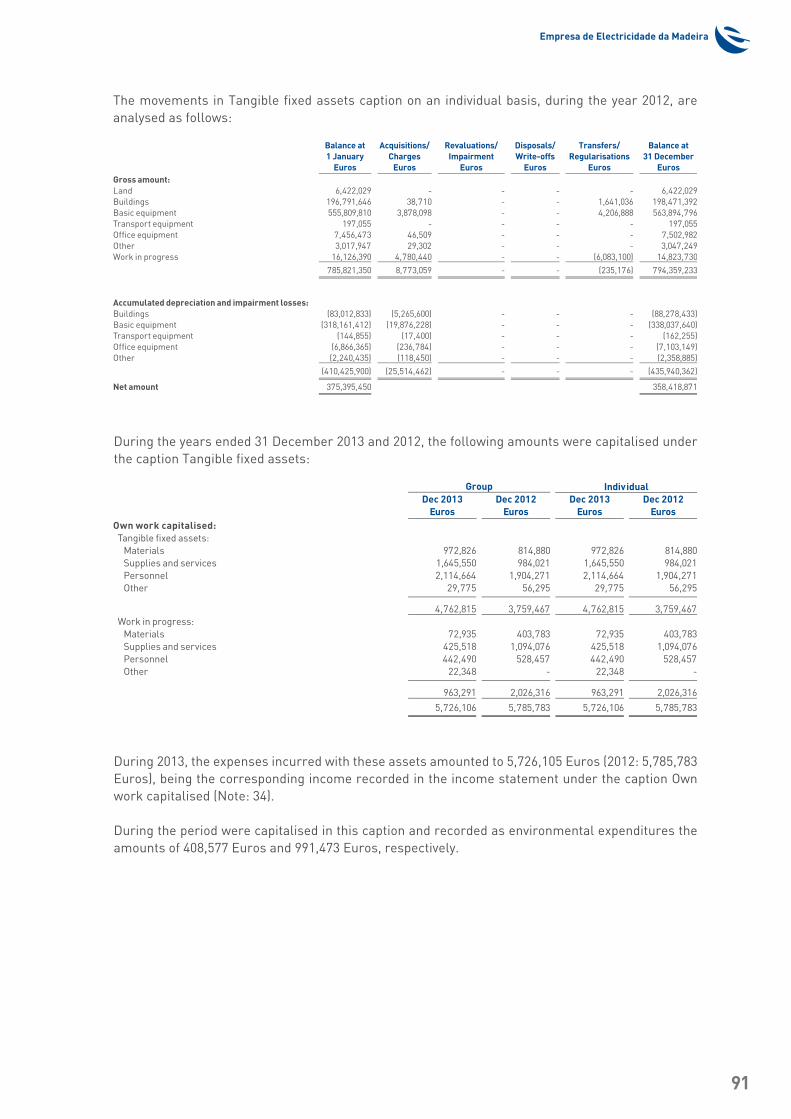
Empresa de Electricidade da Madeira
91
The movements in Tangible fixed assets caption on an individual basis, during the year 2012, are analysed as follows:
During the years ended 31 December 2013 and 2012, the following amounts were capitalised under the caption Tangible fixed assets:
During 2013, the expenses incurred with these assets amounted to 5,726,105 Euros (2012: 5,785,783 Euros), being the corresponding income recorded in the income statement under the caption Own work capitalised (Note: 34).
During the period were capitalised in this caption and recorded as environmental expenditures the amounts of 408,577 Euros and 991,473 Euros, respectively.
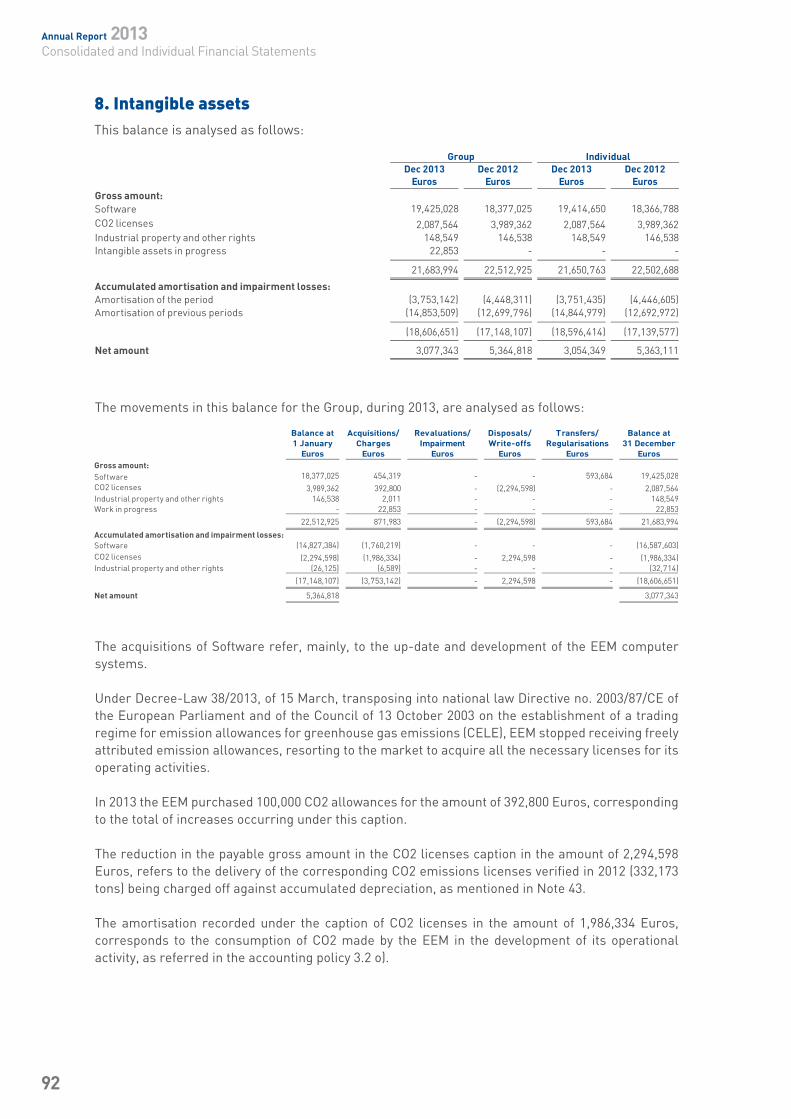
Annual Report 2013Consolidated and Individual Financial Statements
92
The movements in this balance for the Group, during 2013, are analysed as follows:
The acquisitions of Software refer, mainly, to the up-date and development of the EEM computer systems.
Under Decree-Law 38/2013, of 15 March, transposing into national law Directive no. 2003/87/CE of the European Parliament and of the Council of 13 October 2003 on the establishment of a trading regime for emission allowances for greenhouse gas emissions (CELE), EEM stopped receiving freely attributed emission allowances, resorting to the market to acquire all the necessary licenses for its operating activities.
In 2013 the EEM purchased 100,000 CO2 allowances for the amount of 392,800 Euros, corresponding to the total of increases occurring under this caption.
The reduction in the payable gross amount in the CO2 licenses caption in the amount of 2,294,598 Euros, refers to the delivery of the corresponding CO2 emissions licenses verified in 2012 (332,173 tons) being charged off against accumulated depreciation, as mentioned in Note 43.
The amortisation recorded under the caption of CO2 licenses in the amount of 1,986,334 Euros, corresponds to the consumption of CO2 made by the EEM in the development of its operational activity, as referred in the accounting policy 3.2 o).
8. Intangible assetsThis balance is analysed as follows:
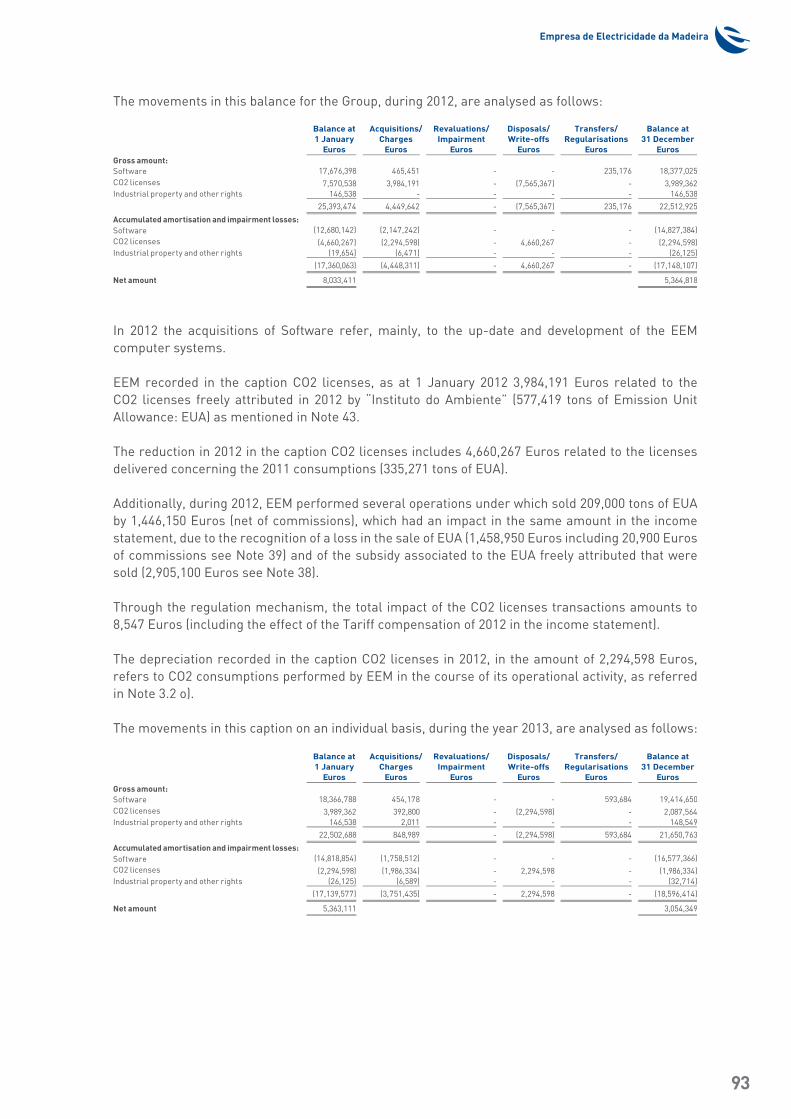
Empresa de Electricidade da Madeira
93
In 2012 the acquisitions of Software refer, mainly, to the up-date and development of the EEM computer systems.
EEM recorded in the caption CO2 licenses, as at 1 January 2012 3,984,191 Euros related to the CO2 licenses freely attributed in 2012 by “Instituto do Ambiente” (577,419 tons of Emission Unit Allowance: EUA) as mentioned in Note 43.
The reduction in 2012 in the caption CO2 licenses includes 4,660,267 Euros related to the licenses delivered concerning the 2011 consumptions (335,271 tons of EUA).
Additionally, during 2012, EEM performed several operations under which sold 209,000 tons of EUA by 1,446,150 Euros (net of commissions), which had an impact in the same amount in the income statement, due to the recognition of a loss in the sale of EUA (1,458,950 Euros including 20,900 Euros of commissions see Note 39) and of the subsidy associated to the EUA freely attributed that were sold (2,905,100 Euros see Note 38).
Through the regulation mechanism, the total impact of the CO2 licenses transactions amounts to 8,547 Euros (including the effect of the Tariff compensation of 2012 in the income statement).
The depreciation recorded in the caption CO2 licenses in 2012, in the amount of 2,294,598 Euros, refers to CO2 consumptions performed by EEM in the course of its operational activity, as referred in Note 3.2 o).
The movements in this caption on an individual basis, during the year 2013, are analysed as follows:
The movements in this balance for the Group, during 2012, are analysed as follows:
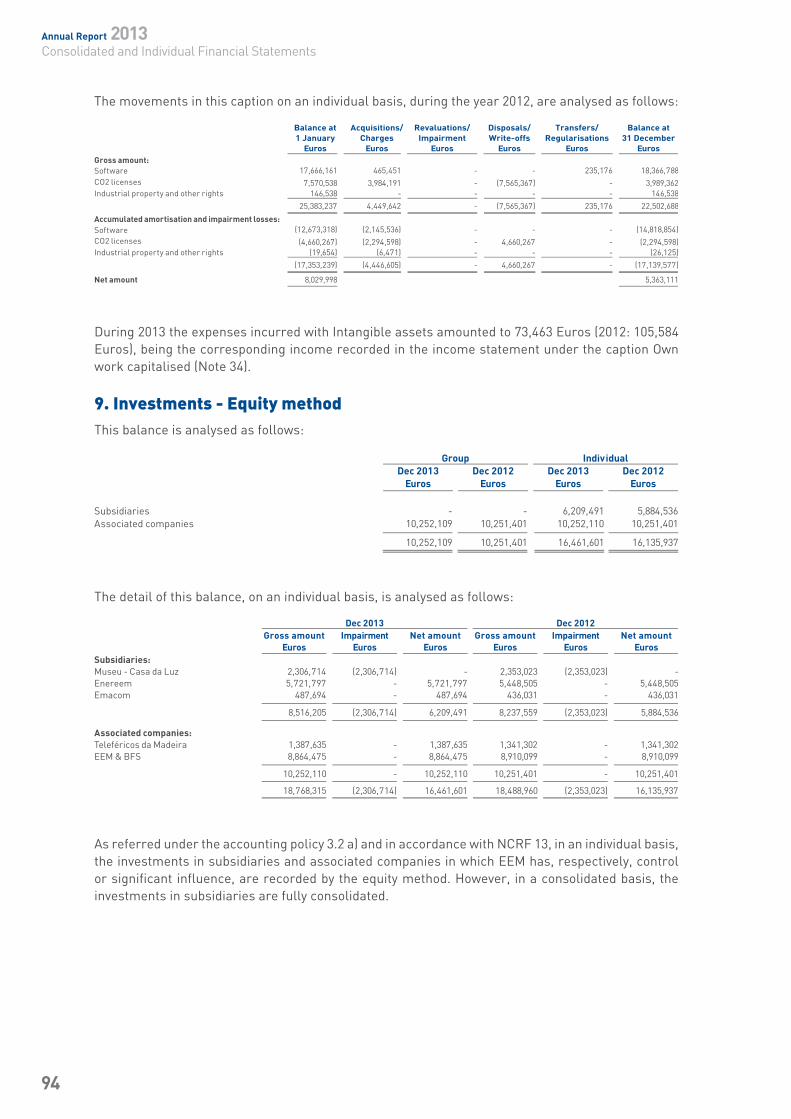
Annual Report 2013Consolidated and Individual Financial Statements
94
The movements in this caption on an individual basis, during the year 2012, are analysed as follows:
During 2013 the expenses incurred with Intangible assets amounted to 73,463 Euros (2012: 105,584 Euros), being the corresponding income recorded in the income statement under the caption Own work capitalised (Note 34).
9. Investments - Equity methodThis balance is analysed as follows:
The detail of this balance, on an individual basis, is analysed as follows:
As referred under the accounting policy 3.2 a) and in accordance with NCRF 13, in an individual basis, the investments in subsidiaries and associated companies in which EEM has, respectively, control or significant influence, are recorded by the equity method. However, in a consolidated basis, the investments in subsidiaries are fully consolidated.
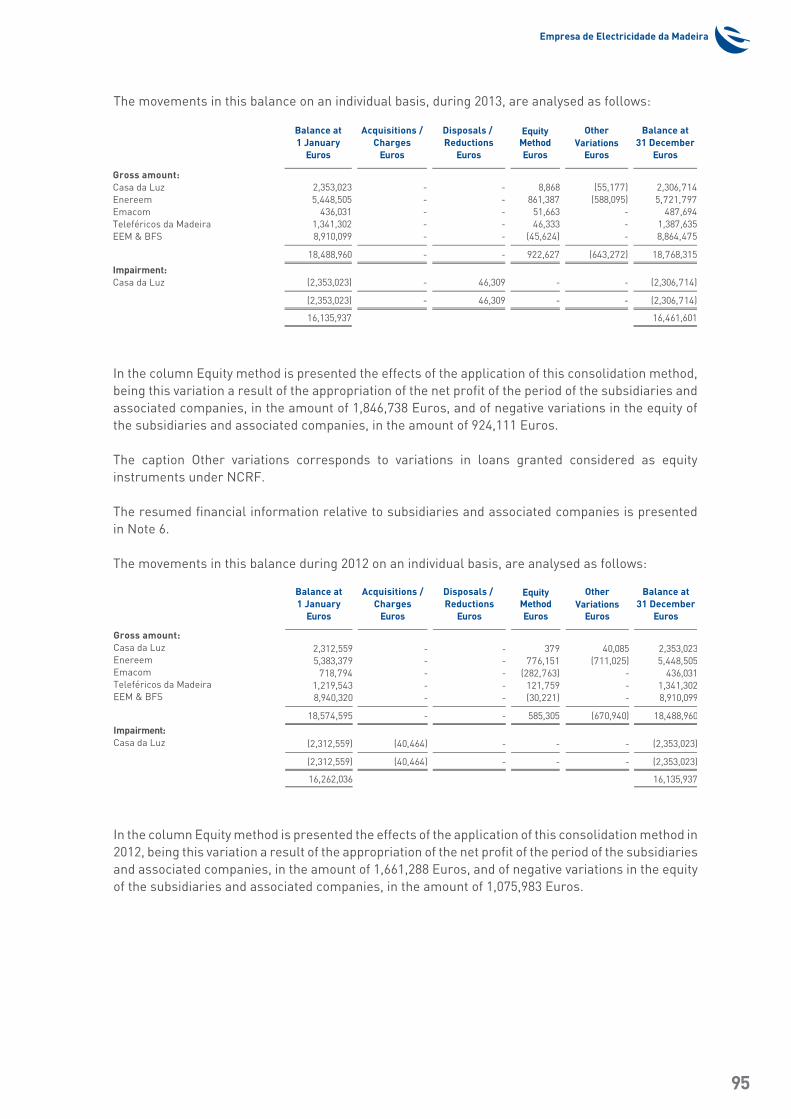
Empresa de Electricidade da Madeira
95
In the column Equity method is presented the effects of the application of this consolidation method, being this variation a result of the appropriation of the net profit of the period of the subsidiaries and associated companies, in the amount of 1,846,738 Euros, and of negative variations in the equity of the subsidiaries and associated companies, in the amount of 924,111 Euros.
The caption Other variations corresponds to variations in loans granted considered as equity instruments under NCRF.
The resumed financial information relative to subsidiaries and associated companies is presented in Note 6.
The movements in this balance during 2012 on an individual basis, are analysed as follows:
In the column Equity method is presented the effects of the application of this consolidation method in 2012, being this variation a result of the appropriation of the net profit of the period of the subsidiaries and associated companies, in the amount of 1,661,288 Euros, and of negative variations in the equity of the subsidiaries and associated companies, in the amount of 1,075,983 Euros.
The movements in this balance on an individual basis, during 2013, are analysed as follows:
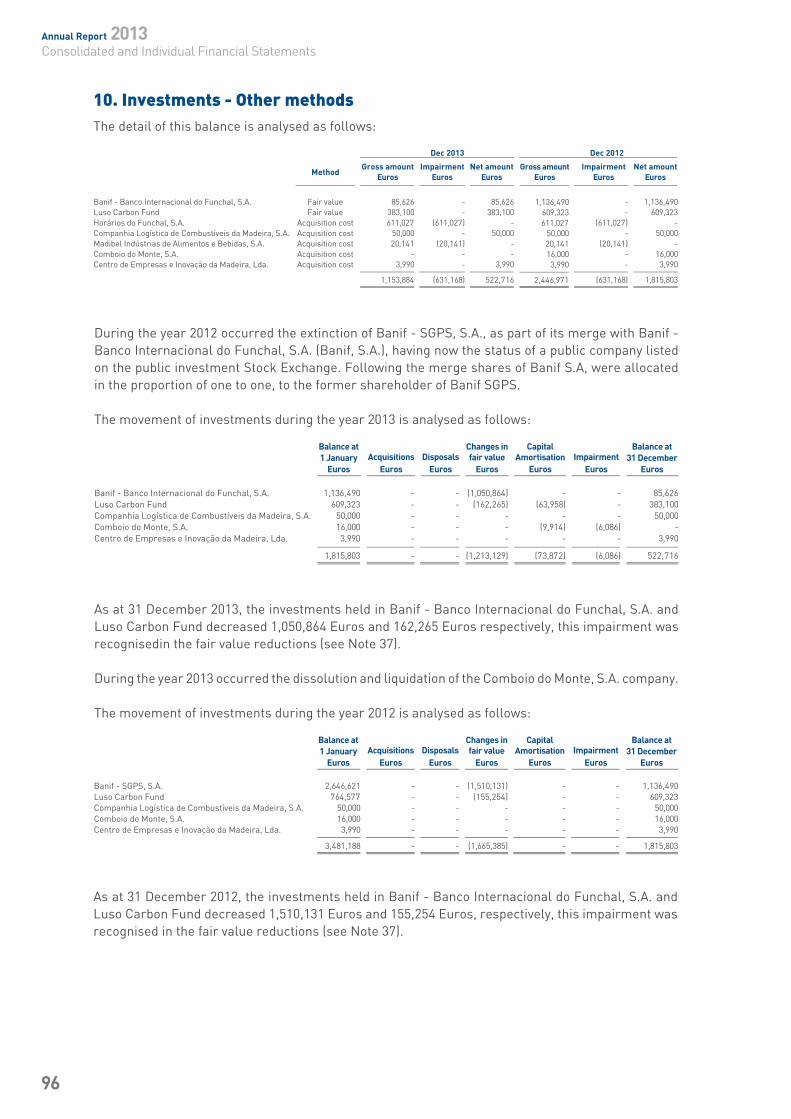
Annual Report 2013Consolidated and Individual Financial Statements
96
As at 31 December 2012, the investments held in Banif - Banco Internacional do Funchal, S.A. and Luso Carbon Fund decreased 1,510,131 Euros and 155,254 Euros, respectively, this impairment was recognised in the fair value reductions (see Note 37).
During the year 2012 occurred the extinction of Banif - SGPS, S.A., as part of its merge with Banif - Banco Internacional do Funchal, S.A. (Banif, S.A.), having now the status of a public company listed on the public investment Stock Exchange. Following the merge shares of Banif S.A, were allocated in the proportion of one to one, to the former shareholder of Banif SGPS.
The movement of investments during the year 2013 is analysed as follows:
As at 31 December 2013, the investments held in Banif - Banco Internacional do Funchal, S.A. and Luso Carbon Fund decreased 1,050,864 Euros and 162,265 Euros respectively, this impairment was recognisedin the fair value reductions (see Note 37).
During the year 2013 occurred the dissolution and liquidation of the Comboio do Monte, S.A. company.
The movement of investments during the year 2012 is analysed as follows:
10. Investments - Other methodsThe detail of this balance is analysed as follows:
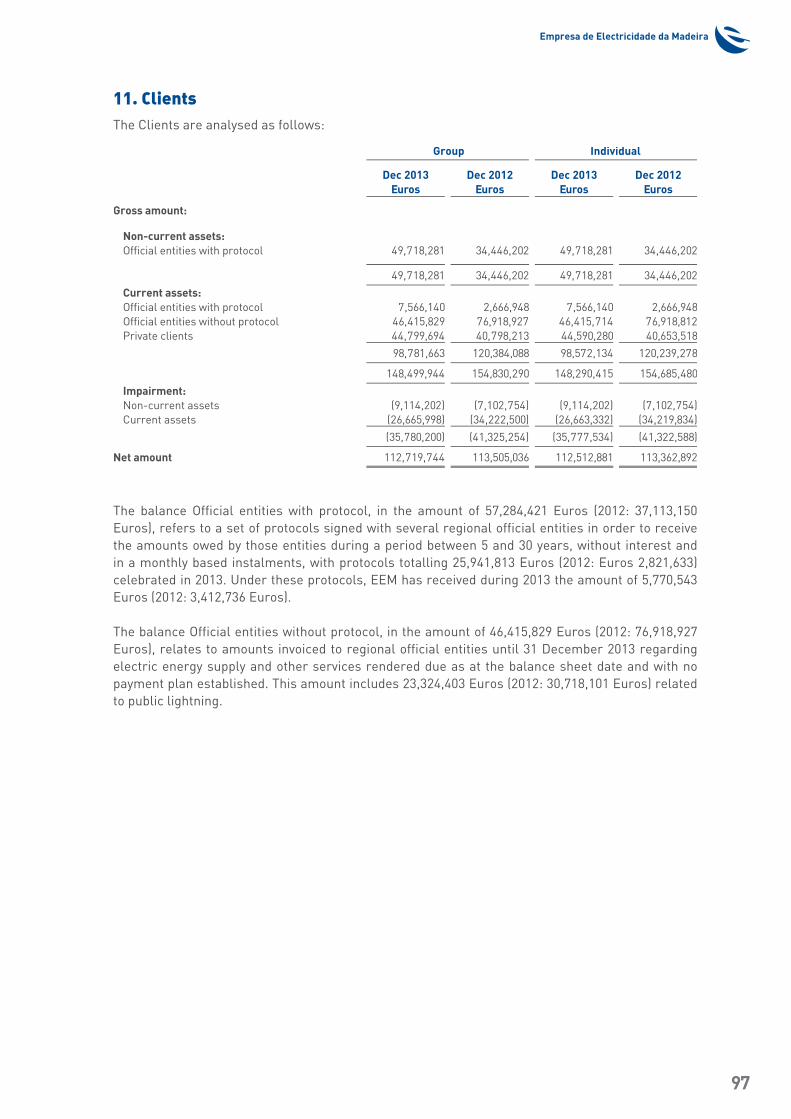
Empresa de Electricidade da Madeira
97
The balance Official entities with protocol, in the amount of 57,284,421 Euros (2012: 37,113,150 Euros), refers to a set of protocols signed with several regional official entities in order to receive the amounts owed by those entities during a period between 5 and 30 years, without interest and in a monthly based instalments, with protocols totalling 25,941,813 Euros (2012: Euros 2,821,633) celebrated in 2013. Under these protocols, EEM has received during 2013 the amount of 5,770,543 Euros (2012: 3,412,736 Euros).
The balance Official entities without protocol, in the amount of 46,415,829 Euros (2012: 76,918,927 Euros), relates to amounts invoiced to regional official entities until 31 December 2013 regarding electric energy supply and other services rendered due as at the balance sheet date and with no payment plan established. This amount includes 23,324,403 Euros (2012: 30,718,101 Euros) related to public lightning.
11. ClientsThe Clients are analysed as follows:
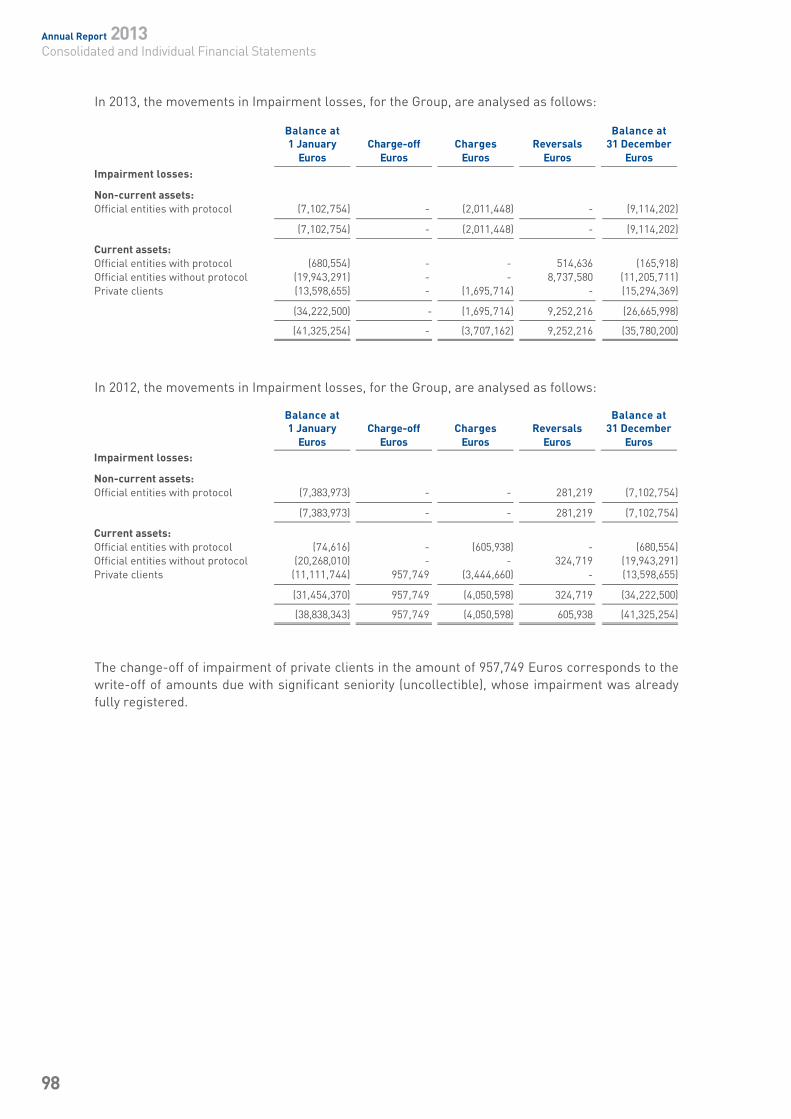
Annual Report 2013Consolidated and Individual Financial Statements
98
In 2013, the movements in Impairment losses, for the Group, are analysed as follows:
In 2012, the movements in Impairment losses, for the Group, are analysed as follows:
The change-off of impairment of private clients in the amount of 957,749 Euros corresponds to the write-off of amounts due with significant seniority (uncollectible), whose impairment was already fully registered.
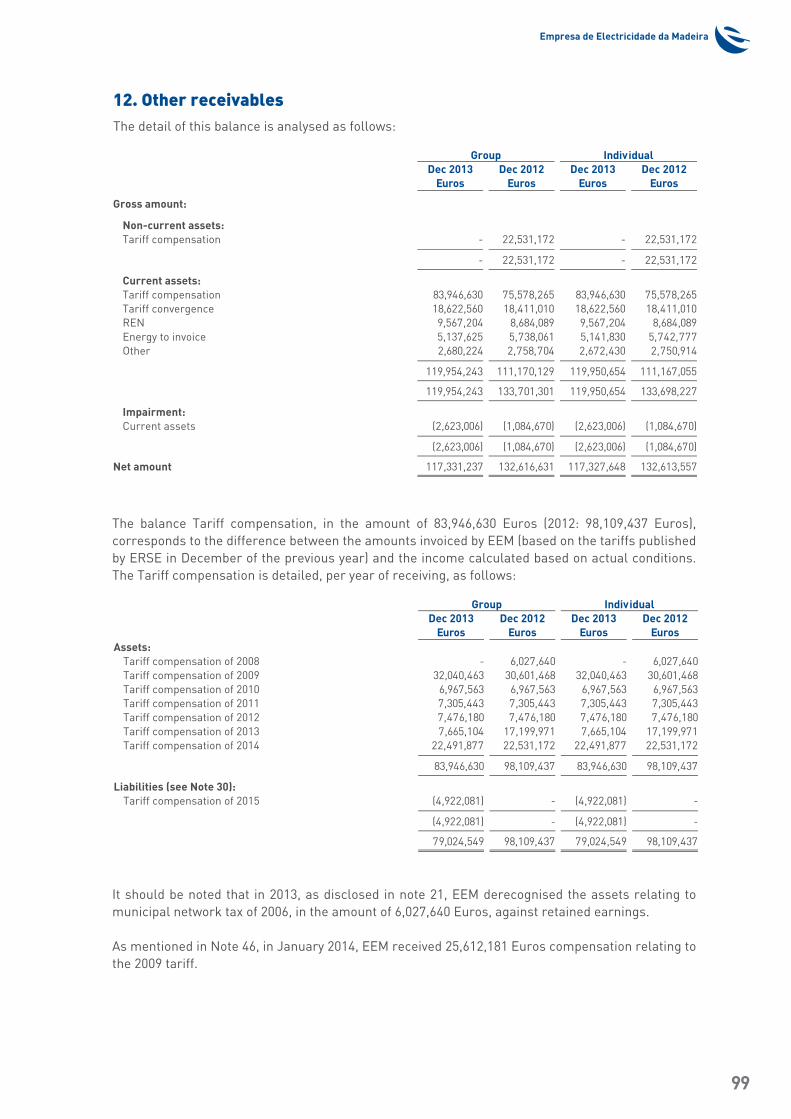
Empresa de Electricidade da Madeira
99
12. Other receivablesThe detail of this balance is analysed as follows:
The balance Tariff compensation, in the amount of 83,946,630 Euros (2012: 98,109,437 Euros), corresponds to the difference between the amounts invoiced by EEM (based on the tariffs published by ERSE in December of the previous year) and the income calculated based on actual conditions. The Tariff compensation is detailed, per year of receiving, as follows:
It should be noted that in 2013, as disclosed in note 21, EEM derecognised the assets relating to municipal network tax of 2006, in the amount of 6,027,640 Euros, against retained earnings.
As mentioned in Note 46, in January 2014, EEM received 25,612,181 Euros compensation relating to the 2009 tariff.
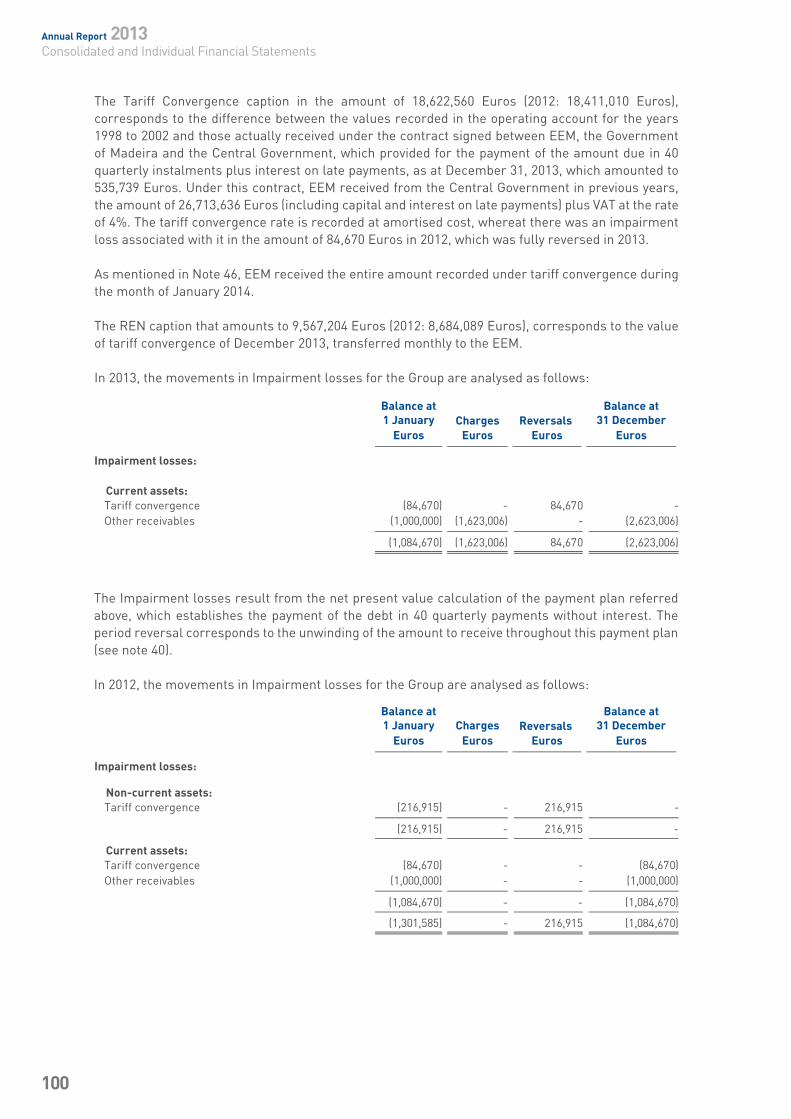
Annual Report 2013Consolidated and Individual Financial Statements
100
The Tariff Convergence caption in the amount of 18,622,560 Euros (2012: 18,411,010 Euros), corresponds to the difference between the values recorded in the operating account for the years 1998 to 2002 and those actually received under the contract signed between EEM, the Government of Madeira and the Central Government, which provided for the payment of the amount due in 40 quarterly instalments plus interest on late payments, as at December 31, 2013, which amounted to 535,739 Euros. Under this contract, EEM received from the Central Government in previous years, the amount of 26,713,636 Euros (including capital and interest on late payments) plus VAT at the rate of 4%. The tariff convergence rate is recorded at amortised cost, whereat there was an impairment loss associated with it in the amount of 84,670 Euros in 2012, which was fully reversed in 2013.
As mentioned in Note 46, EEM received the entire amount recorded under tariff convergence during the month of January 2014.
The REN caption that amounts to 9,567,204 Euros (2012: 8,684,089 Euros), corresponds to the value of tariff convergence of December 2013, transferred monthly to the EEM.
In 2013, the movements in Impairment losses for the Group are analysed as follows:
The Impairment losses result from the net present value calculation of the payment plan referred above, which establishes the payment of the debt in 40 quarterly payments without interest. The period reversal corresponds to the unwinding of the amount to receive throughout this payment plan (see note 40).
In 2012, the movements in Impairment losses for the Group are analysed as follows:
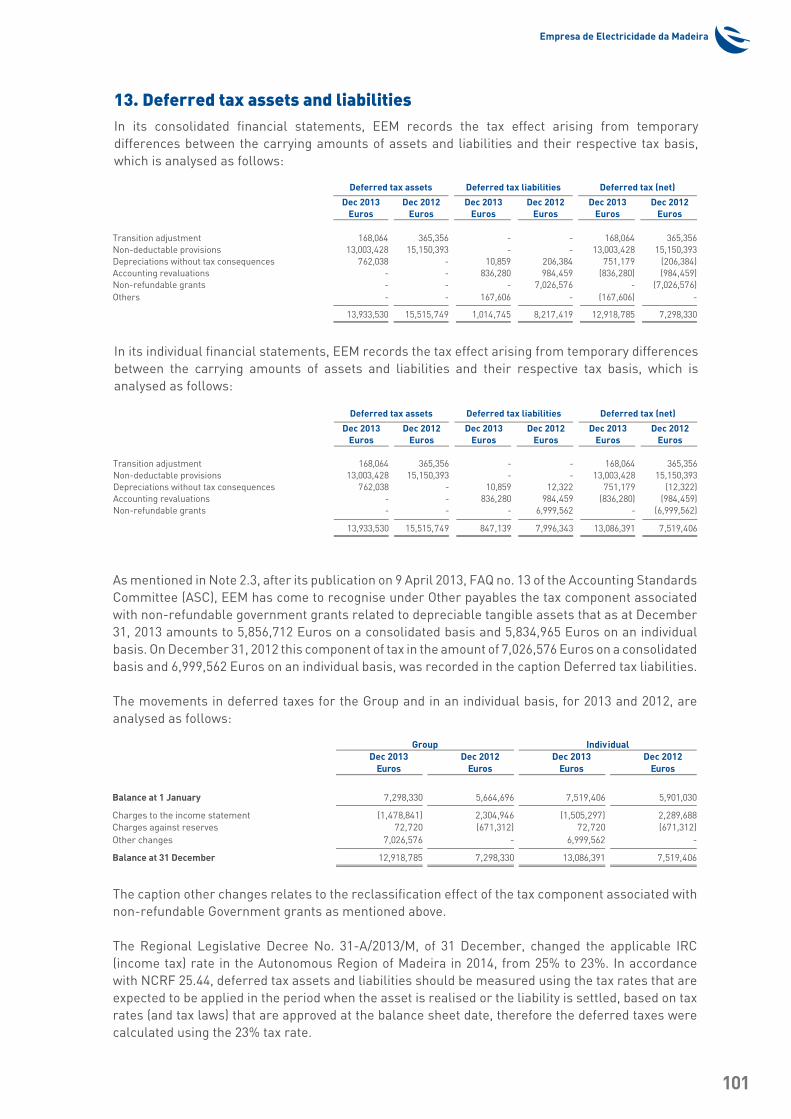
Empresa de Electricidade da Madeira
101
In its individual financial statements, EEM records the tax effect arising from temporary differences between the carrying amounts of assets and liabilities and their respective tax basis, which is analysed as follows:
As mentioned in Note 2.3, after its publication on 9 April 2013, FAQ no. 13 of the Accounting Standards Committee (ASC), EEM has come to recognise under Other payables the tax component associated with non-refundable government grants related to depreciable tangible assets that as at December 31, 2013 amounts to 5,856,712 Euros on a consolidated basis and 5,834,965 Euros on an individual basis. On December 31, 2012 this component of tax in the amount of 7,026,576 Euros on a consolidated basis and 6,999,562 Euros on an individual basis, was recorded in the caption Deferred tax liabilities.
The movements in deferred taxes for the Group and in an individual basis, for 2013 and 2012, are analysed as follows:
The caption other changes relates to the reclassification effect of the tax component associated with non-refundable Government grants as mentioned above.
The Regional Legislative Decree No. 31-A/2013/M, of 31 December, changed the applicable IRC (income tax) rate in the Autonomous Region of Madeira in 2014, from 25% to 23%. In accordance with NCRF 25.44, deferred tax assets and liabilities should be measured using the tax rates that are expected to be applied in the period when the asset is realised or the liability is settled, based on tax rates (and tax laws) that are approved at the balance sheet date, therefore the deferred taxes were calculated using the 23% tax rate.
13. Deferred tax assets and liabilitiesIn its consolidated financial statements, EEM records the tax effect arising from temporary differences between the carrying amounts of assets and liabilities and their respective tax basis, which is analysed as follows:
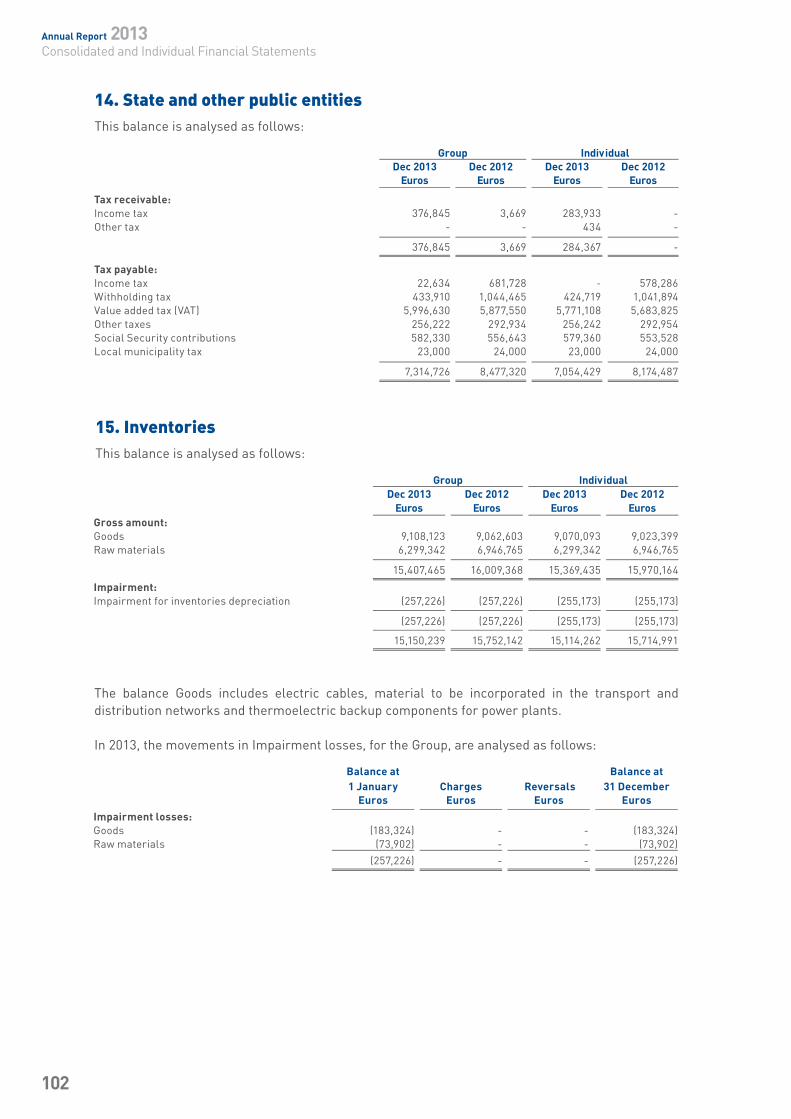
Annual Report 2013Consolidated and Individual Financial Statements
102
14. State and other public entitiesThis balance is analysed as follows:
15. InventoriesThis balance is analysed as follows:
The balance Goods includes electric cables, material to be incorporated in the transport and distribution networks and thermoelectric backup components for power plants.
In 2013, the movements in Impairment losses, for the Group, are analysed as follows:
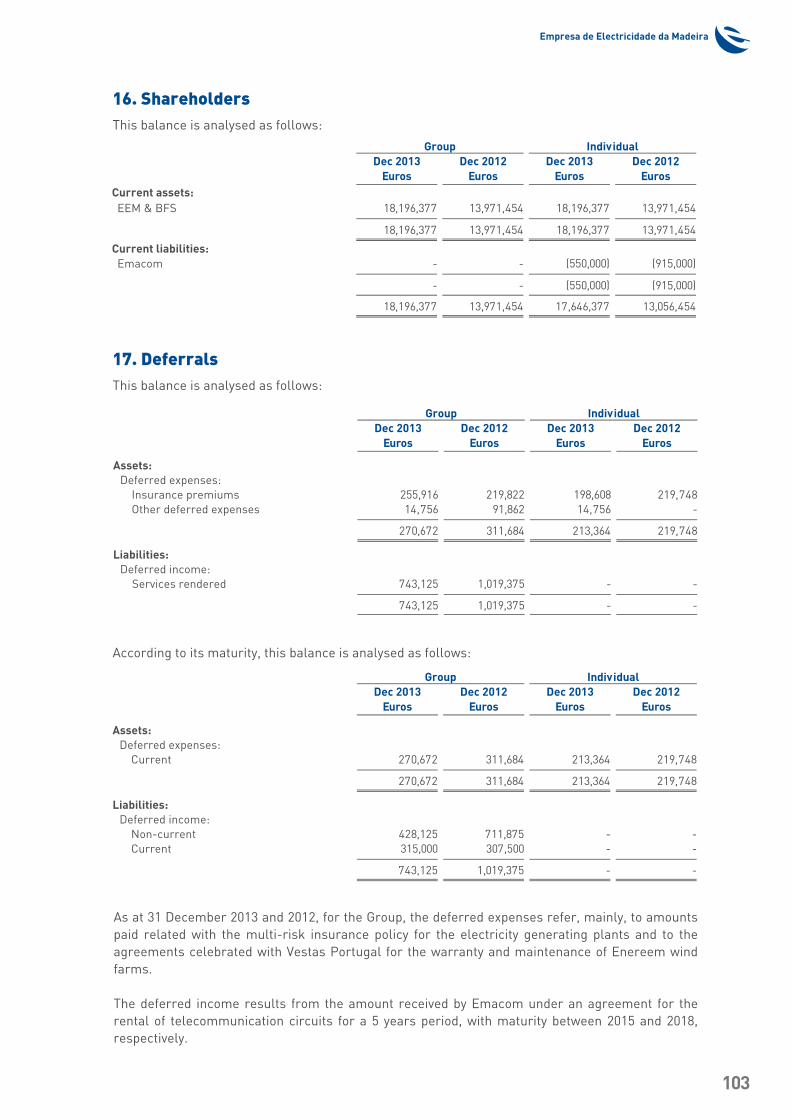
Empresa de Electricidade da Madeira
103
According to its maturity, this balance is analysed as follows:
As at 31 December 2013 and 2012, for the Group, the deferred expenses refer, mainly, to amounts paid related with the multi-risk insurance policy for the electricity generating plants and to the agreements celebrated with Vestas Portugal for the warranty and maintenance of Enereem wind farms.
The deferred income results from the amount received by Emacom under an agreement for the rental of telecommunication circuits for a 5 years period, with maturity between 2015 and 2018, respectively.
16. Shareholders This balance is analysed as follows:
17. DeferralsThis balance is analysed as follows:
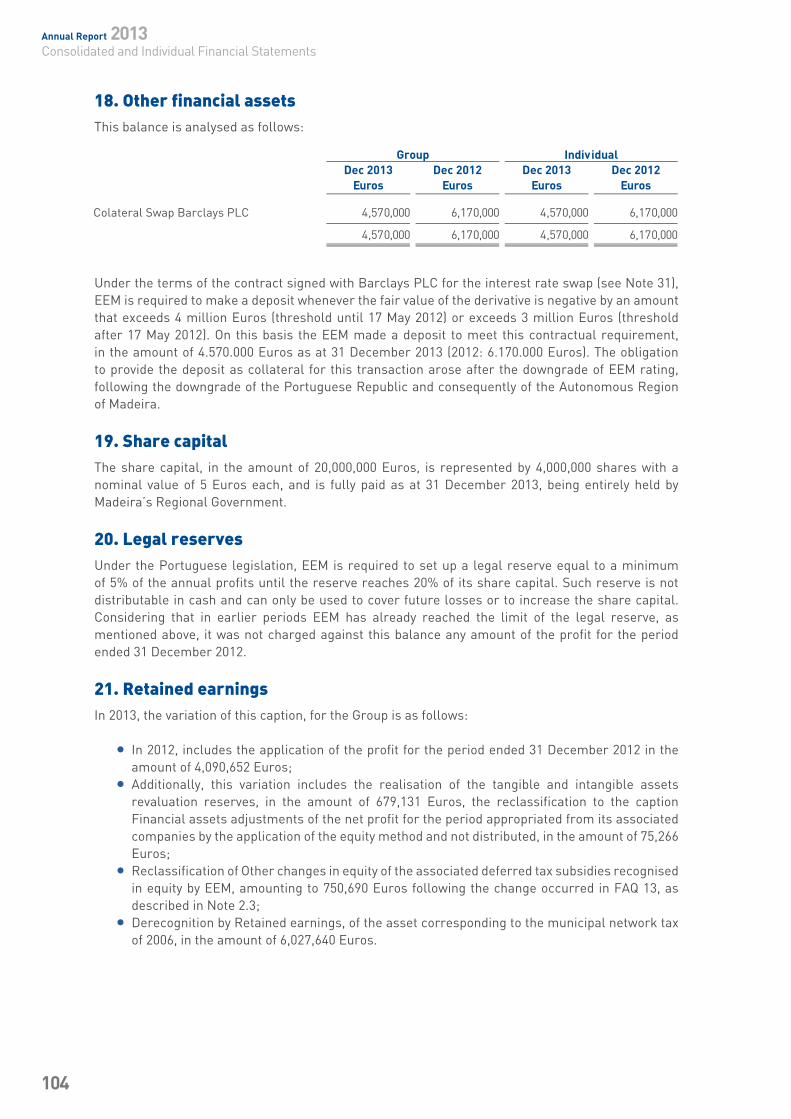
Annual Report 2013Consolidated and Individual Financial Statements
104
Under the terms of the contract signed with Barclays PLC for the interest rate swap (see Note 31), EEM is required to make a deposit whenever the fair value of the derivative is negative by an amount that exceeds 4 million Euros (threshold until 17 May 2012) or exceeds 3 million Euros (threshold after 17 May 2012). On this basis the EEM made a deposit to meet this contractual requirement, in the amount of 4.570.000 Euros as at 31 December 2013 (2012: 6.170.000 Euros). The obligation to provide the deposit as collateral for this transaction arose after the downgrade of EEM rating, following the downgrade of the Portuguese Republic and consequently of the Autonomous Region of Madeira.
19. Share capitalThe share capital, in the amount of 20,000,000 Euros, is represented by 4,000,000 shares with a nominal value of 5 Euros each, and is fully paid as at 31 December 2013, being entirely held by Madeira’s Regional Government.
20. Legal reservesUnder the Portuguese legislation, EEM is required to set up a legal reserve equal to a minimum of 5% of the annual profits until the reserve reaches 20% of its share capital. Such reserve is not distributable in cash and can only be used to cover future losses or to increase the share capital. Considering that in earlier periods EEM has already reached the limit of the legal reserve, as mentioned above, it was not charged against this balance any amount of the profit for the period ended 31 December 2012.
21. Retained earningsIn 2013, the variation of this caption, for the Group is as follows:
• In 2012, includes the application of the profit for the period ended 31 December 2012 in the amount of 4,090,652 Euros;
• Additionally, this variation includes the realisation of the tangible and intangible assets revaluation reserves, in the amount of 679,131 Euros, the reclassification to the caption Financial assets adjustments of the net profit for the period appropriated from its associated companies by the application of the equity method and not distributed, in the amount of 75,266 Euros;
• Reclassification of Other changes in equity of the associated deferred tax subsidies recognised in equity by EEM, amounting to 750,690 Euros following the change occurred in FAQ 13, as described in Note 2.3;
• Derecognition by Retained earnings, of the asset corresponding to the municipal network tax of 2006, in the amount of 6,027,640 Euros.
18. Other financial assetsThis balance is analysed as follows:
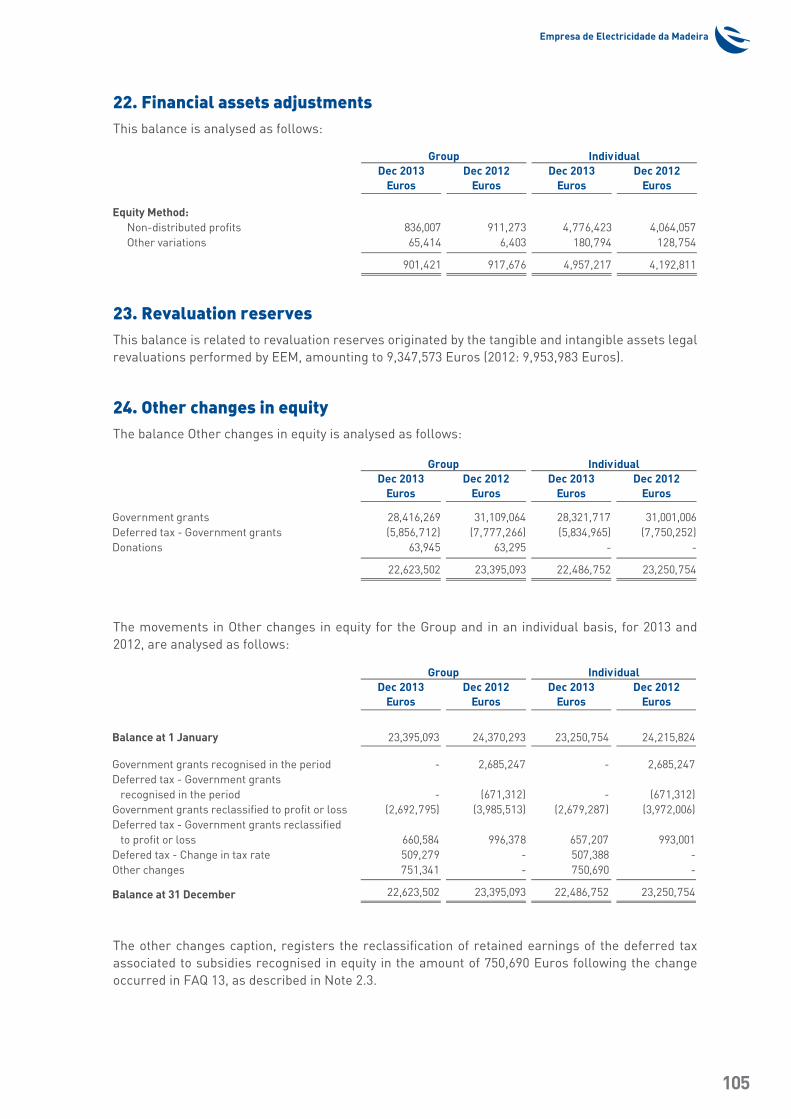
Empresa de Electricidade da Madeira
105
23. Revaluation reservesThis balance is related to revaluation reserves originated by the tangible and intangible assets legal revaluations performed by EEM, amounting to 9,347,573 Euros (2012: 9,953,983 Euros).
The movements in Other changes in equity for the Group and in an individual basis, for 2013 and 2012, are analysed as follows:
The other changes caption, registers the reclassification of retained earnings of the deferred tax associated to subsidies recognised in equity in the amount of 750,690 Euros following the change occurred in FAQ 13, as described in Note 2.3.
24. Other changes in equityThe balance Other changes in equity is analysed as follows:
22. Financial assets adjustmentsThis balance is analysed as follows:
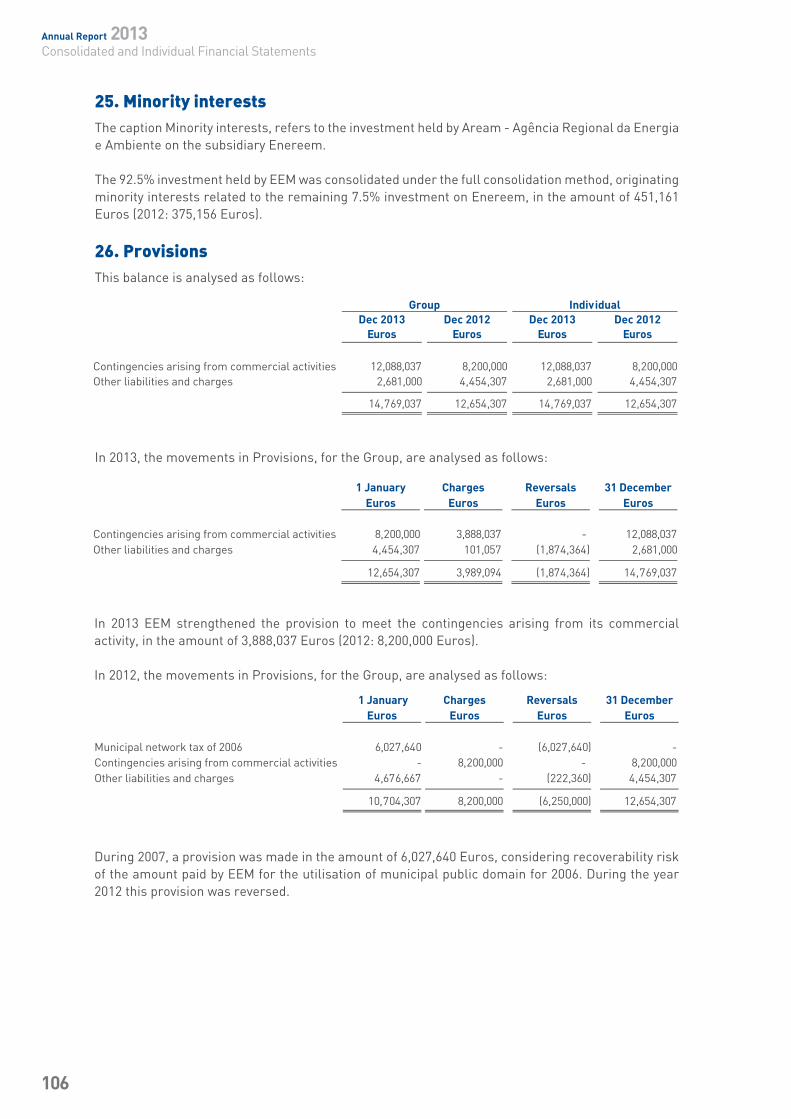
Annual Report 2013Consolidated and Individual Financial Statements
106
25. Minority interestsThe caption Minority interests, refers to the investment held by Aream - Agência Regional da Energia e Ambiente on the subsidiary Enereem.
The 92.5% investment held by EEM was consolidated under the full consolidation method, originating minority interests related to the remaining 7.5% investment on Enereem, in the amount of 451,161 Euros (2012: 375,156 Euros).
26. ProvisionsThis balance is analysed as follows:
In 2013, the movements in Provisions, for the Group, are analysed as follows:
In 2013 EEM strengthened the provision to meet the contingencies arising from its commercial activity, in the amount of 3,888,037 Euros (2012: 8,200,000 Euros).
In 2012, the movements in Provisions, for the Group, are analysed as follows:
During 2007, a provision was made in the amount of 6,027,640 Euros, considering recoverability risk of the amount paid by EEM for the utilisation of municipal public domain for 2006. During the year 2012 this provision was reversed.
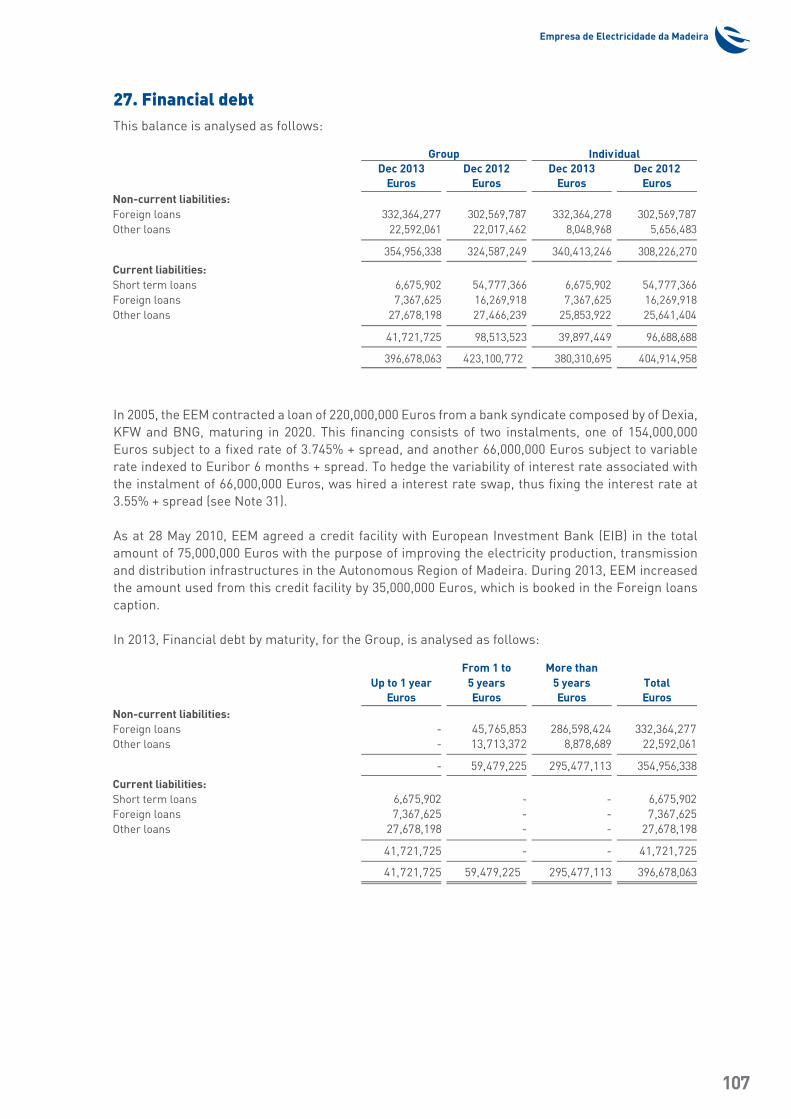
Empresa de Electricidade da Madeira
107
27. Financial debtThis balance is analysed as follows:
In 2005, the EEM contracted a loan of 220,000,000 Euros from a bank syndicate composed by of Dexia, KFW and BNG, maturing in 2020. This financing consists of two instalments, one of 154,000,000 Euros subject to a fixed rate of 3.745% + spread, and another 66,000,000 Euros subject to variable rate indexed to Euribor 6 months + spread. To hedge the variability of interest rate associated with the instalment of 66,000,000 Euros, was hired a interest rate swap, thus fixing the interest rate at 3.55% + spread (see Note 31).
As at 28 May 2010, EEM agreed a credit facility with European Investment Bank (EIB) in the total amount of 75,000,000 Euros with the purpose of improving the electricity production, transmission and distribution infrastructures in the Autonomous Region of Madeira. During 2013, EEM increased the amount used from this credit facility by 35,000,000 Euros, which is booked in the Foreign loans caption.
In 2013, Financial debt by maturity, for the Group, is analysed as follows:
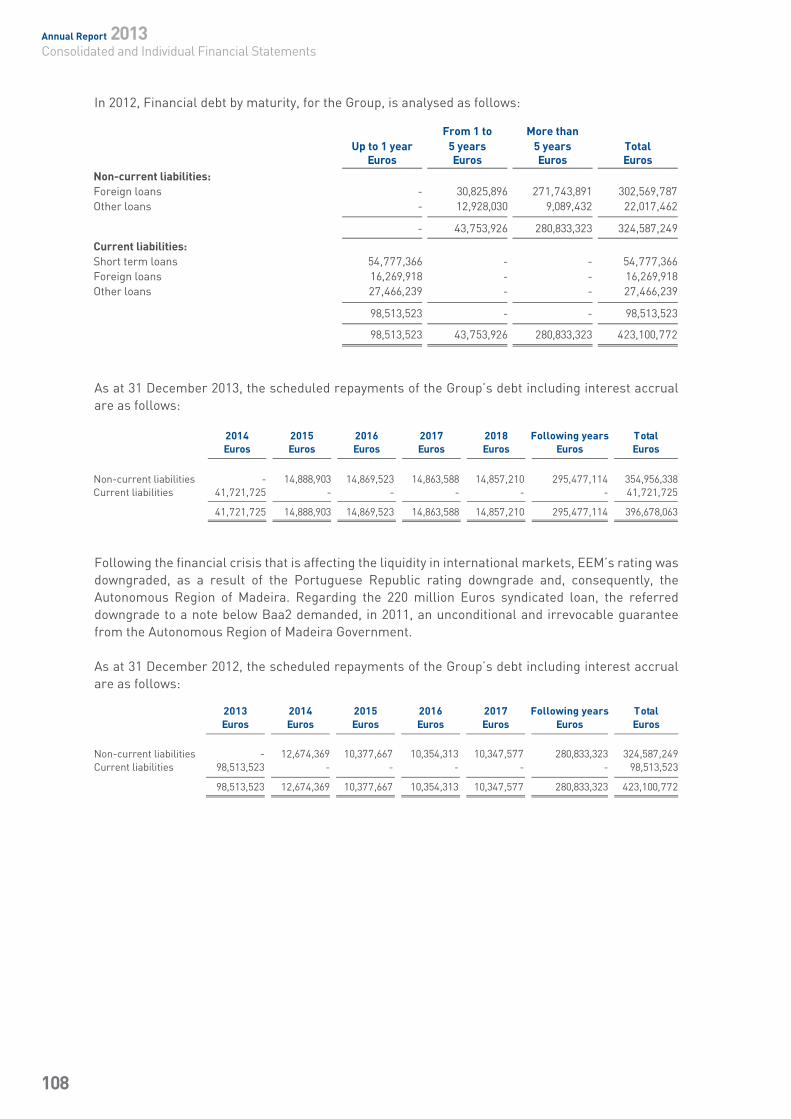
Annual Report 2013Consolidated and Individual Financial Statements
108
In 2012, Financial debt by maturity, for the Group, is analysed as follows:
As at 31 December 2013, the scheduled repayments of the Group’s debt including interest accrual are as follows:
Following the financial crisis that is affecting the liquidity in international markets, EEM’s rating wasdowngraded, as a result of the Portuguese Republic rating downgrade and, consequently, the Autonomous Region of Madeira. Regarding the 220 million Euros syndicated loan, the referred downgrade to a note below Baa2 demanded, in 2011, an unconditional and irrevocable guarantee from the Autonomous Region of Madeira Government.
As at 31 December 2012, the scheduled repayments of the Group’s debt including interest accrual are as follows:
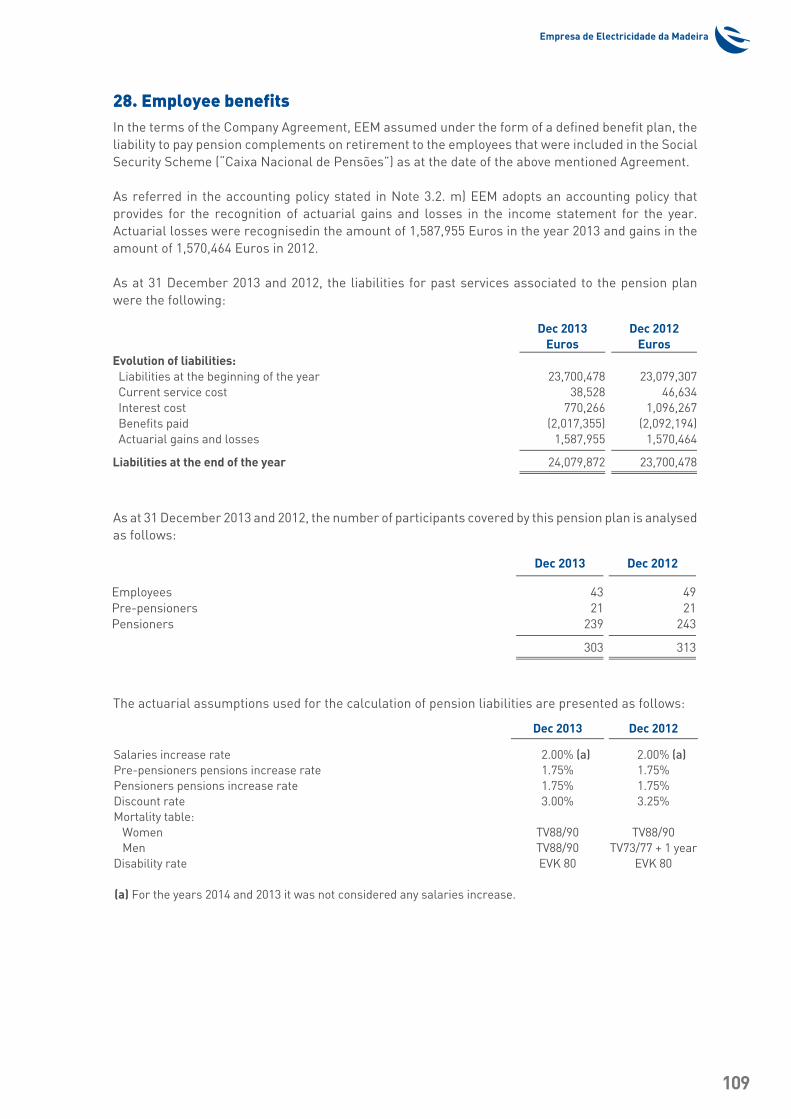
Empresa de Electricidade da Madeira
109
28. Employee benefitsIn the terms of the Company Agreement, EEM assumed under the form of a defined benefit plan, the liability to pay pension complements on retirement to the employees that were included in the Social Security Scheme (“Caixa Nacional de Pensões”) as at the date of the above mentioned Agreement.
As referred in the accounting policy stated in Note 3.2. m) EEM adopts an accounting policy that provides for the recognition of actuarial gains and losses in the income statement for the year. Actuarial losses were recognisedin the amount of 1,587,955 Euros in the year 2013 and gains in the amount of 1,570,464 Euros in 2012.
As at 31 December 2013 and 2012, the liabilities for past services associated to the pension plan were the following:
As at 31 December 2013 and 2012, the number of participants covered by this pension plan is analysed as follows:
The actuarial assumptions used for the calculation of pension liabilities are presented as follows:
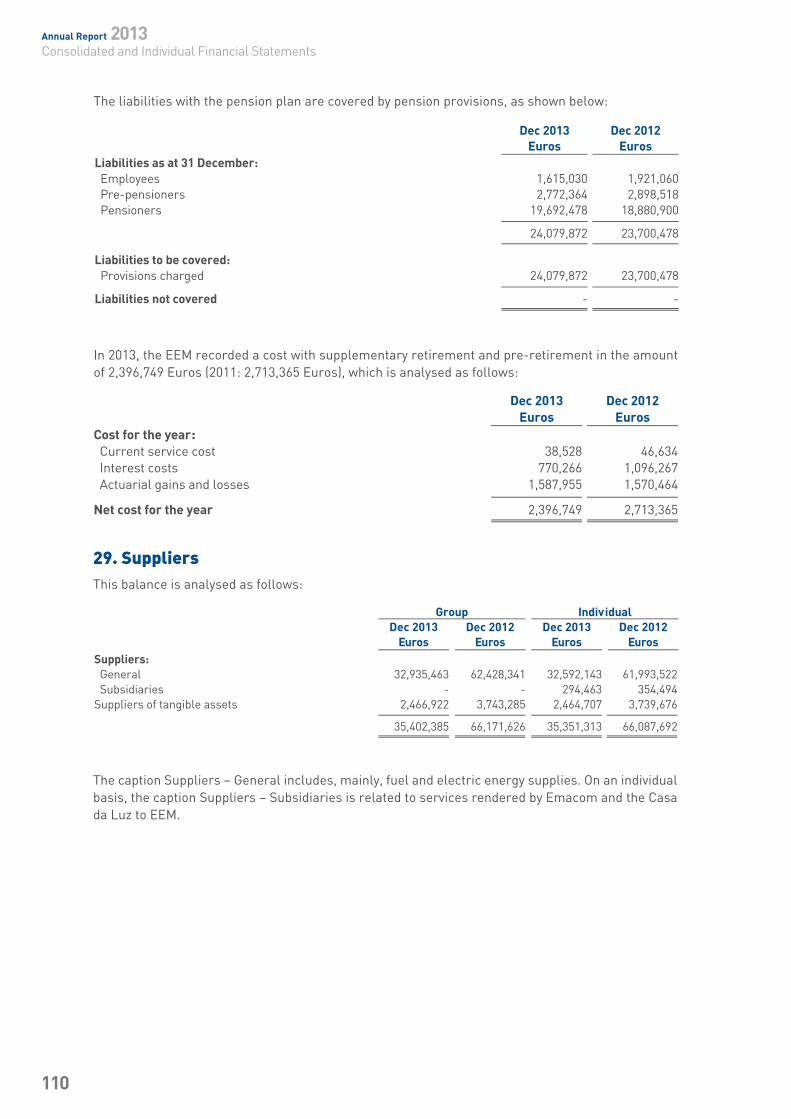
Annual Report 2013Consolidated and Individual Financial Statements
110
The liabilities with the pension plan are covered by pension provisions, as shown below:
In 2013, the EEM recorded a cost with supplementary retirement and pre-retirement in the amount of 2,396,749 Euros (2011: 2,713,365 Euros), which is analysed as follows:
29. SuppliersThis balance is analysed as follows:
The caption Suppliers – General includes, mainly, fuel and electric energy supplies. On an individual basis, the caption Suppliers – Subsidiaries is related to services rendered by Emacom and the Casa da Luz to EEM.
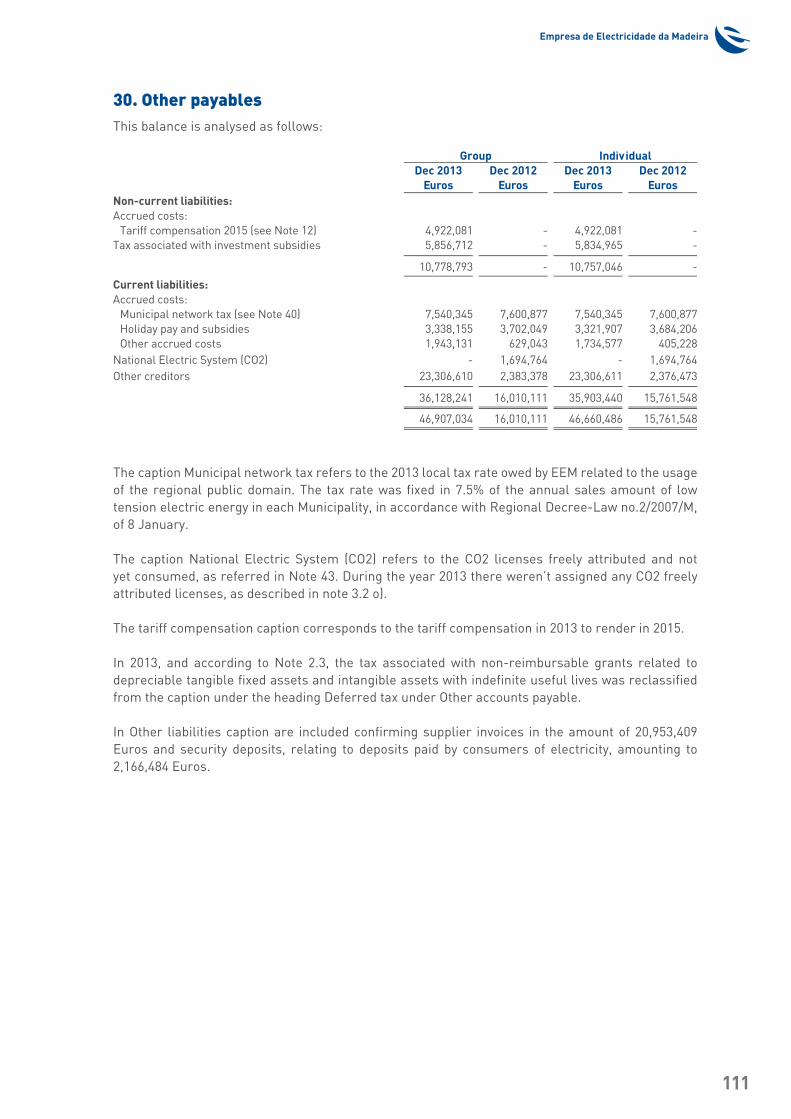
Empresa de Electricidade da Madeira
111
The caption Municipal network tax refers to the 2013 local tax rate owed by EEM related to the usage of the regional public domain. The tax rate was fixed in 7.5% of the annual sales amount of low tension electric energy in each Municipality, in accordance with Regional Decree-Law no.2/2007/M, of 8 January.
The caption National Electric System (CO2) refers to the CO2 licenses freely attributed and not yet consumed, as referred in Note 43. During the year 2013 there weren’t assigned any CO2 freely attributed licenses, as described in note 3.2 o).
The tariff compensation caption corresponds to the tariff compensation in 2013 to render in 2015.
In 2013, and according to Note 2.3, the tax associated with non-reimbursable grants related to depreciable tangible fixed assets and intangible assets with indefinite useful lives was reclassified from the caption under the heading Deferred tax under Other accounts payable.
In Other liabilities caption are included confirming supplier invoices in the amount of 20,953,409 Euros and security deposits, relating to deposits paid by consumers of electricity, amounting to 2,166,484 Euros.
30. Other payablesThis balance is analysed as follows:
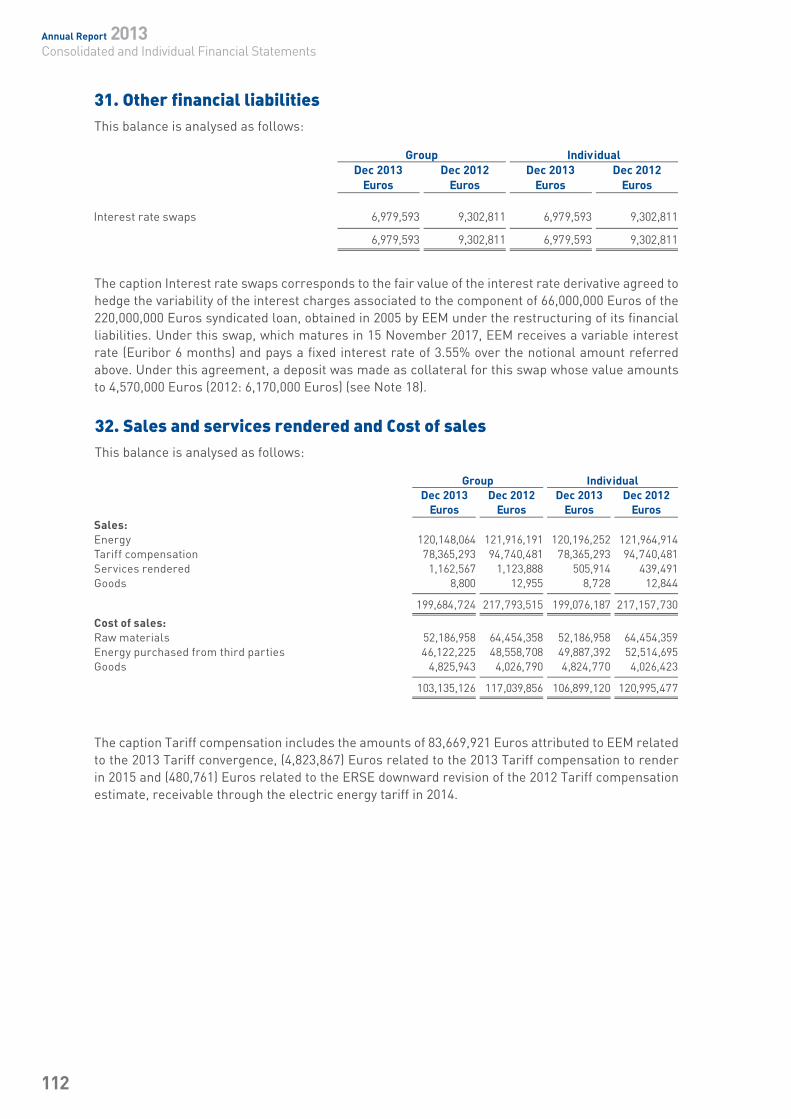
Annual Report 2013Consolidated and Individual Financial Statements
112
32. Sales and services rendered and Cost of salesThis balance is analysed as follows:
The caption Tariff compensation includes the amounts of 83,669,921 Euros attributed to EEM related to the 2013 Tariff convergence, (4,823,867) Euros related to the 2013 Tariff compensation to render in 2015 and (480,761) Euros related to the ERSE downward revision of the 2012 Tariff compensation estimate, receivable through the electric energy tariff in 2014.
The caption Interest rate swaps corresponds to the fair value of the interest rate derivative agreed to hedge the variability of the interest charges associated to the component of 66,000,000 Euros of the 220,000,000 Euros syndicated loan, obtained in 2005 by EEM under the restructuring of its financial liabilities. Under this swap, which matures in 15 November 2017, EEM receives a variable interest rate (Euribor 6 months) and pays a fixed interest rate of 3.55% over the notional amount referred above. Under this agreement, a deposit was made as collateral for this swap whose value amounts to 4,570,000 Euros (2012: 6,170,000 Euros) (see Note 18).
31. Other financial liabilitiesThis balance is analysed as follows:
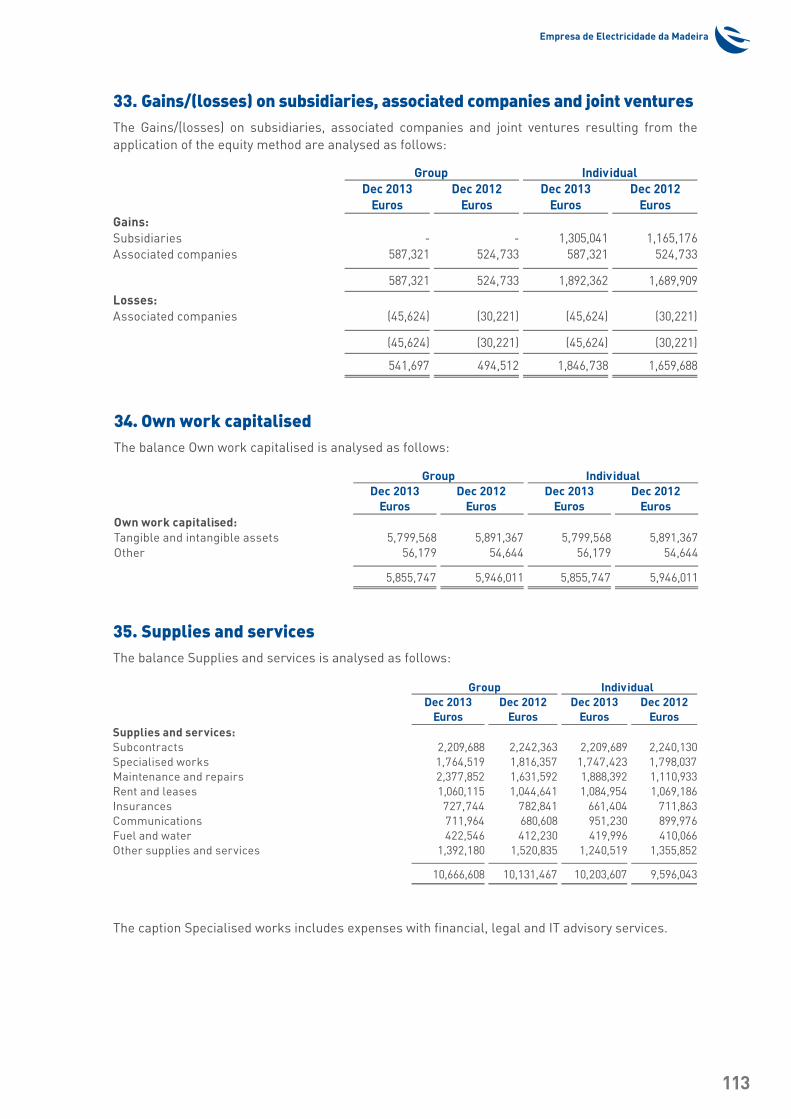
Empresa de Electricidade da Madeira
113
33. Gains/(losses) on subsidiaries, associated companies and joint venturesThe Gains/(losses) on subsidiaries, associated companies and joint ventures resulting from the application of the equity method are analysed as follows:
34. Own work capitalisedThe balance Own work capitalised is analysed as follows:
35. Supplies and servicesThe balance Supplies and services is analysed as follows:
The caption Specialised works includes expenses with financial, legal and IT advisory services.
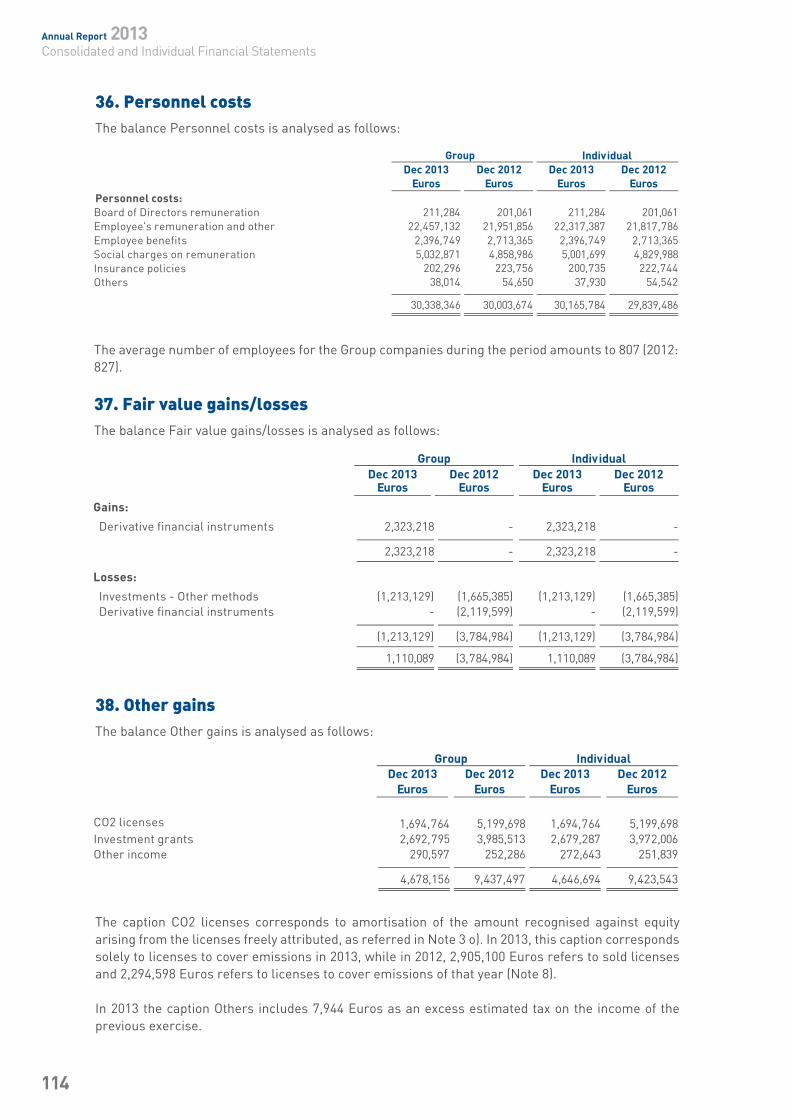
Annual Report 2013Consolidated and Individual Financial Statements
114
36. Personnel costsThe balance Personnel costs is analysed as follows:
The average number of employees for the Group companies during the period amounts to 807 (2012: 827).
37. Fair value gains/lossesThe balance Fair value gains/losses is analysed as follows:
The caption CO2 licenses corresponds to amortisation of the amount recognised against equity arising from the licenses freely attributed, as referred in Note 3 o). In 2013, this caption corresponds solely to licenses to cover emissions in 2013, while in 2012, 2,905,100 Euros refers to sold licenses and 2,294,598 Euros refers to licenses to cover emissions of that year (Note 8).
In 2013 the caption Others includes 7,944 Euros as an excess estimated tax on the income of the previous exercise.
38. Other gainsThe balance Other gains is analysed as follows:
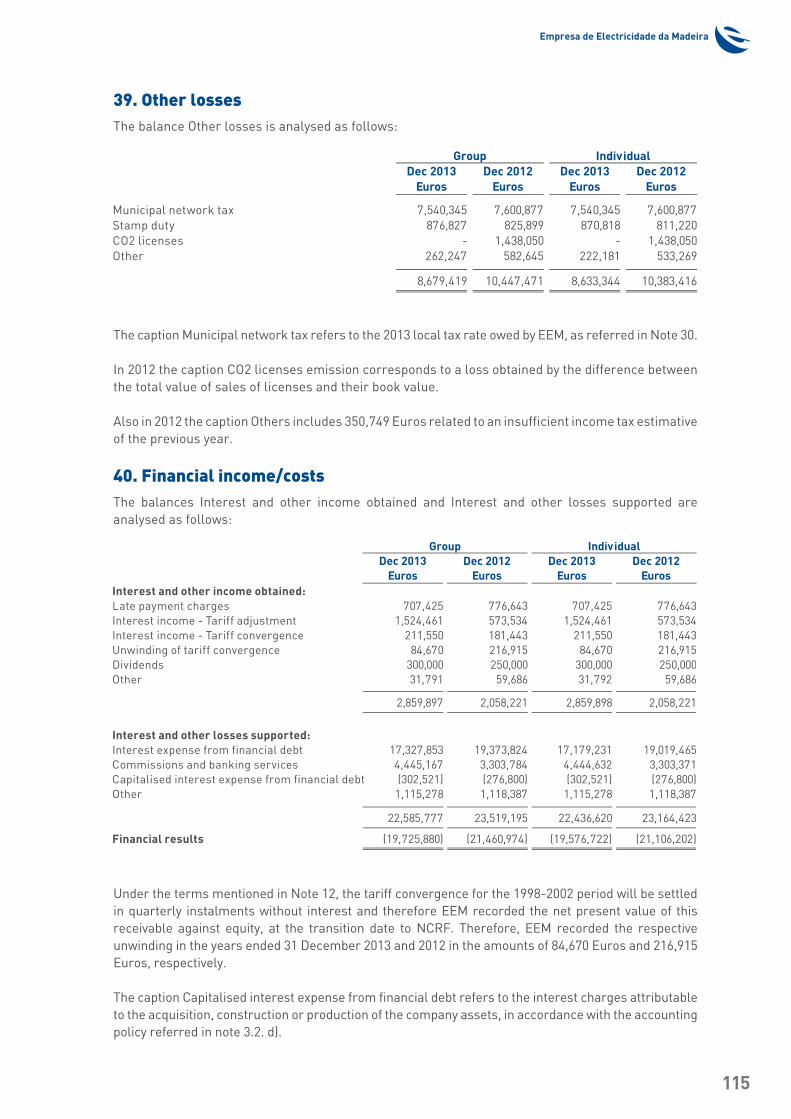
Empresa de Electricidade da Madeira
115
39. Other lossesThe balance Other losses is analysed as follows:
The caption Municipal network tax refers to the 2013 local tax rate owed by EEM, as referred in Note 30.
In 2012 the caption CO2 licenses emission corresponds to a loss obtained by the difference between the total value of sales of licenses and their book value.
Also in 2012 the caption Others includes 350,749 Euros related to an insufficient income tax estimative of the previous year.
40. Financial income/costsThe balances Interest and other income obtained and Interest and other losses supported are analysed as follows:
Under the terms mentioned in Note 12, the tariff convergence for the 1998-2002 period will be settled in quarterly instalments without interest and therefore EEM recorded the net present value of this receivable against equity, at the transition date to NCRF. Therefore, EEM recorded the respective unwinding in the years ended 31 December 2013 and 2012 in the amounts of 84,670 Euros and 216,915 Euros, respectively.
The caption Capitalised interest expense from financial debt refers to the interest charges attributable to the acquisition, construction or production of the company assets, in accordance with the accounting policy referred in note 3.2. d).
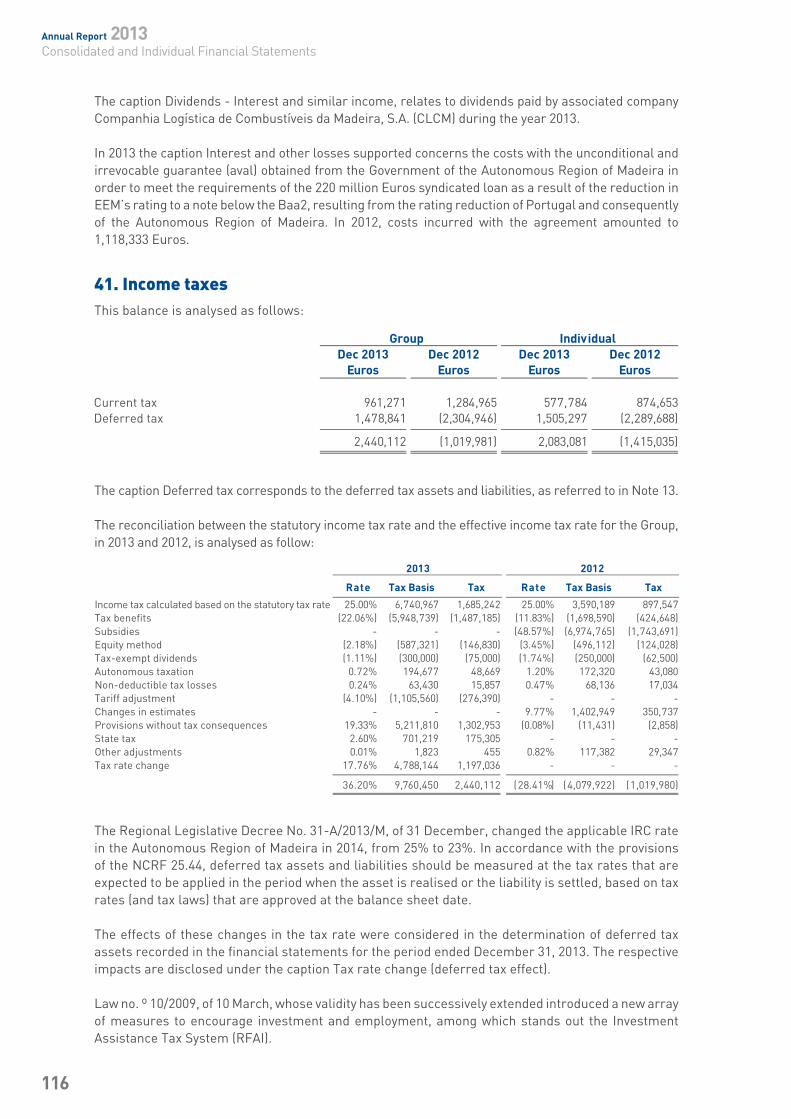
Annual Report 2013Consolidated and Individual Financial Statements
116
The caption Deferred tax corresponds to the deferred tax assets and liabilities, as referred to in Note 13.
The reconciliation between the statutory income tax rate and the effective income tax rate for the Group, in 2013 and 2012, is analysed as follow:
The Regional Legislative Decree No. 31-A/2013/M, of 31 December, changed the applicable IRC rate in the Autonomous Region of Madeira in 2014, from 25% to 23%. In accordance with the provisions of the NCRF 25.44, deferred tax assets and liabilities should be measured at the tax rates that are expected to be applied in the period when the asset is realised or the liability is settled, based on tax rates (and tax laws) that are approved at the balance sheet date.
The effects of these changes in the tax rate were considered in the determination of deferred tax assets recorded in the financial statements for the period ended December 31, 2013. The respective impacts are disclosed under the caption Tax rate change (deferred tax effect).
Law no. º 10/2009, of 10 March, whose validity has been successively extended introduced a new array of measures to encourage investment and employment, among which stands out the Investment Assistance Tax System (RFAI).
The caption Dividends - Interest and similar income, relates to dividends paid by associated company Companhia Logística de Combustíveis da Madeira, S.A. (CLCM) during the year 2013.
In 2013 the caption Interest and other losses supported concerns the costs with the unconditional andirrevocable guarantee (aval) obtained from the Government of the Autonomous Region of Madeira in order to meet the requirements of the 220 million Euros syndicated loan as a result of the reduction in EEM’s rating to a note below the Baa2, resulting from the rating reduction of Portugal and consequently of the Autonomous Region of Madeira. In 2012, costs incurred with the agreement amounted to 1,118,333 Euros.
41. Income taxesThis balance is analysed as follows:
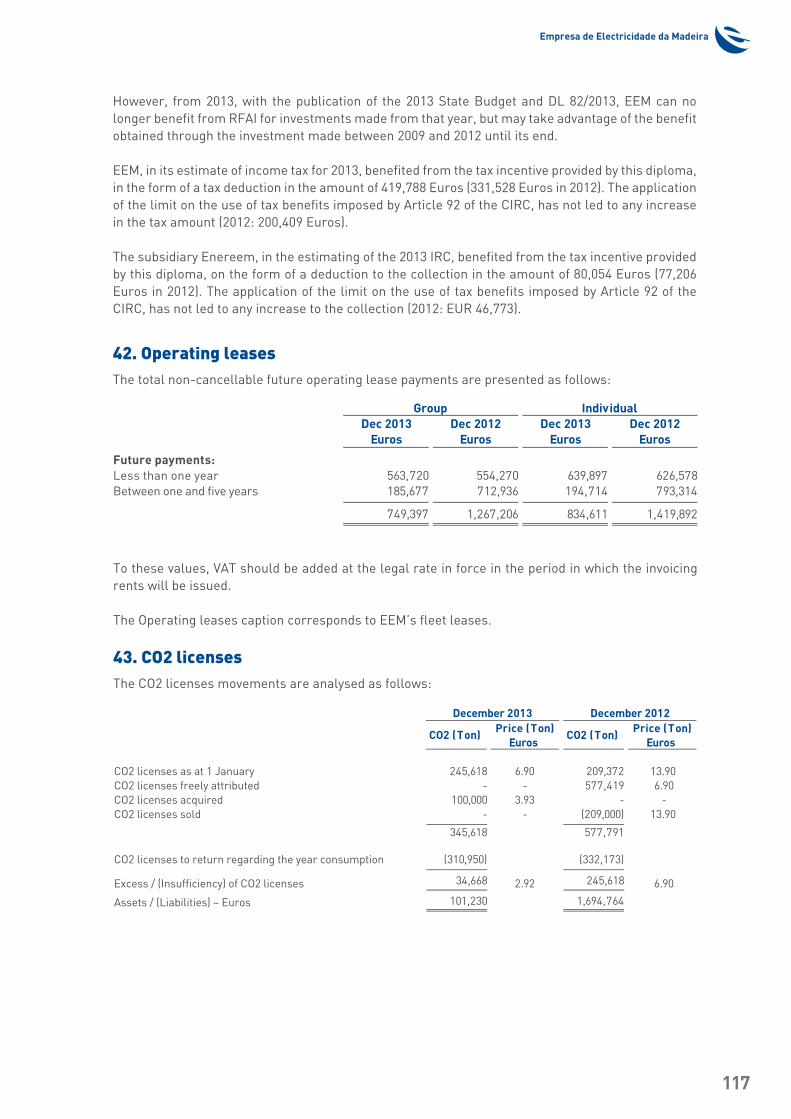
Empresa de Electricidade da Madeira
117
However, from 2013, with the publication of the 2013 State Budget and DL 82/2013, EEM can no longer benefit from RFAI for investments made from that year, but may take advantage of the benefit obtained through the investment made between 2009 and 2012 until its end.
EEM, in its estimate of income tax for 2013, benefited from the tax incentive provided by this diploma, in the form of a tax deduction in the amount of 419,788 Euros (331,528 Euros in 2012). The application of the limit on the use of tax benefits imposed by Article 92 of the CIRC, has not led to any increase in the tax amount (2012: 200,409 Euros).
The subsidiary Enereem, in the estimating of the 2013 IRC, benefited from the tax incentive provided by this diploma, on the form of a deduction to the collection in the amount of 80,054 Euros (77,206 Euros in 2012). The application of the limit on the use of tax benefits imposed by Article 92 of the CIRC, has not led to any increase to the collection (2012: EUR 46,773).
42. Operating leasesThe total non-cancellable future operating lease payments are presented as follows:
To these values, VAT should be added at the legal rate in force in the period in which the invoicing rents will be issued.
The Operating leases caption corresponds to EEM’s fleet leases.
43. CO2 licensesThe CO2 licenses movements are analysed as follows:
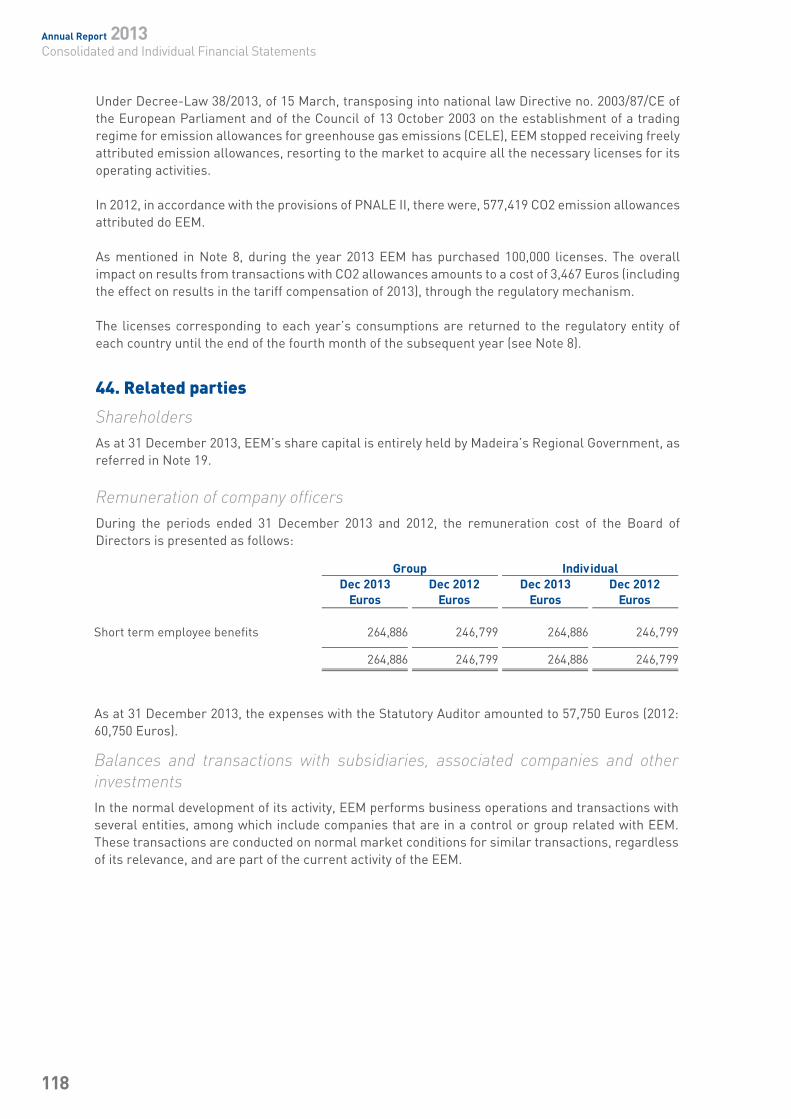
Annual Report 2013Consolidated and Individual Financial Statements
118
Under Decree-Law 38/2013, of 15 March, transposing into national law Directive no. 2003/87/CE of the European Parliament and of the Council of 13 October 2003 on the establishment of a trading regime for emission allowances for greenhouse gas emissions (CELE), EEM stopped receiving freely attributed emission allowances, resorting to the market to acquire all the necessary licenses for its operating activities.
In 2012, in accordance with the provisions of PNALE II, there were, 577,419 CO2 emission allowances attributed do EEM.
As mentioned in Note 8, during the year 2013 EEM has purchased 100,000 licenses. The overall impact on results from transactions with CO2 allowances amounts to a cost of 3,467 Euros (including the effect on results in the tariff compensation of 2013), through the regulatory mechanism.
The licenses corresponding to each year’s consumptions are returned to the regulatory entity of each country until the end of the fourth month of the subsequent year (see Note 8).
44. Related parties
ShareholdersAs at 31 December 2013, EEM’s share capital is entirely held by Madeira’s Regional Government, as referred in Note 19.
RemunerationofcompanyofficersDuring the periods ended 31 December 2013 and 2012, the remuneration cost of the Board of Directors is presented as follows:
As at 31 December 2013, the expenses with the Statutory Auditor amounted to 57,750 Euros (2012: 60,750 Euros).
Balances and transactions with subsidiaries, associated companies and other investmentsIn the normal development of its activity, EEM performs business operations and transactions with several entities, among which include companies that are in a control or group related with EEM. These transactions are conducted on normal market conditions for similar transactions, regardless of its relevance, and are part of the current activity of the EEM.
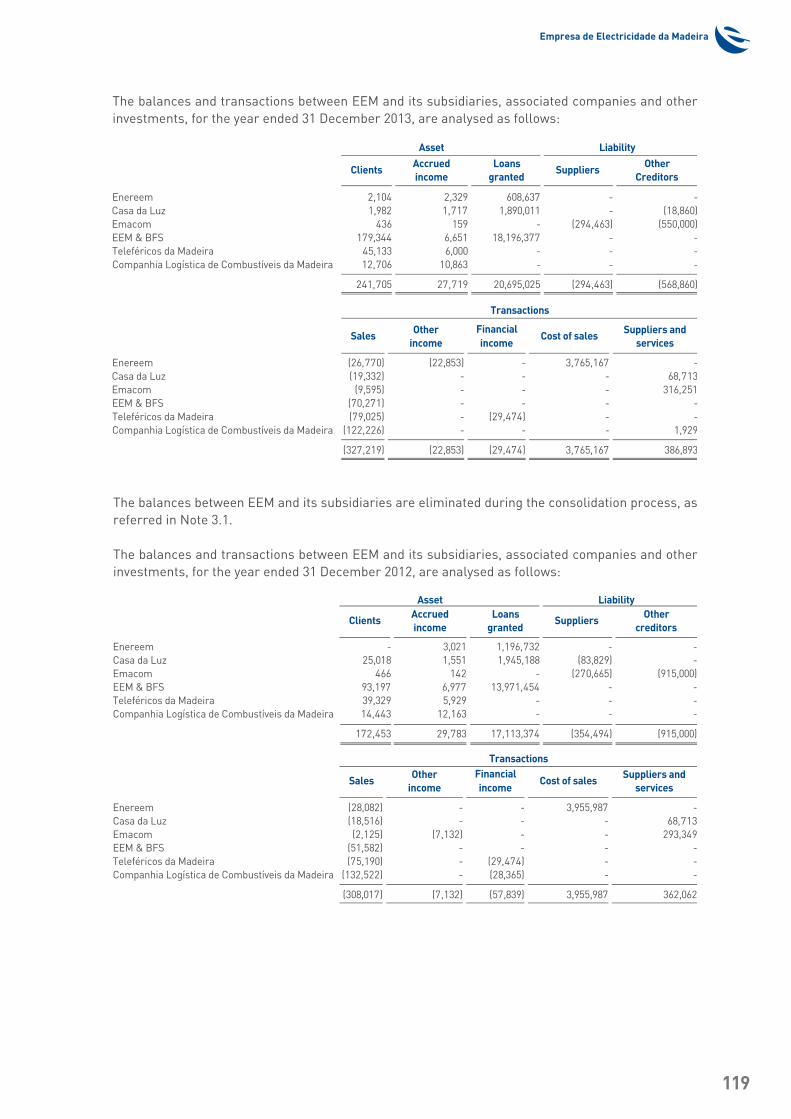
Empresa de Electricidade da Madeira
119
The balances between EEM and its subsidiaries are eliminated during the consolidation process, as referred in Note 3.1.
The balances and transactions between EEM and its subsidiaries, associated companies and other investments, for the year ended 31 December 2012, are analysed as follows:
The balances and transactions between EEM and its subsidiaries, associated companies and other investments, for the year ended 31 December 2013, are analysed as follows:
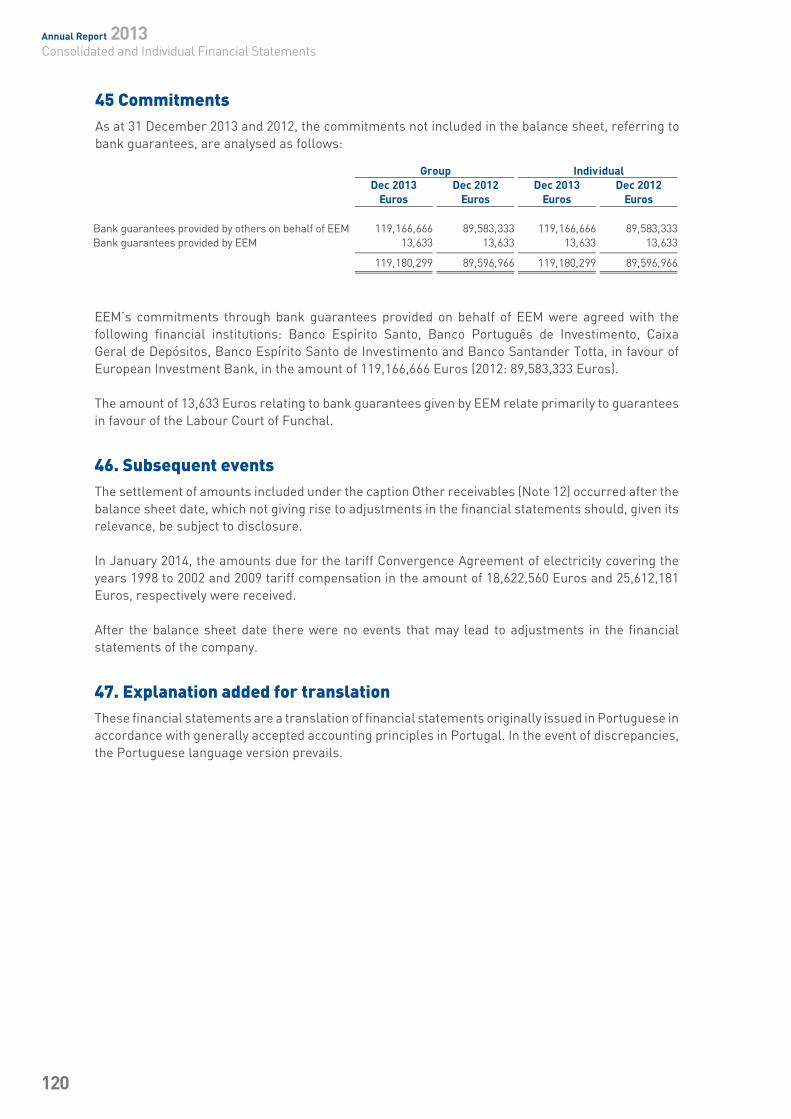
Annual Report 2013Consolidated and Individual Financial Statements
120
45 CommitmentsAs at 31 December 2013 and 2012, the commitments not included in the balance sheet, referring to bank guarantees, are analysed as follows:
EEM’s commitments through bank guarantees provided on behalf of EEM were agreed with the following financial institutions: Banco Espírito Santo, Banco Português de Investimento, Caixa Geral de Depósitos, Banco Espírito Santo de Investimento and Banco Santander Totta, in favour of European Investment Bank, in the amount of 119,166,666 Euros (2012: 89,583,333 Euros).
The amount of 13,633 Euros relating to bank guarantees given by EEM relate primarily to guarantees in favour of the Labour Court of Funchal.
46. Subsequent eventsThe settlement of amounts included under the caption Other receivables (Note 12) occurred after the balance sheet date, which not giving rise to adjustments in the financial statements should, given its relevance, be subject to disclosure.
In January 2014, the amounts due for the tariff Convergence Agreement of electricity covering the years 1998 to 2002 and 2009 tariff compensation in the amount of 18,622,560 Euros and 25,612,181 Euros, respectively were received.
After the balance sheet date there were no events that may lead to adjustments in the financial statements of the company.
47. Explanation added for translationThese financial statements are a translation of financial statements originally issued in Portuguese in accordance with generally accepted accounting principles in Portugal. In the event of discrepancies, the Portuguese language version prevails.
Statutory Auditor’s ReportConsolidatedFinancial Statements
122
Annual Report 2013Statutory Auditor’s Report Consolidated Financial Statements
Empresa de Electricidade da Madeira
123
124
Annual Report 2013Statutory Auditor’s Report Consolidated Financial Statements
Empresa de Electricidade da Madeira
125
126
Annual Report 2013Statutory Auditor’s Report Consolidated Financial Statements
Extract of the Minuteof the GeneralAssembly Meeting
128
MINUTE NUMBER THIRTY TWO
- «On the thirtieth of April of two thousand and fourteen at ten o’clock AM, in accordance with paragraph one of the 376th article of the Commercial Companies Code, the General Assembly of the EEM – Empresa de Electricidade da Madeira, S.A., was gathered in its headquarters at Avenida do Mar e das Comunidades Madeirenses, number thirty-two, in Funchal, a collective entity registered in the Commercial Registry of Funchal number 511010435.
At the meeting there were present the President of the General Assembly, Dr. Maria de Fátima Castro Fernandes e Freitas, the Vice-President of the General Assembly, Dr. Rui Antero Fernandes Pestana, the Secretary of the General Assembly, Dr. Ana Cristina Dantas Andrade, the members of the Executive Board, Dr. Rui Alberto Faria Rebelo and Engineer Mário Eugénio Jardim Fernandes, as well as the single shareholder, the Autonomous Region of Madeira, represented by Dr. Paulo Jorge Figueiroa de França Gomes, representing the total Share capital, valued at twenty million Euros, for which reasons the General Assembly has gathered the necessary quorum to operate and deliberate according to legal terms and regarding the following order of tasks:
POINT ONE: The Annual Report of 2013;
POINT TWO: Deliberate on application of net profits;
POINT THREE: Management Report and Consolidated Accounts of 2013;
POINT FOUR: Deliberate on the general assessment of the administration and fiscal supervision. - Once the session was opened, the members of the Executive Board of EEM – Empresa de
Electricidade da Madeira S.A., presented the Annual Report of 2013 as well as the proposal for the application of results, which was proposed the following application of net income for the year amounting to 4,174,217.67 €:
Retained Earnings: 3,756,795.90 € Statutory Reserve: 417,421.77 €
- Once the document in question was appreciated and the proposal presented, it was resolved unanimously to approve it.
- Regarding point three, the Executive Board of EEM presented the Annual Report and Consolidated Accounts of 2013, with the net income of the year, amounting to 4,204,531.14 € of which 4,127,908.43 € are attributable to the EEM. After proper consideration it was resolved to approve them unanimously.
- Regarding point four, the Autonomous Region of Madeira, single shareholder of EEM, represented by Dr. Paulo Jorge Figueiroa de França Gomes reaffirmed its confidence in the Executive Board of the company and in its fiscal supervisors.
- As no other issues were there to be discussed, the meeting was closed and the present minute written, which, after having been read and approved, was properly signed.»
Annual Report 2013Extract of the Minute of the General Assembly Meeting