
UNIVERSIDADE ESTADUAL PAULISTA INSTITUTO DE BIOCIÊNCIAS DEPARTAMENTO DE GENÉTICA
CAMPUS DE BOTUCATU
CONSTRUÇÃO DE MAPA DE LIGAÇÃO PARA O GENOMA B DE ARACHIS
UTLIZANDO MARCADOR RAPD.
WALDEMIR PINTO DE OLIVEIRA
BOTUCATU – SP
2006

CONSTRUÇÃO DE MAPA DE LIGAÇÃO PARA O GENOMA B DE ARACHIS
UTLIZANDO MARCADOR RAPD.
WALDEMIR PINTO DE OLIVEIRA
ORIENTADOR: Prof. Dr. Marcos Aparecido Gimenes
BOTUCATU – SP
2006
Dissertação apresentada à UniversidadeEstadual Paulista “Júlio de MesquitaFilho”, UNESP, para a obtenção do Títulode Mestre em Ciências Biológicas, Área
de Concentração: Genética

Aos meus pais e irmãos, pelo apoio, carinho, compreensão e confiança,
Aos amigos pelo aprendizado e apoio,
A Deus, pelos amigos, pela minha família e por minha vida.
DEDICO.
AGRADECIMENTOS
Ao Prof. Dr. Marcos Aparecido Gimenes, pela orientação, dedicação, apoio
e a oportunidade oferecida.
A Dra Catalina Romero Lopes, coordenadora do grupo, pelas contribuições,
dedicação e apoio.
Aos pós-graduandos do grupo, Adriana, Akemi, Edna e Marcelo, e a
estagiária Luciana (Jambú), pela amizade e colaboração em todo o período em
que esse trabalho foi realizado.
Aos pós-graduandos que concluíram seus doutorados nesse período,
Andréa, Paula e Tatiany, pelo apoio e amizade.
Ao Eder Jorge de Oliveira do Instituto Agronômico de Campinas, pela ajuda
nas análises dos dados.
Ao pós-graduando Júlio e a estagiaria Vanusa pela amizade e apoio na
manutenção de casa de vegetação nesse ultimo ano.
Aos amigos e funcionários do Departamento de Genética, do Departamento
de Botânica e do Instituto de Biociências da UNESP – Campus de Botucatu.
Ao CNPq, pela bolsa concedida, à FAPESP e ao PRODETAB, pelo auxílio
financeiro na realização do projeto.

Índice
Resumo.........................................................................................................1
Abstract.........................................................................................................2
1. Introdução.................................................................................................3
1.1. Objetivo.....................................................................................10
2. Materiais e Métodos ..............................................................................11
2.1. Obtenção de material vegetal ................................................11
2.2. Extração de DNA ......................................................................11
2.3. Reações de PCR ......................................................................11
2.4. Análise de dados .....................................................................13
2.5. Construção do mapa ...............................................................13
3. Resultados .............................................................................................14
3.1. Amplificação de locos de RAPDs...........................................14
3.2. Mapa de ligação .......................................................................15
4. Discussão ..............................................................................................17
4.1. Locos distorcidos ....................................................................17
4.2. Mapa de ligação .......................................................................20
5. Conclusões ............................................................................................24
6. Referências ............................................................................................25
7. Tabelas ...................................................................................................40
Tabela 1............................................................................................40
Tabela 2............................................................................................41
Tabela 3 ...........................................................................................42
8. Figura 1...................................................................................................43

Artigo em inglês.........................................................................................45
Abstract .....................................................................................................46
1. Introdution .............................................................................................47
1.1. Objective ...................................................................................53
2. Material and Methods ............................................................................54
2.1. Plant material ...........................................................................54
2.2. DNA extraction .........................................................................54
2.3. PCR reactions ..........................................................................55
2.4. Data Analyses ..........................................................................56
2.5. Linkage map construction ......................................................56
3. Results ...................................................................................................57
3.1. RAPD amplifications ...............................................................57
3.2. Linkage map .............................................................................58
4. Discussion .............................................................................................59
4.1 Loci distortion ...........................................................................59
4.2. Linkage map .............................................................................62
5. Conclusion .............................................................................................66
6. References .............................................................................................67
7. Tables .....................................................................................................82
Table 1 .............................................................................................82
Table 2 .............................................................................................83
Table 3 .............................................................................................84
8. Figure 1 ..................................................................................................85

1
Resumo
O amendoim (Arachis hypogaea L.) é uma espécie tetraplóide (AABB) de
grande importância econômica nos trópicos e subtrópicos, ficando entre as quatro
maiores culturas oleaginosas do mundo. Espécie essa em que o desenvolvimento
de mapa de ligação é difícil devido o nível extremamente baixo de polimorfismo
detectado. Assim, a alternativa mais adequada tem sido o uso de populações
mapa obtidas de cruzamentos entre espécies silvestres diplóides possuidoras de
genomas comprovadamente similares aos do amendoim cultivado e que
apresentam características de grande interesse para o melhoramento genético do
amendoim, como altos níveis de polimorfismo genético e resistência à várias
doenças. No presente trabalho, utilizando uma população F2 de 108 indivíduos do
cruzamento entre duas espécies silvestres [A. ipaënsis (KG30076) e A. magna
(KG30097)] do genoma B similar ao de A. hypogaea, entre as quais o nível de
polimorfismo encontrado ficou bem abaixo do esperado (23,6%), foi gerado um
mapa com 139 marcadores RAPDs e oito microssatélites distribuídos em 12
grupos de ligação, cobrindo 2.061,2 cM do genoma e uma distância média entre
os marcadores de 12,8 cM. O mapa de ligação apresentado neste trabalho é o
primeiro mapa para espécies de genoma B altamente relacionadas ao genoma B
de A. hypogaea, construído com marcadores RAPD. O desenvolvimento de mapas
de ligação para cada um dos genomas de A. hypogaea é o primeiro passo na
integração de biotecnologia nos programas de melhoramento que visam
introgressão de genes das espécies silvestres para o amendoim cultivado.
2
Abstract
Arachis hypogaea L. (peanut) is one of the four most important oilseed
crops in the world. Linkage maps of A. hypogaea are difficult to be constructed
because this species presents extremely low levels of polymorphism, as detected
by the use of several different molecular markers. An alternative to obtain
information about its genome is the utilization of wild species of Arachis presenting
genomes similar to that of A. hypogaea. These species present high levels of
genetic polymorphism, traits of agronomic interest, such as resistance against
important pathogens, and high cross-ability. In this work we present a linkage map
constructed based on a F2 population of 108 individuals resulting from the cross
between two wild species of Arachis [A. ipaënsis (KG30076) e A. magna
(KG30097)] presenting the B genome similar to that of A. hypogaea. This species
showed to be very close related, as the polymorphism level observed between
than was very low (23.6%). We obtained a linkage map with 139 RAPD markers
and 8 microsatellite markers distributed onto 12 linkage groups and covering a
distance of 2,061.2 cM of the genome, with an average distance between markers
of 12,8 cM. This is the first linkage map of Arachis species possessing the B
genome and close related to A. hypogaea constructed via RAPD markers. The
development of linkage maps is a first step in the integration of the biotechnologies
to the genetic improvement via wild species of peanuts.

3
1. Introdução
O amendoim (Arachis hypogaea L.) está entre as quatro maiores culturas
oleaginosas do mundo. Sua produção ocorre principalmente em países em
desenvolvimento da África e Ásia, que são responsáveis por cerca de 80% da
produção mundial, que foi de aproximadamente de 34.198 milhões de tonelada em
2004, segundo o Agrianual de 2005. Na safra de 2004/2005, o Brasil plantou 129,5
mil hectares de amendoim (CONAB, 2005), contribuindo com aproximadamente
0,6% da produção mundial.
O amendoim cultivado é uma espécie alotetraplóide (AABB), que se
originou de um cruzamento entre duas espécies selvagens, seguido de uma rara e
espontânea duplicação de cromossomos (Halward et al., 1991; Shoemaker et al.,
1996).
Arachis hypogaea é uma das 31 espécies da seção Arachis, uma das nove
seções que compõem este gênero, que é composto no total por 80 espécies (Valls
& Simpson, 2005). A maioria das espécies da seção Arachis é diplóide e com
genomas classificados em três tipos (A, B e D). As espécies de genoma A em
geral são bastante relacionadas entre si. Por exemplo, híbridos resultantes do
cruzamento de acessos das espécies A. duranensis e A. kempff-mercadoi
apresentaram fertilidade de pólen de 72% (Tallury et al., 2005). Na meiose de
híbridos interespecíficos entre espécies de genoma A foram encontrados 10
bivalentes (Singh & Moss, 1984; Tallury et al., 2005). Já entre as espécies do
grupo de genoma B a cruzabilidade é bastante variável. Cruzamentos entre A.
batizocoi e A. ipaënsis resultaram em híbridos de baixa fertilidade (Tallury et al.,
4
2005). Já cruzamentos entre A. ipaënsis e A. magna resultaram em híbridos
altamente férteis (Gobbi et al., 2006). Com relação às associações entre as
espécies diplóides e A. hypogaea, dados citogenéticos (Fernández & Krapovickas,
1994) e moleculares (Gimenes et al., 2000; Jung et al., 2003; Moretzsohn et al.,
2004) indicam que estas são bastante variáveis. Entretanto, diferentes tipos de
evidências (Kochert et al., 1991; Krapovickas & Gregory, 1994; Fernández &
Krapovickas, 1994; Kochert et al., 1996; Jung et al., 2003; Seijo et al., 2004;
Fávero, 2004) apontam A. duranensis e A. ipaënsis como as prováveis doadoras
dos genomas A e B de A. hypogaea, respectivamente, sendo, portanto, as mais
relacionadas a ele.
O melhoramento do amendoim tem sido realizado utilizando-se
principalmente seu “pool” gênico primário (linhagens, cultivares), porém o
melhoramento por este caminho apresenta algumas limitações como, por
exemplo, a baixa variabilidade genética para caracteres de interesse entre
linhagens e cultivares (Halward et al., 1991) e o baixo polimorfismo molecular
entre acessos de A. hypogaea (Grieshammer & Wynne, 1990; Kochert et al., 1991;
Halward et al., 1992; He & Prakash, 1997; Singh et al., 1998; Hopkins et al., 1999;
Subramanian et al., 2000; Herselman, 2003; Ferguson et al., 2004; Moretzsohn et
al., 2004; Herselman et al., 2004; He et al., 2005) o que limita a utilização de
marcadores moleculares nesta espécie, e conseqüentemente o desenvolvimento
de mapas de ligação e identificação de QTLs. Portanto, no caso do amendoim seu
“pool” gênico secundário, que envolve espécies silvestres da mesma seção,
assume um papel muito importante em seu melhoramento, pois neste é
encontrado altos níveis de resistência a doenças de importância econômica

5
(Sharma et al., 1999; Pande & Narayana Rao, 2001; Kameswara Rao et al., 2003)
e, as espécies que o compõem são estritamente relacionadas ao amendoim
cultivado (Krapovickas & Gregory, 1994), podendo assim ser utilizadas em
cruzamentos com A. hypogaea. O uso do “pool” gênico secundário de A.
hypogaea ainda tem como vantagem o fato destas espécies apresentarem alto
polimorfismo detectável por diferentes marcadores moleculares como, por
exemplo, RFLP (Halward et al., 1991), RAPD (Gimenes et al., 2000; Creste et al.,
2005), AFLP (Gimenes et al., 2002) e microssatélites (Moretzsohn et al., 2004), o
que não acontece em A. hypogaea.
A transferência de características das espécies silvestres para o amendoim
cultivado pode ser realizada por meio de cruzamentos com espécies diplóides ou
com alopoliplóides sintéticos, resultantes de cruzamentos entre as espécies
diplóides. Entretanto, durante este processo também são transferidas às
progênies características indesejáveis, como baixo rendimento e qualidade inferior
da semente. Além disso, os genes de interesse podem estar ligados a genes
indesejáveis, sendo necessárias muitas gerações de retrocruzamento para
separá-los. Por exemplo, segundo Singh et al. (1991) em espécies de Arachis a
resistência a doenças é normalmente associada a características
agronomicamente indesejáveis.
A utilização de espécies silvestres no melhoramento de A. hypogaea pode
ser facilitada pela identificação de marcadores moleculares ligados a genes ou às
regiões cromossômicas de interesse. Além de monitorar a presença do gene ou
alelo de interesse, marcadores ainda permitiriam a seleção dos indivíduos mais
semelhantes ao genótipo recorrente. Deste modo, o número de ciclos de

6
retrocruzamentos necessários para a recuperação do genótipo recorrente seria
reduzido de forma acentuada, acelerando o desenvolvimento de variedades
melhoradas (Openshaw et al., 1994).
O uso de marcadores moleculares na introgressão de genes em Arachis
hypogaea tem mostrado resultados promissores. Garcia et al. (1995), utilizando
marcadores RFLPs e RAPDs, identificaram introgressão de segmentos
cromossômicos do genoma AA de A. cardenasii para o genoma AA de A.
hypogaea. Também foram identificados marcadores estritamente ligados a um
gene de resistência à nematóide (Garcia et al., 1996). A identificação de
marcadores moleculares ligados a genes de interesse pode ser realizada das
seguintes maneiras: analise de “bulks” ou mapeamento. O método de “bulks”
segregantes (BSA - “Bulked segregant analysis”) foi desenvolvido por Michelmore
et al. (1991). Trata-se de um método rápido para identificar marcadores ligados a
regiões específicas do genoma, baseado na construção de dois “bulks” de DNA
contrastantes de uma população segregante do mesmo cruzamento. Cada “bulk” é
constituído de uma mistura de DNAs de indivíduos da população com a
característica de interesse em comum entre eles, por exemplo, a construção de
um “bulk” de indivíduos resistentes e outro de indivíduos suscetíveis a uma
determinada doença, desta forma todos os indivíduos que compõem um “bulk”
compartilham uma mesma região genômica que contém o gene de interesse e
segregam para as demais regiões. Assim, o marcador que co-segregar com os
“bulks” tem uma grande probabilidade de estar ligado à característica avaliada. A
outra maneira de identificar marcadores ligados a regiões de interesse do genoma
é por meio de mapas de ligação. Está metodologia tem como desvantagens em

7
relação ao “Bulk”, a necessidade do uso de um número maior de marcadores para
obter um mapa informativo (média de 2,5 a 6,0 cM, entre marcadores) e a
necessidade da análise individual de cada integrante dessa população. Porém
esse método é considerado uma das aplicações de maior impacto da tecnologia
de marcadores moleculares na análise genética de espécies e, potencialmente, no
melhoramento de plantas (Faleiro et al., 2003). No contexto do melhoramento de
plantas, os mapas genéticos possibilitam a cobertura e análise completa do
genomas, a decomposição de características genéticas complexas nos seus
componentes mendelianos, a localização de regiões genômicas que controlam
caracteres de importância, a quantificação do efeito dessas regiões na
característica estudada e a canalização de toda essa informação para uso em
programas de melhoramento (Ferreira & Grattapaglia, 1998).
A obtenção de mapas de ligação por meio do uso de populações
segregantes é difícil em A. hypogaea, devido ao nível extremamente baixo de
polimorfismo detectado nesta espécie pelos diferentes tipos de marcadores
moleculares (Grieshammer & Wynne, 1990; Kochert et al., 1991; Halward et al.,
1992; He & Prakash, 1997; Singh et al., 1998; Hopkins et al., 1999; Subramanian
et al., 2000; Herselman, 2003; Herselman et al., 2004; Ferguson et al., 2004;
Moretzsohn et al., 2004; He et al., 2005). Por outro lado, a obtenção de
populações segregantes utilizando espécies silvestres de Arachis pode ser
realizada com relativa facilidade, uma vez que estas apresentam altos níveis de
polimorfismo genético (Gimenes et al., 2000; Moretzsohn et al., 2004; Gimenes et
al., 2002; Creste et al., 2005), características de grande interesse agronômico,
(Sharma et al., 1999; Pande & Narayana Rao, 2001; Kameswara Rao et al., 2003)

8
e alta cruzabilidade (Fávero, 2004; Tallury et al., 2005), o que permite a obtenção
de populações a partir de parentais altamente contrastantes.
Até o momento poucos mapas de ligação foram publicados para espécies
do gênero Arachis. Halward et al. (1993) desenvolveram um mapa de ligação
baseado em RFLPs usando uma população F2 derivada de um cruzamento entre
duas espécies diplóides possuidoras do genoma AA (A. stenosperma e A.
cardenasii). Um total de 117 locos foi mapeado em 11 grupos de ligação, cobrindo
aproximadamente 1063 cM do genoma. Burow et al. (1996) desenvolveram uma
linhagem TxAg-7 por meio do cruzamento de A. hypogaea var. Florunner com [A.
batizocoi x (A. cardenasii x A. diogoi)]x4. Esta linhagem TxAg-7 foi utilizada como
parental para gerar uma população BC4F2, que foi utilizada para a identificação de
três marcadores RAPDs associados à resistência a nematóides.
Burow et al. (2001) utilizando uma população segregante de 78 indivíduos
originada a partir de um cruzamento entre um anfidiplóide sintético [A. batizocoi x
(A. cardenasii x A. diogoi)] e A. hypogaea mapearam 370 locos RFLP em 23
grupos de ligação, cobrindo uma distância de 2.210 cM do genoma. Estes autores
observaram que as cromatinas dos dois ancestrais de genoma A formaram
cromossomos mosaicos, refletindo a recombinação ocorrida no híbrido
interespecifico F1. Os dados também mostraram que a recombinação entre os
cromossomos na progênie tetraplóide foi similar ao pareamento de cromossomos
relatados para A. hypogaea, com recombinação entre cromossomos do mesmo
genoma.
Recentemente três novos mapas foram construídos para o amendoim com
o uso de marcadores AFLPs e microssatélites. Herselman et al. (2004) publicaram

9
um mapa para o A. hypogaea com marcadores AFLPs, que foram utilizado para
identificar regiões cromossômicas envolvidas na resistência ao pulgão vetor da
roseta do amendoim, a qual é considerada a mais destrutível doença do
amendoim na África. Moretzsohn et al. (2005) publicaram um mapa com 170
marcadores microssatélites distribuído em 11 grupos de ligação cobrindo 1230,89
cM do genoma, utilizando uma população F2 obtida no cruzamento entre duas
espécies diplóides do genoma AA (A. duranensis e A. stenosperma ) e Gobbi et al.
(2006) construíram o primeiro mapa de ligação para o genoma B do Arachis
utilizando 94 marcadores microssatélites, que foram distribuído em 11 grupos de
ligação cobrindo uma distância de 754,8 cM, usando uma população F2 de 93
indivíduos, resultante do cruzamento entre duas espécies silvestre de genoma B
(A. ipaënsis e A. magna), que são altamente relacionadas ao amendoim cultivado
(Krapovickas & Gregory, 1994). Tanto Moretzsohn et al. (2005) quanto Gobbi et al.
(2006) mapearam um número razoável (36 e 24) de marcadores funcionais
derivados de ESTs.
O marcador molecular RAPD (Random Amplified Polymorphic DNA) tem
sido usado com êxito na construção de mapas de ligação para várias espécies
vegetais de importância econômica, como por exemplo, para soja (Ferreira et al.,
2000), mostarda (Sharma et al., 2002), sorgo (Agrama et al., 2002), feijão (Faleiro
et al., 2003; Santos et al., 2003), eucalipto (Junghans et al., 2003), laranja (Oliveira
et al., 2004), ervilha (Koveza et al., 2005), grão-de-bico (Santra et al., 2000; Iruela
at al., 2006) entre outros.
O uso da técnica RAPD não requer experiência aprofundada em técnicas
de biologia molecular e nem tampouco instalações sofisticadas de laboratório. É
10
uma tecnologia bastante acessível, de fácil manipulação, e o uso dessa técnica
em espécies silvestre do Arachis tem mostrado ser bastante informativo (Gimenes
at al., 2000; Creste at al., 2005).
1.1 Objetivo
O objetivo deste trabalho foi a construção de mapa de ligação, utilizando-se
uma população F2 resultante do cruzamento entre os acessos de A. ipaënsis e A.
magna, ambas possuidoras de genoma B, com marcadores moleculares do tipo
RAPD. Tal mapa será utilizado futuramente na identificação de QTLs
(“Quantitative Trait Loci”) relacionados à resistência a doenças de importância
econômica, no amendoim.

11
2. Material e Métodos
2.1 Obtenção do material vegetal
Uma população F2 de 108 indivíduos foi obtida pela autofecundação de um
híbrido interespecifico originado de um cruzamento entre A. ipaënsis KG30076
(Parental feminino) e A. magna KG30097 (Parental masculino). O cruzamento foi
realizado por Andréa Verônica Gobbi Barbosa no Departamento de Genética,
Instituto de Biociências, Universidade Estadual ‘Júlio de Mesquita Filho’ (UNESP),
onde foi realizada a pesquisa. Os acessos utilizados foram cedidos pelo Dr. José
Francisco Montenegro Valls, curador do Banco Ativo de Germoplasma
(CENARGEN-EMBRAPA, Brasília, DF). Essas plantas foram mantidas em casa de
vegetação.
2.2. Extração de DNA
A extração de DNA foi realizada de acordo com Grattapaglia & Sederoff
(1994). A concentração do DNA foi estimada em gel de agarose 1%, e realizada
uma diluição para concentração de uso a 5ng/µl.
2.3. Reações de PCR
As amplificações dos marcadores RAPDs foram realizadas utilizando-se
“primers” de 10 nucleotídeos da Operon (OPERON Technologies) nas seguintes

12
condições de amplificação: 1 passo inicial de 94ºC por 5 minutos, 40 ciclos de
92oC por 1 minuto, 35oC por 1 minuto e 72oC por 3 minutos e um passo final de
72ºC por 10 minutos. Cada uma das reações de amplificação foram composta por
0,1 µl de Taq DNA polimerase (5 U/µl) (Fermenta), 1,3 µl de tampão 10 X da Taq
DNA polimerase,1,04 µl de MgCl2 (25 mM), 1,04 µl de dNTP (2,5 mM), 3 µl de
“primer” (5 ng/µl), 1,04 µl de BSA(10mg/ml), 3 µl DNA a 5 ng/µl e 2,48 µl de água
para completar um volume final de 13 µl. Os produtos de cada amplificação foram
separados em gel de agarose a 1,5%, e os padrões de bandas foram visualizados
corando-se os géis com brometo de etídio e usando-se luz ultravioleta.
Foram utilizados 13 locos (Tabela 1) previamente mapeados por Gobbi at
al. (2006). Reações de PCR foram composta de 2,0 µl de DNA genômico a 5ng/µl,
0,1 µl de Taq DNA polimerase 5U/µl (Fermenta), 1,0 µl de 10X buffer da Taq DNA
polimerase 1,0 µl MgCl2 (25 mM), 1,0 µl dNTP (2,5 mM), e 1,0 µl de BSA
(10mg/ml), 0,3 µl de cada um dos “primers” e 3,3 µl de H2O Milli Q autoclavada
para completar 10 µl de volume final da reação, que foram efetuadas em
termociclador PTC100 (MJ Research, Inc., Watertown, MA, USA). As condições
de amplificação das reações foram: 96 ºC por 5 min, seguidos de 32 ciclos de 96
ºC por 30 s, X ºC (temperaturas de anelamento para cada par de “primers” Tabela
1), por 45 s, 72 ºC por 1 min, com uma extensão final de 10 min a 72 ºC. Os
produtos de PCR (10 µl) sofreram eletroforese em gel desnaturante de
poliacrilamida 6% (acrilamida/bisacrilamida, 29:1, 5 M uréia em TBE, pH 8,3)
corados com prata.
13
2.3. Análise dos Dados
A identificação de marcadores polimórficos nos parentais foi realizada a
partir da análise de 227 “primers” randômicos, sendo selecionados os “primers”
que permitiram a amplificação do maior número de locos polimórficos. Os
“primers” selecionados foram analisados na população mapa e a presença ou
ausência de cada loco em cada individuo foi representada numa matriz de dados
com h- e kk respectivamente. Para os microssatélites foram observados na
população F2 o genótipo do parental masculino e feminino e o híbrido. O teste de
χ2 foi utilizado para verificar se as freqüências genotípicas obtidas estavam de
acordo com o esperado, isto é, 3:1 para o RAPD e 1:2:1 para os locos de
microssatélites.
2.4. Construção do Mapa
O mapa foi construído utilizado o programa computacional JoinMap (Stam,
1993) usando a função de Kosambi e LOD mínimo de 4,0 e uma taxa de
recombinação de 0,30. A nomenclatura dos marcadores RAPD seguiu usando
convencional designado nos “primers” em seguida o tamanho do fragmento.

14
3. Resultados
3.1. Amplificação do locos de RAPDs
Dos 227 “primers” testados, 86 (37,9%) não amplificaram, 15 (6,6%)
amplificaram apenas locos monomórficos e 126 (55,5%) amplificaram locos
polimórficos. Dentre os 126 “primers” que amplificaram locos polimórficos, 15
amplificaram apenas um loco polimórfico e 111 “primers” (48,89%) permitiram a
amplificação no mínimo de dois locos e no máximo de nove locos polimórficos,
entre os parentais da população mapa. Desses 111 “primers”, foram selecionados
70 para análise na população mapa, baseando-se principalmente na intensidade
do loco e repetibilidade entre os indivíduos da população F2. Os selecionados
amplificaram em média 3,07 locos polimórficos, cujos tamanhos variaram de 350 a
3000 pb. Os 70 “primers” permitiram a amplificação de 911 locos, sendo que 215
(23,6%) foram polimórficos entre as espécies parentais e apresentaram
segregação na população F2. Dos 215, em 118 (54,88%) locos os alelos
amplificados foram de A. ipaënsis e em 97 (45,12%) foram de A. magna.
Os locos polimórficos foram de dois tipos: os monoparentais, nos quais
apenas o alelo de um dos parentais foi detectado e com segregação de 1:1, e os
biparentais, encontrados em ambos os parentais e com segregação esperada de
3:1. O teste de X2 (qui-quadrado) foi aplicado para os dados de cada um dos 215
locos RAPD para verificar se as freqüências genotípicas observadas estavam
dentro do esperado para um loco dominante em uma população F2 resultante de
cruzamento entre parentais homozigotos. Este teste demonstrou que as
15
freqüências observadas em 190 (88,37%) dos locos não diferiram
significantemente da esperada 3:1, com um nível de significância de α = 0,05. E
entre os demais locos, cinco deles (2,32%) foram locos que apresentaram
segregação de 1:1, e 20 (9,30%) apresentaram a segregação distorcida, sendo
que em 11 foram alelos observados em A. ipaënsis e em nove desses alelos em
A. magna.
3.2. Mapa de ligação
Com um LOD de 4,0 e uma taxa de recombinação de 0,30, 147 marcadores
(139 RAPD e 8 microssatélites) foram mapeados em 12 grupos de ligação (Figura
1). Os grupos foram numerados seqüencialmente daquele com maior número de
marcadores para o de menor número. Do total de 215 marcadores RAPD
genotipados, 139 (65,04%) foram mapeados, e dos 13 locos microssatélites
apenas oito, sendo dois (Seg2G05 e AHSI2D04) no grupo 1, um no grupo 2
(SI7G04), um no grupo 3 (Ah282), três (AH126, Seg4B09 e RN27A10) no grupo 6
e um (Ap175) no grupo 7. Os marcadores microssatélites são aqueles com os
nomes sublinhados na Figura 1. Oitenta e um marcadores não foram ligados,
sendo 76 de RAPD (47 de A. ipaënsis e 29 de A. magna) e cinco microssatélites.
A origem parental dos 139 marcadores RAPDs mapeados é apresentada na
Tabela 2 e, como pode ser observado, no geral, os marcadores de cada um dos
parentais estão em freqüências semelhantes em cada um dos grupos de ligação.
Os comprimentos dos principais 10 grupos de ligação variaram de 27,6 cM
a 369,6 cM (Tabela 2). O número de marcadores por grupo de ligação variou de
16
dois nos grupos 11 e 12 a 24 no grupo 1. Alguns marcadores foram mapeados na
mesma posição (OPR8-2000 e OPG04-1900, OPAW12-300 e OPAW04-1400 no
grupo 1; OPZ03-2300 e OPU12-630 no grupo 2; OPV09-1380 e OPU13-1350 no
grupo 3; OPZ105-540 e OPZ09-1900 no grupo 4; OPG03-880 e OPG03-750 no
grupo 7; OPG03-1180 e OPG04-380 no grupo 8). Por outro lado, a distância entre
alguns marcadores foi bastante alta. Por exemplo, OPB07-450 e OPA15-570
foram mapeados a uma distância de 40 cM. A distância total do mapa foi de
2.061,2 cM e a distância média entre os locos foi de 12,8 cM (Tabela 2). Alguns
grupos de ligação apresentaram marcadores ligados a uma distância muito abaixo
da média observada (1,5 e 4,6 cM). Estas áreas de agrupamento foram
observadas nos grupos de ligação 2 e 4. Nestes casos as médias foram
aproximadamente de 6,38 e 6,72 cM, respectivamente.
Três dos cinco marcadores com segregação de 1:1 foram mapeados
(Grupo 1, 6 e 7). Dos 21(20 RAPD e um microssatélite) marcadores que
apresentaram segregação distorcida, 16 foram mapeado em sete grupos de
ligação, sendo que entre os dez grupos principais, as porcentagens desses locos
distorcidos variaram de 9,09% no grupo 8 a 33,33% do grupo 10, que é composto
por apenas três marcadores. Esses marcadores com segregação distorcida estão
identificados no mapa com um ponto (.) depois do nome (Figura 1). Dos 16 locos
distorcidos, 10(62,5%) apresentaram o alelo de A. ipaënsis em maior freqüência e
seis (37,5%) apresentaram o de A. magna (Tabela 3).
Dos oito marcadores microssatélites mapeados, seis foram mapeados
como esperado segundo o mapa desenvolvido por Gobbi et al. (2006), isto é, em

17
grupos de ligação diferentes (Seg2G05, SI2D04, SI7G04, Ah282, RN27A10 e
Ap175) ou ligados (Ah126 e o Seq4B09).
4. Discussão
4.1. Distorção de locos
Dos 228 genotipados na população mapa 21 (9,2%) apresentaram
distorção, sendo 20 locos de RAPD e um loco de microssatélite (Ah280). A
porcentagem de distorção encontrada foi menor do que a observada por Gobbi et
al. (2006), que foi de 17,7%, que avaliaram 94 locos de microssatélites em uma
população mapa também resultante do cruzamento entre A. ipaënsis e A. magna.
A porcentagem de locos distorcidos também foi menor que as encontradas por
Halward et al. (1993) e Burow et al. (2001) (25%), avaliados em populações
resultantes de cruzamentos interespecíficos utilizando marcadores RFLPs
codominantes. Também foi menor do que os 44,13% de locos distorcidos
observados por Moretzsohn et al. (2005), que avaliaram uma população F2,
resultante também de um cruzamento interespecifico (A. duranensis x A.
cardenasii), utilizando marcadores microssatélites. Porcentagens variadas de
locos distorcidos também foram observadas em populações mapas de varias
espécies (Winter et al., 2000; Atieza et al. 2002, Thoquer et al. 2002; Sargent et
al., 2004). Em um cruzamento intra-especifico de Mimulus guttatus, uma planta
modelo para estudos de ecologia e de evolução, o número de locos de
microssatélites distorcidos (74%) também foi maior que o número de locos RAPDs
18
distorcidos encontrados (Hall & Wills, 2005). Os autores desse trabalho atribuíram
esta diferença ao fato dos marcadores microssatélites serem mais informativos e,
portanto, mais sensíveis na detecção de locos distorcidos. Esta sem dúvida
também pode ser a razão para a diferença observada entre este trabalho, que foi
realizado basicamente com marcadores dominantes, e outros trabalhos de
mapeamento realizados em Arachis, que foram realizados com marcadores
codominantes.
Evidências sugerem uma correlação positiva entre o grau de taxa de
distorção de locos em um cruzamento e o nível de divergência genômica (Hall &
Willis, 2005). Pelos dados apresentados acima sobre freqüência de locos
distorcidos em Arachis, os níveis de distorção, tanto para marcadores
microssatélites (Gobbi et al., 2005) como para os marcadores RAPD obtidos neste
trabalho, são os mais baixos observados, sugerindo que as espécies utilizadas
para obtenção da população mapa (A. ipaënsis x A. magna) apresentam menor
divergência genômica, quando comparada a outras espécies de Arachis utilizadas
em cruzamentos para obtenção de populações mapa (A. stenosperma x A.
cardenasii), Halwart et al., 1993; [A. batizocoi x (A. cardenasii x A. diogoi)] e A.
hypogaea Burow et al., 2001; (A. stenosperma x A. duranensis), Moretzsohn et al.,
2005). Segundo Krapovickas & Gregory (1994) A. ipaënsis e A. magna são
espécies muito relacionadas. Já Valls (comunicação pessoal, 2005) considera que
sejam genótipos de uma única espécie, hipótese essa que foi reforçada por Gobbi
et al. (2006), que produziram híbridos férteis no cruzamento entre essas duas
espécies e detectaram baixo polimorfismo entre as duas (39,7%). O baixo
polimorfismo entre A. ipaënsis e A. magna também foi confirmado no presente

19
trabalho, uma vez que foram encontrados apenas 23,6% de locos polimórficos
entre as duas, sendo considerada uma proporção baixa em relação ao
polimorfismo encontrado entre os parentais de outras populações mapas
construídos para espécies de Arachis. Por exemplo, 51,25% de locos RFLP
polimórficos foram observados por Halward et al. (1993) entre A. stenosperma e A.
cardenasii, e 46,8% de locos microssatélites polimórficos foram observados por
Moretzsohn et al. (2005) entre A. stenosperma e A. duranensis, que foram
utilizados para obtenção de uma população mapa F2.
No presente estudo, dos 21 locos que apresentaram distorção, cinco não
foram mapeados e 16 sim, e foram distribuídos em oito grupos de ligação.
Evidências mostraram que marcadores distorcidos não agrupam aleatoriamente
nos mapas de ligação sugerindo que alguns locos estão envolvidos neste padrão
(Thoquet et al., 2002). Gobbi et al. (2006) encontraram 18 locos distorcidos e
estes foram concentrados em seis grupos de ligação, sendo que no grupo de
ligação 1, cinco dos seis locos distorcidos foram mapeados consecutivamente na
região mediana, indicando agrupamento destes locos.
Os padrões de segregação não-mendelianas, segundo Halward et al.
(1993) e Burow et al. (2001), podem ser reflexo da fixação de alelos deletérios,
divergências estruturais ou gênicas associadas com a especiação. Outras
hipóteses sobre as causas de distorção sugeridas são rearranjos estruturais
(Quillet et al., 1995), ligação a genes de auto-incompatibilidade (Berzen et al.,
1995; Sargent et al., 2004), ligação a alelos recessivos deletérios (Oliveira et al.,
2004), diferenças no conteúdo de DNA (Thoquet et al., 2002) e interação entre
genomas divergentes. As interações podem acontecer em diferentes fases do
20
desenvolvimento e podem alterar as freqüências genotípicas em populações F2
das seguintes maneiras: "meiotic drive" podem distorcer as freqüências alélicas
entre os gametófitos F1 viáveis, competição gametofítica ou interação pólen-pistilo
podem também distorcer as freqüências alélicas entre os gametas que alcançam a
fertilização, ou viabilidade diferencial das classes genotípicas entre os zigotos da
F2 (Hall & Willis, 2005). Devido ao fato das espécies serem autógamas e, portanto,
altamente homozigotas, as prováveis causas são alterações estruturais e
divergências gênicas.
4.2. Mapa de ligação
O número de grupos de ligação encontrados neste trabalho é maior que o
número haplóide de cromossomos encontrados nas duas espécies parentais (x
=10). Entretanto, alguns grupos foram formados por pouco marcadores (10, 11 e
12). Por exemplo, o grupo 10 foi formado por três marcadores, sendo dois de A.
ipaënsis e um do A. magna. Portanto, mais marcadores são necessários para ligá-
los aos outros grupos.
A distância entre alguns marcadores em alguns grupos de ligação foi muito
menor que a média observada (12,8 cM) se levado em consideração todo o
conjunto de dados, Thuriaux et al. (1997) sugerem que a recombinação é
concentrada em genes estruturais e há supressão de recombinação em regiões
centroméricas e teloméricas (Tanksley et al., 1992).
A distância média entre os marcadores de 12,8 cM, indica que o mapa
apresenta uma saturação baixa quando comparada a outros mapas altamente

21
saturados, como o de Lotus japonicus, que é composto por 595 marcadores, que
cobrem 376 cM do genoma, e cuja distância média entre marcadores é de 0,6 cM
e a distância máxima encontrada entre marcadores foi de 11 cM (Sandal et al.,
2002). Entretanto, a distancia média entre marcadores é semelhante aos de outros
mapas que foram utilizados com sucesso na identificação de QTLs. Por exemplo,
o mapa utilizado para identificar QTLs de resistência á Ascochyta rabiei em grão-
de-bico, construído com 106 marcadores e cobriu 981,6 cM do genoma, e
distância média entre os marcadores foi de 8,4 cM. (Santra et al., 2002). Outro
exemplo é o mapa utilizado para identificação de QTLs associados à resistência
ao pulgão-verde em sorgo, que foi construído utilizando-se 113 marcadores que
foram mapeados em uma área de 1530 cM, com uma distância média entre os
marcadores de 13,53 cM (Agrama et al., 2002).
O comprimento total do mapa foi de 2.061,2 cM. O primeiro mapa de
ligação para o gênero Arachis (Halward et al., 1993) foi desenvolvido utilizando
uma população F2 resultante do cruzamento de A. sternosperma e A. cardenasii,
ambas espécies de genoma A, cobriu uma distância aproximada de 1.063 cM e a
distância média entre os marcadores foi de aproximadamente 9,1 cM. Burow et al.
(2001), utilizando uma população tetraplóide (AABB), construíram um mapa
formado por 23 grupos de ligação, com 370 marcadores RFLP cobrindo uma
distância total de 2.210 cM e, como uma distância média de 6 cM entre os
marcadores. Moretzsohn et al. (2005) utilizando uma população F2 obtida no
cruzamento entre duas espécies diplóides do genoma AA (A. stenosperma e A.
duranensis), construíram um mapa com 170 marcadores microssatélites
distribuído em 11 grupos de ligação cobrindo 1230,89 cM do genoma e com

22
distância média de 7,24 cM. A distância coberta no presente estudo foi
proporcionalmente maior que a distância coberta no mapa de genoma B
construído a partir do mesmo cruzamento (754,8 cM) com marcadores
microssatélites e que os demais mapas construídos para Arachis. Brondani et al.
(2002) observaram um aumento de 22% e 36% nos mapas de E. grandis e E.
urophylla quando da inclusão de marcadores microssatélites na estrutura do mapa
construída com RAPD. Agrama et al. (2002) observaram um aumento de 42,61%
e 36,14% no comprimento de um mapa construído com marcadores SSRs e
RAPD em relação a outros dois mapa de sorgo construído com marcadores RFLP.
Estas variações nas estimativas de tamanho de genoma são provavelmente
devidas às diferenças nos tamanhos das populações mapas e nos níveis de
estringências adotados para estabelecer a ordem dos locos (Brondani et al.,
2002). Além disso, mapas genéticos baseados em populações F2, são difíceis de
serem construídos porque recombinação entre marcadores pode somente ser
estimada quando marcadores estão em acoplamento de locos (Thoquet et al.,
2002).
Os parâmetros para determinação do nível de saturação e valor de um
mapa de ligação são vários. Casasoli et al. (2001) concluíram que o mapa por eles
obtidos teve um bom nível de saturação, uma vez que encontraram o mesmo
número de grupos de ligação que o número haplóide de cromossomos de
Castanea sativa Mill e um baixo número de marcadores não ligado. Já Thoquet et
al. (2002), além dos parâmetros descritos acima, levam em consideração também
o nível de discrepância entre o mapa F2 e os mapas individuais de cada um dos
parentais e, a baixa freqüência de agrupamentos. Se levarmos em consideração

23
os parâmetros descritos acima, a obtenção de um número de grupos de ligação
maior que número haplóide de cromossomos das duas espécies genitoras da
população e o número de marcadores não ligados sugerem que o nível de
saturação do mapa apresentado neste trabalho ainda necessita ser aumentado.
Uma vez que já existem disponíveis muitos marcadores microssatélites para A.
hypogaea (He et al., 2003; Ferguson et al., 2004; Palmieri et al., 2004; Moretzsohn
et al., 2005; Gobbi et al., 2006) e o nível de transferência destes marcadores para
espécies relacionadas é alto (Hopkins et al., 1999; Moretzsohn et al., 2004;
Moretzsohn. 2005; Gobbi et al., 2006) a saturação deste mapa será realizada
utilizando este tipo de marcador, que pelo fato de ser codominante é muito mais
informativo. Pretende se também a inclusão de marcadores âncoras de outras
leguminosas como, por exemplo, Lotus japonica e Medicago sativa, utilizadas
como plantas modelo e para as quais várias ferramentas genéticas já foram
obtidos, incluindo mapas de ligação (Sagan et al. 1995; Penmetsa & Cook, 1997;
Perry et al., 2003; Kawaguchi et al., 2002), bibliotecas de cDNA (Cowtiz et al.,
1998; Gama et al., 1996; Györgyey et al., 2000; Asamizu et al., 2004), bibliotecas
de insertos longos (Nam et al., 1999; Men et al., 2001; Nakamura et al., 2002; Choi
et al., 2004) e métodos eficiente de transformação (Chabaud et al., 1996; Trinh et
al., 1998; Trieu et al., 2000).
24
5. Conclusões
O mapa de ligação apresentado neste trabalho é o primeiro mapa para
espécies de genoma B altamente relacionadas ao genoma B de A. hypogaea,
construído com marcadores RAPD. Um mapa único foi construído utilizando-se
principalmente marcadores biparentais (3:1). Portanto, este mapa é bem
balanceado uma vez que ambos os parentais contribuíram com aproximadamente
os mesmos números de marcadores (71 marcadores de A. ipaënsis e 68 de A.
magna). O desenvolvimento de mapas de ligação para cada um dos genomas de
A. hypogaea é o primeiro passo na integração de biotecnologia nos programas de
melhoramento que visam introgressão de genes das espécies silvestres para o
amendoim cultivado. Além de permitir a detecção de genes que contribuem para a
variação em características agronômicas, mapas permitirão a seleção mais
facilmente de genótipos de uma progênie que tenham maior porcentagem do
genótipo do parental recorrente, reduzindo dessa maneira o tempo do programa
de seleção. Este mapa também é o ponto inicial para o estudo de algumas
características importantes para o melhoramento de A. hypogaea, como por
exemplo, a resistência ao fungo Puccinia arachidis causador da ferrugem, uma
das principais doenças foliares do amendoim (Pande & Narayana Rao, 2001).
25
6. Referências
Agrama, H.A., G.E. Widle, J.C. Reese, L.R. Campbell & M. R. Tuinstra, 2002.
Genetc mapping of QTLs associated with greenbug resistance and
tolerance in Sorghum bicolor. Theor Appl Genet 104: 1373-1378.
Agrianual, 2005. FNP Consultoria & AgroInformativos. www.fnp.com.br
Asamizu, E., Y. Nakamura, S. Sato & S. Tabata, 2004. Characteristics of the Lotus
Japonicus Gene Repertoire Deduced from Large-Scale Expressed
Sequence Tag (EST) Analysis. Plant Molecular Biology 54(3): 405 - 414.
Atienza, S.G., Z. Satovic, K.K. Petersen, O. Doistra & A. Martin, 2002. Preliminary
genetic linkage map of Miscanthus sinensis with RAPD markers. Theor Appl
Genet 105: 946-952.
Barzen, E., W. Mechelke, E. Ritter, E. Schulte-Kappert & F. Salamini, 1995. An
extended map of the sugar beet genome containing RFLP and RFLP loci.
Theor Appl Genet 90:189–193.
Brondani, R.P.V., C. Brondani & D. Grattapaglia, 2002. Towards a genus-wide
reference linkage map for Eucalyptus based exclusively on highly
informative microsatellite markers. Mol Genet Genomics 267: 338–347.

26
Burow, M.D., C.E. Simpson, A.H. Paterson & J.L. Starr, 1996. Identification of
peanut (Arachis hypogaea L.) RAPD markers diagnostic of root-knot
nematode (Meloidogyne arenaria (Neal) Chitwood) resistance. Mol Breed 2:
369-379.
Burow, M.D., C.E. Simpson, J.L. Starr & A.H. Paterson, 2001. Transmission
Genetics of Chromatin From a Synthetic Amphidiploid to Cultivated Peanut
(A. hypogaea L.): Broadening the Gene Pool of a Monophyletic Polyploid
Species. Genetics 159: 823-837.
Casasoli, M., C. Mattioni, M. Cherubibi & F. Villani, 2001. A genetic linkage map of
european chestnut (Castanea sativa Mill) based on RAPD, ISSR and
isozyme markers. Theor Appl Genet 102: 1190-1199.
Chabaud, M., C. Larsonnaud, C. Marmouget & T. Huguet, 1996. Transformation of
Barrel Medic (Medicago truncatula Gaertn.) by Agrobacterium tumefaciens
and regeneration via somatic embryogenesis of transgenic plants with the
MTENOD12 nodulin promoter fused to the GUS gene. Plant Cell Report 15:
305-310.
Choi, H.K., D. Kim, T. Uhm, E. Limpens, H. Lim, J.H. Mun, P. Kalo, R.V.
Penmetsa, A. Seres, O. Kulikova, B.A. Roe,T. Bisseling, G.B. Kiss & D.R.
27
Cook, 2004. A Sequence-Based Genetic Map of Medicago truncatula and
Comparison of Marker Colinearity with M. sativa. Genetics 166: 1463–1502.
CONAB – Companhia Nacional de Abastecimento, Disponível em:
[http://www.conab.gov.br/download/safra/AmendoimTotalSerieHist.xls]
Acesso em 11 fev.2005.
Cowtiz, PA., L.S. Smith & S.R. Long, 1998. Expressed sequence tags from a root-
hair enriched Medicago trucatula cDNA library. Plant Physiology 117: 1325-
1332.
Creste, S., S. Mui Tsai, J.F.M. Valls, M.A. Gimenes & C.R. Lopes, 2005. Genetic
characterization of Brazilian annual Arachis species from sections Arachis e
Heteranthae using RAPD Markers. Genetic Resources and Crop Evolution
52: 1079-1086.
Faleiro, F.G., V.A. Ragagnin, I. Schuster, R.X. Corrêa, P.I. Good-God, S.H.
Brommonshenkel, M.A. Moreira & E.G. Barros, 2003. Mapeamento de
genes de resistência do feijoeiro à ferrugem, antracnose e mancha-angular
usando marcadores RAPD. Fitopatologia Brasileira 28: 059-066.
Fávero, A. P., 2004. Cruzabilidade entre espécies silvestres de Arachis visando a
introgressão de genes de resistência a doenças no amendoim cultivado.

28
Piracicaba, 165 p. Tese (Doutorado) Escola Superior de Agricultura ‘Luiz de
Queiroz’, Universidade de São Paulo.
Ferguson, M.E., M.D. Burow, S.R. Schulze, P.J. Bramel, A.H. Paterson, S.
Kresovich & S. Mitchell, 2004. Microsatellite identification and
characterization in peanut (A. hypogaea L.). Theor Appl Genet 108: 1064-
1070
Ferreira, A.R., K.R. Foutz & P. Kein, 2000. Soybean genetic map of RAPD markers
assigned to an existing scaffold RFLP map. The American Genetic
Association 91: 392-396.
Ferreira, M. E. & D. Grattapaglia, 1998. Introdução ao uso de marcadores
moleculares em análise genética. Embrapa. 3º.Ed. Brasília: Embrapa-
CENARGEN.
Fernández, A. & A. Krapovickas, 1994. Cromosomas y evolucion em Arachis
(Leguminosae). Bonplandia 8: 127-220.
Gamas, P., F.D. Niebel, N. Lescure & J.V Cullimore, 1996. Use of a subtractive
hybridization approach to identify new Medicago trucatula genes induced
during root nodule development. Mol Microbe Interact 9: 233-242.

29
Garcia, G.M., H.T. Stalker & G. Kochert, 1995. Introgression analysis of an
interspecific hybrid population in peanuts (Arachis hypogaeaL.) usando
RFLP and RAPD markers. Genome 38: 166-176.
Garcia, G.M., H.T. Stalker, E. Shoroeder & G. Kochert, 1996. Identification of
RAPD, SCAR, and RFLP markers tightly linked to nematode resistance
genes introgressed from Arachis cardenasii into Arachis hypogaea. Genome
39: 836-845.
Gimenes, M.A., C.R. Lopes, M.L. Galgaro, J.F.M. Valls & G. Kochert, 2000.
Genetic variation and phylogenetic relatianships based on RAPD analyis in
Caulorrhizae, genus Arachis (Leguminosae). Euphytica 116: 187-195.
Gimenes, M.A., C.R. Lopes, M.L. Galgaro & J.F.M. Valls, 2002. Genetic
relationships among Arachis species based on AFLP. Genetics and
Molecular Biology 25 (3): 349-353.
Gobbi., A., C. Texeira, M. Moretzsohn, P. Guimarães, S. Leal-Bertioli, D. Bertioli,
C.R. Lopes & M. Gimenes, 2006. Development of a linkage map to species
of B genome related to the peanut (Arachis hypogaea – AABB). Artigo em
elaboração

30
Grattapaglia, D. & R. Sederoff, 1994. Genetic linkage maps of Eucalyptus grandis
and E. urophylla using a pseudo-testcross mapping strategy and RAPD
markers. Genetics 137: 1121-1137.
Grieshammer, U. & J.C. Wynne, 1990. Isozyme variability in mature seeds of U.S.
peanut cultivars and collections. Peanut Sci 18: 72–75.
Györgyey, J., D. Vaubert, J.I. Jimenez'Zurdo, C. Charon, L. Troussard, A.
Kondorosi & E. Kondorosi, 2000. Analysis of Medicago trunculata nodule
expresses tags. Mol Plant Microbe Interact 13: 62-71.
Hall, M.C. & J.H. Willis, 2005. Transmission ratio distortion in intraspecific hybrids
of Mimulus guttatus: Implication for genomic divergence. Genetics 170: 373-
386.
Halward, T.M., H.T. Stalker, E.A. Larue & G. Kochert, 1991. Genetic variation
detectable with molecular markers among unadapted germplasm resources
of cultivated peanut and wild species. Genome 34: 1013-1020.
Halward, T., T. Stalker, E. LaRue & G. Kochert, 1992. Use of singleprimer DNA
amplifications in genetic studies of peanut (Arachis hypogaea L.). Plant Mol
Biol 18: 315– 325.

31
Halward, T., H.T. Stalker & G. Kochert, 1993. Development of an RFLP linkage
map in diploid peanut species. Theor Appl Genet 87: 379-384.
He, G. & C.S. Prakash, 1997. Identification of polymorphic DNA markers in
cultivated peanut (Arachis hypogaea L.). Euphytica 97: 143–149.
He, G., R. Meng, H. Gao, B. Guo, G. Gao, M. Newman, R. Pittman & C.S.
Prakash, 2005. Simple sequence repeat markers for botanical varieties of
cultivated peanut (Arachis hypogaea L.). Euphytica 142: 131-136.
Herselman, L., 2003. Genetic variation among Southern African cultivated peanut
(Arachis hypogaea L.) genotypes as revealed by AFLP analysis. Euphytica
133: 319–327.
Herselman, L., R. Thwaites, F.M. Kimmins, B. Courtois, P.J.A. Van Der Merwe &
S.E. Seal, 2004. Identification and mapping of AFLP markers linked to
peanut (Arachis hypogaea L.) resistance to the aphid vector of groundnut
rosette disease. Theor Appl Genet 109: 1426-1433.
Hopkins, M.S., A.M. Casa, T. Wang, S.E. Mitchell, R.E. Dean, G.D. Kochert & S
Kresovich, 1999. Discovery and characterization of polymorphic simple
sequence repeats (SSRs) in peanut. Crop Sci 39: 1243–1247.
32
Iruela, M., J. Rubio, F. Barro, J.I. Cubero, T. Millán & J. Gil, 2006. Detection of two
an intra-specific cross of chickpea (Cicer arietinum L.): development of
SCAR markers associated with resistance. Theor Appl Genet 112: 278-287.
Jung, S., P.L. Tate, R. Horn, G. Kochert, K. Moore & A.G. Abbott, 2003. The
phylogenetic relationship of possible progenitors of the cultivated peanut.
Journal of Heredity 94(4): 334-340.
Junghans, D.T., A.C. Alfenas, S.H. Brommonschenkel, S. Oda, E.J. Melo & D.
Grattapaglia, 2003. Resistance to rust (Puccinia psidii Winter) in Eucalyptus:
mode of inheritance and mapping of a major gene with RAPD markers.
Theor Appl Genet 108: 175-180.
Kameswara Rao, N., L.J. Reddy & P.J Bramel, 2003. Potential of wild species for
genetic enhancement of some semi-arid food crops. Genetic Resources and
Crop Evolution 50: 707-721.
Kawaguchi M., H. Imaizumi-Anraku, H. Koiwa, S. Niwa, A. Ikuta, K. Syono & S.
Akao, 2002. Root, Root Hair, and Symbiotic Mutants of the Model Legume
Lotus japonicus. Molecular Plant Microbe Interactions 1: 17-26.
Kochert, G., T. Halward, W.D. Branch & C.E. Simpson, 1991. RFLP variability in
peanut (Arachis hypogaea L.) cultivars and wild species. Theor Appl Genet.
81: 565-570.
33
Kochert, G., H.T. Stalker, M. Gimenes, L. Galgaro, C.R. Lopes & K. Moore, 1996.
RFLP and cytogenetic evidence on the origin and evolution of allotetraploid
domesticated peanut Arachis hypogaea (Leguminosae). Amer Jour Bot 83:
1282-1291.
Koveza, O., Z. Kokaeva, F. Konovalov & S. Gostimsky, 2005. Identification and
mapping of polymorphic RAPD markers of pea (Pisum sativum L.) genome.
Russian Jorunal of Genetics 41: 262-268.
Krapovickas, A. & W.C. Gregory, 1994. Taxonomia del genero Arachis
(Leguminosae). Bonplandia 8: 1-186.
Men, A.E., K. Meksem, M.A. Kassem, D. Lohar, J. Stiller D. Lightfoot & P.M.
Greesshoff, 2001. A Bacterial Artificial Chromosome Library of Lotus
japonicus Constructed in an Agrobacterium tumefaciens-Transformable
vector. Molecular Plant Microbe Interactions 14: 422-425.
Michelmore, R.W., I. Paran & R.V. Kesseli, 1991. Identification of markers linked to
disease-resitance genes by bulked segregant analysis: A rapid method to
detect markers in specific genomic regions by using segregating
populations. Proc Natl Acad Sci USA 88: 9828-9832.

34
Moretzsohn, M.C., M.S. Hopkins, S.E. Mitchell, S. Kresovich, J.F.M. Valls & M.E.
Ferreira, 2004. Genetic diversity of peanut (Arachis hypogaea L.) and its
wild relatives based on the analysis of hypervariable regions of the genome.
BMC Plant Biol 4(11): 1-10.
Moretzsohn, M.C., L. Leoi, K. Proite, P.M. Guimarães, S.C.M. Leal-Bertioli, M.A.
Gimenes, W.S. Martins, J.F.M. Valls, D. Grattapaglia & D.J. Bertioli, 2005. A
microsatellite-based, gene-rich linkage map for the AA genome of Arachis
(Fabaceae). Theor Appl Genet 111: 1060-1071.
Nakamura, Y., T. Kaneko, E. Asamizu, T. Kato, S. Sato & S. Tabata, 2002.
Structural Analysis of a Lotus japonicus Genome. II. Sequence Features
and Mapping of Sixty-five TAC Clones Which Cover the 6.5-Mb Regions of
the Genome. DNA Research 9: 63–70.
Nam, YW., R.V. Penmetsa, G. Endre, P. Uribe, D.J. Kim & D.R. Cook, 1999.
Construction of a bacterial artificial chromosome library of Medicago
truncutula and identification of clones containing ethylene-response genes.
Theor Appl Genet 98: 638-646.
Oliveira, R.P., M. Cristofani & M.A. Machado, 2004. Genetic linkage maps of ‘Pêra’
sweet orange and ‘Cravo’ mandarin with RAPD markers. Pesq Agropec
Bras 39: 159-165.

35
Openshaw, S.J., S.G. Jarboe & W.D. Beavis, 1994. Marker-assisted selection in
backcross breeding. In: ASHS/CSSA Joint Plant Breeding Symposium, 2,
Corvallis Proceedings. Corvallis: Oregon State University.
Palmieri, D.A.; M.D. Bechara, R.A. Curi, M.A. Gimenes & C.R. Lopes, 2004.
Isolation and characterization of microsatellite loci from forage species
Arachis pintoi (Genus Arachis). Mol Ecol Notes 1–3.
Pande, S. & J. Narayana Rao, 2001. Resistance of wild Arachis species to late leaf
spot and rust in greenhouse trials. Plant Diseases. 85: 851-855.
Penmetsa, R.V. & D.R. Cook, 1997. A legume ethylene insensitive mutant
hyperinfected by its rhizobial symbiont. Science 1997, 225: 527-530.
Perry, JA., T.L. Wang, T.J. Welahm, S. Gardner, J.M. Pike, S. Yoshida & M.
Parniske, 2003. A tilling reverse genetics tool and a web-accessible
collection of mutants of the lugume Lotus japonicus. Plant Physiology 131:
866-871.
Quillet, MC., N. Madjidian, Y. Griveau, H. Serieys, M. Tersac, M. Lorieux & A.
Berville 1995. Mapping genetic factors controlling pollen viability in an
interspecific cross in Helianthus sect. Helianthus.Theor Appl Genet
91:1195–1202.
36
Sagan, M., D. Morandi, E. Tarnghi & G. Duc, 1995. Selections of nodulation and
mycorhizal mutants in the model plant Medicago truncaluta Gaerth after
gamma rays mutagenesis. Plant Science 111: 63-71.
Sandal, N., L. Krusell, S. Radutoiu, M. Olbyrt, A. Pedrosa, S. Stracke, S. Sato, T.
kato, S. Tabata M. Parniske A. Bachmair T. Ketelsen & J. Stougaard, 2002.
A genetic linkage map of the model legume Lotus japonicus and strategies
for fast mapping of new loci. Genetics 161: 1673-1683.
Santos, A.S., R.E. Bressan-Smith, M.G. Pereira, R. Rodrigues & C.F. Ferreira,
2003. Genetc linkage map of Phaseolus vulgaris and identification of QTLs
responsible for resistance to Xanthomonas axonopodis pv. Phaseoli.
Fitopatologia Brasileira 28: 5-10.
Santra, D.K., M. Tekeoglu, M. Ratnaparkhe, W.J. Kaiser & F.J. Muehlbauer, 2000.
Identification and mapping of QTLs conferring resistance to aschyta blight in
chickpea. Crop Sci. 40: 1606-1612.
Sargent, D.J.; T.M. Davis, K.R. Tobutt, M.J. Wilkinson, N.H. Battey & D.W.
Simpson, 2004. A genetic linkage map of microsatellite, gene-specific and
morphological markers in diploid Fragaria. Theor Appl Genet 109: 1385-
1391.

37
Seijo, J.G., G.I. Lavia, A. Fernandez, A. Krapovickas, D. Ducasse & E.A. Moscone,
2004. Physical mapping of the 5s and 18s-25s rRNA genes by FISH as
evidence that Arachis duranensis and A. ipaënsis are the wild diploid
progenitors of A. hypogaea (Leguminosae). Amer Jour Bot 91(9): 1294-
1303.
Sharma, R., R.A.K. Aggarwal, R. Kumar, T. Mohapatra & R.P. Sharma, 2002.
Construction of an RAPD linkage map and localization of QTLs for oleic acid
level using recombinant inbreds in mustard (Brassica juncea). Génome
45(3): 467-472.
Sharma, S.B., M.A. Ansari, K.S. Varaprasad, A.K. Singh & L.J. Reddy, 1999.
Ressistance to Meloidogyne javanica in wild Arachis species. Genetic
Resources and Crop Evolution 46: 557-568.
Shoemaker, R.C., K. Polzin, J. Labate, J. Specht, E.C. Brummer, T. Olson, N.
Young, V. Concibido, J. Wilcox, J.P. Tamulonis, G. Kochert & H.R. Boerma,
1996. Genome duplication in soybean (Glycine subgenus soja). Genetics
144: 329-338.
Singh, A.K. & J.P. Moss, 1984. Utilization of wild relatives in genetic improvement
of Arachis hypogaea L. 5. Genome analysis in section Arachis and its
implications in gene transfer. Theor Appl Genet 68: 355–364.

38
Singh, A.K., H.T. Stalker & J.P. Moss, 1991. Cytogenetics and use of alien genetic
variation in groundnut improvement. In: Tsuchyia, T.; Gupta, P.K. (Eds.).
Chromosome engineering in plants: genetics, breeding, evolution. Part B.
Amsterdam: Elsevier Science Publishers B.V: 65-77.
Singh, A.K., J. Smartt, C.E. Simpson & S.N. Raina, 1998. Genetc variation vis-à-
vis molecular polymorphism in groundnut, Arachis hypogaea L. Genetic
Resources and Crop Evolution 45: 1119-126.
Singh, A.K. & J. Smartt, 1998. The genome donors of the groundnut/peanut
(Arachis Hypogaea L.) resiset. Genetic Resources and Crop Evolution 45:
113-118.
Subramanian, V., S. Gurtu, R.C. Nageswara Rae & S.N. Nigam, 2000.
Identification of DNA polymorphism in cultivated groundnut using random
amplified polymorphic DNA (RAPD) assay. Genome 43: 656–660.
Stam, P., 1993. Construction of integrated genetic linkage maps by means of a
new computer package: JoinMap. Plant J 3:739-744.
Tallury, S.P., K.W. Hilu, S.R. Milla, S.A. Friend, M. Alsaghir, H.T. Stalker & D.
Quandt, 2005. Genomic affinities in Arachis section Arachis(Fabaceae):
molecular and cytogenetic evidence. Theor Appl Genet 111: 1229-1237.

39
Tanksley, S.D., M.W. Ganal J.P. Prince, M.C. de Vicente, M.W. Bonierbale, P.
Broun, T.M. Fulton, J.J. Giovannoni, S. Grandilo, G.B. Martin, R.
Messeguer, J.C. Miller, L. Miller, A.H. Paterson, O. Pineda, M.S. Roder,
R.A. Wing, W. Wu & N.D. Yong, 1992. High density molecular linkage maps
of the tomato and potato genomes. Genetics 132: 1141 1160.
Thoquet, P., M. Gherardi, E-P. Journet, A. Kereszt, J-M. Ane, J-M. Prosperi & T.
Huguet, 2002. The molecular genetic linkage map of the model legume
Medicago truncatula: an essential tool for comparative legume genomics
and the isolation of agronomically important genes. BMC Plant Biology 2: 1-
13.
Thuriaux, P., 1977. Is recombination confined to structural gene on the eukaryotic
genome? Nature 268: 460-462.
Trieu, A.T., S.H. Burleigh, I.V. Kardailsky, I.E. Maldonado-Mendoza, W.K. Versaw,
L.A. Blaylock, H. Shin, T.J. Chiou, H. Katagi, G.R. Dewbre, D. Weige & M.J.
Harrison, 2000. Transformation of Medicago truncaluta via infiltration of
seedlings or flowering plants with Agrobacterium. Plant Journal J 22: 531-
541.
Trinh, T.H., P. Ratet, E. Kondorosi, P. Duarnd, K. Kamate, P. Bauer & A.
Kondorosi, 1998. Rapid and efficient transformation of diploid Medicago

40
truncatula and Medicado sativa spp falcate lines improved in somatic
embryogenesis. Plant Cell Report 17: 345-355.
Valls, J.F.M. & C.E. Simpson, 2005. New species of Arachis (Leguminosae) from
Brazil, Paraguay and Bolivia. Bonplandia 14(1-2): 35-63.
Winters, C.J., L. Zimniak, M.V. Mikhailova, W.B. Reeves & T.E. Andreoli, 2000. Cl−
Channels in Basolateral TAL Membranes XV. Molecular Heterogeneity
Between Cortical and Medullary Channels. J. Membrane Biol 177: 221–230.

Tabela 1. Seqüências e temperatura de anelamento dos “primers” microssatélites utilizados na genotipagem dos
indivíduos da população mapa.
Locos Primer Forward (5´-3´) Primer reverse (5´-3´) Motivo T.A. Referências
Ah282 gccaaacacaccacatttca Gcctccaatcccaaacacta (CCA)6..(AAG)6 50ºC Gimenes (não publ)
IBGSI1007G04 tgcaagaagatcaaaaagca Tctgcacaaccttgttttca 52ºC Gimenes (não publ)
Ap175 cccaataggctaattcagaagg gccttattttgcgactgagg (CT)15 52ºC Palmiere et al., 2004
GPSeg2G05 aggaggaacaatcccatagaa tacattacgcccttttggtg (TAA)9 + (CAA)5 60ºC Moretzsohn at al., 2005
Ah280 cgtcctcgttattctctgaa tctctgaattgaagaagagttatg (CA)14..(CA)5 52ºC Gimenes (não publ)
Ap152 agaggatgcagcggagtaga ctggccaattcctatgatcg (AG)23 50ºC Gimenes (não publ)
Ah1TC1G04 tgctgtgagagaaatggcag gcgcattcttcgattaaagg (TTC)5 + (TC)33 56ºC Moretzsohn (prelo)
AHBGSI1002D04 cggggatgttgctcatgtc atggctccaagcagtgtgaa 52ºC Gimenes (não publ)
AS1RN27A10 52ºC Moretzsohn (não publ)
Ah35 gtaaatgctaacaataaccacaa ccccaaggggaatagtggta (AT)19(GA)16 52ºC Gimenes (não publ)
Ah126 ccctgccactctcactcact cgtacaagtcagggggtgac (GA)8..(GA)9 50ºC Gimenes (não publ)
Ah21 cttggagtggagggatgaaa ctcactcactcgcacctaacc (GAA)9 50ºC Moretzsohn at al., 2005
PPGPSeg4B09 aaacatccagcaaacgaaga gacaactaaatccttgttcctagc (CA)7 56ºC Moretzsohn (não publ)
40

Tabela 2. Informações sobre cada um dos 12 grupos de ligação obtidos com um "LOD score" de 4,0 e recombinação de 0,3.
Grupos
de
ligação
(GL)
Número de
marcadores
Marcadores
de
segregação
(3:1)
Marcadores
de
segregação
(1:1)
Marcadores
microssatélites
Marcadores
distorcidos
Nº. de
marcadores
(RAPDs) do
parental
feminino A.
ipaënsis
Nº. de
marcadores
(RAPDs) do
parental
masculino A.
magna
Distância
média entre
os
marcadores
(cM)
Comprimento
do grupo
(cM)
1 24 18 1 2 3 16 6 15,4 369,6
2 22 17 0 1 4 10 11 14,8 326,0
3 17 14 0 1 2 8 8 15,5 265,7
4 16 16 0 0 0 10 6 14,2 228,3
5 14 14 0 0 0 5 9 15,5 217,4
6 14 8 1 3 2 5 6 13,8 194,3
7 15 11 1 1 2 9 5 12,3 185,5
8 11 10 0 0 1 3 8 10,1 110,8
9 7 7 0 0 0 2 5 13,8 97,2
10 3 2 0 0 1 1 2 9,2 27,6
11 2 2 0 0 0 1 1 13,4 26,9
12 2 1 0 0 1 1 1 5,9 11,9
147 120 (80,95%) 3 (2,04 %) 8 (5,44%) 16 (10,88%) 71 (51,07%) 68 (48,93%) x =12,8 2.061,2
41

Tabela 3. Informações sobre os marcadores RAPD e microssatélites distorcidos.
GL Número de
marcadores
Marcadores
RAPD
Marcadores
microssatélites
Marcadores
distorcidos
Marcadores
(RAPDs)
distorcidos em A.
ipaënsis
Marcadores
(RAPDs)
distorcidos em
A. magna
Marcadores
microssatélite
distorcidos
1 24 22 2 3 2 1 0
2 22 21 1 4 3 1 0
3 17 16 1 3 1 1 0
4 16 16 0 0 0 0 0
5 14 14 0 0 0 0 0
6 14 11 3 2 2 0 0
7 15 14 1 2 1 1 0
8 11 11 0 1 0 1 0
9 7 7 0 0 0 0 0
10 3 3 0 1 1 0 0
11 2 2 0 0 0 0 0
12 2 2 0 1 0 1 0
147 139(94,56%) 8(5,44%) 16 (10,88%) 10 (62,5%) 6 (37,5%) 0%
42

43
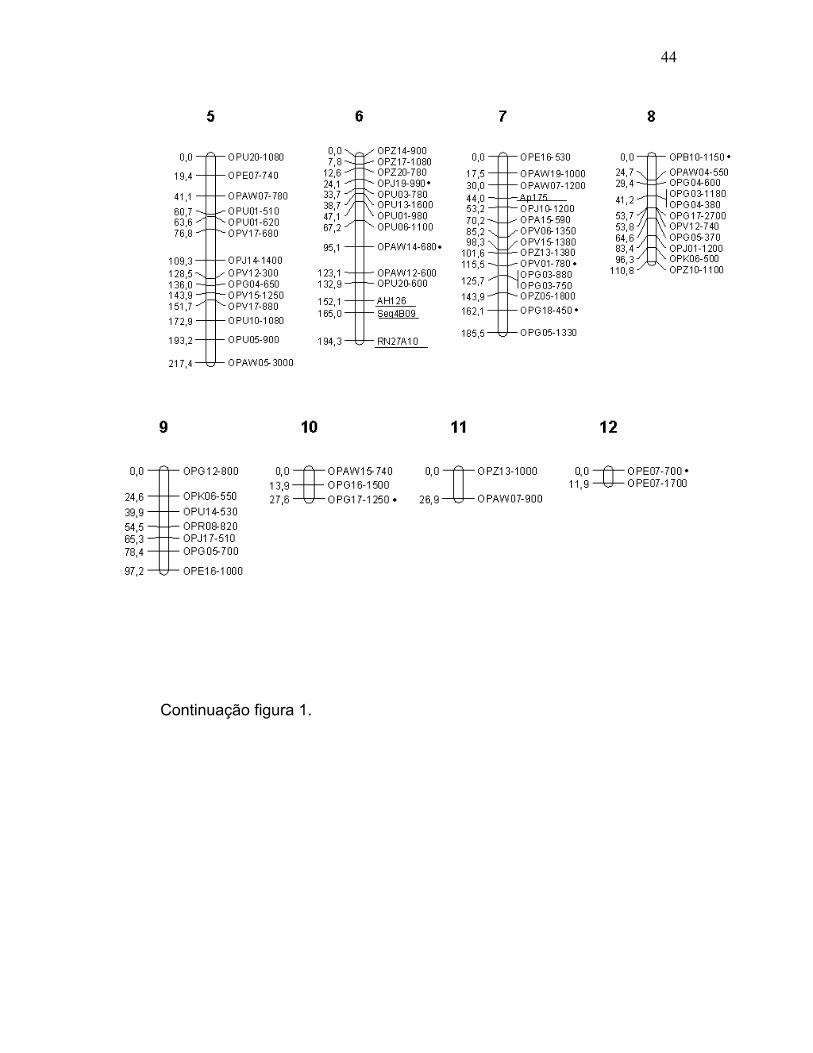
Figura 1. Mapa de ligação desenvolvido para genoma B do amendoim
utilizando marcadores moleculares RAPD em uma população F2 de 108 indivíduos
obtida pela autofecundação de um híbrido F1 resultante do cruzamento entre duas
espécies silvestres (A. ipaënsis e A. magna). Um total de 147 marcadores (139
RAPDs e 8 microssatélites) foi mapeado em 12 grupos de ligação, cobrindo
2.061,2 cM do genoma, utilizando um LOD score de 4.0 e uma freqüência de
recombinação de 0,30. Os marcadores foram identificados usando a nomenclatura
tradicional para o RAPD que é o nome do “primer” seguido do tamanho do
fragmento. Os marcadores com segregação distorcida foram identificados no
mapa com um ponto (.) e os marcadores microssatélites foram sublinhados.
44
Continuação figura 1.

45
Artigo em inglês

46
Abstract
Arachis hypogaea L. (peanut) is one of the four most important oilseed
crops in the world. Linkage maps of A. hypogaea are difficult to be constructed
because this species presents extremely low levels of polymorphism, as detected
by the use of several different molecular markers. An alternative to obtain
information about its genome is the utilization of wild species of Arachis presenting
genomes similar to that of A. hypogaea. These species present high levels of
genetic polymorphism, traits of agronomic interest, such as resistance against
important pathogens, and high cross-ability. In this work we present a linkage map
constructed based on a F2 population of 108 individuals resulting from the cross
between two wild species of Arachis [A. ipaënsis (KG30076) e A. magna
(KG30097)] presenting the B genome similar to that of A. hypogaea. This species
showed to be very close related, as the polymorphism level observed between
than was very low (23.6%). We obtained a linkage map with 139 RAPD markers
and 8 microsatellite markers distributed onto 12 linkage groups and covering a
distance of 2,061.2 cM of the genome, with an average distance between markers
of 12,8 cM. This is the first linkage map of Arachis species possessing the B
genome and close related to A. hypogaea constructed via RAPD markers. The
development of linkage maps is a first step in the integration of the biotechnologies
to the genetic improvement via wild species of peanuts.

47
1. Introduction
Arachis hypogaea L. (peanut) is one of the four most important oilseed
crops in the world. It is mainly cultivated in developing countries from Africa and
Asia. These countries are responsible for approximately 80% of world’s production,
which was estimated in 34,198 million tons in the year of 2004 (Agrianual, 2005). In
2004 and 2005, Brazil cultivated 129.5 thousands of hectares of peanut (CONAB,
2005), contributing with 0.6% of world’s production.
The cultivated peanut is an allotetraploid (AABB). It was originated via
hybridization of two diploid wild species, followed by a rare spontaneous
duplication of chromosomes (Halward et al., 1991; Shoemaker et al., 1996).
The genus Arachis contains 80 species (Valls & Simpson, 2005) assembled
into nine sections. Arachis hypogaea belongs to the section Arachis, which
encompasses 31 species, most of them diploid, with genomes classified as A, B or
D. The species presenting the A genome are very close related to each other. For
example, hybrids between A. duranensis x A. kempff-mercadoi presented 72% of
pollen fertility (Tallury et al., 2005). Interspecif hybrids between A genome species
presented 10 bivalents in the meiosis (Singh & Moss, 1984; Tallury et al., 2005).
However, within the B genome species, the crossability is very variable. Crossings
between A. batizocoi and A. ipaënsis resulted in low fertility hybrids (Tallury et al.,
2005), while crossings between A. ipaënsis and A. magna produced highly fertile
hybrids (Gobbi et al., 2006).
Citogenetic (Fernández & Krapovickas, 1994) and molecular data (Gimenes
et al., 2000; Jung et al., 2003; Moretzsohn et al., 2004) suggest that the

48
relationships among the wild diploid species and A. hypogaea are very variable.
However, different kind of evidences (Kochert et al., 1991; Krapovickas & Gregory,
1994; Fernández & Krapovickas, 1994; Kochert et al., 1996; Jung et al., 2003;
Seijo et al., 2004; Fávero, 2004) indicates that A. duranensis and A. ipaënsis as
the putative donors of the A and B genomes of A. hypogaea, respectively, being,
this way, the species most closely related to the cultivated peanut.
Genetic improvement of peanut has been made through its primary gene
pool (lineages, cultivars), however these processes presents some limitations,
such as the low genetic variability for valuable agronomic traits (Halward et al.,
1991) and the low molecular polymorphism among the accessions of A. hypogaea
(Grieshammer & Wynne, 1990; Kochert et al., 1991; Halward et al., 1992; He &
Prakash, 1997; Singh et al.,1998; Hopkins et al., 1999; Subramanian et al., 2000;
Herselman, 2003; Ferguson et al., 2004; Moretzsohn et al., 2004; Herselman et al.,
2004; He et al., 2005). This severely reduces the utilization of molecular markers to
development of linkage maps and the identification of QTLs in this species. This
way, the secondary gene pool of A. hypogaea, which encompasses the wild
species of the section Arachis, and where high levels of resistance against
economically important pathogens can be found (Sharma et al., 1999; Pande &
Narayana Rao, 2001; Subrahmanyam et al., 2001; Kameswara Rao et al., 2003),
is of great importance for peanut genetic improvement. As these species are
closely related to A. hypogaea (Krapovickas & Gregory, 1994), interspecific
crosses are facilitated. The secondary gene pool presents high levels of
polymorphism, which are easily detected by different molecular markers such as
49
RFLP (Halward et al., 1991), RAPD (Gimenes et al., 2000; Creste et al., 2005),
AFLP (Gimenes et al., 2002) and microsatellites (Moretzsohn et al., 2004).
The transferability of desired traits from wild species to the cultivated peanut
can be achieved by crossings with diploid species or synthetic allopolyploids from
crossings among diploid species. However, undesirable traits, such as low yielding
and low seed quality, are also transferred to the progenies. Moreover, genes of
interest and undesirable genes can be linked, and several generations would be
necessary to break these linkages. In Arachis, the resistance against pathogens is
usually associated to undesirable agronomic traits (Singh et al., 1991).
The utilization of wild Arachis species in the peanut genetic improvement
can be facilitated by the identification of molecular markers linked to genes or
chromosome regions of interest. This would allow the monitoring of the presence of
the gene or allele of interest and the selection of individuals more similar to the
recurrent genotype. The number of backcrosses necessary to the recovering of the
recurrent genotype would be greatly reduced, facilitating the development of new
varieties (Openshaw et al., 1994).
The use of molecular markers for gene introgression in Arachis hypogaea
has been showing promising results. Garcia et al. (1995), utilizing RFLPs and
RAPDs markers, identified the introgression of chromosomes segments of AA
genome from A. cardenasii in A. hypogaea. Markers linked to resistance genes
against nematodes were also identified (Garcia et al., 1996).
The identification of molecular markers linked to interest genes can be
achieved by bulk analyses or linkage mapping. The “Bulked segregant analysis”
(BSA) method was developed by Michelmore et al. (1991). It is a fast method for

50
the identification of markers linked to specific regions of the genome, based on the
construction of two bulks of contrasting DNA, obtained from a segregant population
of the same crossing. One bulk is composed of an assemblage of individuals
presenting the desirable trait, and the other is composed of individuals that did not
present the desirable trait. All the individuals of a bulk share the same genomic
region that contain the gene of interest, and are segregant for the other regions.
The marker that co-segregates with the bulks will probably be linked to the
evaluated trait.
Linkage maps require a higher number of markers (on the average, 2.5 to
6.0cM between markers) and the analysis of each individual of the population.
However, this method is considered a very powerful tool in plant breeding (Faleiro
et al., 2003). Linkage maps allow the complete analyses of genomes, the
decomposition of complex traits in its Mendelian components, the localization of
genomic regions that regulates important traits, the quantification of the effects of
each region over the studied characteristic and the use of all this information for
breeding programs (Ferreira & Grattapaglia, 1998).
Despite its usefulness, it is difficult to obtain linkage maps of A. hypogaea,
as it presents extremely low levels of polymorphism, as detected by the use of
several different molecular markers (Grieshammer & Wynne, 1990; Kochert et al.,
1991; Halward et al., 1992; He & Prakash, 1997; Singh et al.,1998; Hopkins et al.,
1999; Subramanian et al., 2000; Herselman, 2003; Herselman et al., 2004;
Ferguson et al., 2004; Moretzsohn et al., 2004; He et al., 2005). The alternative is
the utilization of wild species of Arachis presenting genomes similar to that of A.
hypogaea, once these species present high levels of genetic polymorphism

51
(Gimenes et al., 2000; Moretzsohn et al., 2004; Gimenes et al., 2002; Creste et al.,
2005), traits of agronomic interest (Sharma et al., 1999; Pande & Narayana Rao,
2001; Kameswara Rao et al., 2003), and high cross-ability (Fávero, 2004; Tallury
et al., 2005), providing a F2 population useful to linkage maps construction,
obtained from highly contrasting parentals.
In Arachis, a few linkage maps have been published. Halward et al. (1993)
developed an RFLP-based map using an F2 population derived from a cross
between two diploid wild species with A genome (A. stenosperma and A.
cardenasii). A total of 117 loci were mapped in 11 linkage groups. Burow et al.
(1996) developed a lineage (TxAg-7) by crossing A. hypogaea var. Florunner with
[A. batizocoi x (A. cardenasii x A. diogoi)]x4. This lineage was used as parental to
generate a population (BC4F2), which was utilized to identify three RAPD markers
associated to the resistance against nematodes.
Another RFLP-based map was published for a tetraploid population (Burow
et al., 2001). A synthetic amphidiploid A. batizocoi x (A. cardenasii x A. diogoi),
was used as donor parent, and crossed with A. hypogaea to generate a population
of 78 individuals. Three hundred seventy RFLP loci were mapped onto 23 linkage
groups, covering 2,210 cM of the genome. The authors observed that the
chromatin from the A genome formed mosaic chromosomes, reflecting the
recombination that occurred in the interspecific F1 hybrid. The data showed also
that the recombination among the chromosomes in the tetraploid progeny was
similar to the chromosome pairing among chromosomes of the same genome
reported to A. hypogaea.

52
Recently, AFLP and microsatellite (SSR) markers were used to construct
three peanut linkage maps. Herselman et al. (2004) utilized AFLP markers to map
genes of resistance to the aphid vector of groundnut rosette disease, which is the
most destructive viral disease of peanut in Africa (Herselman et al., 2004).
Moretzsohn et al. (2005) published a map with 170 SSR markers distributed onto
11 linkage groups and covering 1230.89 cM of the genome. They utilized a F2
population obtained from the crossing between two diploid species with the AA
genome (A. duranensis and A. stenosperma). Gobbi et al. (2005) constructed the
first linkage map of the B genome of Arachis by the use of 94 SSR markers
distributed onto 11 linkage groups and covering 754.8 cM of the genome. They
utilized a F2 population composed of 93 individuals obtained from a cross between
two wild B-genome species (A. ipaënsis e A. magna). These species are closely
related to the cultivated peanut (Krapovickas & Gregory, 1994). Moretzsohn et al.
(2005) and Gobbi et al. (2006) mapped a significant number (36 and 24) of
functional markers derived from ESTs.
Random Amplified Polymorphic DNA (RAPD) has been used in linkage map
construction in a wide range of economically important plant species, such as
soybeans (Ferreira et al., 2000), mustard (Sharma et al., 2002), sorghum (Agrama
et al., 2002), beans (Faleiro et al., 2003; Santos et al., 2003), eucalypt (Junghans
et al., 2003), citrus (Oliveira et al., 2004), pea (; Koveza et al., 2005) and chickpea
(Santra et al., 2000; Iruela et al., 2006).
The RAPD technique does not require sophisticated laboratory facilities
neither previous experience in molecular techniques. However, this simple

53
methodology has showed to be very informative in wild species of Arachis
(Gimenes et al., 2000; Creste et al., 2005).
1.1. Objective
The aim of this work was to construct a linkage map with RAPD markers,
utilizing a F2 population obtained from the cross between A. ipaënsis and A.
magna accessions, both presenting the B genome of Arachis. This linkage map will
be utilized in the identification of QTLs (Quantitative Trait Loci) related to the
resistance against economically important peanut pathogens.
54
2. Material and Methods
2.1. Plant material
A 108 individuals F2 population, resulting from a self cross of an interspecific
hybrid between A. ipaensis (KG30076, female parental) and A. magna (KG30097,
male parental) was obtained and utilized for this study. The crosses were made by
Andréa Verônica Gobbi Barbosa at the Genetic Department, Instituto de
Biociências, Universidade Estadual “Julio de Mesquita Filho” (UNESP), where the
research was done.
The accessions were kindly provided by Dr. José Francisco Montenegro
Valls, from the Banco de Germoplasma de Espécies Silvestres de Arachis (wild
Arachis species germplasm bank) of EMBRAPA-Cenargen, Brasília-FD. Plants
were cultivated in greenhouse.
2.2. DNA extraction
The DNA extraction was made following the procedure described by
Grattapaglia and Sederoff (1994).The concentration of the DNA was estimated
through visualization on 1% agarose gels. A dilution of 5ng/µl was utilized.

55
2.3. PCR reactions
RAPD amplification reactions were performed in a final volume of 13 µl,
containing 3 µl of DNA (5 ng/µl), 3 µl (5 ng/µl) of a 10-base pair random primer
(Operon Technologies), 0,1 µl (5 U/µl) of Taq DNA polymerase (Fermentas Life
Sciences), 1.04 µl of dNTP (2,5 mM), 1,04 µl (25 mM) of MgCl2, 1,3 µl of 10X Taq
Buffer and 1,04 µl (10mg/ml)of BSA. Reactions were performed in a PTC100
thermocycler (MJ Research, Inc., Watertown, MA, USA) with a 5-min denaturation
step at 94°C followed by 40 cycles of 1-min denaturation at 92ºC, 1 min annealing
at 35ºC, and 3 min extension at 72ºC, and a final 10-min elongation step at 72ºC.
Amplification products were separated by electrophoresis in 1.5% w/v
agarose gels with 1x TBE buffer, stained with ethidium bromide. The gels were
visualized by illumination with ultraviolet light.
Thirteen SSR markers were also used to genotype the map poplations
(Table 1). The markers were chosen based on the map developed by Gobbi et al.
(2006). PCR reactions were performed in a final volume of 10 µl, containing 2,0 µl
(5ng/µ) of genomic DNA, 0,1 µl (5 U/µl) of Taq DNA polymerase (Fermentas Life
Sciences), 1 µl of 10X Taq Buffer, 1,0 µl of MgCl2 (25 mM), 1 µl of dNTP (2.5 mM),
1 µl (10mg/ml)of BSA, 0,3 µl of each primer. Reactions were performed in a
PTC100 thermocycler (MJ Research, Inc., Watertown, MA, USA) with a 5-min
denaturation step at 96°C followed by 32 cycles of 30 s denaturation at 96ºC, 45 s
annealing at XºC (Table 1), and 1 min extension at 72ºC, and a final 10-min
elongation step at 72ºC.

56
PCR products (10 µl) were eletrophoresed on denaturing polyacrylamide
gels (6% acrylamide/bisacrylamide, 29:1, 5 M urea in TBE, pH 8.3). The gels were
silver stained.
2.4. Data Analyses
The identification of polymorphic markers in the parental individuals was
made through the analyses of 227 random primers. Primers that allowed the
amplification of the higher polymorphic loci numbers were selected. Selected
primers were analyzed in the map population. The presence/absence of each locus
in each individual was represented in a data matrix as h- and kk respectivaly. To
the SSR markers, the genotype of the parentals and of the hybrids was observed
in the F2 population. The χ2 test was utilized to verify if the genotypic frequencies
obtained were according to 3:1 for RAPD and 1:2:1 for the SSR loci.
2.5. Linkage map construction
The software JoinMap (Stam, 1993) were utilized with the Kosambi function,
to obtain the linkage map. We utilized a minimal LOD of 4.0 and a recombination
tax of 0.30. The nomenclature of the RAPD markers was made as the usual,
followed by the fragment size.

57
3. Results
3.1. RAPD amplifications.
Of the 227 primers tested for amplification, 86 (37.9%) do not amplified, 15
(6.6%) amplified only monomorphic loci and 126 (55.5%) amplified polymorphic
loci. Of those that amplified polymorphic loci, 15 amplified only one locus while 111
(48.89%) amplified between 2 and 9 loci. Of these 111 loci, 70 were selected for
the analysis in the map population, by its band intensity and repeatability. The
selected primers amplified on the average 3.07 polymorphic loci, ranging from 350
to 3000 bp. These 70 primers amplified 911 loci, 215 (23.6%) of then being
polymorphic between the parental species and showing segregation in the F2
population. Of the 215 loci amplified, 118 (54.88%) presented A. ipaënsis alleles
and 97 (45.12%) presented A. maqna alleles.
Polymorphic loci showed to be “monoparental” (in which the allele of one of
the parental individuals was detected and showed 1:1 segregation) or “biparental”
(found in both partentals and showing the expected 3:1 segregation). The X2
statistical analysis showed that the differences between the observed and
expected frequencies were not statistically significant (α = 0,050) in 190 (88.37%)
loci. Among the remaining loci, five (2.32%) of then showed 1:1 segregation and 20
(9.30%) of then showed distorted segregation, being 11 of then from A. ipaënsis
and nine of then from A. magna.
58
3.2. Linkage map
One hundred forty seven markers (139 RAPD and 8 microsatellites) were
mapped in 12 linkage groups (Figure 1), with 4 of LOD and 0.3 of recombination.
Linkage groups were sequentially numbered according to its number of markers,
being the first linkage group the one with the higher number of markers. Of the 215
RAPD markers, 139 (65.04%) were mapped. Of the 13 SSR markers, 8 were
mapped, being two of then (Seg2G05 e AHSI2D04) mapped in the linkage group 1,
one (SI7G04) in the linkage group 2, one (Ah282) in the linkage group 3, three
(AH126, Seg4B09 e RN27A10) in the linkage group 6 and one (Ap175) in the
linkage group 7.
The SSR markers are underlined in the Figure 1. eighty one markers were
not clustered, being 76 of then RAPD markers (47 A. ipaënsis from and 29 from A.
magna) and 5 of then SSR markers. The parental origin of the 139 mapped RAPD
markers is shown in Table 2. It is possible to observe that the markers of the
parental individuals are in similar frequencies in each cluster.
The length of the 10 major linkage groups ranged from 27.6 cM to 369.6 cM
(Table 2). The number of markers per linkage group ranged from 2 (Linkage
groups 11 and 12) to 24 (Linkage group 1). Some of the markers were mapped in
the same position (OPR8-2000 and OPG04-1900, OPAW12-300 and OPAW04-
1400 in the linkage group 1; OPZ03-2300 and OPU12-630 in the linkage group 2;
OPV09-1380 and OPU13-1350 in the linkage group 3; OPZ105-540 and OPZ09-
1900 in the linkage group 4; OPG03-880 and OPG03-750 in the linkage group 7;
OPG03-1180 and OPG04-380 in the Cluster 8). The distance between some of the

59
markers was very high. For example, OPB07-450 and OPA15-570 were mapped at
a distance of 40 cM. The total distance obtained for the linkage map was 2,061.2
cM and the average distance between loci was 12.8 cM (Table 2). Some linkage
groups presented markers linked at a very short distance (1.5 and 4.6 cM). Those
links were observed in the linkage groups 2 and 4. In these cases, the average
was 6.38 and 6.72 cM, respectively.
Of the 21 markers (20 RAPD and one SSR) that presented distorted
segregation, 16 were mapped in 7 linkage group. Among the 10 major linkage
groups the percentages of distorted loci ranged from 9.09% (Linkage group 8) to
33.33% (Linkage group 10, which is composed by only 3 markers). Of the 16
distorted loci, 10(62.5%) presented the A. ipaënsis allele in higher frequency while
six (37.5%) presented the A. magna allele (Table 3).
Of the eight SSR markers mapped, six were mapped as expected according
to the linkage map developed by Gobbi et al. (2006), i.e., in different clusters.
(Seg2G05, SI2D04, SI7G04, Ah282, RN27A10 and Ap175) or linked together
(Ah126 and Seq4B09).
4. Discussion
4.1 Loci distortion
Of the 228 individuals from the map population genotyped, 21 (9.2%)
presented distortion, being 20 RAPD loci and one SSR (Ah280). The percentage of
distortion was lower than that one found by Gobbi et al. (2006), which was of
60
17.7% among 94 SSR loci onto a map population also resulting from the cross
between A. ipaënsis and A. magna. The percentage of distorted loci was also
lower than that found by Halward et al. (1993) and Burow et al. (2001) (25%), onto
populations resulting from interspecific crosses utilizing RFLP markers. It was also
lower than that one obtained by Moretzsohn et al. (2005), which were of 44.13%
onto a population resulting from A. duranensis x A. cardenasii, utilizing SSR
markers. A wide range of distortion percentage was observed in map populations
of various species (Winter et al., 2000; Atieza et al. 2002, Thoquer et al. 2002;
Sargent et al., 2004). In an intraspecific cross of Mimulus guttatus, a model plant
for ecology and evolution studies, the percentage of SSR loci distorted was
74%(Hall & Wills, 2005), higher than the percentage of distorted RAPD loci found
for this species. Authors attributed the differences to the fact that SSR markers are
more informative, which would make than more sensible in the detection of
distorted loci. This could explain the differences observed among the present work,
based mainly on RAPDs, and other linkage maps for Arachis that utilized
codominant markers.
Evidences suggest a positive correlation between the percentage of loci
distortion and the level of genomic divergence between the species utilized in the
crossing (Hall & Willis, 2005). This suggests that, based on the frequency of
distorted loci found in this work (RAPD) and in the work of Gobbi et al., 2005
(SSR), A. ipaënsis and A. magna are less divergent than other Arachis species
crossed to generate linkage maps, such as A. stenosperma and A. cardenasii
(Halwart et al., 1993), [A. batizocoi x (A. cardenasii x A. diogoi)] and A. hypogaea
(Burow et al., 2001) and A. stenosperma and A. duranensii (Moretzsohn et al.,
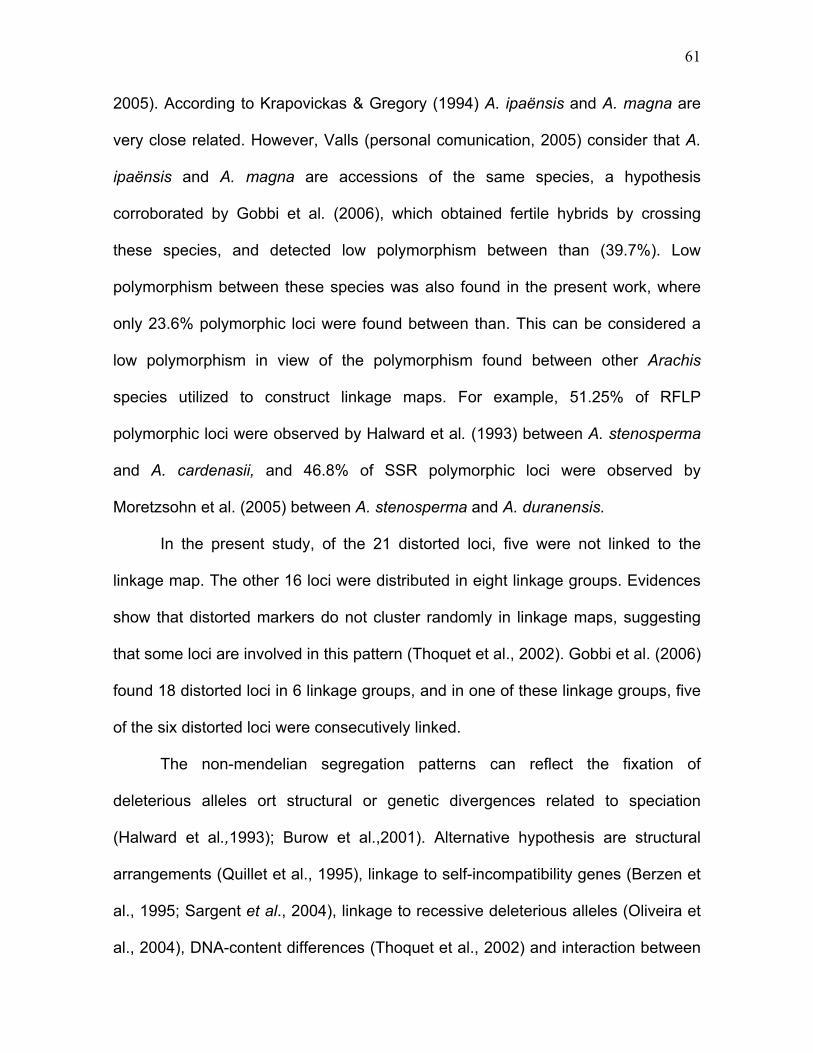
61
2005). According to Krapovickas & Gregory (1994) A. ipaënsis and A. magna are
very close related. However, Valls (personal comunication, 2005) consider that A.
ipaënsis and A. magna are accessions of the same species, a hypothesis
corroborated by Gobbi et al. (2006), which obtained fertile hybrids by crossing
these species, and detected low polymorphism between than (39.7%). Low
polymorphism between these species was also found in the present work, where
only 23.6% polymorphic loci were found between than. This can be considered a
low polymorphism in view of the polymorphism found between other Arachis
species utilized to construct linkage maps. For example, 51.25% of RFLP
polymorphic loci were observed by Halward et al. (1993) between A. stenosperma
and A. cardenasii, and 46.8% of SSR polymorphic loci were observed by
Moretzsohn et al. (2005) between A. stenosperma and A. duranensis.
In the present study, of the 21 distorted loci, five were not linked to the
linkage map. The other 16 loci were distributed in eight linkage groups. Evidences
show that distorted markers do not cluster randomly in linkage maps, suggesting
that some loci are involved in this pattern (Thoquet et al., 2002). Gobbi et al. (2006)
found 18 distorted loci in 6 linkage groups, and in one of these linkage groups, five
of the six distorted loci were consecutively linked.
The non-mendelian segregation patterns can reflect the fixation of
deleterious alleles ort structural or genetic divergences related to speciation
(Halward et al.,1993); Burow et al.,2001). Alternative hypothesis are structural
arrangements (Quillet et al., 1995), linkage to self-incompatibility genes (Berzen et
al., 1995; Sargent et al., 2004), linkage to recessive deleterious alleles (Oliveira et
al., 2004), DNA-content differences (Thoquet et al., 2002) and interaction between

62
divergent genomes. The interactions can occur in different phases of the
development and can alter genotypic frequencies of F2 populations through meiotic
drive (distortion among the viable F1 gametophytes), gametophytes competition or
pollen-pistil interaction, or differential viability of genotypic classes of F2 zygotes
(Hall & Willis, 2005). As the species utilized are autogamous (and consequently
highly homozygotous), the most probable causes of distortion here are structural
alterations and gene divergences.
4.2. Linkage map
The number of linkage groups obtained in this work is larger than the
haploid number of chromosomes found in both the parental species (x =10).
However, some linkage groups (10, 11 and 12) are composed by few markers and
they will certainly be linked to olther groups when more marker be added to this
map. For example, the linkage group 10 is composed by 3 markers, being two of
then from A. ipaënsis and one from A. magna.
The distance between some markers in some linkage groups were much
shorter than the average distance between markers (12.8 cM). Thuriaux et al.
(1997) suggests that the recombination is more intense among structural genes.
Moreover, there is a suppression of recombination in telomeric and centromeric
regions (Tanksley et al., 1992).
The average distance between markers (12.8 cM) indicates that the linkage
map obtained presents a low saturation when compared to linkage maps of high
saturation, e.g, the linkage map of Lotus japonicus, which is composed by 595

63
markers covering 376 cM, with an average distance between markers of 0.6 cM
and a maximum distance between markers of 11 cM (Sandal et al., 2002).
However, the average distance between markers is similar to that of some linkage
maps successfully utilized for the identification of QTLs. One example is the
linkage map that allowed the identification of Ascchyta rabiei resistance's QTLs
(Santra et al., 2002). This linkage map was constructed with 106 markers, covering
981.6 cM with an average distance between markers of 8.4 cM. Another example
is the linkage map that allowed the identification of QTLs related to aphid
resistance in sorghum, which was constructed with 113 markers, covering 1530 cM
with an average distance between markers of 13.53 cM (Agrama et al., 2002).
The linkage map obtained here presents a total length of 2,061.2 cM. The
first linkage map obtained for the genus Arachis covered a distance of 9.1 cM, and
was developed utilizing a F2 population from A. sternosperma x A. cardenasii, both
species with the A genome (Halward at al., 1993). Burow et al. (2001), utilizing a
tetraploid population (AABB), constructed a linkage map composed of 23 linkage
groups. This linkage map covered a distance of 2,210 cM with an average distance
between markers of 6 cM. Moretzsohn et al. (2005), utilizing a F2 population from
A. sternosperma x A. duranensis, both species diploid with the A genome,
constructed a linkage map with 170 SSR markers distributed in 11 linkage groups
and covering a distance of 1230,89 with an average distance between markers of
7.24 cM. The distance covered in the present study was higher than the distance
covered in the linkage map of the B genome constructed with the same cross
utilizing SSR markers (754.8 cM) and than the other linkage maps constructed for
Arachis. Brondani et al. (2002) observed an increase of 22% and 36% after the

64
inclusion of SSR markers in linkage maps of E. grandis and E. urophylla
constructed through RAPD markers. Agrama et al. (2002) observed an increase of
42.61% and 36.14% in the length of a linkage map of sorghum constructed using
RFLP markers after the inclusion of SSRs and RAPD. These variations in the
estimation of genome size probably are due differences in the size of the
populations utilized and in the criteria adopted to define the loci order (Brondani et
al., 2002). Moreover, linkage maps based on F2 populations are difficult to be
constructed because the recombination among markers can only be estimated
when markers are in coupling phase (Thoquet et al., 2002).
The parameters to the determinate the level of saturation and the value of a
linkage map are various. Casasoli et al. (2001) concluded that the linkage map that
they obtained presented a high level of saturation, once they found one cluster for
each chromosome of Castanea sativa Mill, plus a low number of markers not
linked. Thoquet et al. (2002), however, considered also the discrepancy between
the F2 map and the maps of each one of the parentals, plus the low frequency of
linked. Considering the parameters cited, the results of this work, with a number of
linkage groups higher than the haploid number of chromosomes, plus a high
number of markers not linked, suggest that the saturation level of the map still
needs improvement. Once that there are plenty SSR markers developed for A.
hypogaea (He et al., 2003; Ferguson et al., 2004; Palmieri et al., 2004; Moretzsohn
et al., 2005; Gobbi et al., 2006), and that the level of transferability of these
markers for related species is high (Hopkins et al., 1999; Moretzsohn et al., 2004;
Moretzsohn et al., 2005; Gobbi et al.,2006), the saturation of this linkage map will
be done through this class of marker, a much more informative marker than the

65
dominant RAPD marker. We intend also to include anchor markers from other
Leguminosae, such as Lotus japonica and Medicago sativa, model plants utilized
for a wide range of genetic applications, as linkage maps (Sagan et al. 1995;
Penmetsa & Cook, 1997; Perry et al., 2003; Kawaguchi et al., 2002), cDNA
libraries (Cowtiz et al., 1998; Gama et al., 1996; Györgyey et al., 2000; Asamizu et
al., 2004), long-insert libraries (Nam et al. 1999; Men et al., 2001; Nakamura et al.,
2002; Choi et al., 2004) and efficient methods of transformation (Chabaud et al.
1996; Trinh et al., 1998; Trieu et al., 2000).

66
Conclusions
This is the first linkage map Arachis species possessing the B genome an
close related to A. hypogaea, constructed via RAPD markers. The map was
constructed mainly through bi-parental markers (3:1). This means that both
parentals contributed with approximately the same number of markers (71 markers
of A. ipaënsis and 68 of A. magna). The development of linkage maps is a first step
in the integration of the biotechnologies to the genetic improvement via wild
species of peanuts. Linkage maps allow the detection of genes of agronomic
interest and the selection of progenies containing higher percentage of the
recurrent parental genotype. This linkage map is also the first step in the study of
important agronomic traits of A. hypogaea, such as the resistance to the rust
caused by Puccinia arachidis, one of the major causes of loss in peanuts
production (Pande & Narayana Rao, 2001).

67
6. References
Agrama, H.A., G.E. Widle, J.C. Reese, L.R. Campbell & M. R. Tuinstra, 2002.
Genetc mapping of QTLs associated with greenbug resistance and
tolerance in Sorghum bicolor. Theor Appl Genet 104: 1373-1378.
Agrianual, 2005. FNP Consultoria & AgroInformativos. www.fnp.com.br
Asamizu, E., Y. Nakamura, S. Sato & S. Tabata, 2004. Characteristics of the Lotus
Japonicus Gene Repertoire Deduced from Large-Scale Expressed
Sequence Tag (EST) Analysis. Plant Molecular Biology 54(3): 405 - 414.
Atienza, S.G., Z. Satovic, K.K. Petersen, O. Doistra & A. Martin, 2002. Preliminary
genetic linkage map of Miscanthus sinensis with RAPD markers. Theor Appl
Genet 105: 946-952.
Barzen, E., W. Mechelke, E. Ritter, E. Schulte-Kappert & F. Salamini, 1995. An
extended map of the sugar beet genome containing RFLP and RFLP loci.
Theor Appl Genet 90:189–193.
Brondani, R.P.V., C. Brondani & D. Grattapaglia, 2002. Towards a genus-wide
reference linkage map for Eucalyptus based exclusively on highly
informative microsatellite markers. Mol Genet Genomics 267: 338–347.
68
Burow, M.D., C.E. Simpson, A.H. Paterson & J.L. Starr, 1996. Identification of
peanut (Arachis hypogaea L.) RAPD markers diagnostic of root-knot
nematode (Meloidogyne arenaria (Neal) Chitwood) resistance. Mol Breed 2:
369-379.
Burow, M.D., C.E. Simpson, J.L. Starr & A.H. Paterson, 2001. Transmission
Genetics of Chromatin From a Synthetic Amphidiploid to Cultivated Peanut
(A. hypogaea L.): Broadening the Gene Pool of a Monophyletic Polyploid
Species. Genetics 159: 823-837.
Casasoli, M., C. Mattioni, M. Cherubibi & F. Villani, 2001. A genetic linkage map of
european chestnut (Castanea sativa Mill) based on RAPD, ISSR and
isozyme markers. Theor Appl Genet 102: 1190-1199.
Chabaud, M., C. Larsonnaud, C. Marmouget & T. Huguet, 1996. Transformation of
Barrel Medic (Medicago truncatula Gaertn.) by Agrobacterium tumefaciens
and regeneration via somatic embryogenesis of transgenic plants with the
MTENOD12 nodulin promoter fused to the GUS gene. Plant Cell Report 15:
305-310.
Choi, H.K., D. Kim, T. Uhm, E. Limpens, H. Lim, J.H. Mun, P. Kalo, R.V.
Penmetsa, A. Seres, O. Kulikova, B.A. Roe,T. Bisseling, G.B. Kiss & D.R.
Cook, 2004. A Sequence-Based Genetic Map of Medicago truncatula and
Comparison of Marker Colinearity with M. sativa. Genetics 166: 1463–1502.
69
CONAB – Companhia Nacional de Abastecimento, Disponível em:
[http://www.conab.gov.br/download/safra/AmendoimTotalSerieHist.xls]
Acesso em 11 fev.2005.
Cowtiz, PA., L.S. Smith & S.R. Long, 1998. Expressed sequence tags from a root-
hair enriched Medicago trucatula cDNA library. Plant Physiology 117: 1325-
1332.
Creste, S., S. Mui Tsai, J.F.M. Valls, M.A. Gimenes & C.R. Lopes, 2005. Genetic
characterization of Brazilian annual Arachis species from sections Arachis e
Heteranthae using RAPD Markers. Genetic Resources and Crop Evolution
52: 1079-1086.
Faleiro, F.G., V.A. Ragagnin, I. Schuster, R.X. Corrêa, P.I. Good-God, S.H.
Brommonshenkel, M.A. Moreira & E.G. Barros, 2003. Mapeamento de
genes de resistência do feijoeiro à ferrugem, antracnose e mancha-angular
usando marcadores RAPD. Fitopatologia Brasileira 28: 059-066.
Fávero, A. P., 2004. Cruzabilidade entre espécies silvestres de Arachis visando a
introgressão de genes de resistência a doenças no amendoim cultivado.
Piracicaba, 165 p. Tese (Doutorado) Escola Superior de Agricultura ‘Luiz de
Queiroz’, Universidade de São Paulo.

70
Ferguson, M.E., M.D. Burow, S.R. Schulze, P.J. Bramel, A.H. Paterson, S.
Kresovich & S. Mitchell, 2004. Microsatellite identification and
characterization in peanut (A. hypogaea L.). Theor Appl Genet 108: 1064-
1070
Ferreira, A.R., K.R. Foutz & P. Kein, 2000. Soybean genetic map of RAPD markers
assigned to an existing scaffold RFLP map. The American Genetic
Association 91: 392-396.
Ferreira, M. E. & D. Grattapaglia, 1998. Introdução ao uso de marcadores
moleculares em análise genética. Embrapa. 3º.Ed. Brasília: Embrapa-
CENARGEN.
Fernández, A. & A. Krapovickas, 1994. Cromosomas y evolucion em Arachis
(Leguminosae). Bonplandia 8: 127-220.
Gamas, P., F.D. Niebel, N. Lescure & J.V Cullimore, 1996. Use of a subtractive
hybridization approach to identify new Medicago trucatula genes induced
during root nodule development. Mol Microbe Interact 9: 233-242.
Garcia, G.M., H.T. Stalker & G. Kochert, 1995. Introgression analysis of an
interspecific hybrid population in peanuts (Arachis hypogaeaL.) usando
RFLP and RAPD markers. Genome 38: 166-176.

71
Garcia, G.M., H.T. Stalker, E. Shoroeder & G. Kochert, 1996. Identification of
RAPD, SCAR, and RFLP markers tightly linked to nematode resistance
genes introgressed from Arachis cardenasii into Arachis hypogaea. Genome
39: 836-845.
Gimenes, M.A., C.R. Lopes, M.L. Galgaro, J.F.M. Valls & G. Kochert, 2000.
Genetic variation and phylogenetic relatianships based on RAPD analyis in
Caulorrhizae, genus Arachis (Leguminosae). Euphytica 116: 187-195.
Gimenes, M.A., C.R. Lopes, M.L. Galgaro & J.F.M. Valls, 2002. Genetic
relationships among Arachis species based on AFLP. Genetics and
Molecular Biology 25 (3): 349-353.
Gobbi., A., C. Texeira, M. Moretzsohn, P. Guimarães, S. Leal-Bertioli, D. Bertioli,
C.R. Lopes & M. Gimenes, 2006. Development of a linkage map to species
of B genome related to the peanut (Arachis hypogaea – AABB). Artigo em
elaboração.
Grattapaglia, D. & R. Sederoff, 1994. Genetic linkage maps of Eucalyptus grandis
and E. urophylla using a pseudo-testcross mapping strategy and RAPD
markers. Genetics 137: 1121-1137.
Grieshammer, U. & J.C. Wynne, 1990. Isozyme variability in mature seeds of U.S.
peanut cultivars and collections. Peanut Sci 18: 72–75.

72
Györgyey, J., D. Vaubert, J.I. Jimenez'Zurdo, C. Charon, L. Troussard, A.
Kondorosi & E. Kondorosi, 2000. Analysis of Medicago trunculata nodule
expresses tags. Mol Plant Microbe Interact 13: 62-71.
Hall, M.C. & J.H. Willis, 2005. Transmission ratio distortion in intraspecific hybrids
of Mimulus guttatus: Implication for genomic divergence. Genetics 170: 373-
386.
Halward, T.M., H.T. Stalker, E.A. Larue & G. Kochert, 1991. Genetic variation
detectable with molecular markers among unadapted germplasm resources
of cultivated peanut and wild species. Genome 34: 1013-1020.
Halward, T., T. Stalker, E. LaRue & G. Kochert, 1992. Use of singleprimer DNA
amplifications in genetic studies of peanut (Arachis hypogaea L.). Plant Mol
Biol 18: 315–325.
Halward, T., H.T. Stalker, & G. Kochert, 1993. Development of an RFLP linkage
map in diploid peanut species. Theor Appl Genet 87: 379-384.
He, G. & C.S. Prakash, 1997. Identification of polymorphic DNA markers in
cultivated peanut (Arachis hypogaea L.). Euphytica 97: 143–149.

73
He, G., R. Meng, H. Gao, B. Guo, G. Gao, M. Newman, R. Pittman & C.S.
Prakash, 2005. Simple sequence repeat markers for botanical varieties of
cultivated peanut (Arachis hypogaea L.). Euphytica 142: 131-136.
Herselman, L., 2003. Genetic variation among Southern African cultivated peanut
(Arachis hypogaea L.) genotypes as revealed by AFLP analysis. Euphytica
133: 319–327.
Herselman, L., R. Thwaites, F.M. Kimmins, B. Courtois, P.J.A. Van Der Merwe &
S.E. Seal, 2004. Identification and mapping of AFLP markers linked to
peanut (Arachis hypogaea L.) resistance to the aphid vector of groundnut
rosette disease. Theor Appl Genet 109: 1426-1433.
Hopkins, M.S., A.M. Casa, T. Wang, S.E. Mitchell, R.E. Dean, G.D. Kochert & S
Kresovich, 1999. Discovery and characterization of polymorphic simple
sequence repeats (SSRs) in peanut. Crop Sci 39: 1243–1247.
Iruela, M., J. Rubio, F. Barro, J.I. Cubero, T. Millán & J. Gil, 2006. Detection of two
an intra-specific cross of chickpea (Cicer arietinum L.): development of
SCAR markers associated with resistance. Theor Appl Genet 112: 278-287.
Jung, S., P.L. Tate, R. Horn, G. Kochert, K. Moore & A.G. Abbott, 2003. The
phylogenetic relationship of possible progenitors of the cultivated peanut.
Journal of Heredity 94(4): 334-340.

74
Junghans, D.T., A.C. Alfenas, S.H. Brommonschenkel, S. Oda, E.J. Melo & D.
Grattapaglia, 2003. Resistance to rust (Puccinia psidii Winter) in Eucalyptus:
mode of inheritance and mapping of a major gene with RAPD markers.
Theor Appl Genet 108: 175-180.
Kameswara Rao, N., L.J. Reddy & P.J Bramel, 2003. Potential of wild species for
genetic enhancement of some semi-arid food crops. Genetic Resources and
Crop Evolution 50: 707-721.
Kawaguchi, M., H. Imaizumi-Anraku, H. Koiwa, S. Niwa, A. Ikuta, K. Syono & S.
Akao, 2002. Root, Root Hair, and Symbiotic Mutants of the Model Legume
Lotus japonicus. Molecular Plant Microbe Interactions 1: 17-26.
Kochert, G., T. Halward, W.D. Branch & C.E. Simpson, 1991. RFLP variability in
peanut (Arachis hypogaea L.) cultivars and wild species. Theor Appl Genet.
81: 565-570.
Kochert, G., H.T. Stalker, M. Gimenes, L. Galgaro, C.R. Lopes & K. Moore, 1996.
RFLP and cytogenetic evidence on the origin and evolution of allotetraploid
domesticated peanut Arachis hypogaea (Leguminosae). Amer Jour Bot 83:
1282-1291.

75
Koveza, O., Z. Kokaeva, F. Konovalov & S. Gostimsky, 2005. Identification and
mapping of polymorphic RAPD markers of pea (Pisum sativum L.) genome.
Russian Jorunal of Genetics 41: 262-268.
Krapovickas, A. & W.C. Gregory, 1994. Taxonomia del genero Arachis
(Leguminosae). Bonplandia 8: 1-186.
Men, A.E., K. Meksem, M.A. Kassem, D. Lohar, J. Stiller D. Lightfoot & P.M.
Greesshoff, 2001. A Bacterial Artificial Chromosome Library of Lotus
japonicus Constructed in an Agrobacterium tumefaciens-Transformable
vector. Molecular Plant Microbe Interactions 14: 422-425.
Michelmore, R.W., I. Paran & R.V. Kesseli, 1991. Identification of markers linked to
disease-resitance genes by bulked segregant analysis: A rapid method to
detect markers in specific genomic regions by using segregating
populations. Proc Natl Acad Sci USA 88: 9828-9832.
Moretzsohn, M.C., M.S. Hopkins, S.E. Mitchell, S. Kresovich, J.F.M. Valls & M.E.
Ferreira, 2004. Genetic diversity of peanut (Arachis hypogaea L.) and its
wild relatives based on the analysis of hypervariable regions of the genome.
BMC Plant Biol 4(11): 1-10.
Moretzsohn, M.C., L. Leoi, K. Proite, P.M. Guimarães, S.C.M. Leal-Bertioli, M.A.
Gimenes, W.S. Martins, J.F.M. Valls, D. Grattapaglia & D.J. Bertioli, 2005. A

76
microsatellite-based, gene-rich linkage map for the AA genome of Arachis
(Fabaceae). Theor Appl Genet 111: 1060-1071.
Nakamura, Y., T. Kaneko, E. Asamizu, T. Kato, S. Sato & S. Tabata, 2002.
Structural Analysis of a Lotus japonicus Genome. II. Sequence Features
and Mapping of Sixty-five TAC Clones Which Cover the 6.5-Mb Regions of
the Genome. DNA Research 9: 63–70.
Nam YW., R.V. Penmetsa, G. Endre, P. Uribe, D.J. Kim & D.R. Cook, 1999.
Construction of a bacterial artificial chromosome library of Medicago
truncutula and identification of clones containing ethylene-response genes.
Theor Appl Genet 98: 638-646.
Oliveira, R.P., M. Cristofani & M.A. Machado, 2004. Genetic linkage maps of ‘Pêra’
sweet orange and ‘Cravo’ mandarin with RAPD markers. Pesq Agropec
Bras 39: 159-165.
Openshaw, S.J., S.G. Jarboe & W.D. Beavis, 1994. Marker-assisted selection in
backcross breeding. In: ASHS/CSSA Joint Plant Breeding Symposium, 2,
Corvallis Proceedings. Corvallis: Oregon State University.
Palmieri, D.A.; M.D. Bechara, R.A. Curi, M.A. Gimenes & C.R. Lopes, 2004.
Isolation and characterization of microsatellite loci from forage species
Arachis pintoi (Genus Arachis). Mol Ecol Notes 1–3.
77
Pande, S. & J. Narayana Rao, 2001. Resistance of wild Arachis species to late leaf
spot and rust in greenhouse trials. Plant Diseases. 85: 851-855.
Penmetsa, R.V. & D.R. Cook, 1997. A legume ethylene insensitive mutant
hyperinfected by its rhizobial symbiont. Science 1997, 225: 527-530.
Perry, J.A., T.L. Wang, T.J. Welahm, S. Gardner, J.M. Pike, S. Yoshida & M.
Parniske, 2003. A tilling reverse genetics tool and a web-accessible
collection of mutants of the lugume Lotus japonicus. Plant Physiology 131:
866-871.
Quillet, M.C., N. Madjidian, Y. Griveau, H. Serieys, M. Tersac, M. Lorieux, A.
Berville 1995. Mapping genetic factors controlling pollen viability in an
interspecific cross in Helianthus sect. Helianthus.Theor Appl Genet
91:1195–1202.
Sagan, M., D. Morandi, E. Tarnghi & G. Duc, 1995. Selections of nodulation and
mycorhizal mutants in the model plant Medicago truncaluta Gaerth after
gamma rays mutagenesis. Plant Science 111: 63-71.
Sandal, N., L. Krusell, S. Radutoiu, M. Olbyrt, A. Pedrosa, S. Stracke, S. Sato, T.
kato, S. Tabata M. Parniske A. Bachmair T. Ketelsen & J. Stougaard, 2002.
A genetic linkage map of the model legume Lotus japonicus and strategies
for fast mapping of new loci. Genetics 161: 1673-1683.

78
Santos, A.S., R.E. Bressan-Smith, M.G. Pereira, R. Rodrigues & C.F. Ferreira,
2003. Genetc linkage map of Phaseolus vulgaris and identification of QTLs
responsible for resistance to Xanthomonas axonopodis pv. Phaseoli.
Fitopatologia Brasileira 28: 5-10.
Santra, D.K., M. Tekeoglu, M. Ratnaparkhe, W.J. Kaiser & F.J. Muehlbauer, 2000.
Identification and mapping of QTLs conferring resistance to aschyta blight in
chickpea. Crop Sci. 40: 1606-1612.
Sargent, D.J.; T.M. Davis, K.R. Tobutt, M.J. Wilkinson, N.H. Battey & D.W.
Simpson, 2004. A genetic linkage map of microsatellite, gene-specific and
morphological markers in diploid Fragaria. Theor Appl Genet 109: 1385-
1391.
Seijo, J.G., G.I. Lavia, A. Fernandez, A. Krapovickas, D. Ducasse & E.A. Moscone,
2004. Physical mapping of the 5s and 18s-25s rRNA genes by FISH as
evidence that Arachis duranensis and A. ipaënsis are the wild diploid
progenitors of A. hypogaea (Leguminosae). Amer Jour Bot 91(9): 1294-
1303.
Sharma, R., R.A.K. Aggarwal, R. Kumar, T. Mohapatra, & R.P. Sharma, 2002.
Construction of an RAPD linkage map and localization of QTLs for oleic acid

79
level using recombinant inbreds in mustard (Brassica juncea). Génome
45(3): 467-472.
Sharma, S.B., M.A. Ansari, K.S. Varaprasad, A.K. Singh & L.J. Reddy 1999.
Ressistance to Meloidogyne javanica in wild Arachis species. Genetic
Resources and Crop Evolution 46: 557-568.
Shoemaker, R.C., K. Polzin, J. Labate, J. Specht, E.C. Brummer, T. Olson, N.
Young, V. Concibido, J. Wilcox, J.P. Tamulonis, G. Kochert & H.R. Boerma,
1996. Genome duplication in soybean (Glycine subgenus soja). Genetics
144: 329-338.
Singh, A.K. & J.P. Moss, 1984. Utilization of wild relatives in genetic improvement
of Arachis hypogaea L. 5. Genome analysis in section Arachis and its
implications in gene transfer. Theor Appl Genet 68: 355–364.
Singh, A.K., H.T. Stalker & J.P. Moss, 1991. Cytogenetics and use of alien genetic
variation in groundnut improvement. In: Tsuchyia, T.; Gupta, P.K. (Eds.).
Chromosome engineering in plants: genetics, breeding, evolution. Part B.
Amsterdam: Elsevier Science Publishers B.V: 65-77.
Singh, A.K., J. Smartt, C.E. Simpson & S.N. Raina, 1998. Genetc variation vis-à-
vis molecular polymorphism in groundnut, Arachis hypogaea L. Genetic
Resources and Crop Evolution 45: 1119-126.
80
Singh, A.K. & J. Smartt, 1998. The genome donors of the groundnut/peanut
(Arachis Hypogaea L.) resiset. Genetic Resources and Crop Evolution 45:
113-118.
Subramanian, V., S. Gurtu, R.C. Nageswara Rae & S.N. Nigam, 2000.
Identification of DNA polymorphism in cultivated groundnut using random
amplified polymorphic DNA (RAPD) assay. Genome 43: 656–660.
Stam, P., 1993. Construction of integrated genetic linkage maps by means of a
new computer package: JoinMap. Plant J 3:739-744.
Tallury, S.P., K.W. Hilu, S.R. Milla, S.A. Friend, M. Alsaghir, H.T. Stalker & D.
Quandt, 2005. Genomic affinities in Arachis section Arachis(Fabaceae):
molecular and cytogenetic evidence. Theor Appl Genet 111: 1229-1237.
Tanksley, S.D., M.W. Ganal J.P. Prince, M.C. de Vicente, M.W. Bonierbale, P.
Broun, T.M. Fulton, J.J. Giovannoni, S. Grandilo, G.B. Martin, R.
Messeguer, J.C. Miller, L. Miller, A.H. Paterson, O. Pineda, M.S. Roder,
R.A. Wing, W. Wu & N.D. Yong, 1992. High density molecular linkage maps
of the tomato and potato genomes. Genetics 132: 1141 1160.
Thoquet, P., M. Gherardi, E-P. Journet, A. Kereszt, J-M. Ane, J-M. Prosperi & T.
Huguet, 2002. The molecular genetic linkage map of the model legume
Medicago truncatula: an essential tool for comparative legume genomics

81
and the isolation of agronomically important genes. BMC Plant Biology 2: 1-
13.
Thuriaux, P., 1977. Is recombination confined to structural gene on the eukaryotic
genome? Nature 268: 460 462.
Trieu, A.T., S.H. Burleigh, I.V. Kardailsky, I.E. Maldonado-Mendoza, W.K. Versaw,
L.A. Blaylock, H. Shin, T.J. Chiou, H. Katagi, G.R. Dewbre, D. Weige & M.J.
Harrison, 2000. Transformation of Medicago truncaluta via infiltration of
seedlings or flowering plants with Agrobacterium. Plant Journal J 22: 531-
541.
Trinh TH., P. Ratet, E. Kondorosi, P. Duarnd, K. Kamate, P. Bauer & A. Kondorosi,
1998. Rapid and efficient transformation of diploid Medicago truncatula and
Medicado sativa spp falcate lines improved in somatic embryogenesis. Plant
Cell Report 17: 345-355.
Valls, J.F.M. & C.E. Simpson, 2005. New species of Arachis (Leguminosae) from
Brazil, Paraguay and Bolivia. Bonplandia 14(1-2): 35-63.
Winters,C.J., L. Zimniak, M.V. Mikhailova, W.B. Reeves & T.E. Andreoli, 2000. Cl−
Channels in Basolateral TAL Membranes XV. Molecular Heterogeneity
Between Cortical and Medullary Channels. J. Membrane Biol 177: 221–230.

Table 1 - Sequence and annealing temperature of the SSR primers utilized to genotype the individuals of the map
population
Loci Primer Forward (5´-3´) Primer reverse (5´-3´) Motif T.A. References
Ah282 gccaaacacaccacatttca Gcctccaatcccaaacacta (CCA)6..(AAG)6 50ºC Gimenes (no publ.)
IBGSI1007G04 tgcaagaagatcaaaaagca Tctgcacaaccttgttttca 52ºC Gimenes (no publ.)
Ap175 cccaataggctaattcagaagg gccttattttgcgactgagg (CT)15 52ºC Palmiere et al., 2004
GPSeg2G05 aggaggaacaatcccatagaa tacattacgcccttttggtg (TAA)9 + (CAA)5 60ºC Moretzsohn et al., 2005
Ah280 cgtcctcgttattctctgaa tctctgaattgaagaagagttatg (CA)14..(CA)5 52ºC Gimenes (no publ.)
Ap152 agaggatgcagcggagtaga ctggccaattcctatgatcg (AG)23 50ºC Gimenes (no publ.)
Ah1TC1G04 tgctgtgagagaaatggcag gcgcattcttcgattaaagg (TTC)5 + (TC)33 56ºC Moretzsohn et al., 2005
AHBGSI1002D04 cggggatgttgctcatgtc atggctccaagcagtgtgaa 52ºC Gimenes (no publ.)
AS1RN27A10 52ºC Moretzsohn (no publ.)
Ah35 gtaaatgctaacaataaccacaa ccccaaggggaatagtggta (AT)19(GA)16 52ºC Gimenes (no publ.)
Ah126 ccctgccactctcactcact cgtacaagtcagggggtgac (GA)8..(GA)9 50ºC Gimenes (no publ.)
Ah21 cttggagtggagggatgaaa ctcactcactcgcacctaacc (GAA)9 50ºC Moretzsohn et al., 2005
PPGPSeg4B09 aaacatccagcaaacgaaga gacaactaaatccttgttcctagc (CA)7 56ºC Moretzsohn (no publ.)
82

Table 2. Information about the 12 linkage group obtained.
Linkage
group
Number
of
markers
(3:1)
segregation
markers
(1:1)
segregation
markers
SSR
markers
Distorted
markers
Number of
RAPD markers
of the female
parental A.
ipaënsis
Number of
RAPD markers
of the male
parental A.
magna
Average
distance
between
markers (cM)
Linkage group
length
(cM)
1 24 18 1 2 3 16 6 15.4 369.6
2 22 17 0 1 4 10 11 14.8 326.0
3 17 14 0 1 2 8 8 15.5 265.7
4 16 16 0 0 0 10 6 14.2 228.3
5 14 14 0 0 0 5 9 15.5 217.4
6 14 8 1 3 2 5 6 13.8 194.3
7 15 11 1 1 2 9 5 12.3 185.5
8 11 10 0 0 1 3 8 10.1 110.8
9 7 7 0 0 0 2 5 13.8 97.2
10 3 2 0 0 1 1 2 9.2 27.6
11 2 2 0 0 0 1 1 13.4 26.9
12 2 1 0 0 1 1 1 5.9 11.9
147 120 (81.63%) 3 (2.04% %) 8 (5.44%) 16 (10.88%) 71 (51.07%) 68 (48.93%) x =12.8 2.061.2
83

Table 3. Information about the distorted RAPD and SSR markers.
Linkage
group
Number of
markers
RAPD
markers
Microssatélites
markers
Distorted
markers
Distorted RAPD
markers in A.
ipaënsis
Distorted RAPD
markers in A.
magna
Distorted SSR
markers
1 24 22 2 3 2 1 0
2 22 21 1 4 3 1 0
3 17 16 1 2 1 1 0
4 16 16 0 0 0 0 0
5 14 14 0 0 0 0 0
6 14 11 3 2 2 0 0
7 15 14 1 2 1 1 0
8 11 11 0 1 0 1 0
9 7 7 0 0 0 0 0
10 3 3 0 1 1 0 0
11 2 2 0 0 0 0 0
12 2 2 0 1 0 1 0
147 139 (94.56%) 8 (5.44%) 16 (10.88%) 10 (62.5%) 6 (37.5%) 0
84

85
Figure 1. Linkage map developed for the B genome of peanut. A total of 147 markers (139
RAPD and 8 SSR) were mapped in 12 linkage groups, covering 2,061.2 cM of
the genome, utilizing a 4.0 LOD score and a recombination frequency of 0.3
Markers are identified according to the usual nomenclature (number of the
primer followed by the size of the fragment). Markers with distorted
segregation are identified with a dot (.) and SSR markers are underlined.

86
Continuation figure 1.


