
CER
N-T
HES
IS-2
012-
008
14/0
2/20
12
Universidade de Aveiro Departamento de Engenharia Cerâmica e do Vidro
2012
João Pedro Fernandes Ramos
Efeito da Microestrutura do Óxido de Cálcio na Difusão de Isótopos Effect of Calcium Oxide Microstructure on the Diffusion of Isotopes


Universidade de Aveiro 2012
Departamento de Engenharia Cerâmica e do Vidro
João Pedro Fernandes Ramos
Efeito da Microestrutura do Óxido de Cálcio na Difusão de Isótopos Effect of Calcium Oxide Microstructure on the Diffusion of Isotopes

University of Aveiro 2012
Department of Ceramics and Glass Engineering
João Pedro Fernandes Ramos
Effect of Calcium Oxide Microstructure on the Diffusion of Isotopes
Dissertation presented to the University of Aveiro in the fulfillment of the requirement for the awarding of the Masters in Materials Science and Engineering carried out under the supervision of Prof. Doutora Ana Maria Oliveira Rocha e Senos, Associate Professor in the Department of Ceramics and Glass Engineering of the University of Aveiro, and Doctor Thierry Stora, Target and Ion Source Team Leader, at the ISOLDE Facility, at the European Organization for Nuclear Research (CERN).
Financial support from CERN and Agência de Inovação, S.A. under the Grant SFRH/BEST/51352/2011.


I dedicate this work to my beloved girlfriend and to my family, to whom I owe everything…

The Board of Examiners
president Prof. Doutor Jorge Ribeiro Frade Full professor from University of Aveiro, Portugal
Doutor João Guilherme Martins Correia Principal Researcher from ITN - Nuclear and Technological Institute, Sacavém, Portugal
Prof. Doutora Ana Maria de Oliveira Rocha e Senos Associate professor from the University of Aveiro, Portugal (Supervisor)
Doctor Thierry Stora Target and Ion Source Development Team Leader, ISOLDE Facility, CERN – European Organization for Nuclear Research, Switzerland (Co-supervisor)


Acknowledgements Firstly of all I would like to thank my supervisors, Prof. Doutora Ana Senos and Dr. Thierry Stora, for the guidance through this work: not only because they were my scientific mentors but also because of their personal support and motivation. At the University of Aveiro, I’m thankful to Maria João Bastos, Célia Miranda, Ana Ribeiro and Marta Ferro which are responsible for the material characterization tests in the Department of Ceramic and Glass Engineering. Thank for all the availability, patience, support and sympathy. Also to Professors Rui Ferreira, Margarida Almeida and Jorge Frade and for providing part of the essential equipment to my studies. I would also like to thank my colleagues and friends from University of Aveiro, which not only gave me support in the work itself, but also personally. Thank you Cristina Fernandes, Erika Davim, Luís Vilhena, Filipe Davim, João Pereira, Sónia Patrício, Liliana Pires, Ana Rondão, Patrick de Sousa and others. At CERN I would like to thank my friend and office mate, Alexander Gottberg, for everything, not only the help and motivation at work, but also for the warm welcoming at this new life and for the good times we passed together. I’m also thankful to Tânia Mendonça, Bernard Crepieux, Magdalena Kowalska, Michał Czapski, Christoph Seiffert, Martin Breitenfeldt, Gonzalo Izquierdo, Monika Stachura, Michael Owen, Jens Roder, Susanne Kreim, Dr. João Guilherme Correia, Thomas Schneider and all the other colleagues of the ISOLDE group. For the personal support, even though we were very far apart, I want to thank my Portuguese friends Luís Duarte, Francisco Duarte, Rui Figueiredo, Diva Carreira and André Santos. I’m also grateful to my Portuguese friends and fellows at CERN: Luís Alberty, Gabriel Ribeiro, Vitor Gouveia, Dora Rio and David Rogrigues for all those fun trips and moments we pass together in Switzerland. To the most important persons in my life, my sweet Diana and my family, I’m grateful for the constant and undeniable support. You were always there for me even when I was not for you, especially Diana to whose effort I’ll be always grateful. I would like to also thank Agência de Inovação, S.A. (Adi) and CERN for the financial support since April of 2011. I’m especially grateful to Adi for the selection and trust in me for this job and training at CERN To everyone who directly and indirectly contributed to this work, I’m grateful for support in the fulfillment of my dream of working in science research and at such great organization as CERN.

keywords radioactive ion beams, CaCO3 decomposition, CaO sintering, diffusion, CaO reactivity, CERN, ISOLDE, ISOL
summary Calcium oxide (CaO) powder targets have been successfully used at CERN-ISOLDE to produce neutron deficient exotic argon and carbon isotopes under proton irradiation at high temperatures (>1000oC). These targets outperform the other related targets for the production of the same beams. However, they presented either slow release rates (yields) from the beginning or a rapid decrease over time. This problem was believed to come from the target microstructure degradation, justifying the material investigation. In order to do so, the synthesis, reactivity in ambient air and sintering kinetics of CaO were studied, through surface area determination by N2 adsorption, X-ray diffraction for crystalline phase identification and crystallite size determination, and scanning and transmission electron microscopy to investigate the microstructure. The synthesis studies revealed that a nanometric material is obtained from the decarbonation of CaCO3 in vacuum at temperatures higher than 550oC, which is very reactive in air. This reactivity was studied, and it was observed that the CaO powder microstructure is changed through the reaction with air (hydration and carbonation of the oxide) and that this change is not completely reversible after thermal decomposition of the reaction products. Therefore, special care was taken in the target handling at CERN-ISOLDE. From the sintering kinetics, studied in the range of 1000-1200oC, it was determined that this material’s microstructure degrades, with the reduction of the specific surface area and decrease of the powder porosity. At 1200oC, the specific surface area reduction is accentuated, reaching values of 50% of surface area reduction in 10h. These results suggest that the use of high temperatures, equal or higher than 1000oC must be avoided, if the microstructural characteristics of the targets are to be preserved. At CERN-ISOLDE, selected conditions for synthesis, handling of the target and target operation temperatures were chosen, based on the previous material research, and the obtained target material was tested under proton irradiation. From the online studies, the newly developed target proved to show better initial and stable over time release rates of almost all isotopes investigated and especially the exotic ones. These results are essentially due to the nanometric characteristics of the produced target and to the use of operation and handling conditions that decreased the degradation of the microstructural characteristics. Diffusion studies of Ar and Ne were also done in CaO through the application of a mathematical model, to the release curves of the respective isotopes at different temperatures, which enables the determination of the respective diffusion coefficients and activation energies.

palavras-chave Feixes de iões radioativos, decomposição de CaCO3, sinterização de CaO, difusão, reatividade do CaO, CERN, ISOLDE, ISOL
resumo Alvos de pós de oxido de cálcio (CaO) têm sido usados, com sucesso, no CERN-ISOLDE para produzir isótopos de Árgon (com défice de neutrões) e de carbono, sob irradiação com protões a alta temperatura (>1000oC). Estes alvos têm mostrado um desempenho superior a outros alvos usados para produzir os mesmos feixes. Contudo, apresentam baixas taxas de libertação de isótopos desde o início de operação ou uma redução rápida com o tempo. Suspeitou-se que este problema se devia à degradação da microestrutura do material, justificando a sua investigação. Assim, a síntese, reatividade em ar ambiente e a cinética de sinterização do CaO foram estudadas, nomeadamente através da determinação da área superficial especifica por adsorção de N2, difração de raios-X para identificação de fases e determinação do tamanho de cristalite e microscopia eletrónica de varrimento e transmissão para o estudo da microestrutura. Os estudos de síntese do CaO revelaram que um material nanométrico, e muito reativo em ar, é obtido através da descarbonatação do CaCO3 em vácuo a temperaturas superiores a 550oC. Esta reatividade foi estudada e observou-se que a microestrutura do pó de CaO é alterada por reação com o ar (hidratação e carbonatação do óxido) e que esta alteração não é totalmente reversível após decomposição térmica dos produtos de reação. Assim, foram tomados cuidados especiais no manuseamento dos alvos de CaO. Da cinética de sinterização, estudada na gama de 1000-1200oC, foi concluído que a microestrutura deste material se degrada com redução da área superficial específica e diminuição da porosidade do pó. A 1200oC, a redução da área superficial específica é acentuada, atingindo-se valores de 50% de redução em cerca de 10h. Estes resultados indicam que a utilização de temperaturas elevadas, iguais ou superiores a 1000oC, devem ser evitadas se se pretendem preservar as características microestruturais dos alvos. No CERN-ISOLDE, as condições de síntese, de manuseamento do material e temperatura de operação do alvo foram escolhidas, com base nos estudos anteriores, e o material resultante foi testado sobre irradiação de protões. Dos estudos online, o alvo desenvolvido provou ter melhores taxas de libertação iniciais e que se mantêm ao longo do tempo de libertação, comparativamente a outros alvos de CaO previamente usados no CERN-ISOLDE. Isto verificou-se em praticamente todos os isótopos estudados, especialmente nos exóticos. Estes resultados foram atribuídos às caraterísticas nanométricas do alvo produzido e à utilização de condições de manuseamento e de operação, tais que a degradação das características microestruturais do alvo é reduzida. Estudos de difusão de Árgon e Néon foram feitos no CaO através da aplicação de um modelo matemático às curvas de libertação dos respetivos isótopos a diferentes temperaturas de operação, que permitiram a determinação dos respetivos coeficientes de difusão e energias de ativação.

Effect of Calcium Oxide Microstructure on the Diffusion of Isotopes
i
Table of Contents
List of Figures ......................................................................................................... iii
List of Tables ......................................................................................................... vii
Lists of Symbols and Abbreviations ........................................................................ ix
Introduction .......................................................................................................... 1
Chapter I - State of the Art ................................................................................... 5
I.1 Radioactive Ion Beams ................................................................................ 7
I.1.1 The Chart of the Nuclides ............................................................................................... 8 I.1.2 Radioactive Ion Beam Applications ................................................................................ 9 I.1.3 Production of Radioactive Ion Beams ............................................................................ 9
I.2 ISOLDE at CERN ...................................................................................... 12
I.2.1 Layout of ISOLDE Facility ............................................................................................ 13 I.2.2 Target Unit .................................................................................................................... 16 I.2.3 ISOLDE Pulse Shape ................................................................................................... 17
I.3 Target Materials ......................................................................................... 19
I.3.1 Diffusion ........................................................................................................................ 20 I.3.1.1 Main Diffusion Mechanisms ................................................................................. 21 I.3.1.2 Factors Influencing Diffusion ................................................................................ 22 I.3.1.3 Diffusion and ISOLDE Release Curve ................................................................. 22
I.3.2 Effusion ......................................................................................................................... 25 I.3.3 Other Important Material Requirements ....................................................................... 25
I.4 Calcium Oxide Nanopowders .................................................................... 26
I.4.1 General Characteristics ................................................................................................ 28 I.4.2 Calcination .................................................................................................................... 29
I.4.2.1 Effect of the Atmosphere and Temperature ......................................................... 31 I.4.2.2 Influence of the Precursor .................................................................................... 33
I.4.3 Reactivity in Air ............................................................................................................. 34 I.4.4 Sintering of Calcium Oxide ........................................................................................... 35
Chapter II - Experimental Procedure ................................................................. 39
II.1 Characterization Techniques ............................................................... 41
II.1.1 X-Ray Diffraction - XRD .............................................................................................. 41 II.1.2 Surface Area and Porosity Measurements through Isotherm Determination –
BET/BJH .................................................................................................................................. 42 II.1.3 Differential Thermal and Thermogravimetric Analysis – DTA/TGA ............................ 44 II.1.4 Scanning Electron Microscopy – SEM/STEM ............................................................ 44

Effect of Calcium Oxide Microstructure on the Diffusion of Isotopes
ii
II.1.5 Transmission Electron Microscopy - TEM .................................................................. 45 II.1.6 Tape Station – Release Curves Measurement at ISOLDE ........................................ 45
II.2 Raw Material ........................................................................................ 47
II.3 Calcination ........................................................................................... 49
II.4 Calcium Oxide Reactivity Tests ............................................................ 51
II.4.1 Sample Storage .......................................................................................................... 51
II.5 Microstructural Evolution During Vacuum Sintering ............................. 52
II.6 Material Testing at ISOLDE-CERN ...................................................... 53
II.6.1 CaO Target Production at ISOLDE: “Old Procedure” ................................................. 53 II.6.2 CaO Target Production at ISOLDE: “New Procedure” ............................................... 54
II.7 Beam Tests at ISOLDE-CERN ............................................................. 56
II.7.1 Offline Measurements ................................................................................................. 56 II.7.2 Online Operation ......................................................................................................... 56
Chapter III - Results and Discussion ................................................................ 59
III.1 Material Characterization Study ........................................................... 61
III.1.1 Synthesis of CaO .................................................................................................. 61 III.1.2 Reactivity in Air ..................................................................................................... 66 III.1.3 Sintering Kinetics of CaO ..................................................................................... 70
III.2 Material Testing at ISOLDE-CERN ...................................................... 73
III.3 Online Studies ...................................................................................... 76
III.3.1 Isotope Yields ....................................................................................................... 76 III.3.2 Yields Over Time .................................................................................................. 77 III.3.3 Isotope Release Properties .................................................................................. 79 III.3.4 Diffusion and Effusion of Isotopes ........................................................................ 80
Chapter IV - Conclusions ................................................................................... 87
IV.1 Conclusions .......................................................................................... 89
IV.2 Outlook ................................................................................................. 90
References ........................................................................................................... 93
Appendix............................................................................................................. 101
Effect of Calcium Oxide Microstructure on the Diffusion of Isotopes
iii
List of Figures
Figure I-1 - Chart of the nuclides, where the proton, neutron and fission driplines (Bp, Bn,
BF) can be seen. Vertical and horizontal lines represent the magic numbers and the colors
the decay modes of radioactive isotopes. 11 ........................................................................... 8
Figure I-2 - CERN accelerator complex. The types of beams (different colors) produced at
CERN and their paths, can be seen, as well as the main experiments. 1.............................. 13
Figure I-3 - Layout of the ISOLDE facility, describing all the steps of the process and
zones. 17 ................................................................................................................................ 14
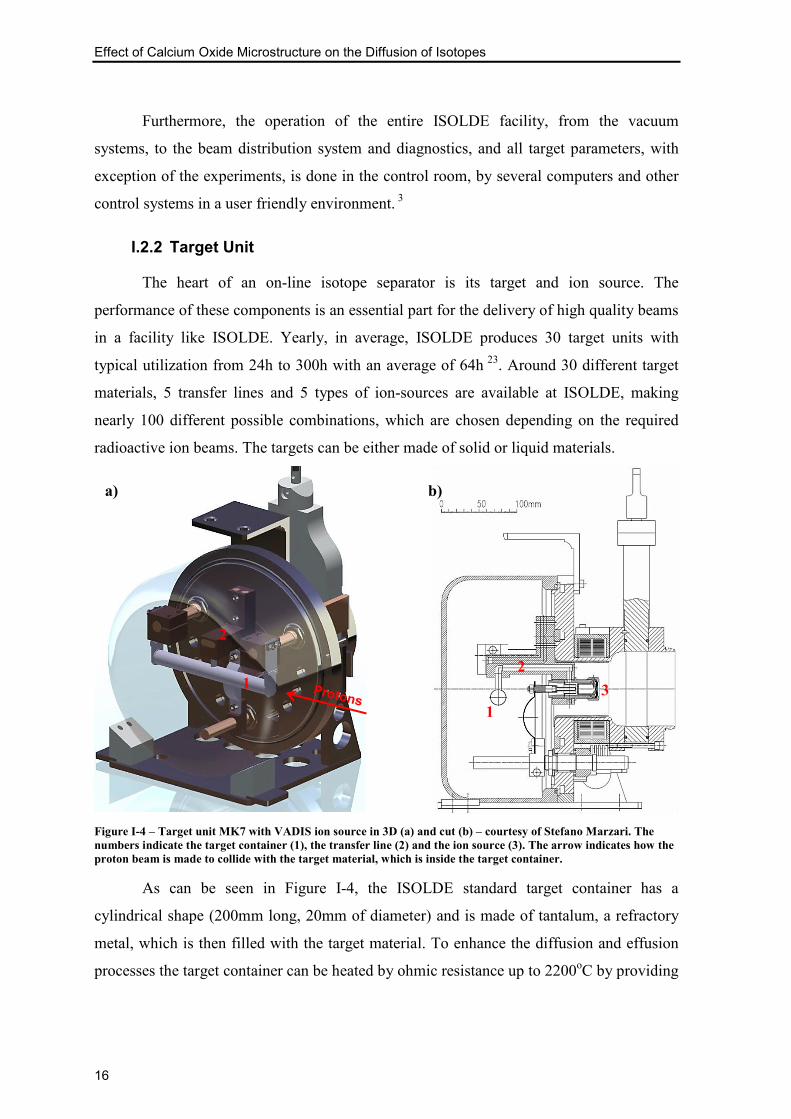
Figure I-4 – Target unit MK7 with VADIS ion source in 3D (a) and cut (b) – courtesy of
Stefano Marzari. The numbers indicate the target container (1), the transfer line (2) and the
ion source (3). The arrow indicates how the proton beam is made to collide with the target
material, which is inside the target container. ..................................................................... 16
Figure I-5 - Theoretical release curve, where final release curve display a fast and a slow
component (courtesy of Alexander Gottberg). .................................................................... 18
Figure I-6 – (a) Simulation of the ISOLDE in-target isotope production yields for calcium
oxide material with a thickness of 7g/cm2 done with ABRABLA. (b) Best historical
experimental yields obtained by the CaO target material at ISOLDE. The filled marks were
measured at the actual ISOLDE installations (PSB), the unfilled marks were measured in
the old ISOLDE installation near the SC. 43 ........................................................................ 27
Figure I-7 - Standard free energy of a reaction in function of the temperature. The dashed
lines represent the equilibrium of the gas pressure above the reactions. 30 ......................... 29
Figure I-8 - Representation of the CaCO3 decomposition and the formation of the porous
layer of CaO. 30 .................................................................................................................... 30
Figure I-9 - Mechanisms of solid state sintering. Only 4 to 6 cause densification, but all
cause neck growth influencing densification. 30 .................................................................. 36
Figure II-1 – Picture of the fast tape station at ISOLDE (a), scheme of the RIB production
until it arrives at the tape station 26 (b) and schematic representation of the tape station
operation to build the release curve 26 (c). ........................................................................... 46
Figure II-2 - XRD of the raw material, CaCO3, used to produce CaO. .............................. 47
Figure II-3 - Thermal analysis of calcium carbonate in air atmosphere. ............................. 48
Effect of Calcium Oxide Microstructure on the Diffusion of Isotopes
iv
Figure II-4 – SEM observation of the CaCO3 powder (a) and particle size distribution
determined by laser diffraction (b). ..................................................................................... 48
Figure II-5 – Furnace temperature and pressure readouts for the samples calcined at 600oC
(a), 700oC (b) and 800oC (c). The beginning of the reaction (A) and end (B) are marked on
the figure. ............................................................................................................................ 50
Figure II-6 – Pumpstand used to produce the CaO at ISOLDE. In the picture: the oven (a),
the turbo pump (b), and below a rotary pump (c), the controls for the water cooling and
others (d), the bottle of Ar to purge the system (e) and the window used to measure the
temperature with the pyrometer (f). .................................................................................... 54
Figure II-7 – Gloves box used to do the material change to the target unit. In the picture:
the pre-chamber (a), the gloves box main chamber (b), a bottle of Ar to fill both pre-
chamber and main chamber (c) and a rotary pump (d). ...................................................... 56
Figure II-8 - Schematic representation of a target container indicating the sides (a) and the
center (d) of it, where the transfer line is also represented (c). ........................................... 57
Figure III-1 - Plot of the specific surface area (SSA) and the crystallite size (XS) versus
temperature for the calcined powder, obtained under similar vacuum conditions, and 2h of
holding time. ........................................................................................................................ 62
Figure III-2 – SEM Microstructure of the CaCO3 powder (a), the N80 sample (b), a high
resolution SEM at the N80 sample (c) and STEM done to N80 sample (d). ...................... 63
Figure III-3 – TEM observations of CaO sample, N80. ...................................................... 64
Figure III-4 - Isotherms obtained by adsorption of N2 for the samples D80 and D10. ...... 65
Figure III-5 - Pore size distribution of the samples N80 and D10. ..................................... 65
Figure III-6 - Thermal analysis of the N80 sample after decomposition and normal
handling (a) and after intentional exposure at air for 2 days (b). ........................................ 67
Figure III-7 - XRD of the N80 powder after normal handling (a) and left at air for 2 days
(b). ....................................................................................................................................... 68
Figure III-8 - Plot of the weight gain over two days for three samples of CaO with different
initial surface areas (a) and respective amplification for shorter times (b). The dotted line
represents the weight gain if the powder would be completely hydrated. .......................... 68
Figure III-9 - Plot of the specific surface area versus the temperature for 3 min and 10h of
thermal treatment. The isolated point corresponds to the initial powder. ........................... 70

Effect of Calcium Oxide Microstructure on the Diffusion of Isotopes
v
Figure III-10 - Plot of the surface areas versus temperature for several temperature and
respective fits. ...................................................................................................................... 71
Figure III-11 - Plot of the diameter variation with time at 1200oC. .................................... 72
Figure III-12 – Arrhenius plot accordingly to the equation (I.28), from the German and
Munir model 71. .................................................................................................................... 72
Figure III-13 – SEM micrographs of the sintered samples at 1200oC for 3 min, a) and d),
2h, b) and e) and 10h c) and f). ............................................................................................ 73
Figure III-14 - Yield evolution on 32Ar on target CaO#191 in 2001 at ISOLDE (courtesy of
Susanne Kreim) and 31Ar in CaO#408. ............................................................................... 78
Figure III-15 - Yields of 35Ar measured throughout the run for targets CaO#469 and
CaO#419. ............................................................................................................................. 78
Figure III-16 – Example of release curve and respective fit, from equation (I.2), for 35Ar at
520oC (a) and release efficiency obtained through the fitting of the experimental release
curves of 35Ar for three different temperatures (b) in target CaO#469. .............................. 81
Figure III-17 – Example of release curve and respective fit, from equation (I.2), for 19Ne at
520oC (a) Release efficiency obtained through the fitting of the experimental release curves
of 19Ne for three different temperatures in target CaO#469. ............................................... 83
Figure III-18 - Plot of the ln(D) vs 1/T in order to determine D0 and Q for 19Ne and 35Ar
(the latter by a different method. ......................................................................................... 85

Effect of Calcium Oxide Microstructure on the Diffusion of Isotopes
vii
List of Tables
Table I-1- Table with target materials most used at ISOLDE: Tm is the melting point
temperature, Tmax is the maximum operation temperature, pvap is the vapor pressure, ρ is
the theoretical density and ζ is the target thickness. 28 ........................................................ 19
Table I-2 – General characteristics of calcium oxide. 47 ...................................................... 28
Table I-3 – Summary of precursors form, calcinations conditions and CaO powders
characteristics reported in the open literature. ..................................................................... 32
Table I-4 – Kinetic exponents for surface area and shrinkage in initial stage models. 33,73 37
Table II-1 – Shape factors and respective packing fractions for different powder
geometries. 80 ....................................................................................................................... 43
Table II-2 – Characteristics of the raw material (CaCO3). .................................................. 49
Table II-3 - Experimental conditions used to decompose CaCO3 into CaO, in vacuum. ... 50
Table II-4 - Weight gain of one CaO sample with different desiccants. ............................. 51
Table II-5 - Experimental conditions in CaO sintering experiments................................... 52
Table II-6 - Calcination conditions for the "old process" of the CaO target production at
ISOLDE. .............................................................................................................................. 54
Table II-7 - Calcination conditions for the "new process" of the CaO target production at
ISOLDE. .............................................................................................................................. 55
Table II-8 - Summary of the online measurements and tests done on target CaO#469. ..... 57
Table III-1 – Summary of the decomposition conditions and characteristics of the obtained
powders. ............................................................................................................................... 61
Table III-2 – Powder characteristics before and after air exposure and reversibility thermal
tests. ..................................................................................................................................... 69
Table III-3 – Characterization of the CaO powders produced at ISOLDE, by the old target
production method before (T12) and after a thermal treatment at 1200oC, 48h (S12). ....... 74
Table III-4 – Characterization of the CaO powders produced at ISOLDE, using the new
targets procedure (T80 and S80 and comparison with CaO powder obtained at UA (N80).
............................................................................................................................................. 74
Table III-5 – Measured yields and respective conditions for target CaO#469 and the
comparison with database yields. ........................................................................................ 76
Effect of Calcium Oxide Microstructure on the Diffusion of Isotopes
viii
Table III-6 - Release time constants obtained by fitting the data with equation (I.2) for
target CaO#419 and CaO#469 for 35Ar. .............................................................................. 79
Table III-7 - Calculation of the release efficiency for Ar isotopes for the target CaO#469
and other older targets. Yprod calculated from ABRABLA simulation for the different
target thicknesses. ................................................................................................................ 80
Table III-8 - Fitted effusion and diffusion parameters for 35Ar for three different
temperatures on target CaO#469. ........................................................................................ 81
Table III-9 - Obtained diffusion parameters (neglected contribution from effusion) through
the release efficiency of 35Ar for three different temperatures on target CaO#469. ........... 82
Table III-10 - Obtained effusion and diffusion fitted parameters for 19Ne for three different
temperatures on target CaO#469. ........................................................................................ 84
Table III-11 - Values of Q and D0 and respective R2 for 19Ne and 35Ar. ............................ 85
Table A-1 - Characteristics of the raw material (CaCO3) used at ISOLDE to produce past
CaO targets in the past (CC2). .......................................................................................... 101
Effect of Calcium Oxide Microstructure on the Diffusion of Isotopes
ix
Lists of Symbols and Abbreviations
Symbols
A Atomic mass
α Weight factor between fast falling and slow falling
BF Fission dripline
Bn Neutron dripline
Bp Proton dripline
C Concentration of the diffusion species
γ Exponent related to the sintering mechanism related with surface area reduction
D Diffusion coefficient
D0 Diffusion pre-exponential factor
λf Decay constant for the fast fall of the release curve
λi Isotope decay constant
λr Decay constant for the rise of the release curve
λs Decay constant for the slow fall of the release curve
σ Isotope production cross section
εsep Separator efficiency
εis Ion source efficiency
εtransp Transport efficiency
εrel Target Release efficiency
ζ Target thickness
G Crystallite size (determined by X-Ray Diffraction ,Scherer equation)
GBET Average particle size from surface area determination
GCoulter Average particle size from particle size determination by laser diffraction
f Particle shape factor
i Beam intensity
Jx Flux of diffusion species
k Constant for German and Munir model of surface area reduction
k0 Constant term for a given material for surface area reduction
kr Rate constant of a decomposition reaction

Effect of Calcium Oxide Microstructure on the Diffusion of Isotopes
x
ks Constant related to the shrinkage during initial stages of sintering
l Length of the pellet after thermal treatment
l0 Initial length of the pellet (isothermal conditions)
n Number of target atoms exposed to the incident beam
N Neutron number
N0 Number of radioactive isotopes at t=0
m Herring scaling factor
p(t) Release curve or delay curve
p Pressure
pv(t) Effusion related release function
pv1,v2(t) Effusion related release curve for an ISOLDE target
pµ(t) Diffusion related release function
p∞(t) Release curve when isotopes have an infinite half-life
pCO2 Partial pressure of carbon dioxide
pvap Vapor pressure
ρ0 Fraction density
ρ Theoretical density
Q Activation energy
R Universal gas constant
r Particle radius
S Specific surface area
s Exponent related to the sintering mechanism related to the shrinkage
S0 Initial surface area (isothermal conditions)
T Temperature
t Time
T1/2 Half-life
tcollection Tape station collection time
tf Slow falling (time constant)
TC Temperature at the center of the container
Tm Melting point temperature
tdelay Tape station delay time
Tmax Maximum operation temperature
Effect of Calcium Oxide Microstructure on the Diffusion of Isotopes
xi
tmeasurement Tape station measurement time
tr Rise time (time constant)
TS Temperature at the side of the container
ts Fast falling (time constant)
ttransport Tape station transport time
ϑ Flux of the incident beam
w Weight loss during decomposition reaction
µ Diffusion delay time parameter
v Effusion delay time parameter
v1 Effusion delay time parameter (E. Bouquerel equation)
v2 2nd effusion delay time parameter (E. Bouquerel equation)
Yobs Observed yield
Yprod In-target production yield
Z Proton number

Effect of Calcium Oxide Microstructure on the Diffusion of Isotopes
xii
Abbreviations
BET Brunauner, Emmet and Teller
BJH Barret-Joyner-Halenda
CERN European Organization for Nuclear Reasearch
DTA/TGA Differential Thermal and Thermogravimetric Analysis
FWHM Full Width at Half Maximum
EBIS Electron Beam Ion Source
EDS Energy Dispersive X-ray Spectrometer
GPS General Purpose Separator
HRS High Resolution Separator
ICDD International Center of Data Diffraction
IS Ion Source
ISOL Isotope Separator Online
ISOLDE Isotope Separator Online Device (ISOL Facility in CERN)
IUPAC International Union of Pure and Applied Chemistry
INTC ISOLDE and Neutron Time-of-Flight Experiments Committee
LHC Large Hadron Collider
PDF Powder Diffraction Files
PSB Proton-Synchrontron Booster
PSD Pore Size Distribution
RFQ Radio Frequency Quadrupole
RIB Radioactive Ion Beam
RT Room Temperature
SC Proton-Synchro-Cyclotron
SEM Scanning Electron Microscopy
SSA Specific Surface Area
STEM Scanning Transmission Electron Microscopy
STP Standard Temperature and Pressure
TEM Transmission Electron Microscopy
TT Thermal Treatment
UA University of Aveiro

Effect of Calcium Oxide Microstructure on the Diffusion of Isotopes
xiii
VADIS Versatile Arc Discharge Ion Source
XRD X-Ray diffraction
XS Crystallite Size
WITCH Weak Interaction Trap for Charged Particles


1
Introduction

Introduction
3
CERN, the European Organization for Nuclear Research, is a well-known centre
for fundamental physics research and hosts the Large Hadron Collider (LHC), the highest
energy particle accelerator presently in operation. The beams produced with different
energies in the large accelerator complex at CERN are available to numerous experiments.
One of such facilities, ISOLDE (acronym for Isotope Separator On Line Device), aims at
the production of beams of radioactive isotopes. 1,2
The ISOLDE facility is located near the Proton Synchrotron Booster (PSB) at
CERN, which supplies the facility with a pulsed proton beam 1. The proton beam is then
conducted by a series of (bending and focusing) magnets to two separate target stations.
Through this method, thick targets are bombarded with high-energy protons and nuclear
reactions of spallation, fission and fragmentation occur inside the target. The reaction
products are stopped in the bulk of the target material, diffuse out, are pumped into an ion
source and are accelerated to form a secondary radioisotope beam. Different target/ion
source units can be coupled to the ISOLDE front-ends for the production of the different
radioactive ion beams (RIB). This technique is a particularly good and powerful method
for the production of pure low energy RIB. 3 To date, ISOLDE is the facility which offers
the largest number of different beams (eg. more than 1000 isobars of 73 chemical
elements) in an ISOL-type facility, resulting from constant target and ion source
developments over the last 40 years. 2
The targets used are made of refractory materials assembled in thick targets, such
as pure metals (molten, powder, foils), oxides (powder, fibers), carbides and other
compounds. 4,5 These targets must be designed with important considerations: (i) target
material must be chosen to optimize the release rate (yield) of the required isotope; (ii)
rapid diffusion rate is important when short lived isotopes are required, or else the nuclei
would have decayed before getting to the ionizer; for a rapid diffusion rate a high
temperature and a material with minimal diffusion lengths (like fine powder or thin foil)
are required; (iii) rapid effusion rate, for example, through a material with an open internal
structure permitting the nuclei reaching the ionizer quickly; (iv) good structural strength at
high temperatures; (v) uniform temperature in the target to prevent condensation of the
required radioactive species and to reduce the thermal stresses in the target; this translates
into good thermal conductivity of the target material for high intensity primary beam. 6

Effect of Calcium Oxide Microstructure on the Diffusion of Isotopes
4
As referred before, target operating temperatures must be as high as possible to
reduce the time constants of the isotope diffusion and effusion release processes,
minimizing decay losses before extraction. The maximum operating temperature is
constrained by the following requirements: (i) limited sintering to preserve the target
release performance under pulsed and intense proton beam irradiation; (ii) reduced stable
beam contaminants coming from chemical impurities; (iii) a moderate equilibrium vapour
pressure (~10-2 Pa) compatible with the ion source operation. 4
As so, the best target microstructure was defined as the one having a high porosity
(>30%) in the macrosize range (>100 nm) within a narrow size distribution, nanosized
grains, and stability at high temperatures. 7,8
Calcium Oxide (CaO) targets have been successfully used at ISOLDE to produce
neutron deficient exotic argon isotopes and carbon isotopes, released as CO and CO2
molecules. Such targets outperform other related targets used to produce the same beams,
such as MgO sintered powder or TiOx fibers. However, either some CaO target units
display a slow release rates from the beginning or a rapid decrease over time when
operated under proton irradiation. This is believed to come from a degradation of the initial
microstructure of the targets, caused by pre-sintering effects. 9
The large potential of these targets, for the production of exotic isotopes and the
drawbacks detected in the release process, justifies the need to investigate the
microstructure evolution of CaO targets, using conditions of temperature and pressure
close to that of target operation under proton irradiation and its effect on the isotope
diffusion.

5
Chapter I - State of the Art

Chapter I – State of the Art
7
I.1 Radioactive Ion Beams
Radioactivity, which was first discovered by Henri Becquerel in 1895, is the
spontaneous emission of radiation by an atomic nucleus. The emitted radiation can be of
different types, most prominently in ascending order of penetration and descending order
of energy: alpha (α - 4He nuclei) that can barely penetrate a sheet of paper, beta (β -
positrons or electrons) that can penetrate a few millimeters of aluminum and gamma (γ –
high energy photons) which can penetrate several centimeters of lead. 10 The emission of
the radioactivity from a specific nucleus can reveal much about it, depending on the types
of radiation and energy. It is by this emission of radiation that the less stable nuclei get to a
more stable state, and thus this process is called decay.
The short ranged, nuclear force keeps the nucleus together, otherwise it would
break apart due to the very large repulsive Coulomb forces between protons, which is
partly compensated by the number of neutrons in the nucleus, since they experience only
attractive nuclear forces. The balance between the Coulomb force and the nuclear force, or
the ratio of protons and neutrons for a certain isotope is what defines the stability of a
nucleus. 10 This leads us to the question: how many nuclides exist, how many have been
observed and which ones are stable? First of all, stable nucleus and very long lived
isotopes, the nuclei which “natural” mater is made of, mean that a possible decay process
occurs in the time scale of the universe or larger. 11 The other nuclei are called radioactive
isotopes, or simply radioisotopes.
In order to study in detail nuclear subnuclear elementary particles and high energy
physics particle accelerators are continuously developed, constructed and operated. A
particle accelerator is a device in which charged particles (beam) are accelerated with
electromagnetic fields to high energies. These particles can then be sent onto a fixed target
or brought to collide with another particle beam in the opposite direction. Advancements in
technology allow to build more powerful accelerators, to study the elementary particles
and their interactions. Usually, the charged particles that are accelerated are: protons,
electrons, positrons, antiprotons, ions and even unstable isotopes, which is the case of
ISOLDE (acronym for Isotope Separator Online Device) at CERN. 12

Effect of Calcium Oxide Microstructure on the Diffusion of Isotopes
8
I.1.1 The Chart of the Nuclides
The chart of nuclides, shown in Figure I-1, displays all the presently known nuclei
in a grid of proton number (Z) versus neutron number (N). There are 186 stable nuclei and
around 3600 observed radioactive isotopes, although 6000 are believed to exist in total. 11
Standard databases also include for each nuclide the measured properties, among which
are, relative abundance (for stable nuclides), decay modes, half-lives (for the radioactive
ones) and masses. 13 Databases of known nuclides and the chart itself can be found on the
Karlsruher Chart 14 or on the internet in the websites of the International Atomic Energy
Agency 15 and the National Nuclear Data Center 16 (both of them use several sources to
keep the data up to date). Obviously this chart is a very useful tool for physicists in these
related fields and a good overview of what are the known nuclides and which are their
properties.
Figure I-1 - Chart of the nuclides, where the proton, neutron and fission driplines (Bp, Bn, BF) can be seen. Vertical and horizontal lines represent the magic numbers and the colors the decay modes of radioactive isotopes. 11
In Figure I-1, the stable nuclei (black squares) form the backbone of chart, and the
color squares represent the radioactive isotopes (colors represent each type of decay
mode). The vertical and horizontal thick lines provide the so-called magic numbers of
protons or neutrons where the nuclides are especially stable. While the N=Z line follows
Chapter I – State of the Art
9
the “valley of stability” for light masses, this does not apply for heavy nuclei anymore:
they have more neutrons than protons. This can be explained by the increase of Coulomb
forces with increasing Z as mentioned above. The neutron (Bn=0) and proton driplines
(Bp=0) represent the theoretical limit at which nuclei are believed to exist. Also the
theoretical fission barrier line (BF) at which no nuclide can exist without spontaneously
fission to form smaller nuclei. The white zones represent regions where nuclei are believed
to exist but still unknown. The isotopes that are away from the zone of the stability of the
nuclear chart have very small half-lives and are very unstable, and therefore are much
more difficult to produce and study. These are called the exotic nuclei.
I.1.2 Radioactive Ion Beam Applications
The research program based in radioactive ion beams (RIB) facilities aims at
discovering fundamental properties of nuclear structure and at explaining the nuclide chart
up to the predicted frontier. This covers, for example, the precise determination of nuclear
masses, research on the properties of excited nuclear states, studies of radioactive decay
modes, the precise determination of nuclear radii, spins and moments and also the
investigation of atomic structure of radioactive elements. Fundamental interactions are also
studied by RIBs, providing a contribution to the understanding of the Standard Model at
low energies. RIBs are as well extremely useful in other fields like in astrophysics, trying
to understand the constituents and the nuclear genesis in the stars, in which the energy is
generated though nuclear reactions amongst stable and radioactive nuclei, and which can
last for billions of years or explode in a few seconds. Life sciences are investigated with
RIBs, in biochemistry and especially in the field of nuclear medicine studying the use of
radioisotopes in medical diagnostics and therapy. Finally, an important field of research is
solid state physics, in which radioisotopes are implanted as probes and act as diagnostic
tools to deliver information about the environment in which they are implanted. In this way
these radiotracers are used to study diffusion dynamics, surface, interface and bulk
properties, spintronics and semiconductors. 11,2
I.1.3 Production of Radioactive Ion Beams
RIBs are produced by different techniques where a beam of protons, neutrons,
electrons, light or heavy ions are brought to collision with a target. 11 Several reactions and

Effect of Calcium Oxide Microstructure on the Diffusion of Isotopes
10
beam target combinations are used to produce the required radioactive isotopes. 17 There
are 3 major types of such reactions used at CERN-ISOLDE:
• Spallation - it happens when a proton with high kinetic energy (between hundreds
of MeV and a few GeV) hits a target. This reaction can be described in a two-step reaction:
first a particle is made to collide with the nucleus exciting it to a high energy state. In the
second step, the excited nucleus emits single nucleons to lower its excitation state. This
reaction is best suited to produce proton-rich isotopes, with a few protons and/or neutrons
less than the original element. 18
• Fragmentation - projectile fragmentation reactions are induced by a high-energy
heavy ion beam with energies above 50 MeV per nucleon. 17 It implicates heavy-ions being
broken up into lighter elements, on a target. The fragmentation reaction can also happen in
target nuclei, when high energetic protons hit a heavy target. 18 This reaction produces a
wide range of nuclei, both neutron and proton-rich, and also light nuclei.
• Fission - it happens when an incident particle, proton, neutron, electron or
photons is absorbed by the nucleus. If the incident energy is high enough, two nuclei and a
number of free nucleons are formed. In “cold fission” (no neutrons or gammas are emitted)
a big nucleus is split in two other nucleus of smaller mass. 10 One of the produced nuclei
will have a mass of about ⅓, and the second of roughly ⅔ of the mass of the original
element. 13
• Fusion-evaporation – a 4th reaction, used throughout different ISOL facilities (and
not at ISOLDE) consists on inducing two nucleus to be brought together overcoming the
energy of the Coulomb barrier. The resulting nucleus evaporates nucleons. This method
produces highly excited nuclei in the neutron-rich side of the stability region and super-
heavy elements.
The nuclear reactions described above are influenced by the nature of the projectile,
its energy and nature of the target. 17 To meet the demand of ever increasing RIB
intensities, new accelerators that can deliver higher intensities and target systems to handle
the power deposition, resulting from the later, are under development. The production of
unwanted species is often more intense compared to the desired exotic nuclei. For this,
selectiveness has to be improved to separate the wanted species from the unwanted ones
(contaminants). By the very definition of exotic nuclei, it is known that they have very
short half-lives. As the isotopes decay, the production and the transport from the target to
Chapter I – State of the Art
11
the experimental setup has to be fast. The efficiency has also to be promoted by developing
better ionization, acceleration and transport systems of the isotope beams. 17
There are two methods to produce RIBs: the in-flight separation technique 19 and
the isotope separator online (ISOL) technique. Both methods transport the produced nuclei
out of their production zone, where there is a large radiation background due to nuclear
reactions, to a well shielded experimental setup. This has two advantages: creating low
radiation background conditions for the experiment, and to purify and prepare the beam
with respect to its necessary conditions: energy, time and ion optical properties for the
following experiments. 17
The ISOL technique uses production methods in a thick target, thermalization in a
solid, liquid or gas catcher, which often is the same as the target, as in the case of ISOLDE
at CERN. The radioactive isotopes are then extracted from the catcher material and ionized
in an ion source. After being extracted from the ion source the isotopes are mass analyzed
by a dipole magnet and afterwards post-accelerated to the required energies for use in
experiments. 17 The beams resulting from this technique are of excellent ion optical quality
(energy resolution, time structure and emittance) but the thermalization process described
and the eventual re-acceleration slow down the delivery of isotopes and causes additional
losses for short lived isotopes. 11
Besides ISOLDE at CERN, which is a leading ISOL facility, there is also much
development ongoing on other facilities like: GSI at Germany, LISOL at Belgium, IGISOL
in Finland, ISAC-TRIUMF in Canada, GANIL in France, IRIS in Russia and JAERI in
Japan. 17
The quality of a RIB facility is mainly determined by the intensity and purity of its
beams. For an ISOL facility the beam intensity can be theoretically described by the
expression 20:
𝑖 = 𝜃.𝜎. 𝑛. 𝜀𝑟𝑒𝑙. 𝜀𝑖𝑠. 𝜀𝑠𝑒𝑝. 𝜀𝑡𝑟𝑎𝑛𝑝 (I.1)
where i, is the beam intensity in ions per second per µA of the incident beam, ϑ is
the flux of the incident beam in particles per second per µA, n is the number of target
atoms exposed to the primary beam per unit of area and σ is the cross-section to produce
the desired isotope (cross section is considered to be the effective size of a nucleus for a
certain nuclear probabilistic reaction to happen). εrel is the release efficiency of the target,
εis is the ion source efficiency and εsep and εtranp are the efficiencies of the transmission of

Effect of Calcium Oxide Microstructure on the Diffusion of Isotopes
12
the mass separator and of the transmission to the users experimental setup, respectively
(these last two efficiencies are normally close to unity). The εrel is directly related to
diffusion through the target material and effusion through the material porosity to the ion
source. It can be greatly improved by developing the target material. By investigating the
microstructure and the diffusion and effusion of the isotopes on the target material, these
properties can be vastly improved and in this way, the target release efficiency would be
increased too, promoting the overall beam intensity, as will be seen later in this work.
I.2 ISOLDE at CERN
CERN, the European Organization for Nuclear Research is the biggest
experimental laboratory center for fundamental particle physics research. It presently hosts
the LHC (Large Hadron Collider), the highest energy and largest particle accelerator in
operation in the world. CERN was founded in 1954, and it is located across the Franco-
Swiss border area near Geneva and is operated by 21 member states (Portugal being one of
them). Other non-member states and organizations are also involved in the numerous
experiments taking place at CERN. CERN is a global example of successful international
collaboration for scientific interests. CERN’s mission is defined in four levels: (i)
educating the scientists of tomorrow; (ii) fundamental research; (iii) promoting
international collaboration and (iv) promoting the transfer of technology. At CERN beams
of particles are accelerated to high energies and are brought to collide between themselves
or with targets. By doing this, scientists expect to understand better the fundamental laws
of nature. 1
The beams produced at the large accelerator complex at CERN are delivered at
various energies to numerous experiments. One of such facilities, ISOLDE, has the aim of
producing beams of radioactive isotopes.
It was in 1964 that ISOLDE was originally proposed at the 0.6GeV Proton-
Synchro-Cyclotron (SC) at CERN. The first experiments started in 1967 and since then,
the ISOLDE facility has suffered several upgrades. Since 1989 that ISOLDE is supplied by
the 1-1.4GeV Proton-Synchrotron Booster (PSB), as Figure I-2 shows. 2 This not only
provides ISOLDE with more energetic protons but also the proton intensity was increased
up to 2µA. This, together with different technological developments, increased the
intensities and the number of accessible isotopes. Right now ISOLDE is the world-leading

Chapter I – State of the Art
13
facility of its type, which can provide more than 1000 isotopes with half-lives down to
milliseconds out of 73 chemical elements, from Z=2 to 92, with intensities up to 1011 atoms
per second.
Figure I-2 - CERN accelerator complex. The types of beams (different colors) produced at CERN and their paths, can be seen, as well as the main experiments. 1
I.2.1 Layout of ISOLDE Facility
The ISOLDE experimental facility, runs between 350 and 400 shifts of 8 hours of
online operation every year 21. The PSB supplies the ISOLDE facility (Figure I-3) with
about 30-40% of CERN’s protons. The proton beam can then be redirected by a series of
focusing and bending magnets to two different front ends, which supply the fixed targets.
The protons are delivered either in pulse sharing mode, sharing the supercycle between the
two, or individually. Some targets can have a converter that is used to transform a beam of
protons into a field of neutrons. With this technology, neutron-rich isotopes with low level
of contaminants can be obtained from actinide targets. 17

Effect of Calcium Oxide Microstructure on the Diffusion of Isotopes
14
When the high energy primary beam hits the target, spallation, fragmentation and
fission reactions take place producing radioactive nuclei that are stopped (also called
thermalization) in the bulk of the target material and then diffuse out of it. The isotopes
then travel through so-called processes of effusion through the transfer line to the ion
source, where they are ionized. An extraction electrode accelerates them at a potential up
to 60 keV, producing the secondary beam. In the ion source, several ionization
mechanisms are used, but generally singly positively or negatively charged ions are
produced 17. Usually the target, transfer line, ion-source and, if installed, the neutron
converter are referred to as the target unit or simply as target 3.
Figure I-3 - Layout of the ISOLDE facility, describing all the steps of the process and zones. 17
To mass analyze and separate the isotopes each target station, also called frontend,
is connected to a mass separator magnet: the General Purpose Separator (GPS) or to the
High Resolution Separator (HRS). The magnets separate the different masses according to
the Lorentzian magnetic principle 22 and both can feed a common beam distribution system
which connects to the different experiments in the ISOLDE hall. The GPS has less
resolution than the HRS, but allows for the separation and use, in parallel, of three beams

Chapter I – State of the Art
15
of different masses to three different experiments at the same time. The separation of
different masses with HRS can provide the facility with one high resolution beam and is a
more complex system with 2 magnets with ion-optical systems for corrections. 3
Some experiments get the beam directly from the mass separators while others need
the beam to be stopped and cooled to be highly ionized and/or post accelerated. The Radio
Frequency Quadrupole (RFQ) cooler, cools down the ion beam to improve its ion-optical
properties and bunches the beam. This is done to improve the peak to background ratio that
is required in some experiments, or to inject the beam into the charge state breeder. The
charge state breeder is an electron beam ion source (EBIS) that changes the singly charged
radioactive ions to multiple charged ion state, as required for post acceleration. Finally, the
highly ionized beam can be accelerated to several MeV per nucleon and sent to
experimental setups which require high kinetic beam energies 17.
There is big concern and legal obligation about radiological protection at ISOLDE,
since there are high amounts of radioactivity that originates from normal operation of the
targets and by the RIB itself. To comply with the legislation aiming to protect the ISOLDE
group and its users, who have to use a dosimeter on the ISOLDE experimental hall, the
strong radioactive target zone is completely separated from the hall. It has dedicated
ventilation, is separately pumped and is highly shielded with steel, concrete blocks and 8m
of soil. The targets are manipulated, stored and changed by industrial robots without the
need for human physical presence. The target zone is also equipped with a class A
radioactive laboratory to safely and correctly handle any radioactive materials. 3 After the
irradiation and operation time, the targets are disposed as radioactive waste. 23
An important part of the ISOLDE infrastructure is made of beam diagnostics, since
it permits the delivery of good quality RIB to the physics experiments. Part of these
instruments, are the wire scanners and grids that permit to see the position and the profile
of the beam, faraday cups that measure the overall intensity of the beam in several
positions along the beam line, tape stations through which we can measure the release rates
(yields) and obtain the release curve of radioactive isotopes. There are gamma detectors
that allow the identification of the produced isotopes through a gamma spectrum. Some of
these instruments will be described in larger detail later, in the experimental procedure
chapter (see section II.7).
Effect of Calcium Oxide Microstructure on the Diffusion of Isotopes
16
Furthermore, the operation of the entire ISOLDE facility, from the vacuum
systems, to the beam distribution system and diagnostics, and all target parameters, with
exception of the experiments, is done in the control room, by several computers and other
control systems in a user friendly environment. 3
I.2.2 Target Unit
The heart of an on-line isotope separator is its target and ion source. The
performance of these components is an essential part for the delivery of high quality beams
in a facility like ISOLDE. Yearly, in average, ISOLDE produces 30 target units with
typical utilization from 24h to 300h with an average of 64h 23. Around 30 different target
materials, 5 transfer lines and 5 types of ion-sources are available at ISOLDE, making
nearly 100 different possible combinations, which are chosen depending on the required
radioactive ion beams. The targets can be either made of solid or liquid materials.
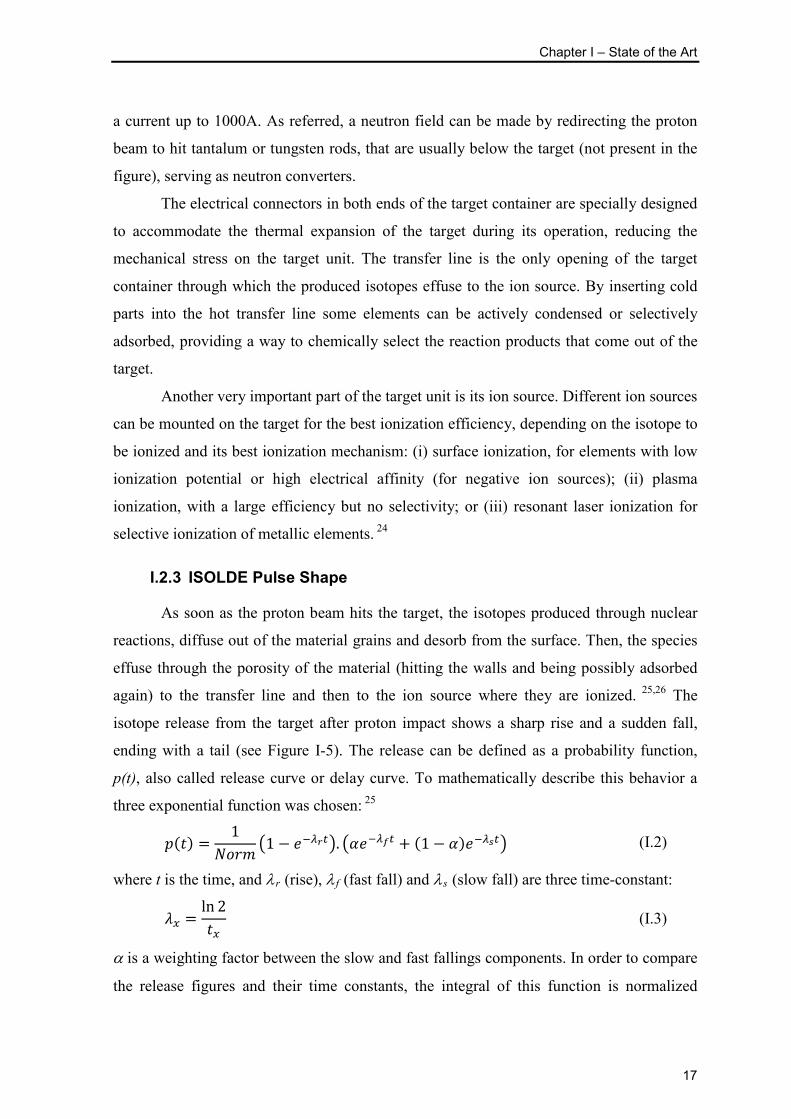
Figure I-4 – Target unit MK7 with VADIS ion source in 3D (a) and cut (b) – courtesy of Stefano Marzari. The numbers indicate the target container (1), the transfer line (2) and the ion source (3). The arrow indicates how the proton beam is made to collide with the target material, which is inside the target container.
As can be seen in Figure I-4, the ISOLDE standard target container has a
cylindrical shape (200mm long, 20mm of diameter) and is made of tantalum, a refractory
metal, which is then filled with the target material. To enhance the diffusion and effusion
processes the target container can be heated by ohmic resistance up to 2200oC by providing
a) b)
1
1 2
3
2
Chapter I – State of the Art
17
a current up to 1000A. As referred, a neutron field can be made by redirecting the proton
beam to hit tantalum or tungsten rods, that are usually below the target (not present in the
figure), serving as neutron converters.
The electrical connectors in both ends of the target container are specially designed
to accommodate the thermal expansion of the target during its operation, reducing the
mechanical stress on the target unit. The transfer line is the only opening of the target
container through which the produced isotopes effuse to the ion source. By inserting cold
parts into the hot transfer line some elements can be actively condensed or selectively
adsorbed, providing a way to chemically select the reaction products that come out of the
target.
Another very important part of the target unit is its ion source. Different ion sources
can be mounted on the target for the best ionization efficiency, depending on the isotope to
be ionized and its best ionization mechanism: (i) surface ionization, for elements with low
ionization potential or high electrical affinity (for negative ion sources); (ii) plasma
ionization, with a large efficiency but no selectivity; or (iii) resonant laser ionization for
selective ionization of metallic elements. 24
I.2.3 ISOLDE Pulse Shape
As soon as the proton beam hits the target, the isotopes produced through nuclear
reactions, diffuse out of the material grains and desorb from the surface. Then, the species
effuse through the porosity of the material (hitting the walls and being possibly adsorbed
again) to the transfer line and then to the ion source where they are ionized. 25,26 The
isotope release from the target after proton impact shows a sharp rise and a sudden fall,
ending with a tail (see Figure I-5). The release can be defined as a probability function,
p(t), also called release curve or delay curve. To mathematically describe this behavior a
three exponential function was chosen: 25
𝑝(𝑡) =1
𝑁𝑜𝑟𝑚�1 − 𝑒−𝜆𝑟𝑡�. �𝛼𝑒−𝜆𝑓𝑡 + (1 − 𝛼)𝑒−𝜆𝑠𝑡� (I.2)
where t is the time, and λr (rise), λ f (fast fall) and λs (slow fall) are three time-constant:
𝜆𝑥 =ln 2𝑡𝑥
(I.3)
α is a weighting factor between the slow and fast fallings components. In order to compare
the release figures and their time constants, the integral of this function is normalized

Effect of Calcium Oxide Microstructure on the Diffusion of Isotopes
18
(Norm) to 1. The fit function of equation (I.2) describes numerically the experimental
curves, and its time parameters are not easily linked to specific physical phenomena.
Figure I-5 - Theoretical release curve, where final release curve display a fast and a slow component (courtesy of Alexander Gottberg).
The intensity curve is calculated by multiplying equation (I.2) per N0 which
corresponds to the number of isotopes produced at t=0 (proton impact). The total yield is
then calculated from the area under release intensity curve normalized to the proton current
(ions/µC). 25
To characterize the release characteristics, a useful parameter is the release
efficiency (εrel). It is defined by the probability (dependent on half-life) that a certain
isotope has to be released out of the target 27. The release efficiency depends on each
material, its respective operation temperature and of the target unit geometry. The release
efficiency is lower for short-lived isotopes and approaches 1 for longer lived ones, since
during effusion and diffusion delay processes part of what was produced, after the proton
impact, is lost. The release efficiency is function of the isotope half-life (T1/2) and is
derived from equation (I.2) by the following relation:
𝜀𝑟𝑒𝑙�𝑇1 2⁄ � = � 𝑝∞(𝑡)𝑒− ln2𝑇1/2
𝑡∞
0𝑑𝑡 (I.4)
where p∞(t) corresponds to the release (equation (I.2)) for isotopes with T1/2→∞, giving:
𝜀𝑟𝑒𝑙�𝑇1 2⁄ � =1
𝑁𝑜𝑟𝑚�
𝛼𝜆𝑓 + 𝜆𝑖
+(1 − 𝛼)𝜆𝑠 + 𝜆𝑖
+−𝛼
𝜆𝑓 + 𝜆𝑟 + 𝜆𝑖+
(𝛼 − 1)𝜆𝑓 + 𝜆𝑟 + 𝜆𝑖
� (I.5)
where λ i is the isotope decay constant:
𝜆𝑖 =ln 2𝑇1/2
(I.6)

Chapter I – State of the Art
19
I.3 Target Materials
For more than 40 years target materials have been developed at ISOLDE searching
constantly for fast release properties in order to promote the production of exotic nuclei. 9
Different materials are used as ISOLDE targets either in solid or liquid state. The materials
in solid state can be shaped as pressed pills, powders, fibers or foils of metals, carbides or
oxides. The liquid targets are made of metals or salts of low melting points. Details about
some of these materials can be seen in Table I-1. Table I-1- Table with target materials most used at ISOLDE: Tm is the melting point temperature, Tmax is the maximum operation temperature, pvap is the vapor pressure, ρ is the theoretical density and ζ is the target thickness. 28
Type Material Tm
(oC) Tmax (oC)
pvap Pa
ρ (g/cm3)
ζ (g/cm2)
Typical Isotopes
Met
al
Sn (l) 232 1100 6x10⁻³ 5.5 110 60-74Zn, 64-75Ga La (l) 920 1400 10-2 6.2 124 114-137Cs, 122-138Ba Pb (l) 328 800 10-1 10.1 200 177-207Hg
Ti 1675 1600 2x10⁻¹ 4.5 25 37-46Ca,42-48Sc Nb 2610 2050 3x10⁻⁴ 8.6 50 70-85Br, 70-85Kr, 74-86Rb, 76-87Sr, 79-89Y Ta 2996 2200 5x10⁻⁵ 16.6 110 many
Car
bide
s SiC 2300* 1200 † 3.2 21 17-23F, 18-24Ne, 20-24Na, 22-28Mg LaC2 ? 1750 2x10⁻¹ 5.0 ~30 98-Cd, 100-114In, 104-Sn, 114-138Cs ThC2 ~2450 2200 2x10⁻³ 9.0 ~50 many UC2 ~2450 2200 2x10⁻² 11.3 ~50 many
Oxi
des
MgO 2800 1500 5x10⁻¹ 3.6 2.9 17-24Ne CaO 2898 1400 ~10-2 3.3 5 6He, 10C, 17N, 18-19Ne, 33-35Ar, 41-46Ar ZrO2 2700 1850 ~10-2 5.9 6 Mn, Zn, Se, Kr, 56,71Cu, 62-74Ga
La2O3 2300 1300 ~10-2 6.5 64‡ 115-125Xe CeO2 2600 1300 <10-2 7.1 16 112-125Xe, etc. ThO2 3050 2100 2x10⁻² 9.9 <30 many
Metals are used in form of foils or powders, creating target densities near one third
of the bulk density. These forms are used to keep diffusion lengths short. Furthermore,
diffusion in solid metals is slow for some elements so, often, oxides or carbides are
preferred where higher temperatures can be applied. Although carbides are very stable,
they are limited in operation temperatures by their vapor pressures or their level of
impurities. The advantages and disadvantages of oxides are explained later in this work. 28
Beyond solid targets, molten targets are also used at ISOLDE. These have a slightly
different way of operation. They operate with larger pulse structure (3 bunches separated * Decomposition temperature † Impurity limited ‡ 400mm long target

Effect of Calcium Oxide Microstructure on the Diffusion of Isotopes
20
by 16µs, instead of the normal set of 4 bunches separated by ~90ns) of the primary beam,
that generate shockwaves in the molten material, promoting the release of the isotopes. 29
These targets produce RIBs of higher intensities of not too shorted-lived isotopes, due to
their high densities. 28
A solid material must fulfill several requirements to be selected as a target material
for the production of RIBs at CERN-ISOLDE. The most important requirements and the
ones that contribute more to the isotope release are the diffusion, effusion and adsorption.
For ISOL applications the best target microstructure was described before as the
one having high open porosity (>30%) in the macrosize range (>100nm), nanosized grains,
and stability at high temperatures. 7 Tortuosity should be minimized, and the pore size
distribution must be narrow, minimizing the resistance to gaseous flow (effusion). 7,8
Additionally, the surface area is a very important parameter to control. Nanometric
scale materials with high surface area are envisaged, since not only diffusion lengths are
shortened but also the release surface is increased. Nevertheless, a high surface area
nanometric material will sinter at lower temperatures. Therefore, the temperature effect
over time on the microstructure has to be well known (e.g. through sintering kinetics) in
order to operate the target with temperatures high enough to promote diffusion and
effusion phenomena but not degrade the microstructure of the material.
The production method of the target material defines the target final properties:
different methods lead to different microstructures and different material properties.
In this section the most important properties will be described as well as their
relation to the release process.
I.3.1 Diffusion
As diffusion remains one of the most important and most limiting factors involved
in release properties from an ISOLDE target, it will be further detailed.
Fick’s first law (in one dimension) is the simplest way of describing diffusion, for
steady concentration conditions of the diffusing species: 30
𝐽𝑥 = −𝐷𝑑𝐶𝑑𝑥
(I.7)
where Jx is the flux of the diffusing species, dC/dx is the concentration gradient and D is
the diffusion coefficient. When concentration varies with time Fick’s second law (also in
one dimension) applies instead: 30

Chapter I – State of the Art
21
𝑑𝐶𝑑𝑡
= 𝐷𝑑2𝐶𝑑𝑥2
(I.8)
These laws can be used to determine the diffusion coefficient of a diffusing element
in a host lattice from experimental data. To this end, a usual technique consists in the
implantation of a radioactive isotope in a sample. Then, by heating at fixed temperatures
for different delays, the diffusion coefficients can be determined as well as the diffusion
pre-exponential factor (D0) and the activation energy (Q).
I.3.1.1 Main Diffusion Mechanisms
The mechanisms of diffusion are the paths that the atoms preferably move in the
crystal lattice. These are mainly influenced by the types of defects present in the material
crystal lattice. The three principal mechanisms are: lattice diffusion (or volume or bulk
diffusion), grain boundary diffusion, and surface diffusion. 30
Lattice diffusion can occur either from a vacancy or by interstitial mechanism.
Other mechanisms like interstitialcy and direct exchange (or ring mechanism) can also
happen. Vacancies are part of the equilibrium point defects so they are always present in
the material 31. Their movement is in the opposite direction and the motion equivalent to
that of the atom. The concentration of vacancies is determined by the temperature, solute
and atmosphere. Another important mechanism is defined by atoms small enough to travel
in the interstitial sites of the crystal lattice, which are said to move through the interstitial
mechanism. Less important, interstitialcy mechanism happens when the distortion of the
lattice is too large for the interstitial diffusion to happen. So a neighboring atom exchanges
position with a lattice atom. The later, direct exchange or ring mechanism is defined by
rotation of a group of atoms without participation of a defect. 30
The grain boundaries of polycrystalline material are highly defective zones by
nature. Because of that, grain boundaries are often zones of faster diffusion. This type of
diffusion is dependent on the grain size, since higher grain sizes have reduced grain
boundaries areas. 30
Surface diffusion happens because the free surface of a solid is a perturbed region
where kinks, edges, terraces and also vacancies and adatoms are formed. The migration of
those last two is what provides the main mechanism of surface diffusion. 30

Effect of Calcium Oxide Microstructure on the Diffusion of Isotopes
22
I.3.1.2 Factors Influencing Diffusion
The diffusion coefficient depends greatly on the diffusing species, their
concentration and the host material 31,32 and consequently on the diffusion mechanism 31.
The temperature has a large influence on the diffusion coefficients and diffusion
rates. The diffusion coefficient varies with the temperature following an Arrhenius
equation: 32
𝐷 = 𝐷0𝑒𝑥𝑝 �−𝑄𝑅𝑇
� (I.9)
where D0 is the temperature independent pre-exponential factor, Q is the activation energy
for the diffusion (both dependent on the host material and diffusion species), R is the
universal gas constant and T is the absolute temperature.
The type of the crystal phase (or lattice) of the host material is important in terms of
atomic packing factor. For example, a face-centered cubic crystalline system has an atomic
packing factor higher (0.74) than the body-centered one (0.68) so, typically, for the same
host and diffusion species the diffusion coefficient is higher in the case of the later,
because the atoms can move more freely. 31
Diffusion is also influenced by defects present in the material crystal lattice. These
defects influence transport phenomena, affecting for instance the rates sintering. 33 Proton
irradiation is known to induce defects on the crystal structure such as voids, flaws and
point defects, and this may affect the release processes by promoting diffusion 34. Since at
ISOLDE the proton beam is pulsed, this will induce high temperature spikes due to the
deposited energy. These high temperatures, together with the temperature set in the target
container, promote the annealing and sintering of the material. Therefore the best
conditions in terms of temperature and proton intensity are those for which the
microstructure is stable, defining the release properties achieved in operation over time.
Only a post irradiation study would reveal the precise influence of all of these factors on
the material microstructure 34.
I.3.1.3 Diffusion and ISOLDE Release Curve
Analyzing the ISOLDE release curve it is possible to obtain meaningful physical
parameters about the release characteristics of the target material and also about the
surrounding geometric components of the target. Effusion and diffusion time constants can
be obtained through the release curve by using a model first proposed by R. Kirchner 27.

Chapter I – State of the Art
23
This model defines the probability of a given isotope to diffuse out of the material grains
and effuse through the material porosity and to the ion source.
The effusion delay function, pv(t), can be defined analogously to the evacuation of
a certain volume through an opening, which can be described by an exponential function 27:
𝑝𝑣(𝑡) = 𝑣𝑒−𝑣𝑡 (I.10)
where v is an effusion delay parameter. The diffusion delay function, pµ(t), was derived
from Fick’s Law for infinite foils of thickness d:
𝑝µ(𝑡) =8𝜇𝜋2
�𝑒−𝜇(2𝑛+1)2𝑡∞
𝑛=0
(I.11)
where µ is the diffusion delay parameter, which can be related to a diffusion coefficient
(D):
𝜇 =𝜋2𝐷𝑑2
(I.12)
By a convolution of effusion and diffusion (equations (I.10) and (I.11)) the
following equation, for the geometry of infinite foils, is obtained 27:
𝑝(𝑡) =8𝜇𝑣𝜋2
�𝑒−𝑣𝑡 − 𝑒−𝜇(2𝑛+1)2𝑡
𝜇(2𝑛 + 1)2 − 𝑣
∞
𝑛=0
(I.13)
E. Bouquerel et al. 35 developed a more accurate equation for effusion delay
function in an ISOLDE target unit by adding a second exponential function, to account for
effusion of atoms from the target container to the ion source through a transfer line:
𝑝𝑣1,𝑣2(𝑡) =1
𝑁𝑜𝑟𝑚(1 − 𝑒−𝑣2𝑡)𝑒−𝑣1𝑡 (I.14)
where v1 and v2 are effusion time parameters. By convoluting equation (I.14) with (I.11),
the following equation for effusion and diffusion was obtained:
𝑝(𝑡) =8𝜇𝜋2
� �𝑒−𝜇(2𝑛+1)2𝑡 − 𝑒−𝑣2𝑡
𝑣2 − 𝜇(2𝑛 + 1)2−𝑒−𝜇(2𝑛+1)2𝑡 − 𝑒−𝑣2𝑡−𝑣1𝑡
𝑣1 + 𝑣2 − 𝜇(2𝑛 + 1)2�
∞
𝑛=0
(I.15)
For the geometry of spherical particles, like powders, a diffusion delay function,
pµ(t) takes the form 36:
𝑝µ(𝑡) =6𝜇𝜋2
�𝑒−𝑛2𝜇𝑡∞
𝑛=1
(I.16)
where D is obtained with a equation similar to equation (I.12) from the particle radius, r:

Effect of Calcium Oxide Microstructure on the Diffusion of Isotopes
24
𝜇 =𝜋2𝐷𝑟2
(I.17)
A equation similar to the one obtained by E. Bouquerel et al. (equation (I.15)) can
be derived for spherical particles by convoluting equations (I.14) and (I.16):
𝑝(𝑡) =6𝜇𝜋2
� �𝑒−𝑛2𝜇𝑡 − 𝑒−𝑣2𝑡
𝑣2 − 𝑛2𝜇−𝑒−𝑛2𝜇𝑡 − 𝑒−𝑣2𝑡−𝑣1𝑡
𝑣1 + 𝑣2 − 𝑛2𝜇�
∞
𝑛=1
(I.18)
The release efficiency, εrel, can also be related to physical phenomena like effusion
and diffusion by the following equation, which was derived from the equation (I.18)
similarly to the deduction of equation (I.5) 35,37:
𝜀𝑟𝑒𝑙�𝑇1 2⁄ � =
3𝜇(𝑣1 + 𝑣2)𝑣2 �𝜋�𝜆𝑖𝜇 coth�𝜋�𝜆𝑖𝜇 � − 1�
𝜋𝜆𝑖(𝜆𝑖 + 𝑣2)(𝜆𝑖 + 𝑣1 + 𝑣2) (I.19)
where λ i is defined on equation (I.6).
The delay parameters of diffusion and effusion, v1, v2, µ can be deduced from the
parameters in equation (I.18) or (I.19) by a fit to the experimental release curves.
Determining µ and knowing the particle radius, one can extract the diffusion coefficient,
D, through equation (I.17) and D0 and Q values from equation (I.9) if measured for
different temperatures.
The release efficiency can also be simply taken from the ratio between the yield
observed experimentally (Yobs) and the in target production yield (Yprod), that would be
obtained if the isotopes wouldn’t decay over time. Yprod , which is only mass dependent,
can be obtained through simulations with programs like ABRABLA 38,39. So, εrel can be
obtained through the equation:
𝜀𝑟𝑒𝑙 =𝑌𝑜𝑏𝑠
𝑌𝑝𝑟𝑜𝑑𝜀𝑖𝑠 (I.20)
where εis is the ion source efficiency. From this using the release efficiency equation,
deduced similarly to equation (I.5), from equation (I.16), just for diffusion, µ can be known
27:
𝜀𝑟𝑒𝑙 = 3��𝜆𝜋2/𝜇 × tanh�𝜆𝜋2/𝜇 − 1�
𝜆𝜋2/𝜇 (I.21)
This method is less accurate and underestimates µ since losses due to effusion are
neglected.
Chapter I – State of the Art
25
Attempts to calculate the diffusion parameters and constants and/or activation
energies from the detailed models have been successful in various works 27,35,36,40,41.
I.3.2 Effusion
After the isotope diffuses out of the target, effusion processes are responsible for
transporting the isotope of interest to the ion source. Effusion can be defined as the
molecular dynamics where a gas molecule doesn’t hit another gas molecule. Effusion is
mostly dependent on the temperature and on the target surface physico-chemical
properties.
The effusion step is also dependent on the following parameters 27: (i) the average
number of collisions of the isotope with the surface of the target or the surrounding
materials until it is ionized; (ii) the average sticking time in each wall collision, which is
mainly dependent on the temperature and on the adsorption enthalpy of the target material
or surrounding materials; (iii) and also the average flight time between each wall collision.
The defined parameters are very dependent on the type of materials that are chosen
for the target unit. Furthermore, by increasing the temperature and reducing the total
volume of the target the effusion speed is enhanced 7.
I.3.3 Other Important Material Requirements
Besides fast diffusion and effusion, other important characteristics for a target
material must be considered and they are as S. Fernandes 7 described: high production
cross section, high operational temperature, high resistance to radiation damage, high
thermal conductivity and high resistance to fatigue, creep, thermal shock and corrosion.
A high isotope production cross section is related to the target material, the primary
beam energy and is the probabilistic event of a certain nuclear reaction to occur. The
amount of material exposed to the beam can be increased, increasing the production rate. 5
One of the most important properties is the refractory characteristics of the
material. A high operational temperature is required to reduce the time constants of the
diffusion and effusion, and usually, the target temperature is set a few hundred degrees
below the material melting point 4. The maximum temperature is constrained by the
evaporation of the target material and/or its impurities, degradation and sintering effects.
The temperature is also limited by the vapor pressure of the material, which has to be
Effect of Calcium Oxide Microstructure on the Diffusion of Isotopes
26
compatible with the ion source (less than 10-2 Pa), from which the ion source efficiency
starts to fall 4.
Due to exposition of the target to high levels of radiation, high resistance to
radiation damage of the material is needed. Radiation can induce changes in the physico-
chemical characteristics (atomic, microstructural and electric, thermo-mechanical
properties). These effects are dependent on the type, energy and the dose of particles which
irradiates the material, its impurities, the surrounding atmosphere and temperature. Target
deterioration by radiation is not a simple time effect. It mainly depends on the intensity of
the beam, but on the bunch characteristics, which is deleterious for the target 20.
Both target material and target container must have a high thermal conductivity and
high emissivity. When the primary beam pulse collides with the target, some fraction of
energy is deposited in the target and in the target container, generating loads of high
temperature in the target. Efficient cooling systems and good thermal conductance between
the target and the container are needed for preserving the mechanical integrity of the target
and also its microstructure. 5
High resistance to fatigue, creep, thermal shock and corrosion is needed since the
target is subjected to thermal gradients induced by the pulsed proton irradiation and ohmic
resistance heating, thus requiring a high fatigue resistance. Fracture failure of the target can
be induced by creep and corrosion in the target material.
I.4 Calcium Oxide Nanopowders
Since the early days of ISOLDE that ceramic powders or loose compacts have been
used as target materials; firstly hydroxides (1970) 42, then oxides and carbides (1975) and
later borides (1986) 43, since higher target temperatures could be reached.
Calcium oxide (CaO) has been used at ISOLDE for a long time, providing good
yields of argon isotopes. Around 1 to 2 CaO targets are produced every year, representing
3.3% of the total ISOLDE RIB time – data from the last 5 years 44.
Alkaline earth materials are known for the production of good yields of noble gas
isotopes through spallation nuclear reactions. 42 Calcium oxide is too corrosive to be used
as a target material at high temperature directly in a tantalum (Ta) container, so it’s
covered, therefore protected, by a rhenium (Re) foil 43. Submitted at high temperatures
(>1050oC), it gives fast release of some of the elements. Proton induced reactions of

Chapter I – State of the Art
27
spallation and fragmentation mainly produce the isotopes as showed from the ABRABLA
simulation plot of Figure I-6 a).
This target is operated with a Versatile Arc Discharge Ion Source (VADIS) plasma
ion source which is especially designed for the production of noble gas RIBs, when
coupled via a cold transfer line (cooled by water) in order to trap condensable elements and
improve the chemical selectivity 43. The yields provided by the different CaO target units
can vary by more than one order of magnitude, only the best historical values at ISOLDE
are shown in Figure I-6 b).
Figure I-6 – (a) Simulation of the ISOLDE in-target isotope production yields for calcium oxide material with a thickness of 7g/cm2 done with ABRABLA. (b) Best historical experimental yields obtained by the CaO target material at ISOLDE. The filled marks were measured at the actual ISOLDE installations (PSB), the unfilled marks were measured in the old ISOLDE installation near the SC. 45
At ISOLDE, as referred in the Introduction, CaO targets outperform other target
material to produce similar beams but the material degrades in operation, either showing
low yields from the beginning or a decrease over time. This effect is believed to be either
due to sintering effects on the material due to high operation temperatures, to the proton
pulses, or both.
1E+0
1E+2
1E+4
1E+6
1E+8
1E+10
5 10 15 20 25 30 35 40 45 50
Y pro
d (io
ns/µ
C)
Mass Number
Argon Isotopes
Neon Isotopes
Carbon Isotopes
1E+0
1E+2
1E+4
1E+6
1E+8
5 10 15 20 25 30 35 40 45 50
Yiel
d (io
ns/µ
C)
Mass Number
Argon PSB
Carbon PSB
Helium PSB
Neon PSB
Argon SC
Carbon SC
Helium SC
Nitrogen SC
Neon SC
a)
b)
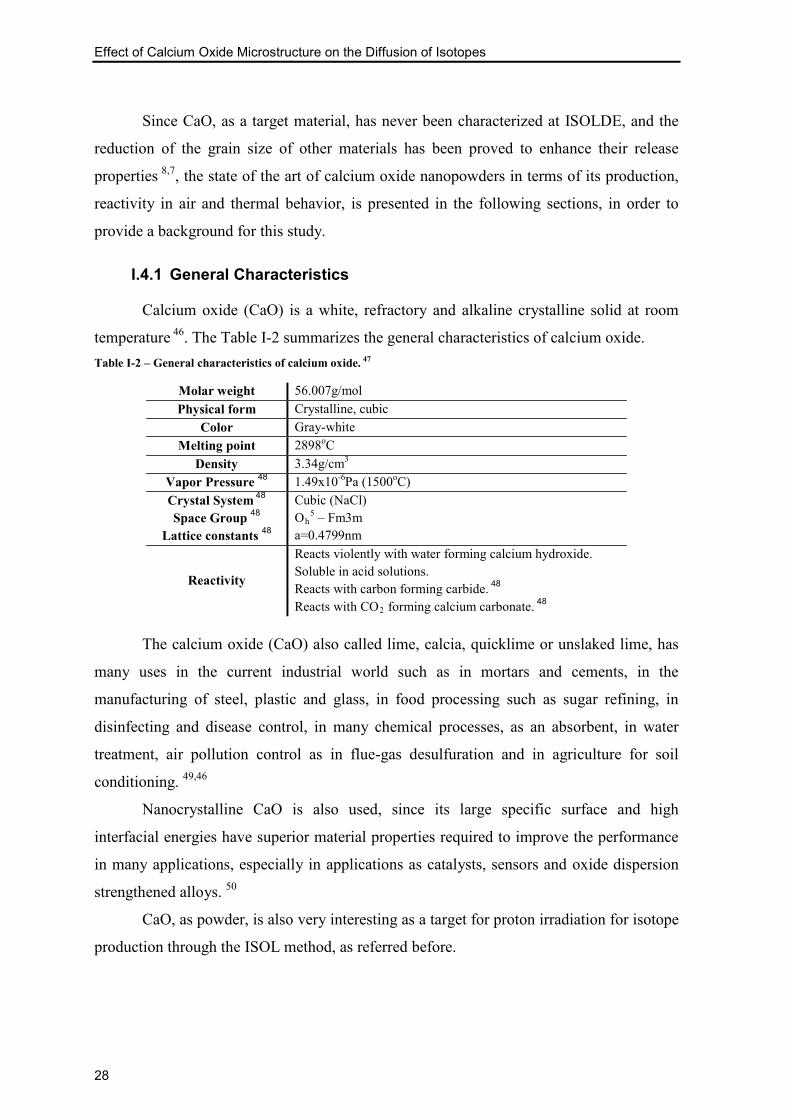
Effect of Calcium Oxide Microstructure on the Diffusion of Isotopes
28
Since CaO, as a target material, has never been characterized at ISOLDE, and the
reduction of the grain size of other materials has been proved to enhance their release
properties 8,7, the state of the art of calcium oxide nanopowders in terms of its production,
reactivity in air and thermal behavior, is presented in the following sections, in order to
provide a background for this study.
I.4.1 General Characteristics
Calcium oxide (CaO) is a white, refractory and alkaline crystalline solid at room
temperature 46. The Table I-2 summarizes the general characteristics of calcium oxide. Table I-2 – General characteristics of calcium oxide. 47
Molar weight 56.007g/mol Physical form Crystalline, cubic
Color Gray-white Melting point 2898oC
Density 3.34g/cm3 Vapor Pressure 48 1.49x10⁻⁶Pa (1500oC) Crystal System 48 Space Group 48
Lattice constants 48
Cubic (NaCl) Oh
5 – Fm3m a=0.4799nm
Reactivity
Reacts violently with water forming calcium hydroxide. Soluble in acid solutions. Reacts with carbon forming carbide. 48 Reacts with CO2 forming calcium carbonate. 48
The calcium oxide (CaO) also called lime, calcia, quicklime or unslaked lime, has
many uses in the current industrial world such as in mortars and cements, in the
manufacturing of steel, plastic and glass, in food processing such as sugar refining, in
disinfecting and disease control, in many chemical processes, as an absorbent, in water
treatment, air pollution control as in flue-gas desulfuration and in agriculture for soil
conditioning. 49,46
Nanocrystalline CaO is also used, since its large specific surface and high
interfacial energies have superior material properties required to improve the performance
in many applications, especially in applications as catalysts, sensors and oxide dispersion
strengthened alloys. 50
CaO, as powder, is also very interesting as a target for proton irradiation for isotope
production through the ISOL method, as referred before.

Chapter I – State of the Art
29
I.4.2 Calcination
The production of CaO through the decomposition of calcium carbonate (CaCO3,
calcite) has been object of study for the past 100 years 51. The chemical decomposition
reactions are within the most common solid state reactions. A different solid gas phases are
produced by heating up another solid, producing simple oxides from carbonates,
hydroxides, nitrates, sulphates and other metal salts. 30 The calcination, lately generalized
to the chemical reaction between solids or decomposition of solids through heating, is the
decomposition of the calcium carbonate, by supplying heat, into calcium oxide (CaO) and
carbon dioxide (CO2):
𝐶𝑎𝐶𝑂3 ↔ 𝐶𝑎𝑂 + 𝐶𝑂2 (I.22)
By having a look into the reaction thermodynamics, in Eq. (I.22), it is known that
the reaction is strongly endothermic, because the calculated standard enthalpy of the
reaction is high and positive, ∆HoR=42.6kcal/mol 52. From the calculation of the Gibbs free
energy change from the reaction, the temperature at which the CaCO3 begins to become
unstable can be known. Equivalent information can be taken from data of the partial
pressure of the gaseous product – CO2 (𝑝𝐶𝑂2).
Figure I-7 - Standard free energy of a reaction in function of the temperature. The dashed lines represent the equilibrium of the gas pressure above the reactions. 30

Effect of Calcium Oxide Microstructure on the Diffusion of Isotopes
30
A graphic representation of the variation of the Gibbs free energy with temperature
and the equilibrium gas pressure can be seen in Figure I-7. This figure is a very important
theoretical asset for this work since from it, one can assess the theoretical temperature at
which the CaCO3 starts to decompose at a specific partial pressure of CO2. This can be
done by drawing a vertical line which intercepts the point where the CaCO3 reaction line
meets the dashed line of the determined 𝑝𝐶𝑂2. It can be seen that, for the decomposition in
air, the reaction starts at ~800oC, whereas for reduced CO2 pressures, lower temperatures
are required. For instances, when 𝑝𝐶𝑂2=10-7atm (10-2 Pa) the reaction is shifted to ~610oC.
To achieve the desired properties and a high quality oxide product, a precise control
of the CaCO3 thermal decomposition is necessary. The characteristics of the precursor,
such as the particle size, porosity, purity, calcination temperature, holding time and CO2
pressure all influence the final characteristics of the synthetized CaO. 49 An understanding
of these factors along with their influence on the kinetics of the reaction is, therefore,
important and has been undertaken in various works which will be reviewed here.
Figure I-8 - Representation of the CaCO3 decomposition and the formation of the porous layer of CaO. 30
In this heterogeneous reaction, as the molar volume of the solid reaction product
(CaO) is less than the one of the reactant (CaCO3), the product forms a porous layer
around the nonporous reactant core, which interface moves inward 30. This is also called
the calcination shrinking core model, illustrated in Figure I-8 53. The kinetics of the
reaction can be either controlled by the reaction at the interface between the CaO and the
CaCO3, by heat transfer to the reaction or gas diffusion (or permeation) from the reaction
surface through the porous product layer 30.
The difference between the molar volumes indicates that the CaO should have a
porosity around ~55% for the CaO produced from CaCO3 and around 50% for the one
produced from Ca(OH)2, but slightly lower porosities (~15% less) in both cases were

Chapter I – State of the Art
31
obtained by D. Beruto et al. 54. This means that the calcite particle aggregates must
experience some shrinkage due to sintering effects during the decomposition step 55. This
can either be due to sintering of CaCO3 before or of CaCO3/CaO during the
decomposition, or both 56,57.
Through the last decades an effort has been made to understand the kinetics,
mechanism, and the rate limiting step of the decomposition reactions under different
conditions to create adequate kinetic models. However, no agreement among authors has
been reached, specifically in the case of the decomposition reactions to obtain CaO, which
is by far the most studied one. 49,58 Studies on the decomposition of CaCO3 and Ca(OH)2
powders or large single crystals in some various atmospheres, have been made, as
summarized in the Table I-3.
The kinetics of the CaCO3 decomposition follows a linear law accordingly to the
geometrical model of the contracting thickness: 30
𝑤 = 𝑘𝑟𝑡 (I.23)
where w is the weight loss, kr is the rate constant and t is the time. This relation is verified
experimentally in several works 49,51,58-61. 49,51,58,59,60,61
I.4.2.1 Effect of the Atmosphere and Temperature
In 1958, D. Glasson 56 first reported that CaO produced through decomposition of
micrometric CaCO3 powders in vacuum yielded higher surface areas than in air. It is by
creating non-equilibrium conditions that the reaction of the equation (I.22) is shifted to the
right hand side promoting the fast nucleation of CaO 57 and thus the formation of very
small crystallites. Several other studies, resumed in Table I-3, report the obtainment of
nanocrystalline CaO and decomposition reactions happening at much lower temperatures
than the decomposition in air. For example, D. Beruto et al. 54 reported complete
decomposition of CaCO3 micrometric powder (3 to 10 µm) at only 510oC under 7x10⁻⁴ Pa
(7x10⁻⁹ atm), to give 15 nm crystallites of CaO with 78 m2/g of specific surface area. This
is coherent with Figure I-7, where thermodynamically, for 𝑝𝐶𝑂2=10-8 atm) the reaction
happens at less than 600oC. Furthermore, E. Powell and A. Searcy 61 report decreasing
surface areas for increasing temperatures of decomposition.
In most of the studies, the obtained CaO crystallites are too small to be analyzed by
SEM and the characterization of CaO powders for Transmission Electron Microscopy
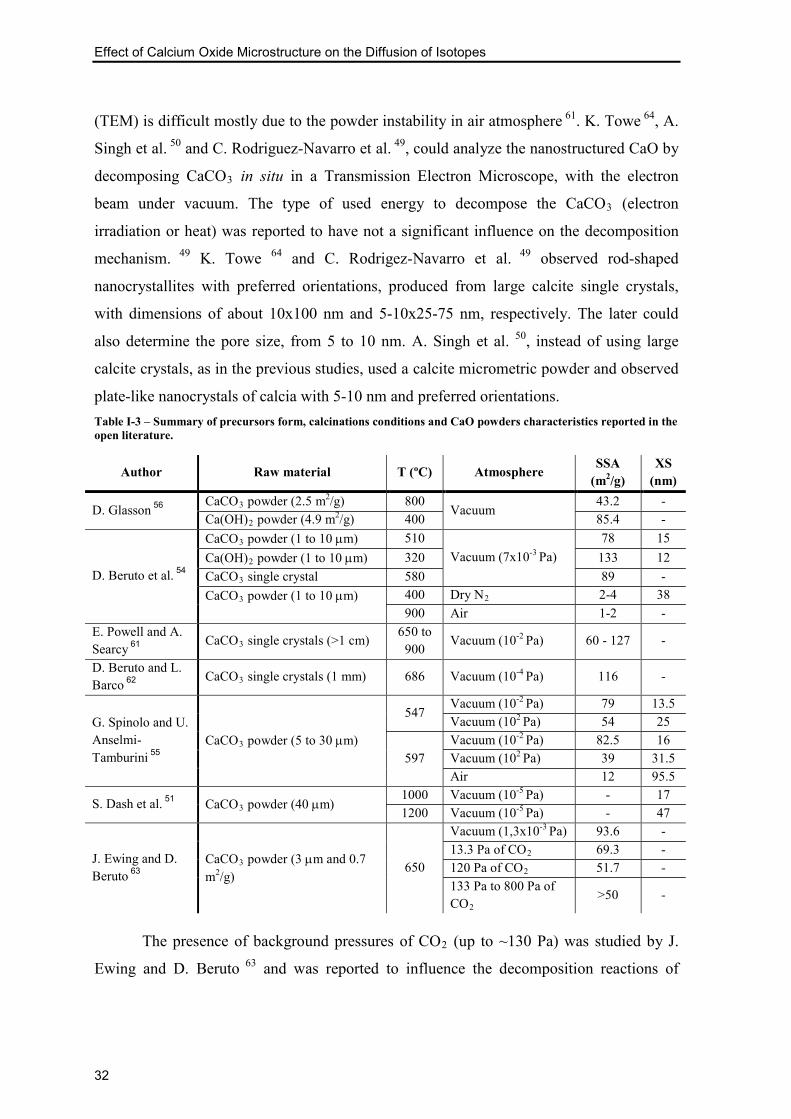
Effect of Calcium Oxide Microstructure on the Diffusion of Isotopes
32
(TEM) is difficult mostly due to the powder instability in air atmosphere 61. K. Towe 64, A.
Singh et al. 50 and C. Rodriguez-Navarro et al. 49, could analyze the nanostructured CaO by
decomposing CaCO3 in situ in a Transmission Electron Microscope, with the electron
beam under vacuum. The type of used energy to decompose the CaCO3 (electron
irradiation or heat) was reported to have not a significant influence on the decomposition
mechanism. 49 K. Towe 64 and C. Rodrigez-Navarro et al. 49 observed rod-shaped
nanocrystallites with preferred orientations, produced from large calcite single crystals,
with dimensions of about 10x100 nm and 5-10x25-75 nm, respectively. The later could
also determine the pore size, from 5 to 10 nm. A. Singh et al. 50, instead of using large
calcite crystals, as in the previous studies, used a calcite micrometric powder and observed
plate-like nanocrystals of calcia with 5-10 nm and preferred orientations. Table I-3 – Summary of precursors form, calcinations conditions and CaO powders characteristics reported in the open literature.
Author Raw material T (ºC) Atmosphere SSA
(m2/g) XS
(nm)
D. Glasson 56 CaCO3 powder (2.5 m2/g) 800
Vacuum 43.2 -
Ca(OH)2 powder (4.9 m2/g) 400 85.4 -
D. Beruto et al. 54
CaCO3 powder (1 to 10 µm) 510 Vacuum (7x10⁻³ Pa)
78 15 Ca(OH)2 powder (1 to 10 µm) 320 133 12 CaCO3 single crystal 580 89 - CaCO3 powder (1 to 10 µm)
400 Dry N2 2-4 38 900 Air 1-2 -
E. Powell and A. Searcy 61
CaCO3 single crystals (>1 cm) 650 to
900 Vacuum (10-2 Pa) 60 - 127 -
D. Beruto and L. Barco 62
CaCO3 single crystals (1 mm) 686 Vacuum (10-4 Pa) 116 -
G. Spinolo and U. Anselmi-Tamburini 55
CaCO3 powder (5 to 30 µm)
547 Vacuum (10-2 Pa) 79 13.5 Vacuum (102 Pa) 54 25
597 Vacuum (10-2 Pa) 82.5 16 Vacuum (102 Pa) 39 31.5 Air 12 95.5
S. Dash et al. 51 CaCO3 powder (40 µm) 1000 Vacuum (10-5 Pa) - 17 1200 Vacuum (10-5 Pa) - 47
J. Ewing and D. Beruto 63
CaCO3 powder (3 µm and 0.7 m2/g)
650
Vacuum (1,3x10⁻³ Pa) 93.6 - 13.3 Pa of CO2 69.3 - 120 Pa of CO2 51.7 - 133 Pa to 800 Pa of CO2
>50 -
The presence of background pressures of CO2 (up to ~130 Pa) was studied by J.
Ewing and D. Beruto 63 and was reported to influence the decomposition reactions of
Chapter I – State of the Art
33
CaCO3 by means of decreasing the surface areas, increasing the crystallinity of CaO
produced, with the increase of 𝑝𝐶𝑂2 (for values, see Table I-3). He also reported that
sintering happened already at 650oC, for 1200Pa of CO2 pressure, and the resulting CaO
particles showed coalescence, dimpling and rounding. The effect of CO2 in sintering will
be better detailed ahead.
Decomposition of CaCO3 under N2 atmospheres showed microstructures and
morphologies identical to those observed in air decomposition. These microstructures
showed rounded grains and coalescence between them. This was observed by J. Ewing, D.
Beruto 63, M. Maciejewski and R. Oswald 57. The former attributes this result to the partial
increase of the CO2 pressure in the decomposition atmosphere up to values comparable to
those attained in air decomposition.
I.4.2.2 Influence of the Precursor
Calcium oxide has been obtained by decomposition of micrometric powders of
Ca(OH)2 and CaCO3 in vacuum by D. Glasson 56 and D. Beruto et al. 54 They both report
higher surface areas in the case of decomposition of Ca(OH)2 comparing with the
decomposition of CaCO3. Furthermore, D. Beruto et al. 54 reported that the reaction is
pseudomorphous for the decomposition of both precursors. This author obtained calcia
particles with different porosities for different precursors (higher in case of decomposition
from CaCO3, because the molar volume of water is less that the molar volume of CO2.
In other study done by D. Beruto and A. Searcy 60 the morphology of the obtained
calcia particles from calcite large single crystals as precursors, was studied. Two
microstructures were reported to be present in the obtained CaO crystals: an inner layer of
about 10 to 50 µm, made of rods typically separated from their neighbors by very small
pores, and an outer layer where the rods are typically collapsed into bundles of ~1 µm
cross section separated by ~1 µm pores. This indicates that the outer layer, which is an
open structure of the inner unbundled rods, is mechanically unstable and that strains can be
induced in it. It is thought that this strain is due to the low mobility of the CaO species in
the reaction interface. 58 The transition between the two layers lead to changes in the pore
size and distribution as suggested by E. Powel and A. Searcy 61 and later proved by D.
Beruto 62: the transition happens, when the intermediate layer has more than ~10 µm, by
difusionless repacking into bundles, reducing the surface area and creating a duplex pore

Effect of Calcium Oxide Microstructure on the Diffusion of Isotopes
34
structure, with the larger pores being in the micrometric range. A consequence of this type
of structure, with bimodal pore-size distribution, is that by heating, coarsening with very
little shrinkage is observed, with decrease in the mesopore* volume being balanced by
increase in the macropore* volume 65.
In the case of decomposition of micrometric calcite particles, no macropores are
observed in CaO. This proves that re-packing into bundles is size dependent. The strain
accumulates on the calcite-CaO rod interfaces, but when the stress exceeds a critical value
the mechanical stability of the CaO aggregate is broken. The formation of macropores is
thought to relieve the stresses. The CaO produced from small calcite particles does not
reach this critical level of stress. 58
I.4.3 Reactivity in Air
Calcium oxide produced from powders or single crystals in vacuum is very reactive
and hydrates very fast compared to the ones produced in air. 66 This very high reactivity is
due to their higher surface areas because of high porosity and low crystallite size. There is
also evidence that this product (the formed hydrate) is nanocrystalline and forms
instantaneously when high reactive CaO is exposed to air. 51
There are three possible reactions (I.24),(I.25) and (I.26), that can happen when
CaO is exposed to air:
𝐶𝑎𝑂 + 𝐻2𝑂 ↔ 𝐶𝑎(𝑂𝐻)2 (I.24)
𝐶𝑎𝑂 + 𝐶𝑂2 ↔ 𝐶𝑎𝐶𝑂3 (I.25)
𝐶𝑎(𝑂𝐻)2 + 𝐶𝑂2 ↔ 𝐶𝑎𝐶𝑂3 + 𝐻2𝑂 (I.26)
Which reaction happens will be decided not only by thermodynamics but also by
kinetic factors. The calculated standard free energy for the reactions (∆GoR) in equations
(I.24), (I.25) and (I.26) are respectively -15.8 kcal mol-1, -31.2 kcal mol-1 and -15.4 kcal
mol-1. 52 These values show that the reaction is spontaneous in all the cases (the more
negative the more spontaneous). The calculated standard enthalpy of the reactions (∆HoR)
in equations (I.24), (I.25) and (I.26), are respectively -26.8 kcal mol-1, -42.6 kcal mol-1 and
-15.9 kcal mol-1, showing that all the reactions are exothermic 52.
* Accordingly to the International Union of Pure and Applied Chemistry (IUPAC), the pore size is
defined in three categories: micropores have less than 2nm, mesopores have between 2 and 50nm and macropores have more than 50nm. 62
Chapter I – State of the Art
35
Hydration studies in CaO shows that this step leads to loss of specific surface area
and increase in particle size, due to agglomeration 56 and to an increase of volume almost to
double, creating internal strains in the material 67. The roughness is reported to increase
with the time of exposure to moisture 68. A study reports that just by quick transferring a
high surface area CaO (78 m2/g) from the decomposition furnace to a thermogravimetry
apparatus, caused sample hydration to an extent of 15 to 18% 54. The hydration resistance
of CaO sintered samples is reported to be enhanced with the sintering temperature. 69
While the hydration is reported to almost double the volume, the carbonation is
reported to only increase the later by 12%. The number of crystallites formed by
carbonation is lower than by hydration. 70 The carbonation proceeds to the interior of the
particle by an advancing interface. The newly formed CaCO3, starts to inhibit the progress
of the reaction because of its very low porosity which implies a large loss of surface area. 71 This finding has been studied in order to improve the hydration resistance of CaO by
forming a layer of the carbonated product. 72
With the increasing interest for the greenhouse effect over the last years, there has
been several studies defending the use of calcium oxide for high temperature CO2
sequestration and its performance after several cycles of decomposition and carbonation.
I.4.4 Sintering of Calcium Oxide
Sintering is a processing technique which is used to produce density controlled
materials and components from ceramics or/and metal powders by applying thermal
energy. It is a process that is influenced by the powder and compact characteristics
(impurities, morphology, particle size distribution, agglomeration, green density, etc.) and
by the sintering conditions (heating and cooling rates, maximum temperature, holding
time, pressure, atmosphere, etc.). 33 The solid state sintering comprises three main phases:
(i) the initial stage, which is characterized by rapid inter-particle neck growth and
corresponds to shrinking values up to 3%, (ii) the intermediate stage which goes until 90-
95% of the theoretical density and is characterized by continuous pore phase at an
equilibrium of their shape, and (iii) the final stage for densities higher than 95% and the
goal is to remove all porosity ending most of the times as isolated pores. 30
The mechanisms of sintering in polycrystalline ceramics are the paths through
which transport of matter happens. This happens from regions which have higher chemical

Effect of Calcium Oxide Microstructure on the Diffusion of Isotopes
36
potentials towards regions with lower chemical potentials. 30 At least 6 mechanisms of
sintering exist in solid state sintering and they are illustrated in the Figure I-9.
Figure I-9 - Mechanisms of solid state sintering. Only 4 to 6 cause densification, but all cause neck growth influencing densification. 30
The specific surface area is a much sensitive parameter in the evaluation of
sintering and can be used for studying the kinetics of the initial sintering. The following
equation was proposed in a model developed by R. German and A. Munir 73 for the surface
area reduction in the initial stage sintering, under isothermal conditions:
�Δ𝑆𝑆0�𝛾
= 𝑘𝑡 (I.27)
where S is the surface area, S0 is the initial surface area, γ is an exponent related to the
sintering mechanism, t is the time and k can be expressed as:
𝑘 =𝑘0𝑒
− 𝑄𝑅𝑇
𝑟𝑚𝑇 (I.28)
being k0 a constant term of a given material, Q the activation energy, R the gas constant, T
the temperature, r the particle radius, and m the Herring scaling exponent. This kinetic
model is also called the German and Munir model. It is only valid for ∆S/S0<0.5, until
necks start to touch each other, marking the end of the initial stage sintering. There are
also other assumptions like dense and spherical monosized particles.
Shrinkage is another kinetic parameter for the first stage of sintering and the
following equation was derived, under isothermal conditions 33:
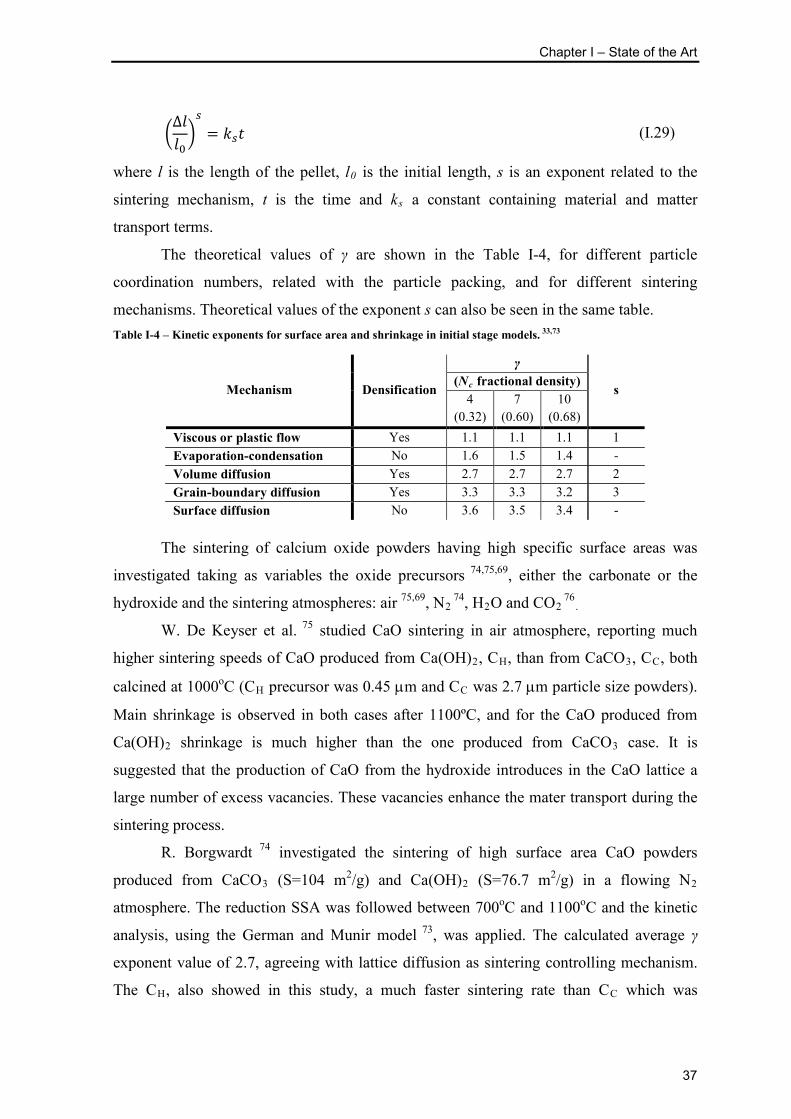
Chapter I – State of the Art
37
�Δ𝑙𝑙0�𝑠
= 𝑘𝑠𝑡 (I.29)
where l is the length of the pellet, l0 is the initial length, s is an exponent related to the
sintering mechanism, t is the time and ks a constant containing material and matter
transport terms.
The theoretical values of γ are shown in the Table I-4, for different particle
coordination numbers, related with the particle packing, and for different sintering
mechanisms. Theoretical values of the exponent s can also be seen in the same table. Table I-4 – Kinetic exponents for surface area and shrinkage in initial stage models. 33,73
Mechanism Densification
γ
s (Nc fractional density)
4 (0.32)
7 (0.60)
10 (0.68)
Viscous or plastic flow Yes 1.1 1.1 1.1 1 Evaporation-condensation No 1.6 1.5 1.4 - Volume diffusion Yes 2.7 2.7 2.7 2 Grain-boundary diffusion Yes 3.3 3.3 3.2 3 Surface diffusion No 3.6 3.5 3.4 -
The sintering of calcium oxide powders having high specific surface areas was
investigated taking as variables the oxide precursors 74,75,69, either the carbonate or the
hydroxide and the sintering atmospheres: air 75,69, N2 74, H2O and CO2
76.
W. De Keyser et al. 75 studied CaO sintering in air atmosphere, reporting much
higher sintering speeds of CaO produced from Ca(OH)2, CH, than from CaCO3, CC, both
calcined at 1000oC (CH precursor was 0.45 µm and CC was 2.7 µm particle size powders).
Main shrinkage is observed in both cases after 1100ºC, and for the CaO produced from
Ca(OH)2 shrinkage is much higher than the one produced from CaCO3 case. It is
suggested that the production of CaO from the hydroxide introduces in the CaO lattice a
large number of excess vacancies. These vacancies enhance the mater transport during the
sintering process.
R. Borgwardt 74 investigated the sintering of high surface area CaO powders
produced from CaCO3 (S=104 m2/g) and Ca(OH)2 (S=76.7 m2/g) in a flowing N2
atmosphere. The reduction SSA was followed between 700oC and 1100oC and the kinetic
analysis, using the German and Munir model 73, was applied. The calculated average γ
exponent value of 2.7, agreeing with lattice diffusion as sintering controlling mechanism.
The CH, also showed in this study, a much faster sintering rate than CC which was

Effect of Calcium Oxide Microstructure on the Diffusion of Isotopes
38
attributed to its lower porosity, leading to a denser compact with more contact points
between the particles. Finally, by decomposing CaCO3 pure and with impurities he
observed a higher sintering rate for the latter, which was explained by the effect of
impurities creating lattice defects and therefore, accelerating solid-state diffusion
processes.
R. Borgwardt 76 also studied the influence of presence of H2O and CO2 in the
sintering atmosphere of the same CaO powders used in the previous study 74, from 350oC
to 1150oC, and partials pressures up to 1.5x10³ Pa of H2O and up to 1.2x10³ Pa of CO2.
Both types of gas are reported to strongly catalyze the sintering process and, furthermore,
their effects are additive. The kinetic analysis taking the German and Munir model 73
couldn’t identify the mechanism, since the values of γ exponent increased by increasing
H2O or CO2 pressure and the values are higher than the theoretical ones, in Table I-4.
Other mechanisms, than lattice diffusion may be operating and it was proposed that the
presence of CO2 and H2O on free surfaces and interfaces activates the surface and grain
boundary transport.
D. Beruto et al. 65 studied the influence of the CO2 pressure in the sintering of CaO
with ~120 m2/g. He observed that a CO2 pressure around 1330 Pa greatly increases the
sintering of CaO at a low temperature of 686oC which is in accord with the activating
effect of CO2 in the matter transport for sintering also reported by R. Borgwart 76. The
surface area reached more than 50% of reduction after 10h, at this temperature.
Effect of Calcium Oxide Microstructure on the Diffusion of Isotopes
39
Chapter II - Experimental Procedure

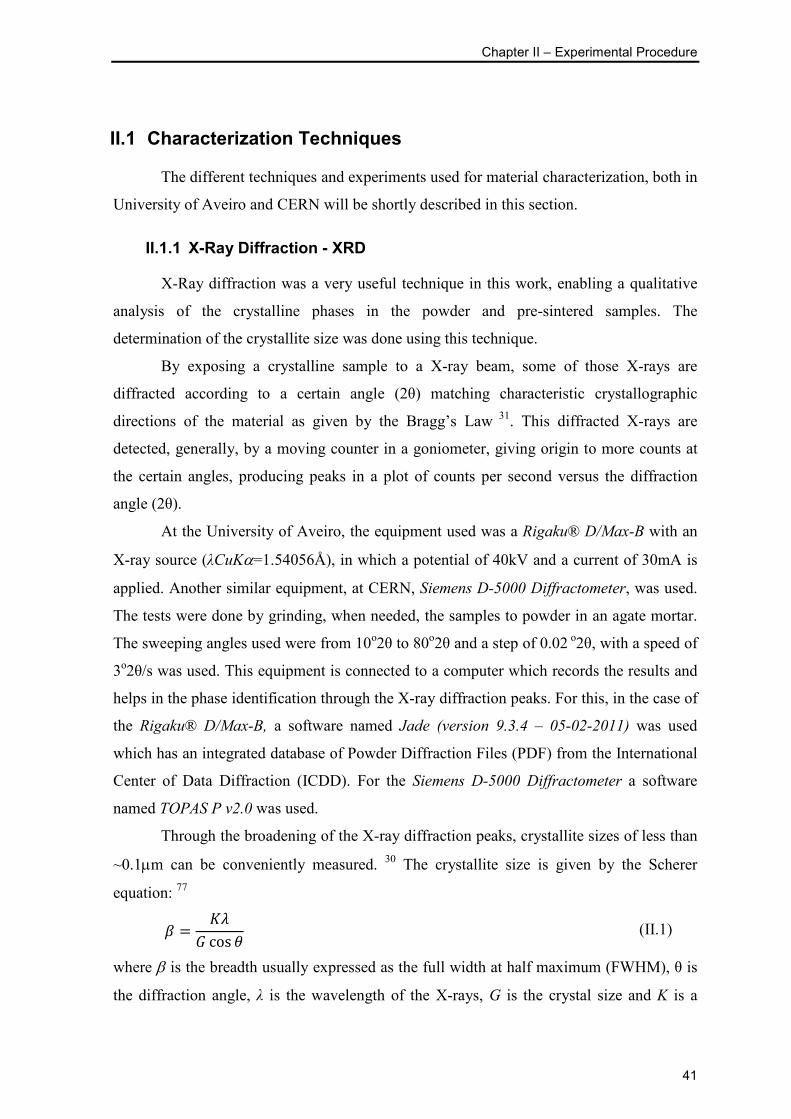
Chapter II – Experimental Procedure
41
II.1 Characterization Techniques
The different techniques and experiments used for material characterization, both in
University of Aveiro and CERN will be shortly described in this section.
II.1.1 X-Ray Diffraction - XRD
X-Ray diffraction was a very useful technique in this work, enabling a qualitative
analysis of the crystalline phases in the powder and pre-sintered samples. The
determination of the crystallite size was done using this technique.
By exposing a crystalline sample to a X-ray beam, some of those X-rays are
diffracted according to a certain angle (2θ) matching characteristic crystallographic
directions of the material as given by the Bragg’s Law 31. This diffracted X-rays are
detected, generally, by a moving counter in a goniometer, giving origin to more counts at
the certain angles, producing peaks in a plot of counts per second versus the diffraction
angle (2θ).
At the University of Aveiro, the equipment used was a Rigaku® D/Max-B with an
X-ray source (λCuKα=1.54056Å), in which a potential of 40kV and a current of 30mA is
applied. Another similar equipment, at CERN, Siemens D-5000 Diffractometer, was used.
The tests were done by grinding, when needed, the samples to powder in an agate mortar.
The sweeping angles used were from 10o2θ to 80o2θ and a step of 0.02 o2θ, with a speed of
3o2θ/s was used. This equipment is connected to a computer which records the results and
helps in the phase identification through the X-ray diffraction peaks. For this, in the case of
the Rigaku® D/Max-B, a software named Jade (version 9.3.4 – 05-02-2011) was used
which has an integrated database of Powder Diffraction Files (PDF) from the International
Center of Data Diffraction (ICDD). For the Siemens D-5000 Diffractometer a software
named TOPAS P v2.0 was used.
Through the broadening of the X-ray diffraction peaks, crystallite sizes of less than
~0.1µm can be conveniently measured. 30 The crystallite size is given by the Scherer
equation: 77
𝛽 =𝐾𝜆
𝐺 cos 𝜃 (II.1)
where β is the breadth usually expressed as the full width at half maximum (FWHM), θ is
the diffraction angle, λ is the wavelength of the X-rays, G is the crystal size and K is a
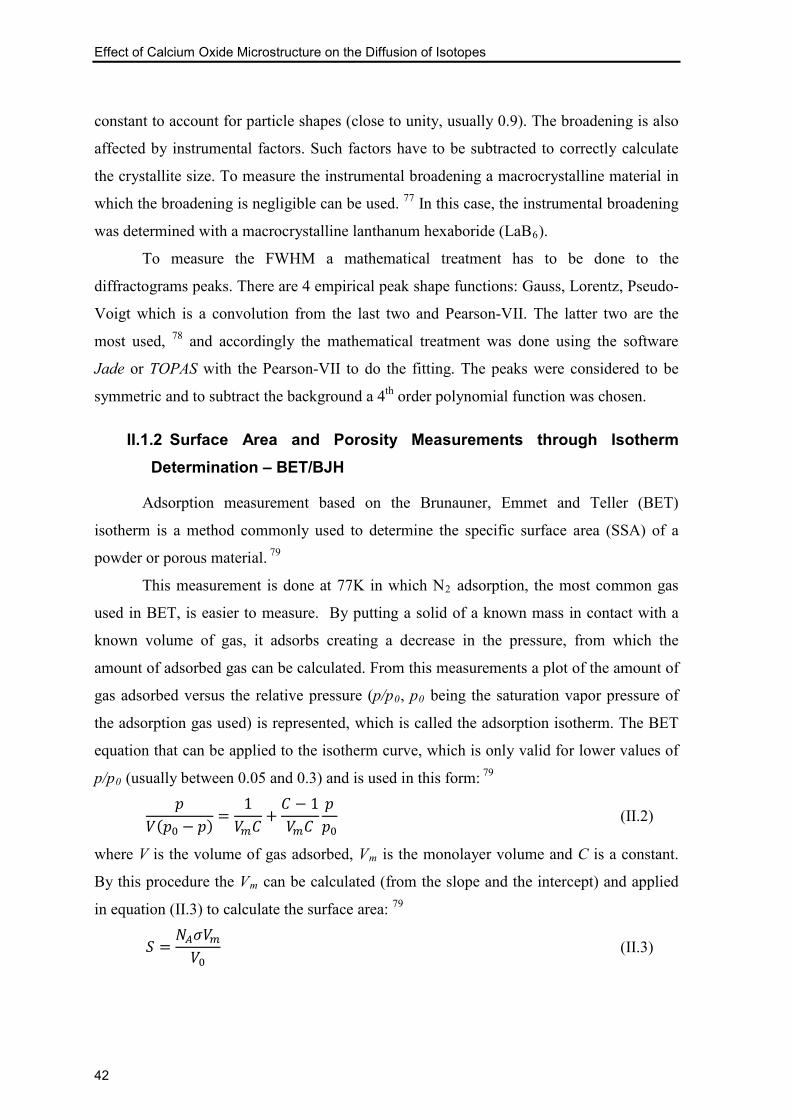
Effect of Calcium Oxide Microstructure on the Diffusion of Isotopes
42
constant to account for particle shapes (close to unity, usually 0.9). The broadening is also
affected by instrumental factors. Such factors have to be subtracted to correctly calculate
the crystallite size. To measure the instrumental broadening a macrocrystalline material in
which the broadening is negligible can be used. 77 In this case, the instrumental broadening
was determined with a macrocrystalline lanthanum hexaboride (LaB6).
To measure the FWHM a mathematical treatment has to be done to the
diffractograms peaks. There are 4 empirical peak shape functions: Gauss, Lorentz, Pseudo-
Voigt which is a convolution from the last two and Pearson-VII. The latter two are the
most used, 78 and accordingly the mathematical treatment was done using the software
Jade or TOPAS with the Pearson-VII to do the fitting. The peaks were considered to be
symmetric and to subtract the background a 4th order polynomial function was chosen.
II.1.2 Surface Area and Porosity Measurements through Isotherm Determination – BET/BJH
Adsorption measurement based on the Brunauner, Emmet and Teller (BET)
isotherm is a method commonly used to determine the specific surface area (SSA) of a
powder or porous material. 79
This measurement is done at 77K in which N2 adsorption, the most common gas
used in BET, is easier to measure. By putting a solid of a known mass in contact with a
known volume of gas, it adsorbs creating a decrease in the pressure, from which the
amount of adsorbed gas can be calculated. From this measurements a plot of the amount of
gas adsorbed versus the relative pressure (p/p0, p0 being the saturation vapor pressure of
the adsorption gas used) is represented, which is called the adsorption isotherm. The BET
equation that can be applied to the isotherm curve, which is only valid for lower values of
p/p0 (usually between 0.05 and 0.3) and is used in this form: 79
𝑝
𝑉(𝑝0 − 𝑝) =1𝑉𝑚𝐶
+𝐶 − 1𝑉𝑚𝐶
𝑝𝑝0
(II.2)
where V is the volume of gas adsorbed, Vm is the monolayer volume and C is a constant.
By this procedure the Vm can be calculated (from the slope and the intercept) and applied
in equation (II.3) to calculate the surface area: 79
𝑆 =𝑁𝐴𝜎𝑉𝑚𝑉0
(II.3)

Chapter II – Experimental Procedure
43
where the S is the surface area, NA is the Avogadro number, σ is the area of an adsorbed
gas molecule and V0 is the volume of 1mol of gas at STP (Standard Temperature and
Pressure).
The average particle size (GBET) of a powder can also be known, assuming a certain
particle shape, and dense and unagglomerated particles, by the following equation: 80
𝐺𝐵𝐸𝑇 =𝑓
𝑆 × 𝑑𝑆 (II.4)
where ds is the theoretical density of the solid material and f is a particle shape factor
defined in Table II-1. Table II-1 – Shape factors and respective packing fractions for different powder geometries. 80
Powder Shape Shape factor, f Packing fraction Sphere 6.0 0.60 Ellipsoid (1:2:4) 7.6 0.52 Cylinder (1:1) 6.0 0.61 Cylinder (1:2) 5.0 0.60 Cylinder (1:10) 4.2 0.48 Cube 7.4 0.72 Parallelepiped (1:4:4) 9.4 0.68 Flake (1:10) 24 0.55
The very initial part of an isotherm and its end may also give information about the
material porosity. There are 6 different main types of the isotherms accordingly to
Brunauer, Emmet and Teller. 30 The different isotherms represent different properties of a
material, also the different type of hysteresis on adsorption and desorption measurements
reveals much about the type of porosity. From the isotherms the pore size distribution
(PSD), pore volume and pore area can be obtained, using either the nonlinear high p/p0
zone of the isothermal or the low one, through methods such as the t-plot (for
microporosity area) and the Barret-Joyner-Halenda method (BJH) for the PSD, pore
volume and pore area. For further reading refer to the bibliography. 81,79
The equipment used was a Micromeritics® – Gemini 2370 V5, in the University of
Aveiro, and a Quantachrome® eNOVA2200, at CERN, which both use N2 as the
adsorption gas and liquid N2 to cool down the samples.
Before every test the samples were degased at 200oC for 4-6h in flowing nitrogen.

Effect of Calcium Oxide Microstructure on the Diffusion of Isotopes
44
II.1.3 Differential Thermal and Thermogravimetric Analysis – DTA/TGA
Differential Thermal Analysis (DTA) is a technique that permits to know the
thermal behavior of a material and the transformations it goes through.
This is done by heating up the material, registering the temperature difference
against an inert material (reference, normally pure alumina), which is being heated
simultaneously. The temperature difference (in μV) is then plotted against the temperature
of the furnace and positive differences between them indicating exothermal
transformations or negative ones, endothermic transformations.
It’s usual in this kind of tests to record the weight variation during DTA test, which
technique is called thermogravimetric analysis (TGA). This provides additional
information about the transformation that is occurring, by overlapping the weight loss
curve (TGA) with temperature to the thermal energy curve (DTA).
The equipment used was a Shimadzu® TGA-50. It’s a DTA/TGA equipment with
the capability of doing the tests under a flowing gas of choice. The tests were done under
flowing Argon. All tests were done in the same conditions: heating from room temperature
to 1000oC at a rate of 10oC/min.
II.1.4 Scanning Electron Microscopy – SEM/STEM
The scanning electron microscopy (SEM) is a widely used technique to study the
microstructure and morphology of materials. An electron gun generates a beam of
electrons inside a vacuum column which is then focused and driven to collide with a target,
the sample. An image is possible due to the electronic signal generated by the low angle
backscattered electrons, which are created by electron interactions with the material
surface. 31
The SEM equipment used was a Hitachi® model SU-70, in the University of
Aveiro, that has a maximum electron acceleration potential of 30 kV, a point-to-point
resolution of 1 nm at 15 kV and an energy dispersive X-ray spectrometer (EDS). This
equipment also permits transmission electron microscopy by putting a detector below the
sample. This technique is often called scanning transmission electron microscopy (STEM).
The powder samples were prepared by making a diluted suspension of powder in
pure ethanol (99%) followed by deposition of a drop in a copper micrometric grid. The
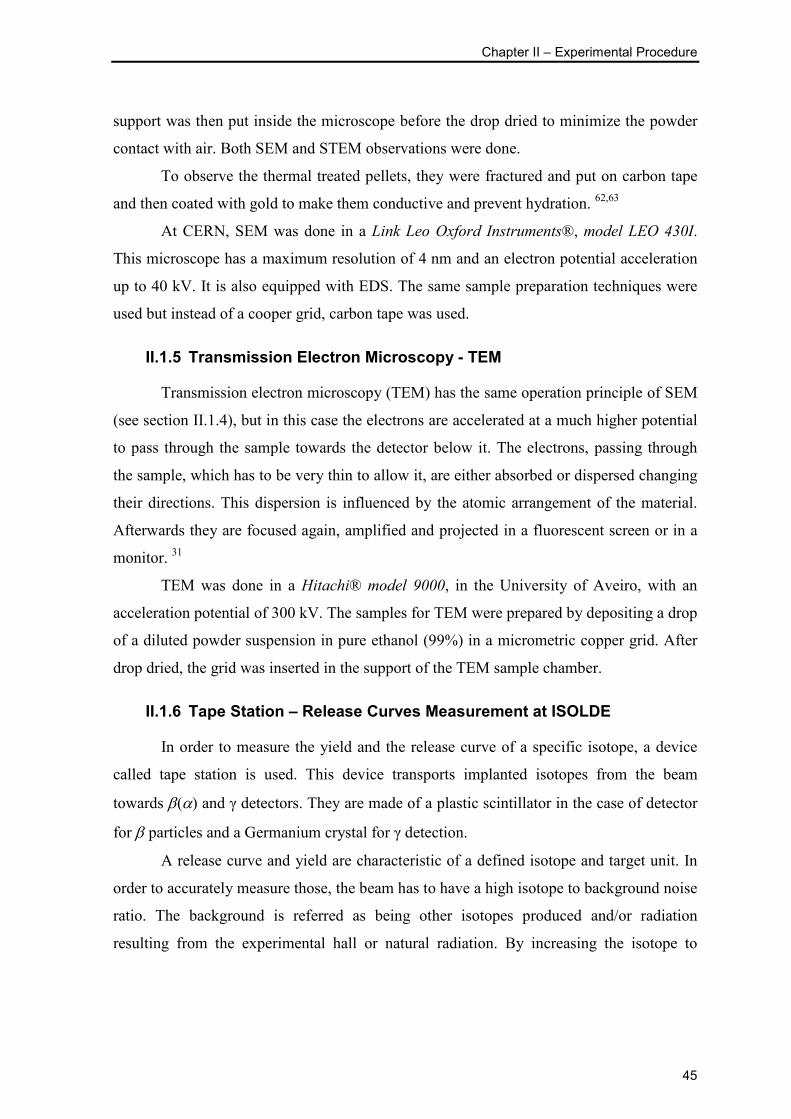
Chapter II – Experimental Procedure
45
support was then put inside the microscope before the drop dried to minimize the powder
contact with air. Both SEM and STEM observations were done.
To observe the thermal treated pellets, they were fractured and put on carbon tape
and then coated with gold to make them conductive and prevent hydration. 62,63
At CERN, SEM was done in a Link Leo Oxford Instruments®, model LEO 430I.
This microscope has a maximum resolution of 4 nm and an electron potential acceleration
up to 40 kV. It is also equipped with EDS. The same sample preparation techniques were
used but instead of a cooper grid, carbon tape was used.
II.1.5 Transmission Electron Microscopy - TEM
Transmission electron microscopy (TEM) has the same operation principle of SEM
(see section II.1.4), but in this case the electrons are accelerated at a much higher potential
to pass through the sample towards the detector below it. The electrons, passing through
the sample, which has to be very thin to allow it, are either absorbed or dispersed changing
their directions. This dispersion is influenced by the atomic arrangement of the material.
Afterwards they are focused again, amplified and projected in a fluorescent screen or in a
monitor. 31
TEM was done in a Hitachi® model 9000, in the University of Aveiro, with an
acceleration potential of 300 kV. The samples for TEM were prepared by depositing a drop
of a diluted powder suspension in pure ethanol (99%) in a micrometric copper grid. After
drop dried, the grid was inserted in the support of the TEM sample chamber.
II.1.6 Tape Station – Release Curves Measurement at ISOLDE
In order to measure the yield and the release curve of a specific isotope, a device
called tape station is used. This device transports implanted isotopes from the beam
towards β(α) and γ detectors. They are made of a plastic scintillator in the case of detector
for β particles and a Germanium crystal for γ detection.
A release curve and yield are characteristic of a defined isotope and target unit. In
order to accurately measure those, the beam has to have a high isotope to background noise
ratio. The background is referred as being other isotopes produced and/or radiation
resulting from the experimental hall or natural radiation. By increasing the isotope to
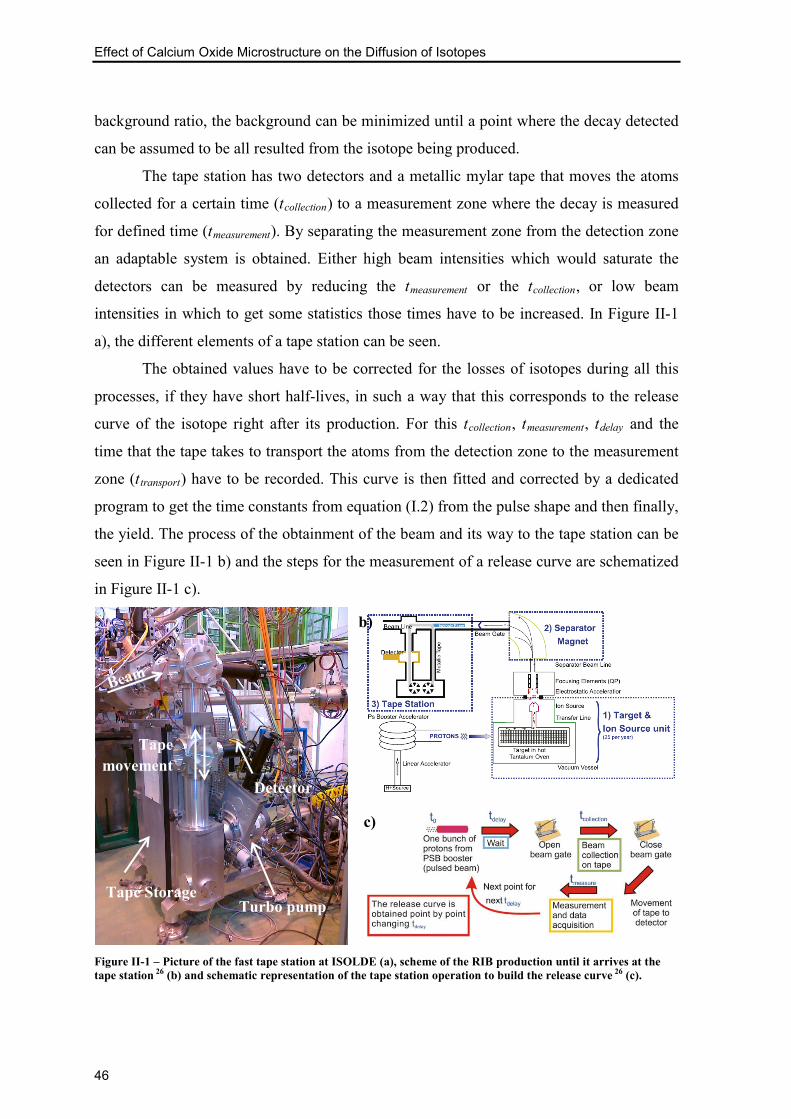
Effect of Calcium Oxide Microstructure on the Diffusion of Isotopes
46
background ratio, the background can be minimized until a point where the decay detected
can be assumed to be all resulted from the isotope being produced.
The tape station has two detectors and a metallic mylar tape that moves the atoms
collected for a certain time (tcollection) to a measurement zone where the decay is measured
for defined time (tmeasurement). By separating the measurement zone from the detection zone
an adaptable system is obtained. Either high beam intensities which would saturate the
detectors can be measured by reducing the tmeasurement or the tcollection, or low beam
intensities in which to get some statistics those times have to be increased. In Figure II-1
a), the different elements of a tape station can be seen.
The obtained values have to be corrected for the losses of isotopes during all this
processes, if they have short half-lives, in such a way that this corresponds to the release
curve of the isotope right after its production. For this tcollection, tmeasurement, tdelay and the
time that the tape takes to transport the atoms from the detection zone to the measurement
zone (ttransport) have to be recorded. This curve is then fitted and corrected by a dedicated
program to get the time constants from equation (I.2) from the pulse shape and then finally,
the yield. The process of the obtainment of the beam and its way to the tape station can be
seen in Figure II-1 b) and the steps for the measurement of a release curve are schematized
in Figure II-1 c).
Figure II-1 – Picture of the fast tape station at ISOLDE (a), scheme of the RIB production until it arrives at the tape station 26 (b) and schematic representation of the tape station operation to build the release curve 26 (c).
Detector
a) b)
c)
Tape Storage Turbo pump
Tape movement

Chapter II – Experimental Procedure
47
For isotopes which don’t have characteristic gamma decay another type of test can
be done using β decay properties. After collection, the tape is transported to the detector
and the decay is measured over time, building a decay curve. This permits the
identification of an isotope through its characteristic half-life.
There are two tape stations at ISOLDE which ares located at different beam lines
after the mass separator. The main difference between them is the minimum possible time
that the tape takes to move from the detection zone to the measurement zone. Because of
that, one is called the fast tape station (ttransport,min=200 ms) and the other the old tape
station(ttransport,min=900 ms).
To evaluate if there are contaminations in the beam after separation, gamma
spectroscopy can be done, in which the different isotopes are assessed by their gamma
decays. The peaks obtained are then compared (energy and relative intensity) with
references in databases 14,82 to identify the isotopes.
II.2 Raw Material
For the material characterization studies done at the University of Aveiro, the raw
material used to produce the calcium oxide (CaO) was a <5µm calcium carbonate (CaCO3)
powder, with 99.5% chemical purity (metal basis) that was acquired from Alfa Aesar®.
Characteristics of the material were retrieved from the supplier and additional
characterization was also done, such as SEM, Coulter, XRD and DTA/TGA analysis
(whose technique details are described ahead (Section II.1)), which results are presented in
Figure II-2 to 3 and resumed in Table II-2.
Figure II-2 - XRD of the raw material, CaCO3, used to produce CaO.
0
2000
4000
6000
8000
10000
10 20 30 40 50 60 70 80
Inte
nsity
(Cou
nts p
er se
cond
)
2θ (deg)
A A A A A A A
A – Aragonite C – Calcite
C
C
C C
C C C C
C C
C C C C C C C C C
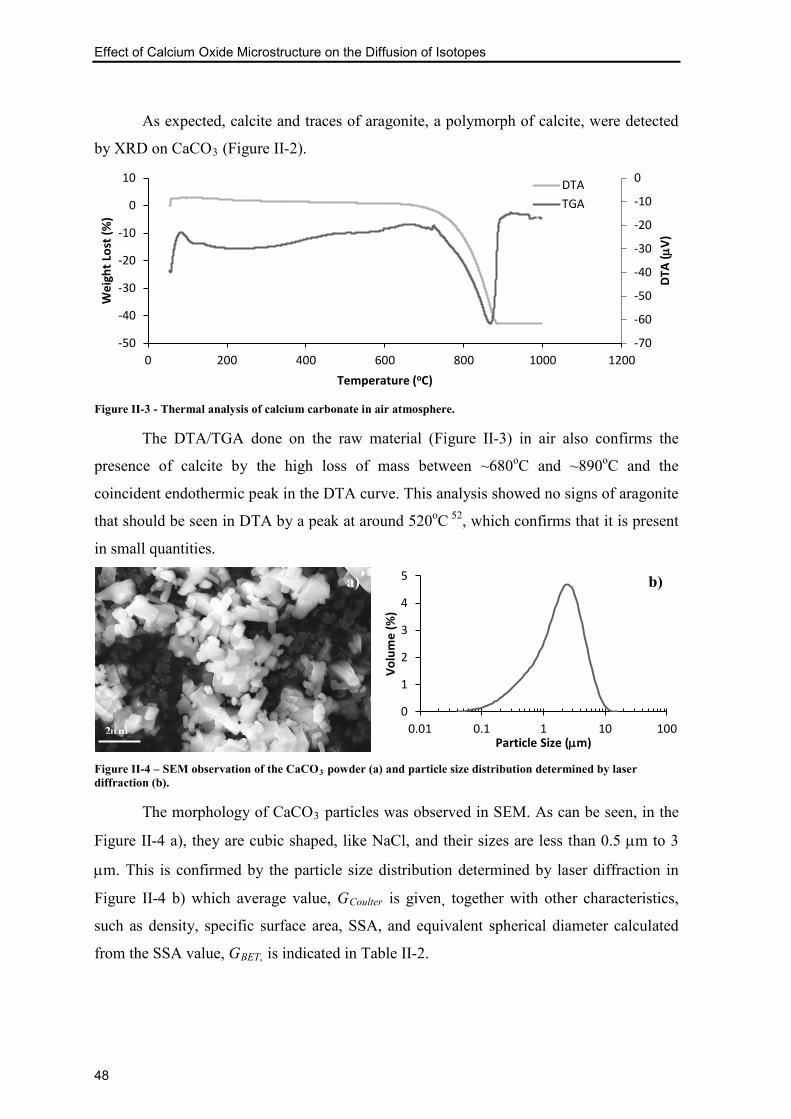
Effect of Calcium Oxide Microstructure on the Diffusion of Isotopes
48
As expected, calcite and traces of aragonite, a polymorph of calcite, were detected
by XRD on CaCO3 (Figure II-2).
Figure II-3 - Thermal analysis of calcium carbonate in air atmosphere.
The DTA/TGA done on the raw material (Figure II-3) in air also confirms the
presence of calcite by the high loss of mass between ~680oC and ~890oC and the
coincident endothermic peak in the DTA curve. This analysis showed no signs of aragonite
that should be seen in DTA by a peak at around 520oC 52, which confirms that it is present
in small quantities.
Figure II-4 – SEM observation of the CaCO3 powder (a) and particle size distribution determined by laser diffraction (b).
The morphology of CaCO3 particles was observed in SEM. As can be seen, in the
Figure II-4 a), they are cubic shaped, like NaCl, and their sizes are less than 0.5 µm to 3
µm. This is confirmed by the particle size distribution determined by laser diffraction in
Figure II-4 b) which average value, GCoulter is given, together with other characteristics,
such as density, specific surface area, SSA, and equivalent spherical diameter calculated
from the SSA value, GBET, is indicated in Table II-2.
-70
-60
-50
-40
-30
-20
-10
0
-50
-40
-30
-20
-10
0
10
0 200 400 600 800 1000 1200
DTA
(µV)
Wei
ght L
ost (
%)
Temperature (oC)
DTATGA
0
1
2
3
4
5
0.01 0.1 1 10 100
Volu
me
(%)
Particle Size (µm) 2µm
a) b)

Chapter II – Experimental Procedure
49
Table II-2 – Characteristics of the raw material (CaCO3).
Present Phases* Calcite, Aragonite Impurities:*1 Density*1 2.930 g/cm3 Strontium
Chlorine Sodium Total sulfur Magnesium Iron Barium
0.0058% 0.0045% 0.0025% 0.0011% 0.0007% 0.0005% 0.0004%
SSA 2.80 m2/g GBET 0.90µm
GCoulter 2.44±1.87µm * Determined by Powder X-Ray Diffraction *1 Alfa Aesar® information
II.3 Calcination
The decarbonation of CaCO3 to obtain CaO was done in a Termolab® vertical
alumina furnace with a Eurotherm® PID (proportional – integral – derivative) controller in
the University of Aveiro. A vacuum system was coupled to the furnace, which consisted in
a vacuum pump Adixen® Pascal 2010 SD with a nominal pumping speed of 8.3m3/h, a
pirani gauge Adixen® AP 2004 to measure the pressure (p) and a pressure display Adixen®
ACS 2000 connected to a computer to register the pressure during the thermal cycle with
the software AVG View provided by Adixen®. The vertical tube had steel flanges cooled by
a circuit of water to avoid the deterioration of the rubber o-rings. In the connection of the
pump to the tube there was a valve to control the pumping speed at the beginning of the
cycle. A needle valve was installed in the furnace to break the vacuum slowly, when the
calcination was finished. The sample holder made of alumina foam and mulite served as
support to a cylindrical crucible with a lid for keeping the powder inside during the initial
stage of the pumping of the furnace.
Before calcination of the powder, tests of the furnace hot zone, heating and cooling
rates, holding temperature and cycle duration were done. To accurately measure the
temperature, a type-R thermocouple (Platinum/Platinum-13%Rhodium) was placed in the
base of the sample holder and connected to a two channel Zipp & Zonen® recorder. As the
furnace doesn’t have forced cooling, at the cooling rates used (10oC/min) it enters a natural
cooling rate from 700ºC to room temperature (RT) taking about 7h.
A test to the vacuum conditions was done too to optimize the vacuum system and
detect eventual leaks. In the end of the tests, the minimum vacuum pressure achieved by
the system after 6h of pumping was in the order of 10-1 to 1 Pa at room temperature and
10Pa at 1100ºC.
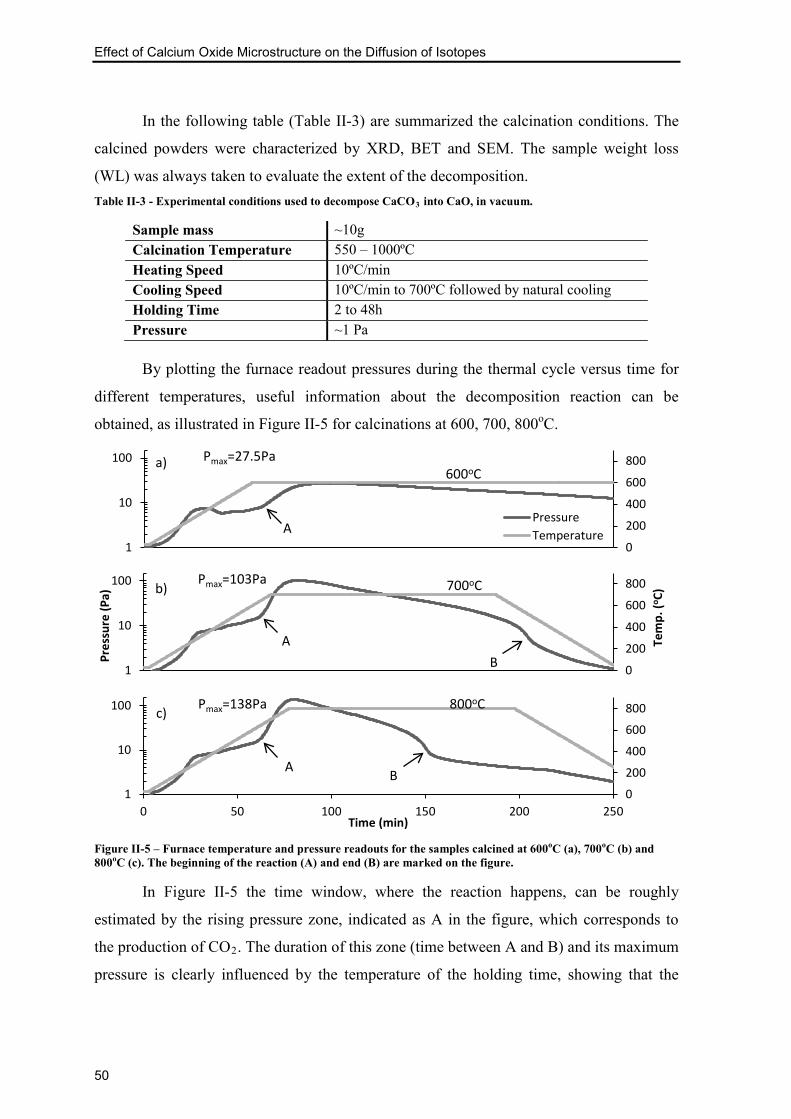
Effect of Calcium Oxide Microstructure on the Diffusion of Isotopes
50
In the following table (Table II-3) are summarized the calcination conditions. The
calcined powders were characterized by XRD, BET and SEM. The sample weight loss
(WL) was always taken to evaluate the extent of the decomposition. Table II-3 - Experimental conditions used to decompose CaCO3 into CaO, in vacuum.
Sample mass ~10g Calcination Temperature 550 – 1000ºC Heating Speed 10ºC/min Cooling Speed 10ºC/min to 700ºC followed by natural cooling Holding Time 2 to 48h Pressure ~1 Pa
By plotting the furnace readout pressures during the thermal cycle versus time for
different temperatures, useful information about the decomposition reaction can be
obtained, as illustrated in Figure II-5 for calcinations at 600, 700, 800oC.
Figure II-5 – Furnace temperature and pressure readouts for the samples calcined at 600oC (a), 700oC (b) and 800oC (c). The beginning of the reaction (A) and end (B) are marked on the figure.
In Figure II-5 the time window, where the reaction happens, can be roughly
estimated by the rising pressure zone, indicated as A in the figure, which corresponds to
the production of CO2. The duration of this zone (time between A and B) and its maximum
pressure is clearly influenced by the temperature of the holding time, showing that the
0
200
400
600
800
1
10
100
PressureTemperature
a) Pmax=27.5Pa 600oC
A
0
200
400
600
800
1
10
100
Tem
p. (o C
)
Pres
sure
(Pa)
b) Pmax=103Pa 700oC
A B
0
200
400
600
800
1
10
100
0 50 100 150 200 250Time (min)
c) Pmax=138Pa 800oC
A B
Chapter II – Experimental Procedure
51
reaction is much faster for high temperatures, since the maximum attained pressure is
higher and the duration is shorter.
II.4 Calcium Oxide Reactivity Tests
Nanometric calcium oxide powder is reported to be very reactive when exposed to
air at usual RT conditions. 61,66 To study the reactivity of the produced calcium oxide,
somea samples of the synthetized powder with different SSAs were exposed to air during 2
days and the weight gain was taken along the exposure time. The powder specific surface
area, XRD phase identification and crystallite size (before and after exposure) as well as
DTA/TGA of the reacted powders, were performed.
To evaluate the reversibility of the air reaction, the exposed powders were thermal
treated in vacuum at 800ºC for different times (5, 15 and 40 min) and the SSA and
crystallite size were determined. Also DTA/TGA was done to the “recovered” ones to
evaluate if the conversion to CaO was complete.
II.4.1 Sample Storage
Due to the observed high reactivity of the produced CaO powders to moisture and
CO2, the samples were kept under special conditions, reducing the pressure of these gases
in the surrounding atmosphere. This was achieved by using a 2l Nahita® glass desiccator
with a valve which could be connected to a pump to evacuate the system, storing the
samples under vacuum.
The need to open the desiccator during the studies exposed the samples to air and
so, a desiccant, silica gel, was used to reduce the hydration. Afterwards, the nanometric
CaO powder itself (produced in house by decomposition of CaCO3 in vacuum at 700ºC),
was used as a desiccant. 61 This powder proved to be much more effective, greatly
reducing the weight gain of the samples, as can be seen in Table II-4. Table II-4 - Weight gain of one CaO sample with different desiccants.
Desiccant Weight gain (%)
Silica Gel CaO 1st day 0.24 0.01 2nd day 0.55 0.02

Effect of Calcium Oxide Microstructure on the Diffusion of Isotopes
52
II.5 Microstructural Evolution During Vacuum Sintering
The obtained CaO powder was compacted and thermal treated in a furnace at the
University of Aveiro, under a temperature range and vacuum pressure equivalent to those
used during CaO target operation at ISOLDE, CERN.
In order to study the microstructural evolution during sintering, cylindrical
compacts, 10 mm diameter, 2-3 mm in thickness were pressed by using a hydraulic
Carver® Laboratory Press – Model C. A small study of the press conditions was done just
in order to evaluate the pressure required to give the compact some mechanical integrity
for normal handling and having at the same time a high porosity. It was concluded that the
best settings were pressing ~0.25 g of powder at 125 MPa for 5 s, resulting in a compact
with high porosity, P~60%.
Since the target units are operated at pressures of ~10-4 Pa, a furnace which could
achieve approximate vacuum conditions was used. A Thermolab® FTV 213/2007 furnace
was used, which could reach pressures of 10-4 Pa at RT and from 10-3 to 10-2 Pa 1200ºC.
This furnace is composed of a small chamber, with a tungsten heating element, which was
pumped by a rotary and an oil diffusion pump. Both chamber and diffusion pump were
cooled by a water circuit.
The handling of powder and compacts revealed to be a very challenging process,
since hydration and carbonation occurs very fast, affecting the powder characteristics and
causing break of compacts. Therefore, immediately after pressing, the compacts were
maintained under vacuum. Nevertheless, some samples were found broken after the
thermal cycle.
A summary of the sintering conditions can be found in the Table II-5. After
sintering, the specific surface area (SSA) the shrinkage (whenever possible) and crystallite
size were determined. Table II-5 - Experimental conditions in CaO sintering experiments.
Sample CaO compacts (P≈60%) Sintering Temperatures 900 – 1200ºC Heating Speed 10ºC/min Cooling Speed 15ºC/min Dwell Time 3min – 10h Pressure 10-4 - 10-2 Pa

Chapter II – Experimental Procedure
53
The obtained SSA reductions and shrinkage were then plotted vs. holding time and
fitted accordingly to the model presented in equation (I.27), using the program Origin
v8.5.1. Identically, the same data treatment procedure was done to the shrinkage.
II.6 Material Testing at ISOLDE-CERN
After the synthesis of CaO from calcium carbonate, the respective powder
characterization and sintering kinetic studies at the University of Aveiro, this investigation
proceeded at ISOLDE. Before online operation, studies were performed on the CaO
synthesis at ISOLDE to evaluate the powder microstructure. This was done using the
established conditions for CaO target production, named “old procedure”, and to compare
the microstructure of the calcinated powder obtained at ISOLDE using an equivalent
thermal cycle as used in Aveiro, calling it “new procedure”.
In consequence of the investigation done, new conditions for the target preparation
and handling could be implemented.
II.6.1 CaO Target Production at ISOLDE: “Old Procedure”
In order to produce and characterize the CaO used in the past at ISOLDE, the “old
procedure” was done. The raw material (CaCO3) was first dried by heating it in a porcelain
crucible at 200ºC for a day. A rhenium (Re) boat with approximately the dimensions of the
target (195 mm long and 20 mm diameter) was filled with the powder and put in a
dedicated oven (see Figure II-6), similar to a target unit, in high vacuum (10-3<p<10-2 Pa)
using a turbo and a rotary pumps. The temperature was then increased (measured with an
optical pyrometer), until pressure reached 10-2 Pa, up to 1200oC. The process took about
24h and was over when the pressure reached a value lower than 10-3 Pa, indicating that the
decarbonation reaction is finished. To make sure that the decarbonation was complete the
oven was kept at the final temperature for some hours, after reaching 10-3 Pa. Afterwards,
the oven was cooled down and purged with Ar and the Re boat was refilled - due to the
high loss of mass (~44%) - with CaCO3, maintaining the CaO produced so far. The whole
process was then repeated one more time.
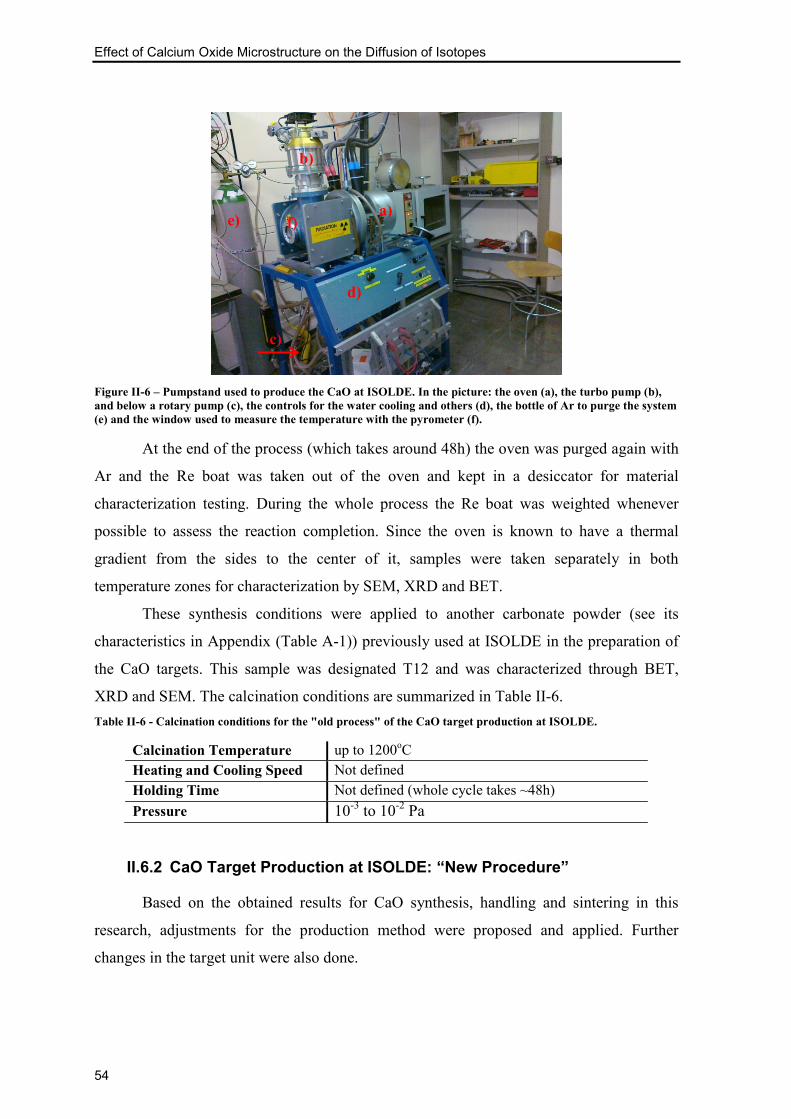
Effect of Calcium Oxide Microstructure on the Diffusion of Isotopes
54
Figure II-6 – Pumpstand used to produce the CaO at ISOLDE. In the picture: the oven (a), the turbo pump (b), and below a rotary pump (c), the controls for the water cooling and others (d), the bottle of Ar to purge the system (e) and the window used to measure the temperature with the pyrometer (f).
At the end of the process (which takes around 48h) the oven was purged again with
Ar and the Re boat was taken out of the oven and kept in a desiccator for material
characterization testing. During the whole process the Re boat was weighted whenever
possible to assess the reaction completion. Since the oven is known to have a thermal
gradient from the sides to the center of it, samples were taken separately in both
temperature zones for characterization by SEM, XRD and BET.
These synthesis conditions were applied to another carbonate powder (see its
characteristics in Appendix (Table A-1)) previously used at ISOLDE in the preparation of
the CaO targets. This sample was designated T12 and was characterized through BET,
XRD and SEM. The calcination conditions are summarized in Table II-6. Table II-6 - Calcination conditions for the "old process" of the CaO target production at ISOLDE.
Calcination Temperature up to 1200oC Heating and Cooling Speed Not defined Holding Time Not defined (whole cycle takes ~48h) Pressure 10-3 to 10-2 Pa
II.6.2 CaO Target Production at ISOLDE: “New Procedure”
Based on the obtained results for CaO synthesis, handling and sintering in this
research, adjustments for the production method were proposed and applied. Further
changes in the target unit were also done.
a)
b)
c)
d)
e) f)

Chapter II – Experimental Procedure
55
To produce the new target, the raw material used at the UA studies was used. The
process was very similar to the old one, but the following changes were made: (i) the
heating and cooling rates were fixed at 10oC/min; (ii) the temperature was risen in one step
to 800oC (overriding the pressure interlock at 10-2 Pa) and the pressures rose up to a
maximum of 160 Pa, similarly to the synthesis studies at the University of Aveiro (see
Figure II-5); (iii) instead of a pyrometer to measure the temperature, a thermocouple type
K was installed for a more accurate control; (iv) the material was kept at 800oC, for 48h, in
order to insure a complete reaction and to outgas the impurities; (v) no refill was done to
avoid unnecessary material hydration (vi) and the transfer of the material to the target unit
was done in a gloves box in a controlled Argon atmosphere (as seen in Figure II-7).
Afterwards, as usual for every target at ISOLDE, the target and the ion source temperatures
were calibrated against input voltage and current, and the target was mounted on the
offline separator for further tests and outgasing of impurities. The newly produced CaO
was likewise characterized by BET and XRD. Two powder samples, named S80, were
taken, one from the center and another from the side of the target. The calcination
conditions can be seen in Table II-7. Table II-7 - Calcination conditions for the "new process" of the CaO target production at ISOLDE.
Calcination Temperature 800oC Heating and Cooling Speed 10oC/min Holding Time ~48h Pressure 10-3 to 160 Pa
The new target unit has also undergone some evolution: two type C thermocouples
were installed in order to measure the current temperature at the center of the container and
at the sides, during online operation. A different heat shielding was installed in order to
reduce the temperature gradient along the container. A different ion source with improved
ionization efficiency of argon was used.
To assess the reproducibility of the process at ISOLDE and characterize the new
target material, a calcium oxide sample was produced in the same target oven with the
same thermal cycle used at the UA (2h of holding time at 800oC, with 10oC/min of heating
and cooling rates). The resulting sample was named T80 and characterized in terms of
surface area and porosity.

Effect of Calcium Oxide Microstructure on the Diffusion of Isotopes
56
Figure II-7 – Gloves box used to do the material change to the target unit. In the picture: the pre-chamber (a), the gloves box main chamber (b), a bottle of Ar to fill both pre-chamber and main chamber (c) and a rotary pump (d).
II.7 Beam Tests at ISOLDE-CERN
II.7.1 Offline Measurements
The target unit was tested at the offline mass separator to evaluate if there were no
leaks and if the electrical, gas and water connections were working, as is usual procedure
at ISOLDE. The target unit was then heated up to operation temperatures (up to 800oC),
which in the case of the old CaO targets was around 1100oC to 1200oC. Stable beams were
assessed for different masses to evaluate the level of impurities produced by the target
material and ion source. The ion source efficiency was then tested by injecting known
quantities of noble gases through a calibrated leak, and monitoring the mass separated in
the beam. The target was left for 3 days at the operation temperatures to outgas impurities.
Before the transport to the ISOLDE frontend, the target unit was filled with argon and
sealed.
II.7.2 Online Operation
The new target was mounted in the front end of ISOLDE, pumped and operated at
temperatures up to 800oC with low proton intensities, 8x10¹² protons per pulse (usually its
3x10¹³). The new target was labeled with the reference CaO#469.
Since there was a thermal gradient on the container of the target CaO#469, a
weighted average, to determine a representative (rounded) temperature given by the
thermocouples (T), was taken into account according to the following formula:
a)
b)
c)
d)

Chapter II – Experimental Procedure
57
𝑇 =2𝑇𝑆 + 𝑇𝐶
3 (II.5)
where TS is the temperature at the sides of the container, TC is temperature at center of the
container, as schematically represented in Figure II-8. The calculated temperatures varies
from 520oC (see Table II-8), with temperature differences from the center to side of 190oC
to 840oC where this difference was only 40oC.
Figure II-8 - Schematic representation of a target container indicating the sides (a) and the center (d) of it, where the transfer line is also represented (c).
Release curves were done using the tape station (described in the following section)
and gamma spectroscopy (also described ahead) in order to assess radioactive isobaric
impurities in the beam. For the tests on the very short lived isotopes such as 31,32Ar the tape
station is not able to measure. For this a special experimental setup (IS476 2) was used. In
order to compare and scale the values 33Ar was measured in both systems. The tests done
are summarized on the Table II-8. Table II-8 - Summary of the online measurements and tests done on target CaO#469.
Isotope (half-life)
Temperature (oC) Objective Method
Target Ion Source
35Ar (1.78s)
650 1980 Study the yield drop by several measurements over the run. Release curve measured
Tape Station
840 2070 Assess the maximum yield Tape Station 730
1980 Study effusion and diffusion processes and the respective temperature influence
Tape Station 650 520
31Ar (15.1ms) 650 1980 Assess the yield IS476 2 (Tape Station)
32Ar (98ms) 650 1980 Assess the yield 33Ar (174.1ms) 650 1980 Assess the yield
19Ne (17.22s) 730
1980 Study effusion and diffusion processes and the respective temperature influence
Tape Station 650 520
10C (19.3s) 730 1980 Assess the yield Tape Station 15C (2.45s) 730 1980 Assess the yield Tape Station
6He (806.7ms) 650 1980 Assess the yield Tape Station
In order to compare the new target with older ones, information about the operation
performance of other targets was taken. This information regards mainly, the obtained
yields (and how they dropped) and the operation parameters. The target labeled as
a) a) b) Proton Beam c)

Effect of Calcium Oxide Microstructure on the Diffusion of Isotopes
58
CaO#123 was operated in November 1999 and was the best calcium oxide target to be
operated at ISOLDE, since its yields on several isotopes were the highest registered 45. This
target was operated at 1050oC. Two recent targets were also compared: the targets
CaO#408 operated in August 2009 and CaO#419 in November of the same year. The latter
is representative of a standard CaO target. All of the old targets were run at 3x10¹³ protons
per pulse.

Effect of Calcium Oxide Microstructure on the Diffusion of Isotopes
59
Chapter III - Results and Discussion


Chapter III – Results and Discussion
61
III.1 Material Characterization Study
As referred before, in order to improve the intensities of beams at ISOLDE, the
target material has to be improved mainly in terms of the diffusion properties. To attain
this goal, the microstructure of the target material had to be investigated aiming at
controlling it. This section presents the results of the CaO synthesis from the respective
carbonate, powder characterization, and powder microstructure evolution during thermal
treatments.
III.1.1 Synthesis of CaO
In order to study the influence of the thermal cycle in the decomposition reaction of
CaCO3, different conditions were tested. The summary of the decomposition conditions
and characteristics of the obtained CaO powder can be seen on Table III-1. A holding time
of 2h was used for the majority of experiments, which was increased for lower
temperatures in order to achieve total decomposition. A long duration cycle of 48h, at
1000oC, was also tested in D10 sample. The main parameters to characterize the obtained
powder were the crystallite size, by XRD using the most intense peak (200), and the
specific surface area. From the surface area, applying equation (II.3), the particle size
could be estimated. Table III-1 – Summary of the decomposition conditions and characteristics of the obtained powders.
Sample T
(oC) t
(h) WL (%)
p (Pa)
SSA (m2/g)
GBET
(nm) XS
(nm)
Main XRD Phases
Detected
Average Pore Size
(nm)
P (%)
D55 550 16 36 ~1 19 - 35 CaO, CaCO3 - - D60 600 12 44 ~1 53 34 37 CaO - - D65 650 3 44 ~1 38 - 38 CaO, Ca(OH)2 - - D70 700 2 45 ~1 49 37 35 CaO - - D80 800 2 46 ~1 46 39 38 CaO - - D90 900 2 46 ~1 42 42 36 CaO - - D10 1000 48 45 ~1 35 51 50 CaO 11 32 N80 800 2 - ~10-1 58±4 31±3 32±2 CaO 12 44
For a total CaCO3 decomposition, 44% of weight loss (WL) is expected taking the
stoichiometry expressed by equation (I.22), but in some cases, higher values of WL were
observed due to losses of powder from the crucible during the furnace operation. The
sample D55, calcined at 550oC, had a lower value of WL (36%) suggesting incomplete

Effect of Calcium Oxide Microstructure on the Diffusion of Isotopes
62
decomposition (confirmed by XRD) which matches the low value of SSA, due to the
presence of low SSA CaCO3 (2.80 m2/g). In the case of D65, the decomposition was
complete but significant hydration had occurred, as confirmed by the detection of Ca(OH)2
by XRD, leading to a lower SSA value. The effects of powder hydration on the SSA will
be further detailed ahead. In all other samples no CaCO3 phase or traces could be detected
on the XRD, confirming the full decomposition, but often traces of the Ca(OH)2 could be
detected. These results are similar to those obtained by D. Glasson at the same
temperature, as can be seen in Table I-3, page 32.
After the optimization of the furnace operation, to operate under lower vacuum
(p~10-1Pa), the samples produced at 800oC (N80) yielded an average SSA value of 58±4
m2/g with XS being 32±2 nm in agreement with GBET (31±3 nm).
In order to better visualize the effect of the decomposition temperature on the
surface area and crystallite size, for similar vacuum conditions, the plot of the Figure III-1
was done.
Figure III-1 - Plot of the specific surface area (SSA) and the crystallite size (XS) versus temperature for the calcined powder, obtained under similar vacuum conditions, and 2h of holding time.
In Figure III-1 a linear decrease of the SSA with the increase of the decomposition
temperature can be seen. The behavior is in agreement with the results of E. Powell 61. D.
Glasson’s 56 results showed increasing surface area until 800oC and then fast decreasing of
SSA, claimed to be due to sintering of CaO, he stated. This behavior doesn’t match the
obtained results in this work. No tendency was found for the variation of the determined
crystallite size. The XS values present a fairly good agreement with the obtained GBET,
value and confirm that a nanometric material is obtained by decomposing CaCO3 under
vacuum, in this range of temperatures, as confirmed by other authors 50,51,54,55,57.
30
34
38
42
46
50
30
35
40
45
50
55
500 600 700 800 900 1000
XS (n
m)
SSA
(m2 /
g)
Temperature (oC)
SSA
XS

Chapter III – Results and Discussion
63
Despite the fact that the obtained powders were nanometric, the obtained surface
areas are somehow lower than those obtained in the literature (see Table I-3, in page 32).
This differences may come from the better vacuum conditions reported in the literature
(10-2<p<10-5 Pa), lower temperatures used for decomposition and better storage/transport
conditions up to the material analysis equipment. Furthermore, J. Ewing 63 and D. Beruto 58
reported that in powder beds, residual pressures of CO2 decreases the surface areas
obtained, by enhancing sintering. Maximum pressures over 100 Pa were measured during
the decompositions, as can be seen in Figure II-5 in page 50, which according to J. Ewing 63, can lower the SSA. This reduction of surface area is due to the catalytic effect of CO2
on the sintering of the samples. 63 The improvement of the vacuum conditions in this work
(with the change of the powder support from porous to denser parts and other adjustment
in valves and o-rings), led to the attaining of SSA and XS closer to those in the literature
values, as can be exemplified by sample N80 when compared with D80 (higher pressure,
see Table III-1).
Figure III-2 – SEM Microstructure of the CaCO3 powder (a), the N80 sample (b), a high resolution SEM at the N80 sample (c) and STEM done to N80 sample (d).
The sample D10 (as shown in Table III-1) was synthesized at 1000oC for a longer
time (48h), to approximate the calcination conditions previously used at ISOLDE. 9 As
a) b)
2µm 2µm
120nm 250nm
c)
N80 - SEM CaCO3
N80 - SEM N80 - STEM

Effect of Calcium Oxide Microstructure on the Diffusion of Isotopes
64
expected, lower values of SSA and higher values of XS were obtained, but the material
was still able to keep its nanometric size.
SEM and STEM was used to analyse the microstructure of the N80 powder, as
presented in Figure III-2. Observing the microstructures of the raw material in the Figure
III-2 a) and the N80 sample in Figure III-2 b), the decomposition reaction can be classified
as pseudomorphous due to the small changes in the particle size and shape. This was also
observed by D. Beruto 54 and others 55,49,63. The CaO powder presents a higher degree of
agglomeration and rounded edges that may come either from hydration during handling
or/and transport to the microscope 68.
The CaO nanograins were hard to see in SEM. The apparent orange-peel roughness
observed at the surface of the particles in the SEM microstructure of Figure III-2 c), and in
the STEM observation of a thin agglomerate in Figure III-2 d), was reported to correspond
to the image of nanosized CaO grains 55. The SEM and STEM observations permit to
conclude that the CaO powder is constituted by agglomerates of identical shape and size as
the initial CaCO3 particles and that these agglomerates are constituted by nanograins
smaller than 70 nm. The particles seem to be more like plate shaped, agreeing with what
was observed for CaO powder obtained by CaCO3 in other studies 50,64.The porosity inside
the agglomerates couldn’t be resolved by SEM.
Figure III-3 – TEM observations of CaO sample, N80.
By taking a look in the TEM micrographs presented in Figure III-3, the cubic
shaped CaO agglomerates can be observed in the left and on the right a high magnification
image shows that they are constituted by very fine grains, confirming the previous
observation in SEM/STEM. One of the limitations in the TEM analysis came from the
a) b)
500nm 50nm

Chapter III – Results and Discussion
65
significant hydration of the sample due to the drying of the alcohol suspension drop before
the microscope observation.
Taking the adsorption of N2 gas at 77K on the powder samples N80 (800oC) and
D10 (1000oC, 48h), the whole isotherm was determined for each powder in Figure III-4.
Figure III-4 - Isotherms obtained by adsorption of N2 for the samples D80 and D10.
Both isotherms are of type IV and present hysteresis 81. These types of isotherms
are associated with materials that have mesoporosity. 81 The software of the BET
equipment was used to calculate of the pore size distribution using the Barret-Joyner-
Halenda (BJH), giving also the pore volume. In Figure III-5, the determined pore size
distribution for the N80 and D10 samples is represented.
Figure III-5 - Pore size distribution of the samples N80 and D10.
From Figure III-5 it can be seen that both pore size distributions are unimodal and
that the porosity of the sample D10 is lower and slightly shifted to lower pore sizes,
comparing to the N80 sample. In Table III-1, the values of porosity and average pore size
calculated from the curves of Figure III-5 are presented. The lower average pore size and
0
1
2
3
4
5
6
7
8
0 0.2 0.4 0.6 0.8 1
Qua
ntity
Ads
orbe
d (m
mol
/g)
p/p0
N80
D10
0.0E+0
5.0E-4
1.0E-3
1.5E-3
2.0E-3
10 100 1000
dV(d
) (cm
3 /Å/
g)
Pore Width (Å)
N80
D10

Effect of Calcium Oxide Microstructure on the Diffusion of Isotopes
66
lower porosity at the sample D10 calcined at 1100oC, 48h, when compared with the N80
sample calcined at 800oC, 2h, are in accord with the reduced SSA value in that sample and
show that at 1000oC sintering effects are already relevant.
The values obtained for the porosity of N80 sample were consistent with the ones
published in the literature 54 (41.5% of porosity and 10 nm of pore average size in CaO
obtained from CaCO3 vacuum calcination). Assuming that the reaction is pseudomorphous
and taking the molar volumes of CaO and CaCO3 one could expect a porosity of ~55%.
This is probably related to some sintering either of CaCO3 before the decomposition 56 or
of the CaO during the calcination, possibly catalyzed by the presence of the CO2 resultant
from the decomposition 55.
III.1.2 Reactivity in Air
As stated in section I.4.3, the calcium oxide reacts, spontaneously, with H2O and
CO2 in air. The high surface area of the CaO powders in this study will enhance the
reactivity, as reported by D. Beruto 66 and E. Powel 61, affecting powder characteristics.
Therefore, the kinetics of the reaction between the nanometric CaO powder and air and the
effect on the powder characteristics needs to be investigated, prior to the powder
processing.
In order to know the extent of the hydration/carbonation reactions, DTA/TGA tests
under Ar flow, were done in N80 sample, as shown in the Figure III-6 a) after normal
handling* and b) intentionally left at air for 2 days.
As can be seen in the TGA curve presented in Figure III-6 a), the sample, after
normal handling, keeps reacting until 330oC (rise in weight of 1.2%). This is probably due
to residual water/carbon dioxide coming from its surface (adsorbed), from the gas bottle
(residuals) or even air leaks in the system. Around 400oC the decomposition of Ca(OH)2 is
happening (DTA endothermic peak and TGA loss of mass). The %H2O is about 4.5 wt.%
which corresponds (equation (I.24)) to a conversion of ~18 wt.% of CaO in Ca(OH)2
during air exposure. Similarly, from the slight weight loss (~2%) around 600oC, which is
most likely due to loss of CO2 (%CO2) due to the CaCO3 decomposition, one can estimate
~4 wt.% (from the reaction (I.25)) of carbonate in CaO. In the XRD of the powder after
* A “normal handled” CaO powder corresponds to an exposure at air variable between 5 and 10min,
due to the purge and opening of the calcination furnace, weighting and transport to the desiccator.
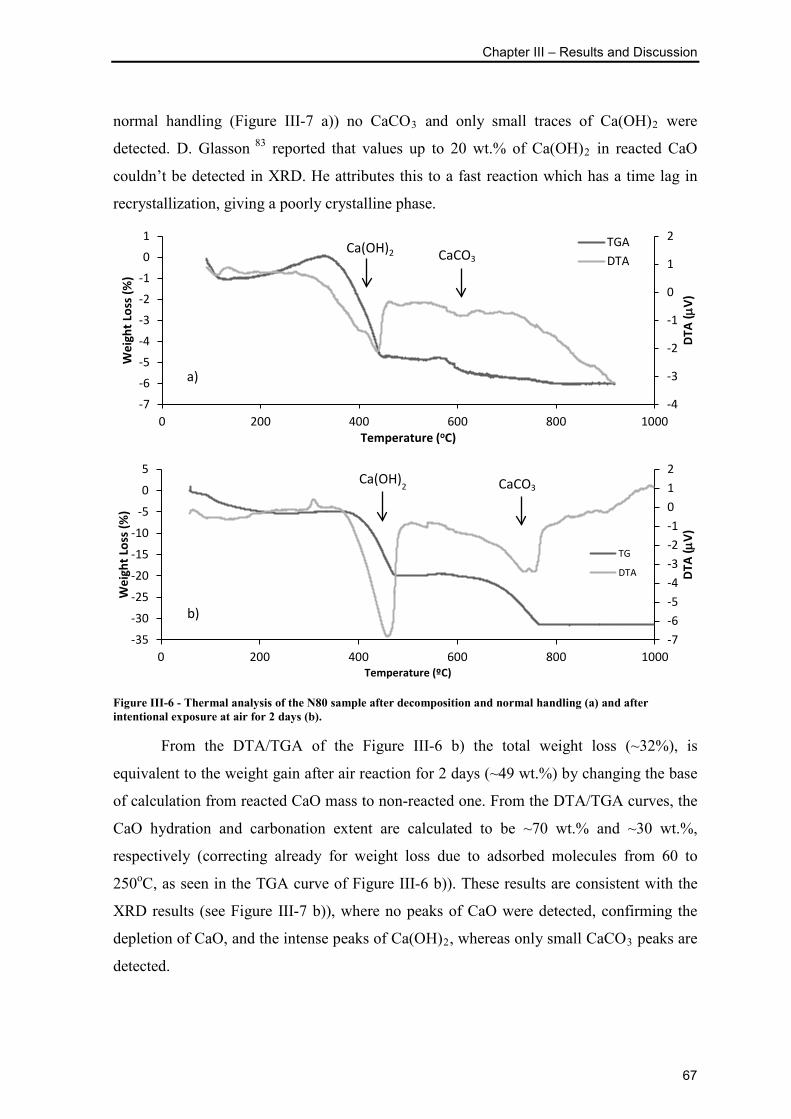
Chapter III – Results and Discussion
67
normal handling (Figure III-7 a)) no CaCO3 and only small traces of Ca(OH)2 were
detected. D. Glasson 83 reported that values up to 20 wt.% of Ca(OH)2 in reacted CaO
couldn’t be detected in XRD. He attributes this to a fast reaction which has a time lag in
recrystallization, giving a poorly crystalline phase.
Figure III-6 - Thermal analysis of the N80 sample after decomposition and normal handling (a) and after intentional exposure at air for 2 days (b).
From the DTA/TGA of the Figure III-6 b) the total weight loss (~32%), is
equivalent to the weight gain after air reaction for 2 days (~49 wt.%) by changing the base
of calculation from reacted CaO mass to non-reacted one. From the DTA/TGA curves, the
CaO hydration and carbonation extent are calculated to be ~70 wt.% and ~30 wt.%,
respectively (correcting already for weight loss due to adsorbed molecules from 60 to
250oC, as seen in the TGA curve of Figure III-6 b)). These results are consistent with the
XRD results (see Figure III-7 b)), where no peaks of CaO were detected, confirming the
depletion of CaO, and the intense peaks of Ca(OH)2, whereas only small CaCO3 peaks are
detected.
-4
-3
-2
-1
0
1
2
-7
-6
-5
-4
-3
-2
-1
0
1
0 200 400 600 800 1000
DTA
(µV)
Wei
ght L
oss (
%)
Temperature (oC)
TGADTA
Ca(OH)2
-7-6-5-4-3-2-1012
-35
-30
-25
-20
-15
-10
-5
0
5
0 200 400 600 800 1000
DTA
(µV)
Wei
ght L
oss (
%)
Temperature (ºC)
TG
DTA
a)
b)
CaCO3
Ca(OH)2 CaCO3
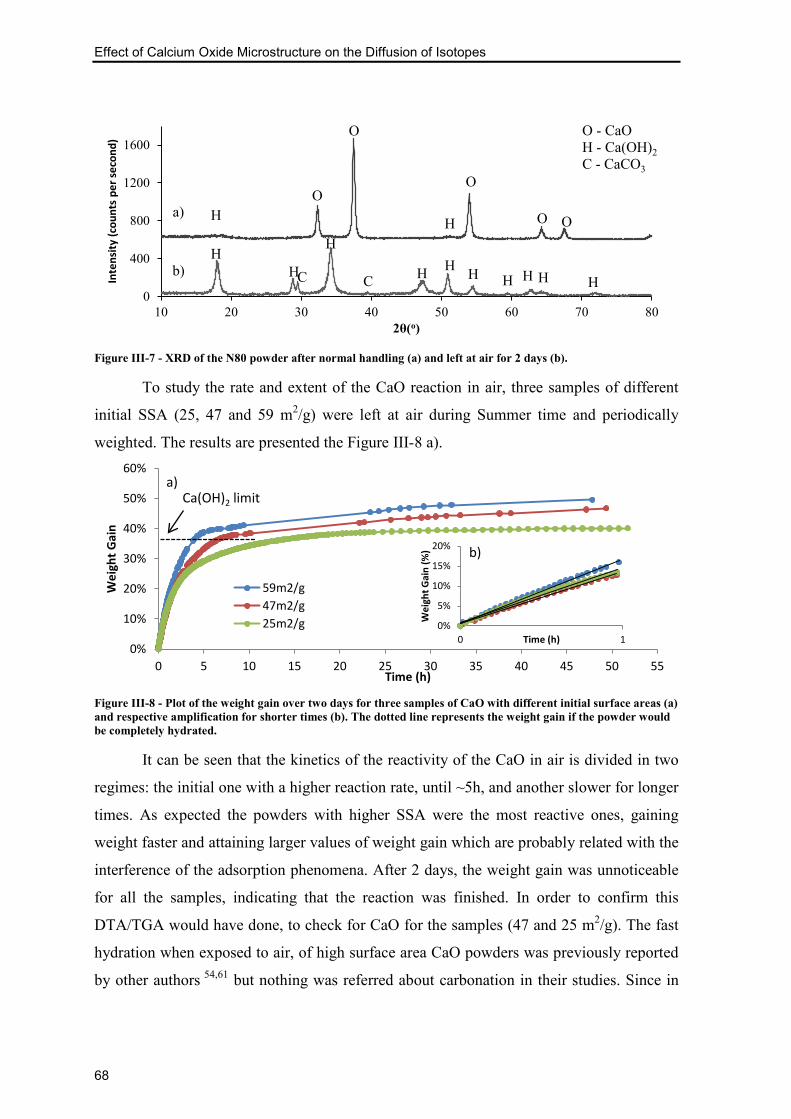
Effect of Calcium Oxide Microstructure on the Diffusion of Isotopes
68
Figure III-7 - XRD of the N80 powder after normal handling (a) and left at air for 2 days (b).
To study the rate and extent of the CaO reaction in air, three samples of different
initial SSA (25, 47 and 59 m2/g) were left at air during Summer time and periodically
weighted. The results are presented the Figure III-8 a).
Figure III-8 - Plot of the weight gain over two days for three samples of CaO with different initial surface areas (a) and respective amplification for shorter times (b). The dotted line represents the weight gain if the powder would be completely hydrated.
It can be seen that the kinetics of the reactivity of the CaO in air is divided in two
regimes: the initial one with a higher reaction rate, until ~5h, and another slower for longer
times. As expected the powders with higher SSA were the most reactive ones, gaining
weight faster and attaining larger values of weight gain which are probably related with the
interference of the adsorption phenomena. After 2 days, the weight gain was unnoticeable
for all the samples, indicating that the reaction was finished. In order to confirm this
DTA/TGA would have done, to check for CaO for the samples (47 and 25 m2/g). The fast
hydration when exposed to air, of high surface area CaO powders was previously reported
by other authors 54,61 but nothing was referred about carbonation in their studies. Since in
0
400
800
1200
1600
10 20 30 40 50 60 70 80
Inte
nsity
(cou
nts
per s
econ
d)
2θ(o)
a)
b)
H
H H
H H H H H H H H
H
C C
O
O
O
O O
O - CaO H - Ca(OH)2 C - CaCO3
0%
10%
20%
30%
40%
50%
60%
0 5 10 15 20 25 30 35 40 45 50 55
Wei
ght G
ain
Time (h)
59m2/g47m2/g25m2/g
Ca(OH)2 limit a)
b)
0%
5%
10%
15%
20%
0 1
Wei
ght G
ain
(%)
Time (h)

Chapter III – Results and Discussion
69
the reacted samples, only a small quantity of CaCO3 was detected (see Table III-2 below)
comparing to the Ca(OH)2, the faster regime is assumed to be mainly controlled by the
hydration reaction, defined by the equation (I.24).
For shorter times the reaction is nearly linear with time (see Figure III-8 b)). The
rate of weight gain is, in average, ~0.3 wt.% min-1. If one, considers this weight gain for
shorter times to be essentially due to hydration, the average “hydration rate” can be
roughly defined as 1 wt.% min-1 of conversion of CaO into Ca(OH)2.
From the above results and using some speculation, the reaction of CaO with air
can be described by the following steps: (i) as soon as CaO is in contact with air, it reacts
both with H2O (equation (I.24)) and CO2 (equation (I.25)) to form spontaneously at the
same time respectively, Ca(OH)2 and CaCO3. It also starts to adsorb, gaining additional
weight. As shown before, the hydration reaction dominates the faster regime; (ii) as soon
as Ca(OH)2 is formed, another spontaneous (accordingly to thermodynamics) reaction can
start to form CaCO3 from the hydrate (equation (I.26)); (iii) when most of the CaO is
consumed by the hydration reaction, the slower regime starts: the reaction of carbonation is
known to form a low porous product slowing down and preventing further reaction 71. As
the reaction progresses more and more, and CaCO3 is being formed, it creates an
impermeable layer, slowing down the process and eventually stopping the transformation
of Ca(OH)2 into CaCO3.
Since it was observed that during the hydration of CaO there is also carbonation the
chosen temperature to test reversibility and to accomplish complete conversion back to
CaO needs to be high enough to decompose the formed CaCO3. The selected temperature
was 800oC and different times at this temperature were tested. Results for powder
characteristics before and after the hydration and reversibility thermal tests can be seen in
the Table III-2. Table III-2 – Powder characteristics before and after air exposure and reversibility thermal tests.
Conditions BET
XS (nm) Main Phase
Ca(OH)2 detected CaCO3 detected SSA
(m2/g) GBET (nm) DTA/TGA XRD DTA/TGA XRD
Initial Powder 59 31 33 CaO ~18% Yes ~2% No
Left at Air (2d) 9 - - Ca(OH)2 ~70% Yes ~30% Yes
800ºC, 5mn 34 52 29 CaO ~12% Traces <2% No
800ºC, 15mn 28 64 32 CaO ~16% Traces <4.5% No
800ºC, 40mn 22 82 33 CaO ~12% Traces <2% No

Effect of Calcium Oxide Microstructure on the Diffusion of Isotopes
70
From the presented results it can be seen that the initial material is not totally
recovered in terms of surface area, although the crystallite size is almost the same as that of
the initial powder. The SSA decreases significantly during the powder exposure and
increases after the thermal treatment, although, the attained values are less than half of the
initial SSA. The time increase at 800oC brings a fast reduction of the SSA values. Not
enough studies were made in this work to assess the sintering kinetics of the CaO obtained
from Ca(OH)2 but the literature reports higher sintering rates than the one produced from
CaCO3 74.
To evaluate the difference in the microstructure of the material, SEM analysis was
done before the powder was left at air and after the thermal treatment. The differences seen
in the micrographs were not conclusive enough, but in the literature the hydration reaction
is reported to be followed by a volume expansion 70, which would change the morphology
of the microstructure.
III.1.3 Sintering Kinetics of CaO
In order to study the thermal behavior of the CaO powders, pressed compacts with
a relative density, ρ0=0.4, were used. Several thermal treatments (TT) were done in a high
vacuum furnace using atmosphere and temperature conditions close to those used during
target operation. The samples were handled* in order to minimize contact with air, to
enhance the reproducibility of the results. Even though all the precautions were taken an
error of ~20% is expected from the obtained results, due to some air exposure.
Figure III-9 - Plot of the specific surface area versus the temperature for 3 min and 10h of thermal treatment. The isolated point corresponds to the initial powder.
* During pressing the powder was exposed approximately 5min to air.
25
30
35
40
45
50
55
60
65
800 900 1000 1100 1200
Spec
ific
Surf
ace
Area
(m2 /
g)
Temperature (oC)
Initial Powder
10h
3min
0

Chapter III – Results and Discussion
71
In the plot of the Figure III-9, the results of surface area reduction after sintering
the powder compacts for the shortest - 3min - and longest times - 10h - can be seen. From
this plot it can be observed that for T>1000oC there are net sintering effects which brings a
significant surface area reduction from the initial powder (more than one half, in the case
of 10h at 1200oC).
It was possible to apply the German and Munir model 73 to the values of SSA at
1200oC by fitting equation (I.27), through iterations, finding S0 and γ as represented in
Figure III-10.
Figure III-10 - Plot of the surface areas versus temperature for several temperature and respective fits.
The obtained value for the kinetic exponent, γ, was 2.1. By checking Table I-4 it
can be seen that for Nc=4, ρ0=0.32, close to the fractional density, ρ0=0.4, of the green
compacts, the determined γ value lies between 1.6 for the mechanism of evaporation-
condensation and 2.7 corresponding to volume diffusion.
Since at 1200oC the SSA values were the ones that were obtained with less
scattering, the exponent γ=2.1, determined at that temperature, was assumed for the
variation of SSA at lower temperatures. The calculated curves could reasonably fit the
points, as seen in Figure III-10 (values of R2 from the fit are presented). This means that
the same mechanism may control the matter transport for sintering. From the same plot, it
can be seen that the higher degree of sintering happens at 1200oC, and at 1000oC and
1100oC the sintering rate is much lower, as expected from a thermal activated mechanism
as diffusion is.
To help the identification of the controlling mechanism of matter transport, the
linear shrinkage (∆l/l0) at 1200oC was determined for the pressed samples. The diameter
values are plotted versus time at 1200oC, Figure III-11, accordingly to equation (I.29).
25
30
35
40
45
50
0 100 200 300 400 500 600 700
SSA
(m2 /g
)
time (min)
1200ºC1100ºC1000ºC
S0,1000ºC =49,0m2/g S0,1100ºC =47,7m2/g S0,1200ºC =46,1m2/g
R2=0.953
R2=0.800
R2=0.794 γ1200ºC =2.1

Effect of Calcium Oxide Microstructure on the Diffusion of Isotopes
72
Figure III-11 - Plot of the diameter variation with time at 1200oC.
Since this model also applies for isothermal conditions, l0 was also taken from the
fit. Figure III-11 shows that the reduction of SSA is accompanied by shrinkage of the
compact (a maximum value of ∆l/l0=2.7% was obtained at 600 min). This observation
leads to the conclusion that the sintering mechanism can be identified with volume
diffusion, since evaporation-condensation doesn’t bring densification of the compact.
Furthermore, the determined value for the kinetic exponent is s=1.96, and by comparing
this result to the theoretical ones in the Table I-4, one can further confirm that the sintering
mechanism is identified with volume diffusion (s=2). This conclusion is consistent with the
studies of R. Borgwardt 74 in which for sintering in N2 atmosphere the value of γ obtained
was 2.7, identifying volume diffusion as the main sintering mechanism.
Figure III-12 – Arrhenius plot accordingly to the equation (I.28), from the German and Munir model 73.
The values of the parameter k, equation (I.27), were obtained from the fits of the
SSA curves in, Figure III-10, for 1000, 1100 and 1200oC. From the Arrhenius plot of kT
values, according to equation (I.28), in Figure III-12, one can estimate the apparent
9.5
9.6
9.7
9.8
9.9
0 100 200 300 400 500 600 700
Diam
eter
(mm
)
t (min)
l0 = 9.82mm s = 1.96
R2=0.930
R² = 0.8906
-4
-3
-2
-1
0
0.00065 0.0007 0.00075 0.0008
ln(k
T)
1/T
Q = 155 kJ mol-1
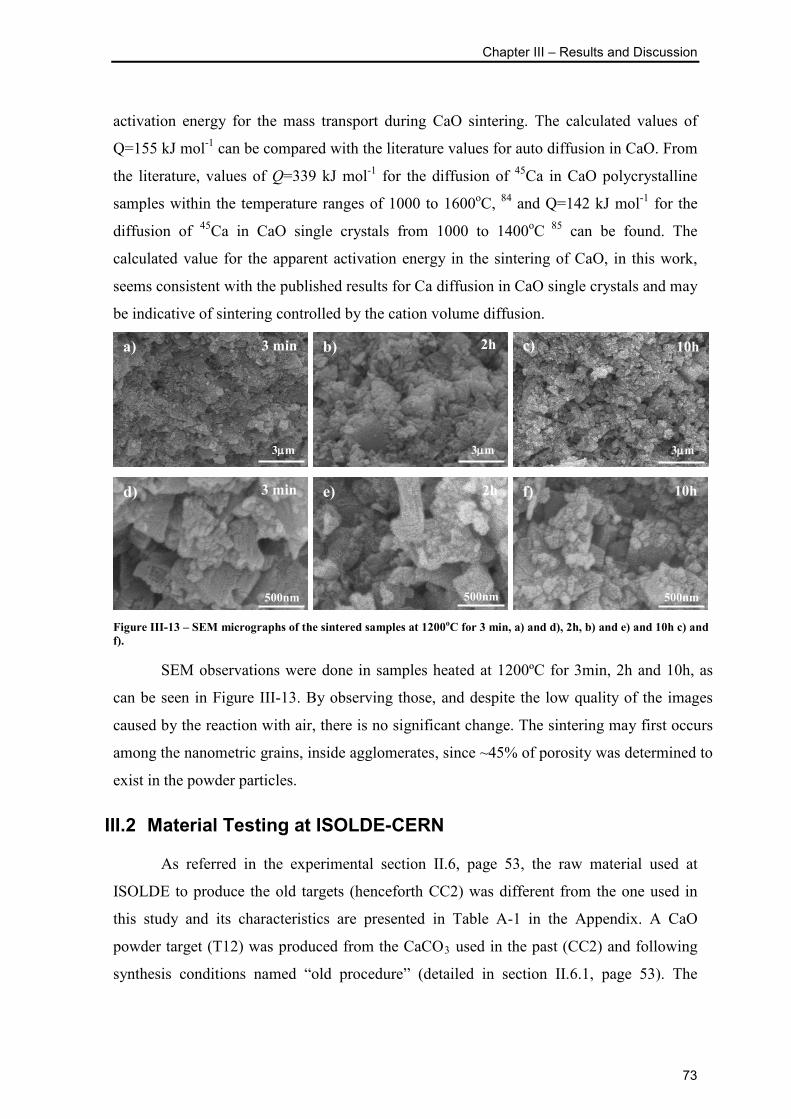
Chapter III – Results and Discussion
73
activation energy for the mass transport during CaO sintering. The calculated values of
Q=155 kJ mol-1 can be compared with the literature values for auto diffusion in CaO. From
the literature, values of Q=339 kJ mol-1 for the diffusion of 45Ca in CaO polycrystalline
samples within the temperature ranges of 1000 to 1600oC, 84 and Q=142 kJ mol-1 for the
diffusion of 45Ca in CaO single crystals from 1000 to 1400oC 85 can be found. The
calculated value for the apparent activation energy in the sintering of CaO, in this work,
seems consistent with the published results for Ca diffusion in CaO single crystals and may
be indicative of sintering controlled by the cation volume diffusion.
Figure III-13 – SEM micrographs of the sintered samples at 1200oC for 3 min, a) and d), 2h, b) and e) and 10h c) and f).
SEM observations were done in samples heated at 1200ºC for 3min, 2h and 10h, as
can be seen in Figure III-13. By observing those, and despite the low quality of the images
caused by the reaction with air, there is no significant change. The sintering may first occurs
among the nanometric grains, inside agglomerates, since ~45% of porosity was determined to
exist in the powder particles.
III.2 Material Testing at ISOLDE-CERN
As referred in the experimental section II.6, page 53, the raw material used at
ISOLDE to produce the old targets (henceforth CC2) was different from the one used in
this study and its characteristics are presented in Table A-1 in the Appendix. A CaO
powder target (T12) was produced from the CaCO3 used in the past (CC2) and following
synthesis conditions named “old procedure” (detailed in section II.6.1, page 53). The
a) b) c)
d) e) f)
500nm
3µm 3µm 3µm
500nm 500nm
3 min 2h 10h
3 min 2h 10h
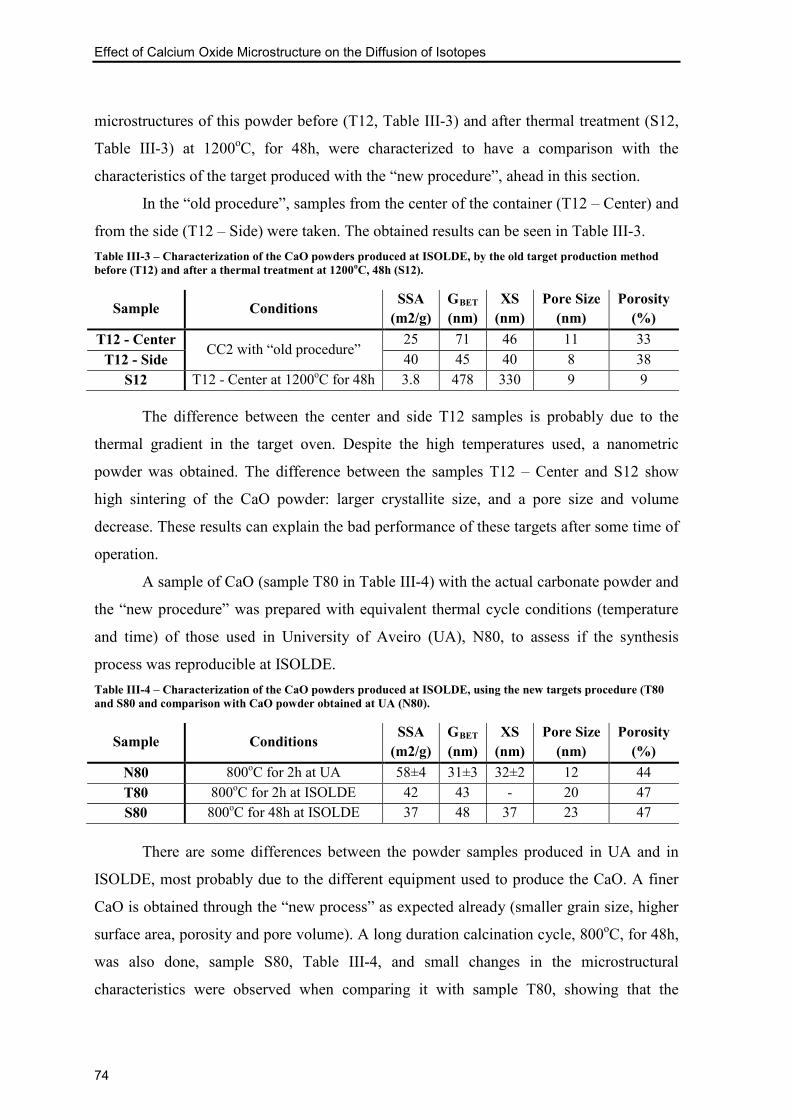
Effect of Calcium Oxide Microstructure on the Diffusion of Isotopes
74
microstructures of this powder before (T12, Table III-3) and after thermal treatment (S12,
Table III-3) at 1200oC, for 48h, were characterized to have a comparison with the
characteristics of the target produced with the “new procedure”, ahead in this section.
In the “old procedure”, samples from the center of the container (T12 – Center) and
from the side (T12 – Side) were taken. The obtained results can be seen in Table III-3. Table III-3 – Characterization of the CaO powders produced at ISOLDE, by the old target production method before (T12) and after a thermal treatment at 1200oC, 48h (S12).
Sample Conditions SSA
(m2/g) GBET (nm)
XS (nm)
Pore Size (nm)
Porosity (%)
T12 - Center CC2 with “old procedure”
25 71 46 11 33 T12 - Side 40 45 40 8 38
S12 T12 - Center at 1200oC for 48h 3.8 478 330 9 9
The difference between the center and side T12 samples is probably due to the
thermal gradient in the target oven. Despite the high temperatures used, a nanometric
powder was obtained. The difference between the samples T12 – Center and S12 show
high sintering of the CaO powder: larger crystallite size, and a pore size and volume
decrease. These results can explain the bad performance of these targets after some time of
operation.
A sample of CaO (sample T80 in Table III-4) with the actual carbonate powder and
the “new procedure” was prepared with equivalent thermal cycle conditions (temperature
and time) of those used in University of Aveiro (UA), N80, to assess if the synthesis
process was reproducible at ISOLDE. Table III-4 – Characterization of the CaO powders produced at ISOLDE, using the new targets procedure (T80 and S80 and comparison with CaO powder obtained at UA (N80).
Sample Conditions SSA
(m2/g) GBET (nm)
XS (nm)
Pore Size (nm)
Porosity (%)
N80 800oC for 2h at UA 58±4 31±3 32±2 12 44 T80 800oC for 2h at ISOLDE 42 43 - 20 47 S80 800oC for 48h at ISOLDE 37 48 37 23 47
There are some differences between the powder samples produced in UA and in
ISOLDE, most probably due to the different equipment used to produce the CaO. A finer
CaO is obtained through the “new process” as expected already (smaller grain size, higher
surface area, porosity and pore volume). A long duration calcination cycle, 800oC, for 48h,
was also done, sample S80, Table III-4, and small changes in the microstructural
characteristics were observed when comparing it with sample T80, showing that the
Chapter III – Results and Discussion
75
produced microstructure is relatively stable at 800oC. From these results, the online
operation temperature of this target was set to a maximum of 800oC. The new target
material doesn’t comply with the defined requirement of pore size 7,8 (>100 nm comparing
to the obtained 20 nm), but this parameter is hard to control since it is characteristic of the
CaCO3 decomposition. One can also see that the CaO obtained from the “new procedure”
(Table III-4) is finer and has larger pore size and volume than the one produced through
the “old procedure” (Table III-3). The CC2 was also a coarser and less pure raw material.
A nanostructured material was already produced before at ISOLDE (as seen in the
reproduced results in Table III-3), but this nanostructure was most of the times lost
depending how the material was produced, handled and operated. Since no study or
knowledge about this material didn’t exist (or was lost) and since production, degas and
handling phases were not controlled, it would be a coincidence for all the conditions to be
combined in order to obtain a material with good release properties of isotopes. This
explains the (sometimes) good isotope yields for this target, and the reported drop on them,
meaning that the target was being heated to high, degrading the microstructure and so the
yields over time.
A new target material was then produced according to “the new procedure”
(detailed in section II.6.2 on page 54), and the new target was labeled with the reference
CaO#469. The sample S80 (in Table III-4) was extracted from the center of the container,
while the side sample indicated a very low surface area (4.5m2/g) and also the XRD
showed CaCO3 peaks only, stating only little or no decomposition. This is again a sign of a
thermal gradient between the center and the side of the target oven. In section III.1.1,
temperature influence studies on the CaCO3 decomposition were done. This was further
confirmed when weighting the Re boat, showing that the reaction was 95% complete,
meaning that only a little quantity didn’t decompose.
The material was transferred from the oven to the target container, in a gloves box
under an Argon atmosphere in order to avoid exposure to air. This method proved to be
effective, since no peaks from the Ca(OH)2 phase were detected in the XRD, unlike most
of the tests done in this study.
In this target unit, an inverse gradient to the one of the oven is formed. The
temperature is lower at the center and higher at the sides as measured by two
thermocouples. This was caused by a water cooled copper block around the transfer line

Effect of Calcium Oxide Microstructure on the Diffusion of Isotopes
76
(see Figure I-4) in the center. As soon as temperatures approached 500oC at the sides of the
container, there was a sudden increase of the pressure (up to 10-1 Pa), showing the
decomposition of the remaining CaCO3, which was completed after 50 min as the pressure
went back to initial low pressures.
Afterwards, the normal procedure followed up (offline operation and outgassing for
3 days) at temperatures lower than 800oC to avoid any nanostructure degradation.
III.3 Online Studies
In order to test the impact of a nanostructure on the isotope release properties with
respect of other calcium oxide targets, a benchmark of this material was obtained by
testing the new unit CaO#469 in comparison with others previously used at ISOLDE. The
release curves for several isotopes were monitored. Yields on 35Ar were probed throughout
the target run to check for possible yields drop. Also, release curves for 35Ar and 19Ne at 3
different target temperatures were taken in order to assess effusion and diffusion properties
of the material. The release efficiency was calculated with values obtained from other CaO
targets used before at ISOLDE.
III.3.1 Isotope Yields
The yields for 6He, 10,15C, 19Ne, 31-33Ar and 35Ar were measured and compared with
a database compiling historical data of the best targets produced at ISOLDE 45, as seen in
Table III-5. Table III-5 – Measured yields and respective conditions for target CaO#469 and the comparison with database yields.
Isotope – T1/2 Temperatures (oC) Yield
(ions/µC) Database Yield (ions/µC), Target Temperature (oC) and Target Unit 45 Ion Source Target
6He – 806.7ms 1970 650 2.3x10⁶ 2.6x10⁶ (1050oC) - CaO#123 10C (CO) – 19.3s 1970 730 6.1x10⁵ 5.3x10⁵ (1050oC) - CaO#123 15C (CO) – 2.45s 1970 730 7.0x10³ 6.2x10³ – SC Target
19Ne – 17.22s 1970 650 9.6x10⁶ 7.5x10⁶ (1050oC) - CaO#123 31Ar – 15.1ms 1970 650 4.2x101 5.0x100 (>1050oC) - CaO#408
32Ar – 98ms 1970 650 2.4x10³ 3.3x10³ (1050oC) - CaO#123 33Ar – 174.1ms 1970 650 1.3x10⁵ 3.8x10⁴ (1050oC) - CaO#123
35Ar – 1.78s 2070 840 2.0x10⁸ 4.3x10⁷ (1050oC) - CaO#123
Table III-5, shows a match or a significant increase of the yields of CaO#469 for
most of the isotopes, versus the database yields. One of the main differences is the

Chapter III – Results and Discussion
77
temperature at which the target CaO#469 operated, relatively to the old targets. Since
proton impact effect at ISOLDE is unknown for this material, the temperature was set to
650oC as regular operation temperature in order to partially compensate for the spike
heating caused by the proton pulses. Whenever the target temperature was risen, it was
only for the measurement in question, being lowered right away.
Clear improvement was obtained on 35Ar yield, being 5 times superior to the one in
the database, and the highest in all history of ISOLDE. This is consistent with the previous
hypothesis that a controlled microstructure (nanostructure), leads to better yields. The good
value for 35Ar is even underestimated since part of the release curve was cut away, and
only partly compensated by the fitting program. The 31Ar yield measurement is probably
the best achievement, being 8 times higher than database values, confirming again that a
microstructure with smaller grains which have shorter diffusion lengths enhances the
release, as will be discussed further ahead. The measured yields for 31,33,35Ar and 10C were
all higher than database values, compared to any of the target materials used so far at
ISOLDE. 19Ne and 15C isotope yields were the highest of all CaO past target units. Most of
the yields were obtained with conservative running parameters to preserve the target
nanostructure, which means that probably they can be further enhanced by increasing the
target operation temperature, without compromising it.
The high yields, on the measured isotopes on the database 45, were mostly provided
by target CaO#123 operated in 1999. Since then, these results were hard to reproduce
mainly for the reasons detailed before (section III.2). The results of target CaO#123 were
probably of such a good quality due to the use of a different production process 9,
decomposing the CaCO3 at a lower temperature (1000oC, instead of 1200oC used
afterwards) in a single batch instead of 2, obtaining smaller grain sizes. Additionally, lower
operation temperatures were used (1050oC), helping to keep the microstructure for longer
times, comparing with other standard CaO targets which were operated at temperatures
between 1050 and 1150oC 45 and also at 1340oC 9.
III.3.2 Yields Over Time
The CaO targets at ISOLDE, are reported to have low yields of exotic Ar isotopes
from the beginning, or a fast drop when operated under proton irradiation. In this work it is
shown that it can be avoided by maintaining the microstructure without significant

Effect of Calcium Oxide Microstructure on the Diffusion of Isotopes
78
degradation due to sintering. An example of a relative drop on the yields for precedent
targets is shown in Figure III-14 for 31,32Ar.
Figure III-14 - Yield evolution on 32Ar on target CaO#191 in 2001 at ISOLDE (courtesy of Susanne Kreim) and 31Ar in CaO#408.
As can be seen in Figure III-14, the yields dropped to 30% of the initial value in
only 15h of operation time. The yield of this isotope is a good benchmark of the
microstructure degradation since it is very short lived (98ms), so any increase on the grain
size would increase the diffusion lengths that would directly affect the total release of 32Ar.
On another target, CaO#408, the yield on 31Ar dropped by a factor 5 from 5 ions/µC after 8
hours of operation time. On the new target, CaO#469, the yields on the very short lived
isotopes (31-33Ar) were measured after 80 hours of operation. The measured numbers
proved to be higher than in any previous target (especially for 31Ar, see Figure III-14), but
no measurements along time could be done.
The yield of 35Ar was taken throughout the run, for target CaO#469, and compared
to the yield drop on a standard target (CaO#419) as can be seen in Figure III-15.
Figure III-15 - Yields of 35Ar measured throughout the run for targets CaO#469 and CaO#419.
0%
20%
40%
60%
80%
100%
0 2 4 6 8 10 12 14 16
Rela
tive
Ar Y
ield
Time (h)
32Ar, CaO#19131Ar, CaO#408
1E+6
1E+7
1E+8
0 20 40 60 80 100 120
Yiel
d (io
ns/μ
C)
Operation time (h)
CaO#469
CaO#419
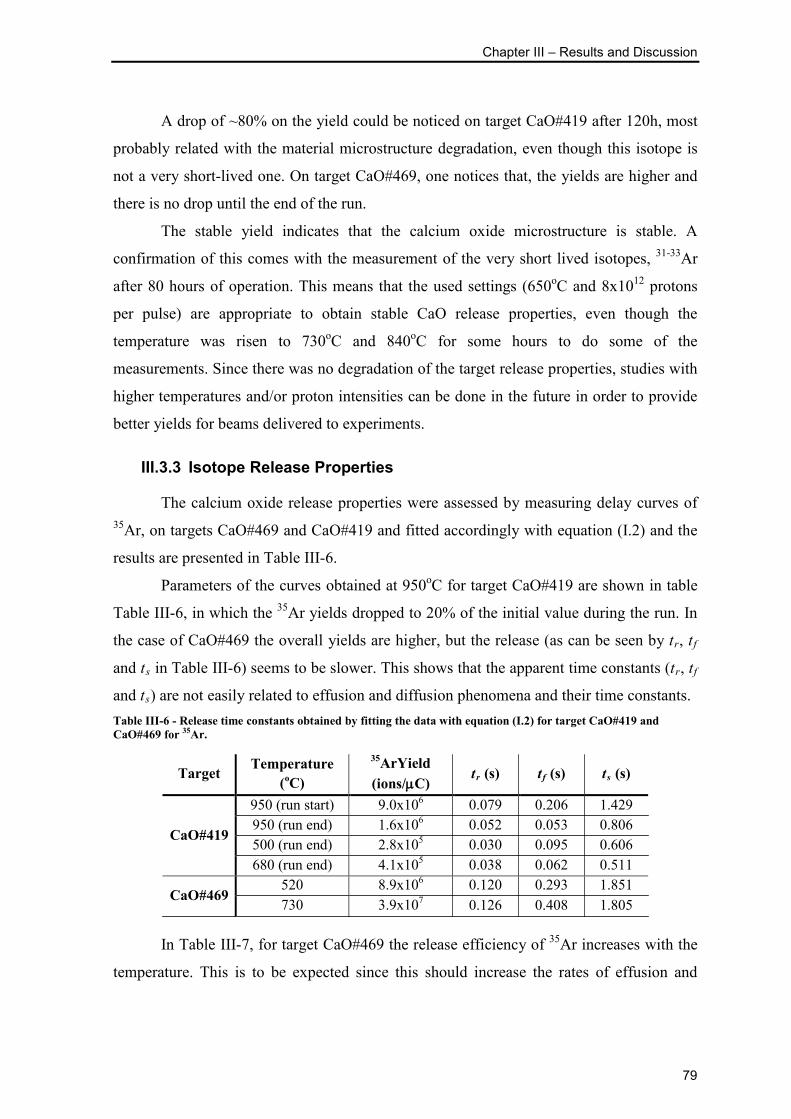
Chapter III – Results and Discussion
79
A drop of ~80% on the yield could be noticed on target CaO#419 after 120h, most
probably related with the material microstructure degradation, even though this isotope is
not a very short-lived one. On target CaO#469, one notices that, the yields are higher and
there is no drop until the end of the run.
The stable yield indicates that the calcium oxide microstructure is stable. A
confirmation of this comes with the measurement of the very short lived isotopes, 31-33Ar
after 80 hours of operation. This means that the used settings (650oC and 8x10¹² protons
per pulse) are appropriate to obtain stable CaO release properties, even though the
temperature was risen to 730oC and 840oC for some hours to do some of the
measurements. Since there was no degradation of the target release properties, studies with
higher temperatures and/or proton intensities can be done in the future in order to provide
better yields for beams delivered to experiments.
III.3.3 Isotope Release Properties
The calcium oxide release properties were assessed by measuring delay curves of 35Ar, on targets CaO#469 and CaO#419 and fitted accordingly with equation (I.2) and the
results are presented in Table III-6.
Parameters of the curves obtained at 950oC for target CaO#419 are shown in table
Table III-6, in which the 35Ar yields dropped to 20% of the initial value during the run. In
the case of CaO#469 the overall yields are higher, but the release (as can be seen by tr, tf
and ts in Table III-6) seems to be slower. This shows that the apparent time constants (tr, tf
and ts) are not easily related to effusion and diffusion phenomena and their time constants. Table III-6 - Release time constants obtained by fitting the data with equation (I.2) for target CaO#419 and CaO#469 for 35Ar.
Target Temperature (oC)
35ArYield (ions/µC)
tr (s) tf (s) ts (s)
CaO#419
950 (run start) 9.0x10⁶ 0.079 0.206 1.429 950 (run end) 1.6x10⁶ 0.052 0.053 0.806 500 (run end) 2.8x10⁵ 0.030 0.095 0.606 680 (run end) 4.1x10⁵ 0.038 0.062 0.511
CaO#469 520 8.9x10⁶ 0.120 0.293 1.851 730 3.9x10⁷ 0.126 0.408 1.805
In Table III-7, for target CaO#469 the release efficiency of 35Ar increases with the
temperature. This is to be expected since this should increase the rates of effusion and

Effect of Calcium Oxide Microstructure on the Diffusion of Isotopes
80
diffusion phenomena. For CaO#419, which represents a standard ISOLDE CaO target, the
release efficiency for 35Ar is 1/5 of that of CaO#469, and it decays over the run to 1/35. For
the very short lived isotopes, the release efficiency is higher in the case of CaO#469, than
other targets (CaO#123 and CaO#408). Surprisingly, the same could not be seen for 32Ar. Table III-7 - Calculation of the release efficiency for Ar isotopes for the target CaO#469 and other older targets. Yprod calculated from ABRABLA simulation for the different target thicknesses.
Target Isotope – T1/2 Temperature
(oC) εis (%)
Yprod (ions/µC)
Yobs (ions/µC)
εrel(%)
CaO#469
31Ar – 15.1ms 650
3.2x10⁴ 4.2x101 0.9 32Ar – 98ms 1.1x10⁶ 2.4x10³ 1.6
33Ar – 173ms 14.0 2.0x10⁷ 1.2x10⁵ 4.3
35Ar – 1.78s
520 7.2
3.4x10⁹
8.9x10⁶ 3.6 650 8.0 3.5x10⁷ 12.9 730 6.1 3.9x10⁷ 19.2 840 19.4 2.0x10⁸ 29.8
CaO#123
31Ar – 15.1ms
1050 9
1.8x10⁴ 1.5x100 0.1 32Ar – 98ms 6.2x10⁵ 3.3x10³ 5.9
33Ar – 173ms 1.1x10⁷ 3.8x10⁴ 3.8 35Ar – 1.78s 1.9x10⁹ 4.3x10⁷ 25.1
CaO#408 31Ar – 15.1ms >1050 21 2.0x10⁴ 5.0x100 0.1
CaO#419 35Ar – 1.78s 950 (run begin) 8 1.8x10⁹ 9.0x10⁶ 6.2
950 (run end) 1.9x10⁶ 1.3
It is important to note that the εrel of the isotopes produced by CaO#123 are
somehow close to the ones produced by CaO#469, at different operation temperatures with
the exception of 31Ar. Nevertheless, this shows that the good performance of these old
targets (CaO#123) is possibly related, as explained before, to a better controlled
microstructure. However degradation of the initial microstructure was experienced due to
higher operation temperatures.
III.3.4 Diffusion and Effusion of Isotopes
Diffusion and effusion parameters can be extracted from the experimental release
efficiency (equation (I.5)) of isotopes with different half-lives, using a fit of equation
(I.19). To calculate the diffusion coefficient, the equation (I.17) was used and a particle
size of 40 nm was considered from the sample S80, considered to be representative of the
target material (see Table III-4, on page 74).

Chapter III – Results and Discussion
81
Figure III-16 – Example of release curve and respective fit, from equation (I.2), for 35Ar at 520oC (a) and release efficiency obtained through the fitting of the experimental release curves of 35Ar for three different temperatures (b) in target CaO#469.
A representative example of a release curve fit of 35Ar can be seen in Figure III-16
a). It can be seen that the fitted function does not match the first part of the release curve,
which normally corresponds to where effusion phenomena is predominant. This induces an
inconsistency later when obtaining the release efficiency curves, as can be seen in Figure
III-16 b), where the release efficiency should be higher as higher is the temperature
because effusion and diffusion rates are faster, improving the release efficiency. This
especially fails in the case of the release efficiency at 520oC, also confirmed by the values
in Table III-8. Table III-8 - Fitted effusion and diffusion parameters for 35Ar for three different temperatures on target CaO#469.
Temperature (oC) Yield (ions/µC) v1 (s-1) v2 (s-1) µ (s-1) D (m2/s) 520 8.9x10⁶ 160 2.13 5.22 1.6x10⁻¹⁶ 650 3.5x10⁷ 155 4.47 0.22 9.1x10⁻¹⁸ 730 3.9x10⁷ 144 3.59 0.29 1.2x10⁻¹⁷
1E+1
1E+2
1E+3
1E+4
1E+5
1E+6
1E+7
0.001 0.01 0.1 1 10 100
Ions
(s-1
)
Time (s)
Fit
Data
1E-3
1E-2
1E-1
1E+0
0.001 0.01 0.1 1 10 100
Rele
ase
effic
ienc
y
T1/2 (s)
520ºC
650ºC
730ºC
T1/2=1.78s - 35Ar
εrel~50%
a)
b)

Effect of Calcium Oxide Microstructure on the Diffusion of Isotopes
82
By comparing the values of µ and calculated D (in Table III-8), one can see that
there is a logic tendency between the temperatures of 650oC and 730oC, which is not the
case at 520oC. For the values of v1 and v2 there is no large evolution, whereas these should
get higher as the temperature is increased. It shows that the difference between the fit and
the data indeed affects the proper extraction of these parameters.
The diffusion delay parameter was alternatively deduced from the release
efficiency by using equations (I.20) and (I.21), neglecting contributions from effusion as
shown in Table III-9. The values are expected to be lower estimates of µ and D, since all
losses are assumed to come from diffusion. Table III-9 - Obtained diffusion parameters (neglected contribution from effusion) through the release efficiency of 35Ar for three different temperatures on target CaO#469.
Temperature (oC) εis (%) Yprod
(ions/µC) εrel (%) µ (s-1) D (m2/s)
520oC 7.2
3.4x10⁹
3.6 0.00058 2.4x10⁻²⁰ 650oC 8.0 12.9 0.0078 3.19x10⁻¹⁹ 730oC 6.1 19.2 0.018 7.4x10⁻¹⁹ 840oC 19.4 29.8 0.047 1.9x10⁻¹⁸
By looking at the values of µ in Table III-9, one can see that they are much lower
than those obtained in Table III-8. The difference results from the disagreement between
the release efficiencies determined by the two different methods (as seen in the values in
Table III-9 and Figure III-16). These methods were already applied successfully before 37,
which can means that a potentially error in the determination of the system efficiency
might be in play: (i) it was detected that part of the beam was not being totally separated
and lost in the way before or in the separator; (ii) the ion source efficiency can also be
another source of the error since it can be overestimated, as seen already in past targets;
(iii) experimental issues with the extraction and acceleration of the RIB were reported
throughout the release measurements. All of these can have a strong influence on the
proper assessment of the release process and efficiencies during the experimental tests.
Another possible explanation may be related with a slow diffusion process (trapped or very
slowly released Ar) which is in play (as shown in Table III-9 by the low values ofµ) which
cannot be resolved by the current model, leading only to apparent diffusion values.
As expected the yield increases with the temperature, as can be seen in Table III-8.
This is especially true in the case of diffusion which is the most limiting step, as can be

Chapter III – Results and Discussion
83
seen by the orders of diffusion and effusion time constants, v1, v2, and µ at 650oC and
730oC.
In the case of 19Ne (T1/2=17.22s), a representative example of a fitted release curve
is also shown in Figure III-17 a), which fit agrees generally well with the data. The
resulting release curves show, as expected, in Figure III-17 b), higher efficiencies for
higher temperatures.
Figure III-17 – Example of release curve and respective fit, from equation (I.2), for 19Ne at 520oC (a) Release efficiency obtained through the fitting of the experimental release curves of 19Ne for three different temperatures in target CaO#469.
From the Table III-10 one can see that the values of v1 and µ are increasing as the
temperature increases, showing that temperature has a large influence on both diffusion
and effusion. In the case of v1 the values are unrealistic because of the rising part on the
release curve could not be experimentally determined (see Figure III-17 a)) and respective
tr).
Calculations about release efficiency, similar to those made in Table III-9, cannot
be done in the case of 19Ne, since the ion source efficiency was not known. In terms of
1E+1
1E+2
1E+3
1E+4
1E+5
1E+6
0.01 0.1 1 10 100
Ions
(s-1
)
Time (s)
Fit
Data
1E-3
1E-2
1E-1
1E+0
0.001 0.01 0.1 1 10 100
Rele
ase
effic
ienc
y
T1/2 (s)
520ºC
650ºC
730ºC
a)
b)

Effect of Calcium Oxide Microstructure on the Diffusion of Isotopes
84
yield, the values for 520oC and 650oC are in agreement, but for 730oC a mistuning in the
high voltage of the extraction and acceleration of the RIB lead to beam losses, leading to a
lower yield. Table III-10 - Obtained effusion and diffusion fitted parameters for 19Ne for three different temperatures on target CaO#469.
Temperature (oC) Yield (ions/µC) v1 (s-1) v2 (s-1) µ (s-1) D (m2/s) 520 2.8x10⁶ 2.7x10⁴ 23.9 0.62 2.5x10⁻¹⁷ 650 9.6x10⁶ 1.3x10¹¹ 72.7 0.96 3.9x10⁻¹⁷ 730 6.6x10⁶ 3.4x10¹⁰ 84.9 1.23 5.0x10⁻¹⁷
The values of D for both Ar and Ne on CaO cannot be compared to published
figures in the literature. In both cases the release is limited by diffusion, except for the
cases of the very short lived Ar isotopes, where it is also limited by effusion. Diffusion
coefficients are in the order of 10-17 m2/s for Neon and 10-18 m2/s for Argon (or between for
10-20 and 10-19 m2/s) in calcium oxide between 520 and 730oC. This was expected since
neon is a smaller atom than argon and since they are both noble gases, neon should diffuse
faster in the same matrix. The values of the diffusion delay time, µ, obtained by E.
Bouquerel 35, were determined to be 1.79 s-1 for Ar in CaO at 1400oC. This value was taken
in an old standard CaO target with a grain size at least one to two orders of magnitude
larger (as discussed before). The diffusion delay time parameter is also compensated by the
much higher temperature used. Further knowledge about the data treatment and the grain
size would have to be known at this kind of temperatures for further conclusions. This
value was also taken considering the equation (I.15), which is not for the spheres
geometry, but for infinite foils. The diffusion values obtained in this study can also be
influenced by the proton irradiation generated defects in the crystal structure. The effusion
delay times obtained by E. Bouquerel 35 are 100 and 10.5 s-1, which are in the same order
of magnitude of the ones obtained in this work.
The values of diffusion coefficient of neon in aluminum oxide taken from the
release fractions in a target for EURISOL 86, that is a close situation (neon in an oxide),
they were, for the temperatures of 1100oC and 1450oC, 1x10-17 m2/s and 7x10-17 m2/s,
respectively, which are very close to the ones obtained in this work. Furthermore from the
diffusion coefficients of helium in a beryllium oxide target operated at ISOLDE 37, which
is also a noble gas in an oxide, for temperatures between 800oC and 1400oC the diffusion
coefficients were measured to be 10-13 to 10-14 m2/s, which are still some orders of
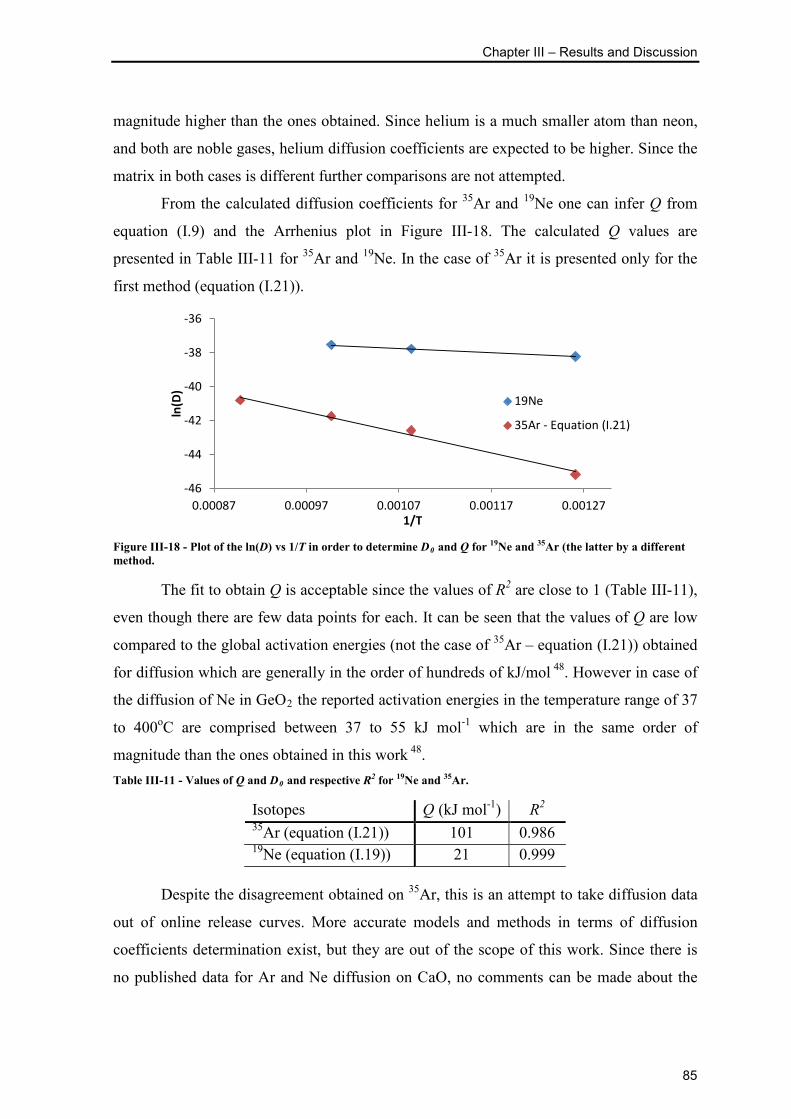
Chapter III – Results and Discussion
85
magnitude higher than the ones obtained. Since helium is a much smaller atom than neon,
and both are noble gases, helium diffusion coefficients are expected to be higher. Since the
matrix in both cases is different further comparisons are not attempted.
From the calculated diffusion coefficients for 35Ar and 19Ne one can infer Q from
equation (I.9) and the Arrhenius plot in Figure III-18. The calculated Q values are
presented in Table III-11 for 35Ar and 19Ne. In the case of 35Ar it is presented only for the
first method (equation (I.21)).
Figure III-18 - Plot of the ln(D) vs 1/T in order to determine D0 and Q for 19Ne and 35Ar (the latter by a different method.
The fit to obtain Q is acceptable since the values of R2 are close to 1 (Table III-11),
even though there are few data points for each. It can be seen that the values of Q are low
compared to the global activation energies (not the case of 35Ar – equation (I.21)) obtained
for diffusion which are generally in the order of hundreds of kJ/mol 48. However in case of
the diffusion of Ne in GeO2 the reported activation energies in the temperature range of 37
to 400oC are comprised between 37 to 55 kJ mol-1 which are in the same order of
magnitude than the ones obtained in this work 48. Table III-11 - Values of Q and D0 and respective R2 for 19Ne and 35Ar.
Isotopes Q (kJ mol-1) R2 35Ar (equation (I.21)) 101 0.986 19Ne (equation (I.19)) 21 0.999
Despite the disagreement obtained on 35Ar, this is an attempt to take diffusion data
out of online release curves. More accurate models and methods in terms of diffusion
coefficients determination exist, but they are out of the scope of this work. Since there is
no published data for Ar and Ne diffusion on CaO, no comments can be made about the
-46
-44
-42
-40
-38
-36
0.00087 0.00097 0.00107 0.00117 0.00127
ln(D
)
1/T
19Ne
35Ar - Equation (I.21)

Effect of Calcium Oxide Microstructure on the Diffusion of Isotopes
86
reliability of this method on this material. One should know that there are other errors
associated to this method: grain size with direct impact on the values of D, since it is most
probable, because of the thermal gradients during production and operation that the grain
size varies. Another source of error can be the operation temperature which is not
homogeneous throughout the target material. Further attempts in the future should be taken
to explore and improve this process to study diffusion on target materials.

Effect of Calcium Oxide Microstructure on the Diffusion of Isotopes
87
Chapter IV - Conclusions


Chapter IV - Conclusions
89
IV.1 Conclusions
From the decomposition of CaCO3 micrometric powder in vacuum (p≤1 Pa), at
temperatures higher than 550oC, a mesoporous and nanometric (≥40 nm) powder could be
obtained. For the same vacuum conditions, the powder crystallite size is lower and the
surface area is higher as lower is the temperature used in the calcination process. The
obtained CaO powders proved also to be very reactive in air to H2O and CO2 gases and
special care was needed to be taken in storage and transport.
The vacuum sintering studies in nanometric CaO showed that the surface area has a
net decrease from 1000oC which is accompanied by shrinkage. The kinetic analysis of the
sintering results points to volume diffusion as controlling mechanism of matter transport
during sintering at 1000-1200oC. The apparent activation energy was determined to be 155
kJ mol-1 close to the value of diffusion of Ca in CaO monocrystals, in the literature. From
this study, one can also conclude that the temperatures used before for the target operation
at ISOLDE, T>1050oC, degrade the CaO microstructure.
The CaO target material at ISOLDE-CERN was investigated. Based on the
synthesis, reactivity and sintering results, changes were proposed for the production,
operation and handling of the target material. The target was produced and operated at
lower temperatures (T<800oC) and special care was taken due to the very fast hydration of
this material.
The performance of the as produced CaO target material proved to be much higher
and stable than standard CaO targets. The obtained yields for 31-33,35Ar, 19Ne, 6He, 10,15C
were higher than recent CaO targets, also higher or equivalent to the old (from 1999) CaO
targets, and sometimes higher than any other target. No drop of the yields was seen. These
results showed that choosing synthesis conditions to get a nanometric CaO powder and
keeping its nanostructure during handling and operation, the release properties could be
maintained over time.
By applying a mathematical model taking into account effusion and diffusion
physical phenomena in the release curves at different temperatures, information on these
parameters, for 19Ne and 35Ar in CaO, was extracted. As expected the diffusion times are
much higher than effusion times, and diffusion is limiting most of the release. Diffusion
coefficients were found to be in the order of 10-17m2/s for Neon and in between 10-20 and
Effect of Calcium Oxide Microstructure on the Diffusion of Isotopes
90
10-18m2/s for Argon in calcium oxide between 520 and 730oC. Activation energies for
diffusion of Ne in CaO were found to be 21 kJ mol-1 and of Ar in CaO to be 101 kJ mol-1.
IV.2 Outlook
A good improvement of the release properties of the calcium oxide as target
material was achieved with this study. The target material development in this work is not
only important to ISOLDE, but also for all other ISOL facilities throughout the world.
Further investigation can still be done to further improve the release properties.
The improvements on this target material, permitted the WITCH experiment (Weak
Interation Trap for Charged particles) at ISOLDE to obtain a yield good enough on 35Ar
and have results with good statistics, which they were attempting, unsuccessfully, for the
last couple of years. It also improved the yield of the very exotic Ar isotopes which can be
used for future experiments.
A nanometric material yet finer can be produced, but the sintering rates of this
material, since it will be more reactive, have to be assessed before online operation. A
good balance must be reached in terms of the nanostructured characteristics of the material
and the temperature of online of operation, since both influences the diffusion times.
Further studies on the limit operation temperature should be made, in order to keep the
microstructure over time and tentatively increase the yields.
In this study, the CaO reactivity in air was only studied in order to prevent it.
Further studies can still be done in this subject, especially in the kinetics of the reactions in
air atmosphere, and determine when, with precision, either is the hydration or the
carbonation reaction predominant.
The proton intensity used to operate this target was set to be low (8x10¹² protons
per pulse). Studies with higher proton intensities can be done in order to study its influence
on the release properties and on the degradation of the target material.
The method to obtain diffusion and effusion times from an online release curve,
show be further explored in the future, in order to better study effusion and diffusion
phenomena in target materials at ISOLDE.
Further improvements can be done in the target container design and in the oven to
reduce the existent temperature gradient and avoid the creation of different microstructures
along the material container.

Chapter IV - Conclusions
91
The material study done on CaO clearly showed that better and stable isotope
yields could be obtained, by knowing better how to produce, operate and handle the
nanostructured material. Similar studies can be done for other oxide materials used at
ISOLDE, certainly gaining in the release properties.


Effect of Calcium Oxide Microstructure on the Diffusion of Isotopes
93
References
1. CERN. CERN in a nutshell. http://public.web.cern.ch/public/en/about/About-en.html
(accessed August 13, 2011).
2. ISOLDE-CERN. The ISOLDE Facility. http://isolde.web.cern.ch/isolde/ (accessed
August 13, 2011).
3. Kugler, E. The ISOLDE Facility. Hyperfine Interactions 2000, 129, 23-42.
4. Stora, T.; Bouquerel, E.; Bruno, L.; Catherall, R.; Fernandes, S.; Kasprowicz, P.;
Lettry, J.; Marzari, S.; Nara Singh, B. S.; Noah, E.; Penescu, L.; Wilfinger, R. Oxide
Target Designs for High Primary Beam Intensities for Future Radioactive Ion Beam
Facilities. CP1099, Application of Accelerators in Research and Industry: 20th
International Conference, 2009; pp 764-768.
5. Bennett, J. R. J. Targets for the Production of High Intensity Radioactive Ion Beams.
Nuclear Instruments and Methods in Physics Research B: Beam Interactions with
Materials and Atoms 1997, 126, 105-112.
6. Köster, U.; Bergmann, U. C.; Carminati, D.; Cathedral, R.; Cederkäl, J.; Correia, J. G.;
Crepieux, B.; Dietrich, M.; Elder, K.; FEdoseyev, V. N.; Franchoo, L.; Fynbo, H.;
Georg, U.; Giles, T.; Jonsson, O. C.; Kirchner, R.; Lau, C.; Lettry, J.; Maier, H. J.;
Mishin, V. I.; Peräjärvi, M.; Ravn, H. L.; Rinaldi, T.; Santana-Leitner, M.; Wahl, U.;
Weissman, L.; the ISOLDE Collaboration. Oxide Fiber Targets of ISOLDE. Nuclear
Instruments and Methods in Physics Research B: Beam Interactions with Materials &
Atoms 2003, 204, 303-313.
7. Fernandes, S. Submicro- and Nanostructured Porous Materials for Productin of High-
Intensity Exotic Radioactive Ion Beams; PhD Thesis; École Polytechnique Fédérale de
Lausanne: Lausanne, 2011.
8. Stora, T.; Fernandes da Visitação, S.; Mathot, S.; Bowen, P. Nanostructured Target for
Isotope Production; Patent; CERN: Geneva, 2009.
9. Ravn, H. L.; Cathedrall, R.; Barker, J.; Drumm, P.; Evensen, A. H. M.; Hagebo, E.;
Hoff, P.; Jonsson, O. C.; Kugler, E.; Lettry, J.; Steffensen, K.; Tengblad, O.; the
ISOLDE Colaboration. Bunched Release of Gases from Oxide Targets. Nuclear
Instruments and Methods in Physics Research B: Beam Interactions with Materials
Effect of Calcium Oxide Microstructure on the Diffusion of Isotopes
94
and Atoms 1997, 126, 176-181.
10. Serway, R. A.; Moses, C. J.; Moyer, C. A. Modern Physics, 3rd ed.; Thompson
Learning: Belmont, USA, 2005; pp 465-548.
11. Huyse, M. The Why and How of Radioactive-Beam Research. Lecture Notes in
Physics 2004, 651, 1-32.
12. Minty, M. G.; Frank, Z. Measurment and Control of Charged Particle Beams;
Springer: New York, 2003; pp 1-3.
13. Krane, K. S. Introductory Nuclear Physics, 3rd ed.; Wiley: Corvalis, Oregon, 1987; pp
1-8, 484-485.
14. Magill, J.; Pfennig, G.; Galy, J. Karlsruher Chart of the Nuclides, 7th ed.; Publications
Office of the European Union, 2006.
15. International Atomic Energy Agency. Live Chart of Nuclides - Table of
Nuclides. http://www-nds.iaea.org/relnsd/vchart/index.html (accessed August 13,
2011).
16. National Nuclear Data Center. Interactive Chart of
Nuclides. http://www.nndc.bnl.gov/chart/reCenter.jsp?z=78&n=104 (accessed August
13, 2011).
17. Duppen, P. V. Isotope Separation On Line and Post Acceleration. Lecture Notes in
Physics 2006, 700, 37-77.
18. Sauvageon, H. Deep spallation cross sections in high energy protons - Uranium
interactions. Zeitschrift Für Physik A Hadrons and Nuclei 1987, 326 (3), 301-308.
19. Morrissey, D. J.; Sherril, B. M. In-Flight Separation of Projectile Fragments. Lecture
Notes in Physics 2004, 651, 113-135.
20. Köster, U. Intense Radioactive-Ion Beams Produced with the ISOL Method. The
European Physical Journal A 2002, 15, 255-263.
21. Kowalska, M. Minutes of the 39th meeting of the INTC. ISOLDE and Neutron Time-
of-Flight Experiments Commitee, Geneva, February 2011.
22. Serway, R. A.; Jewett, Jr., J. W. Princípios de Física: Electromagnetismo, 3rd ed.;
Thompson: São Paulo, 2005; Vol. 3.
23. Kluge, H. -J. ISOLDE Users' Guide; Geneva, 1986.

References
95
24. Wolf, B., Ed. Handbook of Ion Sources; CRC Press: Darmstadt, 1995; pp 1-21.
25. Lettry, J.; Cathedrall, R.; Drumm, P.; Duppen, P. Van; Evensen, A. H. M.; Focker, G.
J.; Jokinen, A.; Jonsson, O. C.; Kugler, E.; Ravn, H.; the ISOLDE Collaboration. Pulse
shape of the ISOLDE Radioactive Ion Beams. Nuclear Instruments and Methods in
Physics Research B: Beam Interactions with Materials and Atoms 1997, 126, 130-134.
26. Turrión, M.; Eller, M.; Cathedrall, R.; Fraile, L. M.; Herman-Izycka, U.; Köster, U.;
Lettry, J.; Riisager, K.; Stora, T. Management of ISOLDE yields. Nuclear Instruments
and Methods in Physics Research B: Beam Interactions with Materials and Atoms
2008, 266, 4674-4677.
27. Kirchner, R. On the release and ionization efficiency of catcher-ion-source systems in
isotope separation on-line. Nuclear Instruments and Methods in Physics Research B:
Beam Interactions with Materials & Atoms 1992, 70, 186-199.
28. Köster, U. ISOLDE target and ion source chemistry. Radiochimica Acta 2001, 89,
77777-77785.
29. Noah, E.; Bruno, L.; Cathedrall, R.; Lettry, J.; Stora, T. Hydrodynamics of ISOLDE
liquid metal targets. Nuclear Instruments and Methods in Physics Research B: Beam
Interactions with Materials and Atoms 2008, 266, 4303-4307.
30. Rahaman, M. N. Ceramic Processing and Sintering, 2nd ed.; CRC Press: Rolla,
Missouri, 2003; pp 62-72, 126-156.
31. Smith, W. F. Princípios de Ciência e Engenharia de Materiais; McGraw-Hill: Lisboa,
1998; pp 103-115,144-153.
32. Callister, W. D. Materials Science and Engineering: An Introduction, 7th ed.; John
Wiley& Sons, Inc.: Utah, 2007.
33. Kang, S.-J. L. Sintering, Densification, Grain Growth & Microstructure; Elsevier:
Oxford, 2005.
34. Fernandes, S.; Bruetsch, R.; Cathedral, R.; Genther-Leopold, I.; Groeschel, F.; Lettry,
J.; Manfrin, E.; Marzari, S.; Sgobba, S.; Noah, E.; Stora, T.; Zanini, L. Microstructure
evolution of nanostructured and submicrometric porous refractory ceramics induced by
a continuous high-energy proton beam. Journal of Nuclear Materials 2011, Article in
the Press.

Effect of Calcium Oxide Microstructure on the Diffusion of Isotopes
96
35. Bouquerel, E. J. A. Atomic Beam Merging and Suppression of Alkali Contaminants in
Multi Body High Power Targets: Desing and Test of Target and Ion Source Prototypes
at ISOLDE; PhD Thesis; Université Paris XI: Orsay, 2009.
36. Ravn, L. H.; Carraz, L. C.; Denimal, J.; Kugler, E.; Skarestad, M.; Sundell, S.;
Westgaard, L. New Techniques at ISOLDE-2. Nuclear Instruments and Methods 1976,
139, 267-273.
37. Stora, T.; Noah, E.; Hodak, R.; Hirsh, T. V.; Hass, M.; Kumar, V.; Kuljeet, S.;
Vaintraub, S.; Delahaye, P.; Laurent, M. G. S.; Lhersonneau, G. A high intensity 6He
for the beta-beam neutrino oscillation facility. Submited to Europhysics Letters.
38. Filges, D.; Frank, G. Handbook of Spallation Research: Theory, Experiments and
Applications; Wiley VCH: Weinheim, 2009.
39. Gaimard, J.-J.; Schmidt, K.-H. A reexamination of the Abrasion-Ablation Model for
the Description of the Nuclear Fragmentation Reaction. Nuclear Physics A 1991, 351,
709-754.
40. Carraz, L. C.; Sundell, S.; Ravn, H. L.; Skarestad, M.; Westgaard, L. High-
Temperature Carbide Targets for Fast On-Line Mass Separation of Alkali and Noble
Gas Elements. Nuclear Instruments and Methods 1979, 158, 69-80.
41. Portillo, M.; Nolen, J.; Gomes, I.; Panteleev, V. N.; Fedorov, D. V.; Barzakh, A. E.;
Beznosjuk, V. I.; Moroz, F. V.; Orlov, S. Y.; Volkov, Y. M. Production of neutron-rich
isotopes by one- and two-step processes in ISOL targets. Nuclear Instruments and
Methods in Physics Research B: Beam Interactions with Materials & Atoms 2002, 194,
193-206.
42. Kjelber, A.; Rudstam, G. The ISOLDE Isotope Separator On-Line Facility at CERN;
CERN: Geneva, 1970.
43. Ravn, H. L.; Bjornstad, T.; Hoff, P.; Jonsson, O. C.; Kugler, E.; Sundell, S.; Vosicki,
B.; the ISOLDE Colaboration. Use of Refractory Oxides, Carbides and Borides as
Targets for On-Line Mass Separation; CERN: Geneva, 1986.
44. CERN. INTC Agenda. http://indico.cern.ch/categoryDisplay.py?categId=2l85
(accessed November 21, 2011).
45. Turrion, M.; Urszula, H.-I. ISOLDE Yield

References
97
Database. https://oraweb.cern.ch/pls/isolde/query_tgt (accessed August 13, 2011).
46. Brady, G. S.; Clauser, H. R.; Vaccari, J. A. Materials handbook : an encyclopedia for
managers, technical professionals, purchasing and production managers, technicians,
supervisors, and foremen, 15th ed.; McGraw-Hill: New York, 2010; pp 540-541.
47. Lide, D. R., Ed. CRC Handbook of Chemestry and Physics, 84th ed.; CRC Press: New
York, 2003.
48. Samsonov, G. V., Ed. The Oxide Handbook, 2nd ed.; IFI/PLENUM: Kiev, 1982.
49. Rodriguez-Navarro, C.; Ruiz-Agudo, E.; Luque, A.; Rodriguez-Navarro, A. B.; Ortega-
Huertas, M. Thermal Decomposition of Calcite: Mechanisms of Formation and
Textural Evolution of CaO Nanocrystals. American Mineralogist 2009, 94 (4), 578-
593.
50. Singh, A.; Kamruddin, M.; Ajikumar, P. K.; Tyagi, A. K.; Raghunathan, V. S.; Raj, B.
Formation of Nanocrystalline Calcia by the Decomposition of Calcite. Journal of the
American Ceramic Society 2002, 85 (4), 927-932.
51. Dash, S.; Kamruddin, M.; Ajikumar, P. K.; Tyagi, A. K.; Raj, B. Nanorystalline and
Metastable Phase Formation in Vacuum Thermal Decomposition of Calcium
Carbonate. Thermochimica Acta 2000, 363 (1-2), 129-135.
52. Weast, R. C., Ed. CRC Handbook of Chemestry and Physics, 64th ed.; CRC Press:
New York, 1983.
53. Milne, C. R.; Silcox, G. D.; Pershing, D. W.; Kirchgessner, D. A. Calcination and
Sintering Models for Application to High-Temperature Short-Time Sulfation of
Calcium-Based Sorbents. Industrial & Engineering Chemistry Research 1990, 29, 139-
149.
54. Beruto, D.; Barco, L.; Seacy, A. W.; Spinolo, G. Characterization of the Porous CaO
Particles Formed by Decomposition of CaCO3 and Ca(OH)2 in Vacuum. Journal of the
American Ceramic Society 1980, 63 (7-8), 439-443.
55. Spinolo, G.; Anselmi-Tamburini, U. Mechanism of Low Temperature Calcite
Decomposition. Solid State Ionics 1989, 32/33, 413-419.
56. Glasson, D. R. Reactivity of Lime and Related Oxides. I. Production of Calcium
Oxide. Journal of Applied Chemistry 1958, 8, 793-797.

Effect of Calcium Oxide Microstructure on the Diffusion of Isotopes
98
57. Maciejewski, M.; Oswald, H. R. Morphological Observations on the Thermal
Decomposition of Calcium Carbonate. Thermochimica Acta 1985, 85, 39-42.
58. Beruto, D. T.; Searcy, A. W.; Kim, M. G. Microstructure, Kinetic, Thermodynamic
Analysis for Calcite Decomposition: Free-Surface and Powder Bed Experiments.
Thermochimica Acta 2004, 424, 99-109.
59. Criado, J. M.; Ortega, A. A Study of the Influence of Particle Size on the Thermal
Decomposition of CaCO3 by Means of Constant Rate Thermal Analysis.
Thermochimica Acta 1992, 195, 163-167.
60. Beruto, D.; Searcy, A. W. Use of the Langmuir Method for Kinetic Studies of
Decomposition Reactions: Calcite (CaCO3). Journal of the Chemical Society, Faraday
Transactions 1: Physical Chemistry in Condensed Phases 1974, 70 (0), 2145-2153.
61. Powell, E. K.; Searcy, A. W. Surface Areas and Morphologies of CaO Produced by
Decomposition of Large CaCO3 Crystals in Vacuum. Journal of the American Ceramic
Society 1982, 65 (3), C-42-C-44.
62. Beruto, D.; Barco, L. Rearrangement of Porous CaO Aggregates During Calcite
Decomposition in Vacuum. Journal of the American Ceramic Society 1983, 66 (12),
893-896.
63. Ewing, J.; Beruto, D. The Nature of CaO Produced by Calcite Powder Decomposition
in Vacuum and in CO2. Journal of the American Ceramic Society 1979, 62 (11-12),
580-584.
64. Towe, K. M. Ultrastructure of Calcite Decomposition in Vacuo. Nature 1978, 274,
239-240.
65. Beruto, D.; Barco, L.; Searcy, A. W. CO2-Catalyzed Surface Area and Porosity
Changes in High-Surface-Area CaO Aggregates. Journal of the American Ceramic
Society 1984, 67 (7), 512-516.
66. Beruto, D.; Searcy, A. W. Calcium Oxides of High Reactivity. Nature 1976, 263, 221-
222.
67. Glasson, D. R. Reactivity of Lime and Related Oxides. V. Crystal Changes in Hydrated
Lime at Different Temperatures. Journal of Applied Chemistry 1961, 11, 24-27.
68. Beruto, D.; Barco, L.; Belleri, G.; Searcy, A. W. Vapor-Phase Hydration of
References
99
Submicrometer CaO Particles. Journal of the American Ceramic Society 1981, 64 (2),
74-80.
69. Bhattacharya, T. K.; Ghosh, A.; Das, S. K. Densification of Reactive Lime from
Limestone. Ceramics International 2001, 27, 455-459.
70. Glasson, D. R. Reactivity of Lime and Related Oxides. VI. Crystal Changes in
Carbonated Lime at Different Temperatures. Journal of Applied Chemistry 1961, 11,
28-34.
71. Glasson, D. R. Reactivity of Lime and Related Oxides. IV. Carbonation of Lime.
Journal of Applied Chemistry 1960, 10, 42-48.
72. Chen, M.; Wang, N.; Yu, J.; Yamaguchi, A. Effect of Porosity on Carbonation and
Hydration Resiscance of CaO Materials. Journal of the European Ceramic Society
2007, 27, 1953-1959.
73. German, R. M.; Munir, Z. A. Surface Area Reduction During Isothermal Sintering.
Journal of the American Ceramic Society 1976, 59 (9-10), 379-383.
74. Borgwardt, R. H. Sintering of Nascent Calcium Oxide. Chemical Engineering Science
1989, 44 (1), 53-60.
75. Keyser, W. L.; Wollast, R.; Duvigneaud, P. H. The Sintering of Activated CaO.
Journal of Materials Science 1969, 4, 989-996.
76. Borgwardt, R. H. Calcium Oxide Sintering in Atmospheres Containing Water and
Carbon Dioxide. Industrial & Engineering Chemistry Research 1989, 28, 493-500.
77. Hammond, C. The Basics of Crystallography and Diffraction, 3rd ed.; Oxford
University Press: New York, 2009; pp 216-219, 256.
78. Pecharsky, V. K.; Zavalij, P. Y. Fundamentals of Powder Diffraction and Structural
Characterization; New York, 2005; pp 171-184.
79. Roque-Malherbe, R. M. A. Adsortion and Diffusion in Nanoporous Materials; CRC
Press: New York, 2007; pp 79-105.
80. German, R. M. A Measure of the Number of Particles in Agglomerates. The
International Journal of Powder Metallurgy 1996, 32 (4), 36-373.
81. Condon, J. B. Surface Area and Porosity Determinaion Measurments and Theory;
Elsevier: Amesterdan, 2006; pp 6-16.

Effect of Calcium Oxide Microstructure on the Diffusion of Isotopes
100
82. Chu, S. Y. F.; Ekström, L. P.; Firestone, R. B. The Lund/LBNL Data
Search. http://nucleardata.nuclear.lu.se/nucleardata/toi/index.asp (accessed August 13,
2011).
83. Glasson, D. R. Reactivity of Lime and Related Oxides. II. Sorption of Water Vapour
on Calcium Oxide. Journal of Applied Chemistry 1958, 8 (12), 798-803.
84. Lindner, R. Die Kinetik im Kalziumoxyd. Acta Chemica Scandinavica 1952, 6, 468-
474.
85. Gupta, Y. P.; Weirick, L. J. Self-diffusion of calcium in single crystal calcium oxide.
Journal of Physics and Chemestry of Solids 1967, 28, 811-821.
86. Fernandes, S.; Stora, T. Eurisol Task #3 Deliverable Report - D3 - Online Tests of a
High Power Al2O3 EURISOL Target Prototype; EURISOL TM03-25-2009-0016;
CERN: Geneva, 2009.
87. the ISOLDE Collaboration; Kugler, E.; Fiander, D.; Johnson, B.; Haas, H.; Przewloka,
A.; Ravn, H. L.; Simon, D. J.; Zimmer, K. The new CERN-ISOLDE on-line mass-
separator facility at the PS-Booster. Nuclear Instruments and Methods in Physics
Research Section B: Beam Interactions with Materials and Atoms 1992, 70 (1-4), 41-
49.

Effect of Calcium Oxide Microstructure on the Diffusion of Isotopes
101
Appendix
Table A-1 - Characteristics of the raw material (CaCO3) used at ISOLDE to produce past CaO targets in the past (CC2).
Present Phases* Calcite, Aragonite Impurities:*2 Avg. P. Size*2 14µm Sodium
Strontium Potassium Chlorine Barium Iron Lead Copper
0.2% 0.1% 0.01% 0.005% 0.005% 0.001% 0.0005% 0.0005%
SSA 0.33 m2/g 𝐆BET 7.64µm
Purity*2 99% * Determined by Powder X-Ray Diffraction *2 Merck® information


