Jicable'15 Welcome LectureJosias Matos de Araujo
Eletrobras
June, 2015

Regulatory framework in Brazil

Regulatory Framework in Brazil
3
Politics
Regulation
and
Supervision
Market
Institutional
Agents
National
Congress
Electricity Sector
Monitoring
Committee - CMSE
Brazilian Electricity
Regulatory Agency
ANEEL
National Council for Energy Policy - CNPE
Electric Energy
Trading Chamber
CCEE
National System
Operator - ONS
Energy Research
Company - EPE
President of the
Republic of Brazil
G
T
D
C
Ministry of Mines
and Energy - MME
EletrobrasPlayers
BNDES
and other
banks
State
Agencies
ANP, ANATEL
Consumers
Council
SNRH, MMA,
ANA, IBAMA
SDE, SEAD,
CADE

Brazilian Electricity Market
&
Generation, Transmission and
Distribution Overview

Population1:
201,901,000
Area:
8,514,876,599 km²
Network Energy Consumption2,3:
463,335 GWh
Energy Consumption per Capita1,2,3:
2,295 kWh/yr.
Average Energy Consumption:
64,003 aMW
Number of Consumers 4:
77,069,509
Residential Consumers 4 :
65,928,608
Average Monthly Energy Consumption:
516,1 kWh/mo.
Average Monthly Residential Energy Consumption :
163,0 kWh/mo.
Sources: 1 IBGE (Brazilian Institute of Geography and Statistics), 20132 Include self-produced energy3 EPE (Energy Research Company), 20134 ANEEL (Brazilian Electricity Regulatory Agency), 2014
Electric Energy Consumption Statistics in Brazil
5

Electric Energy Consumption by Sector
23,01%
31,03%15,65%
4,50%
8,30%
17,51%
463,335
GWh
Residential
Industry
Commercial
Rural
Other
Losses
Source: EPE (Energy Research Company), 20136

Brazilian Electric Energy Market Players
Source: CCEE (Electric Energy Trading Chamber), 20157
0
500
1000
1500
2000
2500
3000
Trader Independent
producer
Generator Special
consumer
Free
consumer
Self-producer Distributor Total Players
2,222
2,5792,715
2012 2013 2014

Generation in Brazil
- Actual Status and Prospects -

National Installed Capacity (GW), 1974-2014
41
58
91
134
0
20
40
60
80
100
120
140
1974 1979 1984 1989 1994 1999 2004 2009 2014
Source: National Energy Balance (BEN 2014), EPE9

Energy Generation: How the installed capacity is shared by type source? 1974 --
2014
0%
10%
20%
30%
40%
50%
60%
70%
80%
90%
100%
1974 1979 1984 1989 1994 1999 2004 2009 2014
Hydroelectric Termoelectric Eolic Nuclear Solar (< 0.01%)
Source: National Energy Balance (BEN 2014), EPE10
WindThermoeletric

National Installed Capacity (MW)
89,193
37,827
4,888
1,990
Hydroelectric
Termoelectric
Eolic
Nuclear
Solar (15 MW)
133,913
MW
Source: National Energy Balance (BEN 2014), EPE11
Wind
1st. Bid of solar (2014) : 890 MW contracted

Evolution of Brazilian Installed Capacity by Geographic Region (GW)
Source: PDE 2023 (Ten-year Energy Expansion Plan 2023), EPE
+57%
12
N
NE
S
SE & CW+20%
+210%
+31%
+107%
70 84
14 45
18 38
20 27
2
0
2
3
2
0
1
3124 195

Hydro
82,620
Import
6,032
SHP
5,538
Wind
5,452
Biomass
10,684
Solar
0
Others
21,674
Evolution of Renewable Energy Generation (MW)
Source: PDE 2023 (Ten-year Energy Expansion Plan 2023), EPE
Hydro
112,178
Import
4,716
SHP
7,319
Wind
22,439
Biomass
13,983
Solar
3,500
Others
47,241
2013
2023
13
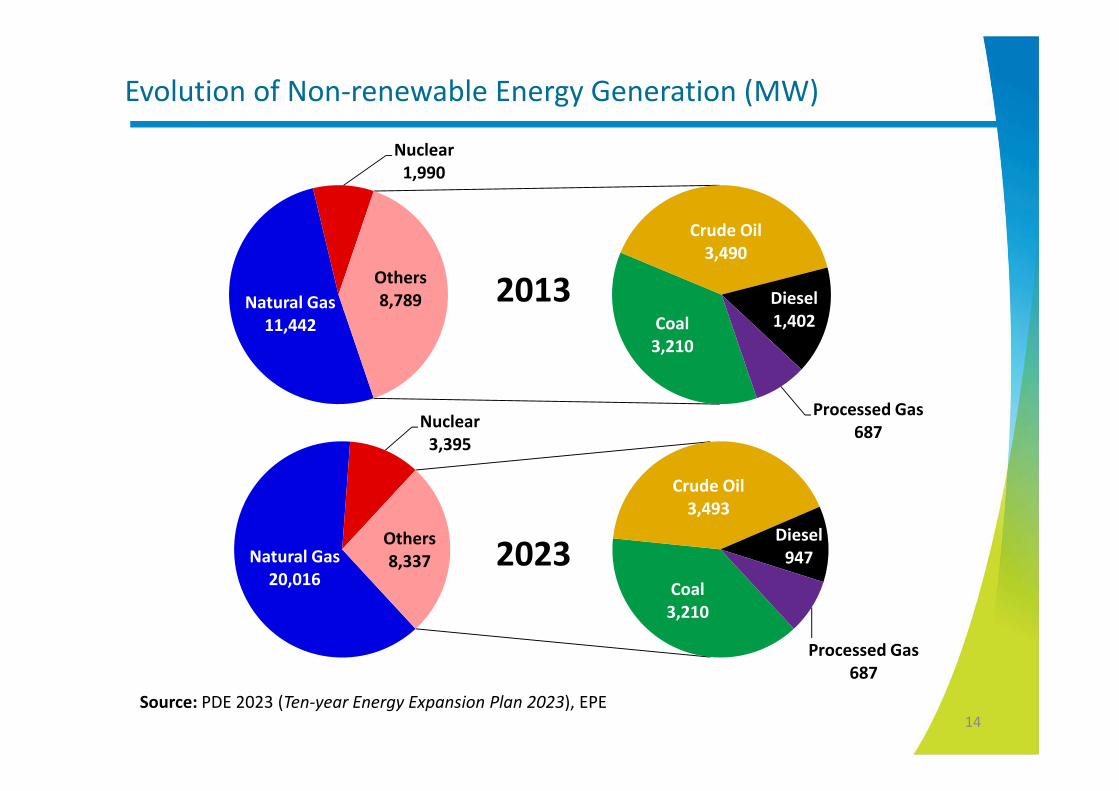
Natural Gas
20,016
Nuclear
3,395
Coal
3,210
Crude Oil
3,493
Diesel
947
Processed Gas
687
Others
8,337
Evolution of Non-renewable Energy Generation (MW)
Source: PDE 2023 (Ten-year Energy Expansion Plan 2023), EPE
2013
2023
14
Natural Gas
11,442
Nuclear
1,990
Coal
3,210
Crude Oil
3,490
Diesel
1,402
Processed Gas
687
Others
8,789

Transmission in Brazil
- Current Status and Prospects -

Interconnected National System - SIN
99% Integrated1% Isolated
Source: MME (Ministry of Mines and Energy), 201416

0
20
40
60
80
100
120
140
1989 1994 1999 2004 2009 2014
230 kV 345 kV 440 kV 500 kV ±600 kV 750 kV
Transmission Lines (Thousand km), 1989-2014
Source: National Energy Balance (BEN 2014), EPE17

52,680
10,303
6,728
40,649
12,816
2,683
230 kV
345 kV
440 kV
500 kV
±600 kV
750 kV
Source: Electrical System Monitoring Bulletin, CMSE, 2014
Transmission Lines (km)
18
125,859
km
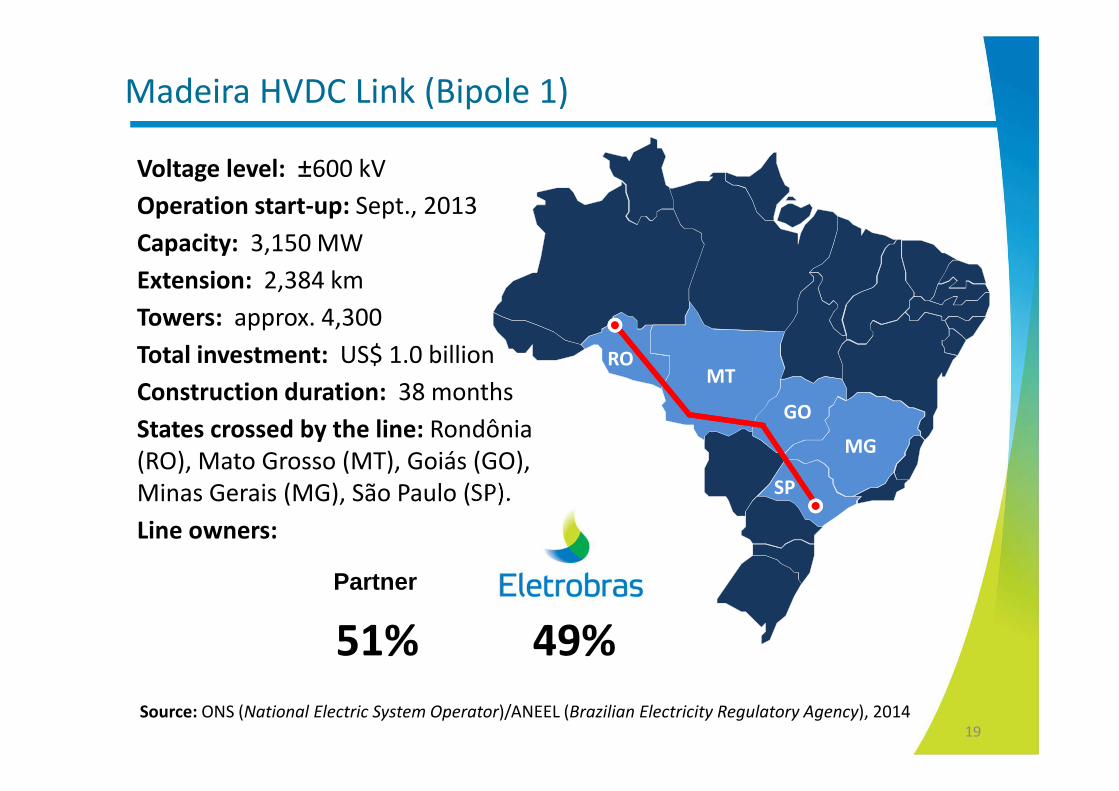
Madeira HVDC Link (Bipole 1)
Voltage level: ±600 kV
Operation start-up: Sept., 2013
Capacity: 3,150 MW
Extension: 2,384 km
Towers: approx. 4,300
Total investment: US$ 1.0 billion
Construction duration: 38 months
States crossed by the line: Rondônia
(RO), Mato Grosso (MT), Goiás (GO),
Minas Gerais (MG), São Paulo (SP).
Line owners:
ROMT
GO
SP
MG
51% 49%
Source: ONS (National Electric System Operator)/ANEEL (Brazilian Electricity Regulatory Agency), 201419
Partner

Madeira HVDC Link (Bipole 1)
Source: Internet20

Madeira HVDC Link (Bipole 2)
Voltage level: ±600 kV
Operation start-up: 2015 (prevision)
Capacity: 3,150 MW
Extension: 2,412 km
Towers: approx. 4,300
Total investment: US$ 973 million
Construction duration: 50 months
States crossed by the line: Rondônia
(RO), Mato Grosso (MT), Goiás (GO),
Minas Gerais (MG), São Paulo (SP).
Line owners:
ROMT
GO
SP
MG
51% 49%
Source: ONS (National Electric System Operator)/ANEEL (Brazilian Electricity Regulatory Agency), 2014 21
Partner

Belo Monte UHVDC Link (Bipole 1)
PA
TO
GOMG
Voltage level: ±800 kV
Under construction
Capacity: 4,000 MW
Extension: 2,096 km
Towers: approx. 4,500
Total investment: US$ 1.67 billion
Construction duration: 46 months
States crossed by the line: Pará (PA),
Tocantis (TO), Goiás (GO), Minas
Gerais (MG).
Line owners:
51% 49%Source: ANEEL (Brazilian Electricity Regulatory Agency), 2014
22
Partner

Belo Monte UHVDC Link (Bipole 2)
PA
TO
GOMG
Voltage level: ±800 kV
Capacity: 3,850 MW
Extension: 2,518 km
Total investment: US$ 2.58
billion
Prevision for commercial
operation: September, 2020.
States crossed by the line: Pará
(PA), Tocantis (TO), Goiás (GO),
Minas Gerais (MG), Rio de
Janeiro (RJ).
Line owners:
Source: ANEEL (Brazilian Electricity Regulatory Agency), 201423
RJ

Evolution of Transmission Lines (km)
Source: PDE 2023 (Ten-year Energy Expansion Plan 2023), EPE24
63.48%
0
50000
100000
150000
200000
250000
300000
230 kV 345 kV 440 kV 500 kV ±600 kV ±800 kV Total
49,897
10,2726,728
39,083
3,996
109,976
68,656
11,9186,922
76,408
6,371 9,518
179,793
Existing in 2013 in 2023

Transmission Line Investments from 2013-2023
Source: PDE 2023 (Ten-year Energy Expansion Plan 2023), EPE. 25
15%
4%
65%
1%
3%
12%
±800 kV ±600 kV 500 kV 440 kV 345 kV 230 kV
US$ 16.71
Billion

Substations Investments from 2013-2023
Source: PDE 2023 (Ten-year Energy Expansion Plan 2023), EPE. 26
24%
3%
46%
2%
7%
18%
±800 kV ±600 kV 500 kV 440 kV 345 kV 230 kV
US$ 9.47
Billion
2023
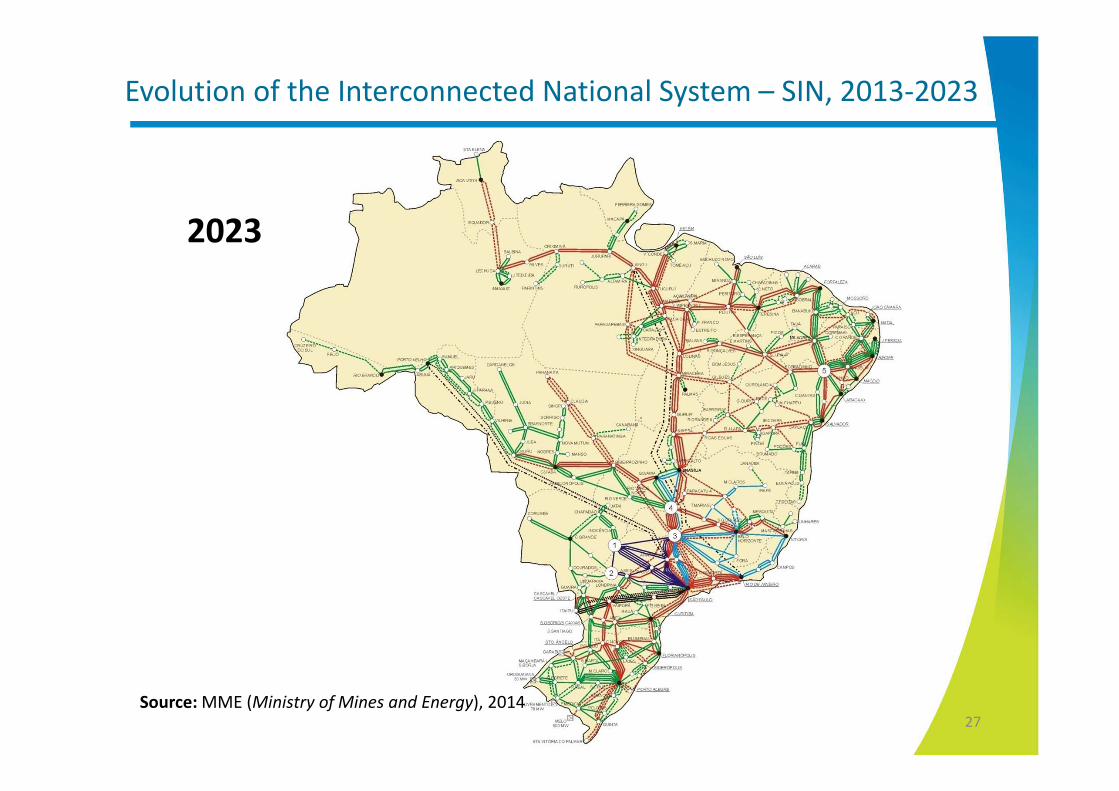
Evolution of the Interconnected National System – SIN, 2013-2023
Source: MME (Ministry of Mines and Energy), 201427
Distribution in Brazil
- Current Status and Prospects -

Distribution Utilities in Brazil
Source: ABRADEE, 2014 29

Distribution Utilities in Brazil
Source: ABRADEE, ANEEL and companies sites, 201430
Total Consumers 77.1 Million
Residential Consumers 65.9 Million
Nº of new consumers/Year 2.9 Million
Distribution lines (km) More than 3.1 Million
Undergrounded transmission lines (km) Almost 13,000
Gross Revenues US$ 56.7 Billion
Annual investments US$ 3.85 Billion
Market (free + captive) 432 mil GWh (343 captive)

Underground Distribution Systems Installed in Brazil
Source: ANEEL, 201431
Jardim dos Namorados System – Salvador (BA)
Ibirapuera Park – São Paulo (SP)
Porto Maravilha Region – Rio de Janeiro (RJ)Before After
Downtown Zone – Belo Horizonte (MG)

Energy Integration in South America

Source: MME (Ministry of Mines and Energy), 201533
Electric Energy
Natural Gas
Energy import/export

A brief overview of the
Eletrobras System

(100.00%)
(94.26%)
(100.00%)
SPEs
G 7
T 9
∑ 16
Belo Monte
Rouar S.A.
Centrales Hidroeléctricas de Nicaragua
– CHN
(100.00%)
(83.71%)(99.91%)
(99.99%)
(50,00%)
(99.56%)
(99.58%)
(99.47%)
(99.88%)
SPEs
G 43
T 10
∑ 53
SPEs
G 59
T 18
∑ 77
SPEs
G 10
T 10
∑ 20
Minorities
G, T and D 26
Binational Generation
Shareholdings Abroad
Inambari Geração de Energia S.A. –
IGESA
(50.00%)
(50.00%)
(29.40%)
(15.00%)
(49.00%)
Generation and Transmission Generation
(100.00%)
(100.00%)
(100.00%)
DistributorsShareholdings
Mangue Seco 2 Eolic
Eletrobras System
(50,93%)
Research Center
35

Eletrobras System
36
33.0%
48.4%Transmission Lines
125,858 km
Generation (Installed capacity)
133,918 MW
BRAZILBRAZIL
Source: Eletrobras Anual Report 2014
*>=230 KV (including partnerships)
Eletrobras
System
Transmission
lines (Total length
- km) (*)
Generation
(Installed capacity
- MW)
Furnas 19,907 8,829
Chesf 19,692 10,616
Eletronorte 10,703 9,476
Eletrosul 11,140 428
Itaipu - 7,000
CGTEE - 840
Eletronuclear - 1,990
Eletrobras - 13
Amazonas En. 701 2,083
CERON - 3
Partnership 5,440 2,891
Total 67,582 44,156
85%
5%
1% 9%
Hydro
Nuclear
Solar+Wind
Fuel
Eletronuclear
Holding
Furnas
Eletronorte
Eletrosul
Chesf
Amazonas Energia
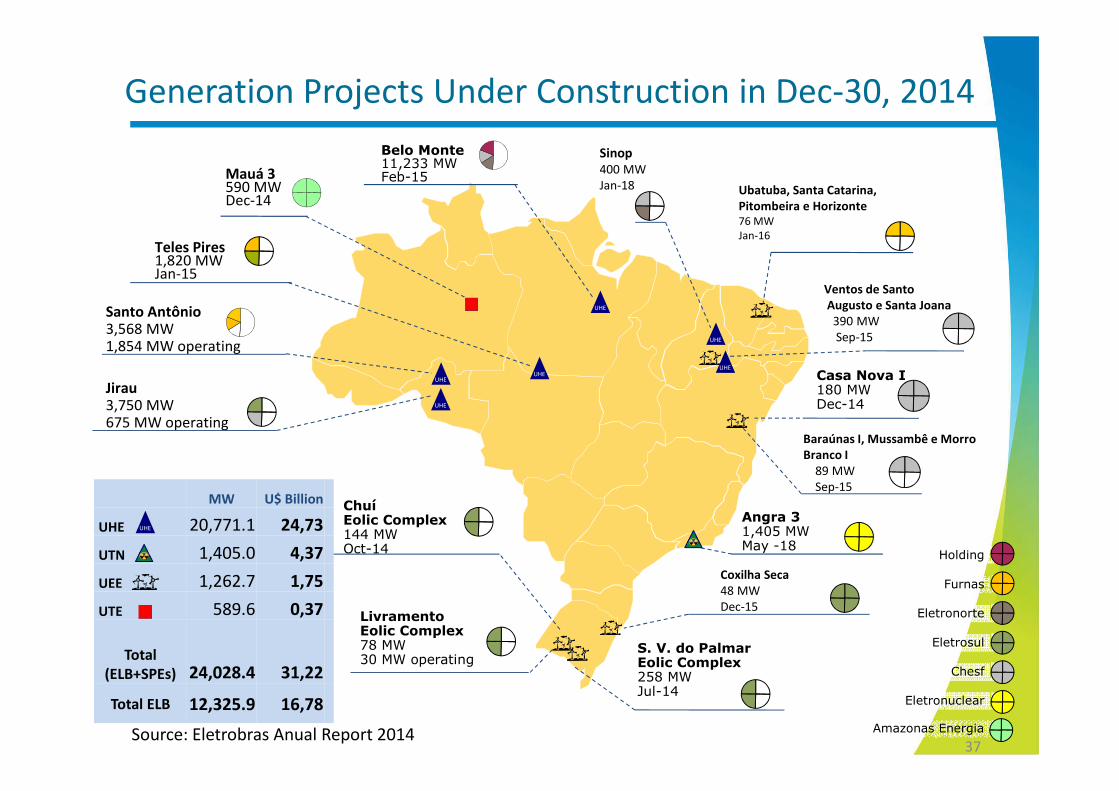
MW U$ Billion
UHE 20,771.1 24,73
UTN 1,405.0 4,37
UEE 1,262.7 1,75
UTE 589.6 0,37
Total
(ELB+SPEs) 24,028.4 31,22
Total ELB 12,325.9 16,78
Belo Monte11,233 MWFeb-15
Santo Antônio3,568 MW1,854 MW operating
Jirau3,750 MW675 MW operating
Teles Pires1,820 MWJan-15
Mauá 3590 MWDec-14
Angra 31,405 MWMay -18
LivramentoEolic Complex78 MW30 MW operating
Casa Nova I180 MWDec-14
UHE
S. V. do PalmarEolic Complex258 MWJul-14
ChuíEolic Complex144 MWOct-14
Ubatuba, Santa Catarina,
Pitombeira e Horizonte76 MW
Jan-16
Sinop400 MW
Jan-18
Ventos de Santo
Augusto e Santa Joana
390 MW
Sep-15
Coxilha Seca
48 MW
Dec-15
Baraúnas I, Mussambê e Morro
Branco I
89 MW
Sep-15
UHE
UHE
UHE
UHE
UHE
UHE
Generation Projects Under Construction in Dec-30, 2014
37Source: Eletrobras Anual Report 2014

BRA
ARG
RR
AC
PA
ROMT
MS
CE
TO
GO
MG
BA
SP
PR
SC
RJ
ES
SE
RN
PB
PEAL
DF
1 Project
220 MW
AP
1 Project
350 MW
7 Projects14,450.6 MW
2 Projects596 MW
6 Projects
1,412.2 MW
3 Projects
1,479 MW
5 Projects
483 MW
2 Projects
2,200 MW
Main Projects (Values in US$)
S. Luiz do Tapajós PA 8,040 MW 9,56 Bi
Jatobá PA 2,338 MW 3,39 Bi
Marabá PA 1,850 MW 4,16 Bi
Serra Quebrada MA/TO 1,328 MW 1,31 Bi
Garabi BRA/ARG 1,152 MW 1,54 Bi
Panambi BRA/ARG 1,048 MW 1,41 Bi
Total - 15,756 MW 21,38 Bi
Studies and Projects
Power
Units
Installed
Capacity (MW)
US$
Bi
Basic Project 04 327.6 0,27
Feasibility Study 24 21,659.6 27,58
Inventory Study 01 270
Total 29 22,257.2 27,85
1 Project
270 MW
AMMA
1 Project
796.4 MW
Basics Studies and Projects – Generation
38
Source: Eletrobras Anual Report 2014

Full
ParticipationPartnership Total
Investment:
US$ 3.52
billion, being
US$ 771
million in full
participation
2,784 km - 32
projects LTs +
SEs associated
8,247 Km - 23
projects LTs +
SEs associated
being 4,013.3
km owned by
ELB
11,031 km
8,360 MVA
14,884 MVA
being 7,237.5
MVA owned by
ELB
23,244
MVA
LTs Eletrobras System
LTs Eletrobras System with Partnership
LTs Other Companies
Existent Future
Main Transmission Lines Projects under construction
Paraná River Complex
Paranapanema River Complex
Grande River Complex
Paranaíba River Complex
Paulo Afonso Complex5
4
3
2
1
39Source: Eletrobras Anual Report 2014

468,685
km
6,658,008
Distribution – Eletrobras System
40
700
Cities attended
Source: Eletrobras Anual Report 2014
4%
15%
13%
17%9%
1%
41%
3%15%
9%
32%7%
0%
34%
4%9%
9%
18%
12%1%
47%
Transmission Lines Consumers

Electric Inclusion with Insulated
Cables in Brazil
42
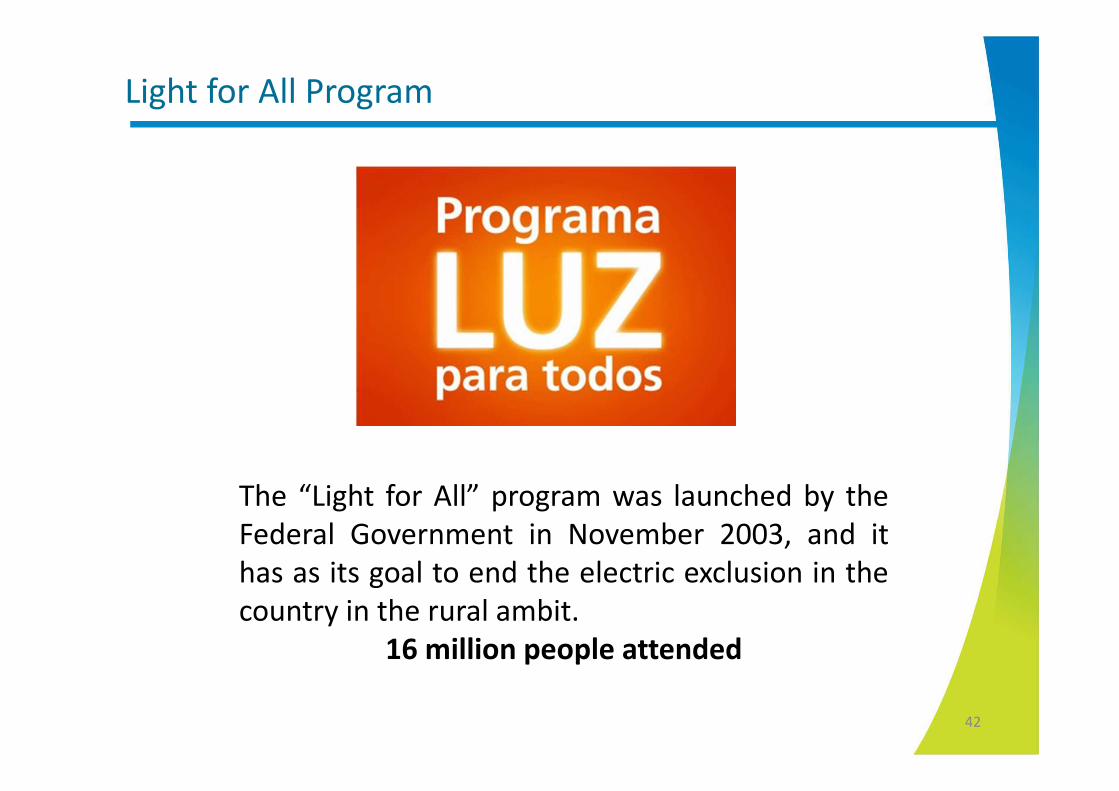
Light for All Program
The “Light for All” program was launched by the
Federal Government in November 2003, and it
has as its goal to end the electric exclusion in the
country in the rural ambit.
16 million people attended
43
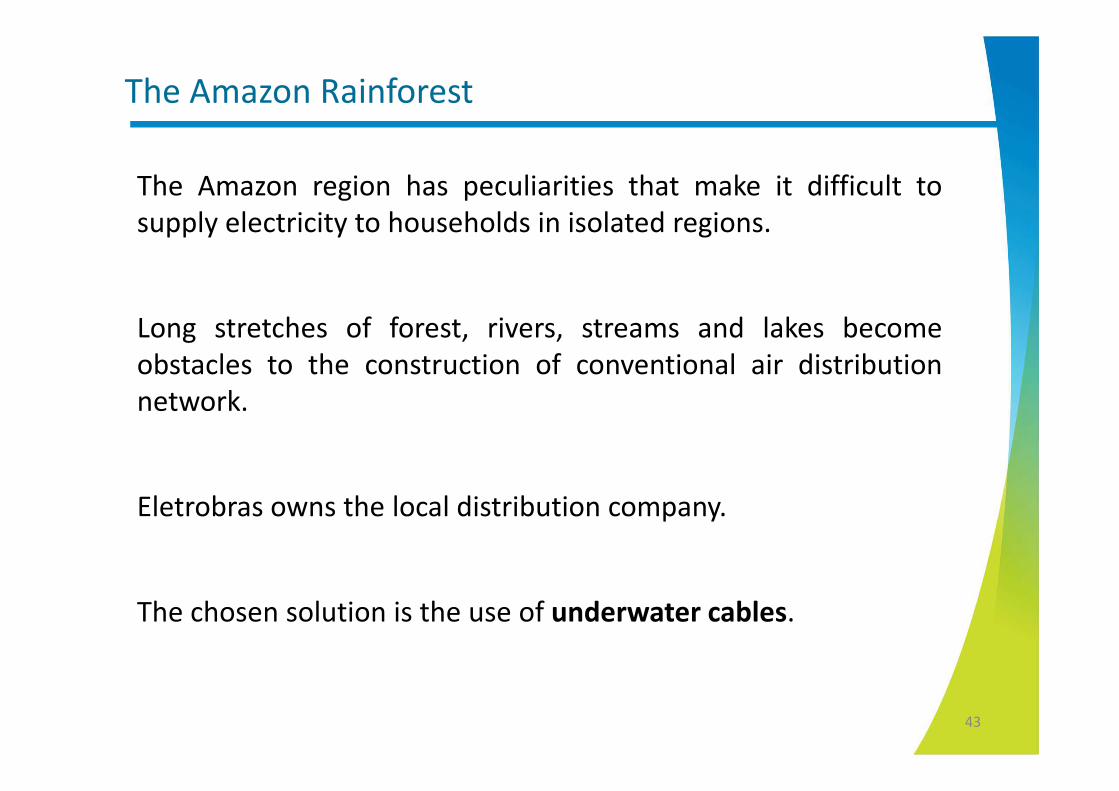
The Amazon Rainforest
The Amazon region has peculiarities that make it difficult to
supply electricity to households in isolated regions.
Long stretches of forest, rivers, streams and lakes become
obstacles to the construction of conventional air distribution
network.
Eletrobras owns the local distribution company.
The chosen solution is the use of underwater cables.

Underwater cable from Manacapuru to St. Afonso Island

Underwater cable from Manacapuru to St. Afonso Island
46
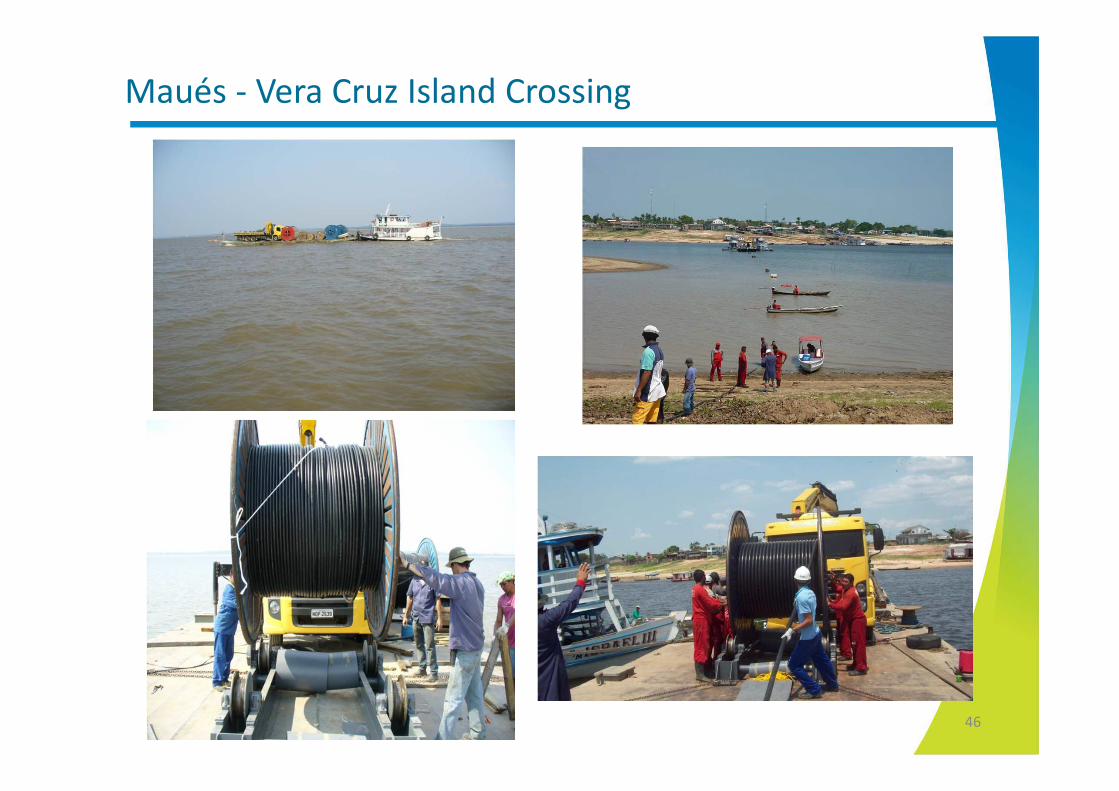
Maués - Vera Cruz Island Crossing

47
Maués - Vera Cruz Island Crossing
3,447.86 meters
48
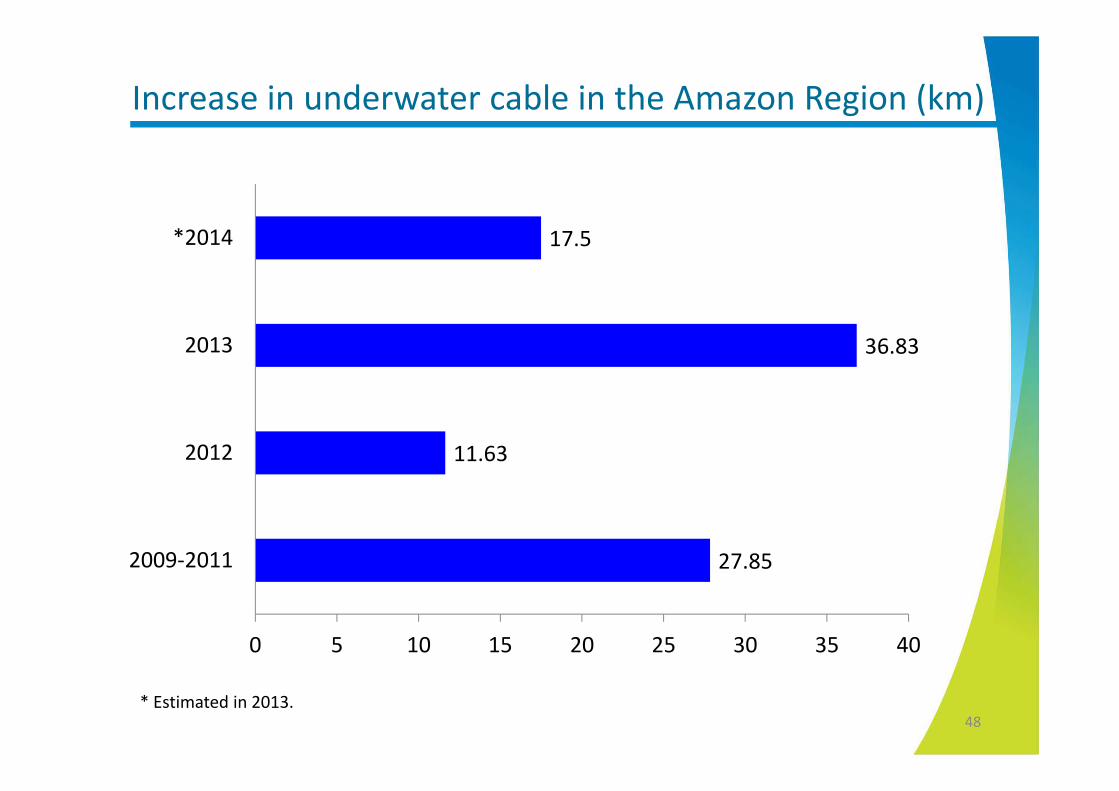
Increase in underwater cable in the Amazon Region (km)
27.85
11.63
36.83
17.5
0 5 10 15 20 25 30 35 40
2009-2011
2012
2013
*2014
* Estimated in 2013.

49
Light for All underwater cables statistics in the Amazon region(*)
67 total crossings.
69 km of underwater cables.
31 cities crossed.
10,300 households served.
51,500 people served.
4.53 km is the largest river crossing located at Andirá r iver.
(*) Data between 2009-2013.

Some of the people who are now
served…


Challenges

• Huge investments in electrical infrastructure expansion in Brazil;
• Great business opportunities for generation, transmission and distributioncompanies from now by 2023;
– Almost 6,000 km new transmission lines every year;
– Almost 5,000 MW new generation every year;
– Almost 2.9 million new consumers every year.
• Increase use of underground cables in crowded cities;
• Integrate new small plants (distributed generation) in the existent networks;
• Improve smart grids actions in distribution network;
• Promote regional integration with Latin America countries;
Challenges
55

• Increasing and maintaining a clean generation matrix in Brazil
• Stimulate a consistent environmental protection in new power plants andtransmission lines
• Work in towards a sustainable company
• Act to reduce emission level of tons of CO2 every year
Challenges
56