density, occupancy, and detectability of lowland tapirs...
TRANSCRIPT

114
© 2017 American Society of Mammalogists, www.mammalogy.org
Density, occupancy, and detectability of lowland tapirs, Tapirus terrestris, in Vale Natural Reserve, southeastern Brazil
Átilla C. Ferreguetti,* WalFrido M. toMÁs, and Helena g. Bergallo
Department of Ecology, Rio de Janeiro State University, Rua São Francisco Xavier, nº 524, Pavilhão Haroldo Lisboa da Cunha, 2º andar, sala 224. Bairro Maracanã, Rio de Janeiro, RJ CEP 20550-019, Brazil (ACF, HGB)Wildlife Laboratory, Embrapa Pantanal, Rua 21 de Setembro, n° 1.880, Bairro Nossa Senhora de Fátima, Corumbá, Mato Grosso do Sul, CEP 79320-900, Brazil (WMT)
* Correspondent: [email protected]
The lowland tapir (Tapirus terrestris, Linnaeus 1758) is one of the surviving members of the Neotropical megafauna. In Brazil, lowland tapirs are considered vulnerable according to the IUCN Red List of Threatened Species and endangered within the Atlantic Rain Forest biome. We aimed to provide the 1st estimates of density and population size for T. terrestris for Vale Natural Reserve (VNR). We predicted the relationships of 6 covariates to habitat occupancy. Density was estimated by the use of distance-sampling techniques, while occupancy, detectability, and activity patterns were assessed with camera-trap monitoring at 39 sample sites over a 1-year period. Density for T. terrestris was 0.8 ± 0.2 lowland tapirs/km2 and population size was 200 ± 33 individuals. Occupancy probability was described by 2 covariates (density of palm trees and distance to water resources) and detectability by those same 2 covariates plus 2 more (distance to road and density of poaching). The species showed the 3 highest peaks of activity at 1900, 2300, and 0400 h. We concluded that VNR still harbors a viable population of lowland tapirs. However, anthropic impacts in the reserve such as poaching and road kills could already be directly affecting the lowland tapir population and producing indirect effects for the whole ecosystem. Results presented herein can be a starting point to support future work in the region and to make predictions regarding the ecosystem relationships, management, and conservation of lowland tapirs.
A anta brasileira (Tapirus terrestris, Linnaeus 1758) é considerada uma das espécies sobreviventes da megafauna neotropical. No Brasil, a anta é considerada vulnerável de acordo com a lista vermelha de espécies ameaçadas da IUCN e considerada em perigo para o bioma da Mata Atlântica. Nosso objetivo foi fornecer as primeiras estimativas de densidade e tamanho populacional de T. terrestris para a Reserva Natural Vale (RNV). Além disso, nós testamos o efeito de 6 covariadas para modelar ocupação do habitat. Estimamos a densidade e o tamanho populacional com a técnica de amostragem de distância por transecção linear. A detectabilidade, ocupação e período de atividade foram estimados com o uso de armadilhas fotográficas em 39 sítios amostrais por um período de 1 ano. Estimamos uma densidade de 0,8 ± 0,2 antas/km2 e um tamanho populacional de 200 ± 33 indivíduos. A probabilidade de ocupação foi representada por 2 covariadas (i.e. densidade de palmeiras e distância do recurso hídrico), e a detectabilidade pelas mesmas covariadas anteriores com a adição de outras 2 (i.e. distância da rodovia e densidade de caça). A população presente na RNV apresentou 3 picos de atividade, às 19:00, 23:00, e 04:00 horas. Nós concluímos que a RNV ainda pode apresentar uma população viável de anta. Porém, os impactos antrópicos presentes na reserva (como a caça ilegal e morte por atropelamentos) podem já estar diretamente afetando a população de anta e produzindo um efeito indireto em todo o ecossistema. Os resultados aqui apresentados podem ser o ponto inicial para o desenvolvimento de futuros estudos na região e também para predições sobre medidas de manejo e conservação da anta e de todo o ecossistema.
Key words: camera trap, distance sampling, poaching, road impact, Tapirus terrestris
Journal of Mammalogy, 98(1):114–123, 2017DOI:10.1093/jmammal/gyw118
Downloaded from https://academic.oup.com/jmammal/article-abstract/98/1/114/2977226/Density-occupancy-and-detectability-of-lowlandby University of Texas at Austin useron 04 September 2017

FERREGUETTI ET AL.—ECOLOGY OF LOWLAND TAPIRS 115
Data on how species use the habitat are necessary for under-standing the ecology of each species, including spatial and tem-poral distributions (Gentile and Cerqueira 1995; Phillips et al. 2004), and are fundamental for management and conservation measures (Caughley 1994; Otis 1997). Each animal species is associated in different ways with structural features of their habitat (Downes et al. 1998; Tews et al. 2004); for example, the density of palms (Beck and Terbogh 2002), the presence of water resources (Goulart et al. 2009), and also elements that can be avoided by a species, for example, poaching and dis-tance to the forest edge (Ferreguetti et al. 2015, 2016). Thus, understanding which factors determine the presence of a spe-cies in a biome as threatened as the Atlantic Rain Forest biome contributes to the development of conservation measures to ensure their survival in such areas (Jones 2001).
Lowland tapirs (Tapirus terrestris, Linnaeus 1758) are a sur-viving member of the Neotropical megafauna (Emmons and Feer 1997; Hansen and Galetti 2009; De Thoisy et al. 2010) and are distributed throughout South America, except in Chile and Uruguay (Naveda et al. 2008). In Brazil, the lowland tapir is considered vulnerable according to the IUCN Red List of Threatened Species and considered endangered in the Atlantic Rain Forest biome (Naveda et al. 2008). The lowland tapir is considered the largest terrestrial mammal occurring in Brazil, with low reproductive potential, a long gestation period, and a large home range (Eisenberg and Redford 1999). These biolog-ical aspects result in low densities (Medici 2010) and make the species relatively vulnerable to local extinctions due to demo-graphic and environmental variations, and losses of genetic diversity (Medici et al. 2007).
The lowland tapir is still hunted for protein in most of its dis-tribution, which represents a major threat to the species (Cullen et al. 2000; Naveda et al. 2008; Medici 2010). Studies have shown that lowland tapirs select habitat according to 2 main factors: food availability (e.g., species of palms) and water resources (Salas and Fuller 1996; Foerster and Vaughan 2002; Naranjo 2009; Medici 2010). Lowland tapirs have a home range of 1.1–14.2 km2 (Medici 2011) and concentrate most of their activity in habitat patches (Tobler 2008; Medici 2010). Lowland tapirs have a low fertility rate, with a single offspring resulting after a gestation period of 13–14 months (Barongi 1993). Because of these characteristics, lowland tapirs have low abundances and are very susceptible to loss and fragmenta-tion of habitat, poaching, road kills, and diseases transmitted by domestic animals (Naveda et al. 2008).
Although there are good data and information available on low-land tapirs, some basic knowledge still is lacking in much of its distribution. Diet, spatial and temporal distribution, intraspecific interactions, population demography, reproductive parameters, and even up-to-date presence/absence data are lacking for many localities. These very basic pieces of information are crucial for modeling the current status, viability, and risk of extinction for lowland tapir populations, as well as predicting the effects of cli-mate change and other future scenarios. Good spatial informa-tion related to lowland tapirs and their habitats is essential for the development of these models (García et al. 2012).
To aid in the conservation of lowland tapirs, our study aimed to provide the 1st estimates of density of the species for the Vale Natural Reserve (VNR), located in the Atlantic Rain Forest biome of Brazil. By using occupancy and detectability modeling, we were able to model the spatial distribution of the species, from which we predicted the direction of response of 6 covariates based on prior knowledge of lowland tapir ecology (Eisenberg and Redford 1999; De Thoisy et al. 2010; Medici 2011; García et al. 2012). A priori, we expected that the covari-ates measured should represent key habitat features for the spe-cies (i.e., density of palms, distance to water resources, and tree density) or elements possibly avoided by the species (i.e., dis-tance to road, distance to forest edge, and poaching). We tested the hypothesis that occupancy probability would be higher in sites with higher density of palms, higher density of other trees, and closeness to water resources. We also hypothesized that detectability would be higher in sites with less influence of poaching and greater distance from roads and forest edges.
Materials and Methods
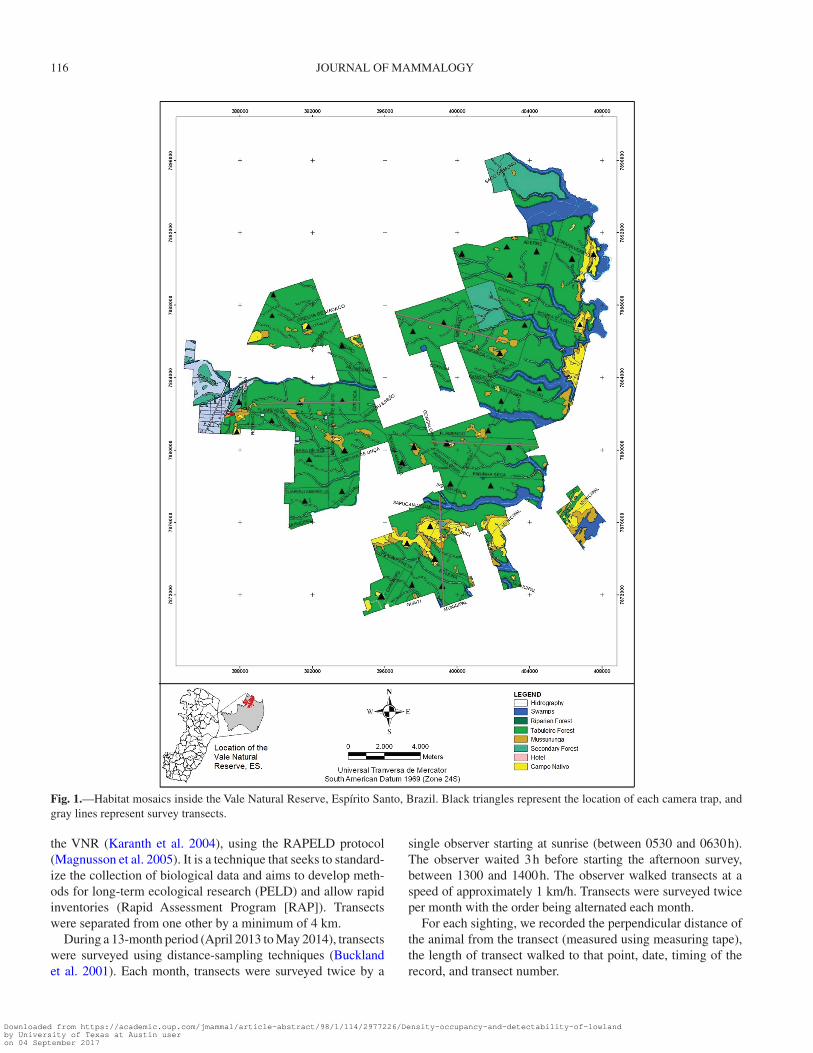
Study area.—This study was conducted in the VNR, a pro-tected area of 235 km2 belonging to the Vale Company. The reserve is located in the neighboring municipalities of Linhares and Jaguaré (19°06′–19°18′ S and 39°45′–40°19′ W), in north-eastern Espírito Santo, Brazil (Fig. 1).
The VNR was established through a gradual process of land acquisition, which started in 1955, when Vale bought its 1st properties in the region, and reached its current extent in 1973. The reserve is composed of 1 main block of forest (approximately 98.1% of the total area), and a much smaller fragment, known as Biribas Reserve, to the southwest of the main block.
According to the Brazil Vegetation Map (IBGE 1993), the VNR is included within the Atlantic Rain Forest biome, com-posed of a mosaic of habitats with 4 main vegetation types (adapted from Jesus 1987; Peixoto and Gentry 1990): “tabu-leiro” forest (coastal plain forest), riparian forest, “mussu-nunga” forest, and natural grassland. The evergreen tabuleiro forest has 2 or more upper strata and high densities of lianas and epiphytes and covers approximately 68% of the total area of the reserve. The riparian forest, which covers some 4% of the reserve, is a mixed type of vegetation associated with streams, characterized by widely spaced trees and a predominance of palms. The mussununga forest (covering approximately 8% of the VNR) is a type of woody vegetation on sandy soils, physi-ognomically similar to the tabuleiro forest at an early or inter-mediate stage of regeneration. The natural grasslands occur as enclaves within the forest, which were once the sites of ponds in the geological past, and cover ca. 6% of the area of the reserve. In addition to these vegetation types, approximately 8% of the reserve is covered by wetlands (swamps) and streams (Fig. 1). The remaining 6% is composed of administrative structures of the reserve.
Line transect surveys.—To estimate density and abundance of T. terrestris, we established four 5-km long line transects in
Downloaded from https://academic.oup.com/jmammal/article-abstract/98/1/114/2977226/Density-occupancy-and-detectability-of-lowlandby University of Texas at Austin useron 04 September 2017
116 JOURNAL OF MAMMALOGY
the VNR (Karanth et al. 2004), using the RAPELD protocol (Magnusson et al. 2005). It is a technique that seeks to standard-ize the collection of biological data and aims to develop meth-ods for long-term ecological research (PELD) and allow rapid inventories (Rapid Assessment Program [RAP]). Transects were separated from one other by a minimum of 4 km.
During a 13-month period (April 2013 to May 2014), transects were surveyed using distance-sampling techniques (Buckland et al. 2001). Each month, transects were surveyed twice by a
single observer starting at sunrise (between 0530 and 0630 h). The observer waited 3 h before starting the afternoon survey, between 1300 and 1400 h. The observer walked transects at a speed of approximately 1 km/h. Transects were surveyed twice per month with the order being alternated each month.
For each sighting, we recorded the perpendicular distance of the animal from the transect (measured using measuring tape), the length of transect walked to that point, date, timing of the record, and transect number.
Fig. 1.—Habitat mosaics inside the Vale Natural Reserve, Espírito Santo, Brazil. Black triangles represent the location of each camera trap, and gray lines represent survey transects.
Downloaded from https://academic.oup.com/jmammal/article-abstract/98/1/114/2977226/Density-occupancy-and-detectability-of-lowlandby University of Texas at Austin useron 04 September 2017

FERREGUETTI ET AL.—ECOLOGY OF LOWLAND TAPIRS 117
Camera trapping.—We selected 39 sampling sites using a systematic random design stratified by vegetation type to ensure that all 4 of the principal vegetation types found in the VNR were represented (i.e., tabuleiro, riparian, and mussununga forests, and natural grassland). This scheme was designed to model occupancy probability of the VNR by the lowland tapir, as well as document its activity pattern (Fig. 1). We placed a random grid over a digital map of the reserve and identified the sampling points by selecting grid cells.
First, in each selected grid cell, we located randomly 1 cam-era trap per grid cell. We did not use bait to attract lowland tapirs. This approach resulted in a relatively even distribution of points within the VNR, while maintaining independence among points, which were separated from one another by a distance of more than 1 km (Magnusson et al. 2005; Ancrenaz et al. 2012). At each site, we installed 1 passive infrared Bushnell camera trap (Bushnell Outdoor Products, Overland Park, Kansas) in picture function, approximately 40–50 cm above the ground, for continuous surveying throughout the study (from May 2013 to June 2014). All stations were examined every 20–25 days to change batteries, when necessary. Traps were programmed to operate for 24 h/day.
Covariates.—We used 6 covariates to model occupancy probability of the lowland tapir. These were distance to forest edge (edge_distance), density of trees (with a diameter at breast height [DBH] of more than 50 cm, tree_density), distance to water (water_distance), density of palms (palm_density), and distance to road (road_distance). The potential effect of poach-ing (poaching) on detectability and occupancy also was ana-lyzed. A priori, these covariates were selected to represent key habitat features (palm_density, tree_density, water_distance) or elements possibly avoided by lowland tapirs (road_distance, edge_distance).
At each sampling point, we established 4 plots (30 × 50 m) arranged by the cardinal compass points (north, south, east, and west). In each plot, we measured the DBH of each tree and counted the number of large trees (DBH > 50 cm). In these plots, we also counted the number of individuals of each spe-cies of palms.
Three spatial covariates—distance to forest edge, water resource, and main road—were quantified for each of the 39 sample sites using ArcGIS software (ESRI*ArcMap 10.1, Redlands, California—ESRI 2011).
Density of poaching within the study area was calculated using the georeferenced database of a 10-year period in which poaching events were recorded by the reserve’s security guards (source: VNR). The density of poaching (records per km2) was calculated for each grid cell in which a camera trap had been installed by dividing the number of records by the grid cell area.
Data analysis.—Density and population size were esti-mated by total number of individuals observed along each trail through the program DISTANCE 6.2 (Buckland et al. 2001). DISTANCE uses the perpendicular distances (animal-track) to estimate effective strip width (ESW) in the study area and model the detection function that best suits the probability
of detection of an animal at a given distance from the track (Laake et al. 1994; Buckland et al. 2001). The best detec-tion model was selected by the Akaike Information Criterion (AIC—Akaike 1973).
Based on an estimate of home range size of 1.1–14.2 km2 for lowland tapirs (Medici 2011), we checked for spatial and tem-poral autocorrelation in the records of lowland tapirs for each camera trap using Mantel tests (Oksanen et al. 2012). For the Mantel tests, we calculated a spatial distance matrix using uni-versal transverse Mercator-14 coordinates (in meters) taken at the center of each grid and a temporal distance matrix using the months of the sampling period. Euclidean distances were used to construct distance matrices for space and time. The Bray–Curtis distances were used to a construct distance matrix of the records of lowland tapir per camera. Significance of Mantel correlations were evaluated by permutation tests with 9,999 permutations. The analyses were performed in R version 2.15.0 (R Development Core Team 2012) with the package vegan ver-sion 2.0-4 for Mantel tests (Oksanen et al. 2012).
We classified camera-trapping data using 5-day intervals (27 occasions), that, based on the approach of Mackenzie et al. (2006), would be sufficient to detect or not detect lowland tapirs and constructed a reliable detection history. We estimated site occupancy (Ψ) and detection probability (p) for the species, with 3 possible outcomes: 1) the site was occupied and the spe-cies was detected (Ψ × p), 2) the species was present but not detected (Ψ × [1 − p]), and 3) the species was not present and not detected (1 − Ψ).
We estimated detection probabilities by sampling each site on 27 occasions. The probability was the parameter projected by a maximum likelihood estimation of the proportion of sites occupied (Ψ) during the sample period. We used a single- season model. This exercise indicated that the occupancy status for tapirs was constant throughout the study, allowing closed occupancy models to be used (Mackenzie et al. 2006).
In our occupancy analysis, we assessed the covariates that might affect occupancy and detectability, in an attempt to iden-tify habitat preferences. We constructed a set of 20 candidate models selected by a priori hypotheses based on 4 different approaches: 1) considering occupancy probability and detect-ability as constant across all sites, 2) considering the variation in occupancy as a function of covariates, 3) considering the variation in detectability as a function of covariates, and 4) con-sidering both the variation in occupancy and detectability as a function of covariates. This allowed us to evaluate the differ-ences in habitat occupancy as determined by a single covariate or a set of covariates, which would contribute to an improve-ment in the model’s performance.
Occupancy modeling was run in PRESENCE 9.3 software (Mackenzie and Royle 2005) with 2,000 bootstraps to assess the adjustment fit (P) and overdispersion parameter (ĉ). In our assessment of occupancy closure and the factors that influ-enced occupancy and detection, we ranked the models by AIC adjusted for small sample size (AICc), following Burnham and Anderson (2002). All models with a ΔAICc value < 2 were considered to be competitive. We also used the AICc weight
Downloaded from https://academic.oup.com/jmammal/article-abstract/98/1/114/2977226/Density-occupancy-and-detectability-of-lowlandby University of Texas at Austin useron 04 September 2017

118 JOURNAL OF MAMMALOGY
(wi) for each model, which corresponds to the amount of evi-
dence in favor of a given model, to choose the best model that we used to test our hypotheses.
The circadian cycle of the species was described based on the timing of photographs obtained from the camera traps. To avoid pseudoreplication, records were only considered to be independent when separated by an interval of 24 h. Analyses were conducted in the “Circular” package in R with associated analytic packages. Circular summaries (Lund and Agostinelli 2007) were used to determine the mean overall timing of activ-ity as recorded by camera traps. A resampling approach was used to derive unbiased estimates of the 95% confidence inter-vals, whereby the circular mean from a random sample of 100 data points was calculated 10,000 times with replacement to generate reliable estimates.
results
Density and population size.—A total of 908 km of transects (196 samples) were surveyed in this study. Throughout the sur-veys, T. terrestris was sighted 63 times.
Estimated density for T. terrestris was 0.8 ± 0.2 lowland tapirs/km2 and estimated population size was 200 ± 33 individu-als with an ESW of 10.80 ± 1.12 m with observations obtained from 0 to 36 m from the line of the transect. The model that best fitted our data was a Half Normal key with cosine adjustment. The coefficient of variation for both parameters was 16.6%.
Occupancy and detectability models.—Records of the lowland tapir were not autocorrelated with respect to space (Mantel’s r = −0.02, P = 0.65) or time (Mantel’s r = 0.05, P = 0.23). A total of 7,020 trap-days were conducted during
the study. We obtained 2,134 independent detections of T. ter-restris and observed the species in 30 of the 39 sites, which resulted in a naive occupancy of 0.77 and a detectability of 0.52. The northern portion of VNR resulted in the highest occupancy rates and detectability of lowland tapirs (Ψ = 0.58–0.95 and p = 0.31–0.48), followed by the southern portion (Ψ = 0.32–0.43 and p = 0.18–0.29). The west portion resulted in the lowest occupancy rates and detectability (Ψ = 0.08–0.13 and p = 0.06–0.09).
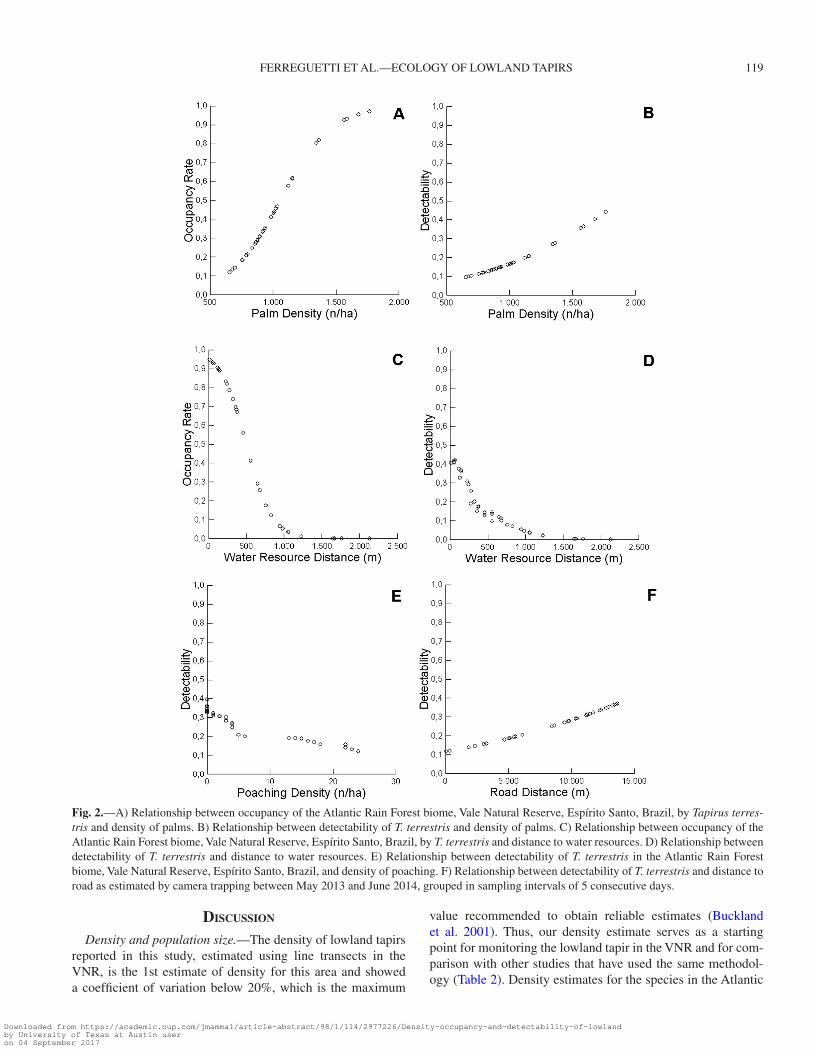
From the 20 occupancy models produced (Table 1), occu-pancy was best described by 2 covariates: 1) density of palm (palm_density), which had a positive relationship in which occupancy increased with high palm density (Ψ = 0.11–0.98; Fig. 2A) and 2) distance to water resources (water_distance), which had a negative relationship, in which occupancy by lowland tapirs decreased as the distance to water increased (Ψ = 0.009–0.96; Fig. 2C). Detectability was affected by 4 covariates: 1) palm_density, which had a positive relationship in which detectability increased in sites with higher density of palms (p = 0.11–0.48; Fig. 2B); 2) water_distance, which had a negative relationship with higher detectability in sites with shorter distances to water (p = 0.02–0.43; Fig. 2D); 3) Density of poaching (poaching), which had a negative relationship illustrating that the higher the poaching the lower detectability (p = 0.16–0.41; Fig. 2E); and (4) distance to road (road_dis-tance), which had a negative relationship with higher detect-ability in sites far away from roads (p = 0.1–0.4; Fig. 2F).
Activity pattern.— Tapirus terrestris showed a broad activity pattern, being photographed throughout the 24-h cycle (Fig. 3). The species showed 3 higher peaks of activity at 1900, 2300, and 0400 h.
Table 1.—Occupancy models for Tapirus terrestris in the Vale Natural Reserve, Brazil, estimated by camera trapping between May 2013 and June 2014, grouped in sampling intervals of 5 consecutive days. With (.) = as constant and covariates: distance to forest edge (edge_dist); density of trees with diameter breast height > 50 cm (tree_dens); density of poaching (poaching); density of palms (palm_dens); distance to road (road_dist); and distance to water resources (water_dist). Ψ = occupancy; p = detectability; overdispersion parameter (ĉ) = 1.14 and the adjust-ment fit (P) = 0.23.
Model AICc ΔAICc wi
Number of parameters
Ψ(palm_dens;water_dist);p(poaching;water_dist;road_dist;palm_dens) 532.62 0 0.89 8Ψ(palm_dens;water_dist);p(poaching;road_dist;palm_dens) 540.27 7.65 0.08 7Ψ(palm_dens;water_dist);p(poaching;water_dist;road_dist) 541.97 9.35 0.001 7Ψ(palm_dens;water_dist);p(poaching;palm_dens) 542.01 9.39 < 0.001 6Ψ(palm_dens);p(poaching;water_dist) 542.33 9.71 < 0.001 5Ψ(palm_dens;water_dist);p(road_dist;palm_dens) 556.10 23.48 < 0.001 6Ψ(palm_dens);p(road_dist;poaching) 556.50 23.88 < 0.001 5Ψ(water_dist);p(road_dist;poaching) 561.14 28.52 < 0.001 5Ψ(water_dist);p(poaching) 565.85 33.23 < 0.001 4Ψ(palm_dens);p(poaching) 572.78 40.16 < 0.001 4Ψ(.);p(.) 576.70 44.08 < 0.001 2Ψ(.);p(road_dist;poaching) 576.84 44.18 < 0.001 3Ψ(palm_dist);p(.) 577.03 44.41 < 0.001 3Ψ(water_dist);p(.) 577.78 45.16 < 0.001 3Ψ(.);p(poaching) 577.88 45.26 < 0.001 3Ψ(.);p(dist_road) 577.98 45.36 < 0.001 3Ψ(poaching;edge_dist);p(poaching) 578.40 45.78 < 0.001 5Ψ(road_dist);p(.) 578.65 46.03 < 0.001 3Ψ(poaching);p(.) 578.92 46.30 < 0.001 3Ψ(edge_dist);p(.) 579.02 46.40 < 0.001 3
Downloaded from https://academic.oup.com/jmammal/article-abstract/98/1/114/2977226/Density-occupancy-and-detectability-of-lowlandby University of Texas at Austin useron 04 September 2017
FERREGUETTI ET AL.—ECOLOGY OF LOWLAND TAPIRS 119
discussion
Density and population size.—The density of lowland tapirs reported in this study, estimated using line transects in the VNR, is the 1st estimate of density for this area and showed a coefficient of variation below 20%, which is the maximum
value recommended to obtain reliable estimates (Buckland et al. 2001). Thus, our density estimate serves as a starting point for monitoring the lowland tapir in the VNR and for com-parison with other studies that have used the same methodol-ogy (Table 2). Density estimates for the species in the Atlantic
Fig. 2.—A) Relationship between occupancy of the Atlantic Rain Forest biome, Vale Natural Reserve, Espírito Santo, Brazil, by Tapirus terres-tris and density of palms. B) Relationship between detectability of T. terrestris and density of palms. C) Relationship between occupancy of the Atlantic Rain Forest biome, Vale Natural Reserve, Espírito Santo, Brazil, by T. terrestris and distance to water resources. D) Relationship between detectability of T. terrestris and distance to water resources. E) Relationship between detectability of T. terrestris in the Atlantic Rain Forest biome, Vale Natural Reserve, Espírito Santo, Brazil, and density of poaching. F) Relationship between detectability of T. terrestris and distance to road as estimated by camera trapping between May 2013 and June 2014, grouped in sampling intervals of 5 consecutive days.
Downloaded from https://academic.oup.com/jmammal/article-abstract/98/1/114/2977226/Density-occupancy-and-detectability-of-lowlandby University of Texas at Austin useron 04 September 2017

120 JOURNAL OF MAMMALOGY
Forest were lower than those reported in the present study. This is because those estimates were made in the fragmented areas of Morro do Diabo (0.34–0.64 individuals per km2—Medici 2010) and the Ecologic estation of Caetetus (0.47 individuals per km2—Cullen et al. 2000), both in the state of Sao Paulo. However, our estimate is similar to those obtained in more preserved areas in other biomes such as Pantanal (0.30–1.01 individuals per km2—Trolle et al. 2008) and Amazonian Forest (3.3–3.7 individuals per km2—Mendes-Pontes 2004). Those density estimates were obtained using different methodologies, which makes comparisons between studies difficult. However, herein we show that VNR contains a population of 200 ± 33
lowland tapirs, which may be considered a viable population for conservation (Gatti et al. 2011).
Occupancy and detectability models.—The model to pre-dict potential habitat suitability for lowland tapirs in the VNR showed that among the 6 covariates evaluated in this study, 2 best explained habitat occupancy by lowland tapirs (i.e., distance to water resources and density of palms) and 4 were best able to predict detectability for the species (i.e., density of palms, dis-tance to water resources, poaching, and distance to road).
The relationship between occupancy by lowland tapirs and distance to water resources was expected after it was deter-mined which habitats they usually occupied, such as riparian forests, wetlands, and streams, where they are most active, especially when foraging (Medici 2010), making it easy to detect individuals in sites closest to a water resource. Thus, the highest occupancy rates and detectability of the lowland tapir in the northern portion of the VNR can be attributed to this portion of the reserve having a higher quantity of water resources (Kierulff et al. 2015) compared to the other portions of VNR (i.e., south and west). Norris (2014) found that distance to water was one of the covariates that best described the distri-bution of lowland tapirs. Lowland tapirs also used sites closest to water as a place for resting, defecation, to prevent ectopara-sites, to facilitate their movements between foraging sites, and for cooling off during the hottest hours of the day (Padilla and Dowler 1994; Foerster and Vaughan 2002). Brazil currently is experiencing a hydro crisis that began in 2014. Lack of rainfall (CPTEC 2015), along with the creation of artificial barrages to store water, has damaged ecosystems and animal populations, especially species like the lowland tapir which is highly depen-dent on water (García et al. 2012). Many streams are disappear-ing because of this process.
Along with water resources, the density of palms is also a covariate that represents a habitat key to the lowland tapir, because the fruits produced by these palm trees are crucial food
Fig. 3.—Activity pattern of T. terrestris in the Atlantic Rain Forest, Vale Natural Reserve, Espírito Santo, Brazil, as estimated by camera trapping between May 2013 and June 2014. Inside values 0–30 are the frequency of records and outside values are hours of the day.
Table 2.—Density estimates of Tapirus terrestris per km2 in the Brazilian biomes. FIT = Footprint Identification Technique; ind = individuals.
Biome Location Density (ind/km2) Reference and applied method
Atlantic Forest Ecologic Estation Caetetús, São Paulo 0.47 Cullen et al. (2000), line transectAtlantic Forest State Park Morro do Diabo, São Paulo 0.20–0.84 Cullen et al. (2000), line transectAtlantic Forest Fazenda Mosquito, São Paulo 0.3 Cullen et al. (2000), line transectAtlantic Forest State Park Mata dos Godoy, Paraná 2.20–2.50 Rocha (2001), number of observations/areaAtlantic Forest State Park Morro do Diabo, São Paulo 0.43 Medici (2010), FITAtlantic Forest State Park Morro do Diabo, São Paulo 0.64 Medici (2010), line transectAtlantic Forest State Park Morro do Diabo, São Paulo 0.34 Medici (2010), radiotelemetryAtlantic Forest Caraguatatuba, São Paulo 0.13–0.21 Ramírez (2013), genetic analysisAtlantic Forest Intervales, São Paulo 0.20–0.57 Ramírez (2013), genetic analysisAtlantic Forest Vale Natural Reserve, Espírito Santo 0.6–1.0 Present study, line transectAmazon Forest Brazilian Amazon 0.11–0.52 Peres (2000), line transectAmazon Forest Center of ecological studies Kayapó, Para 0.62 Zimmerman et al. (2001), line transectAmazon Forest Ecological Estation of Maracá, Roraima 3.3–3.7 Mendes-Pontes (2004), line transectAmazon Forest Lake Uauaçú, Mid-West Amazon 0.23 Haugaasen and Peres (2005), line transectPantanal Fazenda Acurizal, Paraguay River 0.64 Schaller (1983), direct countsPantanal Fazenda Nhumirim, Nhecolândia Forest: 0.40; Cerrado: 0.13 Desbiez (2007) and Desbiez (2009), line
transectPantanal SESC Pantanal, Barão de Melgaço Forest: 0.71; open areas: 0.37 Cordeiro (2004), line transectPantanal SESC Pantanal, Barão de Melgaço 0.47–0.69 Trolle et al. (2008), camera trapPantanal SESC Pantanal, Barão de Melgaço 0.30–1.01 Trolle et al. (2008), line transect
Downloaded from https://academic.oup.com/jmammal/article-abstract/98/1/114/2977226/Density-occupancy-and-detectability-of-lowlandby University of Texas at Austin useron 04 September 2017

FERREGUETTI ET AL.—ECOLOGY OF LOWLAND TAPIRS 121
resources for lowland tapirs (Fragoso 1997). The northern part of the reserve had the highest occupancy rates and palm den-sity values, which were expected as much of the riparian for-ests (i.e., vegetation type that presents high dominance of palm trees) are located in the northern VNR (Kierulff et al. 2015). In the Atlantic Rain Forest biome of Brazil, lowland tapirs are known to use patches of Jerivá palm (Syagrus romanzoffiana) very intensively (Galetti et al. 2001; Tófoli 2006). In the north-eastern region of the Brazilian Pantanal, lowland tapirs show a high preference for Acuri palm forests (Attalea phalerata) compared to other vegetation types (Cordeiro 2004). In the Amazon, patches of Mauritia flexuosa frequently are visited by lowland tapirs (Bodmer 1990; Tobler 2008). Accordingly, occupancy and detectability models demonstrate high occur-rence probabilities in such habitat areas.
Besides natural habitat factors, anthropic factors (i.e., poach-ing and roads) potentially could influence the detectability of lowland tapirs (Licona et al. 2011). Poaching was reported as a problem for animal populations in VNR since 1999 (Chiarello 2000) and the west portion of the VNR is the most affected by poaching (Kierulff et al. 2015). The high rate of poaching in the western portion of the VNR was associated with the lowest occupancy rates and detectability of lowland tapirs. The detect-ability of lowland tapirs has likely been affected by poaching as it is known that tapirs tend to avoid areas with higher hunt-ing activity (Laundre et al. 2010). Medici et al. (2007) con-ducted a population and habitat viability analysis for lowland tapirs and found that poaching is one of the major threats to the species, which is consistent with previous research where the presence of lowland tapirs and the level of poaching were nega-tively correlated (Peres 2000; Cullen et al. 2001; Fa et al. 2002; Cruz et al. 2014). Lowland tapirs especially are vulnerable to hunting when compared with other ungulates (e.g., cervids—Ferreguetti et al. 2015) because of their relatively low-density population (Bodmer et al. 1997; Medici et al. 2007) and life history traits (i.e., long-lived individuals, low rates of increase, and long generation times—Bodmer et al. 1997; Emmons and Feer 1997). Poaching not only has a negative effect on lowland tapir populations, but also has an indirect effect on the compo-sition and structure of the forest, because lowland tapirs play a critical ecological role, affecting the structure, composition, growth, and regeneration of vegetation (Bodmer 1990, 1991; Dirzo and Miranda 1991; Fragoso 1997; Galetti et al. 2015).
Detectability was lowest in sites closest to the road that cuts the VNR, suggesting that lowland tapirs could be avoiding areas next to roads. Roads and other human developments may act as barriers, because the animals tend to avoid sites closest to roads, a behavior that has been reported for other large mam-mals occurring in contiguous habitats (Paetkau et al. 1997). Combined with our finding that detectability is lower in sites closest to the road, during the period of June 2014 to June 2015, 4 individuals of lowland tapir were found dead in the road that cuts the reserve (i.e., BR 101 road), and 1 of the individuals was a pregnant female. To maintain the flow of lowland tapirs across roads, construction of special structures such as wildlife crossings have been proposed (Foster and Humphrey 1995).
For example, in Alberta, Canada, the construction of these structures favored the passage of large mammals such as bears (Ursus arctos), wolves (Canis lupus), moose (Cervus elaphus), and deer (Odocoileus sp.) along the Trans-Canada highway (Clevenger and Waltho 2005).
Activity period.—Lowland tapirs have been described as nocturnal or crepuscular (Padilla and Dowler 1994; Noss et al. 2003; Tobler 2008; Medici 2010; Wallace et al. 2012; Cruz et al. 2014); however, several factors can affect the activ-ity period of this species (i.e., poaching, rainy season). For low-land tapirs, increased diurnal activity was observed in humid months (Foerster and Vaughan 2002; Medici 2010). Lowland tapirs usually are inactive in the middle of the day, which cor-responds to the hottest hours of the day (Medici 2010). From personal observation, we noticed that during the hottest hours of the line transect survey, lowland tapirs were found bedded down in the forest interior.
Implications for conservation.—Although the present study was conducted in the VNR, the northern region of the state of Espírito Santo holds a connected block of protected area of 550 km2. This protected block has 2 important purposes: 1) moni-toring the lowland tapir population in the state of Espírito Santo, and 2) quantifying the impact of roads on animal populations. Results presented herein can be a starting point to support future work in the region and to make predictions regarding the ecosystem relationships, management, and conservation of lowland tapirs. Furthermore, the results can be used as a sur-rogate for other regions or biomes in which the species occurs, because many locations may be affected by the same covariates used herein (i.e., poaching and road impact).
acknowledgMents
We thank Vale Natural Reserve for their support of this research. We appreciate the considerations of both anonymous reviewers. AFC is also grateful to Coordenacão de Aperfeiçoamento de Pessoal de Nível Superior (CAPES) for a graduate scholarship. HGB thanks FAPERJ (E-26/103.016/2011), Prociência/UERJ, and CNPq (457458/2012-7, 307715/2009-4) for research and productivity grants. This study is portion of the results of the Programa de Pesquisas em Biodiversidade da Mata Atlântica (PPBioMA) which was supported by Conselho Nacional de Desenvolvimento Científico e Tecnológico (CNPq) (Process No. 457458/212-7). Data storage is supported by PPBio MA (CNPq - 457458/2012-7) and FAPERJ (E-26/111.394/2012).
literature cited
akaike, H. 1973. Information theory and an extension of the maxi-mum likelihood principle. Pp. 267–281 in Second international symposium on information theory (B. N. Petrov and F. Csaki, eds.). Akademiai, Budapest, Hungary.
anCrenaz, M., A. Hearn, J. ross, R. sollMann, and A. Wilting. 2012. Handbook for wildlife monitoring using camera-traps. Small Carnivore Specialist Group. BBEC II Secretariat, Sabah, Malaysia.
Barongi, R. A. 1993. Husbandry and conservation of tapirs Tapirus spp. International Zoo Yearbook 32:7–15.
Downloaded from https://academic.oup.com/jmammal/article-abstract/98/1/114/2977226/Density-occupancy-and-detectability-of-lowlandby University of Texas at Austin useron 04 September 2017

122 JOURNAL OF MAMMALOGY
BeCk, H., and J. terBogH. 2002. Groves versus isolates: how spatial aggregation of Astrocaryum murumuru palms affects seed removal. Journal of Tropical Ecology 18:275–288.
BodMer, R. 1990. Fruit patch size and frugivory in the lowland tapir (Tapirus terrestris). Journal of Zoology (London) 222:121–128.
BodMer, R. E. 1991. Strategies of seed dispersal and seed predation in Amazonian ungulates. Biotropica 23:255–261.
BodMer, R. E., J. F. eisenBerg, and K. H. redFord. 1997. Hunting and the likelihood of extinction of Amazonian mammals. Conservation Biology 11:460–466.
BuCkland, S. T., D. R. anderson, K. P. BurnHaM, J. L. laake, D. L. BorCHers, and L. tHoMas. 2001. Introduction to distance sam-pling: estimating abundance of biological populations. 1st ed. Oxford University Press, Oxford, United Kingdom.
BurnHaM, K., and D. anderson. 2002. Model selection and multi-model inference: a practical information and theoretic approach. 2nd ed. Springer.
CaugHley, G. 1994. Directions in conservation biology. Journal of Animal Ecology 63:215–244.
CHiarello, A. G. 2000. Influência da caça ilegal sobre mamíferos e aves das matas de tabuleiro do norte do estado do Espírito Santo. Boletim do Museu de Biologia Mello Leitão 12:229–247.
Clevenger, A. P., and N. WaltHo. 2005. Performance indices to iden-tify attributes of highway crossing structures facilitating movement of large mammals. Biological Conservation 121:453–464.
Cordeiro, J. L. P. 2004. Estrutura e heterogeneidade da paisagem de uma unidade de conservação no nordeste do pantanal (RPPN SESC Pantanal), Mato Grosso, Brasil: efeitos sobre a distribuição e densidade de antas (Tapirus terrestris) e de cervos-do-Pantanal (Blastocerus dichotomus). Ph.D. thesis, Rio Grande do Sul Federal University, Rio Grande do Sul, Brazil.
CPteC. 2015. Centro de Previsão de Tempo e Estudos Climáticos. http://www.cptec.inpe.br/. Accessed 1 November 2015.
Cruz, P., A. Paviolo, R. F. Bó, J. J. tHoMPson, and M. S. di Bitetti. 2014. Daily activity patterns and habitat use of the lowland tapir (Tapirus terrestris) in the Atlantic Forest. Mammalian Biology 79:376–383.
Cullen, L., R. E. BodMer, and C. valladares PÁdua. 2000. Effects of hunting in habitat fragments of the Atlantic forests, Brazil. Biological Conservation 95:49–56.
Cullen, L., R. E. BodMer, and C. valladares-Padua. 2001. Ecological consequences of hunting in Atlantic forest patches, Sao Paulo, Brazil. Oryx 35:137–144.
desBiez, a. l. J. 2007. Wildlife conservation in the Pantanal: habitat alteration, invasive species and bushmeat hunting. Ph.D. disserta-tion, University of Kent, Canterbury, United Kingdom.
desBiez, a. l. J. 2009. Lowland tapirs in the Nhecolânia Region of Brazilian Pantanal: population density, habitat use and threats. Tapir Conservation 18:7–10.
de tHoisy, B., et al. 2010. Population history, phylogeography, and conservation genetics of the last Neotropical mega-herbivore, the lowland tapir (Tapirus terrestris). BMC Evolutionary Biology 10:1.
dirzo, R., and A. Miranda. 1991. Altered patterns of herbivory and diversity in the forest understory: a case study of the possible con-sequences of contemporary defaunation. Pp. 273–287 in Plant ani-mal interactions: evolutionary ecology in tropical and temperate regions (P. W. Price, T. M. Lewinsohn, G. W. Fernández, and W. W. Benson, eds.). Wiley Press, New York.
doWnes, B. J., P. S. lake, E. S. G. sCHreiBer, and A. glaister. 1998. Habitat structure and regulation of local species diversity in a stony upland stream. Ecological Monographs 68:237–257.
eisenBerg, J., and K. H. redFord. 1999. Mammals of the Neotropics. University of Chicago Press, Chicago, Illinois 3:1–624.
eMMons, L. H., and F. Feer. 1997. Neotropical rainforest mammals: a field guide. 2nd ed. University of Chicago Press, Chicago, Illinois.
esri. 2011. ArcGIS desktop: release 10. Environmental Systems Research Institute, Inc. Redlands, California.
Fa, J. E., C. A. Peres, and J. A. MeeuWig. 2002. Bushmeat exploration in tropical forests: an intercontinental comparison. Conservation Biology 16:232–237.
Ferreguetti, Á. C., W. M. toMÁs, and H. G. Bergallo. 2015. Density, occupancy, and activity pattern of two sympatric deer (Mazama) in the Atlantic Forest, Brazil. Journal of Mammalogy 96:1245–1254.
Ferreguetti, A. C., W. M. toMas, and H. G. Bergallo. 2016. Density and niche segregation of two armadillo species (Xenarthra: Dasypodidae) in the Vale Natural Reserve, Brazil. Mammalian Biology 81:138–145.
Foerster, C. R., and C. vaugHan. 2002. Home range, habitat use, and activity of Baird’s tapir. Biotropica 34:423–437.
Foster, M. L., and S. R. HuMPHrey. 1995. Use of highway under-passes by Florida panthers and other wildlife. Wildlife Society Bulletin 23:95–100.
Fragoso, J. M. V. 1997. Tapir-generated seed shadows: scale-depen-dent patchiness in the Amazon rain forest. Journal of Ecology 85:519–529.
galetti, M., R. S. BovendorP, and R. guevara. 2015. Defaunation of large mammals leads to an increase in seed predation in the Atlantic forests. Global Ecology and Conservation 3:824–830.
galetti, M., A. keurogHlian, L. Hanada, and M. I. Morato. 2001. Frugivory and seed dispersal by the lowland tapir (Tapirus terres-tris) in Southeast Brazil. Biotropica 33:723–726.
garCía, M. J., E. P. MediCi, E. J. naranJo, W. novarino, and R. S. leonardo. 2012. Distribution, habitat and adaptability of the genus Tapirus. Integrative Zoology 7:346–355.
gatti, A., D. Brito, and S. L. Mendes. 2011. How many lowland tapirs (Tapirus terrestris) are needed in Atlantic Forest fragments to ensure long-term persistence? Studies on Neotropical Fauna and Environment 46:77–84.
gentile, R., and R. Cerqueira. 1995. Movement patterns of five spe-cies of small mammals in a Brazilian restinga. Journal of Tropical Ecology 11:671–677.
goulart, F. V. B., N. C. CÁCeres, M. E. graiPel, M. A. tortato, I. R. gHizoni, and L. G. R. oliveira-santos. 2009. Habitat selec-tion by large mammals in a southern Brazilian Atlantic Forest. Mammalian Biology 74:182–190.
Hansen, D. M., and M. galetti. 2009. The forgotten megafauna. Science 324:42–43.
Haugaasen, t., & C. a. Peres. 2005. Mammal assemblage structure in Amazonian flooded and unflooded forests. Journal of Tropical Ecology 21:133–145.
iBge. 1993. Mapa de Vegetação do Brasil. Fundação Instituto Brasileiro de Geografia e Estatística, Rio de Janeiro, Brazil.
Jesus, R. M. 1987. Mata Atlântica de Linhares: Asectos Florestais. pp. 35–53 in Desenvolvimento Econômico e Impacto Ambiental em Áreas de Trópico Úmido Brasileiro – A experiência da CVRD (Secretaria Estadual de Meio Ambiente, Idaho Water Resource Board, and Companhia Vale do Rio Doce, eds.). Companhia Vale do Rio de Doce, Rio de Janeiro, Brazil.
Jones, J. 2001. Habitat selection studies in avian ecology: a critical review. Auk 118:557–562.
karantH, K. U., J. D. niCHols, N. S. kuMar, W. A. link, and J. E. Hines. 2004. Tigers and their prey: predicting carnivore densities
Downloaded from https://academic.oup.com/jmammal/article-abstract/98/1/114/2977226/Density-occupancy-and-detectability-of-lowlandby University of Texas at Austin useron 04 September 2017
FERREGUETTI ET AL.—ECOLOGY OF LOWLAND TAPIRS 123
from prey abundance. Proceedings of the National Academy of Sciences 101:4854–4858.
kierulFF, M. C. M., L. H. S. avelar, M. E. S. Ferreira, K. F. Povoa, and R. S. Bernils. 2015. Reserva Natural Vale: história e aspectos físicos. Ciência & Ambiente 49:7–40.
laake, J., S. BuCkland, D. anderson, and K. BurnHaM. 1994. Distance user’s guide. Colorado State University Press, Fort Collins.
laundre, J. W., L. Hernandez, and W. J. riPPle. 2010. The landscape of fear: ecological implications of being afraid. The Open Ecology Journal 3:1–7.
liCona, M., R. MCCleery, B. Collier, D. J. BrigHtsMitH, and R. loPez. 2011. Using ungulate occurrence to evaluate commu-nity-based conservation within a biosphere reserve model. Animal Conservation 14:206–214.
lund, U., and C. agostinelli. 2007. Circular: circular statistics. http://cran.r-project.org/package5circular. Accessed 30 June 2015.
MaCkenzie, D., J. niCHols, J. royle, K. PolloCk, L. Bailey, and J. Hines. 2006. Occupancy estimation and modeling: inferring pat-terns and dynamics of species occurrence. Elsevier Publishing, New York.
MaCkenzie, D. I., and J. A. royle. 2005. Designing occupancy stud-ies: general advice and allocating survey effort. Journal of Applied Ecology 42:1105–1114.
Magnusson, W. E., et al. 2005. RAPELD: Uma modificação do método de Gentry para o levantamento da biodiversidade em áreas. Biota Neotropica 5. http://www.biotaneotropica.org.br/v5n2/pt/abstract?point-of-view+bn0100522005. Accessed 15 October 2014.
MediCi, E. P., et al. 2007. Lowland tapir (Tapirus terrestris) pop-ulation and habitat viability assessment (PHVA): final report. Relatório Técnico. IUCN/SSC Tapir Specialist Group (TSG) and IUCN/SSC Conservation Breeding Specialist Group (CBSG).
MediCi, E. P. 2010. Assessing the viability of lowland tapir popula-tions in a fragmented landscape. Ph.D. thesis, Kent University, London, United Kingdom. 276 p.
MediCi, e. P. 2011. Family Tapiridae (tapirs). Pp. 24–56 in Handbook of the mammals of the world, volume 2: hoofed mammals first (D. Wilson and R. Mittermeier, eds.). Lynx Editions, Barcelona, Spain.
Mendes-Pontes, A. R. 2004. Ecology of a community of mammals in a seasonailly dry forest in Roraima, Brazilian Amazon. Mammalian Biology 69:319–336.
naranJo, E. J. 2009. Ecology and conservation of Baird’s tapir in Mexico. Tropical Conservation Science 2:140–158.
naveda, A., et al. 2008. Tapirus terrestris. www.iucnredlist.org. Accessed 1 June 2015.
norris, D. 2014. Model thresholds are more important than pres-ence location type: understanding the distribution of lowland tapir (Tapirus terrestris) in a continuous Atlantic forest of Southeast Brazil. Tropical Conservation Science 7:529–547.
noss, A. J., et al. 2003. A camera trapping and radio telemetry study of lowland tapir (Tapirus terrestris) in Bolivian Dry Forests. Newsletter of the IUCN/SSC Tapir Specialist Group 12:24–32.
oksanen, J., et al. 2012. Vegan: community ecology package. R package version 2.0-4. http://CRAN.R-project.org/package=vegan. Accessed 10 March 2016.
otis, D. L. 1997. Analysis of habitat selection studies with multi-ple patches within cover types. Journal of Wildlife Management 61:1016–1022.
Padilla, M., and C. doWler. 1994. Tapirus terrestris. Mammalian Species 481:1–8.
Paetkau, D., L. P. Waits, P. L. Clarkson, L. CraigHead, and C. stroBeCk. 1997. An empirical evaluation of genetic distance sta-tistics using microsatellite data from bear (Ursidae) populations. Genetics 147:1943–1957.
Peixoto, A., and A. gentry. 1990. Diversity and floristic composition of the “Mata de Tabuleiro” of the Linhares Forest Reserve, Espirito Santo, Brazil. Revista Brasileira de Botânica 13:19–25.
Peres, C. A. 2000. Effects of subsistence hunting on vertebrate com-munity structure in Amazonian forests. Conservation Biology 14:240–253.
PHilliPs, M. L., W. R. Clark, S. M. nusser, M. A. sovada, and R. J. greenWood. 2004. Analysis of predator movement in prairie landscapes with contrasting grassland composition. Journal of Mammalogy 85:187–195.
raMírez, J. F. M. 2013. Diversidade genética e estrutura populacio-nal da anta (Tapirus terrestris) na Serra do Mar, São Paulo, Brasil. Master’s thesis, Universidade Estadual Paulista Júlio de Mesquita Filho, Instituto de Biociências de Rio Claro, São Paulo, Brazil.
r develoPMent Core teaM. 2012. R: a language and environment for statistical computing. R Foundation for Statistical Computing, Vienna, Austria. http://R-project.org/. Accessed 10 March 2016.
roCHa, v. J. 2001. Ecologia de mamíferos de médio e grande porte do Parque Estadual Mata dos Godoy, Londrina (PR). Ph.D. disserta-tion, Universidade Federal do Paraná, Paraná, Brazil.
salas, L. A., and T. K. Fuller. 1996. Diet of the lowland tapir (Tapirus terrestris) in the Tabaro River valley, southern Venezuela. Canadian Journal of Zoology 74:1444–1451.
sCHaller, g. B. 1983. Mammals and their biomass in a Brazilian ranch. Arquivos de Zoologia do Estado de São Paulo 31:1–36.
teWs, J.,et al. 2004. Animal species diversity driven by habitat het-erogeneity/diversity: the importance of keystone structures. Journal of Biogeography 31:79–92.
toBler, M. W. 2008. The ecology of the lowland tapir in Madre de Dios, Peru: using new technologies to study large rainforest mam-mals. Ph.D. dissertation, Texas A&M University, College Station.
tóFoli, C. F. D. 2006. Frugivoria e dispersão de sementes por Tapirus terrestris (Linnaeus, 1758) na paisagem fragmentada do Pontal do Paranapanema, São Paulo. Ph.D. thesis, Universidade de São Paulo, São Paulo, Brazil.
trolle, M., A. J. noss, J. L. P. Cordeiro, and L. F. B. oliveira. 2008. Brazilian tapir density in the Pantanal: a comparison of systematic camera-trapping and line-transect surveys. Biotropica 40:211–217.
WallaCe, R., G. ayala, and M. visCarra. 2012. Lowland tapir (Tapirus terrestris) distribution, activity patterns and relative abun-dance in the Greater Madidi-Tambopata Landscape. Integrative Zoology 7:407–419.
ziMMerMan, J. a., C. l. kelCHner, P. a. klein, J. C. HaMilton, & s. M. Foiles. 2001. Surface step effects on nanoindentation. Physics Review Letters 87:165507–165510.
Submitted 18 February 2016. Accepted 22 June 2016.
Associate Editor was Leslie N. Carraway.
Downloaded from https://academic.oup.com/jmammal/article-abstract/98/1/114/2977226/Density-occupancy-and-detectability-of-lowlandby University of Texas at Austin useron 04 September 2017